Hidalgo County, TX Map & Demographics
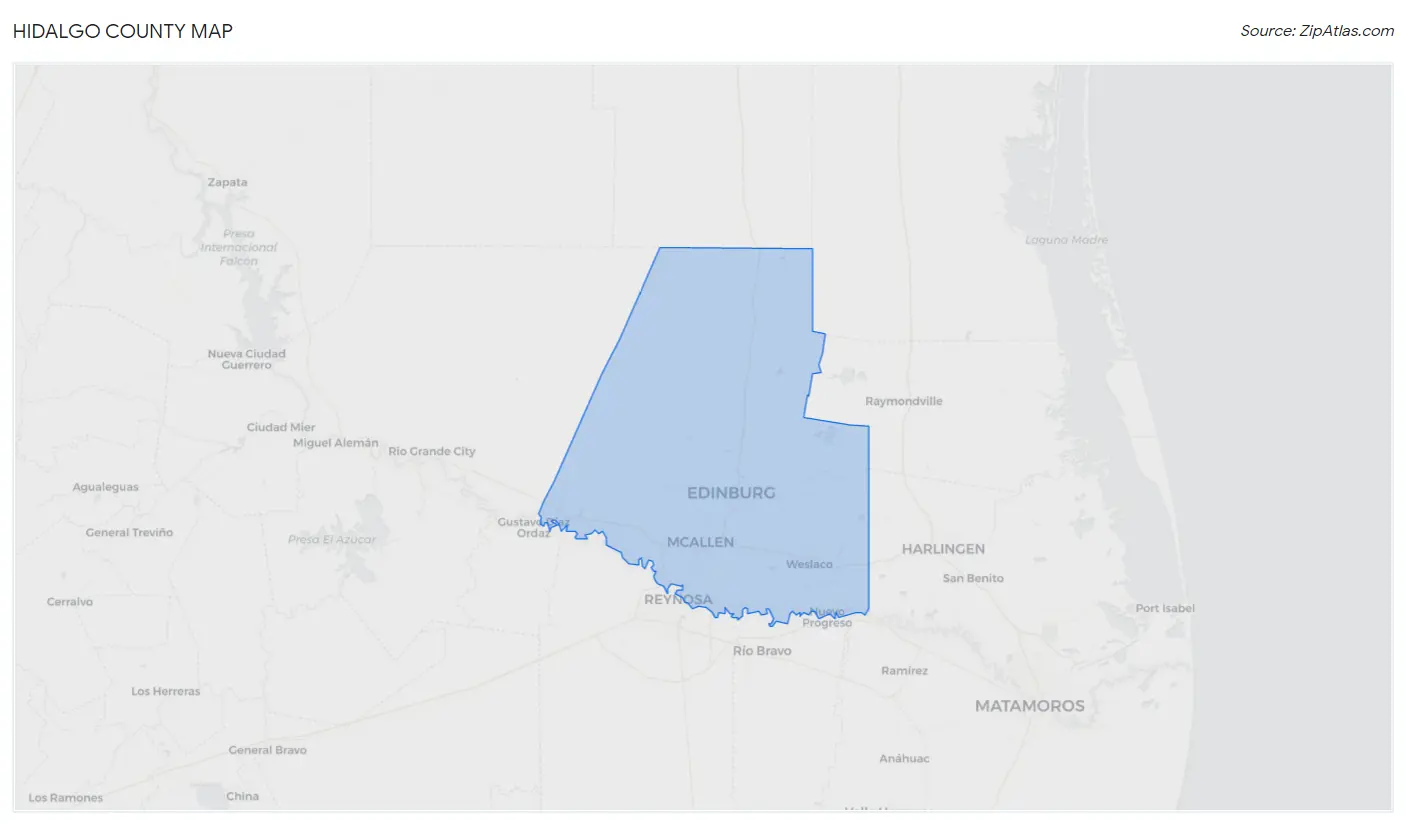
Hidalgo County Map
Hidalgo County Overview
$20,844
PER CAPITA INCOME
$54,864
AVG FAMILY INCOME
$49,371
AVG HOUSEHOLD INCOME
33.0%
WAGE / INCOME GAP [ % ]
67.0¢/ $1
WAGE / INCOME GAP [ $ ]
$12,205
FAMILY INCOME DEFICIT
0.48
INEQUALITY / GINI INDEX
873,167
TOTAL POPULATION
431,639
MALE POPULATION
441,528
FEMALE POPULATION
97.76
MALES / 100 FEMALES
102.29
FEMALES / 100 MALES
29.8
MEDIAN AGE
3.9
AVG FAMILY SIZE
3.4
AVG HOUSEHOLD SIZE
369,639
LABOR FORCE [ PEOPLE ]
58.8%
PERCENT IN LABOR FORCE
7.6%
UNEMPLOYMENT RATE
Hidalgo County Area Codes
Income in Hidalgo County
Income Overview in Hidalgo County
Per Capita Income in Hidalgo County is $20,844, while median incomes of families and households are $54,864 and $49,371 respectively.
| Characteristic | Number | Measure |
| Per Capita Income | 873,167 | $20,844 |
| Median Family Income | 202,695 | $54,864 |
| Mean Family Income | 202,695 | $74,019 |
| Median Household Income | 257,499 | $49,371 |
| Mean Household Income | 257,499 | $68,145 |
| Income Deficit | 202,695 | $12,205 |
| Wage / Income Gap (%) | 873,167 | 32.96% |
| Wage / Income Gap ($) | 873,167 | 67.04¢ per $1 |
| Gini / Inequality Index | 873,167 | 0.48 |
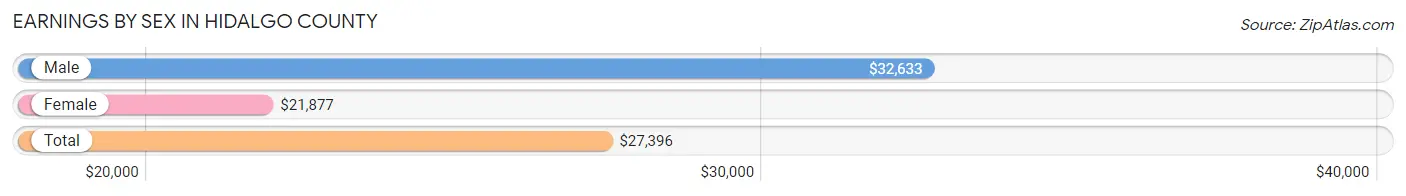
Earnings by Sex in Hidalgo County
Average Earnings in Hidalgo County are $27,396, $32,633 for men and $21,877 for women, a difference of 33.0%.
| Sex | Number | Average Earnings |
| Male | 211,450 (55.7%) | $32,633 |
| Female | 168,424 (44.3%) | $21,877 |
| Total | 379,874 (100.0%) | $27,396 |
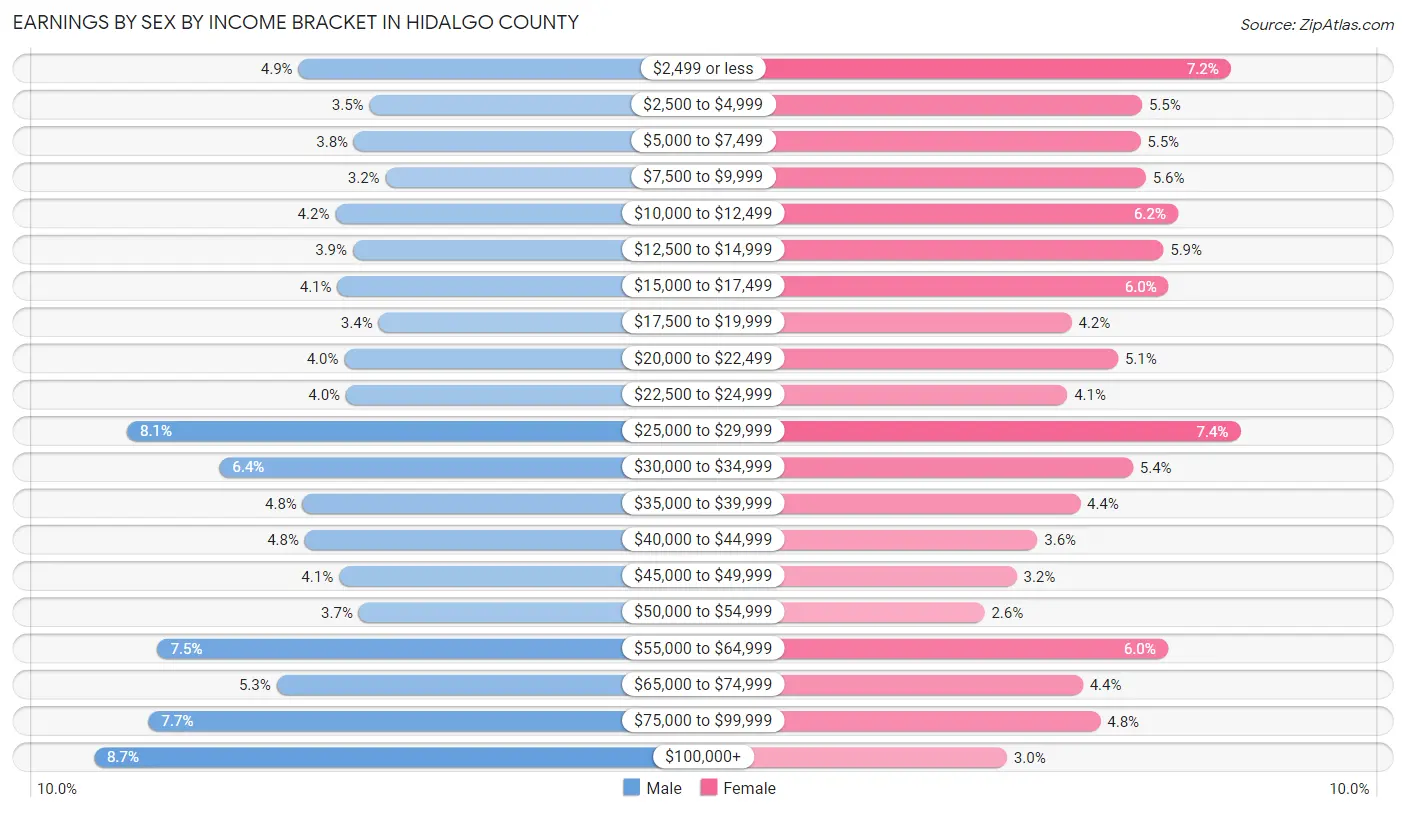
Earnings by Sex by Income Bracket in Hidalgo County
The most common earnings brackets in Hidalgo County are $100,000+ for men (18,387 | 8.7%) and $25,000 to $29,999 for women (12,405 | 7.4%).
| Income | Male | Female |
| $2,499 or less | 10,289 (4.9%) | 12,112 (7.2%) |
| $2,500 to $4,999 | 7,483 (3.5%) | 9,317 (5.5%) |
| $5,000 to $7,499 | 8,107 (3.8%) | 9,259 (5.5%) |
| $7,500 to $9,999 | 6,848 (3.2%) | 9,434 (5.6%) |
| $10,000 to $12,499 | 8,831 (4.2%) | 10,434 (6.2%) |
| $12,500 to $14,999 | 8,136 (3.8%) | 9,992 (5.9%) |
| $15,000 to $17,499 | 8,755 (4.1%) | 10,150 (6.0%) |
| $17,500 to $19,999 | 7,136 (3.4%) | 7,097 (4.2%) |
| $20,000 to $22,499 | 8,484 (4.0%) | 8,548 (5.1%) |
| $22,500 to $24,999 | 8,411 (4.0%) | 6,957 (4.1%) |
| $25,000 to $29,999 | 17,076 (8.1%) | 12,405 (7.4%) |
| $30,000 to $34,999 | 13,436 (6.4%) | 9,025 (5.4%) |
| $35,000 to $39,999 | 10,136 (4.8%) | 7,364 (4.4%) |
| $40,000 to $44,999 | 10,036 (4.8%) | 6,010 (3.6%) |
| $45,000 to $49,999 | 8,700 (4.1%) | 5,358 (3.2%) |
| $50,000 to $54,999 | 7,901 (3.7%) | 4,342 (2.6%) |
| $55,000 to $64,999 | 15,874 (7.5%) | 10,130 (6.0%) |
| $65,000 to $74,999 | 11,175 (5.3%) | 7,443 (4.4%) |
| $75,000 to $99,999 | 16,249 (7.7%) | 7,996 (4.8%) |
| $100,000+ | 18,387 (8.7%) | 5,051 (3.0%) |
| Total | 211,450 (100.0%) | 168,424 (100.0%) |
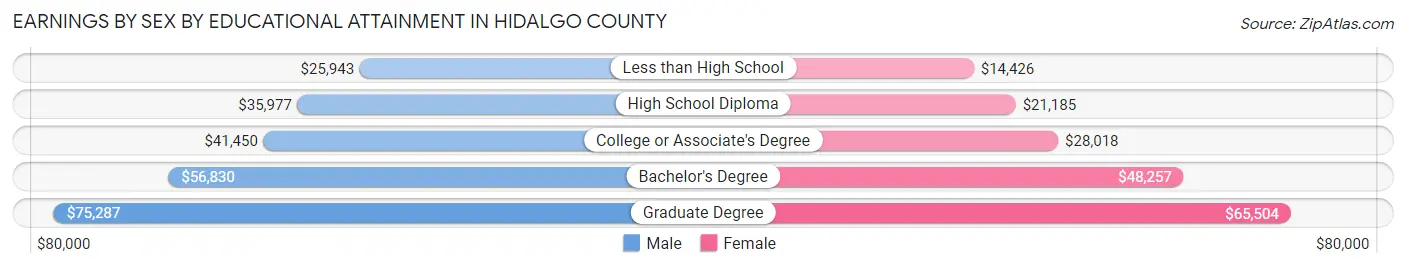
Earnings by Sex by Educational Attainment in Hidalgo County
Average earnings in Hidalgo County are $38,216 for men and $25,617 for women, a difference of 33.0%. Men with an educational attainment of graduate degree enjoy the highest average annual earnings of $75,287, while those with less than high school education earn the least with $25,943. Women with an educational attainment of graduate degree earn the most with the average annual earnings of $65,504, while those with less than high school education have the smallest earnings of $14,426.
| Educational Attainment | Male Income | Female Income |
| Less than High School | $25,943 | $14,426 |
| High School Diploma | $35,977 | $21,185 |
| College or Associate's Degree | $41,450 | $28,018 |
| Bachelor's Degree | $56,830 | $48,257 |
| Graduate Degree | $75,287 | $65,504 |
| Total | $38,216 | $25,617 |
Family Income in Hidalgo County
Family Income Brackets in Hidalgo County
According to the Hidalgo County family income data, there are 36,282 families falling into the $50,000 to $74,999 income range, which is the most common income bracket and makes up 17.9% of all families. Conversely, the $200,000+ income bracket is the least frequent group with only 9,121 families (4.5%) belonging to this category.
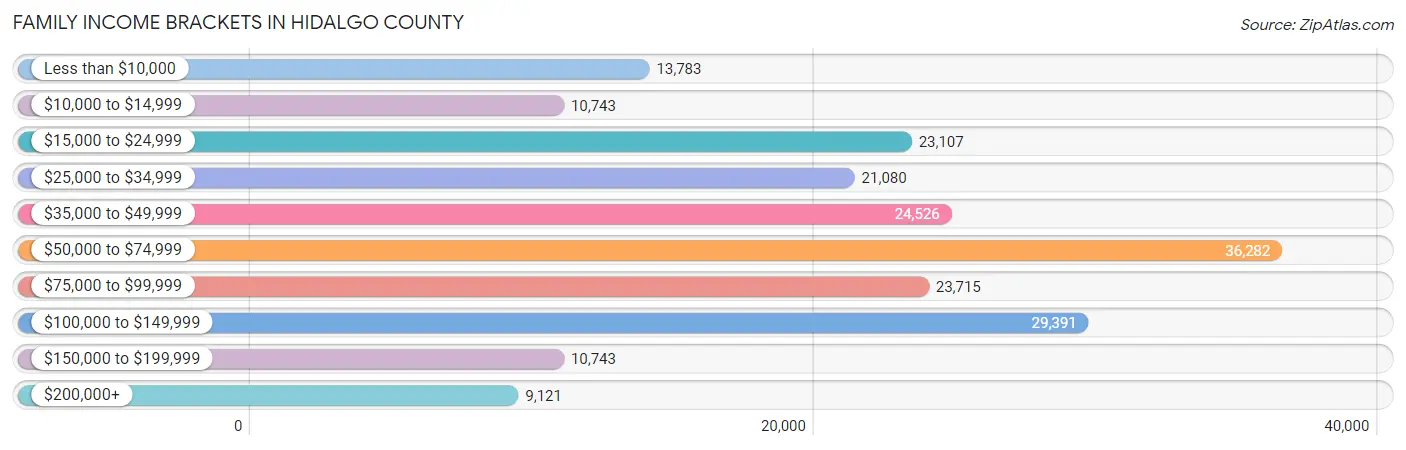
| Income Bracket | # Families | % Families |
| Less than $10,000 | 13,783 | 6.8% |
| $10,000 to $14,999 | 10,743 | 5.3% |
| $15,000 to $24,999 | 23,107 | 11.4% |
| $25,000 to $34,999 | 21,080 | 10.4% |
| $35,000 to $49,999 | 24,526 | 12.1% |
| $50,000 to $74,999 | 36,282 | 17.9% |
| $75,000 to $99,999 | 23,715 | 11.7% |
| $100,000 to $149,999 | 29,391 | 14.5% |
| $150,000 to $199,999 | 10,743 | 5.3% |
| $200,000+ | 9,121 | 4.5% |
Family Income by Famaliy Size in Hidalgo County
4-person families (43,710 | 21.6%) account for the highest median family income in Hidalgo County with $69,032 per family, while 2-person families (60,724 | 30.0%) have the highest median income of $22,017 per family member.
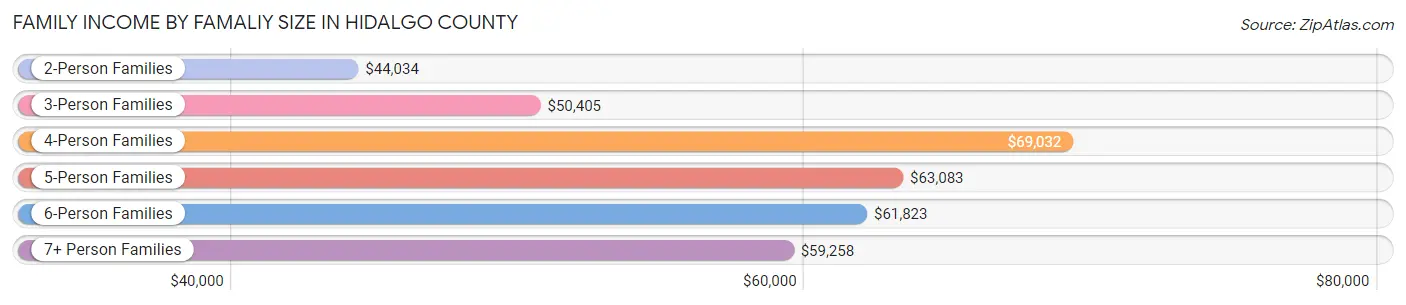
| Income Bracket | # Families | Median Income |
| 2-Person Families | 60,724 (30.0%) | $44,034 |
| 3-Person Families | 43,685 (21.5%) | $50,405 |
| 4-Person Families | 43,710 (21.6%) | $69,032 |
| 5-Person Families | 29,744 (14.7%) | $63,083 |
| 6-Person Families | 13,800 (6.8%) | $61,823 |
| 7+ Person Families | 11,032 (5.4%) | $59,258 |
| Total | 202,695 (100.0%) | $54,864 |
Family Income by Number of Earners in Hidalgo County
The median family income in Hidalgo County is $54,864, with families comprising 3+ earners (30,234) having the highest median family income of $96,915, while families with no earners (28,469) have the lowest median family income of $20,906, accounting for 14.9% and 14.1% of families, respectively.
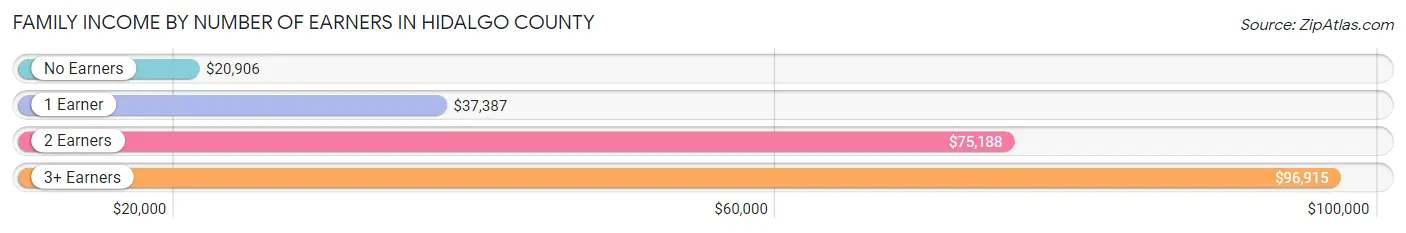
| Number of Earners | # Families | Median Income |
| No Earners | 28,469 (14.1%) | $20,906 |
| 1 Earner | 73,335 (36.2%) | $37,387 |
| 2 Earners | 70,657 (34.9%) | $75,188 |
| 3+ Earners | 30,234 (14.9%) | $96,915 |
| Total | 202,695 (100.0%) | $54,864 |
Household Income in Hidalgo County
Household Income Brackets in Hidalgo County
With 44,290 households falling in the category, the $50,000 to $74,999 income range is the most frequent in Hidalgo County, accounting for 17.2% of all households. In contrast, only 10,042 households (3.9%) fall into the $200,000+ income bracket, making it the least populous group.
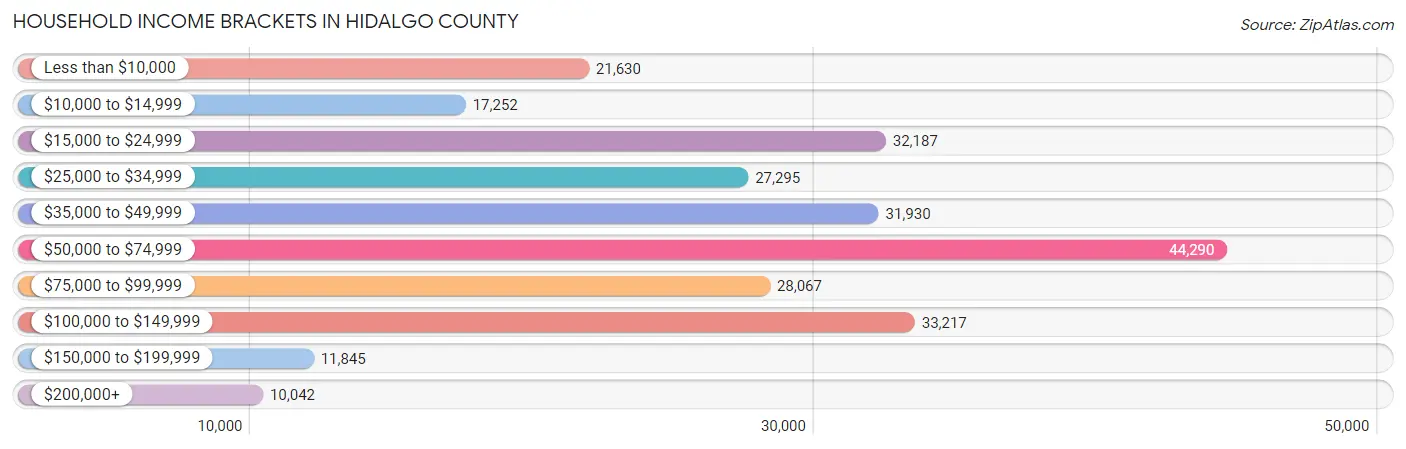
| Income Bracket | # Households | % Households |
| Less than $10,000 | 21,630 | 8.4% |
| $10,000 to $14,999 | 17,252 | 6.7% |
| $15,000 to $24,999 | 32,187 | 12.5% |
| $25,000 to $34,999 | 27,295 | 10.6% |
| $35,000 to $49,999 | 31,930 | 12.4% |
| $50,000 to $74,999 | 44,290 | 17.2% |
| $75,000 to $99,999 | 28,067 | 10.9% |
| $100,000 to $149,999 | 33,217 | 12.9% |
| $150,000 to $199,999 | 11,845 | 4.6% |
| $200,000+ | 10,042 | 3.9% |
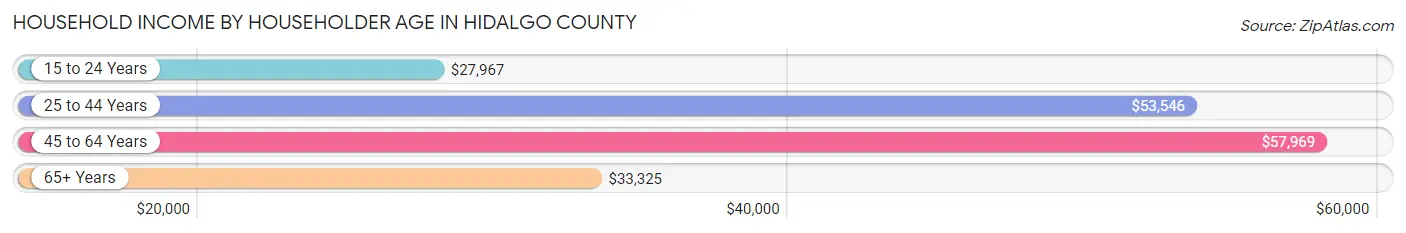
Household Income by Householder Age in Hidalgo County
The median household income in Hidalgo County is $49,371, with the highest median household income of $57,969 found in the 45 to 64 years age bracket for the primary householder. A total of 93,912 households (36.5%) fall into this category. Meanwhile, the 15 to 24 years age bracket for the primary householder has the lowest median household income of $27,967, with 9,999 households (3.9%) in this group.
| Income Bracket | # Households | Median Income |
| 15 to 24 Years | 9,999 (3.9%) | $27,967 |
| 25 to 44 Years | 97,115 (37.7%) | $53,546 |
| 45 to 64 Years | 93,912 (36.5%) | $57,969 |
| 65+ Years | 56,473 (21.9%) | $33,325 |
| Total | 257,499 (100.0%) | $49,371 |
Poverty in Hidalgo County
Income Below Poverty by Sex and Age in Hidalgo County
With 25.9% poverty level for males and 29.4% for females among the residents of Hidalgo County, 6 to 11 year old males and 5 year old females are the most vulnerable to poverty, with 18,478 males (39.6%) and 2,580 females (40.9%) in their respective age groups living below the poverty level.
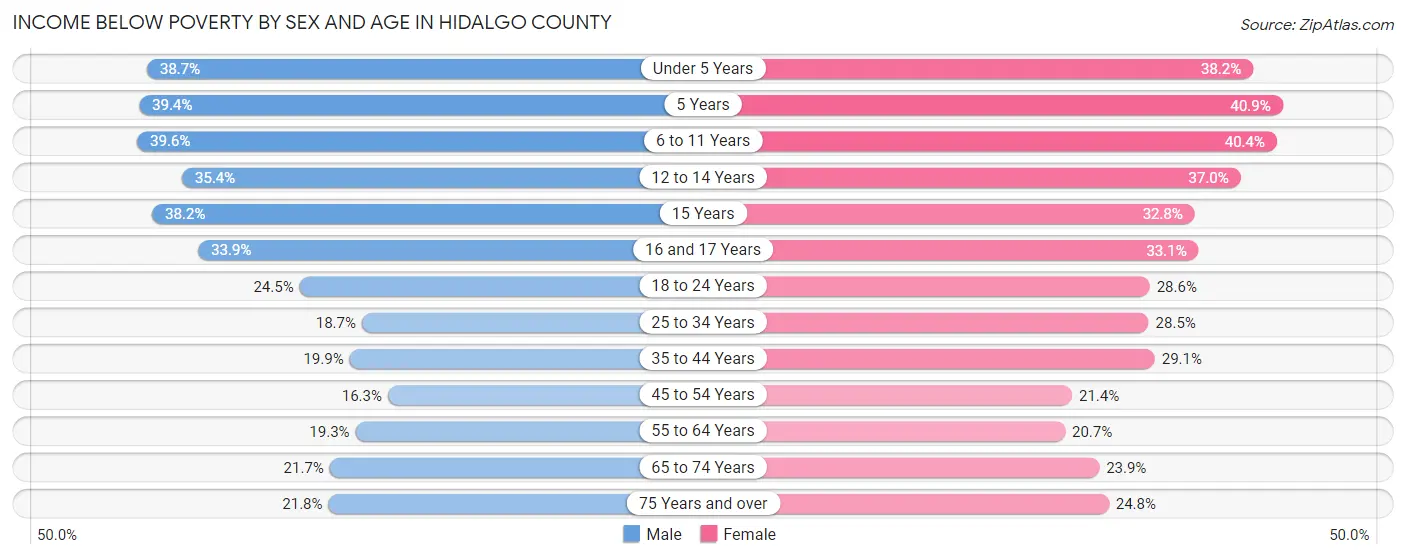
| Age Bracket | Male | Female |
| Under 5 Years | 13,971 (38.7%) | 13,262 (38.2%) |
| 5 Years | 3,029 (39.4%) | 2,580 (40.9%) |
| 6 to 11 Years | 18,478 (39.6%) | 17,995 (40.4%) |
| 12 to 14 Years | 9,018 (35.4%) | 9,563 (37.0%) |
| 15 Years | 2,923 (38.2%) | 2,534 (32.8%) |
| 16 and 17 Years | 5,471 (33.9%) | 5,205 (33.1%) |
| 18 to 24 Years | 12,158 (24.5%) | 14,012 (28.6%) |
| 25 to 34 Years | 10,978 (18.7%) | 16,459 (28.5%) |
| 35 to 44 Years | 10,452 (19.9%) | 15,746 (29.0%) |
| 45 to 54 Years | 7,663 (16.3%) | 10,796 (21.4%) |
| 55 to 64 Years | 6,644 (19.3%) | 8,061 (20.7%) |
| 65 to 74 Years | 5,419 (21.7%) | 7,052 (23.9%) |
| 75 Years and over | 3,832 (21.8%) | 5,975 (24.8%) |
| Total | 110,036 (25.9%) | 129,240 (29.4%) |
Income Above Poverty by Sex and Age in Hidalgo County
According to the poverty statistics in Hidalgo County, males aged 45 to 54 years and females aged 55 to 64 years are the age groups that are most secure financially, with 83.7% of males and 79.3% of females in these age groups living above the poverty line.
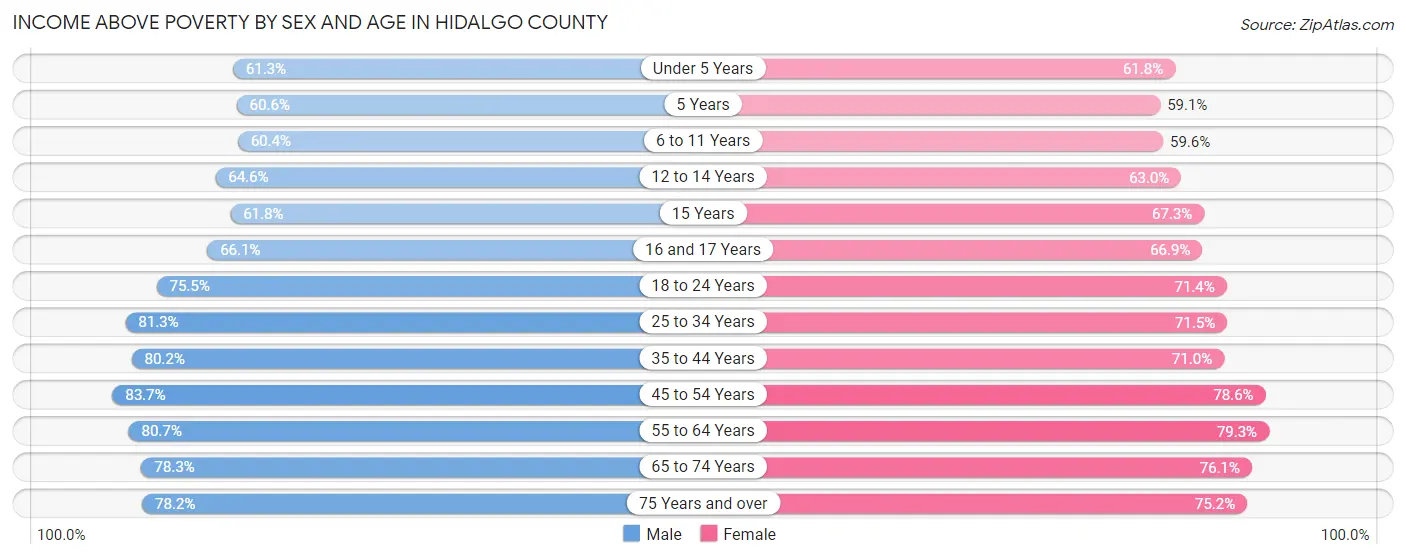
| Age Bracket | Male | Female |
| Under 5 Years | 22,165 (61.3%) | 21,490 (61.8%) |
| 5 Years | 4,664 (60.6%) | 3,728 (59.1%) |
| 6 to 11 Years | 28,233 (60.4%) | 26,581 (59.6%) |
| 12 to 14 Years | 16,455 (64.6%) | 16,275 (63.0%) |
| 15 Years | 4,735 (61.8%) | 5,203 (67.2%) |
| 16 and 17 Years | 10,666 (66.1%) | 10,522 (66.9%) |
| 18 to 24 Years | 37,481 (75.5%) | 35,010 (71.4%) |
| 25 to 34 Years | 47,709 (81.3%) | 41,333 (71.5%) |
| 35 to 44 Years | 42,208 (80.1%) | 38,460 (71.0%) |
| 45 to 54 Years | 39,388 (83.7%) | 39,733 (78.6%) |
| 55 to 64 Years | 27,772 (80.7%) | 30,835 (79.3%) |
| 65 to 74 Years | 19,563 (78.3%) | 22,468 (76.1%) |
| 75 Years and over | 13,738 (78.2%) | 18,133 (75.2%) |
| Total | 314,777 (74.1%) | 309,771 (70.6%) |
Income Below Poverty Among Married-Couple Families in Hidalgo County
The poverty statistics for married-couple families in Hidalgo County show that 18.2% or 24,300 of the total 133,829 families live below the poverty line. Families with 5 or more children have the highest poverty rate of 60.0%, comprising of 1,672 families. On the other hand, families with no children have the lowest poverty rate of 13.1%, which includes 7,694 families.
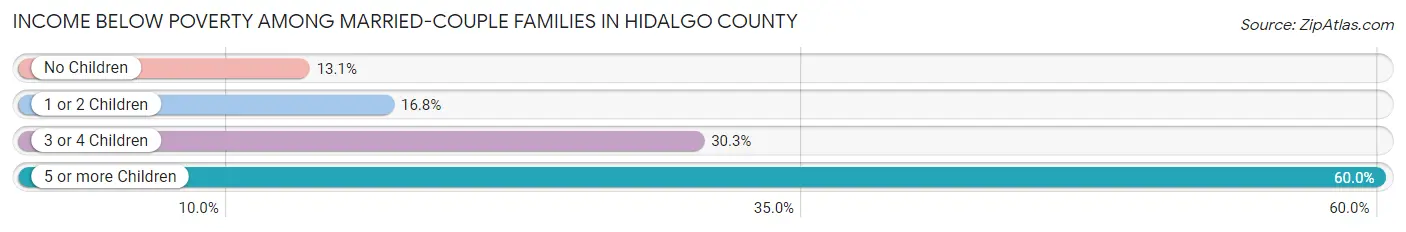
| Children | Above Poverty | Below Poverty |
| No Children | 50,954 (86.9%) | 7,694 (13.1%) |
| 1 or 2 Children | 43,098 (83.2%) | 8,695 (16.8%) |
| 3 or 4 Children | 14,361 (69.7%) | 6,239 (30.3%) |
| 5 or more Children | 1,116 (40.0%) | 1,672 (60.0%) |
| Total | 109,529 (81.8%) | 24,300 (18.2%) |
Income Below Poverty Among Single-Parent Households in Hidalgo County
According to the poverty data in Hidalgo County, 25.6% or 3,777 single-father households and 40.6% or 21,967 single-mother households are living below the poverty line. Among single-father households, those with 5 or more children have the highest poverty rate, with 125 households (43.4%) experiencing poverty. Likewise, among single-mother households, those with 5 or more children have the highest poverty rate, with 1,224 households (76.9%) falling below the poverty line.
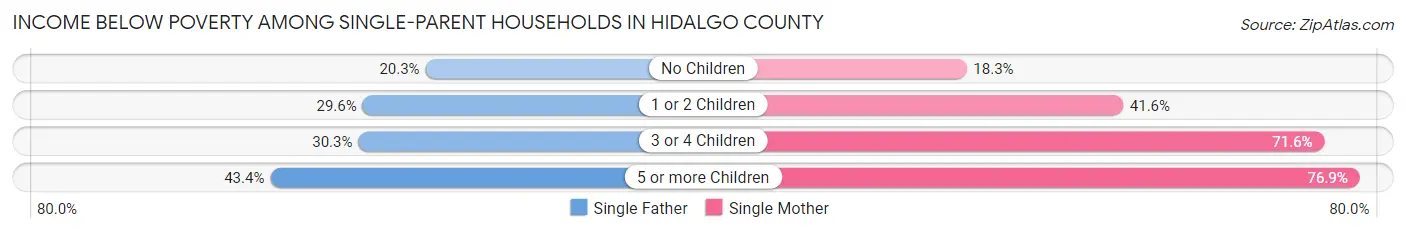
| Children | Single Father | Single Mother |
| No Children | 1,399 (20.3%) | 3,242 (18.3%) |
| 1 or 2 Children | 1,777 (29.6%) | 10,283 (41.6%) |
| 3 or 4 Children | 476 (30.3%) | 7,218 (71.6%) |
| 5 or more Children | 125 (43.4%) | 1,224 (76.9%) |
| Total | 3,777 (25.6%) | 21,967 (40.6%) |
Income Below Poverty Among Married-Couple vs Single-Parent Households in Hidalgo County
The poverty data for Hidalgo County shows that 24,300 of the married-couple family households (18.2%) and 25,744 of the single-parent households (37.4%) are living below the poverty level. Within the married-couple family households, those with 5 or more children have the highest poverty rate, with 1,672 households (60.0%) falling below the poverty line. Among the single-parent households, those with 5 or more children have the highest poverty rate, with 1,349 household (71.8%) living below poverty.
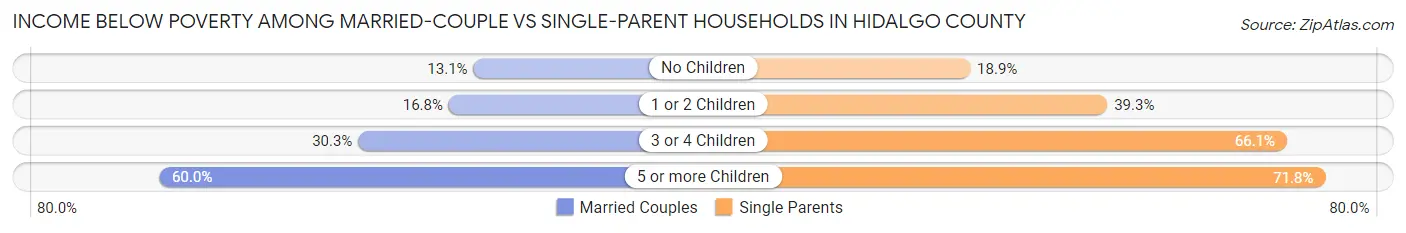
| Children | Married-Couple Families | Single-Parent Households |
| No Children | 7,694 (13.1%) | 4,641 (18.9%) |
| 1 or 2 Children | 8,695 (16.8%) | 12,060 (39.3%) |
| 3 or 4 Children | 6,239 (30.3%) | 7,694 (66.0%) |
| 5 or more Children | 1,672 (60.0%) | 1,349 (71.8%) |
| Total | 24,300 (18.2%) | 25,744 (37.4%) |
Race in Hidalgo County
The most populous races in Hidalgo County are Hispanic or Latino (807,715 | 92.5%), White / Caucasian (445,353 | 51.0%), and Two or more Races (317,400 | 36.3%).
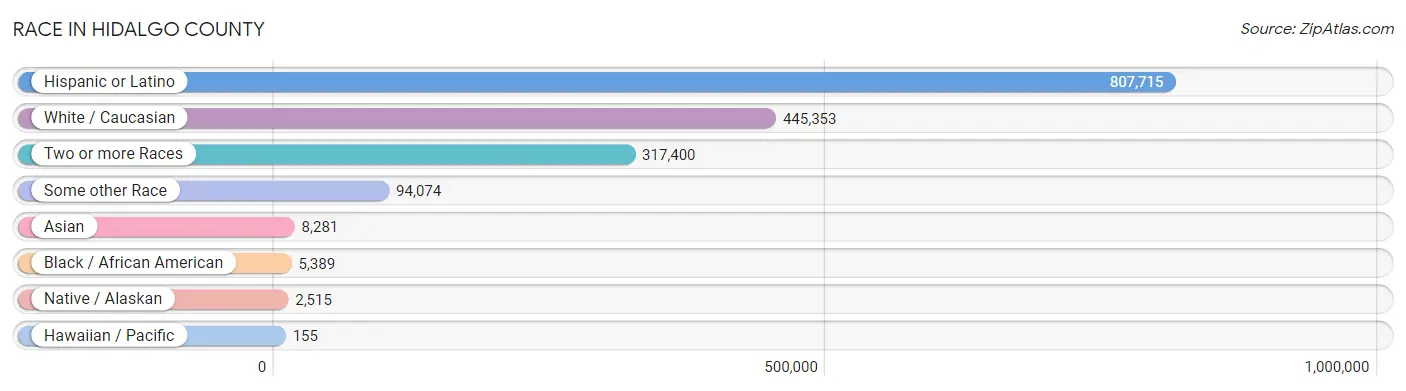
| Race | # Population | % Population |
| Asian | 8,281 | 0.9% |
| Black / African American | 5,389 | 0.6% |
| Hawaiian / Pacific | 155 | 0.0% |
| Hispanic or Latino | 807,715 | 92.5% |
| Native / Alaskan | 2,515 | 0.3% |
| White / Caucasian | 445,353 | 51.0% |
| Two or more Races | 317,400 | 36.3% |
| Some other Race | 94,074 | 10.8% |
| Total | 873,167 | 100.0% |
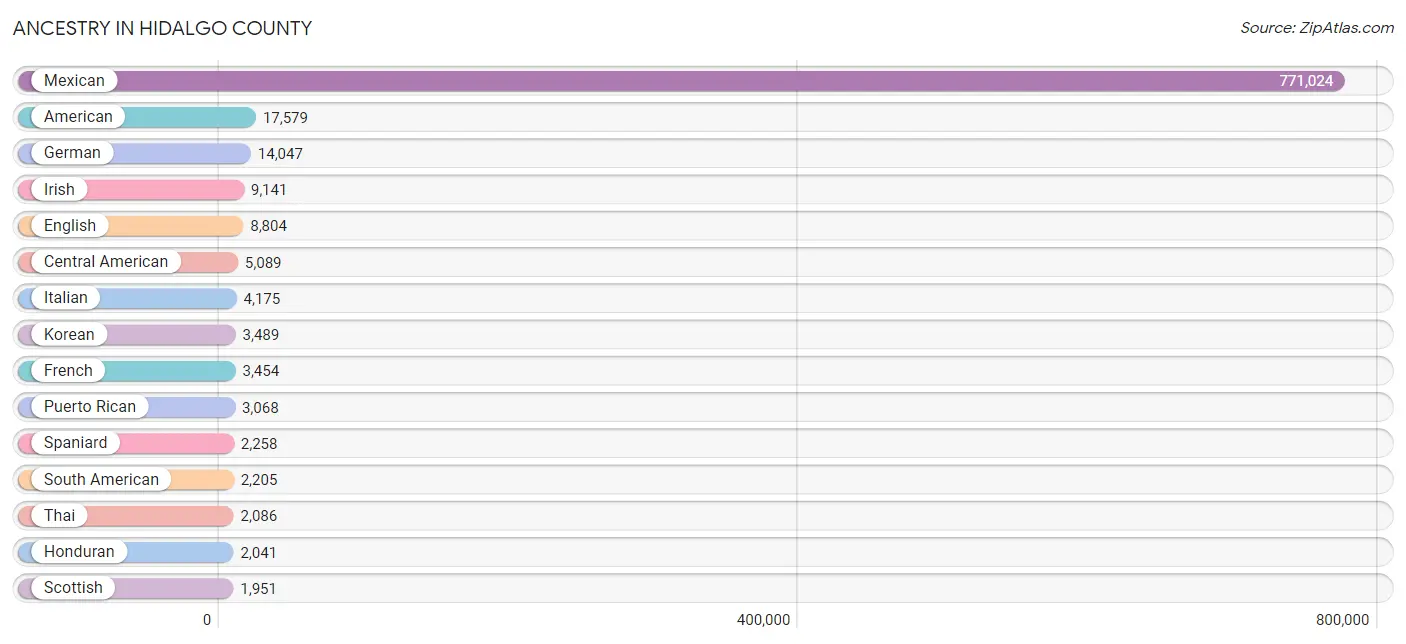
Ancestry in Hidalgo County
The most populous ancestries reported in Hidalgo County are Mexican (771,024 | 88.3%), American (17,579 | 2.0%), German (14,047 | 1.6%), Irish (9,141 | 1.1%), and English (8,804 | 1.0%), together accounting for 94.0% of all Hidalgo County residents.
| Ancestry | # Population | % Population |
| Afghan | 27 | 0.0% |
| African | 339 | 0.0% |
| Alsatian | 18 | 0.0% |
| American | 17,579 | 2.0% |
| Apache | 215 | 0.0% |
| Arab | 498 | 0.1% |
| Argentinean | 134 | 0.0% |
| Armenian | 9 | 0.0% |
| Australian | 67 | 0.0% |
| Austrian | 50 | 0.0% |
| Bahamian | 32 | 0.0% |
| Bangladeshi | 10 | 0.0% |
| Belgian | 141 | 0.0% |
| Belizean | 182 | 0.0% |
| Bhutanese | 643 | 0.1% |
| Blackfeet | 15 | 0.0% |
| Bolivian | 36 | 0.0% |
| Brazilian | 394 | 0.1% |
| British | 505 | 0.1% |
| Bulgarian | 9 | 0.0% |
| Burmese | 728 | 0.1% |
| Cambodian | 15 | 0.0% |
| Canadian | 430 | 0.1% |
| Carpatho Rusyn | 27 | 0.0% |
| Celtic | 20 | 0.0% |
| Central American | 5,089 | 0.6% |
| Central American Indian | 819 | 0.1% |
| Cherokee | 337 | 0.0% |
| Chickasaw | 86 | 0.0% |
| Chilean | 25 | 0.0% |
| Chippewa | 18 | 0.0% |
| Choctaw | 101 | 0.0% |
| Colombian | 860 | 0.1% |
| Comanche | 27 | 0.0% |
| Costa Rican | 18 | 0.0% |
| Croatian | 48 | 0.0% |
| Cuban | 729 | 0.1% |
| Czech | 455 | 0.1% |
| Czechoslovakian | 84 | 0.0% |
| Danish | 253 | 0.0% |
| Delaware | 90 | 0.0% |
| Dominican | 687 | 0.1% |
| Dutch | 1,178 | 0.1% |
| Eastern European | 60 | 0.0% |
| Ecuadorian | 83 | 0.0% |
| Egyptian | 129 | 0.0% |
| English | 8,804 | 1.0% |
| Estonian | 12 | 0.0% |
| Ethiopian | 33 | 0.0% |
| European | 1,572 | 0.2% |
| Fijian | 54 | 0.0% |
| Filipino | 122 | 0.0% |
| Finnish | 153 | 0.0% |
| French | 3,454 | 0.4% |
| French Canadian | 349 | 0.0% |
| German | 14,047 | 1.6% |
| Greek | 196 | 0.0% |
| Guamanian / Chamorro | 11 | 0.0% |
| Guatemalan | 682 | 0.1% |
| Haitian | 84 | 0.0% |
| Honduran | 2,041 | 0.2% |
| Hungarian | 99 | 0.0% |
| Icelander | 28 | 0.0% |
| Indian (Asian) | 1,145 | 0.1% |
| Indonesian | 51 | 0.0% |
| Iranian | 122 | 0.0% |
| Irish | 9,141 | 1.1% |
| Iroquois | 7 | 0.0% |
| Israeli | 41 | 0.0% |
| Italian | 4,175 | 0.5% |
| Jamaican | 150 | 0.0% |
| Kiowa | 34 | 0.0% |
| Korean | 3,489 | 0.4% |
| Laotian | 113 | 0.0% |
| Latvian | 3 | 0.0% |
| Lebanese | 206 | 0.0% |
| Lithuanian | 24 | 0.0% |
| Malaysian | 10 | 0.0% |
| Maltese | 25 | 0.0% |
| Mexican | 771,024 | 88.3% |
| Mexican American Indian | 1,590 | 0.2% |
| Native Hawaiian | 83 | 0.0% |
| Navajo | 79 | 0.0% |
| Nicaraguan | 493 | 0.1% |
| Nigerian | 297 | 0.0% |
| Northern European | 267 | 0.0% |
| Norwegian | 1,461 | 0.2% |
| Okinawan | 11 | 0.0% |
| Pakistani | 34 | 0.0% |
| Panamanian | 95 | 0.0% |
| Pennsylvania German | 21 | 0.0% |
| Peruvian | 364 | 0.0% |
| Polish | 1,315 | 0.2% |
| Portuguese | 326 | 0.0% |
| Potawatomi | 33 | 0.0% |
| Pueblo | 18 | 0.0% |
| Puerto Rican | 3,068 | 0.4% |
| Puget Sound Salish | 8 | 0.0% |
| Romanian | 46 | 0.0% |
| Russian | 118 | 0.0% |
| Salvadoran | 1,760 | 0.2% |
| Samoan | 5 | 0.0% |
| Scandinavian | 260 | 0.0% |
| Scotch-Irish | 721 | 0.1% |
| Scottish | 1,951 | 0.2% |
| Seminole | 7 | 0.0% |
| Serbian | 16 | 0.0% |
| Slavic | 6 | 0.0% |
| Slovak | 80 | 0.0% |
| Slovene | 148 | 0.0% |
| South American | 2,205 | 0.3% |
| Spaniard | 2,258 | 0.3% |
| Spanish | 1,093 | 0.1% |
| Spanish American | 35 | 0.0% |
| Sri Lankan | 518 | 0.1% |
| Subsaharan African | 669 | 0.1% |
| Swedish | 1,248 | 0.1% |
| Swiss | 179 | 0.0% |
| Syrian | 39 | 0.0% |
| Thai | 2,086 | 0.2% |
| Turkish | 25 | 0.0% |
| Ukrainian | 111 | 0.0% |
| Uruguayan | 7 | 0.0% |
| Venezuelan | 598 | 0.1% |
| Vietnamese | 118 | 0.0% |
| Welsh | 385 | 0.0% |
| West Indian | 15 | 0.0% |
| Yaqui | 7 | 0.0% |
| Yugoslavian | 19 | 0.0% | View All 129 Rows |
Immigrants in Hidalgo County
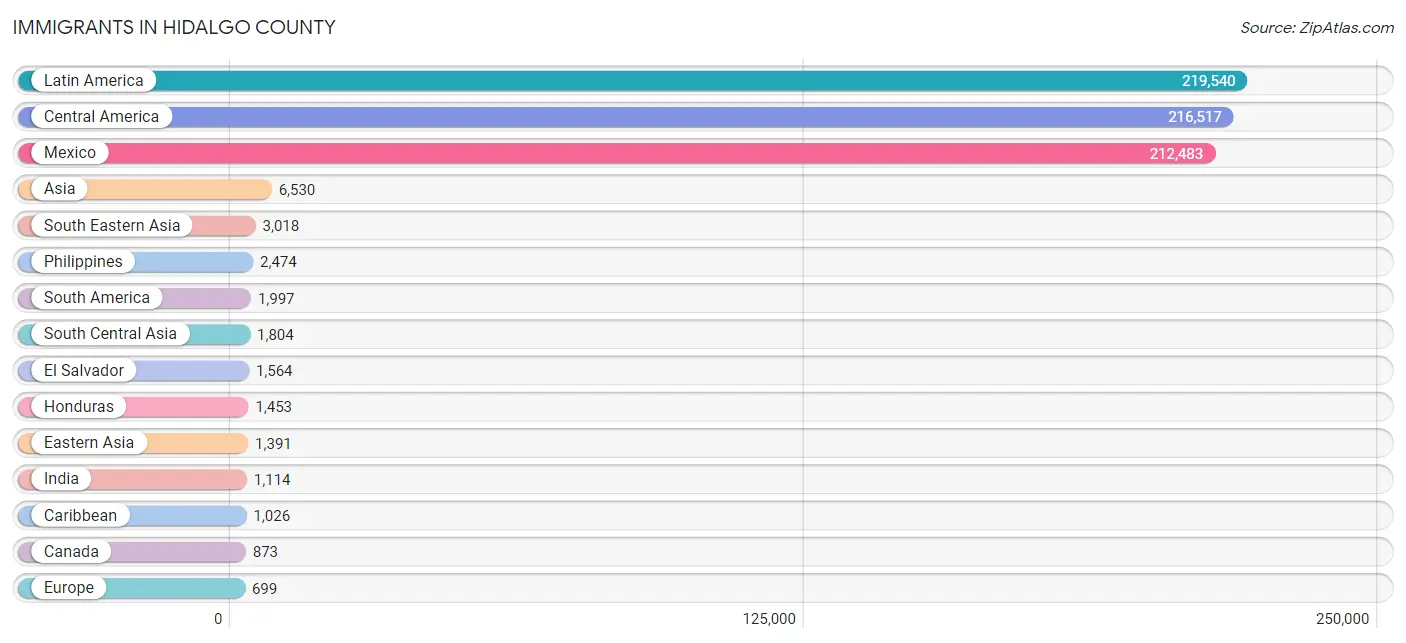
The most numerous immigrant groups reported in Hidalgo County came from Latin America (219,540 | 25.1%), Central America (216,517 | 24.8%), Mexico (212,483 | 24.3%), Asia (6,530 | 0.7%), and South Eastern Asia (3,018 | 0.4%), together accounting for 75.4% of all Hidalgo County residents.
| Immigration Origin | # Population | % Population |
| Afghanistan | 27 | 0.0% |
| Africa | 634 | 0.1% |
| Argentina | 104 | 0.0% |
| Asia | 6,530 | 0.7% |
| Australia | 36 | 0.0% |
| Bangladesh | 242 | 0.0% |
| Belgium | 54 | 0.0% |
| Belize | 78 | 0.0% |
| Bolivia | 92 | 0.0% |
| Brazil | 178 | 0.0% |
| Cameroon | 56 | 0.0% |
| Canada | 873 | 0.1% |
| Caribbean | 1,026 | 0.1% |
| Central America | 216,517 | 24.8% |
| Chile | 12 | 0.0% |
| China | 402 | 0.1% |
| Colombia | 605 | 0.1% |
| Costa Rica | 18 | 0.0% |
| Cuba | 430 | 0.1% |
| Czechoslovakia | 14 | 0.0% |
| Denmark | 38 | 0.0% |
| Dominica | 20 | 0.0% |
| Dominican Republic | 414 | 0.1% |
| Eastern Africa | 33 | 0.0% |
| Eastern Asia | 1,391 | 0.2% |
| Eastern Europe | 104 | 0.0% |
| Ecuador | 90 | 0.0% |
| Egypt | 26 | 0.0% |
| El Salvador | 1,564 | 0.2% |
| England | 126 | 0.0% |
| Ethiopia | 33 | 0.0% |
| Europe | 699 | 0.1% |
| France | 10 | 0.0% |
| Germany | 185 | 0.0% |
| Ghana | 60 | 0.0% |
| Guatemala | 607 | 0.1% |
| Haiti | 68 | 0.0% |
| Honduras | 1,453 | 0.2% |
| Hong Kong | 34 | 0.0% |
| Hungary | 4 | 0.0% |
| India | 1,114 | 0.1% |
| Indonesia | 118 | 0.0% |
| Iran | 93 | 0.0% |
| Iraq | 46 | 0.0% |
| Ireland | 5 | 0.0% |
| Israel | 16 | 0.0% |
| Italy | 23 | 0.0% |
| Jamaica | 9 | 0.0% |
| Japan | 399 | 0.1% |
| Jordan | 12 | 0.0% |
| Korea | 590 | 0.1% |
| Latin America | 219,540 | 25.1% |
| Malaysia | 23 | 0.0% |
| Mexico | 212,483 | 24.3% |
| Middle Africa | 56 | 0.0% |
| Nepal | 132 | 0.0% |
| Netherlands | 1 | 0.0% |
| Nicaragua | 280 | 0.0% |
| Nigeria | 402 | 0.1% |
| Northern Africa | 26 | 0.0% |
| Northern Europe | 264 | 0.0% |
| Oceania | 47 | 0.0% |
| Pakistan | 57 | 0.0% |
| Panama | 34 | 0.0% |
| Peru | 259 | 0.0% |
| Philippines | 2,474 | 0.3% |
| Poland | 20 | 0.0% |
| Romania | 29 | 0.0% |
| Russia | 18 | 0.0% |
| Saudi Arabia | 120 | 0.0% |
| Scotland | 14 | 0.0% |
| South America | 1,997 | 0.2% |
| South Central Asia | 1,804 | 0.2% |
| South Eastern Asia | 3,018 | 0.4% |
| Southern Europe | 81 | 0.0% |
| Spain | 47 | 0.0% |
| Sri Lanka | 93 | 0.0% |
| Taiwan | 216 | 0.0% |
| Thailand | 48 | 0.0% |
| Trinidad and Tobago | 85 | 0.0% |
| Turkey | 8 | 0.0% |
| Ukraine | 7 | 0.0% |
| Uruguay | 14 | 0.0% |
| Venezuela | 619 | 0.1% |
| Vietnam | 324 | 0.0% |
| Western Africa | 462 | 0.1% |
| Western Asia | 297 | 0.0% |
| Western Europe | 250 | 0.0% | View All 88 Rows |
Sex and Age in Hidalgo County
Sex and Age in Hidalgo County
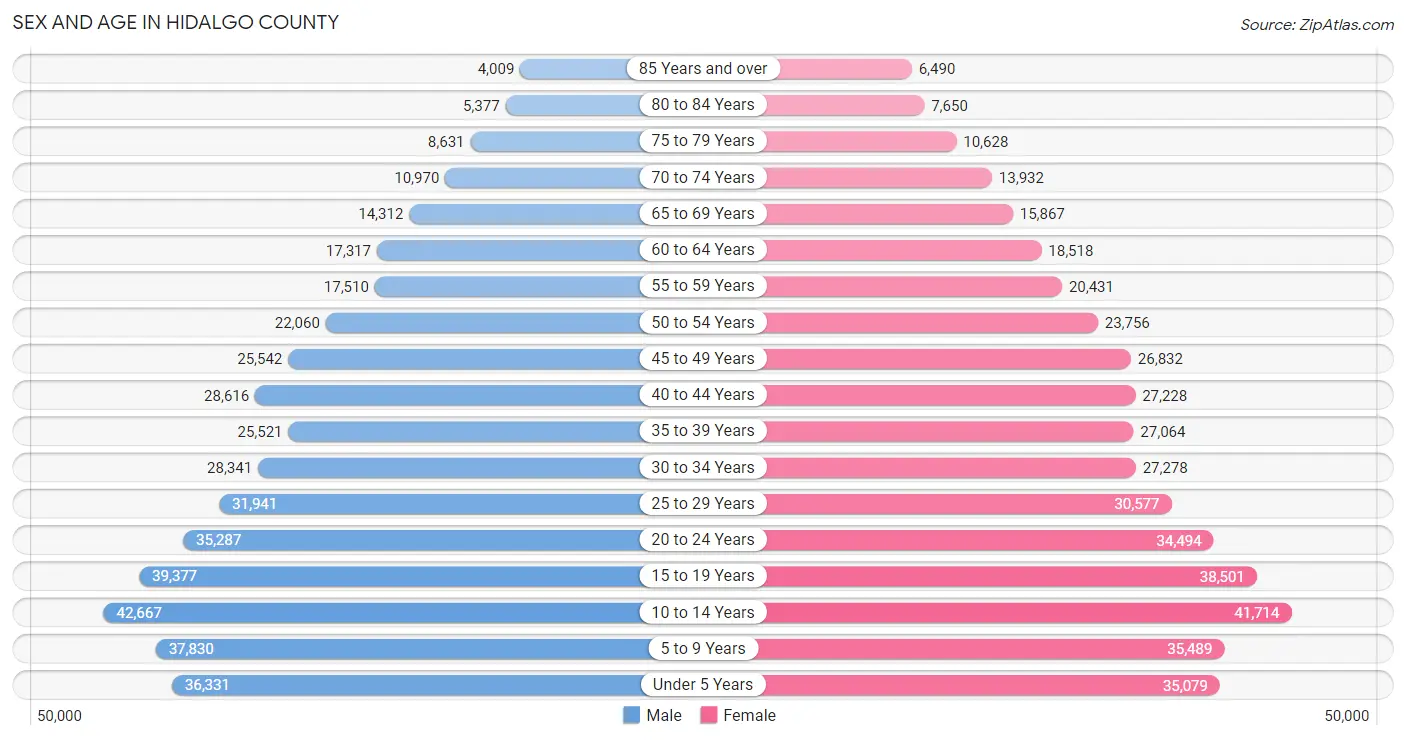
The most populous age groups in Hidalgo County are 10 to 14 Years (42,667 | 9.9%) for men and 10 to 14 Years (41,714 | 9.5%) for women.
| Age Bracket | Male | Female |
| Under 5 Years | 36,331 (8.4%) | 35,079 (7.9%) |
| 5 to 9 Years | 37,830 (8.8%) | 35,489 (8.0%) |
| 10 to 14 Years | 42,667 (9.9%) | 41,714 (9.5%) |
| 15 to 19 Years | 39,377 (9.1%) | 38,501 (8.7%) |
| 20 to 24 Years | 35,287 (8.2%) | 34,494 (7.8%) |
| 25 to 29 Years | 31,941 (7.4%) | 30,577 (6.9%) |
| 30 to 34 Years | 28,341 (6.6%) | 27,278 (6.2%) |
| 35 to 39 Years | 25,521 (5.9%) | 27,064 (6.1%) |
| 40 to 44 Years | 28,616 (6.6%) | 27,228 (6.2%) |
| 45 to 49 Years | 25,542 (5.9%) | 26,832 (6.1%) |
| 50 to 54 Years | 22,060 (5.1%) | 23,756 (5.4%) |
| 55 to 59 Years | 17,510 (4.1%) | 20,431 (4.6%) |
| 60 to 64 Years | 17,317 (4.0%) | 18,518 (4.2%) |
| 65 to 69 Years | 14,312 (3.3%) | 15,867 (3.6%) |
| 70 to 74 Years | 10,970 (2.5%) | 13,932 (3.2%) |
| 75 to 79 Years | 8,631 (2.0%) | 10,628 (2.4%) |
| 80 to 84 Years | 5,377 (1.3%) | 7,650 (1.7%) |
| 85 Years and over | 4,009 (0.9%) | 6,490 (1.5%) |
| Total | 431,639 (100.0%) | 441,528 (100.0%) |
Families and Households in Hidalgo County
Median Family Size in Hidalgo County
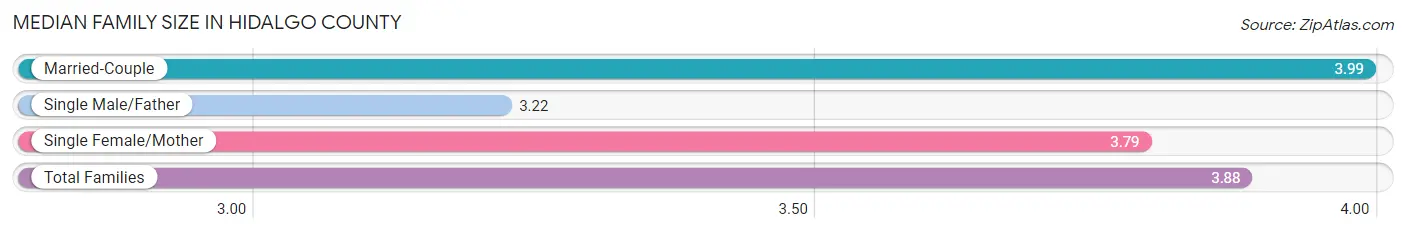
The median family size in Hidalgo County is 3.88 persons per family, with married-couple families (133,829 | 66.0%) accounting for the largest median family size of 3.99 persons per family. On the other hand, single male/father families (14,757 | 7.3%) represent the smallest median family size with 3.22 persons per family.
| Family Type | # Families | Family Size |
| Married-Couple | 133,829 (66.0%) | 3.99 |
| Single Male/Father | 14,757 (7.3%) | 3.22 |
| Single Female/Mother | 54,109 (26.7%) | 3.79 |
| Total Families | 202,695 (100.0%) | 3.88 |
Median Household Size in Hidalgo County
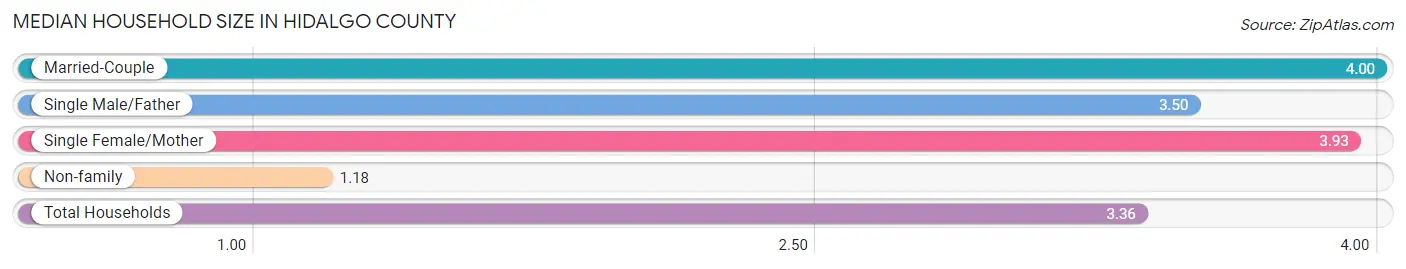
The median household size in Hidalgo County is 3.36 persons per household, with married-couple households (133,829 | 52.0%) accounting for the largest median household size of 4 persons per household. non-family households (54,804 | 21.3%) represent the smallest median household size with 1.18 persons per household.
| Household Type | # Households | Household Size |
| Married-Couple | 133,829 (52.0%) | 4.00 |
| Single Male/Father | 14,757 (5.7%) | 3.50 |
| Single Female/Mother | 54,109 (21.0%) | 3.93 |
| Non-family | 54,804 (21.3%) | 1.18 |
| Total Households | 257,499 (100.0%) | 3.36 |
Household Size by Marriage Status in Hidalgo County
Out of a total of 257,499 households in Hidalgo County, 202,695 (78.7%) are family households, while 54,804 (21.3%) are nonfamily households. The most numerous type of family households are 2-person households, comprising 57,361, and the most common type of nonfamily households are 1-person households, comprising 46,671.
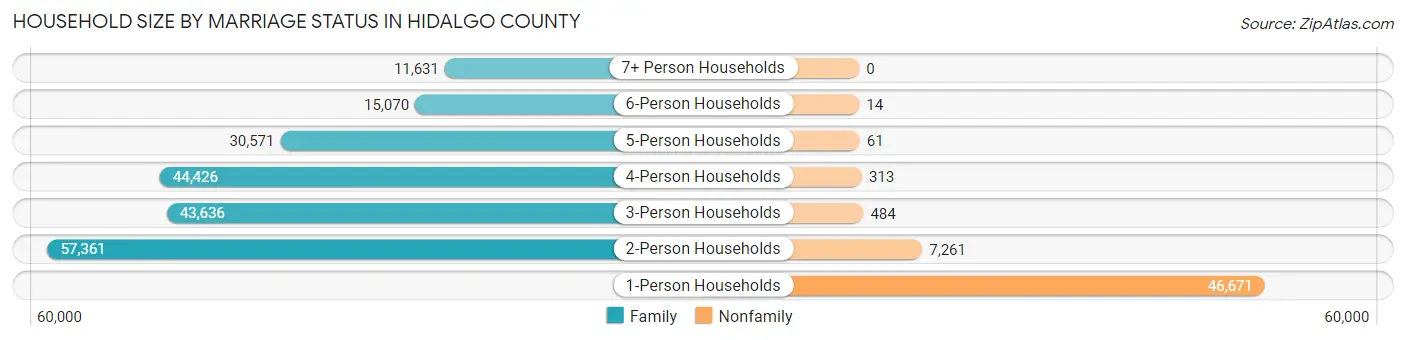
| Household Size | Family Households | Nonfamily Households |
| 1-Person Households | - | 46,671 (18.1%) |
| 2-Person Households | 57,361 (22.3%) | 7,261 (2.8%) |
| 3-Person Households | 43,636 (17.0%) | 484 (0.2%) |
| 4-Person Households | 44,426 (17.2%) | 313 (0.1%) |
| 5-Person Households | 30,571 (11.9%) | 61 (0.0%) |
| 6-Person Households | 15,070 (5.9%) | 14 (0.0%) |
| 7+ Person Households | 11,631 (4.5%) | 0 (0.0%) |
| Total | 202,695 (78.7%) | 54,804 (21.3%) |
Female Fertility in Hidalgo County
Fertility by Age in Hidalgo County
Average fertility rate in Hidalgo County is 62.0 births per 1,000 women. Women in the age bracket of 20 to 34 years have the highest fertility rate with 112.0 births per 1,000 women. Women in the age bracket of 20 to 34 years acount for 77.4% of all women with births.
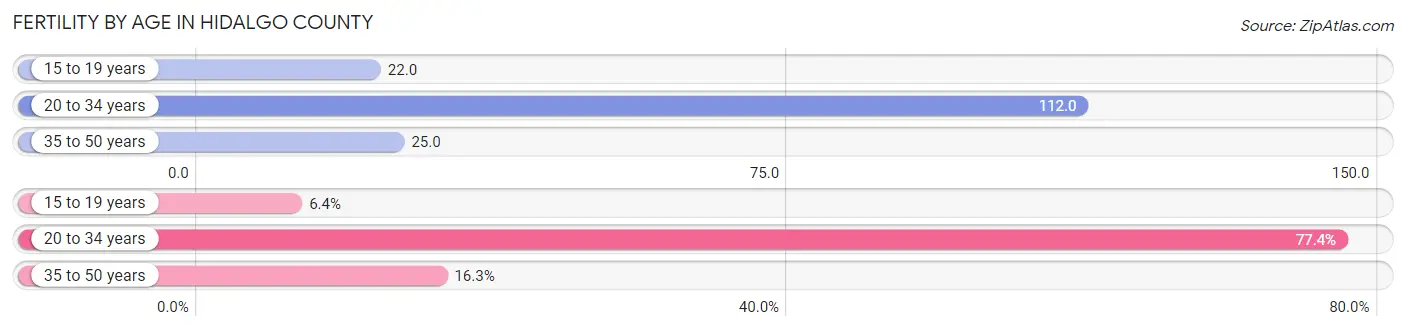
| Age Bracket | Women with Births | Births / 1,000 Women |
| 15 to 19 years | 855 (6.4%) | 22.0 |
| 20 to 34 years | 10,352 (77.4%) | 112.0 |
| 35 to 50 years | 2,175 (16.3%) | 25.0 |
| Total | 13,382 (100.0%) | 62.0 |
Fertility by Age by Marriage Status in Hidalgo County
66.3% of women with births (13,382) in Hidalgo County are married. The highest percentage of unmarried women with births falls into 15 to 19 years age bracket with 81.5% of them unmarried at the time of birth, while the lowest percentage of unmarried women with births belong to 35 to 50 years age bracket with 21.5% of them unmarried.
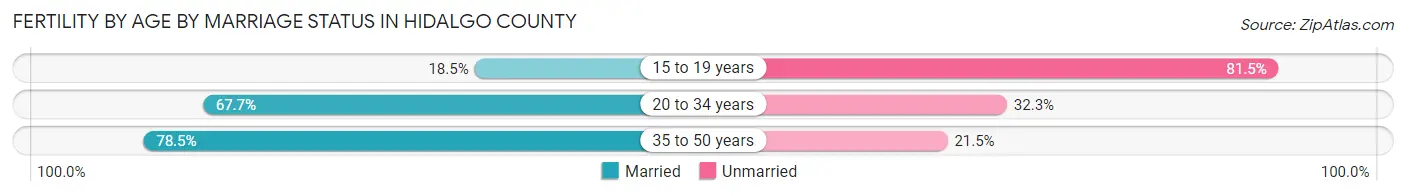
| Age Bracket | Married | Unmarried |
| 15 to 19 years | 158 (18.5%) | 697 (81.5%) |
| 20 to 34 years | 7,008 (67.7%) | 3,344 (32.3%) |
| 35 to 50 years | 1,707 (78.5%) | 468 (21.5%) |
| Total | 8,872 (66.3%) | 4,510 (33.7%) |
Fertility by Education in Hidalgo County
Average fertility rate in Hidalgo County is 62.0 births per 1,000 women. Women with the education attainment of graduate degree have the highest fertility rate of 77.0 births per 1,000 women, while women with the education attainment of bachelor's degree have the lowest fertility at 50.0 births per 1,000 women. Women with the education attainment of college or associate's degree represent 34.0% of all women with births.
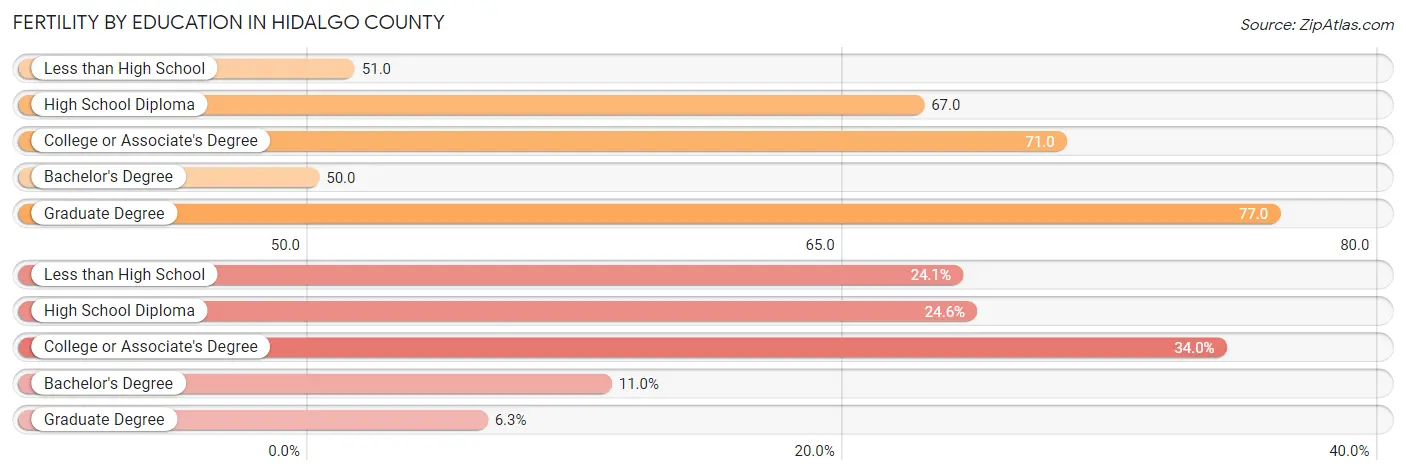
| Educational Attainment | Women with Births | Births / 1,000 Women |
| Less than High School | 3,226 (24.1%) | 51.0 |
| High School Diploma | 3,297 (24.6%) | 67.0 |
| College or Associate's Degree | 4,549 (34.0%) | 71.0 |
| Bachelor's Degree | 1,466 (11.0%) | 50.0 |
| Graduate Degree | 844 (6.3%) | 77.0 |
| Total | 13,382 (100.0%) | 62.0 |
Fertility by Education by Marriage Status in Hidalgo County
33.7% of women with births in Hidalgo County are unmarried. Women with the educational attainment of bachelor's degree are most likely to be married with 86.9% of them married at childbirth, while women with the educational attainment of high school diploma are least likely to be married with 41.4% of them unmarried at childbirth.
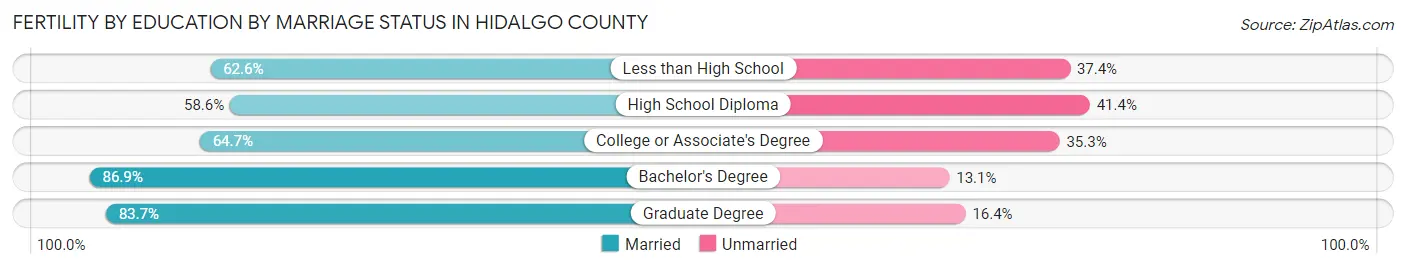
| Educational Attainment | Married | Unmarried |
| Less than High School | 2,019 (62.6%) | 1,207 (37.4%) |
| High School Diploma | 1,932 (58.6%) | 1,365 (41.4%) |
| College or Associate's Degree | 2,943 (64.7%) | 1,606 (35.3%) |
| Bachelor's Degree | 1,274 (86.9%) | 192 (13.1%) |
| Graduate Degree | 706 (83.7%) | 138 (16.4%) |
| Total | 8,872 (66.3%) | 4,510 (33.7%) |
Employment Characteristics in Hidalgo County
Employment by Class of Employer in Hidalgo County
Among the 332,795 employed individuals in Hidalgo County, private company employees (217,014 | 65.2%), self-employed (not incorporated) (37,112 | 11.2%), and local government employees (27,390 | 8.2%) make up the most common classes of employment.
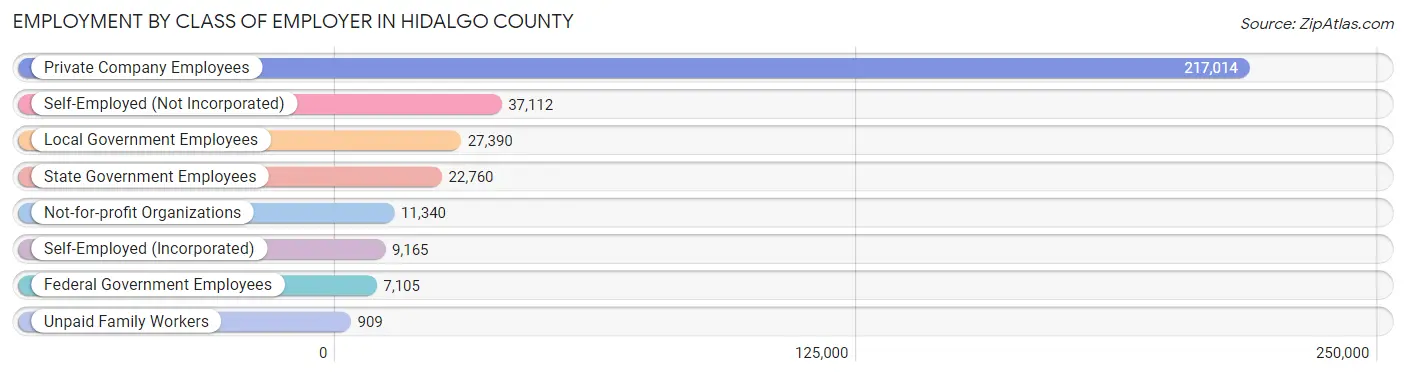
| Employer Class | # Employees | % Employees |
| Private Company Employees | 217,014 | 65.2% |
| Self-Employed (Incorporated) | 9,165 | 2.8% |
| Self-Employed (Not Incorporated) | 37,112 | 11.2% |
| Not-for-profit Organizations | 11,340 | 3.4% |
| Local Government Employees | 27,390 | 8.2% |
| State Government Employees | 22,760 | 6.8% |
| Federal Government Employees | 7,105 | 2.1% |
| Unpaid Family Workers | 909 | 0.3% |
| Total | 332,795 | 100.0% |
Employment Status by Age in Hidalgo County
According to the labor force statistics for Hidalgo County, out of the total population over 16 years of age (628,638), 58.8% or 369,639 individuals are in the labor force, with 7.6% or 28,093 of them unemployed. The age group with the highest labor force participation rate is 30 to 34 years, with 78.0% or 43,383 individuals in the labor force. Within the labor force, the 16 to 19 years age range has the highest percentage of unemployed individuals, with 21.6% or 3,602 of them being unemployed.
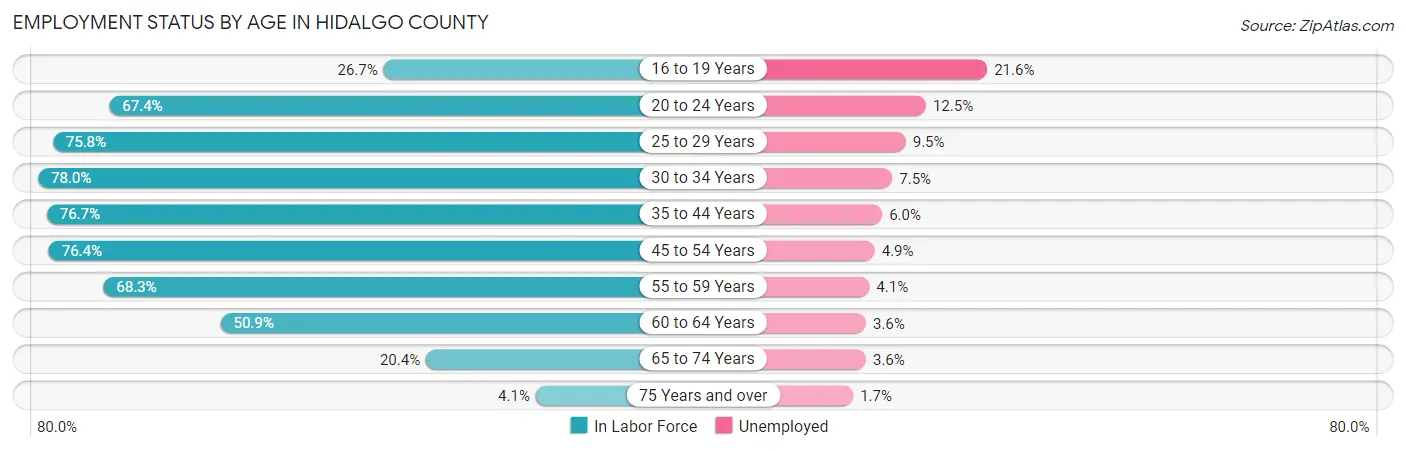
| Age Bracket | In Labor Force | Unemployed |
| 16 to 19 Years | 16,677 (26.7%) | 3,602 (21.6%) |
| 20 to 24 Years | 47,032 (67.4%) | 5,879 (12.5%) |
| 25 to 29 Years | 47,389 (75.8%) | 4,502 (9.5%) |
| 30 to 34 Years | 43,383 (78.0%) | 3,254 (7.5%) |
| 35 to 44 Years | 83,165 (76.7%) | 4,990 (6.0%) |
| 45 to 54 Years | 75,017 (76.4%) | 3,676 (4.9%) |
| 55 to 59 Years | 25,914 (68.3%) | 1,062 (4.1%) |
| 60 to 64 Years | 18,240 (50.9%) | 657 (3.6%) |
| 65 to 74 Years | 11,237 (20.4%) | 405 (3.6%) |
| 75 Years and over | 1,754 (4.1%) | 30 (1.7%) |
| Total | 369,639 (58.8%) | 28,093 (7.6%) |
Employment Status by Educational Attainment in Hidalgo County
According to labor force statistics for Hidalgo County, 73.6% of individuals (293,320) out of the total population between 25 and 64 years of age (398,532) are in the labor force, with 6.2% or 18,186 of them being unemployed. The group with the highest labor force participation rate are those with the educational attainment of bachelor's degree or higher, with 85.1% or 72,418 individuals in the labor force. Within the labor force, individuals with high school diploma education have the highest percentage of unemployment, with 8.5% or 6,248 of them being unemployed.
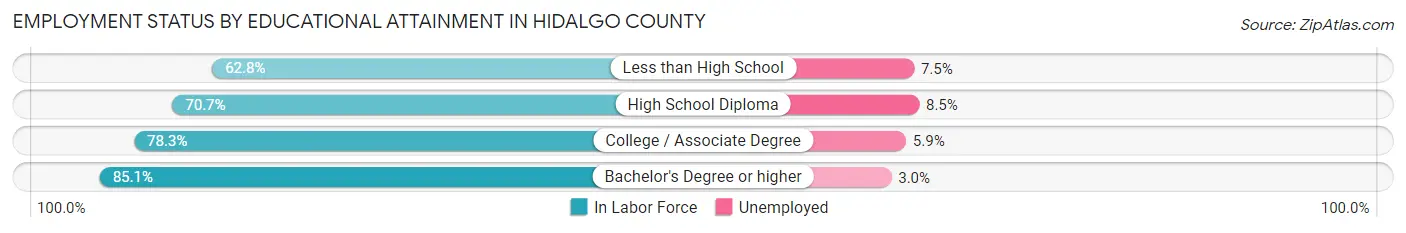
| Educational Attainment | In Labor Force | Unemployed |
| Less than High School | 68,091 (62.8%) | 8,132 (7.5%) |
| High School Diploma | 73,511 (70.7%) | 8,838 (8.5%) |
| College / Associate Degree | 79,109 (78.3%) | 5,961 (5.9%) |
| Bachelor's Degree or higher | 72,418 (85.1%) | 2,553 (3.0%) |
| Total | 293,320 (73.6%) | 24,709 (6.2%) |
Employment Occupations by Sex in Hidalgo County
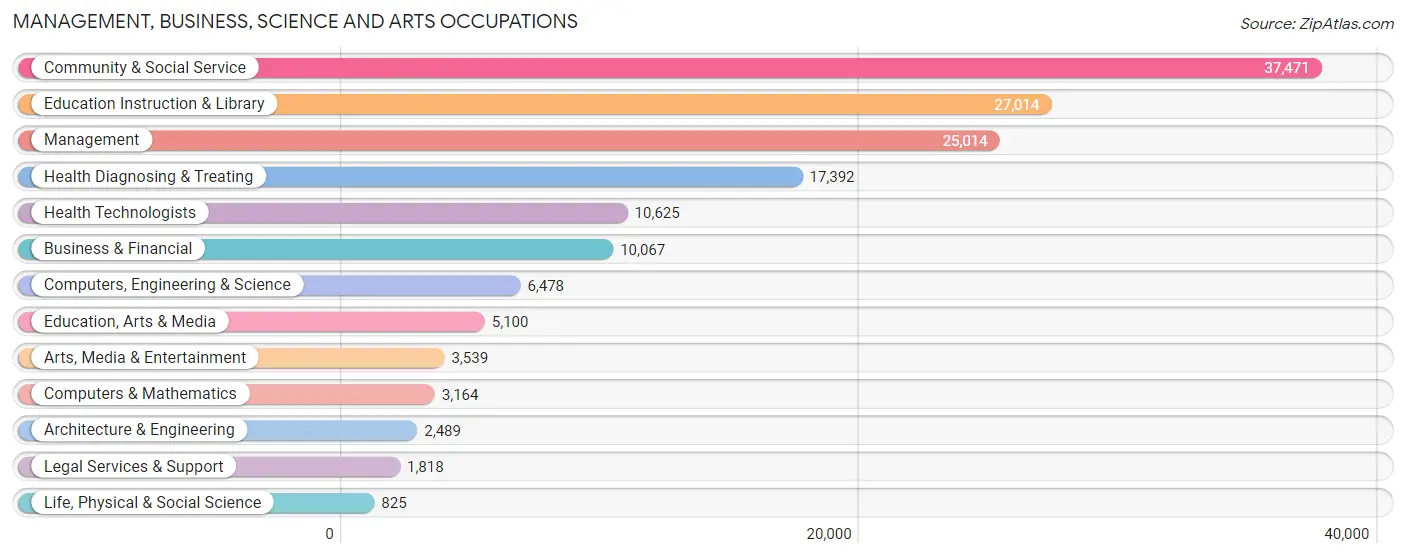
Management, Business, Science and Arts Occupations
The most common Management, Business, Science and Arts occupations in Hidalgo County are Community & Social Service (37,471 | 11.0%), Education Instruction & Library (27,014 | 7.9%), Management (25,014 | 7.3%), Health Diagnosing & Treating (17,392 | 5.1%), and Health Technologists (10,625 | 3.1%).
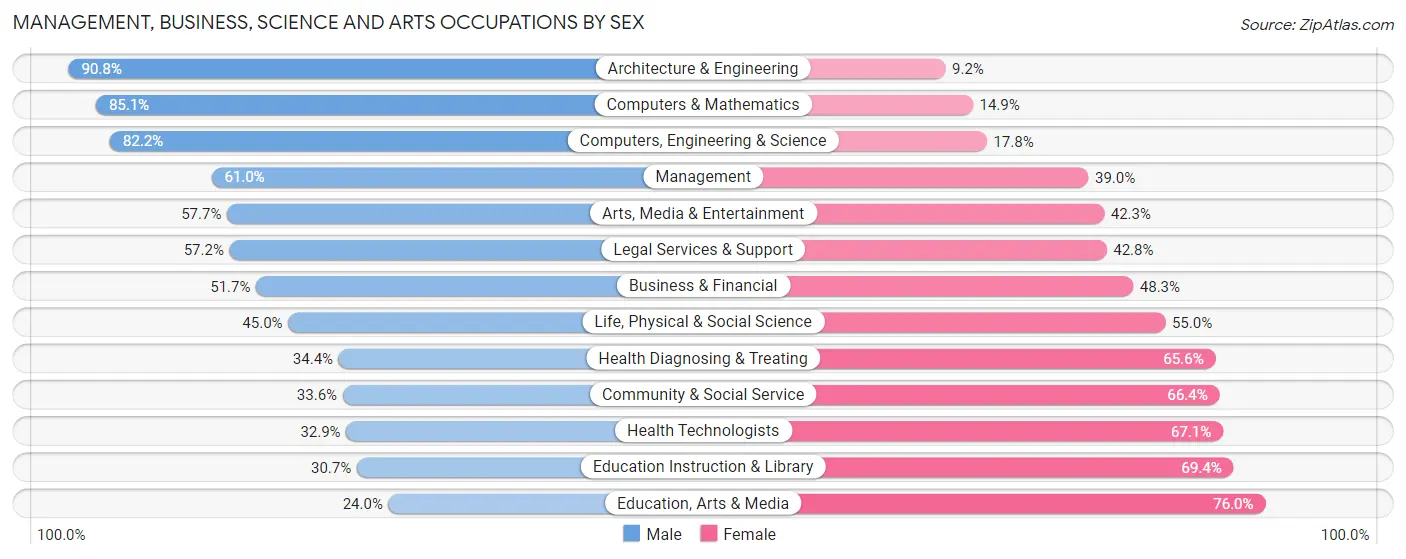
Management, Business, Science and Arts Occupations by Sex
Within the Management, Business, Science and Arts occupations in Hidalgo County, the most male-oriented occupations are Architecture & Engineering (90.8%), Computers & Mathematics (85.1%), and Computers, Engineering & Science (82.2%), while the most female-oriented occupations are Education, Arts & Media (76.0%), Education Instruction & Library (69.4%), and Health Technologists (67.1%).
| Occupation | Male | Female |
| Management | 15,263 (61.0%) | 9,751 (39.0%) |
| Business & Financial | 5,202 (51.7%) | 4,865 (48.3%) |
| Computers, Engineering & Science | 5,325 (82.2%) | 1,153 (17.8%) |
| Computers & Mathematics | 2,693 (85.1%) | 471 (14.9%) |
| Architecture & Engineering | 2,261 (90.8%) | 228 (9.2%) |
| Life, Physical & Social Science | 371 (45.0%) | 454 (55.0%) |
| Community & Social Service | 12,590 (33.6%) | 24,881 (66.4%) |
| Education, Arts & Media | 1,226 (24.0%) | 3,874 (76.0%) |
| Legal Services & Support | 1,040 (57.2%) | 778 (42.8%) |
| Education Instruction & Library | 8,281 (30.6%) | 18,733 (69.4%) |
| Arts, Media & Entertainment | 2,043 (57.7%) | 1,496 (42.3%) |
| Health Diagnosing & Treating | 5,989 (34.4%) | 11,403 (65.6%) |
| Health Technologists | 3,491 (32.9%) | 7,134 (67.1%) |
| Total (Category) | 44,369 (46.0%) | 52,053 (54.0%) |
| Total (Overall) | 191,020 (56.0%) | 149,933 (44.0%) |
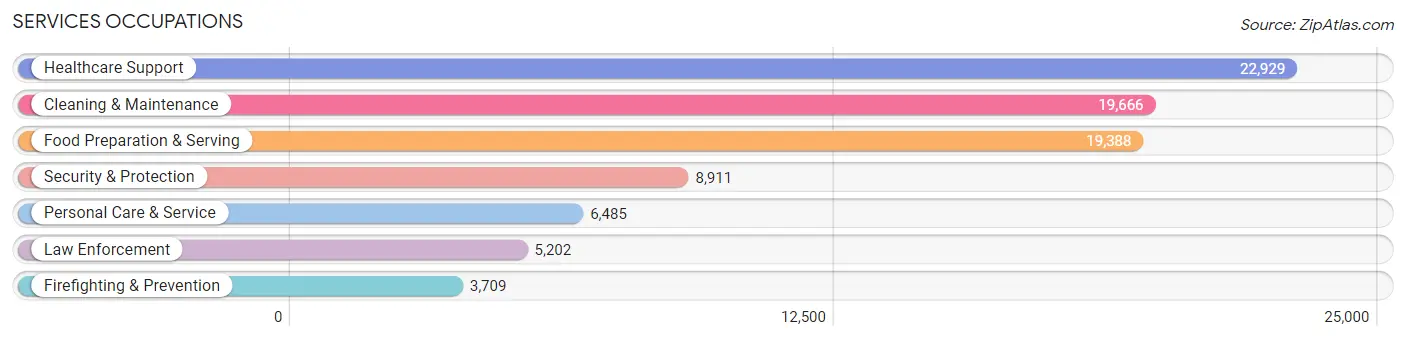
Services Occupations
The most common Services occupations in Hidalgo County are Healthcare Support (22,929 | 6.7%), Cleaning & Maintenance (19,666 | 5.8%), Food Preparation & Serving (19,388 | 5.7%), Security & Protection (8,911 | 2.6%), and Personal Care & Service (6,485 | 1.9%).
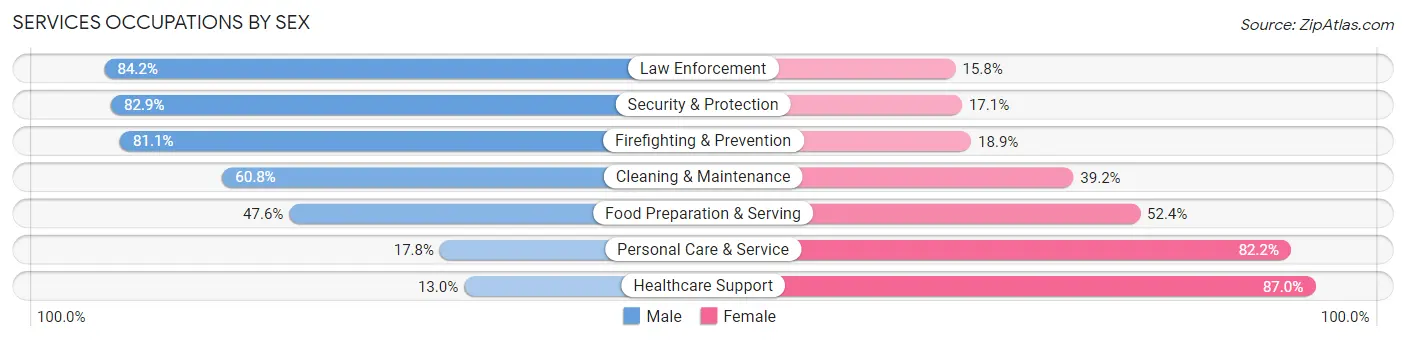
Services Occupations by Sex
Within the Services occupations in Hidalgo County, the most male-oriented occupations are Law Enforcement (84.2%), Security & Protection (82.9%), and Firefighting & Prevention (81.1%), while the most female-oriented occupations are Healthcare Support (87.0%), Personal Care & Service (82.2%), and Food Preparation & Serving (52.4%).
| Occupation | Male | Female |
| Healthcare Support | 2,979 (13.0%) | 19,950 (87.0%) |
| Security & Protection | 7,385 (82.9%) | 1,526 (17.1%) |
| Firefighting & Prevention | 3,007 (81.1%) | 702 (18.9%) |
| Law Enforcement | 4,378 (84.2%) | 824 (15.8%) |
| Food Preparation & Serving | 9,231 (47.6%) | 10,157 (52.4%) |
| Cleaning & Maintenance | 11,960 (60.8%) | 7,706 (39.2%) |
| Personal Care & Service | 1,154 (17.8%) | 5,331 (82.2%) |
| Total (Category) | 32,709 (42.3%) | 44,670 (57.7%) |
| Total (Overall) | 191,020 (56.0%) | 149,933 (44.0%) |
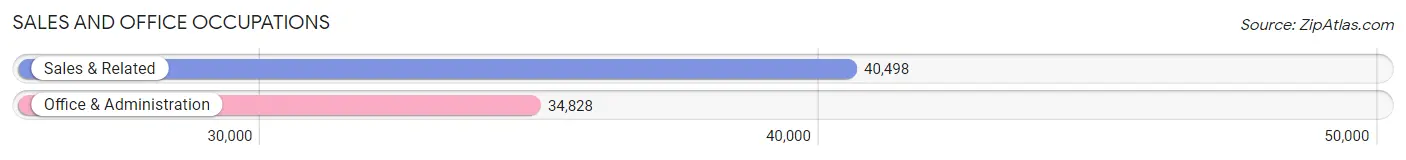
Sales and Office Occupations
The most common Sales and Office occupations in Hidalgo County are Sales & Related (40,498 | 11.9%), and Office & Administration (34,828 | 10.2%).
Sales and Office Occupations by Sex
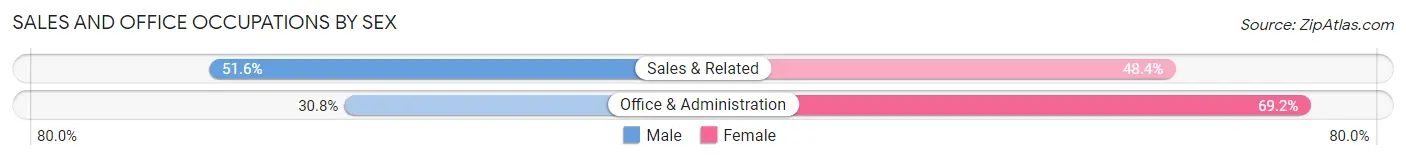
| Occupation | Male | Female |
| Sales & Related | 20,898 (51.6%) | 19,600 (48.4%) |
| Office & Administration | 10,738 (30.8%) | 24,090 (69.2%) |
| Total (Category) | 31,636 (42.0%) | 43,690 (58.0%) |
| Total (Overall) | 191,020 (56.0%) | 149,933 (44.0%) |
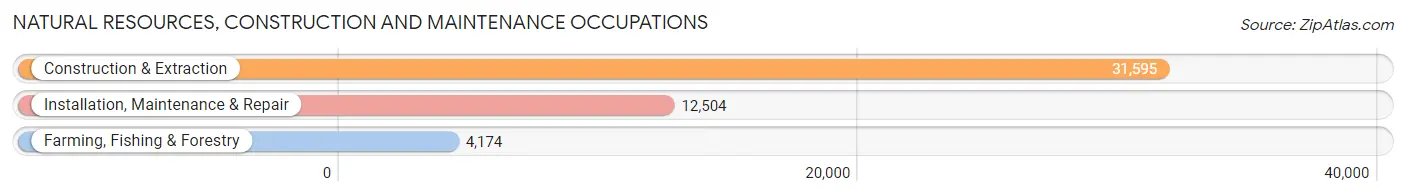
Natural Resources, Construction and Maintenance Occupations
The most common Natural Resources, Construction and Maintenance occupations in Hidalgo County are Construction & Extraction (31,595 | 9.3%), Installation, Maintenance & Repair (12,504 | 3.7%), and Farming, Fishing & Forestry (4,174 | 1.2%).
Natural Resources, Construction and Maintenance Occupations by Sex
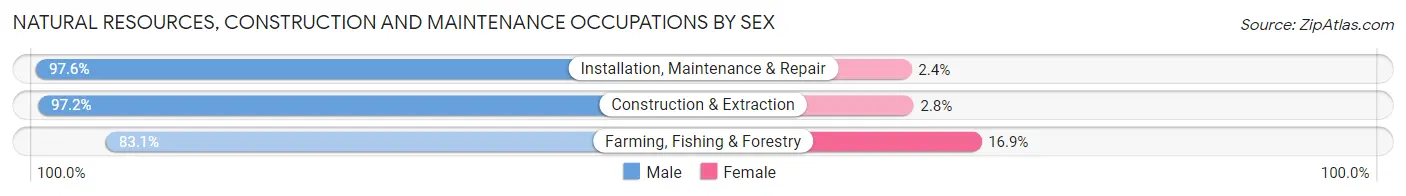
| Occupation | Male | Female |
| Farming, Fishing & Forestry | 3,468 (83.1%) | 706 (16.9%) |
| Construction & Extraction | 30,700 (97.2%) | 895 (2.8%) |
| Installation, Maintenance & Repair | 12,205 (97.6%) | 299 (2.4%) |
| Total (Category) | 46,373 (96.1%) | 1,900 (3.9%) |
| Total (Overall) | 191,020 (56.0%) | 149,933 (44.0%) |
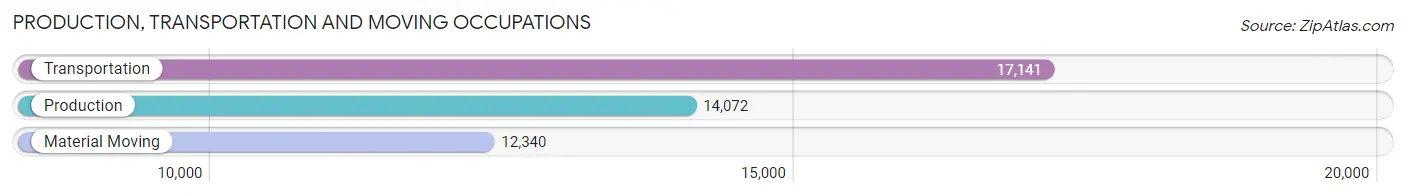
Production, Transportation and Moving Occupations
The most common Production, Transportation and Moving occupations in Hidalgo County are Transportation (17,141 | 5.0%), Production (14,072 | 4.1%), and Material Moving (12,340 | 3.6%).
Production, Transportation and Moving Occupations by Sex
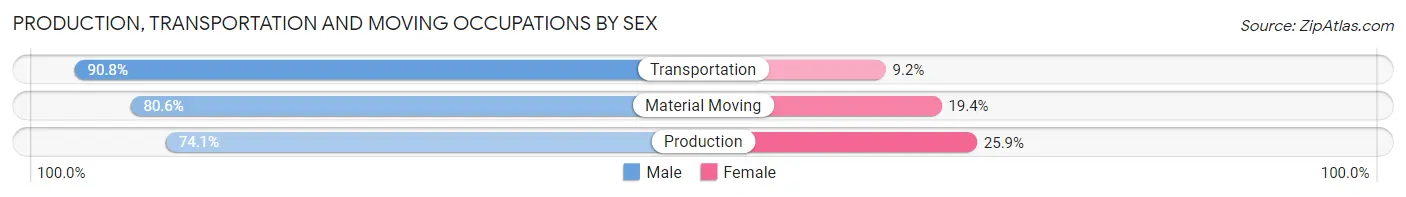
| Occupation | Male | Female |
| Production | 10,423 (74.1%) | 3,649 (25.9%) |
| Transportation | 15,568 (90.8%) | 1,573 (9.2%) |
| Material Moving | 9,942 (80.6%) | 2,398 (19.4%) |
| Total (Category) | 35,933 (82.5%) | 7,620 (17.5%) |
| Total (Overall) | 191,020 (56.0%) | 149,933 (44.0%) |
Employment Industries by Sex in Hidalgo County
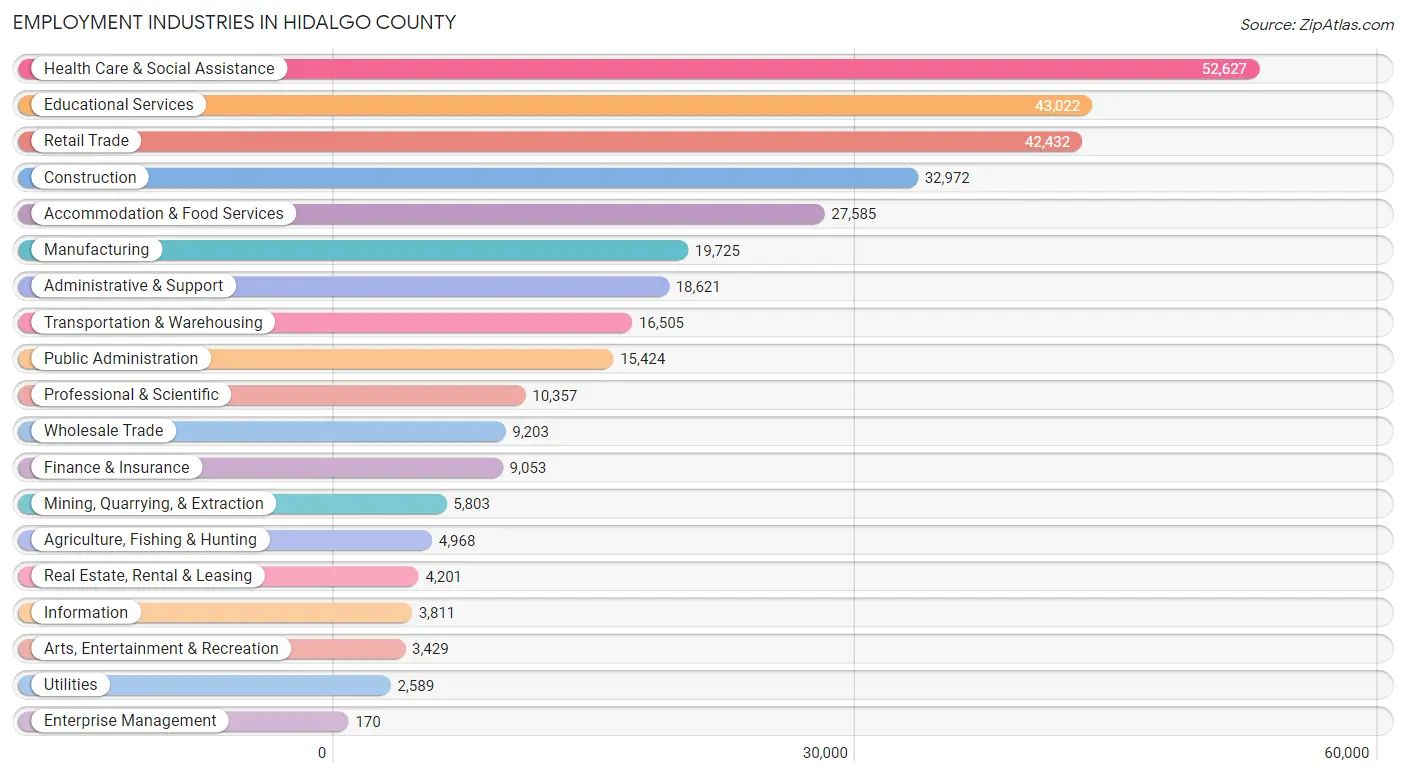
Employment Industries in Hidalgo County
The major employment industries in Hidalgo County include Health Care & Social Assistance (52,627 | 15.4%), Educational Services (43,022 | 12.6%), Retail Trade (42,432 | 12.4%), Construction (32,972 | 9.7%), and Accommodation & Food Services (27,585 | 8.1%).
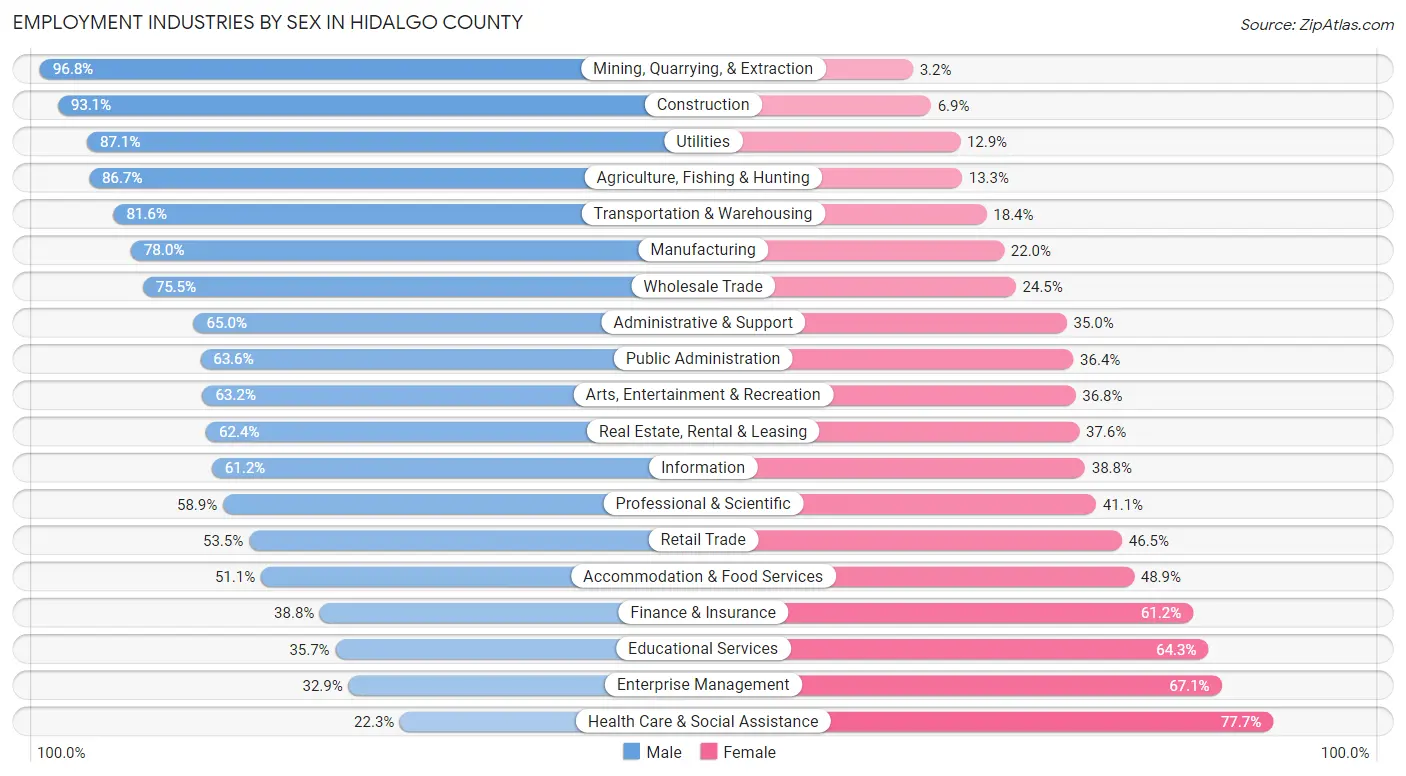
Employment Industries by Sex in Hidalgo County
The Hidalgo County industries that see more men than women are Mining, Quarrying, & Extraction (96.8%), Construction (93.1%), and Utilities (87.1%), whereas the industries that tend to have a higher number of women are Health Care & Social Assistance (77.7%), Enterprise Management (67.1%), and Educational Services (64.3%).
| Industry | Male | Female |
| Agriculture, Fishing & Hunting | 4,306 (86.7%) | 662 (13.3%) |
| Mining, Quarrying, & Extraction | 5,619 (96.8%) | 184 (3.2%) |
| Construction | 30,699 (93.1%) | 2,273 (6.9%) |
| Manufacturing | 15,380 (78.0%) | 4,345 (22.0%) |
| Wholesale Trade | 6,951 (75.5%) | 2,252 (24.5%) |
| Retail Trade | 22,719 (53.5%) | 19,713 (46.5%) |
| Transportation & Warehousing | 13,466 (81.6%) | 3,039 (18.4%) |
| Utilities | 2,254 (87.1%) | 335 (12.9%) |
| Information | 2,333 (61.2%) | 1,478 (38.8%) |
| Finance & Insurance | 3,514 (38.8%) | 5,539 (61.2%) |
| Real Estate, Rental & Leasing | 2,622 (62.4%) | 1,579 (37.6%) |
| Professional & Scientific | 6,102 (58.9%) | 4,255 (41.1%) |
| Enterprise Management | 56 (32.9%) | 114 (67.1%) |
| Administrative & Support | 12,103 (65.0%) | 6,518 (35.0%) |
| Educational Services | 15,343 (35.7%) | 27,679 (64.3%) |
| Health Care & Social Assistance | 11,722 (22.3%) | 40,905 (77.7%) |
| Arts, Entertainment & Recreation | 2,166 (63.2%) | 1,263 (36.8%) |
| Accommodation & Food Services | 14,088 (51.1%) | 13,497 (48.9%) |
| Public Administration | 9,812 (63.6%) | 5,612 (36.4%) |
| Total | 191,020 (56.0%) | 149,933 (44.0%) |
Education in Hidalgo County
School Enrollment in Hidalgo County
The most common levels of schooling among the 274,938 students in Hidalgo County are middle school (65,144 | 23.7%), high school (64,714 | 23.5%), and elementary school (61,193 | 22.3%).
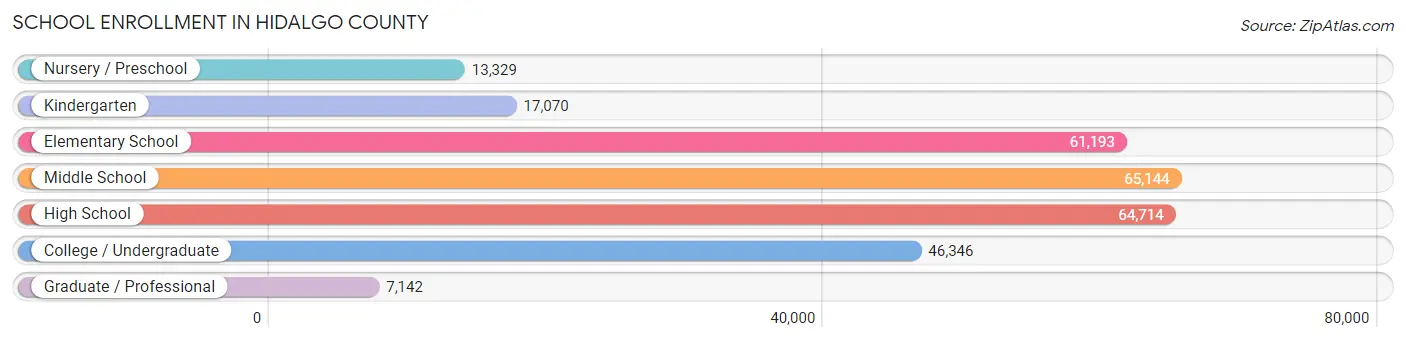
| School Level | # Students | % Students |
| Nursery / Preschool | 13,329 | 4.9% |
| Kindergarten | 17,070 | 6.2% |
| Elementary School | 61,193 | 22.3% |
| Middle School | 65,144 | 23.7% |
| High School | 64,714 | 23.5% |
| College / Undergraduate | 46,346 | 16.9% |
| Graduate / Professional | 7,142 | 2.6% |
| Total | 274,938 | 100.0% |
School Enrollment by Age by Funding Source in Hidalgo County
Out of a total of 274,938 students who are enrolled in schools in Hidalgo County, 14,572 (5.3%) attend a private institution, while the remaining 260,366 (94.7%) are enrolled in public schools. The age group of 35 years and over has the highest likelihood of being enrolled in private schools, with 1,698 (23.0% in the age bracket) enrolled. Conversely, the age group of 15 to 17 year olds has the lowest likelihood of being enrolled in a private school, with 44,636 (99.0% in the age bracket) attending a public institution.
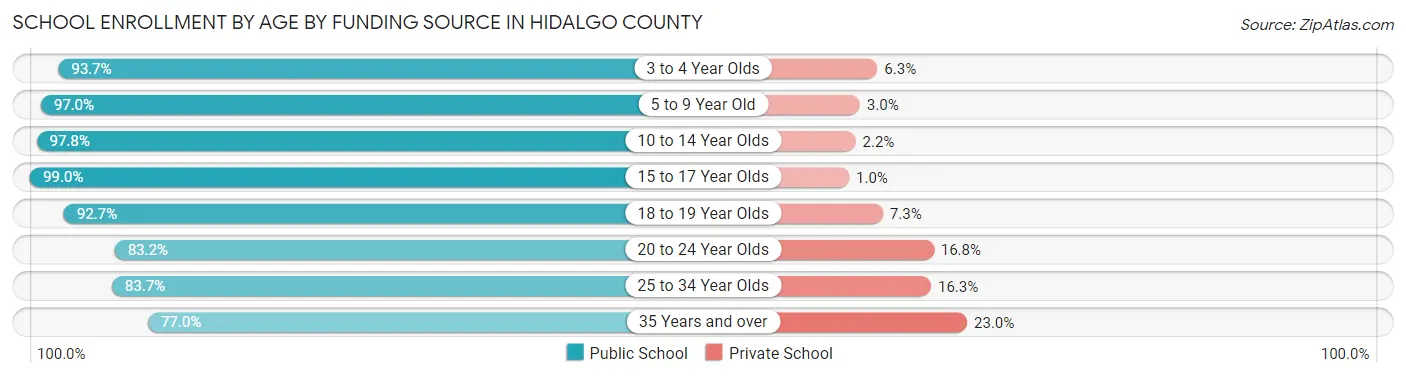
| Age Bracket | Public School | Private School |
| 3 to 4 Year Olds | 11,918 (93.7%) | 799 (6.3%) |
| 5 to 9 Year Old | 67,773 (97.0%) | 2,107 (3.0%) |
| 10 to 14 Year Olds | 79,588 (97.8%) | 1,818 (2.2%) |
| 15 to 17 Year Olds | 44,636 (99.0%) | 456 (1.0%) |
| 18 to 19 Year Olds | 20,080 (92.7%) | 1,584 (7.3%) |
| 20 to 24 Year Olds | 21,447 (83.2%) | 4,328 (16.8%) |
| 25 to 34 Year Olds | 9,226 (83.7%) | 1,793 (16.3%) |
| 35 Years and over | 5,687 (77.0%) | 1,698 (23.0%) |
| Total | 260,366 (94.7%) | 14,572 (5.3%) |
Educational Attainment by Field of Study in Hidalgo County
Business (21,283 | 20.2%), education (19,193 | 18.2%), science & technology (11,514 | 11.0%), arts & humanities (9,043 | 8.6%), and engineering (6,867 | 6.5%) are the most common fields of study among 105,141 individuals in Hidalgo County who have obtained a bachelor's degree or higher.
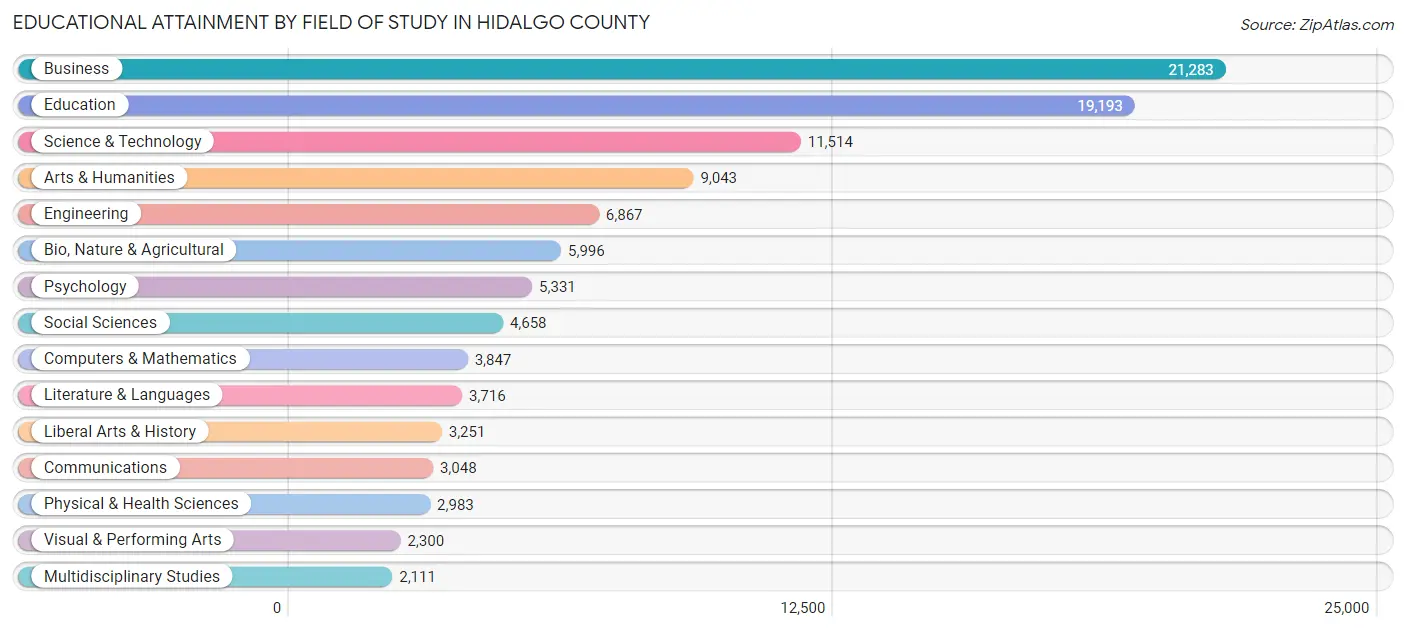
| Field of Study | # Graduates | % Graduates |
| Computers & Mathematics | 3,847 | 3.7% |
| Bio, Nature & Agricultural | 5,996 | 5.7% |
| Physical & Health Sciences | 2,983 | 2.8% |
| Psychology | 5,331 | 5.1% |
| Social Sciences | 4,658 | 4.4% |
| Engineering | 6,867 | 6.5% |
| Multidisciplinary Studies | 2,111 | 2.0% |
| Science & Technology | 11,514 | 11.0% |
| Business | 21,283 | 20.2% |
| Education | 19,193 | 18.2% |
| Literature & Languages | 3,716 | 3.5% |
| Liberal Arts & History | 3,251 | 3.1% |
| Visual & Performing Arts | 2,300 | 2.2% |
| Communications | 3,048 | 2.9% |
| Arts & Humanities | 9,043 | 8.6% |
| Total | 105,141 | 100.0% |
Transportation & Commute in Hidalgo County
Vehicle Availability by Sex in Hidalgo County
The most prevalent vehicle ownership categories in Hidalgo County are males with 2 vehicles (74,371, accounting for 39.9%) and females with 2 vehicles (55,538, making up 51.1%).
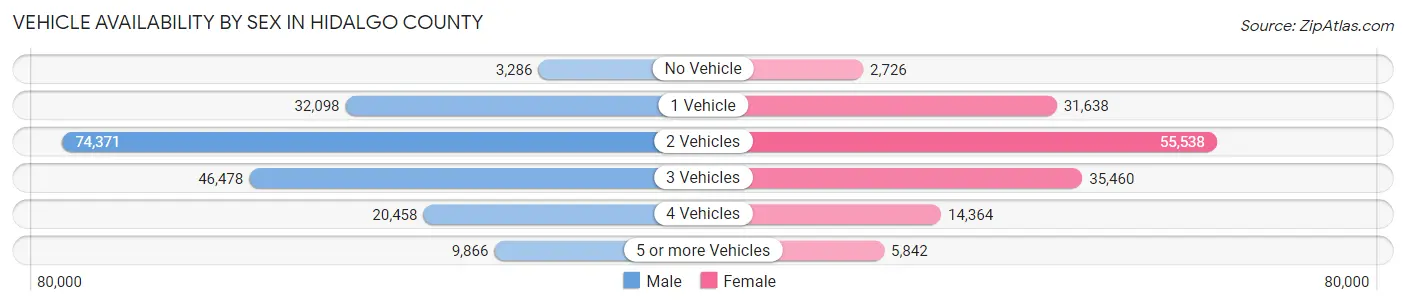
| Vehicles Available | Male | Female |
| No Vehicle | 3,286 (1.8%) | 2,726 (1.9%) |
| 1 Vehicle | 32,098 (17.2%) | 31,638 (21.7%) |
| 2 Vehicles | 74,371 (39.9%) | 55,538 (38.2%) |
| 3 Vehicles | 46,478 (24.9%) | 35,460 (24.4%) |
| 4 Vehicles | 20,458 (11.0%) | 14,364 (9.9%) |
| 5 or more Vehicles | 9,866 (5.3%) | 5,842 (4.0%) |
| Total | 186,557 (100.0%) | 145,568 (100.0%) |
Commute Time in Hidalgo County
The most frequently occuring commute durations in Hidalgo County are 15 to 19 minutes (54,824 commuters, 17.9%), 20 to 24 minutes (54,359 commuters, 17.7%), and 10 to 14 minutes (50,544 commuters, 16.5%).
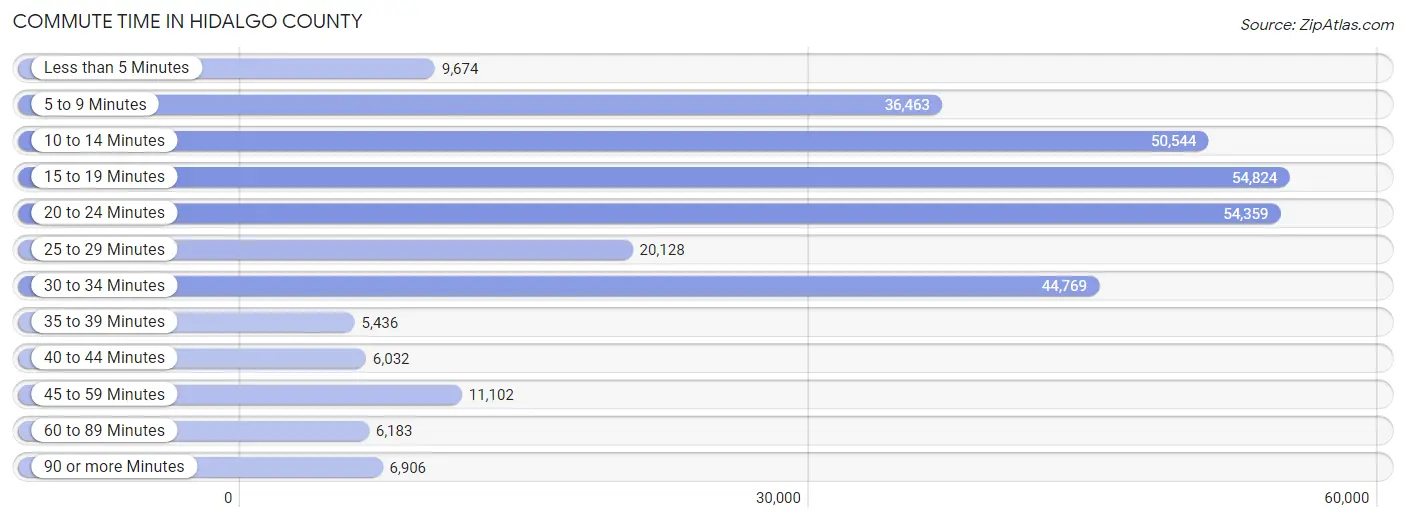
| Commute Time | # Commuters | % Commuters |
| Less than 5 Minutes | 9,674 | 3.2% |
| 5 to 9 Minutes | 36,463 | 11.9% |
| 10 to 14 Minutes | 50,544 | 16.5% |
| 15 to 19 Minutes | 54,824 | 17.9% |
| 20 to 24 Minutes | 54,359 | 17.7% |
| 25 to 29 Minutes | 20,128 | 6.6% |
| 30 to 34 Minutes | 44,769 | 14.6% |
| 35 to 39 Minutes | 5,436 | 1.8% |
| 40 to 44 Minutes | 6,032 | 2.0% |
| 45 to 59 Minutes | 11,102 | 3.6% |
| 60 to 89 Minutes | 6,183 | 2.0% |
| 90 or more Minutes | 6,906 | 2.2% |
Commute Time by Sex in Hidalgo County
The most common commute times in Hidalgo County are 20 to 24 minutes (31,393 commuters, 18.1%) for males and 15 to 19 minutes (26,372 commuters, 19.8%) for females.
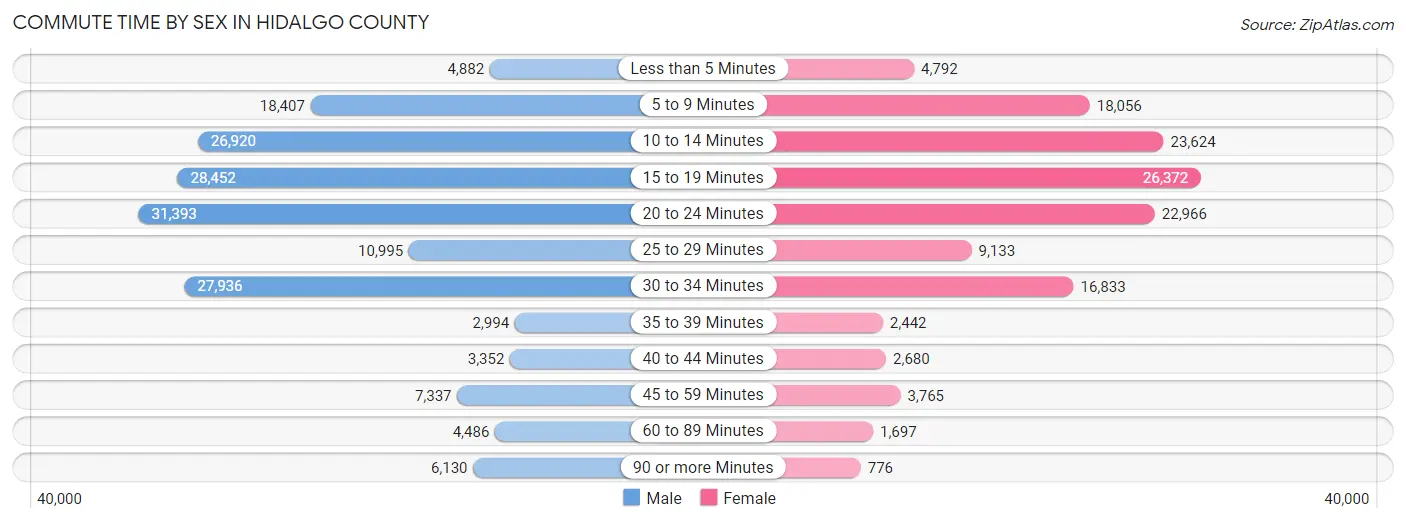
| Commute Time | Male | Female |
| Less than 5 Minutes | 4,882 (2.8%) | 4,792 (3.6%) |
| 5 to 9 Minutes | 18,407 (10.6%) | 18,056 (13.6%) |
| 10 to 14 Minutes | 26,920 (15.5%) | 23,624 (17.7%) |
| 15 to 19 Minutes | 28,452 (16.4%) | 26,372 (19.8%) |
| 20 to 24 Minutes | 31,393 (18.1%) | 22,966 (17.2%) |
| 25 to 29 Minutes | 10,995 (6.4%) | 9,133 (6.9%) |
| 30 to 34 Minutes | 27,936 (16.1%) | 16,833 (12.6%) |
| 35 to 39 Minutes | 2,994 (1.7%) | 2,442 (1.8%) |
| 40 to 44 Minutes | 3,352 (1.9%) | 2,680 (2.0%) |
| 45 to 59 Minutes | 7,337 (4.2%) | 3,765 (2.8%) |
| 60 to 89 Minutes | 4,486 (2.6%) | 1,697 (1.3%) |
| 90 or more Minutes | 6,130 (3.5%) | 776 (0.6%) |
Time of Departure to Work by Sex in Hidalgo County
The most frequent times of departure to work in Hidalgo County are 7:00 AM to 7:29 AM (27,727, 16.0%) for males and 7:00 AM to 7:29 AM (25,719, 19.3%) for females.
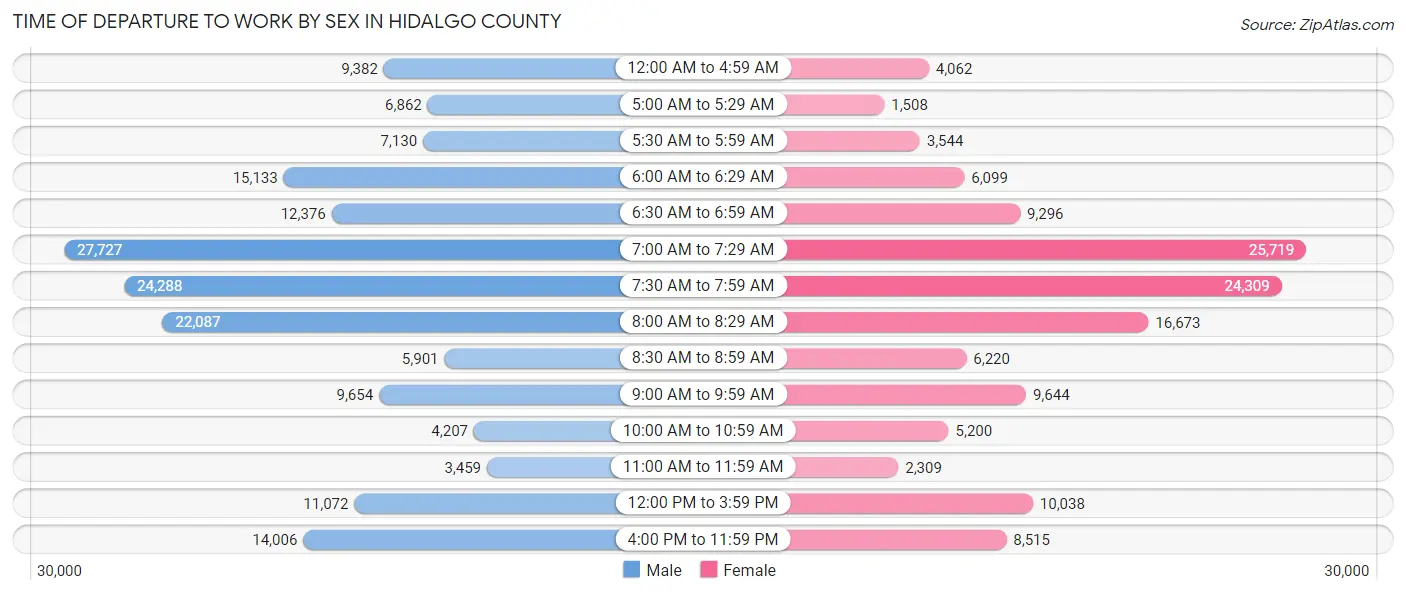
| Time of Departure | Male | Female |
| 12:00 AM to 4:59 AM | 9,382 (5.4%) | 4,062 (3.0%) |
| 5:00 AM to 5:29 AM | 6,862 (4.0%) | 1,508 (1.1%) |
| 5:30 AM to 5:59 AM | 7,130 (4.1%) | 3,544 (2.7%) |
| 6:00 AM to 6:29 AM | 15,133 (8.7%) | 6,099 (4.6%) |
| 6:30 AM to 6:59 AM | 12,376 (7.1%) | 9,296 (7.0%) |
| 7:00 AM to 7:29 AM | 27,727 (16.0%) | 25,719 (19.3%) |
| 7:30 AM to 7:59 AM | 24,288 (14.0%) | 24,309 (18.3%) |
| 8:00 AM to 8:29 AM | 22,087 (12.8%) | 16,673 (12.5%) |
| 8:30 AM to 8:59 AM | 5,901 (3.4%) | 6,220 (4.7%) |
| 9:00 AM to 9:59 AM | 9,654 (5.6%) | 9,644 (7.2%) |
| 10:00 AM to 10:59 AM | 4,207 (2.4%) | 5,200 (3.9%) |
| 11:00 AM to 11:59 AM | 3,459 (2.0%) | 2,309 (1.7%) |
| 12:00 PM to 3:59 PM | 11,072 (6.4%) | 10,038 (7.5%) |
| 4:00 PM to 11:59 PM | 14,006 (8.1%) | 8,515 (6.4%) |
| Total | 173,284 (100.0%) | 133,136 (100.0%) |
Housing Occupancy in Hidalgo County
Occupancy by Ownership in Hidalgo County
Of the total 257,499 dwellings in Hidalgo County, owner-occupied units account for 174,713 (67.8%), while renter-occupied units make up 82,786 (32.2%).
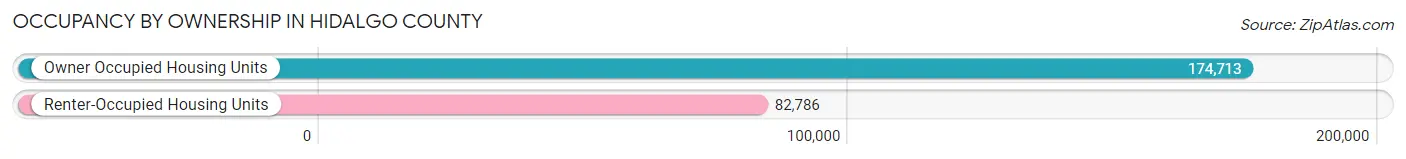
| Occupancy | # Housing Units | % Housing Units |
| Owner Occupied Housing Units | 174,713 | 67.8% |
| Renter-Occupied Housing Units | 82,786 | 32.2% |
| Total Occupied Housing Units | 257,499 | 100.0% |
Occupancy by Household Size in Hidalgo County
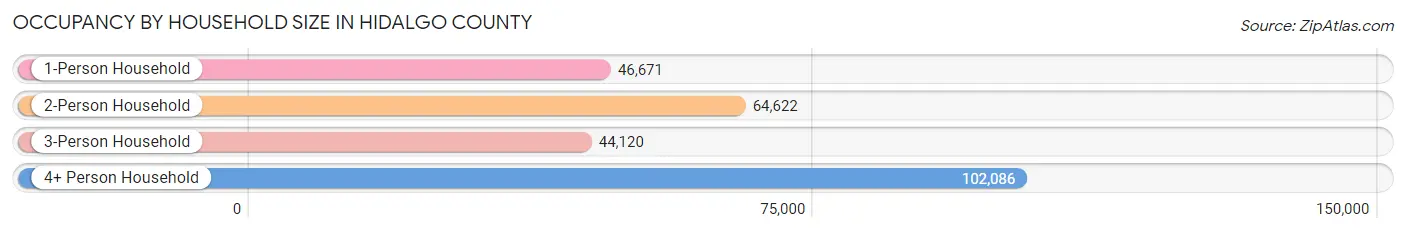
| Household Size | # Housing Units | % Housing Units |
| 1-Person Household | 46,671 | 18.1% |
| 2-Person Household | 64,622 | 25.1% |
| 3-Person Household | 44,120 | 17.1% |
| 4+ Person Household | 102,086 | 39.7% |
| Total Housing Units | 257,499 | 100.0% |
Occupancy by Ownership by Household Size in Hidalgo County
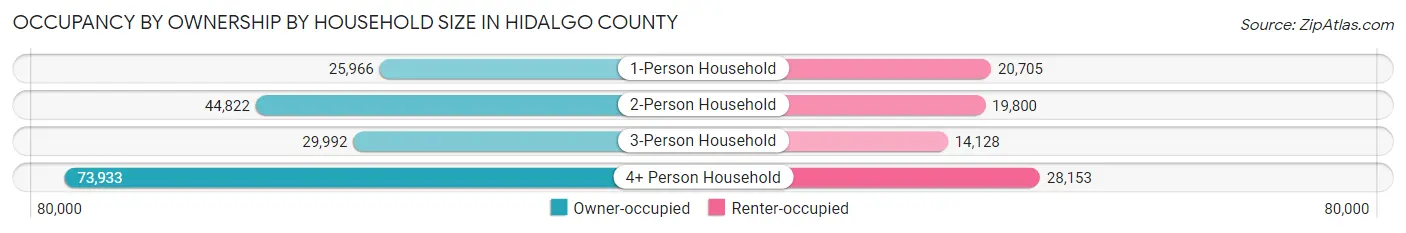
| Household Size | Owner-occupied | Renter-occupied |
| 1-Person Household | 25,966 (55.6%) | 20,705 (44.4%) |
| 2-Person Household | 44,822 (69.4%) | 19,800 (30.6%) |
| 3-Person Household | 29,992 (68.0%) | 14,128 (32.0%) |
| 4+ Person Household | 73,933 (72.4%) | 28,153 (27.6%) |
| Total Housing Units | 174,713 (67.8%) | 82,786 (32.2%) |
Occupancy by Educational Attainment in Hidalgo County
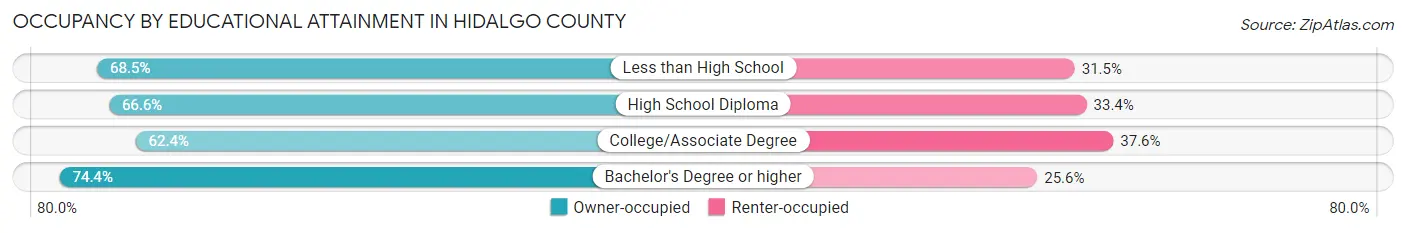
| Household Size | Owner-occupied | Renter-occupied |
| Less than High School | 53,548 (68.5%) | 24,634 (31.5%) |
| High School Diploma | 39,914 (66.6%) | 19,995 (33.4%) |
| College/Associate Degree | 39,502 (62.4%) | 23,822 (37.6%) |
| Bachelor's Degree or higher | 41,749 (74.4%) | 14,335 (25.6%) |
Occupancy by Age of Householder in Hidalgo County
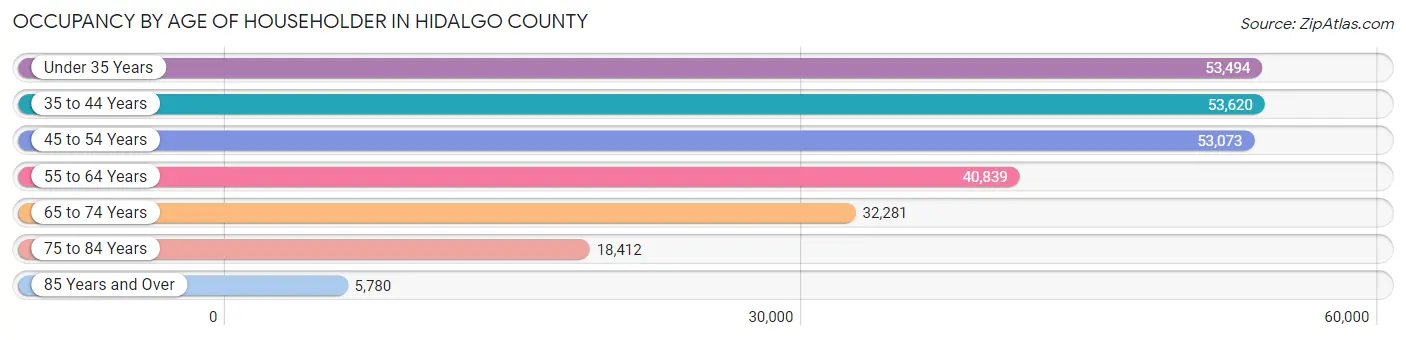
| Age Bracket | # Households | % Households |
| Under 35 Years | 53,494 | 20.8% |
| 35 to 44 Years | 53,620 | 20.8% |
| 45 to 54 Years | 53,073 | 20.6% |
| 55 to 64 Years | 40,839 | 15.9% |
| 65 to 74 Years | 32,281 | 12.5% |
| 75 to 84 Years | 18,412 | 7.1% |
| 85 Years and Over | 5,780 | 2.2% |
| Total | 257,499 | 100.0% |
Housing Finances in Hidalgo County
Median Income by Occupancy in Hidalgo County
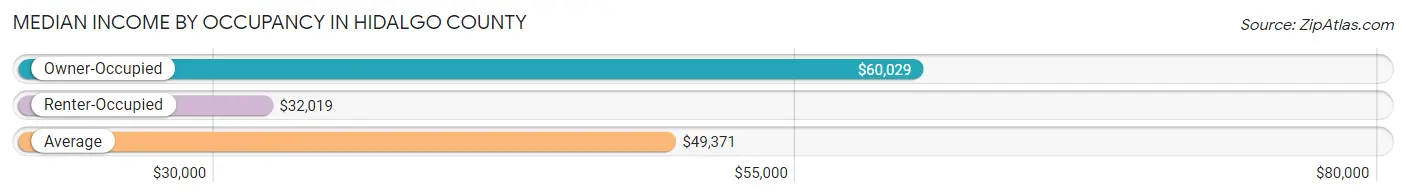
| Occupancy Type | # Households | Median Income |
| Owner-Occupied | 174,713 (67.8%) | $60,029 |
| Renter-Occupied | 82,786 (32.2%) | $32,019 |
| Average | 257,499 (100.0%) | $49,371 |
Occupancy by Householder Income Bracket in Hidalgo County
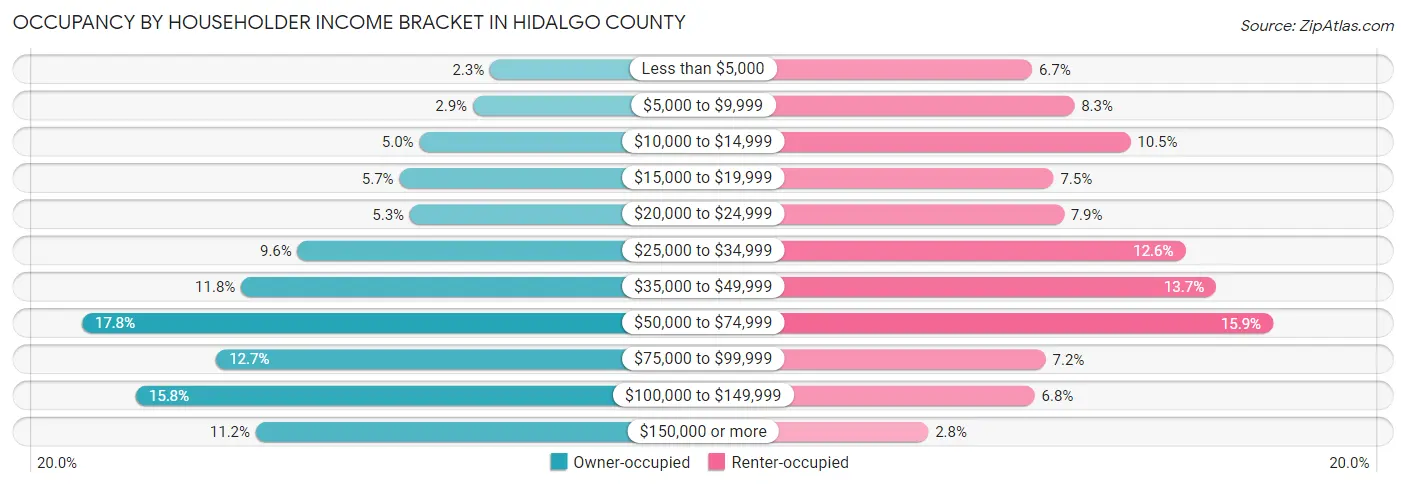
| Income Bracket | Owner-occupied | Renter-occupied |
| Less than $5,000 | 3,965 (2.3%) | 5,563 (6.7%) |
| $5,000 to $9,999 | 5,104 (2.9%) | 6,894 (8.3%) |
| $10,000 to $14,999 | 8,664 (5.0%) | 8,665 (10.5%) |
| $15,000 to $19,999 | 9,992 (5.7%) | 6,238 (7.5%) |
| $20,000 to $24,999 | 9,289 (5.3%) | 6,561 (7.9%) |
| $25,000 to $34,999 | 16,774 (9.6%) | 10,397 (12.6%) |
| $35,000 to $49,999 | 20,525 (11.7%) | 11,369 (13.7%) |
| $50,000 to $74,999 | 31,138 (17.8%) | 13,165 (15.9%) |
| $75,000 to $99,999 | 22,187 (12.7%) | 5,996 (7.2%) |
| $100,000 to $149,999 | 27,531 (15.8%) | 5,643 (6.8%) |
| $150,000 or more | 19,544 (11.2%) | 2,295 (2.8%) |
| Total | 174,713 (100.0%) | 82,786 (100.0%) |
Monthly Housing Cost Tiers in Hidalgo County
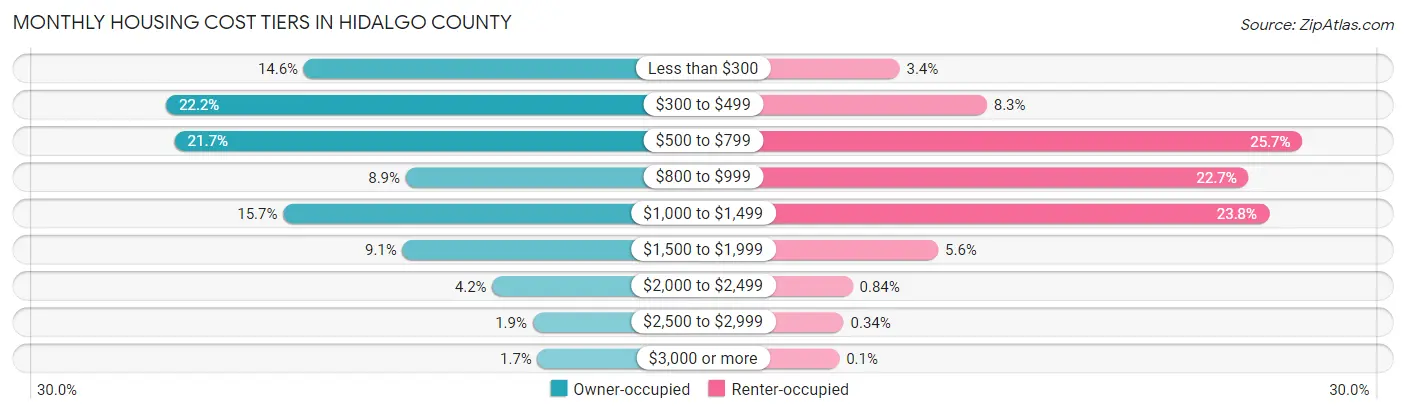
| Monthly Cost | Owner-occupied | Renter-occupied |
| Less than $300 | 25,448 (14.6%) | 2,841 (3.4%) |
| $300 to $499 | 38,777 (22.2%) | 6,833 (8.3%) |
| $500 to $799 | 37,937 (21.7%) | 21,257 (25.7%) |
| $800 to $999 | 15,628 (8.9%) | 18,803 (22.7%) |
| $1,000 to $1,499 | 27,454 (15.7%) | 19,728 (23.8%) |
| $1,500 to $1,999 | 15,938 (9.1%) | 4,599 (5.6%) |
| $2,000 to $2,499 | 7,262 (4.2%) | 697 (0.8%) |
| $2,500 to $2,999 | 3,367 (1.9%) | 281 (0.3%) |
| $3,000 or more | 2,902 (1.7%) | 80 (0.1%) |
| Total | 174,713 (100.0%) | 82,786 (100.0%) |
Physical Housing Characteristics in Hidalgo County
Housing Structures in Hidalgo County
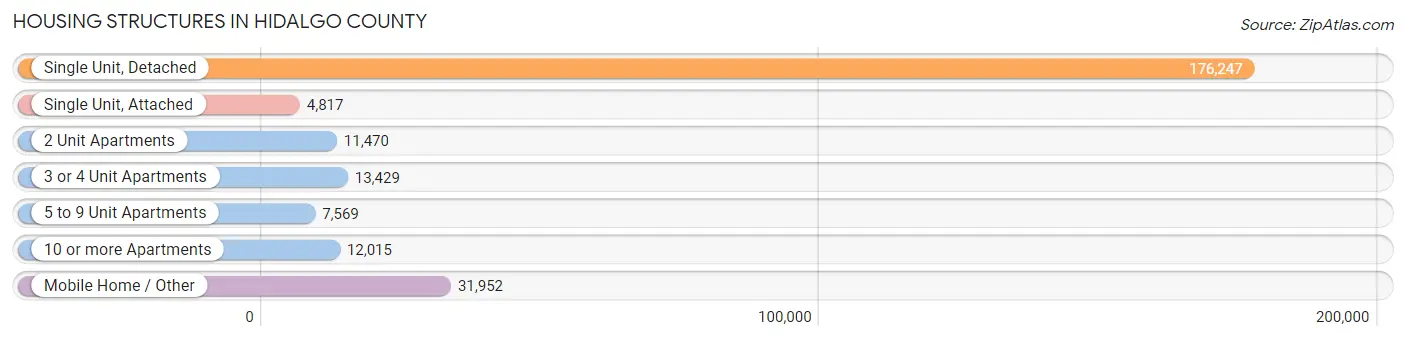
| Structure Type | # Housing Units | % Housing Units |
| Single Unit, Detached | 176,247 | 68.4% |
| Single Unit, Attached | 4,817 | 1.9% |
| 2 Unit Apartments | 11,470 | 4.4% |
| 3 or 4 Unit Apartments | 13,429 | 5.2% |
| 5 to 9 Unit Apartments | 7,569 | 2.9% |
| 10 or more Apartments | 12,015 | 4.7% |
| Mobile Home / Other | 31,952 | 12.4% |
| Total | 257,499 | 100.0% |
Housing Structures by Occupancy in Hidalgo County
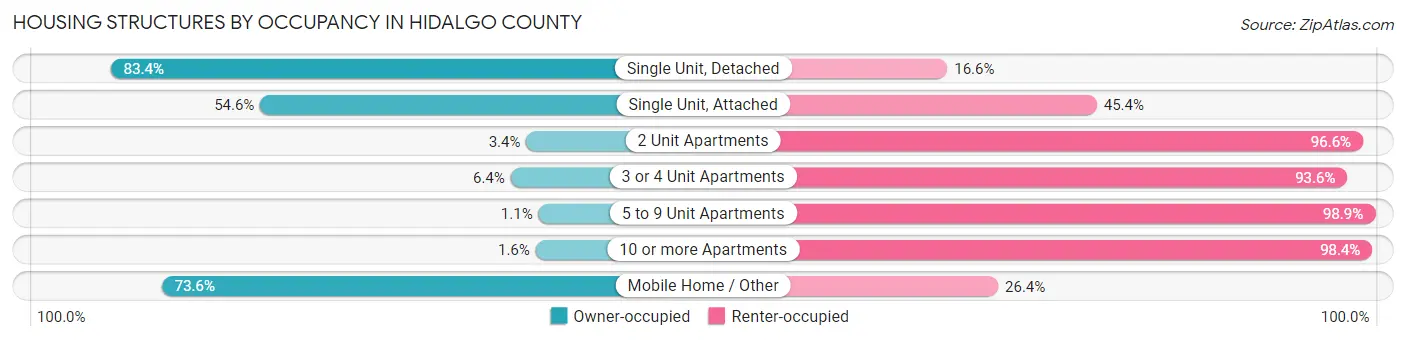
| Structure Type | Owner-occupied | Renter-occupied |
| Single Unit, Detached | 147,029 (83.4%) | 29,218 (16.6%) |
| Single Unit, Attached | 2,632 (54.6%) | 2,185 (45.4%) |
| 2 Unit Apartments | 390 (3.4%) | 11,080 (96.6%) |
| 3 or 4 Unit Apartments | 862 (6.4%) | 12,567 (93.6%) |
| 5 to 9 Unit Apartments | 80 (1.1%) | 7,489 (98.9%) |
| 10 or more Apartments | 194 (1.6%) | 11,821 (98.4%) |
| Mobile Home / Other | 23,526 (73.6%) | 8,426 (26.4%) |
| Total | 174,713 (67.8%) | 82,786 (32.2%) |
Housing Structures by Number of Rooms in Hidalgo County
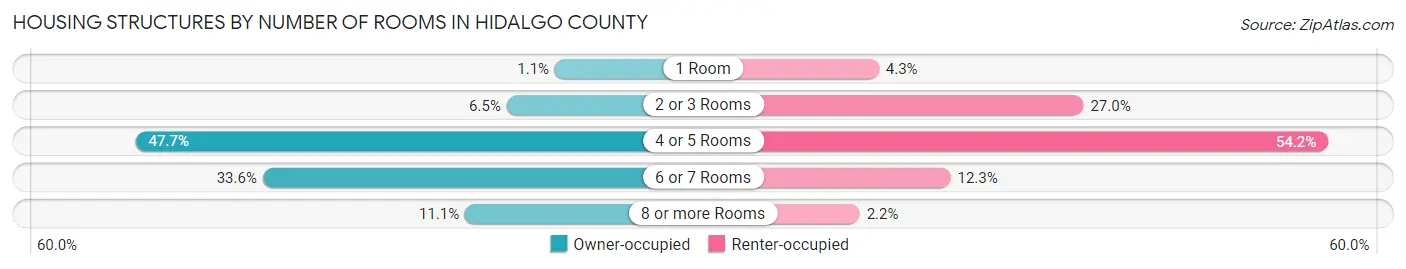
| Number of Rooms | Owner-occupied | Renter-occupied |
| 1 Room | 1,993 (1.1%) | 3,580 (4.3%) |
| 2 or 3 Rooms | 11,341 (6.5%) | 22,375 (27.0%) |
| 4 or 5 Rooms | 83,306 (47.7%) | 44,844 (54.2%) |
| 6 or 7 Rooms | 58,643 (33.6%) | 10,164 (12.3%) |
| 8 or more Rooms | 19,430 (11.1%) | 1,823 (2.2%) |
| Total | 174,713 (100.0%) | 82,786 (100.0%) |
Housing Structure by Heating Type in Hidalgo County
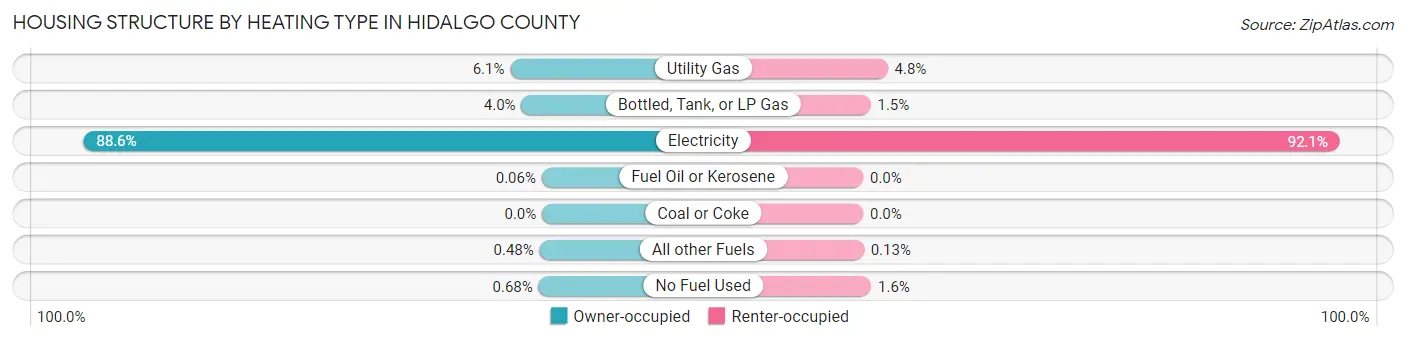
| Heating Type | Owner-occupied | Renter-occupied |
| Utility Gas | 10,723 (6.1%) | 3,933 (4.8%) |
| Bottled, Tank, or LP Gas | 6,981 (4.0%) | 1,201 (1.5%) |
| Electricity | 154,869 (88.6%) | 76,260 (92.1%) |
| Fuel Oil or Kerosene | 104 (0.1%) | 0 (0.0%) |
| Coal or Coke | 0 (0.0%) | 0 (0.0%) |
| All other Fuels | 844 (0.5%) | 109 (0.1%) |
| No Fuel Used | 1,192 (0.7%) | 1,283 (1.5%) |
| Total | 174,713 (100.0%) | 82,786 (100.0%) |
Household Vehicle Usage in Hidalgo County
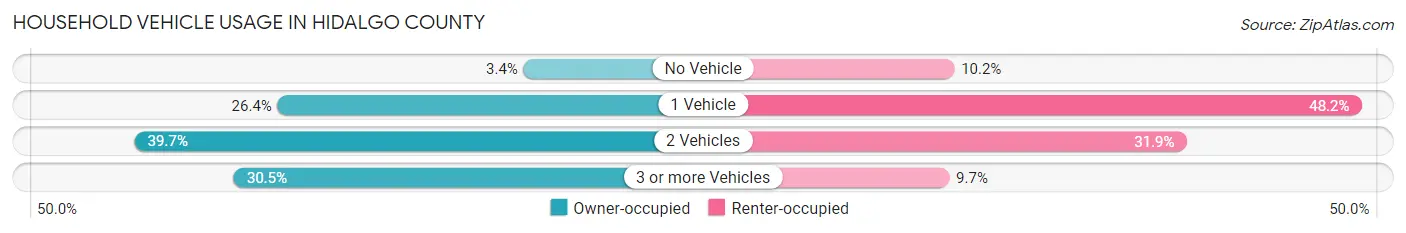
| Vehicles per Household | Owner-occupied | Renter-occupied |
| No Vehicle | 5,949 (3.4%) | 8,444 (10.2%) |
| 1 Vehicle | 46,094 (26.4%) | 39,899 (48.2%) |
| 2 Vehicles | 69,431 (39.7%) | 26,387 (31.9%) |
| 3 or more Vehicles | 53,239 (30.5%) | 8,056 (9.7%) |
| Total | 174,713 (100.0%) | 82,786 (100.0%) |
Real Estate & Mortgages in Hidalgo County
Real Estate and Mortgage Overview in Hidalgo County
| Characteristic | Without Mortgage | With Mortgage |
| Housing Units | 103,448 | 71,265 |
| Median Property Value | $86,400 | $152,000 |
| Median Household Income | $48,265 | $11,945 |
| Monthly Housing Costs | $433 | $2,850 |
| Real Estate Taxes | $1,452 | $2,316 |
Property Value by Mortgage Status in Hidalgo County
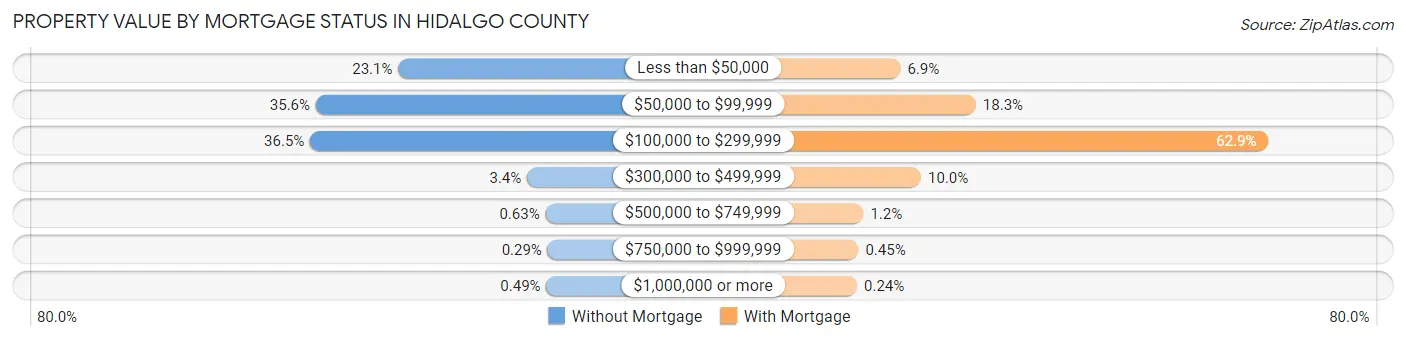
| Property Value | Without Mortgage | With Mortgage |
| Less than $50,000 | 23,851 (23.1%) | 4,890 (6.9%) |
| $50,000 to $99,999 | 36,845 (35.6%) | 13,069 (18.3%) |
| $100,000 to $299,999 | 37,750 (36.5%) | 44,835 (62.9%) |
| $300,000 to $499,999 | 3,545 (3.4%) | 7,117 (10.0%) |
| $500,000 to $749,999 | 651 (0.6%) | 861 (1.2%) |
| $750,000 to $999,999 | 297 (0.3%) | 321 (0.4%) |
| $1,000,000 or more | 509 (0.5%) | 172 (0.2%) |
| Total | 103,448 (100.0%) | 71,265 (100.0%) |
Household Income by Mortgage Status in Hidalgo County
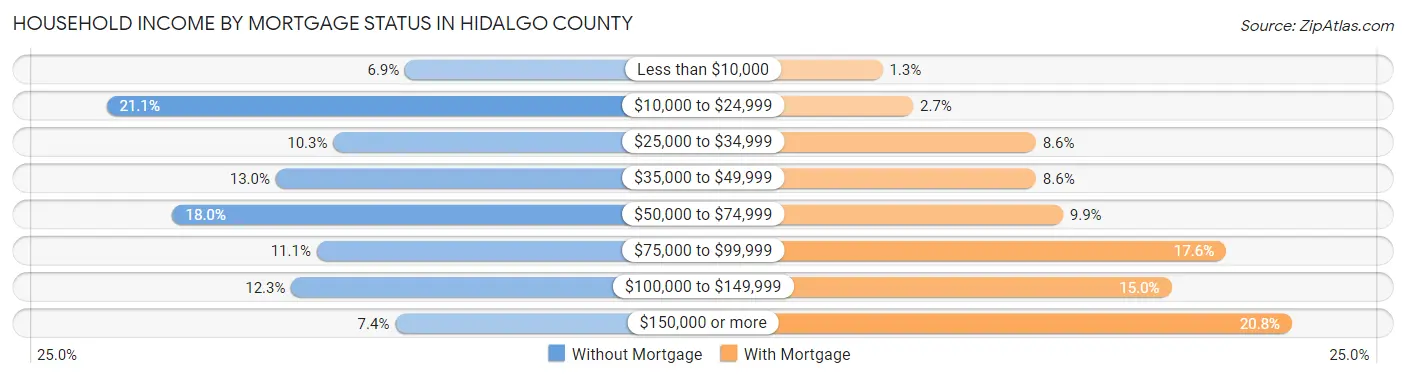
| Household Income | Without Mortgage | With Mortgage |
| Less than $10,000 | 7,117 (6.9%) | 910 (1.3%) |
| $10,000 to $24,999 | 21,832 (21.1%) | 1,952 (2.7%) |
| $25,000 to $34,999 | 10,654 (10.3%) | 6,113 (8.6%) |
| $35,000 to $49,999 | 13,489 (13.0%) | 6,120 (8.6%) |
| $50,000 to $74,999 | 18,566 (17.9%) | 7,036 (9.9%) |
| $75,000 to $99,999 | 11,472 (11.1%) | 12,572 (17.6%) |
| $100,000 to $149,999 | 12,719 (12.3%) | 10,715 (15.0%) |
| $150,000 or more | 7,599 (7.3%) | 14,812 (20.8%) |
| Total | 103,448 (100.0%) | 71,265 (100.0%) |
Property Value to Household Income Ratio in Hidalgo County
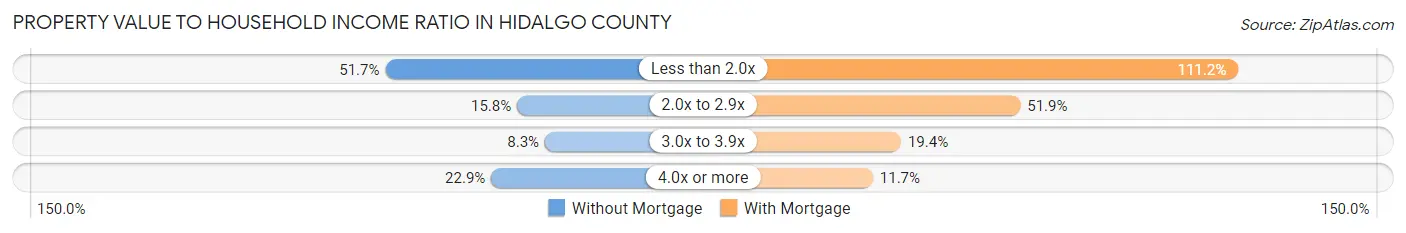
| Value-to-Income Ratio | Without Mortgage | With Mortgage |
| Less than 2.0x | 53,526 (51.7%) | 79,260 (111.2%) |
| 2.0x to 2.9x | 16,385 (15.8%) | 36,964 (51.9%) |
| 3.0x to 3.9x | 8,546 (8.3%) | 13,799 (19.4%) |
| 4.0x or more | 23,690 (22.9%) | 8,332 (11.7%) |
| Total | 103,448 (100.0%) | 71,265 (100.0%) |
Real Estate Taxes by Mortgage Status in Hidalgo County
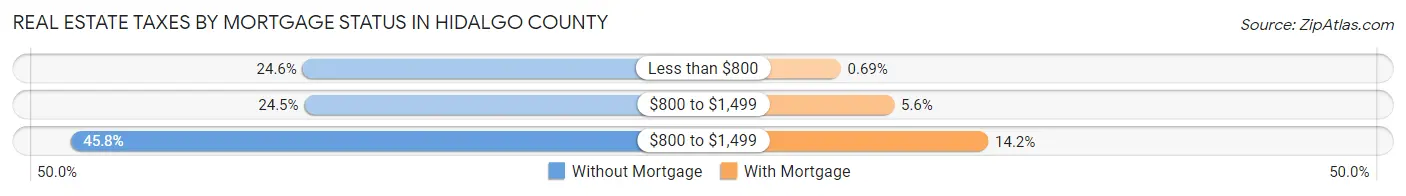
| Property Taxes | Without Mortgage | With Mortgage |
| Less than $800 | 25,457 (24.6%) | 494 (0.7%) |
| $800 to $1,499 | 25,291 (24.4%) | 3,969 (5.6%) |
| $800 to $1,499 | 47,398 (45.8%) | 10,089 (14.2%) |
| Total | 103,448 (100.0%) | 71,265 (100.0%) |
Health & Disability in Hidalgo County
Health Insurance Coverage by Age in Hidalgo County
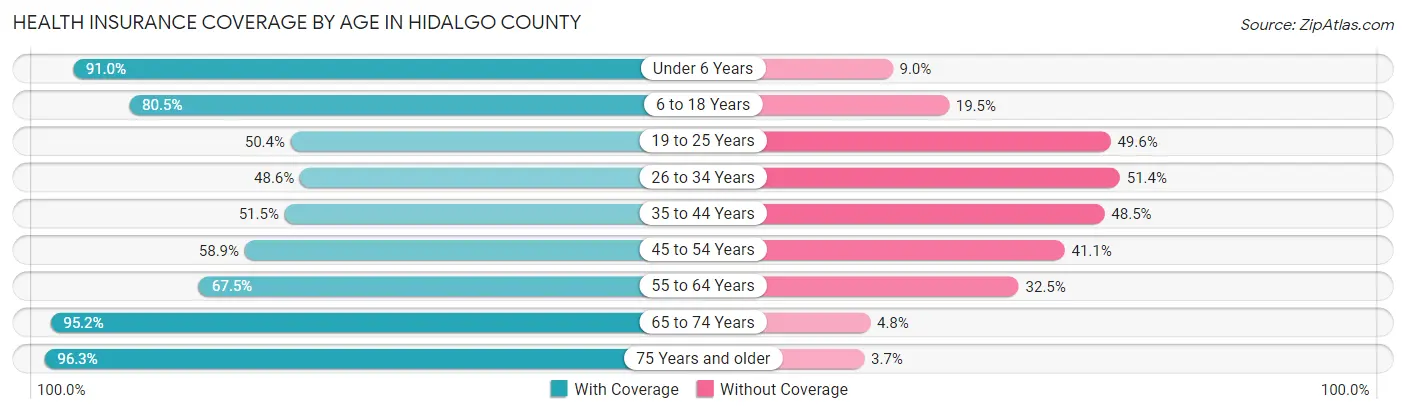
| Age Bracket | With Coverage | Without Coverage |
| Under 6 Years | 77,863 (91.0%) | 7,694 (9.0%) |
| 6 to 18 Years | 168,019 (80.5%) | 40,682 (19.5%) |
| 19 to 25 Years | 47,160 (50.4%) | 46,487 (49.6%) |
| 26 to 34 Years | 50,539 (48.6%) | 53,401 (51.4%) |
| 35 to 44 Years | 54,964 (51.5%) | 51,775 (48.5%) |
| 45 to 54 Years | 57,418 (58.9%) | 40,020 (41.1%) |
| 55 to 64 Years | 49,479 (67.5%) | 23,833 (32.5%) |
| 65 to 74 Years | 51,885 (95.2%) | 2,617 (4.8%) |
| 75 Years and older | 40,142 (96.3%) | 1,536 (3.7%) |
| Total | 597,469 (69.0%) | 268,045 (31.0%) |
Health Insurance Coverage by Citizenship Status in Hidalgo County
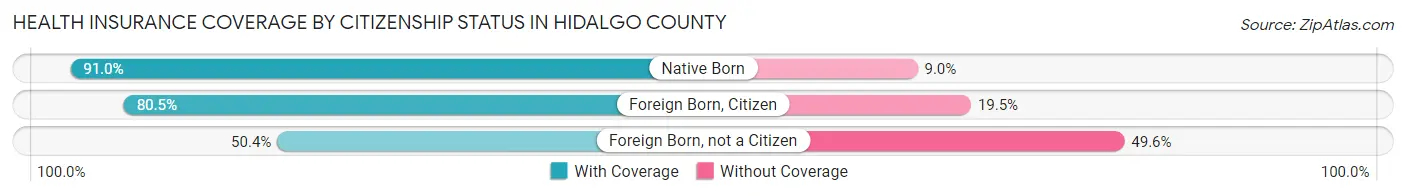
| Citizenship Status | With Coverage | Without Coverage |
| Native Born | 77,863 (91.0%) | 7,694 (9.0%) |
| Foreign Born, Citizen | 168,019 (80.5%) | 40,682 (19.5%) |
| Foreign Born, not a Citizen | 47,160 (50.4%) | 46,487 (49.6%) |
Health Insurance Coverage by Household Income in Hidalgo County
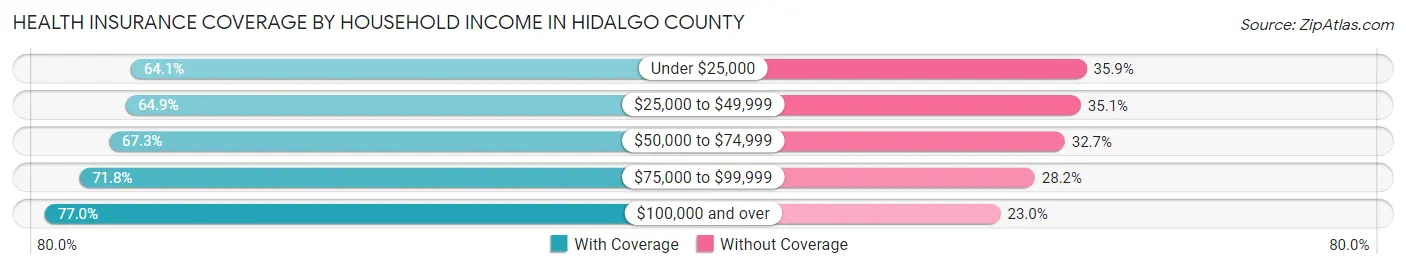
| Household Income | With Coverage | Without Coverage |
| Under $25,000 | 121,949 (64.1%) | 68,425 (35.9%) |
| $25,000 to $49,999 | 124,418 (64.9%) | 67,248 (35.1%) |
| $50,000 to $74,999 | 106,774 (67.3%) | 51,832 (32.7%) |
| $75,000 to $99,999 | 75,477 (71.8%) | 29,623 (28.2%) |
| $100,000 and over | 167,868 (77.0%) | 50,263 (23.0%) |
Public vs Private Health Insurance Coverage by Age in Hidalgo County
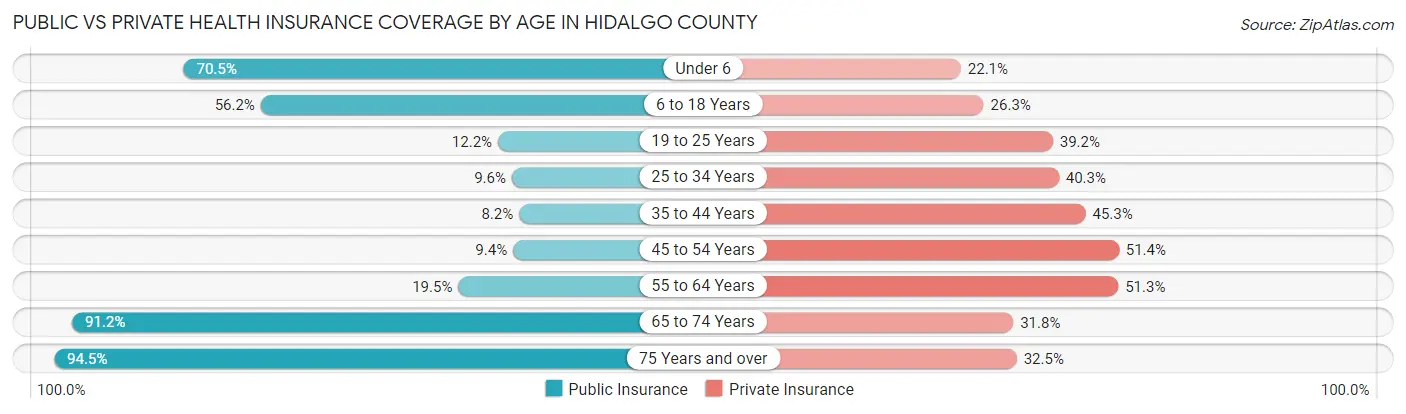
| Age Bracket | Public Insurance | Private Insurance |
| Under 6 | 60,309 (70.5%) | 18,906 (22.1%) |
| 6 to 18 Years | 117,254 (56.2%) | 54,960 (26.3%) |
| 19 to 25 Years | 11,382 (12.1%) | 36,679 (39.2%) |
| 25 to 34 Years | 9,939 (9.6%) | 41,859 (40.3%) |
| 35 to 44 Years | 8,772 (8.2%) | 48,302 (45.3%) |
| 45 to 54 Years | 9,114 (9.3%) | 50,092 (51.4%) |
| 55 to 64 Years | 14,303 (19.5%) | 37,616 (51.3%) |
| 65 to 74 Years | 49,696 (91.2%) | 17,344 (31.8%) |
| 75 Years and over | 39,396 (94.5%) | 13,532 (32.5%) |
| Total | 320,165 (37.0%) | 319,290 (36.9%) |
Disability Status by Sex by Age in Hidalgo County
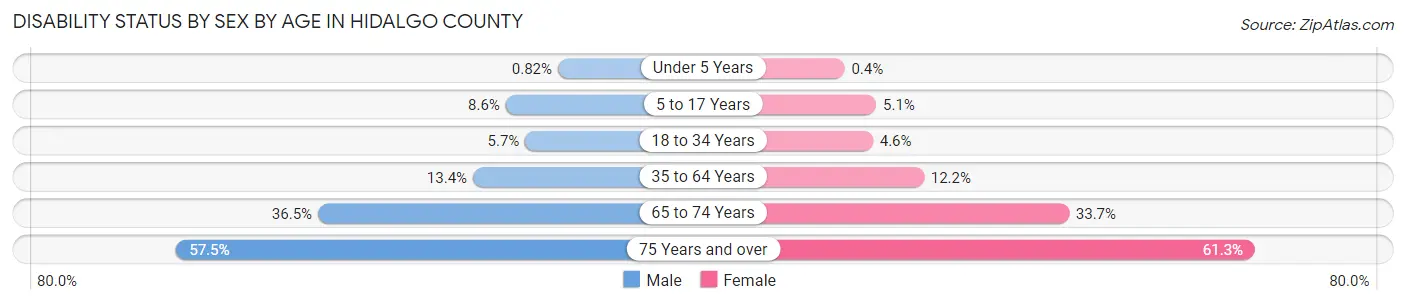
| Age Bracket | Male | Female |
| Under 5 Years | 297 (0.8%) | 139 (0.4%) |
| 5 to 17 Years | 8,926 (8.6%) | 5,125 (5.1%) |
| 18 to 34 Years | 6,143 (5.7%) | 4,929 (4.6%) |
| 35 to 64 Years | 17,972 (13.4%) | 17,480 (12.2%) |
| 65 to 74 Years | 9,105 (36.4%) | 9,955 (33.7%) |
| 75 Years and over | 10,097 (57.5%) | 14,787 (61.3%) |
Disability Class by Sex by Age in Hidalgo County
Disability Class: Hearing Difficulty
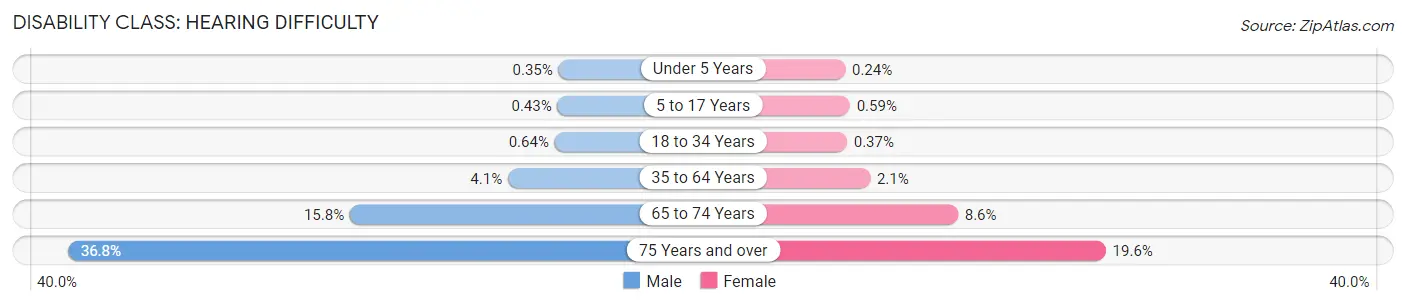
| Age Bracket | Male | Female |
| Under 5 Years | 127 (0.4%) | 85 (0.2%) |
| 5 to 17 Years | 445 (0.4%) | 590 (0.6%) |
| 18 to 34 Years | 697 (0.6%) | 394 (0.4%) |
| 35 to 64 Years | 5,502 (4.1%) | 3,006 (2.1%) |
| 65 to 74 Years | 3,956 (15.8%) | 2,543 (8.6%) |
| 75 Years and over | 6,464 (36.8%) | 4,722 (19.6%) |
Disability Class: Vision Difficulty
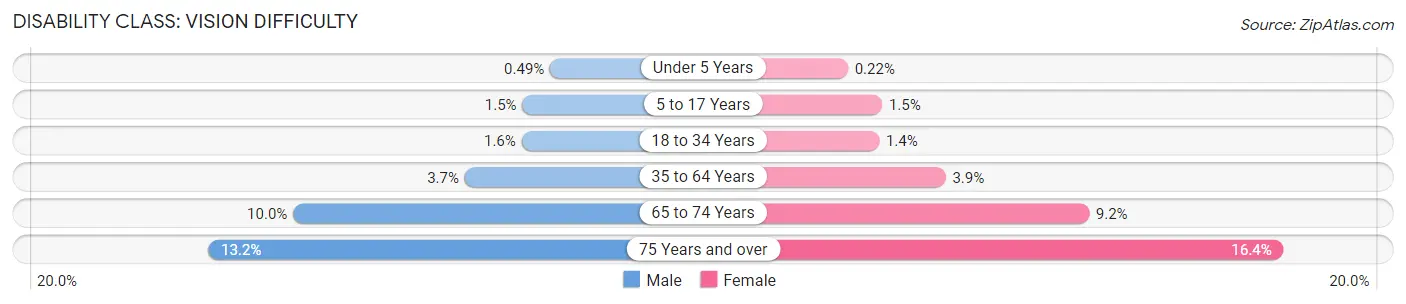
| Age Bracket | Male | Female |
| Under 5 Years | 177 (0.5%) | 76 (0.2%) |
| 5 to 17 Years | 1,588 (1.5%) | 1,498 (1.5%) |
| 18 to 34 Years | 1,680 (1.5%) | 1,473 (1.4%) |
| 35 to 64 Years | 4,896 (3.7%) | 5,523 (3.8%) |
| 65 to 74 Years | 2,506 (10.0%) | 2,708 (9.2%) |
| 75 Years and over | 2,318 (13.2%) | 3,953 (16.4%) |
Disability Class: Cognitive Difficulty
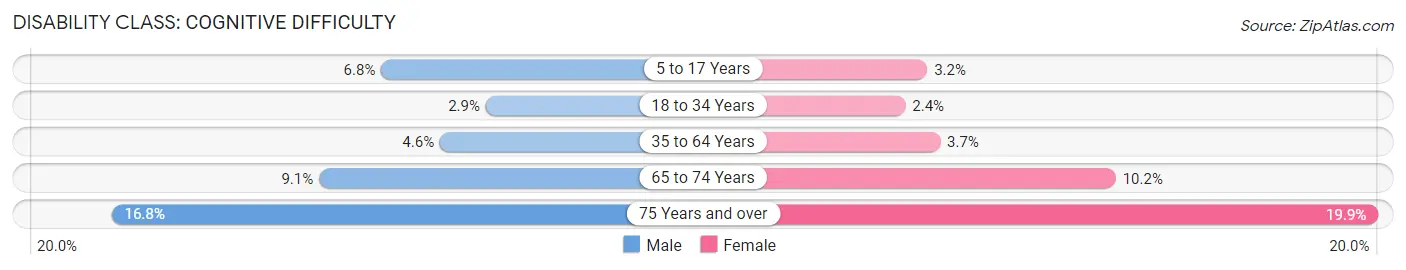
| Age Bracket | Male | Female |
| 5 to 17 Years | 7,048 (6.8%) | 3,196 (3.2%) |
| 18 to 34 Years | 3,124 (2.9%) | 2,523 (2.4%) |
| 35 to 64 Years | 6,130 (4.6%) | 5,240 (3.6%) |
| 65 to 74 Years | 2,266 (9.1%) | 3,001 (10.2%) |
| 75 Years and over | 2,946 (16.8%) | 4,800 (19.9%) |
Disability Class: Ambulatory Difficulty
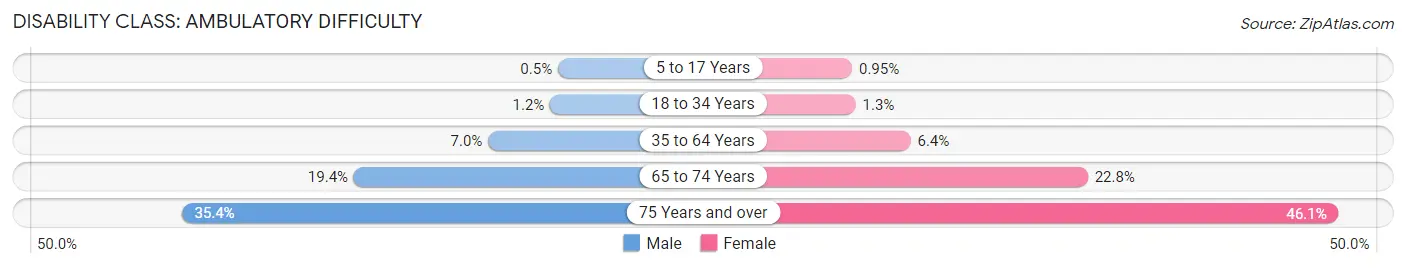
| Age Bracket | Male | Female |
| 5 to 17 Years | 522 (0.5%) | 960 (0.9%) |
| 18 to 34 Years | 1,326 (1.2%) | 1,372 (1.3%) |
| 35 to 64 Years | 9,344 (7.0%) | 9,158 (6.4%) |
| 65 to 74 Years | 4,856 (19.4%) | 6,736 (22.8%) |
| 75 Years and over | 6,226 (35.4%) | 11,114 (46.1%) |
Disability Class: Self-Care Difficulty
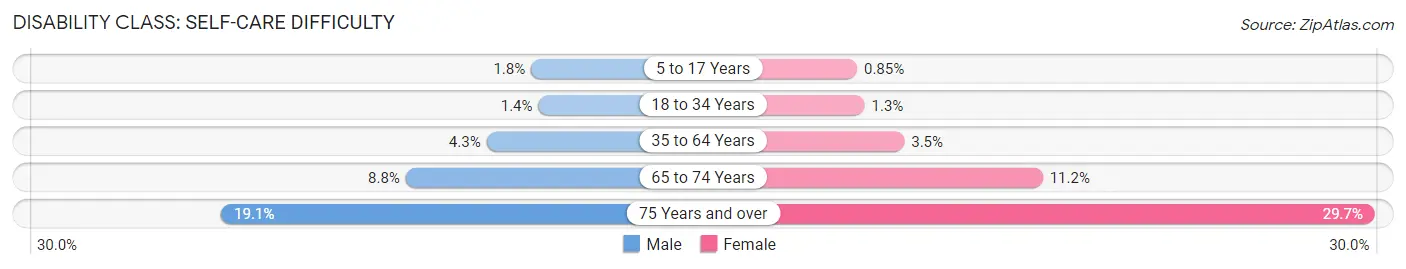
| Age Bracket | Male | Female |
| 5 to 17 Years | 1,876 (1.8%) | 860 (0.9%) |
| 18 to 34 Years | 1,504 (1.4%) | 1,357 (1.3%) |
| 35 to 64 Years | 5,728 (4.3%) | 5,005 (3.5%) |
| 65 to 74 Years | 2,193 (8.8%) | 3,302 (11.2%) |
| 75 Years and over | 3,349 (19.1%) | 7,155 (29.7%) |
Technology Access in Hidalgo County
Computing Device Access in Hidalgo County
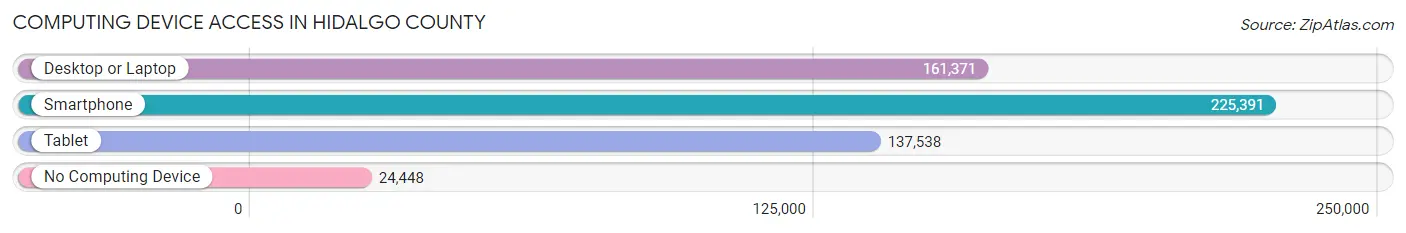
| Device Type | # Households | % Households |
| Desktop or Laptop | 161,371 | 62.7% |
| Smartphone | 225,391 | 87.5% |
| Tablet | 137,538 | 53.4% |
| No Computing Device | 24,448 | 9.5% |
| Total | 257,499 | 100.0% |
Internet Access in Hidalgo County
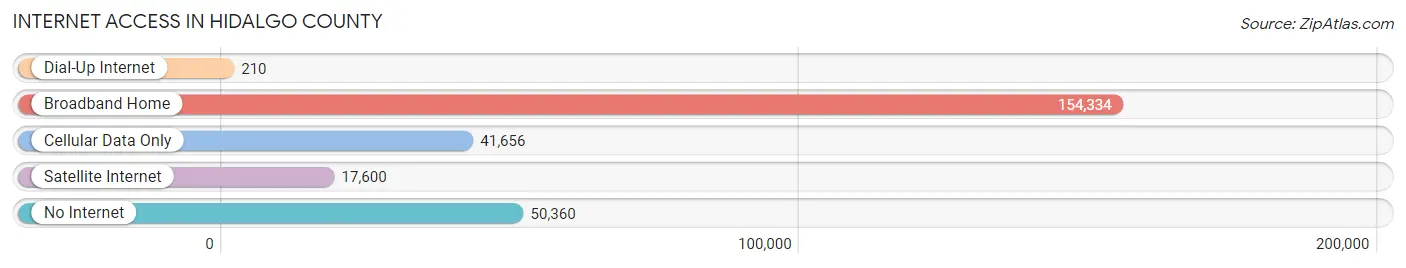
| Internet Type | # Households | % Households |
| Dial-Up Internet | 210 | 0.1% |
| Broadband Home | 154,334 | 59.9% |
| Cellular Data Only | 41,656 | 16.2% |
| Satellite Internet | 17,600 | 6.8% |
| No Internet | 50,360 | 19.6% |
| Total | 257,499 | 100.0% |
Hidalgo County Summary
Hidalgo County is located in the southernmost part of Texas, along the Rio Grande River. It is bordered by Starr County to the north, Cameron County to the east, and Mexico to the south. The county seat is Edinburg, and the largest city is McAllen. The county was named after Miguel Hidalgo y Costilla, a Mexican priest who is considered the father of Mexican independence.
Hidalgo County has a rich history that dates back to the early 1800s. The area was originally inhabited by Native American tribes, including the Coahuiltecans, Karankawas, and Lipan Apaches. In 1848, the Treaty of Guadalupe Hidalgo ended the Mexican-American War and established the Rio Grande as the border between the United States and Mexico. This resulted in the creation of Hidalgo County, which was officially established in 1852.
The county’s economy has traditionally been based on agriculture, with cotton, sorghum, and vegetables being the main crops. In recent years, however, the economy has diversified to include manufacturing, tourism, and retail. The county is home to several large employers, including the University of Texas Rio Grande Valley, the McAllen Medical Center, and the McAllen-Hidalgo International Bridge.
Hidalgo County has a population of 842,304, according to the 2020 U.S. Census. The population is largely Hispanic, with over 90% of the population identifying as such. The median household income is $45,845, and the median age is 30. The county is also home to a large number of immigrants, with over 40% of the population being foreign-born.
Hidalgo County is home to a variety of attractions, including the National Butterfly Center, the Santa Ana National Wildlife Refuge, and the World Birding Center. The county is also home to several museums, including the International Museum of Art and Science and the Museum of South Texas History.
Hidalgo County is a vibrant and diverse region of Texas. Its rich history, diverse economy, and vibrant culture make it an attractive destination for visitors and residents alike. With its proximity to Mexico, the county is a gateway to Latin America and a hub for international trade and commerce.
Common Questions
What is Per Capita Income in Hidalgo County?
Per Capita income in Hidalgo County is $20,844.
What is the Median Family Income in Hidalgo County?
Median Family Income in Hidalgo County is $54,864.
What is the Median Household income in Hidalgo County?
Median Household Income in Hidalgo County is $49,371.
What is Income or Wage Gap in Hidalgo County?
Income or Wage Gap in Hidalgo County is 33.0%.
Women in Hidalgo County earn 67.0 cents for every dollar earned by a man.
What is Family Income Deficit in Hidalgo County?
Family Income Deficit in Hidalgo County is $12,205.
Families that are below poverty line in Hidalgo County earn $12,205 less on average than the poverty threshold level.
What is Inequality or Gini Index in Hidalgo County?
Inequality or Gini Index in Hidalgo County is 0.48.
What is the Total Population of Hidalgo County?
Total Population of Hidalgo County is 873,167.
What is the Total Male Population of Hidalgo County?
Total Male Population of Hidalgo County is 431,639.
What is the Total Female Population of Hidalgo County?
Total Female Population of Hidalgo County is 441,528.
What is the Ratio of Males per 100 Females in Hidalgo County?
There are 97.76 Males per 100 Females in Hidalgo County.
What is the Ratio of Females per 100 Males in Hidalgo County?
There are 102.29 Females per 100 Males in Hidalgo County.
What is the Median Population Age in Hidalgo County?
Median Population Age in Hidalgo County is 29.8 Years.
What is the Average Family Size in Hidalgo County
Average Family Size in Hidalgo County is 3.9 People.
What is the Average Household Size in Hidalgo County
Average Household Size in Hidalgo County is 3.4 People.
How Large is the Labor Force in Hidalgo County?
There are 369,639 People in the Labor Forcein in Hidalgo County.
What is the Percentage of People in the Labor Force in Hidalgo County?
58.8% of People are in the Labor Force in Hidalgo County.
What is the Unemployment Rate in Hidalgo County?
Unemployment Rate in Hidalgo County is 7.6%.