Benham, KY Map & Demographics
Benham Map
Benham Overview
$23,413
PER CAPITA INCOME
$53,173
AVG FAMILY INCOME
$50,595
AVG HOUSEHOLD INCOME
10.4%
WAGE / INCOME GAP [ % ]
89.6¢/ $1
WAGE / INCOME GAP [ $ ]
0.35
INEQUALITY / GINI INDEX
610
TOTAL POPULATION
327
MALE POPULATION
283
FEMALE POPULATION
115.55
MALES / 100 FEMALES
86.54
FEMALES / 100 MALES
44.2
MEDIAN AGE
2.7
AVG FAMILY SIZE
2.2
AVG HOUSEHOLD SIZE
215
LABOR FORCE [ PEOPLE ]
42.3%
PERCENT IN LABOR FORCE
9.8%
UNEMPLOYMENT RATE
Benham Zip Codes
Benham Area Codes
Income in Benham
Income Overview in Benham
Per Capita Income in Benham is $23,413, while median incomes of families and households are $53,173 and $50,595 respectively.
| Characteristic | Number | Measure |
| Per Capita Income | 610 | $23,413 |
| Median Family Income | 199 | $53,173 |
| Mean Family Income | 199 | $66,959 |
| Median Household Income | 270 | $50,595 |
| Mean Household Income | 270 | $54,949 |
| Income Deficit | 199 | $0 |
| Wage / Income Gap (%) | 610 | 10.38% |
| Wage / Income Gap ($) | 610 | 89.62¢ per $1 |
| Gini / Inequality Index | 610 | 0.35 |
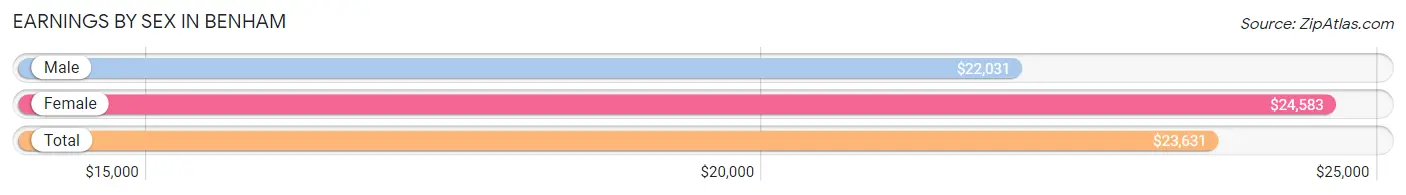
Earnings by Sex in Benham
Average Earnings in Benham are $23,631, $22,031 for men and $24,583 for women, a difference of 10.4%.
| Sex | Number | Average Earnings |
| Male | 118 (59.9%) | $22,031 |
| Female | 79 (40.1%) | $24,583 |
| Total | 197 (100.0%) | $23,631 |
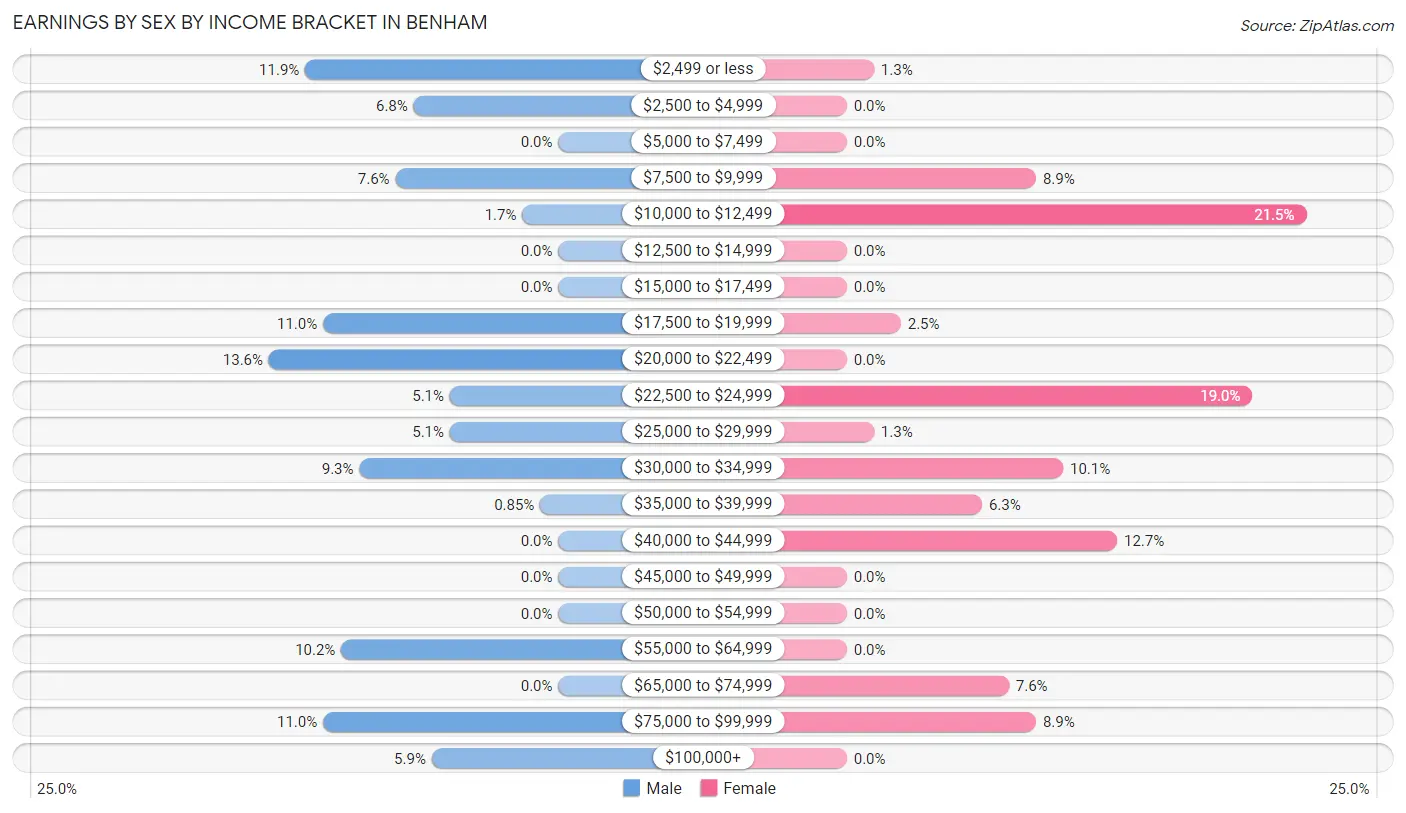
Earnings by Sex by Income Bracket in Benham
The most common earnings brackets in Benham are $20,000 to $22,499 for men (16 | 13.6%) and $10,000 to $12,499 for women (17 | 21.5%).
| Income | Male | Female |
| $2,499 or less | 14 (11.9%) | 1 (1.3%) |
| $2,500 to $4,999 | 8 (6.8%) | 0 (0.0%) |
| $5,000 to $7,499 | 0 (0.0%) | 0 (0.0%) |
| $7,500 to $9,999 | 9 (7.6%) | 7 (8.9%) |
| $10,000 to $12,499 | 2 (1.7%) | 17 (21.5%) |
| $12,500 to $14,999 | 0 (0.0%) | 0 (0.0%) |
| $15,000 to $17,499 | 0 (0.0%) | 0 (0.0%) |
| $17,500 to $19,999 | 13 (11.0%) | 2 (2.5%) |
| $20,000 to $22,499 | 16 (13.6%) | 0 (0.0%) |
| $22,500 to $24,999 | 6 (5.1%) | 15 (19.0%) |
| $25,000 to $29,999 | 6 (5.1%) | 1 (1.3%) |
| $30,000 to $34,999 | 11 (9.3%) | 8 (10.1%) |
| $35,000 to $39,999 | 1 (0.9%) | 5 (6.3%) |
| $40,000 to $44,999 | 0 (0.0%) | 10 (12.7%) |
| $45,000 to $49,999 | 0 (0.0%) | 0 (0.0%) |
| $50,000 to $54,999 | 0 (0.0%) | 0 (0.0%) |
| $55,000 to $64,999 | 12 (10.2%) | 0 (0.0%) |
| $65,000 to $74,999 | 0 (0.0%) | 6 (7.6%) |
| $75,000 to $99,999 | 13 (11.0%) | 7 (8.9%) |
| $100,000+ | 7 (5.9%) | 0 (0.0%) |
| Total | 118 (100.0%) | 79 (100.0%) |
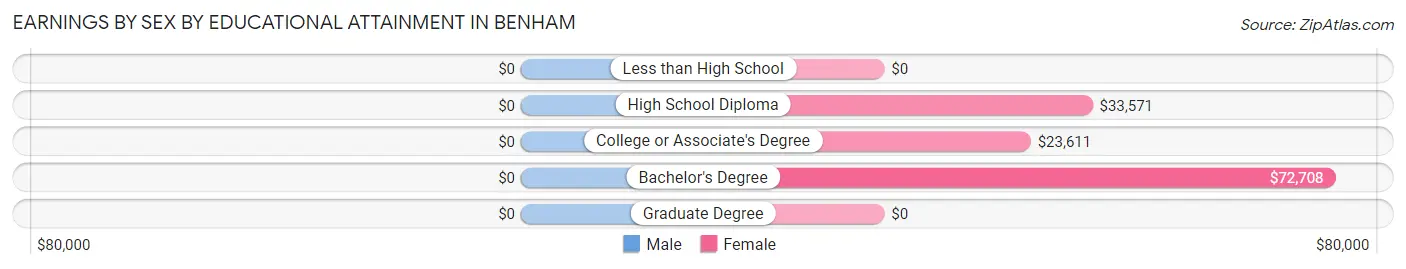
Earnings by Sex by Educational Attainment in Benham
| Educational Attainment | Male Income | Female Income |
| Less than High School | - | - |
| High School Diploma | - | - |
| College or Associate's Degree | - | - |
| Bachelor's Degree | - | - |
| Graduate Degree | - | - |
| Total | $26,250 | $33,214 |
Family Income in Benham
Family Income Brackets in Benham
According to the Benham family income data, there are 98 families falling into the $50,000 to $74,999 income range, which is the most common income bracket and makes up 49.2% of all families.
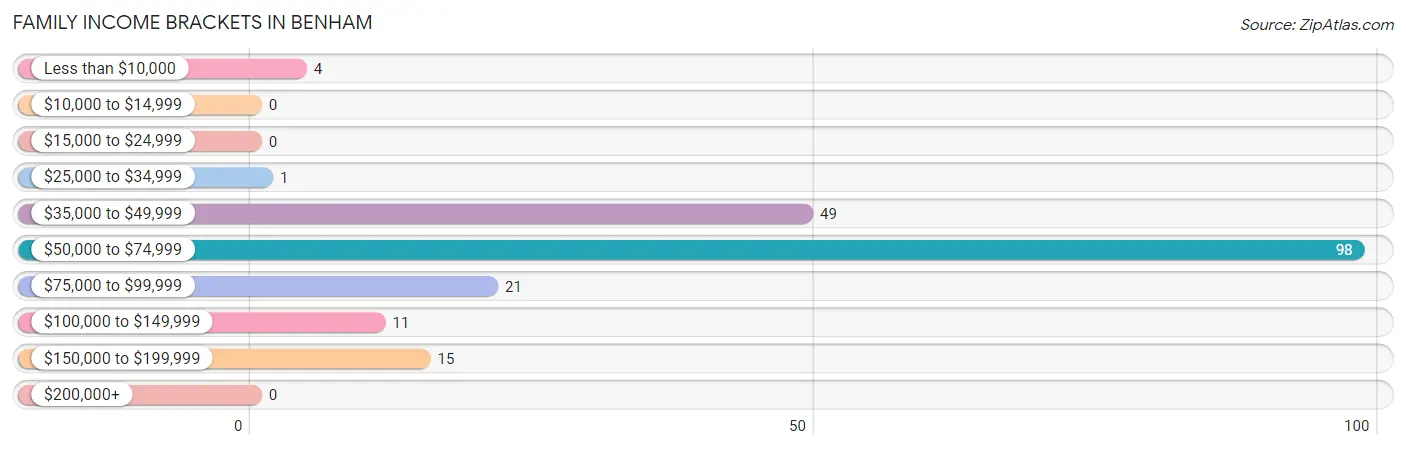
| Income Bracket | # Families | % Families |
| Less than $10,000 | 4 | 2.0% |
| $10,000 to $14,999 | 0 | 0.0% |
| $15,000 to $24,999 | 0 | 0.0% |
| $25,000 to $34,999 | 1 | 0.5% |
| $35,000 to $49,999 | 49 | 24.6% |
| $50,000 to $74,999 | 98 | 49.2% |
| $75,000 to $99,999 | 21 | 10.6% |
| $100,000 to $149,999 | 11 | 5.5% |
| $150,000 to $199,999 | 15 | 7.5% |
| $200,000+ | 0 | 0.0% |
Family Income by Famaliy Size in Benham
4-person families (23 | 11.6%) account for the highest median family income in Benham with $78,393 per family, while 2-person families (133 | 66.8%) have the highest median income of $26,110 per family member.
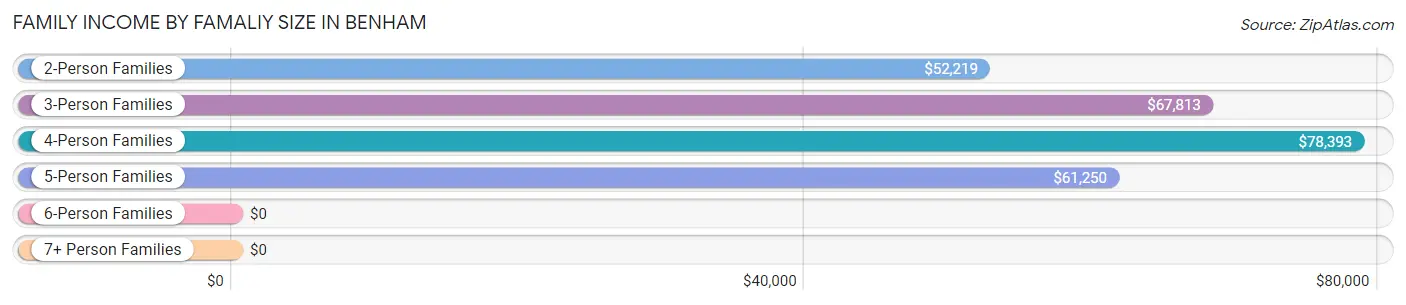
| Income Bracket | # Families | Median Income |
| 2-Person Families | 133 (66.8%) | $52,219 |
| 3-Person Families | 19 (9.6%) | $67,813 |
| 4-Person Families | 23 (11.6%) | $78,393 |
| 5-Person Families | 19 (9.6%) | $61,250 |
| 6-Person Families | 4 (2.0%) | $0 |
| 7+ Person Families | 1 (0.5%) | $0 |
| Total | 199 (100.0%) | $53,173 |
Family Income by Number of Earners in Benham
The median family income in Benham is $53,173, with families comprising 1 earner (22) having the highest median family income of $93,571, while families with no earners (112) have the lowest median family income of $51,250, accounting for 11.1% and 56.3% of families, respectively.
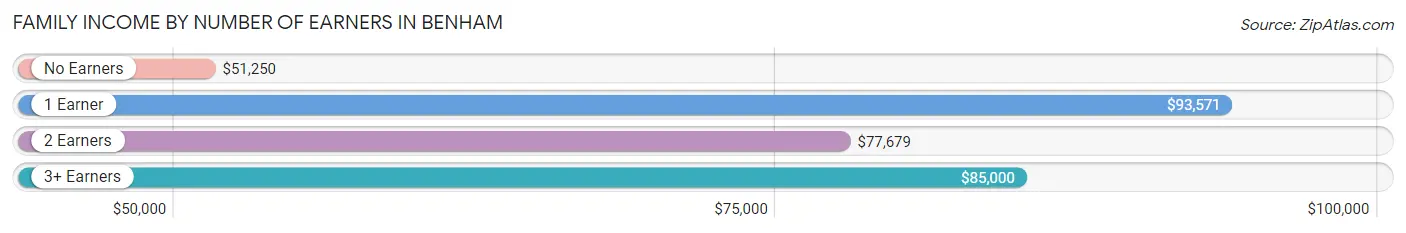
| Number of Earners | # Families | Median Income |
| No Earners | 112 (56.3%) | $51,250 |
| 1 Earner | 22 (11.1%) | $93,571 |
| 2 Earners | 55 (27.6%) | $77,679 |
| 3+ Earners | 10 (5.0%) | $85,000 |
| Total | 199 (100.0%) | $53,173 |
Household Income in Benham
Household Income Brackets in Benham
With 98 households falling in the category, the $50,000 to $74,999 income range is the most frequent in Benham, accounting for 36.3% of all households.
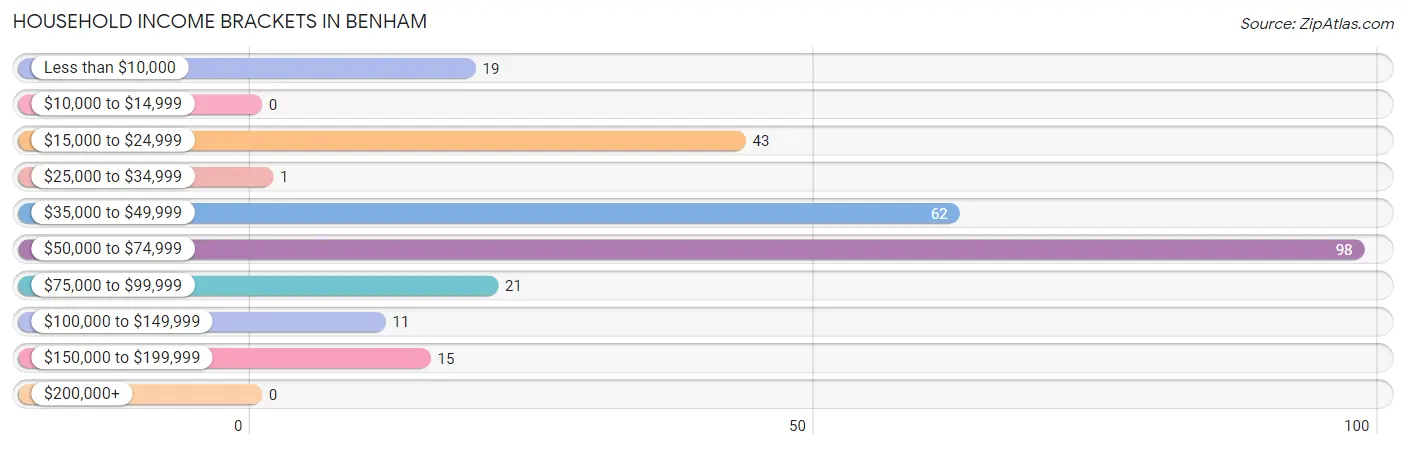
| Income Bracket | # Households | % Households |
| Less than $10,000 | 19 | 7.0% |
| $10,000 to $14,999 | 0 | 0.0% |
| $15,000 to $24,999 | 43 | 15.9% |
| $25,000 to $34,999 | 1 | 0.4% |
| $35,000 to $49,999 | 62 | 23.0% |
| $50,000 to $74,999 | 98 | 36.3% |
| $75,000 to $99,999 | 21 | 7.8% |
| $100,000 to $149,999 | 11 | 4.1% |
| $150,000 to $199,999 | 15 | 5.6% |
| $200,000+ | 0 | 0.0% |
Household Income by Householder Age in Benham
The median household income in Benham is $50,595, with the highest median household income of $50,906 found in the 65+ years age bracket for the primary householder. A total of 123 households (45.6%) fall into this category. Meanwhile, the 15 to 24 years age bracket for the primary householder has the lowest median household income of $0, with 2 households (0.7%) in this group.
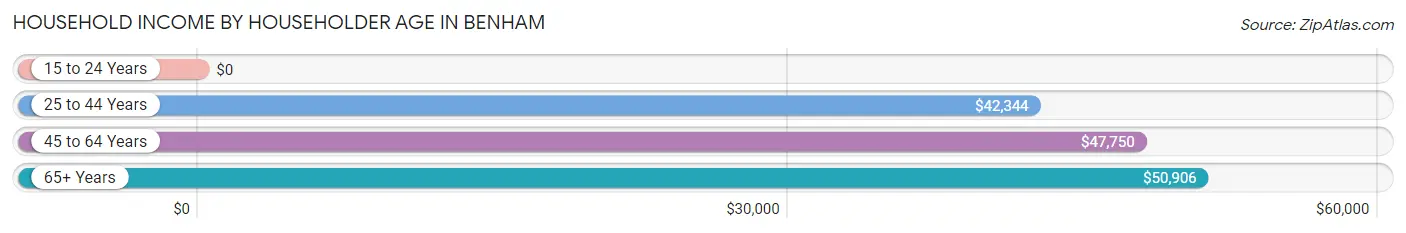
| Income Bracket | # Households | Median Income |
| 15 to 24 Years | 2 (0.7%) | $0 |
| 25 to 44 Years | 70 (25.9%) | $42,344 |
| 45 to 64 Years | 75 (27.8%) | $47,750 |
| 65+ Years | 123 (45.6%) | $50,906 |
| Total | 270 (100.0%) | $50,595 |
Poverty in Benham
Income Below Poverty by Sex and Age in Benham
With 7.6% poverty level for males and 1.4% for females among the residents of Benham, 12 to 14 year old males and 35 to 44 year old females are the most vulnerable to poverty, with 6 males (50.0%) and 4 females (7.7%) in their respective age groups living below the poverty level.
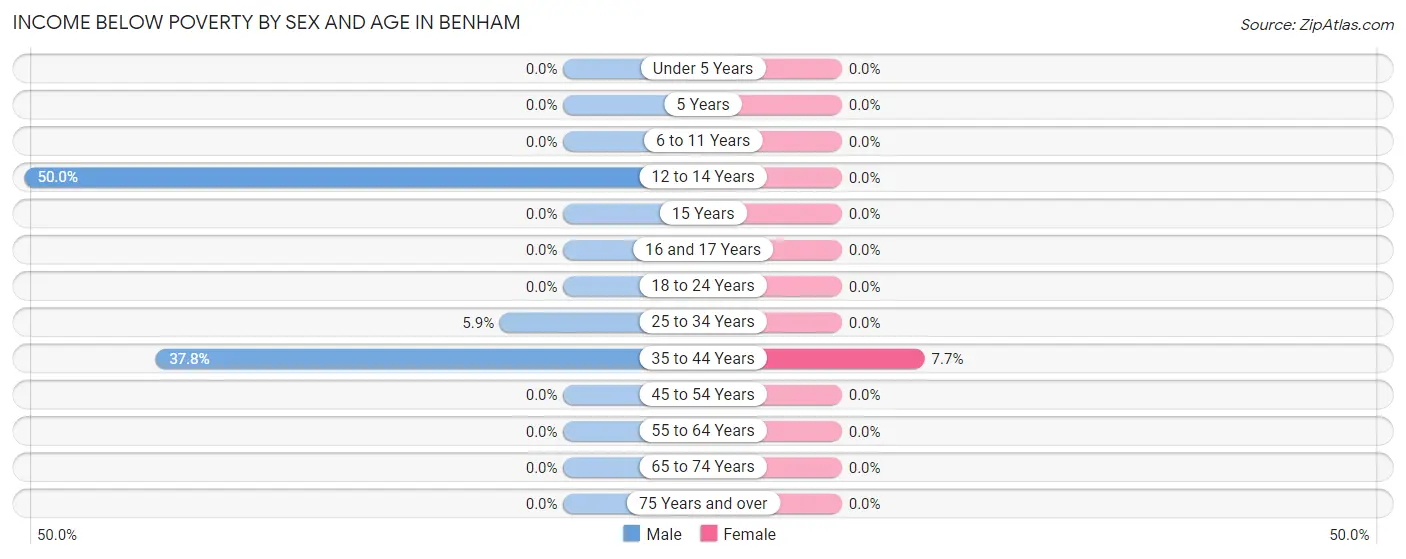
| Age Bracket | Male | Female |
| Under 5 Years | 0 (0.0%) | 0 (0.0%) |
| 5 Years | 0 (0.0%) | 0 (0.0%) |
| 6 to 11 Years | 0 (0.0%) | 0 (0.0%) |
| 12 to 14 Years | 6 (50.0%) | 0 (0.0%) |
| 15 Years | 0 (0.0%) | 0 (0.0%) |
| 16 and 17 Years | 0 (0.0%) | 0 (0.0%) |
| 18 to 24 Years | 0 (0.0%) | 0 (0.0%) |
| 25 to 34 Years | 2 (5.9%) | 0 (0.0%) |
| 35 to 44 Years | 17 (37.8%) | 4 (7.7%) |
| 45 to 54 Years | 0 (0.0%) | 0 (0.0%) |
| 55 to 64 Years | 0 (0.0%) | 0 (0.0%) |
| 65 to 74 Years | 0 (0.0%) | 0 (0.0%) |
| 75 Years and over | 0 (0.0%) | 0 (0.0%) |
| Total | 25 (7.6%) | 4 (1.4%) |
Income Above Poverty by Sex and Age in Benham
According to the poverty statistics in Benham, males aged under 5 years and females aged under 5 years are the age groups that are most secure financially, with 100.0% of males and 100.0% of females in these age groups living above the poverty line.
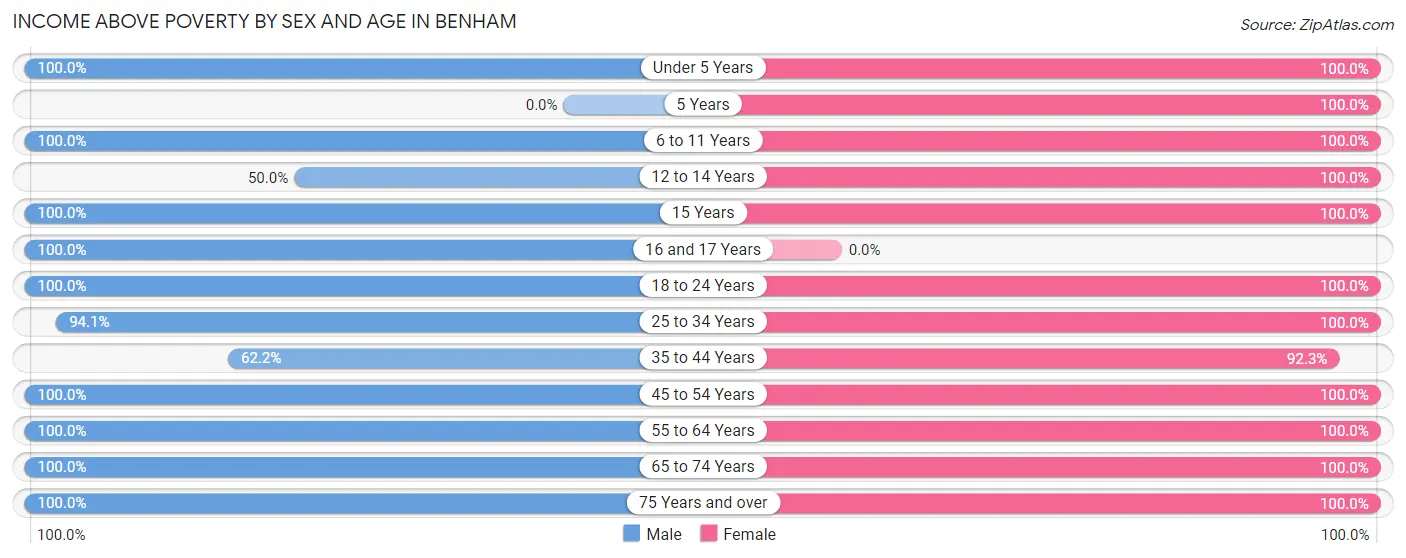
| Age Bracket | Male | Female |
| Under 5 Years | 11 (100.0%) | 14 (100.0%) |
| 5 Years | 0 (0.0%) | 10 (100.0%) |
| 6 to 11 Years | 12 (100.0%) | 16 (100.0%) |
| 12 to 14 Years | 6 (50.0%) | 17 (100.0%) |
| 15 Years | 2 (100.0%) | 8 (100.0%) |
| 16 and 17 Years | 6 (100.0%) | 0 (0.0%) |
| 18 to 24 Years | 42 (100.0%) | 19 (100.0%) |
| 25 to 34 Years | 32 (94.1%) | 16 (100.0%) |
| 35 to 44 Years | 28 (62.2%) | 48 (92.3%) |
| 45 to 54 Years | 43 (100.0%) | 22 (100.0%) |
| 55 to 64 Years | 36 (100.0%) | 11 (100.0%) |
| 65 to 74 Years | 76 (100.0%) | 57 (100.0%) |
| 75 Years and over | 8 (100.0%) | 41 (100.0%) |
| Total | 302 (92.3%) | 279 (98.6%) |
Income Below Poverty Among Married-Couple Families in Benham
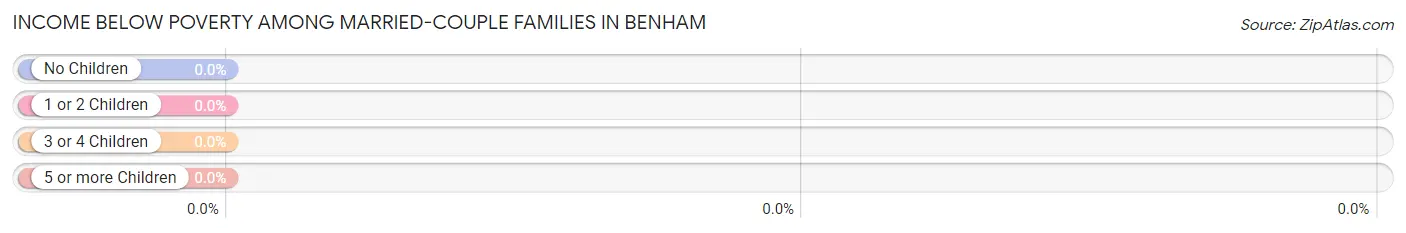
| Children | Above Poverty | Below Poverty |
| No Children | 95 (100.0%) | 0 (0.0%) |
| 1 or 2 Children | 32 (100.0%) | 0 (0.0%) |
| 3 or 4 Children | 11 (100.0%) | 0 (0.0%) |
| 5 or more Children | 0 (0.0%) | 0 (0.0%) |
| Total | 138 (100.0%) | 0 (0.0%) |
Income Below Poverty Among Single-Parent Households in Benham
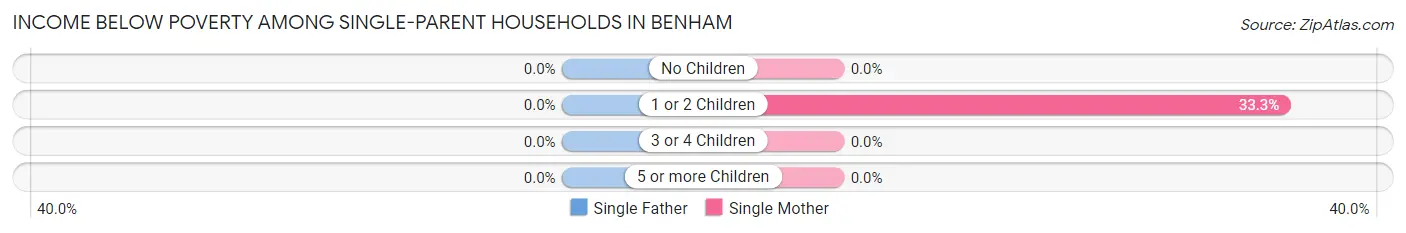
| Children | Single Father | Single Mother |
| No Children | 0 (0.0%) | 0 (0.0%) |
| 1 or 2 Children | 0 (0.0%) | 4 (33.3%) |
| 3 or 4 Children | 0 (0.0%) | 0 (0.0%) |
| 5 or more Children | 0 (0.0%) | 0 (0.0%) |
| Total | 0 (0.0%) | 4 (9.1%) |
Income Below Poverty Among Married-Couple vs Single-Parent Households in Benham
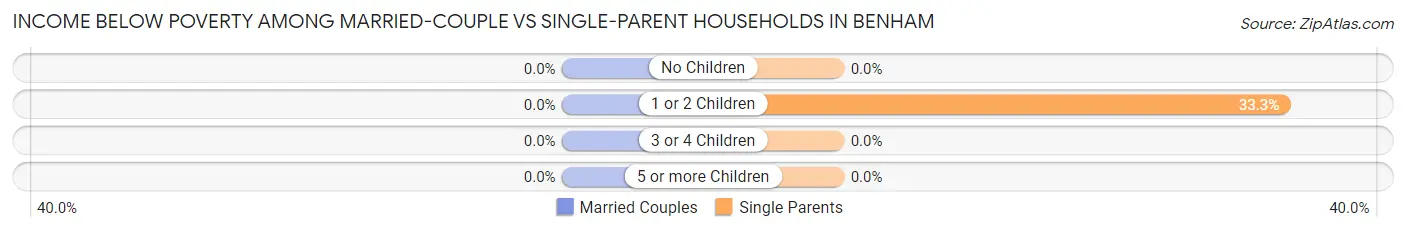
| Children | Married-Couple Families | Single-Parent Households |
| No Children | 0 (0.0%) | 0 (0.0%) |
| 1 or 2 Children | 0 (0.0%) | 4 (33.3%) |
| 3 or 4 Children | 0 (0.0%) | 0 (0.0%) |
| 5 or more Children | 0 (0.0%) | 0 (0.0%) |
| Total | 0 (0.0%) | 4 (6.6%) |
Race in Benham
The most populous races in Benham are White / Caucasian (525 | 86.1%), Two or more Races (85 | 13.9%), and Hispanic or Latino (2 | 0.3%).
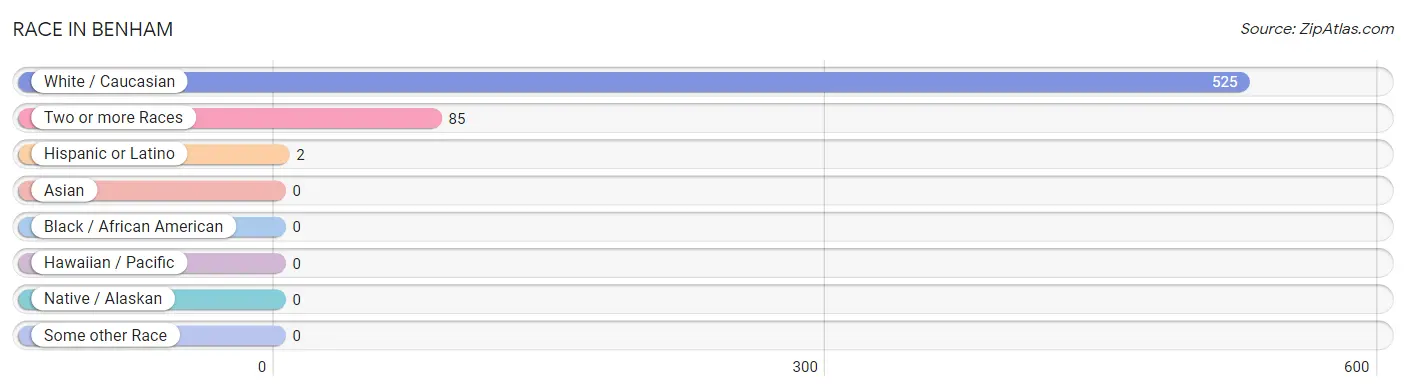
| Race | # Population | % Population |
| Asian | 0 | 0.0% |
| Black / African American | 0 | 0.0% |
| Hawaiian / Pacific | 0 | 0.0% |
| Hispanic or Latino | 2 | 0.3% |
| Native / Alaskan | 0 | 0.0% |
| White / Caucasian | 525 | 86.1% |
| Two or more Races | 85 | 13.9% |
| Some other Race | 0 | 0.0% |
| Total | 610 | 100.0% |
Ancestry in Benham
The most populous ancestries reported in Benham are English (61 | 10.0%), Irish (59 | 9.7%), Scottish (57 | 9.3%), American (38 | 6.2%), and Italian (22 | 3.6%), together accounting for 38.9% of all Benham residents.
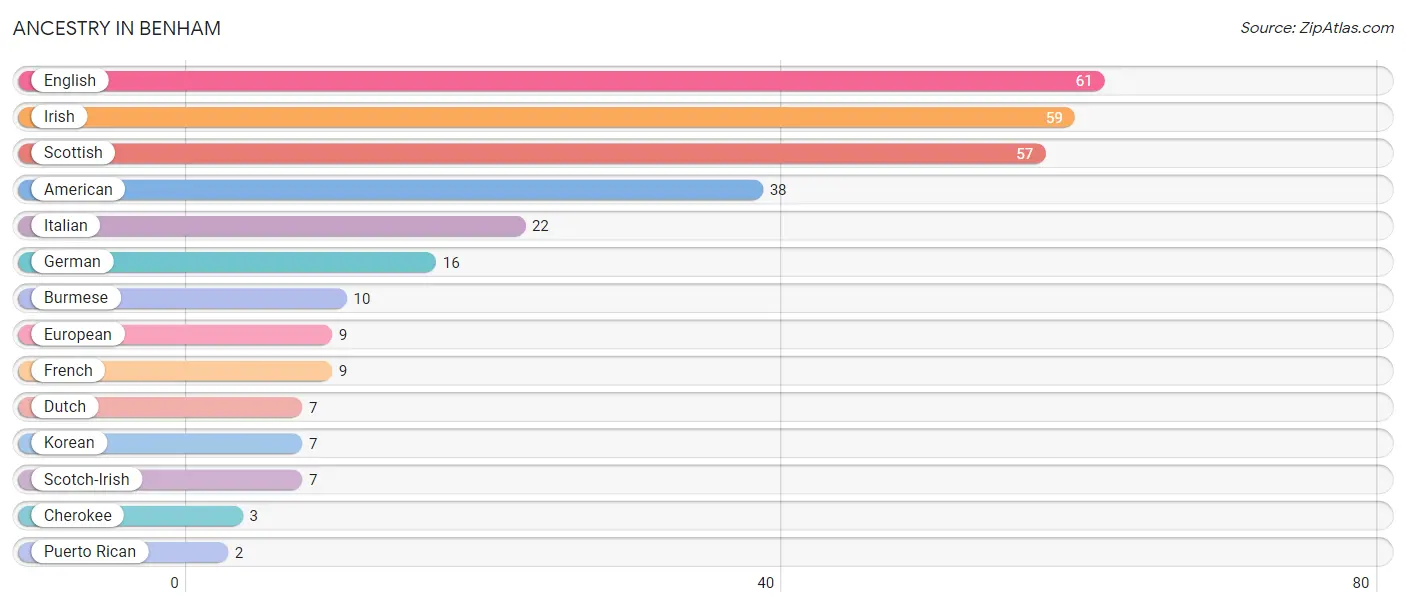
| Ancestry | # Population | % Population |
| American | 38 | 6.2% |
| Burmese | 10 | 1.6% |
| Cherokee | 3 | 0.5% |
| Dutch | 7 | 1.1% |
| English | 61 | 10.0% |
| European | 9 | 1.5% |
| French | 9 | 1.5% |
| German | 16 | 2.6% |
| Irish | 59 | 9.7% |
| Italian | 22 | 3.6% |
| Korean | 7 | 1.1% |
| Puerto Rican | 2 | 0.3% |
| Scotch-Irish | 7 | 1.1% |
| Scottish | 57 | 9.3% | View All 14 Rows |
Immigrants in Benham
The most numerous immigrant groups reported in Benham came from Asia (4 | 0.7%), Philippines (4 | 0.7%), and South Eastern Asia (4 | 0.7%), together accounting for 2.0% of all Benham residents.
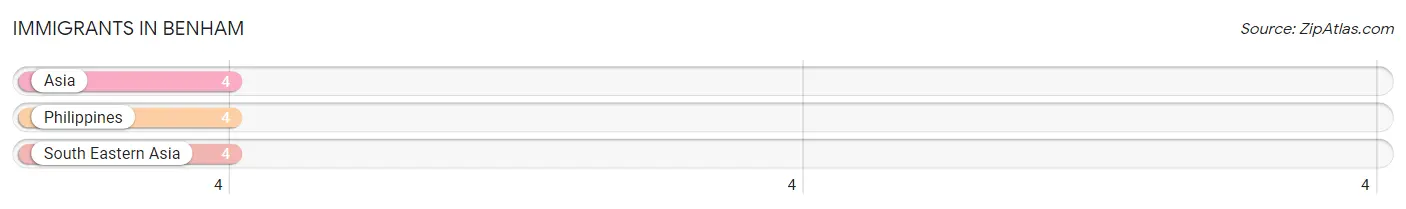
| Immigration Origin | # Population | % Population |
| Asia | 4 | 0.7% |
| Philippines | 4 | 0.7% |
| South Eastern Asia | 4 | 0.7% | View All 3 Rows |
Sex and Age in Benham
Sex and Age in Benham
The most populous age groups in Benham are 70 to 74 Years (60 | 18.3%) for men and 40 to 44 Years (34 | 12.0%) for women.
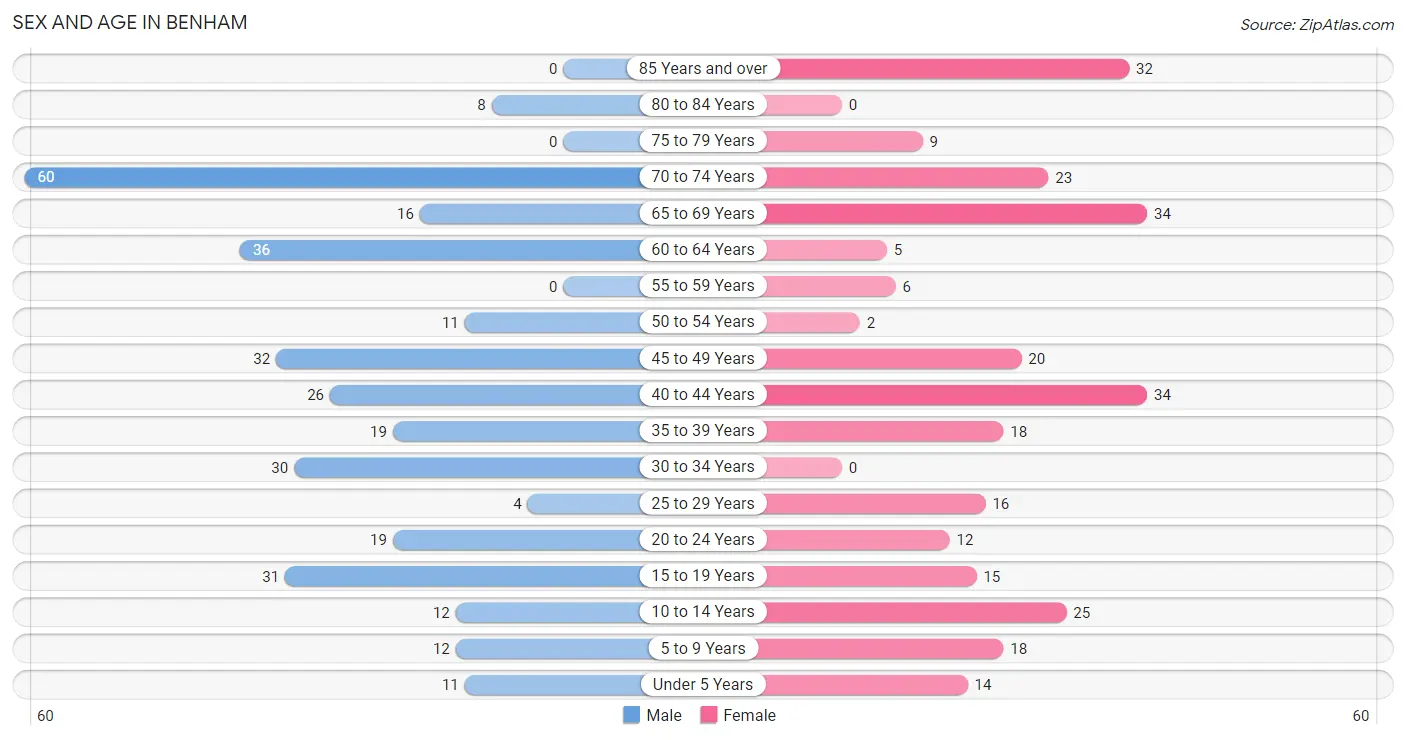
| Age Bracket | Male | Female |
| Under 5 Years | 11 (3.4%) | 14 (5.0%) |
| 5 to 9 Years | 12 (3.7%) | 18 (6.4%) |
| 10 to 14 Years | 12 (3.7%) | 25 (8.8%) |
| 15 to 19 Years | 31 (9.5%) | 15 (5.3%) |
| 20 to 24 Years | 19 (5.8%) | 12 (4.2%) |
| 25 to 29 Years | 4 (1.2%) | 16 (5.7%) |
| 30 to 34 Years | 30 (9.2%) | 0 (0.0%) |
| 35 to 39 Years | 19 (5.8%) | 18 (6.4%) |
| 40 to 44 Years | 26 (8.0%) | 34 (12.0%) |
| 45 to 49 Years | 32 (9.8%) | 20 (7.1%) |
| 50 to 54 Years | 11 (3.4%) | 2 (0.7%) |
| 55 to 59 Years | 0 (0.0%) | 6 (2.1%) |
| 60 to 64 Years | 36 (11.0%) | 5 (1.8%) |
| 65 to 69 Years | 16 (4.9%) | 34 (12.0%) |
| 70 to 74 Years | 60 (18.3%) | 23 (8.1%) |
| 75 to 79 Years | 0 (0.0%) | 9 (3.2%) |
| 80 to 84 Years | 8 (2.5%) | 0 (0.0%) |
| 85 Years and over | 0 (0.0%) | 32 (11.3%) |
| Total | 327 (100.0%) | 283 (100.0%) |
Families and Households in Benham
Median Family Size in Benham
The median family size in Benham is 2.69 persons per family, with married-couple families (138 | 69.4%) accounting for the largest median family size of 3.07 persons per family. On the other hand, single female/mother families (44 | 22.1%) represent the smallest median family size with 1.68 persons per family.
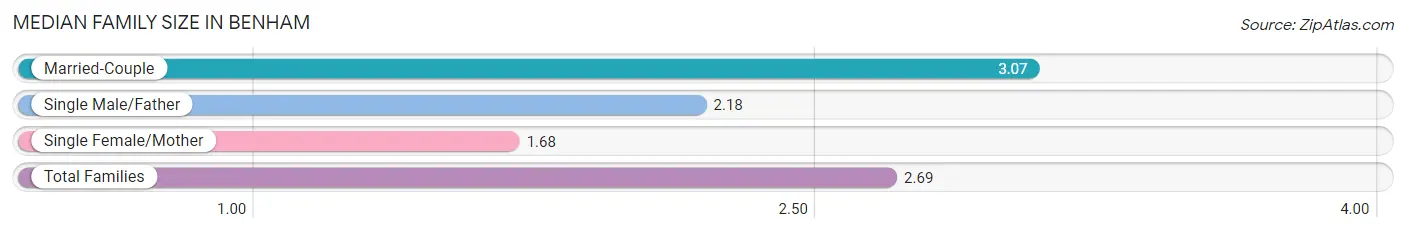
| Family Type | # Families | Family Size |
| Married-Couple | 138 (69.4%) | 3.07 |
| Single Male/Father | 17 (8.5%) | 2.18 |
| Single Female/Mother | 44 (22.1%) | 1.68 |
| Total Families | 199 (100.0%) | 2.69 |
Median Household Size in Benham
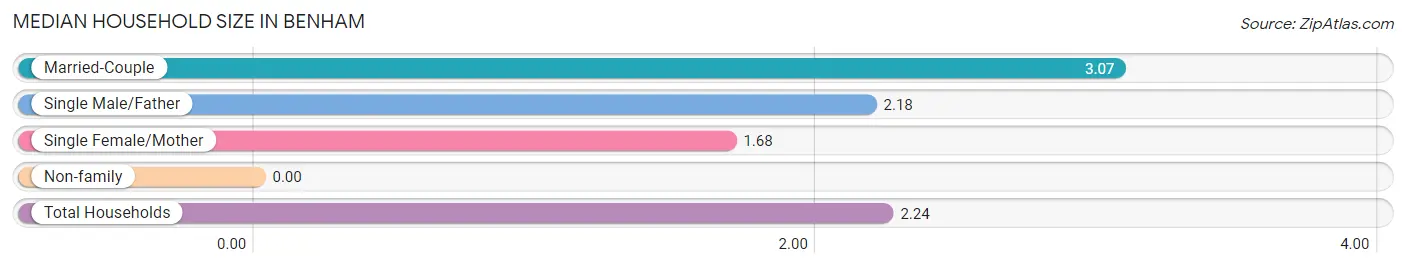
| Household Type | # Households | Household Size |
| Married-Couple | 138 (51.1%) | 3.07 |
| Single Male/Father | 17 (6.3%) | 2.18 |
| Single Female/Mother | 44 (16.3%) | 1.68 |
| Non-family | 71 (26.3%) | - |
| Total Households | 270 (100.0%) | 2.24 |
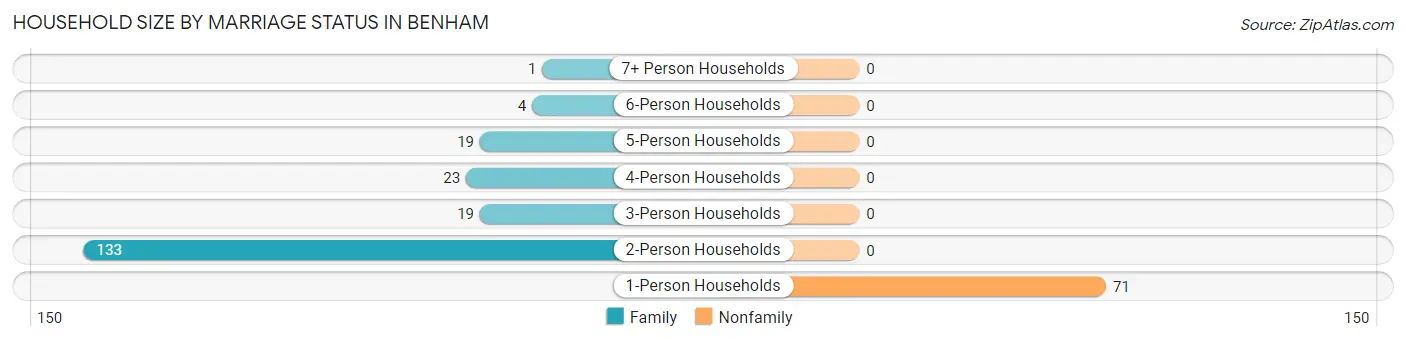
Household Size by Marriage Status in Benham
Out of a total of 270 households in Benham, 199 (73.7%) are family households, while 71 (26.3%) are nonfamily households. The most numerous type of family households are 2-person households, comprising 133, and the most common type of nonfamily households are 1-person households, comprising 71.
| Household Size | Family Households | Nonfamily Households |
| 1-Person Households | - | 71 (26.3%) |
| 2-Person Households | 133 (49.3%) | 0 (0.0%) |
| 3-Person Households | 19 (7.0%) | 0 (0.0%) |
| 4-Person Households | 23 (8.5%) | 0 (0.0%) |
| 5-Person Households | 19 (7.0%) | 0 (0.0%) |
| 6-Person Households | 4 (1.5%) | 0 (0.0%) |
| 7+ Person Households | 1 (0.4%) | 0 (0.0%) |
| Total | 199 (73.7%) | 71 (26.3%) |
Female Fertility in Benham
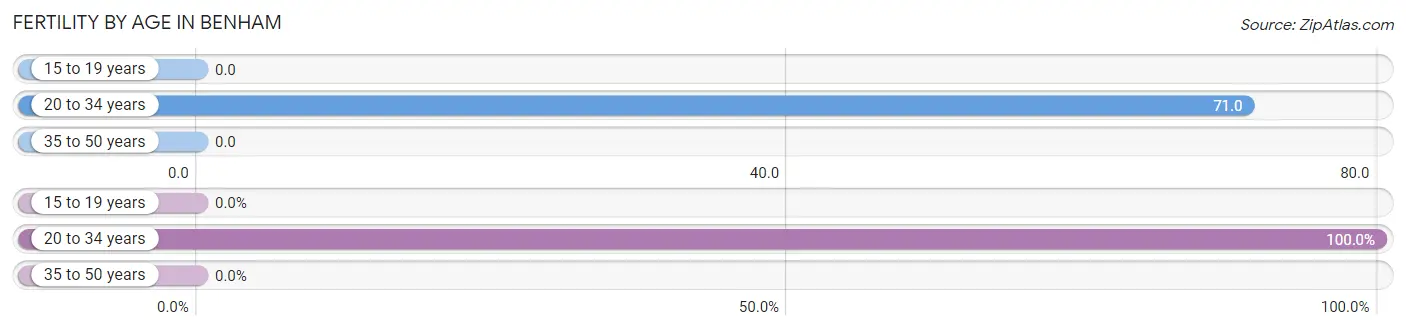
Fertility by Age in Benham
Average fertility rate in Benham is 17.0 births per 1,000 women. Women in the age bracket of 20 to 34 years have the highest fertility rate with 71.0 births per 1,000 women. Women in the age bracket of 20 to 34 years acount for 100.0% of all women with births.
| Age Bracket | Women with Births | Births / 1,000 Women |
| 15 to 19 years | 0 (0.0%) | 0.0 |
| 20 to 34 years | 2 (100.0%) | 71.0 |
| 35 to 50 years | 0 (0.0%) | 0.0 |
| Total | 2 (100.0%) | 17.0 |
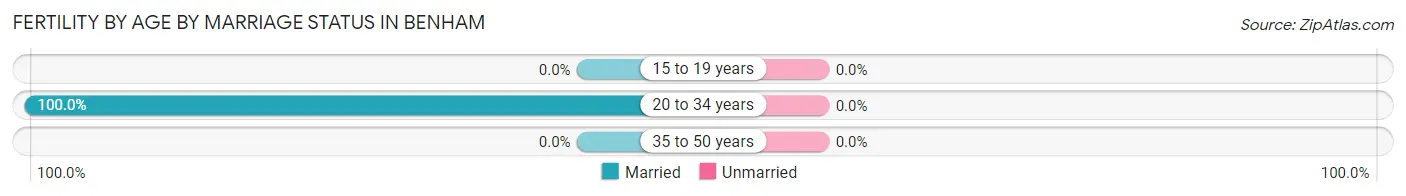
Fertility by Age by Marriage Status in Benham
| Age Bracket | Married | Unmarried |
| 15 to 19 years | 0 (0.0%) | 0 (0.0%) |
| 20 to 34 years | 2 (100.0%) | 0 (0.0%) |
| 35 to 50 years | 0 (0.0%) | 0 (0.0%) |
| Total | 2 (100.0%) | 0 (0.0%) |
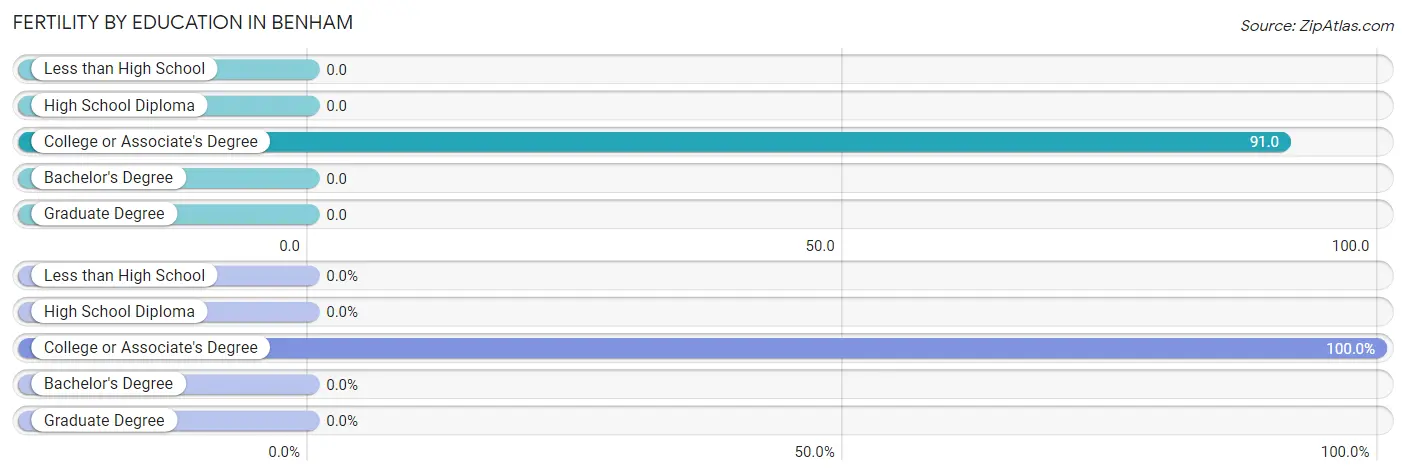
Fertility by Education in Benham
| Educational Attainment | Women with Births | Births / 1,000 Women |
| Less than High School | 0 (0.0%) | 0.0 |
| High School Diploma | 0 (0.0%) | 0.0 |
| College or Associate's Degree | 2 (100.0%) | 91.0 |
| Bachelor's Degree | 0 (0.0%) | 0.0 |
| Graduate Degree | 0 (0.0%) | 0.0 |
| Total | 2 (100.0%) | 17.0 |
Fertility by Education by Marriage Status in Benham
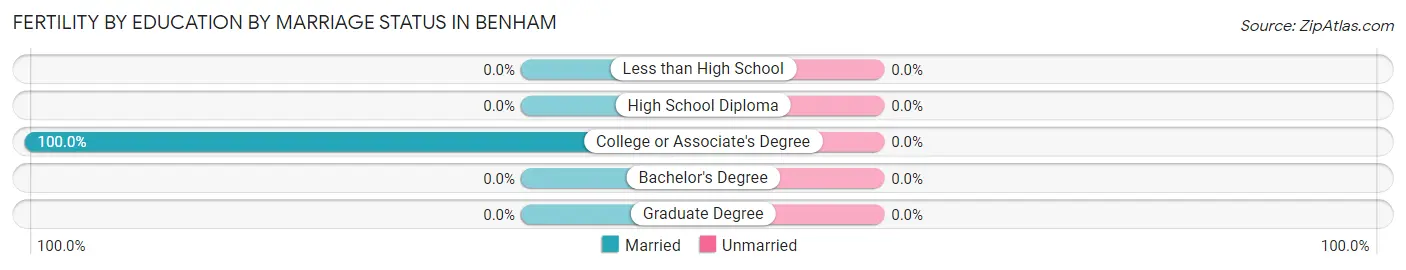
| Educational Attainment | Married | Unmarried |
| Less than High School | 0 (0.0%) | 0 (0.0%) |
| High School Diploma | 0 (0.0%) | 0 (0.0%) |
| College or Associate's Degree | 2 (100.0%) | 0 (0.0%) |
| Bachelor's Degree | 0 (0.0%) | 0 (0.0%) |
| Graduate Degree | 0 (0.0%) | 0 (0.0%) |
| Total | 2 (100.0%) | 0 (0.0%) |
Employment Characteristics in Benham
Employment by Class of Employer in Benham
Among the 194 employed individuals in Benham, private company employees (104 | 53.6%), not-for-profit organizations (53 | 27.3%), and self-employed (not incorporated) (30 | 15.5%) make up the most common classes of employment.
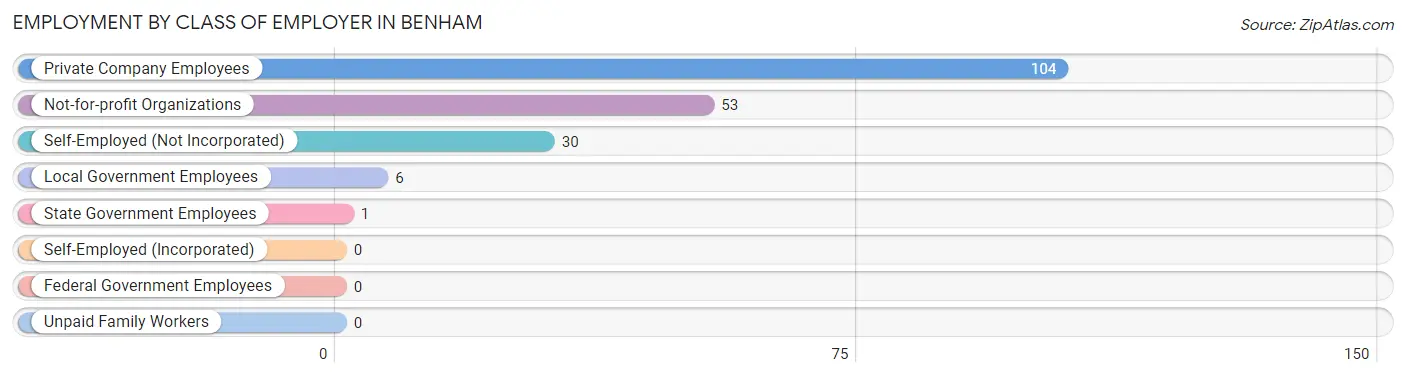
| Employer Class | # Employees | % Employees |
| Private Company Employees | 104 | 53.6% |
| Self-Employed (Incorporated) | 0 | 0.0% |
| Self-Employed (Not Incorporated) | 30 | 15.5% |
| Not-for-profit Organizations | 53 | 27.3% |
| Local Government Employees | 6 | 3.1% |
| State Government Employees | 1 | 0.5% |
| Federal Government Employees | 0 | 0.0% |
| Unpaid Family Workers | 0 | 0.0% |
| Total | 194 | 100.0% |
Employment Status by Age in Benham
According to the labor force statistics for Benham, out of the total population over 16 years of age (508), 42.3% or 215 individuals are in the labor force, with 9.8% or 21 of them unemployed. The age group with the highest labor force participation rate is 25 to 29 years, with 100.0% or 20 individuals in the labor force. Within the labor force, the 16 to 19 years age range has the highest percentage of unemployed individuals, with 35.3% or 6 of them being unemployed.
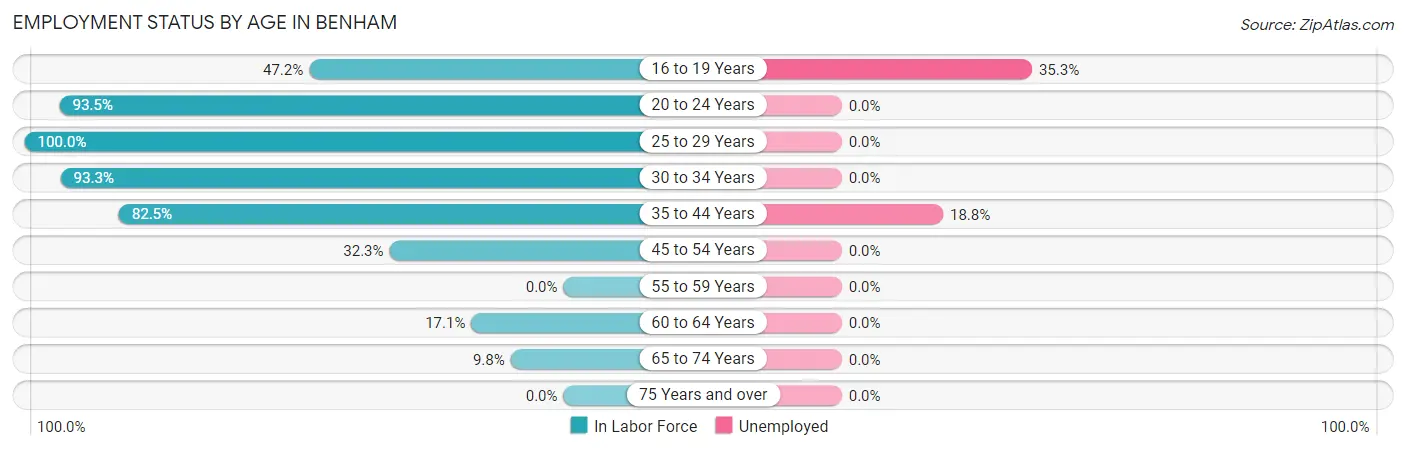
| Age Bracket | In Labor Force | Unemployed |
| 16 to 19 Years | 17 (47.2%) | 6 (35.3%) |
| 20 to 24 Years | 29 (93.5%) | 0 (0.0%) |
| 25 to 29 Years | 20 (100.0%) | 0 (0.0%) |
| 30 to 34 Years | 28 (93.3%) | 0 (0.0%) |
| 35 to 44 Years | 80 (82.5%) | 15 (18.8%) |
| 45 to 54 Years | 21 (32.3%) | 0 (0.0%) |
| 55 to 59 Years | 0 (0.0%) | 0 (0.0%) |
| 60 to 64 Years | 7 (17.1%) | 0 (0.0%) |
| 65 to 74 Years | 13 (9.8%) | 0 (0.0%) |
| 75 Years and over | 0 (0.0%) | 0 (0.0%) |
| Total | 215 (42.3%) | 21 (9.8%) |
Employment Status by Educational Attainment in Benham
According to labor force statistics for Benham, 60.2% of individuals (156) out of the total population between 25 and 64 years of age (259) are in the labor force, with 9.6% or 15 of them being unemployed. The group with the highest labor force participation rate are those with the educational attainment of bachelor's degree or higher, with 97.6% or 41 individuals in the labor force. Within the labor force, individuals with bachelor's degree or higher education have the highest percentage of unemployment, with 36.6% or 15 of them being unemployed.
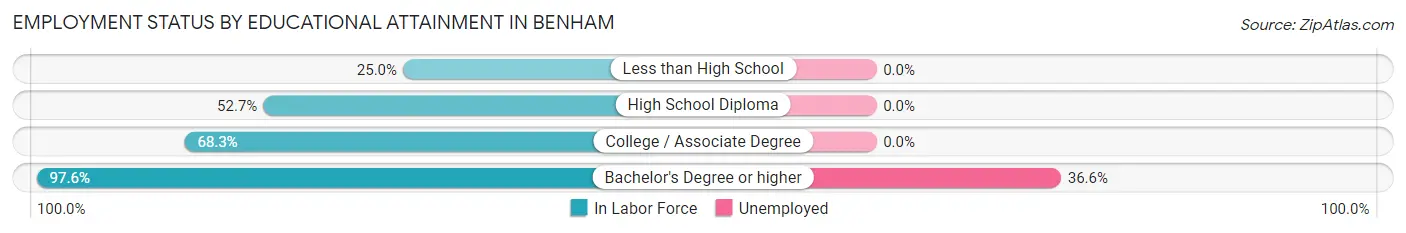
| Educational Attainment | In Labor Force | Unemployed |
| Less than High School | 11 (25.0%) | 0 (0.0%) |
| High School Diploma | 48 (52.7%) | 0 (0.0%) |
| College / Associate Degree | 56 (68.3%) | 0 (0.0%) |
| Bachelor's Degree or higher | 41 (97.6%) | 15 (36.6%) |
| Total | 156 (60.2%) | 25 (9.6%) |
Employment Occupations by Sex in Benham
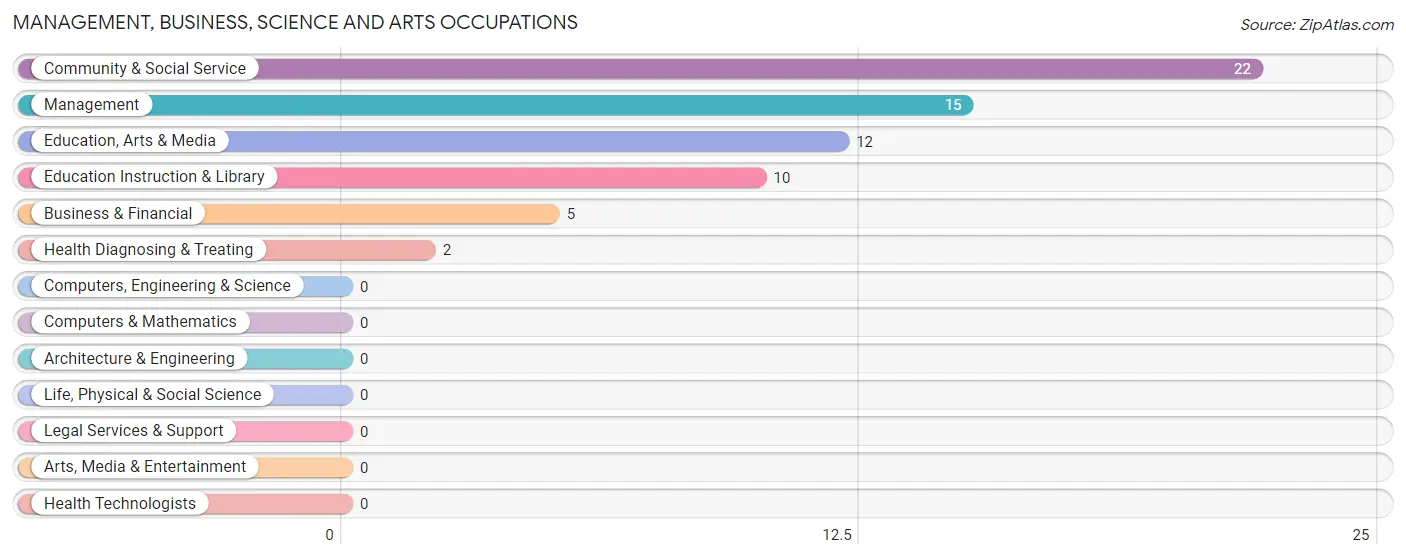
Management, Business, Science and Arts Occupations
The most common Management, Business, Science and Arts occupations in Benham are Community & Social Service (22 | 11.3%), Management (15 | 7.7%), Education, Arts & Media (12 | 6.2%), Education Instruction & Library (10 | 5.1%), and Business & Financial (5 | 2.6%).
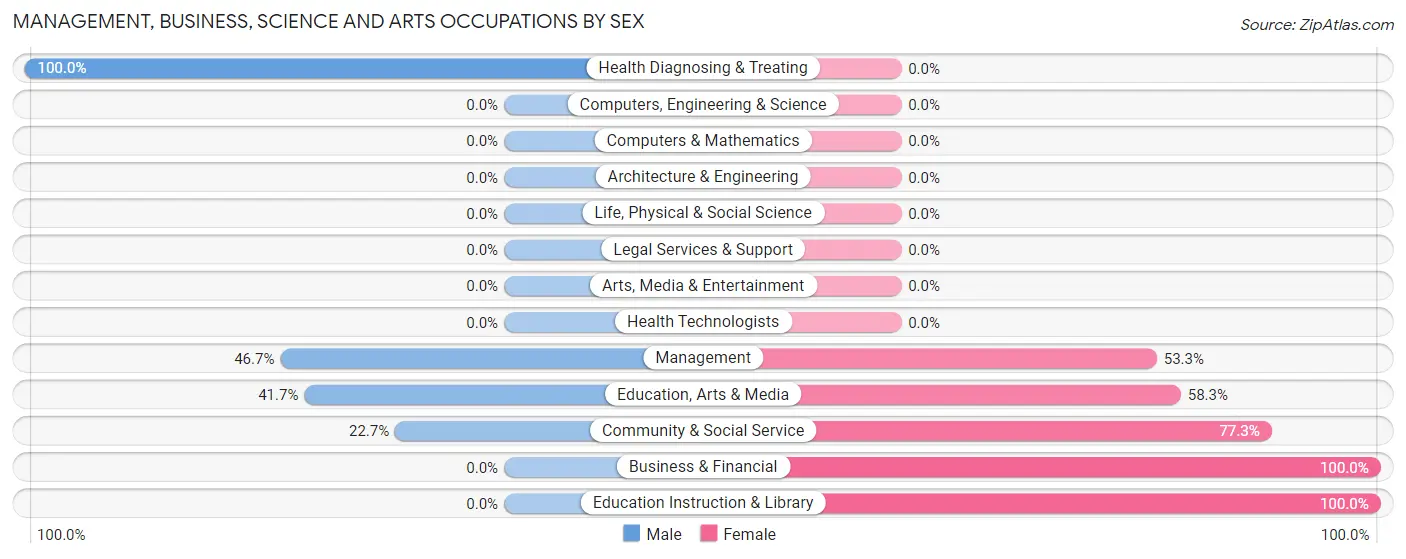
Management, Business, Science and Arts Occupations by Sex
Within the Management, Business, Science and Arts occupations in Benham, the most male-oriented occupations are Health Diagnosing & Treating (100.0%), Management (46.7%), and Education, Arts & Media (41.7%), while the most female-oriented occupations are Business & Financial (100.0%), Education Instruction & Library (100.0%), and Community & Social Service (77.3%).
| Occupation | Male | Female |
| Management | 7 (46.7%) | 8 (53.3%) |
| Business & Financial | 0 (0.0%) | 5 (100.0%) |
| Computers, Engineering & Science | 0 (0.0%) | 0 (0.0%) |
| Computers & Mathematics | 0 (0.0%) | 0 (0.0%) |
| Architecture & Engineering | 0 (0.0%) | 0 (0.0%) |
| Life, Physical & Social Science | 0 (0.0%) | 0 (0.0%) |
| Community & Social Service | 5 (22.7%) | 17 (77.3%) |
| Education, Arts & Media | 5 (41.7%) | 7 (58.3%) |
| Legal Services & Support | 0 (0.0%) | 0 (0.0%) |
| Education Instruction & Library | 0 (0.0%) | 10 (100.0%) |
| Arts, Media & Entertainment | 0 (0.0%) | 0 (0.0%) |
| Health Diagnosing & Treating | 2 (100.0%) | 0 (0.0%) |
| Health Technologists | 0 (0.0%) | 0 (0.0%) |
| Total (Category) | 14 (31.8%) | 30 (68.2%) |
| Total (Overall) | 118 (60.8%) | 76 (39.2%) |
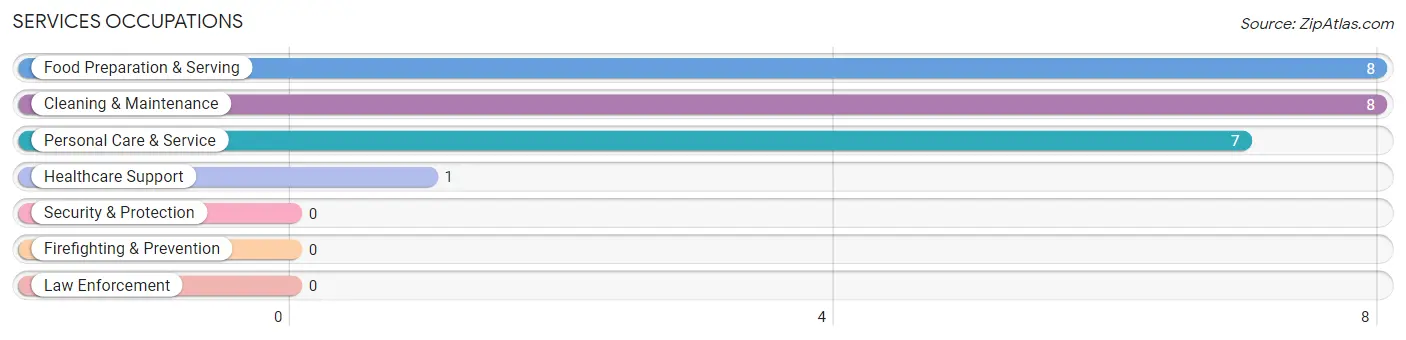
Services Occupations
The most common Services occupations in Benham are Food Preparation & Serving (8 | 4.1%), Cleaning & Maintenance (8 | 4.1%), Personal Care & Service (7 | 3.6%), and Healthcare Support (1 | 0.5%).
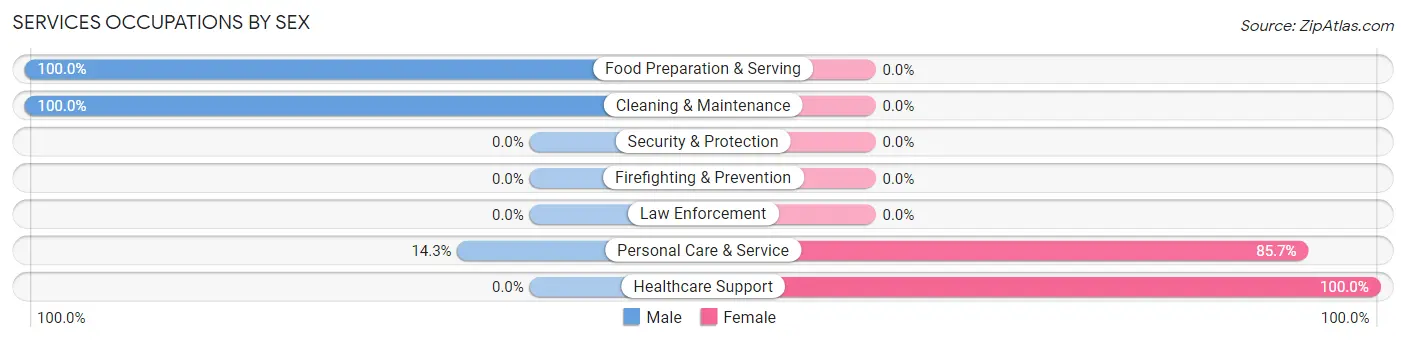
Services Occupations by Sex
Within the Services occupations in Benham, the most male-oriented occupations are Food Preparation & Serving (100.0%), Cleaning & Maintenance (100.0%), and Personal Care & Service (14.3%), while the most female-oriented occupations are Healthcare Support (100.0%), and Personal Care & Service (85.7%).
| Occupation | Male | Female |
| Healthcare Support | 0 (0.0%) | 1 (100.0%) |
| Security & Protection | 0 (0.0%) | 0 (0.0%) |
| Firefighting & Prevention | 0 (0.0%) | 0 (0.0%) |
| Law Enforcement | 0 (0.0%) | 0 (0.0%) |
| Food Preparation & Serving | 8 (100.0%) | 0 (0.0%) |
| Cleaning & Maintenance | 8 (100.0%) | 0 (0.0%) |
| Personal Care & Service | 1 (14.3%) | 6 (85.7%) |
| Total (Category) | 17 (70.8%) | 7 (29.2%) |
| Total (Overall) | 118 (60.8%) | 76 (39.2%) |
Sales and Office Occupations
The most common Sales and Office occupations in Benham are Sales & Related (45 | 23.2%), and Office & Administration (15 | 7.7%).
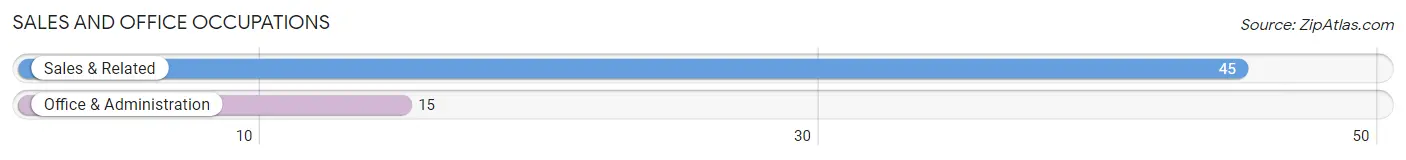
Sales and Office Occupations by Sex
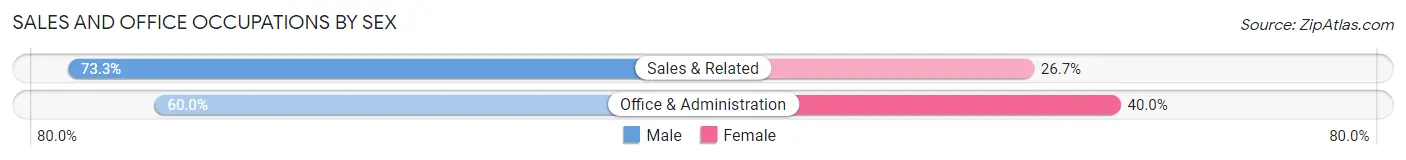
| Occupation | Male | Female |
| Sales & Related | 33 (73.3%) | 12 (26.7%) |
| Office & Administration | 9 (60.0%) | 6 (40.0%) |
| Total (Category) | 42 (70.0%) | 18 (30.0%) |
| Total (Overall) | 118 (60.8%) | 76 (39.2%) |
Natural Resources, Construction and Maintenance Occupations
The most common Natural Resources, Construction and Maintenance occupations in Benham are Construction & Extraction (10 | 5.1%), and Installation, Maintenance & Repair (7 | 3.6%).
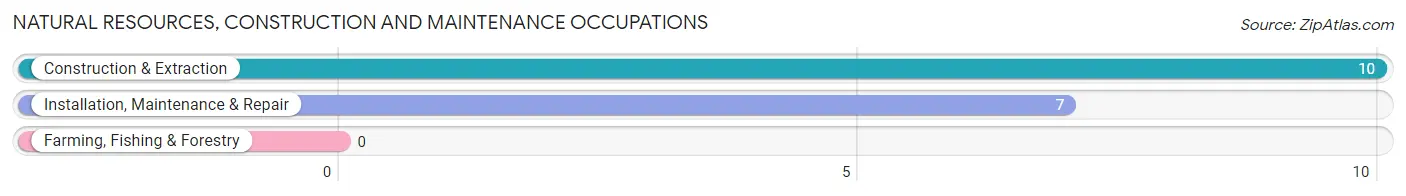
Natural Resources, Construction and Maintenance Occupations by Sex
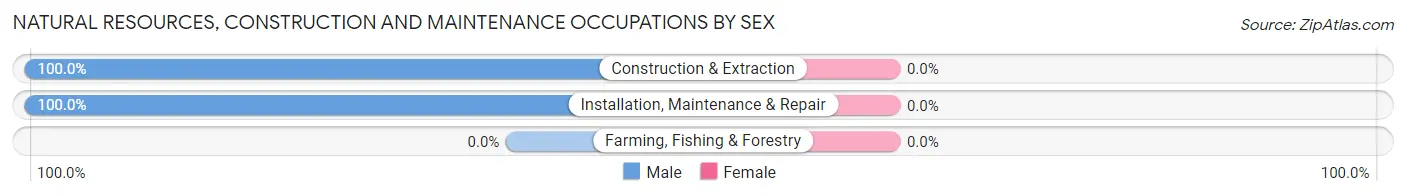
| Occupation | Male | Female |
| Farming, Fishing & Forestry | 0 (0.0%) | 0 (0.0%) |
| Construction & Extraction | 10 (100.0%) | 0 (0.0%) |
| Installation, Maintenance & Repair | 7 (100.0%) | 0 (0.0%) |
| Total (Category) | 17 (100.0%) | 0 (0.0%) |
| Total (Overall) | 118 (60.8%) | 76 (39.2%) |
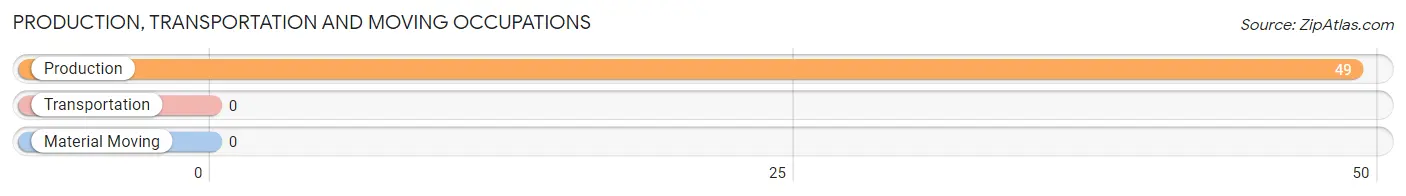
Production, Transportation and Moving Occupations
The most common Production, Transportation and Moving occupations in Benham are , and Production (49 | 25.3%).
Production, Transportation and Moving Occupations by Sex
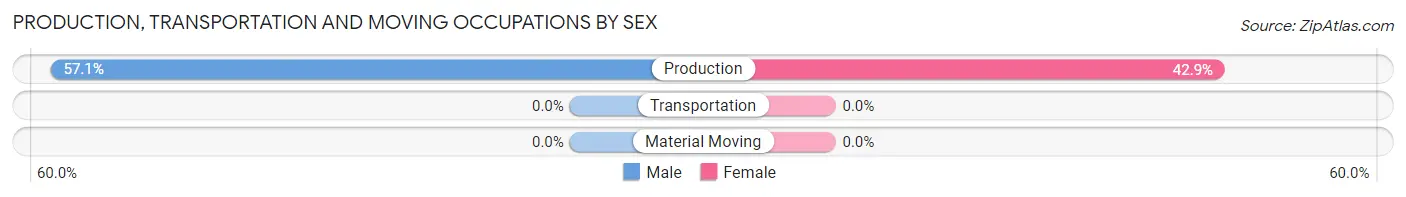
| Occupation | Male | Female |
| Production | 28 (57.1%) | 21 (42.9%) |
| Transportation | 0 (0.0%) | 0 (0.0%) |
| Material Moving | 0 (0.0%) | 0 (0.0%) |
| Total (Category) | 28 (57.1%) | 21 (42.9%) |
| Total (Overall) | 118 (60.8%) | 76 (39.2%) |
Employment Industries by Sex in Benham
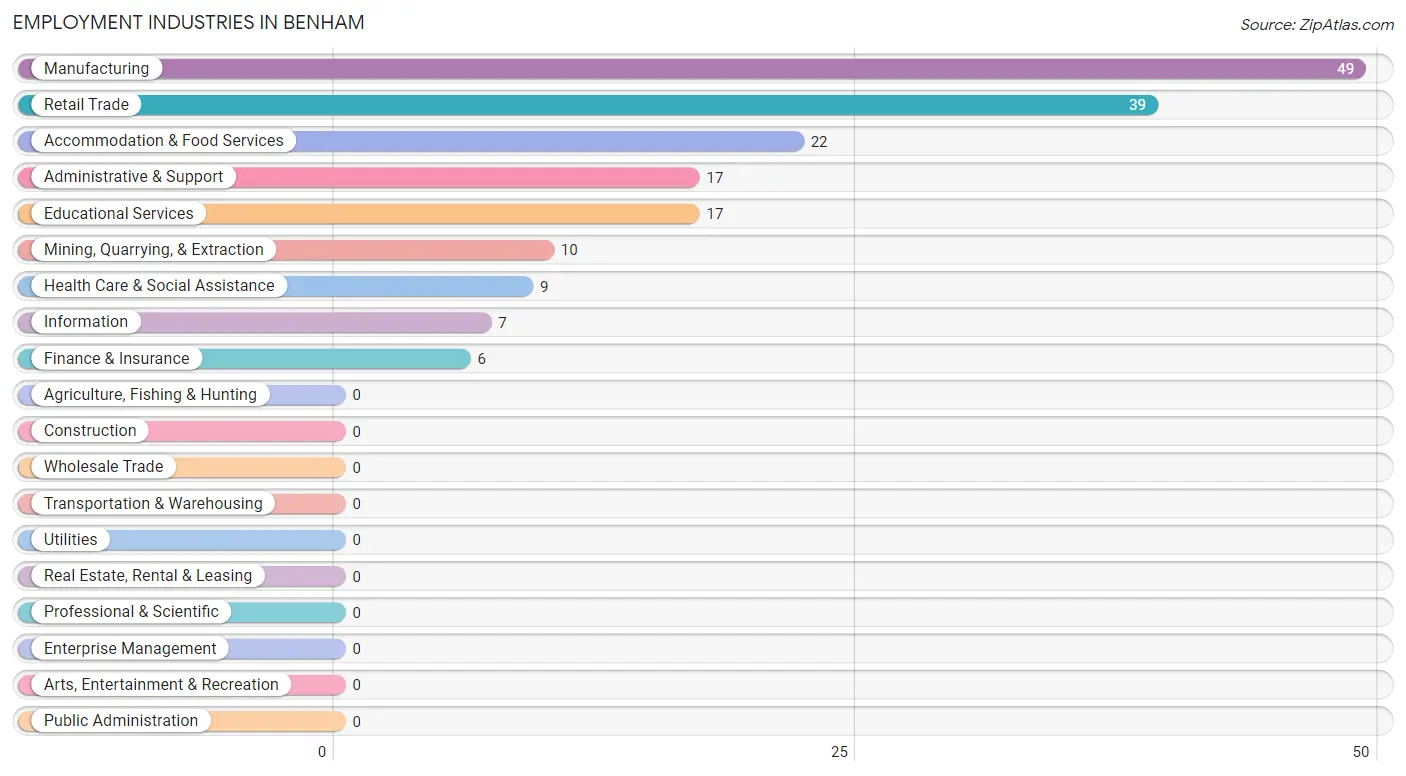
Employment Industries in Benham
The major employment industries in Benham include Manufacturing (49 | 25.3%), Retail Trade (39 | 20.1%), Accommodation & Food Services (22 | 11.3%), Administrative & Support (17 | 8.8%), and Educational Services (17 | 8.8%).
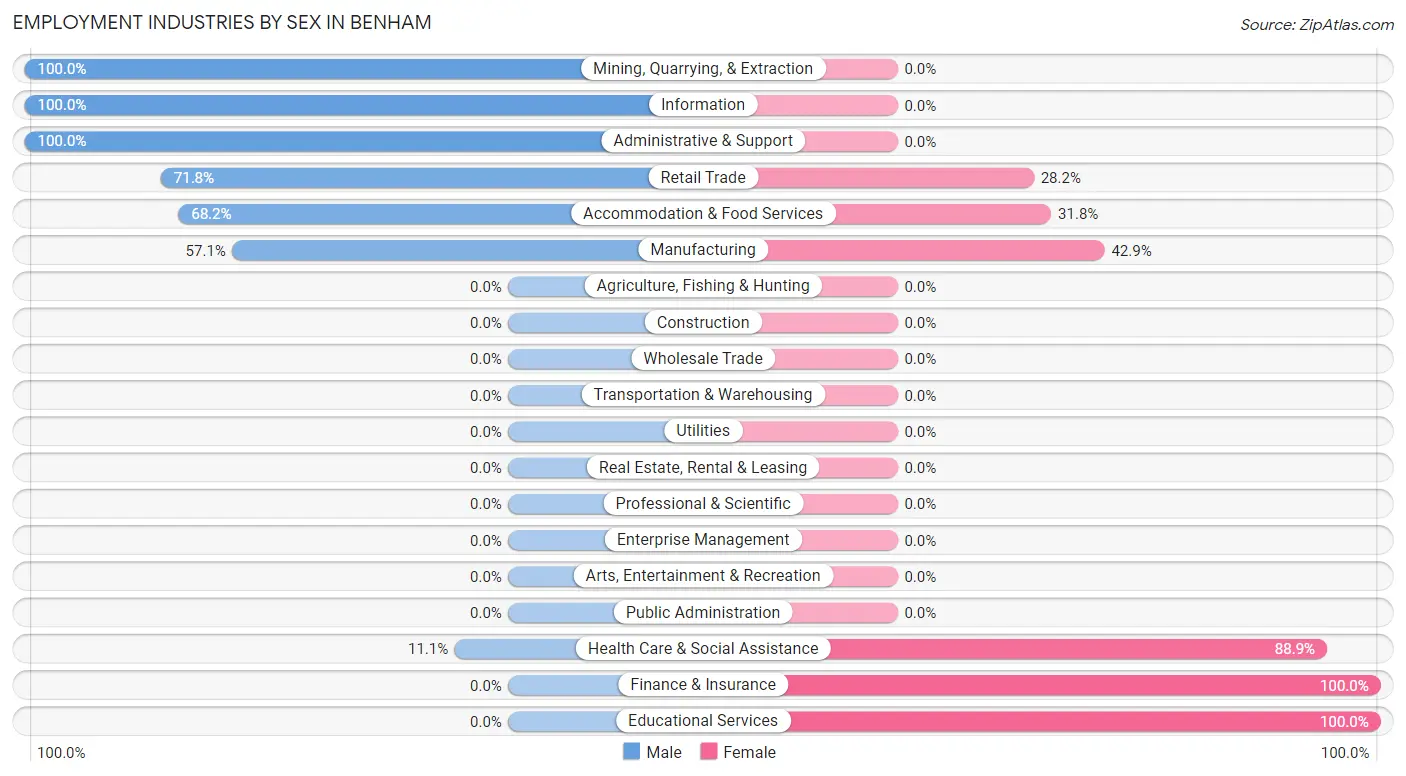
Employment Industries by Sex in Benham
The Benham industries that see more men than women are Mining, Quarrying, & Extraction (100.0%), Information (100.0%), and Administrative & Support (100.0%), whereas the industries that tend to have a higher number of women are Finance & Insurance (100.0%), Educational Services (100.0%), and Health Care & Social Assistance (88.9%).
| Industry | Male | Female |
| Agriculture, Fishing & Hunting | 0 (0.0%) | 0 (0.0%) |
| Mining, Quarrying, & Extraction | 10 (100.0%) | 0 (0.0%) |
| Construction | 0 (0.0%) | 0 (0.0%) |
| Manufacturing | 28 (57.1%) | 21 (42.9%) |
| Wholesale Trade | 0 (0.0%) | 0 (0.0%) |
| Retail Trade | 28 (71.8%) | 11 (28.2%) |
| Transportation & Warehousing | 0 (0.0%) | 0 (0.0%) |
| Utilities | 0 (0.0%) | 0 (0.0%) |
| Information | 7 (100.0%) | 0 (0.0%) |
| Finance & Insurance | 0 (0.0%) | 6 (100.0%) |
| Real Estate, Rental & Leasing | 0 (0.0%) | 0 (0.0%) |
| Professional & Scientific | 0 (0.0%) | 0 (0.0%) |
| Enterprise Management | 0 (0.0%) | 0 (0.0%) |
| Administrative & Support | 17 (100.0%) | 0 (0.0%) |
| Educational Services | 0 (0.0%) | 17 (100.0%) |
| Health Care & Social Assistance | 1 (11.1%) | 8 (88.9%) |
| Arts, Entertainment & Recreation | 0 (0.0%) | 0 (0.0%) |
| Accommodation & Food Services | 15 (68.2%) | 7 (31.8%) |
| Public Administration | 0 (0.0%) | 0 (0.0%) |
| Total | 118 (60.8%) | 76 (39.2%) |
Education in Benham
School Enrollment in Benham
The most common levels of schooling among the 149 students in Benham are middle school (37 | 24.8%), high school (33 | 22.2%), and graduate / professional (23 | 15.4%).
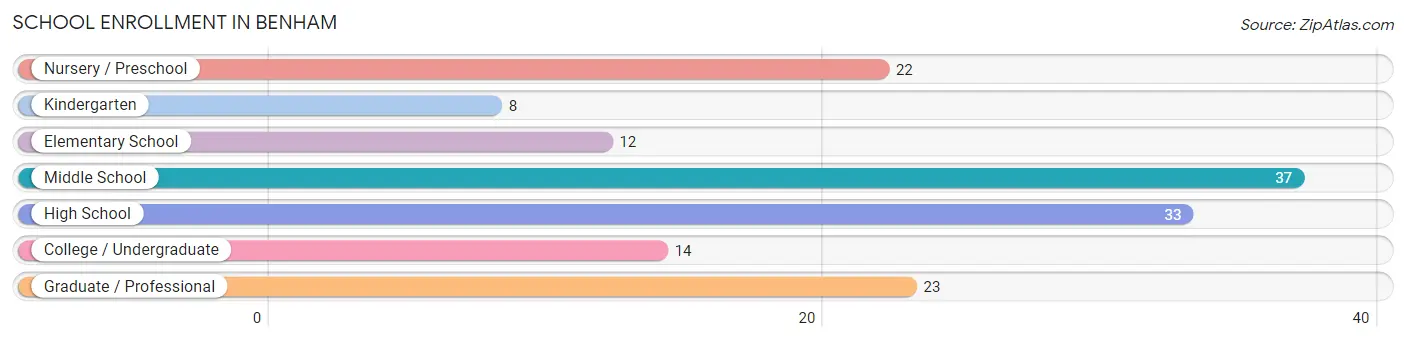
| School Level | # Students | % Students |
| Nursery / Preschool | 22 | 14.8% |
| Kindergarten | 8 | 5.4% |
| Elementary School | 12 | 8.1% |
| Middle School | 37 | 24.8% |
| High School | 33 | 22.2% |
| College / Undergraduate | 14 | 9.4% |
| Graduate / Professional | 23 | 15.4% |
| Total | 149 | 100.0% |
School Enrollment by Age by Funding Source in Benham
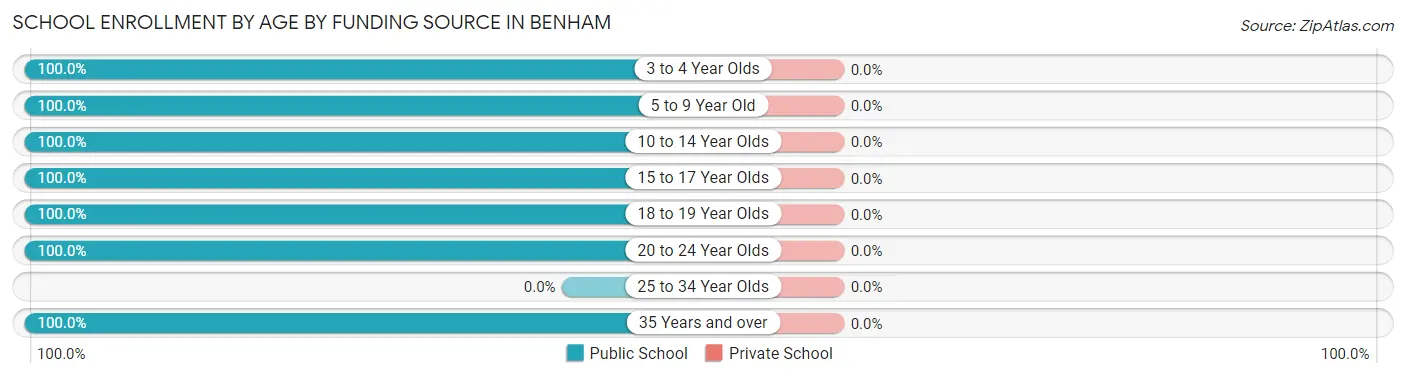
| Age Bracket | Public School | Private School |
| 3 to 4 Year Olds | 22 (100.0%) | 0 (0.0%) |
| 5 to 9 Year Old | 20 (100.0%) | 0 (0.0%) |
| 10 to 14 Year Olds | 37 (100.0%) | 0 (0.0%) |
| 15 to 17 Year Olds | 16 (100.0%) | 0 (0.0%) |
| 18 to 19 Year Olds | 23 (100.0%) | 0 (0.0%) |
| 20 to 24 Year Olds | 6 (100.0%) | 0 (0.0%) |
| 25 to 34 Year Olds | 0 (0.0%) | 0 (0.0%) |
| 35 Years and over | 25 (100.0%) | 0 (0.0%) |
| Total | 149 (100.0%) | 0 (0.0%) |
Educational Attainment by Field of Study in Benham
Computers & mathematics (19 | 23.7%), science & technology (14 | 17.5%), education (14 | 17.5%), visual & performing arts (9 | 11.3%), and bio, nature & agricultural (8 | 10.0%) are the most common fields of study among 80 individuals in Benham who have obtained a bachelor's degree or higher.
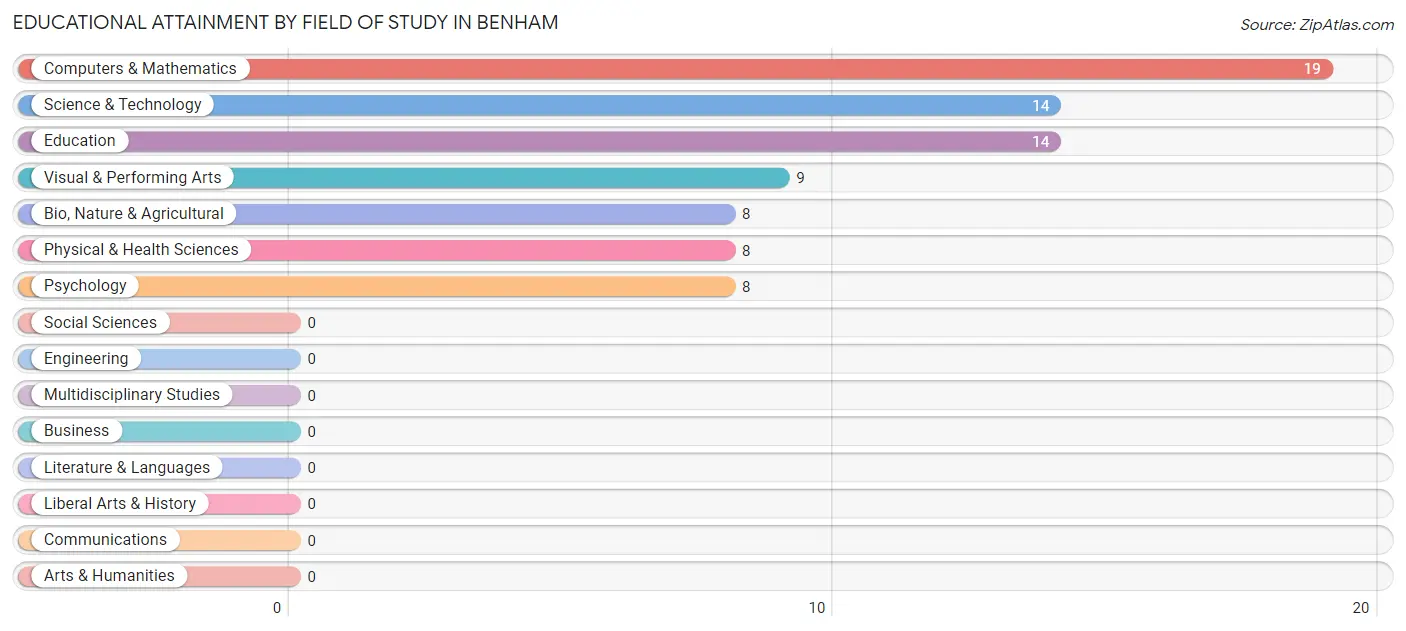
| Field of Study | # Graduates | % Graduates |
| Computers & Mathematics | 19 | 23.7% |
| Bio, Nature & Agricultural | 8 | 10.0% |
| Physical & Health Sciences | 8 | 10.0% |
| Psychology | 8 | 10.0% |
| Social Sciences | 0 | 0.0% |
| Engineering | 0 | 0.0% |
| Multidisciplinary Studies | 0 | 0.0% |
| Science & Technology | 14 | 17.5% |
| Business | 0 | 0.0% |
| Education | 14 | 17.5% |
| Literature & Languages | 0 | 0.0% |
| Liberal Arts & History | 0 | 0.0% |
| Visual & Performing Arts | 9 | 11.3% |
| Communications | 0 | 0.0% |
| Arts & Humanities | 0 | 0.0% |
| Total | 80 | 100.0% |
Transportation & Commute in Benham
Vehicle Availability by Sex in Benham
The most prevalent vehicle ownership categories in Benham are males with 2 vehicles (39, accounting for 33.6%) and females with 2 vehicles (22, making up 51.3%).
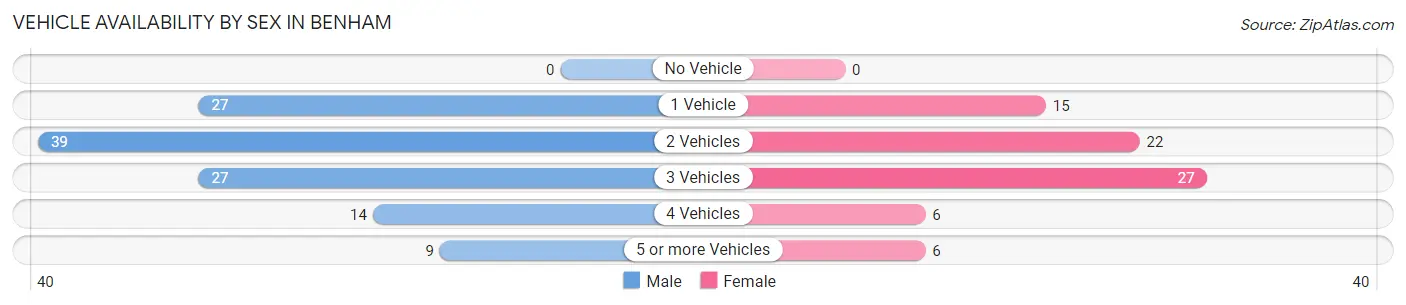
| Vehicles Available | Male | Female |
| No Vehicle | 0 (0.0%) | 0 (0.0%) |
| 1 Vehicle | 27 (23.3%) | 15 (19.7%) |
| 2 Vehicles | 39 (33.6%) | 22 (28.9%) |
| 3 Vehicles | 27 (23.3%) | 27 (35.5%) |
| 4 Vehicles | 14 (12.1%) | 6 (7.9%) |
| 5 or more Vehicles | 9 (7.8%) | 6 (7.9%) |
| Total | 116 (100.0%) | 76 (100.0%) |
Commute Time in Benham
The most frequently occuring commute durations in Benham are 10 to 14 minutes (62 commuters, 35.6%), 5 to 9 minutes (45 commuters, 25.9%), and less than 5 minutes (36 commuters, 20.7%).
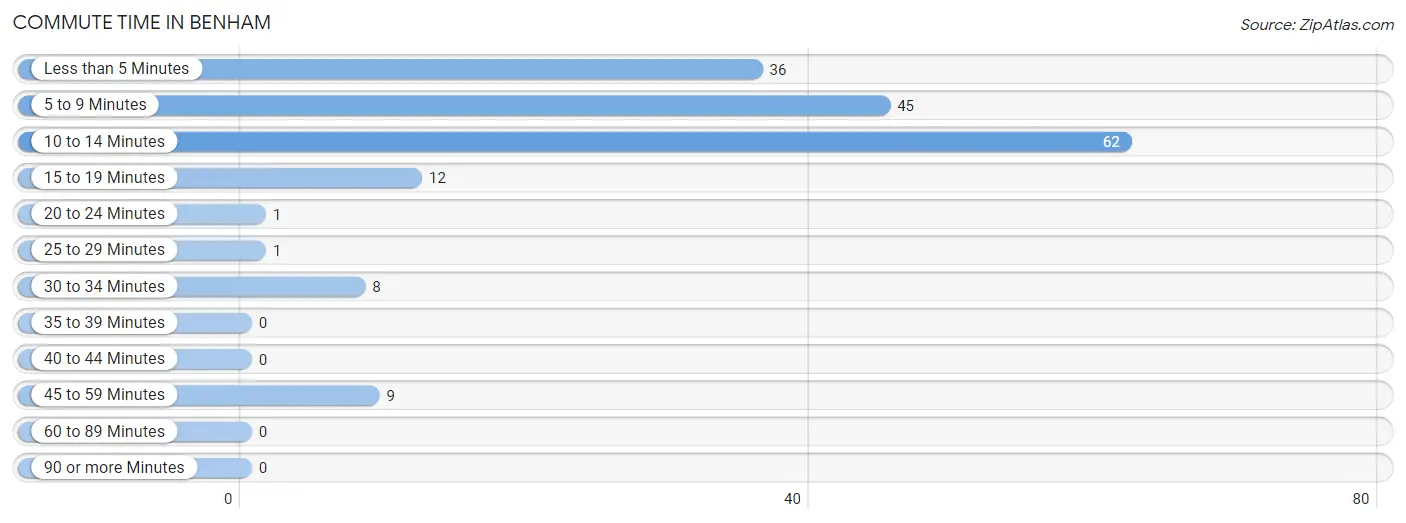
| Commute Time | # Commuters | % Commuters |
| Less than 5 Minutes | 36 | 20.7% |
| 5 to 9 Minutes | 45 | 25.9% |
| 10 to 14 Minutes | 62 | 35.6% |
| 15 to 19 Minutes | 12 | 6.9% |
| 20 to 24 Minutes | 1 | 0.6% |
| 25 to 29 Minutes | 1 | 0.6% |
| 30 to 34 Minutes | 8 | 4.6% |
| 35 to 39 Minutes | 0 | 0.0% |
| 40 to 44 Minutes | 0 | 0.0% |
| 45 to 59 Minutes | 9 | 5.2% |
| 60 to 89 Minutes | 0 | 0.0% |
| 90 or more Minutes | 0 | 0.0% |
Commute Time by Sex in Benham
The most common commute times in Benham are 10 to 14 minutes (39 commuters, 39.8%) for males and 5 to 9 minutes (27 commuters, 35.5%) for females.
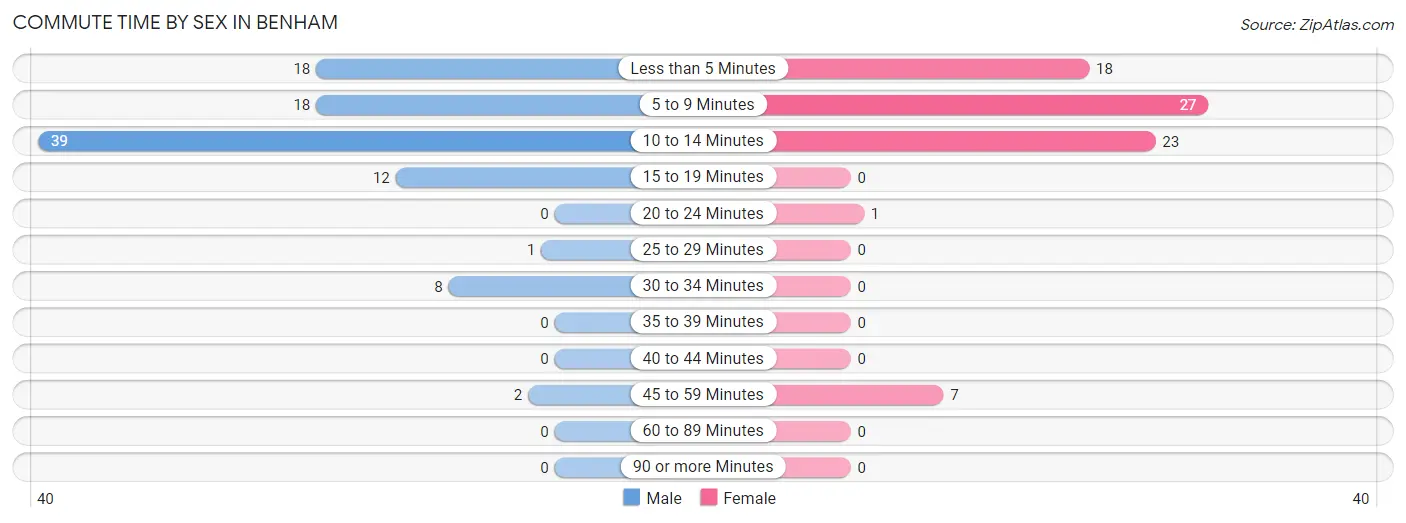
| Commute Time | Male | Female |
| Less than 5 Minutes | 18 (18.4%) | 18 (23.7%) |
| 5 to 9 Minutes | 18 (18.4%) | 27 (35.5%) |
| 10 to 14 Minutes | 39 (39.8%) | 23 (30.3%) |
| 15 to 19 Minutes | 12 (12.2%) | 0 (0.0%) |
| 20 to 24 Minutes | 0 (0.0%) | 1 (1.3%) |
| 25 to 29 Minutes | 1 (1.0%) | 0 (0.0%) |
| 30 to 34 Minutes | 8 (8.2%) | 0 (0.0%) |
| 35 to 39 Minutes | 0 (0.0%) | 0 (0.0%) |
| 40 to 44 Minutes | 0 (0.0%) | 0 (0.0%) |
| 45 to 59 Minutes | 2 (2.0%) | 7 (9.2%) |
| 60 to 89 Minutes | 0 (0.0%) | 0 (0.0%) |
| 90 or more Minutes | 0 (0.0%) | 0 (0.0%) |
Time of Departure to Work by Sex in Benham
The most frequent times of departure to work in Benham are 6:30 AM to 6:59 AM (39, 39.8%) for males and 8:00 AM to 8:29 AM (25, 32.9%) for females.
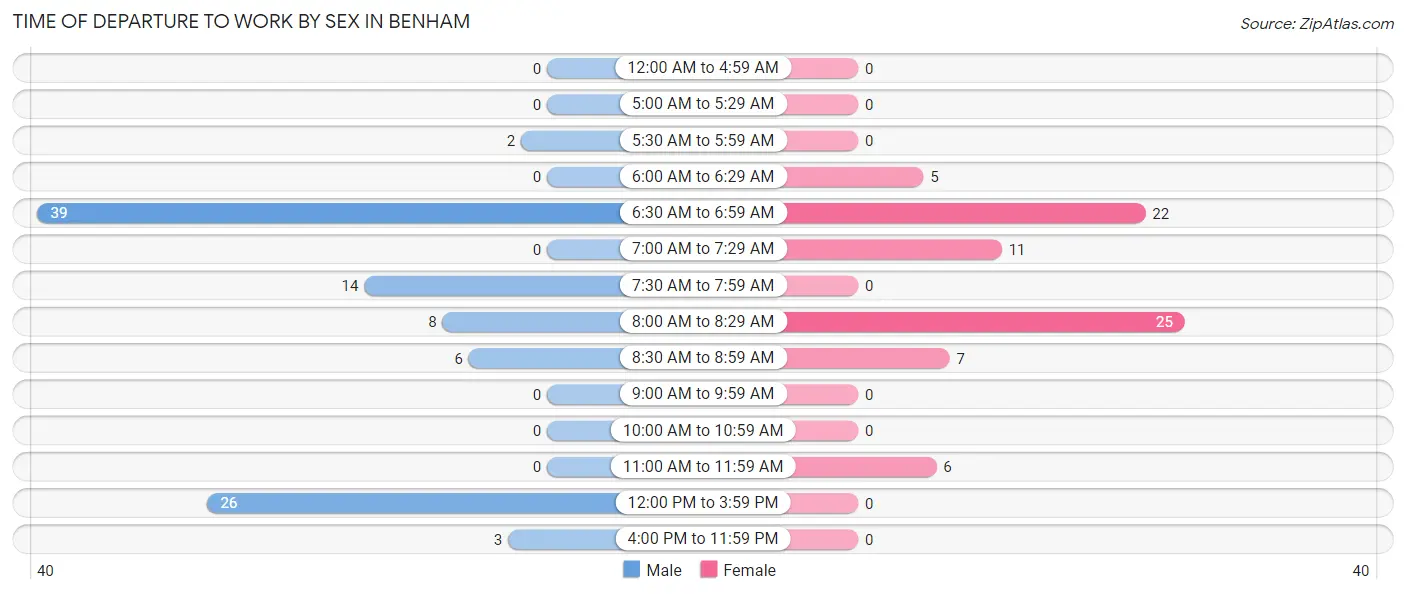
| Time of Departure | Male | Female |
| 12:00 AM to 4:59 AM | 0 (0.0%) | 0 (0.0%) |
| 5:00 AM to 5:29 AM | 0 (0.0%) | 0 (0.0%) |
| 5:30 AM to 5:59 AM | 2 (2.0%) | 0 (0.0%) |
| 6:00 AM to 6:29 AM | 0 (0.0%) | 5 (6.6%) |
| 6:30 AM to 6:59 AM | 39 (39.8%) | 22 (28.9%) |
| 7:00 AM to 7:29 AM | 0 (0.0%) | 11 (14.5%) |
| 7:30 AM to 7:59 AM | 14 (14.3%) | 0 (0.0%) |
| 8:00 AM to 8:29 AM | 8 (8.2%) | 25 (32.9%) |
| 8:30 AM to 8:59 AM | 6 (6.1%) | 7 (9.2%) |
| 9:00 AM to 9:59 AM | 0 (0.0%) | 0 (0.0%) |
| 10:00 AM to 10:59 AM | 0 (0.0%) | 0 (0.0%) |
| 11:00 AM to 11:59 AM | 0 (0.0%) | 6 (7.9%) |
| 12:00 PM to 3:59 PM | 26 (26.5%) | 0 (0.0%) |
| 4:00 PM to 11:59 PM | 3 (3.1%) | 0 (0.0%) |
| Total | 98 (100.0%) | 76 (100.0%) |
Housing Occupancy in Benham
Occupancy by Ownership in Benham
Of the total 270 dwellings in Benham, owner-occupied units account for 239 (88.5%), while renter-occupied units make up 31 (11.5%).
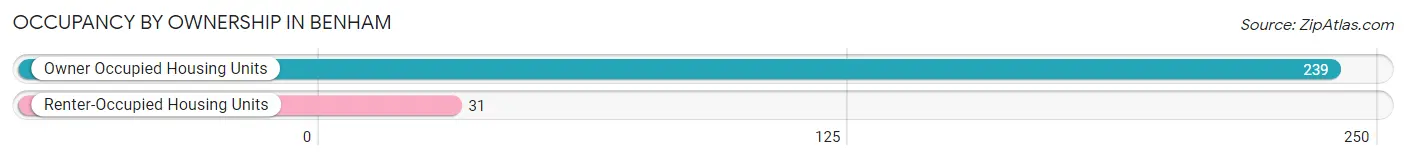
| Occupancy | # Housing Units | % Housing Units |
| Owner Occupied Housing Units | 239 | 88.5% |
| Renter-Occupied Housing Units | 31 | 11.5% |
| Total Occupied Housing Units | 270 | 100.0% |
Occupancy by Household Size in Benham
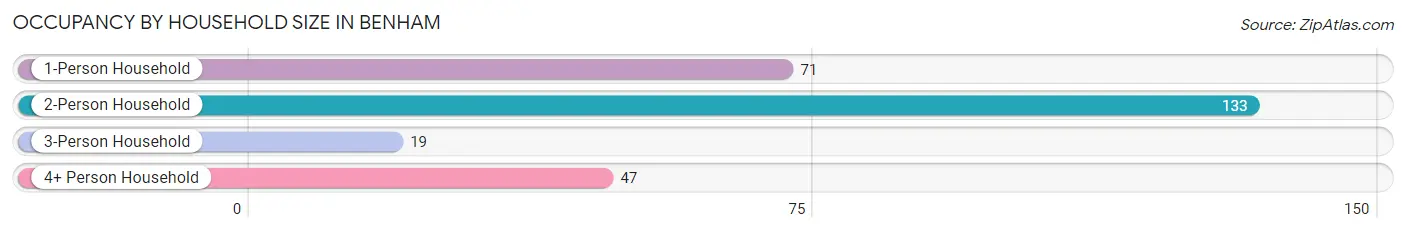
| Household Size | # Housing Units | % Housing Units |
| 1-Person Household | 71 | 26.3% |
| 2-Person Household | 133 | 49.3% |
| 3-Person Household | 19 | 7.0% |
| 4+ Person Household | 47 | 17.4% |
| Total Housing Units | 270 | 100.0% |
Occupancy by Ownership by Household Size in Benham
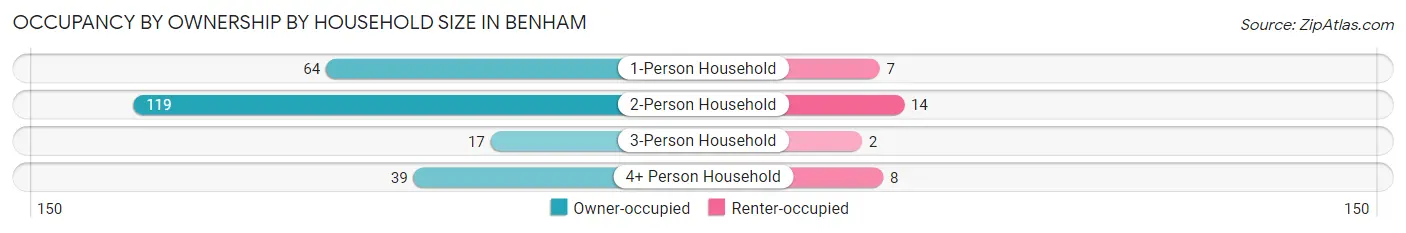
| Household Size | Owner-occupied | Renter-occupied |
| 1-Person Household | 64 (90.1%) | 7 (9.9%) |
| 2-Person Household | 119 (89.5%) | 14 (10.5%) |
| 3-Person Household | 17 (89.5%) | 2 (10.5%) |
| 4+ Person Household | 39 (83.0%) | 8 (17.0%) |
| Total Housing Units | 239 (88.5%) | 31 (11.5%) |
Occupancy by Educational Attainment in Benham
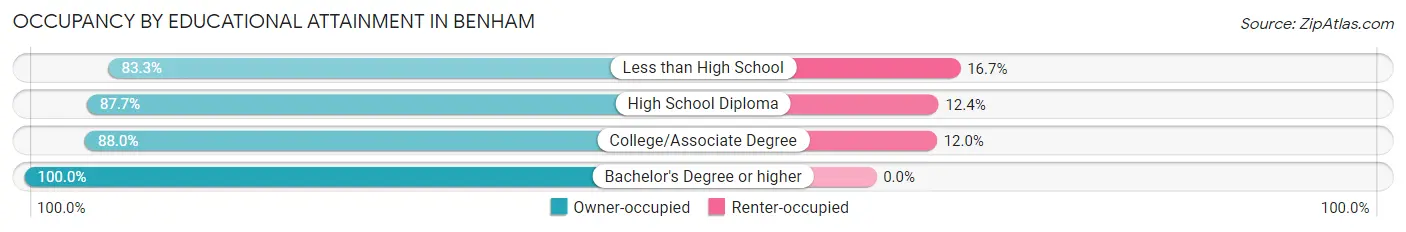
| Household Size | Owner-occupied | Renter-occupied |
| Less than High School | 60 (83.3%) | 12 (16.7%) |
| High School Diploma | 71 (87.6%) | 10 (12.3%) |
| College/Associate Degree | 66 (88.0%) | 9 (12.0%) |
| Bachelor's Degree or higher | 42 (100.0%) | 0 (0.0%) |
Occupancy by Age of Householder in Benham
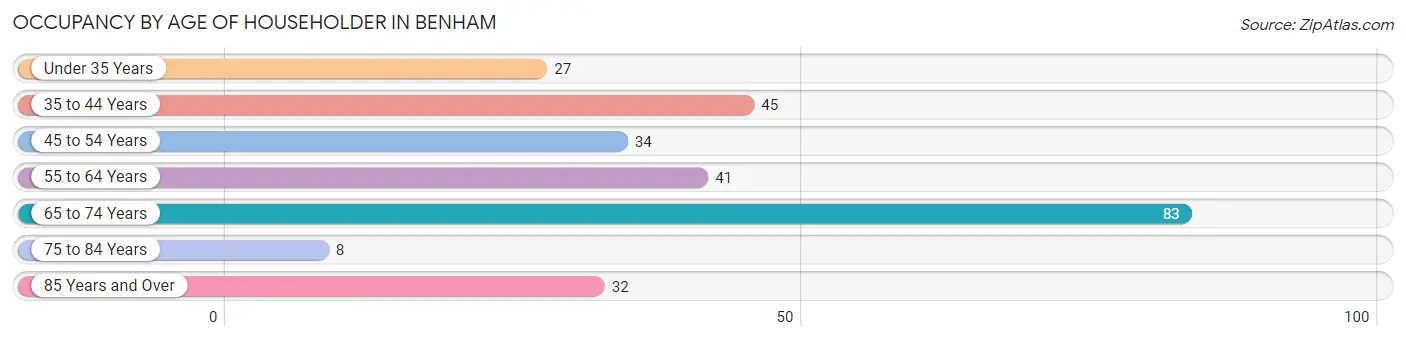
| Age Bracket | # Households | % Households |
| Under 35 Years | 27 | 10.0% |
| 35 to 44 Years | 45 | 16.7% |
| 45 to 54 Years | 34 | 12.6% |
| 55 to 64 Years | 41 | 15.2% |
| 65 to 74 Years | 83 | 30.7% |
| 75 to 84 Years | 8 | 3.0% |
| 85 Years and Over | 32 | 11.8% |
| Total | 270 | 100.0% |
Housing Finances in Benham
Median Income by Occupancy in Benham
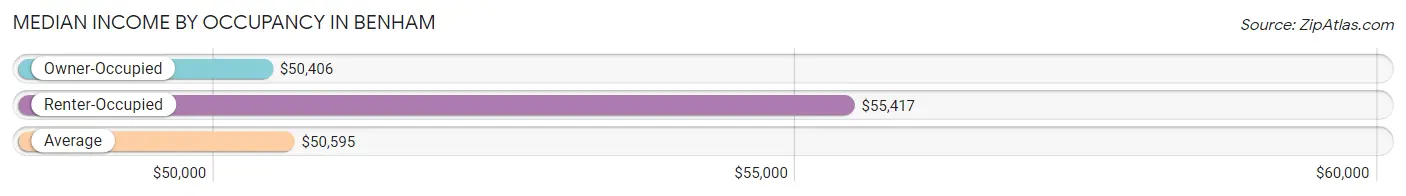
| Occupancy Type | # Households | Median Income |
| Owner-Occupied | 239 (88.5%) | $50,406 |
| Renter-Occupied | 31 (11.5%) | $55,417 |
| Average | 270 (100.0%) | $50,595 |
Occupancy by Householder Income Bracket in Benham
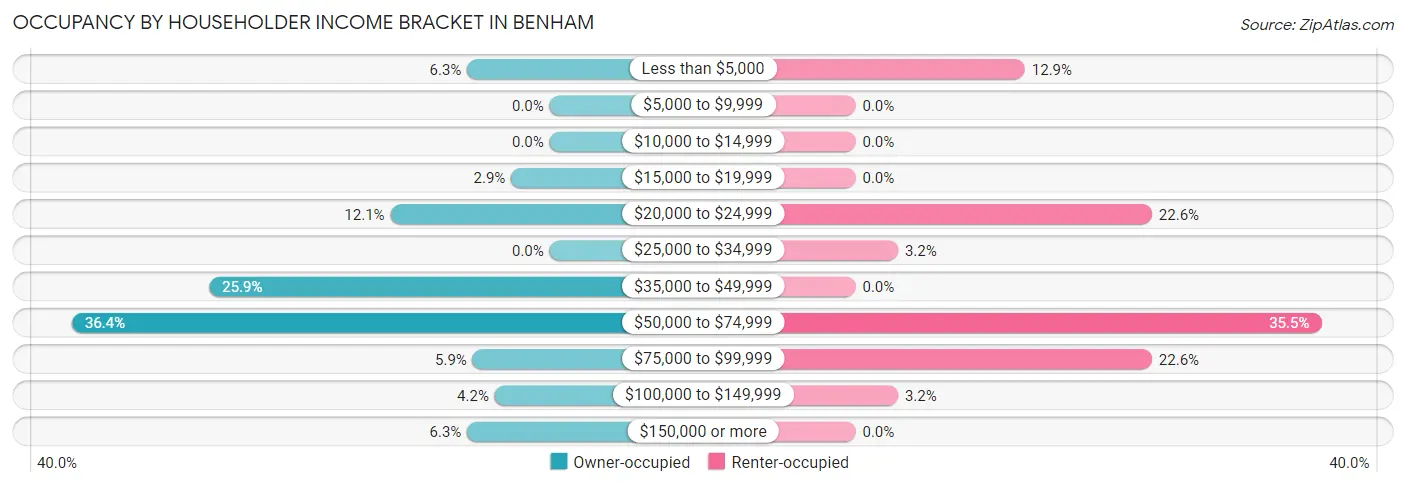
| Income Bracket | Owner-occupied | Renter-occupied |
| Less than $5,000 | 15 (6.3%) | 4 (12.9%) |
| $5,000 to $9,999 | 0 (0.0%) | 0 (0.0%) |
| $10,000 to $14,999 | 0 (0.0%) | 0 (0.0%) |
| $15,000 to $19,999 | 7 (2.9%) | 0 (0.0%) |
| $20,000 to $24,999 | 29 (12.1%) | 7 (22.6%) |
| $25,000 to $34,999 | 0 (0.0%) | 1 (3.2%) |
| $35,000 to $49,999 | 62 (25.9%) | 0 (0.0%) |
| $50,000 to $74,999 | 87 (36.4%) | 11 (35.5%) |
| $75,000 to $99,999 | 14 (5.9%) | 7 (22.6%) |
| $100,000 to $149,999 | 10 (4.2%) | 1 (3.2%) |
| $150,000 or more | 15 (6.3%) | 0 (0.0%) |
| Total | 239 (100.0%) | 31 (100.0%) |
Monthly Housing Cost Tiers in Benham
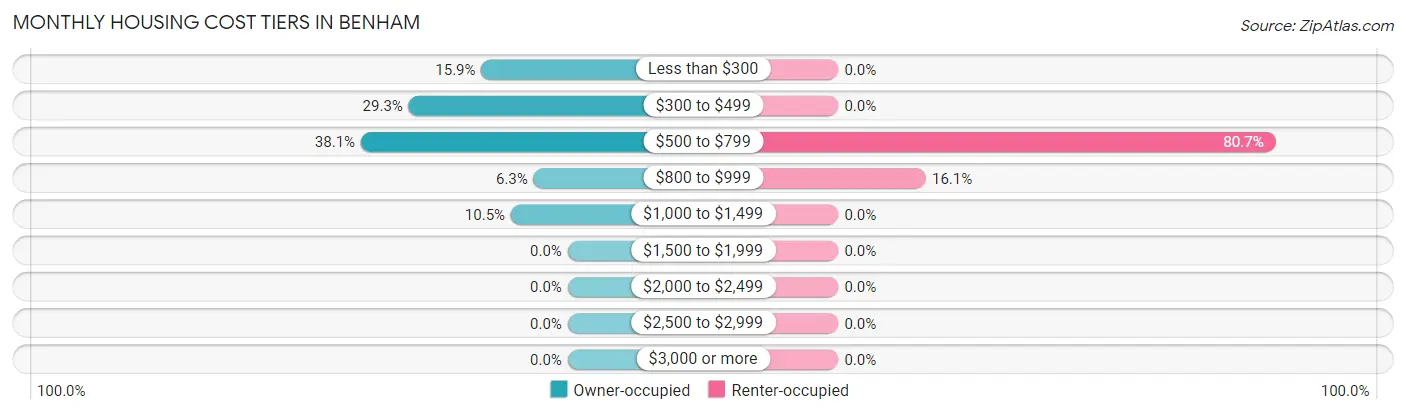
| Monthly Cost | Owner-occupied | Renter-occupied |
| Less than $300 | 38 (15.9%) | 0 (0.0%) |
| $300 to $499 | 70 (29.3%) | 0 (0.0%) |
| $500 to $799 | 91 (38.1%) | 25 (80.6%) |
| $800 to $999 | 15 (6.3%) | 5 (16.1%) |
| $1,000 to $1,499 | 25 (10.5%) | 0 (0.0%) |
| $1,500 to $1,999 | 0 (0.0%) | 0 (0.0%) |
| $2,000 to $2,499 | 0 (0.0%) | 0 (0.0%) |
| $2,500 to $2,999 | 0 (0.0%) | 0 (0.0%) |
| $3,000 or more | 0 (0.0%) | 0 (0.0%) |
| Total | 239 (100.0%) | 31 (100.0%) |
Physical Housing Characteristics in Benham
Housing Structures in Benham
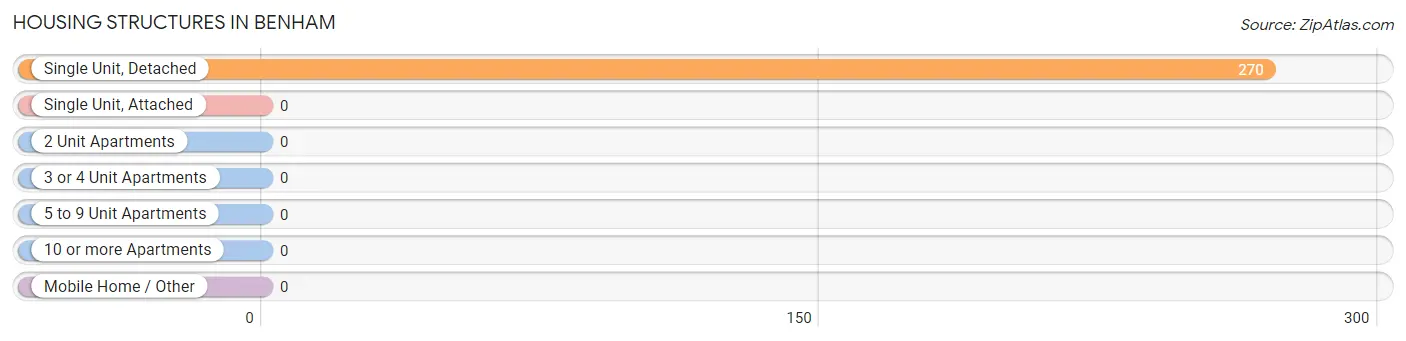
| Structure Type | # Housing Units | % Housing Units |
| Single Unit, Detached | 270 | 100.0% |
| Single Unit, Attached | 0 | 0.0% |
| 2 Unit Apartments | 0 | 0.0% |
| 3 or 4 Unit Apartments | 0 | 0.0% |
| 5 to 9 Unit Apartments | 0 | 0.0% |
| 10 or more Apartments | 0 | 0.0% |
| Mobile Home / Other | 0 | 0.0% |
| Total | 270 | 100.0% |
Housing Structures by Occupancy in Benham
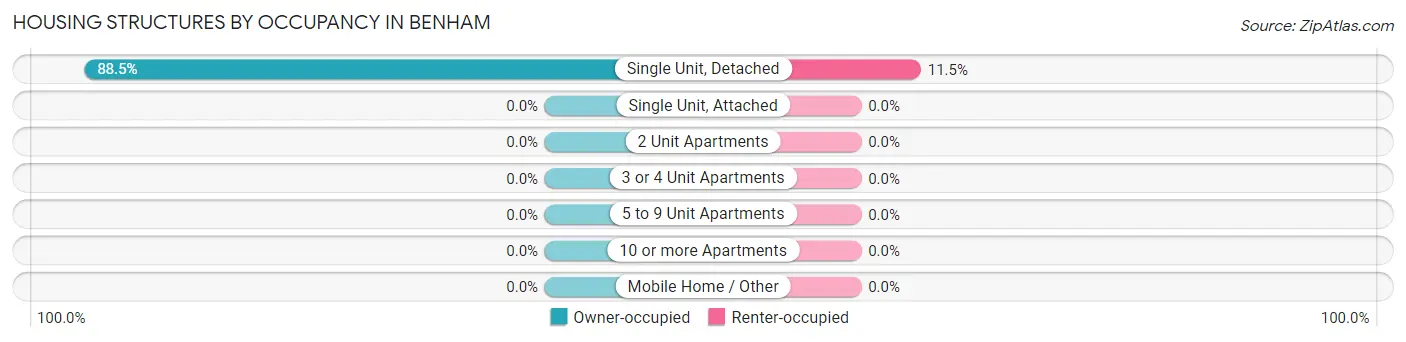
| Structure Type | Owner-occupied | Renter-occupied |
| Single Unit, Detached | 239 (88.5%) | 31 (11.5%) |
| Single Unit, Attached | 0 (0.0%) | 0 (0.0%) |
| 2 Unit Apartments | 0 (0.0%) | 0 (0.0%) |
| 3 or 4 Unit Apartments | 0 (0.0%) | 0 (0.0%) |
| 5 to 9 Unit Apartments | 0 (0.0%) | 0 (0.0%) |
| 10 or more Apartments | 0 (0.0%) | 0 (0.0%) |
| Mobile Home / Other | 0 (0.0%) | 0 (0.0%) |
| Total | 239 (88.5%) | 31 (11.5%) |
Housing Structures by Number of Rooms in Benham
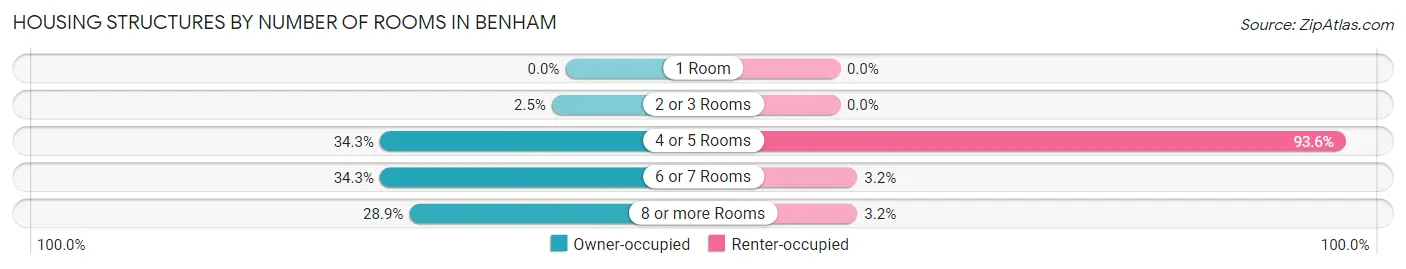
| Number of Rooms | Owner-occupied | Renter-occupied |
| 1 Room | 0 (0.0%) | 0 (0.0%) |
| 2 or 3 Rooms | 6 (2.5%) | 0 (0.0%) |
| 4 or 5 Rooms | 82 (34.3%) | 29 (93.5%) |
| 6 or 7 Rooms | 82 (34.3%) | 1 (3.2%) |
| 8 or more Rooms | 69 (28.9%) | 1 (3.2%) |
| Total | 239 (100.0%) | 31 (100.0%) |
Housing Structure by Heating Type in Benham
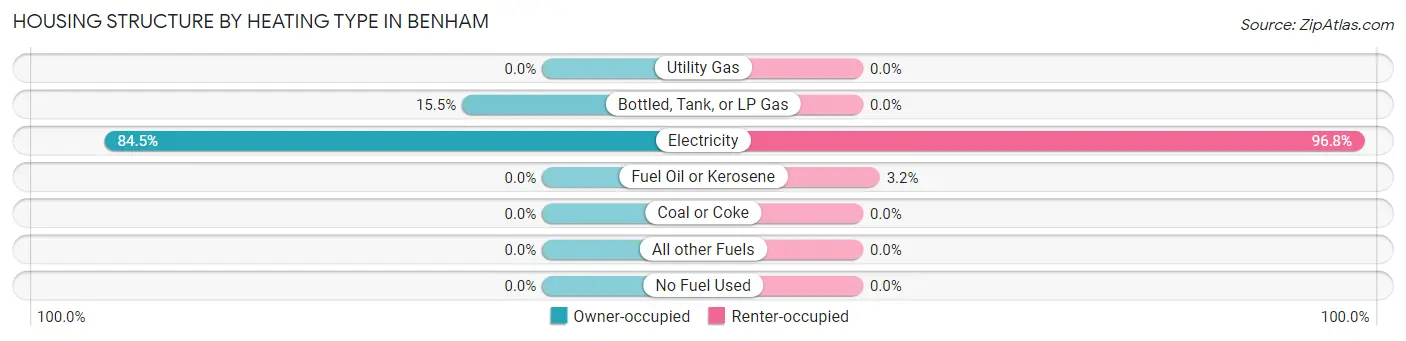
| Heating Type | Owner-occupied | Renter-occupied |
| Utility Gas | 0 (0.0%) | 0 (0.0%) |
| Bottled, Tank, or LP Gas | 37 (15.5%) | 0 (0.0%) |
| Electricity | 202 (84.5%) | 30 (96.8%) |
| Fuel Oil or Kerosene | 0 (0.0%) | 1 (3.2%) |
| Coal or Coke | 0 (0.0%) | 0 (0.0%) |
| All other Fuels | 0 (0.0%) | 0 (0.0%) |
| No Fuel Used | 0 (0.0%) | 0 (0.0%) |
| Total | 239 (100.0%) | 31 (100.0%) |
Household Vehicle Usage in Benham
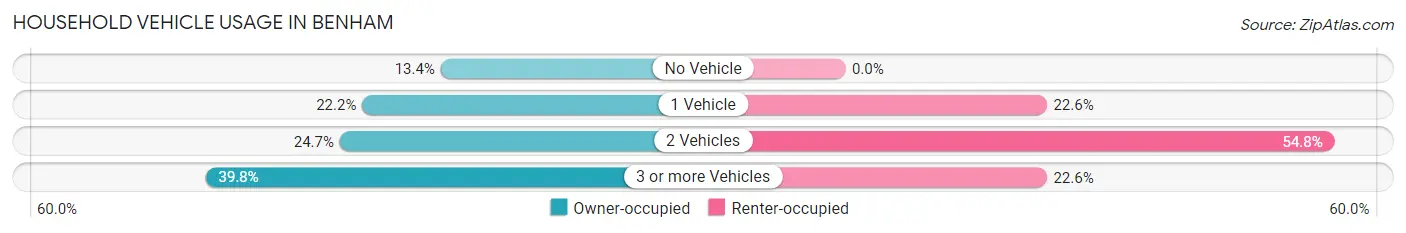
| Vehicles per Household | Owner-occupied | Renter-occupied |
| No Vehicle | 32 (13.4%) | 0 (0.0%) |
| 1 Vehicle | 53 (22.2%) | 7 (22.6%) |
| 2 Vehicles | 59 (24.7%) | 17 (54.8%) |
| 3 or more Vehicles | 95 (39.8%) | 7 (22.6%) |
| Total | 239 (100.0%) | 31 (100.0%) |
Real Estate & Mortgages in Benham
Real Estate and Mortgage Overview in Benham
| Characteristic | Without Mortgage | With Mortgage |
| Housing Units | 153 | 86 |
| Median Property Value | $46,900 | $84,300 |
| Median Household Income | $46,042 | $0 |
| Monthly Housing Costs | $377 | $0 |
| Real Estate Taxes | $492 | $32 |
Property Value by Mortgage Status in Benham
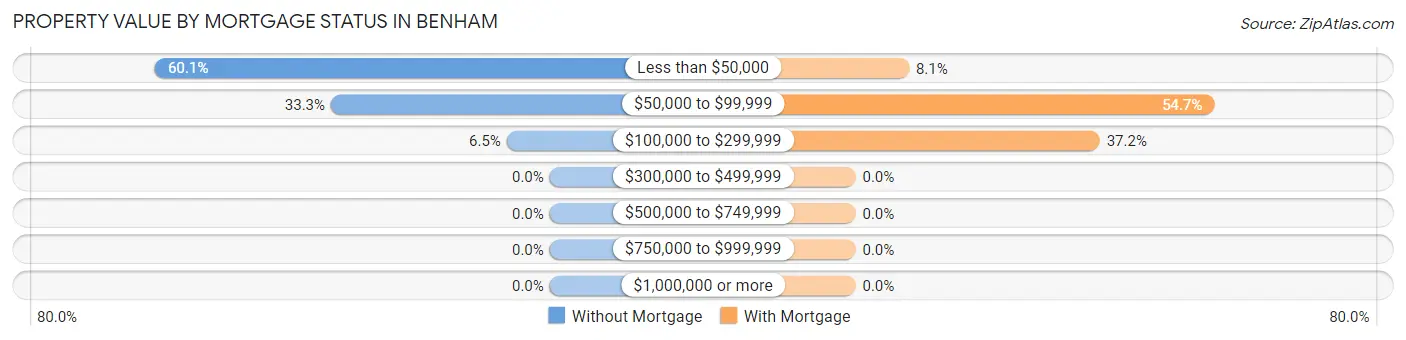
| Property Value | Without Mortgage | With Mortgage |
| Less than $50,000 | 92 (60.1%) | 7 (8.1%) |
| $50,000 to $99,999 | 51 (33.3%) | 47 (54.6%) |
| $100,000 to $299,999 | 10 (6.5%) | 32 (37.2%) |
| $300,000 to $499,999 | 0 (0.0%) | 0 (0.0%) |
| $500,000 to $749,999 | 0 (0.0%) | 0 (0.0%) |
| $750,000 to $999,999 | 0 (0.0%) | 0 (0.0%) |
| $1,000,000 or more | 0 (0.0%) | 0 (0.0%) |
| Total | 153 (100.0%) | 86 (100.0%) |
Household Income by Mortgage Status in Benham
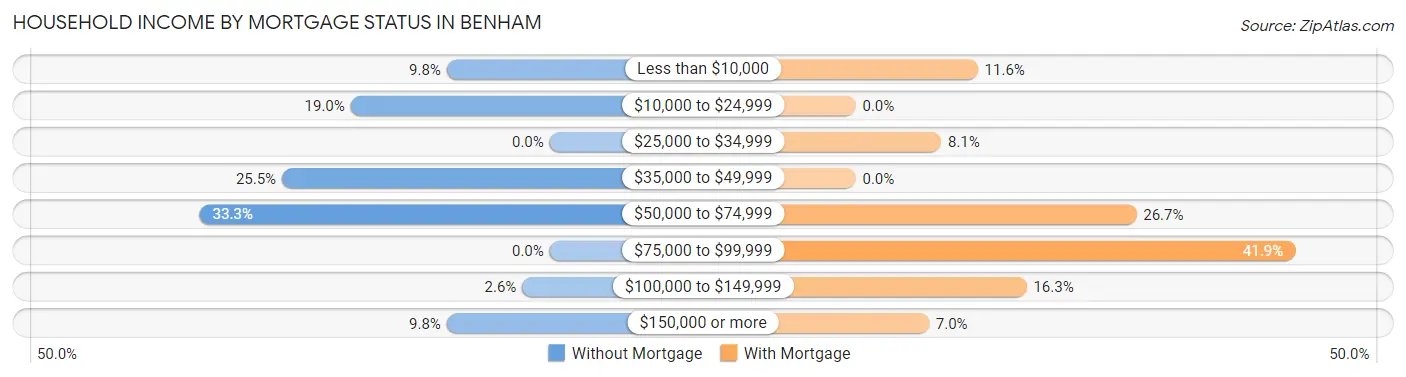
| Household Income | Without Mortgage | With Mortgage |
| Less than $10,000 | 15 (9.8%) | 10 (11.6%) |
| $10,000 to $24,999 | 29 (19.0%) | 0 (0.0%) |
| $25,000 to $34,999 | 0 (0.0%) | 7 (8.1%) |
| $35,000 to $49,999 | 39 (25.5%) | 0 (0.0%) |
| $50,000 to $74,999 | 51 (33.3%) | 23 (26.7%) |
| $75,000 to $99,999 | 0 (0.0%) | 36 (41.9%) |
| $100,000 to $149,999 | 4 (2.6%) | 14 (16.3%) |
| $150,000 or more | 15 (9.8%) | 6 (7.0%) |
| Total | 153 (100.0%) | 86 (100.0%) |
Property Value to Household Income Ratio in Benham
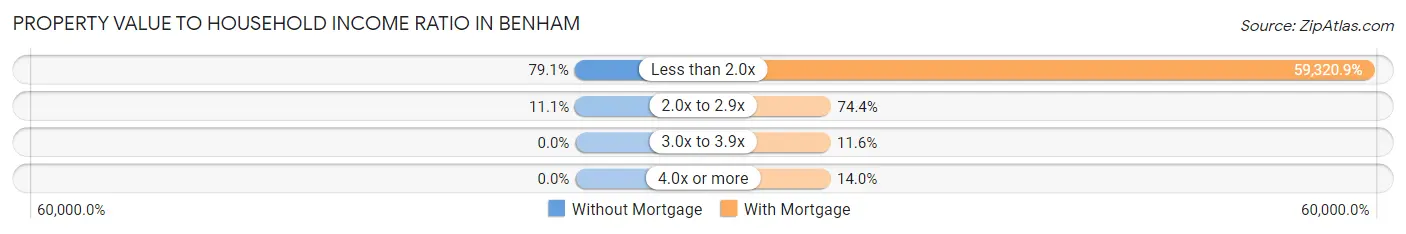
| Value-to-Income Ratio | Without Mortgage | With Mortgage |
| Less than 2.0x | 121 (79.1%) | 51,016 (59,320.9%) |
| 2.0x to 2.9x | 17 (11.1%) | 64 (74.4%) |
| 3.0x to 3.9x | 0 (0.0%) | 10 (11.6%) |
| 4.0x or more | 0 (0.0%) | 12 (14.0%) |
| Total | 153 (100.0%) | 86 (100.0%) |
Real Estate Taxes by Mortgage Status in Benham
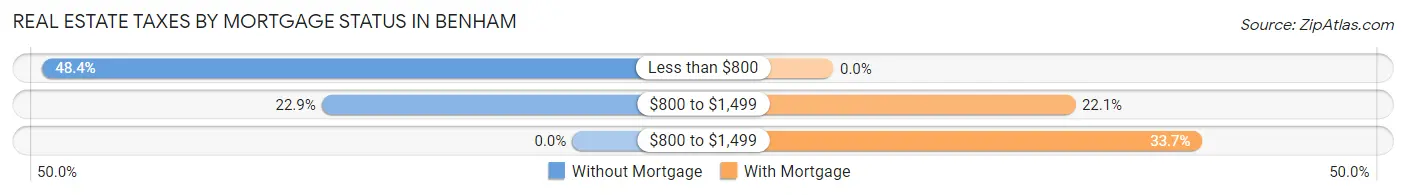
| Property Taxes | Without Mortgage | With Mortgage |
| Less than $800 | 74 (48.4%) | 0 (0.0%) |
| $800 to $1,499 | 35 (22.9%) | 19 (22.1%) |
| $800 to $1,499 | 0 (0.0%) | 29 (33.7%) |
| Total | 153 (100.0%) | 86 (100.0%) |
Health & Disability in Benham
Health Insurance Coverage by Age in Benham
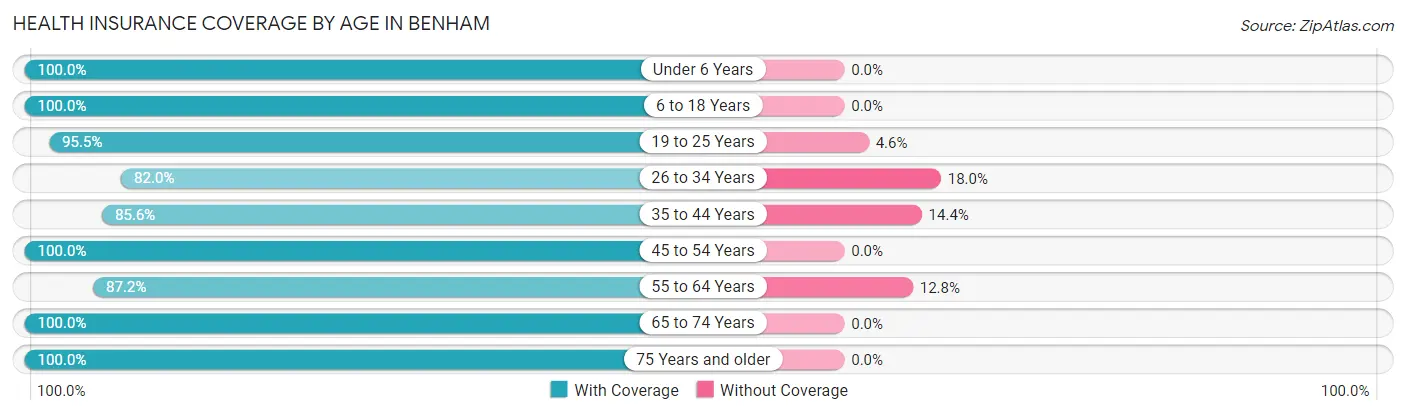
| Age Bracket | With Coverage | Without Coverage |
| Under 6 Years | 35 (100.0%) | 0 (0.0%) |
| 6 to 18 Years | 90 (100.0%) | 0 (0.0%) |
| 19 to 25 Years | 42 (95.5%) | 2 (4.5%) |
| 26 to 34 Years | 41 (82.0%) | 9 (18.0%) |
| 35 to 44 Years | 83 (85.6%) | 14 (14.4%) |
| 45 to 54 Years | 65 (100.0%) | 0 (0.0%) |
| 55 to 64 Years | 41 (87.2%) | 6 (12.8%) |
| 65 to 74 Years | 133 (100.0%) | 0 (0.0%) |
| 75 Years and older | 49 (100.0%) | 0 (0.0%) |
| Total | 579 (94.9%) | 31 (5.1%) |
Health Insurance Coverage by Citizenship Status in Benham
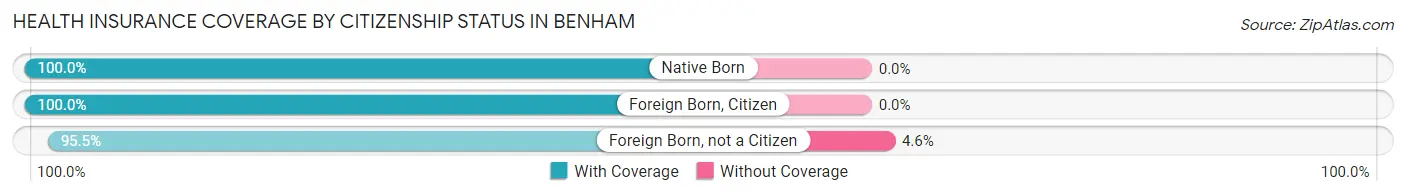
| Citizenship Status | With Coverage | Without Coverage |
| Native Born | 35 (100.0%) | 0 (0.0%) |
| Foreign Born, Citizen | 90 (100.0%) | 0 (0.0%) |
| Foreign Born, not a Citizen | 42 (95.5%) | 2 (4.5%) |
Health Insurance Coverage by Household Income in Benham
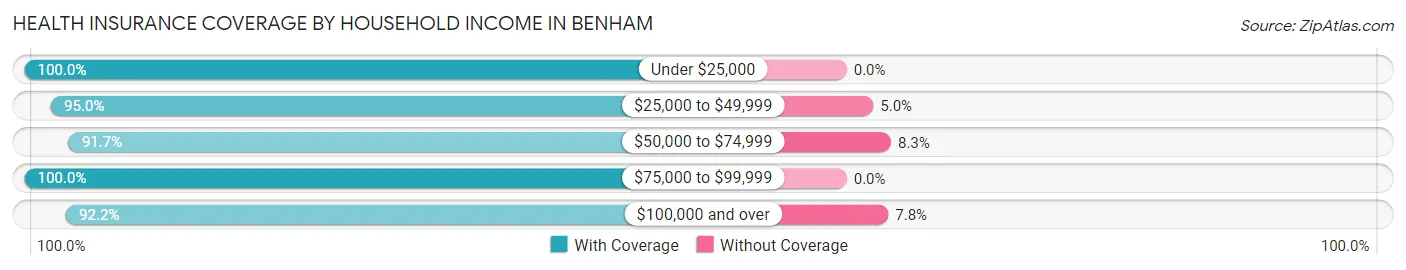
| Household Income | With Coverage | Without Coverage |
| Under $25,000 | 68 (100.0%) | 0 (0.0%) |
| $25,000 to $49,999 | 172 (95.0%) | 9 (5.0%) |
| $50,000 to $74,999 | 177 (91.7%) | 16 (8.3%) |
| $75,000 to $99,999 | 87 (100.0%) | 0 (0.0%) |
| $100,000 and over | 71 (92.2%) | 6 (7.8%) |
Public vs Private Health Insurance Coverage by Age in Benham
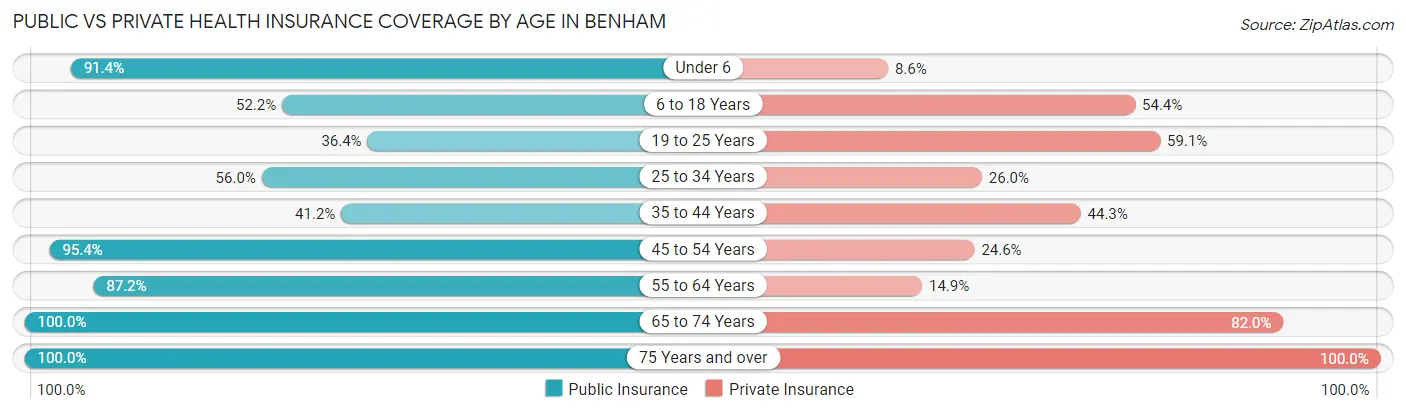
| Age Bracket | Public Insurance | Private Insurance |
| Under 6 | 32 (91.4%) | 3 (8.6%) |
| 6 to 18 Years | 47 (52.2%) | 49 (54.4%) |
| 19 to 25 Years | 16 (36.4%) | 26 (59.1%) |
| 25 to 34 Years | 28 (56.0%) | 13 (26.0%) |
| 35 to 44 Years | 40 (41.2%) | 43 (44.3%) |
| 45 to 54 Years | 62 (95.4%) | 16 (24.6%) |
| 55 to 64 Years | 41 (87.2%) | 7 (14.9%) |
| 65 to 74 Years | 133 (100.0%) | 109 (82.0%) |
| 75 Years and over | 49 (100.0%) | 49 (100.0%) |
| Total | 448 (73.4%) | 315 (51.6%) |
Disability Status by Sex by Age in Benham
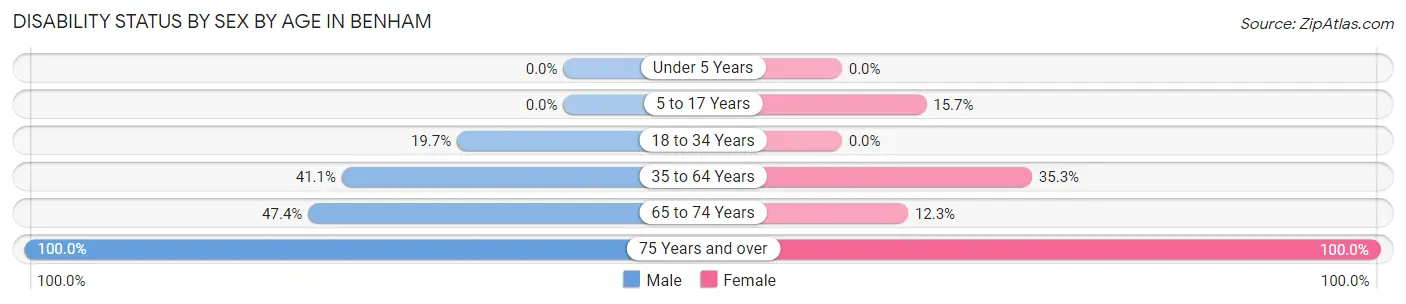
| Age Bracket | Male | Female |
| Under 5 Years | 0 (0.0%) | 0 (0.0%) |
| 5 to 17 Years | 0 (0.0%) | 8 (15.7%) |
| 18 to 34 Years | 15 (19.7%) | 0 (0.0%) |
| 35 to 64 Years | 51 (41.1%) | 30 (35.3%) |
| 65 to 74 Years | 36 (47.4%) | 7 (12.3%) |
| 75 Years and over | 8 (100.0%) | 41 (100.0%) |
Disability Class by Sex by Age in Benham
Disability Class: Hearing Difficulty
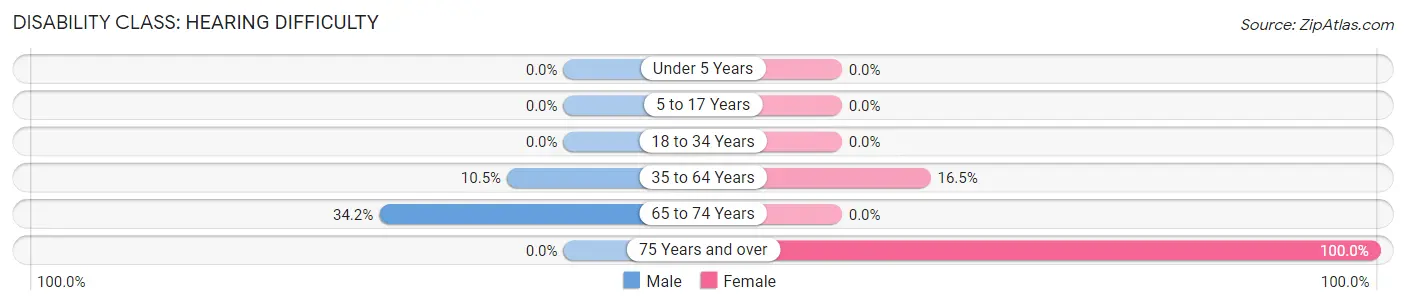
| Age Bracket | Male | Female |
| Under 5 Years | 0 (0.0%) | 0 (0.0%) |
| 5 to 17 Years | 0 (0.0%) | 0 (0.0%) |
| 18 to 34 Years | 0 (0.0%) | 0 (0.0%) |
| 35 to 64 Years | 13 (10.5%) | 14 (16.5%) |
| 65 to 74 Years | 26 (34.2%) | 0 (0.0%) |
| 75 Years and over | 0 (0.0%) | 41 (100.0%) |
Disability Class: Vision Difficulty
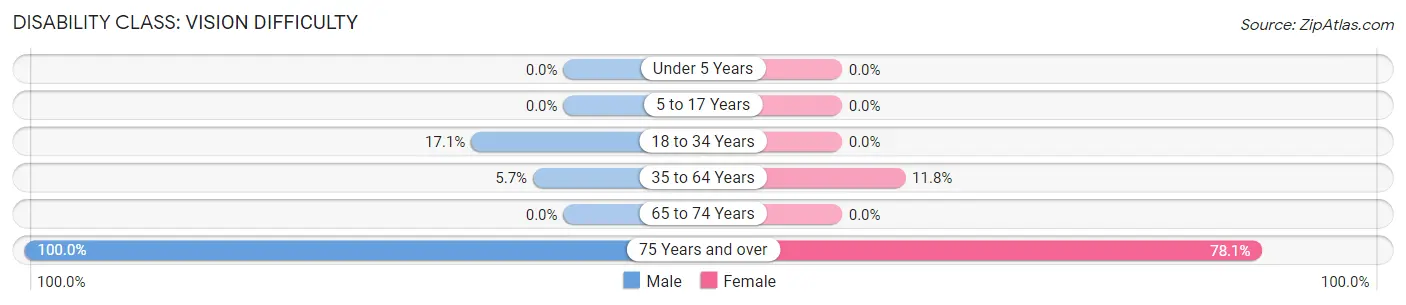
| Age Bracket | Male | Female |
| Under 5 Years | 0 (0.0%) | 0 (0.0%) |
| 5 to 17 Years | 0 (0.0%) | 0 (0.0%) |
| 18 to 34 Years | 13 (17.1%) | 0 (0.0%) |
| 35 to 64 Years | 7 (5.7%) | 10 (11.8%) |
| 65 to 74 Years | 0 (0.0%) | 0 (0.0%) |
| 75 Years and over | 8 (100.0%) | 32 (78.0%) |
Disability Class: Cognitive Difficulty
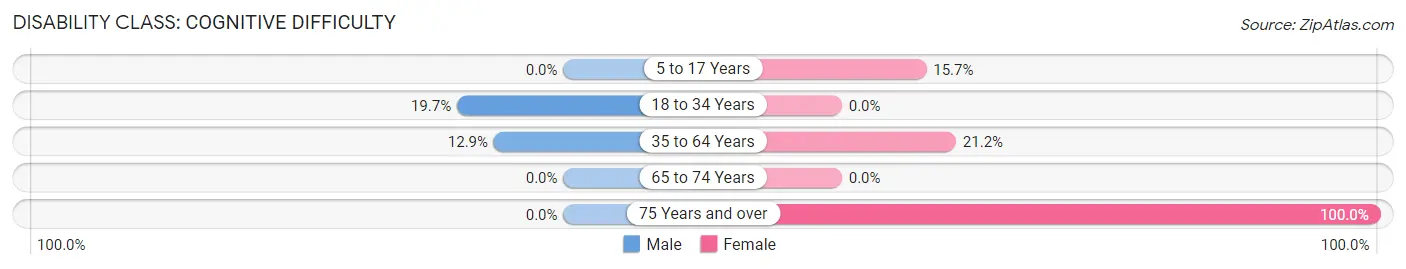
| Age Bracket | Male | Female |
| 5 to 17 Years | 0 (0.0%) | 8 (15.7%) |
| 18 to 34 Years | 15 (19.7%) | 0 (0.0%) |
| 35 to 64 Years | 16 (12.9%) | 18 (21.2%) |
| 65 to 74 Years | 0 (0.0%) | 0 (0.0%) |
| 75 Years and over | 0 (0.0%) | 41 (100.0%) |
Disability Class: Ambulatory Difficulty
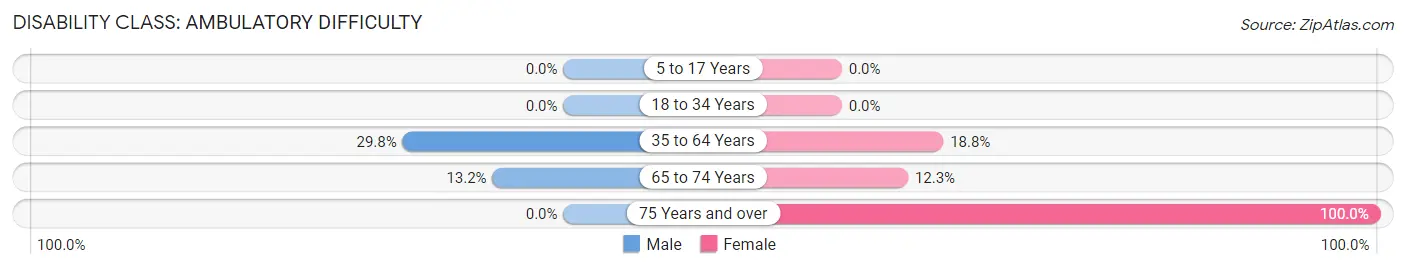
| Age Bracket | Male | Female |
| 5 to 17 Years | 0 (0.0%) | 0 (0.0%) |
| 18 to 34 Years | 0 (0.0%) | 0 (0.0%) |
| 35 to 64 Years | 37 (29.8%) | 16 (18.8%) |
| 65 to 74 Years | 10 (13.2%) | 7 (12.3%) |
| 75 Years and over | 0 (0.0%) | 41 (100.0%) |
Disability Class: Self-Care Difficulty
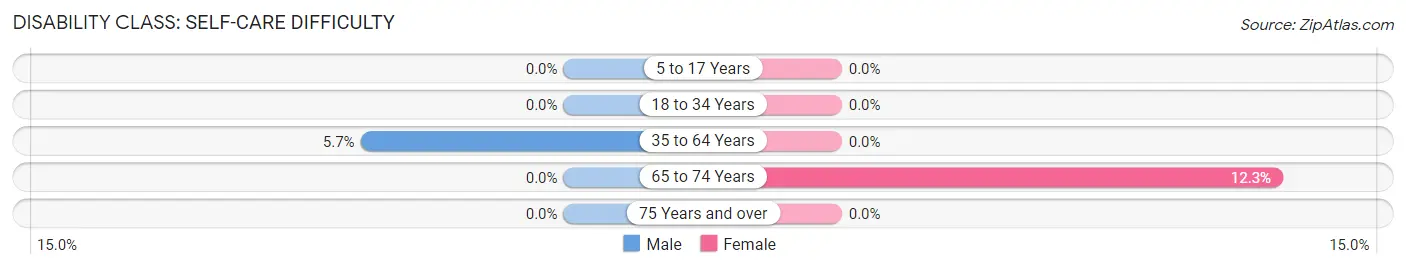
| Age Bracket | Male | Female |
| 5 to 17 Years | 0 (0.0%) | 0 (0.0%) |
| 18 to 34 Years | 0 (0.0%) | 0 (0.0%) |
| 35 to 64 Years | 7 (5.7%) | 0 (0.0%) |
| 65 to 74 Years | 0 (0.0%) | 7 (12.3%) |
| 75 Years and over | 0 (0.0%) | 0 (0.0%) |
Technology Access in Benham
Computing Device Access in Benham
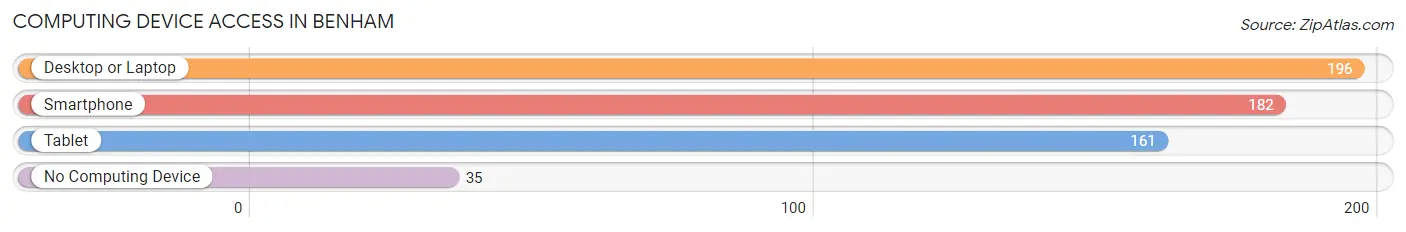
| Device Type | # Households | % Households |
| Desktop or Laptop | 196 | 72.6% |
| Smartphone | 182 | 67.4% |
| Tablet | 161 | 59.6% |
| No Computing Device | 35 | 13.0% |
| Total | 270 | 100.0% |
Internet Access in Benham
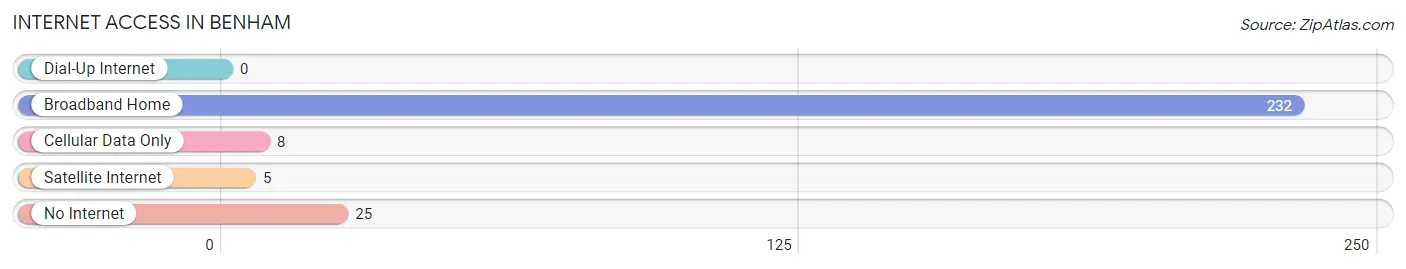
| Internet Type | # Households | % Households |
| Dial-Up Internet | 0 | 0.0% |
| Broadband Home | 232 | 85.9% |
| Cellular Data Only | 8 | 3.0% |
| Satellite Internet | 5 | 1.8% |
| No Internet | 25 | 9.3% |
| Total | 270 | 100.0% |
Benham Summary
Benham is a small city located in Harlan County, Kentucky. It is situated in the Appalachian Mountains and is part of the Cumberland Plateau. The city has a population of approximately 1,000 people and is the county seat of Harlan County.
History
Benham was founded in 1891 by the Louisville and Nashville Railroad. The city was named after Colonel William Benham, a Civil War veteran and former president of the railroad. The city was incorporated in 1894 and was the first city in Harlan County to be incorporated.
The city was originally a coal mining town and was home to several coal mines. The coal industry was the main source of employment for the city until the 1950s when the coal industry began to decline. The city has since diversified its economy and is now home to several small businesses.
Geography
Benham is located in the Appalachian Mountains and is part of the Cumberland Plateau. The city is situated at an elevation of 1,890 feet and is surrounded by mountains and hills. The city is located near the Kentucky-Virginia border and is approximately 30 miles from the city of Harlan.
The city is located in a temperate climate and experiences four distinct seasons. The average temperature in the summer is around 75 degrees Fahrenheit and the average temperature in the winter is around 35 degrees Fahrenheit.
Economy
The economy of Benham is largely based on tourism and small businesses. The city is home to several small businesses, including restaurants, retail stores, and service providers. The city is also home to several tourist attractions, including the Benham Schoolhouse Inn, the Benham Coal Mine Museum, and the Benham Falls.
The city is also home to several manufacturing companies, including a furniture manufacturer and a metal fabrication company. The city is also home to several coal mines, although the coal industry has declined in recent years.
Demographics
As of the 2010 census, the population of Benham was 1,000 people. The racial makeup of the city was 97.2% White, 0.7% African American, 0.3% Native American, 0.2% Asian, and 1.6% from other races. The median household income was $25,000 and the median family income was $30,000.
The city is home to several churches, including the Benham United Methodist Church, the Benham Baptist Church, and the Benham Presbyterian Church. The city is also home to several schools, including the Benham Elementary School, the Benham Middle School, and the Benham High School.
Conclusion
Benham is a small city located in Harlan County, Kentucky. It is situated in the Appalachian Mountains and is part of the Cumberland Plateau. The city has a population of approximately 1,000 people and is the county seat of Harlan County. The economy of Benham is largely based on tourism and small businesses. The city is home to several small businesses, including restaurants, retail stores, and service providers. The racial makeup of the city was 97.2% White, 0.7% African American, 0.3% Native American, 0.2% Asian, and 1.6% from other races. The city is home to several churches, schools, and tourist attractions.
Common Questions
What is Per Capita Income in Benham?
Per Capita income in Benham is $23,413.
What is the Median Family Income in Benham?
Median Family Income in Benham is $53,173.
What is the Median Household income in Benham?
Median Household Income in Benham is $50,595.
What is Income or Wage Gap in Benham?
Income or Wage Gap in Benham is 10.4%.
Women in Benham earn 89.6 cents for every dollar earned by a man.
What is Inequality or Gini Index in Benham?
Inequality or Gini Index in Benham is 0.35.
What is the Total Population of Benham?
Total Population of Benham is 610.
What is the Total Male Population of Benham?
Total Male Population of Benham is 327.
What is the Total Female Population of Benham?
Total Female Population of Benham is 283.
What is the Ratio of Males per 100 Females in Benham?
There are 115.55 Males per 100 Females in Benham.
What is the Ratio of Females per 100 Males in Benham?
There are 86.54 Females per 100 Males in Benham.
What is the Median Population Age in Benham?
Median Population Age in Benham is 44.2 Years.
What is the Average Family Size in Benham
Average Family Size in Benham is 2.7 People.
What is the Average Household Size in Benham
Average Household Size in Benham is 2.2 People.
How Large is the Labor Force in Benham?
There are 215 People in the Labor Forcein in Benham.
What is the Percentage of People in the Labor Force in Benham?
42.3% of People are in the Labor Force in Benham.
What is the Unemployment Rate in Benham?
Unemployment Rate in Benham is 9.8%.