Sandy Hook, KY Map & Demographics
Sandy Hook Map
Sandy Hook Overview
$16,329
PER CAPITA INCOME
$20,469
AVG HOUSEHOLD INCOME
34.4%
WAGE / INCOME GAP [ % ]
65.6¢/ $1
WAGE / INCOME GAP [ $ ]
$15,890
FAMILY INCOME DEFICIT
0.54
INEQUALITY / GINI INDEX
708
TOTAL POPULATION
310
MALE POPULATION
398
FEMALE POPULATION
77.89
MALES / 100 FEMALES
128.39
FEMALES / 100 MALES
44.5
MEDIAN AGE
3.6
AVG FAMILY SIZE
2.4
AVG HOUSEHOLD SIZE
150
LABOR FORCE [ PEOPLE ]
26.6%
PERCENT IN LABOR FORCE
5.3%
UNEMPLOYMENT RATE
Sandy Hook Zip Codes
Sandy Hook Area Codes
Income in Sandy Hook
Income Overview in Sandy Hook
| Characteristic | Number | Measure |
| Per Capita Income | 708 | $16,329 |
| Median Family Income | 139 | $0 |
| Mean Family Income | 139 | $50,914 |
| Median Household Income | 263 | $20,469 |
| Mean Household Income | 263 | $36,461 |
| Income Deficit | 139 | $15,890 |
| Wage / Income Gap (%) | 708 | 34.40% |
| Wage / Income Gap ($) | 708 | 65.60¢ per $1 |
| Gini / Inequality Index | 708 | 0.54 |
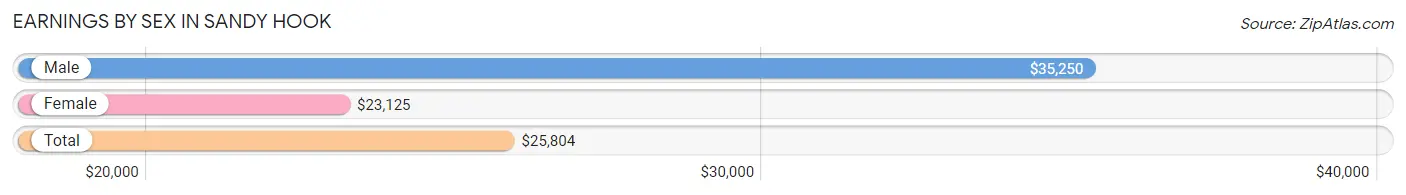
Earnings by Sex in Sandy Hook
Average Earnings in Sandy Hook are $25,804, $35,250 for men and $23,125 for women, a difference of 34.4%.
| Sex | Number | Average Earnings |
| Male | 81 (52.9%) | $35,250 |
| Female | 72 (47.1%) | $23,125 |
| Total | 153 (100.0%) | $25,804 |
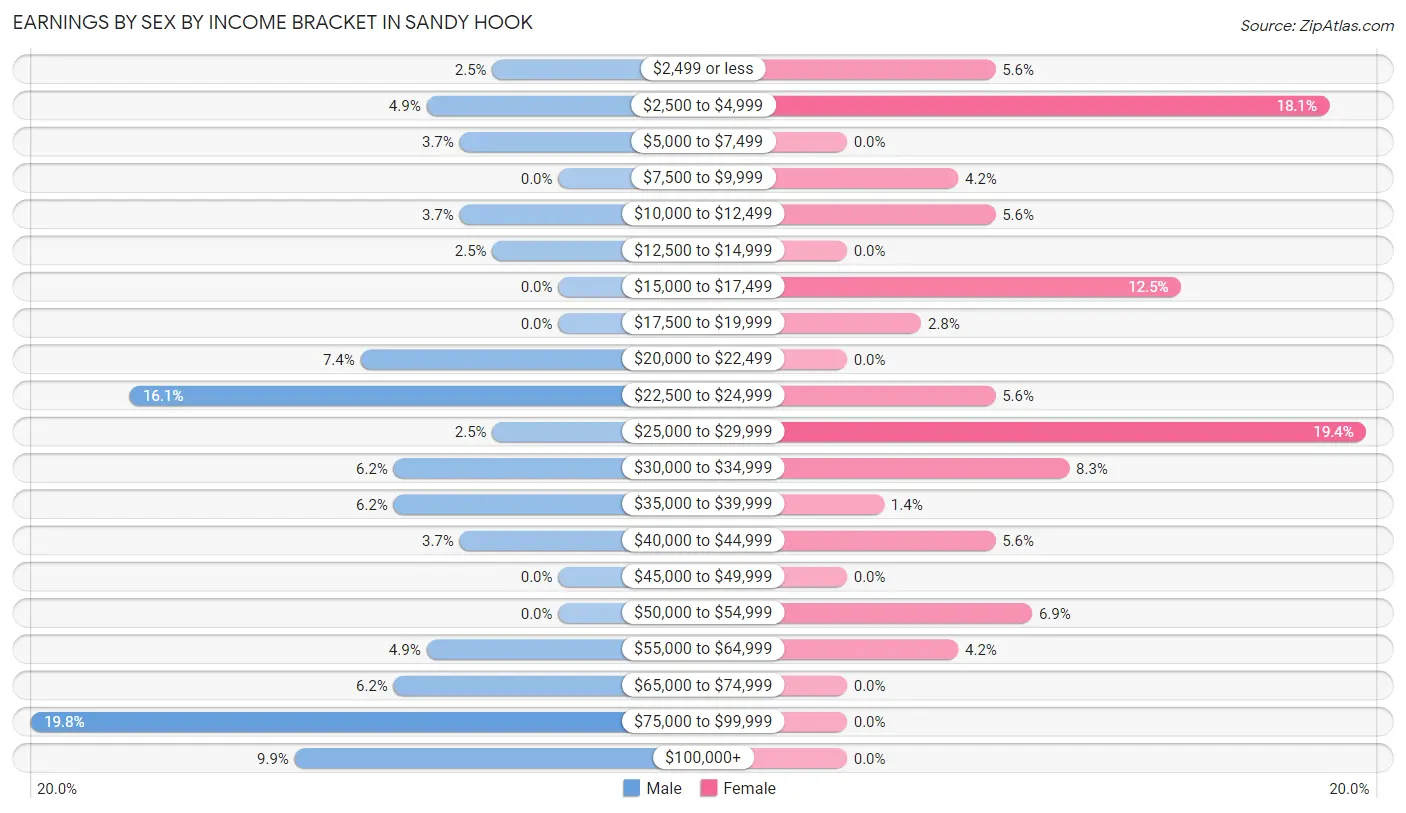
Earnings by Sex by Income Bracket in Sandy Hook
The most common earnings brackets in Sandy Hook are $75,000 to $99,999 for men (16 | 19.8%) and $25,000 to $29,999 for women (14 | 19.4%).
| Income | Male | Female |
| $2,499 or less | 2 (2.5%) | 4 (5.6%) |
| $2,500 to $4,999 | 4 (4.9%) | 13 (18.1%) |
| $5,000 to $7,499 | 3 (3.7%) | 0 (0.0%) |
| $7,500 to $9,999 | 0 (0.0%) | 3 (4.2%) |
| $10,000 to $12,499 | 3 (3.7%) | 4 (5.6%) |
| $12,500 to $14,999 | 2 (2.5%) | 0 (0.0%) |
| $15,000 to $17,499 | 0 (0.0%) | 9 (12.5%) |
| $17,500 to $19,999 | 0 (0.0%) | 2 (2.8%) |
| $20,000 to $22,499 | 6 (7.4%) | 0 (0.0%) |
| $22,500 to $24,999 | 13 (16.1%) | 4 (5.6%) |
| $25,000 to $29,999 | 2 (2.5%) | 14 (19.4%) |
| $30,000 to $34,999 | 5 (6.2%) | 6 (8.3%) |
| $35,000 to $39,999 | 5 (6.2%) | 1 (1.4%) |
| $40,000 to $44,999 | 3 (3.7%) | 4 (5.6%) |
| $45,000 to $49,999 | 0 (0.0%) | 0 (0.0%) |
| $50,000 to $54,999 | 0 (0.0%) | 5 (6.9%) |
| $55,000 to $64,999 | 4 (4.9%) | 3 (4.2%) |
| $65,000 to $74,999 | 5 (6.2%) | 0 (0.0%) |
| $75,000 to $99,999 | 16 (19.8%) | 0 (0.0%) |
| $100,000+ | 8 (9.9%) | 0 (0.0%) |
| Total | 81 (100.0%) | 72 (100.0%) |
Earnings by Sex by Educational Attainment in Sandy Hook
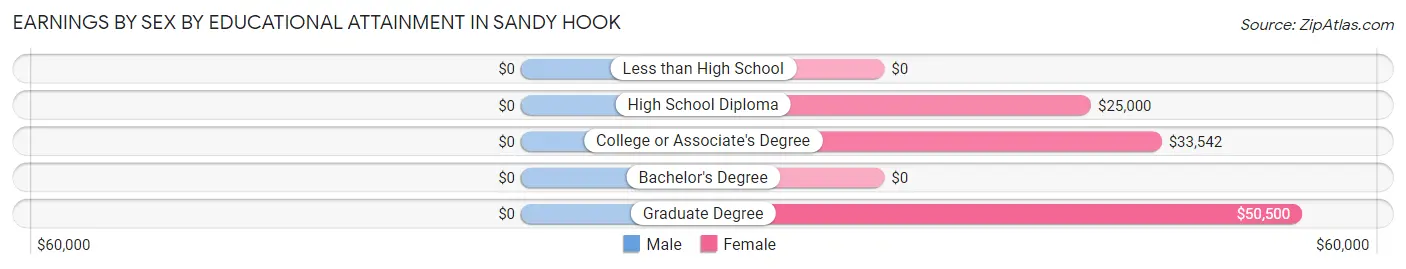
| Educational Attainment | Male Income | Female Income |
| Less than High School | - | - |
| High School Diploma | - | - |
| College or Associate's Degree | - | - |
| Bachelor's Degree | - | - |
| Graduate Degree | - | - |
| Total | - | - |
Family Income in Sandy Hook
Family Income Brackets in Sandy Hook
According to the Sandy Hook family income data, there are 27 families falling into the $10,000 to $14,999 income range, which is the most common income bracket and makes up 19.4% of all families.
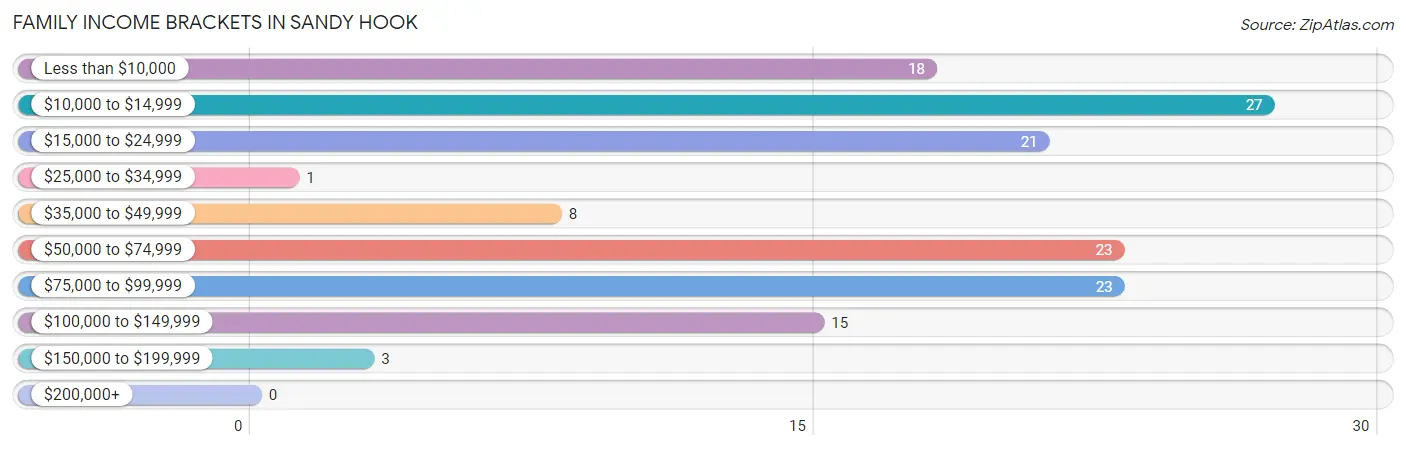
| Income Bracket | # Families | % Families |
| Less than $10,000 | 18 | 12.9% |
| $10,000 to $14,999 | 27 | 19.4% |
| $15,000 to $24,999 | 21 | 15.1% |
| $25,000 to $34,999 | 1 | 0.7% |
| $35,000 to $49,999 | 8 | 5.8% |
| $50,000 to $74,999 | 23 | 16.5% |
| $75,000 to $99,999 | 23 | 16.5% |
| $100,000 to $149,999 | 15 | 10.8% |
| $150,000 to $199,999 | 3 | 2.2% |
| $200,000+ | 0 | 0.0% |
Family Income by Famaliy Size in Sandy Hook
2-person families (62 | 44.6%) account for the highest median family income in Sandy Hook with $53,750 per family, while 2-person families (62 | 44.6%) have the highest median income of $26,875 per family member.
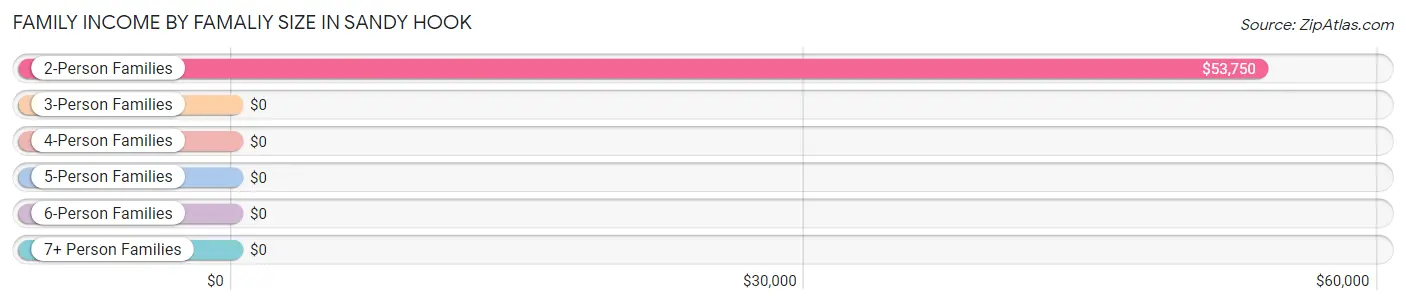
| Income Bracket | # Families | Median Income |
| 2-Person Families | 62 (44.6%) | $53,750 |
| 3-Person Families | 43 (30.9%) | $0 |
| 4-Person Families | 26 (18.7%) | $0 |
| 5-Person Families | 8 (5.8%) | $0 |
| 6-Person Families | 0 (0.0%) | $0 |
| 7+ Person Families | 0 (0.0%) | $0 |
| Total | 139 (100.0%) | $0 |
Family Income by Number of Earners in Sandy Hook
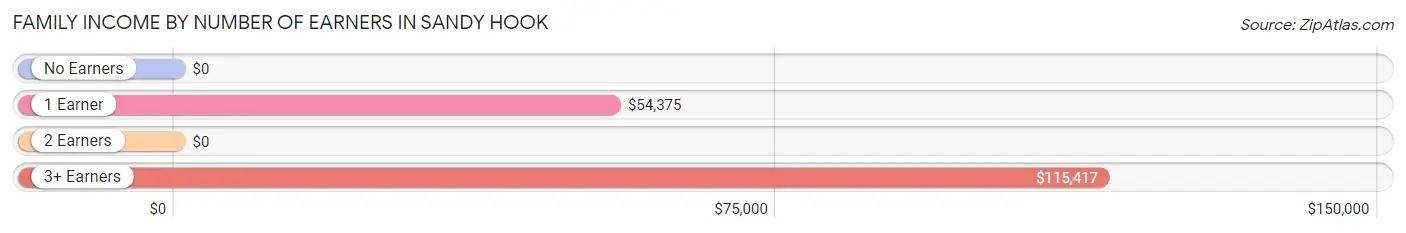
| Number of Earners | # Families | Median Income |
| No Earners | 60 (43.2%) | $0 |
| 1 Earner | 62 (44.6%) | $54,375 |
| 2 Earners | 6 (4.3%) | $0 |
| 3+ Earners | 11 (7.9%) | $115,417 |
| Total | 139 (100.0%) | $0 |
Household Income in Sandy Hook
Household Income Brackets in Sandy Hook
With 83 households falling in the category, the $10,000 to $14,999 income range is the most frequent in Sandy Hook, accounting for 31.6% of all households.
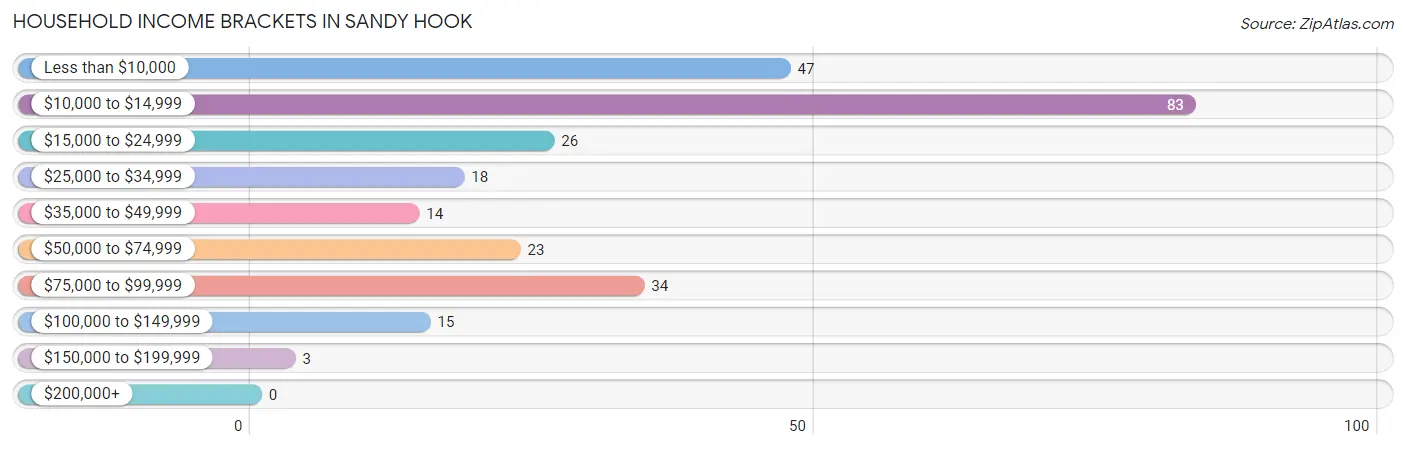
| Income Bracket | # Households | % Households |
| Less than $10,000 | 47 | 17.9% |
| $10,000 to $14,999 | 83 | 31.6% |
| $15,000 to $24,999 | 26 | 9.9% |
| $25,000 to $34,999 | 18 | 6.8% |
| $35,000 to $49,999 | 14 | 5.3% |
| $50,000 to $74,999 | 23 | 8.7% |
| $75,000 to $99,999 | 34 | 12.9% |
| $100,000 to $149,999 | 15 | 5.7% |
| $150,000 to $199,999 | 3 | 1.1% |
| $200,000+ | 0 | 0.0% |
Household Income by Householder Age in Sandy Hook
The median household income in Sandy Hook is $20,469, with the highest median household income of $11,481 found in the 25 to 44 years age bracket for the primary householder. A total of 48 households (18.2%) fall into this category. Meanwhile, the 15 to 24 years age bracket for the primary householder has the lowest median household income of $0, with 11 households (4.2%) in this group.
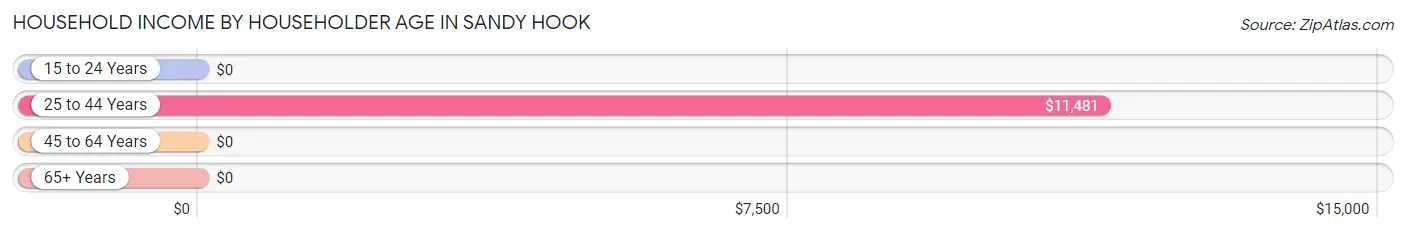
| Income Bracket | # Households | Median Income |
| 15 to 24 Years | 11 (4.2%) | $0 |
| 25 to 44 Years | 48 (18.2%) | $11,481 |
| 45 to 64 Years | 87 (33.1%) | $0 |
| 65+ Years | 117 (44.5%) | $0 |
| Total | 263 (100.0%) | $20,469 |
Poverty in Sandy Hook
Income Below Poverty by Sex and Age in Sandy Hook
With 44.2% poverty level for males and 60.6% for females among the residents of Sandy Hook, 6 to 11 year old males and under 5 year old females are the most vulnerable to poverty, with 41 males (83.7%) and 4 females (100.0%) in their respective age groups living below the poverty level.
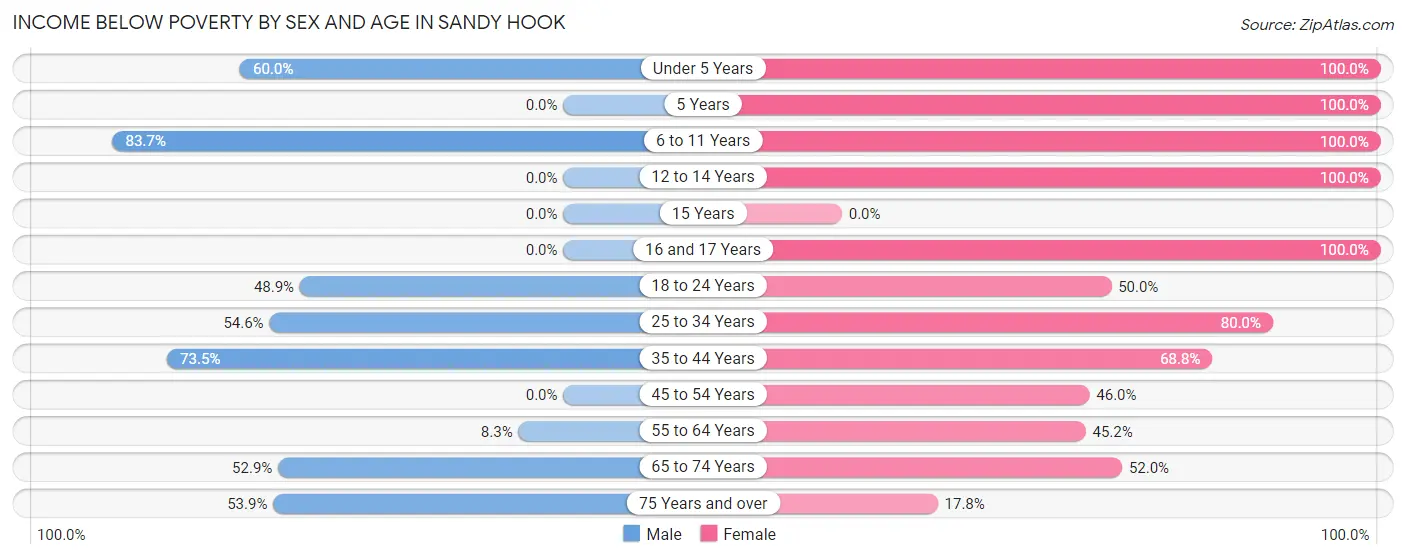
| Age Bracket | Male | Female |
| Under 5 Years | 3 (60.0%) | 4 (100.0%) |
| 5 Years | 0 (0.0%) | 32 (100.0%) |
| 6 to 11 Years | 41 (83.7%) | 20 (100.0%) |
| 12 to 14 Years | 0 (0.0%) | 10 (100.0%) |
| 15 Years | 0 (0.0%) | 0 (0.0%) |
| 16 and 17 Years | 0 (0.0%) | 13 (100.0%) |
| 18 to 24 Years | 22 (48.9%) | 9 (50.0%) |
| 25 to 34 Years | 6 (54.5%) | 24 (80.0%) |
| 35 to 44 Years | 25 (73.5%) | 33 (68.8%) |
| 45 to 54 Years | 0 (0.0%) | 17 (46.0%) |
| 55 to 64 Years | 3 (8.3%) | 19 (45.2%) |
| 65 to 74 Years | 18 (52.9%) | 26 (52.0%) |
| 75 Years and over | 7 (53.8%) | 8 (17.8%) |
| Total | 125 (44.2%) | 215 (60.6%) |
Income Above Poverty by Sex and Age in Sandy Hook
According to the poverty statistics in Sandy Hook, males aged 12 to 14 years and females aged 15 years are the age groups that are most secure financially, with 100.0% of males and 100.0% of females in these age groups living above the poverty line.
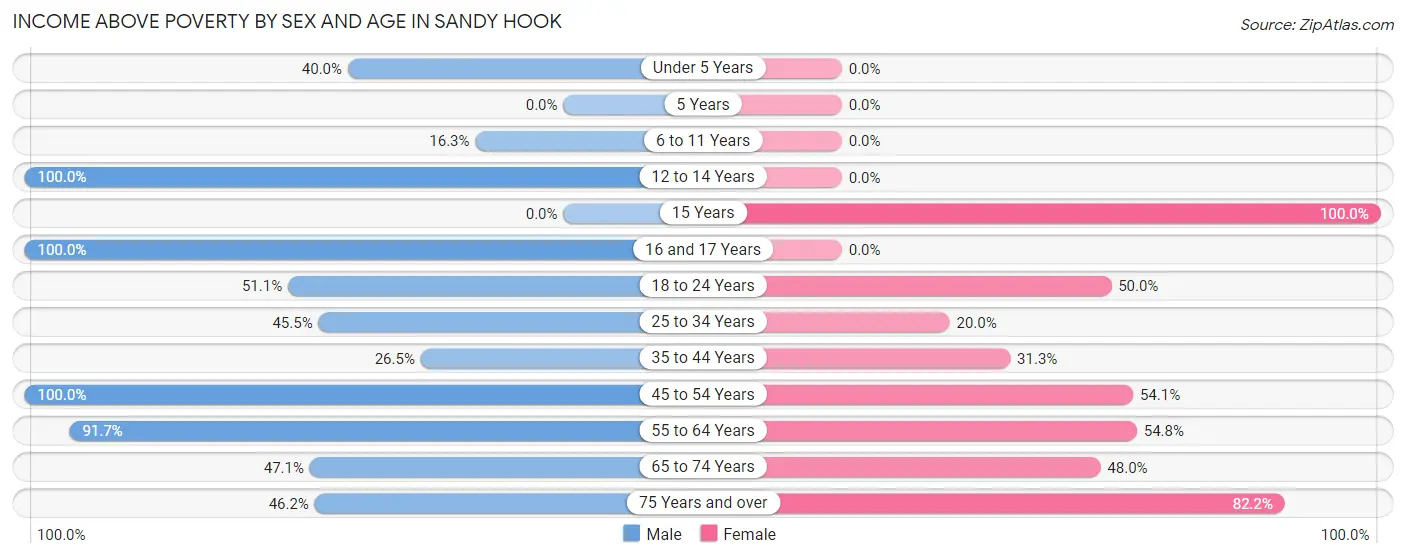
| Age Bracket | Male | Female |
| Under 5 Years | 2 (40.0%) | 0 (0.0%) |
| 5 Years | 0 (0.0%) | 0 (0.0%) |
| 6 to 11 Years | 8 (16.3%) | 0 (0.0%) |
| 12 to 14 Years | 18 (100.0%) | 0 (0.0%) |
| 15 Years | 0 (0.0%) | 6 (100.0%) |
| 16 and 17 Years | 21 (100.0%) | 0 (0.0%) |
| 18 to 24 Years | 23 (51.1%) | 9 (50.0%) |
| 25 to 34 Years | 5 (45.5%) | 6 (20.0%) |
| 35 to 44 Years | 9 (26.5%) | 15 (31.2%) |
| 45 to 54 Years | 17 (100.0%) | 20 (54.0%) |
| 55 to 64 Years | 33 (91.7%) | 23 (54.8%) |
| 65 to 74 Years | 16 (47.1%) | 24 (48.0%) |
| 75 Years and over | 6 (46.2%) | 37 (82.2%) |
| Total | 158 (55.8%) | 140 (39.4%) |
Income Below Poverty Among Married-Couple Families in Sandy Hook
The poverty statistics for married-couple families in Sandy Hook show that 37.8% or 28 of the total 74 families live below the poverty line. Families with 3 or 4 children have the highest poverty rate of 100.0%, comprising of 8 families. On the other hand, families with no children have the lowest poverty rate of 0.0%, which includes 0 families.
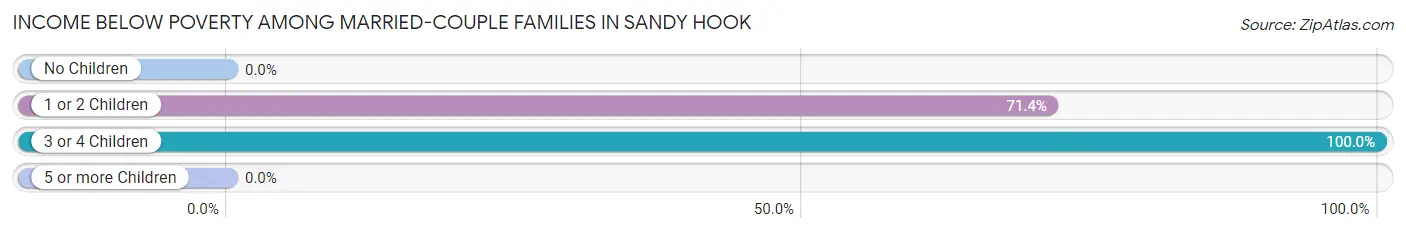
| Children | Above Poverty | Below Poverty |
| No Children | 38 (100.0%) | 0 (0.0%) |
| 1 or 2 Children | 8 (28.6%) | 20 (71.4%) |
| 3 or 4 Children | 0 (0.0%) | 8 (100.0%) |
| 5 or more Children | 0 (0.0%) | 0 (0.0%) |
| Total | 46 (62.2%) | 28 (37.8%) |
Income Below Poverty Among Single-Parent Households in Sandy Hook
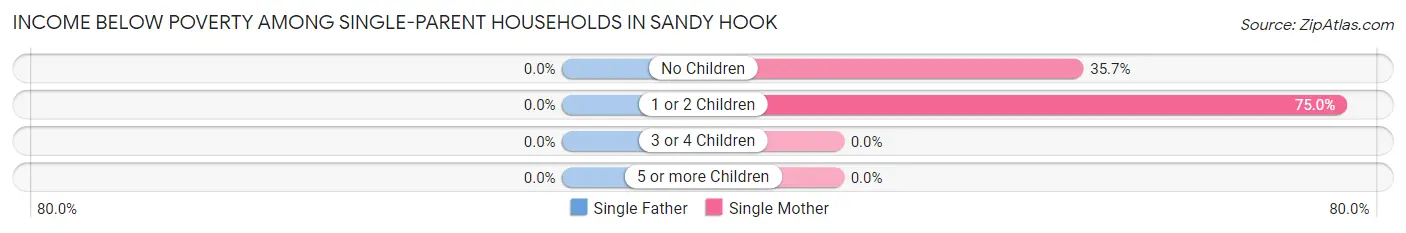
| Children | Single Father | Single Mother |
| No Children | 0 (0.0%) | 10 (35.7%) |
| 1 or 2 Children | 0 (0.0%) | 12 (75.0%) |
| 3 or 4 Children | 0 (0.0%) | 0 (0.0%) |
| 5 or more Children | 0 (0.0%) | 0 (0.0%) |
| Total | 0 (0.0%) | 22 (50.0%) |
Income Below Poverty Among Married-Couple vs Single-Parent Households in Sandy Hook
The poverty data for Sandy Hook shows that 28 of the married-couple family households (37.8%) and 22 of the single-parent households (33.9%) are living below the poverty level. Within the married-couple family households, those with 3 or 4 children have the highest poverty rate, with 8 households (100.0%) falling below the poverty line. Among the single-parent households, those with no children have the highest poverty rate, with 10 household (35.7%) living below poverty.
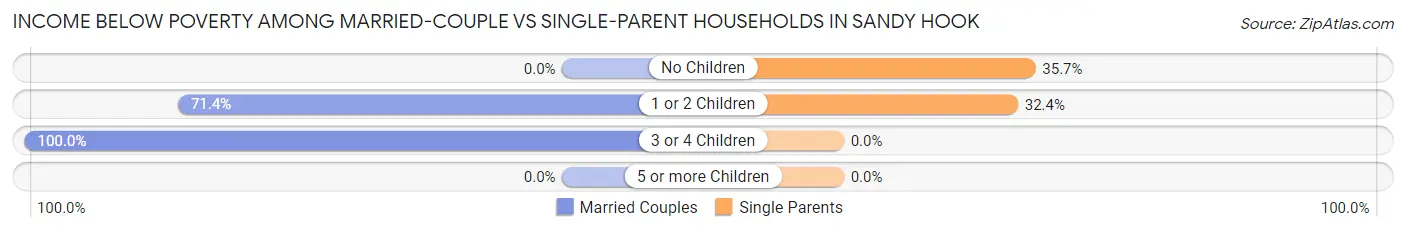
| Children | Married-Couple Families | Single-Parent Households |
| No Children | 0 (0.0%) | 10 (35.7%) |
| 1 or 2 Children | 20 (71.4%) | 12 (32.4%) |
| 3 or 4 Children | 8 (100.0%) | 0 (0.0%) |
| 5 or more Children | 0 (0.0%) | 0 (0.0%) |
| Total | 28 (37.8%) | 22 (33.9%) |
Race in Sandy Hook
The most populous races in Sandy Hook are White / Caucasian (689 | 97.3%), Black / African American (14 | 2.0%), and Two or more Races (5 | 0.7%).
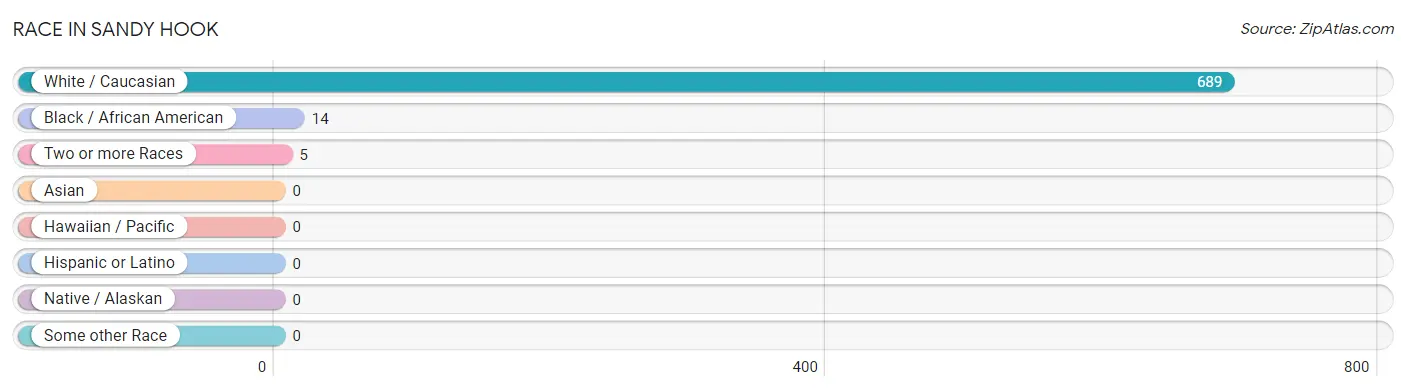
| Race | # Population | % Population |
| Asian | 0 | 0.0% |
| Black / African American | 14 | 2.0% |
| Hawaiian / Pacific | 0 | 0.0% |
| Hispanic or Latino | 0 | 0.0% |
| Native / Alaskan | 0 | 0.0% |
| White / Caucasian | 689 | 97.3% |
| Two or more Races | 5 | 0.7% |
| Some other Race | 0 | 0.0% |
| Total | 708 | 100.0% |
Ancestry in Sandy Hook
The most populous ancestries reported in Sandy Hook are American (344 | 48.6%), English (49 | 6.9%), Irish (46 | 6.5%), German (40 | 5.7%), and French (25 | 3.5%), together accounting for 71.2% of all Sandy Hook residents.
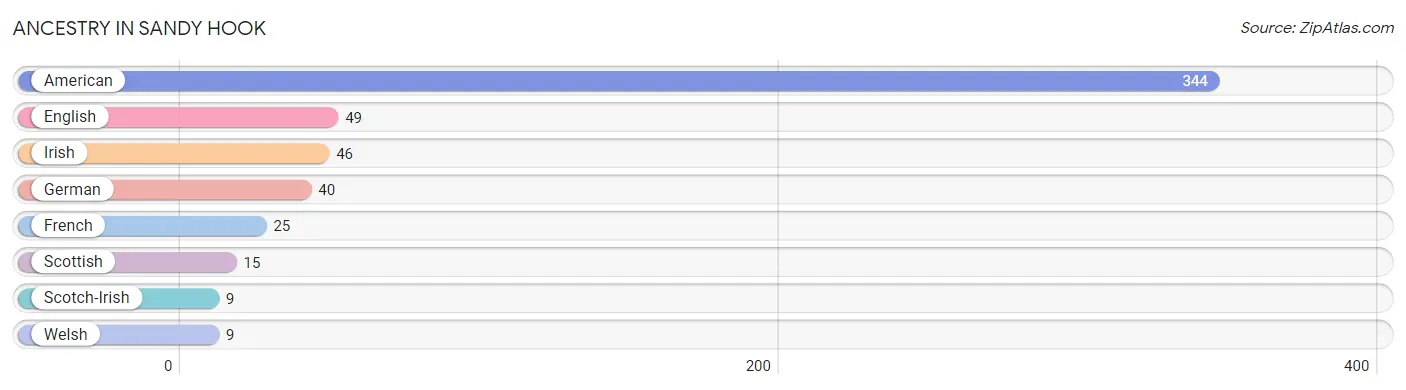
| Ancestry | # Population | % Population |
| American | 344 | 48.6% |
| English | 49 | 6.9% |
| French | 25 | 3.5% |
| German | 40 | 5.7% |
| Irish | 46 | 6.5% |
| Scotch-Irish | 9 | 1.3% |
| Scottish | 15 | 2.1% |
| Welsh | 9 | 1.3% | View All 8 Rows |
Immigrants in Sandy Hook

| Immigration Origin | # Population | % Population | View All 0 Rows |
Sex and Age in Sandy Hook
Sex and Age in Sandy Hook
The most populous age groups in Sandy Hook are 15 to 19 Years (47 | 15.2%) for men and 85 Years and over (63 | 15.8%) for women.
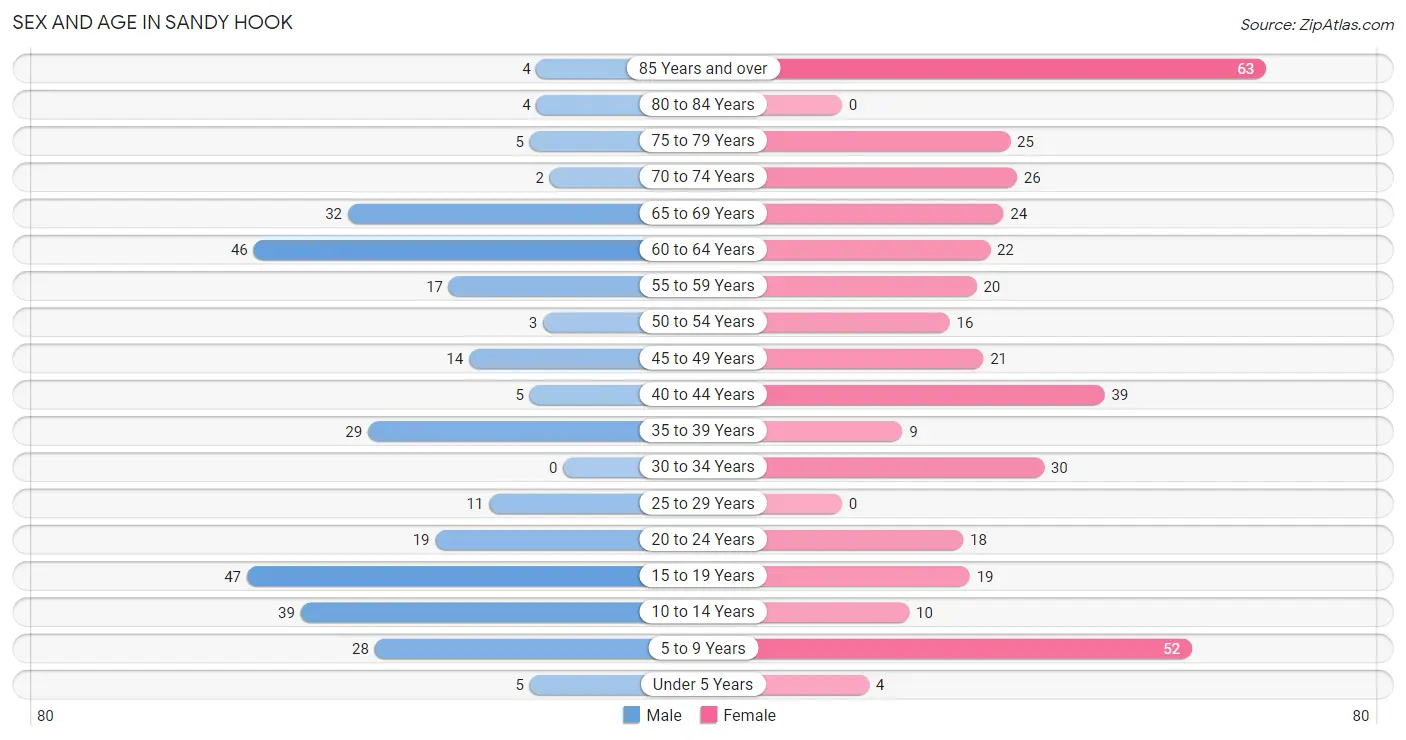
| Age Bracket | Male | Female |
| Under 5 Years | 5 (1.6%) | 4 (1.0%) |
| 5 to 9 Years | 28 (9.0%) | 52 (13.1%) |
| 10 to 14 Years | 39 (12.6%) | 10 (2.5%) |
| 15 to 19 Years | 47 (15.2%) | 19 (4.8%) |
| 20 to 24 Years | 19 (6.1%) | 18 (4.5%) |
| 25 to 29 Years | 11 (3.5%) | 0 (0.0%) |
| 30 to 34 Years | 0 (0.0%) | 30 (7.5%) |
| 35 to 39 Years | 29 (9.3%) | 9 (2.3%) |
| 40 to 44 Years | 5 (1.6%) | 39 (9.8%) |
| 45 to 49 Years | 14 (4.5%) | 21 (5.3%) |
| 50 to 54 Years | 3 (1.0%) | 16 (4.0%) |
| 55 to 59 Years | 17 (5.5%) | 20 (5.0%) |
| 60 to 64 Years | 46 (14.8%) | 22 (5.5%) |
| 65 to 69 Years | 32 (10.3%) | 24 (6.0%) |
| 70 to 74 Years | 2 (0.6%) | 26 (6.5%) |
| 75 to 79 Years | 5 (1.6%) | 25 (6.3%) |
| 80 to 84 Years | 4 (1.3%) | 0 (0.0%) |
| 85 Years and over | 4 (1.3%) | 63 (15.8%) |
| Total | 310 (100.0%) | 398 (100.0%) |
Families and Households in Sandy Hook
Median Family Size in Sandy Hook
The median family size in Sandy Hook is 3.58 persons per family, with married-couple families (74 | 53.2%) accounting for the largest median family size of 4 persons per family. On the other hand, single male/father families (21 | 15.1%) represent the smallest median family size with 2.67 persons per family.
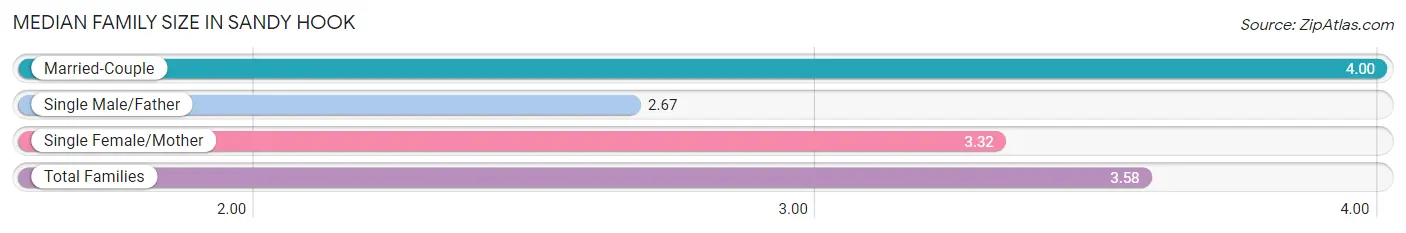
| Family Type | # Families | Family Size |
| Married-Couple | 74 (53.2%) | 4.00 |
| Single Male/Father | 21 (15.1%) | 2.67 |
| Single Female/Mother | 44 (31.7%) | 3.32 |
| Total Families | 139 (100.0%) | 3.58 |
Median Household Size in Sandy Hook
The median household size in Sandy Hook is 2.43 persons per household, with married-couple households (74 | 28.1%) accounting for the largest median household size of 4 persons per household. non-family households (124 | 47.1%) represent the smallest median household size with 1.06 persons per household.
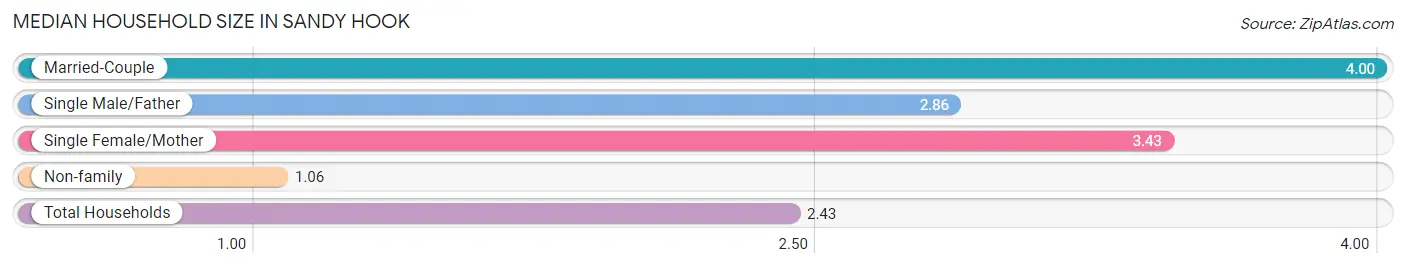
| Household Type | # Households | Household Size |
| Married-Couple | 74 (28.1%) | 4.00 |
| Single Male/Father | 21 (8.0%) | 2.86 |
| Single Female/Mother | 44 (16.7%) | 3.43 |
| Non-family | 124 (47.1%) | 1.06 |
| Total Households | 263 (100.0%) | 2.43 |
Household Size by Marriage Status in Sandy Hook
Out of a total of 263 households in Sandy Hook, 139 (52.8%) are family households, while 124 (47.1%) are nonfamily households. The most numerous type of family households are 2-person households, comprising 57, and the most common type of nonfamily households are 1-person households, comprising 114.
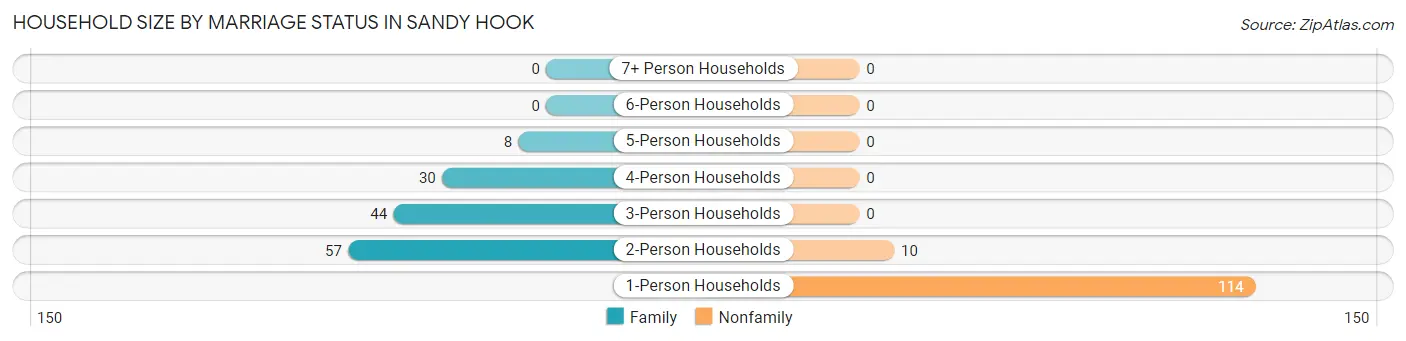
| Household Size | Family Households | Nonfamily Households |
| 1-Person Households | - | 114 (43.3%) |
| 2-Person Households | 57 (21.7%) | 10 (3.8%) |
| 3-Person Households | 44 (16.7%) | 0 (0.0%) |
| 4-Person Households | 30 (11.4%) | 0 (0.0%) |
| 5-Person Households | 8 (3.0%) | 0 (0.0%) |
| 6-Person Households | 0 (0.0%) | 0 (0.0%) |
| 7+ Person Households | 0 (0.0%) | 0 (0.0%) |
| Total | 139 (52.8%) | 124 (47.1%) |
Female Fertility in Sandy Hook
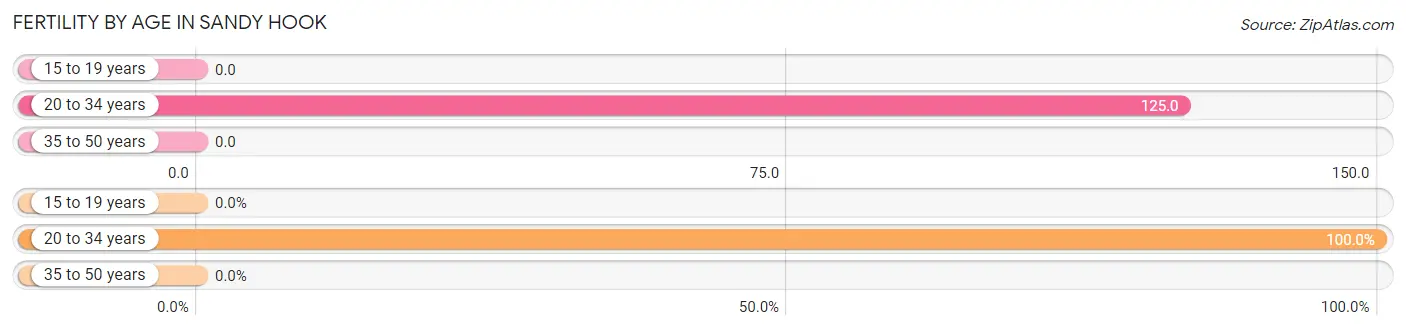
Fertility by Age in Sandy Hook
Average fertility rate in Sandy Hook is 42.0 births per 1,000 women. Women in the age bracket of 20 to 34 years have the highest fertility rate with 125.0 births per 1,000 women. Women in the age bracket of 20 to 34 years acount for 100.0% of all women with births.
| Age Bracket | Women with Births | Births / 1,000 Women |
| 15 to 19 years | 0 (0.0%) | 0.0 |
| 20 to 34 years | 6 (100.0%) | 125.0 |
| 35 to 50 years | 0 (0.0%) | 0.0 |
| Total | 6 (100.0%) | 42.0 |
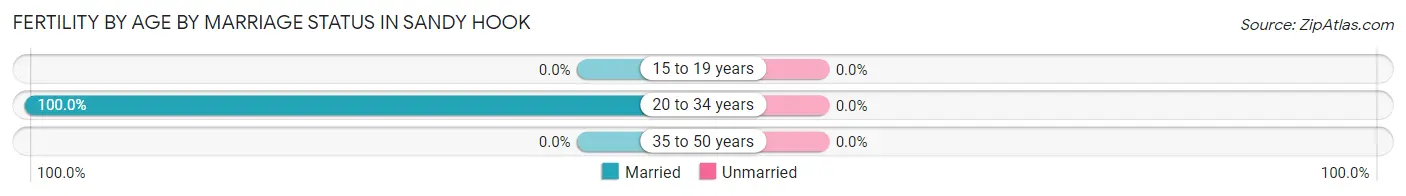
Fertility by Age by Marriage Status in Sandy Hook
| Age Bracket | Married | Unmarried |
| 15 to 19 years | 0 (0.0%) | 0 (0.0%) |
| 20 to 34 years | 6 (100.0%) | 0 (0.0%) |
| 35 to 50 years | 0 (0.0%) | 0 (0.0%) |
| Total | 6 (100.0%) | 0 (0.0%) |
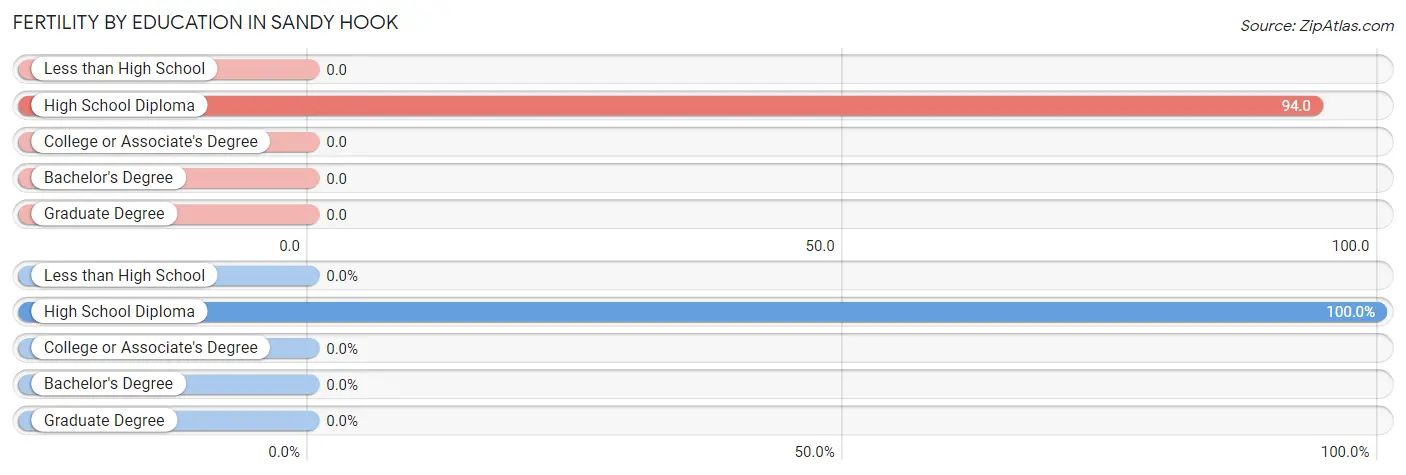
Fertility by Education in Sandy Hook
| Educational Attainment | Women with Births | Births / 1,000 Women |
| Less than High School | 0 (0.0%) | 0.0 |
| High School Diploma | 6 (100.0%) | 94.0 |
| College or Associate's Degree | 0 (0.0%) | 0.0 |
| Bachelor's Degree | 0 (0.0%) | 0.0 |
| Graduate Degree | 0 (0.0%) | 0.0 |
| Total | 6 (100.0%) | 42.0 |
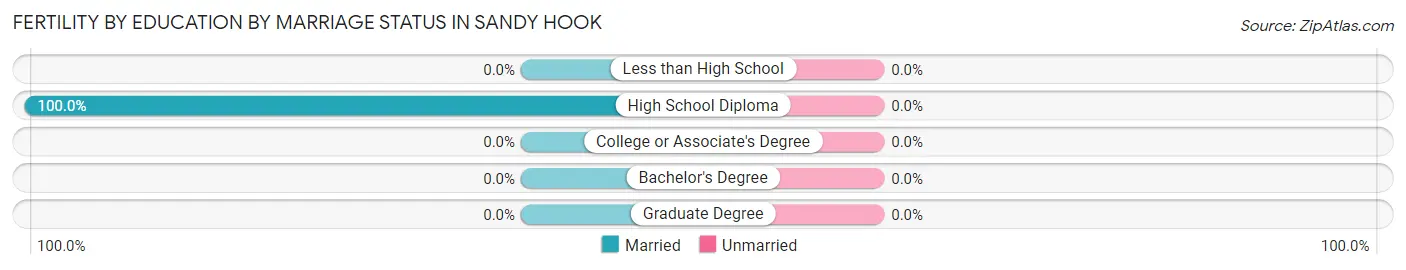
Fertility by Education by Marriage Status in Sandy Hook
| Educational Attainment | Married | Unmarried |
| Less than High School | 0 (0.0%) | 0 (0.0%) |
| High School Diploma | 6 (100.0%) | 0 (0.0%) |
| College or Associate's Degree | 0 (0.0%) | 0 (0.0%) |
| Bachelor's Degree | 0 (0.0%) | 0 (0.0%) |
| Graduate Degree | 0 (0.0%) | 0 (0.0%) |
| Total | 6 (100.0%) | 0 (0.0%) |
Employment Characteristics in Sandy Hook
Employment by Class of Employer in Sandy Hook
Among the 138 employed individuals in Sandy Hook, private company employees (90 | 65.2%), self-employed (not incorporated) (33 | 23.9%), and self-employed (incorporated) (7 | 5.1%) make up the most common classes of employment.
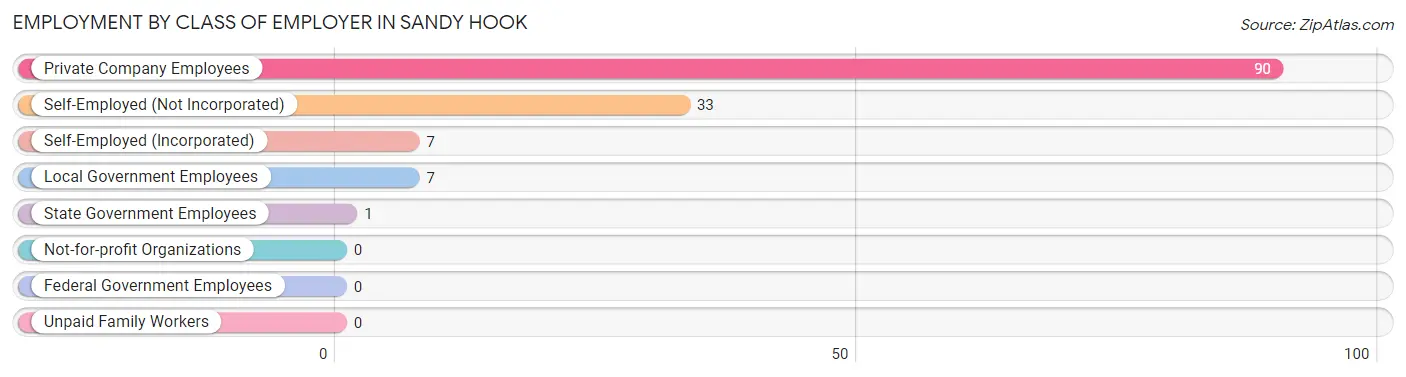
| Employer Class | # Employees | % Employees |
| Private Company Employees | 90 | 65.2% |
| Self-Employed (Incorporated) | 7 | 5.1% |
| Self-Employed (Not Incorporated) | 33 | 23.9% |
| Not-for-profit Organizations | 0 | 0.0% |
| Local Government Employees | 7 | 5.1% |
| State Government Employees | 1 | 0.7% |
| Federal Government Employees | 0 | 0.0% |
| Unpaid Family Workers | 0 | 0.0% |
| Total | 138 | 100.0% |
Employment Status by Age in Sandy Hook
According to the labor force statistics for Sandy Hook, out of the total population over 16 years of age (564), 26.6% or 150 individuals are in the labor force, with 5.3% or 8 of them unemployed. The age group with the highest labor force participation rate is 25 to 29 years, with 100.0% or 11 individuals in the labor force. Within the labor force, the 25 to 29 years age range has the highest percentage of unemployed individuals, with 45.5% or 5 of them being unemployed.
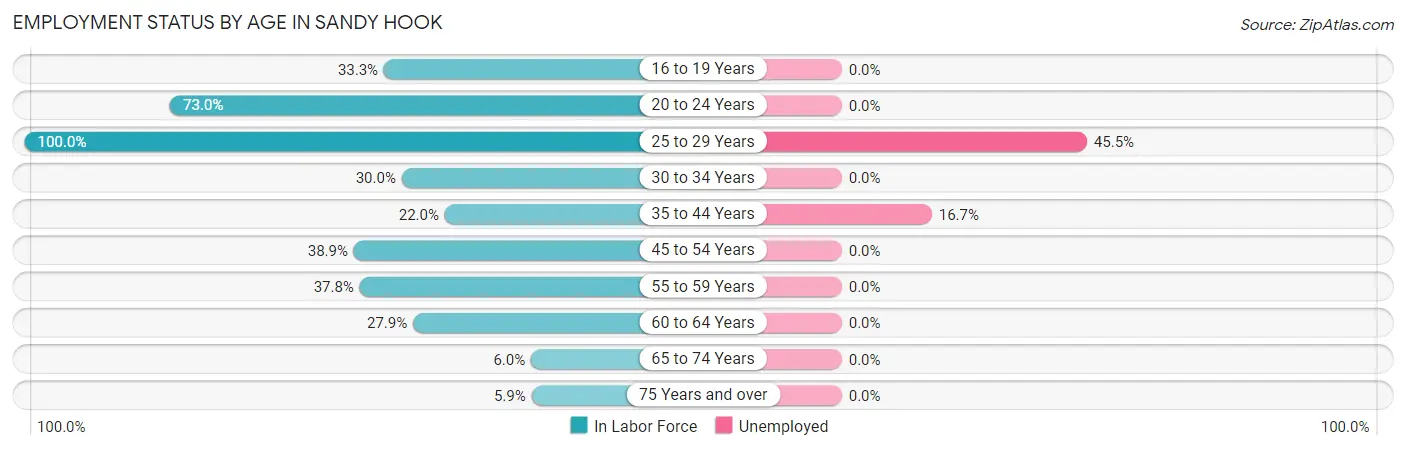
| Age Bracket | In Labor Force | Unemployed |
| 16 to 19 Years | 20 (33.3%) | 0 (0.0%) |
| 20 to 24 Years | 27 (73.0%) | 0 (0.0%) |
| 25 to 29 Years | 11 (100.0%) | 5 (45.5%) |
| 30 to 34 Years | 9 (30.0%) | 0 (0.0%) |
| 35 to 44 Years | 18 (22.0%) | 3 (16.7%) |
| 45 to 54 Years | 21 (38.9%) | 0 (0.0%) |
| 55 to 59 Years | 14 (37.8%) | 0 (0.0%) |
| 60 to 64 Years | 19 (27.9%) | 0 (0.0%) |
| 65 to 74 Years | 5 (6.0%) | 0 (0.0%) |
| 75 Years and over | 6 (5.9%) | 0 (0.0%) |
| Total | 150 (26.6%) | 8 (5.3%) |
Employment Status by Educational Attainment in Sandy Hook
According to labor force statistics for Sandy Hook, 32.6% of individuals (92) out of the total population between 25 and 64 years of age (282) are in the labor force, with 8.7% or 8 of them being unemployed. The group with the highest labor force participation rate are those with the educational attainment of high school diploma, with 40.4% or 44 individuals in the labor force. Within the labor force, individuals with college / associate degree education have the highest percentage of unemployment, with 16.1% or 5 of them being unemployed.
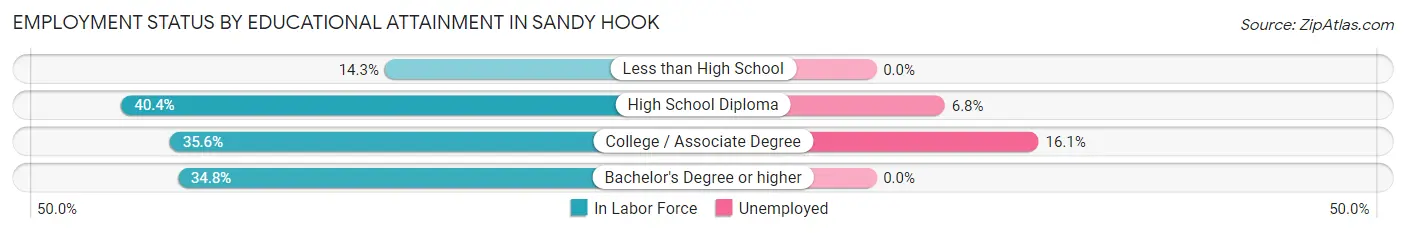
| Educational Attainment | In Labor Force | Unemployed |
| Less than High School | 9 (14.3%) | 0 (0.0%) |
| High School Diploma | 44 (40.4%) | 7 (6.8%) |
| College / Associate Degree | 31 (35.6%) | 14 (16.1%) |
| Bachelor's Degree or higher | 8 (34.8%) | 0 (0.0%) |
| Total | 92 (32.6%) | 25 (8.7%) |
Employment Occupations by Sex in Sandy Hook
Management, Business, Science and Arts Occupations
The most common Management, Business, Science and Arts occupations in Sandy Hook are Community & Social Service (15 | 10.6%), Education Instruction & Library (15 | 10.6%), Management (9 | 6.3%), Computers, Engineering & Science (5 | 3.5%), and Computers & Mathematics (5 | 3.5%).
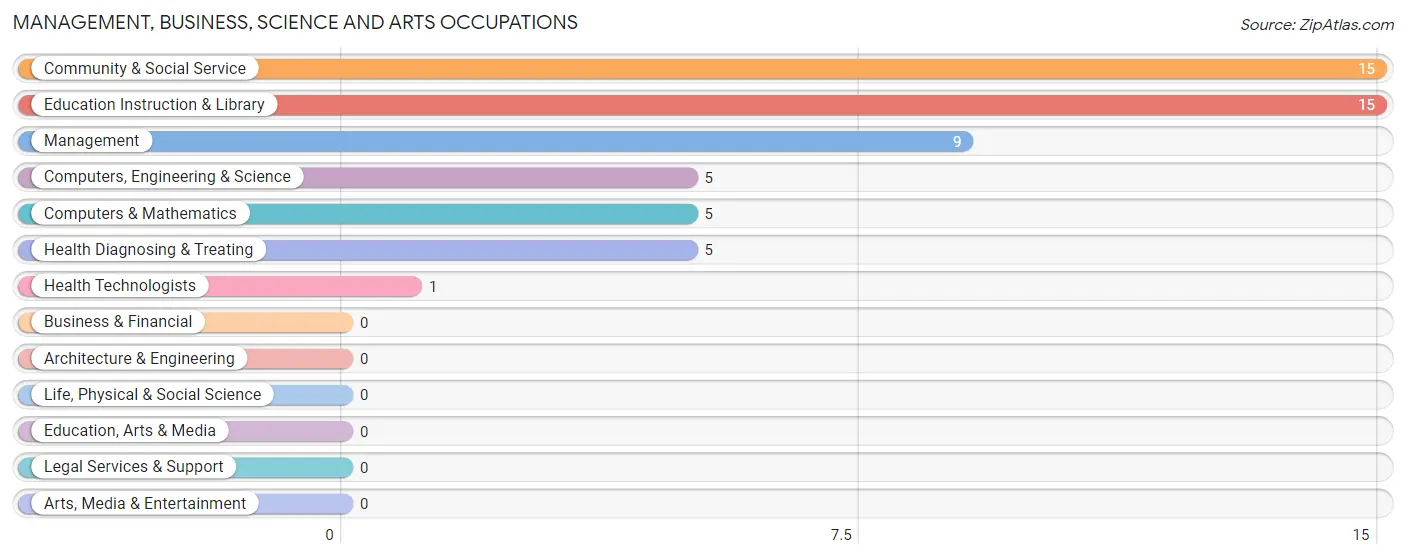
Management, Business, Science and Arts Occupations by Sex
Within the Management, Business, Science and Arts occupations in Sandy Hook, the most male-oriented occupations are Computers, Engineering & Science (100.0%), Computers & Mathematics (100.0%), and Management (55.6%), while the most female-oriented occupations are Community & Social Service (100.0%), Education Instruction & Library (100.0%), and Health Diagnosing & Treating (100.0%).
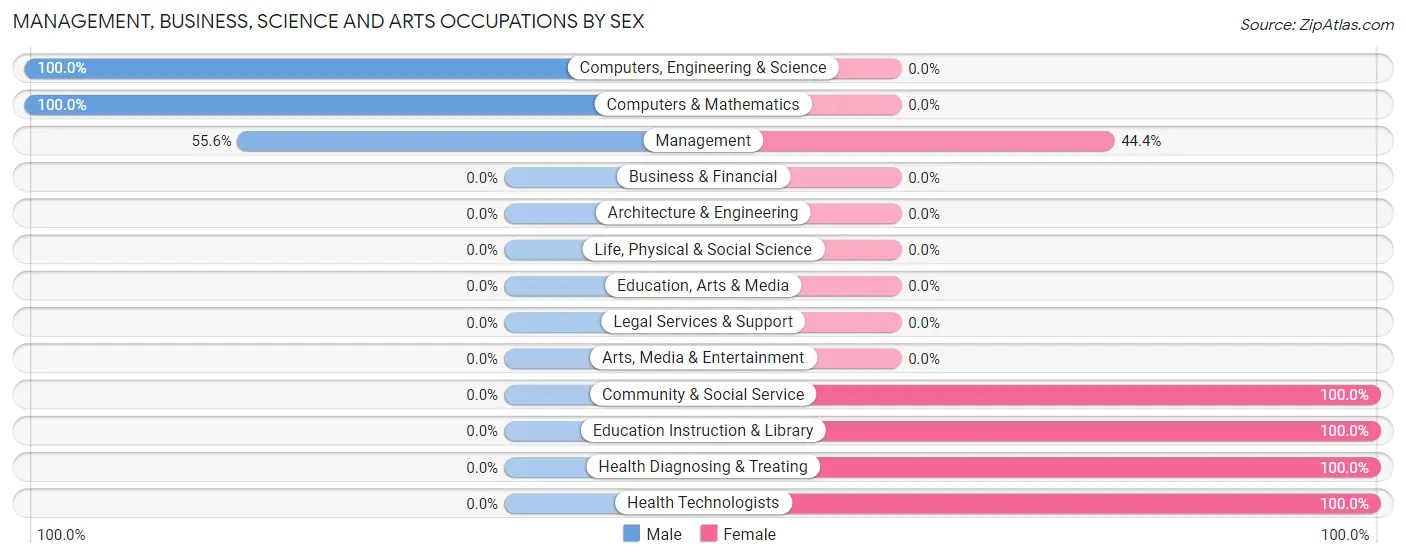
| Occupation | Male | Female |
| Management | 5 (55.6%) | 4 (44.4%) |
| Business & Financial | 0 (0.0%) | 0 (0.0%) |
| Computers, Engineering & Science | 5 (100.0%) | 0 (0.0%) |
| Computers & Mathematics | 5 (100.0%) | 0 (0.0%) |
| Architecture & Engineering | 0 (0.0%) | 0 (0.0%) |
| Life, Physical & Social Science | 0 (0.0%) | 0 (0.0%) |
| Community & Social Service | 0 (0.0%) | 15 (100.0%) |
| Education, Arts & Media | 0 (0.0%) | 0 (0.0%) |
| Legal Services & Support | 0 (0.0%) | 0 (0.0%) |
| Education Instruction & Library | 0 (0.0%) | 15 (100.0%) |
| Arts, Media & Entertainment | 0 (0.0%) | 0 (0.0%) |
| Health Diagnosing & Treating | 0 (0.0%) | 5 (100.0%) |
| Health Technologists | 0 (0.0%) | 1 (100.0%) |
| Total (Category) | 10 (29.4%) | 24 (70.6%) |
| Total (Overall) | 74 (52.1%) | 68 (47.9%) |
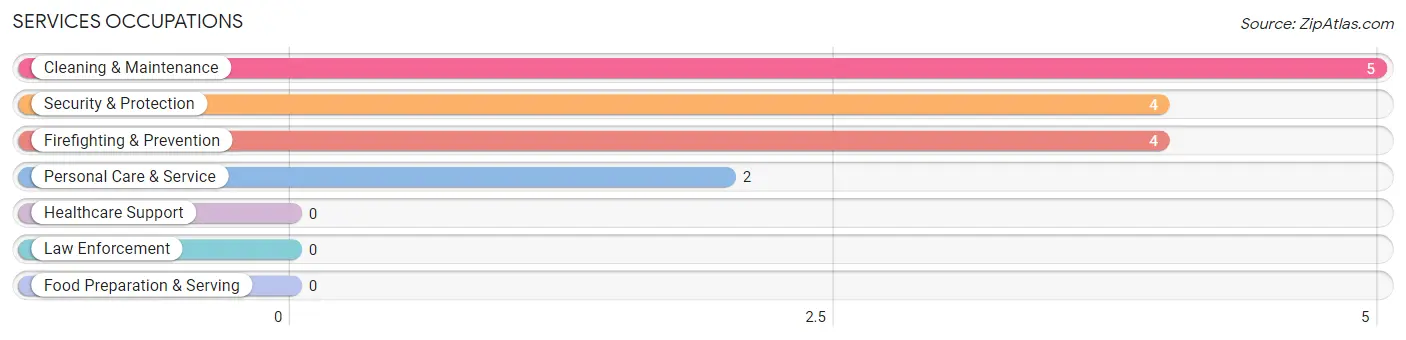
Services Occupations
The most common Services occupations in Sandy Hook are Cleaning & Maintenance (5 | 3.5%), Security & Protection (4 | 2.8%), Firefighting & Prevention (4 | 2.8%), and Personal Care & Service (2 | 1.4%).
Services Occupations by Sex
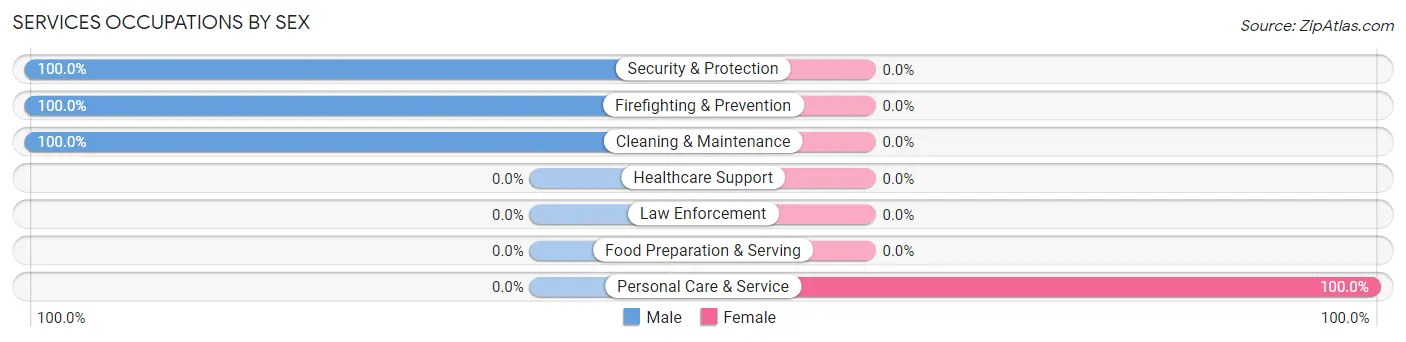
| Occupation | Male | Female |
| Healthcare Support | 0 (0.0%) | 0 (0.0%) |
| Security & Protection | 4 (100.0%) | 0 (0.0%) |
| Firefighting & Prevention | 4 (100.0%) | 0 (0.0%) |
| Law Enforcement | 0 (0.0%) | 0 (0.0%) |
| Food Preparation & Serving | 0 (0.0%) | 0 (0.0%) |
| Cleaning & Maintenance | 5 (100.0%) | 0 (0.0%) |
| Personal Care & Service | 0 (0.0%) | 2 (100.0%) |
| Total (Category) | 9 (81.8%) | 2 (18.2%) |
| Total (Overall) | 74 (52.1%) | 68 (47.9%) |
Sales and Office Occupations
The most common Sales and Office occupations in Sandy Hook are Sales & Related (45 | 31.7%), and Office & Administration (19 | 13.4%).
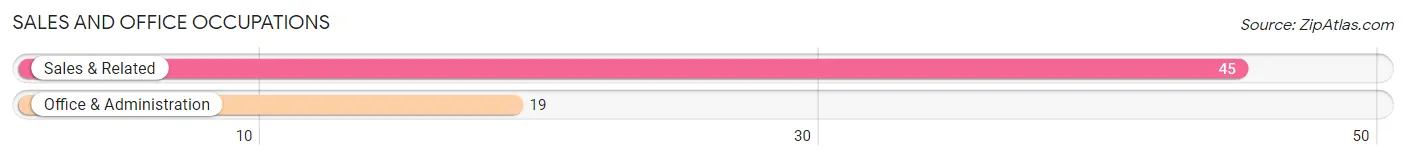
Sales and Office Occupations by Sex
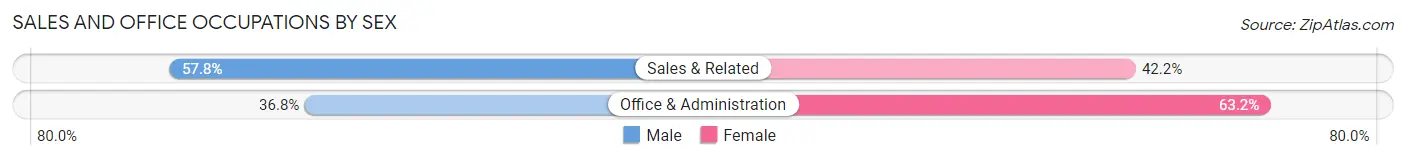
| Occupation | Male | Female |
| Sales & Related | 26 (57.8%) | 19 (42.2%) |
| Office & Administration | 7 (36.8%) | 12 (63.2%) |
| Total (Category) | 33 (51.6%) | 31 (48.4%) |
| Total (Overall) | 74 (52.1%) | 68 (47.9%) |
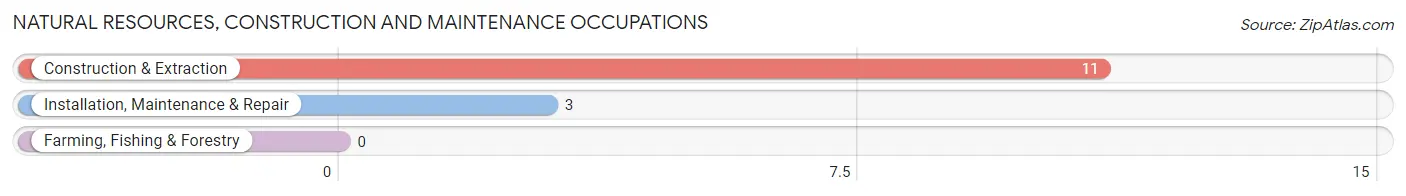
Natural Resources, Construction and Maintenance Occupations
The most common Natural Resources, Construction and Maintenance occupations in Sandy Hook are Construction & Extraction (11 | 7.7%), and Installation, Maintenance & Repair (3 | 2.1%).
Natural Resources, Construction and Maintenance Occupations by Sex
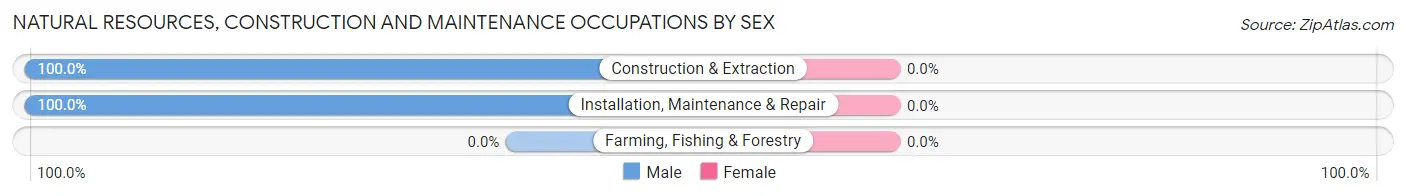
| Occupation | Male | Female |
| Farming, Fishing & Forestry | 0 (0.0%) | 0 (0.0%) |
| Construction & Extraction | 11 (100.0%) | 0 (0.0%) |
| Installation, Maintenance & Repair | 3 (100.0%) | 0 (0.0%) |
| Total (Category) | 14 (100.0%) | 0 (0.0%) |
| Total (Overall) | 74 (52.1%) | 68 (47.9%) |
Production, Transportation and Moving Occupations
The most common Production, Transportation and Moving occupations in Sandy Hook are Production (14 | 9.9%), and Material Moving (5 | 3.5%).
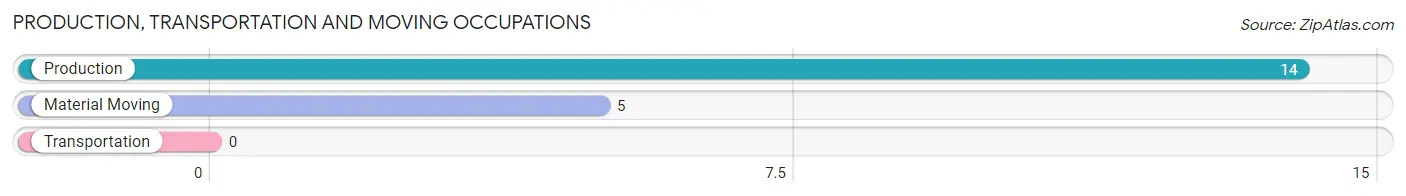
Production, Transportation and Moving Occupations by Sex
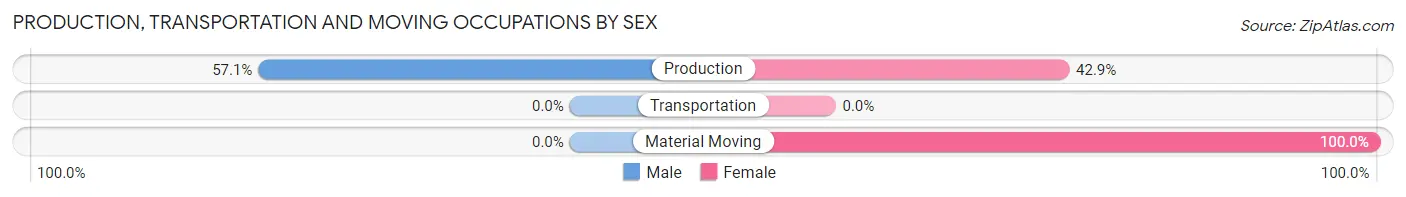
| Occupation | Male | Female |
| Production | 8 (57.1%) | 6 (42.9%) |
| Transportation | 0 (0.0%) | 0 (0.0%) |
| Material Moving | 0 (0.0%) | 5 (100.0%) |
| Total (Category) | 8 (42.1%) | 11 (57.9%) |
| Total (Overall) | 74 (52.1%) | 68 (47.9%) |
Employment Industries by Sex in Sandy Hook
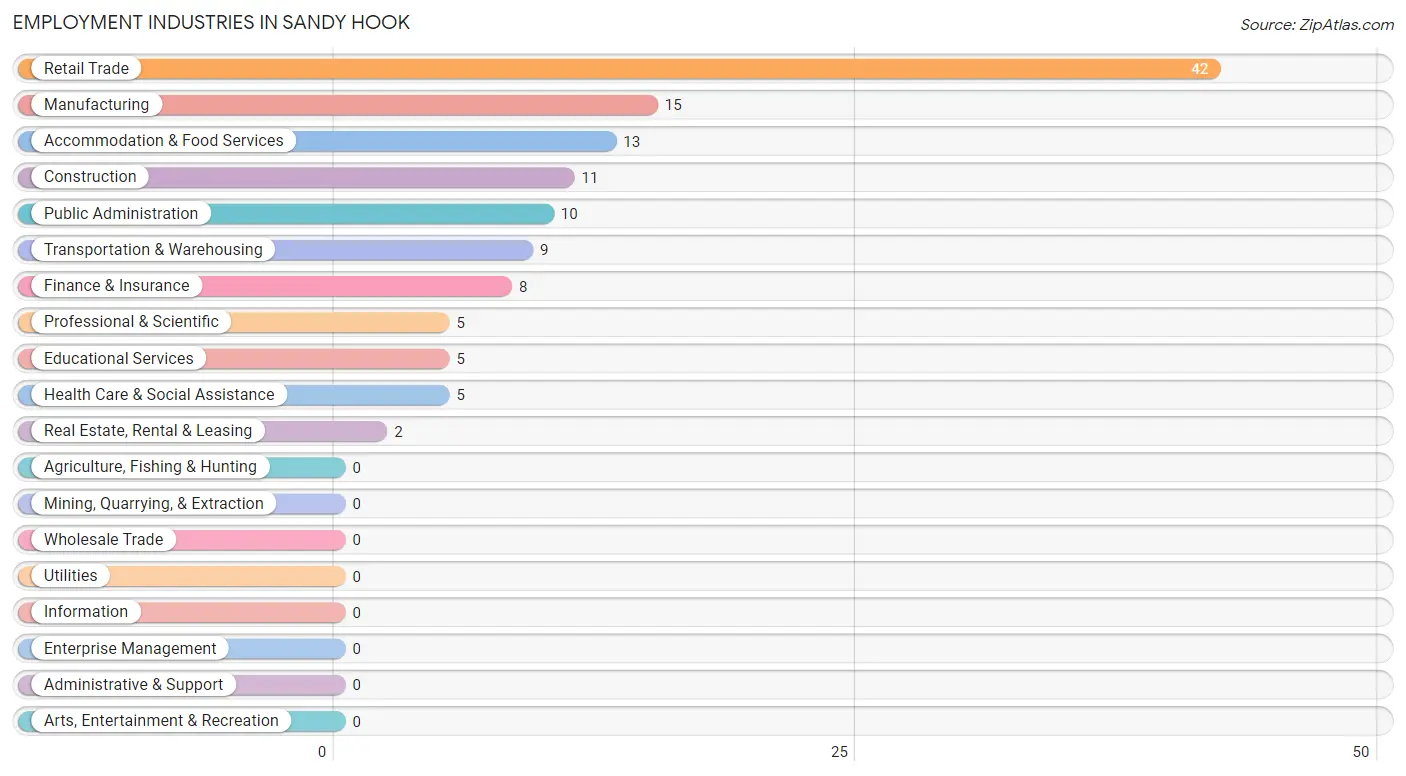
Employment Industries in Sandy Hook
The major employment industries in Sandy Hook include Retail Trade (42 | 29.6%), Manufacturing (15 | 10.6%), Accommodation & Food Services (13 | 9.1%), Construction (11 | 7.7%), and Public Administration (10 | 7.0%).
Employment Industries by Sex in Sandy Hook
The Sandy Hook industries that see more men than women are Construction (100.0%), Professional & Scientific (100.0%), and Public Administration (90.0%), whereas the industries that tend to have a higher number of women are Real Estate, Rental & Leasing (100.0%), Educational Services (100.0%), and Health Care & Social Assistance (100.0%).
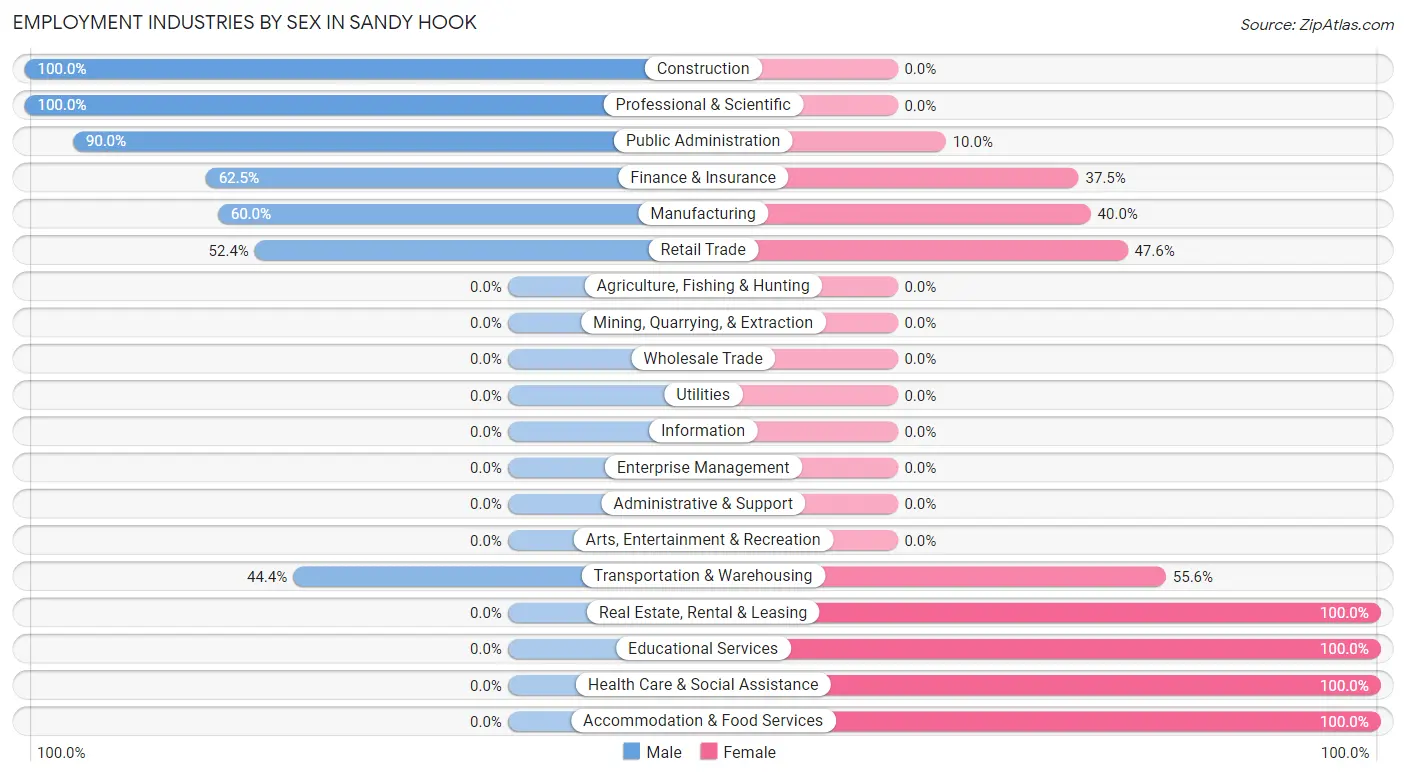
| Industry | Male | Female |
| Agriculture, Fishing & Hunting | 0 (0.0%) | 0 (0.0%) |
| Mining, Quarrying, & Extraction | 0 (0.0%) | 0 (0.0%) |
| Construction | 11 (100.0%) | 0 (0.0%) |
| Manufacturing | 9 (60.0%) | 6 (40.0%) |
| Wholesale Trade | 0 (0.0%) | 0 (0.0%) |
| Retail Trade | 22 (52.4%) | 20 (47.6%) |
| Transportation & Warehousing | 4 (44.4%) | 5 (55.6%) |
| Utilities | 0 (0.0%) | 0 (0.0%) |
| Information | 0 (0.0%) | 0 (0.0%) |
| Finance & Insurance | 5 (62.5%) | 3 (37.5%) |
| Real Estate, Rental & Leasing | 0 (0.0%) | 2 (100.0%) |
| Professional & Scientific | 5 (100.0%) | 0 (0.0%) |
| Enterprise Management | 0 (0.0%) | 0 (0.0%) |
| Administrative & Support | 0 (0.0%) | 0 (0.0%) |
| Educational Services | 0 (0.0%) | 5 (100.0%) |
| Health Care & Social Assistance | 0 (0.0%) | 5 (100.0%) |
| Arts, Entertainment & Recreation | 0 (0.0%) | 0 (0.0%) |
| Accommodation & Food Services | 0 (0.0%) | 13 (100.0%) |
| Public Administration | 9 (90.0%) | 1 (10.0%) |
| Total | 74 (52.1%) | 68 (47.9%) |
Education in Sandy Hook
School Enrollment in Sandy Hook
The most common levels of schooling among the 149 students in Sandy Hook are high school (62 | 41.6%), middle school (46 | 30.9%), and elementary school (24 | 16.1%).
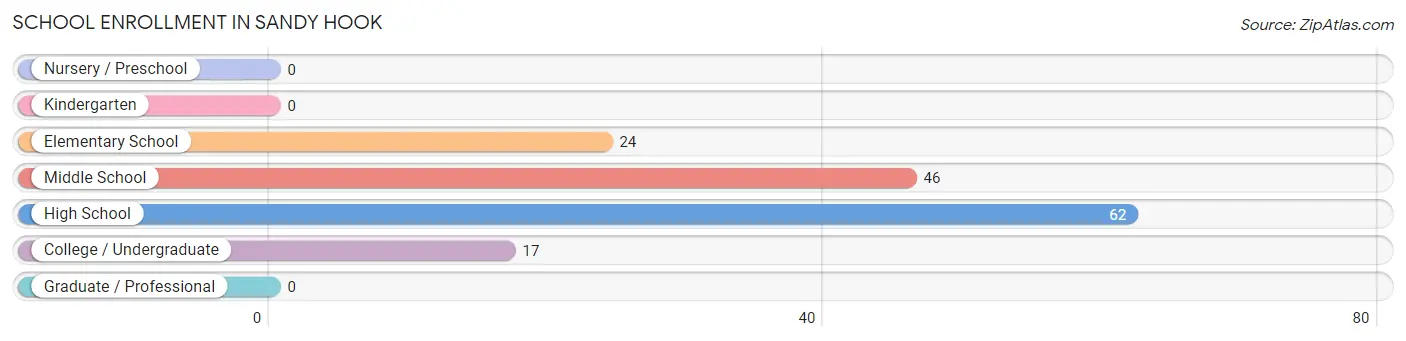
| School Level | # Students | % Students |
| Nursery / Preschool | 0 | 0.0% |
| Kindergarten | 0 | 0.0% |
| Elementary School | 24 | 16.1% |
| Middle School | 46 | 30.9% |
| High School | 62 | 41.6% |
| College / Undergraduate | 17 | 11.4% |
| Graduate / Professional | 0 | 0.0% |
| Total | 149 | 100.0% |
School Enrollment by Age by Funding Source in Sandy Hook
Out of a total of 149 students who are enrolled in schools in Sandy Hook, 8 (5.4%) attend a private institution, while the remaining 141 (94.6%) are enrolled in public schools. The age group of 35 years and over has the highest likelihood of being enrolled in private schools, with 2 (100.0% in the age bracket) enrolled. Conversely, the age group of 5 to 9 year old has the lowest likelihood of being enrolled in a private school, with 24 (100.0% in the age bracket) attending a public institution.
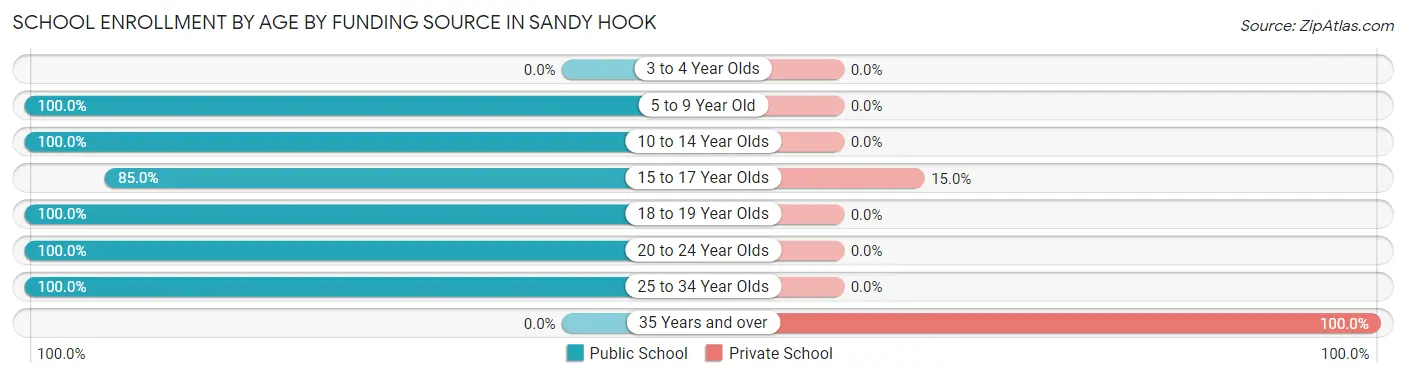
| Age Bracket | Public School | Private School |
| 3 to 4 Year Olds | 0 (0.0%) | 0 (0.0%) |
| 5 to 9 Year Old | 24 (100.0%) | 0 (0.0%) |
| 10 to 14 Year Olds | 46 (100.0%) | 0 (0.0%) |
| 15 to 17 Year Olds | 34 (85.0%) | 6 (15.0%) |
| 18 to 19 Year Olds | 22 (100.0%) | 0 (0.0%) |
| 20 to 24 Year Olds | 12 (100.0%) | 0 (0.0%) |
| 25 to 34 Year Olds | 3 (100.0%) | 0 (0.0%) |
| 35 Years and over | 0 (0.0%) | 2 (100.0%) |
| Total | 141 (94.6%) | 8 (5.4%) |
Educational Attainment by Field of Study in Sandy Hook
Education (17 | 44.7%), physical & health sciences (9 | 23.7%), science & technology (6 | 15.8%), psychology (4 | 10.5%), and visual & performing arts (2 | 5.3%) are the most common fields of study among 38 individuals in Sandy Hook who have obtained a bachelor's degree or higher.
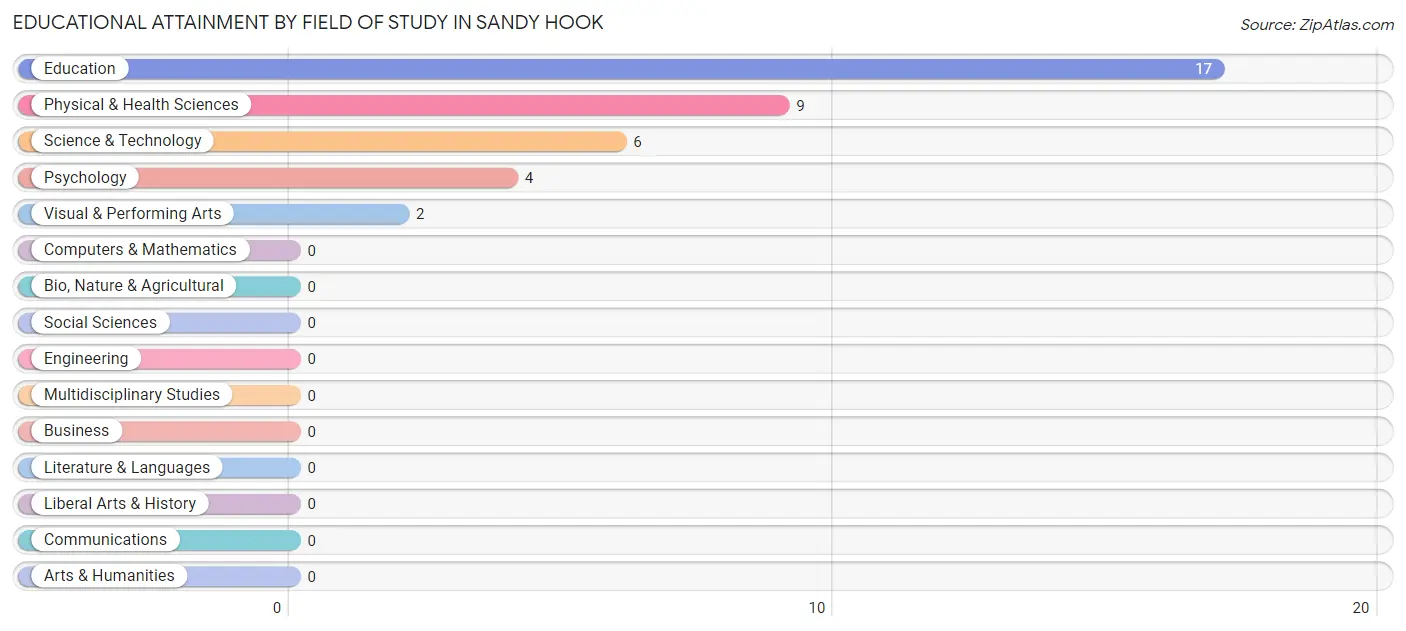
| Field of Study | # Graduates | % Graduates |
| Computers & Mathematics | 0 | 0.0% |
| Bio, Nature & Agricultural | 0 | 0.0% |
| Physical & Health Sciences | 9 | 23.7% |
| Psychology | 4 | 10.5% |
| Social Sciences | 0 | 0.0% |
| Engineering | 0 | 0.0% |
| Multidisciplinary Studies | 0 | 0.0% |
| Science & Technology | 6 | 15.8% |
| Business | 0 | 0.0% |
| Education | 17 | 44.7% |
| Literature & Languages | 0 | 0.0% |
| Liberal Arts & History | 0 | 0.0% |
| Visual & Performing Arts | 2 | 5.3% |
| Communications | 0 | 0.0% |
| Arts & Humanities | 0 | 0.0% |
| Total | 38 | 100.0% |
Transportation & Commute in Sandy Hook
Vehicle Availability by Sex in Sandy Hook
The most prevalent vehicle ownership categories in Sandy Hook are males with 2 vehicles (23, accounting for 32.9%) and females with 2 vehicles (30, making up 33.8%).
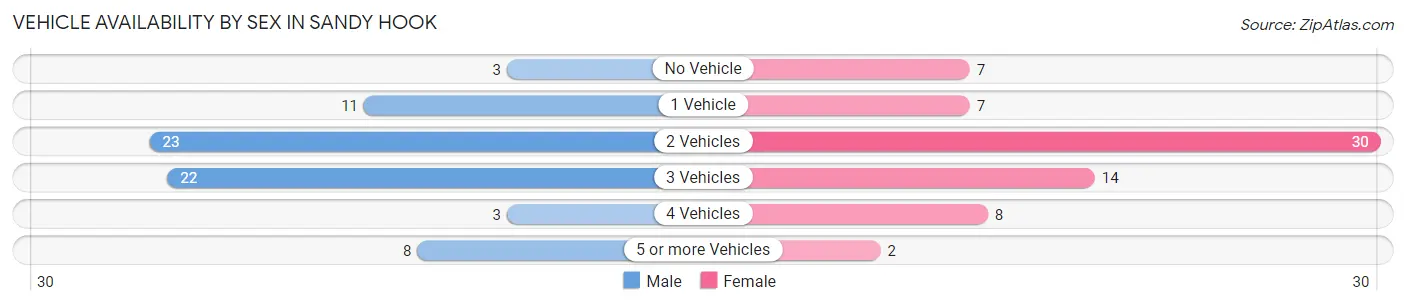
| Vehicles Available | Male | Female |
| No Vehicle | 3 (4.3%) | 7 (10.3%) |
| 1 Vehicle | 11 (15.7%) | 7 (10.3%) |
| 2 Vehicles | 23 (32.9%) | 30 (44.1%) |
| 3 Vehicles | 22 (31.4%) | 14 (20.6%) |
| 4 Vehicles | 3 (4.3%) | 8 (11.8%) |
| 5 or more Vehicles | 8 (11.4%) | 2 (2.9%) |
| Total | 70 (100.0%) | 68 (100.0%) |
Commute Time in Sandy Hook
The most frequently occuring commute durations in Sandy Hook are less than 5 minutes (41 commuters, 33.6%), 5 to 9 minutes (31 commuters, 25.4%), and 60 to 89 minutes (17 commuters, 13.9%).
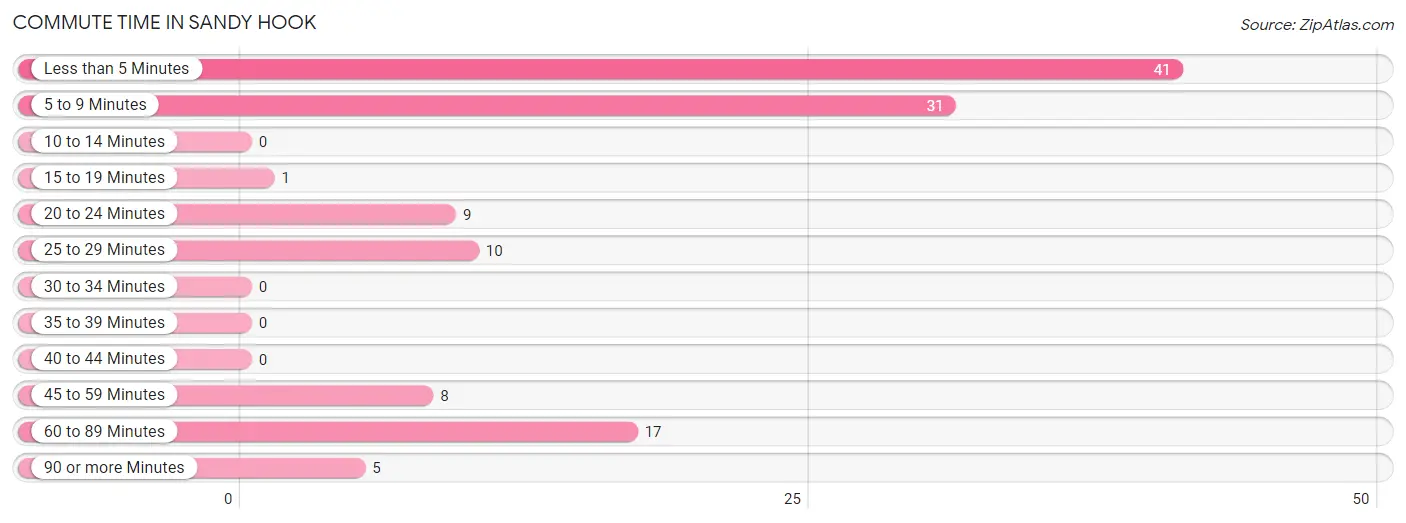
| Commute Time | # Commuters | % Commuters |
| Less than 5 Minutes | 41 | 33.6% |
| 5 to 9 Minutes | 31 | 25.4% |
| 10 to 14 Minutes | 0 | 0.0% |
| 15 to 19 Minutes | 1 | 0.8% |
| 20 to 24 Minutes | 9 | 7.4% |
| 25 to 29 Minutes | 10 | 8.2% |
| 30 to 34 Minutes | 0 | 0.0% |
| 35 to 39 Minutes | 0 | 0.0% |
| 40 to 44 Minutes | 0 | 0.0% |
| 45 to 59 Minutes | 8 | 6.6% |
| 60 to 89 Minutes | 17 | 13.9% |
| 90 or more Minutes | 5 | 4.1% |
Commute Time by Sex in Sandy Hook
The most common commute times in Sandy Hook are 5 to 9 minutes (26 commuters, 42.6%) for males and less than 5 minutes (35 commuters, 57.4%) for females.
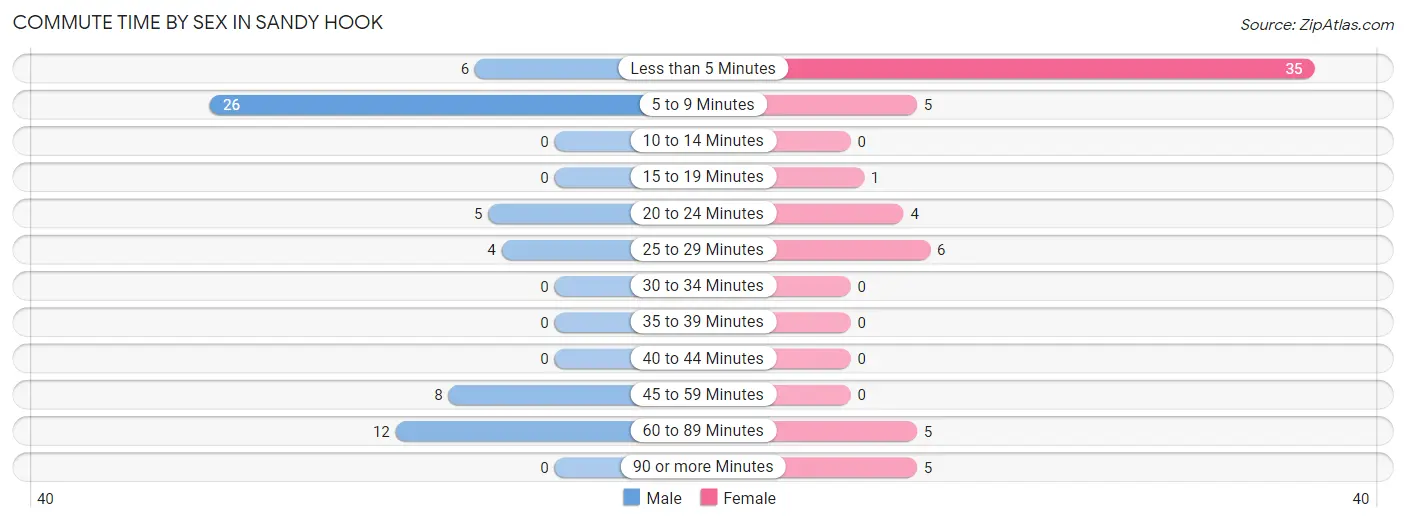
| Commute Time | Male | Female |
| Less than 5 Minutes | 6 (9.8%) | 35 (57.4%) |
| 5 to 9 Minutes | 26 (42.6%) | 5 (8.2%) |
| 10 to 14 Minutes | 0 (0.0%) | 0 (0.0%) |
| 15 to 19 Minutes | 0 (0.0%) | 1 (1.6%) |
| 20 to 24 Minutes | 5 (8.2%) | 4 (6.6%) |
| 25 to 29 Minutes | 4 (6.6%) | 6 (9.8%) |
| 30 to 34 Minutes | 0 (0.0%) | 0 (0.0%) |
| 35 to 39 Minutes | 0 (0.0%) | 0 (0.0%) |
| 40 to 44 Minutes | 0 (0.0%) | 0 (0.0%) |
| 45 to 59 Minutes | 8 (13.1%) | 0 (0.0%) |
| 60 to 89 Minutes | 12 (19.7%) | 5 (8.2%) |
| 90 or more Minutes | 0 (0.0%) | 5 (8.2%) |
Time of Departure to Work by Sex in Sandy Hook
The most frequent times of departure to work in Sandy Hook are 9:00 AM to 9:59 AM (25, 41.0%) for males and 12:00 PM to 3:59 PM (16, 26.2%) for females.
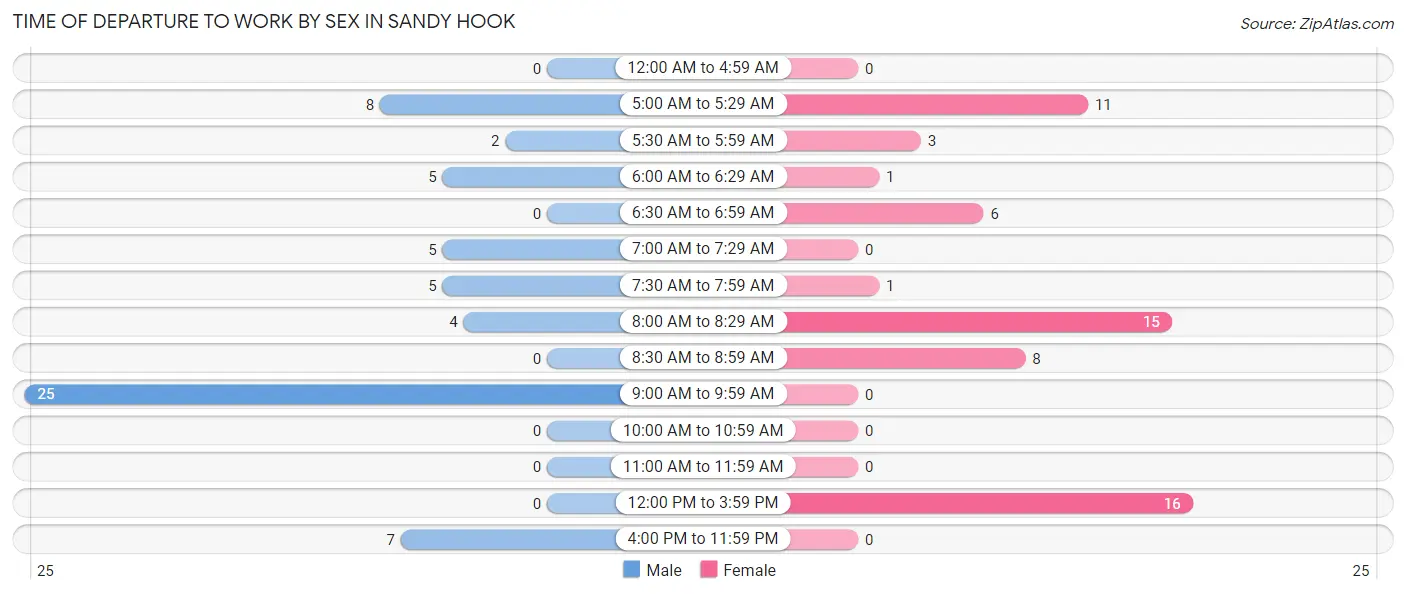
| Time of Departure | Male | Female |
| 12:00 AM to 4:59 AM | 0 (0.0%) | 0 (0.0%) |
| 5:00 AM to 5:29 AM | 8 (13.1%) | 11 (18.0%) |
| 5:30 AM to 5:59 AM | 2 (3.3%) | 3 (4.9%) |
| 6:00 AM to 6:29 AM | 5 (8.2%) | 1 (1.6%) |
| 6:30 AM to 6:59 AM | 0 (0.0%) | 6 (9.8%) |
| 7:00 AM to 7:29 AM | 5 (8.2%) | 0 (0.0%) |
| 7:30 AM to 7:59 AM | 5 (8.2%) | 1 (1.6%) |
| 8:00 AM to 8:29 AM | 4 (6.6%) | 15 (24.6%) |
| 8:30 AM to 8:59 AM | 0 (0.0%) | 8 (13.1%) |
| 9:00 AM to 9:59 AM | 25 (41.0%) | 0 (0.0%) |
| 10:00 AM to 10:59 AM | 0 (0.0%) | 0 (0.0%) |
| 11:00 AM to 11:59 AM | 0 (0.0%) | 0 (0.0%) |
| 12:00 PM to 3:59 PM | 0 (0.0%) | 16 (26.2%) |
| 4:00 PM to 11:59 PM | 7 (11.5%) | 0 (0.0%) |
| Total | 61 (100.0%) | 61 (100.0%) |
Housing Occupancy in Sandy Hook
Occupancy by Ownership in Sandy Hook
Of the total 263 dwellings in Sandy Hook, owner-occupied units account for 120 (45.6%), while renter-occupied units make up 143 (54.4%).
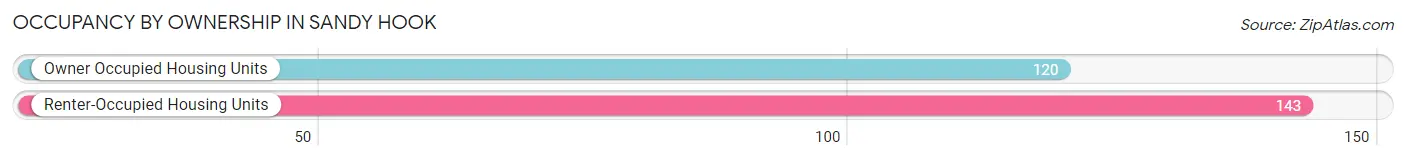
| Occupancy | # Housing Units | % Housing Units |
| Owner Occupied Housing Units | 120 | 45.6% |
| Renter-Occupied Housing Units | 143 | 54.4% |
| Total Occupied Housing Units | 263 | 100.0% |
Occupancy by Household Size in Sandy Hook
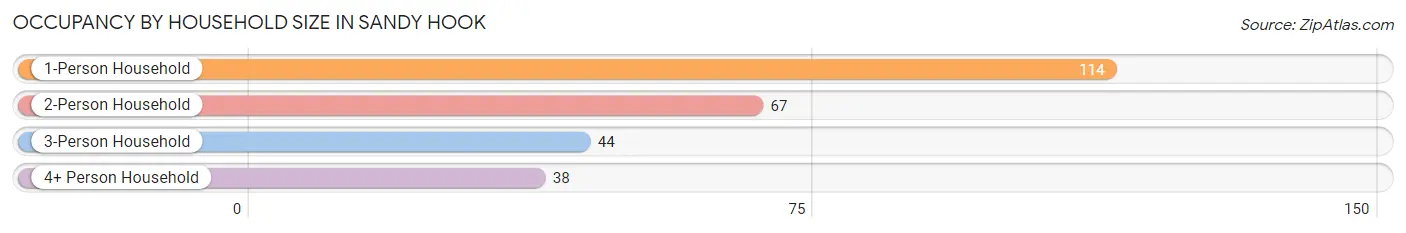
| Household Size | # Housing Units | % Housing Units |
| 1-Person Household | 114 | 43.3% |
| 2-Person Household | 67 | 25.5% |
| 3-Person Household | 44 | 16.7% |
| 4+ Person Household | 38 | 14.4% |
| Total Housing Units | 263 | 100.0% |
Occupancy by Ownership by Household Size in Sandy Hook
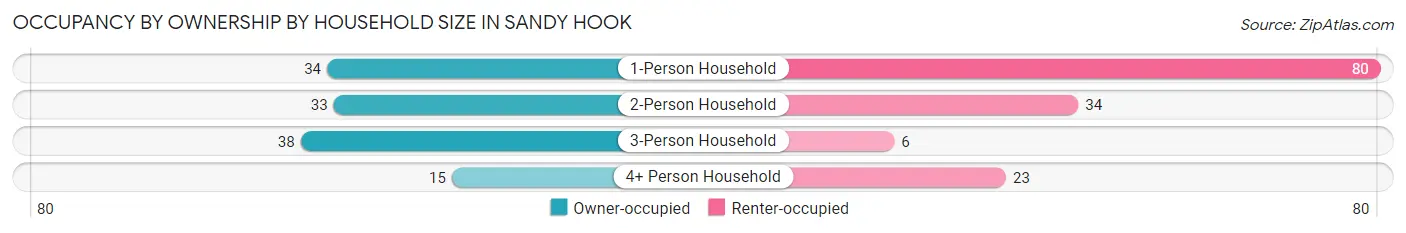
| Household Size | Owner-occupied | Renter-occupied |
| 1-Person Household | 34 (29.8%) | 80 (70.2%) |
| 2-Person Household | 33 (49.2%) | 34 (50.7%) |
| 3-Person Household | 38 (86.4%) | 6 (13.6%) |
| 4+ Person Household | 15 (39.5%) | 23 (60.5%) |
| Total Housing Units | 120 (45.6%) | 143 (54.4%) |
Occupancy by Educational Attainment in Sandy Hook
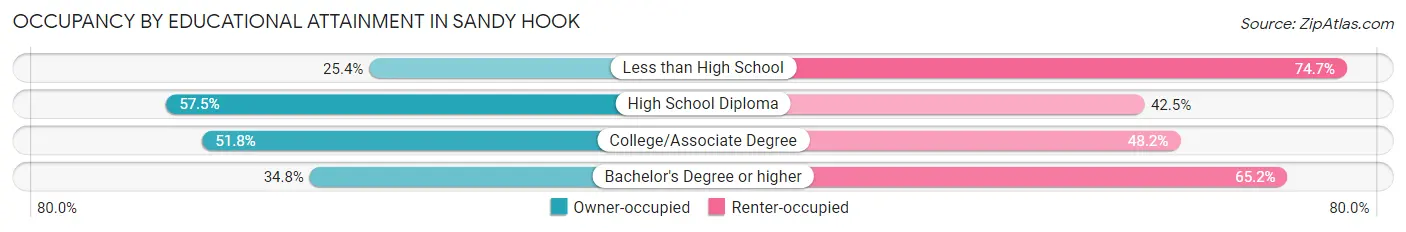
| Household Size | Owner-occupied | Renter-occupied |
| Less than High School | 18 (25.4%) | 53 (74.7%) |
| High School Diploma | 65 (57.5%) | 48 (42.5%) |
| College/Associate Degree | 29 (51.8%) | 27 (48.2%) |
| Bachelor's Degree or higher | 8 (34.8%) | 15 (65.2%) |
Occupancy by Age of Householder in Sandy Hook
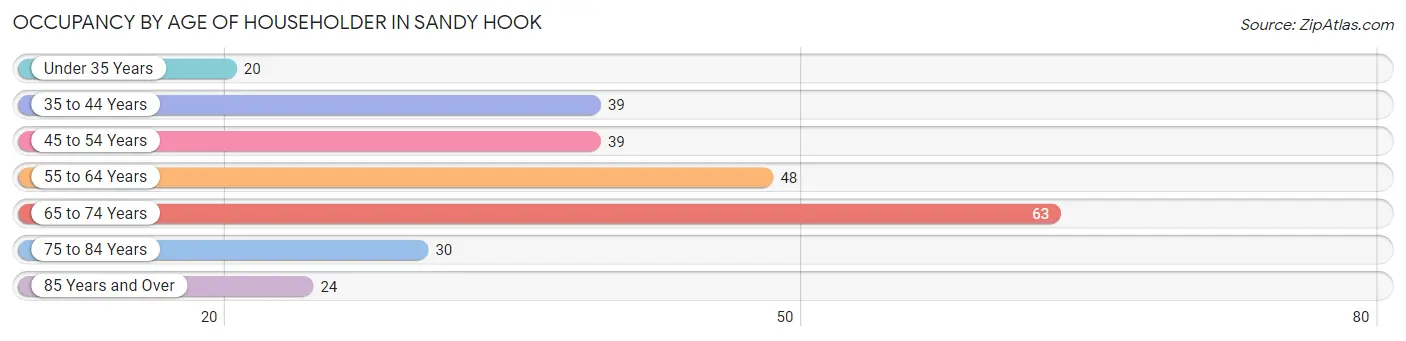
| Age Bracket | # Households | % Households |
| Under 35 Years | 20 | 7.6% |
| 35 to 44 Years | 39 | 14.8% |
| 45 to 54 Years | 39 | 14.8% |
| 55 to 64 Years | 48 | 18.2% |
| 65 to 74 Years | 63 | 23.9% |
| 75 to 84 Years | 30 | 11.4% |
| 85 Years and Over | 24 | 9.1% |
| Total | 263 | 100.0% |
Housing Finances in Sandy Hook
Median Income by Occupancy in Sandy Hook
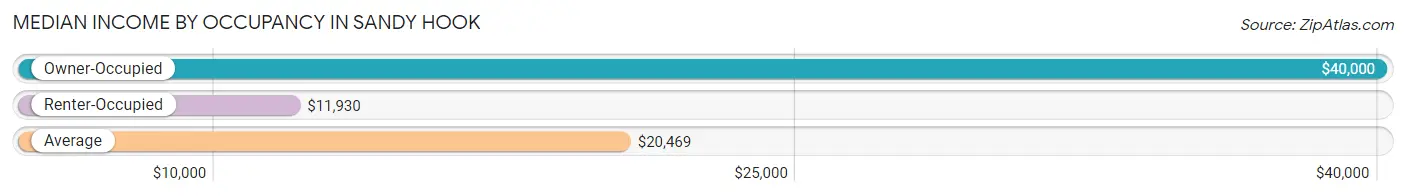
| Occupancy Type | # Households | Median Income |
| Owner-Occupied | 120 (45.6%) | $40,000 |
| Renter-Occupied | 143 (54.4%) | $11,930 |
| Average | 263 (100.0%) | $20,469 |
Occupancy by Householder Income Bracket in Sandy Hook
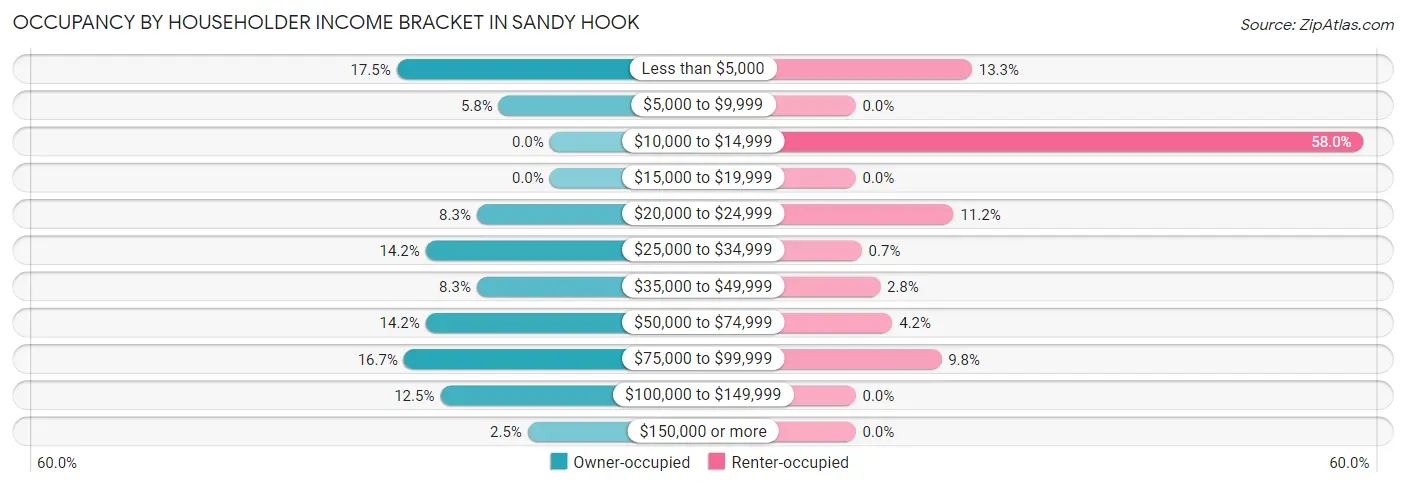
| Income Bracket | Owner-occupied | Renter-occupied |
| Less than $5,000 | 21 (17.5%) | 19 (13.3%) |
| $5,000 to $9,999 | 7 (5.8%) | 0 (0.0%) |
| $10,000 to $14,999 | 0 (0.0%) | 83 (58.0%) |
| $15,000 to $19,999 | 0 (0.0%) | 0 (0.0%) |
| $20,000 to $24,999 | 10 (8.3%) | 16 (11.2%) |
| $25,000 to $34,999 | 17 (14.2%) | 1 (0.7%) |
| $35,000 to $49,999 | 10 (8.3%) | 4 (2.8%) |
| $50,000 to $74,999 | 17 (14.2%) | 6 (4.2%) |
| $75,000 to $99,999 | 20 (16.7%) | 14 (9.8%) |
| $100,000 to $149,999 | 15 (12.5%) | 0 (0.0%) |
| $150,000 or more | 3 (2.5%) | 0 (0.0%) |
| Total | 120 (100.0%) | 143 (100.0%) |
Monthly Housing Cost Tiers in Sandy Hook
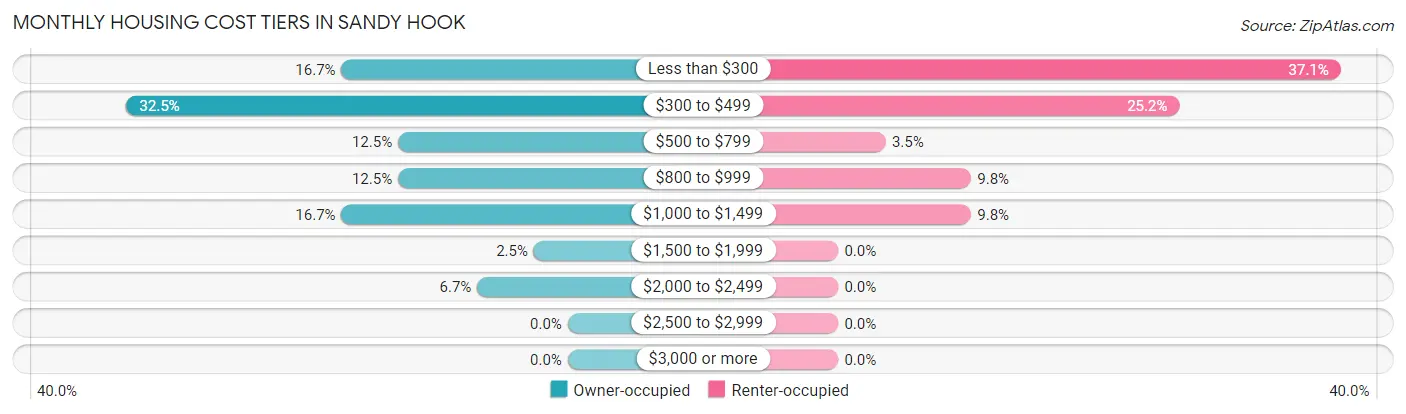
| Monthly Cost | Owner-occupied | Renter-occupied |
| Less than $300 | 20 (16.7%) | 53 (37.1%) |
| $300 to $499 | 39 (32.5%) | 36 (25.2%) |
| $500 to $799 | 15 (12.5%) | 5 (3.5%) |
| $800 to $999 | 15 (12.5%) | 14 (9.8%) |
| $1,000 to $1,499 | 20 (16.7%) | 14 (9.8%) |
| $1,500 to $1,999 | 3 (2.5%) | 0 (0.0%) |
| $2,000 to $2,499 | 8 (6.7%) | 0 (0.0%) |
| $2,500 to $2,999 | 0 (0.0%) | 0 (0.0%) |
| $3,000 or more | 0 (0.0%) | 0 (0.0%) |
| Total | 120 (100.0%) | 143 (100.0%) |
Physical Housing Characteristics in Sandy Hook
Housing Structures in Sandy Hook
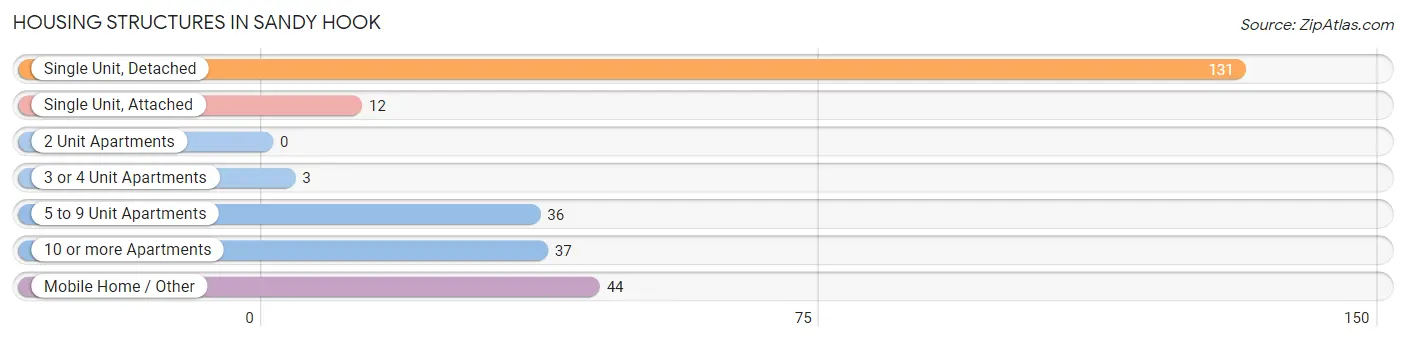
| Structure Type | # Housing Units | % Housing Units |
| Single Unit, Detached | 131 | 49.8% |
| Single Unit, Attached | 12 | 4.6% |
| 2 Unit Apartments | 0 | 0.0% |
| 3 or 4 Unit Apartments | 3 | 1.1% |
| 5 to 9 Unit Apartments | 36 | 13.7% |
| 10 or more Apartments | 37 | 14.1% |
| Mobile Home / Other | 44 | 16.7% |
| Total | 263 | 100.0% |
Housing Structures by Occupancy in Sandy Hook
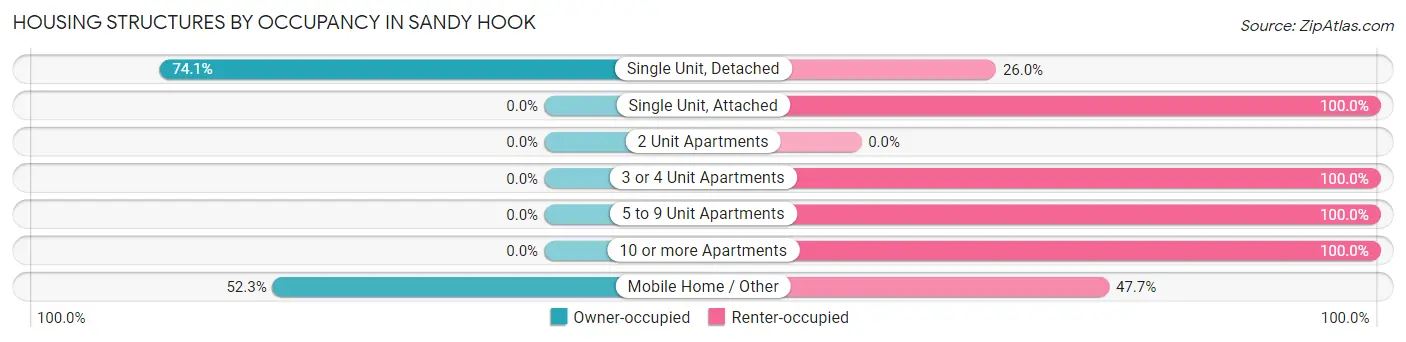
| Structure Type | Owner-occupied | Renter-occupied |
| Single Unit, Detached | 97 (74.1%) | 34 (26.0%) |
| Single Unit, Attached | 0 (0.0%) | 12 (100.0%) |
| 2 Unit Apartments | 0 (0.0%) | 0 (0.0%) |
| 3 or 4 Unit Apartments | 0 (0.0%) | 3 (100.0%) |
| 5 to 9 Unit Apartments | 0 (0.0%) | 36 (100.0%) |
| 10 or more Apartments | 0 (0.0%) | 37 (100.0%) |
| Mobile Home / Other | 23 (52.3%) | 21 (47.7%) |
| Total | 120 (45.6%) | 143 (54.4%) |
Housing Structures by Number of Rooms in Sandy Hook
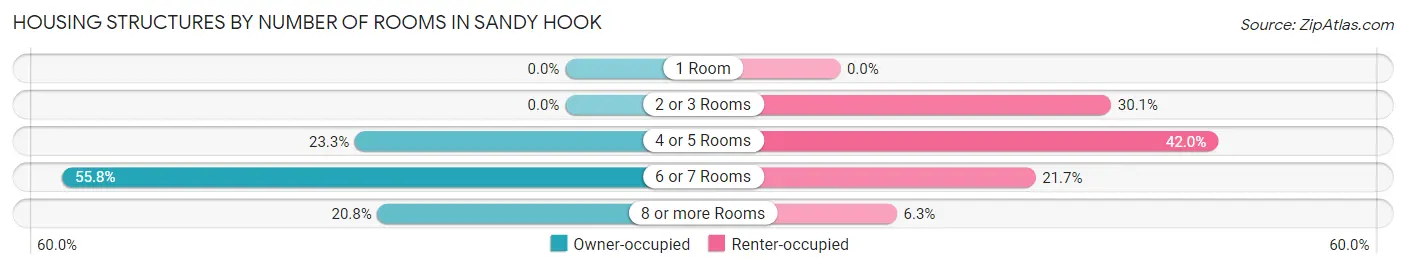
| Number of Rooms | Owner-occupied | Renter-occupied |
| 1 Room | 0 (0.0%) | 0 (0.0%) |
| 2 or 3 Rooms | 0 (0.0%) | 43 (30.1%) |
| 4 or 5 Rooms | 28 (23.3%) | 60 (42.0%) |
| 6 or 7 Rooms | 67 (55.8%) | 31 (21.7%) |
| 8 or more Rooms | 25 (20.8%) | 9 (6.3%) |
| Total | 120 (100.0%) | 143 (100.0%) |
Housing Structure by Heating Type in Sandy Hook
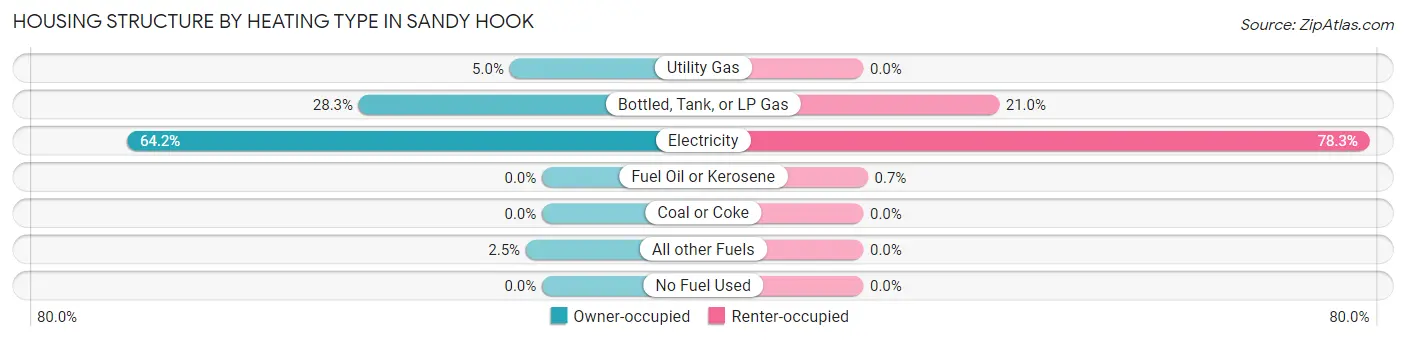
| Heating Type | Owner-occupied | Renter-occupied |
| Utility Gas | 6 (5.0%) | 0 (0.0%) |
| Bottled, Tank, or LP Gas | 34 (28.3%) | 30 (21.0%) |
| Electricity | 77 (64.2%) | 112 (78.3%) |
| Fuel Oil or Kerosene | 0 (0.0%) | 1 (0.7%) |
| Coal or Coke | 0 (0.0%) | 0 (0.0%) |
| All other Fuels | 3 (2.5%) | 0 (0.0%) |
| No Fuel Used | 0 (0.0%) | 0 (0.0%) |
| Total | 120 (100.0%) | 143 (100.0%) |
Household Vehicle Usage in Sandy Hook
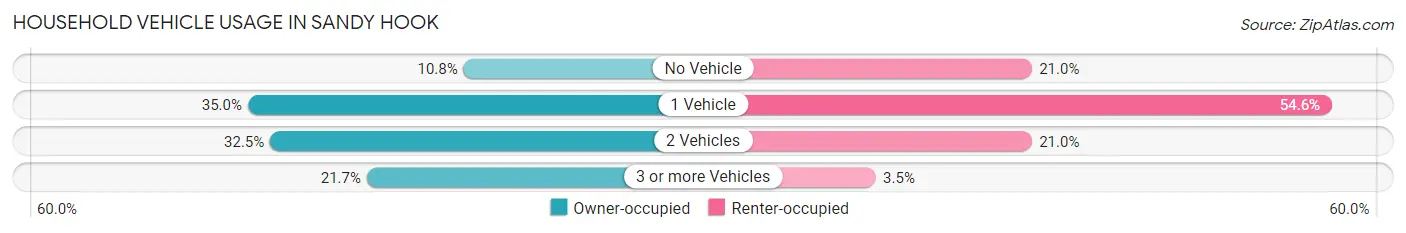
| Vehicles per Household | Owner-occupied | Renter-occupied |
| No Vehicle | 13 (10.8%) | 30 (21.0%) |
| 1 Vehicle | 42 (35.0%) | 78 (54.5%) |
| 2 Vehicles | 39 (32.5%) | 30 (21.0%) |
| 3 or more Vehicles | 26 (21.7%) | 5 (3.5%) |
| Total | 120 (100.0%) | 143 (100.0%) |
Real Estate & Mortgages in Sandy Hook
Real Estate and Mortgage Overview in Sandy Hook
| Characteristic | Without Mortgage | With Mortgage |
| Housing Units | 71 | 49 |
| Median Property Value | - | - |
| Median Household Income | $31,607 | $0 |
| Monthly Housing Costs | $334 | $0 |
| Real Estate Taxes | $478 | $0 |
Property Value by Mortgage Status in Sandy Hook
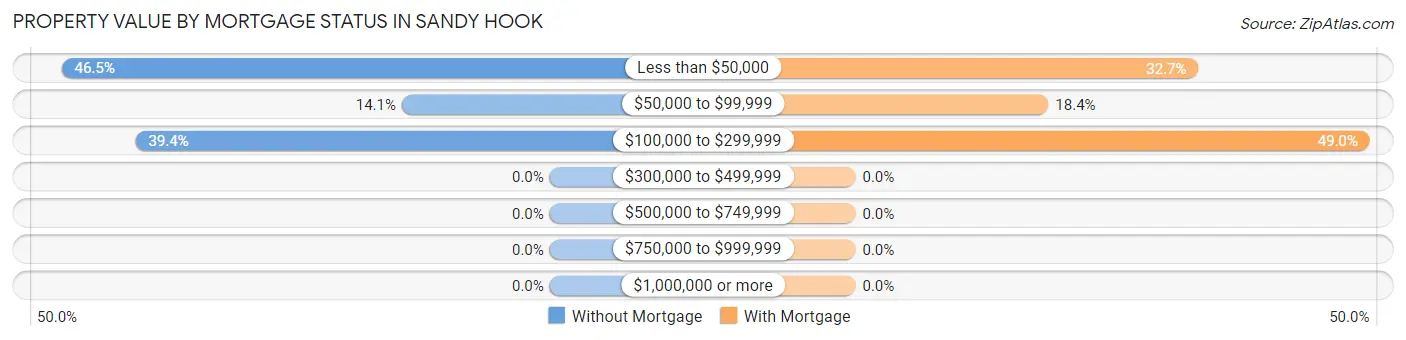
| Property Value | Without Mortgage | With Mortgage |
| Less than $50,000 | 33 (46.5%) | 16 (32.7%) |
| $50,000 to $99,999 | 10 (14.1%) | 9 (18.4%) |
| $100,000 to $299,999 | 28 (39.4%) | 24 (49.0%) |
| $300,000 to $499,999 | 0 (0.0%) | 0 (0.0%) |
| $500,000 to $749,999 | 0 (0.0%) | 0 (0.0%) |
| $750,000 to $999,999 | 0 (0.0%) | 0 (0.0%) |
| $1,000,000 or more | 0 (0.0%) | 0 (0.0%) |
| Total | 71 (100.0%) | 49 (100.0%) |
Household Income by Mortgage Status in Sandy Hook
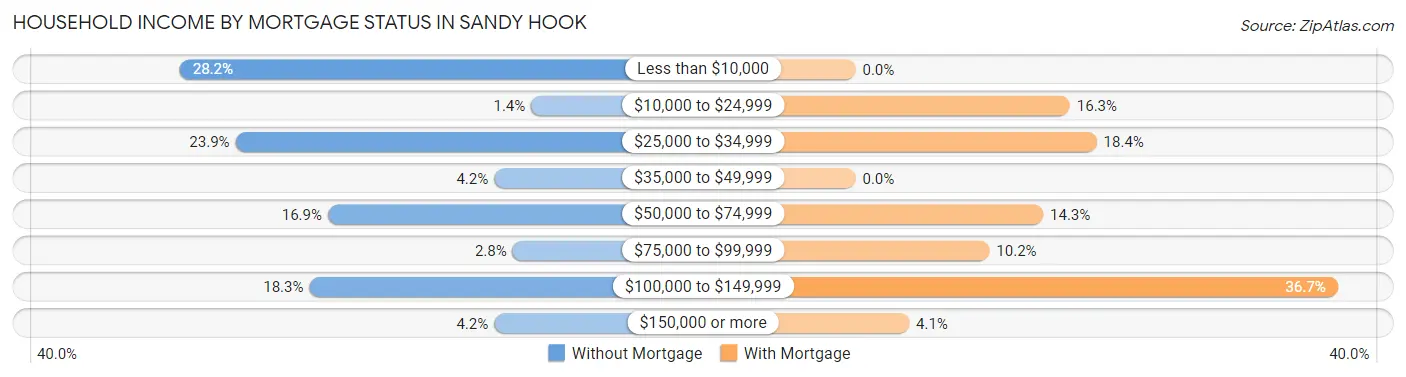
| Household Income | Without Mortgage | With Mortgage |
| Less than $10,000 | 20 (28.2%) | 0 (0.0%) |
| $10,000 to $24,999 | 1 (1.4%) | 8 (16.3%) |
| $25,000 to $34,999 | 17 (23.9%) | 9 (18.4%) |
| $35,000 to $49,999 | 3 (4.2%) | 0 (0.0%) |
| $50,000 to $74,999 | 12 (16.9%) | 7 (14.3%) |
| $75,000 to $99,999 | 2 (2.8%) | 5 (10.2%) |
| $100,000 to $149,999 | 13 (18.3%) | 18 (36.7%) |
| $150,000 or more | 3 (4.2%) | 2 (4.1%) |
| Total | 71 (100.0%) | 49 (100.0%) |
Property Value to Household Income Ratio in Sandy Hook
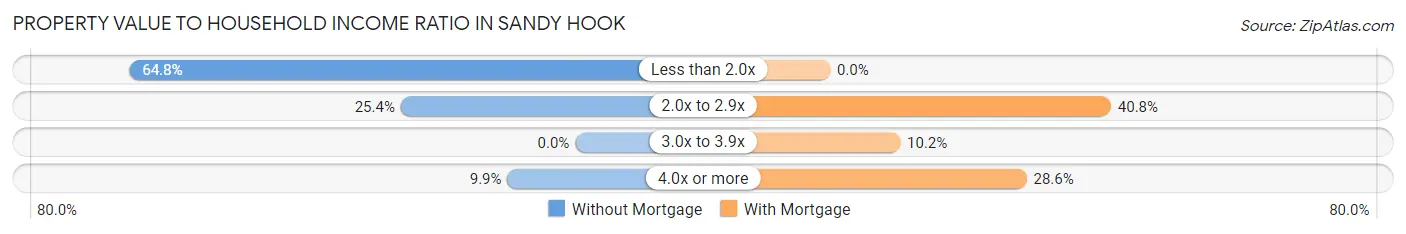
| Value-to-Income Ratio | Without Mortgage | With Mortgage |
| Less than 2.0x | 46 (64.8%) | 0 (0.0%) |
| 2.0x to 2.9x | 18 (25.4%) | 20 (40.8%) |
| 3.0x to 3.9x | 0 (0.0%) | 5 (10.2%) |
| 4.0x or more | 7 (9.9%) | 14 (28.6%) |
| Total | 71 (100.0%) | 49 (100.0%) |
Real Estate Taxes by Mortgage Status in Sandy Hook
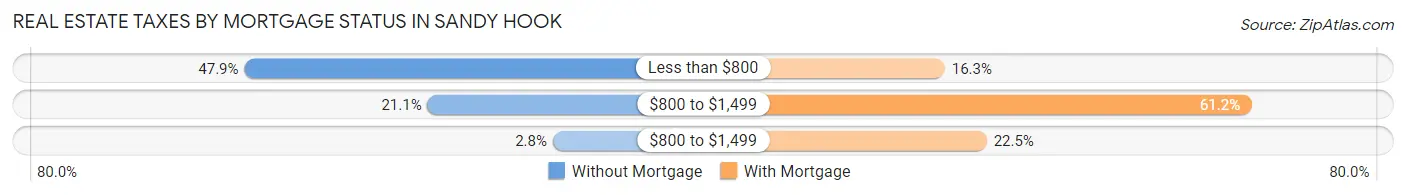
| Property Taxes | Without Mortgage | With Mortgage |
| Less than $800 | 34 (47.9%) | 8 (16.3%) |
| $800 to $1,499 | 15 (21.1%) | 30 (61.2%) |
| $800 to $1,499 | 2 (2.8%) | 11 (22.5%) |
| Total | 71 (100.0%) | 49 (100.0%) |
Health & Disability in Sandy Hook
Health Insurance Coverage by Age in Sandy Hook
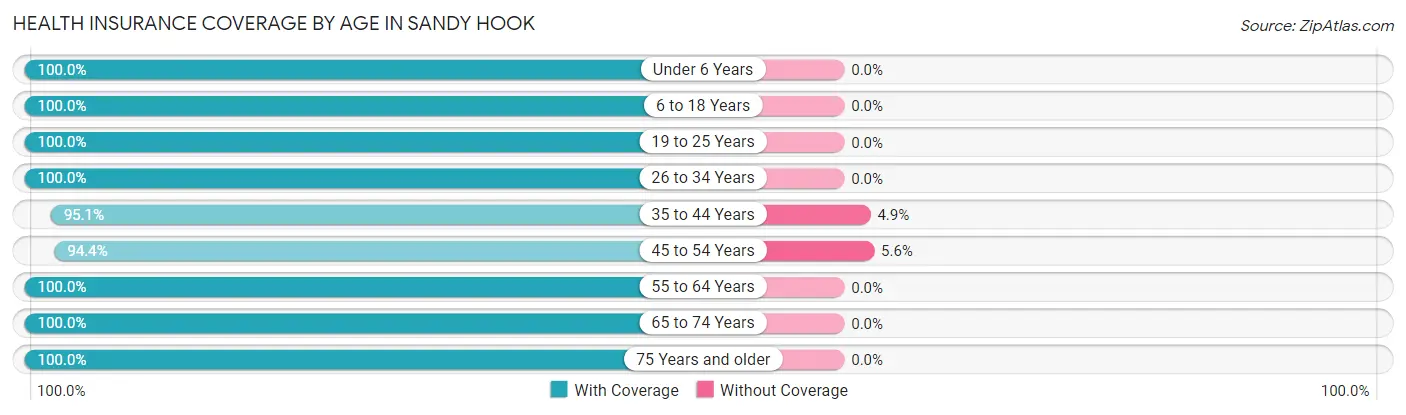
| Age Bracket | With Coverage | Without Coverage |
| Under 6 Years | 41 (100.0%) | 0 (0.0%) |
| 6 to 18 Years | 159 (100.0%) | 0 (0.0%) |
| 19 to 25 Years | 47 (100.0%) | 0 (0.0%) |
| 26 to 34 Years | 35 (100.0%) | 0 (0.0%) |
| 35 to 44 Years | 78 (95.1%) | 4 (4.9%) |
| 45 to 54 Years | 51 (94.4%) | 3 (5.6%) |
| 55 to 64 Years | 78 (100.0%) | 0 (0.0%) |
| 65 to 74 Years | 84 (100.0%) | 0 (0.0%) |
| 75 Years and older | 58 (100.0%) | 0 (0.0%) |
| Total | 631 (98.9%) | 7 (1.1%) |
Health Insurance Coverage by Citizenship Status in Sandy Hook
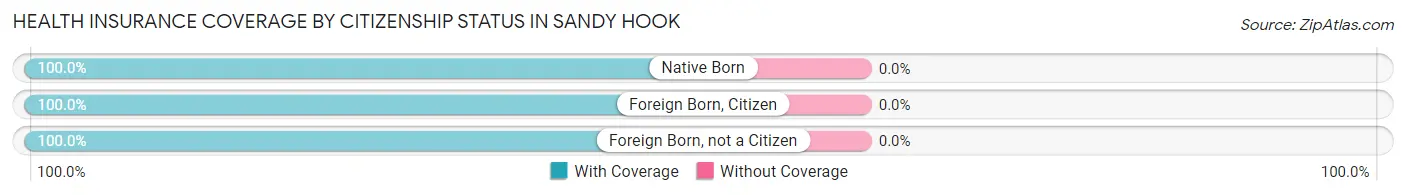
| Citizenship Status | With Coverage | Without Coverage |
| Native Born | 41 (100.0%) | 0 (0.0%) |
| Foreign Born, Citizen | 159 (100.0%) | 0 (0.0%) |
| Foreign Born, not a Citizen | 47 (100.0%) | 0 (0.0%) |
Health Insurance Coverage by Household Income in Sandy Hook
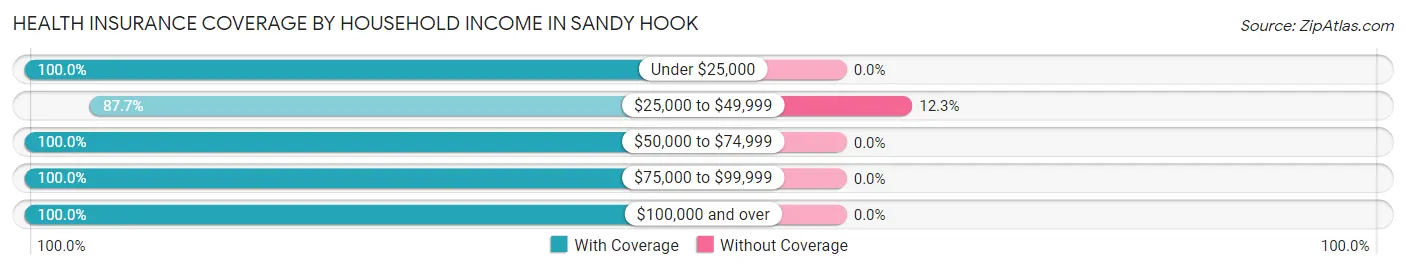
| Household Income | With Coverage | Without Coverage |
| Under $25,000 | 372 (100.0%) | 0 (0.0%) |
| $25,000 to $49,999 | 50 (87.7%) | 7 (12.3%) |
| $50,000 to $74,999 | 50 (100.0%) | 0 (0.0%) |
| $75,000 to $99,999 | 98 (100.0%) | 0 (0.0%) |
| $100,000 and over | 61 (100.0%) | 0 (0.0%) |
Public vs Private Health Insurance Coverage by Age in Sandy Hook
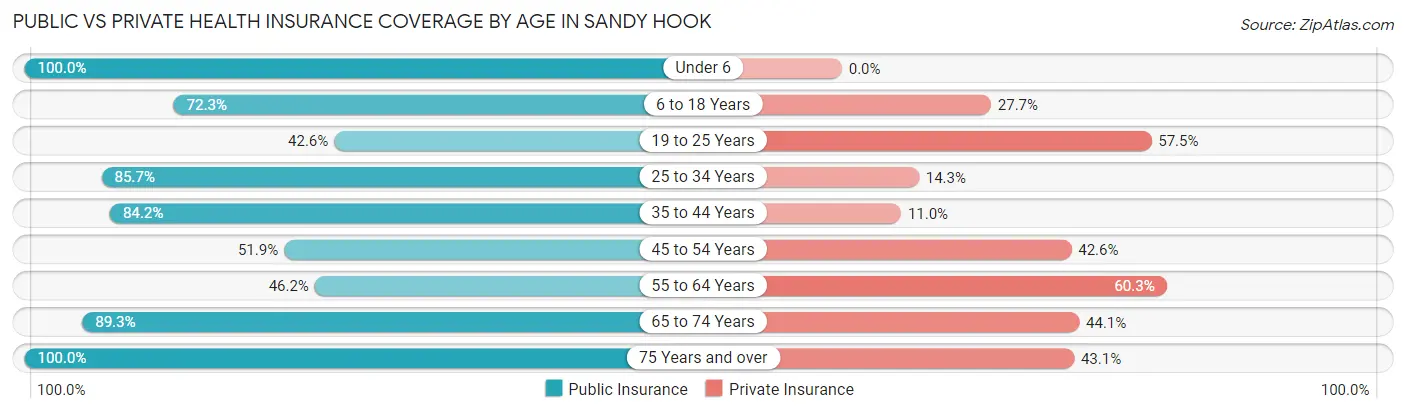
| Age Bracket | Public Insurance | Private Insurance |
| Under 6 | 41 (100.0%) | 0 (0.0%) |
| 6 to 18 Years | 115 (72.3%) | 44 (27.7%) |
| 19 to 25 Years | 20 (42.5%) | 27 (57.5%) |
| 25 to 34 Years | 30 (85.7%) | 5 (14.3%) |
| 35 to 44 Years | 69 (84.2%) | 9 (11.0%) |
| 45 to 54 Years | 28 (51.8%) | 23 (42.6%) |
| 55 to 64 Years | 36 (46.2%) | 47 (60.3%) |
| 65 to 74 Years | 75 (89.3%) | 37 (44.1%) |
| 75 Years and over | 58 (100.0%) | 25 (43.1%) |
| Total | 472 (74.0%) | 217 (34.0%) |
Disability Status by Sex by Age in Sandy Hook
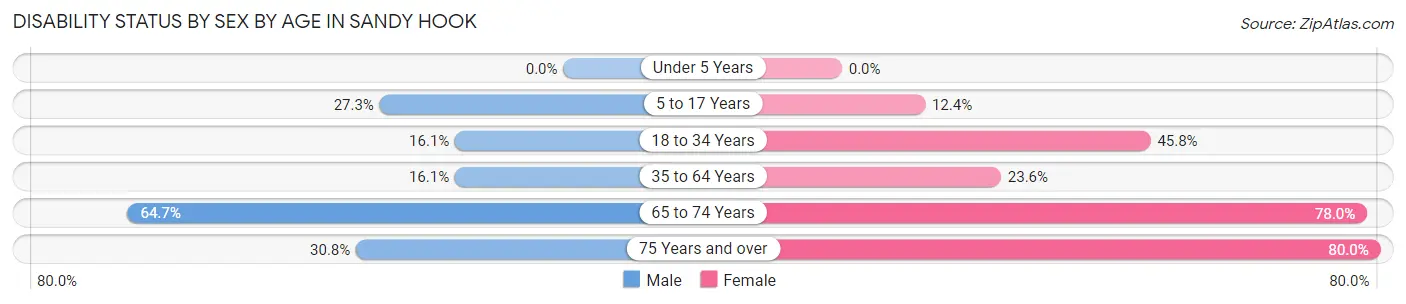
| Age Bracket | Male | Female |
| Under 5 Years | 0 (0.0%) | 0 (0.0%) |
| 5 to 17 Years | 24 (27.3%) | 10 (12.3%) |
| 18 to 34 Years | 9 (16.1%) | 22 (45.8%) |
| 35 to 64 Years | 14 (16.1%) | 30 (23.6%) |
| 65 to 74 Years | 22 (64.7%) | 39 (78.0%) |
| 75 Years and over | 4 (30.8%) | 36 (80.0%) |
Disability Class by Sex by Age in Sandy Hook
Disability Class: Hearing Difficulty
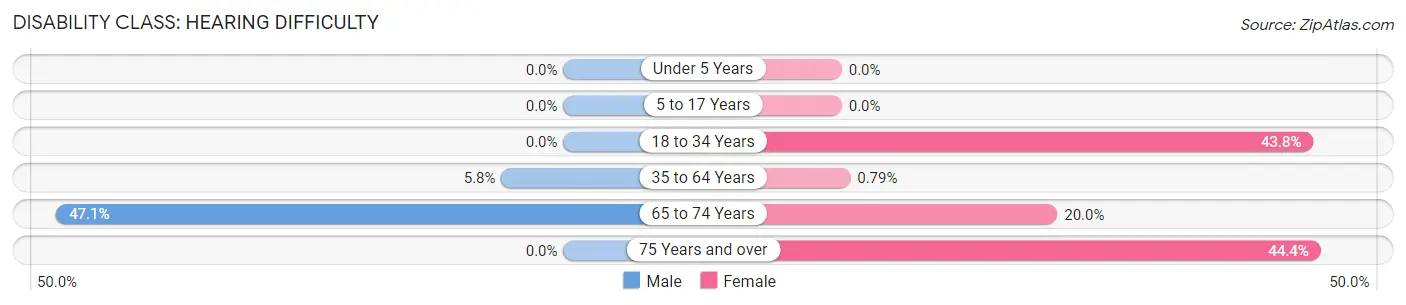
| Age Bracket | Male | Female |
| Under 5 Years | 0 (0.0%) | 0 (0.0%) |
| 5 to 17 Years | 0 (0.0%) | 0 (0.0%) |
| 18 to 34 Years | 0 (0.0%) | 21 (43.8%) |
| 35 to 64 Years | 5 (5.8%) | 1 (0.8%) |
| 65 to 74 Years | 16 (47.1%) | 10 (20.0%) |
| 75 Years and over | 0 (0.0%) | 20 (44.4%) |
Disability Class: Vision Difficulty
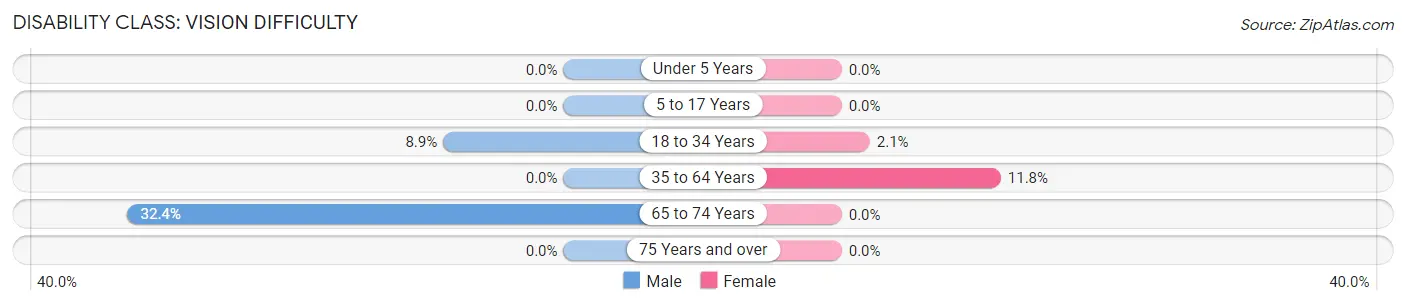
| Age Bracket | Male | Female |
| Under 5 Years | 0 (0.0%) | 0 (0.0%) |
| 5 to 17 Years | 0 (0.0%) | 0 (0.0%) |
| 18 to 34 Years | 5 (8.9%) | 1 (2.1%) |
| 35 to 64 Years | 0 (0.0%) | 15 (11.8%) |
| 65 to 74 Years | 11 (32.4%) | 0 (0.0%) |
| 75 Years and over | 0 (0.0%) | 0 (0.0%) |
Disability Class: Cognitive Difficulty
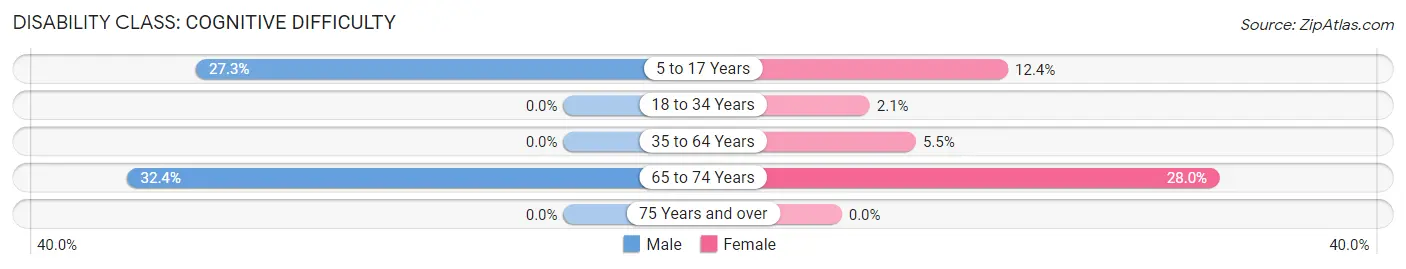
| Age Bracket | Male | Female |
| 5 to 17 Years | 24 (27.3%) | 10 (12.3%) |
| 18 to 34 Years | 0 (0.0%) | 1 (2.1%) |
| 35 to 64 Years | 0 (0.0%) | 7 (5.5%) |
| 65 to 74 Years | 11 (32.4%) | 14 (28.0%) |
| 75 Years and over | 0 (0.0%) | 0 (0.0%) |
Disability Class: Ambulatory Difficulty
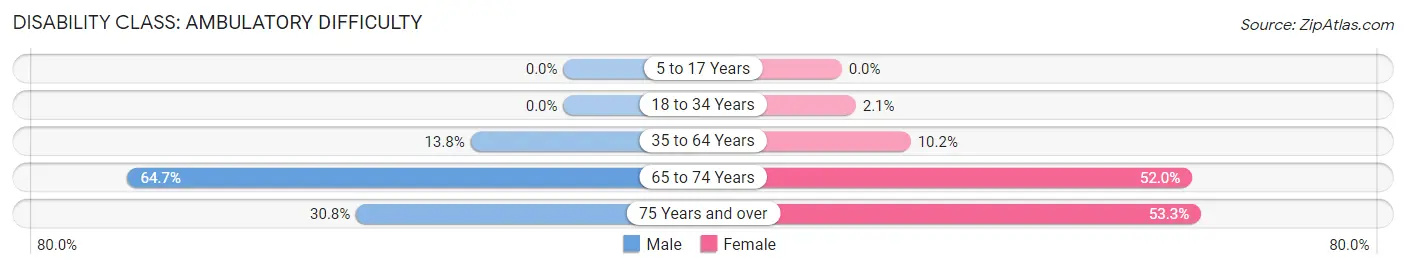
| Age Bracket | Male | Female |
| 5 to 17 Years | 0 (0.0%) | 0 (0.0%) |
| 18 to 34 Years | 0 (0.0%) | 1 (2.1%) |
| 35 to 64 Years | 12 (13.8%) | 13 (10.2%) |
| 65 to 74 Years | 22 (64.7%) | 26 (52.0%) |
| 75 Years and over | 4 (30.8%) | 24 (53.3%) |
Disability Class: Self-Care Difficulty
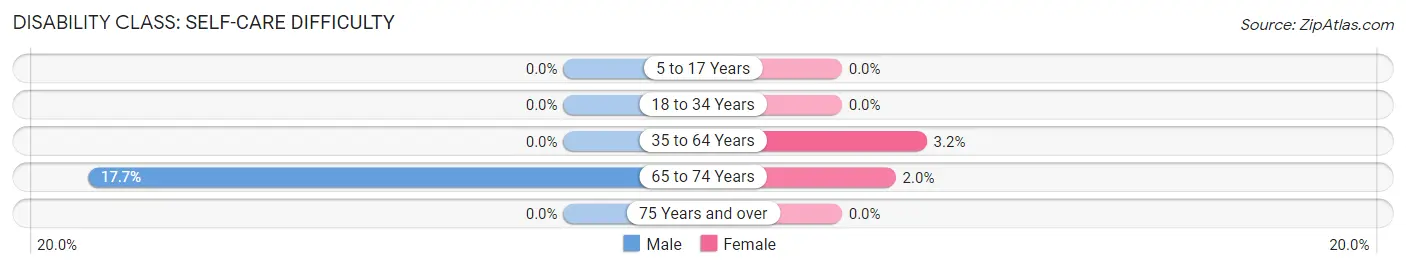
| Age Bracket | Male | Female |
| 5 to 17 Years | 0 (0.0%) | 0 (0.0%) |
| 18 to 34 Years | 0 (0.0%) | 0 (0.0%) |
| 35 to 64 Years | 0 (0.0%) | 4 (3.2%) |
| 65 to 74 Years | 6 (17.6%) | 1 (2.0%) |
| 75 Years and over | 0 (0.0%) | 0 (0.0%) |
Technology Access in Sandy Hook
Computing Device Access in Sandy Hook
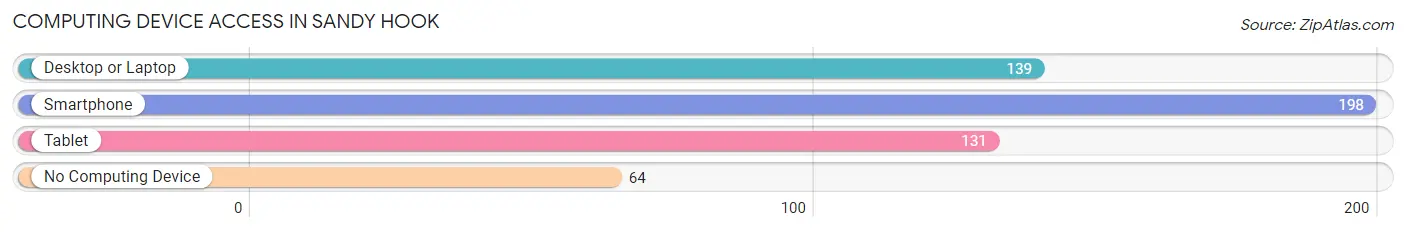
| Device Type | # Households | % Households |
| Desktop or Laptop | 139 | 52.8% |
| Smartphone | 198 | 75.3% |
| Tablet | 131 | 49.8% |
| No Computing Device | 64 | 24.3% |
| Total | 263 | 100.0% |
Internet Access in Sandy Hook
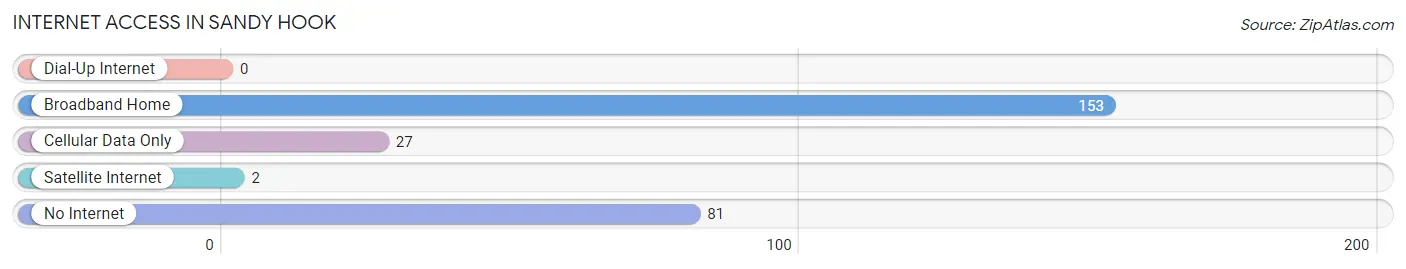
| Internet Type | # Households | % Households |
| Dial-Up Internet | 0 | 0.0% |
| Broadband Home | 153 | 58.2% |
| Cellular Data Only | 27 | 10.3% |
| Satellite Internet | 2 | 0.8% |
| No Internet | 81 | 30.8% |
| Total | 263 | 100.0% |
Sandy Hook Summary
Sandy Hook is a small unincorporated community located in Elliott County, Kentucky. It is situated in the foothills of the Appalachian Mountains, approximately 20 miles from the Ohio River. The population of Sandy Hook was estimated to be around 500 people in 2000.
History
Sandy Hook was first settled in the early 1800s by a group of settlers from Virginia. The town was named after the nearby Sandy Hook Creek, which was named for the sandy soil in the area. The town was originally a farming community, but it soon became a center for timber and coal production. In the late 1800s, the town was home to several sawmills and coal mines.
In the early 1900s, Sandy Hook was a bustling town with a population of over 1,000 people. The town had several stores, a post office, a school, and a hotel. The town was also home to several churches, including the Sandy Hook Methodist Church, which was founded in 1883.
In the mid-1900s, the coal industry began to decline in the area, and the population of Sandy Hook began to decline as well. By the late 1900s, the population had dropped to around 500 people.
Geography
Sandy Hook is located in the foothills of the Appalachian Mountains in Elliott County, Kentucky. The town is situated on the banks of the Sandy Hook Creek, which is a tributary of the Little Sandy River. The town is surrounded by rolling hills and forests, and is located approximately 20 miles from the Ohio River.
The climate in Sandy Hook is humid subtropical, with hot summers and mild winters. The average annual temperature is around 60 degrees Fahrenheit, and the average annual precipitation is around 45 inches.
Economy
The economy of Sandy Hook is largely based on agriculture and forestry. The town is home to several farms, and the surrounding area is home to several timber companies. The town is also home to several small businesses, including a grocery store, a hardware store, and a gas station.
The town is also home to several coal mines, which provide employment for many of the town’s residents. The coal industry has been in decline in the area for several decades, but it still provides employment for many of the town’s residents.
Demographics
As of the 2000 census, the population of Sandy Hook was estimated to be around 500 people. The racial makeup of the town was 97.2% White, 0.8% African American, 0.2% Native American, 0.2% Asian, and 1.6% from other races. The median household income was $25,000, and the median family income was $30,000.
The town is home to several churches, including the Sandy Hook Methodist Church, which was founded in 1883. The town is also home to several schools, including Sandy Hook Elementary School and Sandy Hook High School.
Conclusion
Sandy Hook is a small unincorporated community located in Elliott County, Kentucky. It is situated in the foothills of the Appalachian Mountains, approximately 20 miles from the Ohio River. The population of Sandy Hook was estimated to be around 500 people in 2000. The economy of Sandy Hook is largely based on agriculture and forestry, and the town is home to several small businesses. The racial makeup of the town was 97.2% White, 0.8% African American, 0.2% Native American, 0.2% Asian, and 1.6% from other races. The town is home to several churches and schools, and is a peaceful and quiet place to live.
Common Questions
What is Per Capita Income in Sandy Hook?
Per Capita income in Sandy Hook is $16,329.
What is the Median Household income in Sandy Hook?
Median Household Income in Sandy Hook is $20,469.
What is Income or Wage Gap in Sandy Hook?
Income or Wage Gap in Sandy Hook is 34.4%.
Women in Sandy Hook earn 65.6 cents for every dollar earned by a man.
What is Family Income Deficit in Sandy Hook?
Family Income Deficit in Sandy Hook is $15,890.
Families that are below poverty line in Sandy Hook earn $15,890 less on average than the poverty threshold level.
What is Inequality or Gini Index in Sandy Hook?
Inequality or Gini Index in Sandy Hook is 0.54.
What is the Total Population of Sandy Hook?
Total Population of Sandy Hook is 708.
What is the Total Male Population of Sandy Hook?
Total Male Population of Sandy Hook is 310.
What is the Total Female Population of Sandy Hook?
Total Female Population of Sandy Hook is 398.
What is the Ratio of Males per 100 Females in Sandy Hook?
There are 77.89 Males per 100 Females in Sandy Hook.
What is the Ratio of Females per 100 Males in Sandy Hook?
There are 128.39 Females per 100 Males in Sandy Hook.
What is the Median Population Age in Sandy Hook?
Median Population Age in Sandy Hook is 44.5 Years.
What is the Average Family Size in Sandy Hook
Average Family Size in Sandy Hook is 3.6 People.
What is the Average Household Size in Sandy Hook
Average Household Size in Sandy Hook is 2.4 People.
How Large is the Labor Force in Sandy Hook?
There are 150 People in the Labor Forcein in Sandy Hook.
What is the Percentage of People in the Labor Force in Sandy Hook?
26.6% of People are in the Labor Force in Sandy Hook.
What is the Unemployment Rate in Sandy Hook?
Unemployment Rate in Sandy Hook is 5.3%.