West Liberty, KY Map & Demographics
West Liberty Map
West Liberty Overview
$14,769
PER CAPITA INCOME
$55,875
AVG FAMILY INCOME
$47,083
AVG HOUSEHOLD INCOME
43.8%
WAGE / INCOME GAP [ % ]
56.2¢/ $1
WAGE / INCOME GAP [ $ ]
0.47
INEQUALITY / GINI INDEX
3,247
TOTAL POPULATION
2,390
MALE POPULATION
857
FEMALE POPULATION
278.88
MALES / 100 FEMALES
35.86
FEMALES / 100 MALES
37.1
MEDIAN AGE
3.4
AVG FAMILY SIZE
2.6
AVG HOUSEHOLD SIZE
680
LABOR FORCE [ PEOPLE ]
22.9%
PERCENT IN LABOR FORCE
3.1%
UNEMPLOYMENT RATE
West Liberty Zip Codes
West Liberty Area Codes
Income in West Liberty
Income Overview in West Liberty
Per Capita Income in West Liberty is $14,769, while median incomes of families and households are $55,875 and $47,083 respectively.
| Characteristic | Number | Measure |
| Per Capita Income | 3,247 | $14,769 |
| Median Family Income | 383 | $55,875 |
| Mean Family Income | 383 | $79,937 |
| Median Household Income | 629 | $47,083 |
| Mean Household Income | 629 | $66,176 |
| Income Deficit | 383 | $0 |
| Wage / Income Gap (%) | 3,247 | 43.81% |
| Wage / Income Gap ($) | 3,247 | 56.19¢ per $1 |
| Gini / Inequality Index | 3,247 | 0.47 |
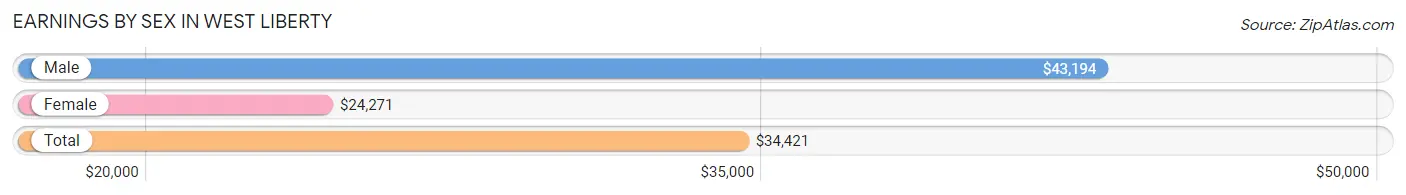
Earnings by Sex in West Liberty
Average Earnings in West Liberty are $34,421, $43,194 for men and $24,271 for women, a difference of 43.8%.
| Sex | Number | Average Earnings |
| Male | 407 (50.6%) | $43,194 |
| Female | 397 (49.4%) | $24,271 |
| Total | 804 (100.0%) | $34,421 |
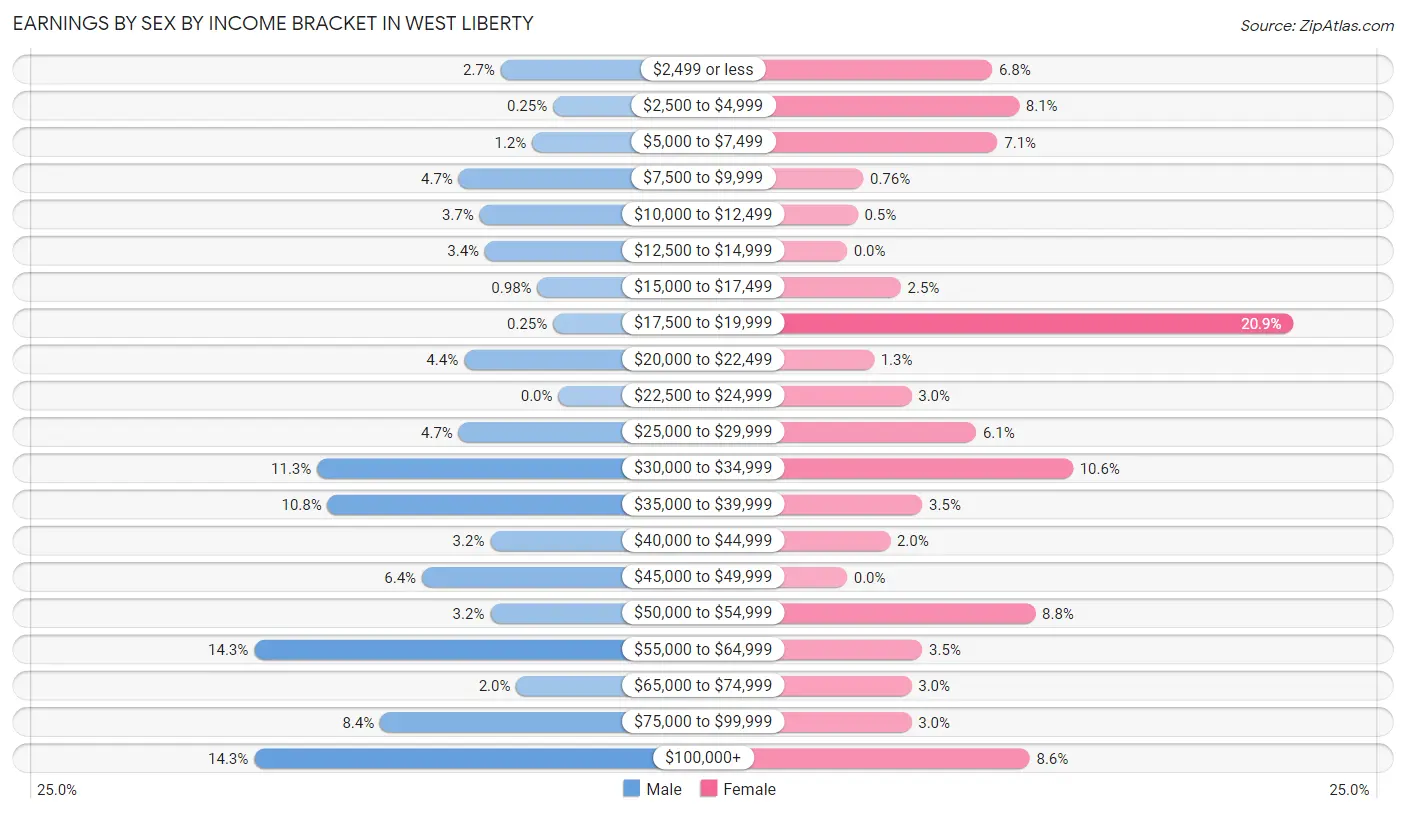
Earnings by Sex by Income Bracket in West Liberty
The most common earnings brackets in West Liberty are $55,000 to $64,999 for men (58 | 14.2%) and $17,500 to $19,999 for women (83 | 20.9%).
| Income | Male | Female |
| $2,499 or less | 11 (2.7%) | 27 (6.8%) |
| $2,500 to $4,999 | 1 (0.3%) | 32 (8.1%) |
| $5,000 to $7,499 | 5 (1.2%) | 28 (7.0%) |
| $7,500 to $9,999 | 19 (4.7%) | 3 (0.8%) |
| $10,000 to $12,499 | 15 (3.7%) | 2 (0.5%) |
| $12,500 to $14,999 | 14 (3.4%) | 0 (0.0%) |
| $15,000 to $17,499 | 4 (1.0%) | 10 (2.5%) |
| $17,500 to $19,999 | 1 (0.3%) | 83 (20.9%) |
| $20,000 to $22,499 | 18 (4.4%) | 5 (1.3%) |
| $22,500 to $24,999 | 0 (0.0%) | 12 (3.0%) |
| $25,000 to $29,999 | 19 (4.7%) | 24 (6.0%) |
| $30,000 to $34,999 | 46 (11.3%) | 42 (10.6%) |
| $35,000 to $39,999 | 44 (10.8%) | 14 (3.5%) |
| $40,000 to $44,999 | 13 (3.2%) | 8 (2.0%) |
| $45,000 to $49,999 | 26 (6.4%) | 0 (0.0%) |
| $50,000 to $54,999 | 13 (3.2%) | 35 (8.8%) |
| $55,000 to $64,999 | 58 (14.2%) | 14 (3.5%) |
| $65,000 to $74,999 | 8 (2.0%) | 12 (3.0%) |
| $75,000 to $99,999 | 34 (8.4%) | 12 (3.0%) |
| $100,000+ | 58 (14.2%) | 34 (8.6%) |
| Total | 407 (100.0%) | 397 (100.0%) |
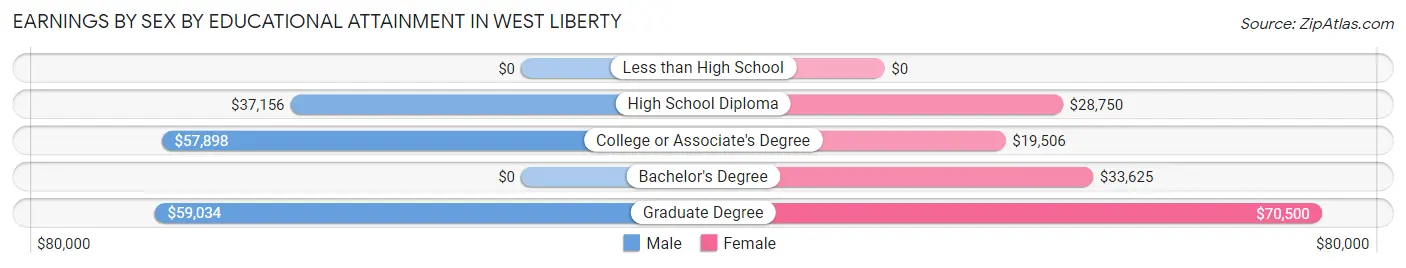
Earnings by Sex by Educational Attainment in West Liberty
Average earnings in West Liberty are $46,964 for men and $28,875 for women, a difference of 38.5%. Men with an educational attainment of graduate degree enjoy the highest average annual earnings of $59,034, while those with high school diploma education earn the least with $37,156. Women with an educational attainment of graduate degree earn the most with the average annual earnings of $70,500, while those with college or associate's degree education have the smallest earnings of $19,506.
| Educational Attainment | Male Income | Female Income |
| Less than High School | - | - |
| High School Diploma | $37,156 | $28,750 |
| College or Associate's Degree | $57,898 | $19,506 |
| Bachelor's Degree | - | - |
| Graduate Degree | $59,034 | $70,500 |
| Total | $46,964 | $28,875 |
Family Income in West Liberty
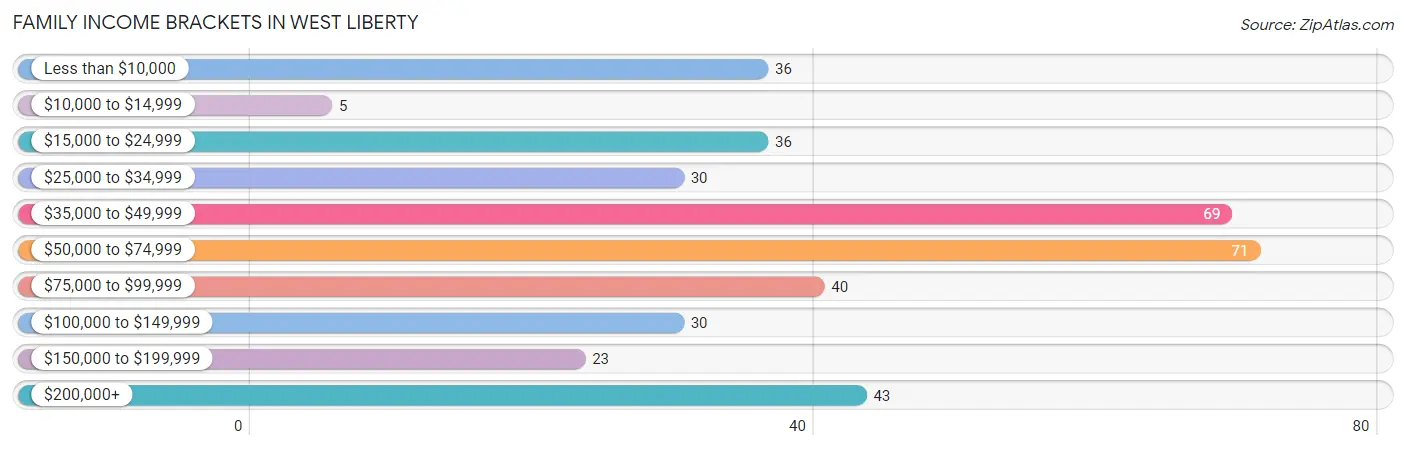
Family Income Brackets in West Liberty
According to the West Liberty family income data, there are 71 families falling into the $50,000 to $74,999 income range, which is the most common income bracket and makes up 18.5% of all families. Conversely, the $10,000 to $14,999 income bracket is the least frequent group with only 5 families (1.3%) belonging to this category.
| Income Bracket | # Families | % Families |
| Less than $10,000 | 36 | 9.4% |
| $10,000 to $14,999 | 5 | 1.3% |
| $15,000 to $24,999 | 36 | 9.4% |
| $25,000 to $34,999 | 30 | 7.8% |
| $35,000 to $49,999 | 69 | 18.0% |
| $50,000 to $74,999 | 71 | 18.5% |
| $75,000 to $99,999 | 40 | 10.4% |
| $100,000 to $149,999 | 30 | 7.8% |
| $150,000 to $199,999 | 23 | 6.0% |
| $200,000+ | 43 | 11.2% |
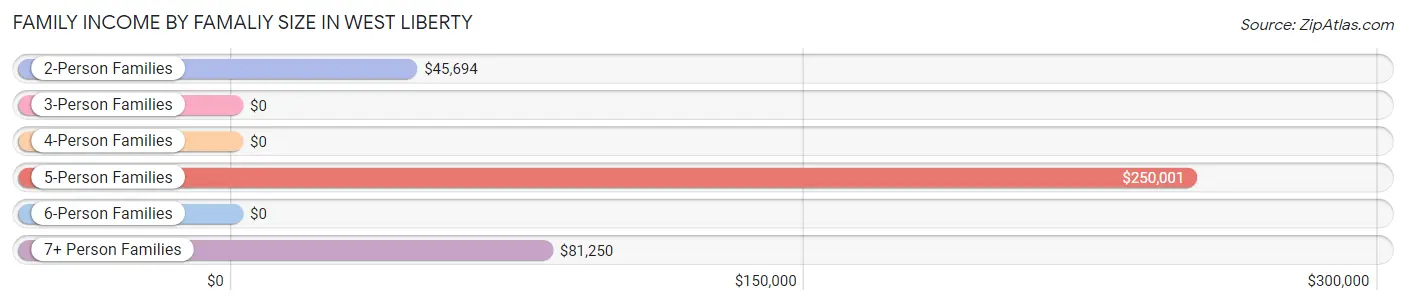
Family Income by Famaliy Size in West Liberty
5-person families (32 | 8.4%) account for the highest median family income in West Liberty with $250,001 per family, while 5-person families (32 | 8.4%) have the highest median income of $50,000 per family member.
| Income Bracket | # Families | Median Income |
| 2-Person Families | 215 (56.1%) | $45,694 |
| 3-Person Families | 86 (22.5%) | $0 |
| 4-Person Families | 36 (9.4%) | $0 |
| 5-Person Families | 32 (8.4%) | $250,001 |
| 6-Person Families | 4 (1.0%) | $0 |
| 7+ Person Families | 10 (2.6%) | $81,250 |
| Total | 383 (100.0%) | $55,875 |
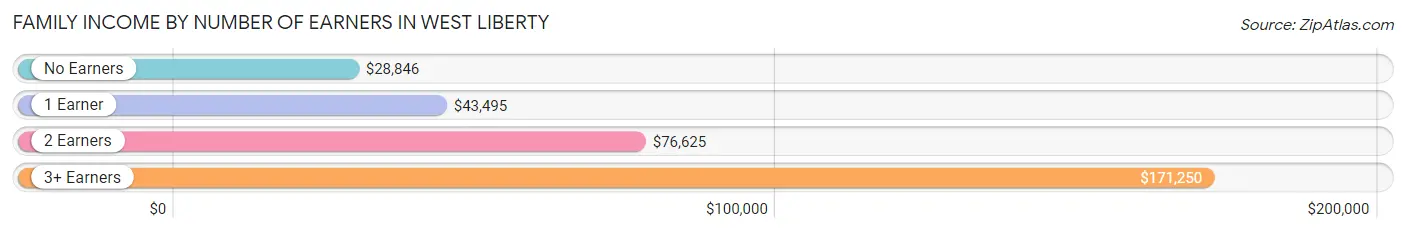
Family Income by Number of Earners in West Liberty
The median family income in West Liberty is $55,875, with families comprising 3+ earners (27) having the highest median family income of $171,250, while families with no earners (86) have the lowest median family income of $28,846, accounting for 7.0% and 22.5% of families, respectively.
| Number of Earners | # Families | Median Income |
| No Earners | 86 (22.5%) | $28,846 |
| 1 Earner | 129 (33.7%) | $43,495 |
| 2 Earners | 141 (36.8%) | $76,625 |
| 3+ Earners | 27 (7.0%) | $171,250 |
| Total | 383 (100.0%) | $55,875 |
Household Income in West Liberty
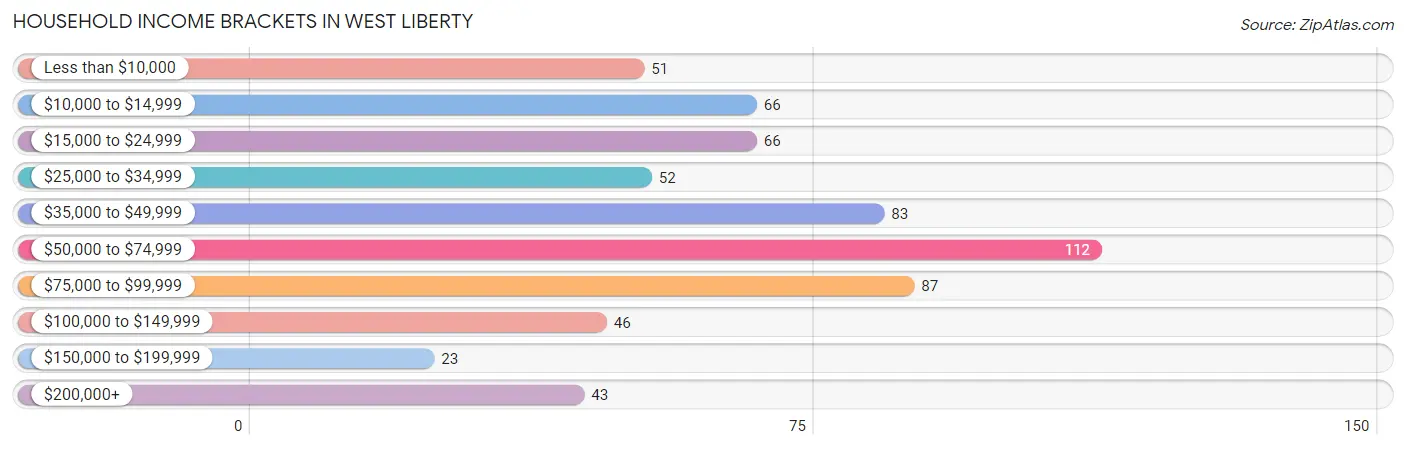
Household Income Brackets in West Liberty
With 112 households falling in the category, the $50,000 to $74,999 income range is the most frequent in West Liberty, accounting for 17.8% of all households. In contrast, only 23 households (3.7%) fall into the $150,000 to $199,999 income bracket, making it the least populous group.
| Income Bracket | # Households | % Households |
| Less than $10,000 | 51 | 8.1% |
| $10,000 to $14,999 | 66 | 10.5% |
| $15,000 to $24,999 | 66 | 10.5% |
| $25,000 to $34,999 | 52 | 8.3% |
| $35,000 to $49,999 | 83 | 13.2% |
| $50,000 to $74,999 | 112 | 17.8% |
| $75,000 to $99,999 | 87 | 13.8% |
| $100,000 to $149,999 | 46 | 7.3% |
| $150,000 to $199,999 | 23 | 3.7% |
| $200,000+ | 43 | 6.8% |
Household Income by Householder Age in West Liberty
The median household income in West Liberty is $47,083, with the highest median household income of $74,167 found in the 25 to 44 years age bracket for the primary householder. A total of 188 households (29.9%) fall into this category. Meanwhile, the 15 to 24 years age bracket for the primary householder has the lowest median household income of $0, with 12 households (1.9%) in this group.
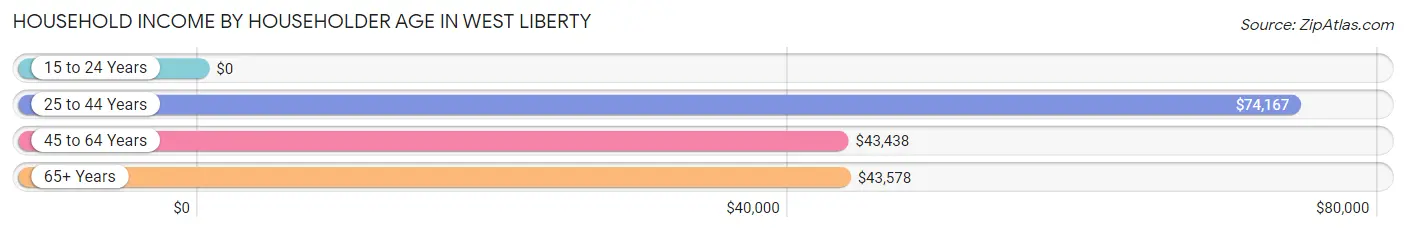
| Income Bracket | # Households | Median Income |
| 15 to 24 Years | 12 (1.9%) | $0 |
| 25 to 44 Years | 188 (29.9%) | $74,167 |
| 45 to 64 Years | 203 (32.3%) | $43,438 |
| 65+ Years | 226 (35.9%) | $43,578 |
| Total | 629 (100.0%) | $47,083 |
Poverty in West Liberty
Income Below Poverty by Sex and Age in West Liberty
With 15.2% poverty level for males and 26.1% for females among the residents of West Liberty, 18 to 24 year old males and 5 year old females are the most vulnerable to poverty, with 26 males (53.1%) and 4 females (100.0%) in their respective age groups living below the poverty level.
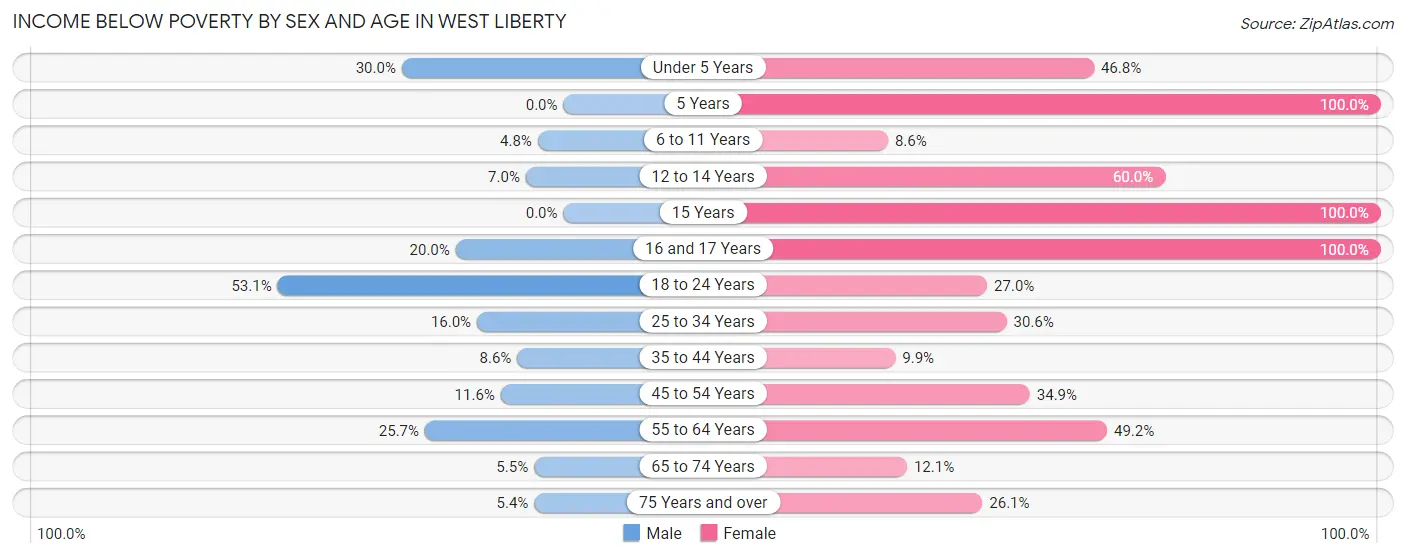
| Age Bracket | Male | Female |
| Under 5 Years | 9 (30.0%) | 22 (46.8%) |
| 5 Years | 0 (0.0%) | 4 (100.0%) |
| 6 to 11 Years | 3 (4.8%) | 3 (8.6%) |
| 12 to 14 Years | 3 (7.0%) | 9 (60.0%) |
| 15 Years | 0 (0.0%) | 6 (100.0%) |
| 16 and 17 Years | 5 (20.0%) | 7 (100.0%) |
| 18 to 24 Years | 26 (53.1%) | 17 (27.0%) |
| 25 to 34 Years | 34 (16.0%) | 26 (30.6%) |
| 35 to 44 Years | 6 (8.6%) | 17 (9.9%) |
| 45 to 54 Years | 17 (11.6%) | 37 (34.9%) |
| 55 to 64 Years | 18 (25.7%) | 32 (49.2%) |
| 65 to 74 Years | 3 (5.4%) | 19 (12.1%) |
| 75 Years and over | 2 (5.4%) | 18 (26.1%) |
| Total | 126 (15.2%) | 217 (26.1%) |
Income Above Poverty by Sex and Age in West Liberty
According to the poverty statistics in West Liberty, males aged 5 years and females aged 6 to 11 years are the age groups that are most secure financially, with 100.0% of males and 91.4% of females in these age groups living above the poverty line.
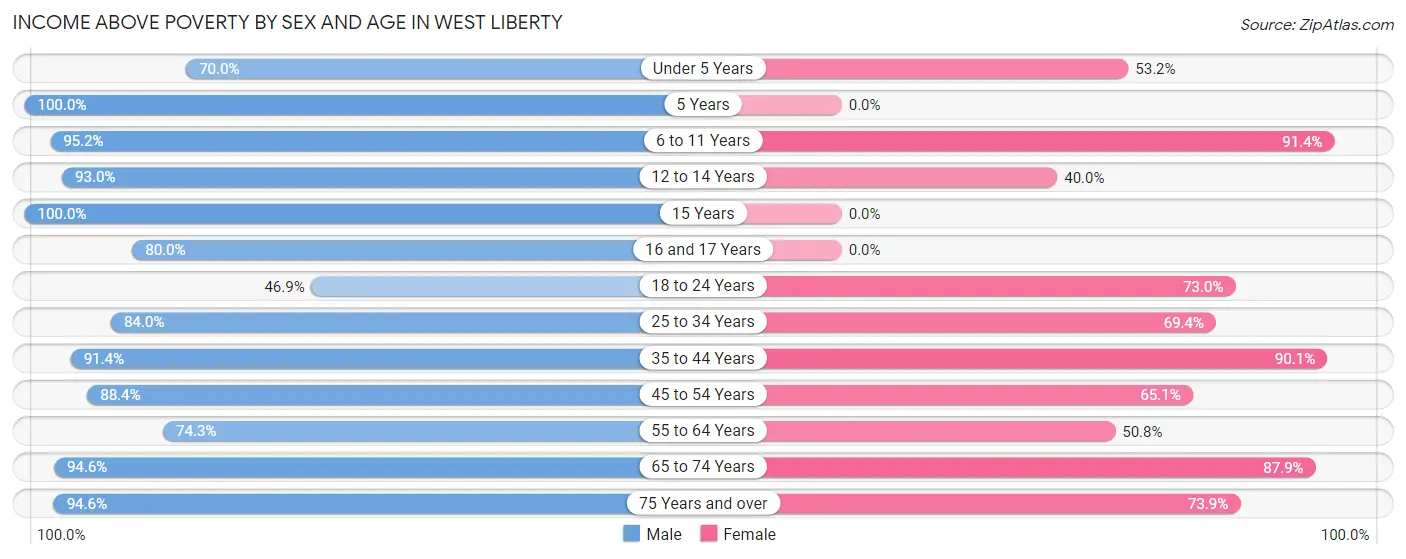
| Age Bracket | Male | Female |
| Under 5 Years | 21 (70.0%) | 25 (53.2%) |
| 5 Years | 22 (100.0%) | 0 (0.0%) |
| 6 to 11 Years | 60 (95.2%) | 32 (91.4%) |
| 12 to 14 Years | 40 (93.0%) | 6 (40.0%) |
| 15 Years | 8 (100.0%) | 0 (0.0%) |
| 16 and 17 Years | 20 (80.0%) | 0 (0.0%) |
| 18 to 24 Years | 23 (46.9%) | 46 (73.0%) |
| 25 to 34 Years | 178 (84.0%) | 59 (69.4%) |
| 35 to 44 Years | 64 (91.4%) | 154 (90.1%) |
| 45 to 54 Years | 129 (88.4%) | 69 (65.1%) |
| 55 to 64 Years | 52 (74.3%) | 33 (50.8%) |
| 65 to 74 Years | 52 (94.6%) | 138 (87.9%) |
| 75 Years and over | 35 (94.6%) | 51 (73.9%) |
| Total | 704 (84.8%) | 613 (73.9%) |
Income Below Poverty Among Married-Couple Families in West Liberty
The poverty statistics for married-couple families in West Liberty show that 10.0% or 22 of the total 220 families live below the poverty line. Families with 1 or 2 children have the highest poverty rate of 15.0%, comprising of 9 families. On the other hand, families with 5 or more children have the lowest poverty rate of 0.0%, which includes 0 families.
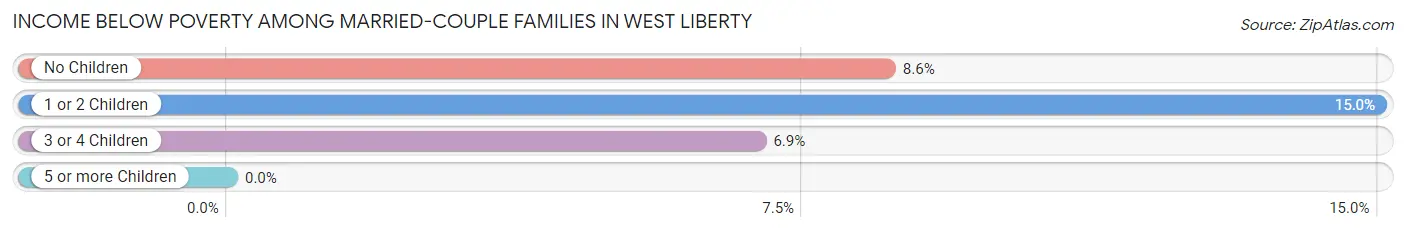
| Children | Above Poverty | Below Poverty |
| No Children | 117 (91.4%) | 11 (8.6%) |
| 1 or 2 Children | 51 (85.0%) | 9 (15.0%) |
| 3 or 4 Children | 27 (93.1%) | 2 (6.9%) |
| 5 or more Children | 3 (100.0%) | 0 (0.0%) |
| Total | 198 (90.0%) | 22 (10.0%) |
Income Below Poverty Among Single-Parent Households in West Liberty
According to the poverty data in West Liberty, 9.4% or 3 single-father households and 32.8% or 43 single-mother households are living below the poverty line. Among single-father households, those with no children have the highest poverty rate, with 3 households (17.6%) experiencing poverty. Likewise, among single-mother households, those with 1 or 2 children have the highest poverty rate, with 43 households (89.6%) falling below the poverty line.
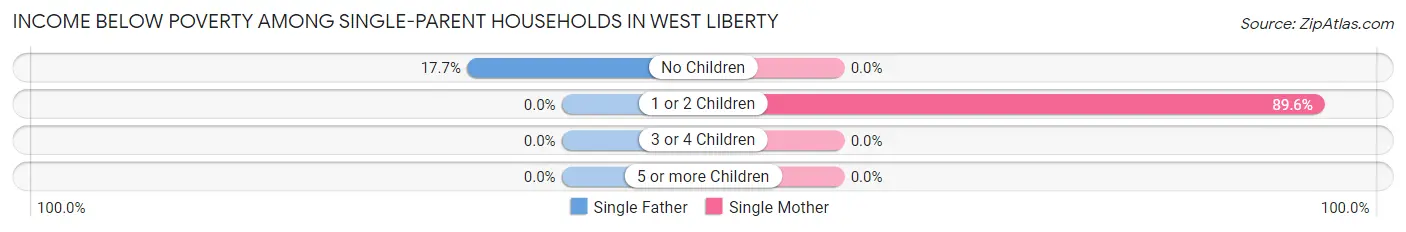
| Children | Single Father | Single Mother |
| No Children | 3 (17.6%) | 0 (0.0%) |
| 1 or 2 Children | 0 (0.0%) | 43 (89.6%) |
| 3 or 4 Children | 0 (0.0%) | 0 (0.0%) |
| 5 or more Children | 0 (0.0%) | 0 (0.0%) |
| Total | 3 (9.4%) | 43 (32.8%) |
Income Below Poverty Among Married-Couple vs Single-Parent Households in West Liberty
The poverty data for West Liberty shows that 22 of the married-couple family households (10.0%) and 46 of the single-parent households (28.2%) are living below the poverty level. Within the married-couple family households, those with 1 or 2 children have the highest poverty rate, with 9 households (15.0%) falling below the poverty line. Among the single-parent households, those with 1 or 2 children have the highest poverty rate, with 43 household (74.1%) living below poverty.
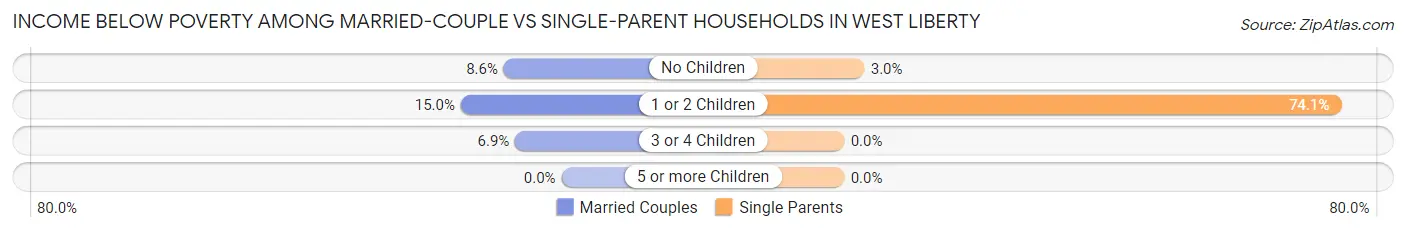
| Children | Married-Couple Families | Single-Parent Households |
| No Children | 11 (8.6%) | 3 (3.0%) |
| 1 or 2 Children | 9 (15.0%) | 43 (74.1%) |
| 3 or 4 Children | 2 (6.9%) | 0 (0.0%) |
| 5 or more Children | 0 (0.0%) | 0 (0.0%) |
| Total | 22 (10.0%) | 46 (28.2%) |
Race in West Liberty
The most populous races in West Liberty are White / Caucasian (2,546 | 78.4%), Black / African American (442 | 13.6%), and Two or more Races (112 | 3.5%).
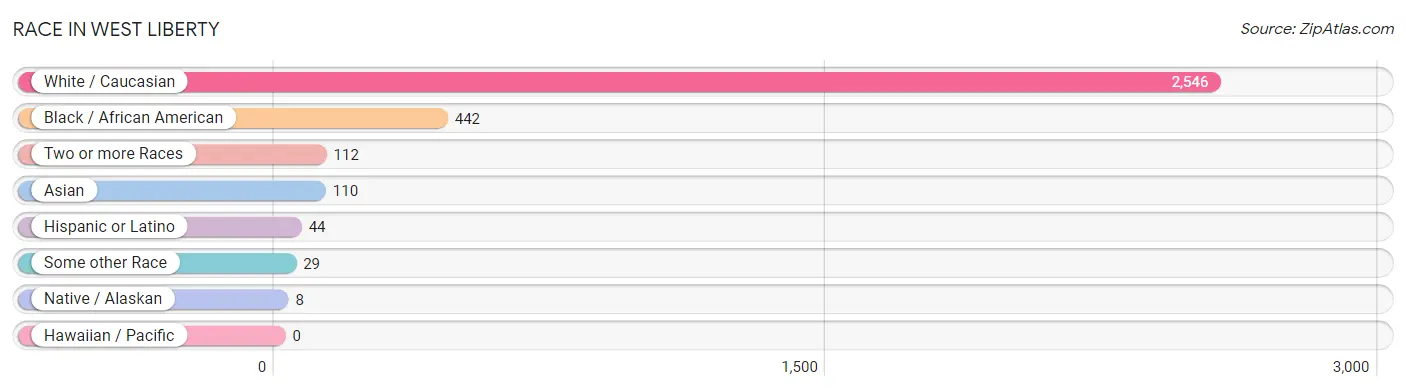
| Race | # Population | % Population |
| Asian | 110 | 3.4% |
| Black / African American | 442 | 13.6% |
| Hawaiian / Pacific | 0 | 0.0% |
| Hispanic or Latino | 44 | 1.4% |
| Native / Alaskan | 8 | 0.3% |
| White / Caucasian | 2,546 | 78.4% |
| Two or more Races | 112 | 3.5% |
| Some other Race | 29 | 0.9% |
| Total | 3,247 | 100.0% |
Ancestry in West Liberty
The most populous ancestries reported in West Liberty are American (1,203 | 37.0%), English (363 | 11.2%), Irish (260 | 8.0%), Korean (110 | 3.4%), and German (108 | 3.3%), together accounting for 63.0% of all West Liberty residents.
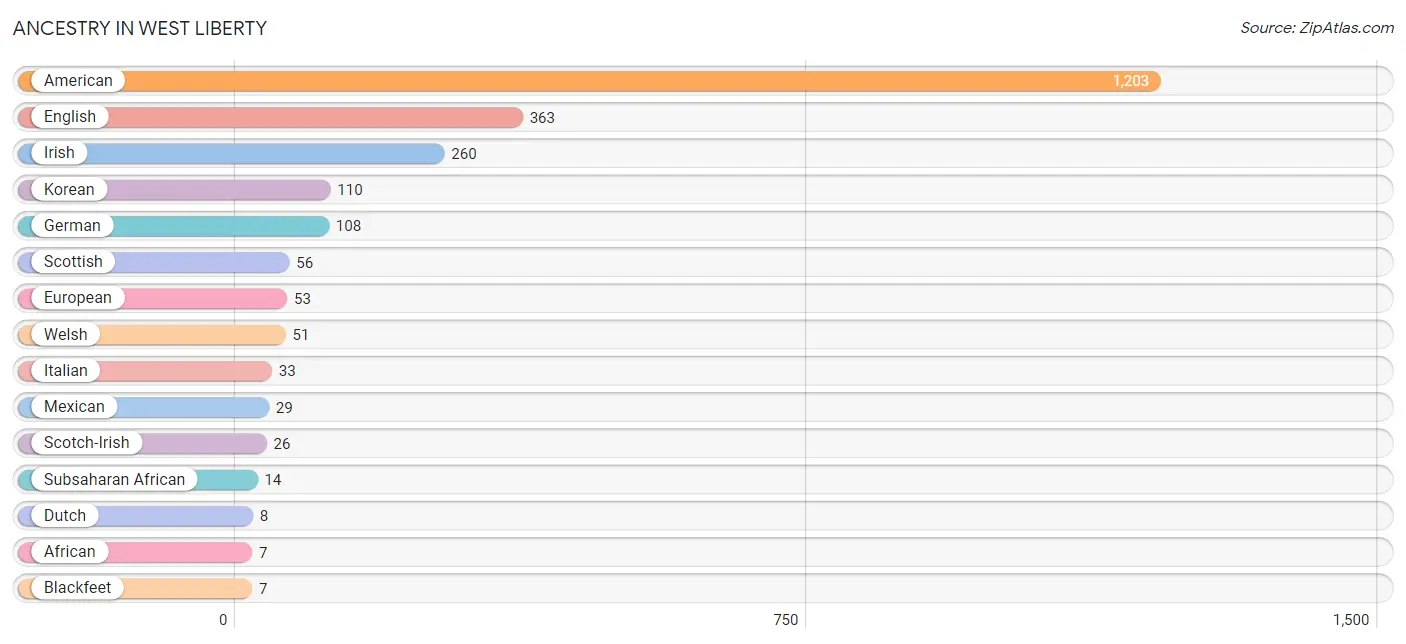
| Ancestry | # Population | % Population |
| African | 7 | 0.2% |
| American | 1,203 | 37.0% |
| Blackfeet | 7 | 0.2% |
| Czech | 1 | 0.0% |
| Dutch | 8 | 0.3% |
| English | 363 | 11.2% |
| European | 53 | 1.6% |
| German | 108 | 3.3% |
| Greek | 7 | 0.2% |
| Irish | 260 | 8.0% |
| Italian | 33 | 1.0% |
| Korean | 110 | 3.4% |
| Mexican | 29 | 0.9% |
| Polish | 7 | 0.2% |
| Portuguese | 4 | 0.1% |
| Puerto Rican | 7 | 0.2% |
| Scotch-Irish | 26 | 0.8% |
| Scottish | 56 | 1.7% |
| Somali | 7 | 0.2% |
| Subsaharan African | 14 | 0.4% |
| Swedish | 5 | 0.2% |
| Welsh | 51 | 1.6% | View All 22 Rows |
Immigrants in West Liberty
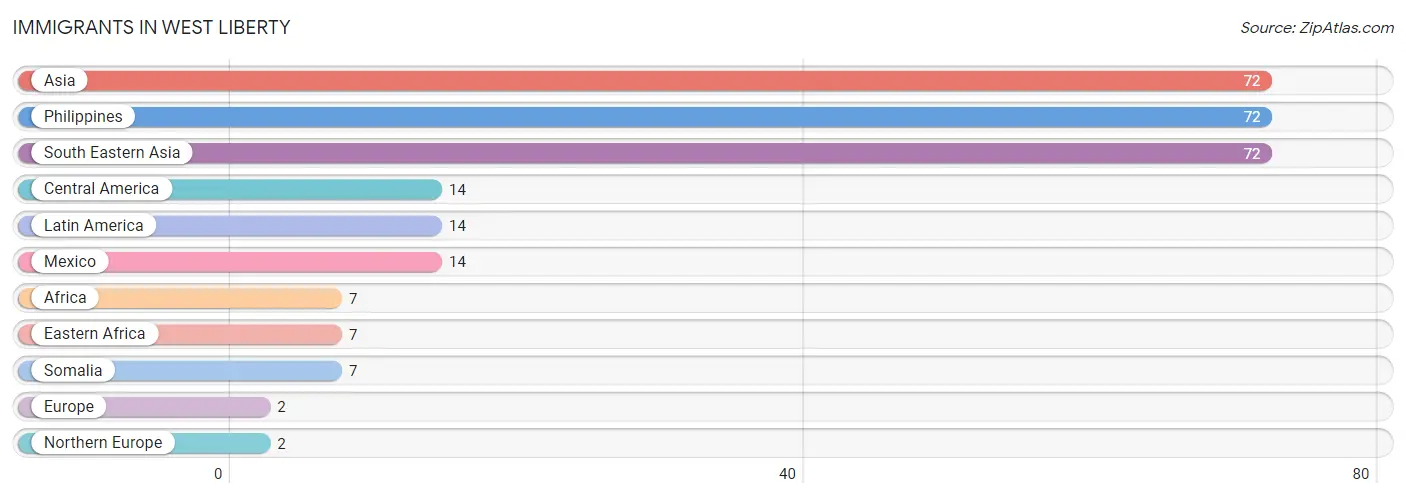
The most numerous immigrant groups reported in West Liberty came from Asia (72 | 2.2%), Philippines (72 | 2.2%), South Eastern Asia (72 | 2.2%), Central America (14 | 0.4%), and Latin America (14 | 0.4%), together accounting for 7.5% of all West Liberty residents.
| Immigration Origin | # Population | % Population |
| Africa | 7 | 0.2% |
| Asia | 72 | 2.2% |
| Central America | 14 | 0.4% |
| Eastern Africa | 7 | 0.2% |
| Europe | 2 | 0.1% |
| Latin America | 14 | 0.4% |
| Mexico | 14 | 0.4% |
| Northern Europe | 2 | 0.1% |
| Philippines | 72 | 2.2% |
| Somalia | 7 | 0.2% |
| South Eastern Asia | 72 | 2.2% | View All 11 Rows |
Sex and Age in West Liberty
Sex and Age in West Liberty
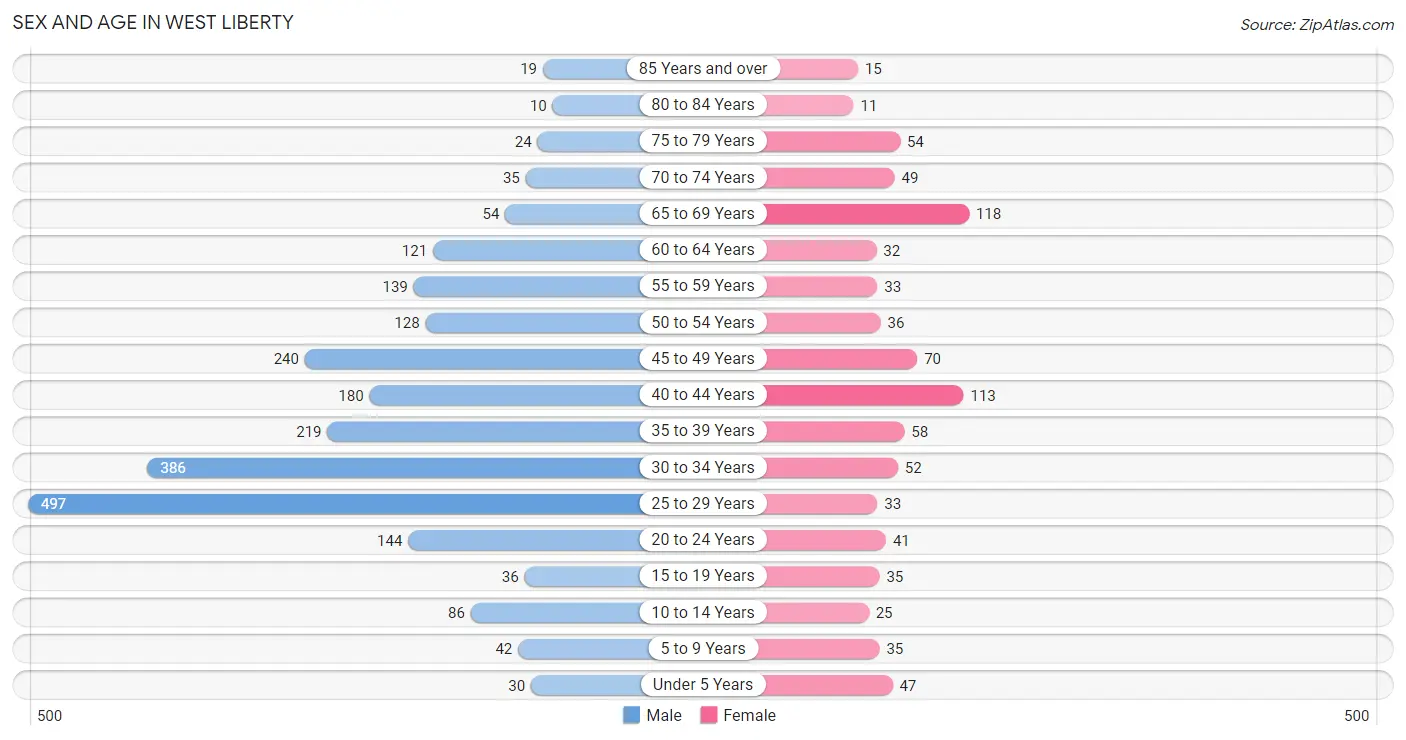
The most populous age groups in West Liberty are 25 to 29 Years (497 | 20.8%) for men and 65 to 69 Years (118 | 13.8%) for women.
| Age Bracket | Male | Female |
| Under 5 Years | 30 (1.3%) | 47 (5.5%) |
| 5 to 9 Years | 42 (1.8%) | 35 (4.1%) |
| 10 to 14 Years | 86 (3.6%) | 25 (2.9%) |
| 15 to 19 Years | 36 (1.5%) | 35 (4.1%) |
| 20 to 24 Years | 144 (6.0%) | 41 (4.8%) |
| 25 to 29 Years | 497 (20.8%) | 33 (3.8%) |
| 30 to 34 Years | 386 (16.2%) | 52 (6.1%) |
| 35 to 39 Years | 219 (9.2%) | 58 (6.8%) |
| 40 to 44 Years | 180 (7.5%) | 113 (13.2%) |
| 45 to 49 Years | 240 (10.0%) | 70 (8.2%) |
| 50 to 54 Years | 128 (5.4%) | 36 (4.2%) |
| 55 to 59 Years | 139 (5.8%) | 33 (3.8%) |
| 60 to 64 Years | 121 (5.1%) | 32 (3.7%) |
| 65 to 69 Years | 54 (2.3%) | 118 (13.8%) |
| 70 to 74 Years | 35 (1.5%) | 49 (5.7%) |
| 75 to 79 Years | 24 (1.0%) | 54 (6.3%) |
| 80 to 84 Years | 10 (0.4%) | 11 (1.3%) |
| 85 Years and over | 19 (0.8%) | 15 (1.8%) |
| Total | 2,390 (100.0%) | 857 (100.0%) |
Families and Households in West Liberty
Median Family Size in West Liberty
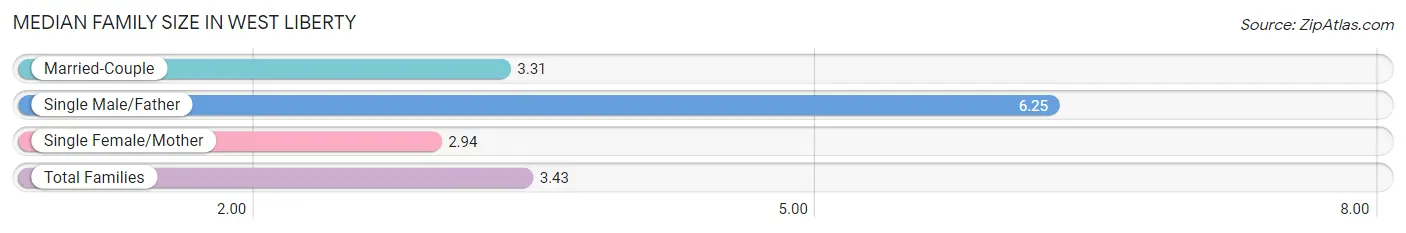
The median family size in West Liberty is 3.43 persons per family, with single male/father families (32 | 8.4%) accounting for the largest median family size of 6.25 persons per family. On the other hand, single female/mother families (131 | 34.2%) represent the smallest median family size with 2.94 persons per family.
| Family Type | # Families | Family Size |
| Married-Couple | 220 (57.4%) | 3.31 |
| Single Male/Father | 32 (8.4%) | 6.25 |
| Single Female/Mother | 131 (34.2%) | 2.94 |
| Total Families | 383 (100.0%) | 3.43 |
Median Household Size in West Liberty
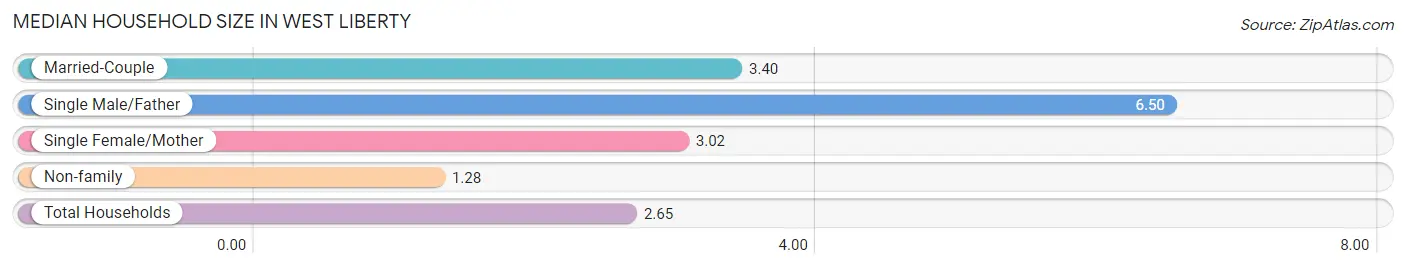
The median household size in West Liberty is 2.65 persons per household, with single male/father households (32 | 5.1%) accounting for the largest median household size of 6.5 persons per household. non-family households (246 | 39.1%) represent the smallest median household size with 1.28 persons per household.
| Household Type | # Households | Household Size |
| Married-Couple | 220 (35.0%) | 3.40 |
| Single Male/Father | 32 (5.1%) | 6.50 |
| Single Female/Mother | 131 (20.8%) | 3.02 |
| Non-family | 246 (39.1%) | 1.28 |
| Total Households | 629 (100.0%) | 2.65 |
Household Size by Marriage Status in West Liberty
Out of a total of 629 households in West Liberty, 383 (60.9%) are family households, while 246 (39.1%) are nonfamily households. The most numerous type of family households are 2-person households, comprising 205, and the most common type of nonfamily households are 1-person households, comprising 174.
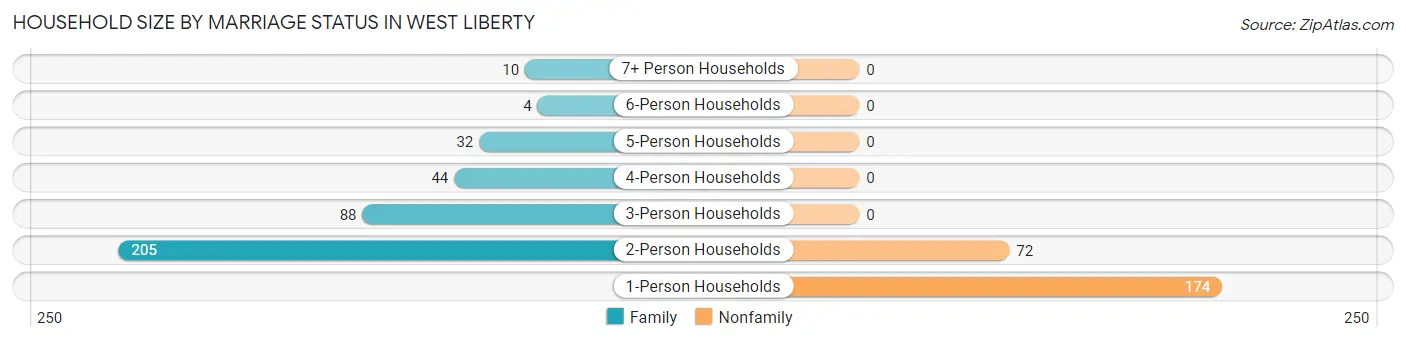
| Household Size | Family Households | Nonfamily Households |
| 1-Person Households | - | 174 (27.7%) |
| 2-Person Households | 205 (32.6%) | 72 (11.5%) |
| 3-Person Households | 88 (14.0%) | 0 (0.0%) |
| 4-Person Households | 44 (7.0%) | 0 (0.0%) |
| 5-Person Households | 32 (5.1%) | 0 (0.0%) |
| 6-Person Households | 4 (0.6%) | 0 (0.0%) |
| 7+ Person Households | 10 (1.6%) | 0 (0.0%) |
| Total | 383 (60.9%) | 246 (39.1%) |
Female Fertility in West Liberty
Fertility by Age in West Liberty
Average fertility rate in West Liberty is 17.0 births per 1,000 women. Women in the age bracket of 20 to 34 years have the highest fertility rate with 56.0 births per 1,000 women. Women in the age bracket of 20 to 34 years acount for 100.0% of all women with births.
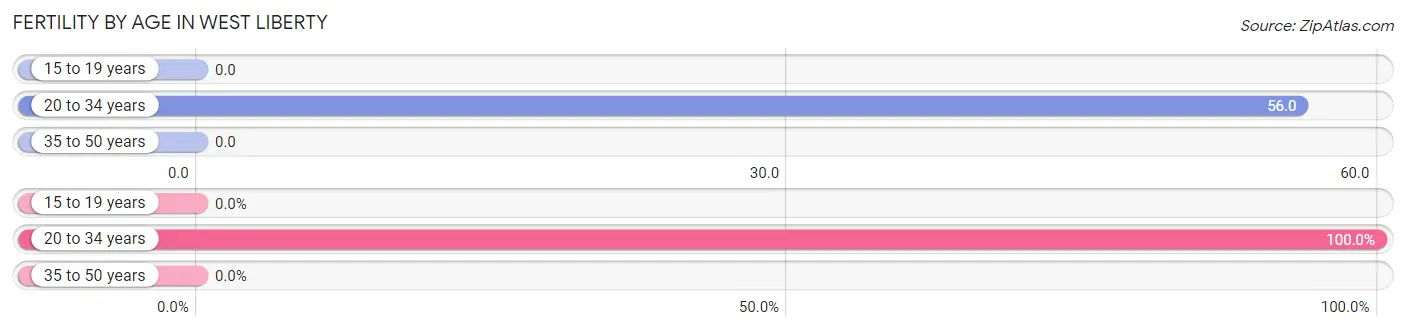
| Age Bracket | Women with Births | Births / 1,000 Women |
| 15 to 19 years | 0 (0.0%) | 0.0 |
| 20 to 34 years | 7 (100.0%) | 56.0 |
| 35 to 50 years | 0 (0.0%) | 0.0 |
| Total | 7 (100.0%) | 17.0 |
Fertility by Age by Marriage Status in West Liberty
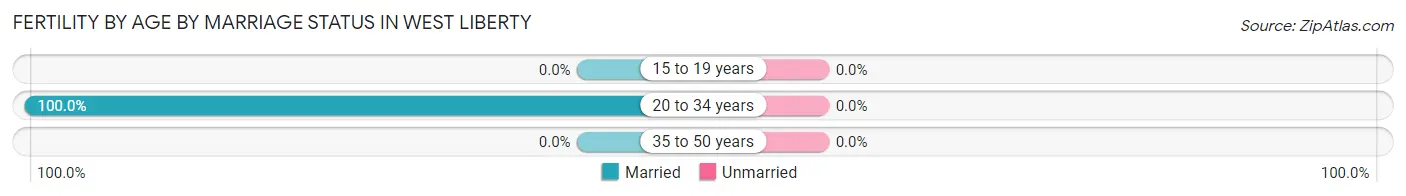
| Age Bracket | Married | Unmarried |
| 15 to 19 years | 0 (0.0%) | 0 (0.0%) |
| 20 to 34 years | 7 (100.0%) | 0 (0.0%) |
| 35 to 50 years | 0 (0.0%) | 0 (0.0%) |
| Total | 7 (100.0%) | 0 (0.0%) |
Fertility by Education in West Liberty
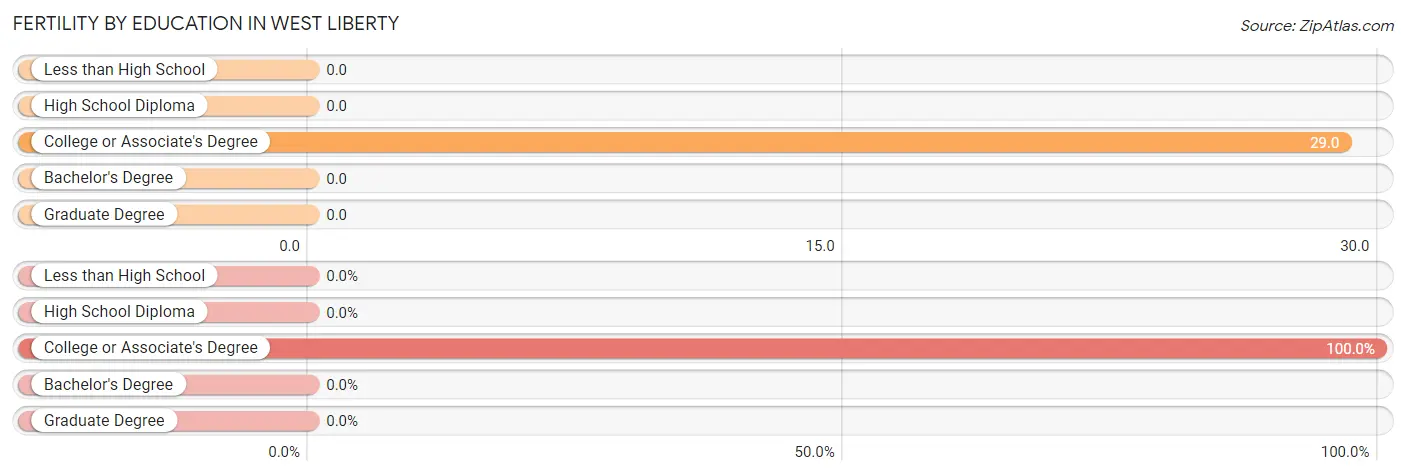
| Educational Attainment | Women with Births | Births / 1,000 Women |
| Less than High School | 0 (0.0%) | 0.0 |
| High School Diploma | 0 (0.0%) | 0.0 |
| College or Associate's Degree | 7 (100.0%) | 29.0 |
| Bachelor's Degree | 0 (0.0%) | 0.0 |
| Graduate Degree | 0 (0.0%) | 0.0 |
| Total | 7 (100.0%) | 17.0 |
Fertility by Education by Marriage Status in West Liberty
| Educational Attainment | Married | Unmarried |
| Less than High School | 0 (0.0%) | 0 (0.0%) |
| High School Diploma | 0 (0.0%) | 0 (0.0%) |
| College or Associate's Degree | 7 (100.0%) | 0 (0.0%) |
| Bachelor's Degree | 0 (0.0%) | 0 (0.0%) |
| Graduate Degree | 0 (0.0%) | 0 (0.0%) |
| Total | 7 (100.0%) | 0 (0.0%) |
Employment Characteristics in West Liberty
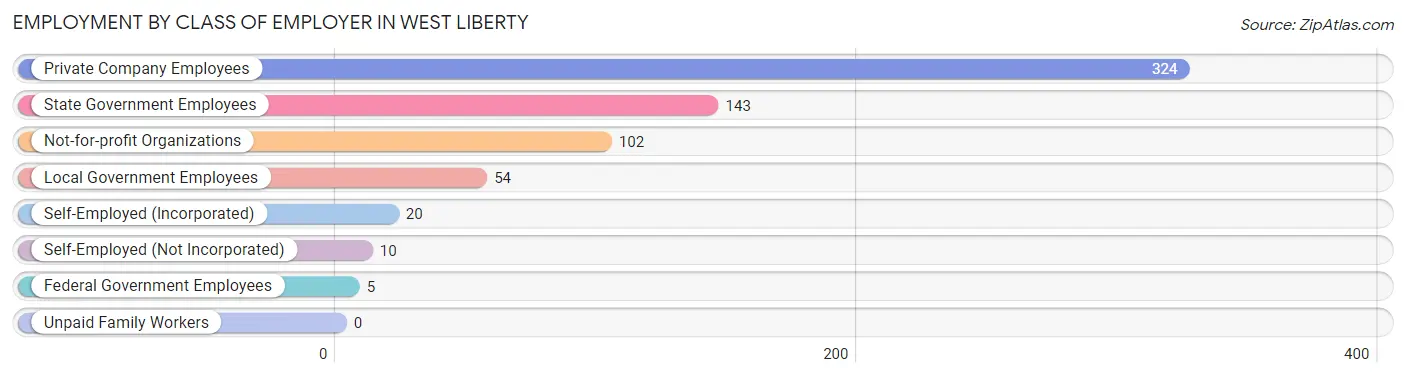
Employment by Class of Employer in West Liberty
Among the 658 employed individuals in West Liberty, private company employees (324 | 49.2%), state government employees (143 | 21.7%), and not-for-profit organizations (102 | 15.5%) make up the most common classes of employment.
| Employer Class | # Employees | % Employees |
| Private Company Employees | 324 | 49.2% |
| Self-Employed (Incorporated) | 20 | 3.0% |
| Self-Employed (Not Incorporated) | 10 | 1.5% |
| Not-for-profit Organizations | 102 | 15.5% |
| Local Government Employees | 54 | 8.2% |
| State Government Employees | 143 | 21.7% |
| Federal Government Employees | 5 | 0.8% |
| Unpaid Family Workers | 0 | 0.0% |
| Total | 658 | 100.0% |
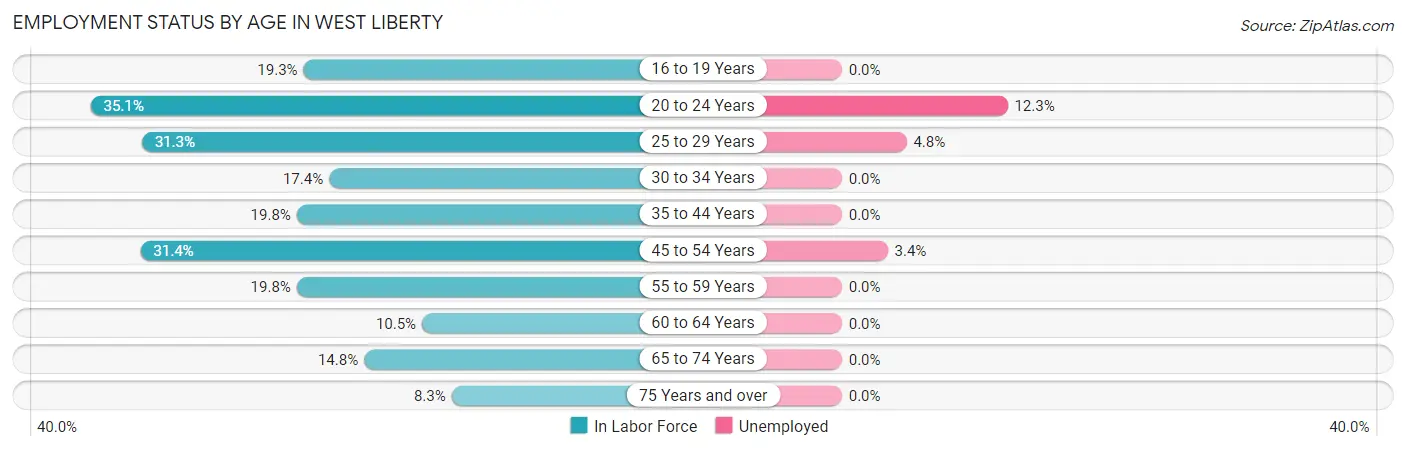
Employment Status by Age in West Liberty
According to the labor force statistics for West Liberty, out of the total population over 16 years of age (2,968), 22.9% or 680 individuals are in the labor force, with 3.1% or 21 of them unemployed. The age group with the highest labor force participation rate is 20 to 24 years, with 35.1% or 65 individuals in the labor force. Within the labor force, the 20 to 24 years age range has the highest percentage of unemployed individuals, with 12.3% or 8 of them being unemployed.
| Age Bracket | In Labor Force | Unemployed |
| 16 to 19 Years | 11 (19.3%) | 0 (0.0%) |
| 20 to 24 Years | 65 (35.1%) | 8 (12.3%) |
| 25 to 29 Years | 166 (31.3%) | 8 (4.8%) |
| 30 to 34 Years | 76 (17.4%) | 0 (0.0%) |
| 35 to 44 Years | 113 (19.8%) | 0 (0.0%) |
| 45 to 54 Years | 149 (31.4%) | 5 (3.4%) |
| 55 to 59 Years | 34 (19.8%) | 0 (0.0%) |
| 60 to 64 Years | 16 (10.5%) | 0 (0.0%) |
| 65 to 74 Years | 38 (14.8%) | 0 (0.0%) |
| 75 Years and over | 11 (8.3%) | 0 (0.0%) |
| Total | 680 (22.9%) | 21 (3.1%) |
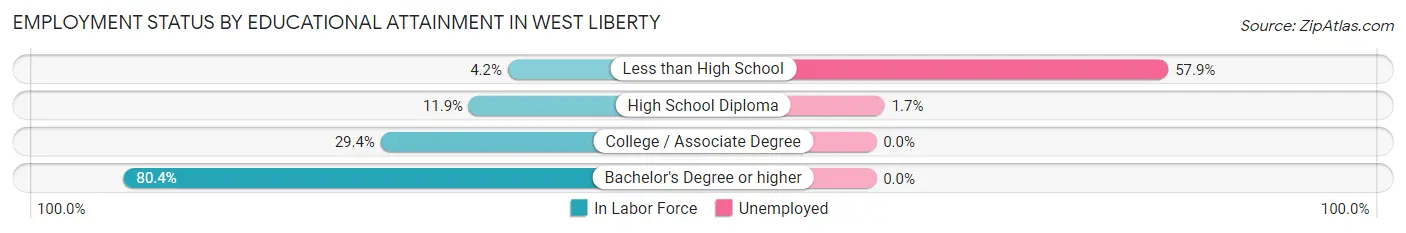
Employment Status by Educational Attainment in West Liberty
According to labor force statistics for West Liberty, 23.7% of individuals (554) out of the total population between 25 and 64 years of age (2,337) are in the labor force, with 2.3% or 13 of them being unemployed. The group with the highest labor force participation rate are those with the educational attainment of bachelor's degree or higher, with 80.4% or 238 individuals in the labor force. Within the labor force, individuals with less than high school education have the highest percentage of unemployment, with 57.9% or 11 of them being unemployed.
| Educational Attainment | In Labor Force | Unemployed |
| Less than High School | 19 (4.2%) | 263 (57.9%) |
| High School Diploma | 116 (11.9%) | 17 (1.7%) |
| College / Associate Degree | 181 (29.4%) | 0 (0.0%) |
| Bachelor's Degree or higher | 238 (80.4%) | 0 (0.0%) |
| Total | 554 (23.7%) | 54 (2.3%) |
Employment Occupations by Sex in West Liberty
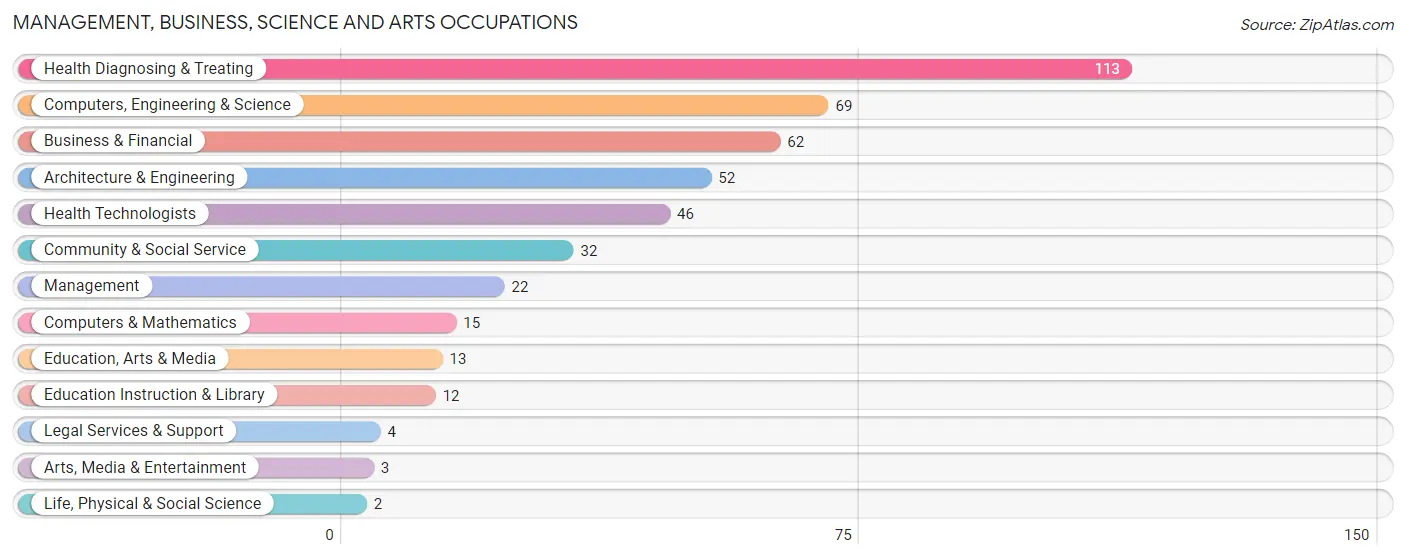
Management, Business, Science and Arts Occupations
The most common Management, Business, Science and Arts occupations in West Liberty are Health Diagnosing & Treating (113 | 17.2%), Computers, Engineering & Science (69 | 10.5%), Business & Financial (62 | 9.4%), Architecture & Engineering (52 | 7.9%), and Health Technologists (46 | 7.0%).
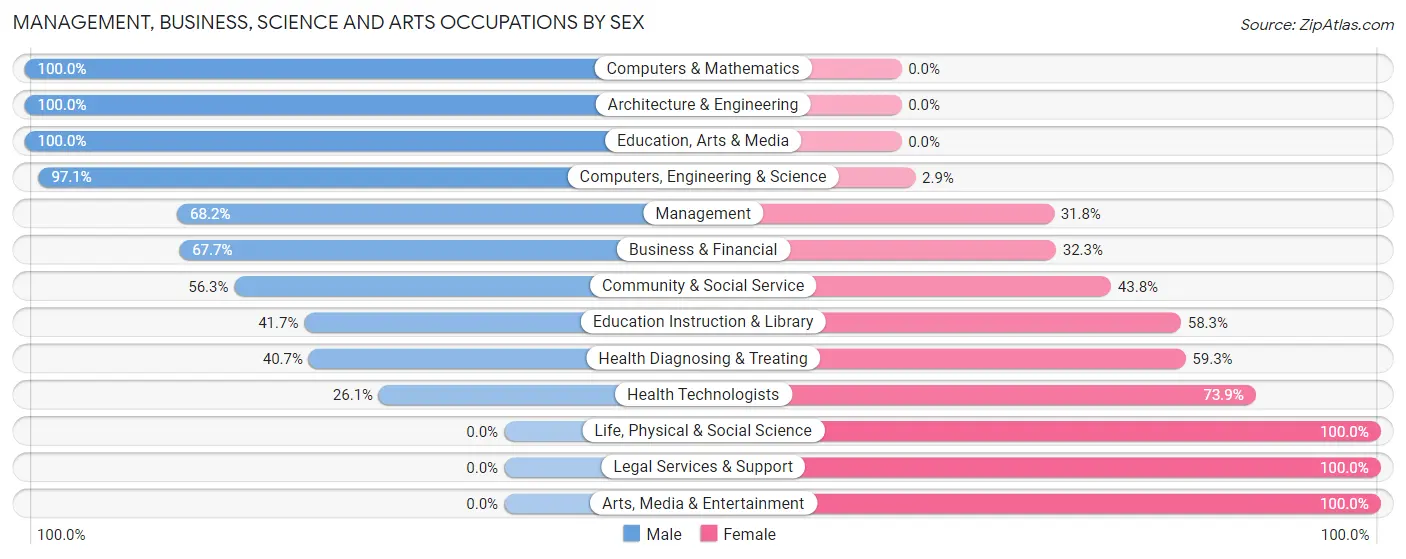
Management, Business, Science and Arts Occupations by Sex
Within the Management, Business, Science and Arts occupations in West Liberty, the most male-oriented occupations are Computers & Mathematics (100.0%), Architecture & Engineering (100.0%), and Education, Arts & Media (100.0%), while the most female-oriented occupations are Life, Physical & Social Science (100.0%), Legal Services & Support (100.0%), and Arts, Media & Entertainment (100.0%).
| Occupation | Male | Female |
| Management | 15 (68.2%) | 7 (31.8%) |
| Business & Financial | 42 (67.7%) | 20 (32.3%) |
| Computers, Engineering & Science | 67 (97.1%) | 2 (2.9%) |
| Computers & Mathematics | 15 (100.0%) | 0 (0.0%) |
| Architecture & Engineering | 52 (100.0%) | 0 (0.0%) |
| Life, Physical & Social Science | 0 (0.0%) | 2 (100.0%) |
| Community & Social Service | 18 (56.2%) | 14 (43.8%) |
| Education, Arts & Media | 13 (100.0%) | 0 (0.0%) |
| Legal Services & Support | 0 (0.0%) | 4 (100.0%) |
| Education Instruction & Library | 5 (41.7%) | 7 (58.3%) |
| Arts, Media & Entertainment | 0 (0.0%) | 3 (100.0%) |
| Health Diagnosing & Treating | 46 (40.7%) | 67 (59.3%) |
| Health Technologists | 12 (26.1%) | 34 (73.9%) |
| Total (Category) | 188 (63.1%) | 110 (36.9%) |
| Total (Overall) | 378 (57.5%) | 280 (42.5%) |
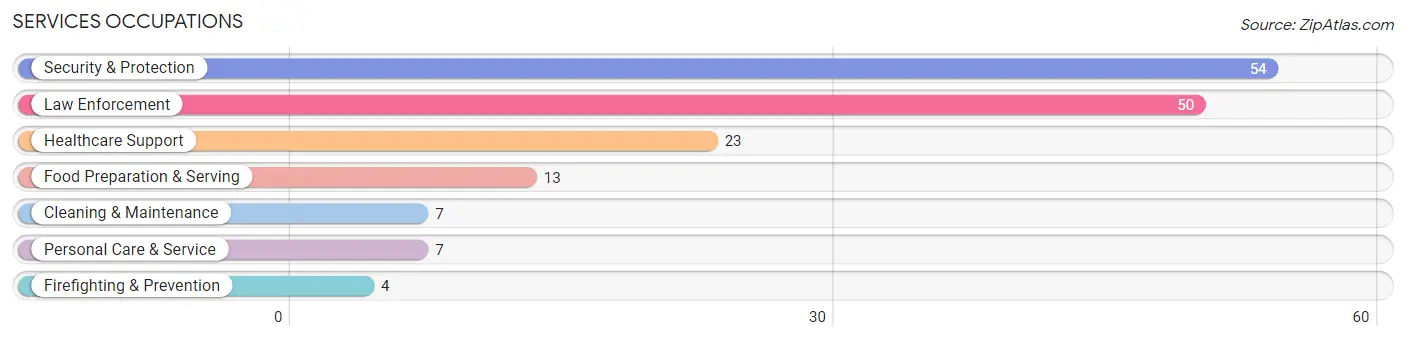
Services Occupations
The most common Services occupations in West Liberty are Security & Protection (54 | 8.2%), Law Enforcement (50 | 7.6%), Healthcare Support (23 | 3.5%), Food Preparation & Serving (13 | 2.0%), and Cleaning & Maintenance (7 | 1.1%).
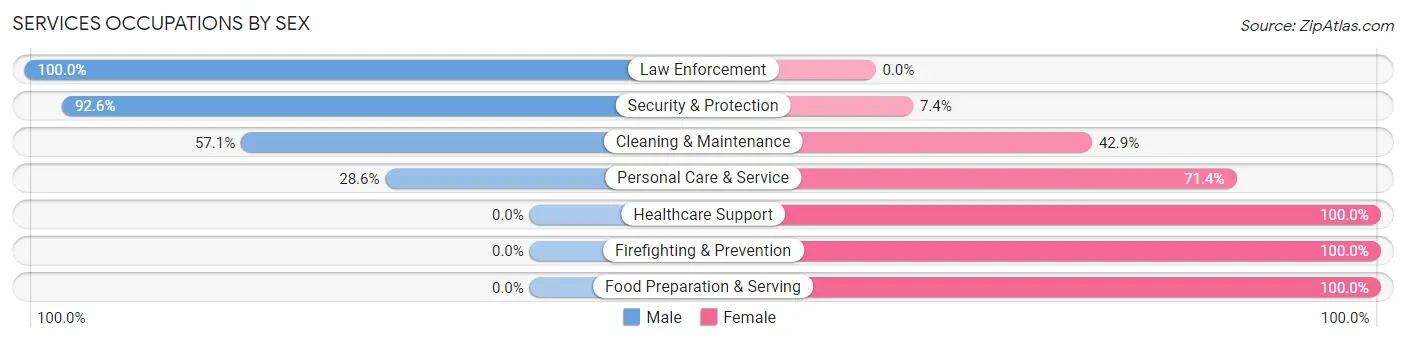
Services Occupations by Sex
Within the Services occupations in West Liberty, the most male-oriented occupations are Law Enforcement (100.0%), Security & Protection (92.6%), and Cleaning & Maintenance (57.1%), while the most female-oriented occupations are Healthcare Support (100.0%), Firefighting & Prevention (100.0%), and Food Preparation & Serving (100.0%).
| Occupation | Male | Female |
| Healthcare Support | 0 (0.0%) | 23 (100.0%) |
| Security & Protection | 50 (92.6%) | 4 (7.4%) |
| Firefighting & Prevention | 0 (0.0%) | 4 (100.0%) |
| Law Enforcement | 50 (100.0%) | 0 (0.0%) |
| Food Preparation & Serving | 0 (0.0%) | 13 (100.0%) |
| Cleaning & Maintenance | 4 (57.1%) | 3 (42.9%) |
| Personal Care & Service | 2 (28.6%) | 5 (71.4%) |
| Total (Category) | 56 (53.8%) | 48 (46.2%) |
| Total (Overall) | 378 (57.5%) | 280 (42.5%) |
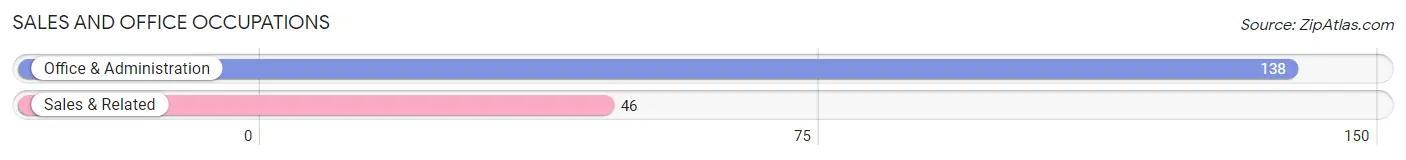
Sales and Office Occupations
The most common Sales and Office occupations in West Liberty are Office & Administration (138 | 21.0%), and Sales & Related (46 | 7.0%).
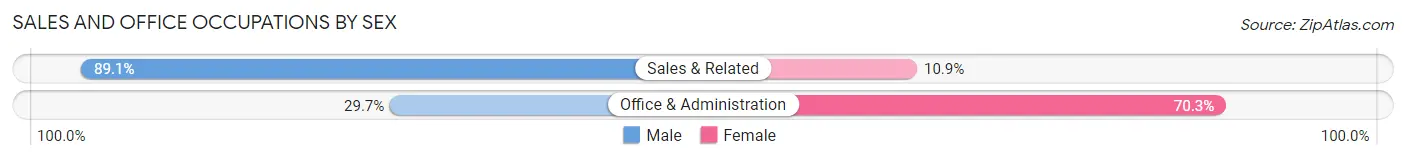
Sales and Office Occupations by Sex
| Occupation | Male | Female |
| Sales & Related | 41 (89.1%) | 5 (10.9%) |
| Office & Administration | 41 (29.7%) | 97 (70.3%) |
| Total (Category) | 82 (44.6%) | 102 (55.4%) |
| Total (Overall) | 378 (57.5%) | 280 (42.5%) |
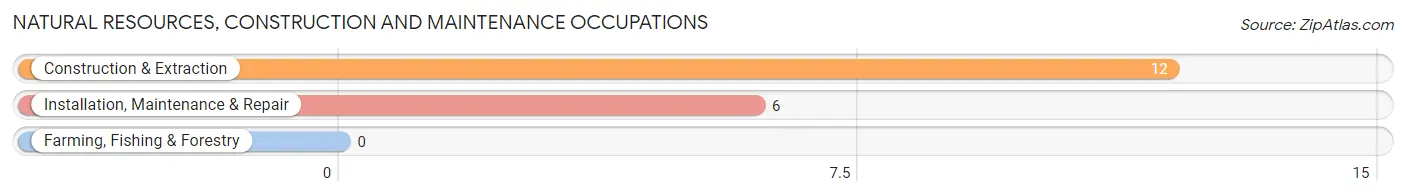
Natural Resources, Construction and Maintenance Occupations
The most common Natural Resources, Construction and Maintenance occupations in West Liberty are Construction & Extraction (12 | 1.8%), and Installation, Maintenance & Repair (6 | 0.9%).
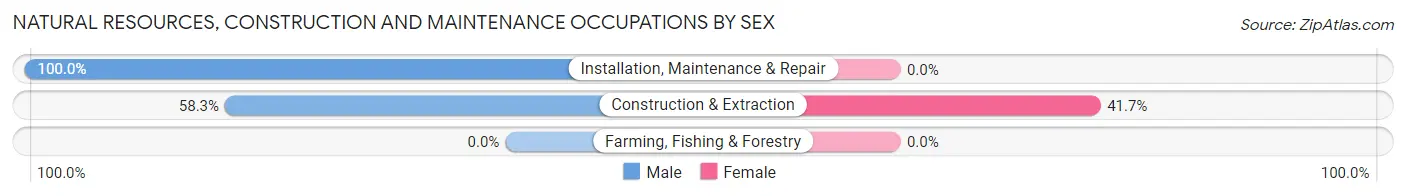
Natural Resources, Construction and Maintenance Occupations by Sex
| Occupation | Male | Female |
| Farming, Fishing & Forestry | 0 (0.0%) | 0 (0.0%) |
| Construction & Extraction | 7 (58.3%) | 5 (41.7%) |
| Installation, Maintenance & Repair | 6 (100.0%) | 0 (0.0%) |
| Total (Category) | 13 (72.2%) | 5 (27.8%) |
| Total (Overall) | 378 (57.5%) | 280 (42.5%) |
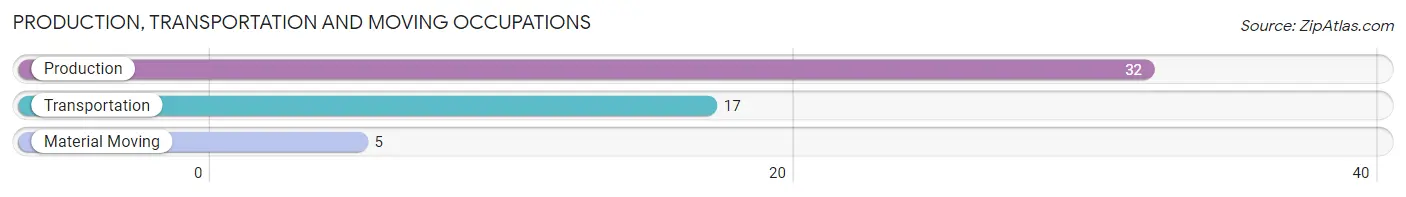
Production, Transportation and Moving Occupations
The most common Production, Transportation and Moving occupations in West Liberty are Production (32 | 4.9%), Transportation (17 | 2.6%), and Material Moving (5 | 0.8%).
Production, Transportation and Moving Occupations by Sex
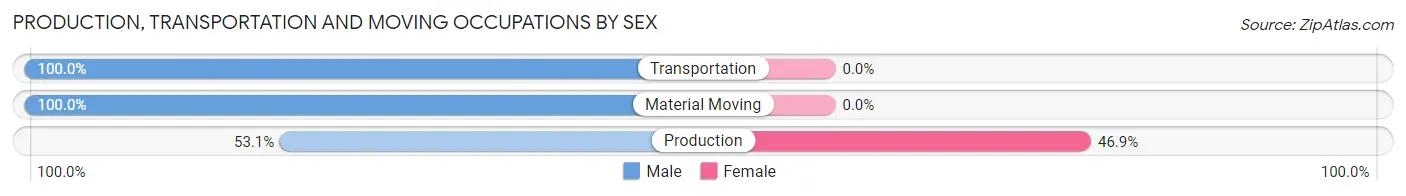
| Occupation | Male | Female |
| Production | 17 (53.1%) | 15 (46.9%) |
| Transportation | 17 (100.0%) | 0 (0.0%) |
| Material Moving | 5 (100.0%) | 0 (0.0%) |
| Total (Category) | 39 (72.2%) | 15 (27.8%) |
| Total (Overall) | 378 (57.5%) | 280 (42.5%) |
Employment Industries by Sex in West Liberty
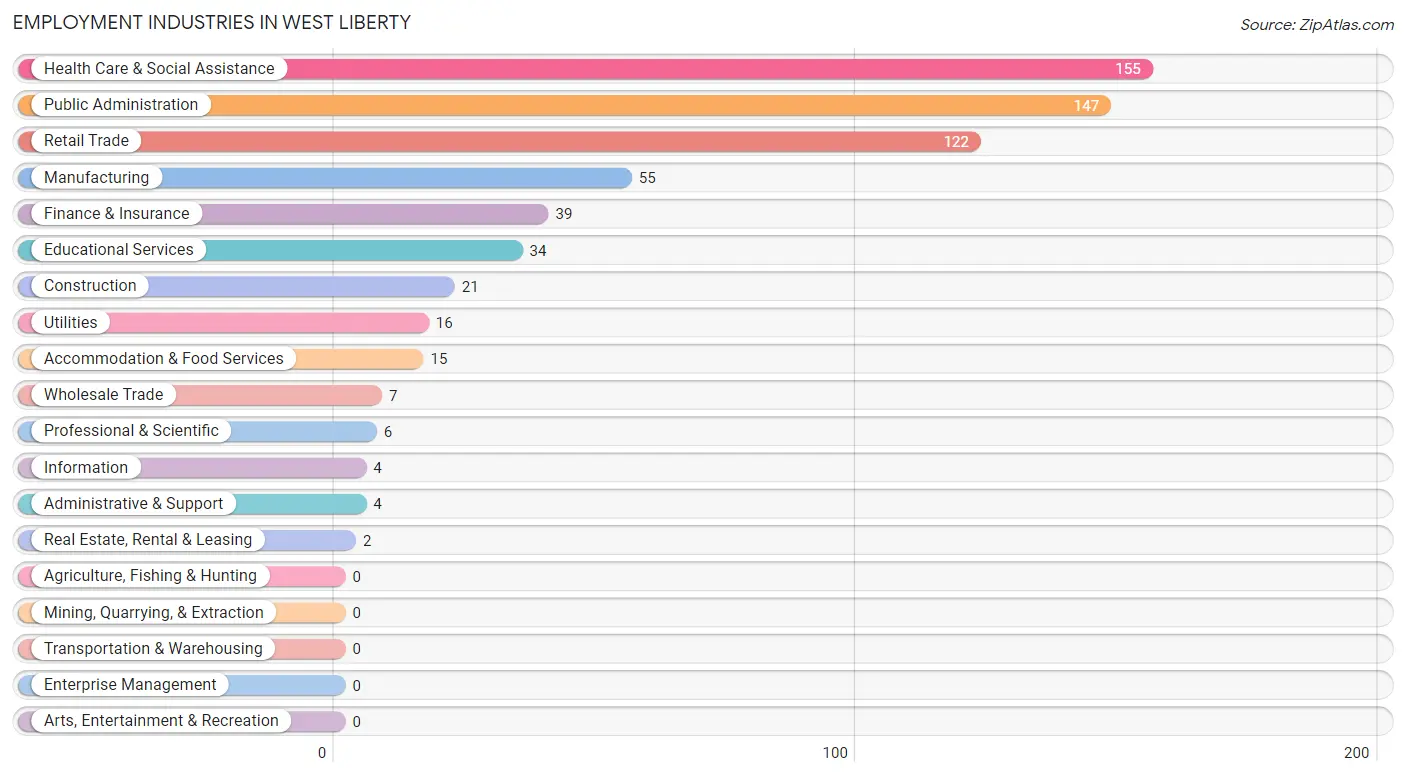
Employment Industries in West Liberty
The major employment industries in West Liberty include Health Care & Social Assistance (155 | 23.6%), Public Administration (147 | 22.3%), Retail Trade (122 | 18.5%), Manufacturing (55 | 8.4%), and Finance & Insurance (39 | 5.9%).
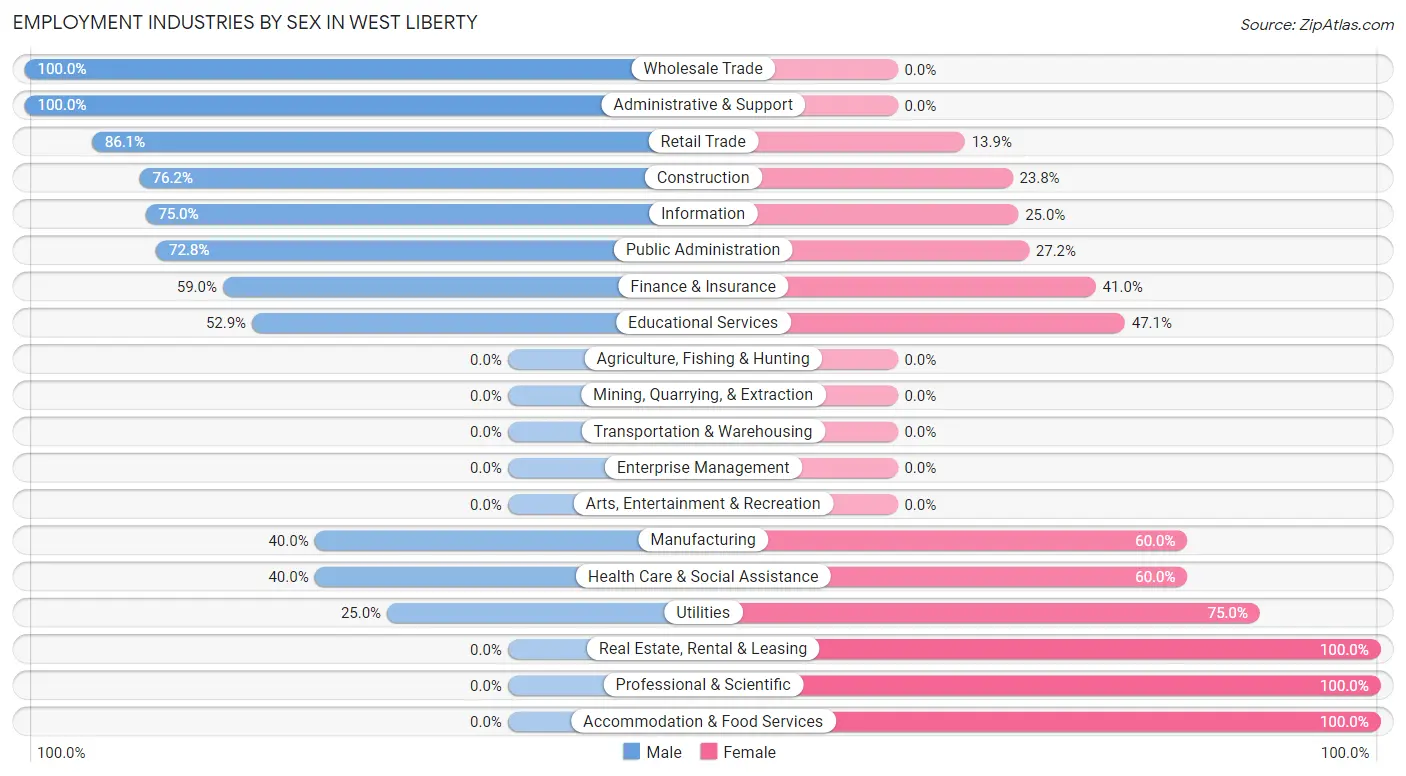
Employment Industries by Sex in West Liberty
The West Liberty industries that see more men than women are Wholesale Trade (100.0%), Administrative & Support (100.0%), and Retail Trade (86.1%), whereas the industries that tend to have a higher number of women are Real Estate, Rental & Leasing (100.0%), Professional & Scientific (100.0%), and Accommodation & Food Services (100.0%).
| Industry | Male | Female |
| Agriculture, Fishing & Hunting | 0 (0.0%) | 0 (0.0%) |
| Mining, Quarrying, & Extraction | 0 (0.0%) | 0 (0.0%) |
| Construction | 16 (76.2%) | 5 (23.8%) |
| Manufacturing | 22 (40.0%) | 33 (60.0%) |
| Wholesale Trade | 7 (100.0%) | 0 (0.0%) |
| Retail Trade | 105 (86.1%) | 17 (13.9%) |
| Transportation & Warehousing | 0 (0.0%) | 0 (0.0%) |
| Utilities | 4 (25.0%) | 12 (75.0%) |
| Information | 3 (75.0%) | 1 (25.0%) |
| Finance & Insurance | 23 (59.0%) | 16 (41.0%) |
| Real Estate, Rental & Leasing | 0 (0.0%) | 2 (100.0%) |
| Professional & Scientific | 0 (0.0%) | 6 (100.0%) |
| Enterprise Management | 0 (0.0%) | 0 (0.0%) |
| Administrative & Support | 4 (100.0%) | 0 (0.0%) |
| Educational Services | 18 (52.9%) | 16 (47.1%) |
| Health Care & Social Assistance | 62 (40.0%) | 93 (60.0%) |
| Arts, Entertainment & Recreation | 0 (0.0%) | 0 (0.0%) |
| Accommodation & Food Services | 0 (0.0%) | 15 (100.0%) |
| Public Administration | 107 (72.8%) | 40 (27.2%) |
| Total | 378 (57.5%) | 280 (42.5%) |
Education in West Liberty
School Enrollment in West Liberty
The most common levels of schooling among the 398 students in West Liberty are college / undergraduate (141 | 35.4%), middle school (101 | 25.4%), and high school (68 | 17.1%).
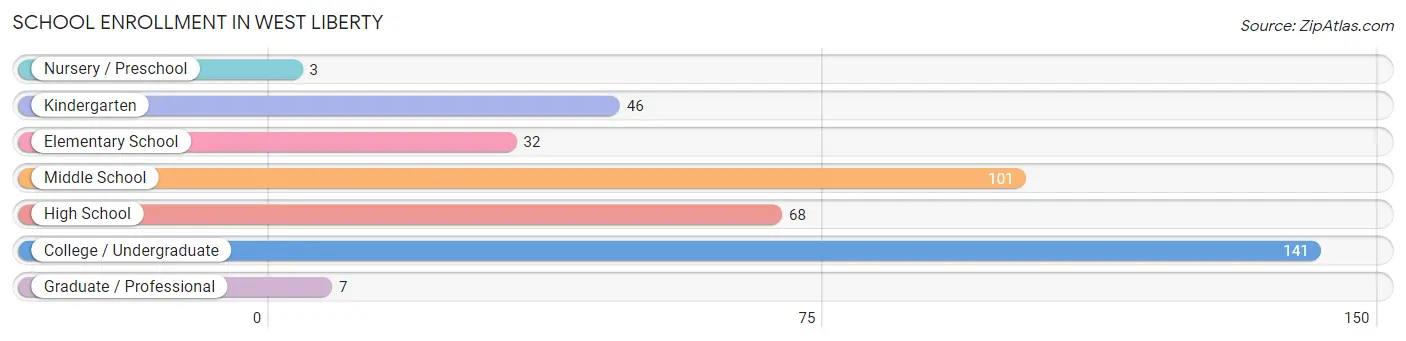
| School Level | # Students | % Students |
| Nursery / Preschool | 3 | 0.7% |
| Kindergarten | 46 | 11.6% |
| Elementary School | 32 | 8.0% |
| Middle School | 101 | 25.4% |
| High School | 68 | 17.1% |
| College / Undergraduate | 141 | 35.4% |
| Graduate / Professional | 7 | 1.8% |
| Total | 398 | 100.0% |
School Enrollment by Age by Funding Source in West Liberty
Out of a total of 398 students who are enrolled in schools in West Liberty, 23 (5.8%) attend a private institution, while the remaining 375 (94.2%) are enrolled in public schools. The age group of 5 to 9 year old has the highest likelihood of being enrolled in private schools, with 15 (20.5% in the age bracket) enrolled. Conversely, the age group of 3 to 4 year olds has the lowest likelihood of being enrolled in a private school, with 3 (100.0% in the age bracket) attending a public institution.
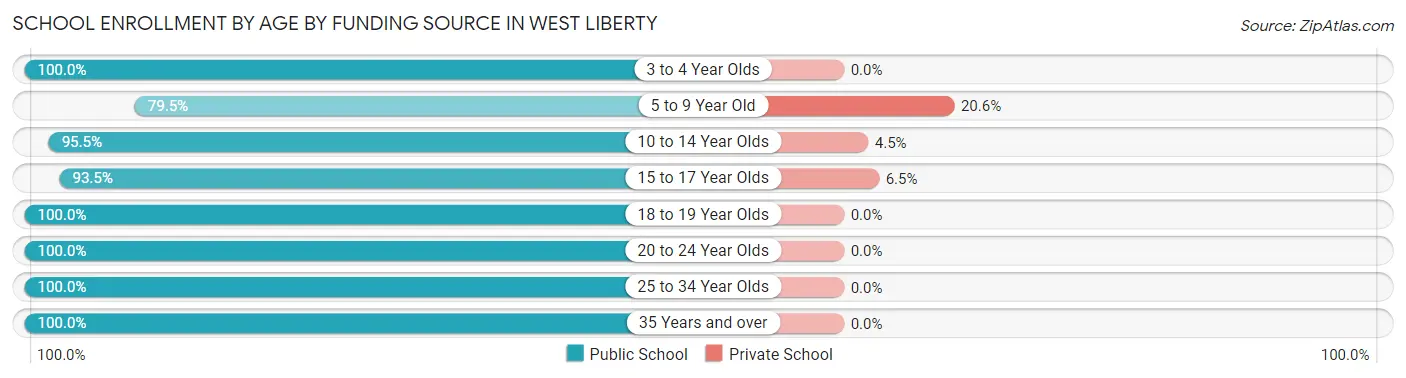
| Age Bracket | Public School | Private School |
| 3 to 4 Year Olds | 3 (100.0%) | 0 (0.0%) |
| 5 to 9 Year Old | 58 (79.4%) | 15 (20.5%) |
| 10 to 14 Year Olds | 106 (95.5%) | 5 (4.5%) |
| 15 to 17 Year Olds | 43 (93.5%) | 3 (6.5%) |
| 18 to 19 Year Olds | 12 (100.0%) | 0 (0.0%) |
| 20 to 24 Year Olds | 36 (100.0%) | 0 (0.0%) |
| 25 to 34 Year Olds | 23 (100.0%) | 0 (0.0%) |
| 35 Years and over | 94 (100.0%) | 0 (0.0%) |
| Total | 375 (94.2%) | 23 (5.8%) |
Educational Attainment by Field of Study in West Liberty
Arts & humanities (84 | 19.7%), business (66 | 15.5%), science & technology (60 | 14.1%), engineering (57 | 13.4%), and education (41 | 9.6%) are the most common fields of study among 426 individuals in West Liberty who have obtained a bachelor's degree or higher.
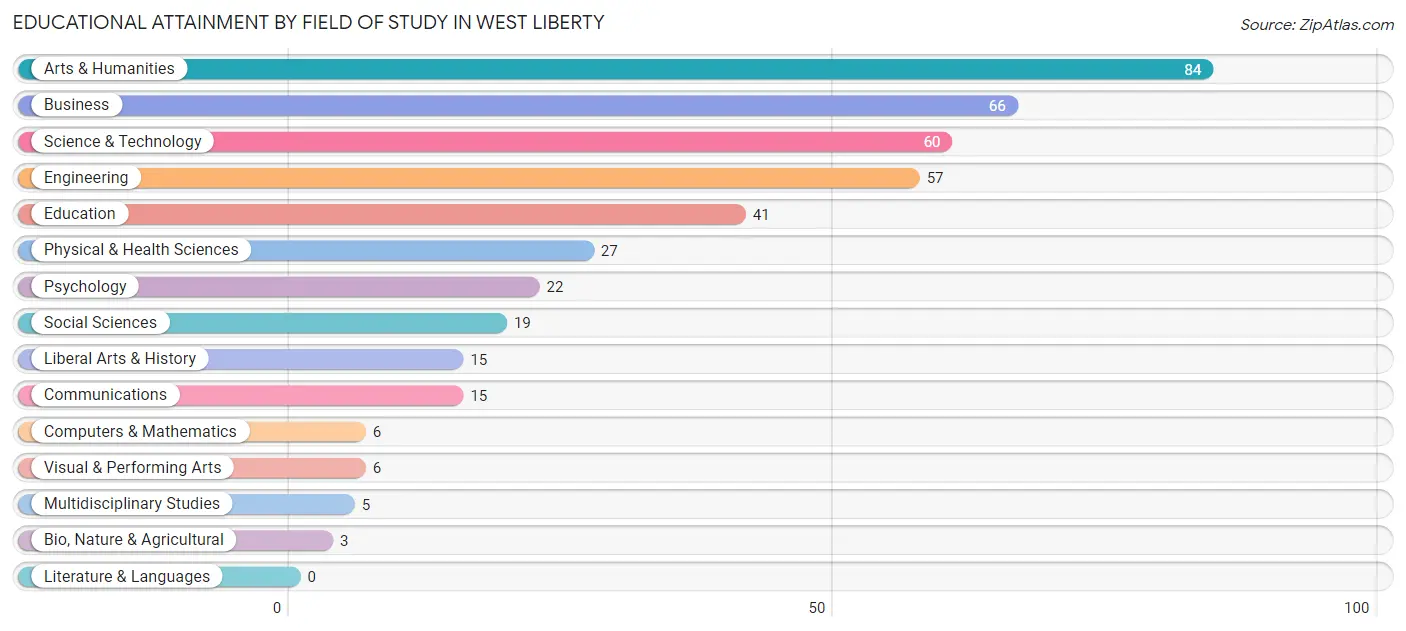
| Field of Study | # Graduates | % Graduates |
| Computers & Mathematics | 6 | 1.4% |
| Bio, Nature & Agricultural | 3 | 0.7% |
| Physical & Health Sciences | 27 | 6.3% |
| Psychology | 22 | 5.2% |
| Social Sciences | 19 | 4.5% |
| Engineering | 57 | 13.4% |
| Multidisciplinary Studies | 5 | 1.2% |
| Science & Technology | 60 | 14.1% |
| Business | 66 | 15.5% |
| Education | 41 | 9.6% |
| Literature & Languages | 0 | 0.0% |
| Liberal Arts & History | 15 | 3.5% |
| Visual & Performing Arts | 6 | 1.4% |
| Communications | 15 | 3.5% |
| Arts & Humanities | 84 | 19.7% |
| Total | 426 | 100.0% |
Transportation & Commute in West Liberty
Vehicle Availability by Sex in West Liberty
The most prevalent vehicle ownership categories in West Liberty are males with 2 vehicles (160, accounting for 42.3%) and females with 2 vehicles (107, making up 57.1%).
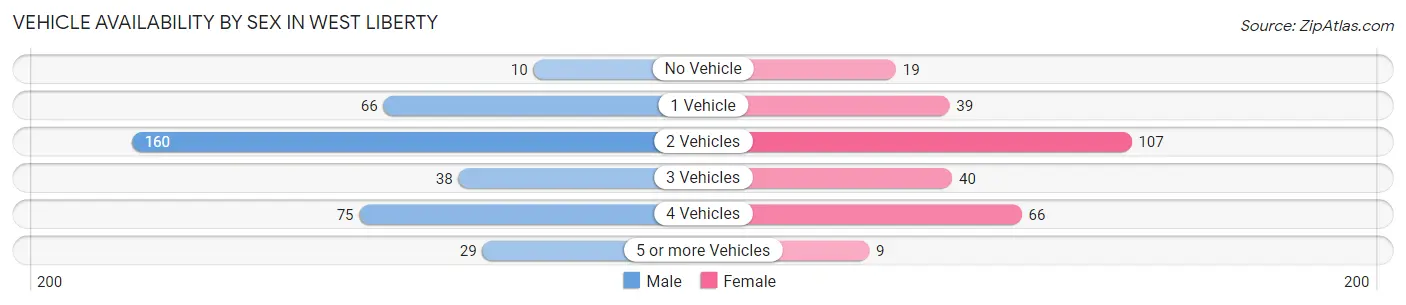
| Vehicles Available | Male | Female |
| No Vehicle | 10 (2.6%) | 19 (6.8%) |
| 1 Vehicle | 66 (17.5%) | 39 (13.9%) |
| 2 Vehicles | 160 (42.3%) | 107 (38.2%) |
| 3 Vehicles | 38 (10.1%) | 40 (14.3%) |
| 4 Vehicles | 75 (19.8%) | 66 (23.6%) |
| 5 or more Vehicles | 29 (7.7%) | 9 (3.2%) |
| Total | 378 (100.0%) | 280 (100.0%) |
Commute Time in West Liberty
The most frequently occuring commute durations in West Liberty are 5 to 9 minutes (211 commuters, 36.1%), less than 5 minutes (117 commuters, 20.0%), and 10 to 14 minutes (57 commuters, 9.7%).
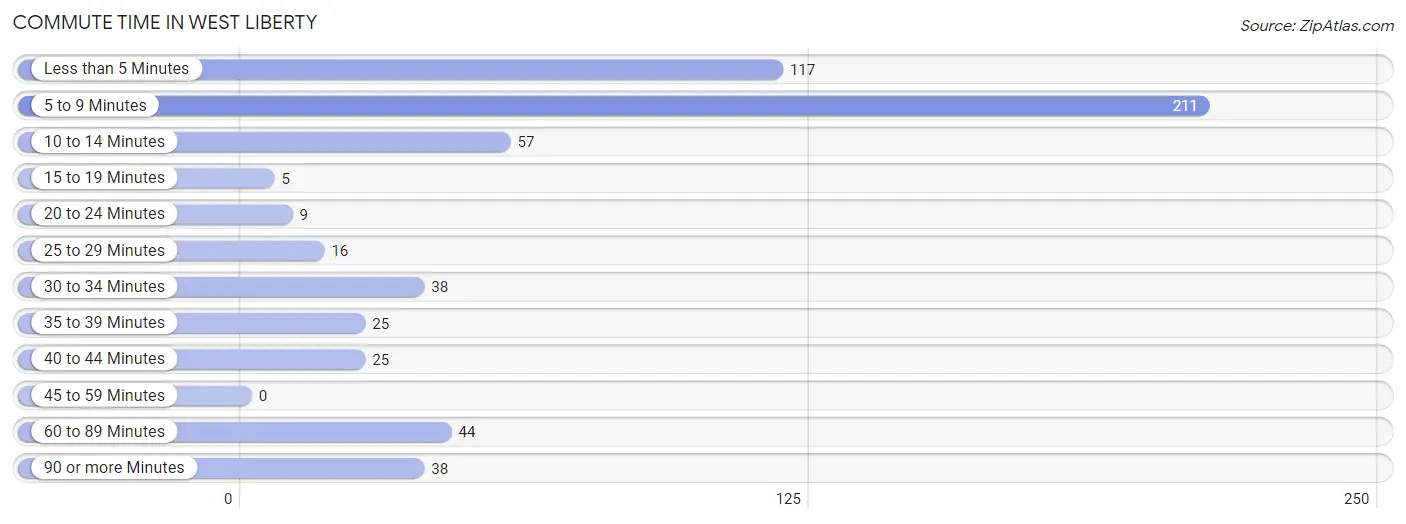
| Commute Time | # Commuters | % Commuters |
| Less than 5 Minutes | 117 | 20.0% |
| 5 to 9 Minutes | 211 | 36.1% |
| 10 to 14 Minutes | 57 | 9.7% |
| 15 to 19 Minutes | 5 | 0.9% |
| 20 to 24 Minutes | 9 | 1.5% |
| 25 to 29 Minutes | 16 | 2.7% |
| 30 to 34 Minutes | 38 | 6.5% |
| 35 to 39 Minutes | 25 | 4.3% |
| 40 to 44 Minutes | 25 | 4.3% |
| 45 to 59 Minutes | 0 | 0.0% |
| 60 to 89 Minutes | 44 | 7.5% |
| 90 or more Minutes | 38 | 6.5% |
Commute Time by Sex in West Liberty
The most common commute times in West Liberty are 5 to 9 minutes (119 commuters, 36.3%) for males and 5 to 9 minutes (92 commuters, 35.8%) for females.
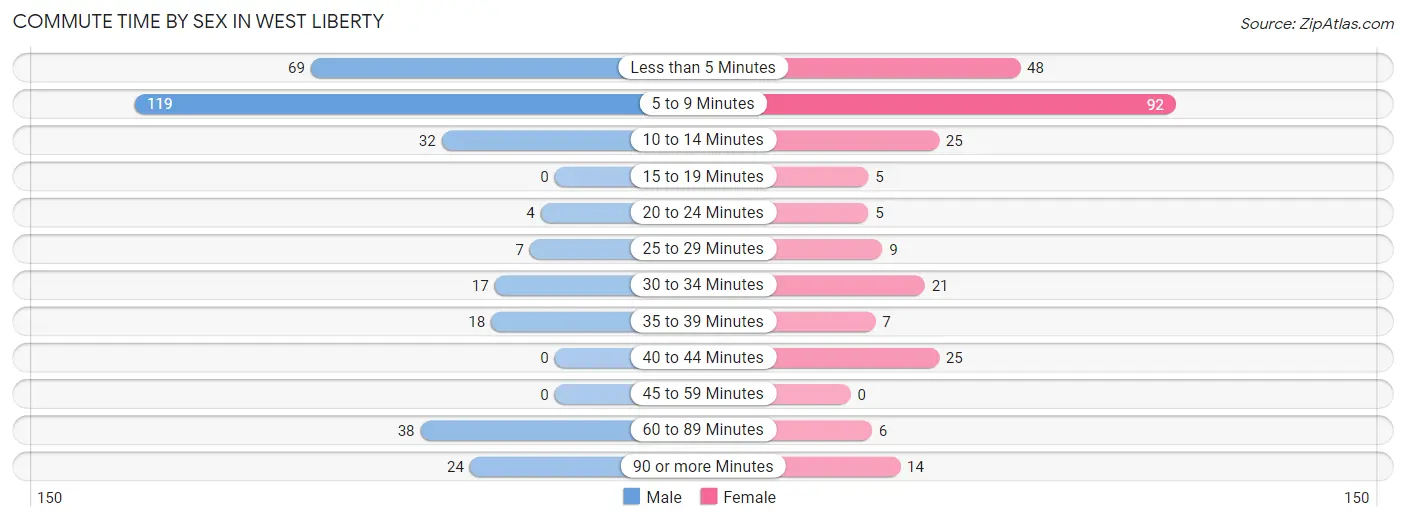
| Commute Time | Male | Female |
| Less than 5 Minutes | 69 (21.0%) | 48 (18.7%) |
| 5 to 9 Minutes | 119 (36.3%) | 92 (35.8%) |
| 10 to 14 Minutes | 32 (9.8%) | 25 (9.7%) |
| 15 to 19 Minutes | 0 (0.0%) | 5 (1.9%) |
| 20 to 24 Minutes | 4 (1.2%) | 5 (1.9%) |
| 25 to 29 Minutes | 7 (2.1%) | 9 (3.5%) |
| 30 to 34 Minutes | 17 (5.2%) | 21 (8.2%) |
| 35 to 39 Minutes | 18 (5.5%) | 7 (2.7%) |
| 40 to 44 Minutes | 0 (0.0%) | 25 (9.7%) |
| 45 to 59 Minutes | 0 (0.0%) | 0 (0.0%) |
| 60 to 89 Minutes | 38 (11.6%) | 6 (2.3%) |
| 90 or more Minutes | 24 (7.3%) | 14 (5.4%) |
Time of Departure to Work by Sex in West Liberty
The most frequent times of departure to work in West Liberty are 7:30 AM to 7:59 AM (105, 32.0%) for males and 7:30 AM to 7:59 AM (56, 21.8%) for females.
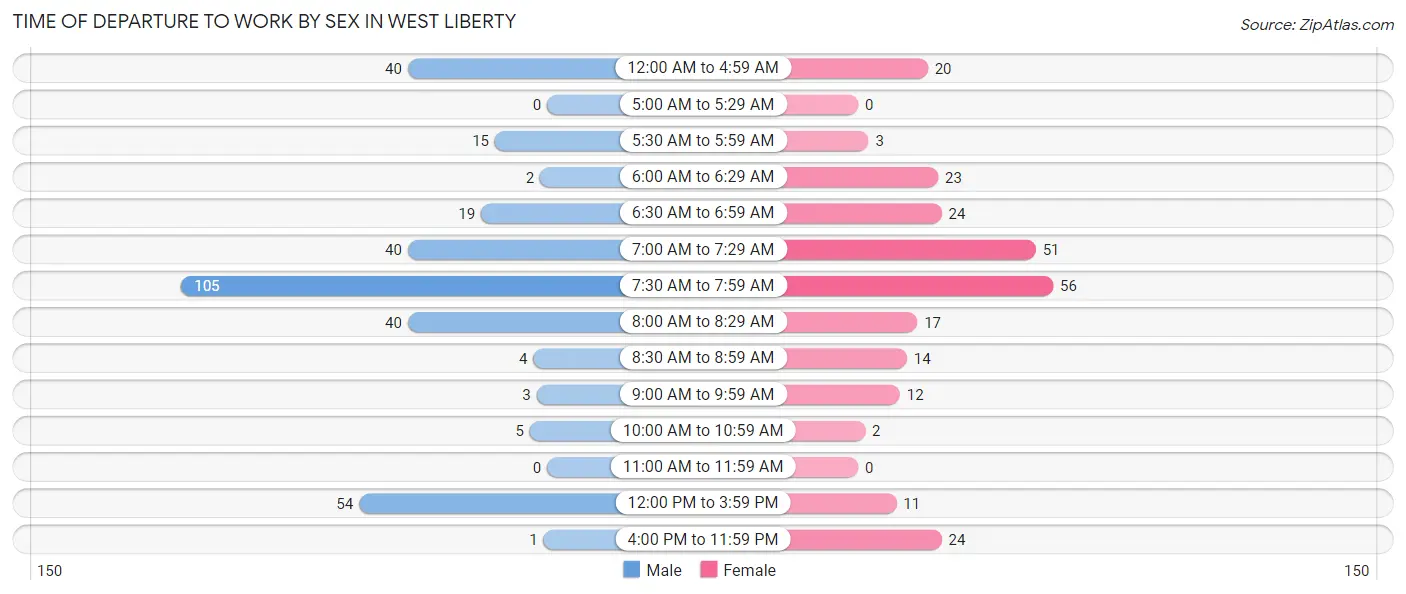
| Time of Departure | Male | Female |
| 12:00 AM to 4:59 AM | 40 (12.2%) | 20 (7.8%) |
| 5:00 AM to 5:29 AM | 0 (0.0%) | 0 (0.0%) |
| 5:30 AM to 5:59 AM | 15 (4.6%) | 3 (1.2%) |
| 6:00 AM to 6:29 AM | 2 (0.6%) | 23 (8.9%) |
| 6:30 AM to 6:59 AM | 19 (5.8%) | 24 (9.3%) |
| 7:00 AM to 7:29 AM | 40 (12.2%) | 51 (19.8%) |
| 7:30 AM to 7:59 AM | 105 (32.0%) | 56 (21.8%) |
| 8:00 AM to 8:29 AM | 40 (12.2%) | 17 (6.6%) |
| 8:30 AM to 8:59 AM | 4 (1.2%) | 14 (5.4%) |
| 9:00 AM to 9:59 AM | 3 (0.9%) | 12 (4.7%) |
| 10:00 AM to 10:59 AM | 5 (1.5%) | 2 (0.8%) |
| 11:00 AM to 11:59 AM | 0 (0.0%) | 0 (0.0%) |
| 12:00 PM to 3:59 PM | 54 (16.5%) | 11 (4.3%) |
| 4:00 PM to 11:59 PM | 1 (0.3%) | 24 (9.3%) |
| Total | 328 (100.0%) | 257 (100.0%) |
Housing Occupancy in West Liberty
Occupancy by Ownership in West Liberty
Of the total 629 dwellings in West Liberty, owner-occupied units account for 352 (56.0%), while renter-occupied units make up 277 (44.0%).
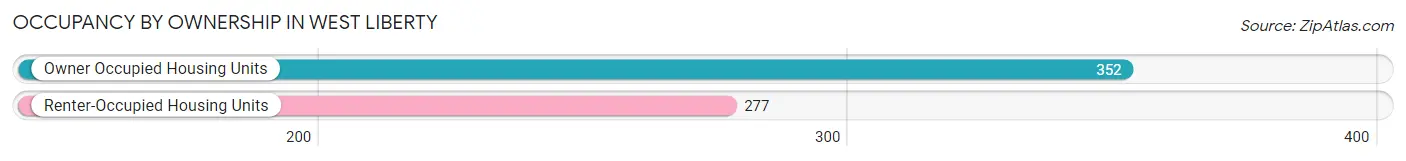
| Occupancy | # Housing Units | % Housing Units |
| Owner Occupied Housing Units | 352 | 56.0% |
| Renter-Occupied Housing Units | 277 | 44.0% |
| Total Occupied Housing Units | 629 | 100.0% |
Occupancy by Household Size in West Liberty
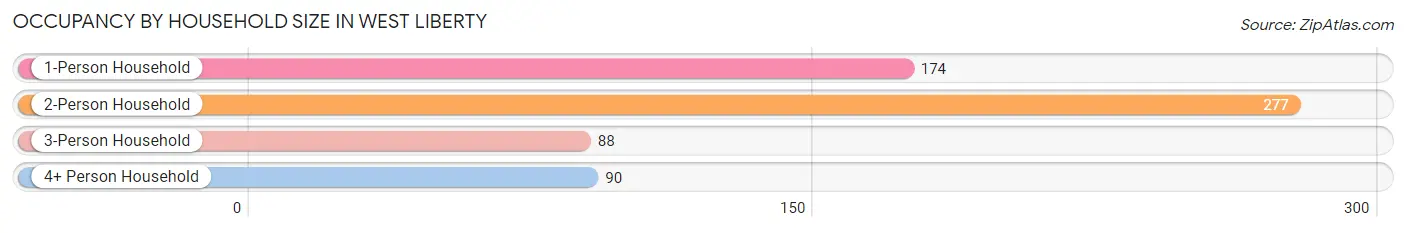
| Household Size | # Housing Units | % Housing Units |
| 1-Person Household | 174 | 27.7% |
| 2-Person Household | 277 | 44.0% |
| 3-Person Household | 88 | 14.0% |
| 4+ Person Household | 90 | 14.3% |
| Total Housing Units | 629 | 100.0% |
Occupancy by Ownership by Household Size in West Liberty
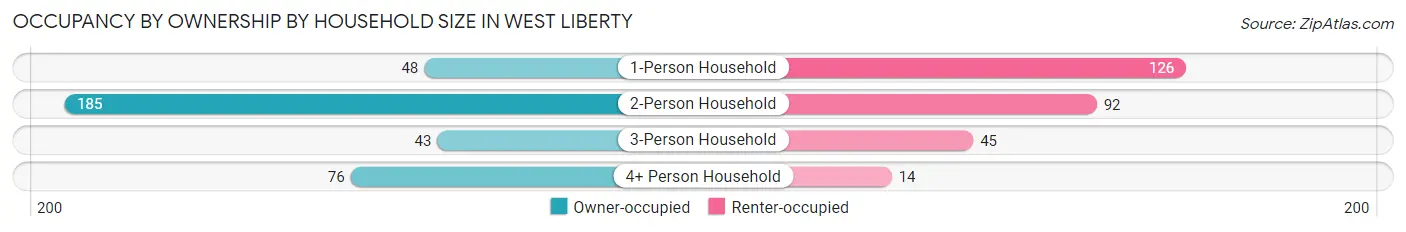
| Household Size | Owner-occupied | Renter-occupied |
| 1-Person Household | 48 (27.6%) | 126 (72.4%) |
| 2-Person Household | 185 (66.8%) | 92 (33.2%) |
| 3-Person Household | 43 (48.9%) | 45 (51.1%) |
| 4+ Person Household | 76 (84.4%) | 14 (15.6%) |
| Total Housing Units | 352 (56.0%) | 277 (44.0%) |
Occupancy by Educational Attainment in West Liberty
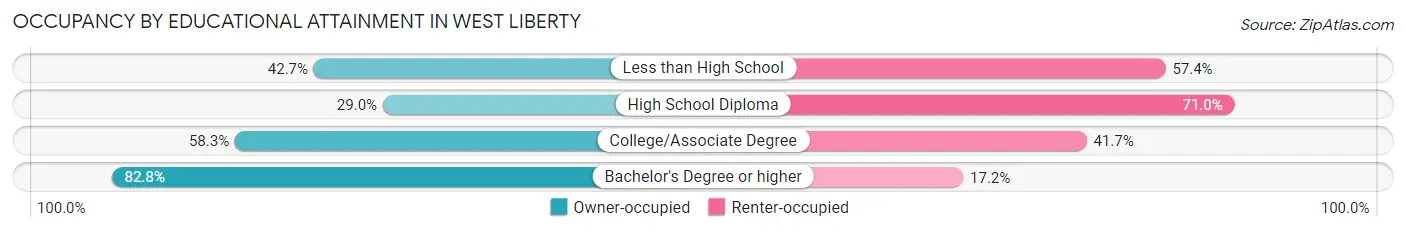
| Household Size | Owner-occupied | Renter-occupied |
| Less than High School | 29 (42.6%) | 39 (57.4%) |
| High School Diploma | 53 (29.0%) | 130 (71.0%) |
| College/Associate Degree | 102 (58.3%) | 73 (41.7%) |
| Bachelor's Degree or higher | 168 (82.8%) | 35 (17.2%) |
Occupancy by Age of Householder in West Liberty
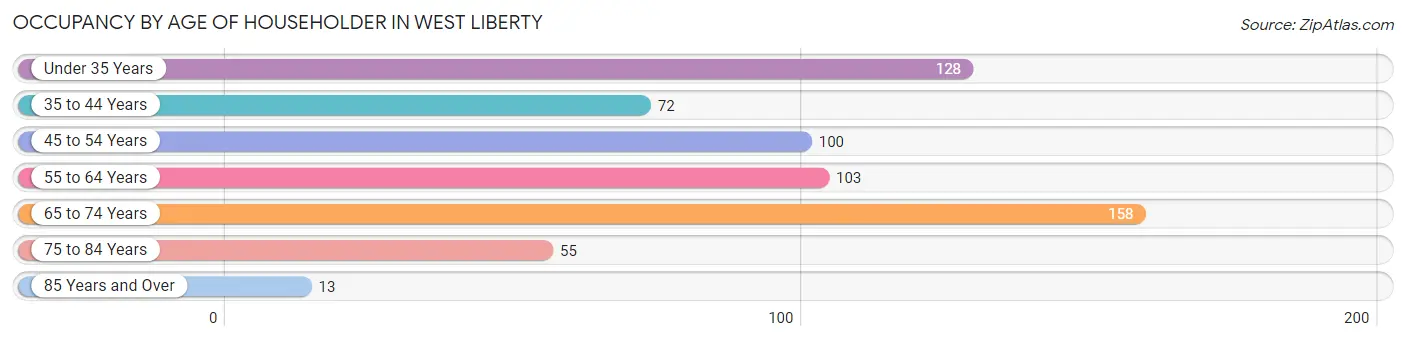
| Age Bracket | # Households | % Households |
| Under 35 Years | 128 | 20.3% |
| 35 to 44 Years | 72 | 11.5% |
| 45 to 54 Years | 100 | 15.9% |
| 55 to 64 Years | 103 | 16.4% |
| 65 to 74 Years | 158 | 25.1% |
| 75 to 84 Years | 55 | 8.7% |
| 85 Years and Over | 13 | 2.1% |
| Total | 629 | 100.0% |
Housing Finances in West Liberty
Median Income by Occupancy in West Liberty

| Occupancy Type | # Households | Median Income |
| Owner-Occupied | 352 (56.0%) | $65,500 |
| Renter-Occupied | 277 (44.0%) | $28,625 |
| Average | 629 (100.0%) | $47,083 |
Occupancy by Householder Income Bracket in West Liberty
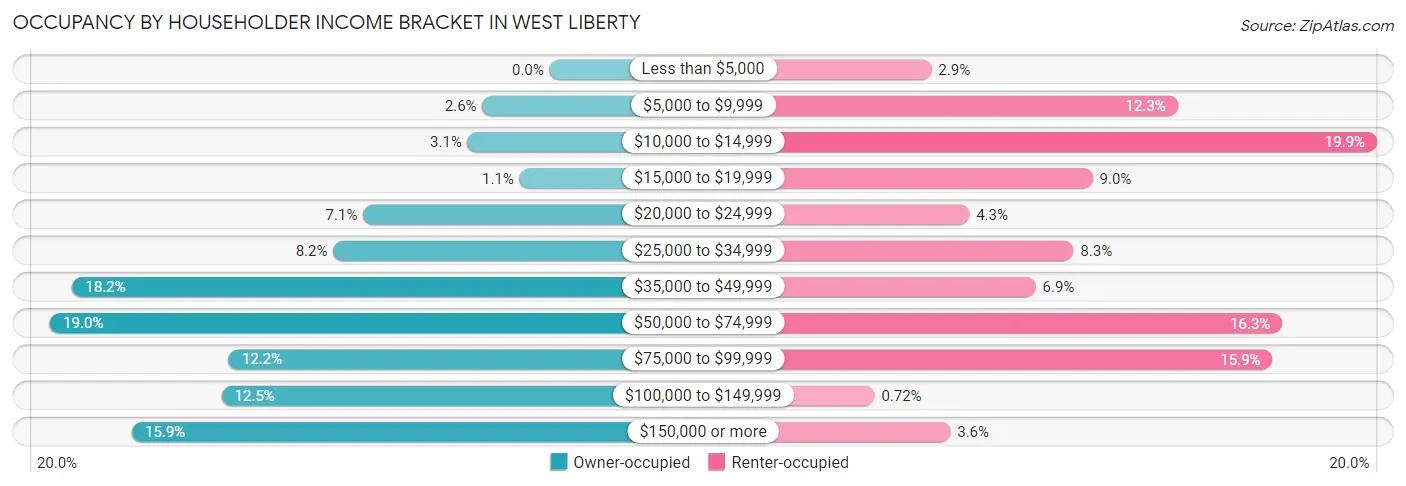
| Income Bracket | Owner-occupied | Renter-occupied |
| Less than $5,000 | 0 (0.0%) | 8 (2.9%) |
| $5,000 to $9,999 | 9 (2.6%) | 34 (12.3%) |
| $10,000 to $14,999 | 11 (3.1%) | 55 (19.9%) |
| $15,000 to $19,999 | 4 (1.1%) | 25 (9.0%) |
| $20,000 to $24,999 | 25 (7.1%) | 12 (4.3%) |
| $25,000 to $34,999 | 29 (8.2%) | 23 (8.3%) |
| $35,000 to $49,999 | 64 (18.2%) | 19 (6.9%) |
| $50,000 to $74,999 | 67 (19.0%) | 45 (16.3%) |
| $75,000 to $99,999 | 43 (12.2%) | 44 (15.9%) |
| $100,000 to $149,999 | 44 (12.5%) | 2 (0.7%) |
| $150,000 or more | 56 (15.9%) | 10 (3.6%) |
| Total | 352 (100.0%) | 277 (100.0%) |
Monthly Housing Cost Tiers in West Liberty
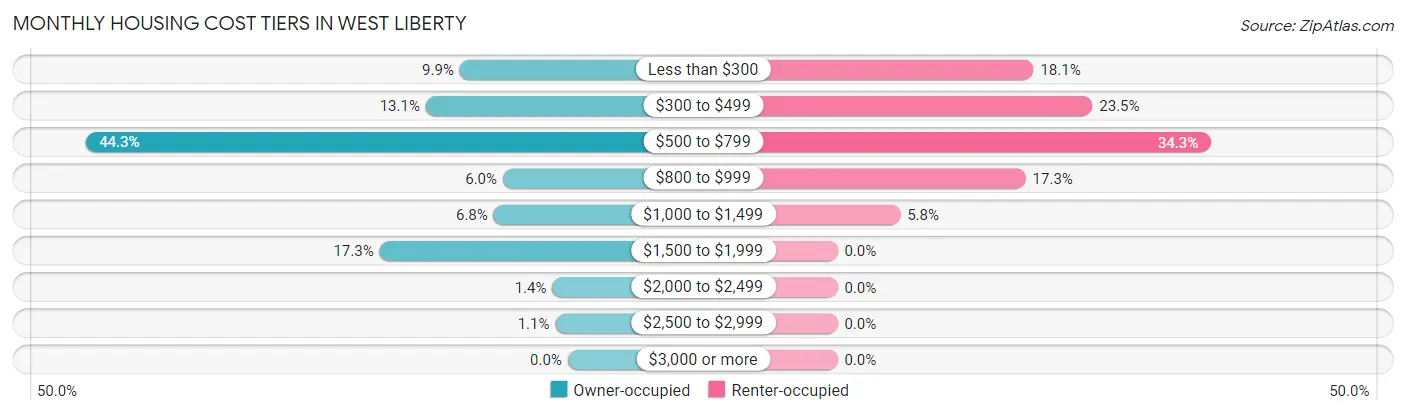
| Monthly Cost | Owner-occupied | Renter-occupied |
| Less than $300 | 35 (9.9%) | 50 (18.0%) |
| $300 to $499 | 46 (13.1%) | 65 (23.5%) |
| $500 to $799 | 156 (44.3%) | 95 (34.3%) |
| $800 to $999 | 21 (6.0%) | 48 (17.3%) |
| $1,000 to $1,499 | 24 (6.8%) | 16 (5.8%) |
| $1,500 to $1,999 | 61 (17.3%) | 0 (0.0%) |
| $2,000 to $2,499 | 5 (1.4%) | 0 (0.0%) |
| $2,500 to $2,999 | 4 (1.1%) | 0 (0.0%) |
| $3,000 or more | 0 (0.0%) | 0 (0.0%) |
| Total | 352 (100.0%) | 277 (100.0%) |
Physical Housing Characteristics in West Liberty
Housing Structures in West Liberty
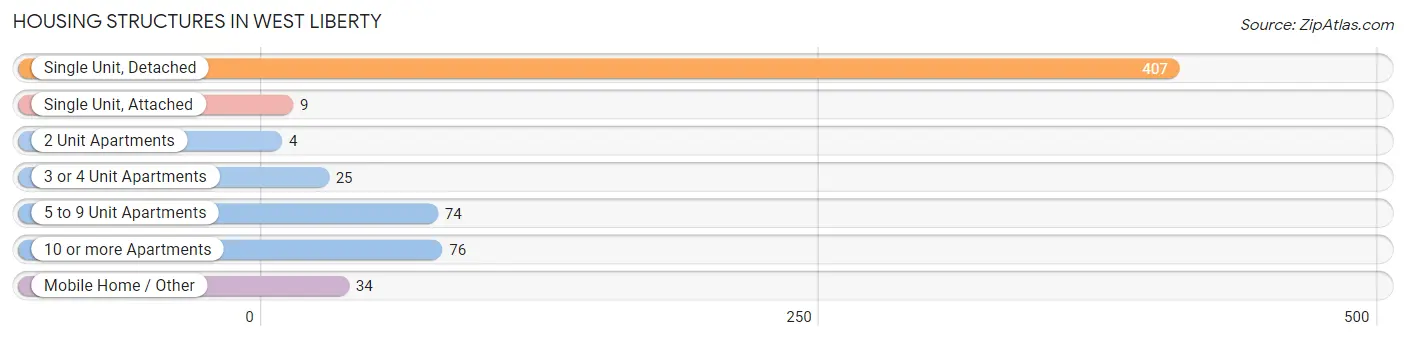
| Structure Type | # Housing Units | % Housing Units |
| Single Unit, Detached | 407 | 64.7% |
| Single Unit, Attached | 9 | 1.4% |
| 2 Unit Apartments | 4 | 0.6% |
| 3 or 4 Unit Apartments | 25 | 4.0% |
| 5 to 9 Unit Apartments | 74 | 11.8% |
| 10 or more Apartments | 76 | 12.1% |
| Mobile Home / Other | 34 | 5.4% |
| Total | 629 | 100.0% |
Housing Structures by Occupancy in West Liberty
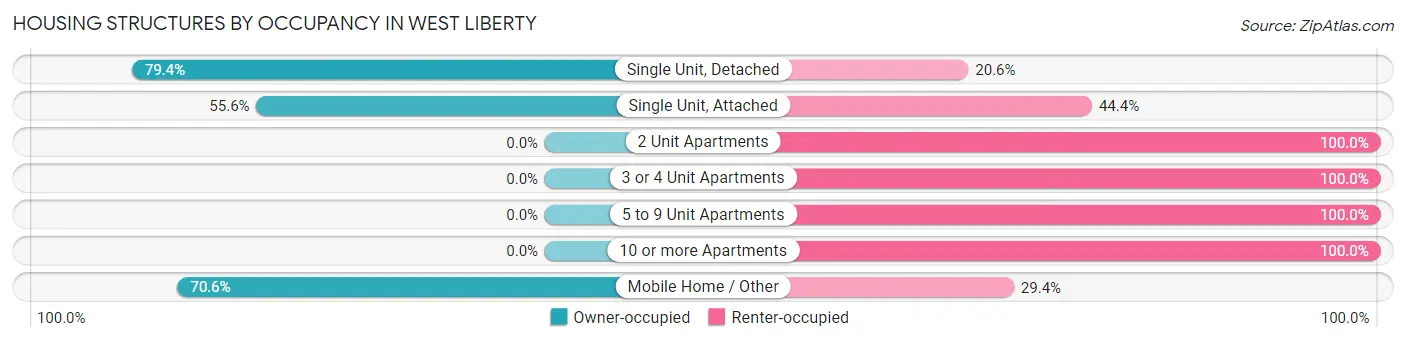
| Structure Type | Owner-occupied | Renter-occupied |
| Single Unit, Detached | 323 (79.4%) | 84 (20.6%) |
| Single Unit, Attached | 5 (55.6%) | 4 (44.4%) |
| 2 Unit Apartments | 0 (0.0%) | 4 (100.0%) |
| 3 or 4 Unit Apartments | 0 (0.0%) | 25 (100.0%) |
| 5 to 9 Unit Apartments | 0 (0.0%) | 74 (100.0%) |
| 10 or more Apartments | 0 (0.0%) | 76 (100.0%) |
| Mobile Home / Other | 24 (70.6%) | 10 (29.4%) |
| Total | 352 (56.0%) | 277 (44.0%) |
Housing Structures by Number of Rooms in West Liberty
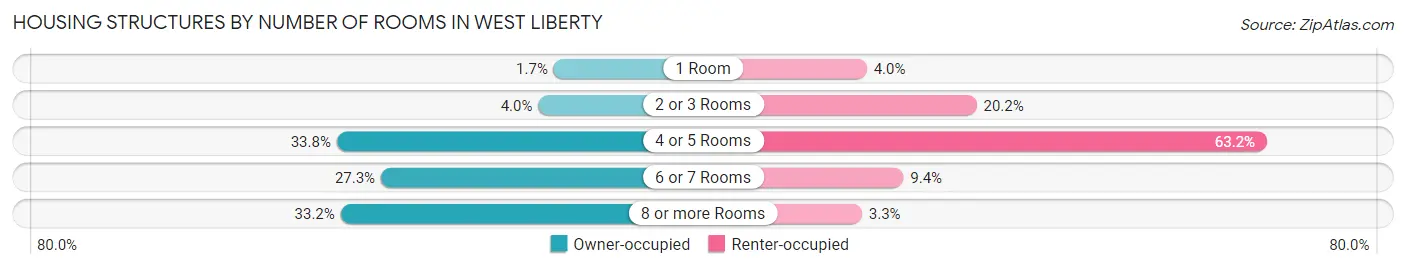
| Number of Rooms | Owner-occupied | Renter-occupied |
| 1 Room | 6 (1.7%) | 11 (4.0%) |
| 2 or 3 Rooms | 14 (4.0%) | 56 (20.2%) |
| 4 or 5 Rooms | 119 (33.8%) | 175 (63.2%) |
| 6 or 7 Rooms | 96 (27.3%) | 26 (9.4%) |
| 8 or more Rooms | 117 (33.2%) | 9 (3.3%) |
| Total | 352 (100.0%) | 277 (100.0%) |
Housing Structure by Heating Type in West Liberty
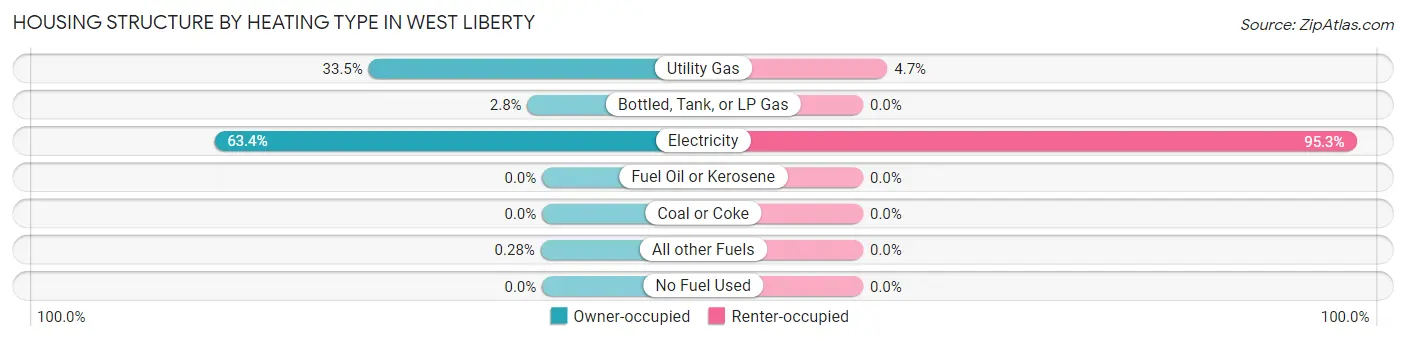
| Heating Type | Owner-occupied | Renter-occupied |
| Utility Gas | 118 (33.5%) | 13 (4.7%) |
| Bottled, Tank, or LP Gas | 10 (2.8%) | 0 (0.0%) |
| Electricity | 223 (63.3%) | 264 (95.3%) |
| Fuel Oil or Kerosene | 0 (0.0%) | 0 (0.0%) |
| Coal or Coke | 0 (0.0%) | 0 (0.0%) |
| All other Fuels | 1 (0.3%) | 0 (0.0%) |
| No Fuel Used | 0 (0.0%) | 0 (0.0%) |
| Total | 352 (100.0%) | 277 (100.0%) |
Household Vehicle Usage in West Liberty
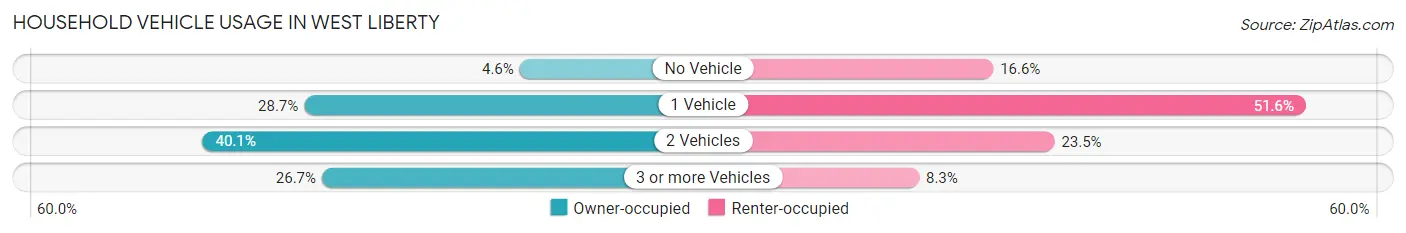
| Vehicles per Household | Owner-occupied | Renter-occupied |
| No Vehicle | 16 (4.5%) | 46 (16.6%) |
| 1 Vehicle | 101 (28.7%) | 143 (51.6%) |
| 2 Vehicles | 141 (40.1%) | 65 (23.5%) |
| 3 or more Vehicles | 94 (26.7%) | 23 (8.3%) |
| Total | 352 (100.0%) | 277 (100.0%) |
Real Estate & Mortgages in West Liberty
Real Estate and Mortgage Overview in West Liberty
| Characteristic | Without Mortgage | With Mortgage |
| Housing Units | 181 | 171 |
| Median Property Value | $161,300 | $169,700 |
| Median Household Income | $66,438 | $12 |
| Monthly Housing Costs | $529 | $0 |
| Real Estate Taxes | $993 | $9 |
Property Value by Mortgage Status in West Liberty
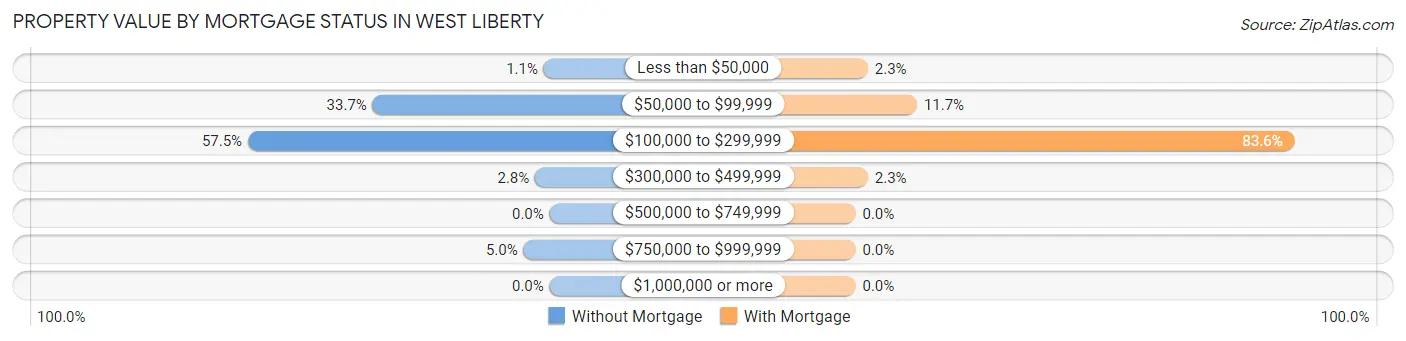
| Property Value | Without Mortgage | With Mortgage |
| Less than $50,000 | 2 (1.1%) | 4 (2.3%) |
| $50,000 to $99,999 | 61 (33.7%) | 20 (11.7%) |
| $100,000 to $299,999 | 104 (57.5%) | 143 (83.6%) |
| $300,000 to $499,999 | 5 (2.8%) | 4 (2.3%) |
| $500,000 to $749,999 | 0 (0.0%) | 0 (0.0%) |
| $750,000 to $999,999 | 9 (5.0%) | 0 (0.0%) |
| $1,000,000 or more | 0 (0.0%) | 0 (0.0%) |
| Total | 181 (100.0%) | 171 (100.0%) |
Household Income by Mortgage Status in West Liberty
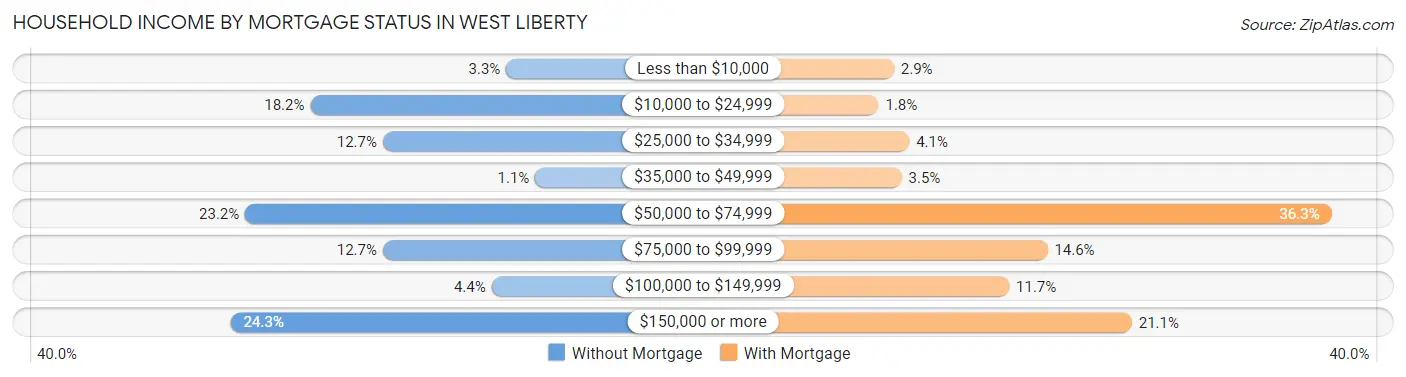
| Household Income | Without Mortgage | With Mortgage |
| Less than $10,000 | 6 (3.3%) | 5 (2.9%) |
| $10,000 to $24,999 | 33 (18.2%) | 3 (1.8%) |
| $25,000 to $34,999 | 23 (12.7%) | 7 (4.1%) |
| $35,000 to $49,999 | 2 (1.1%) | 6 (3.5%) |
| $50,000 to $74,999 | 42 (23.2%) | 62 (36.3%) |
| $75,000 to $99,999 | 23 (12.7%) | 25 (14.6%) |
| $100,000 to $149,999 | 8 (4.4%) | 20 (11.7%) |
| $150,000 or more | 44 (24.3%) | 36 (21.0%) |
| Total | 181 (100.0%) | 171 (100.0%) |
Property Value to Household Income Ratio in West Liberty
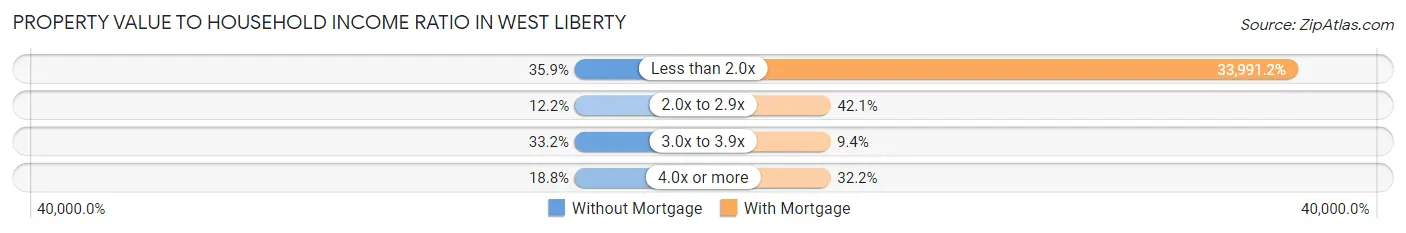
| Value-to-Income Ratio | Without Mortgage | With Mortgage |
| Less than 2.0x | 65 (35.9%) | 58,125 (33,991.2%) |
| 2.0x to 2.9x | 22 (12.1%) | 72 (42.1%) |
| 3.0x to 3.9x | 60 (33.2%) | 16 (9.4%) |
| 4.0x or more | 34 (18.8%) | 55 (32.2%) |
| Total | 181 (100.0%) | 171 (100.0%) |
Real Estate Taxes by Mortgage Status in West Liberty
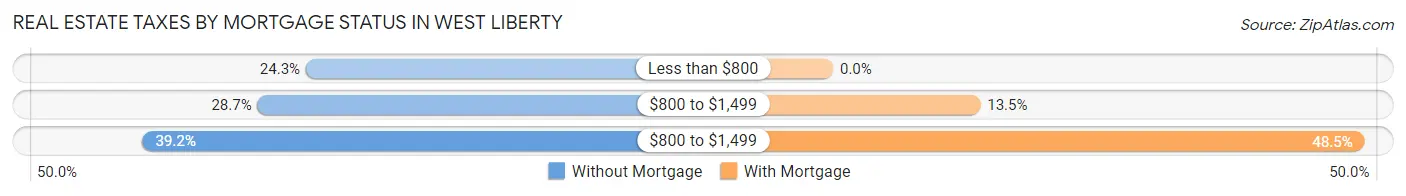
| Property Taxes | Without Mortgage | With Mortgage |
| Less than $800 | 44 (24.3%) | 0 (0.0%) |
| $800 to $1,499 | 52 (28.7%) | 23 (13.5%) |
| $800 to $1,499 | 71 (39.2%) | 83 (48.5%) |
| Total | 181 (100.0%) | 171 (100.0%) |
Health & Disability in West Liberty
Health Insurance Coverage by Age in West Liberty
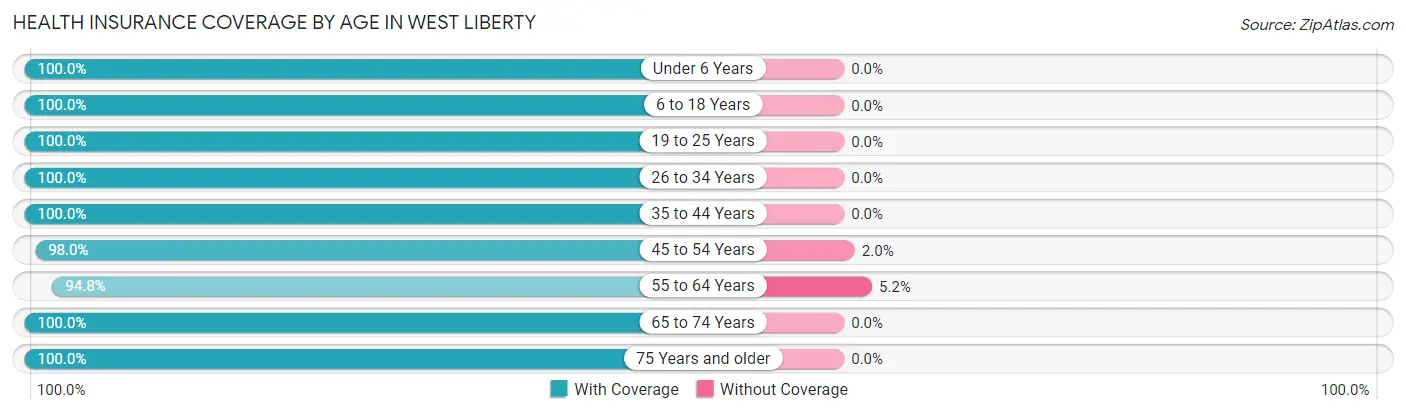
| Age Bracket | With Coverage | Without Coverage |
| Under 6 Years | 103 (100.0%) | 0 (0.0%) |
| 6 to 18 Years | 220 (100.0%) | 0 (0.0%) |
| 19 to 25 Years | 131 (100.0%) | 0 (0.0%) |
| 26 to 34 Years | 266 (100.0%) | 0 (0.0%) |
| 35 to 44 Years | 241 (100.0%) | 0 (0.0%) |
| 45 to 54 Years | 247 (98.0%) | 5 (2.0%) |
| 55 to 64 Years | 128 (94.8%) | 7 (5.2%) |
| 65 to 74 Years | 212 (100.0%) | 0 (0.0%) |
| 75 Years and older | 106 (100.0%) | 0 (0.0%) |
| Total | 1,654 (99.3%) | 12 (0.7%) |
Health Insurance Coverage by Citizenship Status in West Liberty
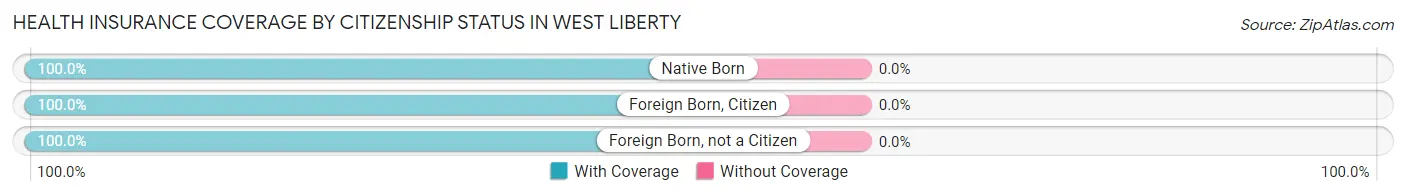
| Citizenship Status | With Coverage | Without Coverage |
| Native Born | 103 (100.0%) | 0 (0.0%) |
| Foreign Born, Citizen | 220 (100.0%) | 0 (0.0%) |
| Foreign Born, not a Citizen | 131 (100.0%) | 0 (0.0%) |
Health Insurance Coverage by Household Income in West Liberty
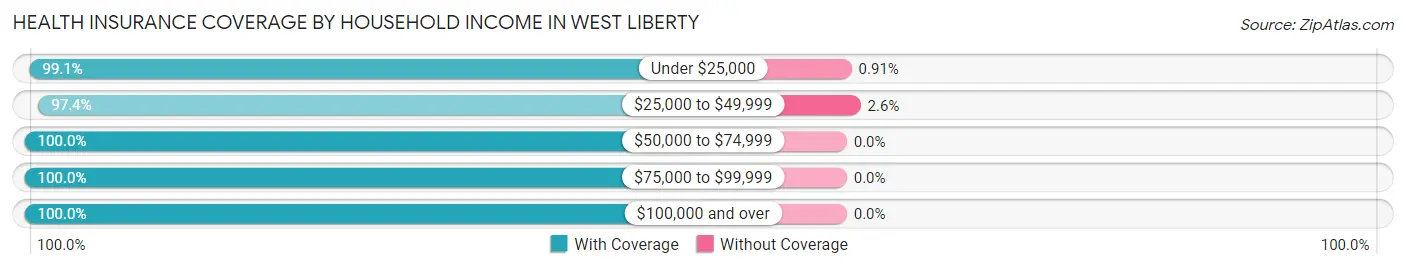
| Household Income | With Coverage | Without Coverage |
| Under $25,000 | 325 (99.1%) | 3 (0.9%) |
| $25,000 to $49,999 | 340 (97.4%) | 9 (2.6%) |
| $50,000 to $74,999 | 273 (100.0%) | 0 (0.0%) |
| $75,000 to $99,999 | 197 (100.0%) | 0 (0.0%) |
| $100,000 and over | 519 (100.0%) | 0 (0.0%) |
Public vs Private Health Insurance Coverage by Age in West Liberty
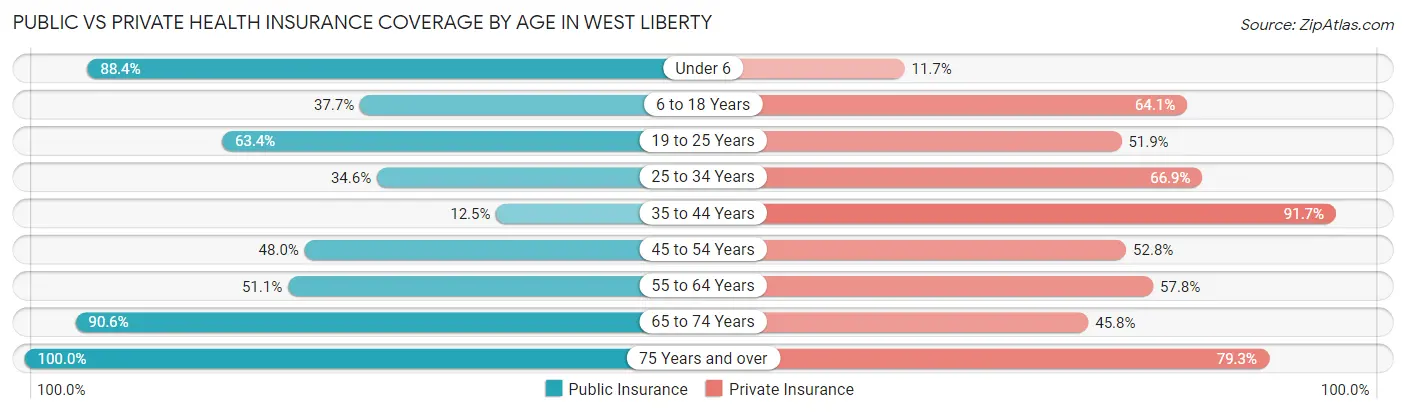
| Age Bracket | Public Insurance | Private Insurance |
| Under 6 | 91 (88.3%) | 12 (11.7%) |
| 6 to 18 Years | 83 (37.7%) | 141 (64.1%) |
| 19 to 25 Years | 83 (63.4%) | 68 (51.9%) |
| 25 to 34 Years | 92 (34.6%) | 178 (66.9%) |
| 35 to 44 Years | 30 (12.4%) | 221 (91.7%) |
| 45 to 54 Years | 121 (48.0%) | 133 (52.8%) |
| 55 to 64 Years | 69 (51.1%) | 78 (57.8%) |
| 65 to 74 Years | 192 (90.6%) | 97 (45.8%) |
| 75 Years and over | 106 (100.0%) | 84 (79.2%) |
| Total | 867 (52.0%) | 1,012 (60.7%) |
Disability Status by Sex by Age in West Liberty
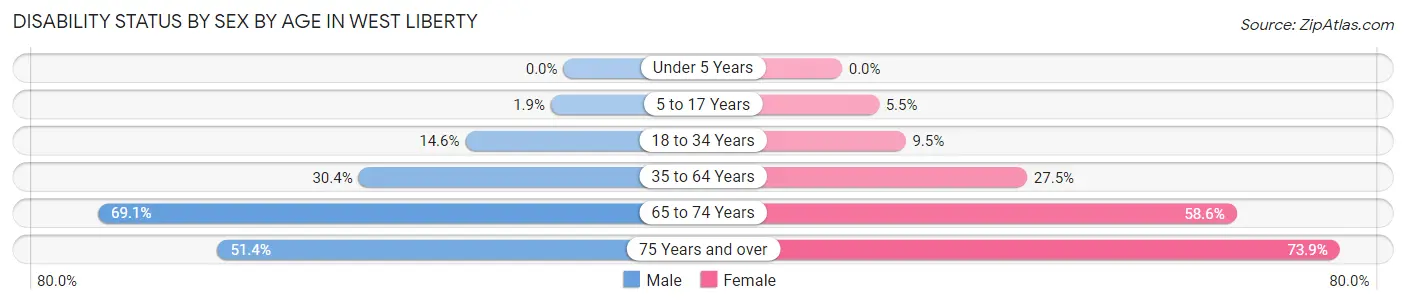
| Age Bracket | Male | Female |
| Under 5 Years | 0 (0.0%) | 0 (0.0%) |
| 5 to 17 Years | 3 (1.9%) | 4 (5.5%) |
| 18 to 34 Years | 38 (14.6%) | 14 (9.5%) |
| 35 to 64 Years | 87 (30.4%) | 94 (27.5%) |
| 65 to 74 Years | 38 (69.1%) | 92 (58.6%) |
| 75 Years and over | 19 (51.3%) | 51 (73.9%) |
Disability Class by Sex by Age in West Liberty
Disability Class: Hearing Difficulty
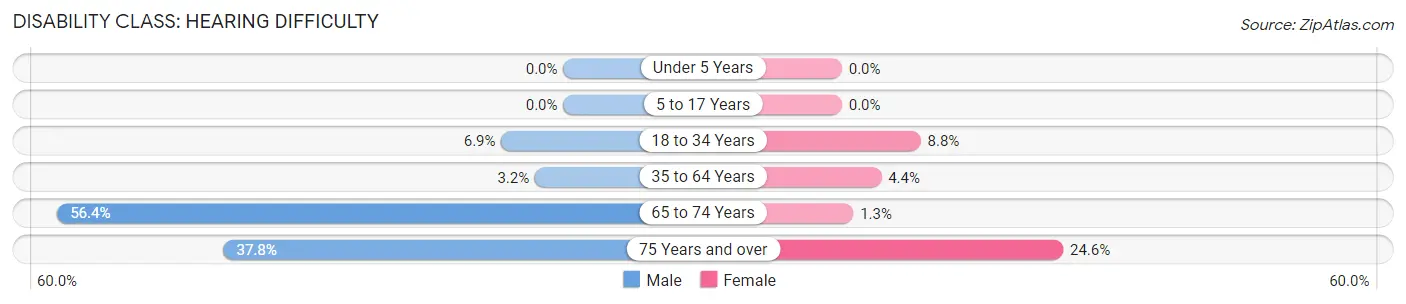
| Age Bracket | Male | Female |
| Under 5 Years | 0 (0.0%) | 0 (0.0%) |
| 5 to 17 Years | 0 (0.0%) | 0 (0.0%) |
| 18 to 34 Years | 18 (6.9%) | 13 (8.8%) |
| 35 to 64 Years | 9 (3.2%) | 15 (4.4%) |
| 65 to 74 Years | 31 (56.4%) | 2 (1.3%) |
| 75 Years and over | 14 (37.8%) | 17 (24.6%) |
Disability Class: Vision Difficulty
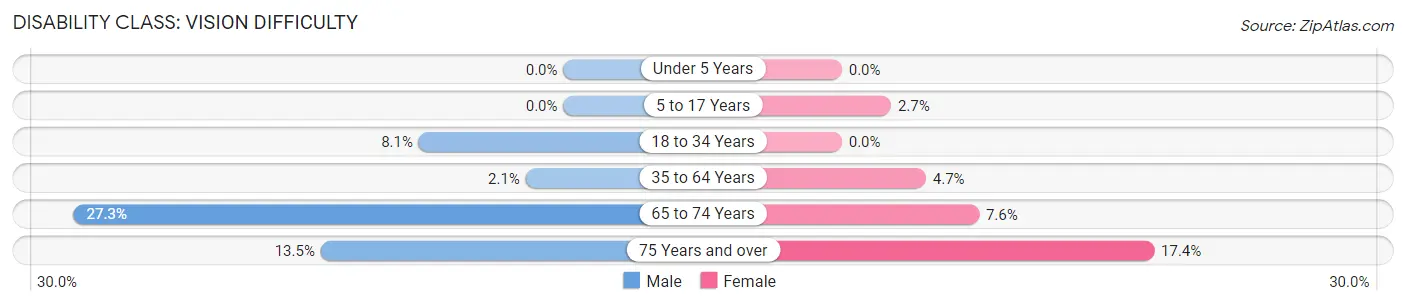
| Age Bracket | Male | Female |
| Under 5 Years | 0 (0.0%) | 0 (0.0%) |
| 5 to 17 Years | 0 (0.0%) | 2 (2.7%) |
| 18 to 34 Years | 21 (8.1%) | 0 (0.0%) |
| 35 to 64 Years | 6 (2.1%) | 16 (4.7%) |
| 65 to 74 Years | 15 (27.3%) | 12 (7.6%) |
| 75 Years and over | 5 (13.5%) | 12 (17.4%) |
Disability Class: Cognitive Difficulty
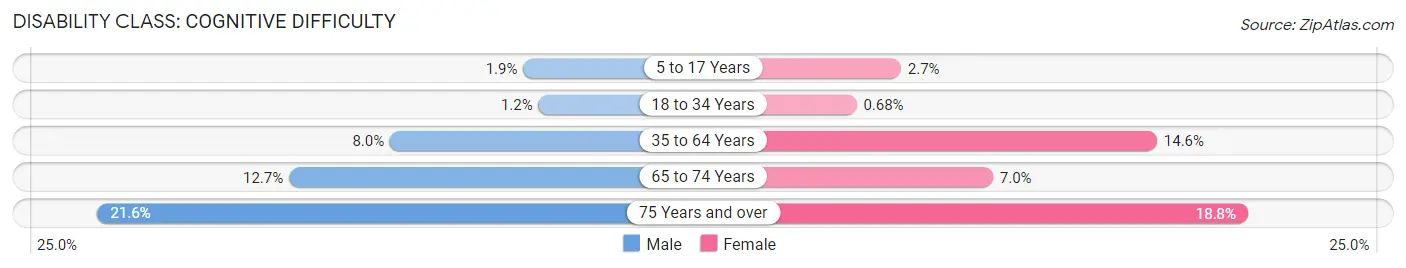
| Age Bracket | Male | Female |
| 5 to 17 Years | 3 (1.9%) | 2 (2.7%) |
| 18 to 34 Years | 3 (1.1%) | 1 (0.7%) |
| 35 to 64 Years | 23 (8.0%) | 50 (14.6%) |
| 65 to 74 Years | 7 (12.7%) | 11 (7.0%) |
| 75 Years and over | 8 (21.6%) | 13 (18.8%) |
Disability Class: Ambulatory Difficulty
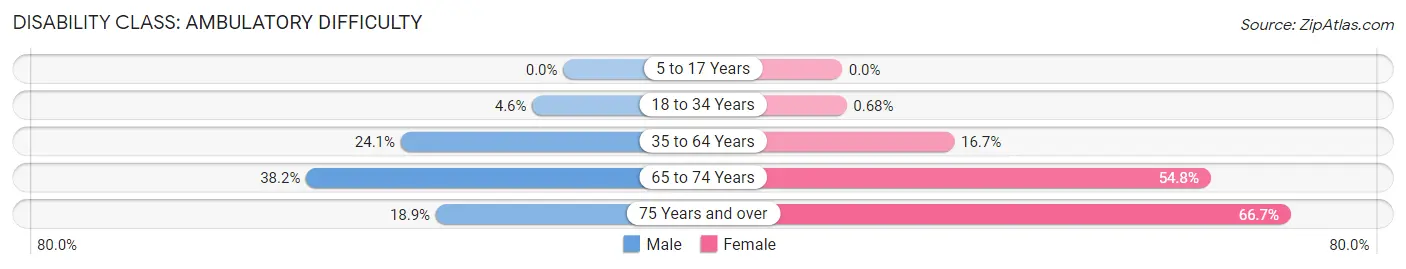
| Age Bracket | Male | Female |
| 5 to 17 Years | 0 (0.0%) | 0 (0.0%) |
| 18 to 34 Years | 12 (4.6%) | 1 (0.7%) |
| 35 to 64 Years | 69 (24.1%) | 57 (16.7%) |
| 65 to 74 Years | 21 (38.2%) | 86 (54.8%) |
| 75 Years and over | 7 (18.9%) | 46 (66.7%) |
Disability Class: Self-Care Difficulty
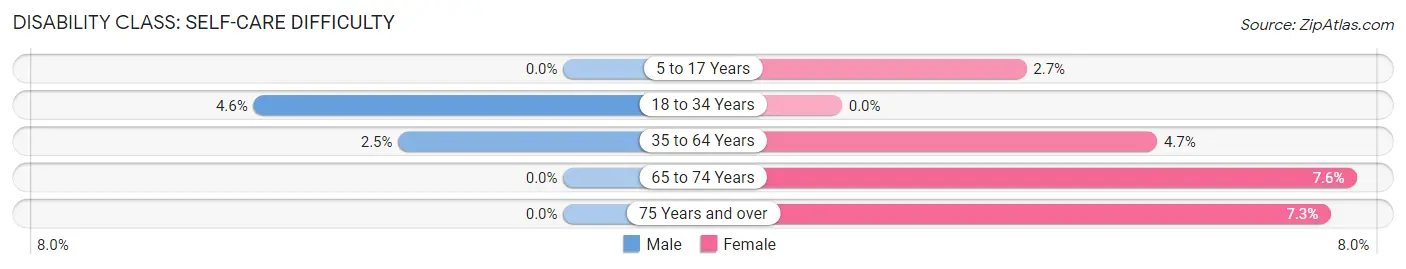
| Age Bracket | Male | Female |
| 5 to 17 Years | 0 (0.0%) | 2 (2.7%) |
| 18 to 34 Years | 12 (4.6%) | 0 (0.0%) |
| 35 to 64 Years | 7 (2.5%) | 16 (4.7%) |
| 65 to 74 Years | 0 (0.0%) | 12 (7.6%) |
| 75 Years and over | 0 (0.0%) | 5 (7.2%) |
Technology Access in West Liberty
Computing Device Access in West Liberty
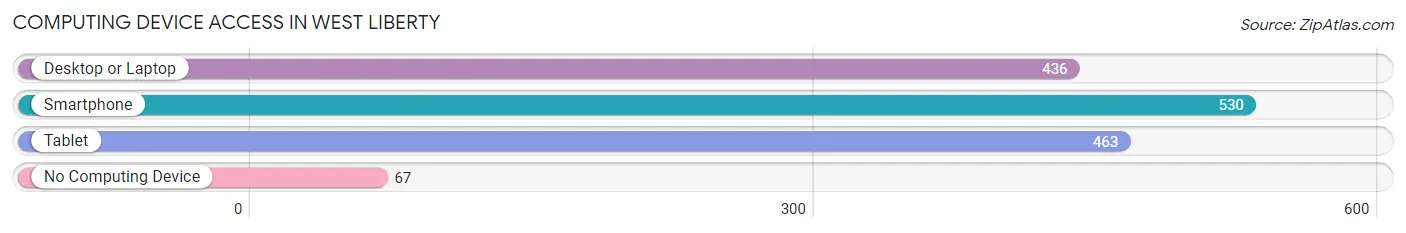
| Device Type | # Households | % Households |
| Desktop or Laptop | 436 | 69.3% |
| Smartphone | 530 | 84.3% |
| Tablet | 463 | 73.6% |
| No Computing Device | 67 | 10.6% |
| Total | 629 | 100.0% |
Internet Access in West Liberty
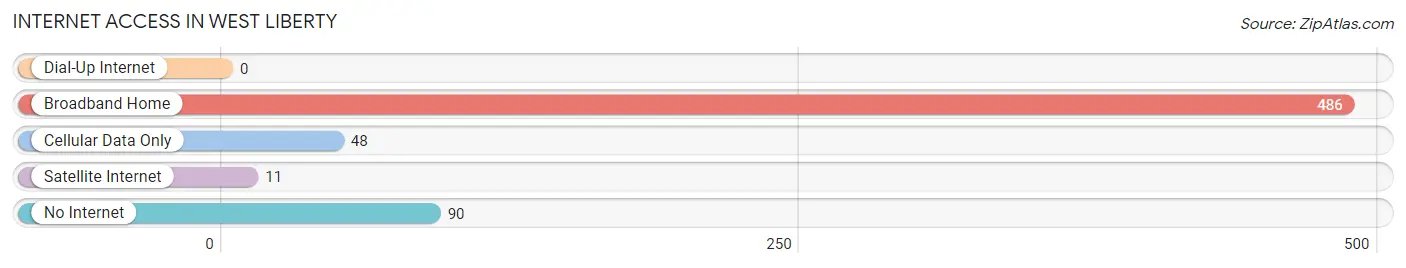
| Internet Type | # Households | % Households |
| Dial-Up Internet | 0 | 0.0% |
| Broadband Home | 486 | 77.3% |
| Cellular Data Only | 48 | 7.6% |
| Satellite Internet | 11 | 1.8% |
| No Internet | 90 | 14.3% |
| Total | 629 | 100.0% |
West Liberty Summary
West Liberty, Kentucky is a small town located in Morgan County, Kentucky. It is situated in the foothills of the Appalachian Mountains and is part of the Eastern Kentucky Coalfield. The town has a population of approximately 2,000 people and is the county seat of Morgan County.
History
West Liberty was founded in 1804 by a group of settlers from Virginia. The town was originally known as Liberty, but the name was changed to West Liberty in 1812 to avoid confusion with another town in the area. The town was incorporated in 1820 and has remained a small, rural community ever since.
The town was an important stop on the Underground Railroad, with many slaves escaping to freedom in the North. During the Civil War, West Liberty was the site of a major battle between Union and Confederate forces. The town was also the site of a major coal mining operation in the late 19th and early 20th centuries.
Geography
West Liberty is located in the foothills of the Appalachian Mountains in eastern Kentucky. The town is situated in a valley between two mountain ranges, the Cumberland Mountains to the north and the Pine Mountain Range to the south. The town is located at an elevation of 1,000 feet above sea level.
The town is located near the headwaters of the Licking River, which flows through the town and is a major tributary of the Kentucky River. The town is also located near the headwaters of the Big Sandy River, which flows through the town and is a major tributary of the Ohio River.
Economy
West Liberty’s economy is largely based on agriculture and tourism. The town is home to several small farms, which produce a variety of crops, including corn, soybeans, and tobacco. The town is also home to several small businesses, including restaurants, retail stores, and a few small manufacturing companies.
The town is also a popular tourist destination, with many visitors coming to the area to enjoy the scenic beauty of the Appalachian Mountains. The town is home to several historic sites, including the West Liberty Historic District, which is listed on the National Register of Historic Places.
Demographics
As of the 2010 census, West Liberty had a population of 2,000 people. The racial makeup of the town was 97.5% White, 0.5% African American, 0.5% Native American, 0.5% Asian, and 0.5% from other races. The median household income was $25,000, and the median family income was $30,000.
The town is served by the Morgan County School District, which includes two elementary schools, one middle school, and one high school. The town is also home to several churches, including the West Liberty United Methodist Church, the West Liberty Baptist Church, and the West Liberty Presbyterian Church.
Conclusion
West Liberty, Kentucky is a small town located in the foothills of the Appalachian Mountains in eastern Kentucky. The town has a population of approximately 2,000 people and is the county seat of Morgan County. The town’s economy is largely based on agriculture and tourism, and the town is home to several small businesses, historic sites, and churches. West Liberty is a popular tourist destination, and the town is served by the Morgan County School District.
Common Questions
What is Per Capita Income in West Liberty?
Per Capita income in West Liberty is $14,769.
What is the Median Family Income in West Liberty?
Median Family Income in West Liberty is $55,875.
What is the Median Household income in West Liberty?
Median Household Income in West Liberty is $47,083.
What is Income or Wage Gap in West Liberty?
Income or Wage Gap in West Liberty is 43.8%.
Women in West Liberty earn 56.2 cents for every dollar earned by a man.
What is Inequality or Gini Index in West Liberty?
Inequality or Gini Index in West Liberty is 0.47.
What is the Total Population of West Liberty?
Total Population of West Liberty is 3,247.
What is the Total Male Population of West Liberty?
Total Male Population of West Liberty is 2,390.
What is the Total Female Population of West Liberty?
Total Female Population of West Liberty is 857.
What is the Ratio of Males per 100 Females in West Liberty?
There are 278.88 Males per 100 Females in West Liberty.
What is the Ratio of Females per 100 Males in West Liberty?
There are 35.86 Females per 100 Males in West Liberty.
What is the Median Population Age in West Liberty?
Median Population Age in West Liberty is 37.1 Years.
What is the Average Family Size in West Liberty
Average Family Size in West Liberty is 3.4 People.
What is the Average Household Size in West Liberty
Average Household Size in West Liberty is 2.6 People.
How Large is the Labor Force in West Liberty?
There are 680 People in the Labor Forcein in West Liberty.
What is the Percentage of People in the Labor Force in West Liberty?
22.9% of People are in the Labor Force in West Liberty.
What is the Unemployment Rate in West Liberty?
Unemployment Rate in West Liberty is 3.1%.