Monterey, KY Map & Demographics
Monterey Map
Monterey Overview
$31,435
PER CAPITA INCOME
$64,375
AVG FAMILY INCOME
0.58
INEQUALITY / GINI INDEX
103
TOTAL POPULATION
62
MALE POPULATION
41
FEMALE POPULATION
151.22
MALES / 100 FEMALES
66.13
FEMALES / 100 MALES
45.8
MEDIAN AGE
3.3
AVG FAMILY SIZE
2.0
AVG HOUSEHOLD SIZE
52
LABOR FORCE [ PEOPLE ]
58.4%
PERCENT IN LABOR FORCE
17.3%
UNEMPLOYMENT RATE
Income in Monterey
Income Overview in Monterey
| Characteristic | Number | Measure |
| Per Capita Income | 103 | $31,435 |
| Median Family Income | 22 | $64,375 |
| Mean Family Income | 22 | $80,909 |
| Median Household Income | 52 | $0 |
| Mean Household Income | 52 | $60,583 |
| Income Deficit | 22 | $0 |
| Wage / Income Gap (%) | 103 | 0.00% |
| Wage / Income Gap ($) | 103 | 100.00¢ per $1 |
| Gini / Inequality Index | 103 | 0.58 |
Earnings by Sex in Monterey
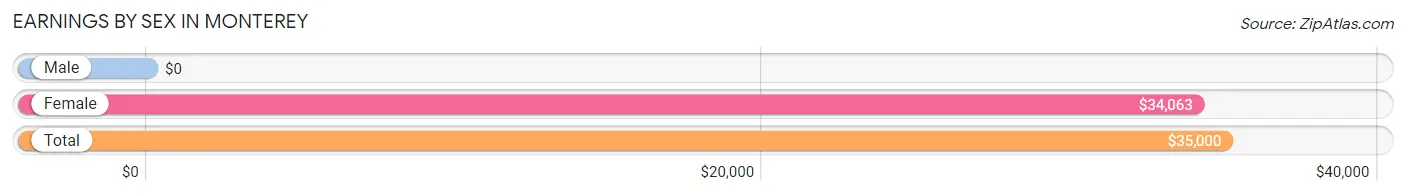
| Sex | Number | Average Earnings |
| Male | 31 (67.4%) | $0 |
| Female | 15 (32.6%) | $34,063 |
| Total | 46 (100.0%) | $35,000 |
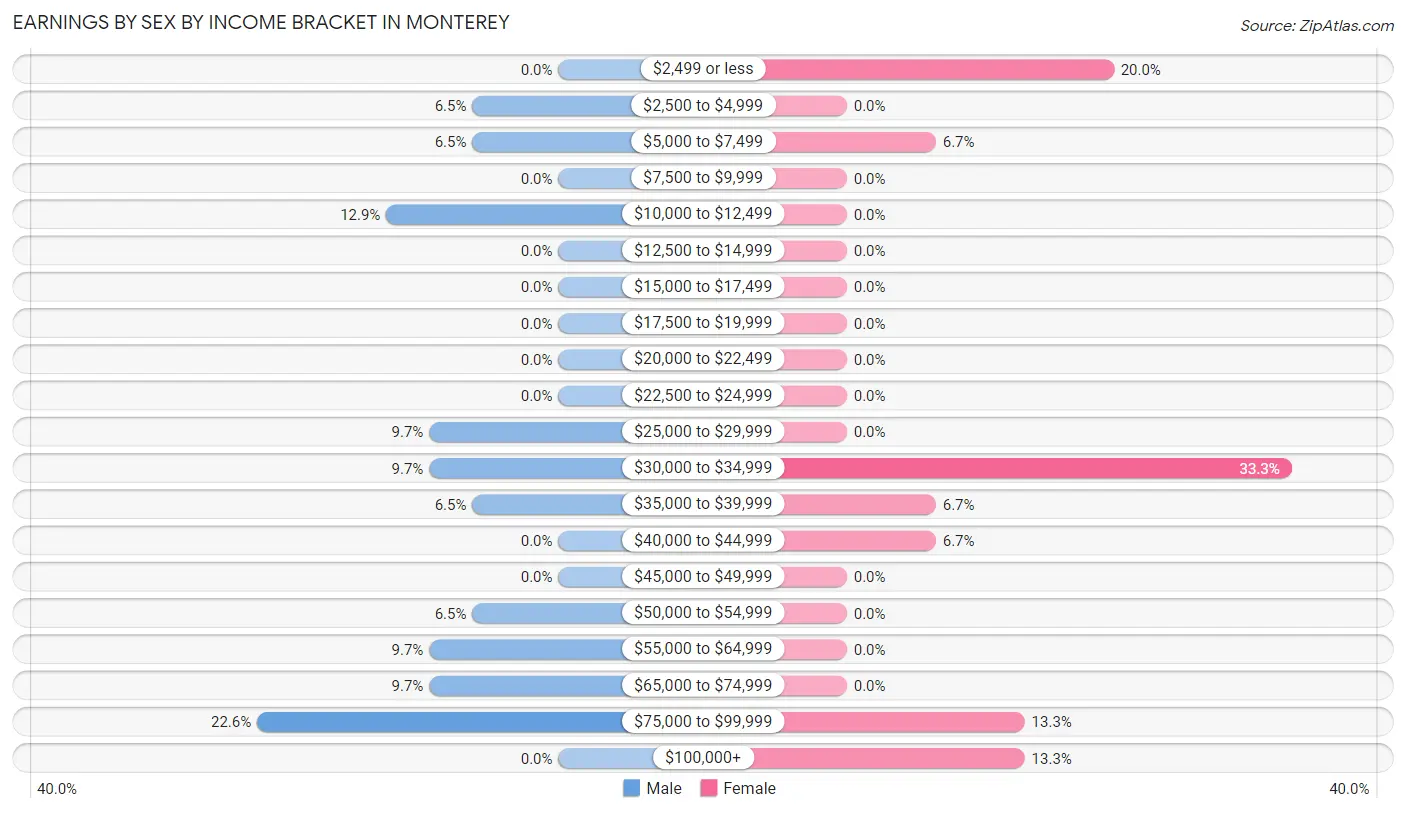
Earnings by Sex by Income Bracket in Monterey
The most common earnings brackets in Monterey are $75,000 to $99,999 for men (7 | 22.6%) and $30,000 to $34,999 for women (5 | 33.3%).
| Income | Male | Female |
| $2,499 or less | 0 (0.0%) | 3 (20.0%) |
| $2,500 to $4,999 | 2 (6.5%) | 0 (0.0%) |
| $5,000 to $7,499 | 2 (6.5%) | 1 (6.7%) |
| $7,500 to $9,999 | 0 (0.0%) | 0 (0.0%) |
| $10,000 to $12,499 | 4 (12.9%) | 0 (0.0%) |
| $12,500 to $14,999 | 0 (0.0%) | 0 (0.0%) |
| $15,000 to $17,499 | 0 (0.0%) | 0 (0.0%) |
| $17,500 to $19,999 | 0 (0.0%) | 0 (0.0%) |
| $20,000 to $22,499 | 0 (0.0%) | 0 (0.0%) |
| $22,500 to $24,999 | 0 (0.0%) | 0 (0.0%) |
| $25,000 to $29,999 | 3 (9.7%) | 0 (0.0%) |
| $30,000 to $34,999 | 3 (9.7%) | 5 (33.3%) |
| $35,000 to $39,999 | 2 (6.5%) | 1 (6.7%) |
| $40,000 to $44,999 | 0 (0.0%) | 1 (6.7%) |
| $45,000 to $49,999 | 0 (0.0%) | 0 (0.0%) |
| $50,000 to $54,999 | 2 (6.5%) | 0 (0.0%) |
| $55,000 to $64,999 | 3 (9.7%) | 0 (0.0%) |
| $65,000 to $74,999 | 3 (9.7%) | 0 (0.0%) |
| $75,000 to $99,999 | 7 (22.6%) | 2 (13.3%) |
| $100,000+ | 0 (0.0%) | 2 (13.3%) |
| Total | 31 (100.0%) | 15 (100.0%) |
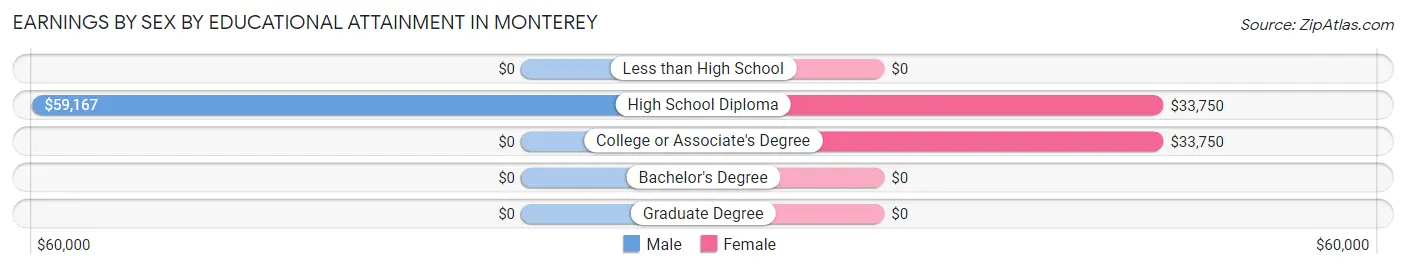
Earnings by Sex by Educational Attainment in Monterey
Average earnings in Monterey are $58,333 for men and $35,000 for women, a difference of 40.0%. Men with an educational attainment of high school diploma enjoy the highest average annual earnings of $59,167, while those with high school diploma education earn the least with $59,167. Women with an educational attainment of high school diploma earn the most with the average annual earnings of $33,750, while those with high school diploma education have the smallest earnings of $33,750.
| Educational Attainment | Male Income | Female Income |
| Less than High School | - | - |
| High School Diploma | $59,167 | $33,750 |
| College or Associate's Degree | - | - |
| Bachelor's Degree | - | - |
| Graduate Degree | - | - |
| Total | $58,333 | $35,000 |
Family Income in Monterey
Family Income Brackets in Monterey
According to the Monterey family income data, there are 8 families falling into the $50,000 to $74,999 income range, which is the most common income bracket and makes up 36.4% of all families.
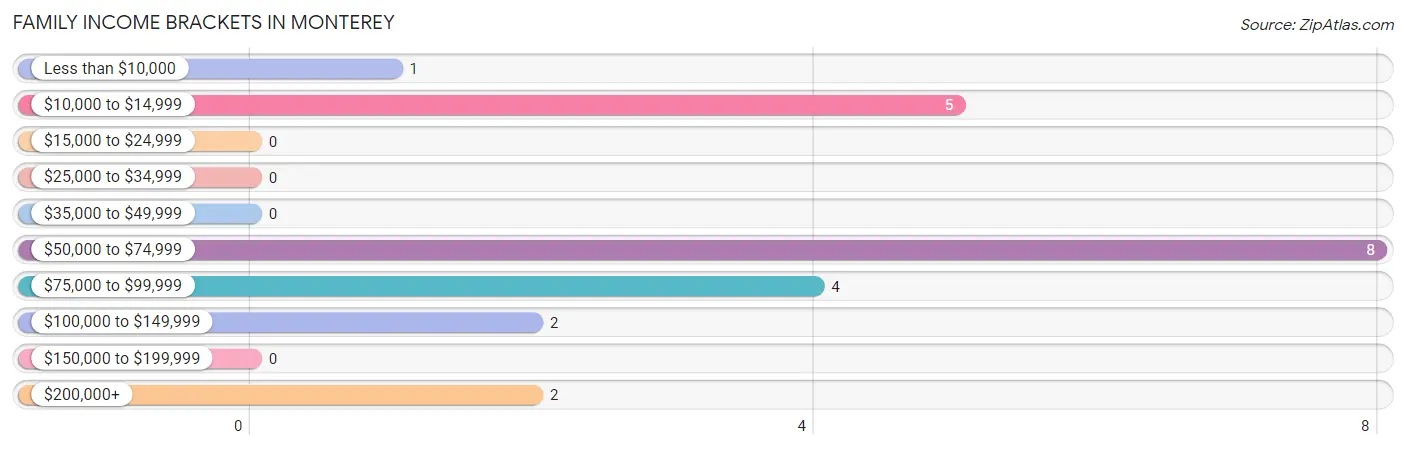
| Income Bracket | # Families | % Families |
| Less than $10,000 | 1 | 4.5% |
| $10,000 to $14,999 | 5 | 22.7% |
| $15,000 to $24,999 | 0 | 0.0% |
| $25,000 to $34,999 | 0 | 0.0% |
| $35,000 to $49,999 | 0 | 0.0% |
| $50,000 to $74,999 | 8 | 36.4% |
| $75,000 to $99,999 | 4 | 18.2% |
| $100,000 to $149,999 | 2 | 9.1% |
| $150,000 to $199,999 | 0 | 0.0% |
| $200,000+ | 2 | 9.1% |
Family Income by Famaliy Size in Monterey
3-person families (7 | 31.8%) account for the highest median family income in Monterey with $62,813 per family, while 3-person families (7 | 31.8%) have the highest median income of $20,938 per family member.
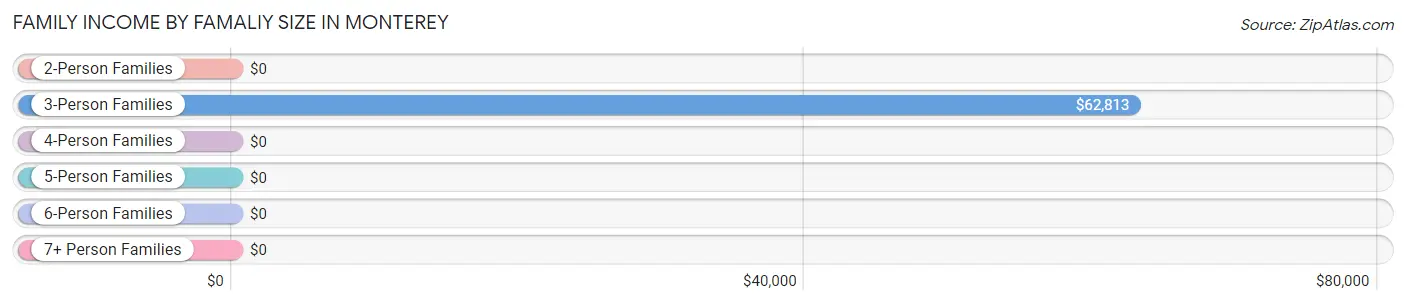
| Income Bracket | # Families | Median Income |
| 2-Person Families | 8 (36.4%) | $0 |
| 3-Person Families | 7 (31.8%) | $62,813 |
| 4-Person Families | 6 (27.3%) | $0 |
| 5-Person Families | 1 (4.5%) | $0 |
| 6-Person Families | 0 (0.0%) | $0 |
| 7+ Person Families | 0 (0.0%) | $0 |
| Total | 22 (100.0%) | $64,375 |
Family Income by Number of Earners in Monterey
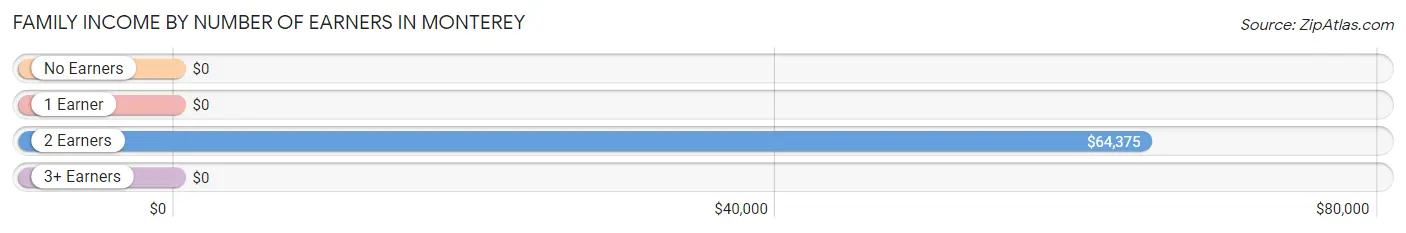
| Number of Earners | # Families | Median Income |
| No Earners | 8 (36.4%) | $0 |
| 1 Earner | 1 (4.5%) | $0 |
| 2 Earners | 7 (31.8%) | $64,375 |
| 3+ Earners | 6 (27.3%) | $0 |
| Total | 22 (100.0%) | $64,375 |
Household Income in Monterey
Household Income Brackets in Monterey
With 18 households falling in the category, the less than $10,000 income range is the most frequent in Monterey, accounting for 34.6% of all households.
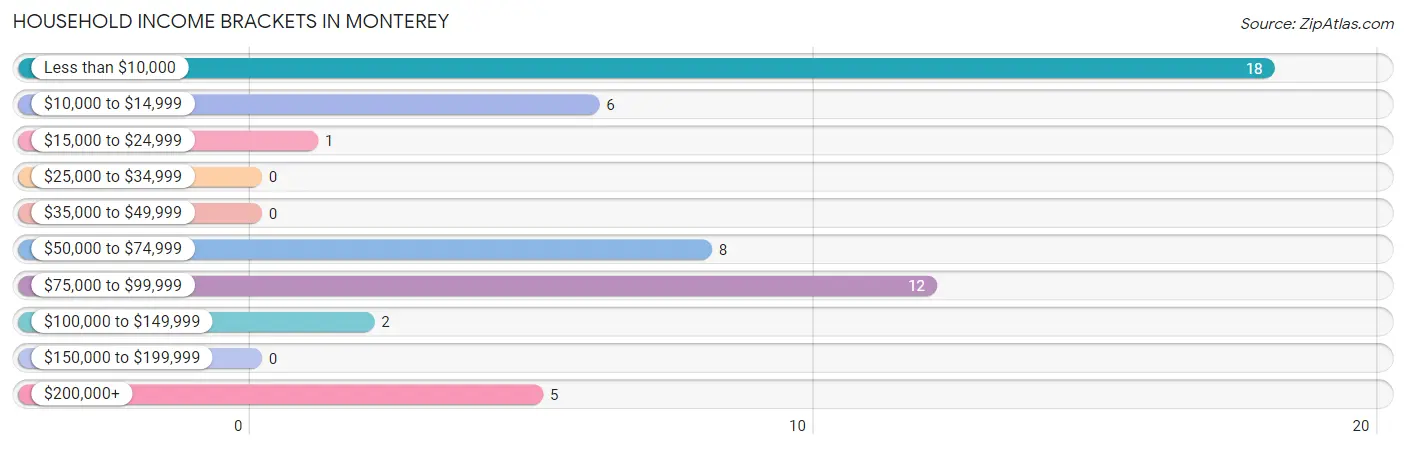
| Income Bracket | # Households | % Households |
| Less than $10,000 | 18 | 34.6% |
| $10,000 to $14,999 | 6 | 11.5% |
| $15,000 to $24,999 | 1 | 1.9% |
| $25,000 to $34,999 | 0 | 0.0% |
| $35,000 to $49,999 | 0 | 0.0% |
| $50,000 to $74,999 | 8 | 15.4% |
| $75,000 to $99,999 | 12 | 23.1% |
| $100,000 to $149,999 | 2 | 3.8% |
| $150,000 to $199,999 | 0 | 0.0% |
| $200,000+ | 5 | 9.6% |
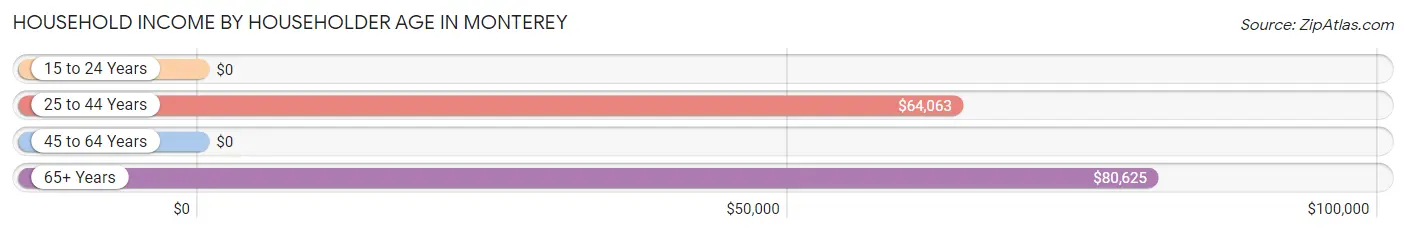
Household Income by Householder Age in Monterey
The median household income in Monterey is $0, with the highest median household income of $80,625 found in the 65+ years age bracket for the primary householder. A total of 5 households (9.6%) fall into this category.
| Income Bracket | # Households | Median Income |
| 15 to 24 Years | 0 (0.0%) | $0 |
| 25 to 44 Years | 7 (13.5%) | $64,063 |
| 45 to 64 Years | 40 (76.9%) | $0 |
| 65+ Years | 5 (9.6%) | $80,625 |
| Total | 52 (100.0%) | $0 |
Poverty in Monterey
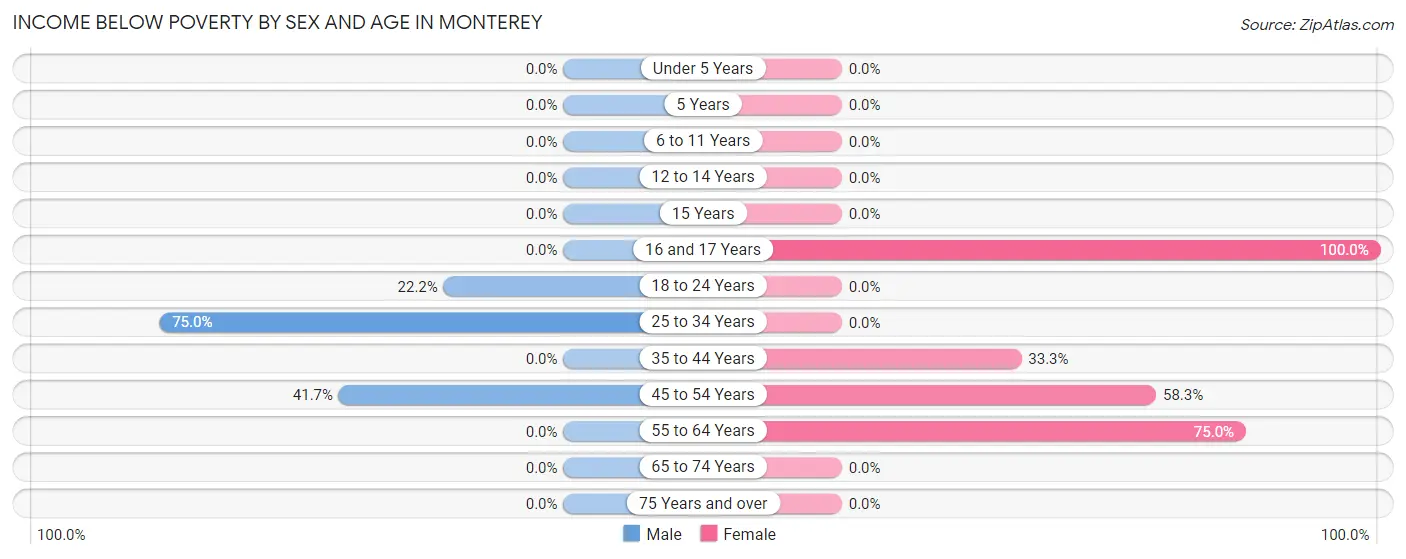
Income Below Poverty by Sex and Age in Monterey
With 29.0% poverty level for males and 36.6% for females among the residents of Monterey, 25 to 34 year old males and 16 and 17 year old females are the most vulnerable to poverty, with 6 males (75.0%) and 1 females (100.0%) in their respective age groups living below the poverty level.
| Age Bracket | Male | Female |
| Under 5 Years | 0 (0.0%) | 0 (0.0%) |
| 5 Years | 0 (0.0%) | 0 (0.0%) |
| 6 to 11 Years | 0 (0.0%) | 0 (0.0%) |
| 12 to 14 Years | 0 (0.0%) | 0 (0.0%) |
| 15 Years | 0 (0.0%) | 0 (0.0%) |
| 16 and 17 Years | 0 (0.0%) | 1 (100.0%) |
| 18 to 24 Years | 2 (22.2%) | 0 (0.0%) |
| 25 to 34 Years | 6 (75.0%) | 0 (0.0%) |
| 35 to 44 Years | 0 (0.0%) | 1 (33.3%) |
| 45 to 54 Years | 10 (41.7%) | 7 (58.3%) |
| 55 to 64 Years | 0 (0.0%) | 6 (75.0%) |
| 65 to 74 Years | 0 (0.0%) | 0 (0.0%) |
| 75 Years and over | 0 (0.0%) | 0 (0.0%) |
| Total | 18 (29.0%) | 15 (36.6%) |
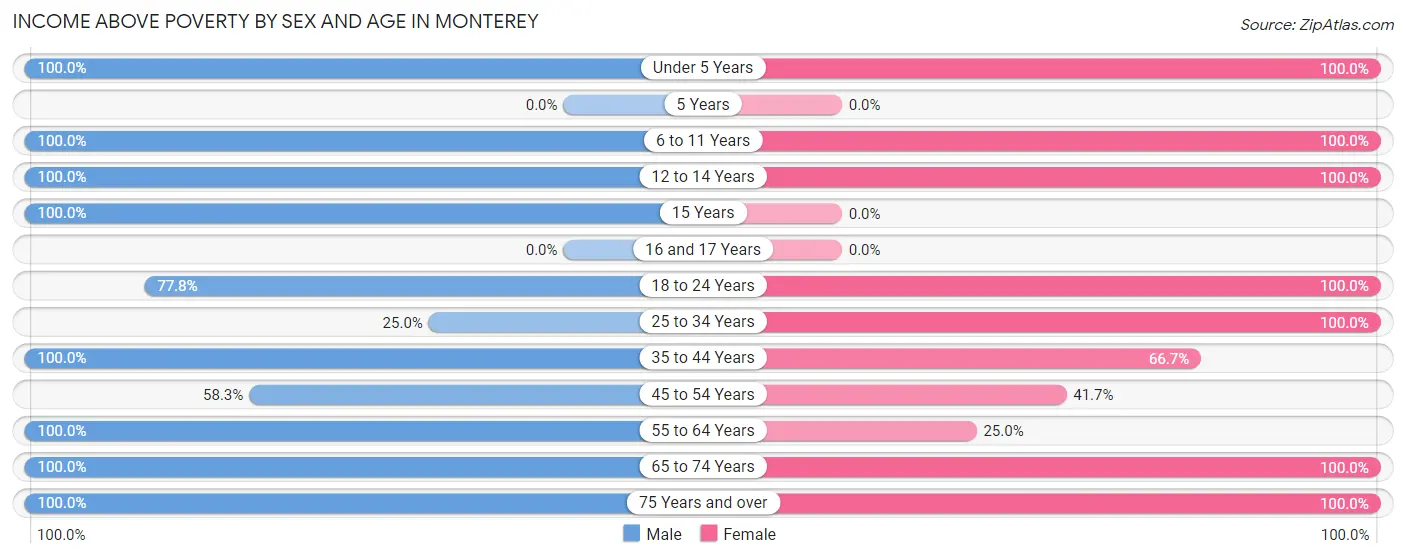
Income Above Poverty by Sex and Age in Monterey
According to the poverty statistics in Monterey, males aged under 5 years and females aged under 5 years are the age groups that are most secure financially, with 100.0% of males and 100.0% of females in these age groups living above the poverty line.
| Age Bracket | Male | Female |
| Under 5 Years | 3 (100.0%) | 2 (100.0%) |
| 5 Years | 0 (0.0%) | 0 (0.0%) |
| 6 to 11 Years | 2 (100.0%) | 3 (100.0%) |
| 12 to 14 Years | 2 (100.0%) | 1 (100.0%) |
| 15 Years | 1 (100.0%) | 0 (0.0%) |
| 16 and 17 Years | 0 (0.0%) | 0 (0.0%) |
| 18 to 24 Years | 7 (77.8%) | 3 (100.0%) |
| 25 to 34 Years | 2 (25.0%) | 5 (100.0%) |
| 35 to 44 Years | 7 (100.0%) | 2 (66.7%) |
| 45 to 54 Years | 14 (58.3%) | 5 (41.7%) |
| 55 to 64 Years | 2 (100.0%) | 2 (25.0%) |
| 65 to 74 Years | 2 (100.0%) | 1 (100.0%) |
| 75 Years and over | 2 (100.0%) | 2 (100.0%) |
| Total | 44 (71.0%) | 26 (63.4%) |
Income Below Poverty Among Married-Couple Families in Monterey
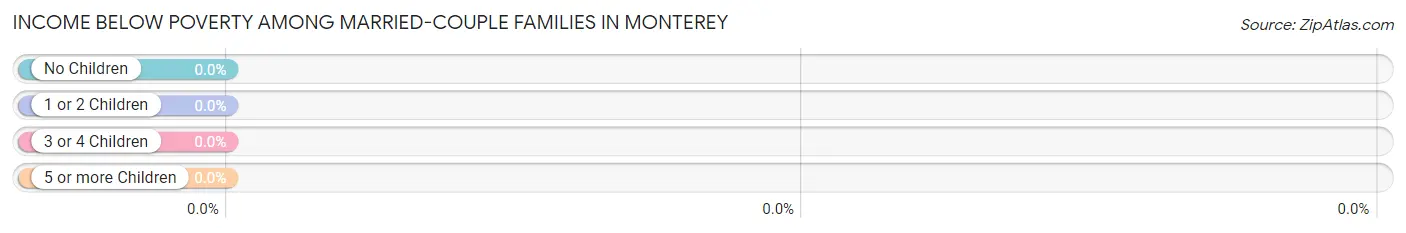
| Children | Above Poverty | Below Poverty |
| No Children | 7 (100.0%) | 0 (0.0%) |
| 1 or 2 Children | 8 (100.0%) | 0 (0.0%) |
| 3 or 4 Children | 1 (100.0%) | 0 (0.0%) |
| 5 or more Children | 0 (0.0%) | 0 (0.0%) |
| Total | 16 (100.0%) | 0 (0.0%) |
Income Below Poverty Among Single-Parent Households in Monterey
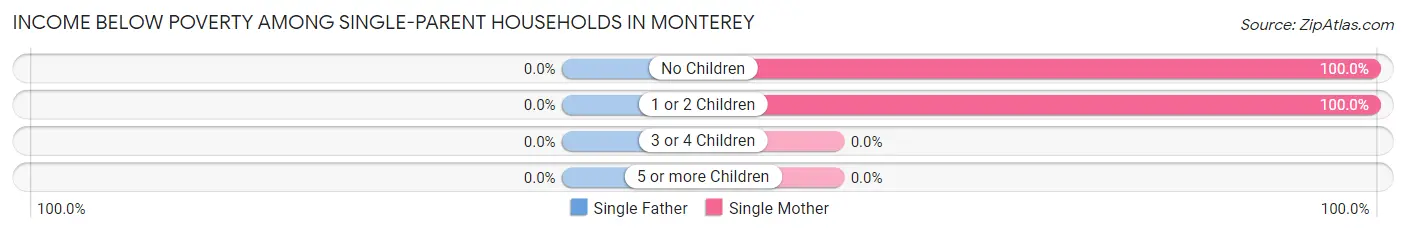
| Children | Single Father | Single Mother |
| No Children | 0 (0.0%) | 5 (100.0%) |
| 1 or 2 Children | 0 (0.0%) | 1 (100.0%) |
| 3 or 4 Children | 0 (0.0%) | 0 (0.0%) |
| 5 or more Children | 0 (0.0%) | 0 (0.0%) |
| Total | 0 (0.0%) | 6 (100.0%) |
Income Below Poverty Among Married-Couple vs Single-Parent Households in Monterey
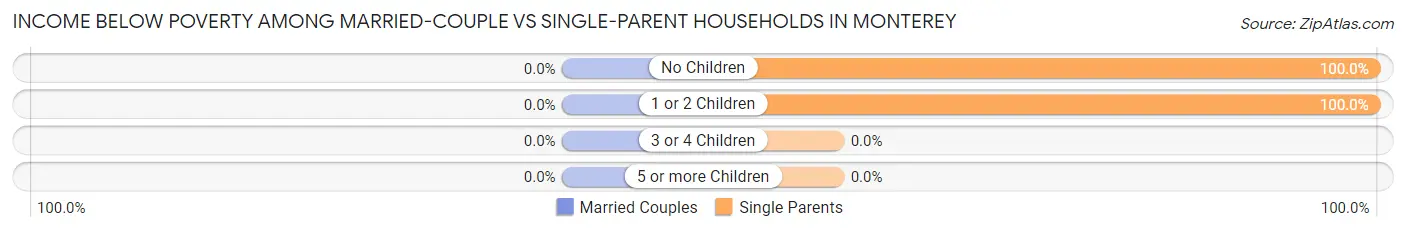
| Children | Married-Couple Families | Single-Parent Households |
| No Children | 0 (0.0%) | 5 (100.0%) |
| 1 or 2 Children | 0 (0.0%) | 1 (100.0%) |
| 3 or 4 Children | 0 (0.0%) | 0 (0.0%) |
| 5 or more Children | 0 (0.0%) | 0 (0.0%) |
| Total | 0 (0.0%) | 6 (100.0%) |
Race in Monterey
The most populous races in Monterey are , and White / Caucasian (103 | 100.0%).
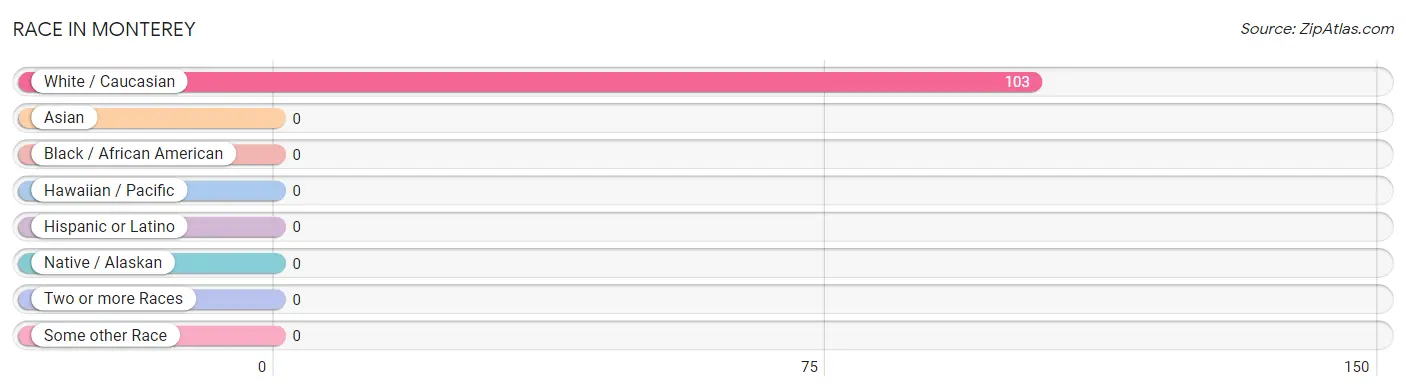
| Race | # Population | % Population |
| Asian | 0 | 0.0% |
| Black / African American | 0 | 0.0% |
| Hawaiian / Pacific | 0 | 0.0% |
| Hispanic or Latino | 0 | 0.0% |
| Native / Alaskan | 0 | 0.0% |
| White / Caucasian | 103 | 100.0% |
| Two or more Races | 0 | 0.0% |
| Some other Race | 0 | 0.0% |
| Total | 103 | 100.0% |
Ancestry in Monterey
The most populous ancestries reported in Monterey are American (18 | 17.5%), German (15 | 14.6%), English (13 | 12.6%), Irish (12 | 11.7%), and French (11 | 10.7%), together accounting for 67.0% of all Monterey residents.
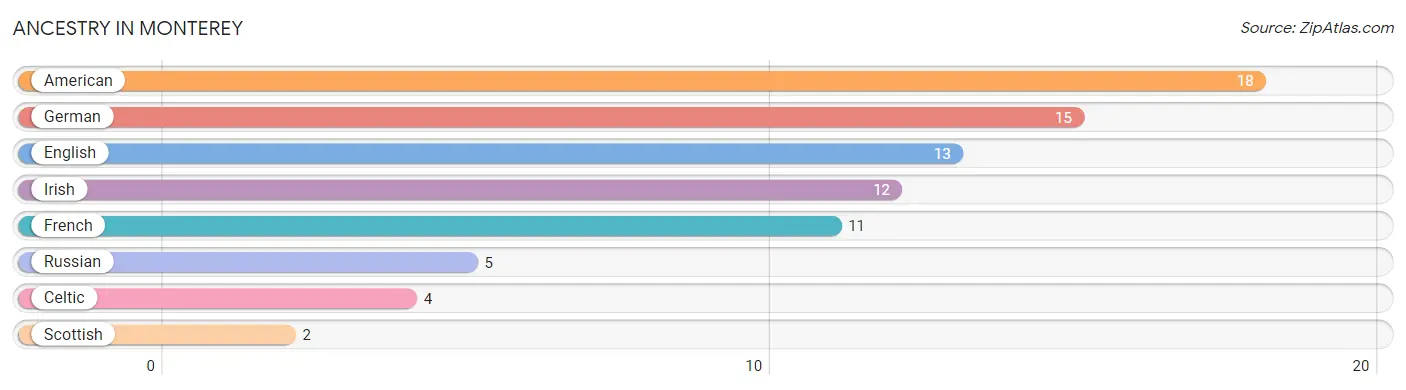
| Ancestry | # Population | % Population |
| American | 18 | 17.5% |
| Celtic | 4 | 3.9% |
| English | 13 | 12.6% |
| French | 11 | 10.7% |
| German | 15 | 14.6% |
| Irish | 12 | 11.7% |
| Russian | 5 | 4.9% |
| Scottish | 2 | 1.9% | View All 8 Rows |
Immigrants in Monterey

| Immigration Origin | # Population | % Population | View All 0 Rows |
Sex and Age in Monterey
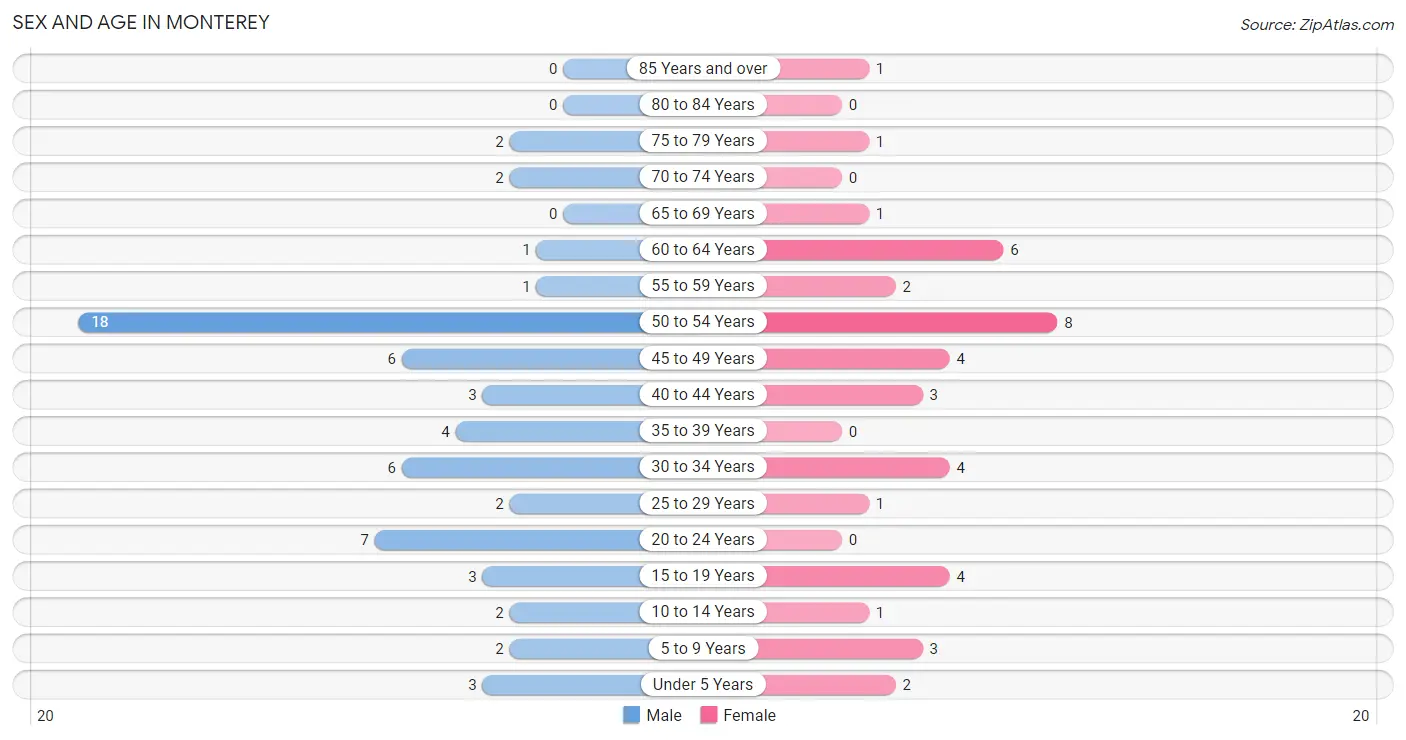
Sex and Age in Monterey
The most populous age groups in Monterey are 50 to 54 Years (18 | 29.0%) for men and 50 to 54 Years (8 | 19.5%) for women.
| Age Bracket | Male | Female |
| Under 5 Years | 3 (4.8%) | 2 (4.9%) |
| 5 to 9 Years | 2 (3.2%) | 3 (7.3%) |
| 10 to 14 Years | 2 (3.2%) | 1 (2.4%) |
| 15 to 19 Years | 3 (4.8%) | 4 (9.8%) |
| 20 to 24 Years | 7 (11.3%) | 0 (0.0%) |
| 25 to 29 Years | 2 (3.2%) | 1 (2.4%) |
| 30 to 34 Years | 6 (9.7%) | 4 (9.8%) |
| 35 to 39 Years | 4 (6.5%) | 0 (0.0%) |
| 40 to 44 Years | 3 (4.8%) | 3 (7.3%) |
| 45 to 49 Years | 6 (9.7%) | 4 (9.8%) |
| 50 to 54 Years | 18 (29.0%) | 8 (19.5%) |
| 55 to 59 Years | 1 (1.6%) | 2 (4.9%) |
| 60 to 64 Years | 1 (1.6%) | 6 (14.6%) |
| 65 to 69 Years | 0 (0.0%) | 1 (2.4%) |
| 70 to 74 Years | 2 (3.2%) | 0 (0.0%) |
| 75 to 79 Years | 2 (3.2%) | 1 (2.4%) |
| 80 to 84 Years | 0 (0.0%) | 0 (0.0%) |
| 85 Years and over | 0 (0.0%) | 1 (2.4%) |
| Total | 62 (100.0%) | 41 (100.0%) |
Families and Households in Monterey
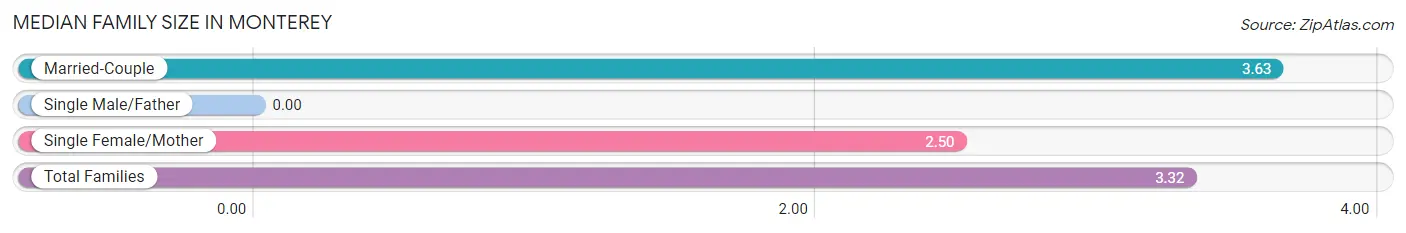
Median Family Size in Monterey
| Family Type | # Families | Family Size |
| Married-Couple | 16 (72.7%) | 3.63 |
| Single Male/Father | 0 (0.0%) | - |
| Single Female/Mother | 6 (27.3%) | 2.50 |
| Total Families | 22 (100.0%) | 3.32 |
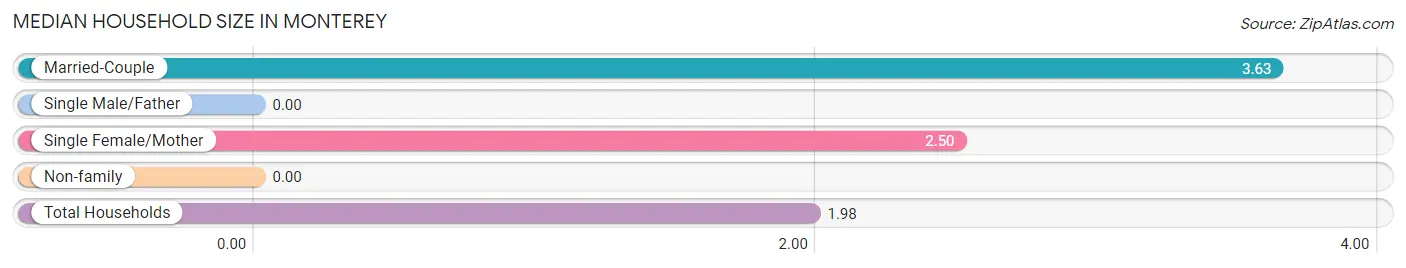
Median Household Size in Monterey
| Household Type | # Households | Household Size |
| Married-Couple | 16 (30.8%) | 3.63 |
| Single Male/Father | 0 (0.0%) | - |
| Single Female/Mother | 6 (11.5%) | 2.50 |
| Non-family | 30 (57.7%) | - |
| Total Households | 52 (100.0%) | 1.98 |
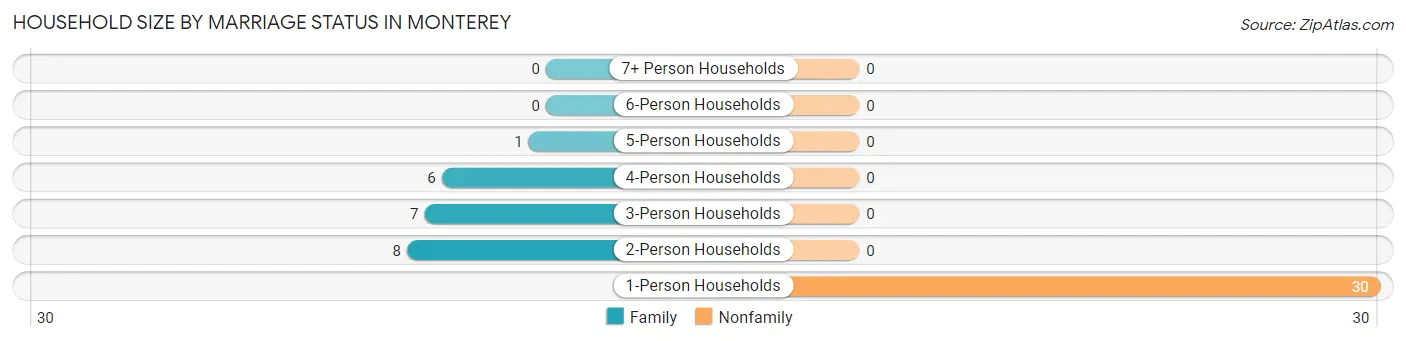
Household Size by Marriage Status in Monterey
Out of a total of 52 households in Monterey, 22 (42.3%) are family households, while 30 (57.7%) are nonfamily households. The most numerous type of family households are 2-person households, comprising 8, and the most common type of nonfamily households are 1-person households, comprising 30.
| Household Size | Family Households | Nonfamily Households |
| 1-Person Households | - | 30 (57.7%) |
| 2-Person Households | 8 (15.4%) | 0 (0.0%) |
| 3-Person Households | 7 (13.5%) | 0 (0.0%) |
| 4-Person Households | 6 (11.5%) | 0 (0.0%) |
| 5-Person Households | 1 (1.9%) | 0 (0.0%) |
| 6-Person Households | 0 (0.0%) | 0 (0.0%) |
| 7+ Person Households | 0 (0.0%) | 0 (0.0%) |
| Total | 22 (42.3%) | 30 (57.7%) |
Female Fertility in Monterey
Fertility by Age in Monterey
Average fertility rate in Monterey is 63.0 births per 1,000 women. Women in the age bracket of 20 to 34 years have the highest fertility rate with 200.0 births per 1,000 women. Women in the age bracket of 20 to 34 years acount for 100.0% of all women with births.
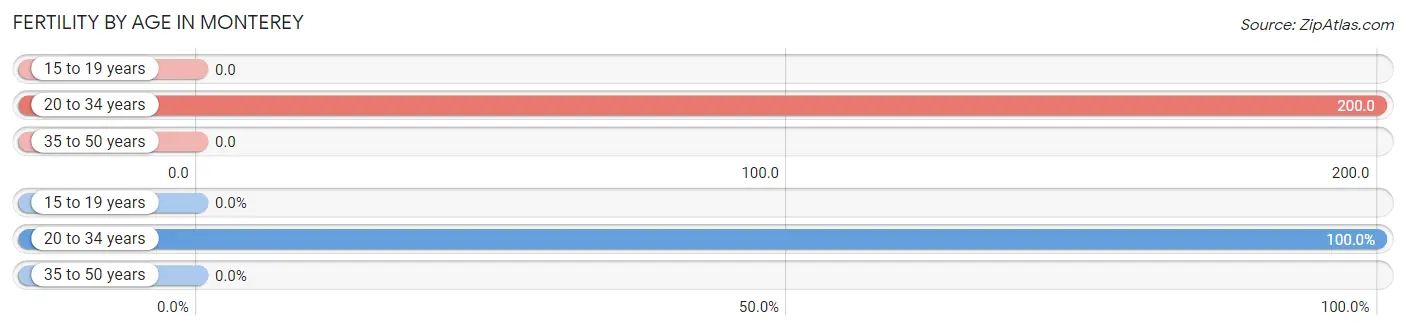
| Age Bracket | Women with Births | Births / 1,000 Women |
| 15 to 19 years | 0 (0.0%) | 0.0 |
| 20 to 34 years | 1 (100.0%) | 200.0 |
| 35 to 50 years | 0 (0.0%) | 0.0 |
| Total | 1 (100.0%) | 63.0 |
Fertility by Age by Marriage Status in Monterey
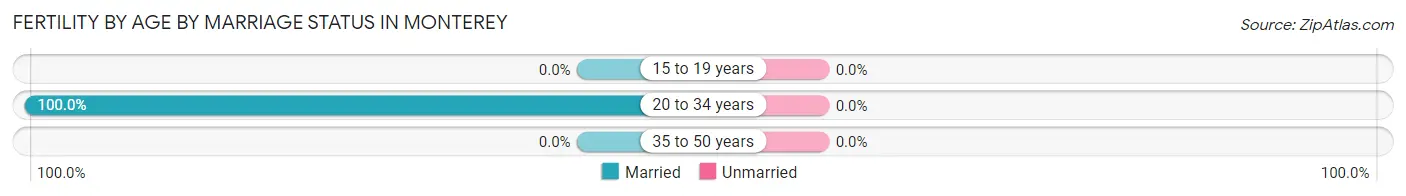
| Age Bracket | Married | Unmarried |
| 15 to 19 years | 0 (0.0%) | 0 (0.0%) |
| 20 to 34 years | 1 (100.0%) | 0 (0.0%) |
| 35 to 50 years | 0 (0.0%) | 0 (0.0%) |
| Total | 1 (100.0%) | 0 (0.0%) |
Fertility by Education in Monterey
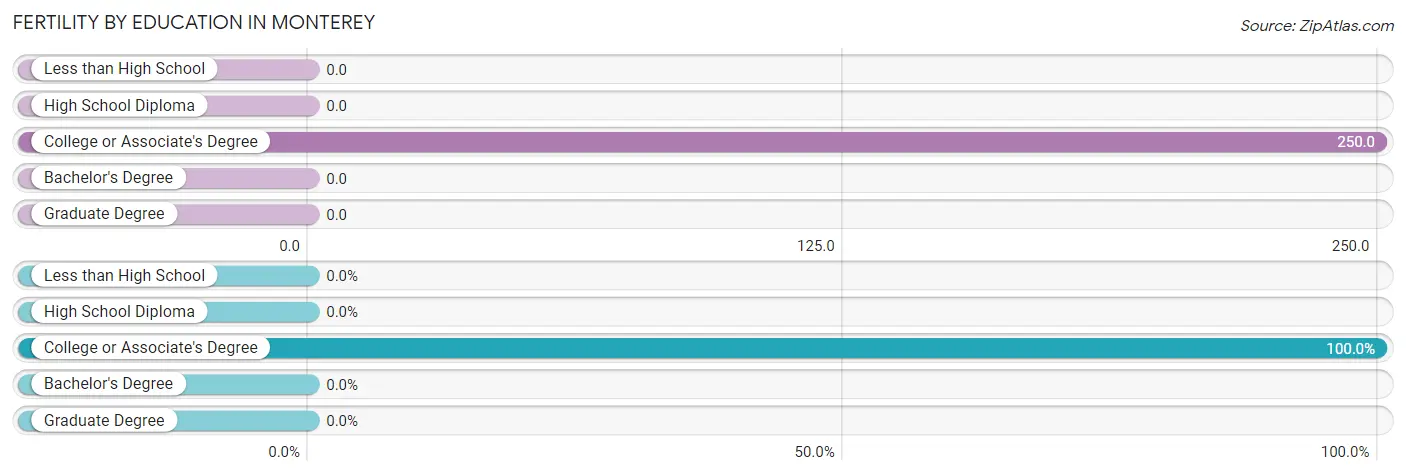
| Educational Attainment | Women with Births | Births / 1,000 Women |
| Less than High School | 0 (0.0%) | 0.0 |
| High School Diploma | 0 (0.0%) | 0.0 |
| College or Associate's Degree | 1 (100.0%) | 250.0 |
| Bachelor's Degree | 0 (0.0%) | 0.0 |
| Graduate Degree | 0 (0.0%) | 0.0 |
| Total | 1 (100.0%) | 63.0 |
Fertility by Education by Marriage Status in Monterey
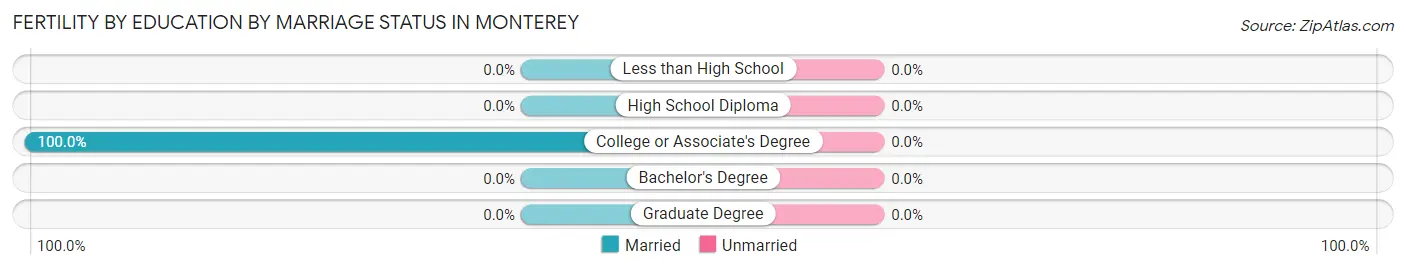
| Educational Attainment | Married | Unmarried |
| Less than High School | 0 (0.0%) | 0 (0.0%) |
| High School Diploma | 0 (0.0%) | 0 (0.0%) |
| College or Associate's Degree | 1 (100.0%) | 0 (0.0%) |
| Bachelor's Degree | 0 (0.0%) | 0 (0.0%) |
| Graduate Degree | 0 (0.0%) | 0 (0.0%) |
| Total | 1 (100.0%) | 0 (0.0%) |
Employment Characteristics in Monterey
Employment by Class of Employer in Monterey
Among the 43 employed individuals in Monterey, private company employees (27 | 62.8%), state government employees (11 | 25.6%), and local government employees (5 | 11.6%) make up the most common classes of employment.
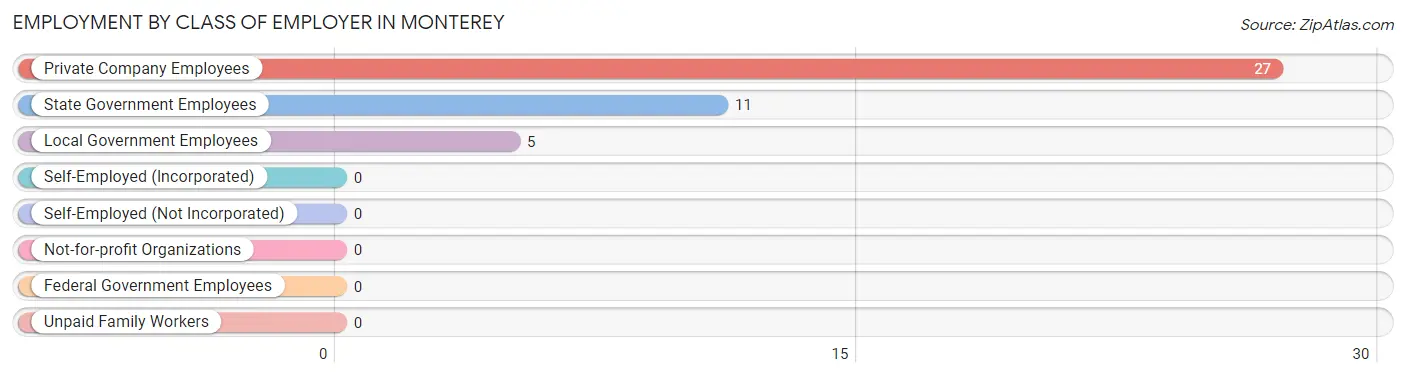
| Employer Class | # Employees | % Employees |
| Private Company Employees | 27 | 62.8% |
| Self-Employed (Incorporated) | 0 | 0.0% |
| Self-Employed (Not Incorporated) | 0 | 0.0% |
| Not-for-profit Organizations | 0 | 0.0% |
| Local Government Employees | 5 | 11.6% |
| State Government Employees | 11 | 25.6% |
| Federal Government Employees | 0 | 0.0% |
| Unpaid Family Workers | 0 | 0.0% |
| Total | 43 | 100.0% |
Employment Status by Age in Monterey
According to the labor force statistics for Monterey, out of the total population over 16 years of age (89), 58.4% or 52 individuals are in the labor force, with 17.3% or 9 of them unemployed. The age group with the highest labor force participation rate is 25 to 29 years, with 100.0% or 3 individuals in the labor force. Within the labor force, the 16 to 19 years age range has the highest percentage of unemployed individuals, with 60.0% or 3 of them being unemployed.
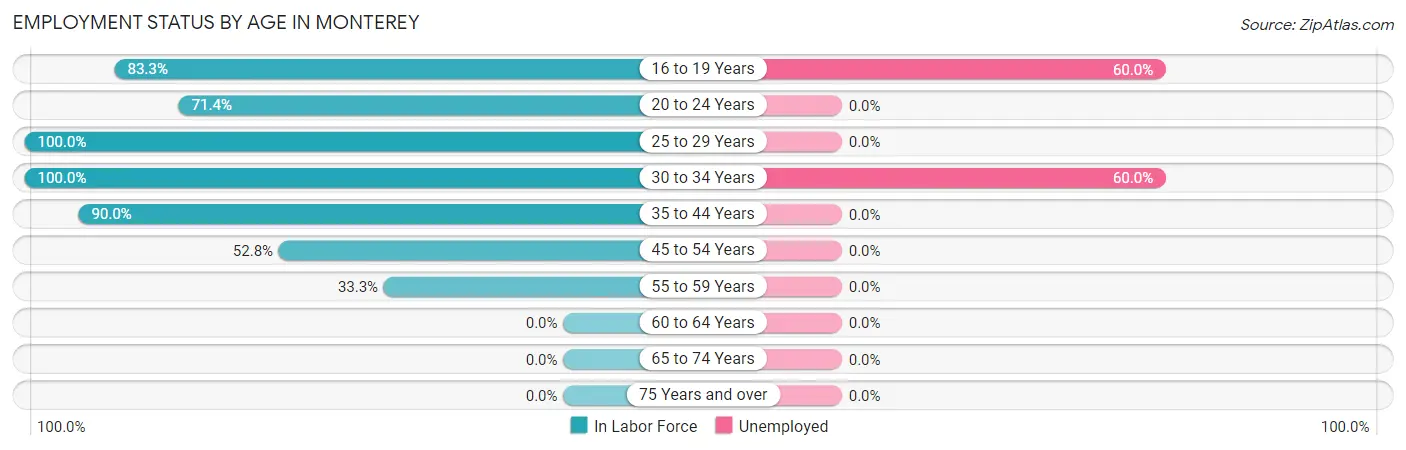
| Age Bracket | In Labor Force | Unemployed |
| 16 to 19 Years | 5 (83.3%) | 3 (60.0%) |
| 20 to 24 Years | 5 (71.4%) | 0 (0.0%) |
| 25 to 29 Years | 3 (100.0%) | 0 (0.0%) |
| 30 to 34 Years | 10 (100.0%) | 6 (60.0%) |
| 35 to 44 Years | 9 (90.0%) | 0 (0.0%) |
| 45 to 54 Years | 19 (52.8%) | 0 (0.0%) |
| 55 to 59 Years | 1 (33.3%) | 0 (0.0%) |
| 60 to 64 Years | 0 (0.0%) | 0 (0.0%) |
| 65 to 74 Years | 0 (0.0%) | 0 (0.0%) |
| 75 Years and over | 0 (0.0%) | 0 (0.0%) |
| Total | 52 (58.4%) | 9 (17.3%) |
Employment Status by Educational Attainment in Monterey
According to labor force statistics for Monterey, 60.9% of individuals (42) out of the total population between 25 and 64 years of age (69) are in the labor force, with 14.3% or 6 of them being unemployed. The group with the highest labor force participation rate are those with the educational attainment of college / associate degree, with 90.9% or 10 individuals in the labor force. Within the labor force, individuals with high school diploma education have the highest percentage of unemployment, with 23.1% or 6 of them being unemployed.
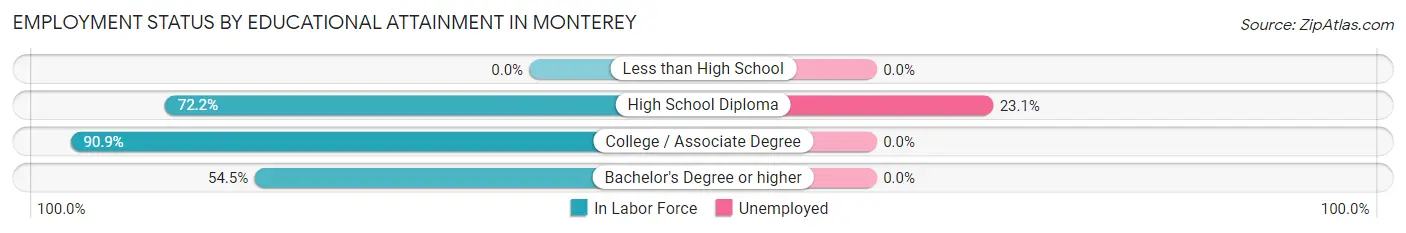
| Educational Attainment | In Labor Force | Unemployed |
| Less than High School | 0 (0.0%) | 0 (0.0%) |
| High School Diploma | 26 (72.2%) | 8 (23.1%) |
| College / Associate Degree | 10 (90.9%) | 0 (0.0%) |
| Bachelor's Degree or higher | 6 (54.5%) | 0 (0.0%) |
| Total | 42 (60.9%) | 10 (14.3%) |
Employment Occupations by Sex in Monterey
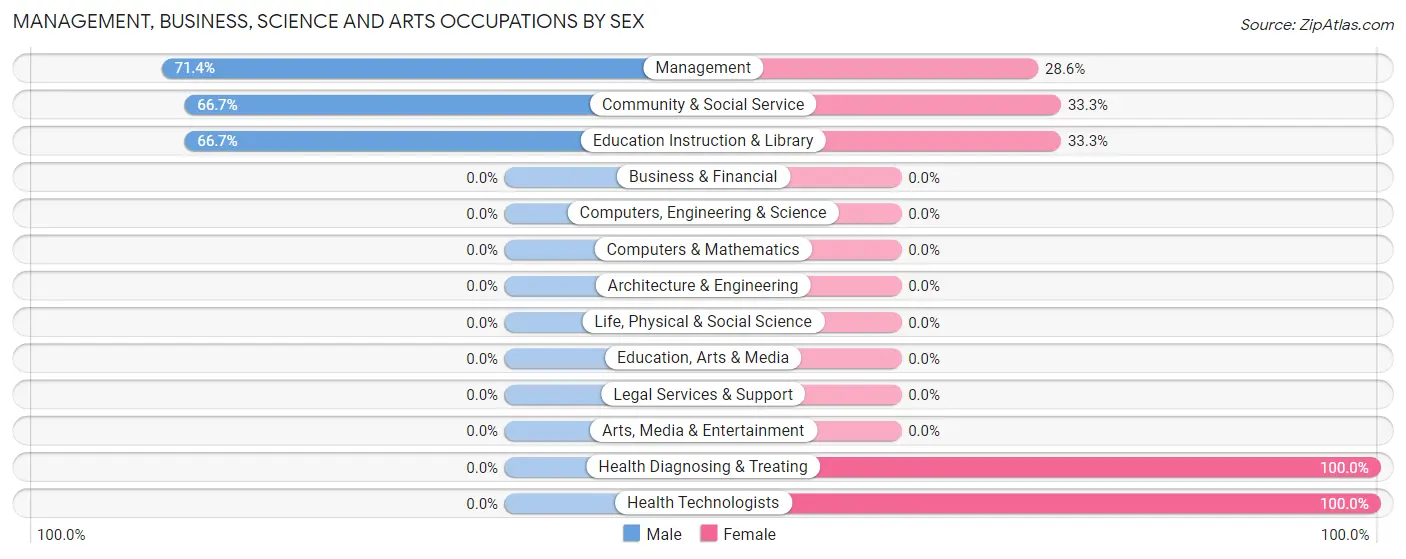
Management, Business, Science and Arts Occupations
The most common Management, Business, Science and Arts occupations in Monterey are Management (7 | 16.3%), Community & Social Service (3 | 7.0%), Education Instruction & Library (3 | 7.0%), Health Diagnosing & Treating (1 | 2.3%), and Health Technologists (1 | 2.3%).
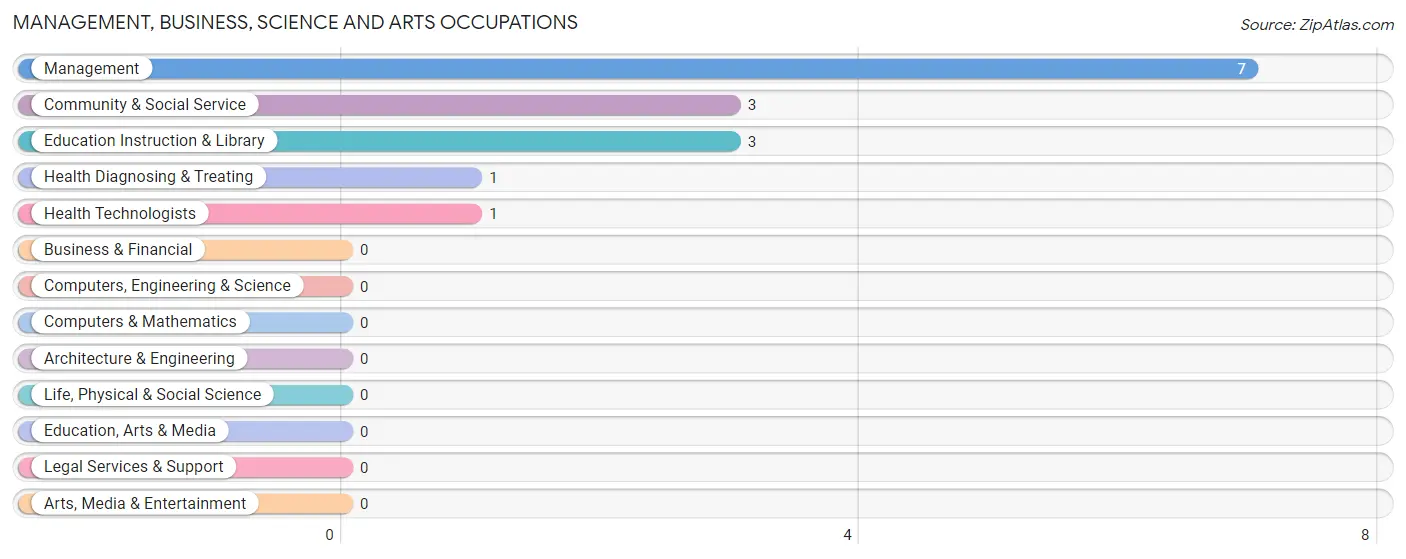
Management, Business, Science and Arts Occupations by Sex
Within the Management, Business, Science and Arts occupations in Monterey, the most male-oriented occupations are Management (71.4%), Community & Social Service (66.7%), and Education Instruction & Library (66.7%), while the most female-oriented occupations are Health Diagnosing & Treating (100.0%), Health Technologists (100.0%), and Community & Social Service (33.3%).
| Occupation | Male | Female |
| Management | 5 (71.4%) | 2 (28.6%) |
| Business & Financial | 0 (0.0%) | 0 (0.0%) |
| Computers, Engineering & Science | 0 (0.0%) | 0 (0.0%) |
| Computers & Mathematics | 0 (0.0%) | 0 (0.0%) |
| Architecture & Engineering | 0 (0.0%) | 0 (0.0%) |
| Life, Physical & Social Science | 0 (0.0%) | 0 (0.0%) |
| Community & Social Service | 2 (66.7%) | 1 (33.3%) |
| Education, Arts & Media | 0 (0.0%) | 0 (0.0%) |
| Legal Services & Support | 0 (0.0%) | 0 (0.0%) |
| Education Instruction & Library | 2 (66.7%) | 1 (33.3%) |
| Arts, Media & Entertainment | 0 (0.0%) | 0 (0.0%) |
| Health Diagnosing & Treating | 0 (0.0%) | 1 (100.0%) |
| Health Technologists | 0 (0.0%) | 1 (100.0%) |
| Total (Category) | 7 (63.6%) | 4 (36.4%) |
| Total (Overall) | 31 (72.1%) | 12 (27.9%) |
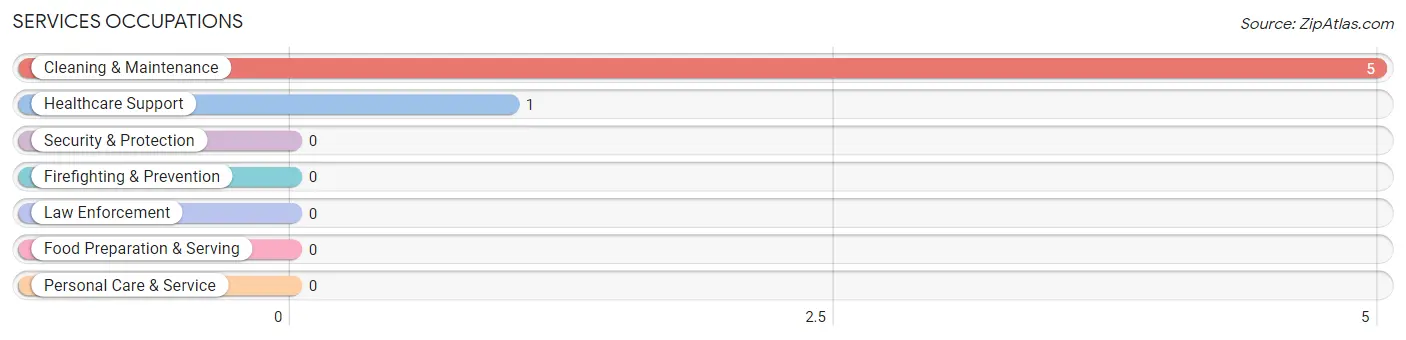
Services Occupations
The most common Services occupations in Monterey are Cleaning & Maintenance (5 | 11.6%), and Healthcare Support (1 | 2.3%).
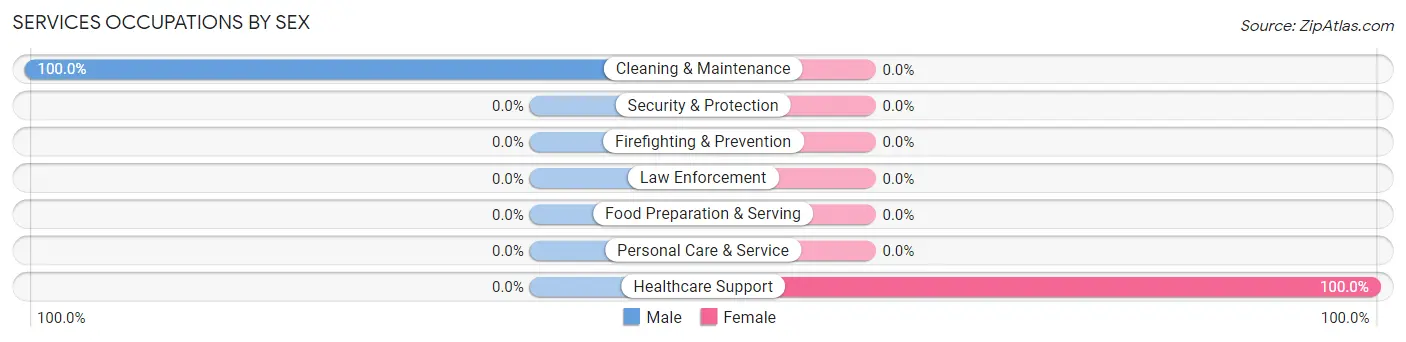
Services Occupations by Sex
| Occupation | Male | Female |
| Healthcare Support | 0 (0.0%) | 1 (100.0%) |
| Security & Protection | 0 (0.0%) | 0 (0.0%) |
| Firefighting & Prevention | 0 (0.0%) | 0 (0.0%) |
| Law Enforcement | 0 (0.0%) | 0 (0.0%) |
| Food Preparation & Serving | 0 (0.0%) | 0 (0.0%) |
| Cleaning & Maintenance | 5 (100.0%) | 0 (0.0%) |
| Personal Care & Service | 0 (0.0%) | 0 (0.0%) |
| Total (Category) | 5 (83.3%) | 1 (16.7%) |
| Total (Overall) | 31 (72.1%) | 12 (27.9%) |
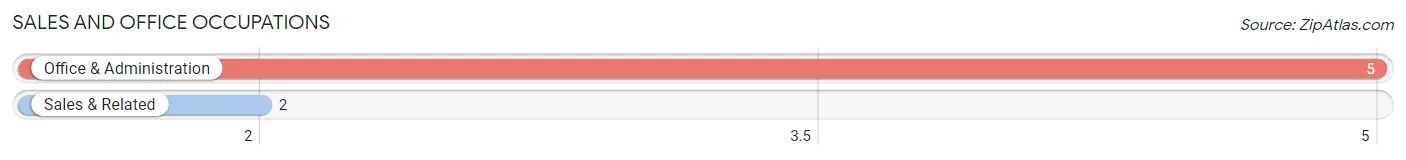
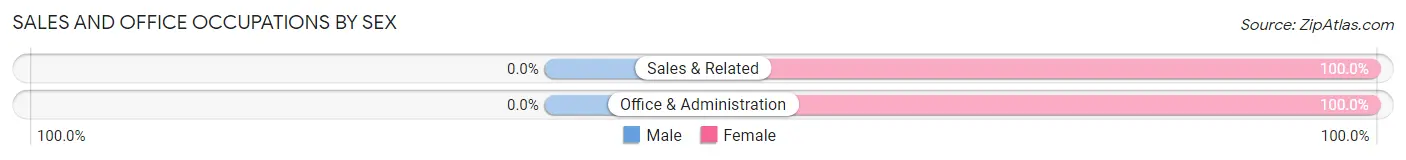
Sales and Office Occupations
The most common Sales and Office occupations in Monterey are Office & Administration (5 | 11.6%), and Sales & Related (2 | 4.6%).
Sales and Office Occupations by Sex
| Occupation | Male | Female |
| Sales & Related | 0 (0.0%) | 2 (100.0%) |
| Office & Administration | 0 (0.0%) | 5 (100.0%) |
| Total (Category) | 0 (0.0%) | 7 (100.0%) |
| Total (Overall) | 31 (72.1%) | 12 (27.9%) |
Natural Resources, Construction and Maintenance Occupations
The most common Natural Resources, Construction and Maintenance occupations in Monterey are , and Construction & Extraction (6 | 14.0%).
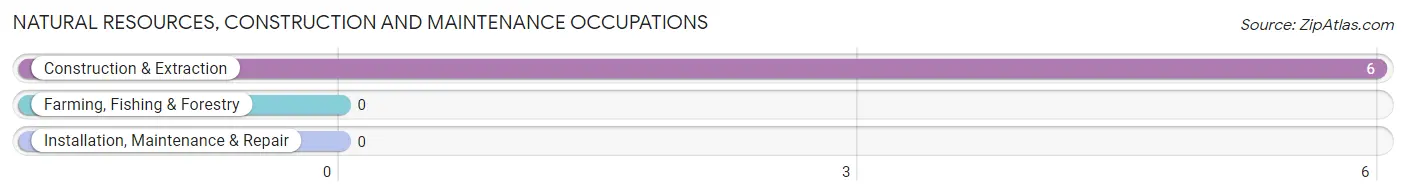
Natural Resources, Construction and Maintenance Occupations by Sex
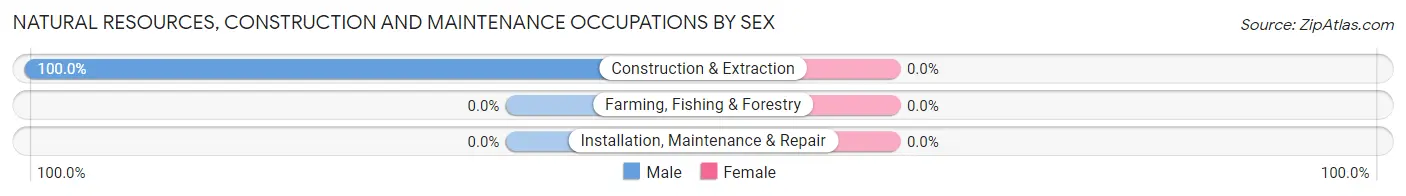
| Occupation | Male | Female |
| Farming, Fishing & Forestry | 0 (0.0%) | 0 (0.0%) |
| Construction & Extraction | 6 (100.0%) | 0 (0.0%) |
| Installation, Maintenance & Repair | 0 (0.0%) | 0 (0.0%) |
| Total (Category) | 6 (100.0%) | 0 (0.0%) |
| Total (Overall) | 31 (72.1%) | 12 (27.9%) |
Production, Transportation and Moving Occupations
The most common Production, Transportation and Moving occupations in Monterey are Production (9 | 20.9%), Material Moving (3 | 7.0%), and Transportation (1 | 2.3%).
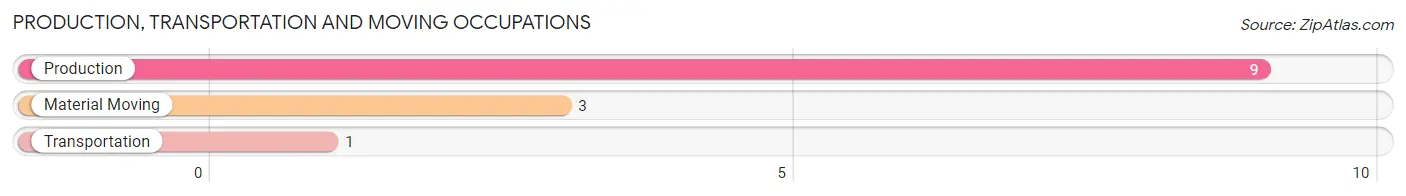
Production, Transportation and Moving Occupations by Sex
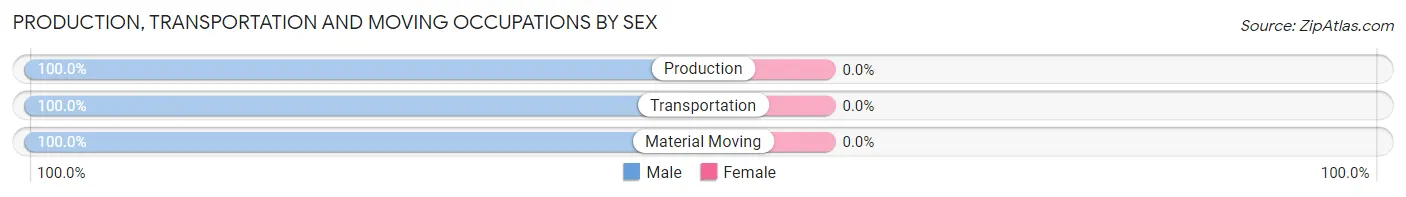
| Occupation | Male | Female |
| Production | 9 (100.0%) | 0 (0.0%) |
| Transportation | 1 (100.0%) | 0 (0.0%) |
| Material Moving | 3 (100.0%) | 0 (0.0%) |
| Total (Category) | 13 (100.0%) | 0 (0.0%) |
| Total (Overall) | 31 (72.1%) | 12 (27.9%) |
Employment Industries by Sex in Monterey
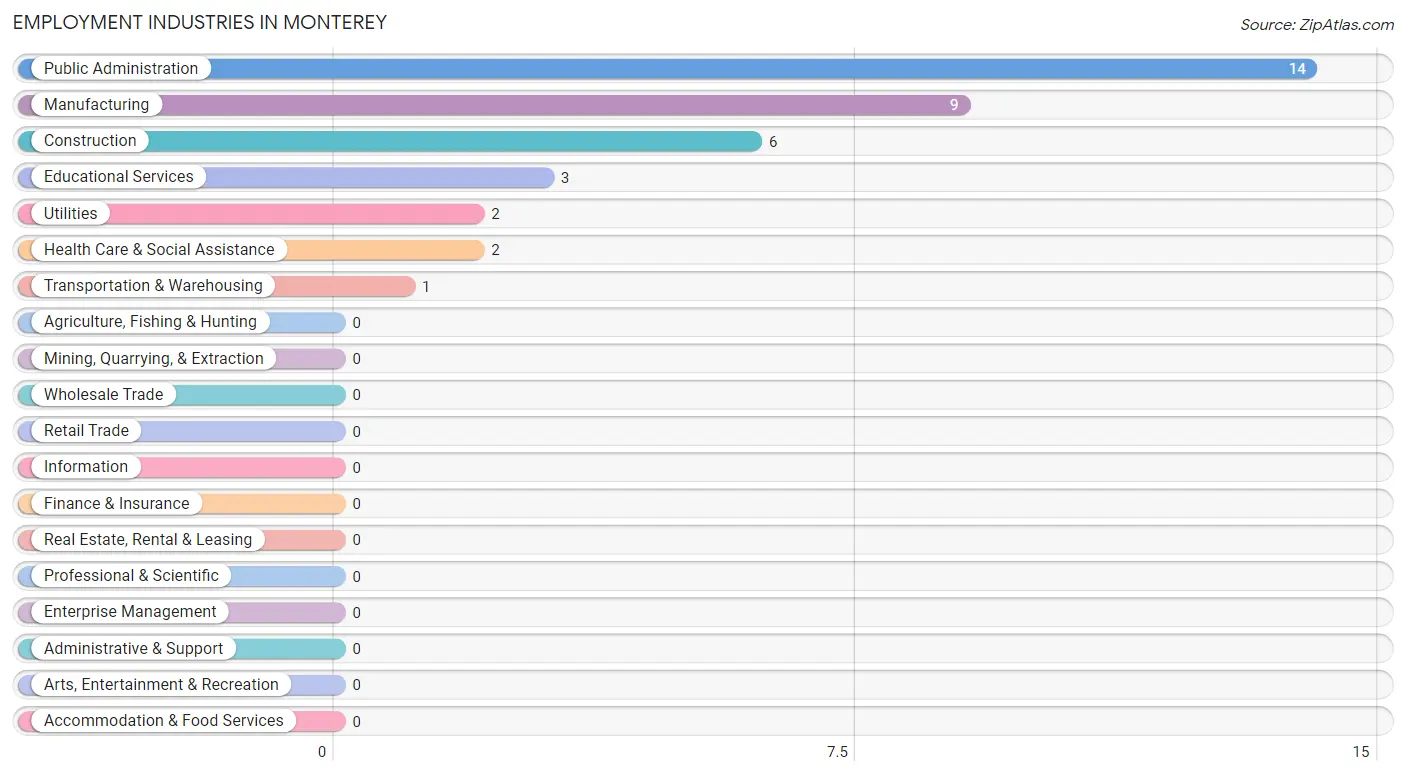
Employment Industries in Monterey
The major employment industries in Monterey include Public Administration (14 | 32.6%), Manufacturing (9 | 20.9%), Construction (6 | 14.0%), Educational Services (3 | 7.0%), and Utilities (2 | 4.6%).
Employment Industries by Sex in Monterey
The Monterey industries that see more men than women are Construction (100.0%), Manufacturing (100.0%), and Transportation & Warehousing (100.0%), whereas the industries that tend to have a higher number of women are Utilities (100.0%), Health Care & Social Assistance (100.0%), and Public Administration (50.0%).
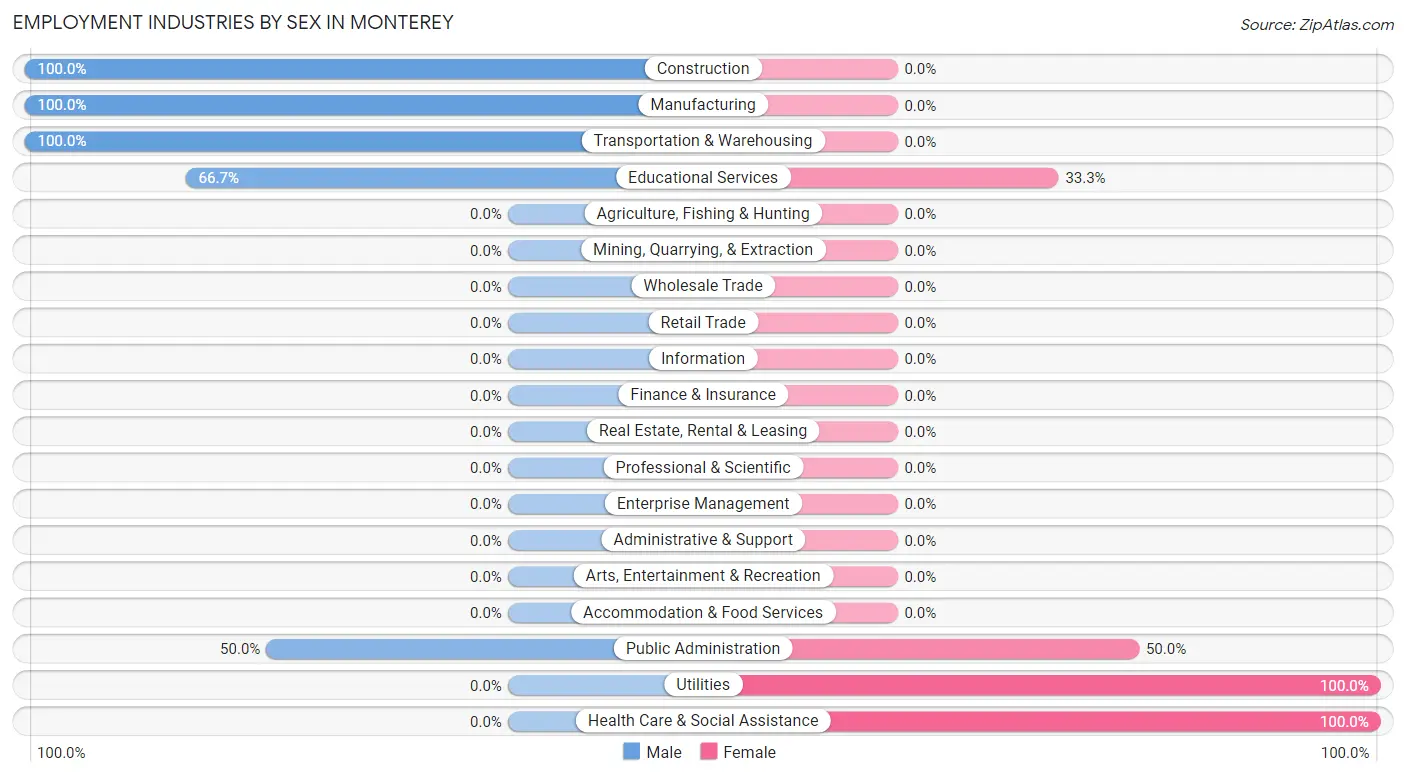
| Industry | Male | Female |
| Agriculture, Fishing & Hunting | 0 (0.0%) | 0 (0.0%) |
| Mining, Quarrying, & Extraction | 0 (0.0%) | 0 (0.0%) |
| Construction | 6 (100.0%) | 0 (0.0%) |
| Manufacturing | 9 (100.0%) | 0 (0.0%) |
| Wholesale Trade | 0 (0.0%) | 0 (0.0%) |
| Retail Trade | 0 (0.0%) | 0 (0.0%) |
| Transportation & Warehousing | 1 (100.0%) | 0 (0.0%) |
| Utilities | 0 (0.0%) | 2 (100.0%) |
| Information | 0 (0.0%) | 0 (0.0%) |
| Finance & Insurance | 0 (0.0%) | 0 (0.0%) |
| Real Estate, Rental & Leasing | 0 (0.0%) | 0 (0.0%) |
| Professional & Scientific | 0 (0.0%) | 0 (0.0%) |
| Enterprise Management | 0 (0.0%) | 0 (0.0%) |
| Administrative & Support | 0 (0.0%) | 0 (0.0%) |
| Educational Services | 2 (66.7%) | 1 (33.3%) |
| Health Care & Social Assistance | 0 (0.0%) | 2 (100.0%) |
| Arts, Entertainment & Recreation | 0 (0.0%) | 0 (0.0%) |
| Accommodation & Food Services | 0 (0.0%) | 0 (0.0%) |
| Public Administration | 7 (50.0%) | 7 (50.0%) |
| Total | 31 (72.1%) | 12 (27.9%) |
Education in Monterey
School Enrollment in Monterey
The most common levels of schooling among the 17 students in Monterey are high school (6 | 35.3%), college / undergraduate (4 | 23.5%), and elementary school (3 | 17.6%).
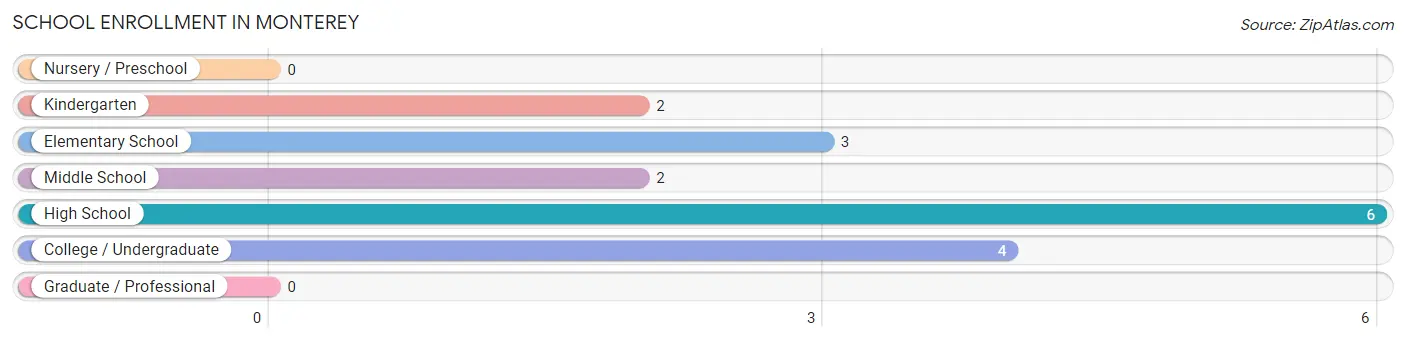
| School Level | # Students | % Students |
| Nursery / Preschool | 0 | 0.0% |
| Kindergarten | 2 | 11.8% |
| Elementary School | 3 | 17.6% |
| Middle School | 2 | 11.8% |
| High School | 6 | 35.3% |
| College / Undergraduate | 4 | 23.5% |
| Graduate / Professional | 0 | 0.0% |
| Total | 17 | 100.0% |
School Enrollment by Age by Funding Source in Monterey
Out of a total of 17 students who are enrolled in schools in Monterey, 5 (29.4%) attend a private institution, while the remaining 12 (70.6%) are enrolled in public schools. The age group of 18 to 19 year olds has the highest likelihood of being enrolled in private schools, with 5 (100.0% in the age bracket) enrolled. Conversely, the age group of 5 to 9 year old has the lowest likelihood of being enrolled in a private school, with 5 (100.0% in the age bracket) attending a public institution.
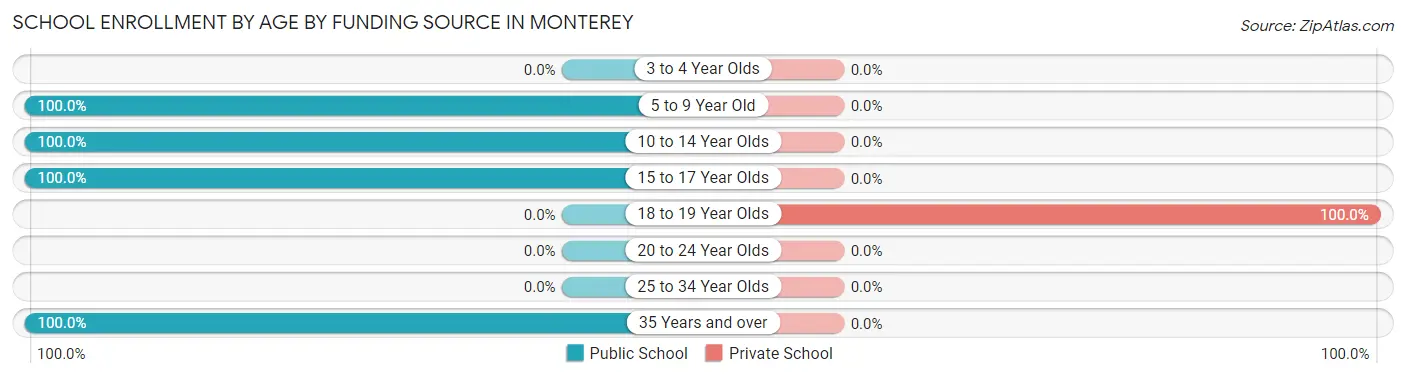
| Age Bracket | Public School | Private School |
| 3 to 4 Year Olds | 0 (0.0%) | 0 (0.0%) |
| 5 to 9 Year Old | 5 (100.0%) | 0 (0.0%) |
| 10 to 14 Year Olds | 3 (100.0%) | 0 (0.0%) |
| 15 to 17 Year Olds | 2 (100.0%) | 0 (0.0%) |
| 18 to 19 Year Olds | 0 (0.0%) | 5 (100.0%) |
| 20 to 24 Year Olds | 0 (0.0%) | 0 (0.0%) |
| 25 to 34 Year Olds | 0 (0.0%) | 0 (0.0%) |
| 35 Years and over | 2 (100.0%) | 0 (0.0%) |
| Total | 12 (70.6%) | 5 (29.4%) |
Educational Attainment by Field of Study in Monterey
Business (5 | 38.5%), physical & health sciences (4 | 30.8%), and education (4 | 30.8%) are the most common fields of study among 13 individuals in Monterey who have obtained a bachelor's degree or higher.
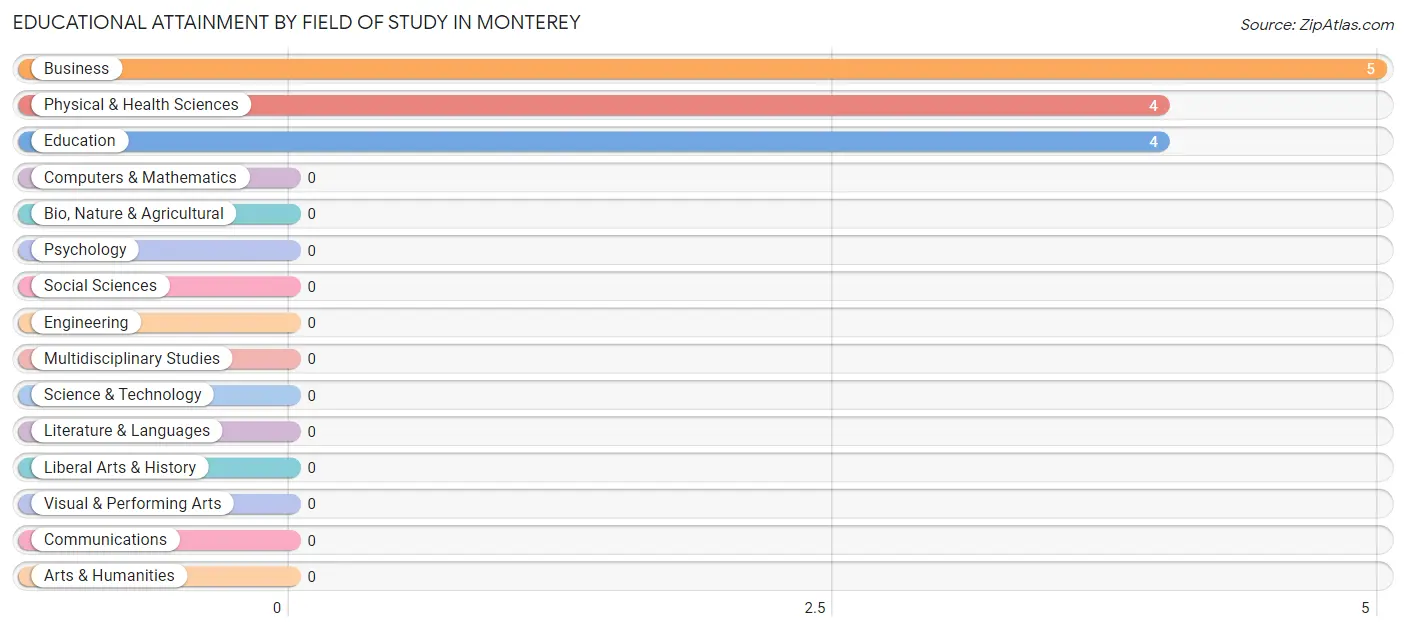
| Field of Study | # Graduates | % Graduates |
| Computers & Mathematics | 0 | 0.0% |
| Bio, Nature & Agricultural | 0 | 0.0% |
| Physical & Health Sciences | 4 | 30.8% |
| Psychology | 0 | 0.0% |
| Social Sciences | 0 | 0.0% |
| Engineering | 0 | 0.0% |
| Multidisciplinary Studies | 0 | 0.0% |
| Science & Technology | 0 | 0.0% |
| Business | 5 | 38.5% |
| Education | 4 | 30.8% |
| Literature & Languages | 0 | 0.0% |
| Liberal Arts & History | 0 | 0.0% |
| Visual & Performing Arts | 0 | 0.0% |
| Communications | 0 | 0.0% |
| Arts & Humanities | 0 | 0.0% |
| Total | 13 | 100.0% |
Transportation & Commute in Monterey
Vehicle Availability by Sex in Monterey
The most prevalent vehicle ownership categories in Monterey are males with 4 vehicles (15, accounting for 48.4%) and females with 4 vehicles (6, making up 125.0%).
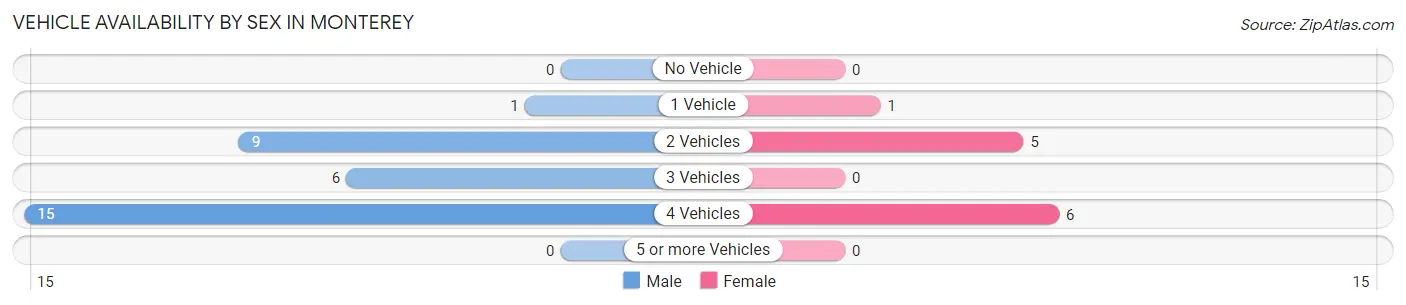
| Vehicles Available | Male | Female |
| No Vehicle | 0 (0.0%) | 0 (0.0%) |
| 1 Vehicle | 1 (3.2%) | 1 (8.3%) |
| 2 Vehicles | 9 (29.0%) | 5 (41.7%) |
| 3 Vehicles | 6 (19.4%) | 0 (0.0%) |
| 4 Vehicles | 15 (48.4%) | 6 (50.0%) |
| 5 or more Vehicles | 0 (0.0%) | 0 (0.0%) |
| Total | 31 (100.0%) | 12 (100.0%) |
Commute Time in Monterey
The most frequently occuring commute durations in Monterey are 30 to 34 minutes (16 commuters, 37.2%), 20 to 24 minutes (8 commuters, 18.6%), and 25 to 29 minutes (6 commuters, 14.0%).
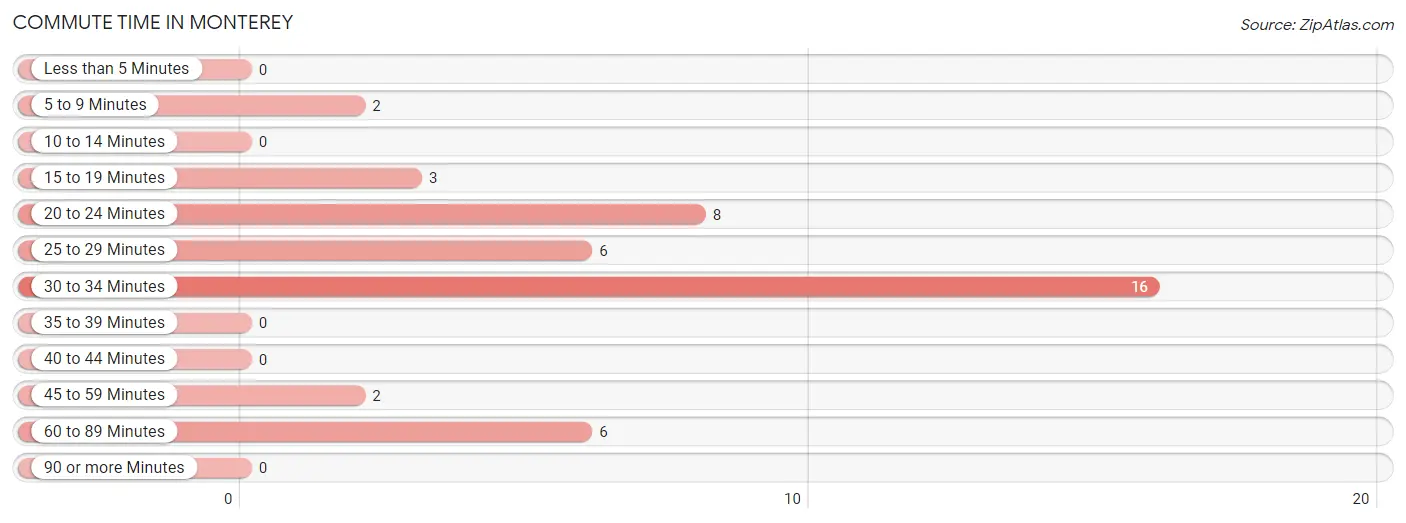
| Commute Time | # Commuters | % Commuters |
| Less than 5 Minutes | 0 | 0.0% |
| 5 to 9 Minutes | 2 | 4.6% |
| 10 to 14 Minutes | 0 | 0.0% |
| 15 to 19 Minutes | 3 | 7.0% |
| 20 to 24 Minutes | 8 | 18.6% |
| 25 to 29 Minutes | 6 | 14.0% |
| 30 to 34 Minutes | 16 | 37.2% |
| 35 to 39 Minutes | 0 | 0.0% |
| 40 to 44 Minutes | 0 | 0.0% |
| 45 to 59 Minutes | 2 | 4.6% |
| 60 to 89 Minutes | 6 | 14.0% |
| 90 or more Minutes | 0 | 0.0% |
Commute Time by Sex in Monterey
The most common commute times in Monterey are 30 to 34 minutes (10 commuters, 32.3%) for males and 30 to 34 minutes (6 commuters, 50.0%) for females.
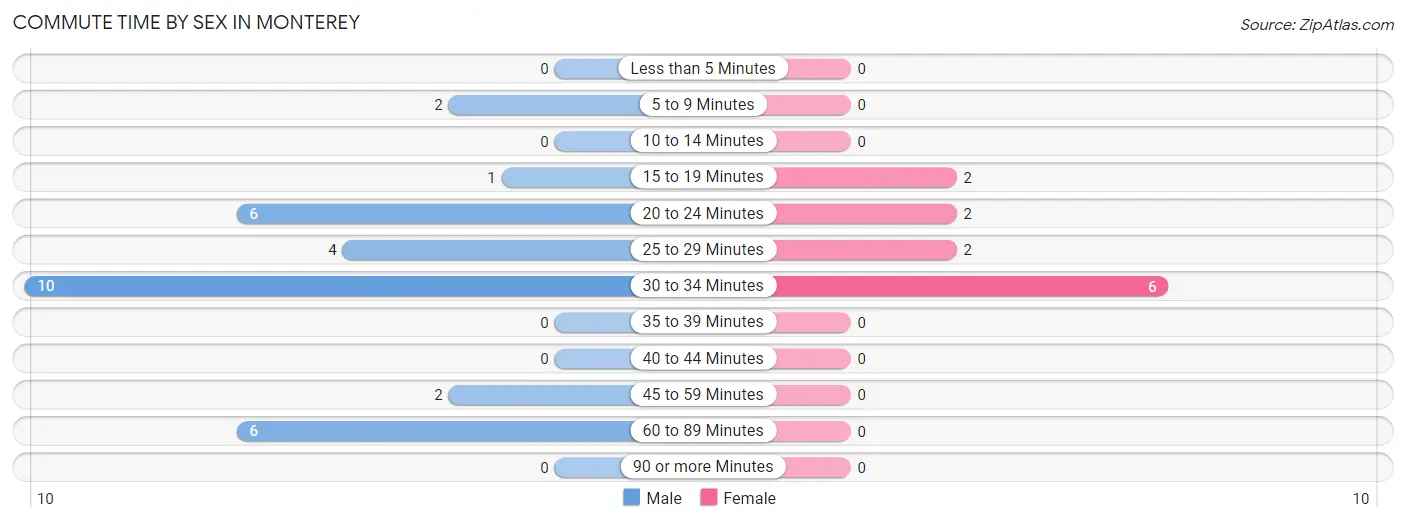
| Commute Time | Male | Female |
| Less than 5 Minutes | 0 (0.0%) | 0 (0.0%) |
| 5 to 9 Minutes | 2 (6.5%) | 0 (0.0%) |
| 10 to 14 Minutes | 0 (0.0%) | 0 (0.0%) |
| 15 to 19 Minutes | 1 (3.2%) | 2 (16.7%) |
| 20 to 24 Minutes | 6 (19.4%) | 2 (16.7%) |
| 25 to 29 Minutes | 4 (12.9%) | 2 (16.7%) |
| 30 to 34 Minutes | 10 (32.3%) | 6 (50.0%) |
| 35 to 39 Minutes | 0 (0.0%) | 0 (0.0%) |
| 40 to 44 Minutes | 0 (0.0%) | 0 (0.0%) |
| 45 to 59 Minutes | 2 (6.5%) | 0 (0.0%) |
| 60 to 89 Minutes | 6 (19.4%) | 0 (0.0%) |
| 90 or more Minutes | 0 (0.0%) | 0 (0.0%) |
Time of Departure to Work by Sex in Monterey
The most frequent times of departure to work in Monterey are 5:00 AM to 5:29 AM (12, 38.7%) for males and 6:30 AM to 6:59 AM (6, 50.0%) for females.
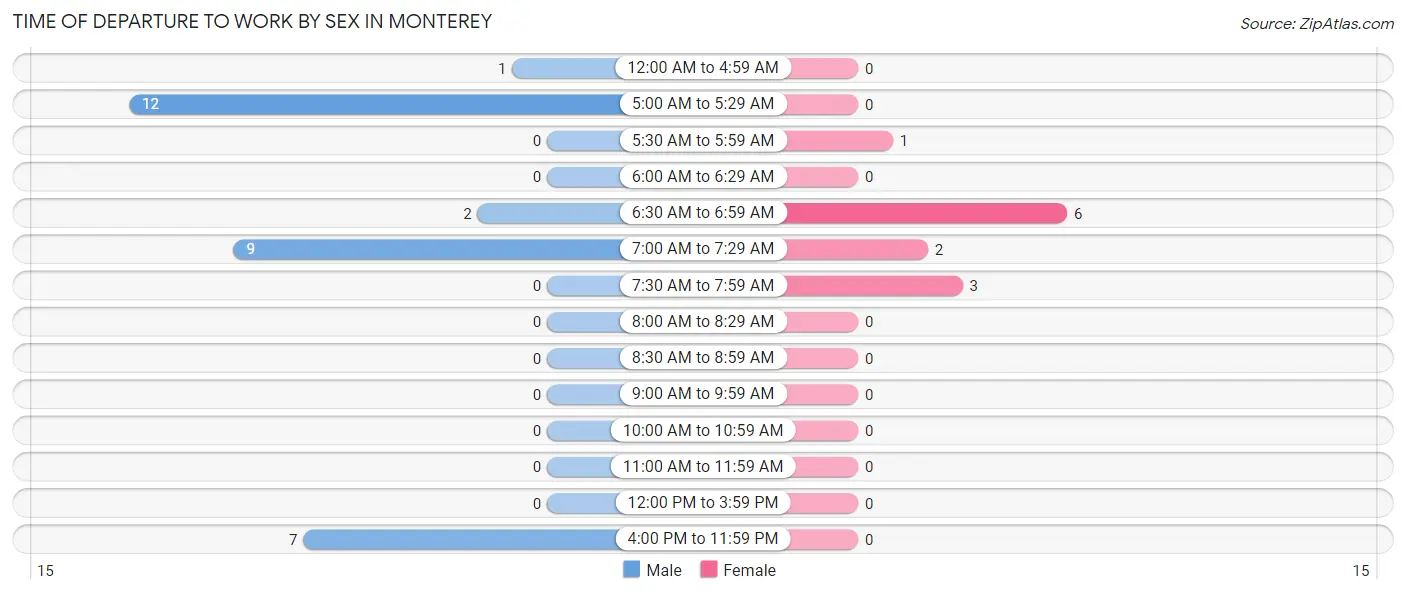
| Time of Departure | Male | Female |
| 12:00 AM to 4:59 AM | 1 (3.2%) | 0 (0.0%) |
| 5:00 AM to 5:29 AM | 12 (38.7%) | 0 (0.0%) |
| 5:30 AM to 5:59 AM | 0 (0.0%) | 1 (8.3%) |
| 6:00 AM to 6:29 AM | 0 (0.0%) | 0 (0.0%) |
| 6:30 AM to 6:59 AM | 2 (6.5%) | 6 (50.0%) |
| 7:00 AM to 7:29 AM | 9 (29.0%) | 2 (16.7%) |
| 7:30 AM to 7:59 AM | 0 (0.0%) | 3 (25.0%) |
| 8:00 AM to 8:29 AM | 0 (0.0%) | 0 (0.0%) |
| 8:30 AM to 8:59 AM | 0 (0.0%) | 0 (0.0%) |
| 9:00 AM to 9:59 AM | 0 (0.0%) | 0 (0.0%) |
| 10:00 AM to 10:59 AM | 0 (0.0%) | 0 (0.0%) |
| 11:00 AM to 11:59 AM | 0 (0.0%) | 0 (0.0%) |
| 12:00 PM to 3:59 PM | 0 (0.0%) | 0 (0.0%) |
| 4:00 PM to 11:59 PM | 7 (22.6%) | 0 (0.0%) |
| Total | 31 (100.0%) | 12 (100.0%) |
Housing Occupancy in Monterey
Occupancy by Ownership in Monterey
Of the total 52 dwellings in Monterey, owner-occupied units account for 48 (92.3%), while renter-occupied units make up 4 (7.7%).
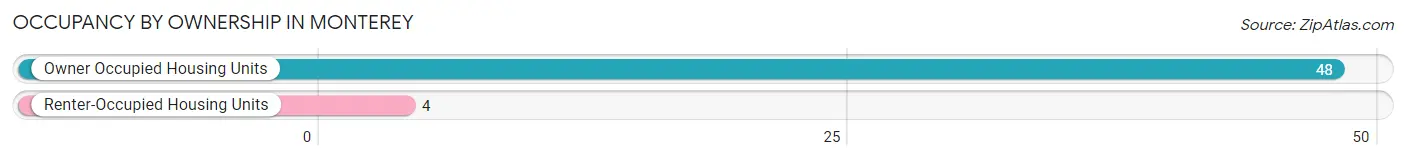
| Occupancy | # Housing Units | % Housing Units |
| Owner Occupied Housing Units | 48 | 92.3% |
| Renter-Occupied Housing Units | 4 | 7.7% |
| Total Occupied Housing Units | 52 | 100.0% |
Occupancy by Household Size in Monterey
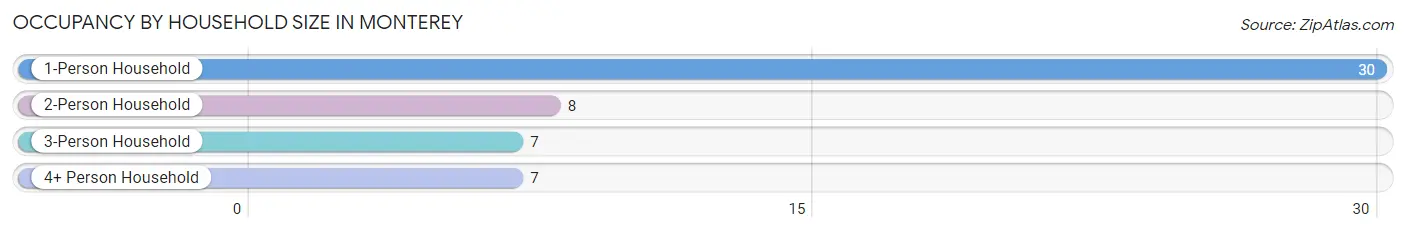
| Household Size | # Housing Units | % Housing Units |
| 1-Person Household | 30 | 57.7% |
| 2-Person Household | 8 | 15.4% |
| 3-Person Household | 7 | 13.5% |
| 4+ Person Household | 7 | 13.5% |
| Total Housing Units | 52 | 100.0% |
Occupancy by Ownership by Household Size in Monterey
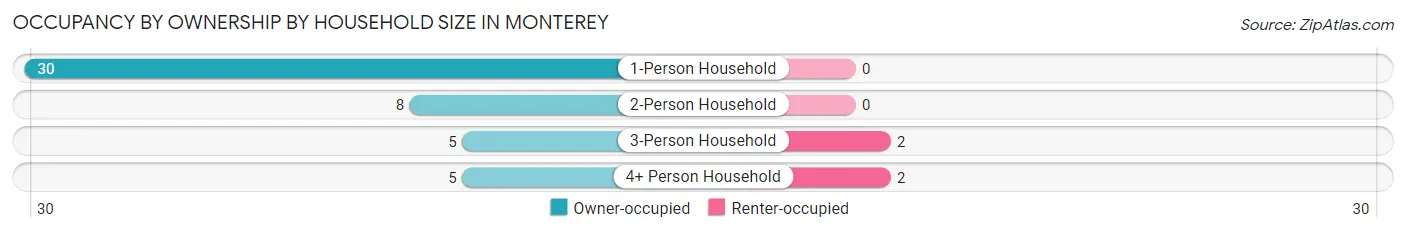
| Household Size | Owner-occupied | Renter-occupied |
| 1-Person Household | 30 (100.0%) | 0 (0.0%) |
| 2-Person Household | 8 (100.0%) | 0 (0.0%) |
| 3-Person Household | 5 (71.4%) | 2 (28.6%) |
| 4+ Person Household | 5 (71.4%) | 2 (28.6%) |
| Total Housing Units | 48 (92.3%) | 4 (7.7%) |
Occupancy by Educational Attainment in Monterey
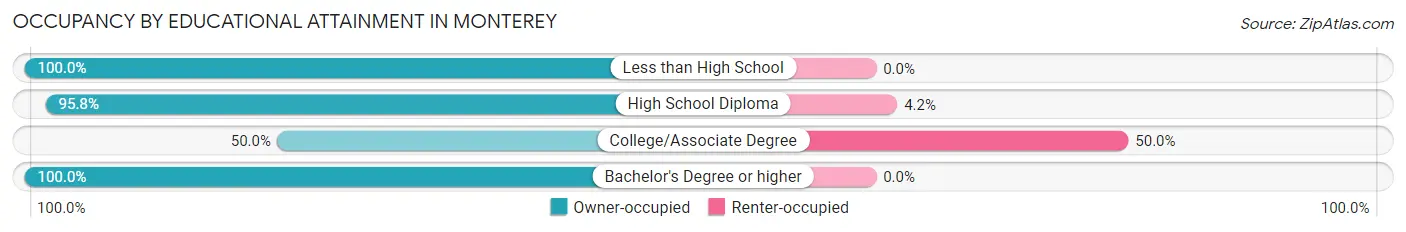
| Household Size | Owner-occupied | Renter-occupied |
| Less than High School | 11 (100.0%) | 0 (0.0%) |
| High School Diploma | 23 (95.8%) | 1 (4.2%) |
| College/Associate Degree | 3 (50.0%) | 3 (50.0%) |
| Bachelor's Degree or higher | 11 (100.0%) | 0 (0.0%) |
Occupancy by Age of Householder in Monterey
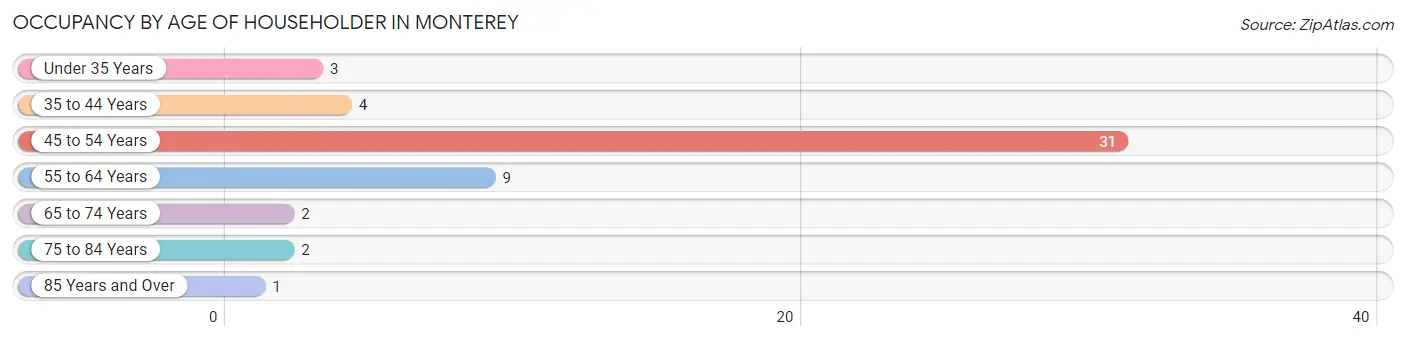
| Age Bracket | # Households | % Households |
| Under 35 Years | 3 | 5.8% |
| 35 to 44 Years | 4 | 7.7% |
| 45 to 54 Years | 31 | 59.6% |
| 55 to 64 Years | 9 | 17.3% |
| 65 to 74 Years | 2 | 3.8% |
| 75 to 84 Years | 2 | 3.8% |
| 85 Years and Over | 1 | 1.9% |
| Total | 52 | 100.0% |
Housing Finances in Monterey
Median Income by Occupancy in Monterey
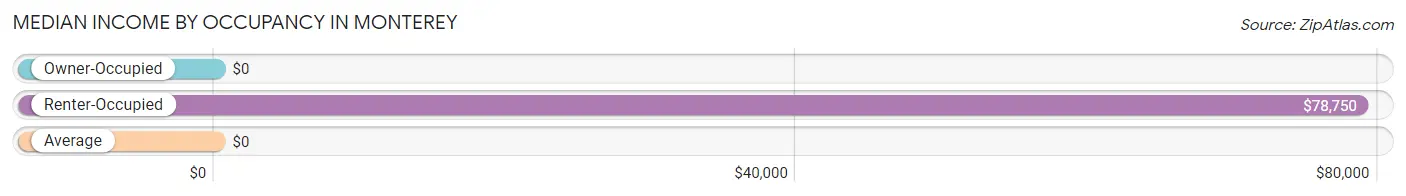
| Occupancy Type | # Households | Median Income |
| Owner-Occupied | 48 (92.3%) | $0 |
| Renter-Occupied | 4 (7.7%) | $78,750 |
| Average | 52 (100.0%) | $0 |
Occupancy by Householder Income Bracket in Monterey
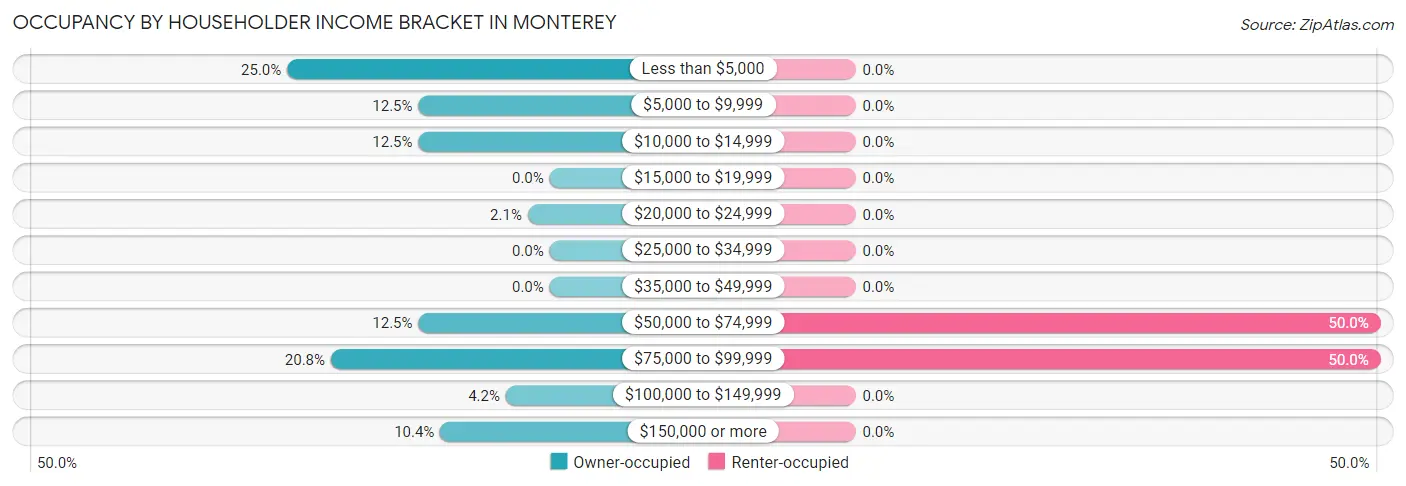
| Income Bracket | Owner-occupied | Renter-occupied |
| Less than $5,000 | 12 (25.0%) | 0 (0.0%) |
| $5,000 to $9,999 | 6 (12.5%) | 0 (0.0%) |
| $10,000 to $14,999 | 6 (12.5%) | 0 (0.0%) |
| $15,000 to $19,999 | 0 (0.0%) | 0 (0.0%) |
| $20,000 to $24,999 | 1 (2.1%) | 0 (0.0%) |
| $25,000 to $34,999 | 0 (0.0%) | 0 (0.0%) |
| $35,000 to $49,999 | 0 (0.0%) | 0 (0.0%) |
| $50,000 to $74,999 | 6 (12.5%) | 2 (50.0%) |
| $75,000 to $99,999 | 10 (20.8%) | 2 (50.0%) |
| $100,000 to $149,999 | 2 (4.2%) | 0 (0.0%) |
| $150,000 or more | 5 (10.4%) | 0 (0.0%) |
| Total | 48 (100.0%) | 4 (100.0%) |
Monthly Housing Cost Tiers in Monterey
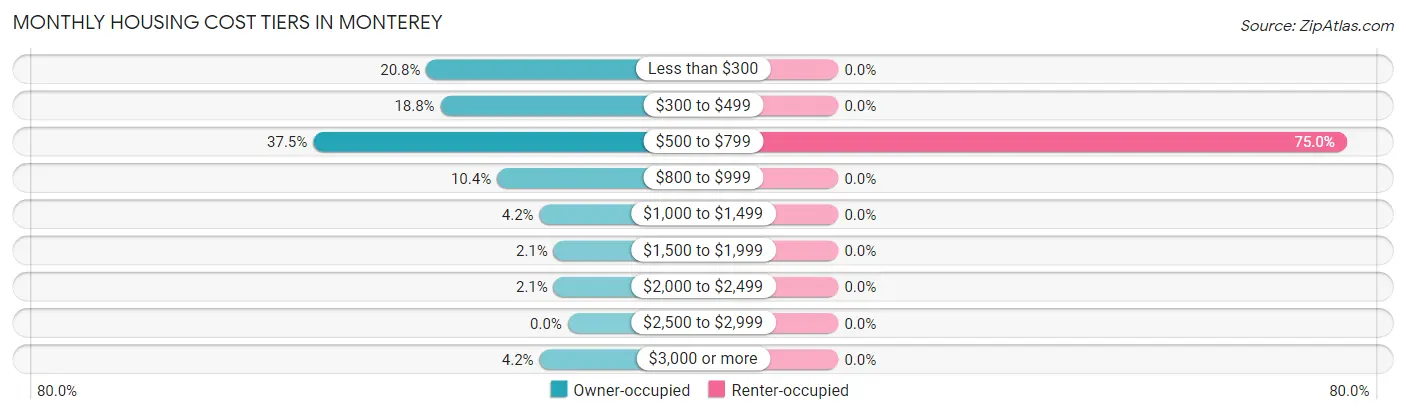
| Monthly Cost | Owner-occupied | Renter-occupied |
| Less than $300 | 10 (20.8%) | 0 (0.0%) |
| $300 to $499 | 9 (18.8%) | 0 (0.0%) |
| $500 to $799 | 18 (37.5%) | 3 (75.0%) |
| $800 to $999 | 5 (10.4%) | 0 (0.0%) |
| $1,000 to $1,499 | 2 (4.2%) | 0 (0.0%) |
| $1,500 to $1,999 | 1 (2.1%) | 0 (0.0%) |
| $2,000 to $2,499 | 1 (2.1%) | 0 (0.0%) |
| $2,500 to $2,999 | 0 (0.0%) | 0 (0.0%) |
| $3,000 or more | 2 (4.2%) | 0 (0.0%) |
| Total | 48 (100.0%) | 4 (100.0%) |
Physical Housing Characteristics in Monterey
Housing Structures in Monterey
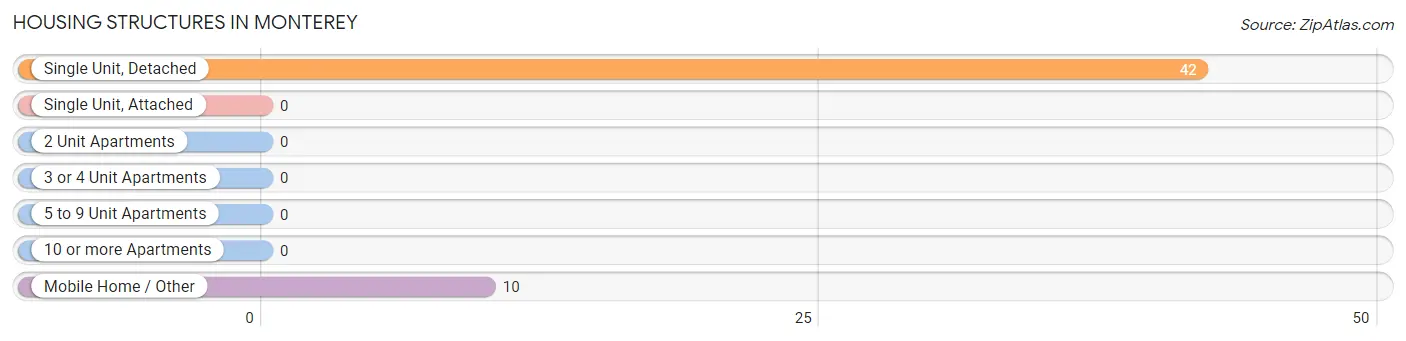
| Structure Type | # Housing Units | % Housing Units |
| Single Unit, Detached | 42 | 80.8% |
| Single Unit, Attached | 0 | 0.0% |
| 2 Unit Apartments | 0 | 0.0% |
| 3 or 4 Unit Apartments | 0 | 0.0% |
| 5 to 9 Unit Apartments | 0 | 0.0% |
| 10 or more Apartments | 0 | 0.0% |
| Mobile Home / Other | 10 | 19.2% |
| Total | 52 | 100.0% |
Housing Structures by Occupancy in Monterey
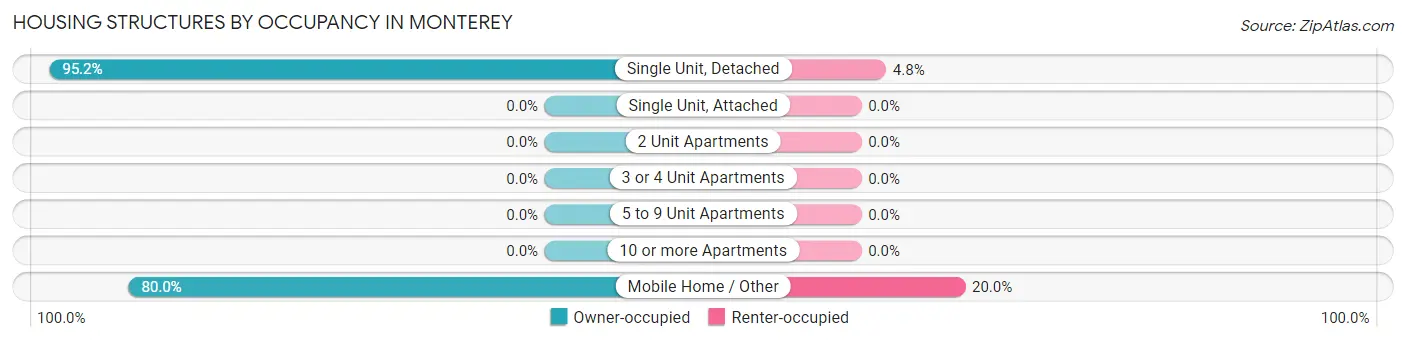
| Structure Type | Owner-occupied | Renter-occupied |
| Single Unit, Detached | 40 (95.2%) | 2 (4.8%) |
| Single Unit, Attached | 0 (0.0%) | 0 (0.0%) |
| 2 Unit Apartments | 0 (0.0%) | 0 (0.0%) |
| 3 or 4 Unit Apartments | 0 (0.0%) | 0 (0.0%) |
| 5 to 9 Unit Apartments | 0 (0.0%) | 0 (0.0%) |
| 10 or more Apartments | 0 (0.0%) | 0 (0.0%) |
| Mobile Home / Other | 8 (80.0%) | 2 (20.0%) |
| Total | 48 (92.3%) | 4 (7.7%) |
Housing Structures by Number of Rooms in Monterey
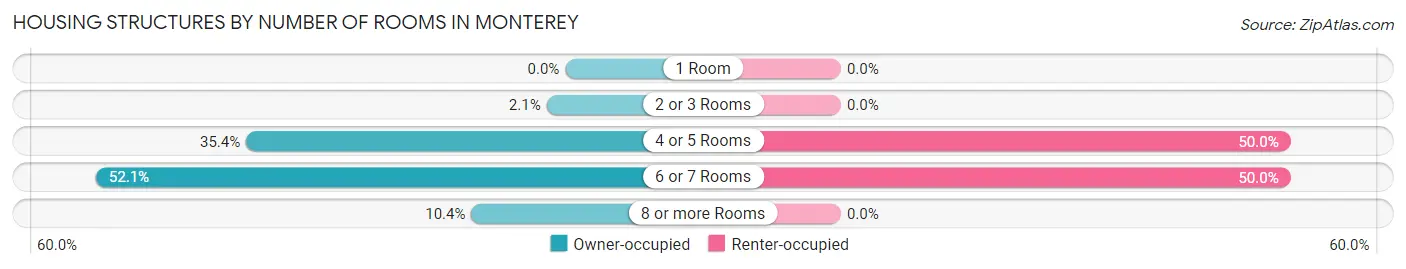
| Number of Rooms | Owner-occupied | Renter-occupied |
| 1 Room | 0 (0.0%) | 0 (0.0%) |
| 2 or 3 Rooms | 1 (2.1%) | 0 (0.0%) |
| 4 or 5 Rooms | 17 (35.4%) | 2 (50.0%) |
| 6 or 7 Rooms | 25 (52.1%) | 2 (50.0%) |
| 8 or more Rooms | 5 (10.4%) | 0 (0.0%) |
| Total | 48 (100.0%) | 4 (100.0%) |
Housing Structure by Heating Type in Monterey
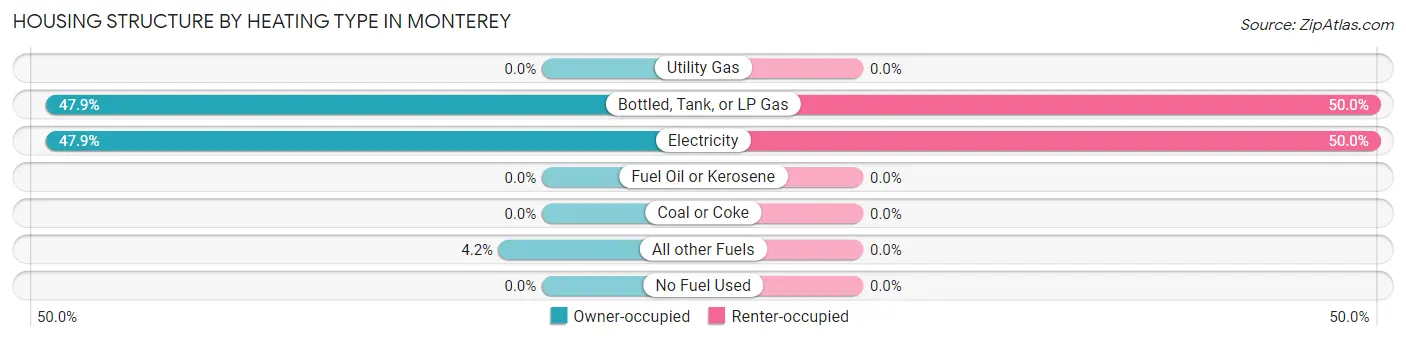
| Heating Type | Owner-occupied | Renter-occupied |
| Utility Gas | 0 (0.0%) | 0 (0.0%) |
| Bottled, Tank, or LP Gas | 23 (47.9%) | 2 (50.0%) |
| Electricity | 23 (47.9%) | 2 (50.0%) |
| Fuel Oil or Kerosene | 0 (0.0%) | 0 (0.0%) |
| Coal or Coke | 0 (0.0%) | 0 (0.0%) |
| All other Fuels | 2 (4.2%) | 0 (0.0%) |
| No Fuel Used | 0 (0.0%) | 0 (0.0%) |
| Total | 48 (100.0%) | 4 (100.0%) |
Household Vehicle Usage in Monterey
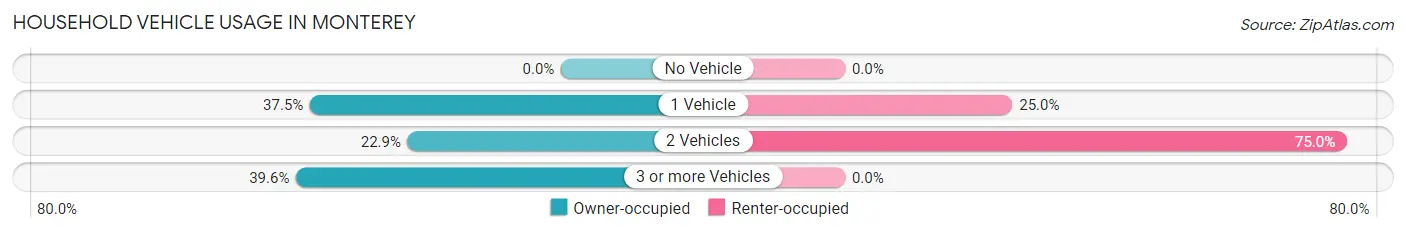
| Vehicles per Household | Owner-occupied | Renter-occupied |
| No Vehicle | 0 (0.0%) | 0 (0.0%) |
| 1 Vehicle | 18 (37.5%) | 1 (25.0%) |
| 2 Vehicles | 11 (22.9%) | 3 (75.0%) |
| 3 or more Vehicles | 19 (39.6%) | 0 (0.0%) |
| Total | 48 (100.0%) | 4 (100.0%) |
Real Estate & Mortgages in Monterey
Real Estate and Mortgage Overview in Monterey
| Characteristic | Without Mortgage | With Mortgage |
| Housing Units | 30 | 18 |
| Median Property Value | $107,100 | $0 |
| Median Household Income | - | - |
| Monthly Housing Costs | $467 | $2 |
| Real Estate Taxes | - | - |
Property Value by Mortgage Status in Monterey
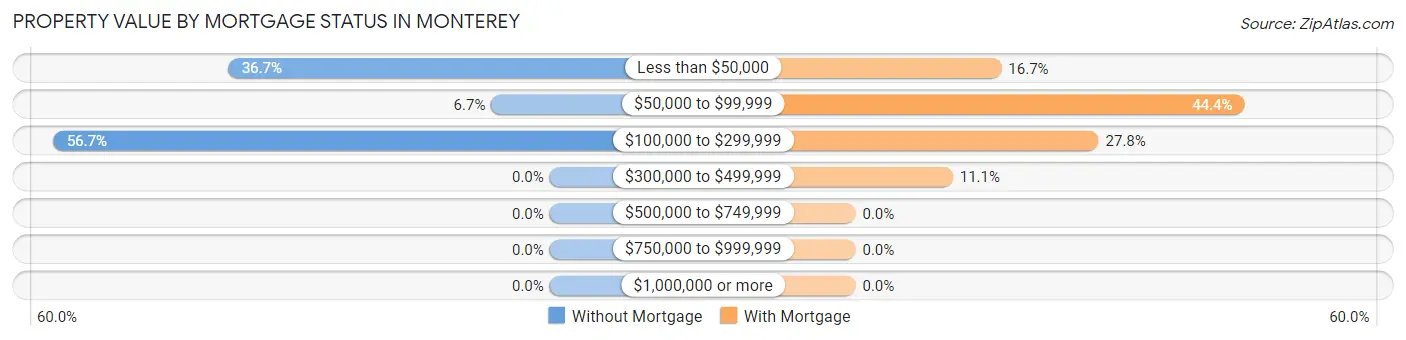
| Property Value | Without Mortgage | With Mortgage |
| Less than $50,000 | 11 (36.7%) | 3 (16.7%) |
| $50,000 to $99,999 | 2 (6.7%) | 8 (44.4%) |
| $100,000 to $299,999 | 17 (56.7%) | 5 (27.8%) |
| $300,000 to $499,999 | 0 (0.0%) | 2 (11.1%) |
| $500,000 to $749,999 | 0 (0.0%) | 0 (0.0%) |
| $750,000 to $999,999 | 0 (0.0%) | 0 (0.0%) |
| $1,000,000 or more | 0 (0.0%) | 0 (0.0%) |
| Total | 30 (100.0%) | 18 (100.0%) |
Household Income by Mortgage Status in Monterey
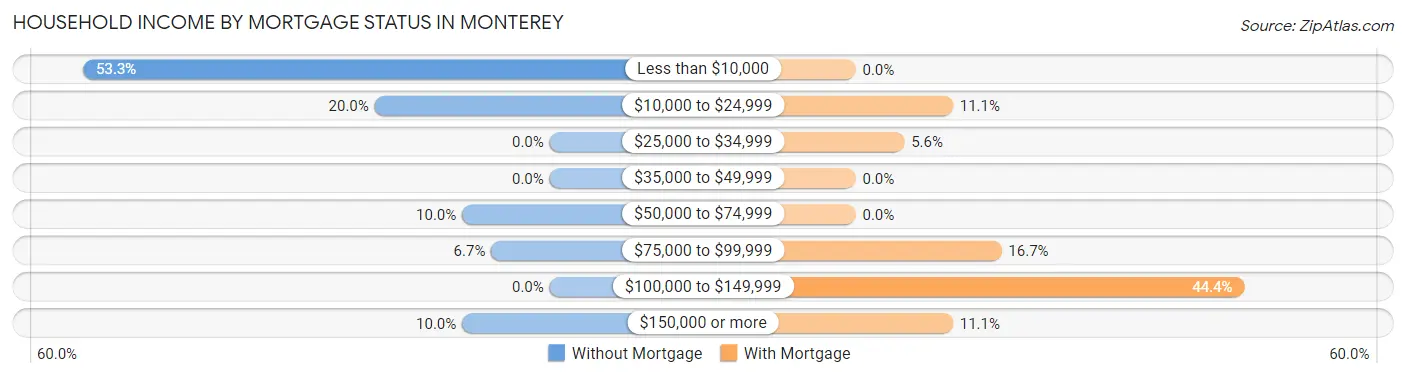
| Household Income | Without Mortgage | With Mortgage |
| Less than $10,000 | 16 (53.3%) | 0 (0.0%) |
| $10,000 to $24,999 | 6 (20.0%) | 2 (11.1%) |
| $25,000 to $34,999 | 0 (0.0%) | 1 (5.6%) |
| $35,000 to $49,999 | 0 (0.0%) | 0 (0.0%) |
| $50,000 to $74,999 | 3 (10.0%) | 0 (0.0%) |
| $75,000 to $99,999 | 2 (6.7%) | 3 (16.7%) |
| $100,000 to $149,999 | 0 (0.0%) | 8 (44.4%) |
| $150,000 or more | 3 (10.0%) | 2 (11.1%) |
| Total | 30 (100.0%) | 18 (100.0%) |
Property Value to Household Income Ratio in Monterey
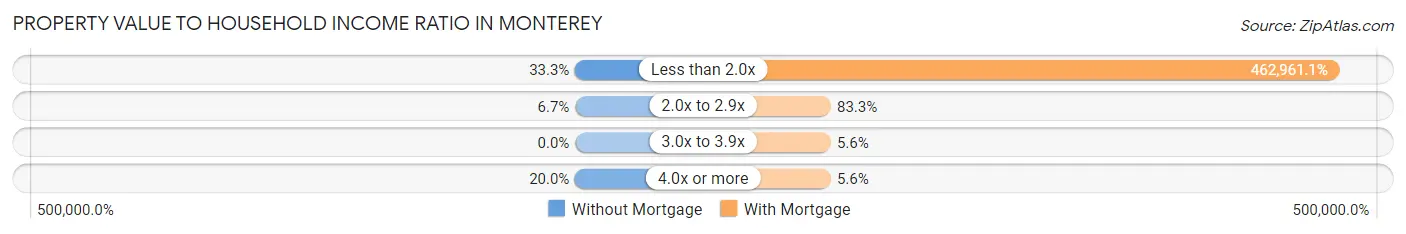
| Value-to-Income Ratio | Without Mortgage | With Mortgage |
| Less than 2.0x | 10 (33.3%) | 83,333 (462,961.1%) |
| 2.0x to 2.9x | 2 (6.7%) | 15 (83.3%) |
| 3.0x to 3.9x | 0 (0.0%) | 1 (5.6%) |
| 4.0x or more | 6 (20.0%) | 1 (5.6%) |
| Total | 30 (100.0%) | 18 (100.0%) |
Real Estate Taxes by Mortgage Status in Monterey
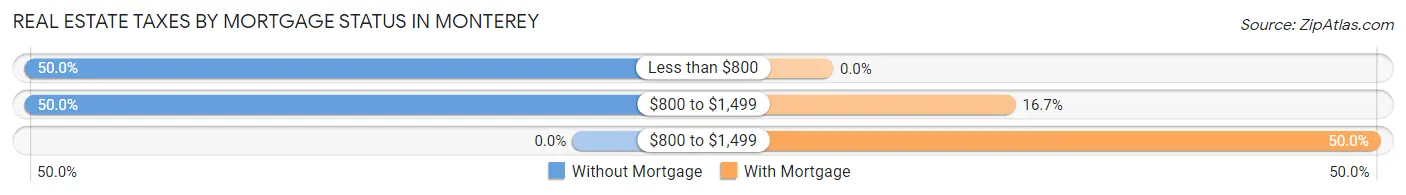
| Property Taxes | Without Mortgage | With Mortgage |
| Less than $800 | 15 (50.0%) | 0 (0.0%) |
| $800 to $1,499 | 15 (50.0%) | 3 (16.7%) |
| $800 to $1,499 | 0 (0.0%) | 9 (50.0%) |
| Total | 30 (100.0%) | 18 (100.0%) |
Health & Disability in Monterey
Health Insurance Coverage by Age in Monterey
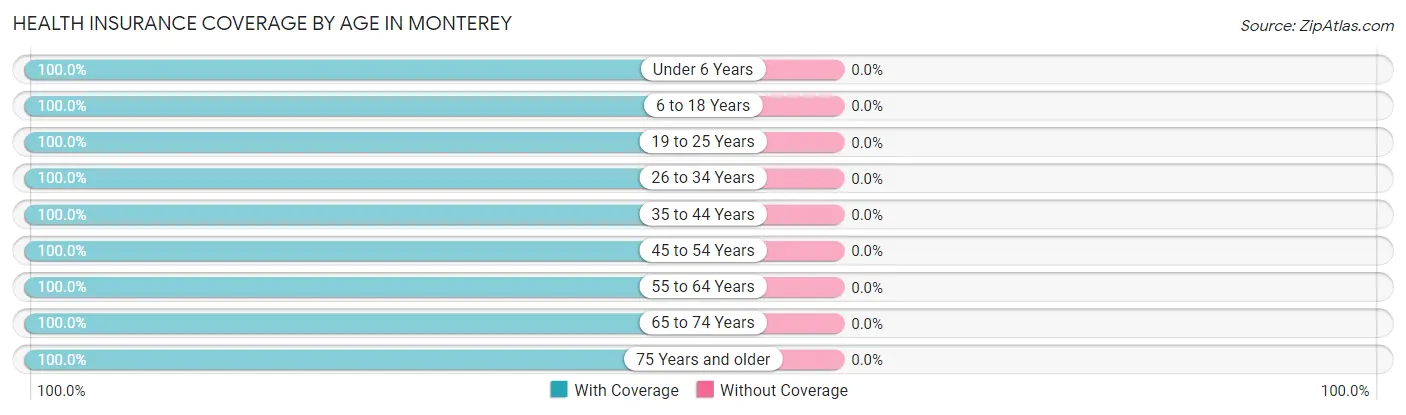
| Age Bracket | With Coverage | Without Coverage |
| Under 6 Years | 5 (100.0%) | 0 (0.0%) |
| 6 to 18 Years | 13 (100.0%) | 0 (0.0%) |
| 19 to 25 Years | 10 (100.0%) | 0 (0.0%) |
| 26 to 34 Years | 12 (100.0%) | 0 (0.0%) |
| 35 to 44 Years | 10 (100.0%) | 0 (0.0%) |
| 45 to 54 Years | 36 (100.0%) | 0 (0.0%) |
| 55 to 64 Years | 10 (100.0%) | 0 (0.0%) |
| 65 to 74 Years | 3 (100.0%) | 0 (0.0%) |
| 75 Years and older | 4 (100.0%) | 0 (0.0%) |
| Total | 103 (100.0%) | 0 (0.0%) |
Health Insurance Coverage by Citizenship Status in Monterey
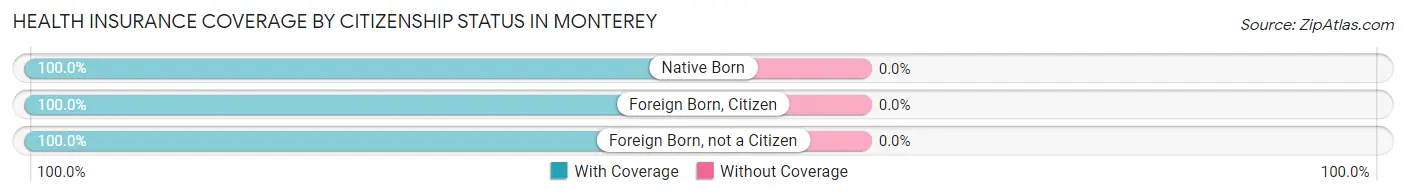
| Citizenship Status | With Coverage | Without Coverage |
| Native Born | 5 (100.0%) | 0 (0.0%) |
| Foreign Born, Citizen | 13 (100.0%) | 0 (0.0%) |
| Foreign Born, not a Citizen | 10 (100.0%) | 0 (0.0%) |
Health Insurance Coverage by Household Income in Monterey
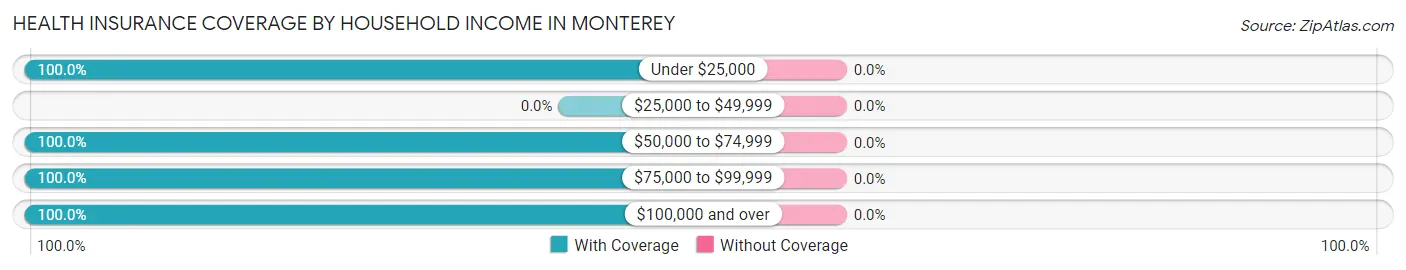
| Household Income | With Coverage | Without Coverage |
| Under $25,000 | 34 (100.0%) | 0 (0.0%) |
| $25,000 to $49,999 | 0 (0.0%) | 0 (0.0%) |
| $50,000 to $74,999 | 25 (100.0%) | 0 (0.0%) |
| $75,000 to $99,999 | 25 (100.0%) | 0 (0.0%) |
| $100,000 and over | 19 (100.0%) | 0 (0.0%) |
Public vs Private Health Insurance Coverage by Age in Monterey
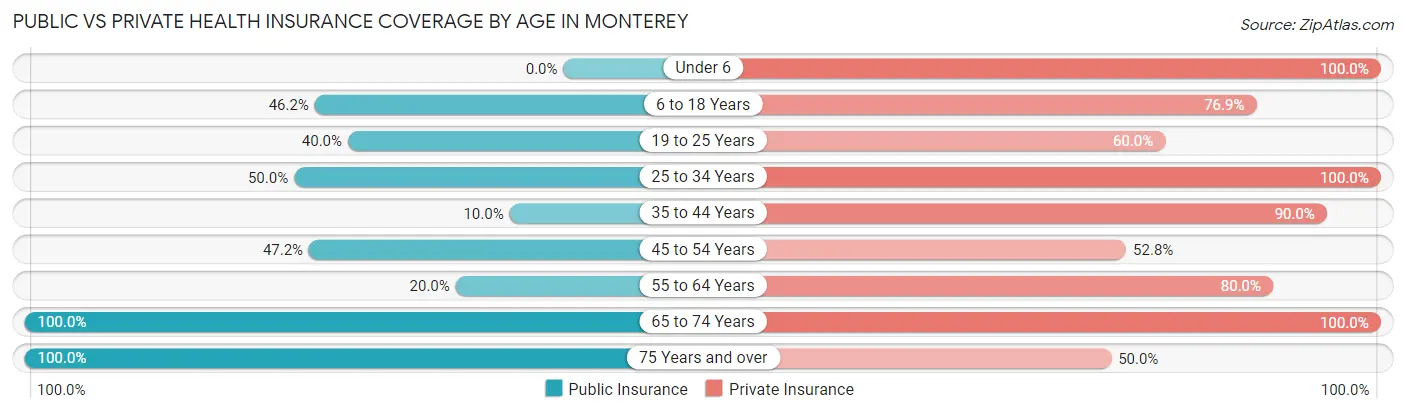
| Age Bracket | Public Insurance | Private Insurance |
| Under 6 | 0 (0.0%) | 5 (100.0%) |
| 6 to 18 Years | 6 (46.2%) | 10 (76.9%) |
| 19 to 25 Years | 4 (40.0%) | 6 (60.0%) |
| 25 to 34 Years | 6 (50.0%) | 12 (100.0%) |
| 35 to 44 Years | 1 (10.0%) | 9 (90.0%) |
| 45 to 54 Years | 17 (47.2%) | 19 (52.8%) |
| 55 to 64 Years | 2 (20.0%) | 8 (80.0%) |
| 65 to 74 Years | 3 (100.0%) | 3 (100.0%) |
| 75 Years and over | 4 (100.0%) | 2 (50.0%) |
| Total | 43 (41.7%) | 74 (71.8%) |
Disability Status by Sex by Age in Monterey
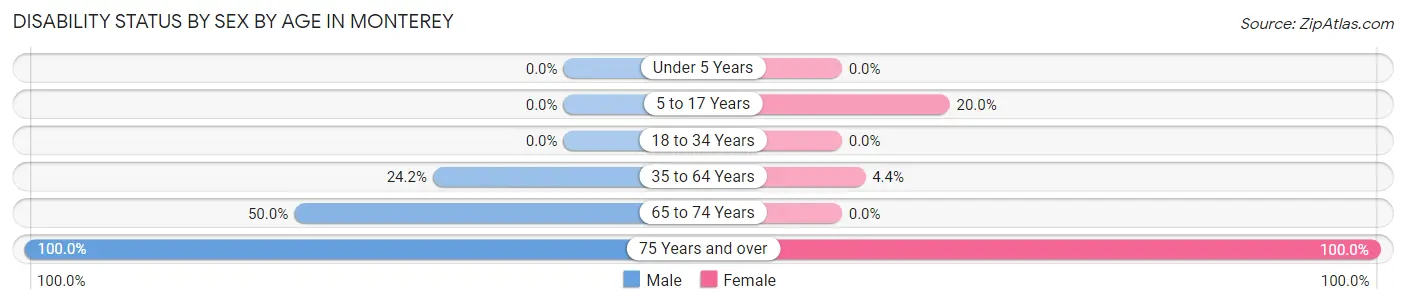
| Age Bracket | Male | Female |
| Under 5 Years | 0 (0.0%) | 0 (0.0%) |
| 5 to 17 Years | 0 (0.0%) | 1 (20.0%) |
| 18 to 34 Years | 0 (0.0%) | 0 (0.0%) |
| 35 to 64 Years | 8 (24.2%) | 1 (4.3%) |
| 65 to 74 Years | 1 (50.0%) | 0 (0.0%) |
| 75 Years and over | 2 (100.0%) | 2 (100.0%) |
Disability Class by Sex by Age in Monterey
Disability Class: Hearing Difficulty
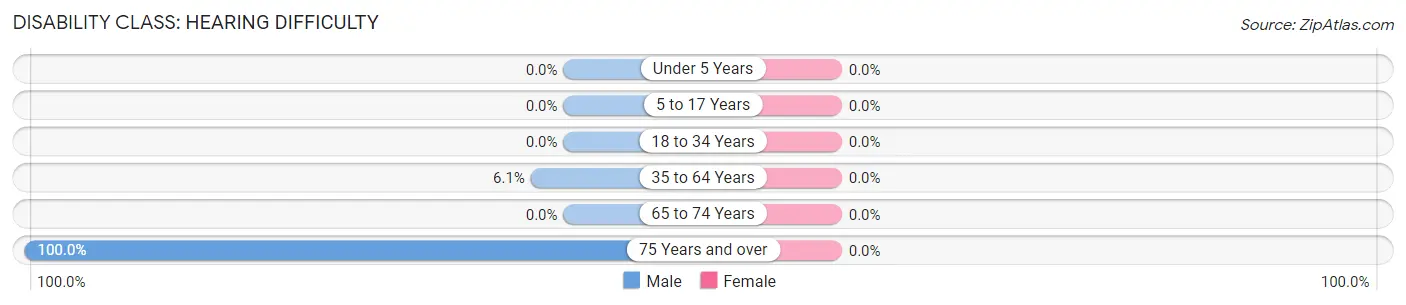
| Age Bracket | Male | Female |
| Under 5 Years | 0 (0.0%) | 0 (0.0%) |
| 5 to 17 Years | 0 (0.0%) | 0 (0.0%) |
| 18 to 34 Years | 0 (0.0%) | 0 (0.0%) |
| 35 to 64 Years | 2 (6.1%) | 0 (0.0%) |
| 65 to 74 Years | 0 (0.0%) | 0 (0.0%) |
| 75 Years and over | 2 (100.0%) | 0 (0.0%) |
Disability Class: Vision Difficulty
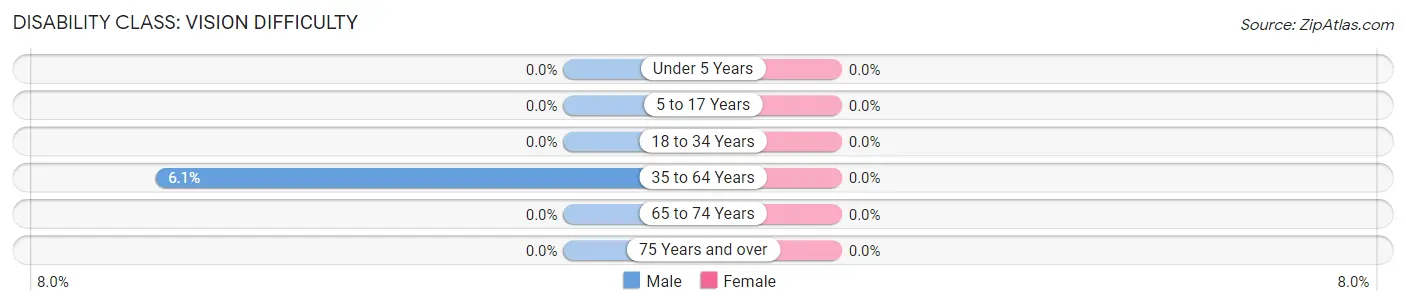
| Age Bracket | Male | Female |
| Under 5 Years | 0 (0.0%) | 0 (0.0%) |
| 5 to 17 Years | 0 (0.0%) | 0 (0.0%) |
| 18 to 34 Years | 0 (0.0%) | 0 (0.0%) |
| 35 to 64 Years | 2 (6.1%) | 0 (0.0%) |
| 65 to 74 Years | 0 (0.0%) | 0 (0.0%) |
| 75 Years and over | 0 (0.0%) | 0 (0.0%) |
Disability Class: Cognitive Difficulty
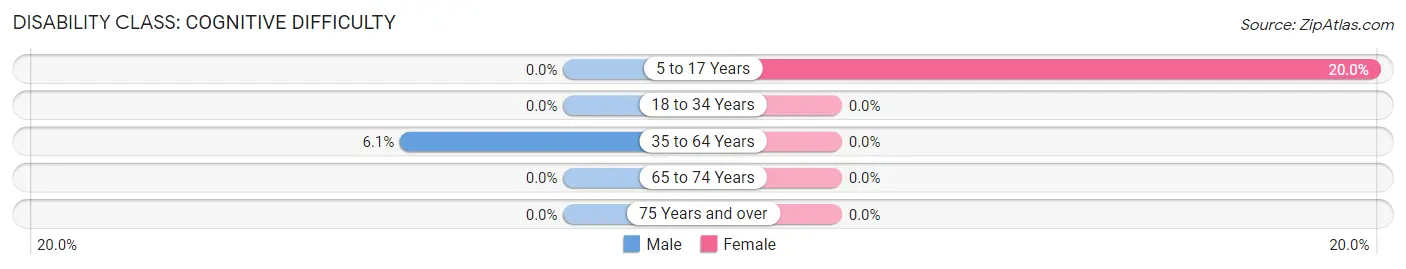
| Age Bracket | Male | Female |
| 5 to 17 Years | 0 (0.0%) | 1 (20.0%) |
| 18 to 34 Years | 0 (0.0%) | 0 (0.0%) |
| 35 to 64 Years | 2 (6.1%) | 0 (0.0%) |
| 65 to 74 Years | 0 (0.0%) | 0 (0.0%) |
| 75 Years and over | 0 (0.0%) | 0 (0.0%) |
Disability Class: Ambulatory Difficulty
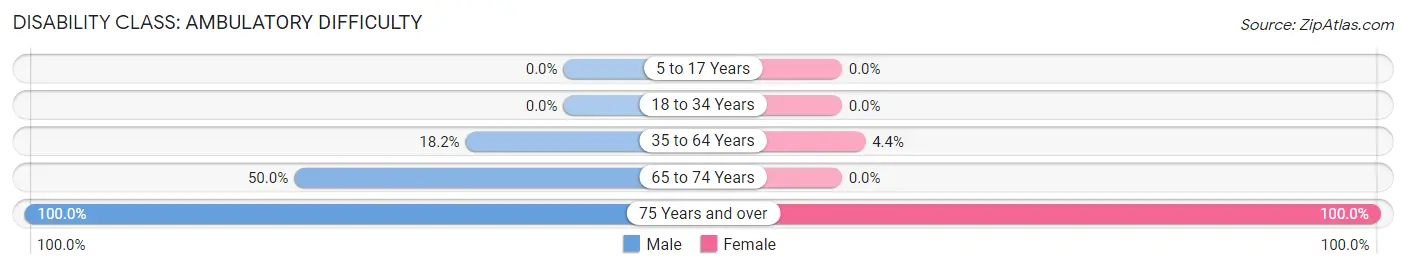
| Age Bracket | Male | Female |
| 5 to 17 Years | 0 (0.0%) | 0 (0.0%) |
| 18 to 34 Years | 0 (0.0%) | 0 (0.0%) |
| 35 to 64 Years | 6 (18.2%) | 1 (4.3%) |
| 65 to 74 Years | 1 (50.0%) | 0 (0.0%) |
| 75 Years and over | 2 (100.0%) | 2 (100.0%) |
Disability Class: Self-Care Difficulty
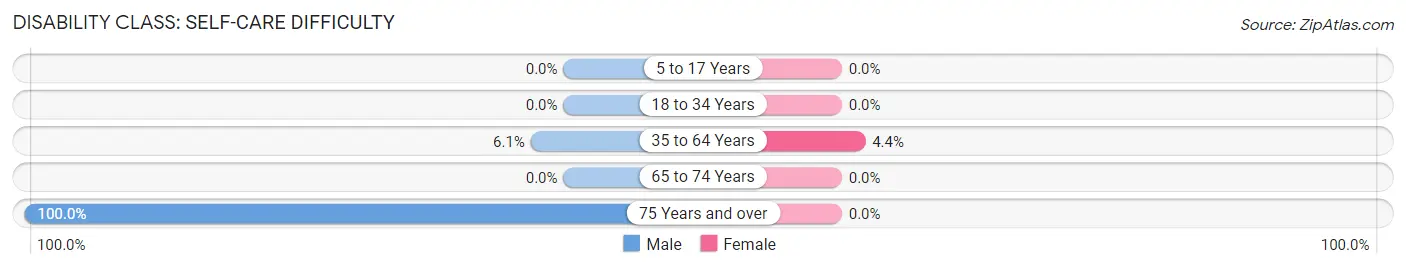
| Age Bracket | Male | Female |
| 5 to 17 Years | 0 (0.0%) | 0 (0.0%) |
| 18 to 34 Years | 0 (0.0%) | 0 (0.0%) |
| 35 to 64 Years | 2 (6.1%) | 1 (4.3%) |
| 65 to 74 Years | 0 (0.0%) | 0 (0.0%) |
| 75 Years and over | 2 (100.0%) | 0 (0.0%) |
Technology Access in Monterey
Computing Device Access in Monterey
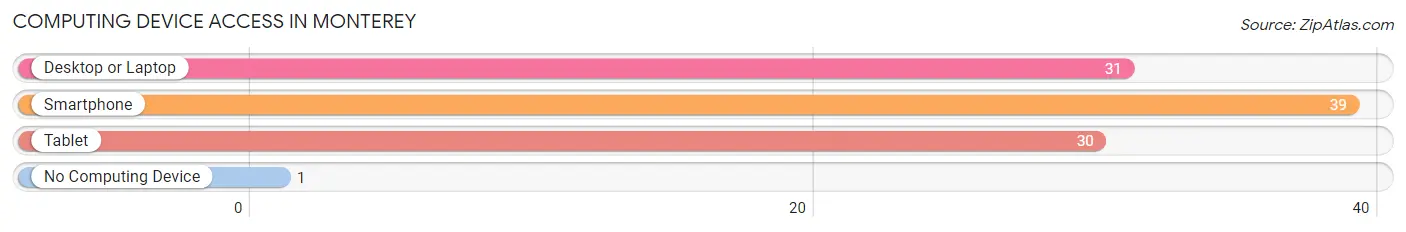
| Device Type | # Households | % Households |
| Desktop or Laptop | 31 | 59.6% |
| Smartphone | 39 | 75.0% |
| Tablet | 30 | 57.7% |
| No Computing Device | 1 | 1.9% |
| Total | 52 | 100.0% |
Internet Access in Monterey
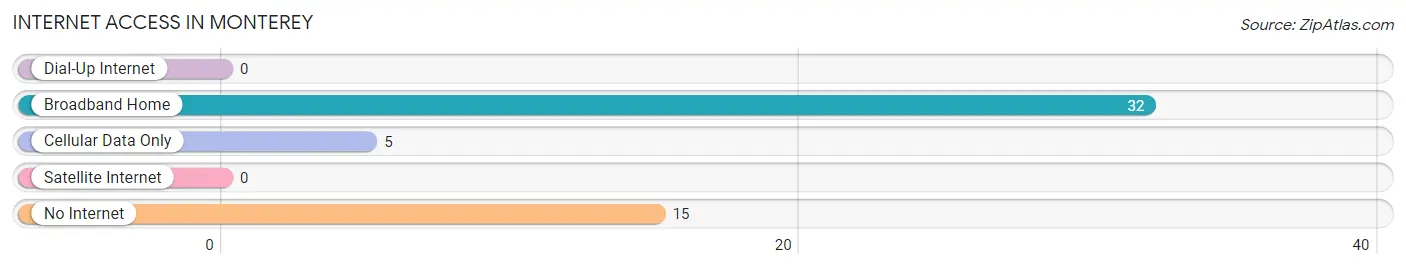
| Internet Type | # Households | % Households |
| Dial-Up Internet | 0 | 0.0% |
| Broadband Home | 32 | 61.5% |
| Cellular Data Only | 5 | 9.6% |
| Satellite Internet | 0 | 0.0% |
| No Internet | 15 | 28.8% |
| Total | 52 | 100.0% |
Monterey Summary
Monterey, Kentucky is a small town located in the southeastern part of the state, in the foothills of the Appalachian Mountains. It is situated in the heart of the Daniel Boone National Forest, and is surrounded by the beautiful rolling hills of the Cumberland Plateau. The town is home to a population of just over 500 people, and is the county seat of Clay County.
History
Monterey was first settled in the early 1800s by a group of settlers from Virginia. The town was originally known as “Mountain View”, and was later renamed “Monterey” in honor of the Battle of Monterey during the Mexican-American War. The town was officially incorporated in 1845, and has remained a small, rural community ever since.
The town was an important stop on the Louisville and Nashville Railroad, and was a major hub for the timber industry in the late 19th and early 20th centuries. The town was also home to a large coal mining operation, which provided employment for many of the town’s residents.
Geography
Monterey is located in the southeastern part of the state, in the foothills of the Appalachian Mountains. The town is situated in the heart of the Daniel Boone National Forest, and is surrounded by the beautiful rolling hills of the Cumberland Plateau. The town is located at the intersection of US Highway 421 and Kentucky Route 80.
The town is located at an elevation of 890 feet above sea level, and has a total area of 1.2 square miles. The town is located within the Eastern Time Zone, and is approximately 60 miles from Lexington, Kentucky.
Economy
The economy of Monterey is largely based on agriculture and tourism. The town is home to several small farms, which produce a variety of crops, including corn, soybeans, and hay. The town is also home to several small businesses, including a grocery store, a hardware store, and a few restaurants.
The town is also a popular tourist destination, due to its proximity to the Daniel Boone National Forest. The town is home to several campgrounds, and is a popular destination for hikers, campers, and other outdoor enthusiasts.
Demographics
As of the 2010 census, the population of Monterey was 514. The town has a population density of 431 people per square mile. The median age of the town’s residents is 44.7 years, and the median household income is $30,938. The town is predominantly white, with 92.3% of the population identifying as such. The town also has a small Hispanic population, with 4.3% of the population identifying as Hispanic or Latino.
Monterey is a small, rural town with a rich history and a strong sense of community. The town is home to a diverse population, and is a popular destination for outdoor enthusiasts. The town’s economy is largely based on agriculture and tourism, and the town is home to several small businesses. Monterey is a great place to live, work, and play.
Common Questions
What is Per Capita Income in Monterey?
Per Capita income in Monterey is $31,435.
What is the Median Family Income in Monterey?
Median Family Income in Monterey is $64,375.
What is Inequality or Gini Index in Monterey?
Inequality or Gini Index in Monterey is 0.58.
What is the Total Population of Monterey?
Total Population of Monterey is 103.
What is the Total Male Population of Monterey?
Total Male Population of Monterey is 62.
What is the Total Female Population of Monterey?
Total Female Population of Monterey is 41.
What is the Ratio of Males per 100 Females in Monterey?
There are 151.22 Males per 100 Females in Monterey.
What is the Ratio of Females per 100 Males in Monterey?
There are 66.13 Females per 100 Males in Monterey.
What is the Median Population Age in Monterey?
Median Population Age in Monterey is 45.8 Years.
What is the Average Family Size in Monterey
Average Family Size in Monterey is 3.3 People.
What is the Average Household Size in Monterey
Average Household Size in Monterey is 2.0 People.
How Large is the Labor Force in Monterey?
There are 52 People in the Labor Forcein in Monterey.
What is the Percentage of People in the Labor Force in Monterey?
58.4% of People are in the Labor Force in Monterey.
What is the Unemployment Rate in Monterey?
Unemployment Rate in Monterey is 17.3%.