Masonville, KY Map & Demographics
Masonville Map
Masonville Overview
$33,531
PER CAPITA INCOME
$86,552
AVG FAMILY INCOME
$85,194
AVG HOUSEHOLD INCOME
24.6%
WAGE / INCOME GAP [ % ]
75.4¢/ $1
WAGE / INCOME GAP [ $ ]
0.39
INEQUALITY / GINI INDEX
2,175
TOTAL POPULATION
1,047
MALE POPULATION
1,128
FEMALE POPULATION
92.82
MALES / 100 FEMALES
107.74
FEMALES / 100 MALES
32.4
MEDIAN AGE
3.2
AVG FAMILY SIZE
2.9
AVG HOUSEHOLD SIZE
1,106
LABOR FORCE [ PEOPLE ]
76.9%
PERCENT IN LABOR FORCE
3.6%
UNEMPLOYMENT RATE
Income in Masonville
Income Overview in Masonville
Per Capita Income in Masonville is $33,531, while median incomes of families and households are $86,552 and $85,194 respectively.
| Characteristic | Number | Measure |
| Per Capita Income | 2,175 | $33,531 |
| Median Family Income | 610 | $86,552 |
| Mean Family Income | 610 | $104,535 |
| Median Household Income | 747 | $85,194 |
| Mean Household Income | 747 | $95,109 |
| Income Deficit | 610 | $0 |
| Wage / Income Gap (%) | 2,175 | 24.58% |
| Wage / Income Gap ($) | 2,175 | 75.42¢ per $1 |
| Gini / Inequality Index | 2,175 | 0.39 |
Earnings by Sex in Masonville
Average Earnings in Masonville are $47,487, $54,091 for men and $40,795 for women, a difference of 24.6%.
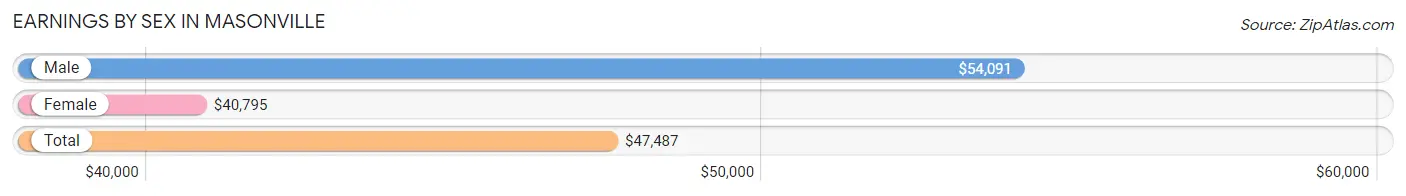
| Sex | Number | Average Earnings |
| Male | 564 (50.4%) | $54,091 |
| Female | 555 (49.6%) | $40,795 |
| Total | 1,119 (100.0%) | $47,487 |
Earnings by Sex by Income Bracket in Masonville
The most common earnings brackets in Masonville are $55,000 to $64,999 for men (106 | 18.8%) and $12,500 to $14,999 for women (88 | 15.9%).
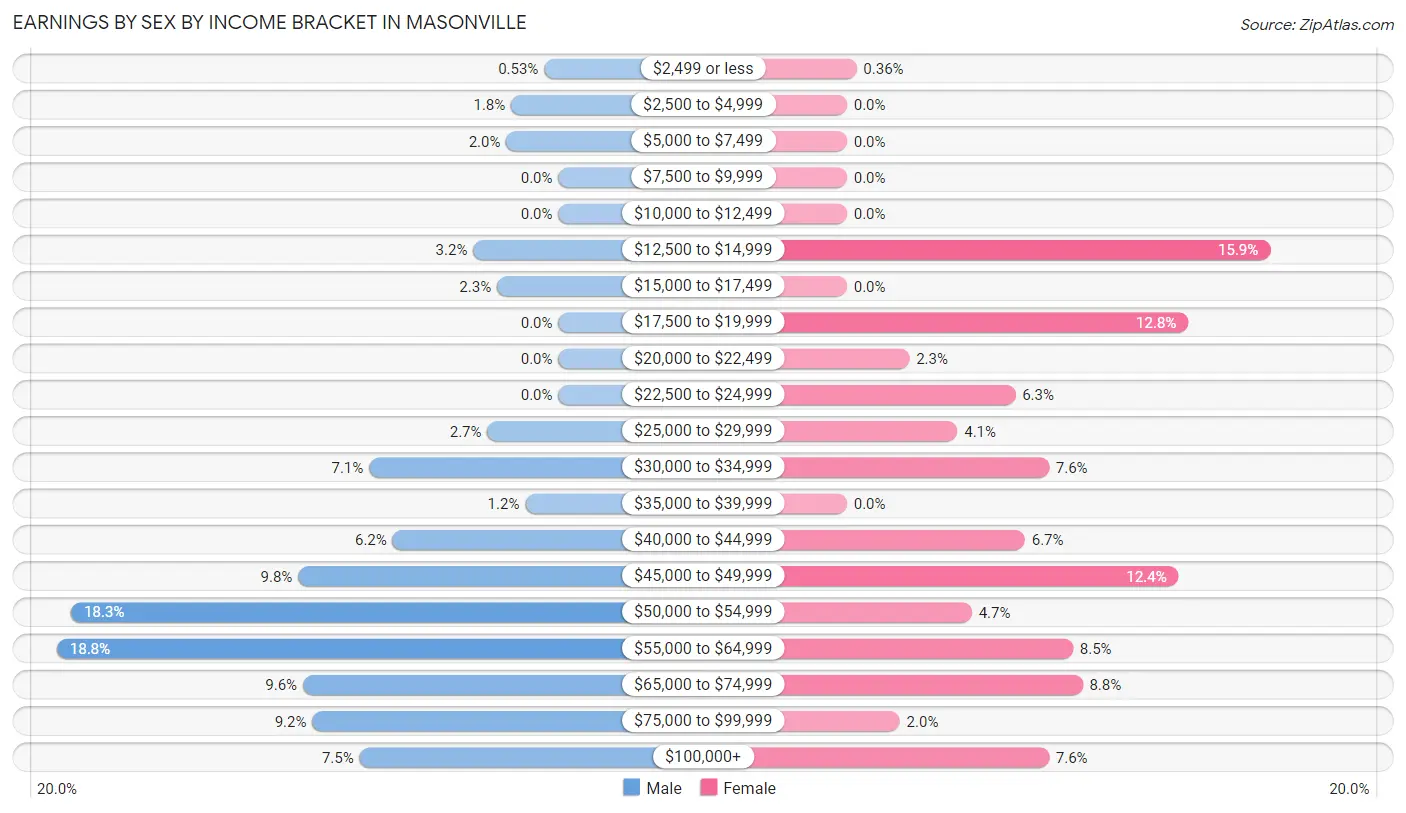
| Income | Male | Female |
| $2,499 or less | 3 (0.5%) | 2 (0.4%) |
| $2,500 to $4,999 | 10 (1.8%) | 0 (0.0%) |
| $5,000 to $7,499 | 11 (1.9%) | 0 (0.0%) |
| $7,500 to $9,999 | 0 (0.0%) | 0 (0.0%) |
| $10,000 to $12,499 | 0 (0.0%) | 0 (0.0%) |
| $12,500 to $14,999 | 18 (3.2%) | 88 (15.9%) |
| $15,000 to $17,499 | 13 (2.3%) | 0 (0.0%) |
| $17,500 to $19,999 | 0 (0.0%) | 71 (12.8%) |
| $20,000 to $22,499 | 0 (0.0%) | 13 (2.3%) |
| $22,500 to $24,999 | 0 (0.0%) | 35 (6.3%) |
| $25,000 to $29,999 | 15 (2.7%) | 23 (4.1%) |
| $30,000 to $34,999 | 40 (7.1%) | 42 (7.6%) |
| $35,000 to $39,999 | 7 (1.2%) | 0 (0.0%) |
| $40,000 to $44,999 | 35 (6.2%) | 37 (6.7%) |
| $45,000 to $49,999 | 55 (9.8%) | 69 (12.4%) |
| $50,000 to $54,999 | 103 (18.3%) | 26 (4.7%) |
| $55,000 to $64,999 | 106 (18.8%) | 47 (8.5%) |
| $65,000 to $74,999 | 54 (9.6%) | 49 (8.8%) |
| $75,000 to $99,999 | 52 (9.2%) | 11 (2.0%) |
| $100,000+ | 42 (7.4%) | 42 (7.6%) |
| Total | 564 (100.0%) | 555 (100.0%) |
Earnings by Sex by Educational Attainment in Masonville
Average earnings in Masonville are $54,594 for men and $44,135 for women, a difference of 19.2%. Men with an educational attainment of bachelor's degree enjoy the highest average annual earnings of $56,875, while those with high school diploma education earn the least with $46,705. Women with an educational attainment of graduate degree earn the most with the average annual earnings of $54,141, while those with high school diploma education have the smallest earnings of $24,954.
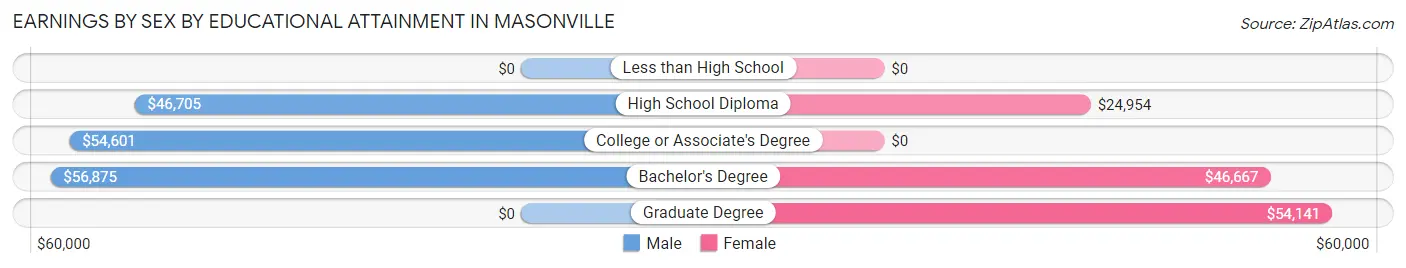
| Educational Attainment | Male Income | Female Income |
| Less than High School | - | - |
| High School Diploma | $46,705 | $24,954 |
| College or Associate's Degree | $54,601 | $0 |
| Bachelor's Degree | $56,875 | $46,667 |
| Graduate Degree | - | - |
| Total | $54,594 | $44,135 |
Family Income in Masonville
Family Income Brackets in Masonville
According to the Masonville family income data, there are 131 families falling into the $50,000 to $74,999 income range, which is the most common income bracket and makes up 21.5% of all families.
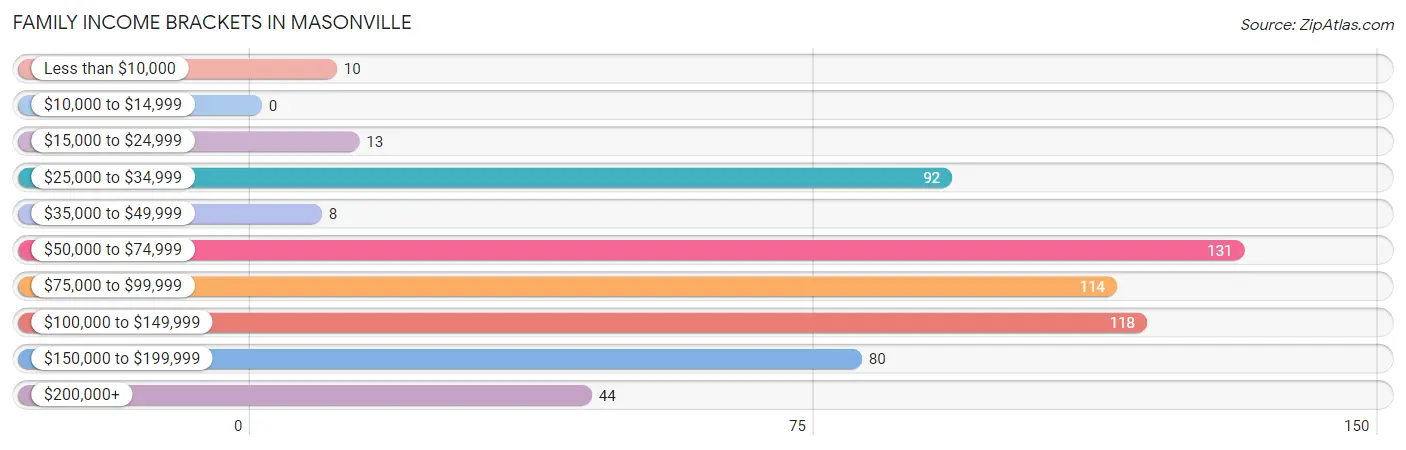
| Income Bracket | # Families | % Families |
| Less than $10,000 | 10 | 1.6% |
| $10,000 to $14,999 | 0 | 0.0% |
| $15,000 to $24,999 | 13 | 2.1% |
| $25,000 to $34,999 | 92 | 15.1% |
| $35,000 to $49,999 | 8 | 1.3% |
| $50,000 to $74,999 | 131 | 21.5% |
| $75,000 to $99,999 | 114 | 18.7% |
| $100,000 to $149,999 | 118 | 19.3% |
| $150,000 to $199,999 | 80 | 13.1% |
| $200,000+ | 44 | 7.2% |
Family Income by Famaliy Size in Masonville
3-person families (157 | 25.7%) account for the highest median family income in Masonville with $107,656 per family, while 2-person families (202 | 33.1%) have the highest median income of $39,250 per family member.
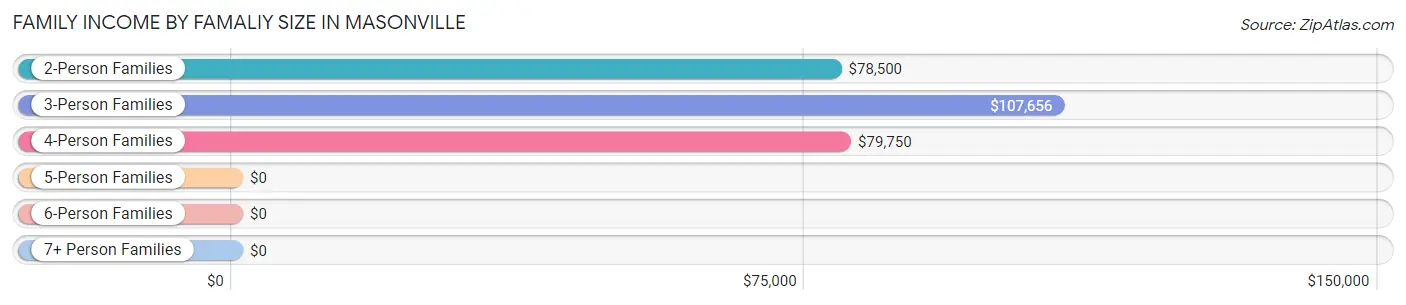
| Income Bracket | # Families | Median Income |
| 2-Person Families | 202 (33.1%) | $78,500 |
| 3-Person Families | 157 (25.7%) | $107,656 |
| 4-Person Families | 137 (22.5%) | $79,750 |
| 5-Person Families | 72 (11.8%) | $0 |
| 6-Person Families | 31 (5.1%) | $0 |
| 7+ Person Families | 11 (1.8%) | $0 |
| Total | 610 (100.0%) | $86,552 |
Family Income by Number of Earners in Masonville
The median family income in Masonville is $86,552, with families comprising 3+ earners (44) having the highest median family income of $193,846, while families with 1 earner (177) have the lowest median family income of $53,750, accounting for 7.2% and 29.0% of families, respectively.
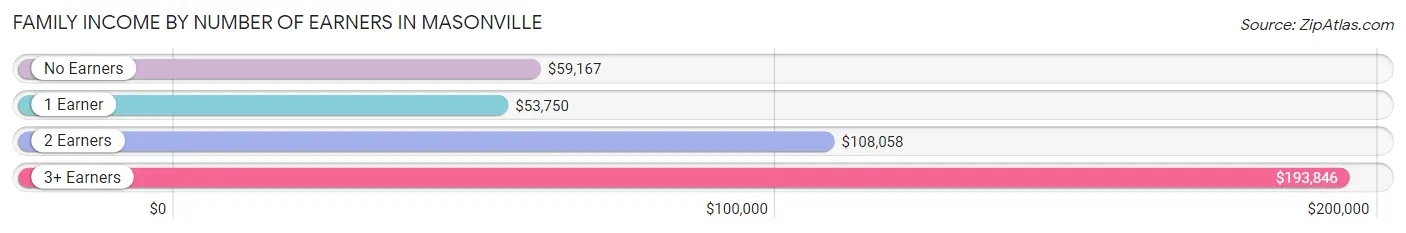
| Number of Earners | # Families | Median Income |
| No Earners | 60 (9.8%) | $59,167 |
| 1 Earner | 177 (29.0%) | $53,750 |
| 2 Earners | 329 (53.9%) | $108,058 |
| 3+ Earners | 44 (7.2%) | $193,846 |
| Total | 610 (100.0%) | $86,552 |
Household Income in Masonville
Household Income Brackets in Masonville
With 149 households falling in the category, the $50,000 to $74,999 income range is the most frequent in Masonville, accounting for 20.0% of all households. In contrast, only 13 households (1.7%) fall into the $15,000 to $24,999 income bracket, making it the least populous group.
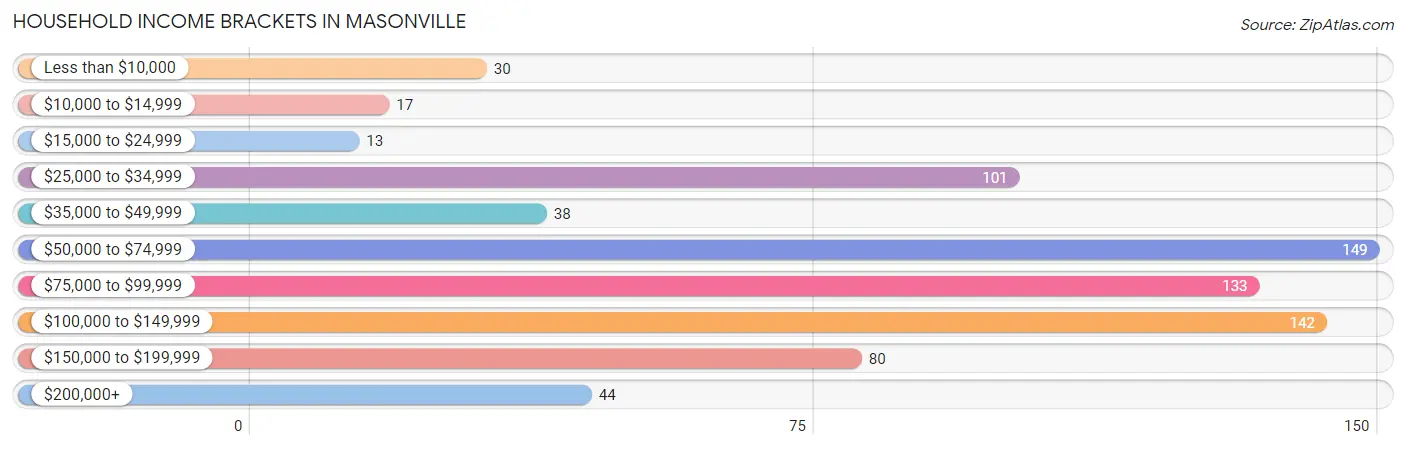
| Income Bracket | # Households | % Households |
| Less than $10,000 | 30 | 4.0% |
| $10,000 to $14,999 | 17 | 2.3% |
| $15,000 to $24,999 | 13 | 1.7% |
| $25,000 to $34,999 | 101 | 13.5% |
| $35,000 to $49,999 | 38 | 5.1% |
| $50,000 to $74,999 | 149 | 19.9% |
| $75,000 to $99,999 | 133 | 17.8% |
| $100,000 to $149,999 | 142 | 19.0% |
| $150,000 to $199,999 | 80 | 10.7% |
| $200,000+ | 44 | 5.9% |
Household Income by Householder Age in Masonville
The median household income in Masonville is $85,194, with the highest median household income of $107,527 found in the 45 to 64 years age bracket for the primary householder. A total of 239 households (32.0%) fall into this category.
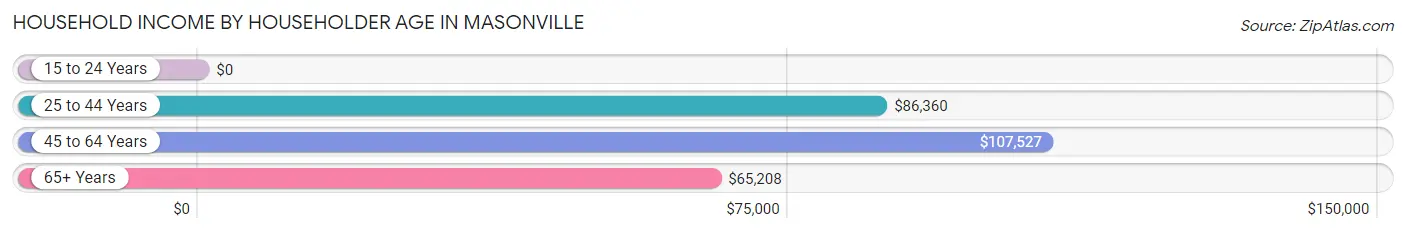
| Income Bracket | # Households | Median Income |
| 15 to 24 Years | 0 (0.0%) | $0 |
| 25 to 44 Years | 383 (51.3%) | $86,360 |
| 45 to 64 Years | 239 (32.0%) | $107,527 |
| 65+ Years | 125 (16.7%) | $65,208 |
| Total | 747 (100.0%) | $85,194 |
Poverty in Masonville
Income Below Poverty by Sex and Age in Masonville
With 11.3% poverty level for males and 9.7% for females among the residents of Masonville, 18 to 24 year old males and 55 to 64 year old females are the most vulnerable to poverty, with 20 males (48.8%) and 37 females (38.1%) in their respective age groups living below the poverty level.
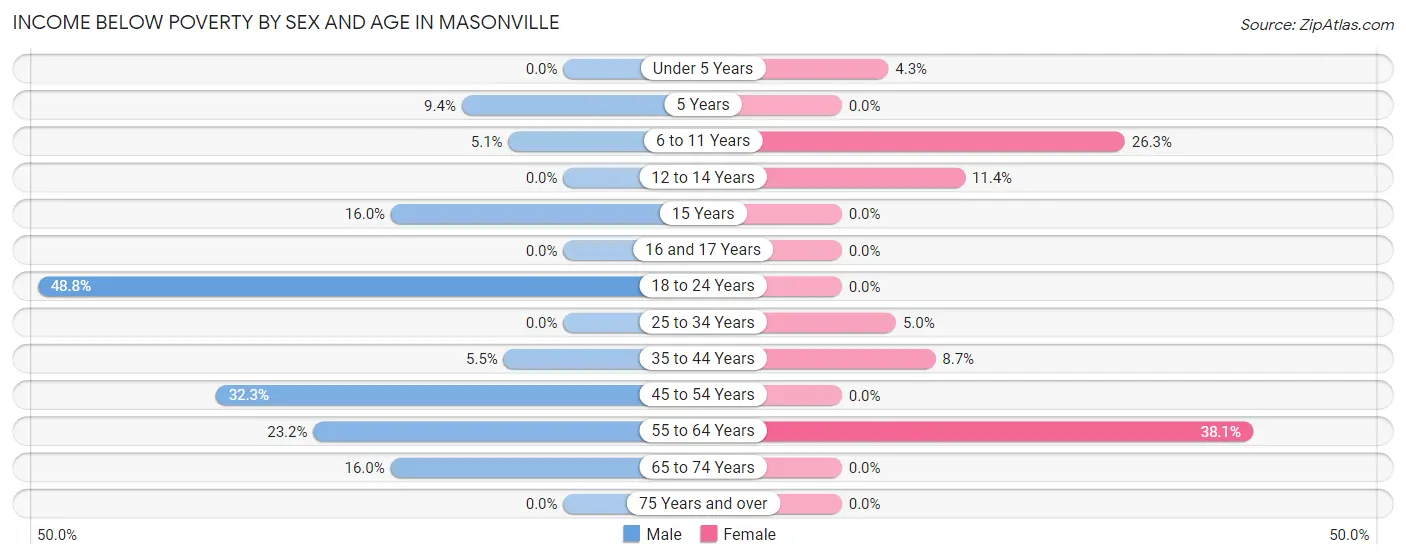
| Age Bracket | Male | Female |
| Under 5 Years | 0 (0.0%) | 8 (4.3%) |
| 5 Years | 10 (9.4%) | 0 (0.0%) |
| 6 to 11 Years | 5 (5.1%) | 31 (26.3%) |
| 12 to 14 Years | 0 (0.0%) | 4 (11.4%) |
| 15 Years | 8 (16.0%) | 0 (0.0%) |
| 16 and 17 Years | 0 (0.0%) | 0 (0.0%) |
| 18 to 24 Years | 20 (48.8%) | 0 (0.0%) |
| 25 to 34 Years | 0 (0.0%) | 10 (5.0%) |
| 35 to 44 Years | 15 (5.5%) | 19 (8.7%) |
| 45 to 54 Years | 30 (32.3%) | 0 (0.0%) |
| 55 to 64 Years | 13 (23.2%) | 37 (38.1%) |
| 65 to 74 Years | 17 (16.0%) | 0 (0.0%) |
| 75 Years and over | 0 (0.0%) | 0 (0.0%) |
| Total | 118 (11.3%) | 109 (9.7%) |
Income Above Poverty by Sex and Age in Masonville
According to the poverty statistics in Masonville, males aged under 5 years and females aged 15 years are the age groups that are most secure financially, with 100.0% of males and 100.0% of females in these age groups living above the poverty line.
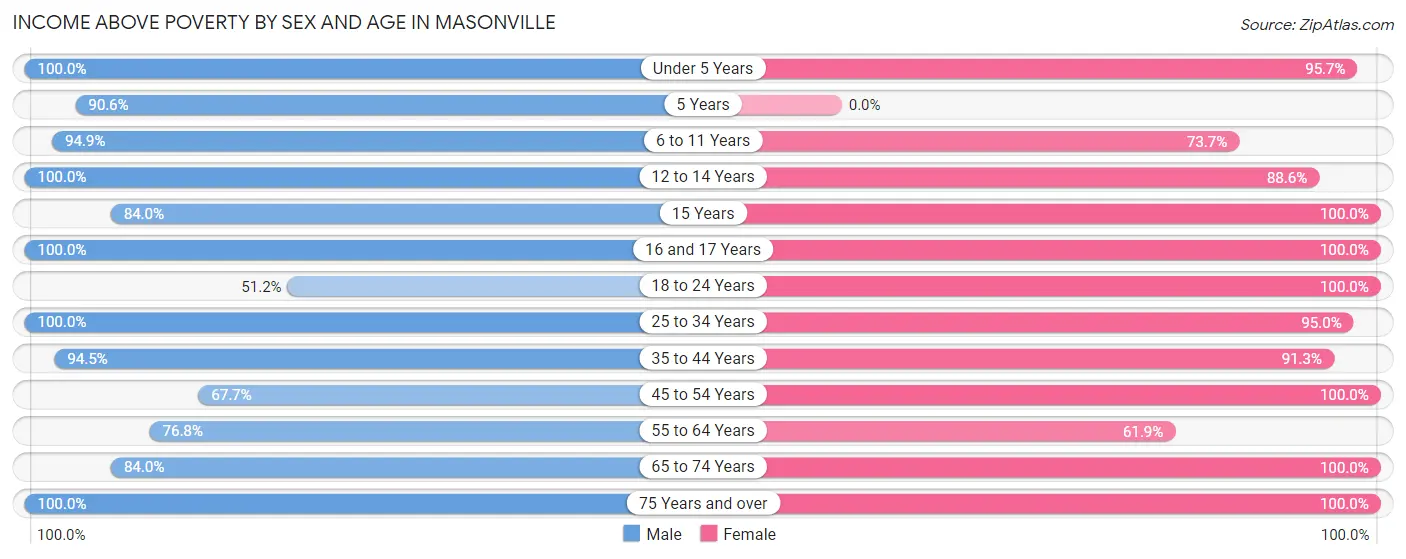
| Age Bracket | Male | Female |
| Under 5 Years | 43 (100.0%) | 177 (95.7%) |
| 5 Years | 96 (90.6%) | 0 (0.0%) |
| 6 to 11 Years | 93 (94.9%) | 87 (73.7%) |
| 12 to 14 Years | 35 (100.0%) | 31 (88.6%) |
| 15 Years | 42 (84.0%) | 67 (100.0%) |
| 16 and 17 Years | 9 (100.0%) | 2 (100.0%) |
| 18 to 24 Years | 21 (51.2%) | 60 (100.0%) |
| 25 to 34 Years | 120 (100.0%) | 189 (95.0%) |
| 35 to 44 Years | 256 (94.5%) | 200 (91.3%) |
| 45 to 54 Years | 63 (67.7%) | 72 (100.0%) |
| 55 to 64 Years | 43 (76.8%) | 60 (61.9%) |
| 65 to 74 Years | 89 (84.0%) | 55 (100.0%) |
| 75 Years and over | 19 (100.0%) | 19 (100.0%) |
| Total | 929 (88.7%) | 1,019 (90.3%) |
Income Below Poverty Among Married-Couple Families in Masonville
The poverty statistics for married-couple families in Masonville show that 1.5% or 7 of the total 459 families live below the poverty line. Families with 3 or 4 children have the highest poverty rate of 31.8%, comprising of 7 families. On the other hand, families with no children have the lowest poverty rate of 0.0%, which includes 0 families.
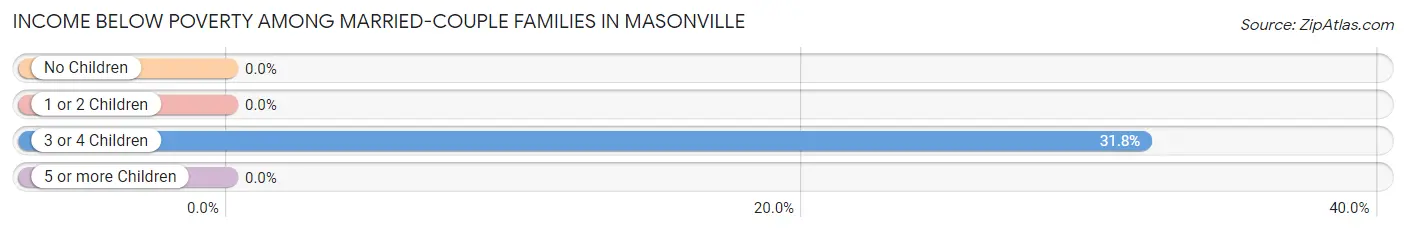
| Children | Above Poverty | Below Poverty |
| No Children | 173 (100.0%) | 0 (0.0%) |
| 1 or 2 Children | 264 (100.0%) | 0 (0.0%) |
| 3 or 4 Children | 15 (68.2%) | 7 (31.8%) |
| 5 or more Children | 0 (0.0%) | 0 (0.0%) |
| Total | 452 (98.5%) | 7 (1.5%) |
Income Below Poverty Among Single-Parent Households in Masonville
According to the poverty data in Masonville, 54.2% or 13 single-father households and 18.1% or 23 single-mother households are living below the poverty line. Among single-father households, those with 1 or 2 children have the highest poverty rate, with 13 households (100.0%) experiencing poverty. Likewise, among single-mother households, those with 1 or 2 children have the highest poverty rate, with 13 households (21.0%) falling below the poverty line.
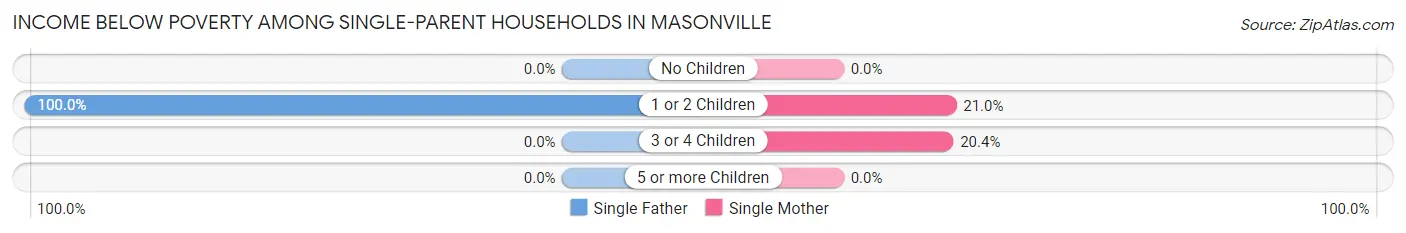
| Children | Single Father | Single Mother |
| No Children | 0 (0.0%) | 0 (0.0%) |
| 1 or 2 Children | 13 (100.0%) | 13 (21.0%) |
| 3 or 4 Children | 0 (0.0%) | 10 (20.4%) |
| 5 or more Children | 0 (0.0%) | 0 (0.0%) |
| Total | 13 (54.2%) | 23 (18.1%) |
Income Below Poverty Among Married-Couple vs Single-Parent Households in Masonville
The poverty data for Masonville shows that 7 of the married-couple family households (1.5%) and 36 of the single-parent households (23.8%) are living below the poverty level. Within the married-couple family households, those with 3 or 4 children have the highest poverty rate, with 7 households (31.8%) falling below the poverty line. Among the single-parent households, those with 1 or 2 children have the highest poverty rate, with 26 household (34.7%) living below poverty.
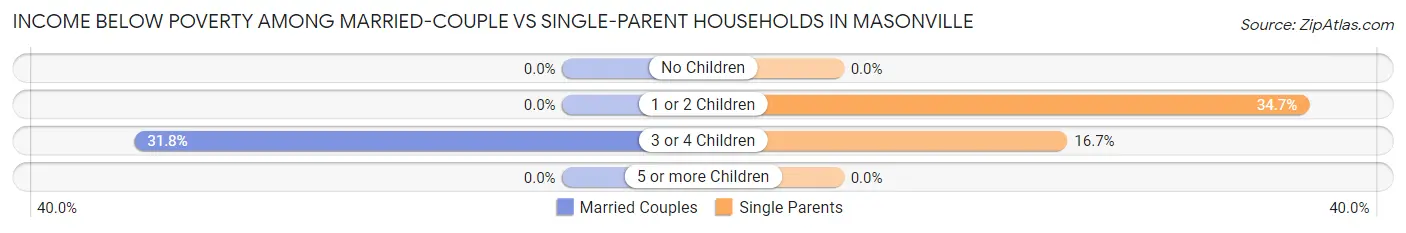
| Children | Married-Couple Families | Single-Parent Households |
| No Children | 0 (0.0%) | 0 (0.0%) |
| 1 or 2 Children | 0 (0.0%) | 26 (34.7%) |
| 3 or 4 Children | 7 (31.8%) | 10 (16.7%) |
| 5 or more Children | 0 (0.0%) | 0 (0.0%) |
| Total | 7 (1.5%) | 36 (23.8%) |
Race in Masonville
The most populous races in Masonville are White / Caucasian (2,064 | 94.9%), Two or more Races (108 | 5.0%), and Hispanic or Latino (15 | 0.7%).
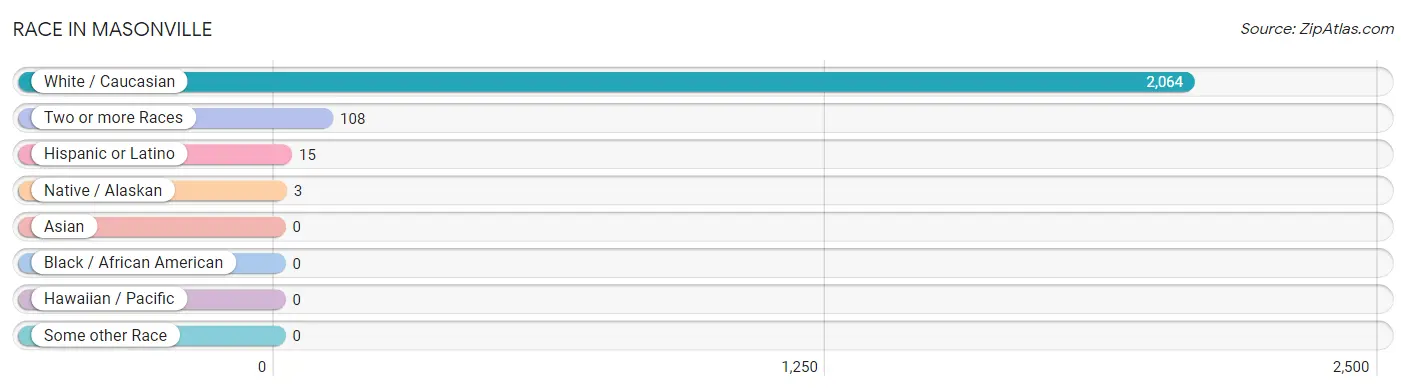
| Race | # Population | % Population |
| Asian | 0 | 0.0% |
| Black / African American | 0 | 0.0% |
| Hawaiian / Pacific | 0 | 0.0% |
| Hispanic or Latino | 15 | 0.7% |
| Native / Alaskan | 3 | 0.1% |
| White / Caucasian | 2,064 | 94.9% |
| Two or more Races | 108 | 5.0% |
| Some other Race | 0 | 0.0% |
| Total | 2,175 | 100.0% |
Ancestry in Masonville
The most populous ancestries reported in Masonville are American (380 | 17.5%), English (359 | 16.5%), Irish (197 | 9.1%), German (190 | 8.7%), and Scottish (66 | 3.0%), together accounting for 54.8% of all Masonville residents.
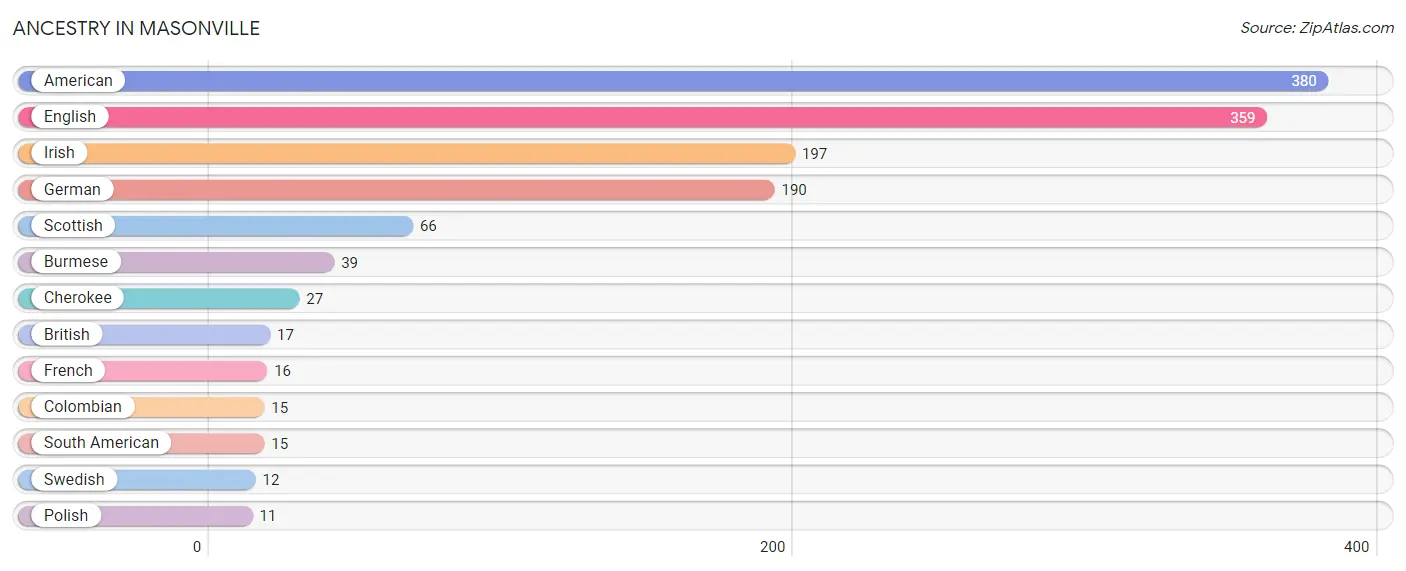
| Ancestry | # Population | % Population |
| American | 380 | 17.5% |
| British | 17 | 0.8% |
| Burmese | 39 | 1.8% |
| Cherokee | 27 | 1.2% |
| Colombian | 15 | 0.7% |
| English | 359 | 16.5% |
| French | 16 | 0.7% |
| German | 190 | 8.7% |
| Irish | 197 | 9.1% |
| Polish | 11 | 0.5% |
| Scottish | 66 | 3.0% |
| South American | 15 | 0.7% |
| Swedish | 12 | 0.5% | View All 13 Rows |
Immigrants in Masonville

| Immigration Origin | # Population | % Population | View All 0 Rows |
Sex and Age in Masonville
Sex and Age in Masonville
The most populous age groups in Masonville are 5 to 9 Years (189 | 18.0%) for men and Under 5 Years (185 | 16.4%) for women.
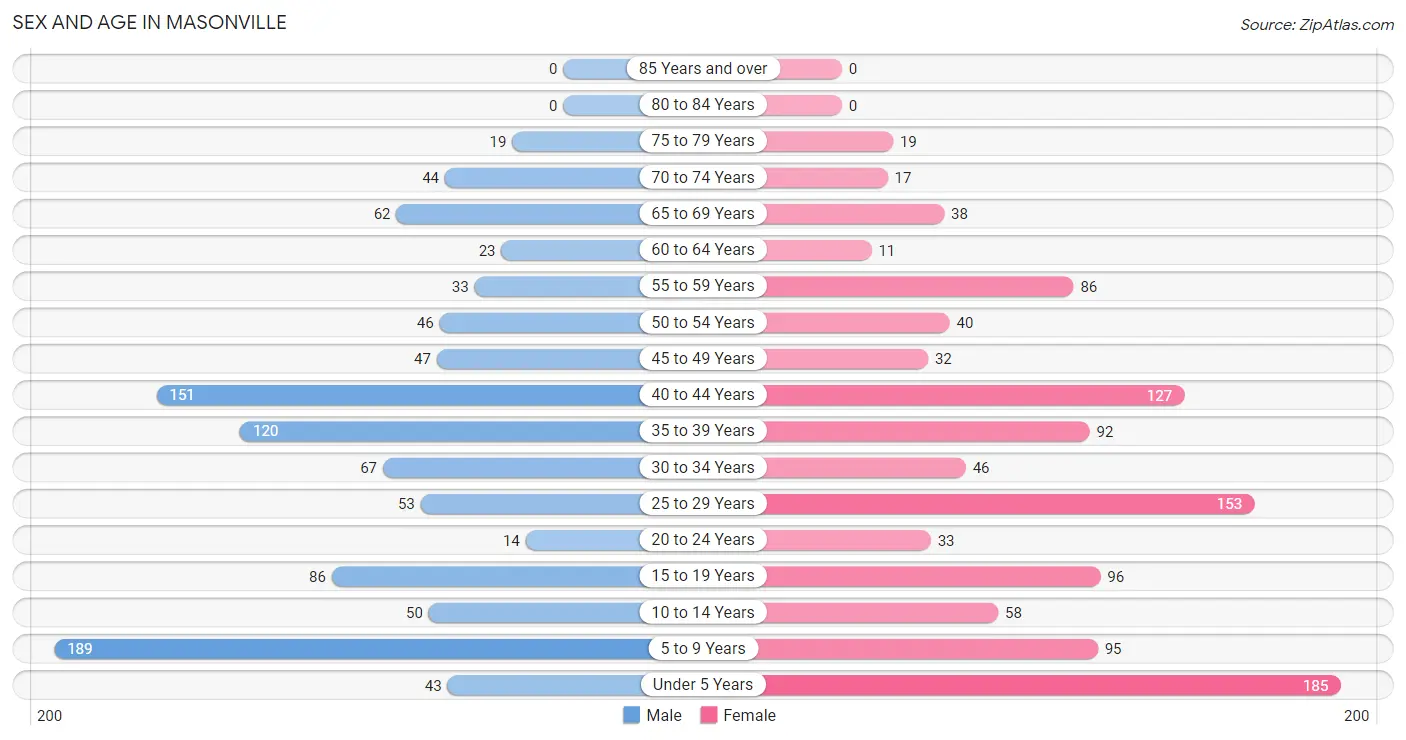
| Age Bracket | Male | Female |
| Under 5 Years | 43 (4.1%) | 185 (16.4%) |
| 5 to 9 Years | 189 (18.0%) | 95 (8.4%) |
| 10 to 14 Years | 50 (4.8%) | 58 (5.1%) |
| 15 to 19 Years | 86 (8.2%) | 96 (8.5%) |
| 20 to 24 Years | 14 (1.3%) | 33 (2.9%) |
| 25 to 29 Years | 53 (5.1%) | 153 (13.6%) |
| 30 to 34 Years | 67 (6.4%) | 46 (4.1%) |
| 35 to 39 Years | 120 (11.5%) | 92 (8.2%) |
| 40 to 44 Years | 151 (14.4%) | 127 (11.3%) |
| 45 to 49 Years | 47 (4.5%) | 32 (2.8%) |
| 50 to 54 Years | 46 (4.4%) | 40 (3.5%) |
| 55 to 59 Years | 33 (3.2%) | 86 (7.6%) |
| 60 to 64 Years | 23 (2.2%) | 11 (1.0%) |
| 65 to 69 Years | 62 (5.9%) | 38 (3.4%) |
| 70 to 74 Years | 44 (4.2%) | 17 (1.5%) |
| 75 to 79 Years | 19 (1.8%) | 19 (1.7%) |
| 80 to 84 Years | 0 (0.0%) | 0 (0.0%) |
| 85 Years and over | 0 (0.0%) | 0 (0.0%) |
| Total | 1,047 (100.0%) | 1,128 (100.0%) |
Families and Households in Masonville
Median Family Size in Masonville
The median family size in Masonville is 3.23 persons per family, with single male/father families (24 | 3.9%) accounting for the largest median family size of 4.17 persons per family. On the other hand, single female/mother families (127 | 20.8%) represent the smallest median family size with 3.01 persons per family.
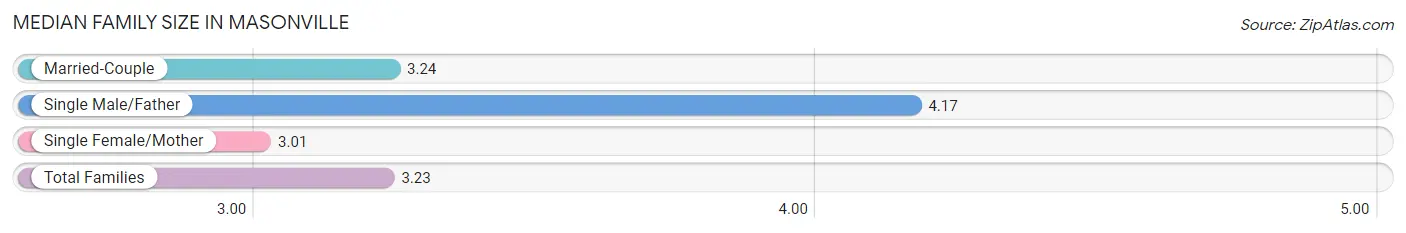
| Family Type | # Families | Family Size |
| Married-Couple | 459 (75.2%) | 3.24 |
| Single Male/Father | 24 (3.9%) | 4.17 |
| Single Female/Mother | 127 (20.8%) | 3.01 |
| Total Families | 610 (100.0%) | 3.23 |
Median Household Size in Masonville
The median household size in Masonville is 2.91 persons per household, with single male/father households (24 | 3.2%) accounting for the largest median household size of 4.17 persons per household. non-family households (137 | 18.3%) represent the smallest median household size with 1.39 persons per household.
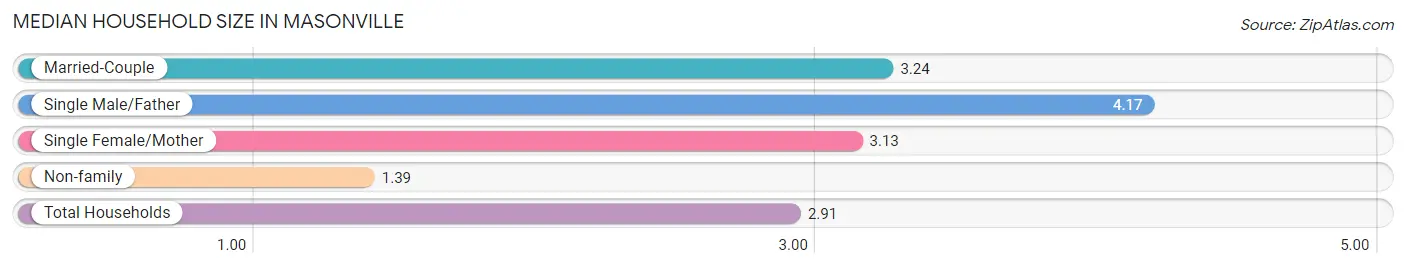
| Household Type | # Households | Household Size |
| Married-Couple | 459 (61.5%) | 3.24 |
| Single Male/Father | 24 (3.2%) | 4.17 |
| Single Female/Mother | 127 (17.0%) | 3.13 |
| Non-family | 137 (18.3%) | 1.39 |
| Total Households | 747 (100.0%) | 2.91 |
Household Size by Marriage Status in Masonville
Out of a total of 747 households in Masonville, 610 (81.7%) are family households, while 137 (18.3%) are nonfamily households. The most numerous type of family households are 2-person households, comprising 202, and the most common type of nonfamily households are 1-person households, comprising 107.
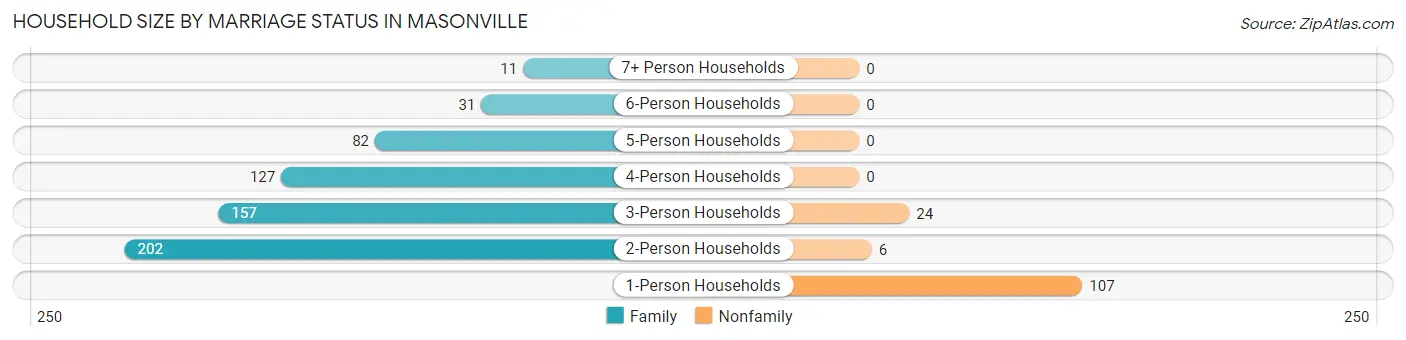
| Household Size | Family Households | Nonfamily Households |
| 1-Person Households | - | 107 (14.3%) |
| 2-Person Households | 202 (27.0%) | 6 (0.8%) |
| 3-Person Households | 157 (21.0%) | 24 (3.2%) |
| 4-Person Households | 127 (17.0%) | 0 (0.0%) |
| 5-Person Households | 82 (11.0%) | 0 (0.0%) |
| 6-Person Households | 31 (4.2%) | 0 (0.0%) |
| 7+ Person Households | 11 (1.5%) | 0 (0.0%) |
| Total | 610 (81.7%) | 137 (18.3%) |
Female Fertility in Masonville
Fertility by Age in Masonville
Average fertility rate in Masonville is 41.0 births per 1,000 women. Women in the age bracket of 20 to 34 years have the highest fertility rate with 103.0 births per 1,000 women. Women in the age bracket of 20 to 34 years acount for 100.0% of all women with births.
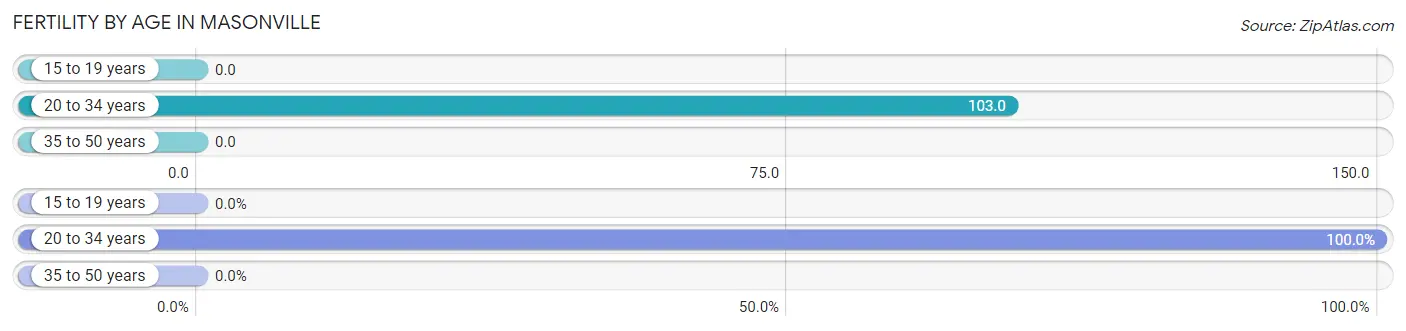
| Age Bracket | Women with Births | Births / 1,000 Women |
| 15 to 19 years | 0 (0.0%) | 0.0 |
| 20 to 34 years | 24 (100.0%) | 103.0 |
| 35 to 50 years | 0 (0.0%) | 0.0 |
| Total | 24 (100.0%) | 41.0 |
Fertility by Age by Marriage Status in Masonville
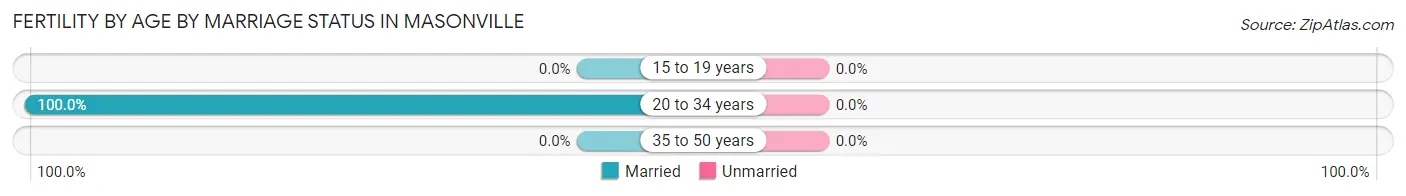
| Age Bracket | Married | Unmarried |
| 15 to 19 years | 0 (0.0%) | 0 (0.0%) |
| 20 to 34 years | 24 (100.0%) | 0 (0.0%) |
| 35 to 50 years | 0 (0.0%) | 0 (0.0%) |
| Total | 24 (100.0%) | 0 (0.0%) |
Fertility by Education in Masonville
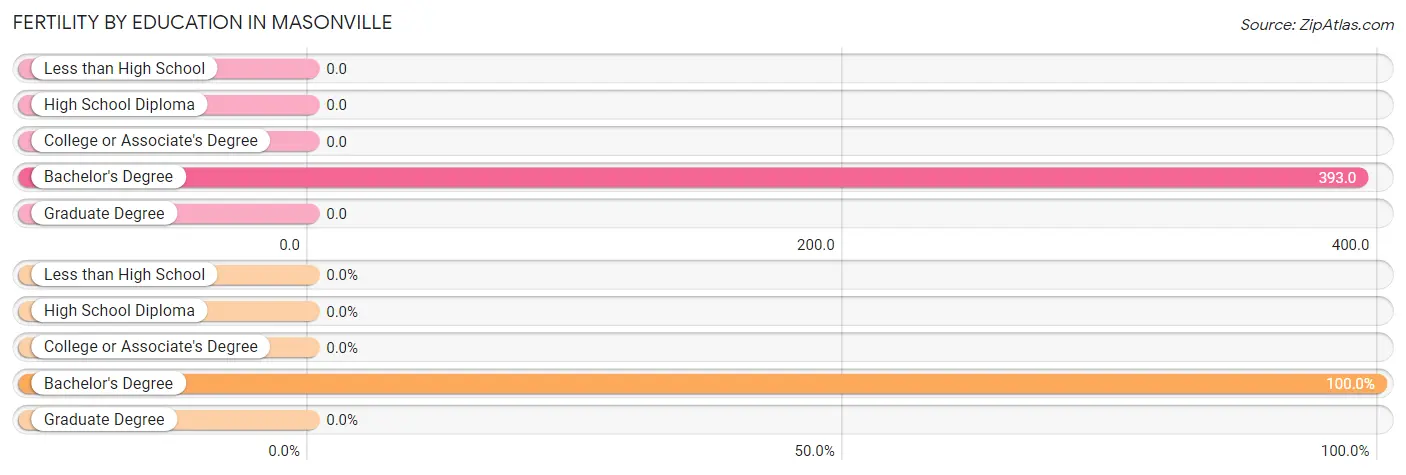
| Educational Attainment | Women with Births | Births / 1,000 Women |
| Less than High School | 0 (0.0%) | 0.0 |
| High School Diploma | 0 (0.0%) | 0.0 |
| College or Associate's Degree | 0 (0.0%) | 0.0 |
| Bachelor's Degree | 24 (100.0%) | 393.0 |
| Graduate Degree | 0 (0.0%) | 0.0 |
| Total | 24 (100.0%) | 41.0 |
Fertility by Education by Marriage Status in Masonville
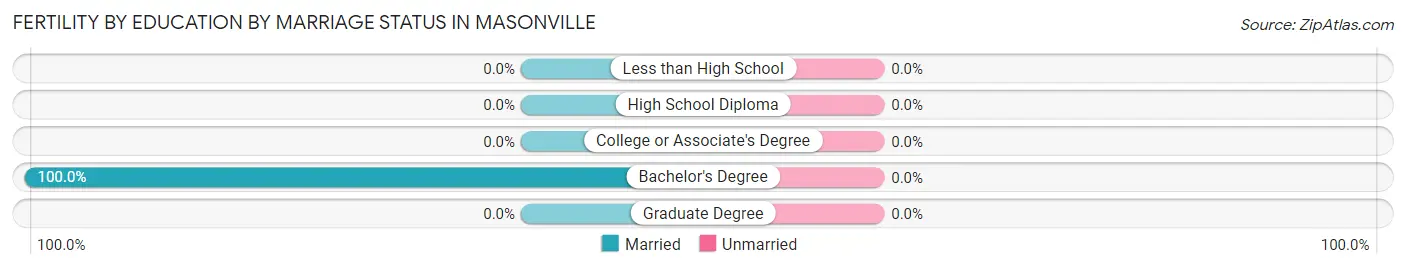
| Educational Attainment | Married | Unmarried |
| Less than High School | 0 (0.0%) | 0 (0.0%) |
| High School Diploma | 0 (0.0%) | 0 (0.0%) |
| College or Associate's Degree | 0 (0.0%) | 0 (0.0%) |
| Bachelor's Degree | 24 (100.0%) | 0 (0.0%) |
| Graduate Degree | 0 (0.0%) | 0 (0.0%) |
| Total | 24 (100.0%) | 0 (0.0%) |
Employment Characteristics in Masonville
Employment by Class of Employer in Masonville
Among the 1,049 employed individuals in Masonville, private company employees (686 | 65.4%), local government employees (158 | 15.1%), and state government employees (78 | 7.4%) make up the most common classes of employment.
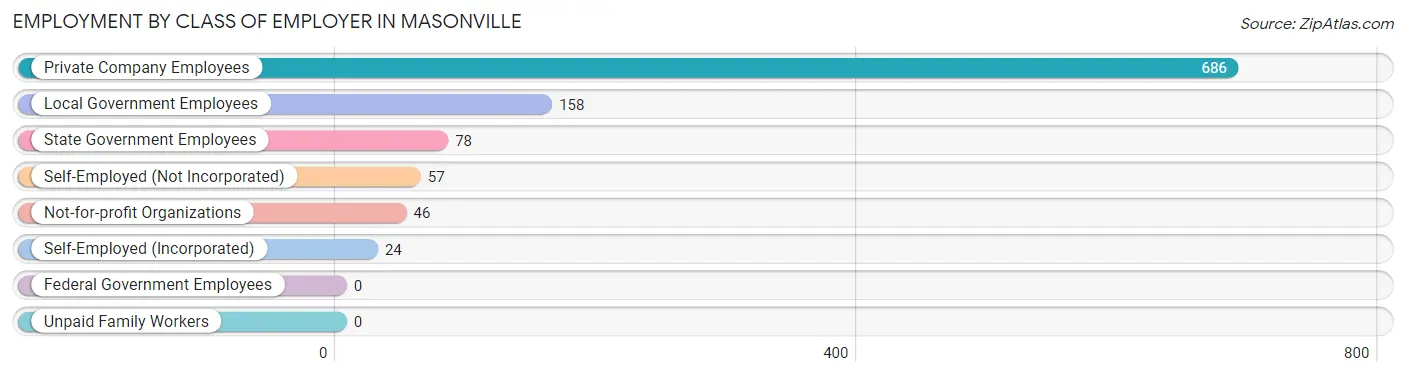
| Employer Class | # Employees | % Employees |
| Private Company Employees | 686 | 65.4% |
| Self-Employed (Incorporated) | 24 | 2.3% |
| Self-Employed (Not Incorporated) | 57 | 5.4% |
| Not-for-profit Organizations | 46 | 4.4% |
| Local Government Employees | 158 | 15.1% |
| State Government Employees | 78 | 7.4% |
| Federal Government Employees | 0 | 0.0% |
| Unpaid Family Workers | 0 | 0.0% |
| Total | 1,049 | 100.0% |
Employment Status by Age in Masonville
According to the labor force statistics for Masonville, out of the total population over 16 years of age (1,438), 76.9% or 1,106 individuals are in the labor force, with 3.6% or 40 of them unemployed. The age group with the highest labor force participation rate is 30 to 34 years, with 100.0% or 113 individuals in the labor force. Within the labor force, the 20 to 24 years age range has the highest percentage of unemployed individuals, with 33.3% or 11 of them being unemployed.
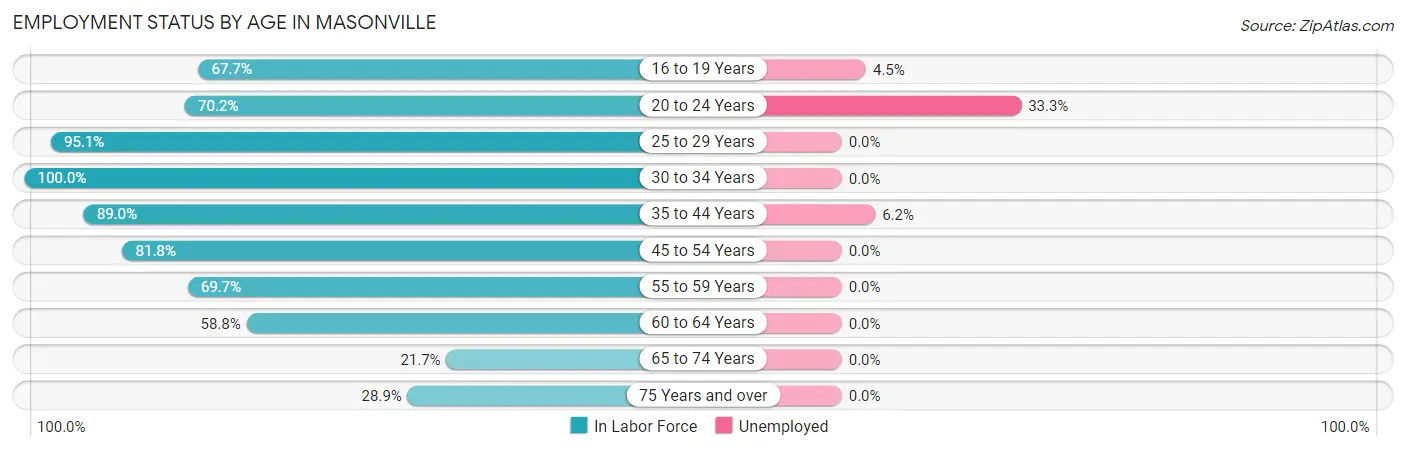
| Age Bracket | In Labor Force | Unemployed |
| 16 to 19 Years | 44 (67.7%) | 2 (4.5%) |
| 20 to 24 Years | 33 (70.2%) | 11 (33.3%) |
| 25 to 29 Years | 196 (95.1%) | 0 (0.0%) |
| 30 to 34 Years | 113 (100.0%) | 0 (0.0%) |
| 35 to 44 Years | 436 (89.0%) | 27 (6.2%) |
| 45 to 54 Years | 135 (81.8%) | 0 (0.0%) |
| 55 to 59 Years | 83 (69.7%) | 0 (0.0%) |
| 60 to 64 Years | 20 (58.8%) | 0 (0.0%) |
| 65 to 74 Years | 35 (21.7%) | 0 (0.0%) |
| 75 Years and over | 11 (28.9%) | 0 (0.0%) |
| Total | 1,106 (76.9%) | 40 (3.6%) |
Employment Status by Educational Attainment in Masonville
According to labor force statistics for Masonville, 87.2% of individuals (983) out of the total population between 25 and 64 years of age (1,127) are in the labor force, with 2.7% or 27 of them being unemployed. The group with the highest labor force participation rate are those with the educational attainment of less than high school, with 100.0% or 24 individuals in the labor force. Within the labor force, individuals with bachelor's degree or higher education have the highest percentage of unemployment, with 7.9% or 27 of them being unemployed.
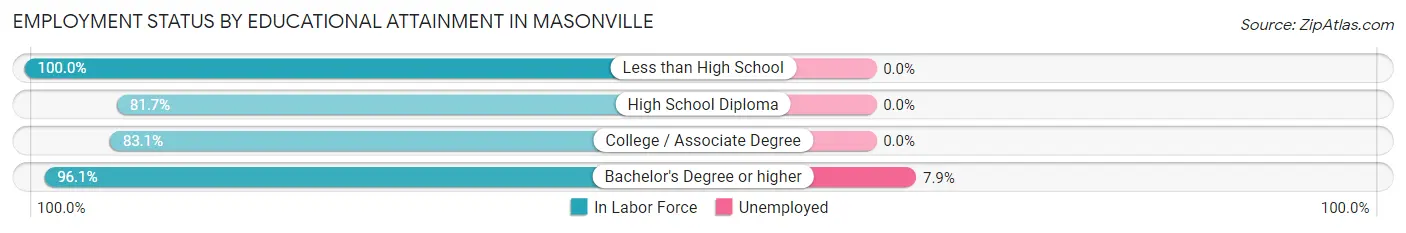
| Educational Attainment | In Labor Force | Unemployed |
| Less than High School | 24 (100.0%) | 0 (0.0%) |
| High School Diploma | 206 (81.7%) | 0 (0.0%) |
| College / Associate Degree | 412 (83.1%) | 0 (0.0%) |
| Bachelor's Degree or higher | 341 (96.1%) | 28 (7.9%) |
| Total | 983 (87.2%) | 30 (2.7%) |
Employment Occupations by Sex in Masonville
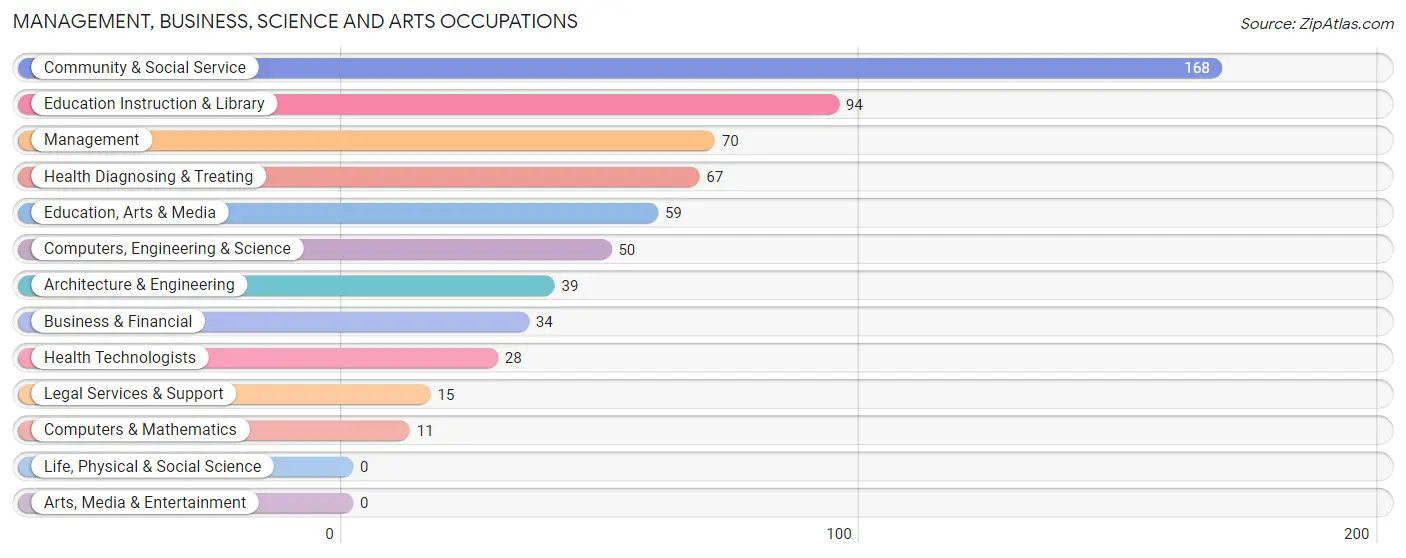
Management, Business, Science and Arts Occupations
The most common Management, Business, Science and Arts occupations in Masonville are Community & Social Service (168 | 15.8%), Education Instruction & Library (94 | 8.8%), Management (70 | 6.6%), Health Diagnosing & Treating (67 | 6.3%), and Education, Arts & Media (59 | 5.5%).
Management, Business, Science and Arts Occupations by Sex
Within the Management, Business, Science and Arts occupations in Masonville, the most male-oriented occupations are Management (100.0%), Legal Services & Support (100.0%), and Education, Arts & Media (76.3%), while the most female-oriented occupations are Computers & Mathematics (100.0%), Education Instruction & Library (100.0%), and Health Diagnosing & Treating (82.1%).
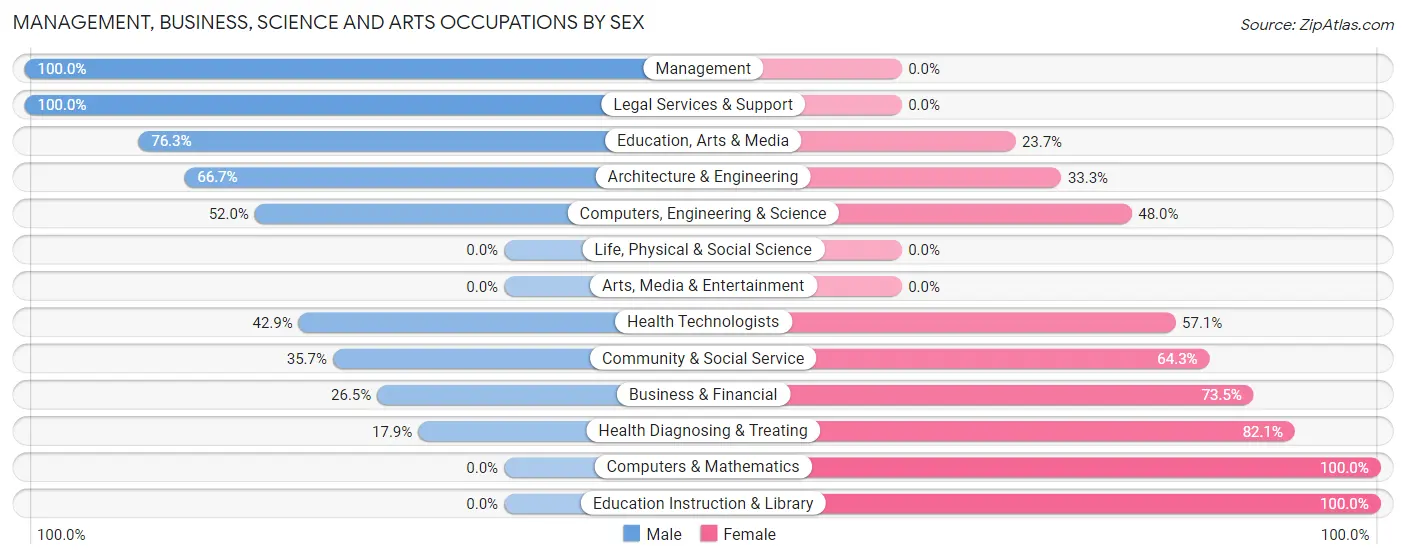
| Occupation | Male | Female |
| Management | 70 (100.0%) | 0 (0.0%) |
| Business & Financial | 9 (26.5%) | 25 (73.5%) |
| Computers, Engineering & Science | 26 (52.0%) | 24 (48.0%) |
| Computers & Mathematics | 0 (0.0%) | 11 (100.0%) |
| Architecture & Engineering | 26 (66.7%) | 13 (33.3%) |
| Life, Physical & Social Science | 0 (0.0%) | 0 (0.0%) |
| Community & Social Service | 60 (35.7%) | 108 (64.3%) |
| Education, Arts & Media | 45 (76.3%) | 14 (23.7%) |
| Legal Services & Support | 15 (100.0%) | 0 (0.0%) |
| Education Instruction & Library | 0 (0.0%) | 94 (100.0%) |
| Arts, Media & Entertainment | 0 (0.0%) | 0 (0.0%) |
| Health Diagnosing & Treating | 12 (17.9%) | 55 (82.1%) |
| Health Technologists | 12 (42.9%) | 16 (57.1%) |
| Total (Category) | 177 (45.5%) | 212 (54.5%) |
| Total (Overall) | 540 (50.7%) | 526 (49.3%) |
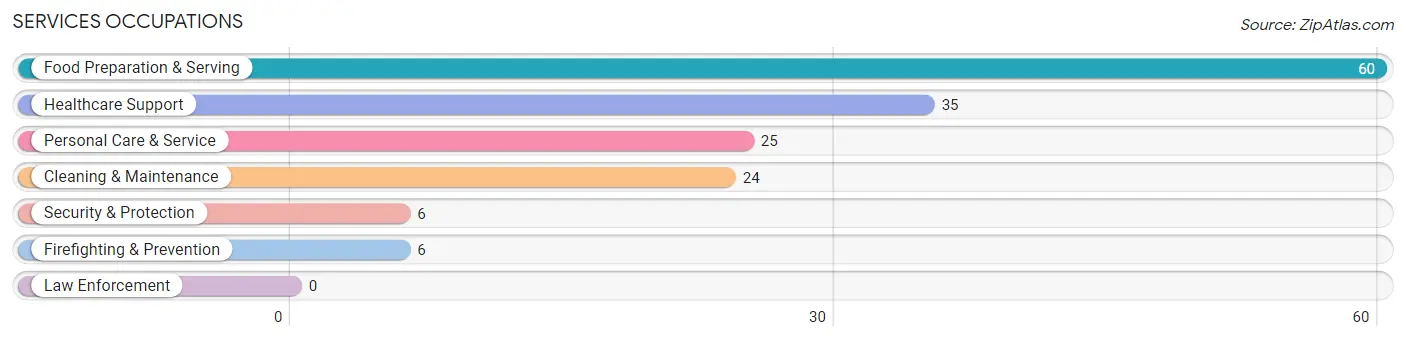
Services Occupations
The most common Services occupations in Masonville are Food Preparation & Serving (60 | 5.6%), Healthcare Support (35 | 3.3%), Personal Care & Service (25 | 2.4%), Cleaning & Maintenance (24 | 2.2%), and Security & Protection (6 | 0.6%).
Services Occupations by Sex
Within the Services occupations in Masonville, the most male-oriented occupations are Security & Protection (100.0%), Firefighting & Prevention (100.0%), and Cleaning & Maintenance (100.0%), while the most female-oriented occupations are Healthcare Support (100.0%), and Food Preparation & Serving (100.0%).
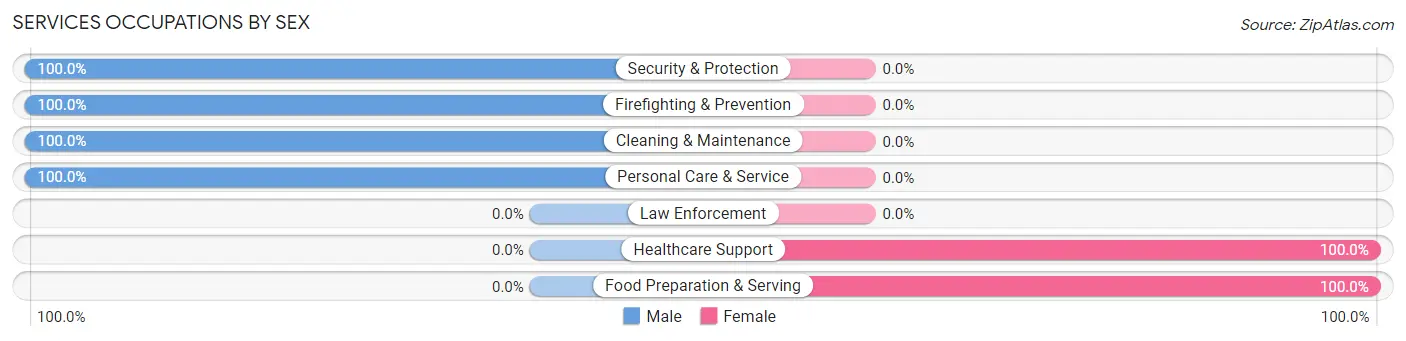
| Occupation | Male | Female |
| Healthcare Support | 0 (0.0%) | 35 (100.0%) |
| Security & Protection | 6 (100.0%) | 0 (0.0%) |
| Firefighting & Prevention | 6 (100.0%) | 0 (0.0%) |
| Law Enforcement | 0 (0.0%) | 0 (0.0%) |
| Food Preparation & Serving | 0 (0.0%) | 60 (100.0%) |
| Cleaning & Maintenance | 24 (100.0%) | 0 (0.0%) |
| Personal Care & Service | 25 (100.0%) | 0 (0.0%) |
| Total (Category) | 55 (36.7%) | 95 (63.3%) |
| Total (Overall) | 540 (50.7%) | 526 (49.3%) |
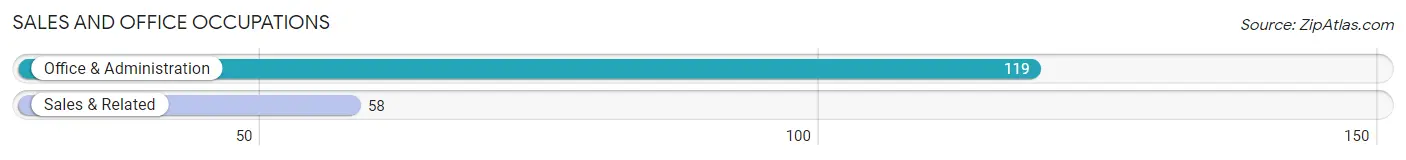
Sales and Office Occupations
The most common Sales and Office occupations in Masonville are Office & Administration (119 | 11.2%), and Sales & Related (58 | 5.4%).
Sales and Office Occupations by Sex
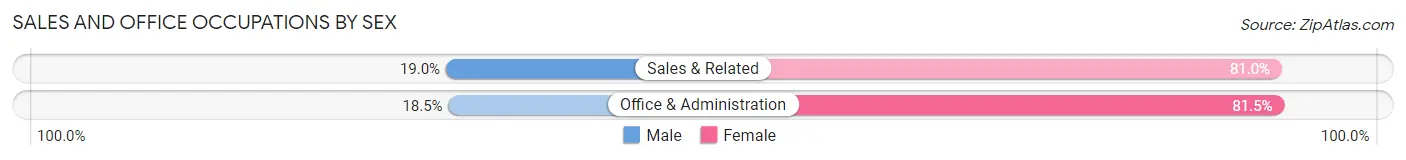
| Occupation | Male | Female |
| Sales & Related | 11 (19.0%) | 47 (81.0%) |
| Office & Administration | 22 (18.5%) | 97 (81.5%) |
| Total (Category) | 33 (18.6%) | 144 (81.4%) |
| Total (Overall) | 540 (50.7%) | 526 (49.3%) |
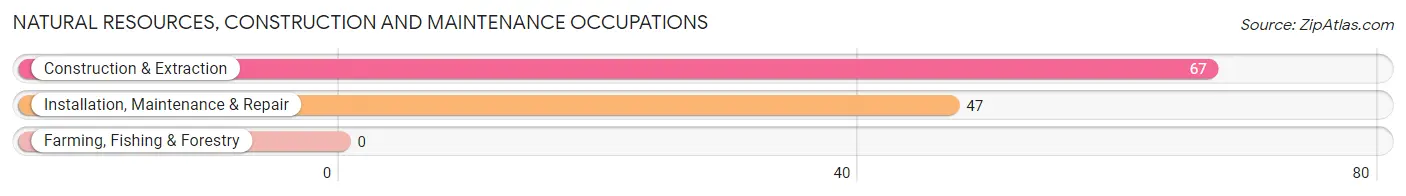
Natural Resources, Construction and Maintenance Occupations
The most common Natural Resources, Construction and Maintenance occupations in Masonville are Construction & Extraction (67 | 6.3%), and Installation, Maintenance & Repair (47 | 4.4%).
Natural Resources, Construction and Maintenance Occupations by Sex
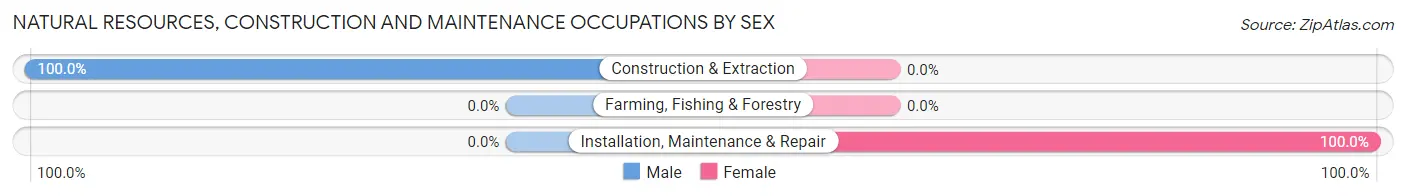
| Occupation | Male | Female |
| Farming, Fishing & Forestry | 0 (0.0%) | 0 (0.0%) |
| Construction & Extraction | 67 (100.0%) | 0 (0.0%) |
| Installation, Maintenance & Repair | 0 (0.0%) | 47 (100.0%) |
| Total (Category) | 67 (58.8%) | 47 (41.2%) |
| Total (Overall) | 540 (50.7%) | 526 (49.3%) |
Production, Transportation and Moving Occupations
The most common Production, Transportation and Moving occupations in Masonville are Production (98 | 9.2%), Material Moving (96 | 9.0%), and Transportation (42 | 3.9%).
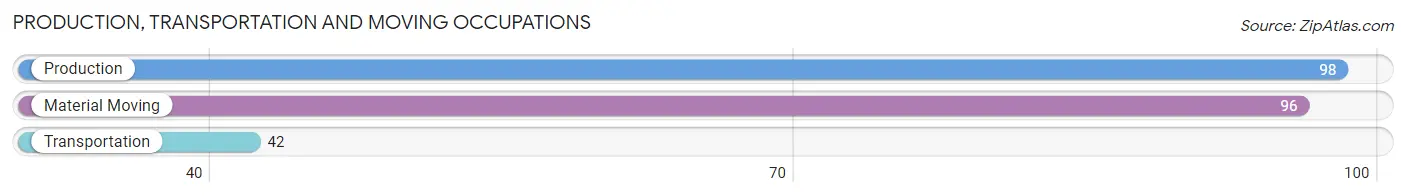
Production, Transportation and Moving Occupations by Sex
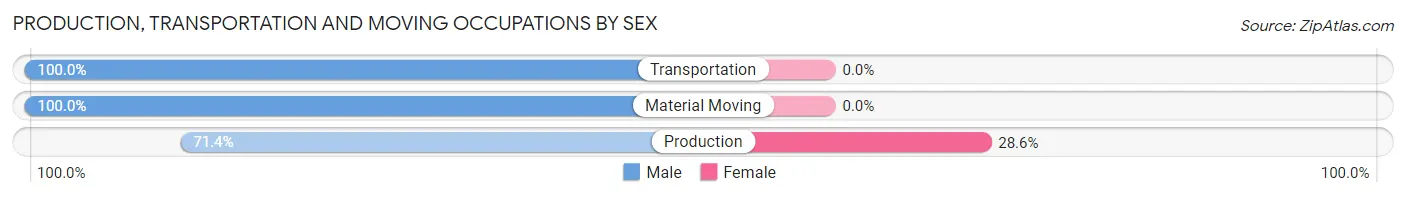
| Occupation | Male | Female |
| Production | 70 (71.4%) | 28 (28.6%) |
| Transportation | 42 (100.0%) | 0 (0.0%) |
| Material Moving | 96 (100.0%) | 0 (0.0%) |
| Total (Category) | 208 (88.1%) | 28 (11.9%) |
| Total (Overall) | 540 (50.7%) | 526 (49.3%) |
Employment Industries by Sex in Masonville
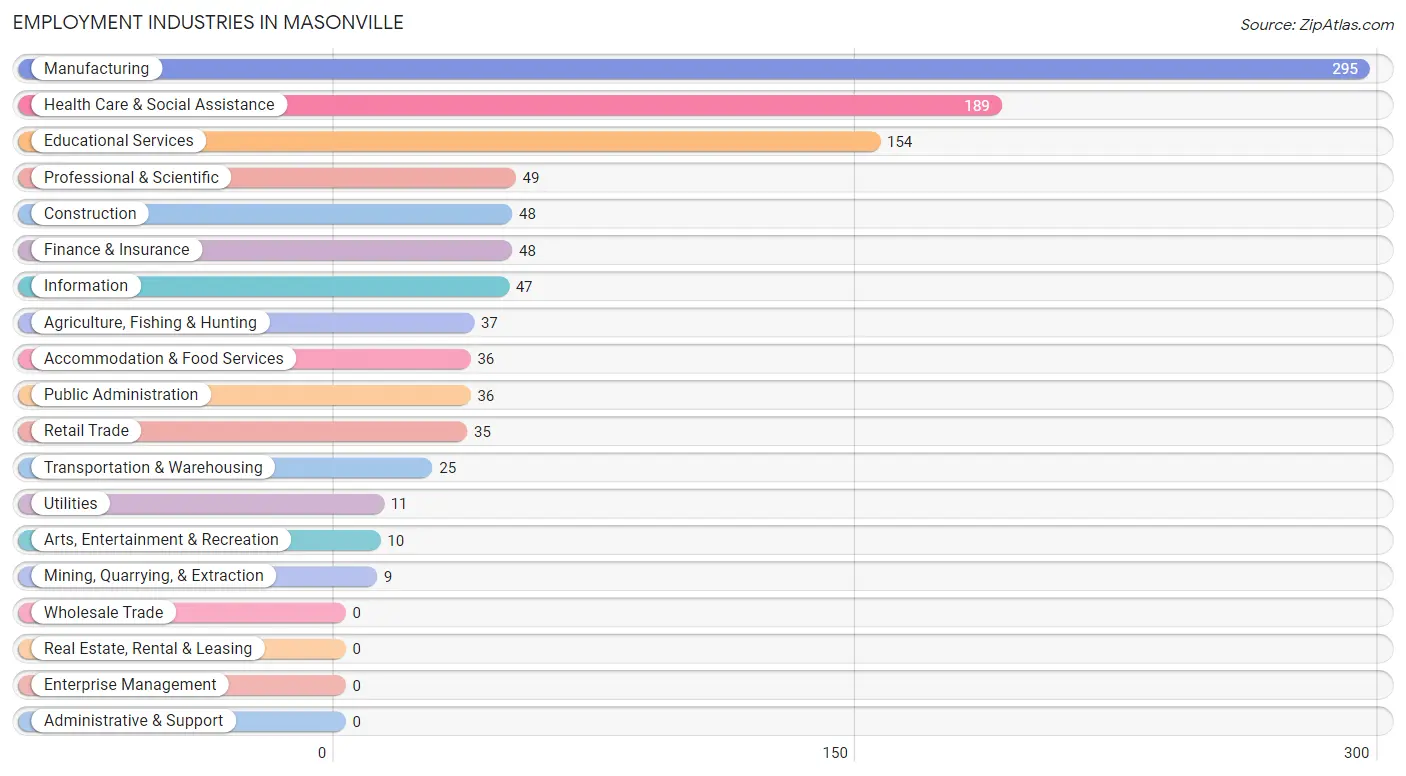
Employment Industries in Masonville
The major employment industries in Masonville include Manufacturing (295 | 27.7%), Health Care & Social Assistance (189 | 17.7%), Educational Services (154 | 14.4%), Professional & Scientific (49 | 4.6%), and Construction (48 | 4.5%).
Employment Industries by Sex in Masonville
The Masonville industries that see more men than women are Agriculture, Fishing & Hunting (100.0%), Mining, Quarrying, & Extraction (100.0%), and Transportation & Warehousing (100.0%), whereas the industries that tend to have a higher number of women are Information (100.0%), Educational Services (100.0%), and Accommodation & Food Services (100.0%).
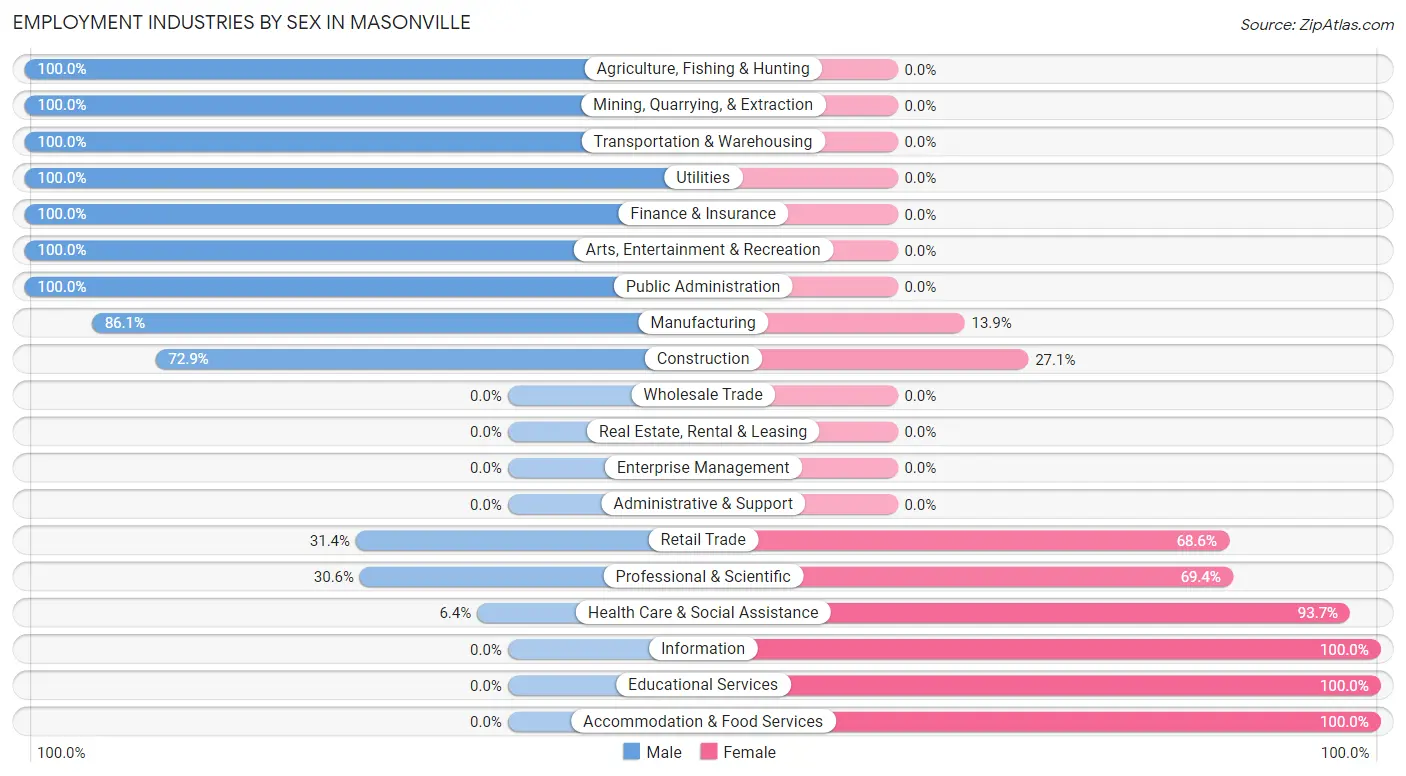
| Industry | Male | Female |
| Agriculture, Fishing & Hunting | 37 (100.0%) | 0 (0.0%) |
| Mining, Quarrying, & Extraction | 9 (100.0%) | 0 (0.0%) |
| Construction | 35 (72.9%) | 13 (27.1%) |
| Manufacturing | 254 (86.1%) | 41 (13.9%) |
| Wholesale Trade | 0 (0.0%) | 0 (0.0%) |
| Retail Trade | 11 (31.4%) | 24 (68.6%) |
| Transportation & Warehousing | 25 (100.0%) | 0 (0.0%) |
| Utilities | 11 (100.0%) | 0 (0.0%) |
| Information | 0 (0.0%) | 47 (100.0%) |
| Finance & Insurance | 48 (100.0%) | 0 (0.0%) |
| Real Estate, Rental & Leasing | 0 (0.0%) | 0 (0.0%) |
| Professional & Scientific | 15 (30.6%) | 34 (69.4%) |
| Enterprise Management | 0 (0.0%) | 0 (0.0%) |
| Administrative & Support | 0 (0.0%) | 0 (0.0%) |
| Educational Services | 0 (0.0%) | 154 (100.0%) |
| Health Care & Social Assistance | 12 (6.4%) | 177 (93.6%) |
| Arts, Entertainment & Recreation | 10 (100.0%) | 0 (0.0%) |
| Accommodation & Food Services | 0 (0.0%) | 36 (100.0%) |
| Public Administration | 36 (100.0%) | 0 (0.0%) |
| Total | 540 (50.7%) | 526 (49.3%) |
Education in Masonville
School Enrollment in Masonville
The most common levels of schooling among the 696 students in Masonville are high school (165 | 23.7%), elementary school (147 | 21.1%), and nursery / preschool (129 | 18.5%).
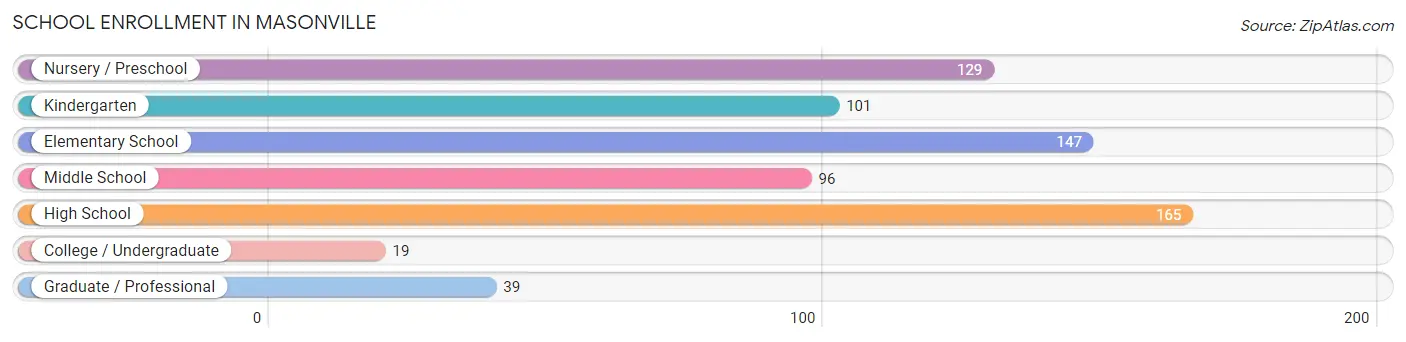
| School Level | # Students | % Students |
| Nursery / Preschool | 129 | 18.5% |
| Kindergarten | 101 | 14.5% |
| Elementary School | 147 | 21.1% |
| Middle School | 96 | 13.8% |
| High School | 165 | 23.7% |
| College / Undergraduate | 19 | 2.7% |
| Graduate / Professional | 39 | 5.6% |
| Total | 696 | 100.0% |
School Enrollment by Age by Funding Source in Masonville
Out of a total of 696 students who are enrolled in schools in Masonville, 78 (11.2%) attend a private institution, while the remaining 618 (88.8%) are enrolled in public schools. The age group of 3 to 4 year olds has the highest likelihood of being enrolled in private schools, with 49 (52.7% in the age bracket) enrolled. Conversely, the age group of 10 to 14 year olds has the lowest likelihood of being enrolled in a private school, with 108 (100.0% in the age bracket) attending a public institution.
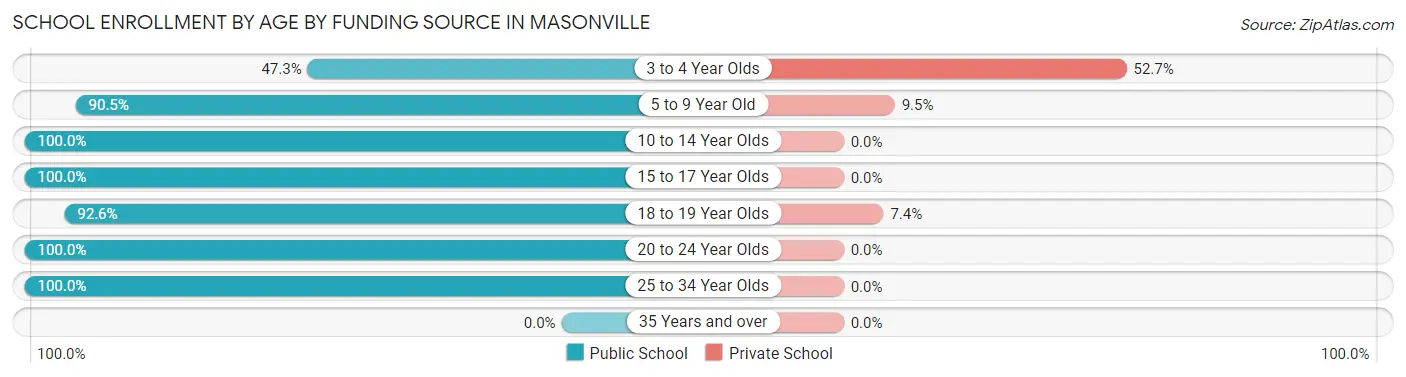
| Age Bracket | Public School | Private School |
| 3 to 4 Year Olds | 44 (47.3%) | 49 (52.7%) |
| 5 to 9 Year Old | 257 (90.5%) | 27 (9.5%) |
| 10 to 14 Year Olds | 108 (100.0%) | 0 (0.0%) |
| 15 to 17 Year Olds | 128 (100.0%) | 0 (0.0%) |
| 18 to 19 Year Olds | 25 (92.6%) | 2 (7.4%) |
| 20 to 24 Year Olds | 11 (100.0%) | 0 (0.0%) |
| 25 to 34 Year Olds | 45 (100.0%) | 0 (0.0%) |
| 35 Years and over | 0 (0.0%) | 0 (0.0%) |
| Total | 618 (88.8%) | 78 (11.2%) |
Educational Attainment by Field of Study in Masonville
Education (128 | 29.0%), business (96 | 21.7%), arts & humanities (56 | 12.7%), visual & performing arts (40 | 9.0%), and bio, nature & agricultural (27 | 6.1%) are the most common fields of study among 442 individuals in Masonville who have obtained a bachelor's degree or higher.
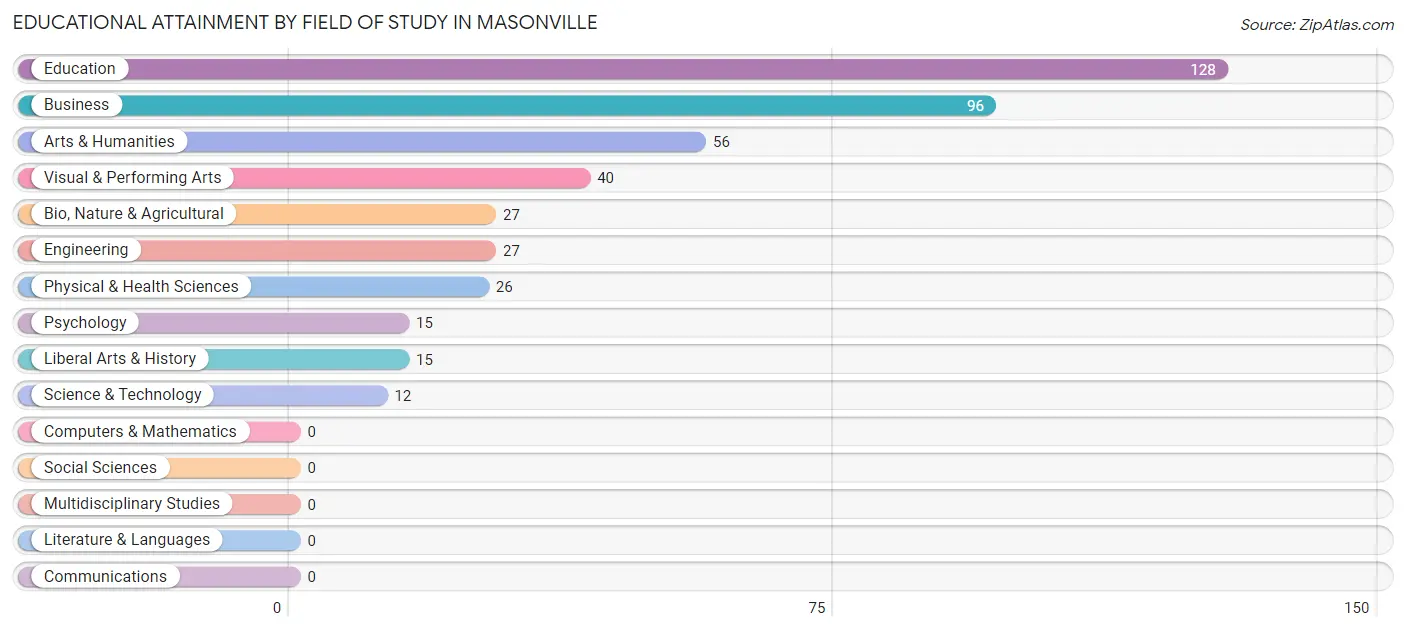
| Field of Study | # Graduates | % Graduates |
| Computers & Mathematics | 0 | 0.0% |
| Bio, Nature & Agricultural | 27 | 6.1% |
| Physical & Health Sciences | 26 | 5.9% |
| Psychology | 15 | 3.4% |
| Social Sciences | 0 | 0.0% |
| Engineering | 27 | 6.1% |
| Multidisciplinary Studies | 0 | 0.0% |
| Science & Technology | 12 | 2.7% |
| Business | 96 | 21.7% |
| Education | 128 | 29.0% |
| Literature & Languages | 0 | 0.0% |
| Liberal Arts & History | 15 | 3.4% |
| Visual & Performing Arts | 40 | 9.0% |
| Communications | 0 | 0.0% |
| Arts & Humanities | 56 | 12.7% |
| Total | 442 | 100.0% |
Transportation & Commute in Masonville
Vehicle Availability by Sex in Masonville
The most prevalent vehicle ownership categories in Masonville are males with 2 vehicles (364, accounting for 69.6%) and females with 2 vehicles (300, making up 69.2%).
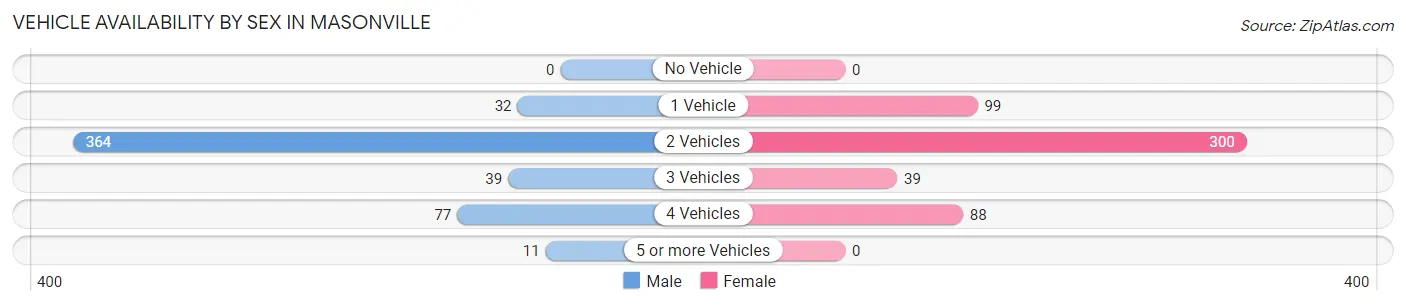
| Vehicles Available | Male | Female |
| No Vehicle | 0 (0.0%) | 0 (0.0%) |
| 1 Vehicle | 32 (6.1%) | 99 (18.8%) |
| 2 Vehicles | 364 (69.6%) | 300 (57.0%) |
| 3 Vehicles | 39 (7.5%) | 39 (7.4%) |
| 4 Vehicles | 77 (14.7%) | 88 (16.7%) |
| 5 or more Vehicles | 11 (2.1%) | 0 (0.0%) |
| Total | 523 (100.0%) | 526 (100.0%) |
Commute Time in Masonville
The most frequently occuring commute durations in Masonville are 15 to 19 minutes (327 commuters, 33.0%), 10 to 14 minutes (178 commuters, 18.0%), and 20 to 24 minutes (178 commuters, 18.0%).

| Commute Time | # Commuters | % Commuters |
| Less than 5 Minutes | 11 | 1.1% |
| 5 to 9 Minutes | 101 | 10.2% |
| 10 to 14 Minutes | 178 | 18.0% |
| 15 to 19 Minutes | 327 | 33.0% |
| 20 to 24 Minutes | 178 | 18.0% |
| 25 to 29 Minutes | 14 | 1.4% |
| 30 to 34 Minutes | 95 | 9.6% |
| 35 to 39 Minutes | 0 | 0.0% |
| 40 to 44 Minutes | 0 | 0.0% |
| 45 to 59 Minutes | 62 | 6.3% |
| 60 to 89 Minutes | 24 | 2.4% |
| 90 or more Minutes | 0 | 0.0% |
Commute Time by Sex in Masonville
The most common commute times in Masonville are 15 to 19 minutes (151 commuters, 30.9%) for males and 15 to 19 minutes (176 commuters, 35.1%) for females.
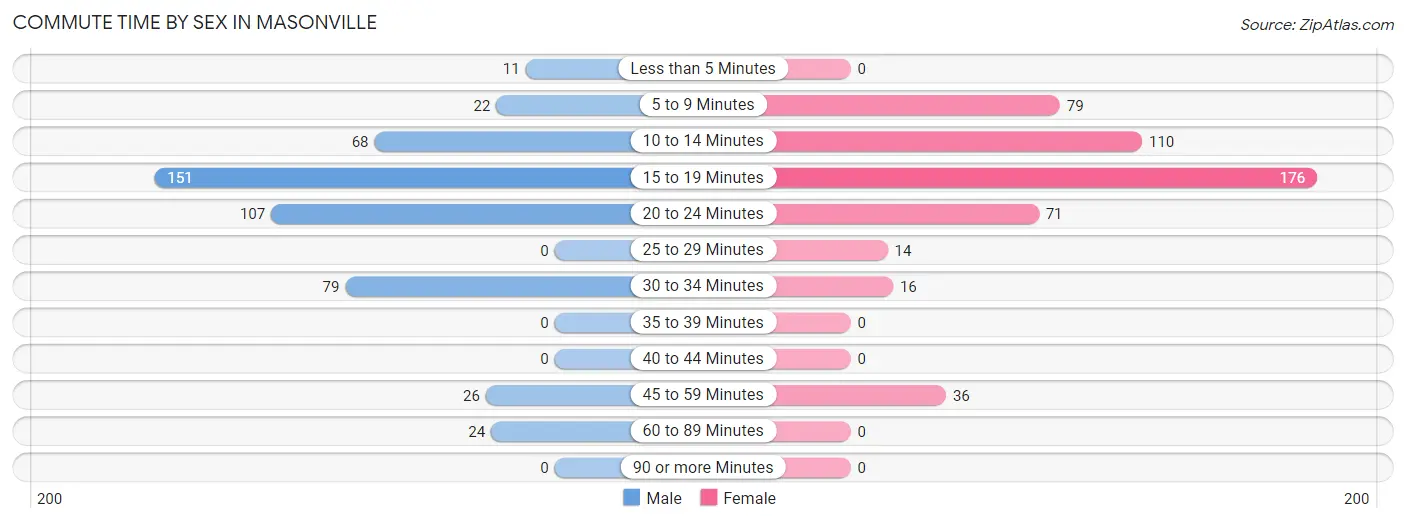
| Commute Time | Male | Female |
| Less than 5 Minutes | 11 (2.2%) | 0 (0.0%) |
| 5 to 9 Minutes | 22 (4.5%) | 79 (15.7%) |
| 10 to 14 Minutes | 68 (13.9%) | 110 (21.9%) |
| 15 to 19 Minutes | 151 (30.9%) | 176 (35.1%) |
| 20 to 24 Minutes | 107 (21.9%) | 71 (14.1%) |
| 25 to 29 Minutes | 0 (0.0%) | 14 (2.8%) |
| 30 to 34 Minutes | 79 (16.2%) | 16 (3.2%) |
| 35 to 39 Minutes | 0 (0.0%) | 0 (0.0%) |
| 40 to 44 Minutes | 0 (0.0%) | 0 (0.0%) |
| 45 to 59 Minutes | 26 (5.3%) | 36 (7.2%) |
| 60 to 89 Minutes | 24 (4.9%) | 0 (0.0%) |
| 90 or more Minutes | 0 (0.0%) | 0 (0.0%) |
Time of Departure to Work by Sex in Masonville
The most frequent times of departure to work in Masonville are 7:30 AM to 7:59 AM (100, 20.5%) for males and 6:30 AM to 6:59 AM (96, 19.1%) for females.
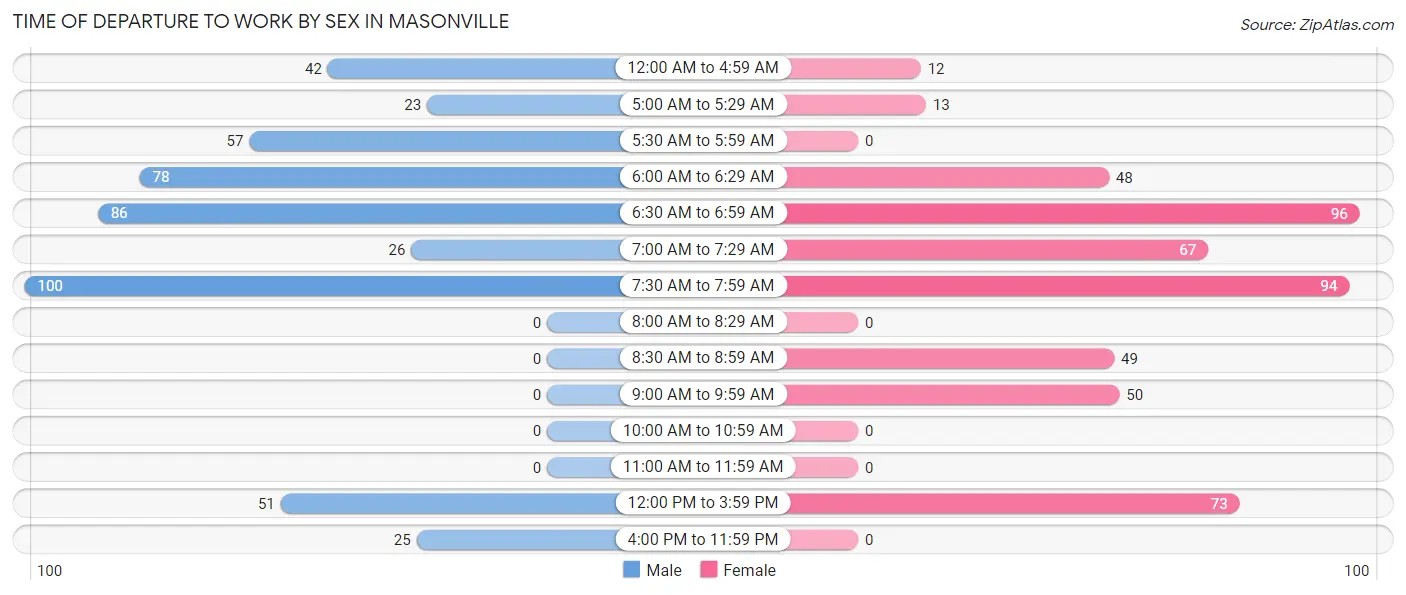
| Time of Departure | Male | Female |
| 12:00 AM to 4:59 AM | 42 (8.6%) | 12 (2.4%) |
| 5:00 AM to 5:29 AM | 23 (4.7%) | 13 (2.6%) |
| 5:30 AM to 5:59 AM | 57 (11.7%) | 0 (0.0%) |
| 6:00 AM to 6:29 AM | 78 (16.0%) | 48 (9.6%) |
| 6:30 AM to 6:59 AM | 86 (17.6%) | 96 (19.1%) |
| 7:00 AM to 7:29 AM | 26 (5.3%) | 67 (13.4%) |
| 7:30 AM to 7:59 AM | 100 (20.5%) | 94 (18.7%) |
| 8:00 AM to 8:29 AM | 0 (0.0%) | 0 (0.0%) |
| 8:30 AM to 8:59 AM | 0 (0.0%) | 49 (9.8%) |
| 9:00 AM to 9:59 AM | 0 (0.0%) | 50 (10.0%) |
| 10:00 AM to 10:59 AM | 0 (0.0%) | 0 (0.0%) |
| 11:00 AM to 11:59 AM | 0 (0.0%) | 0 (0.0%) |
| 12:00 PM to 3:59 PM | 51 (10.4%) | 73 (14.5%) |
| 4:00 PM to 11:59 PM | 25 (5.1%) | 0 (0.0%) |
| Total | 488 (100.0%) | 502 (100.0%) |
Housing Occupancy in Masonville
Occupancy by Ownership in Masonville
Of the total 747 dwellings in Masonville, owner-occupied units account for 702 (94.0%), while renter-occupied units make up 45 (6.0%).
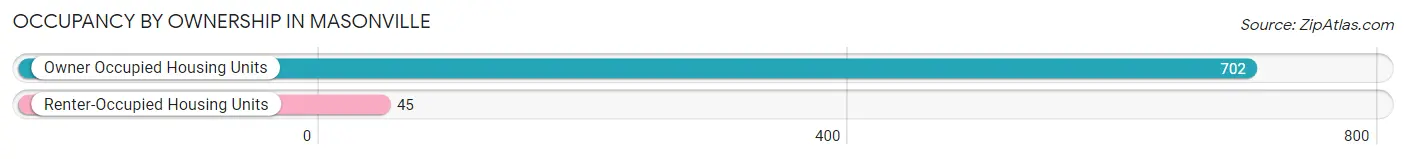
| Occupancy | # Housing Units | % Housing Units |
| Owner Occupied Housing Units | 702 | 94.0% |
| Renter-Occupied Housing Units | 45 | 6.0% |
| Total Occupied Housing Units | 747 | 100.0% |
Occupancy by Household Size in Masonville
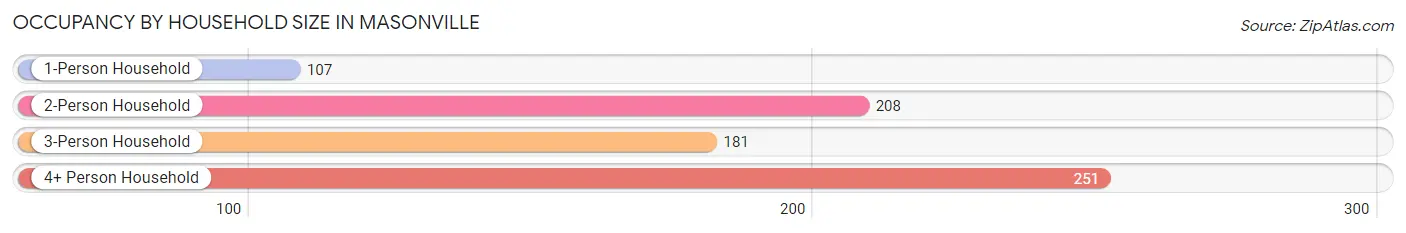
| Household Size | # Housing Units | % Housing Units |
| 1-Person Household | 107 | 14.3% |
| 2-Person Household | 208 | 27.8% |
| 3-Person Household | 181 | 24.2% |
| 4+ Person Household | 251 | 33.6% |
| Total Housing Units | 747 | 100.0% |
Occupancy by Ownership by Household Size in Masonville
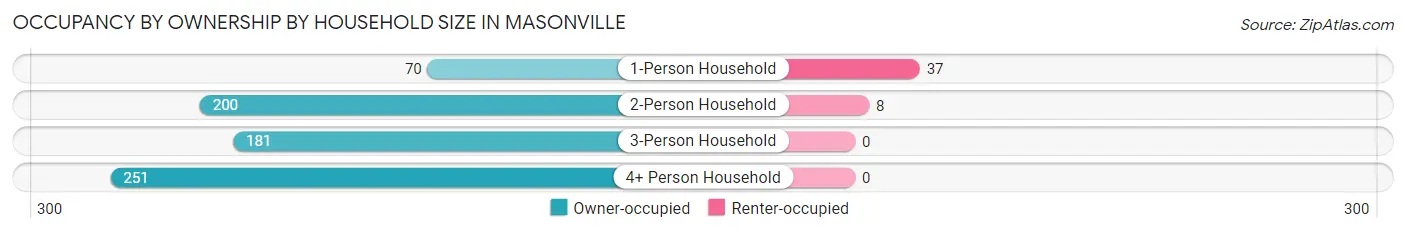
| Household Size | Owner-occupied | Renter-occupied |
| 1-Person Household | 70 (65.4%) | 37 (34.6%) |
| 2-Person Household | 200 (96.2%) | 8 (3.8%) |
| 3-Person Household | 181 (100.0%) | 0 (0.0%) |
| 4+ Person Household | 251 (100.0%) | 0 (0.0%) |
| Total Housing Units | 702 (94.0%) | 45 (6.0%) |
Occupancy by Educational Attainment in Masonville
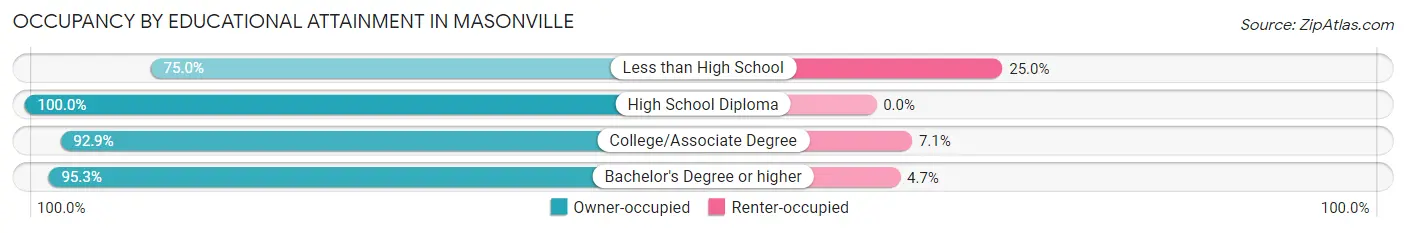
| Household Size | Owner-occupied | Renter-occupied |
| Less than High School | 24 (75.0%) | 8 (25.0%) |
| High School Diploma | 110 (100.0%) | 0 (0.0%) |
| College/Associate Degree | 327 (92.9%) | 25 (7.1%) |
| Bachelor's Degree or higher | 241 (95.3%) | 12 (4.7%) |
Occupancy by Age of Householder in Masonville
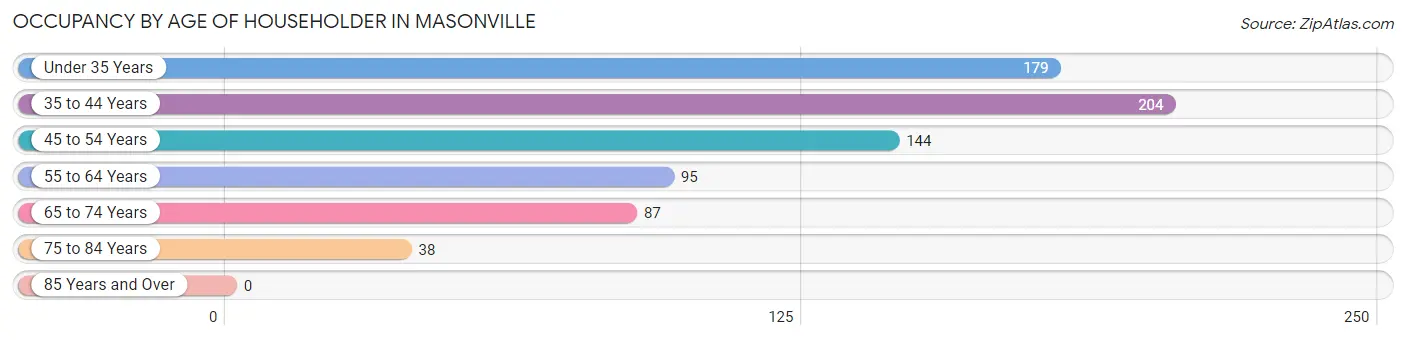
| Age Bracket | # Households | % Households |
| Under 35 Years | 179 | 24.0% |
| 35 to 44 Years | 204 | 27.3% |
| 45 to 54 Years | 144 | 19.3% |
| 55 to 64 Years | 95 | 12.7% |
| 65 to 74 Years | 87 | 11.7% |
| 75 to 84 Years | 38 | 5.1% |
| 85 Years and Over | 0 | 0.0% |
| Total | 747 | 100.0% |
Housing Finances in Masonville
Median Income by Occupancy in Masonville
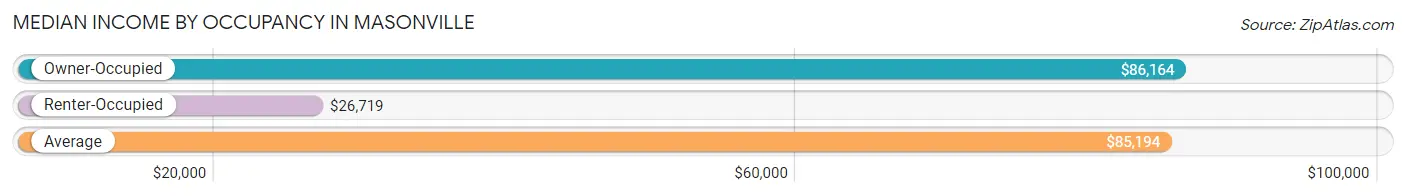
| Occupancy Type | # Households | Median Income |
| Owner-Occupied | 702 (94.0%) | $86,164 |
| Renter-Occupied | 45 (6.0%) | $26,719 |
| Average | 747 (100.0%) | $85,194 |
Occupancy by Householder Income Bracket in Masonville
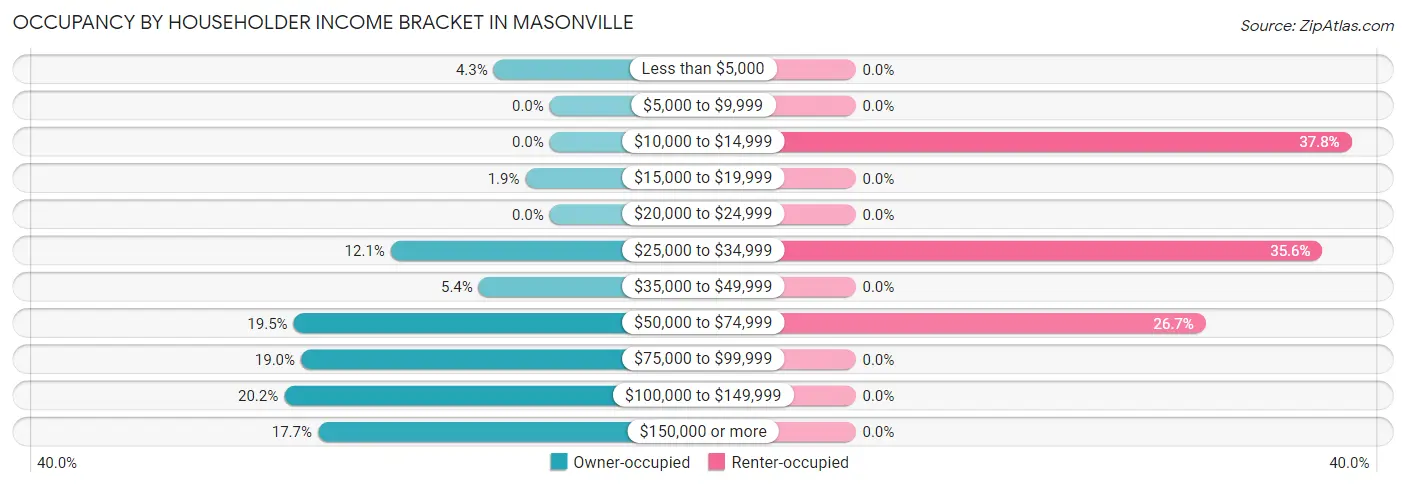
| Income Bracket | Owner-occupied | Renter-occupied |
| Less than $5,000 | 30 (4.3%) | 0 (0.0%) |
| $5,000 to $9,999 | 0 (0.0%) | 0 (0.0%) |
| $10,000 to $14,999 | 0 (0.0%) | 17 (37.8%) |
| $15,000 to $19,999 | 13 (1.8%) | 0 (0.0%) |
| $20,000 to $24,999 | 0 (0.0%) | 0 (0.0%) |
| $25,000 to $34,999 | 85 (12.1%) | 16 (35.6%) |
| $35,000 to $49,999 | 38 (5.4%) | 0 (0.0%) |
| $50,000 to $74,999 | 137 (19.5%) | 12 (26.7%) |
| $75,000 to $99,999 | 133 (19.0%) | 0 (0.0%) |
| $100,000 to $149,999 | 142 (20.2%) | 0 (0.0%) |
| $150,000 or more | 124 (17.7%) | 0 (0.0%) |
| Total | 702 (100.0%) | 45 (100.0%) |
Monthly Housing Cost Tiers in Masonville
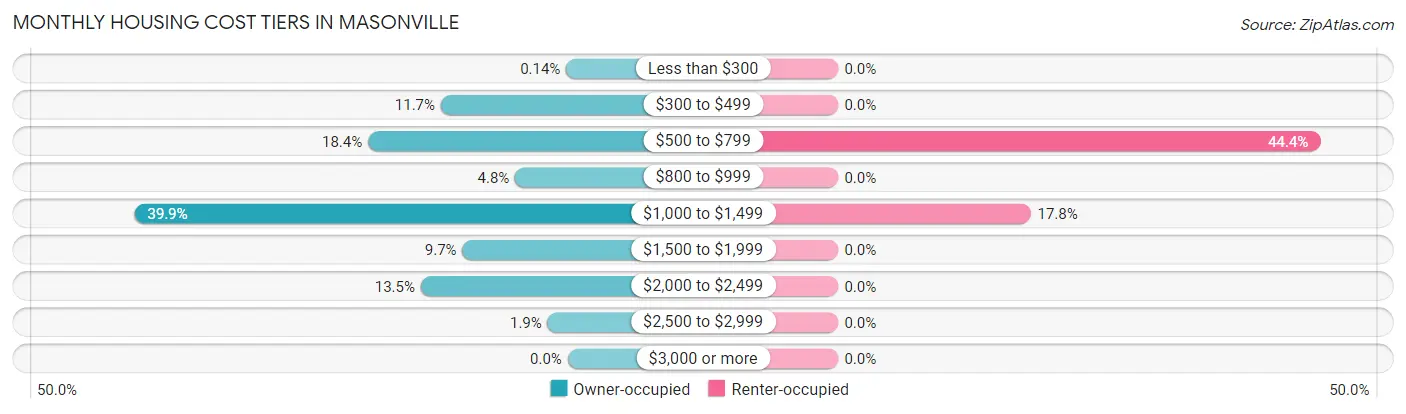
| Monthly Cost | Owner-occupied | Renter-occupied |
| Less than $300 | 1 (0.1%) | 0 (0.0%) |
| $300 to $499 | 82 (11.7%) | 0 (0.0%) |
| $500 to $799 | 129 (18.4%) | 20 (44.4%) |
| $800 to $999 | 34 (4.8%) | 0 (0.0%) |
| $1,000 to $1,499 | 280 (39.9%) | 8 (17.8%) |
| $1,500 to $1,999 | 68 (9.7%) | 0 (0.0%) |
| $2,000 to $2,499 | 95 (13.5%) | 0 (0.0%) |
| $2,500 to $2,999 | 13 (1.8%) | 0 (0.0%) |
| $3,000 or more | 0 (0.0%) | 0 (0.0%) |
| Total | 702 (100.0%) | 45 (100.0%) |
Physical Housing Characteristics in Masonville
Housing Structures in Masonville
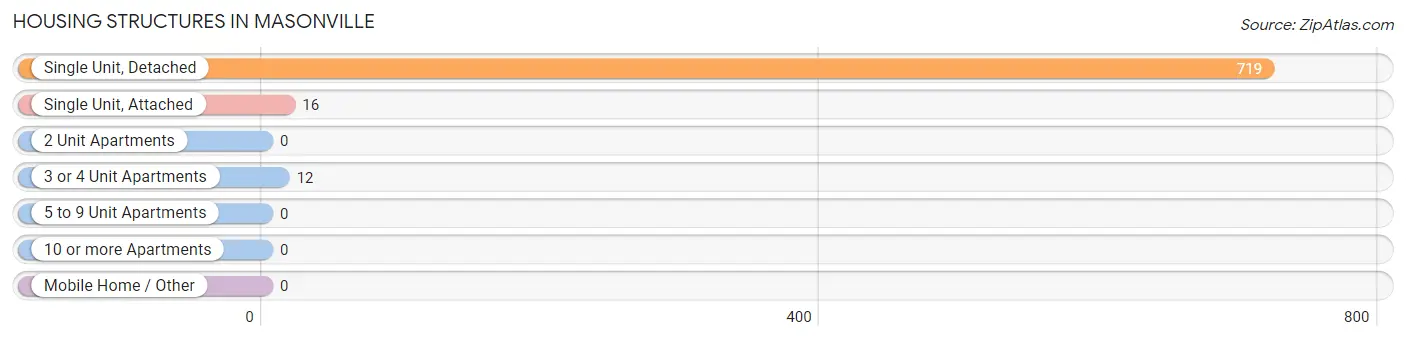
| Structure Type | # Housing Units | % Housing Units |
| Single Unit, Detached | 719 | 96.3% |
| Single Unit, Attached | 16 | 2.1% |
| 2 Unit Apartments | 0 | 0.0% |
| 3 or 4 Unit Apartments | 12 | 1.6% |
| 5 to 9 Unit Apartments | 0 | 0.0% |
| 10 or more Apartments | 0 | 0.0% |
| Mobile Home / Other | 0 | 0.0% |
| Total | 747 | 100.0% |
Housing Structures by Occupancy in Masonville
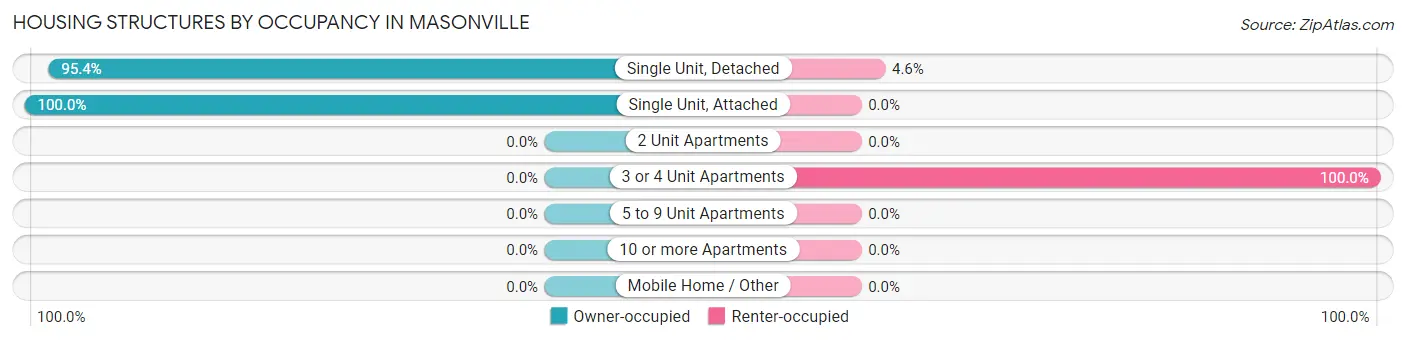
| Structure Type | Owner-occupied | Renter-occupied |
| Single Unit, Detached | 686 (95.4%) | 33 (4.6%) |
| Single Unit, Attached | 16 (100.0%) | 0 (0.0%) |
| 2 Unit Apartments | 0 (0.0%) | 0 (0.0%) |
| 3 or 4 Unit Apartments | 0 (0.0%) | 12 (100.0%) |
| 5 to 9 Unit Apartments | 0 (0.0%) | 0 (0.0%) |
| 10 or more Apartments | 0 (0.0%) | 0 (0.0%) |
| Mobile Home / Other | 0 (0.0%) | 0 (0.0%) |
| Total | 702 (94.0%) | 45 (6.0%) |
Housing Structures by Number of Rooms in Masonville
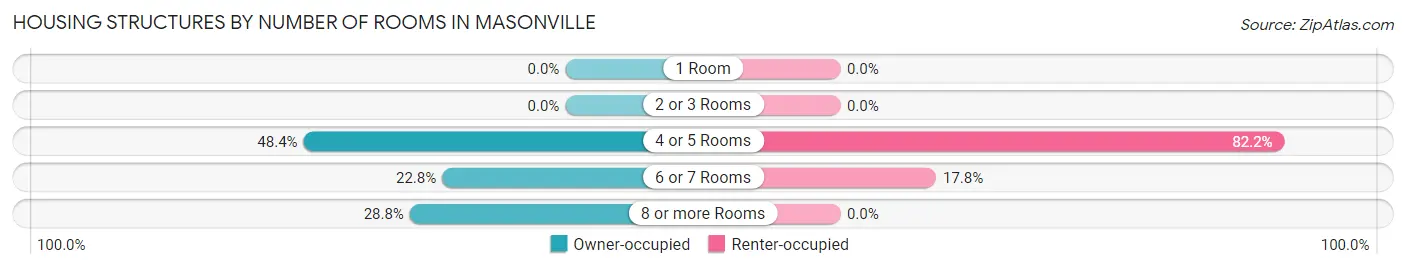
| Number of Rooms | Owner-occupied | Renter-occupied |
| 1 Room | 0 (0.0%) | 0 (0.0%) |
| 2 or 3 Rooms | 0 (0.0%) | 0 (0.0%) |
| 4 or 5 Rooms | 340 (48.4%) | 37 (82.2%) |
| 6 or 7 Rooms | 160 (22.8%) | 8 (17.8%) |
| 8 or more Rooms | 202 (28.8%) | 0 (0.0%) |
| Total | 702 (100.0%) | 45 (100.0%) |
Housing Structure by Heating Type in Masonville
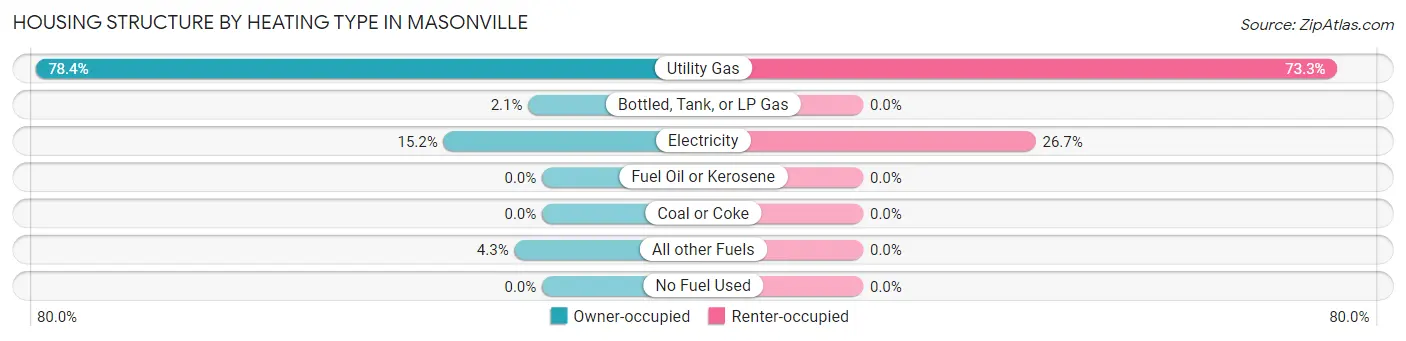
| Heating Type | Owner-occupied | Renter-occupied |
| Utility Gas | 550 (78.3%) | 33 (73.3%) |
| Bottled, Tank, or LP Gas | 15 (2.1%) | 0 (0.0%) |
| Electricity | 107 (15.2%) | 12 (26.7%) |
| Fuel Oil or Kerosene | 0 (0.0%) | 0 (0.0%) |
| Coal or Coke | 0 (0.0%) | 0 (0.0%) |
| All other Fuels | 30 (4.3%) | 0 (0.0%) |
| No Fuel Used | 0 (0.0%) | 0 (0.0%) |
| Total | 702 (100.0%) | 45 (100.0%) |
Household Vehicle Usage in Masonville
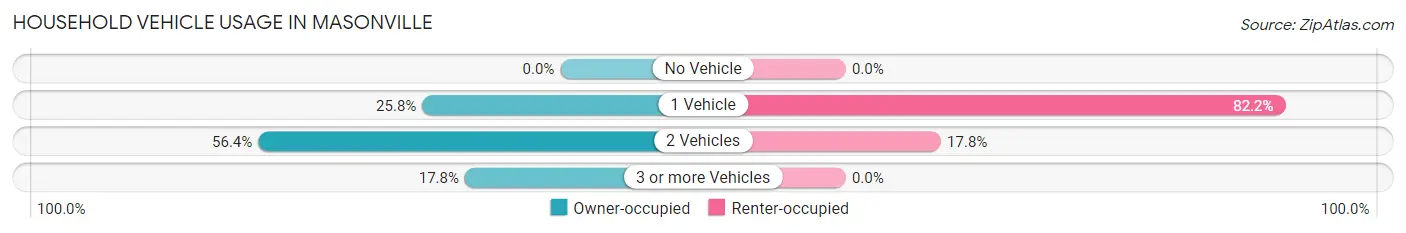
| Vehicles per Household | Owner-occupied | Renter-occupied |
| No Vehicle | 0 (0.0%) | 0 (0.0%) |
| 1 Vehicle | 181 (25.8%) | 37 (82.2%) |
| 2 Vehicles | 396 (56.4%) | 8 (17.8%) |
| 3 or more Vehicles | 125 (17.8%) | 0 (0.0%) |
| Total | 702 (100.0%) | 45 (100.0%) |
Real Estate & Mortgages in Masonville
Real Estate and Mortgage Overview in Masonville
| Characteristic | Without Mortgage | With Mortgage |
| Housing Units | 146 | 556 |
| Median Property Value | $155,800 | $218,500 |
| Median Household Income | $44,500 | $108 |
| Monthly Housing Costs | $477 | $0 |
| Real Estate Taxes | $2,000 | $0 |
Property Value by Mortgage Status in Masonville
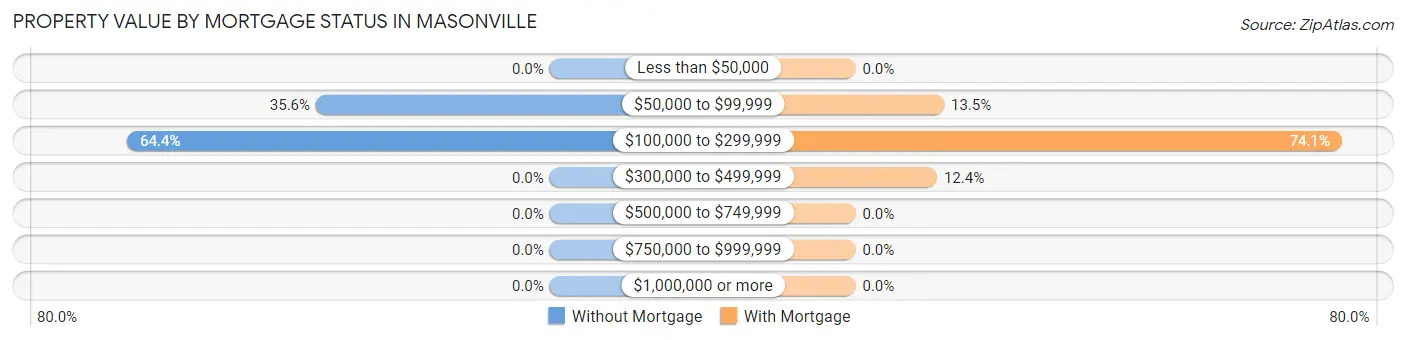
| Property Value | Without Mortgage | With Mortgage |
| Less than $50,000 | 0 (0.0%) | 0 (0.0%) |
| $50,000 to $99,999 | 52 (35.6%) | 75 (13.5%) |
| $100,000 to $299,999 | 94 (64.4%) | 412 (74.1%) |
| $300,000 to $499,999 | 0 (0.0%) | 69 (12.4%) |
| $500,000 to $749,999 | 0 (0.0%) | 0 (0.0%) |
| $750,000 to $999,999 | 0 (0.0%) | 0 (0.0%) |
| $1,000,000 or more | 0 (0.0%) | 0 (0.0%) |
| Total | 146 (100.0%) | 556 (100.0%) |
Household Income by Mortgage Status in Masonville
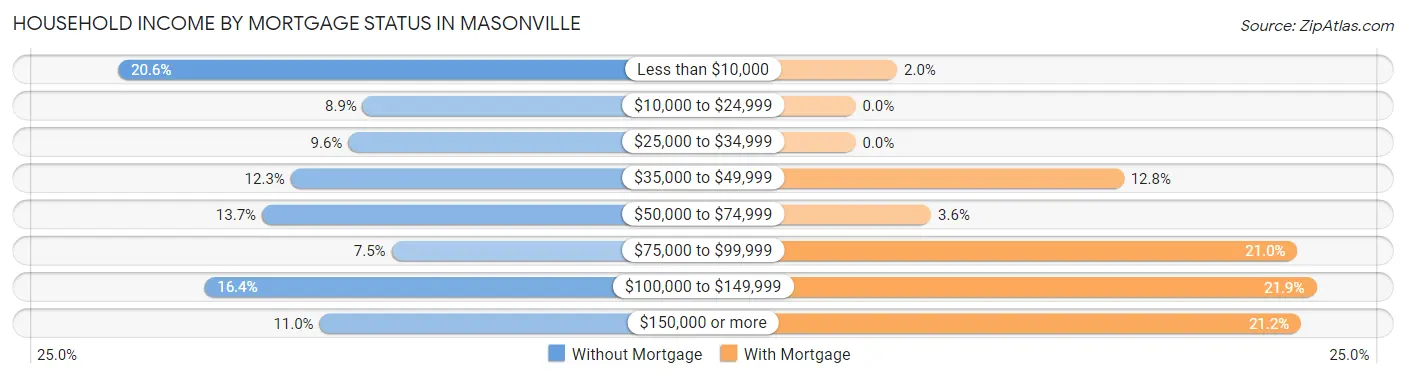
| Household Income | Without Mortgage | With Mortgage |
| Less than $10,000 | 30 (20.5%) | 11 (2.0%) |
| $10,000 to $24,999 | 13 (8.9%) | 0 (0.0%) |
| $25,000 to $34,999 | 14 (9.6%) | 0 (0.0%) |
| $35,000 to $49,999 | 18 (12.3%) | 71 (12.8%) |
| $50,000 to $74,999 | 20 (13.7%) | 20 (3.6%) |
| $75,000 to $99,999 | 11 (7.5%) | 117 (21.0%) |
| $100,000 to $149,999 | 24 (16.4%) | 122 (21.9%) |
| $150,000 or more | 16 (11.0%) | 118 (21.2%) |
| Total | 146 (100.0%) | 556 (100.0%) |
Property Value to Household Income Ratio in Masonville
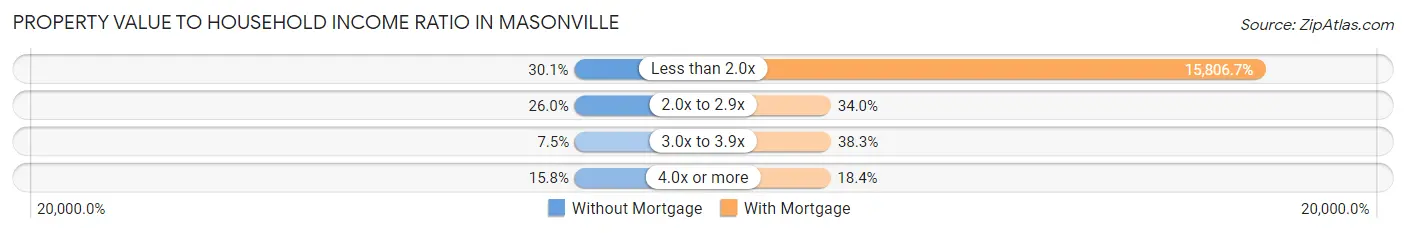
| Value-to-Income Ratio | Without Mortgage | With Mortgage |
| Less than 2.0x | 44 (30.1%) | 87,885 (15,806.6%) |
| 2.0x to 2.9x | 38 (26.0%) | 189 (34.0%) |
| 3.0x to 3.9x | 11 (7.5%) | 213 (38.3%) |
| 4.0x or more | 23 (15.8%) | 102 (18.3%) |
| Total | 146 (100.0%) | 556 (100.0%) |
Real Estate Taxes by Mortgage Status in Masonville
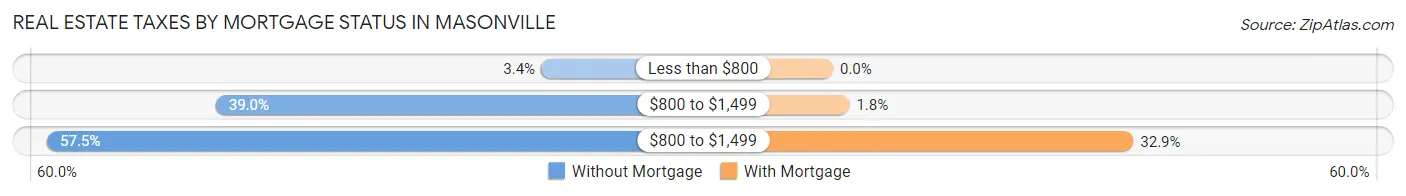
| Property Taxes | Without Mortgage | With Mortgage |
| Less than $800 | 5 (3.4%) | 0 (0.0%) |
| $800 to $1,499 | 57 (39.0%) | 10 (1.8%) |
| $800 to $1,499 | 84 (57.5%) | 183 (32.9%) |
| Total | 146 (100.0%) | 556 (100.0%) |
Health & Disability in Masonville
Health Insurance Coverage by Age in Masonville
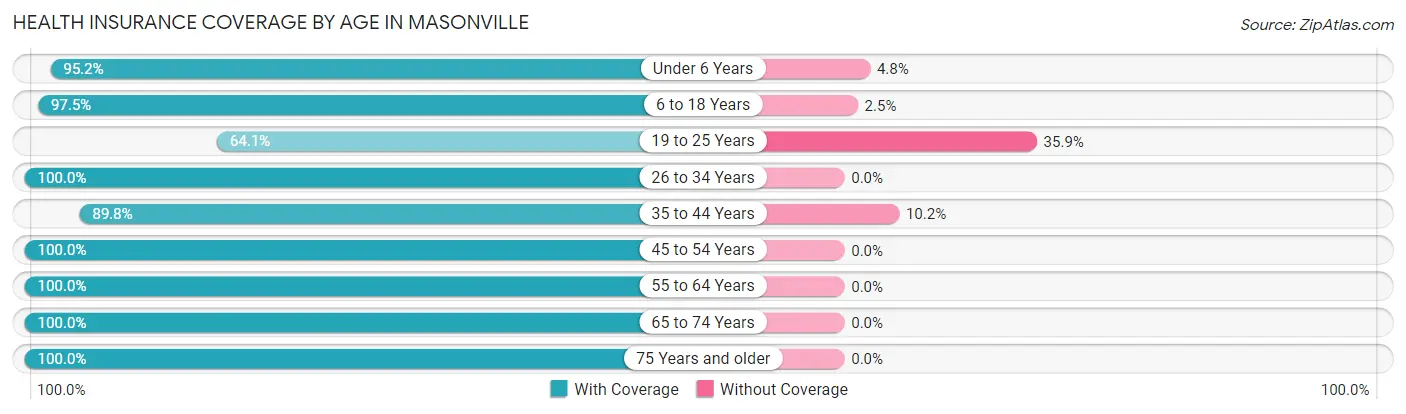
| Age Bracket | With Coverage | Without Coverage |
| Under 6 Years | 318 (95.2%) | 16 (4.8%) |
| 6 to 18 Years | 430 (97.5%) | 11 (2.5%) |
| 19 to 25 Years | 59 (64.1%) | 33 (35.9%) |
| 26 to 34 Years | 301 (100.0%) | 0 (0.0%) |
| 35 to 44 Years | 440 (89.8%) | 50 (10.2%) |
| 45 to 54 Years | 165 (100.0%) | 0 (0.0%) |
| 55 to 64 Years | 153 (100.0%) | 0 (0.0%) |
| 65 to 74 Years | 161 (100.0%) | 0 (0.0%) |
| 75 Years and older | 38 (100.0%) | 0 (0.0%) |
| Total | 2,065 (94.9%) | 110 (5.1%) |
Health Insurance Coverage by Citizenship Status in Masonville
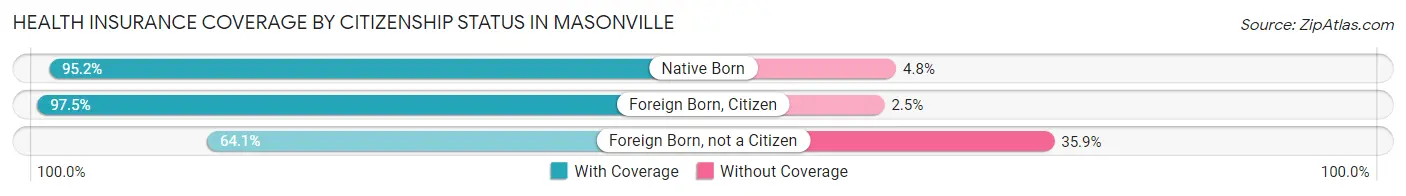
| Citizenship Status | With Coverage | Without Coverage |
| Native Born | 318 (95.2%) | 16 (4.8%) |
| Foreign Born, Citizen | 430 (97.5%) | 11 (2.5%) |
| Foreign Born, not a Citizen | 59 (64.1%) | 33 (35.9%) |
Health Insurance Coverage by Household Income in Masonville
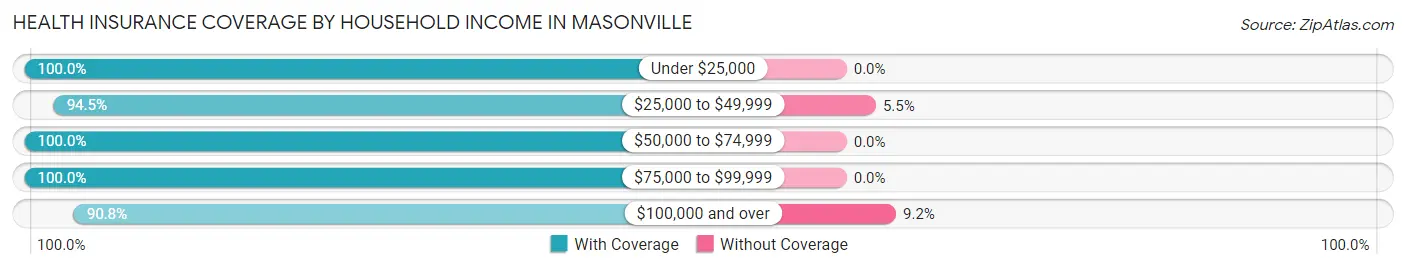
| Household Income | With Coverage | Without Coverage |
| Under $25,000 | 68 (100.0%) | 0 (0.0%) |
| $25,000 to $49,999 | 381 (94.5%) | 22 (5.5%) |
| $50,000 to $74,999 | 379 (100.0%) | 0 (0.0%) |
| $75,000 to $99,999 | 372 (100.0%) | 0 (0.0%) |
| $100,000 and over | 865 (90.8%) | 88 (9.2%) |
Public vs Private Health Insurance Coverage by Age in Masonville
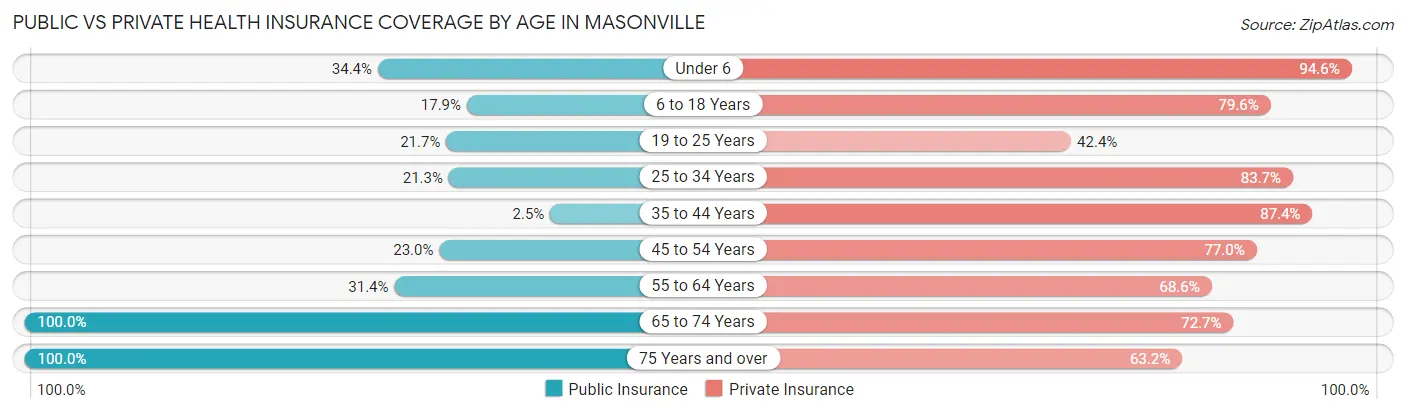
| Age Bracket | Public Insurance | Private Insurance |
| Under 6 | 115 (34.4%) | 316 (94.6%) |
| 6 to 18 Years | 79 (17.9%) | 351 (79.6%) |
| 19 to 25 Years | 20 (21.7%) | 39 (42.4%) |
| 25 to 34 Years | 64 (21.3%) | 252 (83.7%) |
| 35 to 44 Years | 12 (2.5%) | 428 (87.4%) |
| 45 to 54 Years | 38 (23.0%) | 127 (77.0%) |
| 55 to 64 Years | 48 (31.4%) | 105 (68.6%) |
| 65 to 74 Years | 161 (100.0%) | 117 (72.7%) |
| 75 Years and over | 38 (100.0%) | 24 (63.2%) |
| Total | 575 (26.4%) | 1,759 (80.9%) |
Disability Status by Sex by Age in Masonville
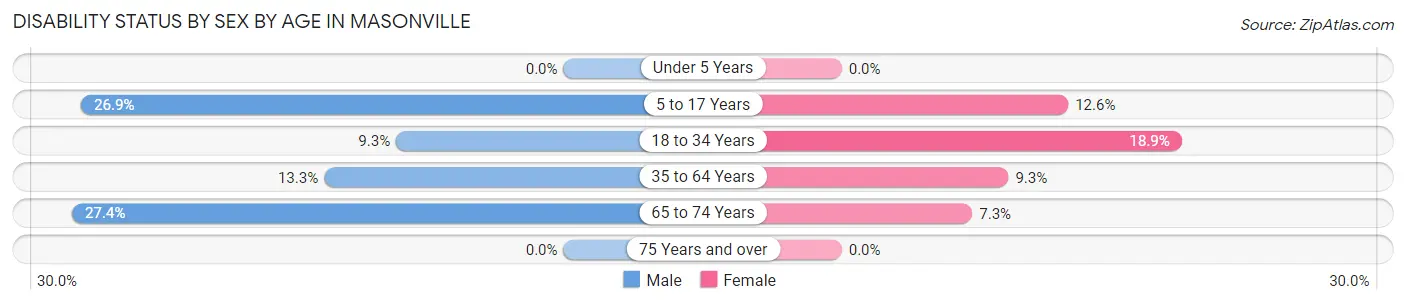
| Age Bracket | Male | Female |
| Under 5 Years | 0 (0.0%) | 0 (0.0%) |
| 5 to 17 Years | 80 (26.9%) | 28 (12.6%) |
| 18 to 34 Years | 15 (9.3%) | 49 (18.9%) |
| 35 to 64 Years | 56 (13.3%) | 36 (9.3%) |
| 65 to 74 Years | 29 (27.4%) | 4 (7.3%) |
| 75 Years and over | 0 (0.0%) | 0 (0.0%) |
Disability Class by Sex by Age in Masonville
Disability Class: Hearing Difficulty
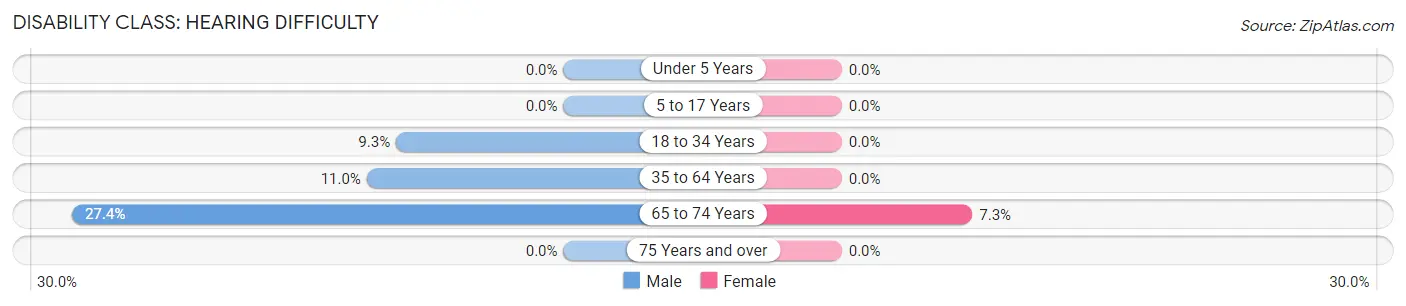
| Age Bracket | Male | Female |
| Under 5 Years | 0 (0.0%) | 0 (0.0%) |
| 5 to 17 Years | 0 (0.0%) | 0 (0.0%) |
| 18 to 34 Years | 15 (9.3%) | 0 (0.0%) |
| 35 to 64 Years | 46 (11.0%) | 0 (0.0%) |
| 65 to 74 Years | 29 (27.4%) | 4 (7.3%) |
| 75 Years and over | 0 (0.0%) | 0 (0.0%) |
Disability Class: Vision Difficulty
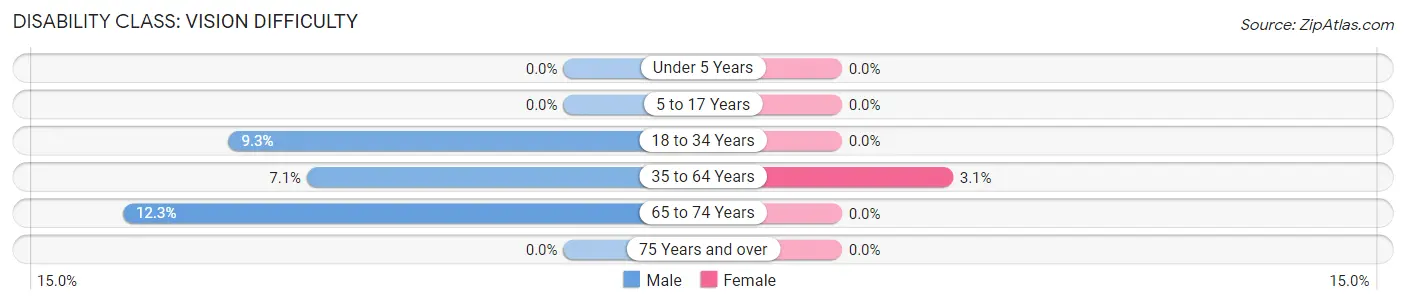
| Age Bracket | Male | Female |
| Under 5 Years | 0 (0.0%) | 0 (0.0%) |
| 5 to 17 Years | 0 (0.0%) | 0 (0.0%) |
| 18 to 34 Years | 15 (9.3%) | 0 (0.0%) |
| 35 to 64 Years | 30 (7.1%) | 12 (3.1%) |
| 65 to 74 Years | 13 (12.3%) | 0 (0.0%) |
| 75 Years and over | 0 (0.0%) | 0 (0.0%) |
Disability Class: Cognitive Difficulty
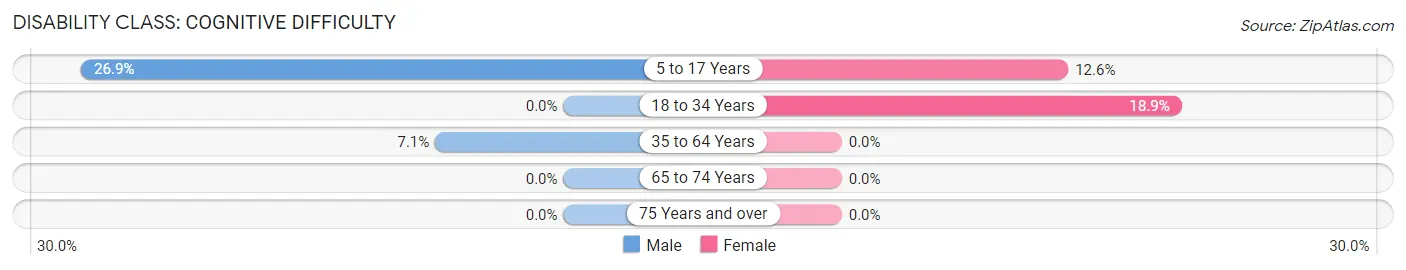
| Age Bracket | Male | Female |
| 5 to 17 Years | 80 (26.9%) | 28 (12.6%) |
| 18 to 34 Years | 0 (0.0%) | 49 (18.9%) |
| 35 to 64 Years | 30 (7.1%) | 0 (0.0%) |
| 65 to 74 Years | 0 (0.0%) | 0 (0.0%) |
| 75 Years and over | 0 (0.0%) | 0 (0.0%) |
Disability Class: Ambulatory Difficulty
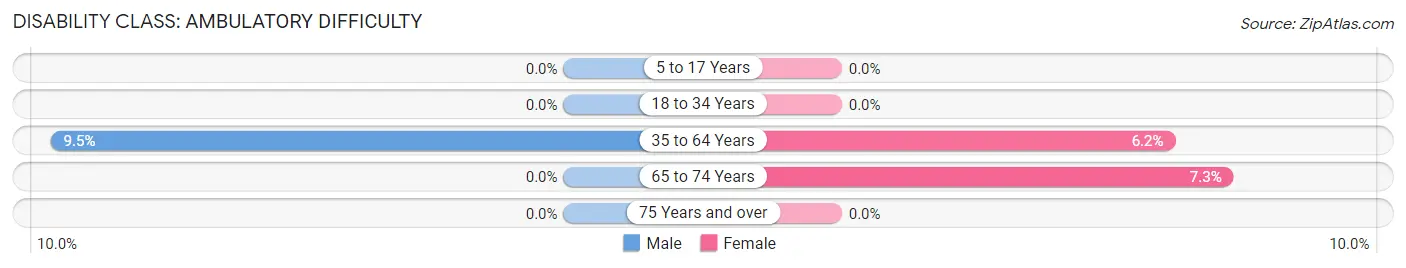
| Age Bracket | Male | Female |
| 5 to 17 Years | 0 (0.0%) | 0 (0.0%) |
| 18 to 34 Years | 0 (0.0%) | 0 (0.0%) |
| 35 to 64 Years | 40 (9.5%) | 24 (6.2%) |
| 65 to 74 Years | 0 (0.0%) | 4 (7.3%) |
| 75 Years and over | 0 (0.0%) | 0 (0.0%) |
Disability Class: Self-Care Difficulty
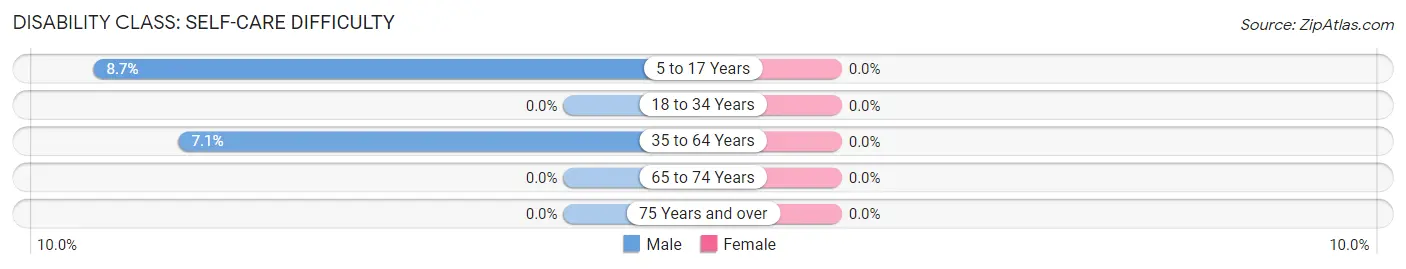
| Age Bracket | Male | Female |
| 5 to 17 Years | 26 (8.7%) | 0 (0.0%) |
| 18 to 34 Years | 0 (0.0%) | 0 (0.0%) |
| 35 to 64 Years | 30 (7.1%) | 0 (0.0%) |
| 65 to 74 Years | 0 (0.0%) | 0 (0.0%) |
| 75 Years and over | 0 (0.0%) | 0 (0.0%) |
Technology Access in Masonville
Computing Device Access in Masonville
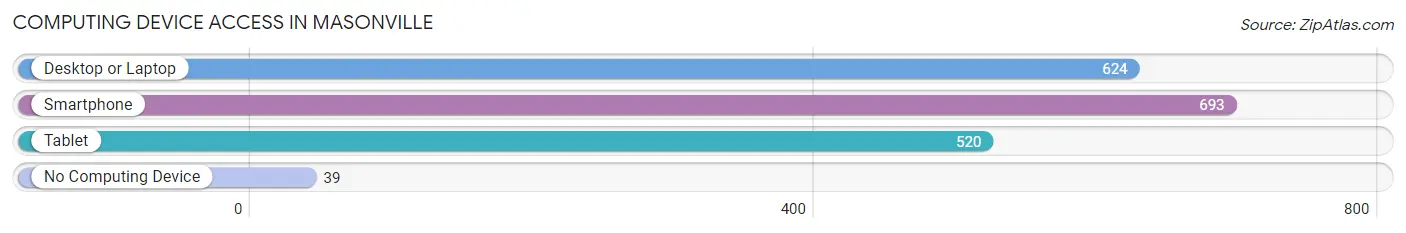
| Device Type | # Households | % Households |
| Desktop or Laptop | 624 | 83.5% |
| Smartphone | 693 | 92.8% |
| Tablet | 520 | 69.6% |
| No Computing Device | 39 | 5.2% |
| Total | 747 | 100.0% |
Internet Access in Masonville
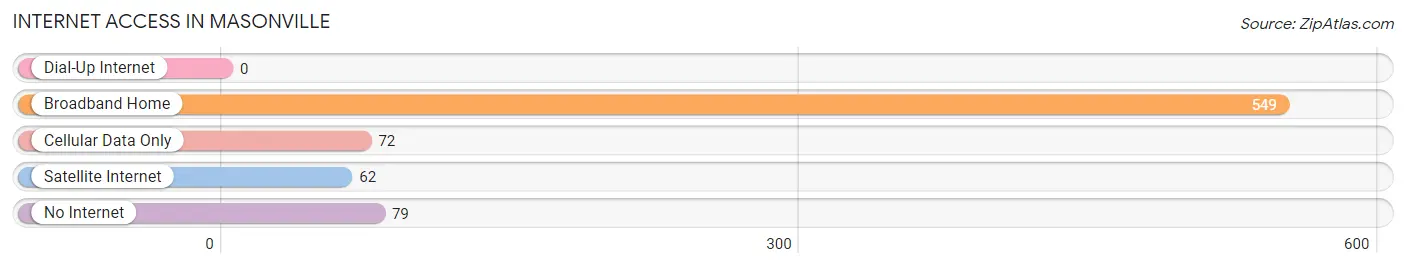
| Internet Type | # Households | % Households |
| Dial-Up Internet | 0 | 0.0% |
| Broadband Home | 549 | 73.5% |
| Cellular Data Only | 72 | 9.6% |
| Satellite Internet | 62 | 8.3% |
| No Internet | 79 | 10.6% |
| Total | 747 | 100.0% |
Masonville Summary
Masonville is a small unincorporated community located in the western part of Livingston County, Kentucky. It is situated along the banks of the Green River, approximately 10 miles south of the county seat of Smithland. The population of Masonville was estimated to be around 200 people in 2020.
History
Masonville was first settled in the early 1800s by a group of settlers from Mason County, Virginia. The town was named after the county in which the settlers had come from. The town was originally known as Masonville Station, as it was a stop on the Louisville and Nashville Railroad. The railroad was built in the late 1800s and ran through the town until the early 1900s.
The town was also home to a post office, which was established in 1883. The post office was closed in the early 1900s, but the town still retains its name.
Geography
Masonville is located in western Livingston County, Kentucky. It is situated along the banks of the Green River, approximately 10 miles south of the county seat of Smithland. The town is located in a rural area, with the nearest major city being Paducah, which is located about 40 miles to the west.
The town is located in a hilly area, with the highest point being around 500 feet above sea level. The town is surrounded by farmland and wooded areas, with the nearest major body of water being the Green River.
Economy
Masonville is a small, rural community with a limited economy. The town is home to a few small businesses, including a convenience store, a gas station, and a few restaurants. The town also has a few small manufacturing businesses, such as a furniture factory and a woodworking shop.
The town is also home to a few farms, which produce a variety of crops, including corn, soybeans, and wheat. The town also has a few small businesses that provide services, such as auto repair and lawn care.
Demographics
Masonville is a small, rural community with a population of around 200 people. The town is predominantly white, with the majority of the population being of European descent. The town also has a small African American population, as well as a few Hispanic and Asian residents.
The town has a median household income of around $30,000, which is slightly lower than the national average. The town also has a higher than average poverty rate, with around 20% of the population living below the poverty line.
Conclusion
Masonville is a small, rural community located in western Livingston County, Kentucky. The town was first settled in the early 1800s by a group of settlers from Mason County, Virginia. The town is home to a few small businesses, as well as a few farms and manufacturing businesses. The population of Masonville is around 200 people, with the majority of the population being of European descent. The town has a median household income of around $30,000, and a higher than average poverty rate.
Common Questions
What is Per Capita Income in Masonville?
Per Capita income in Masonville is $33,531.
What is the Median Family Income in Masonville?
Median Family Income in Masonville is $86,552.
What is the Median Household income in Masonville?
Median Household Income in Masonville is $85,194.
What is Income or Wage Gap in Masonville?
Income or Wage Gap in Masonville is 24.6%.
Women in Masonville earn 75.4 cents for every dollar earned by a man.
What is Inequality or Gini Index in Masonville?
Inequality or Gini Index in Masonville is 0.39.
What is the Total Population of Masonville?
Total Population of Masonville is 2,175.
What is the Total Male Population of Masonville?
Total Male Population of Masonville is 1,047.
What is the Total Female Population of Masonville?
Total Female Population of Masonville is 1,128.
What is the Ratio of Males per 100 Females in Masonville?
There are 92.82 Males per 100 Females in Masonville.
What is the Ratio of Females per 100 Males in Masonville?
There are 107.74 Females per 100 Males in Masonville.
What is the Median Population Age in Masonville?
Median Population Age in Masonville is 32.4 Years.
What is the Average Family Size in Masonville
Average Family Size in Masonville is 3.2 People.
What is the Average Household Size in Masonville
Average Household Size in Masonville is 2.9 People.
How Large is the Labor Force in Masonville?
There are 1,106 People in the Labor Forcein in Masonville.
What is the Percentage of People in the Labor Force in Masonville?
76.9% of People are in the Labor Force in Masonville.
What is the Unemployment Rate in Masonville?
Unemployment Rate in Masonville is 3.6%.