Wayland, KY Map & Demographics
Wayland Map
Wayland Overview
$18,610
PER CAPITA INCOME
$43,750
AVG FAMILY INCOME
$31,667
AVG HOUSEHOLD INCOME
11.1%
WAGE / INCOME GAP [ % ]
88.9¢/ $1
WAGE / INCOME GAP [ $ ]
$13,009
FAMILY INCOME DEFICIT
0.50
INEQUALITY / GINI INDEX
329
TOTAL POPULATION
178
MALE POPULATION
151
FEMALE POPULATION
117.88
MALES / 100 FEMALES
84.83
FEMALES / 100 MALES
34.2
MEDIAN AGE
3.5
AVG FAMILY SIZE
2.9
AVG HOUSEHOLD SIZE
118
LABOR FORCE [ PEOPLE ]
46.1%
PERCENT IN LABOR FORCE
8.5%
UNEMPLOYMENT RATE
Wayland Zip Codes
Wayland Area Codes
Income in Wayland
Income Overview in Wayland
Per Capita Income in Wayland is $18,610, while median incomes of families and households are $43,750 and $31,667 respectively.
| Characteristic | Number | Measure |
| Per Capita Income | 329 | $18,610 |
| Median Family Income | 71 | $43,750 |
| Mean Family Income | 71 | $63,013 |
| Median Household Income | 112 | $31,667 |
| Mean Household Income | 112 | $52,902 |
| Income Deficit | 71 | $13,009 |
| Wage / Income Gap (%) | 329 | 11.13% |
| Wage / Income Gap ($) | 329 | 88.87¢ per $1 |
| Gini / Inequality Index | 329 | 0.50 |
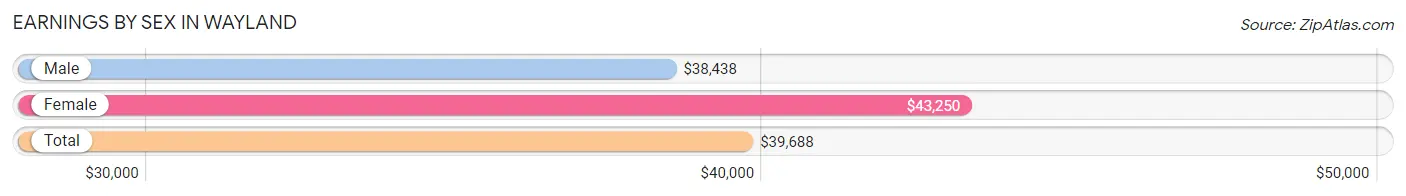
Earnings by Sex in Wayland
Average Earnings in Wayland are $39,688, $38,438 for men and $43,250 for women, a difference of 11.1%.
| Sex | Number | Average Earnings |
| Male | 72 (64.9%) | $38,438 |
| Female | 39 (35.1%) | $43,250 |
| Total | 111 (100.0%) | $39,688 |
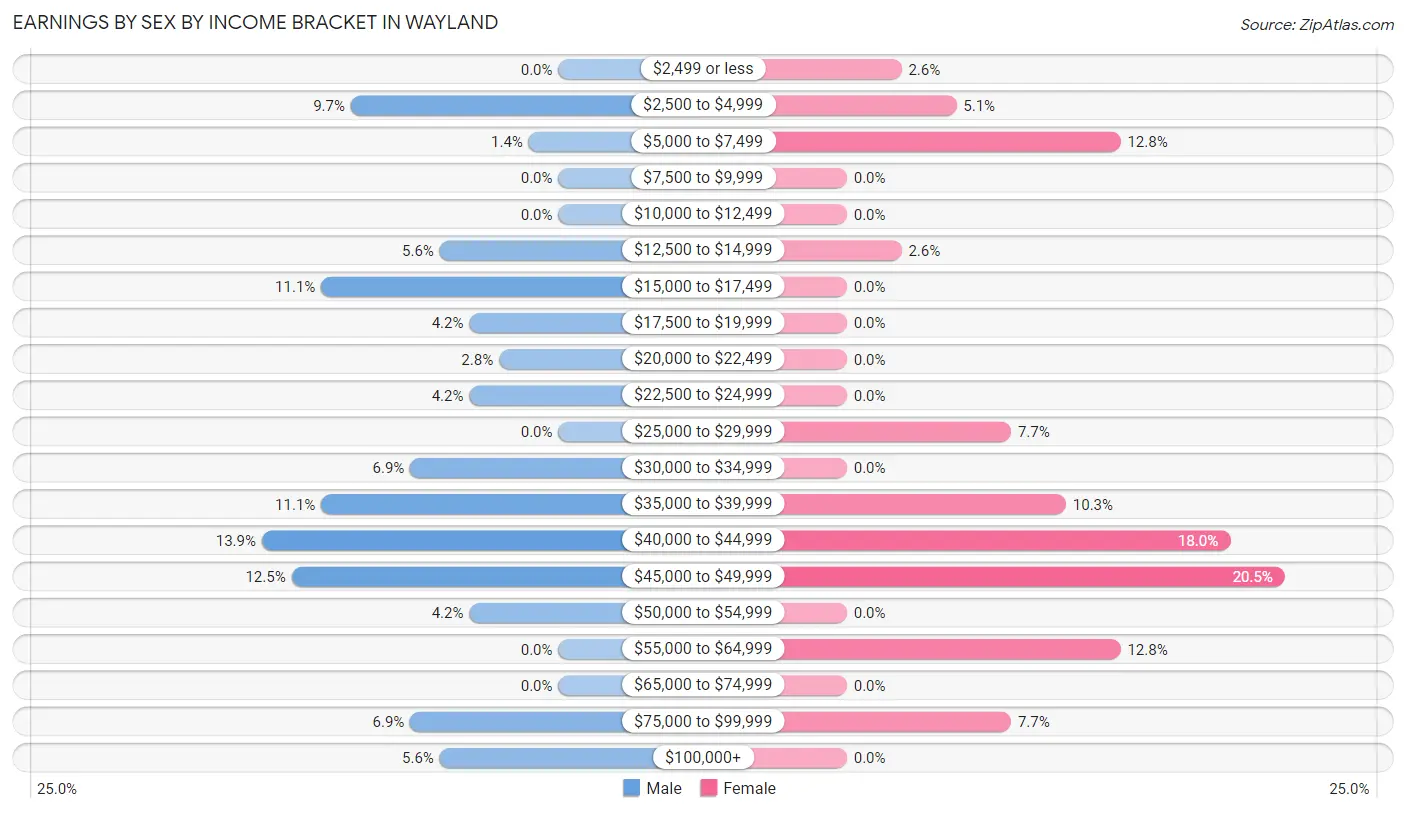
Earnings by Sex by Income Bracket in Wayland
The most common earnings brackets in Wayland are $40,000 to $44,999 for men (10 | 13.9%) and $45,000 to $49,999 for women (8 | 20.5%).
| Income | Male | Female |
| $2,499 or less | 0 (0.0%) | 1 (2.6%) |
| $2,500 to $4,999 | 7 (9.7%) | 2 (5.1%) |
| $5,000 to $7,499 | 1 (1.4%) | 5 (12.8%) |
| $7,500 to $9,999 | 0 (0.0%) | 0 (0.0%) |
| $10,000 to $12,499 | 0 (0.0%) | 0 (0.0%) |
| $12,500 to $14,999 | 4 (5.6%) | 1 (2.6%) |
| $15,000 to $17,499 | 8 (11.1%) | 0 (0.0%) |
| $17,500 to $19,999 | 3 (4.2%) | 0 (0.0%) |
| $20,000 to $22,499 | 2 (2.8%) | 0 (0.0%) |
| $22,500 to $24,999 | 3 (4.2%) | 0 (0.0%) |
| $25,000 to $29,999 | 0 (0.0%) | 3 (7.7%) |
| $30,000 to $34,999 | 5 (6.9%) | 0 (0.0%) |
| $35,000 to $39,999 | 8 (11.1%) | 4 (10.3%) |
| $40,000 to $44,999 | 10 (13.9%) | 7 (17.9%) |
| $45,000 to $49,999 | 9 (12.5%) | 8 (20.5%) |
| $50,000 to $54,999 | 3 (4.2%) | 0 (0.0%) |
| $55,000 to $64,999 | 0 (0.0%) | 5 (12.8%) |
| $65,000 to $74,999 | 0 (0.0%) | 0 (0.0%) |
| $75,000 to $99,999 | 5 (6.9%) | 3 (7.7%) |
| $100,000+ | 4 (5.6%) | 0 (0.0%) |
| Total | 72 (100.0%) | 39 (100.0%) |
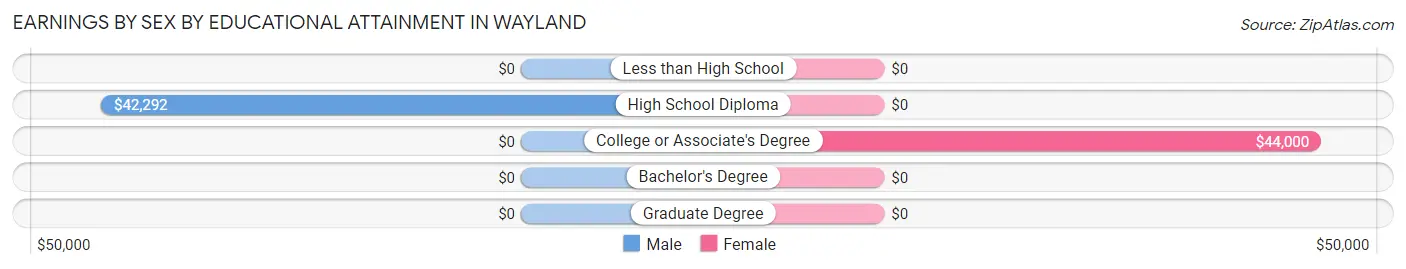
Earnings by Sex by Educational Attainment in Wayland
Average earnings in Wayland are $39,844 for men and $44,000 for women, a difference of 9.5%. Men with an educational attainment of high school diploma enjoy the highest average annual earnings of $42,292, while those with high school diploma education earn the least with $42,292. Women with an educational attainment of college or associate's degree earn the most with the average annual earnings of $44,000, while those with college or associate's degree education have the smallest earnings of $44,000.
| Educational Attainment | Male Income | Female Income |
| Less than High School | - | - |
| High School Diploma | $42,292 | $0 |
| College or Associate's Degree | - | - |
| Bachelor's Degree | - | - |
| Graduate Degree | - | - |
| Total | $39,844 | $44,000 |
Family Income in Wayland
Family Income Brackets in Wayland
According to the Wayland family income data, there are 13 families falling into the $50,000 to $74,999 income range, which is the most common income bracket and makes up 18.3% of all families. Conversely, the $200,000+ income bracket is the least frequent group with only 1 families (1.4%) belonging to this category.
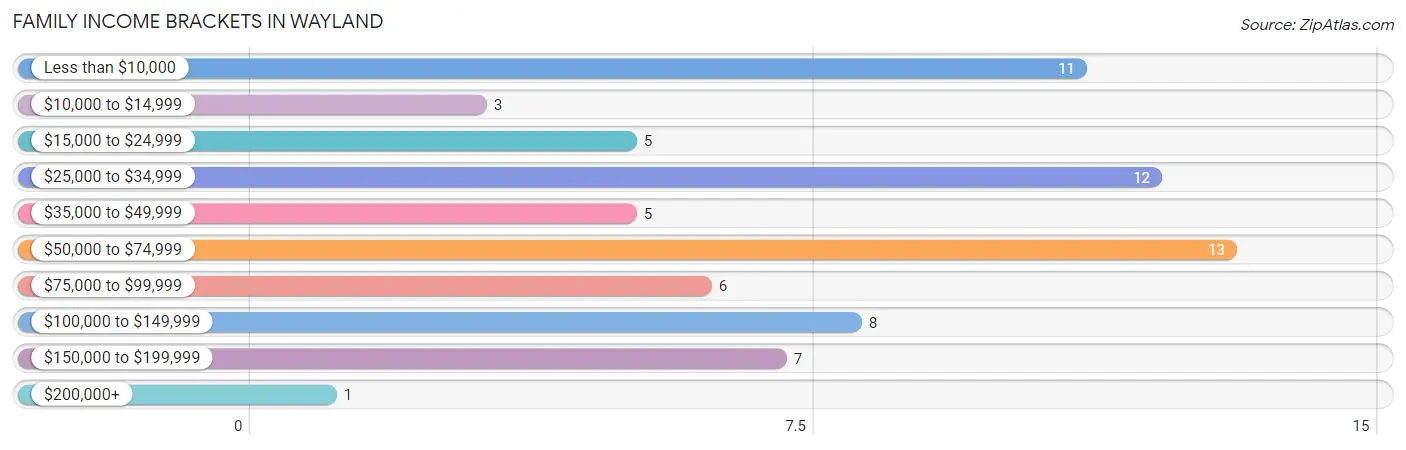
| Income Bracket | # Families | % Families |
| Less than $10,000 | 11 | 15.5% |
| $10,000 to $14,999 | 3 | 4.2% |
| $15,000 to $24,999 | 5 | 7.0% |
| $25,000 to $34,999 | 12 | 16.9% |
| $35,000 to $49,999 | 5 | 7.0% |
| $50,000 to $74,999 | 13 | 18.3% |
| $75,000 to $99,999 | 6 | 8.5% |
| $100,000 to $149,999 | 8 | 11.3% |
| $150,000 to $199,999 | 7 | 9.9% |
| $200,000+ | 1 | 1.4% |
Family Income by Famaliy Size in Wayland
3-person families (25 | 35.2%) account for the highest median family income in Wayland with $63,906 per family, while 3-person families (25 | 35.2%) have the highest median income of $21,302 per family member.
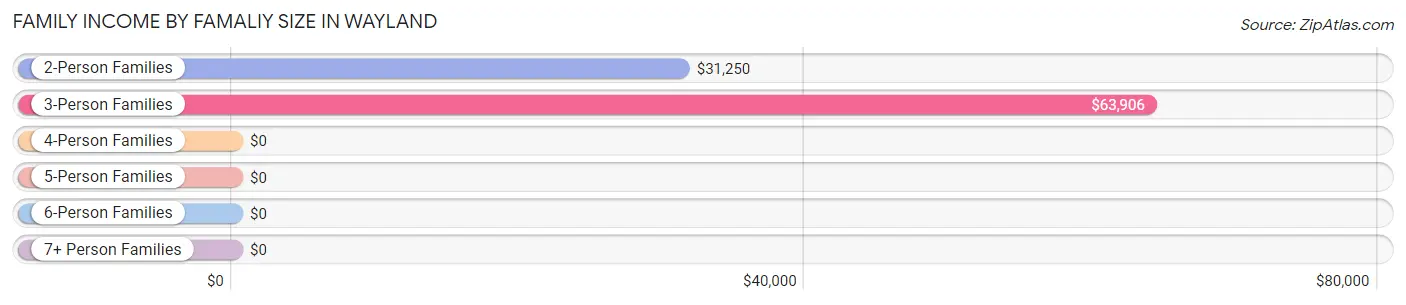
| Income Bracket | # Families | Median Income |
| 2-Person Families | 24 (33.8%) | $31,250 |
| 3-Person Families | 25 (35.2%) | $63,906 |
| 4-Person Families | 6 (8.5%) | $0 |
| 5-Person Families | 13 (18.3%) | $0 |
| 6-Person Families | 3 (4.2%) | $0 |
| 7+ Person Families | 0 (0.0%) | $0 |
| Total | 71 (100.0%) | $43,750 |
Family Income by Number of Earners in Wayland
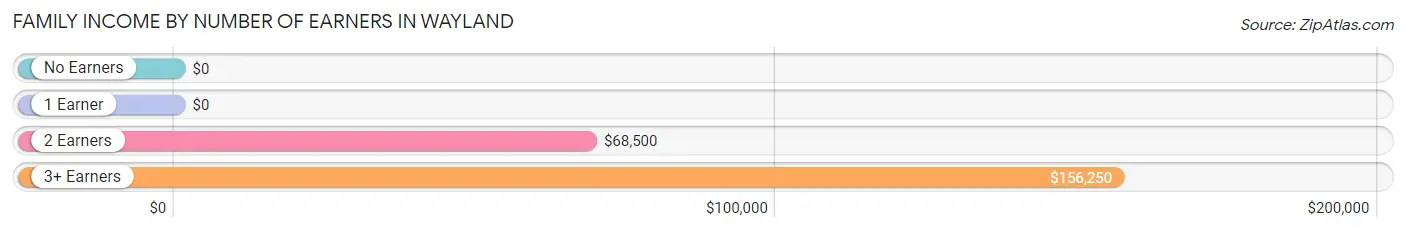
| Number of Earners | # Families | Median Income |
| No Earners | 27 (38.0%) | $0 |
| 1 Earner | 14 (19.7%) | $0 |
| 2 Earners | 22 (31.0%) | $68,500 |
| 3+ Earners | 8 (11.3%) | $156,250 |
| Total | 71 (100.0%) | $43,750 |
Household Income in Wayland
Household Income Brackets in Wayland
With 18 households falling in the category, the $25,000 to $34,999 income range is the most frequent in Wayland, accounting for 16.1% of all households. In contrast, only 1 households (0.9%) fall into the $200,000+ income bracket, making it the least populous group.
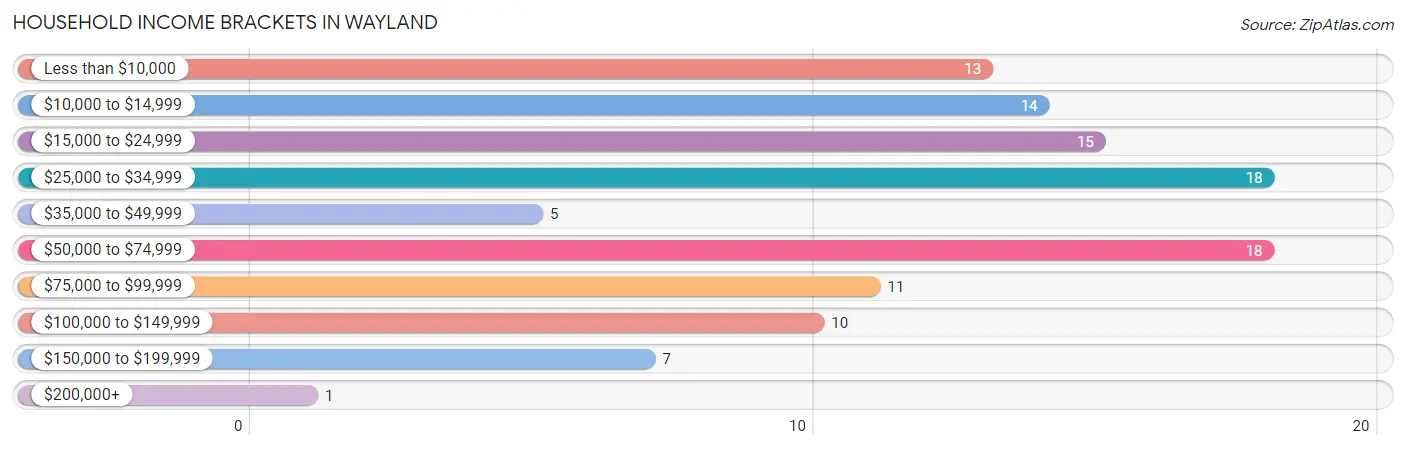
| Income Bracket | # Households | % Households |
| Less than $10,000 | 13 | 11.6% |
| $10,000 to $14,999 | 14 | 12.5% |
| $15,000 to $24,999 | 15 | 13.4% |
| $25,000 to $34,999 | 18 | 16.1% |
| $35,000 to $49,999 | 5 | 4.5% |
| $50,000 to $74,999 | 18 | 16.1% |
| $75,000 to $99,999 | 11 | 9.8% |
| $100,000 to $149,999 | 10 | 8.9% |
| $150,000 to $199,999 | 7 | 6.3% |
| $200,000+ | 1 | 0.9% |
Household Income by Householder Age in Wayland
The median household income in Wayland is $31,667, with the highest median household income of $51,750 found in the 25 to 44 years age bracket for the primary householder. A total of 37 households (33.0%) fall into this category. Meanwhile, the 15 to 24 years age bracket for the primary householder has the lowest median household income of $0, with 5 households (4.5%) in this group.
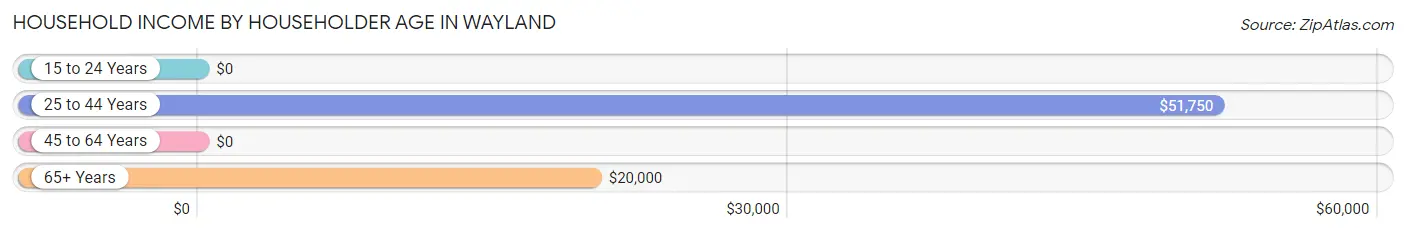
| Income Bracket | # Households | Median Income |
| 15 to 24 Years | 5 (4.5%) | $0 |
| 25 to 44 Years | 37 (33.0%) | $51,750 |
| 45 to 64 Years | 38 (33.9%) | $0 |
| 65+ Years | 32 (28.6%) | $20,000 |
| Total | 112 (100.0%) | $31,667 |
Poverty in Wayland
Income Below Poverty by Sex and Age in Wayland
With 36.7% poverty level for males and 49.7% for females among the residents of Wayland, 16 and 17 year old males and 6 to 11 year old females are the most vulnerable to poverty, with 5 males (71.4%) and 8 females (100.0%) in their respective age groups living below the poverty level.
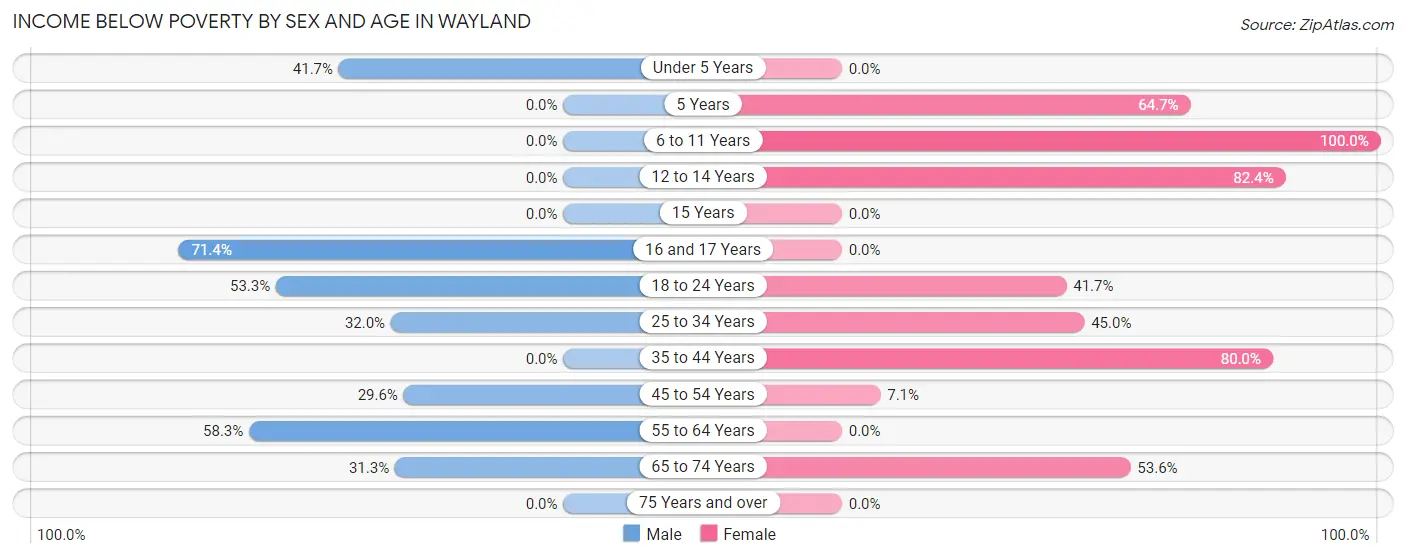
| Age Bracket | Male | Female |
| Under 5 Years | 5 (41.7%) | 0 (0.0%) |
| 5 Years | 0 (0.0%) | 11 (64.7%) |
| 6 to 11 Years | 0 (0.0%) | 8 (100.0%) |
| 12 to 14 Years | 0 (0.0%) | 14 (82.4%) |
| 15 Years | 0 (0.0%) | 0 (0.0%) |
| 16 and 17 Years | 5 (71.4%) | 0 (0.0%) |
| 18 to 24 Years | 16 (53.3%) | 5 (41.7%) |
| 25 to 34 Years | 8 (32.0%) | 9 (45.0%) |
| 35 to 44 Years | 0 (0.0%) | 12 (80.0%) |
| 45 to 54 Years | 8 (29.6%) | 1 (7.1%) |
| 55 to 64 Years | 14 (58.3%) | 0 (0.0%) |
| 65 to 74 Years | 5 (31.2%) | 15 (53.6%) |
| 75 Years and over | 0 (0.0%) | 0 (0.0%) |
| Total | 61 (36.7%) | 75 (49.7%) |
Income Above Poverty by Sex and Age in Wayland
According to the poverty statistics in Wayland, males aged 6 to 11 years and females aged under 5 years are the age groups that are most secure financially, with 100.0% of males and 100.0% of females in these age groups living above the poverty line.
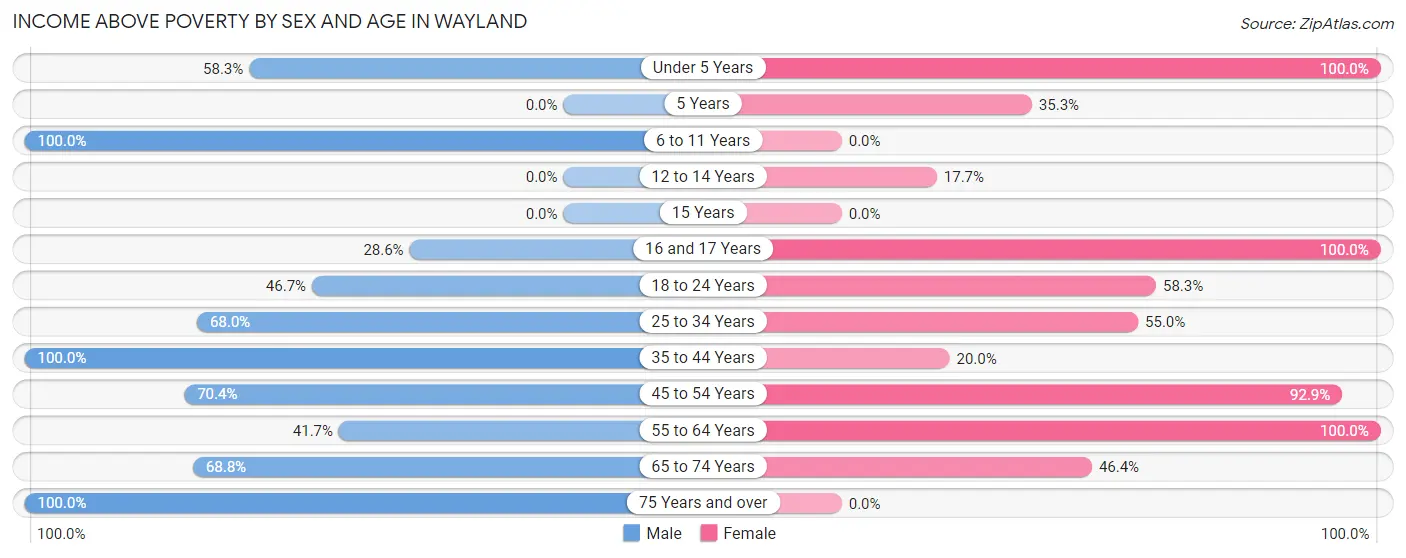
| Age Bracket | Male | Female |
| Under 5 Years | 7 (58.3%) | 4 (100.0%) |
| 5 Years | 0 (0.0%) | 6 (35.3%) |
| 6 to 11 Years | 3 (100.0%) | 0 (0.0%) |
| 12 to 14 Years | 0 (0.0%) | 3 (17.6%) |
| 15 Years | 0 (0.0%) | 0 (0.0%) |
| 16 and 17 Years | 2 (28.6%) | 6 (100.0%) |
| 18 to 24 Years | 14 (46.7%) | 7 (58.3%) |
| 25 to 34 Years | 17 (68.0%) | 11 (55.0%) |
| 35 to 44 Years | 19 (100.0%) | 3 (20.0%) |
| 45 to 54 Years | 19 (70.4%) | 13 (92.9%) |
| 55 to 64 Years | 10 (41.7%) | 10 (100.0%) |
| 65 to 74 Years | 11 (68.8%) | 13 (46.4%) |
| 75 Years and over | 3 (100.0%) | 0 (0.0%) |
| Total | 105 (63.2%) | 76 (50.3%) |
Income Below Poverty Among Married-Couple Families in Wayland
The poverty statistics for married-couple families in Wayland show that 21.1% or 11 of the total 52 families live below the poverty line. Families with 1 or 2 children have the highest poverty rate of 26.7%, comprising of 8 families. On the other hand, families with no children have the lowest poverty rate of 13.6%, which includes 3 families.
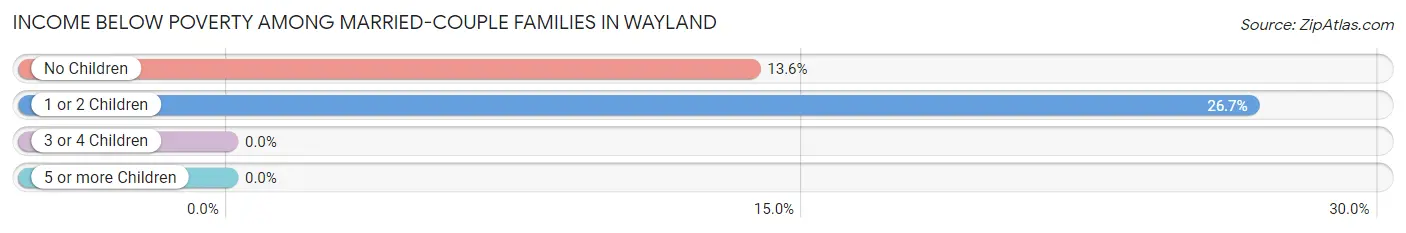
| Children | Above Poverty | Below Poverty |
| No Children | 19 (86.4%) | 3 (13.6%) |
| 1 or 2 Children | 22 (73.3%) | 8 (26.7%) |
| 3 or 4 Children | 0 (0.0%) | 0 (0.0%) |
| 5 or more Children | 0 (0.0%) | 0 (0.0%) |
| Total | 41 (78.8%) | 11 (21.1%) |
Income Below Poverty Among Single-Parent Households in Wayland
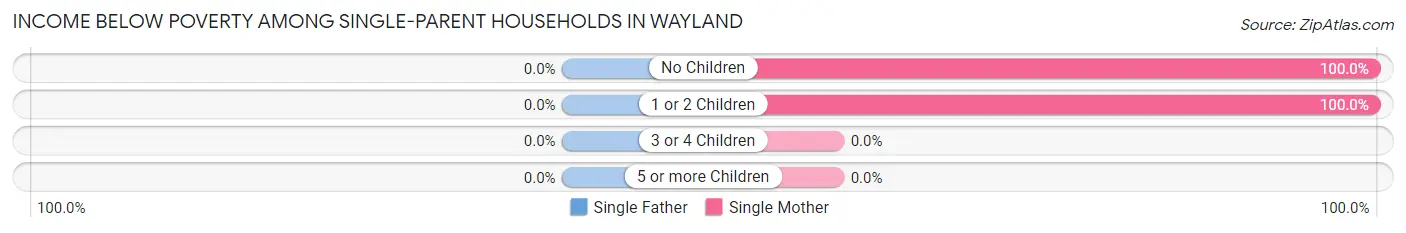
| Children | Single Father | Single Mother |
| No Children | 0 (0.0%) | 5 (100.0%) |
| 1 or 2 Children | 0 (0.0%) | 7 (100.0%) |
| 3 or 4 Children | 0 (0.0%) | 0 (0.0%) |
| 5 or more Children | 0 (0.0%) | 0 (0.0%) |
| Total | 0 (0.0%) | 12 (100.0%) |
Income Below Poverty Among Married-Couple vs Single-Parent Households in Wayland
The poverty data for Wayland shows that 11 of the married-couple family households (21.1%) and 12 of the single-parent households (63.2%) are living below the poverty level. Within the married-couple family households, those with 1 or 2 children have the highest poverty rate, with 8 households (26.7%) falling below the poverty line. Among the single-parent households, those with 1 or 2 children have the highest poverty rate, with 7 household (100.0%) living below poverty.
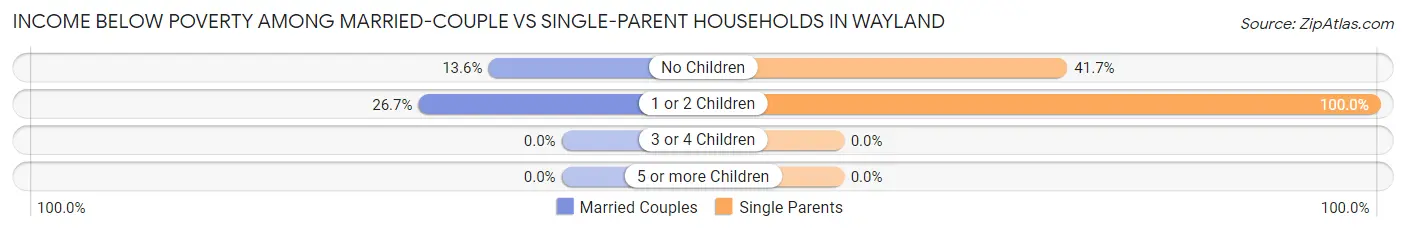
| Children | Married-Couple Families | Single-Parent Households |
| No Children | 3 (13.6%) | 5 (41.7%) |
| 1 or 2 Children | 8 (26.7%) | 7 (100.0%) |
| 3 or 4 Children | 0 (0.0%) | 0 (0.0%) |
| 5 or more Children | 0 (0.0%) | 0 (0.0%) |
| Total | 11 (21.1%) | 12 (63.2%) |
Race in Wayland
The most populous races in Wayland are White / Caucasian (321 | 97.6%), Hispanic or Latino (5 | 1.5%), and Two or more Races (5 | 1.5%).
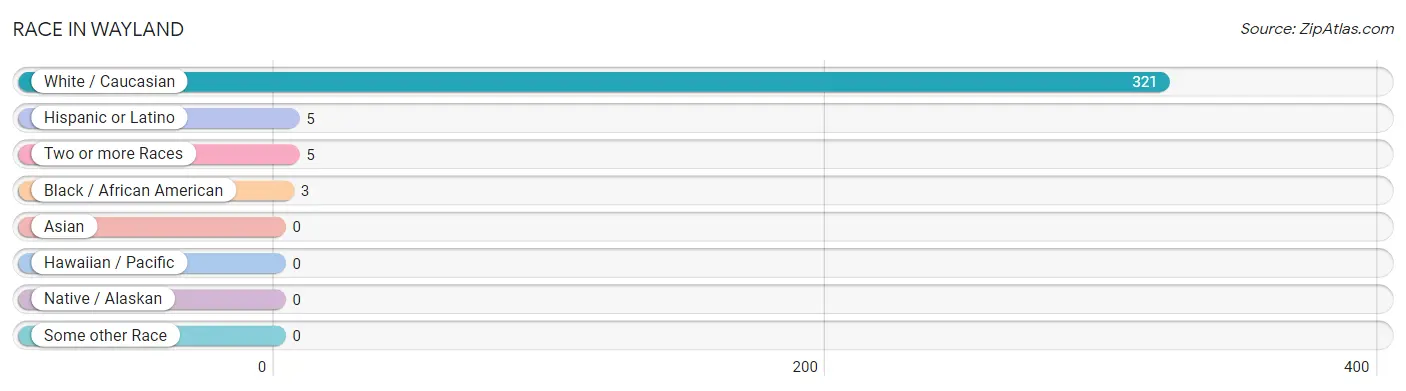
| Race | # Population | % Population |
| Asian | 0 | 0.0% |
| Black / African American | 3 | 0.9% |
| Hawaiian / Pacific | 0 | 0.0% |
| Hispanic or Latino | 5 | 1.5% |
| Native / Alaskan | 0 | 0.0% |
| White / Caucasian | 321 | 97.6% |
| Two or more Races | 5 | 1.5% |
| Some other Race | 0 | 0.0% |
| Total | 329 | 100.0% |
Ancestry in Wayland
The most populous ancestries reported in Wayland are American (57 | 17.3%), English (26 | 7.9%), Irish (25 | 7.6%), British (11 | 3.3%), and German (7 | 2.1%), together accounting for 38.3% of all Wayland residents.
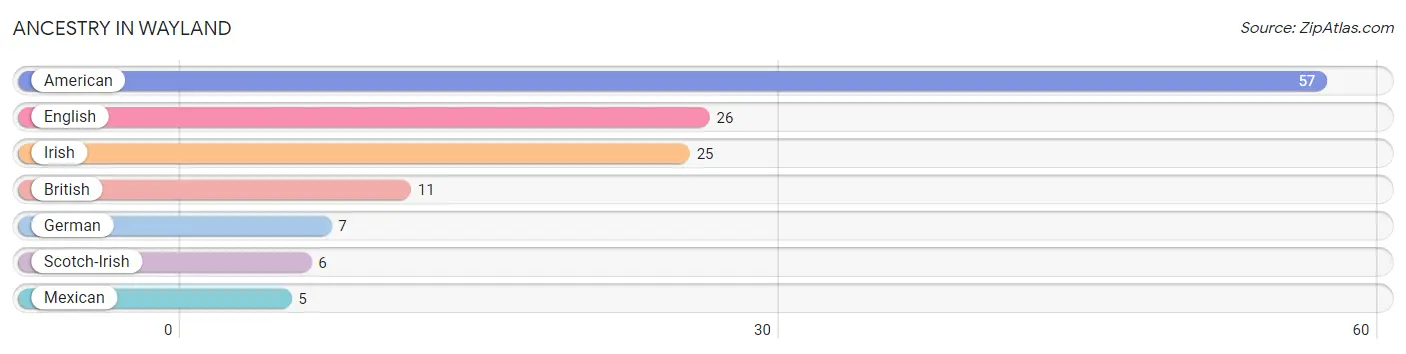
| Ancestry | # Population | % Population |
| American | 57 | 17.3% |
| British | 11 | 3.3% |
| English | 26 | 7.9% |
| German | 7 | 2.1% |
| Irish | 25 | 7.6% |
| Mexican | 5 | 1.5% |
| Scotch-Irish | 6 | 1.8% | View All 7 Rows |
Immigrants in Wayland

| Immigration Origin | # Population | % Population | View All 0 Rows |
Sex and Age in Wayland
Sex and Age in Wayland
The most populous age groups in Wayland are Under 5 Years (20 | 11.2%) for men and 5 to 9 Years (25 | 16.6%) for women.
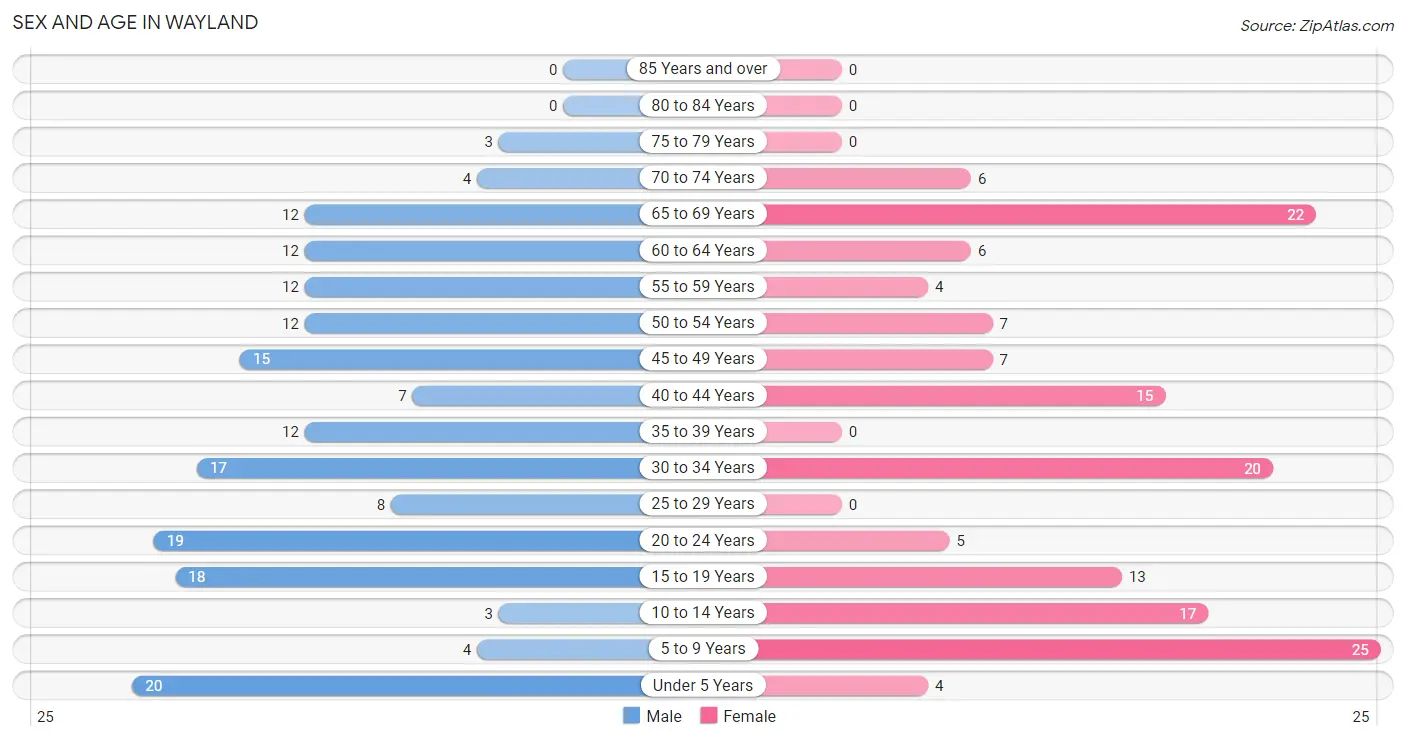
| Age Bracket | Male | Female |
| Under 5 Years | 20 (11.2%) | 4 (2.6%) |
| 5 to 9 Years | 4 (2.2%) | 25 (16.6%) |
| 10 to 14 Years | 3 (1.7%) | 17 (11.3%) |
| 15 to 19 Years | 18 (10.1%) | 13 (8.6%) |
| 20 to 24 Years | 19 (10.7%) | 5 (3.3%) |
| 25 to 29 Years | 8 (4.5%) | 0 (0.0%) |
| 30 to 34 Years | 17 (9.6%) | 20 (13.3%) |
| 35 to 39 Years | 12 (6.7%) | 0 (0.0%) |
| 40 to 44 Years | 7 (3.9%) | 15 (9.9%) |
| 45 to 49 Years | 15 (8.4%) | 7 (4.6%) |
| 50 to 54 Years | 12 (6.7%) | 7 (4.6%) |
| 55 to 59 Years | 12 (6.7%) | 4 (2.6%) |
| 60 to 64 Years | 12 (6.7%) | 6 (4.0%) |
| 65 to 69 Years | 12 (6.7%) | 22 (14.6%) |
| 70 to 74 Years | 4 (2.2%) | 6 (4.0%) |
| 75 to 79 Years | 3 (1.7%) | 0 (0.0%) |
| 80 to 84 Years | 0 (0.0%) | 0 (0.0%) |
| 85 Years and over | 0 (0.0%) | 0 (0.0%) |
| Total | 178 (100.0%) | 151 (100.0%) |
Families and Households in Wayland
Median Family Size in Wayland
The median family size in Wayland is 3.48 persons per family, with married-couple families (52 | 73.2%) accounting for the largest median family size of 3.63 persons per family. On the other hand, single male/father families (7 | 9.9%) represent the smallest median family size with 2.29 persons per family.
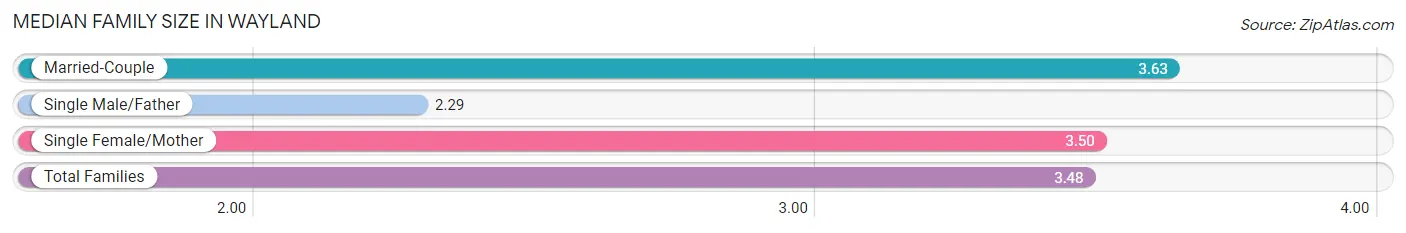
| Family Type | # Families | Family Size |
| Married-Couple | 52 (73.2%) | 3.63 |
| Single Male/Father | 7 (9.9%) | 2.29 |
| Single Female/Mother | 12 (16.9%) | 3.50 |
| Total Families | 71 (100.0%) | 3.48 |
Median Household Size in Wayland
The median household size in Wayland is 2.86 persons per household, with single female/mother households (12 | 10.7%) accounting for the largest median household size of 5.5 persons per household. non-family households (41 | 36.6%) represent the smallest median household size with 1.20 persons per household.
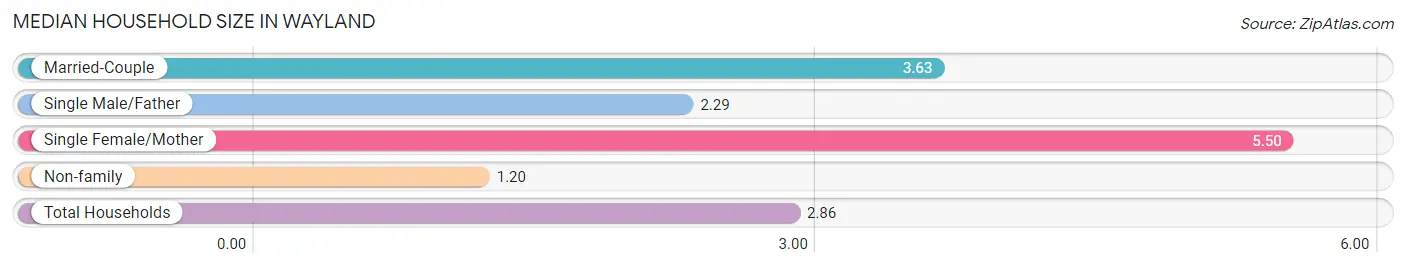
| Household Type | # Households | Household Size |
| Married-Couple | 52 (46.4%) | 3.63 |
| Single Male/Father | 7 (6.2%) | 2.29 |
| Single Female/Mother | 12 (10.7%) | 5.50 |
| Non-family | 41 (36.6%) | 1.20 |
| Total Households | 112 (100.0%) | 2.86 |
Household Size by Marriage Status in Wayland
Out of a total of 112 households in Wayland, 71 (63.4%) are family households, while 41 (36.6%) are nonfamily households. The most numerous type of family households are 3-person households, comprising 22, and the most common type of nonfamily households are 1-person households, comprising 36.
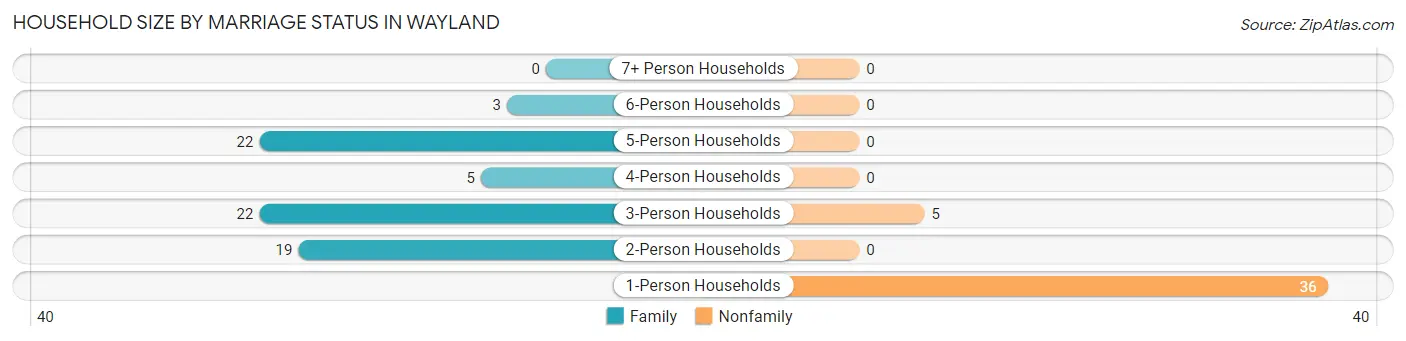
| Household Size | Family Households | Nonfamily Households |
| 1-Person Households | - | 36 (32.1%) |
| 2-Person Households | 19 (17.0%) | 0 (0.0%) |
| 3-Person Households | 22 (19.6%) | 5 (4.5%) |
| 4-Person Households | 5 (4.5%) | 0 (0.0%) |
| 5-Person Households | 22 (19.6%) | 0 (0.0%) |
| 6-Person Households | 3 (2.7%) | 0 (0.0%) |
| 7+ Person Households | 0 (0.0%) | 0 (0.0%) |
| Total | 71 (63.4%) | 41 (36.6%) |
Female Fertility in Wayland
Fertility by Age in Wayland
Average fertility rate in Wayland is 65.0 births per 1,000 women. Women in the age bracket of 20 to 34 years have the highest fertility rate with 160.0 births per 1,000 women. Women in the age bracket of 20 to 34 years acount for 100.0% of all women with births.
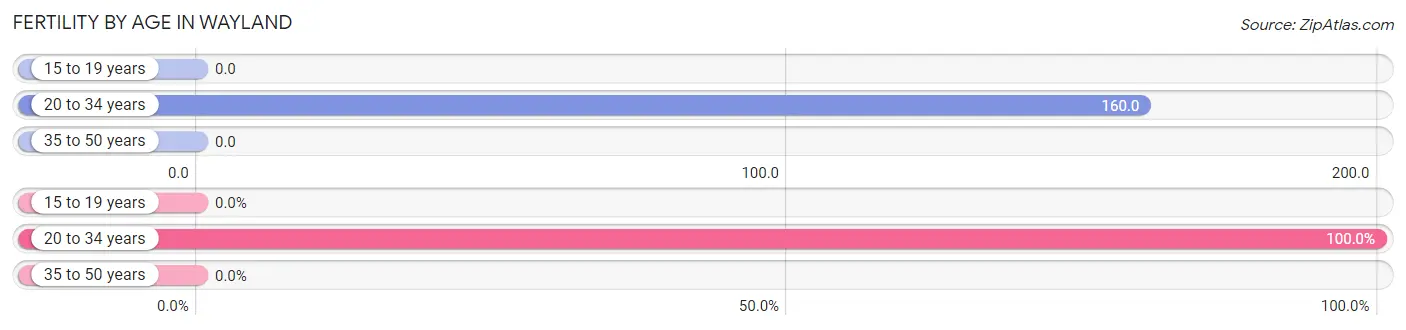
| Age Bracket | Women with Births | Births / 1,000 Women |
| 15 to 19 years | 0 (0.0%) | 0.0 |
| 20 to 34 years | 4 (100.0%) | 160.0 |
| 35 to 50 years | 0 (0.0%) | 0.0 |
| Total | 4 (100.0%) | 65.0 |
Fertility by Age by Marriage Status in Wayland
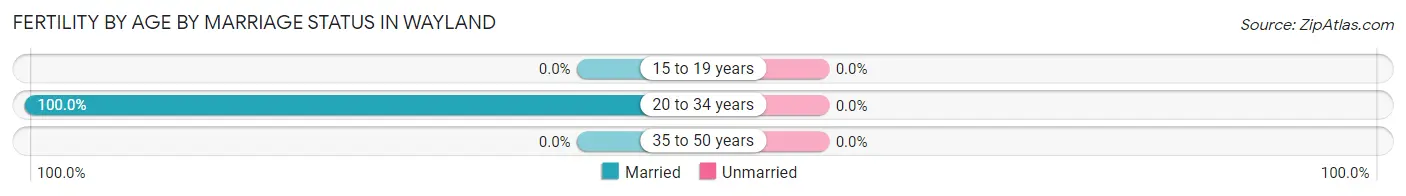
| Age Bracket | Married | Unmarried |
| 15 to 19 years | 0 (0.0%) | 0 (0.0%) |
| 20 to 34 years | 4 (100.0%) | 0 (0.0%) |
| 35 to 50 years | 0 (0.0%) | 0 (0.0%) |
| Total | 4 (100.0%) | 0 (0.0%) |
Fertility by Education in Wayland
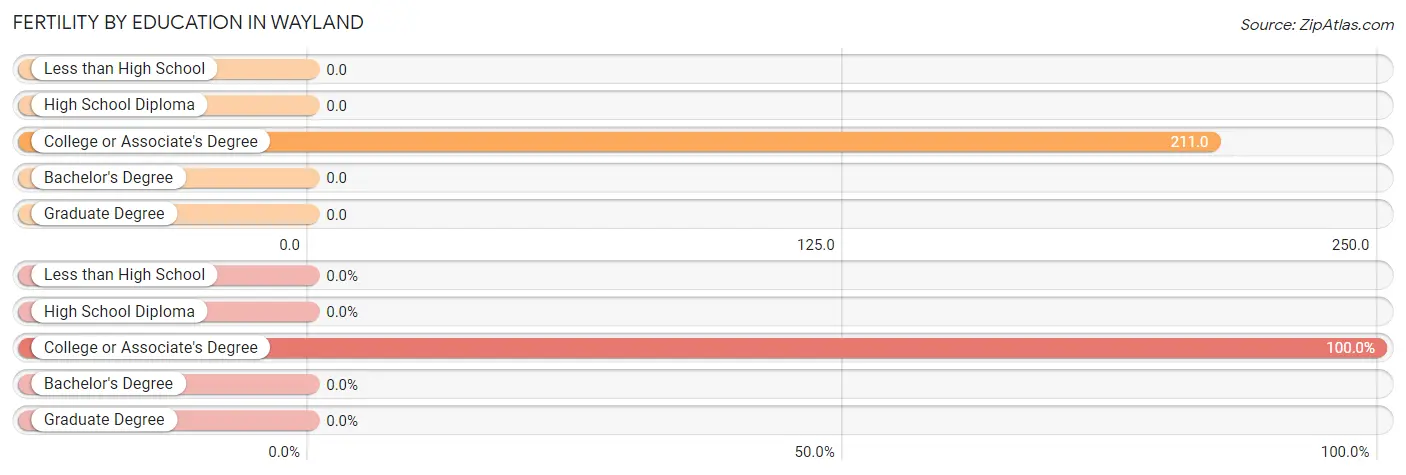
| Educational Attainment | Women with Births | Births / 1,000 Women |
| Less than High School | 0 (0.0%) | 0.0 |
| High School Diploma | 0 (0.0%) | 0.0 |
| College or Associate's Degree | 4 (100.0%) | 211.0 |
| Bachelor's Degree | 0 (0.0%) | 0.0 |
| Graduate Degree | 0 (0.0%) | 0.0 |
| Total | 4 (100.0%) | 65.0 |
Fertility by Education by Marriage Status in Wayland
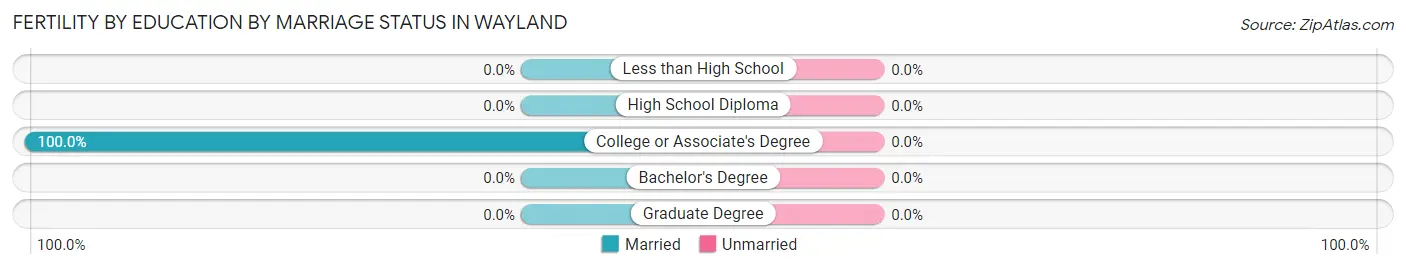
| Educational Attainment | Married | Unmarried |
| Less than High School | 0 (0.0%) | 0 (0.0%) |
| High School Diploma | 0 (0.0%) | 0 (0.0%) |
| College or Associate's Degree | 4 (100.0%) | 0 (0.0%) |
| Bachelor's Degree | 0 (0.0%) | 0 (0.0%) |
| Graduate Degree | 0 (0.0%) | 0 (0.0%) |
| Total | 4 (100.0%) | 0 (0.0%) |
Employment Characteristics in Wayland
Employment by Class of Employer in Wayland
Among the 99 employed individuals in Wayland, private company employees (54 | 54.5%), not-for-profit organizations (17 | 17.2%), and local government employees (12 | 12.1%) make up the most common classes of employment.
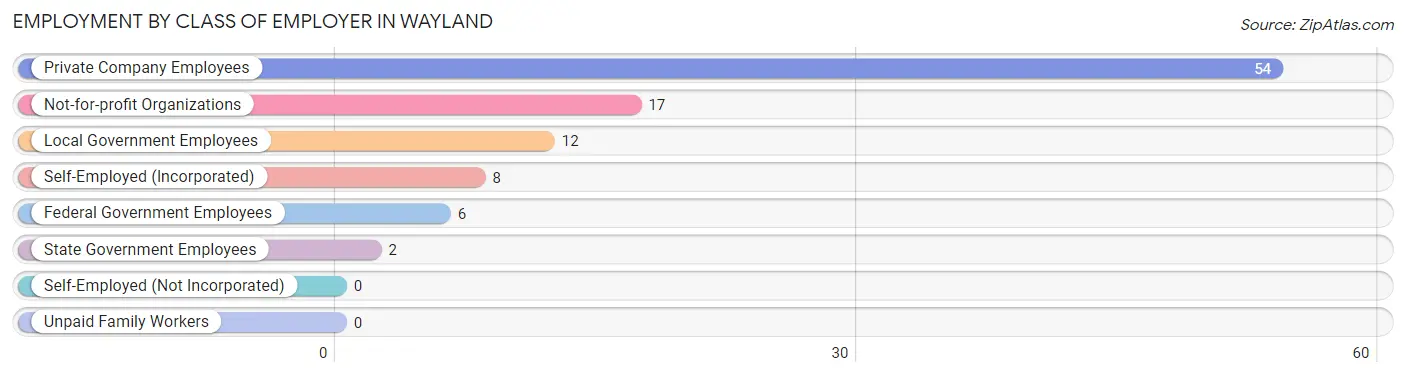
| Employer Class | # Employees | % Employees |
| Private Company Employees | 54 | 54.5% |
| Self-Employed (Incorporated) | 8 | 8.1% |
| Self-Employed (Not Incorporated) | 0 | 0.0% |
| Not-for-profit Organizations | 17 | 17.2% |
| Local Government Employees | 12 | 12.1% |
| State Government Employees | 2 | 2.0% |
| Federal Government Employees | 6 | 6.1% |
| Unpaid Family Workers | 0 | 0.0% |
| Total | 99 | 100.0% |
Employment Status by Age in Wayland
According to the labor force statistics for Wayland, out of the total population over 16 years of age (256), 46.1% or 118 individuals are in the labor force, with 8.5% or 10 of them unemployed. The age group with the highest labor force participation rate is 20 to 24 years, with 83.3% or 20 individuals in the labor force. Within the labor force, the 65 to 74 years age range has the highest percentage of unemployed individuals, with 40.0% or 2 of them being unemployed.
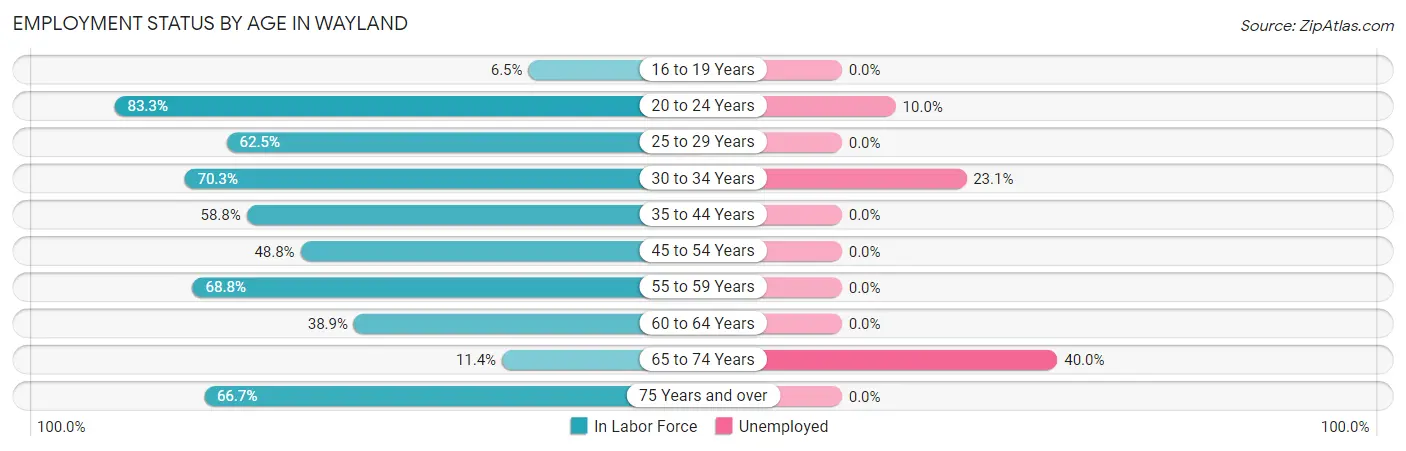
| Age Bracket | In Labor Force | Unemployed |
| 16 to 19 Years | 2 (6.5%) | 0 (0.0%) |
| 20 to 24 Years | 20 (83.3%) | 2 (10.0%) |
| 25 to 29 Years | 5 (62.5%) | 0 (0.0%) |
| 30 to 34 Years | 26 (70.3%) | 6 (23.1%) |
| 35 to 44 Years | 20 (58.8%) | 0 (0.0%) |
| 45 to 54 Years | 20 (48.8%) | 0 (0.0%) |
| 55 to 59 Years | 11 (68.8%) | 0 (0.0%) |
| 60 to 64 Years | 7 (38.9%) | 0 (0.0%) |
| 65 to 74 Years | 5 (11.4%) | 2 (40.0%) |
| 75 Years and over | 2 (66.7%) | 0 (0.0%) |
| Total | 118 (46.1%) | 10 (8.5%) |
Employment Status by Educational Attainment in Wayland
According to labor force statistics for Wayland, 57.8% of individuals (89) out of the total population between 25 and 64 years of age (154) are in the labor force, with 6.7% or 6 of them being unemployed. The group with the highest labor force participation rate are those with the educational attainment of college / associate degree, with 71.4% or 35 individuals in the labor force. Within the labor force, individuals with less than high school education have the highest percentage of unemployment, with 24.0% or 6 of them being unemployed.
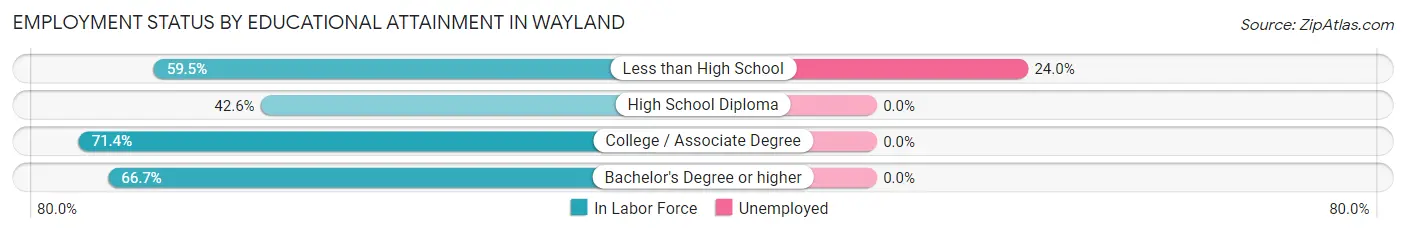
| Educational Attainment | In Labor Force | Unemployed |
| Less than High School | 25 (59.5%) | 10 (24.0%) |
| High School Diploma | 23 (42.6%) | 0 (0.0%) |
| College / Associate Degree | 35 (71.4%) | 0 (0.0%) |
| Bachelor's Degree or higher | 6 (66.7%) | 0 (0.0%) |
| Total | 89 (57.8%) | 10 (6.7%) |
Employment Occupations by Sex in Wayland
Management, Business, Science and Arts Occupations
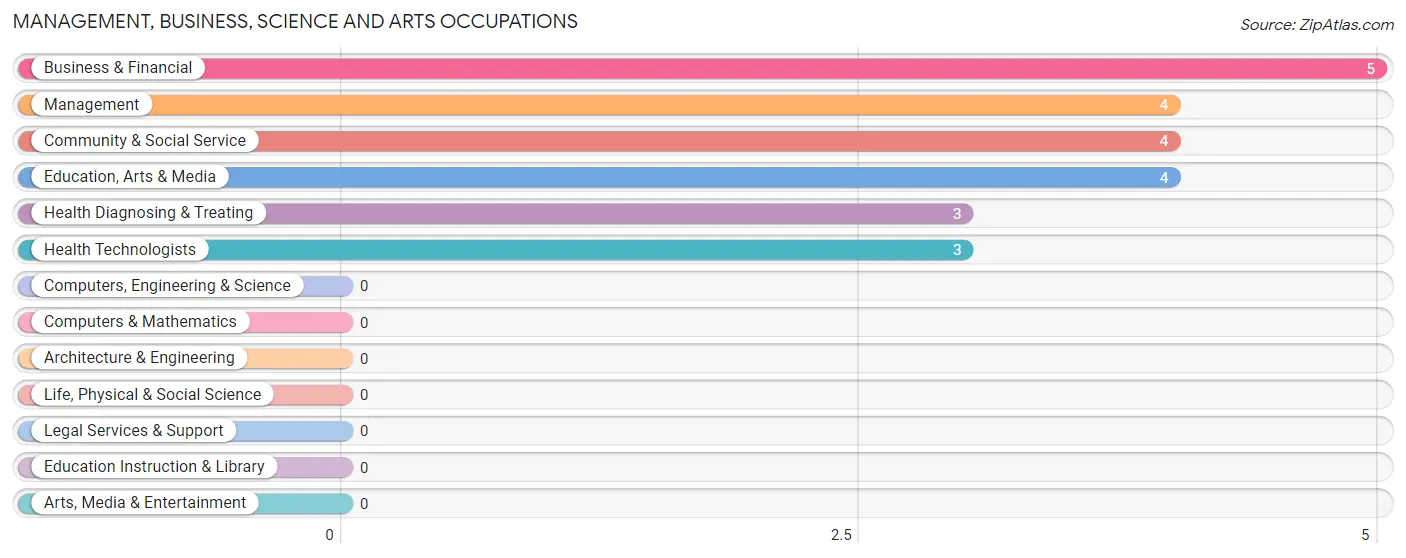
The most common Management, Business, Science and Arts occupations in Wayland are Business & Financial (5 | 4.6%), Management (4 | 3.7%), Community & Social Service (4 | 3.7%), Education, Arts & Media (4 | 3.7%), and Health Diagnosing & Treating (3 | 2.8%).
Management, Business, Science and Arts Occupations by Sex
Within the Management, Business, Science and Arts occupations in Wayland, the most male-oriented occupations are Management (100.0%), Health Diagnosing & Treating (100.0%), and Health Technologists (100.0%), while the most female-oriented occupations are Community & Social Service (100.0%), Education, Arts & Media (100.0%), and Business & Financial (60.0%).
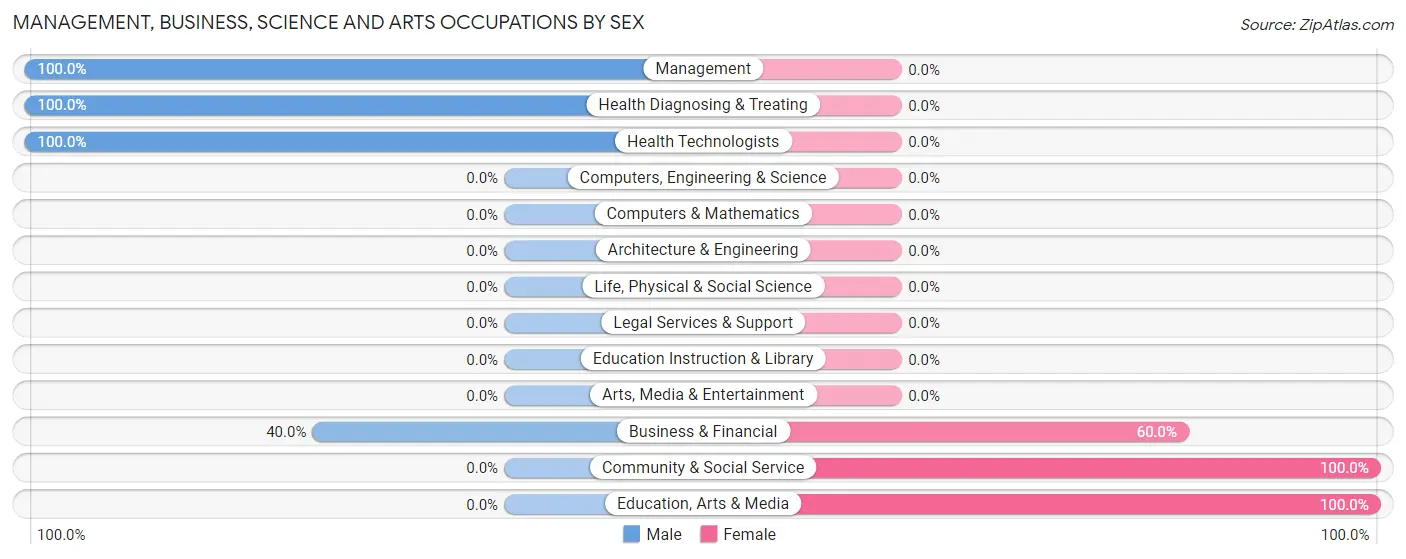
| Occupation | Male | Female |
| Management | 4 (100.0%) | 0 (0.0%) |
| Business & Financial | 2 (40.0%) | 3 (60.0%) |
| Computers, Engineering & Science | 0 (0.0%) | 0 (0.0%) |
| Computers & Mathematics | 0 (0.0%) | 0 (0.0%) |
| Architecture & Engineering | 0 (0.0%) | 0 (0.0%) |
| Life, Physical & Social Science | 0 (0.0%) | 0 (0.0%) |
| Community & Social Service | 0 (0.0%) | 4 (100.0%) |
| Education, Arts & Media | 0 (0.0%) | 4 (100.0%) |
| Legal Services & Support | 0 (0.0%) | 0 (0.0%) |
| Education Instruction & Library | 0 (0.0%) | 0 (0.0%) |
| Arts, Media & Entertainment | 0 (0.0%) | 0 (0.0%) |
| Health Diagnosing & Treating | 3 (100.0%) | 0 (0.0%) |
| Health Technologists | 3 (100.0%) | 0 (0.0%) |
| Total (Category) | 9 (56.2%) | 7 (43.8%) |
| Total (Overall) | 72 (66.7%) | 36 (33.3%) |
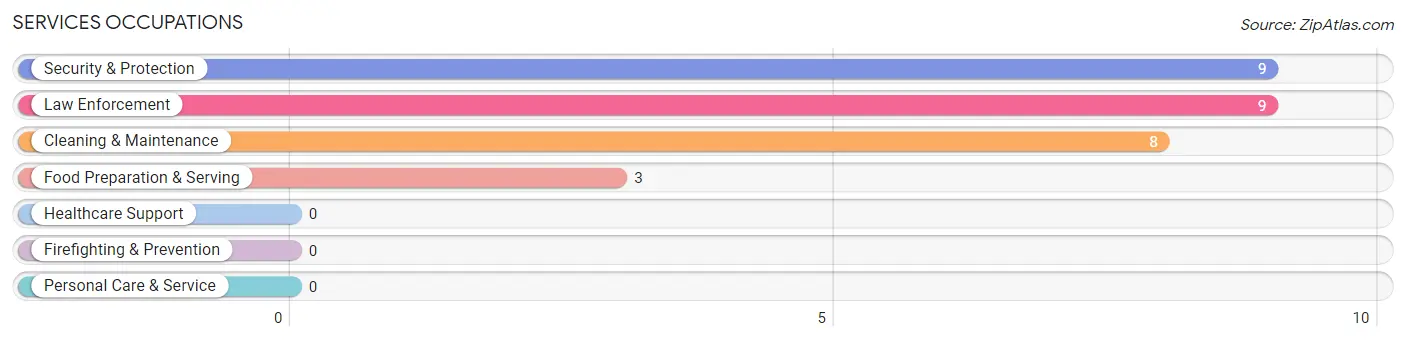
Services Occupations
The most common Services occupations in Wayland are Security & Protection (9 | 8.3%), Law Enforcement (9 | 8.3%), Cleaning & Maintenance (8 | 7.4%), and Food Preparation & Serving (3 | 2.8%).
Services Occupations by Sex
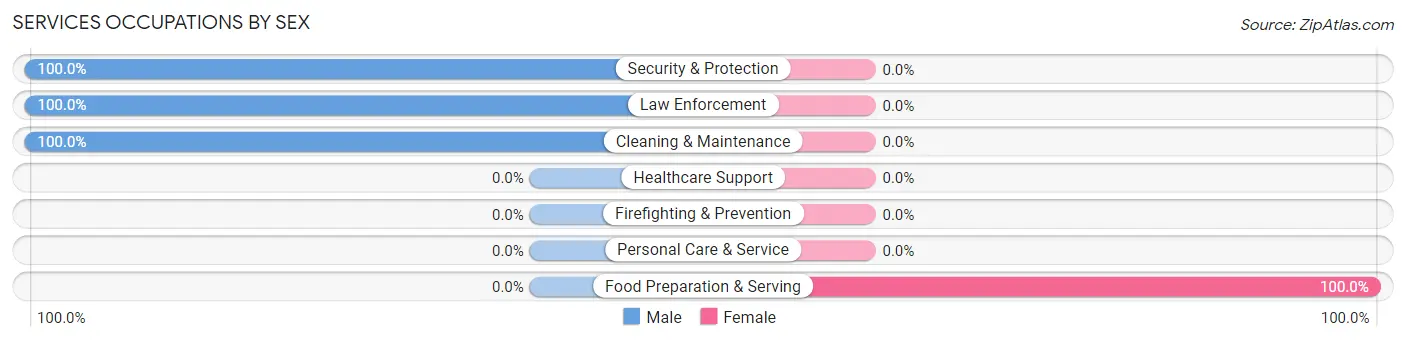
| Occupation | Male | Female |
| Healthcare Support | 0 (0.0%) | 0 (0.0%) |
| Security & Protection | 9 (100.0%) | 0 (0.0%) |
| Firefighting & Prevention | 0 (0.0%) | 0 (0.0%) |
| Law Enforcement | 9 (100.0%) | 0 (0.0%) |
| Food Preparation & Serving | 0 (0.0%) | 3 (100.0%) |
| Cleaning & Maintenance | 8 (100.0%) | 0 (0.0%) |
| Personal Care & Service | 0 (0.0%) | 0 (0.0%) |
| Total (Category) | 17 (85.0%) | 3 (15.0%) |
| Total (Overall) | 72 (66.7%) | 36 (33.3%) |
Sales and Office Occupations
The most common Sales and Office occupations in Wayland are Sales & Related (23 | 21.3%), and Office & Administration (17 | 15.7%).
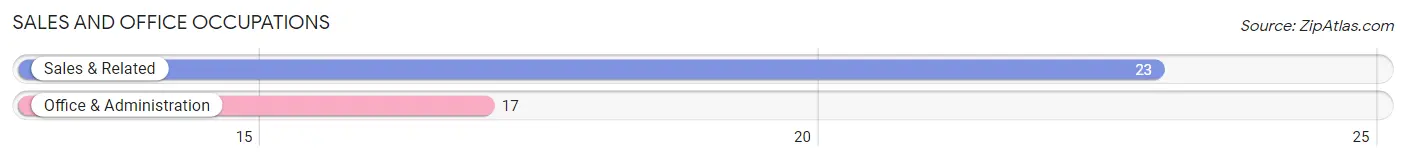
Sales and Office Occupations by Sex
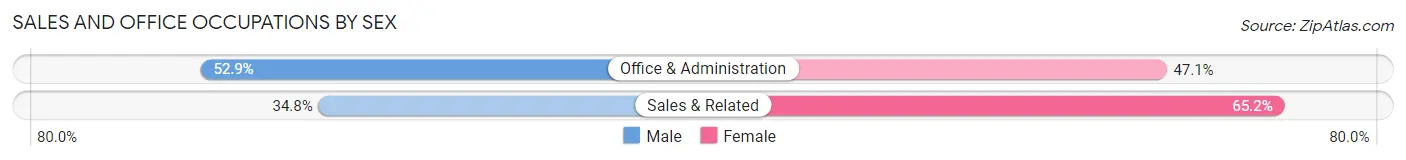
| Occupation | Male | Female |
| Sales & Related | 8 (34.8%) | 15 (65.2%) |
| Office & Administration | 9 (52.9%) | 8 (47.1%) |
| Total (Category) | 17 (42.5%) | 23 (57.5%) |
| Total (Overall) | 72 (66.7%) | 36 (33.3%) |
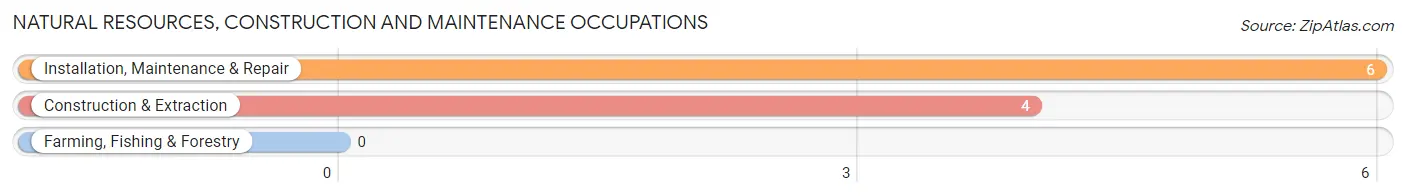
Natural Resources, Construction and Maintenance Occupations
The most common Natural Resources, Construction and Maintenance occupations in Wayland are Installation, Maintenance & Repair (6 | 5.6%), and Construction & Extraction (4 | 3.7%).
Natural Resources, Construction and Maintenance Occupations by Sex
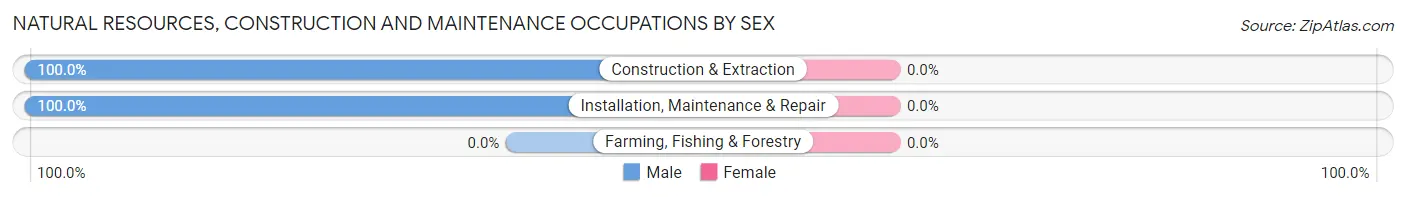
| Occupation | Male | Female |
| Farming, Fishing & Forestry | 0 (0.0%) | 0 (0.0%) |
| Construction & Extraction | 4 (100.0%) | 0 (0.0%) |
| Installation, Maintenance & Repair | 6 (100.0%) | 0 (0.0%) |
| Total (Category) | 10 (100.0%) | 0 (0.0%) |
| Total (Overall) | 72 (66.7%) | 36 (33.3%) |
Production, Transportation and Moving Occupations
The most common Production, Transportation and Moving occupations in Wayland are Material Moving (11 | 10.2%), Transportation (7 | 6.5%), and Production (4 | 3.7%).
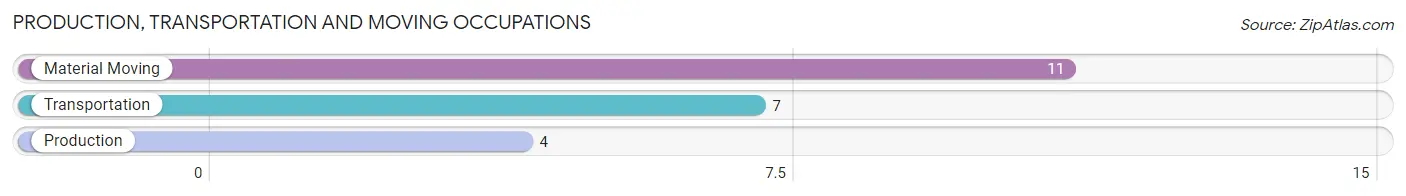
Production, Transportation and Moving Occupations by Sex
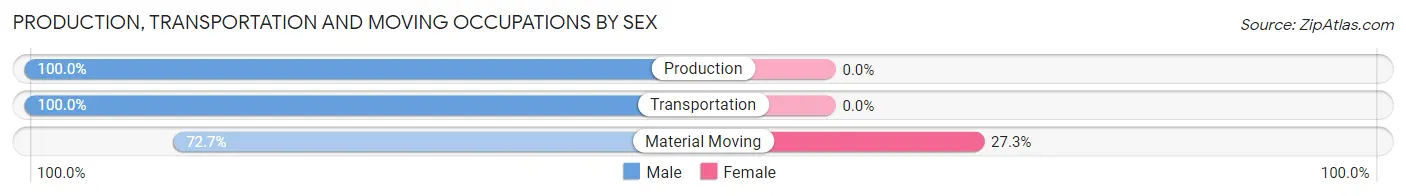
| Occupation | Male | Female |
| Production | 4 (100.0%) | 0 (0.0%) |
| Transportation | 7 (100.0%) | 0 (0.0%) |
| Material Moving | 8 (72.7%) | 3 (27.3%) |
| Total (Category) | 19 (86.4%) | 3 (13.6%) |
| Total (Overall) | 72 (66.7%) | 36 (33.3%) |
Employment Industries by Sex in Wayland
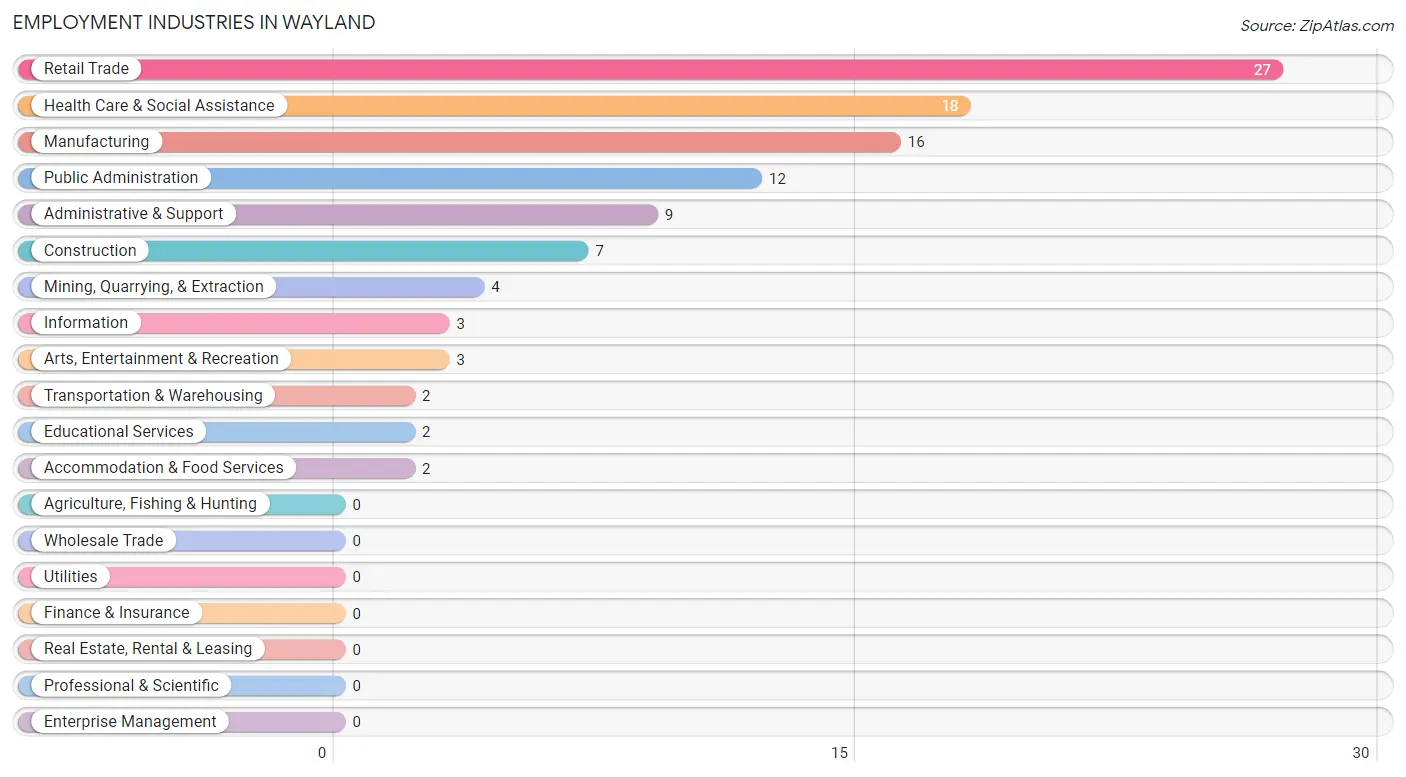
Employment Industries in Wayland
The major employment industries in Wayland include Retail Trade (27 | 25.0%), Health Care & Social Assistance (18 | 16.7%), Manufacturing (16 | 14.8%), Public Administration (12 | 11.1%), and Administrative & Support (9 | 8.3%).
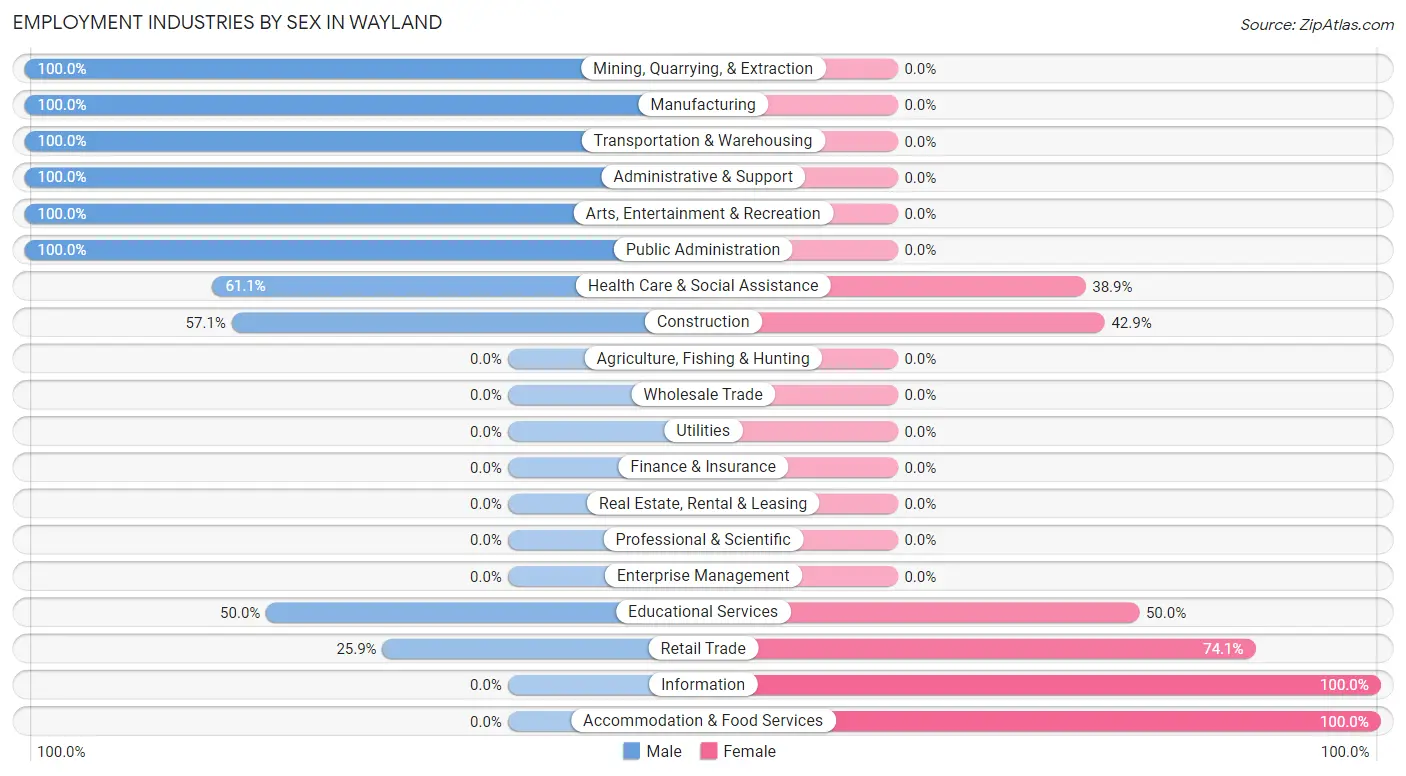
Employment Industries by Sex in Wayland
The Wayland industries that see more men than women are Mining, Quarrying, & Extraction (100.0%), Manufacturing (100.0%), and Transportation & Warehousing (100.0%), whereas the industries that tend to have a higher number of women are Information (100.0%), Accommodation & Food Services (100.0%), and Retail Trade (74.1%).
| Industry | Male | Female |
| Agriculture, Fishing & Hunting | 0 (0.0%) | 0 (0.0%) |
| Mining, Quarrying, & Extraction | 4 (100.0%) | 0 (0.0%) |
| Construction | 4 (57.1%) | 3 (42.9%) |
| Manufacturing | 16 (100.0%) | 0 (0.0%) |
| Wholesale Trade | 0 (0.0%) | 0 (0.0%) |
| Retail Trade | 7 (25.9%) | 20 (74.1%) |
| Transportation & Warehousing | 2 (100.0%) | 0 (0.0%) |
| Utilities | 0 (0.0%) | 0 (0.0%) |
| Information | 0 (0.0%) | 3 (100.0%) |
| Finance & Insurance | 0 (0.0%) | 0 (0.0%) |
| Real Estate, Rental & Leasing | 0 (0.0%) | 0 (0.0%) |
| Professional & Scientific | 0 (0.0%) | 0 (0.0%) |
| Enterprise Management | 0 (0.0%) | 0 (0.0%) |
| Administrative & Support | 9 (100.0%) | 0 (0.0%) |
| Educational Services | 1 (50.0%) | 1 (50.0%) |
| Health Care & Social Assistance | 11 (61.1%) | 7 (38.9%) |
| Arts, Entertainment & Recreation | 3 (100.0%) | 0 (0.0%) |
| Accommodation & Food Services | 0 (0.0%) | 2 (100.0%) |
| Public Administration | 12 (100.0%) | 0 (0.0%) |
| Total | 72 (66.7%) | 36 (33.3%) |
Education in Wayland
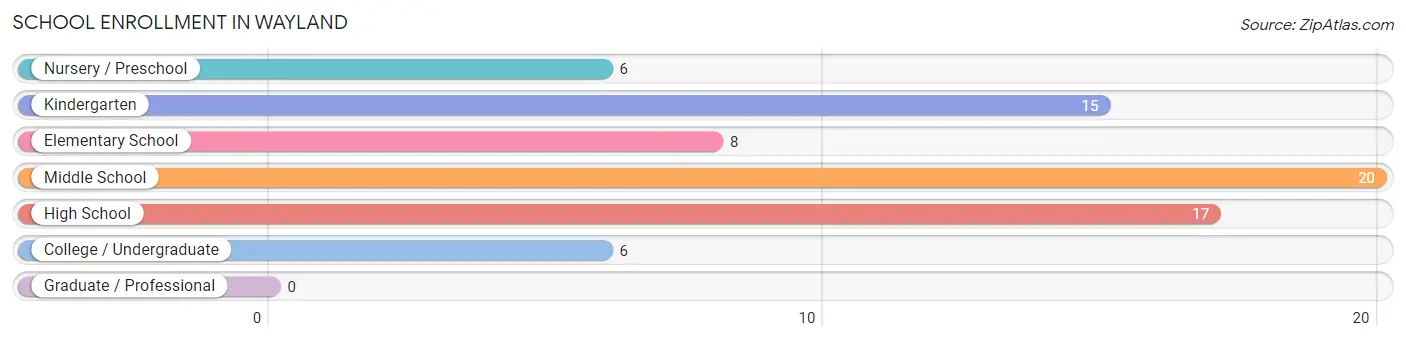
School Enrollment in Wayland
The most common levels of schooling among the 72 students in Wayland are middle school (20 | 27.8%), high school (17 | 23.6%), and kindergarten (15 | 20.8%).
| School Level | # Students | % Students |
| Nursery / Preschool | 6 | 8.3% |
| Kindergarten | 15 | 20.8% |
| Elementary School | 8 | 11.1% |
| Middle School | 20 | 27.8% |
| High School | 17 | 23.6% |
| College / Undergraduate | 6 | 8.3% |
| Graduate / Professional | 0 | 0.0% |
| Total | 72 | 100.0% |
School Enrollment by Age by Funding Source in Wayland
Out of a total of 72 students who are enrolled in schools in Wayland, 1 (1.4%) attend a private institution, while the remaining 71 (98.6%) are enrolled in public schools. The age group of 18 to 19 year olds has the highest likelihood of being enrolled in private schools, with 1 (20.0% in the age bracket) enrolled. Conversely, the age group of 5 to 9 year old has the lowest likelihood of being enrolled in a private school, with 29 (100.0% in the age bracket) attending a public institution.
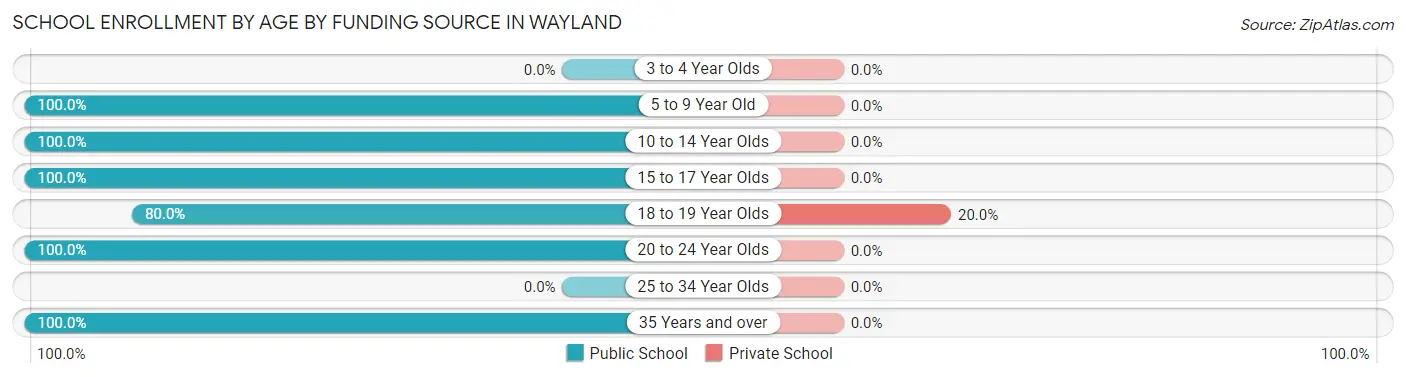
| Age Bracket | Public School | Private School |
| 3 to 4 Year Olds | 0 (0.0%) | 0 (0.0%) |
| 5 to 9 Year Old | 29 (100.0%) | 0 (0.0%) |
| 10 to 14 Year Olds | 20 (100.0%) | 0 (0.0%) |
| 15 to 17 Year Olds | 13 (100.0%) | 0 (0.0%) |
| 18 to 19 Year Olds | 4 (80.0%) | 1 (20.0%) |
| 20 to 24 Year Olds | 4 (100.0%) | 0 (0.0%) |
| 25 to 34 Year Olds | 0 (0.0%) | 0 (0.0%) |
| 35 Years and over | 1 (100.0%) | 0 (0.0%) |
| Total | 71 (98.6%) | 1 (1.4%) |
Educational Attainment by Field of Study in Wayland
Computers & mathematics (3 | 18.8%), physical & health sciences (3 | 18.8%), psychology (3 | 18.8%), social sciences (3 | 18.8%), and science & technology (2 | 12.5%) are the most common fields of study among 16 individuals in Wayland who have obtained a bachelor's degree or higher.
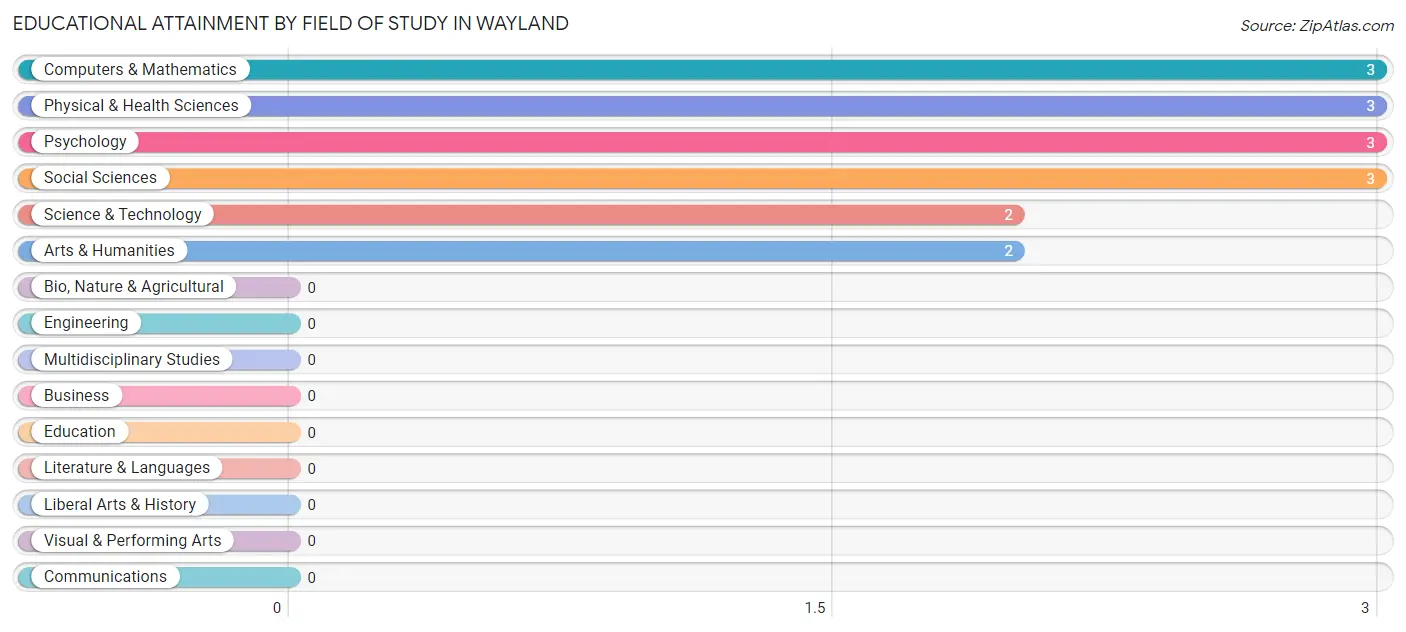
| Field of Study | # Graduates | % Graduates |
| Computers & Mathematics | 3 | 18.8% |
| Bio, Nature & Agricultural | 0 | 0.0% |
| Physical & Health Sciences | 3 | 18.8% |
| Psychology | 3 | 18.8% |
| Social Sciences | 3 | 18.8% |
| Engineering | 0 | 0.0% |
| Multidisciplinary Studies | 0 | 0.0% |
| Science & Technology | 2 | 12.5% |
| Business | 0 | 0.0% |
| Education | 0 | 0.0% |
| Literature & Languages | 0 | 0.0% |
| Liberal Arts & History | 0 | 0.0% |
| Visual & Performing Arts | 0 | 0.0% |
| Communications | 0 | 0.0% |
| Arts & Humanities | 2 | 12.5% |
| Total | 16 | 100.0% |
Transportation & Commute in Wayland
Vehicle Availability by Sex in Wayland
The most prevalent vehicle ownership categories in Wayland are males with 2 vehicles (23, accounting for 36.5%) and females with 2 vehicles (19, making up 63.9%).
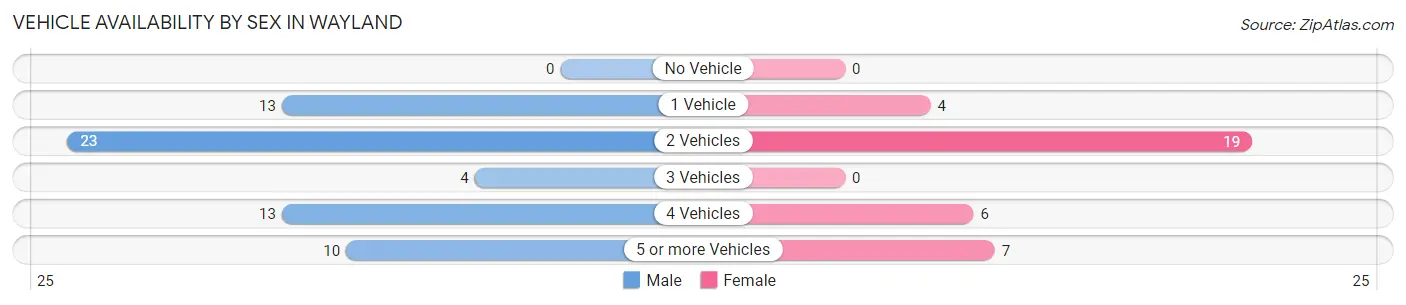
| Vehicles Available | Male | Female |
| No Vehicle | 0 (0.0%) | 0 (0.0%) |
| 1 Vehicle | 13 (20.6%) | 4 (11.1%) |
| 2 Vehicles | 23 (36.5%) | 19 (52.8%) |
| 3 Vehicles | 4 (6.4%) | 0 (0.0%) |
| 4 Vehicles | 13 (20.6%) | 6 (16.7%) |
| 5 or more Vehicles | 10 (15.9%) | 7 (19.4%) |
| Total | 63 (100.0%) | 36 (100.0%) |
Commute Time in Wayland
The most frequently occuring commute durations in Wayland are 30 to 34 minutes (30 commuters, 30.3%), 5 to 9 minutes (25 commuters, 25.3%), and 45 to 59 minutes (17 commuters, 17.2%).
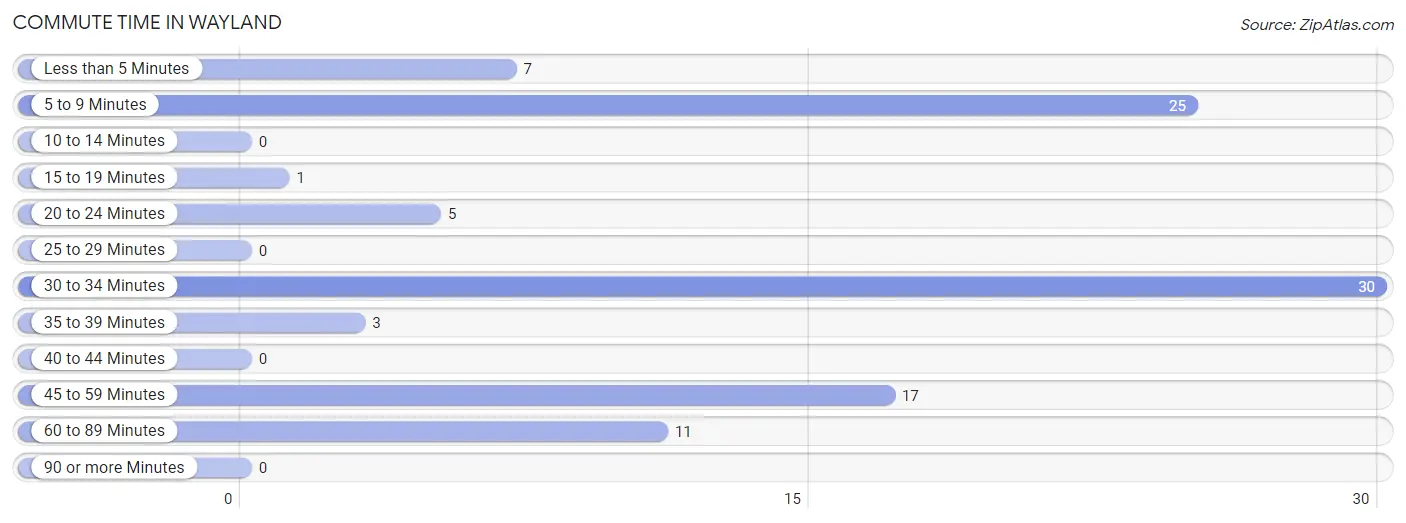
| Commute Time | # Commuters | % Commuters |
| Less than 5 Minutes | 7 | 7.1% |
| 5 to 9 Minutes | 25 | 25.3% |
| 10 to 14 Minutes | 0 | 0.0% |
| 15 to 19 Minutes | 1 | 1.0% |
| 20 to 24 Minutes | 5 | 5.1% |
| 25 to 29 Minutes | 0 | 0.0% |
| 30 to 34 Minutes | 30 | 30.3% |
| 35 to 39 Minutes | 3 | 3.0% |
| 40 to 44 Minutes | 0 | 0.0% |
| 45 to 59 Minutes | 17 | 17.2% |
| 60 to 89 Minutes | 11 | 11.1% |
| 90 or more Minutes | 0 | 0.0% |
Commute Time by Sex in Wayland
The most common commute times in Wayland are 30 to 34 minutes (16 commuters, 25.4%) for males and 30 to 34 minutes (14 commuters, 38.9%) for females.
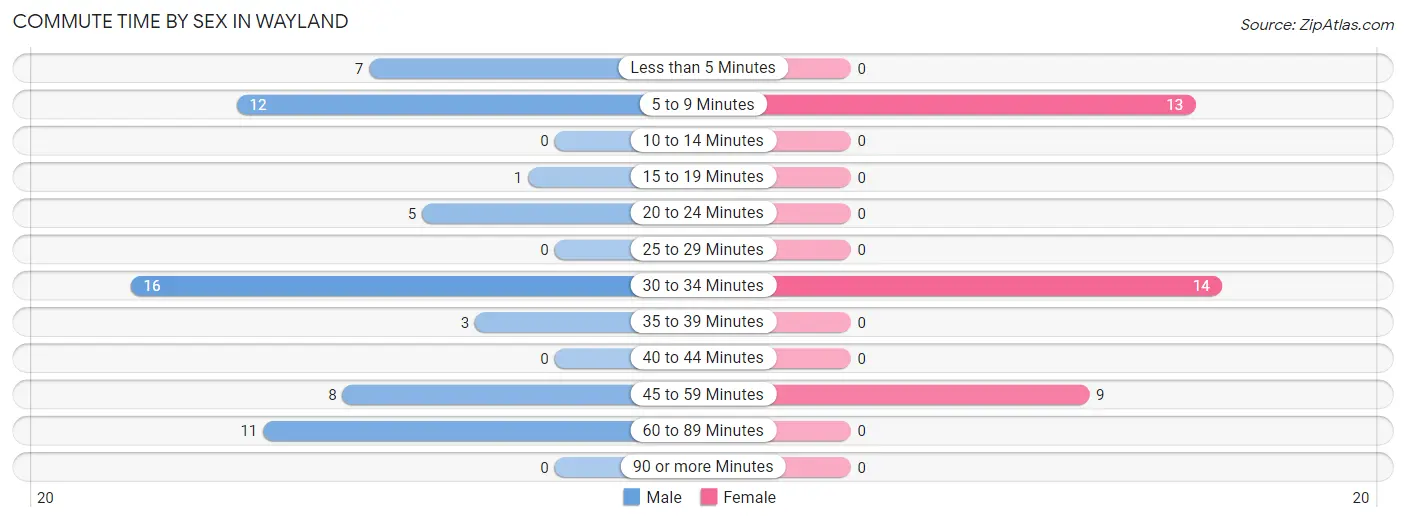
| Commute Time | Male | Female |
| Less than 5 Minutes | 7 (11.1%) | 0 (0.0%) |
| 5 to 9 Minutes | 12 (19.1%) | 13 (36.1%) |
| 10 to 14 Minutes | 0 (0.0%) | 0 (0.0%) |
| 15 to 19 Minutes | 1 (1.6%) | 0 (0.0%) |
| 20 to 24 Minutes | 5 (7.9%) | 0 (0.0%) |
| 25 to 29 Minutes | 0 (0.0%) | 0 (0.0%) |
| 30 to 34 Minutes | 16 (25.4%) | 14 (38.9%) |
| 35 to 39 Minutes | 3 (4.8%) | 0 (0.0%) |
| 40 to 44 Minutes | 0 (0.0%) | 0 (0.0%) |
| 45 to 59 Minutes | 8 (12.7%) | 9 (25.0%) |
| 60 to 89 Minutes | 11 (17.5%) | 0 (0.0%) |
| 90 or more Minutes | 0 (0.0%) | 0 (0.0%) |
Time of Departure to Work by Sex in Wayland
The most frequent times of departure to work in Wayland are 7:00 AM to 7:29 AM (17, 27.0%) for males and 5:30 AM to 5:59 AM (13, 36.1%) for females.
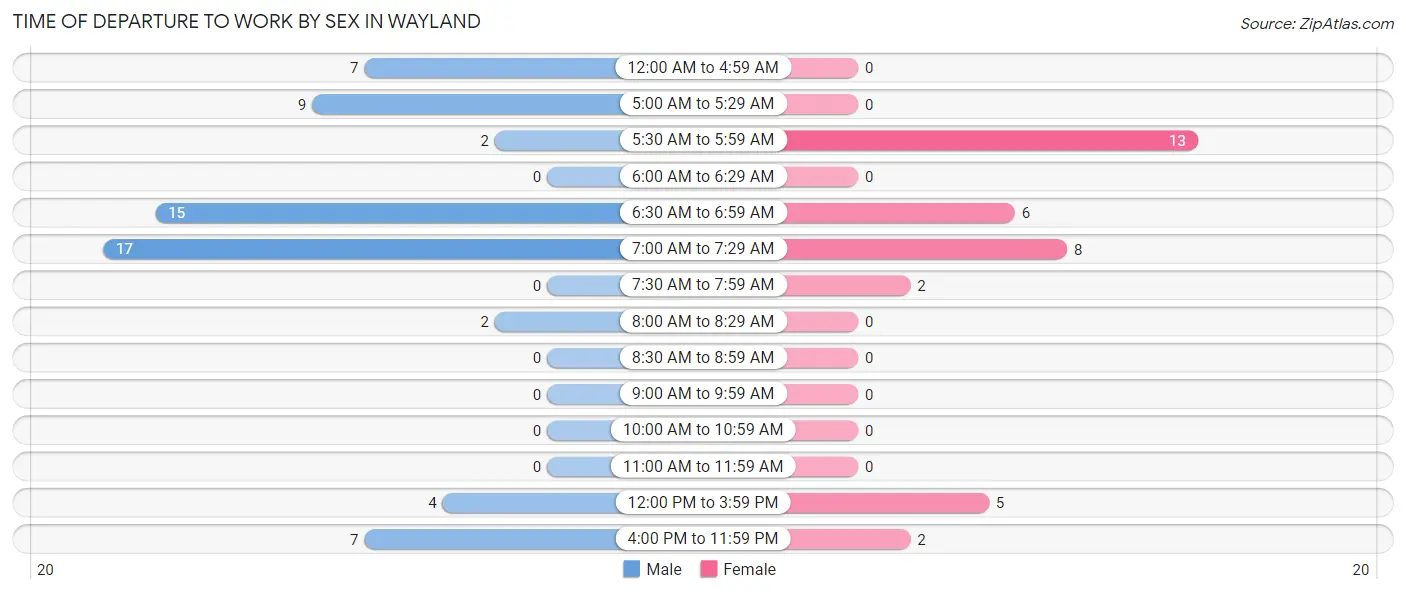
| Time of Departure | Male | Female |
| 12:00 AM to 4:59 AM | 7 (11.1%) | 0 (0.0%) |
| 5:00 AM to 5:29 AM | 9 (14.3%) | 0 (0.0%) |
| 5:30 AM to 5:59 AM | 2 (3.2%) | 13 (36.1%) |
| 6:00 AM to 6:29 AM | 0 (0.0%) | 0 (0.0%) |
| 6:30 AM to 6:59 AM | 15 (23.8%) | 6 (16.7%) |
| 7:00 AM to 7:29 AM | 17 (27.0%) | 8 (22.2%) |
| 7:30 AM to 7:59 AM | 0 (0.0%) | 2 (5.6%) |
| 8:00 AM to 8:29 AM | 2 (3.2%) | 0 (0.0%) |
| 8:30 AM to 8:59 AM | 0 (0.0%) | 0 (0.0%) |
| 9:00 AM to 9:59 AM | 0 (0.0%) | 0 (0.0%) |
| 10:00 AM to 10:59 AM | 0 (0.0%) | 0 (0.0%) |
| 11:00 AM to 11:59 AM | 0 (0.0%) | 0 (0.0%) |
| 12:00 PM to 3:59 PM | 4 (6.4%) | 5 (13.9%) |
| 4:00 PM to 11:59 PM | 7 (11.1%) | 2 (5.6%) |
| Total | 63 (100.0%) | 36 (100.0%) |
Housing Occupancy in Wayland
Occupancy by Ownership in Wayland
Of the total 112 dwellings in Wayland, owner-occupied units account for 67 (59.8%), while renter-occupied units make up 45 (40.2%).
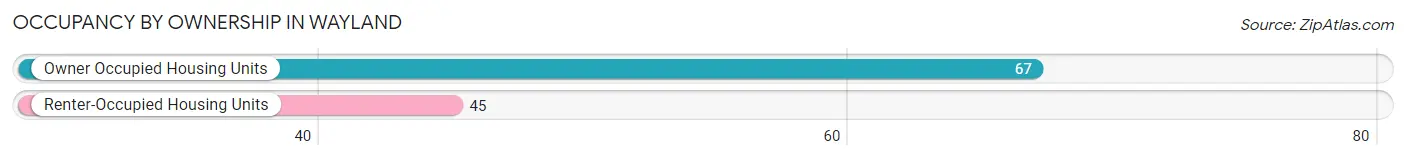
| Occupancy | # Housing Units | % Housing Units |
| Owner Occupied Housing Units | 67 | 59.8% |
| Renter-Occupied Housing Units | 45 | 40.2% |
| Total Occupied Housing Units | 112 | 100.0% |
Occupancy by Household Size in Wayland
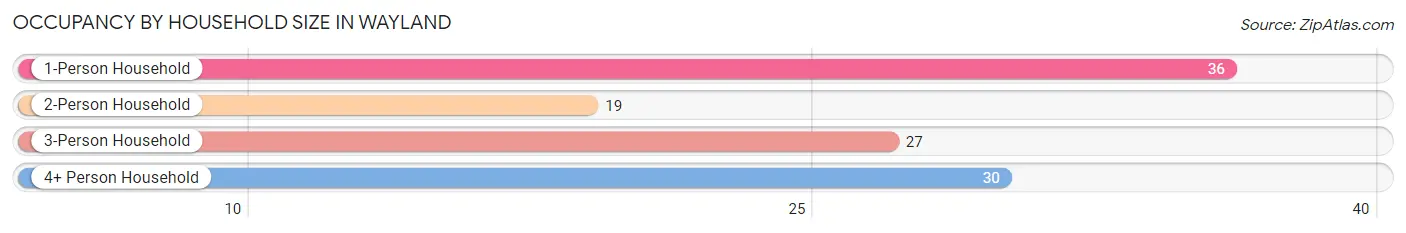
| Household Size | # Housing Units | % Housing Units |
| 1-Person Household | 36 | 32.1% |
| 2-Person Household | 19 | 17.0% |
| 3-Person Household | 27 | 24.1% |
| 4+ Person Household | 30 | 26.8% |
| Total Housing Units | 112 | 100.0% |
Occupancy by Ownership by Household Size in Wayland
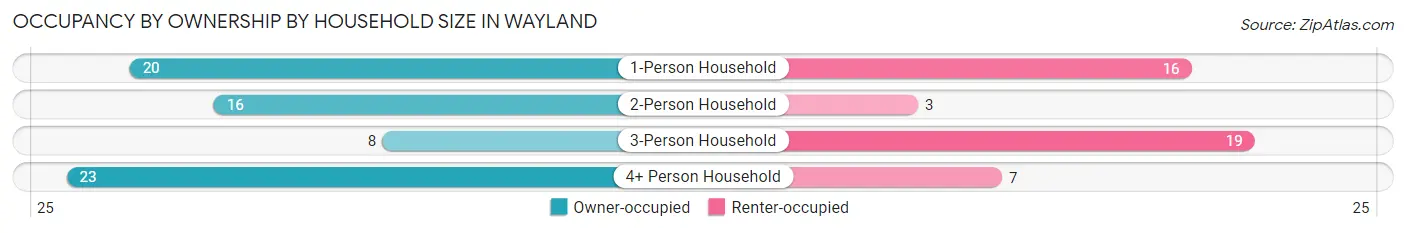
| Household Size | Owner-occupied | Renter-occupied |
| 1-Person Household | 20 (55.6%) | 16 (44.4%) |
| 2-Person Household | 16 (84.2%) | 3 (15.8%) |
| 3-Person Household | 8 (29.6%) | 19 (70.4%) |
| 4+ Person Household | 23 (76.7%) | 7 (23.3%) |
| Total Housing Units | 67 (59.8%) | 45 (40.2%) |
Occupancy by Educational Attainment in Wayland
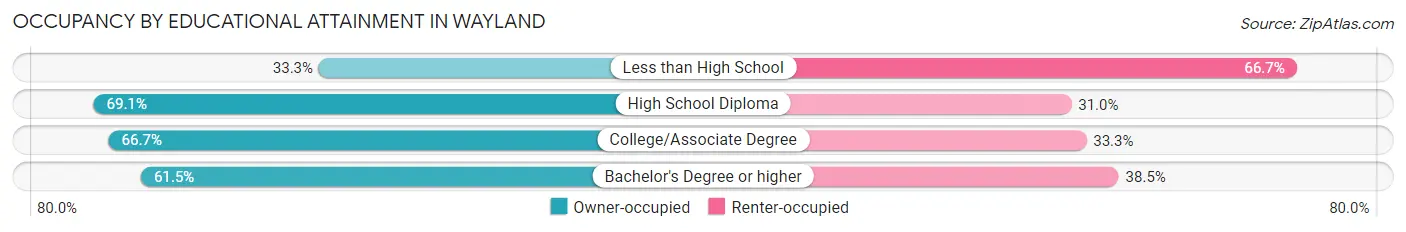
| Household Size | Owner-occupied | Renter-occupied |
| Less than High School | 8 (33.3%) | 16 (66.7%) |
| High School Diploma | 29 (69.1%) | 13 (30.9%) |
| College/Associate Degree | 22 (66.7%) | 11 (33.3%) |
| Bachelor's Degree or higher | 8 (61.5%) | 5 (38.5%) |
Occupancy by Age of Householder in Wayland
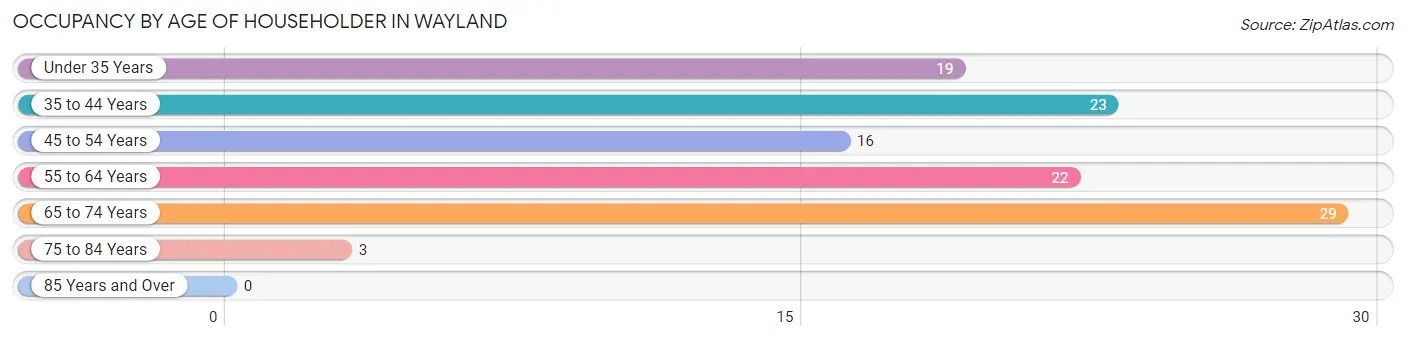
| Age Bracket | # Households | % Households |
| Under 35 Years | 19 | 17.0% |
| 35 to 44 Years | 23 | 20.5% |
| 45 to 54 Years | 16 | 14.3% |
| 55 to 64 Years | 22 | 19.6% |
| 65 to 74 Years | 29 | 25.9% |
| 75 to 84 Years | 3 | 2.7% |
| 85 Years and Over | 0 | 0.0% |
| Total | 112 | 100.0% |
Housing Finances in Wayland
Median Income by Occupancy in Wayland
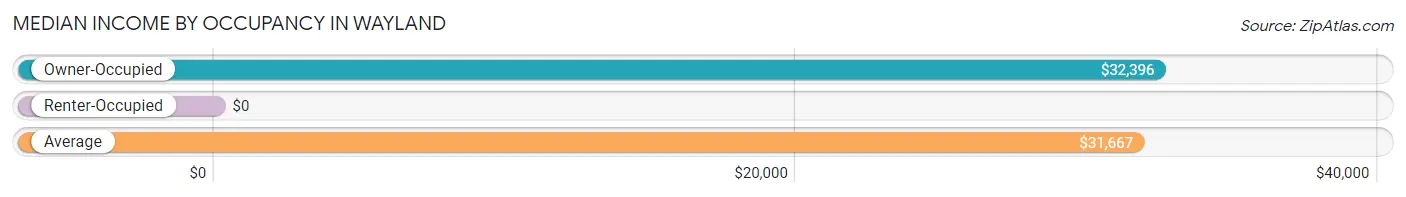
| Occupancy Type | # Households | Median Income |
| Owner-Occupied | 67 (59.8%) | $32,396 |
| Renter-Occupied | 45 (40.2%) | $0 |
| Average | 112 (100.0%) | $31,667 |
Occupancy by Householder Income Bracket in Wayland
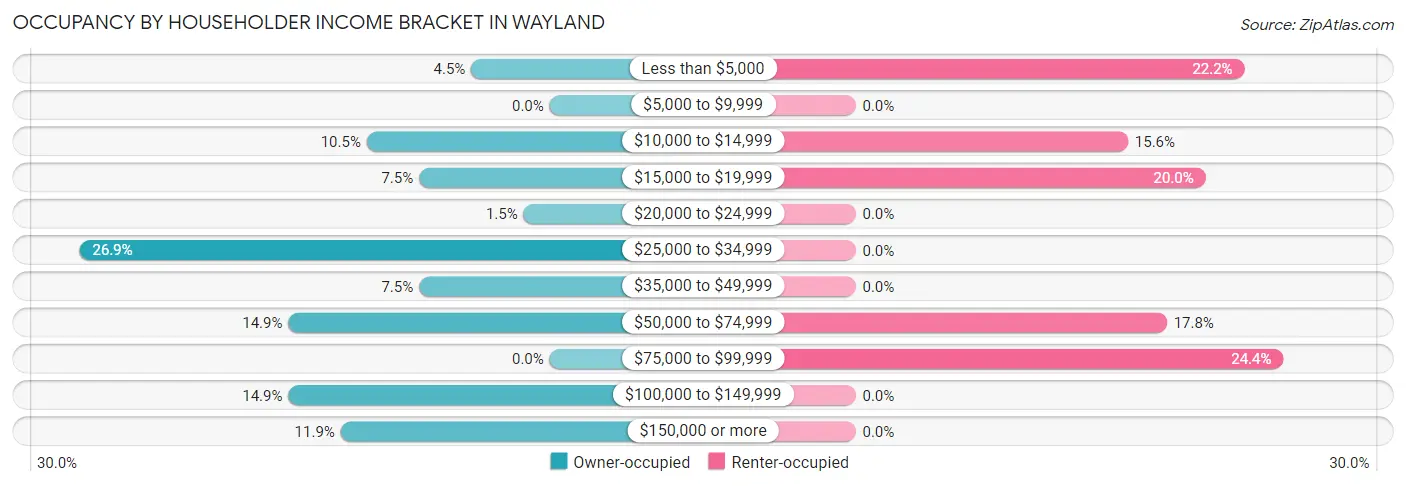
| Income Bracket | Owner-occupied | Renter-occupied |
| Less than $5,000 | 3 (4.5%) | 10 (22.2%) |
| $5,000 to $9,999 | 0 (0.0%) | 0 (0.0%) |
| $10,000 to $14,999 | 7 (10.4%) | 7 (15.6%) |
| $15,000 to $19,999 | 5 (7.5%) | 9 (20.0%) |
| $20,000 to $24,999 | 1 (1.5%) | 0 (0.0%) |
| $25,000 to $34,999 | 18 (26.9%) | 0 (0.0%) |
| $35,000 to $49,999 | 5 (7.5%) | 0 (0.0%) |
| $50,000 to $74,999 | 10 (14.9%) | 8 (17.8%) |
| $75,000 to $99,999 | 0 (0.0%) | 11 (24.4%) |
| $100,000 to $149,999 | 10 (14.9%) | 0 (0.0%) |
| $150,000 or more | 8 (11.9%) | 0 (0.0%) |
| Total | 67 (100.0%) | 45 (100.0%) |
Monthly Housing Cost Tiers in Wayland
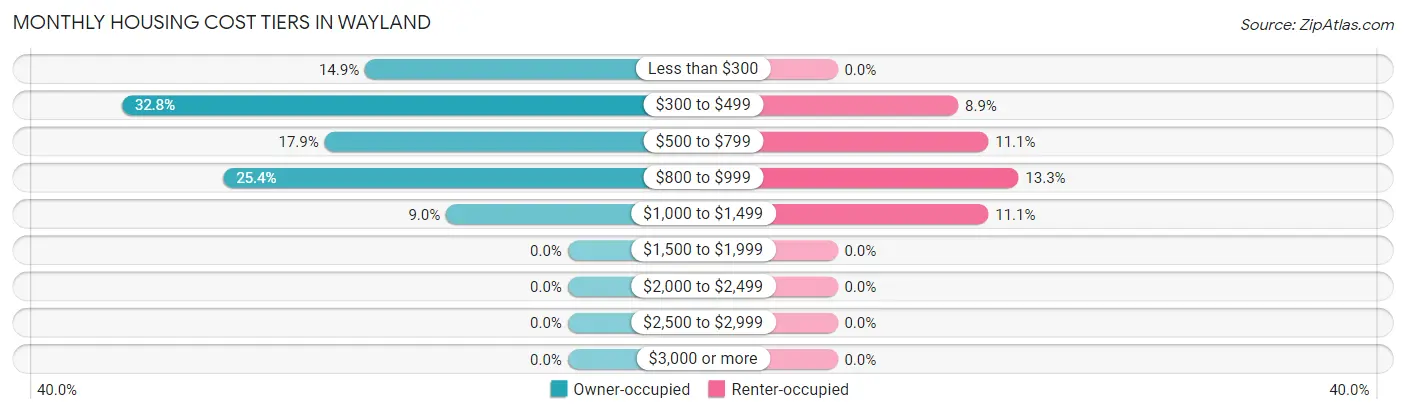
| Monthly Cost | Owner-occupied | Renter-occupied |
| Less than $300 | 10 (14.9%) | 0 (0.0%) |
| $300 to $499 | 22 (32.8%) | 4 (8.9%) |
| $500 to $799 | 12 (17.9%) | 5 (11.1%) |
| $800 to $999 | 17 (25.4%) | 6 (13.3%) |
| $1,000 to $1,499 | 6 (9.0%) | 5 (11.1%) |
| $1,500 to $1,999 | 0 (0.0%) | 0 (0.0%) |
| $2,000 to $2,499 | 0 (0.0%) | 0 (0.0%) |
| $2,500 to $2,999 | 0 (0.0%) | 0 (0.0%) |
| $3,000 or more | 0 (0.0%) | 0 (0.0%) |
| Total | 67 (100.0%) | 45 (100.0%) |
Physical Housing Characteristics in Wayland
Housing Structures in Wayland
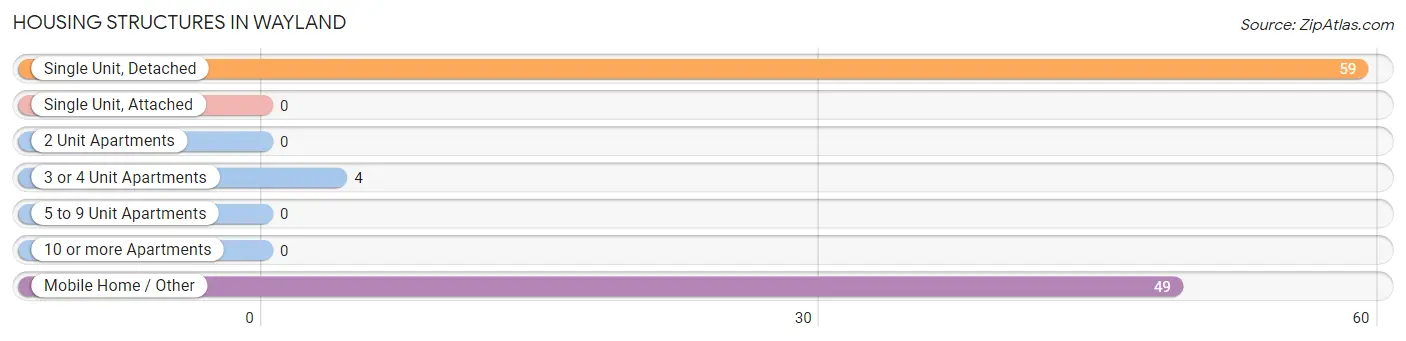
| Structure Type | # Housing Units | % Housing Units |
| Single Unit, Detached | 59 | 52.7% |
| Single Unit, Attached | 0 | 0.0% |
| 2 Unit Apartments | 0 | 0.0% |
| 3 or 4 Unit Apartments | 4 | 3.6% |
| 5 to 9 Unit Apartments | 0 | 0.0% |
| 10 or more Apartments | 0 | 0.0% |
| Mobile Home / Other | 49 | 43.8% |
| Total | 112 | 100.0% |
Housing Structures by Occupancy in Wayland
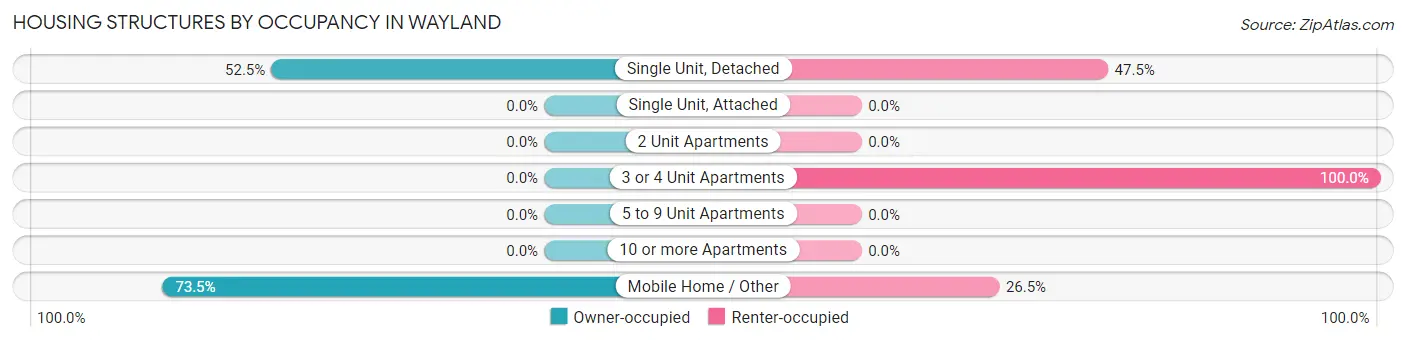
| Structure Type | Owner-occupied | Renter-occupied |
| Single Unit, Detached | 31 (52.5%) | 28 (47.5%) |
| Single Unit, Attached | 0 (0.0%) | 0 (0.0%) |
| 2 Unit Apartments | 0 (0.0%) | 0 (0.0%) |
| 3 or 4 Unit Apartments | 0 (0.0%) | 4 (100.0%) |
| 5 to 9 Unit Apartments | 0 (0.0%) | 0 (0.0%) |
| 10 or more Apartments | 0 (0.0%) | 0 (0.0%) |
| Mobile Home / Other | 36 (73.5%) | 13 (26.5%) |
| Total | 67 (59.8%) | 45 (40.2%) |
Housing Structures by Number of Rooms in Wayland
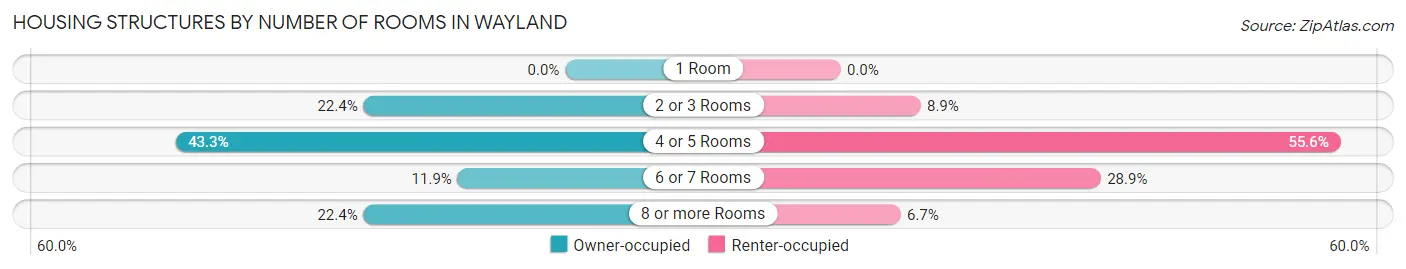
| Number of Rooms | Owner-occupied | Renter-occupied |
| 1 Room | 0 (0.0%) | 0 (0.0%) |
| 2 or 3 Rooms | 15 (22.4%) | 4 (8.9%) |
| 4 or 5 Rooms | 29 (43.3%) | 25 (55.6%) |
| 6 or 7 Rooms | 8 (11.9%) | 13 (28.9%) |
| 8 or more Rooms | 15 (22.4%) | 3 (6.7%) |
| Total | 67 (100.0%) | 45 (100.0%) |
Housing Structure by Heating Type in Wayland
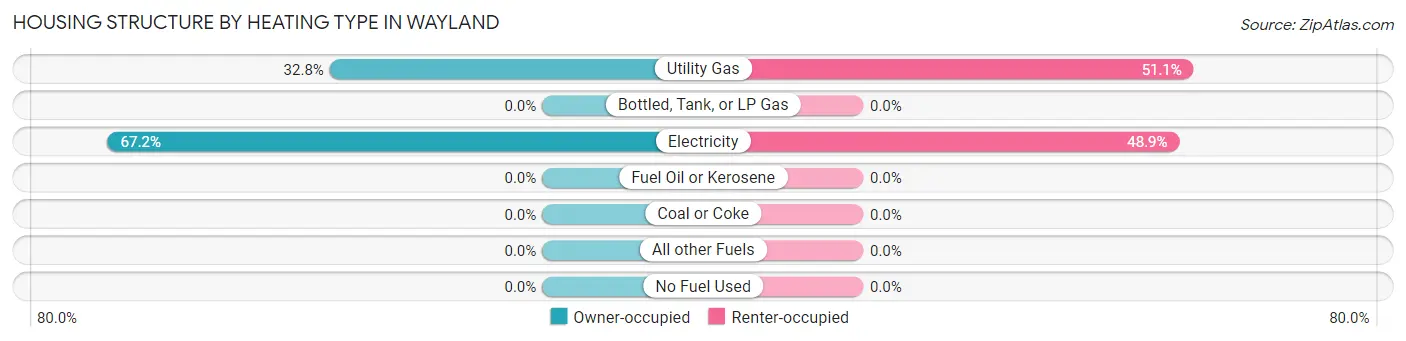
| Heating Type | Owner-occupied | Renter-occupied |
| Utility Gas | 22 (32.8%) | 23 (51.1%) |
| Bottled, Tank, or LP Gas | 0 (0.0%) | 0 (0.0%) |
| Electricity | 45 (67.2%) | 22 (48.9%) |
| Fuel Oil or Kerosene | 0 (0.0%) | 0 (0.0%) |
| Coal or Coke | 0 (0.0%) | 0 (0.0%) |
| All other Fuels | 0 (0.0%) | 0 (0.0%) |
| No Fuel Used | 0 (0.0%) | 0 (0.0%) |
| Total | 67 (100.0%) | 45 (100.0%) |
Household Vehicle Usage in Wayland
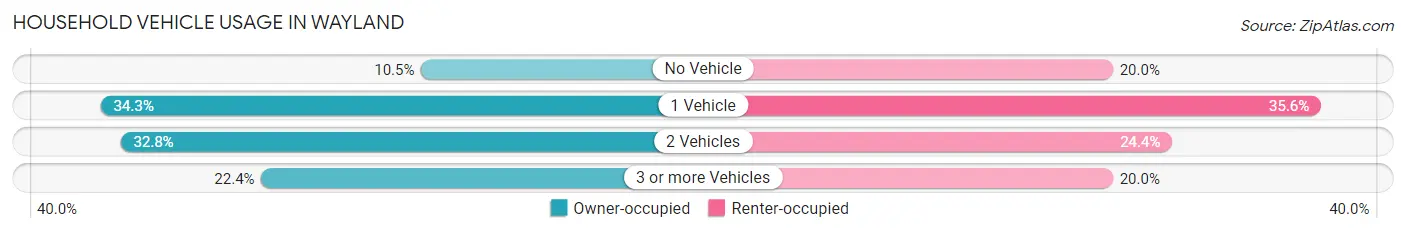
| Vehicles per Household | Owner-occupied | Renter-occupied |
| No Vehicle | 7 (10.4%) | 9 (20.0%) |
| 1 Vehicle | 23 (34.3%) | 16 (35.6%) |
| 2 Vehicles | 22 (32.8%) | 11 (24.4%) |
| 3 or more Vehicles | 15 (22.4%) | 9 (20.0%) |
| Total | 67 (100.0%) | 45 (100.0%) |
Real Estate & Mortgages in Wayland
Real Estate and Mortgage Overview in Wayland
| Characteristic | Without Mortgage | With Mortgage |
| Housing Units | 41 | 26 |
| Median Property Value | $18,100 | $0 |
| Median Household Income | $31,979 | $1 |
| Monthly Housing Costs | $428 | $0 |
| Real Estate Taxes | $199 | $6 |
Property Value by Mortgage Status in Wayland
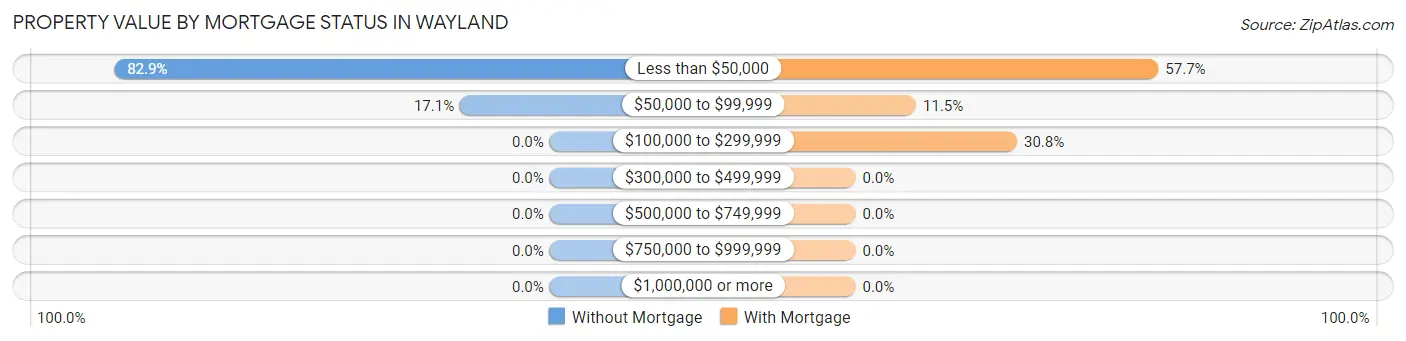
| Property Value | Without Mortgage | With Mortgage |
| Less than $50,000 | 34 (82.9%) | 15 (57.7%) |
| $50,000 to $99,999 | 7 (17.1%) | 3 (11.5%) |
| $100,000 to $299,999 | 0 (0.0%) | 8 (30.8%) |
| $300,000 to $499,999 | 0 (0.0%) | 0 (0.0%) |
| $500,000 to $749,999 | 0 (0.0%) | 0 (0.0%) |
| $750,000 to $999,999 | 0 (0.0%) | 0 (0.0%) |
| $1,000,000 or more | 0 (0.0%) | 0 (0.0%) |
| Total | 41 (100.0%) | 26 (100.0%) |
Household Income by Mortgage Status in Wayland
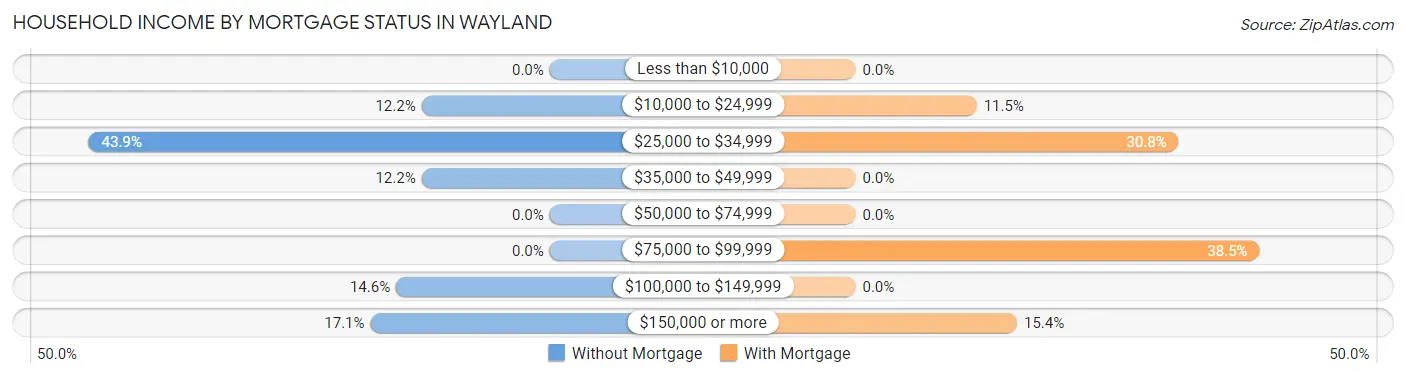
| Household Income | Without Mortgage | With Mortgage |
| Less than $10,000 | 0 (0.0%) | 0 (0.0%) |
| $10,000 to $24,999 | 5 (12.2%) | 3 (11.5%) |
| $25,000 to $34,999 | 18 (43.9%) | 8 (30.8%) |
| $35,000 to $49,999 | 5 (12.2%) | 0 (0.0%) |
| $50,000 to $74,999 | 0 (0.0%) | 0 (0.0%) |
| $75,000 to $99,999 | 0 (0.0%) | 10 (38.5%) |
| $100,000 to $149,999 | 6 (14.6%) | 0 (0.0%) |
| $150,000 or more | 7 (17.1%) | 4 (15.4%) |
| Total | 41 (100.0%) | 26 (100.0%) |
Property Value to Household Income Ratio in Wayland
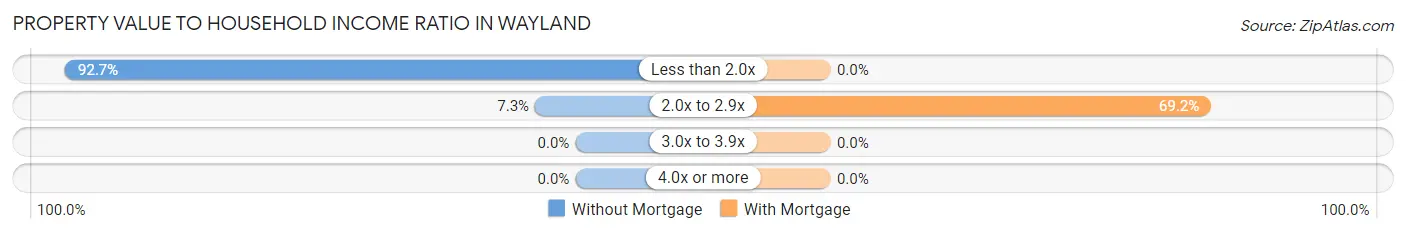
| Value-to-Income Ratio | Without Mortgage | With Mortgage |
| Less than 2.0x | 38 (92.7%) | 0 (0.0%) |
| 2.0x to 2.9x | 3 (7.3%) | 18 (69.2%) |
| 3.0x to 3.9x | 0 (0.0%) | 0 (0.0%) |
| 4.0x or more | 0 (0.0%) | 0 (0.0%) |
| Total | 41 (100.0%) | 26 (100.0%) |
Real Estate Taxes by Mortgage Status in Wayland
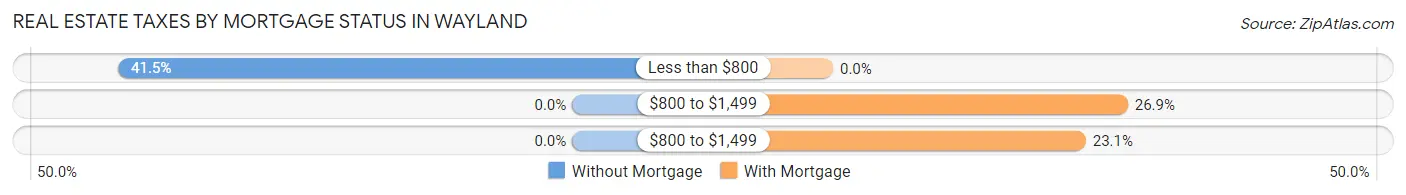
| Property Taxes | Without Mortgage | With Mortgage |
| Less than $800 | 17 (41.5%) | 0 (0.0%) |
| $800 to $1,499 | 0 (0.0%) | 7 (26.9%) |
| $800 to $1,499 | 0 (0.0%) | 6 (23.1%) |
| Total | 41 (100.0%) | 26 (100.0%) |
Health & Disability in Wayland
Health Insurance Coverage by Age in Wayland
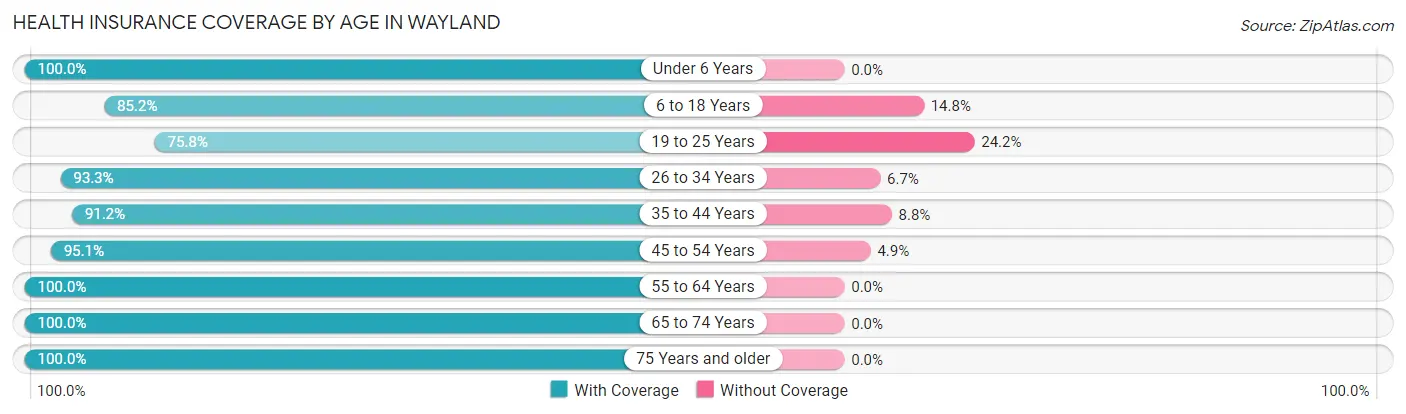
| Age Bracket | With Coverage | Without Coverage |
| Under 6 Years | 41 (100.0%) | 0 (0.0%) |
| 6 to 18 Years | 46 (85.2%) | 8 (14.8%) |
| 19 to 25 Years | 25 (75.8%) | 8 (24.2%) |
| 26 to 34 Years | 42 (93.3%) | 3 (6.7%) |
| 35 to 44 Years | 31 (91.2%) | 3 (8.8%) |
| 45 to 54 Years | 39 (95.1%) | 2 (4.9%) |
| 55 to 64 Years | 34 (100.0%) | 0 (0.0%) |
| 65 to 74 Years | 44 (100.0%) | 0 (0.0%) |
| 75 Years and older | 3 (100.0%) | 0 (0.0%) |
| Total | 305 (92.7%) | 24 (7.3%) |
Health Insurance Coverage by Citizenship Status in Wayland
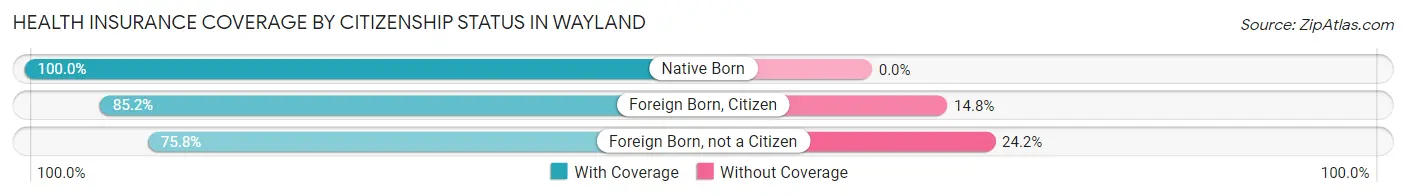
| Citizenship Status | With Coverage | Without Coverage |
| Native Born | 41 (100.0%) | 0 (0.0%) |
| Foreign Born, Citizen | 46 (85.2%) | 8 (14.8%) |
| Foreign Born, not a Citizen | 25 (75.8%) | 8 (24.2%) |
Health Insurance Coverage by Household Income in Wayland
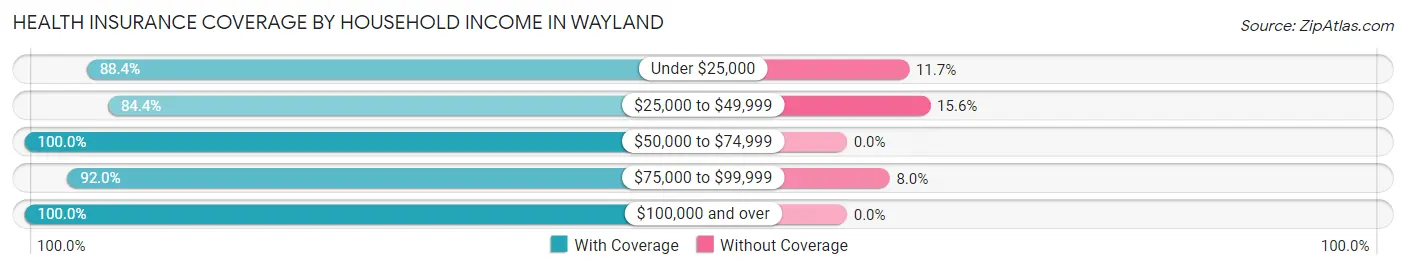
| Household Income | With Coverage | Without Coverage |
| Under $25,000 | 91 (88.3%) | 12 (11.7%) |
| $25,000 to $49,999 | 54 (84.4%) | 10 (15.6%) |
| $50,000 to $74,999 | 55 (100.0%) | 0 (0.0%) |
| $75,000 to $99,999 | 23 (92.0%) | 2 (8.0%) |
| $100,000 and over | 73 (100.0%) | 0 (0.0%) |
Public vs Private Health Insurance Coverage by Age in Wayland
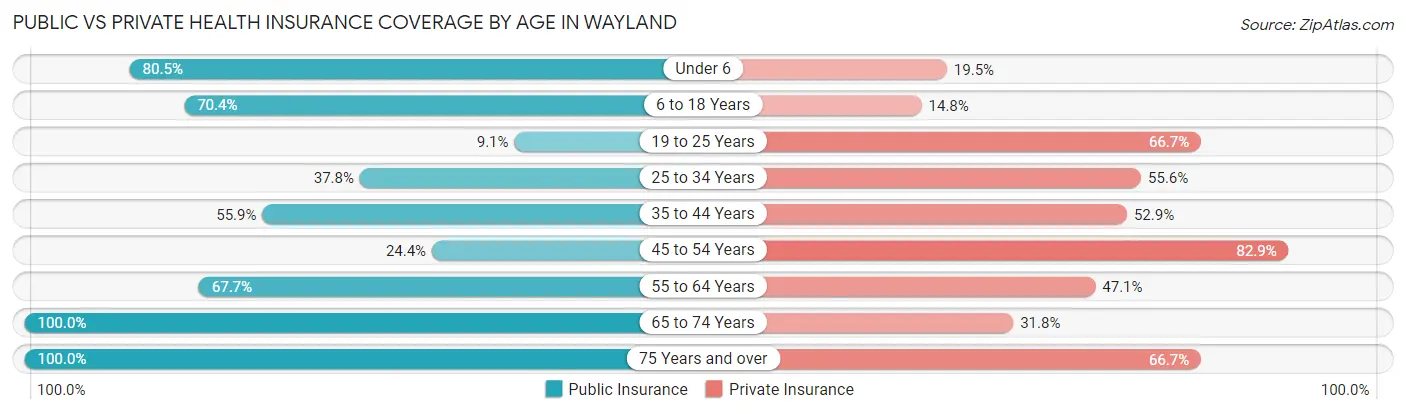
| Age Bracket | Public Insurance | Private Insurance |
| Under 6 | 33 (80.5%) | 8 (19.5%) |
| 6 to 18 Years | 38 (70.4%) | 8 (14.8%) |
| 19 to 25 Years | 3 (9.1%) | 22 (66.7%) |
| 25 to 34 Years | 17 (37.8%) | 25 (55.6%) |
| 35 to 44 Years | 19 (55.9%) | 18 (52.9%) |
| 45 to 54 Years | 10 (24.4%) | 34 (82.9%) |
| 55 to 64 Years | 23 (67.6%) | 16 (47.1%) |
| 65 to 74 Years | 44 (100.0%) | 14 (31.8%) |
| 75 Years and over | 3 (100.0%) | 2 (66.7%) |
| Total | 190 (57.8%) | 147 (44.7%) |
Disability Status by Sex by Age in Wayland
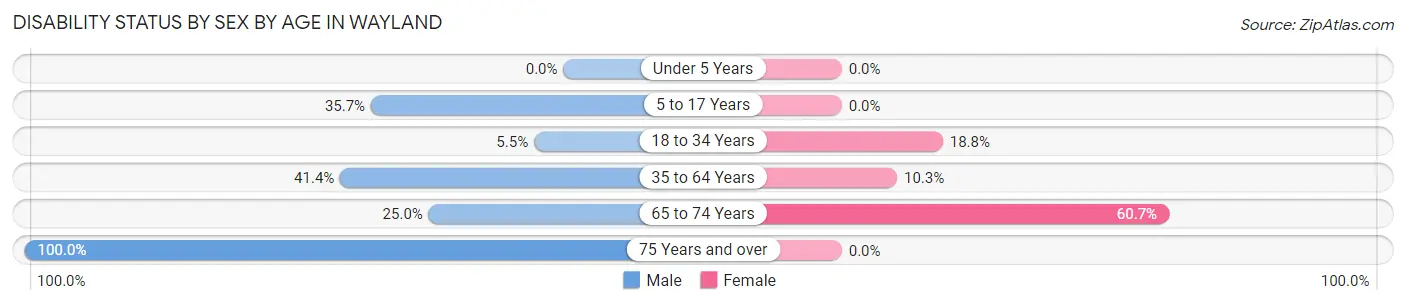
| Age Bracket | Male | Female |
| Under 5 Years | 0 (0.0%) | 0 (0.0%) |
| 5 to 17 Years | 5 (35.7%) | 0 (0.0%) |
| 18 to 34 Years | 3 (5.4%) | 6 (18.8%) |
| 35 to 64 Years | 29 (41.4%) | 4 (10.3%) |
| 65 to 74 Years | 4 (25.0%) | 17 (60.7%) |
| 75 Years and over | 3 (100.0%) | 0 (0.0%) |
Disability Class by Sex by Age in Wayland
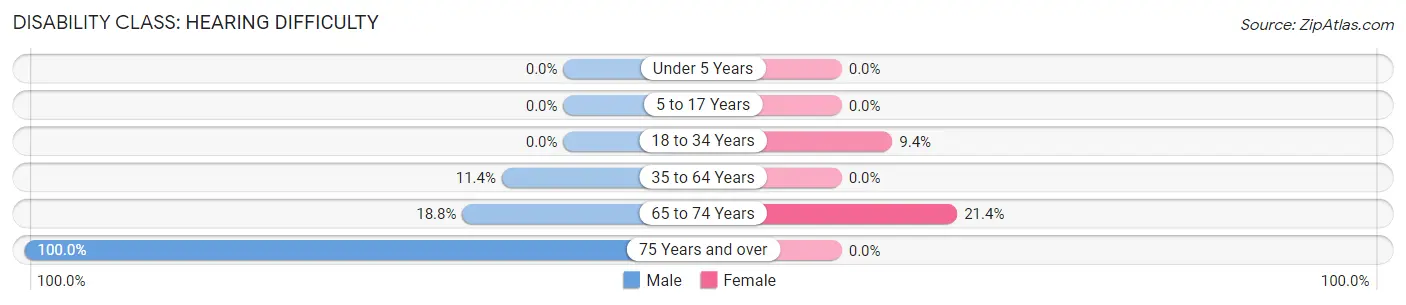
Disability Class: Hearing Difficulty
| Age Bracket | Male | Female |
| Under 5 Years | 0 (0.0%) | 0 (0.0%) |
| 5 to 17 Years | 0 (0.0%) | 0 (0.0%) |
| 18 to 34 Years | 0 (0.0%) | 3 (9.4%) |
| 35 to 64 Years | 8 (11.4%) | 0 (0.0%) |
| 65 to 74 Years | 3 (18.8%) | 6 (21.4%) |
| 75 Years and over | 3 (100.0%) | 0 (0.0%) |
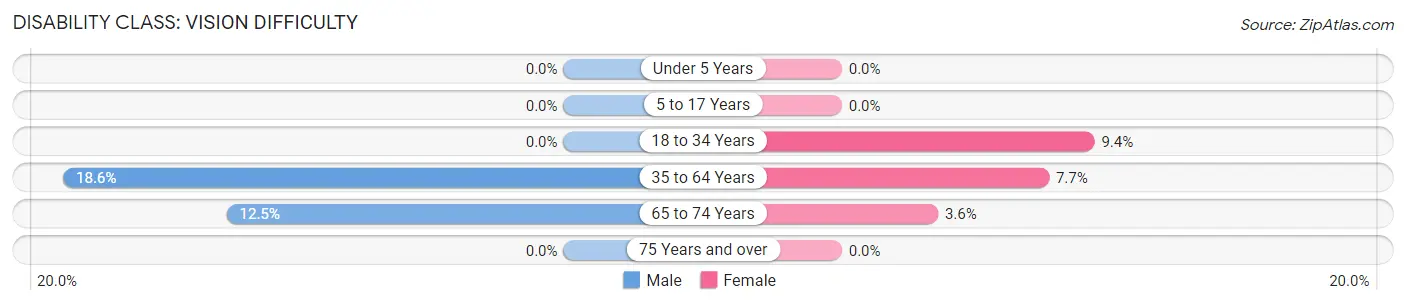
Disability Class: Vision Difficulty
| Age Bracket | Male | Female |
| Under 5 Years | 0 (0.0%) | 0 (0.0%) |
| 5 to 17 Years | 0 (0.0%) | 0 (0.0%) |
| 18 to 34 Years | 0 (0.0%) | 3 (9.4%) |
| 35 to 64 Years | 13 (18.6%) | 3 (7.7%) |
| 65 to 74 Years | 2 (12.5%) | 1 (3.6%) |
| 75 Years and over | 0 (0.0%) | 0 (0.0%) |
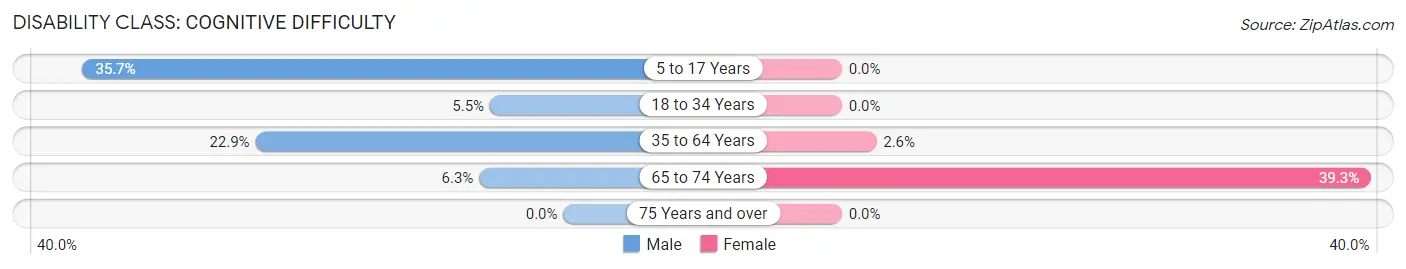
Disability Class: Cognitive Difficulty
| Age Bracket | Male | Female |
| 5 to 17 Years | 5 (35.7%) | 0 (0.0%) |
| 18 to 34 Years | 3 (5.4%) | 0 (0.0%) |
| 35 to 64 Years | 16 (22.9%) | 1 (2.6%) |
| 65 to 74 Years | 1 (6.2%) | 11 (39.3%) |
| 75 Years and over | 0 (0.0%) | 0 (0.0%) |
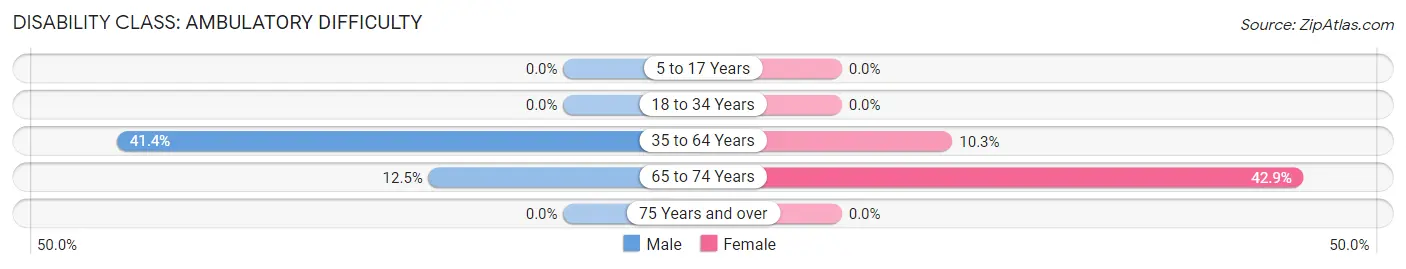
Disability Class: Ambulatory Difficulty
| Age Bracket | Male | Female |
| 5 to 17 Years | 0 (0.0%) | 0 (0.0%) |
| 18 to 34 Years | 0 (0.0%) | 0 (0.0%) |
| 35 to 64 Years | 29 (41.4%) | 4 (10.3%) |
| 65 to 74 Years | 2 (12.5%) | 12 (42.9%) |
| 75 Years and over | 0 (0.0%) | 0 (0.0%) |
Disability Class: Self-Care Difficulty
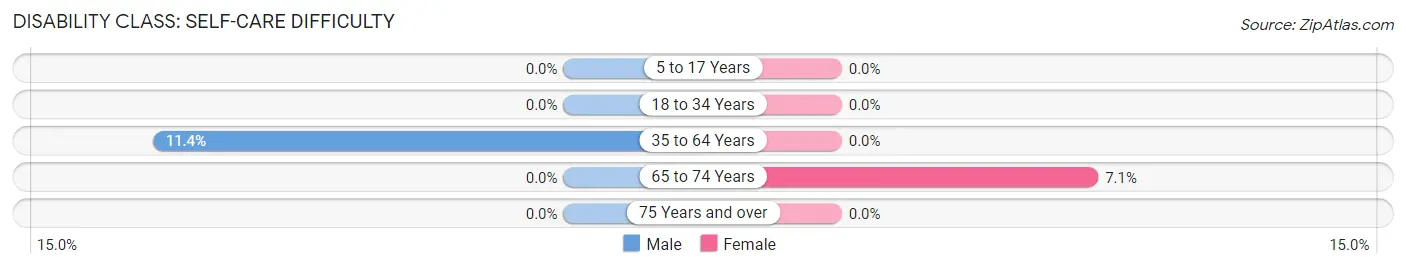
| Age Bracket | Male | Female |
| 5 to 17 Years | 0 (0.0%) | 0 (0.0%) |
| 18 to 34 Years | 0 (0.0%) | 0 (0.0%) |
| 35 to 64 Years | 8 (11.4%) | 0 (0.0%) |
| 65 to 74 Years | 0 (0.0%) | 2 (7.1%) |
| 75 Years and over | 0 (0.0%) | 0 (0.0%) |
Technology Access in Wayland
Computing Device Access in Wayland
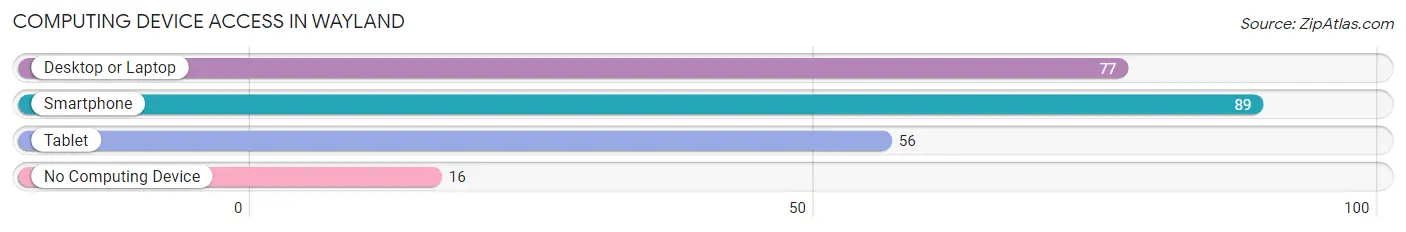
| Device Type | # Households | % Households |
| Desktop or Laptop | 77 | 68.8% |
| Smartphone | 89 | 79.5% |
| Tablet | 56 | 50.0% |
| No Computing Device | 16 | 14.3% |
| Total | 112 | 100.0% |
Internet Access in Wayland
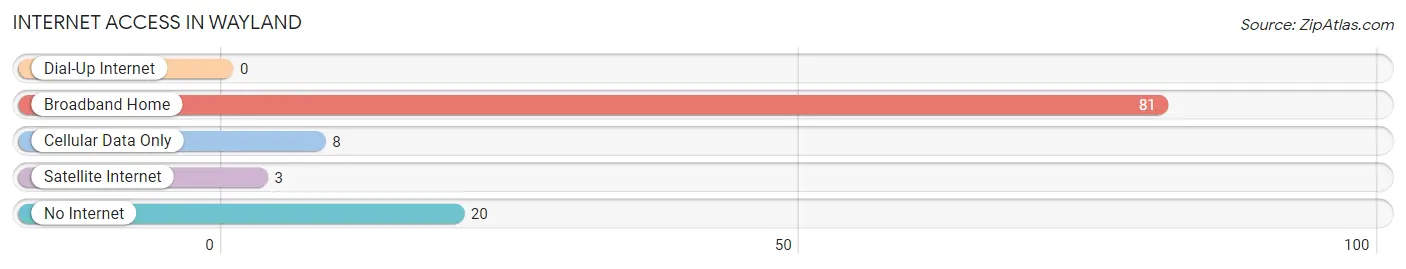
| Internet Type | # Households | % Households |
| Dial-Up Internet | 0 | 0.0% |
| Broadband Home | 81 | 72.3% |
| Cellular Data Only | 8 | 7.1% |
| Satellite Internet | 3 | 2.7% |
| No Internet | 20 | 17.9% |
| Total | 112 | 100.0% |
Wayland Summary
History
The city of Wayland, Kentucky is located in the western part of the state, in the county of Muhlenberg. It is situated on the banks of the Green River, and is part of the Owensboro metropolitan area. The city was founded in 1820 by William Wayland, a Revolutionary War veteran, and was originally known as Wayland’s Station. The city was incorporated in 1872, and has since grown to a population of over 4,000 people.
The city of Wayland has a rich history, and has been home to many notable figures throughout its history. The city was the birthplace of the famous Kentucky politician and statesman, John C. Breckinridge, who served as the 14th Vice President of the United States. The city was also the home of the famous Kentucky author, Jesse Stuart, who wrote many books about the area.
Geography
Wayland is located in the western part of Kentucky, in the county of Muhlenberg. It is situated on the banks of the Green River, and is part of the Owensboro metropolitan area. The city is located in a region of rolling hills and valleys, and is surrounded by farmland. The city is located approximately 30 miles from the state capital of Frankfort, and is about an hour’s drive from Louisville and Lexington.
The climate in Wayland is generally mild, with temperatures ranging from the low 30s in the winter to the mid-80s in the summer. The city receives an average of 45 inches of precipitation per year, with most of it falling in the spring and summer months.
Economy
The economy of Wayland is largely based on agriculture and manufacturing. The city is home to several large manufacturing plants, including a paper mill, a steel mill, and a plastics plant. The city is also home to several small businesses, including restaurants, retail stores, and service providers.
The city is also home to several educational institutions, including a community college and a technical school. The city is also home to a number of churches, and is served by several local media outlets, including a newspaper and a radio station.
Demographics
As of the 2010 census, the population of Wayland was 4,072. The racial makeup of the city was 94.3% White, 2.7% African American, 0.3% Native American, 0.3% Asian, 0.1% Pacific Islander, 0.7% from other races, and 1.9% from two or more races. Hispanic or Latino of any race were 2.2% of the population.
The median income for a household in the city was $31,250, and the median income for a family was $37,500. The per capita income for the city was $17,845. About 17.2% of families and 20.2% of the population were below the poverty line, including 28.3% of those under age 18 and 11.2% of those age 65 or over.
Conclusion
Wayland, Kentucky is a small city with a rich history and a diverse economy. The city is home to several large manufacturing plants, as well as a number of small businesses and educational institutions. The city has a population of over 4,000 people, and the racial makeup of the city is predominantly white. The median income for a household in the city is $31,250, and the per capita income is $17,845. Wayland is a great place to live, work, and raise a family.
Common Questions
What is Per Capita Income in Wayland?
Per Capita income in Wayland is $18,610.
What is the Median Family Income in Wayland?
Median Family Income in Wayland is $43,750.
What is the Median Household income in Wayland?
Median Household Income in Wayland is $31,667.
What is Income or Wage Gap in Wayland?
Income or Wage Gap in Wayland is 11.1%.
Women in Wayland earn 88.9 cents for every dollar earned by a man.
What is Family Income Deficit in Wayland?
Family Income Deficit in Wayland is $13,009.
Families that are below poverty line in Wayland earn $13,009 less on average than the poverty threshold level.
What is Inequality or Gini Index in Wayland?
Inequality or Gini Index in Wayland is 0.50.
What is the Total Population of Wayland?
Total Population of Wayland is 329.
What is the Total Male Population of Wayland?
Total Male Population of Wayland is 178.
What is the Total Female Population of Wayland?
Total Female Population of Wayland is 151.
What is the Ratio of Males per 100 Females in Wayland?
There are 117.88 Males per 100 Females in Wayland.
What is the Ratio of Females per 100 Males in Wayland?
There are 84.83 Females per 100 Males in Wayland.
What is the Median Population Age in Wayland?
Median Population Age in Wayland is 34.2 Years.
What is the Average Family Size in Wayland
Average Family Size in Wayland is 3.5 People.
What is the Average Household Size in Wayland
Average Household Size in Wayland is 2.9 People.
How Large is the Labor Force in Wayland?
There are 118 People in the Labor Forcein in Wayland.
What is the Percentage of People in the Labor Force in Wayland?
46.1% of People are in the Labor Force in Wayland.
What is the Unemployment Rate in Wayland?
Unemployment Rate in Wayland is 8.5%.