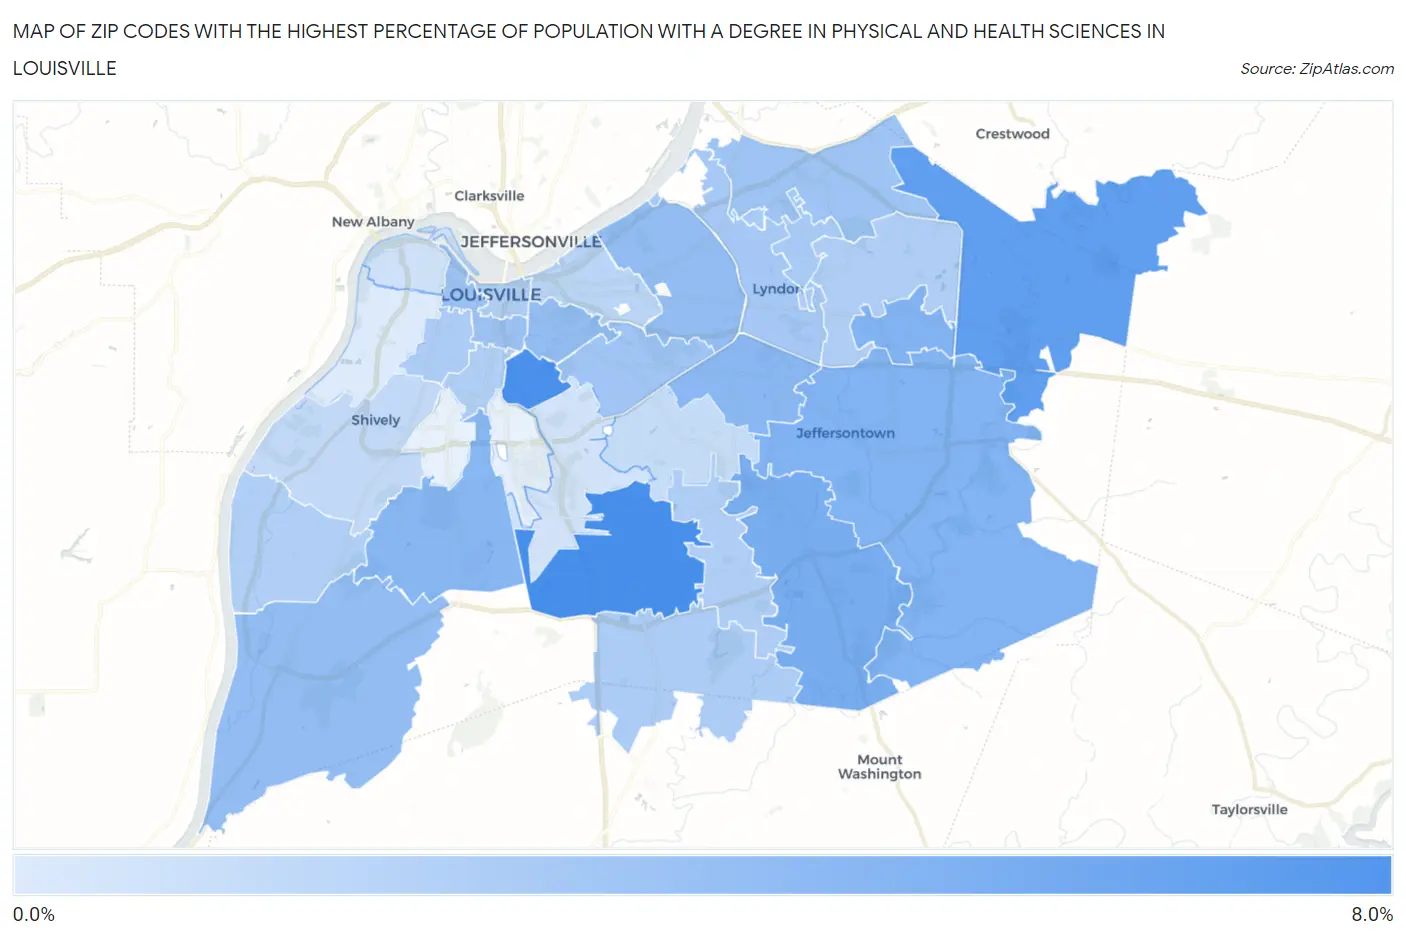
Zip Codes with the Highest Percentage of Population with a Degree in Physical and Health Sciences in Louisville, KY
RELATED REPORTS & OPTIONS
Physical and Health Sciences
Louisville
Compare Zip Codes
Map of Zip Codes with the Highest Percentage of Population with a Degree in Physical and Health Sciences in Louisville
0.20%
6.3%

Zip Codes with the Highest Percentage of Population with a Degree in Physical and Health Sciences in Louisville, KY
| Zip Code | % Graduates | vs State | vs National | |
| 1. | 40219 | 6.3% | 3.1%(+3.22)#83 | 3.1%(+3.20)#2,986 |
| 2. | 40217 | 6.2% | 3.1%(+3.09)#87 | 3.1%(+3.08)#3,103 |
| 3. | 40245 | 5.3% | 3.1%(+2.18)#102 | 3.1%(+2.17)#4,123 |
| 4. | 40291 | 4.3% | 3.1%(+1.21)#129 | 3.1%(+1.20)#5,970 |
| 5. | 40299 | 3.9% | 3.1%(+0.824)#142 | 3.1%(+0.812)#7,008 |
| 6. | 40243 | 3.9% | 3.1%(+0.784)#143 | 3.1%(+0.772)#7,129 |
| 7. | 40214 | 3.6% | 3.1%(+0.535)#151 | 3.1%(+0.523)#7,979 |
| 8. | 40220 | 3.5% | 3.1%(+0.454)#155 | 3.1%(+0.442)#8,275 |
| 9. | 40204 | 3.2% | 3.1%(+0.094)#172 | 3.1%(+0.082)#9,648 |
| 10. | 40272 | 3.2% | 3.1%(+0.080)#173 | 3.1%(+0.068)#9,693 |
| 11. | 40207 | 3.2% | 3.1%(+0.066)#174 | 3.1%(+0.054)#9,758 |
| 12. | 40203 | 2.8% | 3.1%(-0.277)#194 | 3.1%(-0.289)#11,268 |
| 13. | 40241 | 2.7% | 3.1%(-0.397)#203 | 3.1%(-0.409)#11,828 |
| 14. | 40205 | 2.6% | 3.1%(-0.470)#207 | 3.1%(-0.482)#12,154 |
| 15. | 40222 | 2.4% | 3.1%(-0.653)#214 | 3.1%(-0.665)#13,029 |
| 16. | 40242 | 2.3% | 3.1%(-0.801)#225 | 3.1%(-0.813)#13,740 |
| 17. | 40229 | 2.1% | 3.1%(-0.943)#233 | 3.1%(-0.955)#14,389 |
| 18. | 40210 | 2.1% | 3.1%(-0.994)#237 | 3.1%(-1.01)#14,667 |
| 19. | 40202 | 2.1% | 3.1%(-1.03)#241 | 3.1%(-1.05)#14,873 |
| 20. | 40223 | 2.0% | 3.1%(-1.05)#243 | 3.1%(-1.06)#14,926 |
| 21. | 40228 | 2.0% | 3.1%(-1.05)#244 | 3.1%(-1.07)#14,965 |
| 22. | 40258 | 2.0% | 3.1%(-1.10)#247 | 3.1%(-1.11)#15,151 |
| 23. | 40208 | 1.9% | 3.1%(-1.15)#251 | 3.1%(-1.16)#15,391 |
| 24. | 40206 | 1.6% | 3.1%(-1.50)#272 | 3.1%(-1.52)#16,934 |
| 25. | 40216 | 1.3% | 3.1%(-1.77)#288 | 3.1%(-1.78)#18,051 |
| 26. | 40218 | 1.1% | 3.1%(-1.95)#301 | 3.1%(-1.96)#18,733 |
| 27. | 40212 | 0.78% | 3.1%(-2.30)#315 | 3.1%(-2.32)#19,907 |
| 28. | 40213 | 0.67% | 3.1%(-2.42)#323 | 3.1%(-2.43)#20,227 |
| 29. | 40211 | 0.20% | 3.1%(-2.88)#328 | 3.1%(-2.90)#21,034 |
1
Common Questions
What are the Top 10 Zip Codes with the Highest Percentage of Population with a Degree in Physical and Health Sciences in Louisville, KY?
Top 10 Zip Codes with the Highest Percentage of Population with a Degree in Physical and Health Sciences in Louisville, KY are:
What zip code has the Highest Percentage of Population with a Degree in Physical and Health Sciences in Louisville, KY?
40219 has the Highest Percentage of Population with a Degree in Physical and Health Sciences in Louisville, KY with 6.3%.
What is the Percentage of Population with a Degree in Physical and Health Sciences in Louisville, KY?
Percentage of Population with a Degree in Physical and Health Sciences in Louisville is 3.3%.
What is the Percentage of Population with a Degree in Physical and Health Sciences in Kentucky?
Percentage of Population with a Degree in Physical and Health Sciences in Kentucky is 3.1%.
What is the Percentage of Population with a Degree in Physical and Health Sciences in the United States?
Percentage of Population with a Degree in Physical and Health Sciences in the United States is 3.1%.