Kenton Vale, KY Map & Demographics
Kenton Vale Map
Kenton Vale Overview
$28,220
PER CAPITA INCOME
$60,694
AVG FAMILY INCOME
$58,000
AVG HOUSEHOLD INCOME
41.4%
WAGE / INCOME GAP [ % ]
58.6¢/ $1
WAGE / INCOME GAP [ $ ]
0.36
INEQUALITY / GINI INDEX
143
TOTAL POPULATION
65
MALE POPULATION
78
FEMALE POPULATION
83.33
MALES / 100 FEMALES
120.00
FEMALES / 100 MALES
39.9
MEDIAN AGE
2.5
AVG FAMILY SIZE
2.0
AVG HOUSEHOLD SIZE
76
LABOR FORCE [ PEOPLE ]
62.8%
PERCENT IN LABOR FORCE
Kenton Vale Area Codes
Income in Kenton Vale
Income Overview in Kenton Vale
Per Capita Income in Kenton Vale is $28,220, while median incomes of families and households are $60,694 and $58,000 respectively.
| Characteristic | Number | Measure |
| Per Capita Income | 143 | $28,220 |
| Median Family Income | 41 | $60,694 |
| Mean Family Income | 41 | $63,020 |
| Median Household Income | 70 | $58,000 |
| Mean Household Income | 70 | $58,363 |
| Income Deficit | 41 | $0 |
| Wage / Income Gap (%) | 143 | 41.43% |
| Wage / Income Gap ($) | 143 | 58.57¢ per $1 |
| Gini / Inequality Index | 143 | 0.36 |
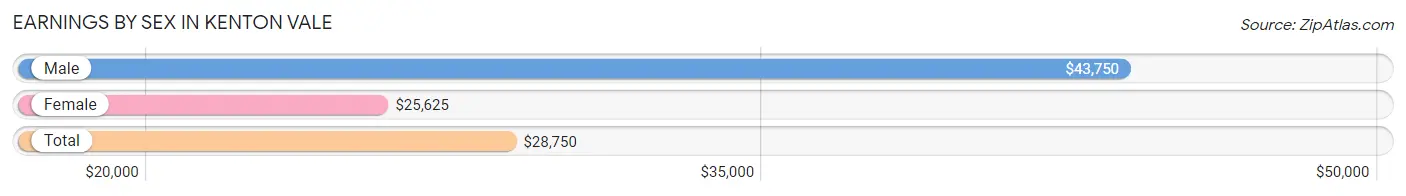
Earnings by Sex in Kenton Vale
Average Earnings in Kenton Vale are $28,750, $43,750 for men and $25,625 for women, a difference of 41.4%.
| Sex | Number | Average Earnings |
| Male | 44 (55.7%) | $43,750 |
| Female | 35 (44.3%) | $25,625 |
| Total | 79 (100.0%) | $28,750 |
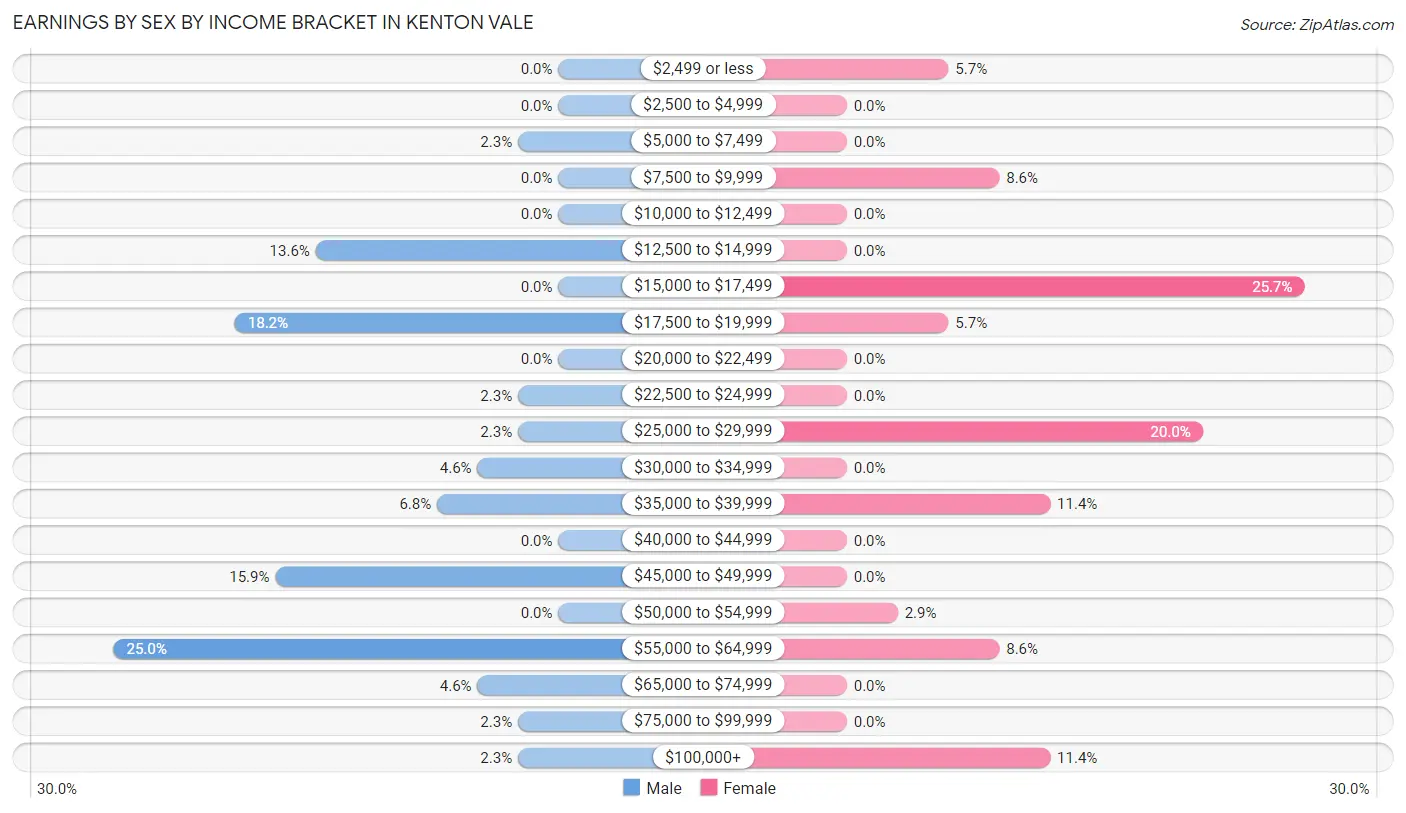
Earnings by Sex by Income Bracket in Kenton Vale
The most common earnings brackets in Kenton Vale are $55,000 to $64,999 for men (11 | 25.0%) and $15,000 to $17,499 for women (9 | 25.7%).
| Income | Male | Female |
| $2,499 or less | 0 (0.0%) | 2 (5.7%) |
| $2,500 to $4,999 | 0 (0.0%) | 0 (0.0%) |
| $5,000 to $7,499 | 1 (2.3%) | 0 (0.0%) |
| $7,500 to $9,999 | 0 (0.0%) | 3 (8.6%) |
| $10,000 to $12,499 | 0 (0.0%) | 0 (0.0%) |
| $12,500 to $14,999 | 6 (13.6%) | 0 (0.0%) |
| $15,000 to $17,499 | 0 (0.0%) | 9 (25.7%) |
| $17,500 to $19,999 | 8 (18.2%) | 2 (5.7%) |
| $20,000 to $22,499 | 0 (0.0%) | 0 (0.0%) |
| $22,500 to $24,999 | 1 (2.3%) | 0 (0.0%) |
| $25,000 to $29,999 | 1 (2.3%) | 7 (20.0%) |
| $30,000 to $34,999 | 2 (4.5%) | 0 (0.0%) |
| $35,000 to $39,999 | 3 (6.8%) | 4 (11.4%) |
| $40,000 to $44,999 | 0 (0.0%) | 0 (0.0%) |
| $45,000 to $49,999 | 7 (15.9%) | 0 (0.0%) |
| $50,000 to $54,999 | 0 (0.0%) | 1 (2.9%) |
| $55,000 to $64,999 | 11 (25.0%) | 3 (8.6%) |
| $65,000 to $74,999 | 2 (4.5%) | 0 (0.0%) |
| $75,000 to $99,999 | 1 (2.3%) | 0 (0.0%) |
| $100,000+ | 1 (2.3%) | 4 (11.4%) |
| Total | 44 (100.0%) | 35 (100.0%) |
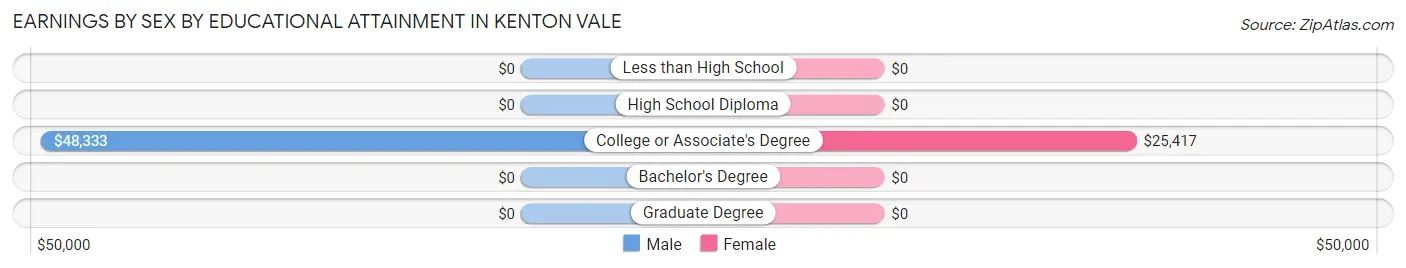
Earnings by Sex by Educational Attainment in Kenton Vale
Average earnings in Kenton Vale are $48,750 for men and $26,042 for women, a difference of 46.6%. Men with an educational attainment of college or associate's degree enjoy the highest average annual earnings of $48,333, while those with college or associate's degree education earn the least with $48,333. Women with an educational attainment of college or associate's degree earn the most with the average annual earnings of $25,417, while those with college or associate's degree education have the smallest earnings of $25,417.
| Educational Attainment | Male Income | Female Income |
| Less than High School | - | - |
| High School Diploma | - | - |
| College or Associate's Degree | $48,333 | $25,417 |
| Bachelor's Degree | - | - |
| Graduate Degree | - | - |
| Total | $48,750 | $26,042 |
Family Income in Kenton Vale
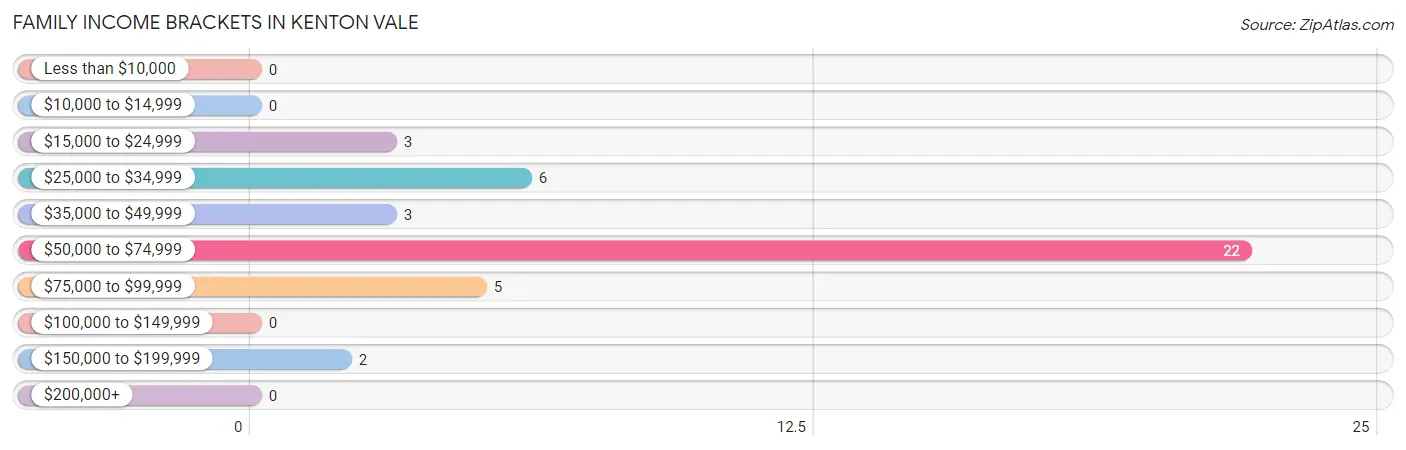
Family Income Brackets in Kenton Vale
According to the Kenton Vale family income data, there are 22 families falling into the $50,000 to $74,999 income range, which is the most common income bracket and makes up 53.7% of all families.
| Income Bracket | # Families | % Families |
| Less than $10,000 | 0 | 0.0% |
| $10,000 to $14,999 | 0 | 0.0% |
| $15,000 to $24,999 | 3 | 7.3% |
| $25,000 to $34,999 | 6 | 14.6% |
| $35,000 to $49,999 | 3 | 7.3% |
| $50,000 to $74,999 | 22 | 53.7% |
| $75,000 to $99,999 | 5 | 12.2% |
| $100,000 to $149,999 | 0 | 0.0% |
| $150,000 to $199,999 | 2 | 4.9% |
| $200,000+ | 0 | 0.0% |
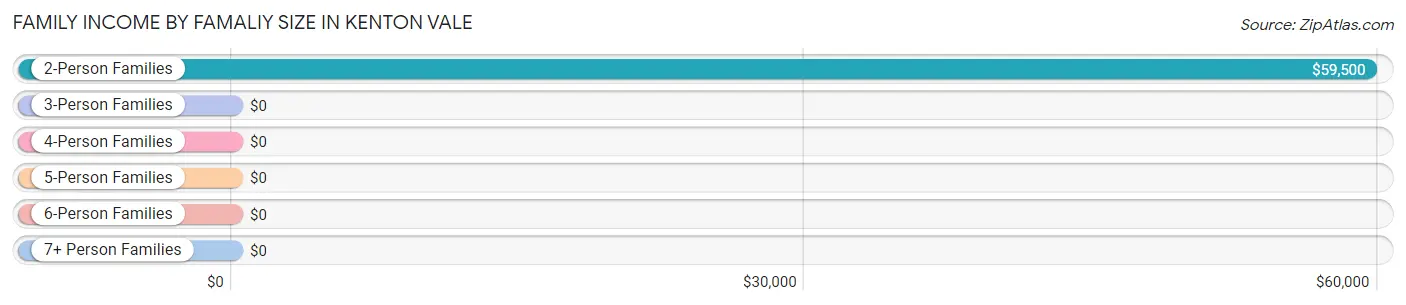
Family Income by Famaliy Size in Kenton Vale
2-person families (34 | 82.9%) account for the highest median family income in Kenton Vale with $59,500 per family, while 2-person families (34 | 82.9%) have the highest median income of $29,750 per family member.
| Income Bracket | # Families | Median Income |
| 2-Person Families | 34 (82.9%) | $59,500 |
| 3-Person Families | 5 (12.2%) | $0 |
| 4-Person Families | 0 (0.0%) | $0 |
| 5-Person Families | 0 (0.0%) | $0 |
| 6-Person Families | 0 (0.0%) | $0 |
| 7+ Person Families | 2 (4.9%) | $0 |
| Total | 41 (100.0%) | $60,694 |
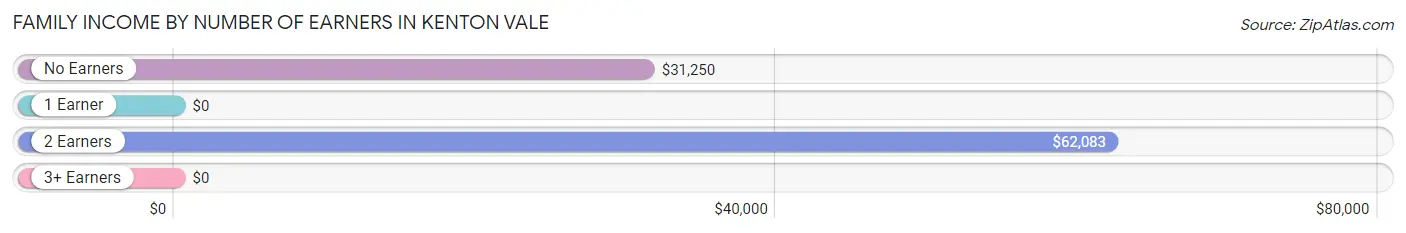
Family Income by Number of Earners in Kenton Vale
| Number of Earners | # Families | Median Income |
| No Earners | 12 (29.3%) | $31,250 |
| 1 Earner | 4 (9.8%) | $0 |
| 2 Earners | 25 (61.0%) | $62,083 |
| 3+ Earners | 0 (0.0%) | $0 |
| Total | 41 (100.0%) | $60,694 |
Household Income in Kenton Vale
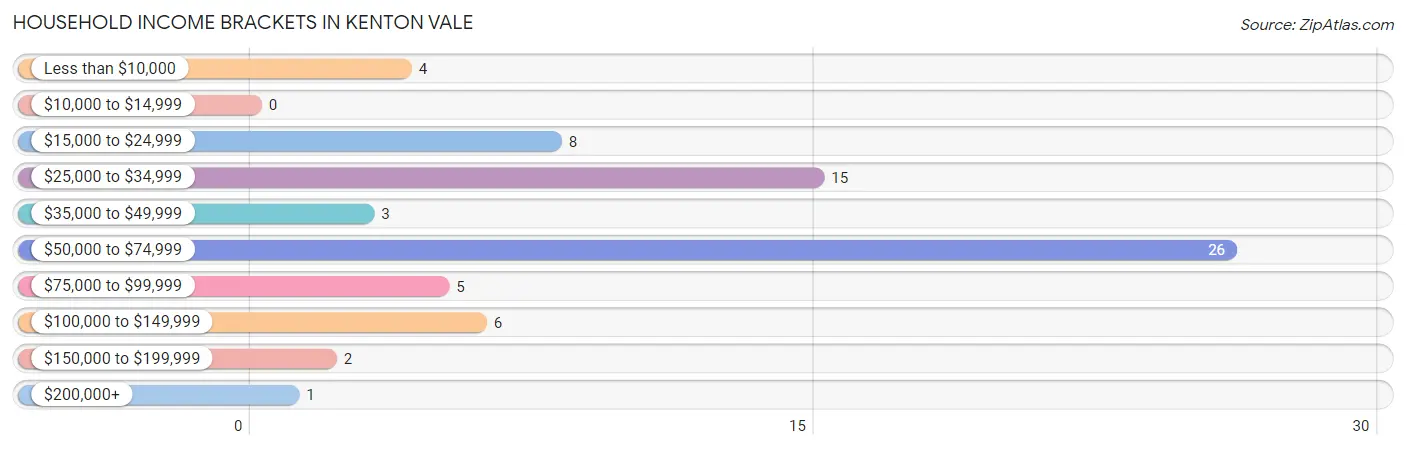
Household Income Brackets in Kenton Vale
With 26 households falling in the category, the $50,000 to $74,999 income range is the most frequent in Kenton Vale, accounting for 37.1% of all households.
| Income Bracket | # Households | % Households |
| Less than $10,000 | 4 | 5.7% |
| $10,000 to $14,999 | 0 | 0.0% |
| $15,000 to $24,999 | 8 | 11.4% |
| $25,000 to $34,999 | 15 | 21.4% |
| $35,000 to $49,999 | 3 | 4.3% |
| $50,000 to $74,999 | 26 | 37.1% |
| $75,000 to $99,999 | 5 | 7.1% |
| $100,000 to $149,999 | 6 | 8.6% |
| $150,000 to $199,999 | 2 | 2.9% |
| $200,000+ | 1 | 1.4% |
Household Income by Householder Age in Kenton Vale
The median household income in Kenton Vale is $58,000, with the highest median household income of $73,571 found in the 25 to 44 years age bracket for the primary householder. A total of 26 households (37.1%) fall into this category.
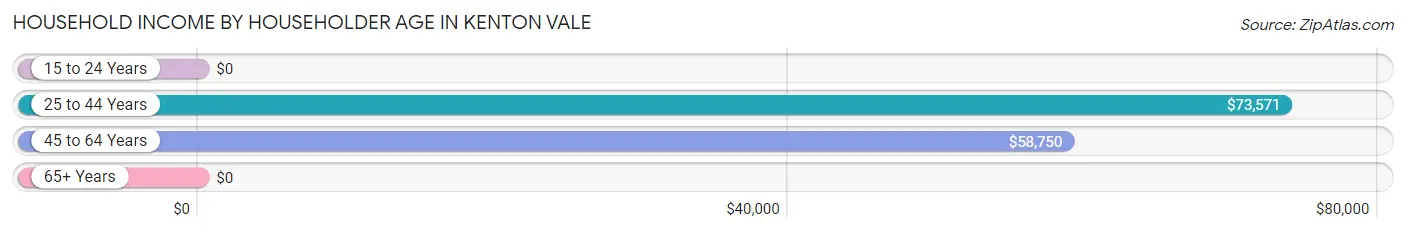
| Income Bracket | # Households | Median Income |
| 15 to 24 Years | 0 (0.0%) | $0 |
| 25 to 44 Years | 26 (37.1%) | $73,571 |
| 45 to 64 Years | 31 (44.3%) | $58,750 |
| 65+ Years | 13 (18.6%) | $0 |
| Total | 70 (100.0%) | $58,000 |
Poverty in Kenton Vale
Income Below Poverty by Sex and Age in Kenton Vale
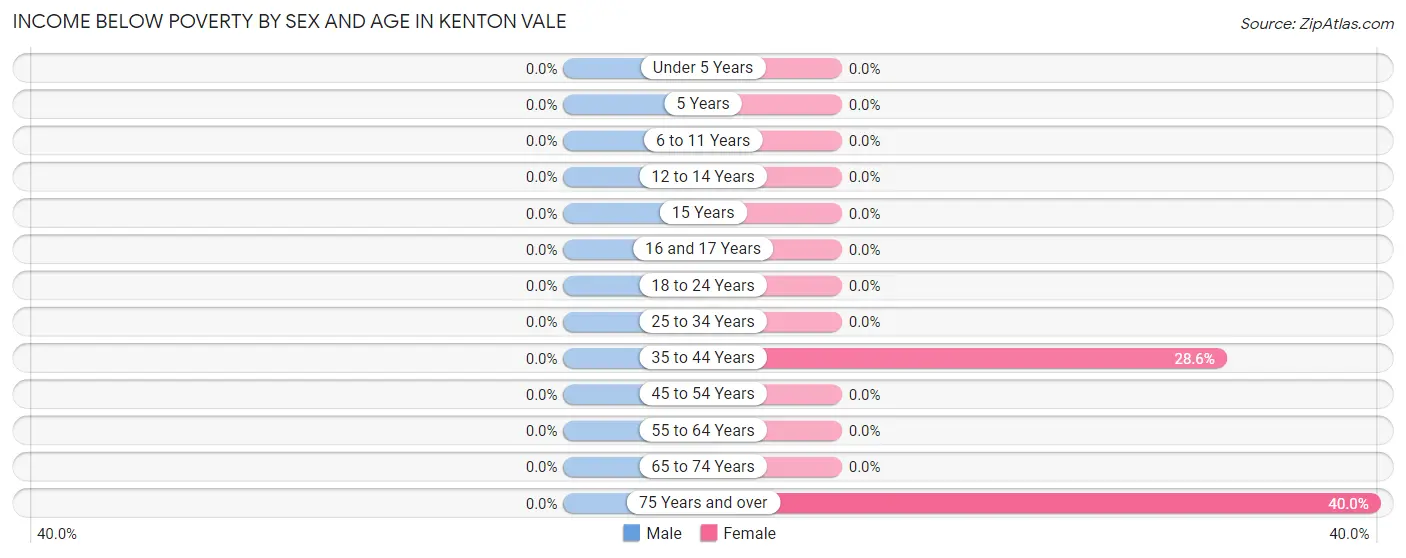
| Age Bracket | Male | Female |
| Under 5 Years | 0 (0.0%) | 0 (0.0%) |
| 5 Years | 0 (0.0%) | 0 (0.0%) |
| 6 to 11 Years | 0 (0.0%) | 0 (0.0%) |
| 12 to 14 Years | 0 (0.0%) | 0 (0.0%) |
| 15 Years | 0 (0.0%) | 0 (0.0%) |
| 16 and 17 Years | 0 (0.0%) | 0 (0.0%) |
| 18 to 24 Years | 0 (0.0%) | 0 (0.0%) |
| 25 to 34 Years | 0 (0.0%) | 0 (0.0%) |
| 35 to 44 Years | 0 (0.0%) | 2 (28.6%) |
| 45 to 54 Years | 0 (0.0%) | 0 (0.0%) |
| 55 to 64 Years | 0 (0.0%) | 0 (0.0%) |
| 65 to 74 Years | 0 (0.0%) | 0 (0.0%) |
| 75 Years and over | 0 (0.0%) | 4 (40.0%) |
| Total | 0 (0.0%) | 6 (7.7%) |
Income Above Poverty by Sex and Age in Kenton Vale
According to the poverty statistics in Kenton Vale, males aged under 5 years and females aged under 5 years are the age groups that are most secure financially, with 100.0% of males and 100.0% of females in these age groups living above the poverty line.
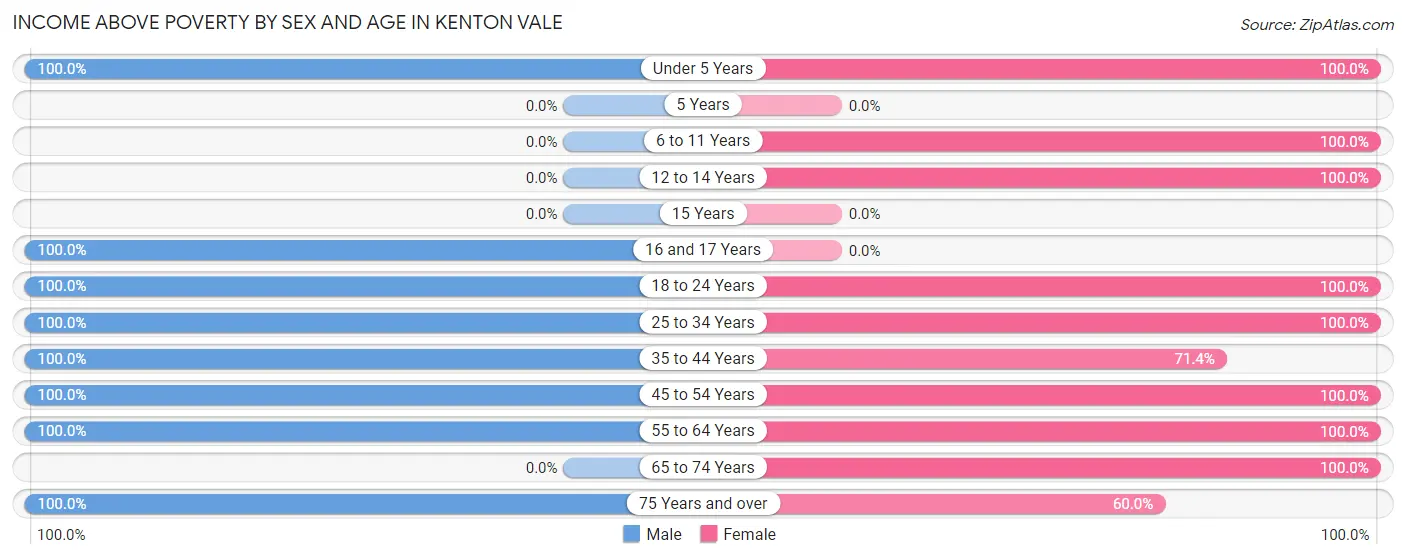
| Age Bracket | Male | Female |
| Under 5 Years | 8 (100.0%) | 7 (100.0%) |
| 5 Years | 0 (0.0%) | 0 (0.0%) |
| 6 to 11 Years | 0 (0.0%) | 2 (100.0%) |
| 12 to 14 Years | 0 (0.0%) | 5 (100.0%) |
| 15 Years | 0 (0.0%) | 0 (0.0%) |
| 16 and 17 Years | 6 (100.0%) | 0 (0.0%) |
| 18 to 24 Years | 1 (100.0%) | 2 (100.0%) |
| 25 to 34 Years | 14 (100.0%) | 14 (100.0%) |
| 35 to 44 Years | 9 (100.0%) | 5 (71.4%) |
| 45 to 54 Years | 9 (100.0%) | 11 (100.0%) |
| 55 to 64 Years | 15 (100.0%) | 18 (100.0%) |
| 65 to 74 Years | 0 (0.0%) | 2 (100.0%) |
| 75 Years and over | 3 (100.0%) | 6 (60.0%) |
| Total | 65 (100.0%) | 72 (92.3%) |
Income Below Poverty Among Married-Couple Families in Kenton Vale
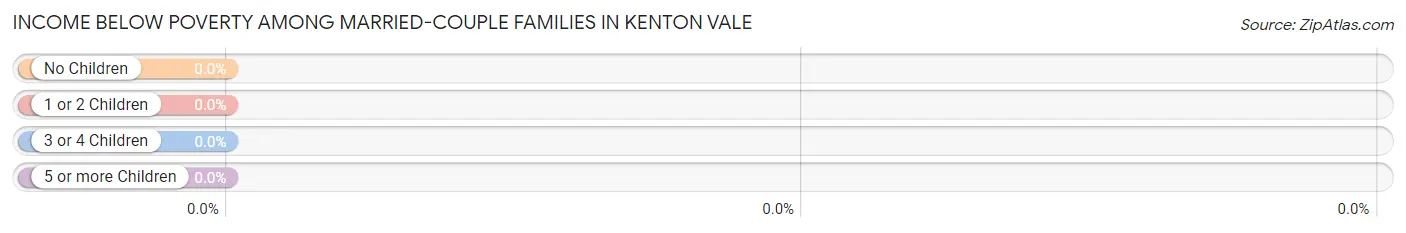
| Children | Above Poverty | Below Poverty |
| No Children | 29 (100.0%) | 0 (0.0%) |
| 1 or 2 Children | 0 (0.0%) | 0 (0.0%) |
| 3 or 4 Children | 0 (0.0%) | 0 (0.0%) |
| 5 or more Children | 2 (100.0%) | 0 (0.0%) |
| Total | 31 (100.0%) | 0 (0.0%) |
Income Below Poverty Among Single-Parent Households in Kenton Vale
| Children | Single Father | Single Mother |
| No Children | 0 (0.0%) | 0 (0.0%) |
| 1 or 2 Children | 0 (0.0%) | 0 (0.0%) |
| 3 or 4 Children | 0 (0.0%) | 0 (0.0%) |
| 5 or more Children | 0 (0.0%) | 0 (0.0%) |
| Total | 0 (0.0%) | 0 (0.0%) |
Income Below Poverty Among Married-Couple vs Single-Parent Households in Kenton Vale
| Children | Married-Couple Families | Single-Parent Households |
| No Children | 0 (0.0%) | 0 (0.0%) |
| 1 or 2 Children | 0 (0.0%) | 0 (0.0%) |
| 3 or 4 Children | 0 (0.0%) | 0 (0.0%) |
| 5 or more Children | 0 (0.0%) | 0 (0.0%) |
| Total | 0 (0.0%) | 0 (0.0%) |
Race in Kenton Vale
The most populous races in Kenton Vale are White / Caucasian (126 | 88.1%), Hispanic or Latino (15 | 10.5%), and Two or more Races (13 | 9.1%).
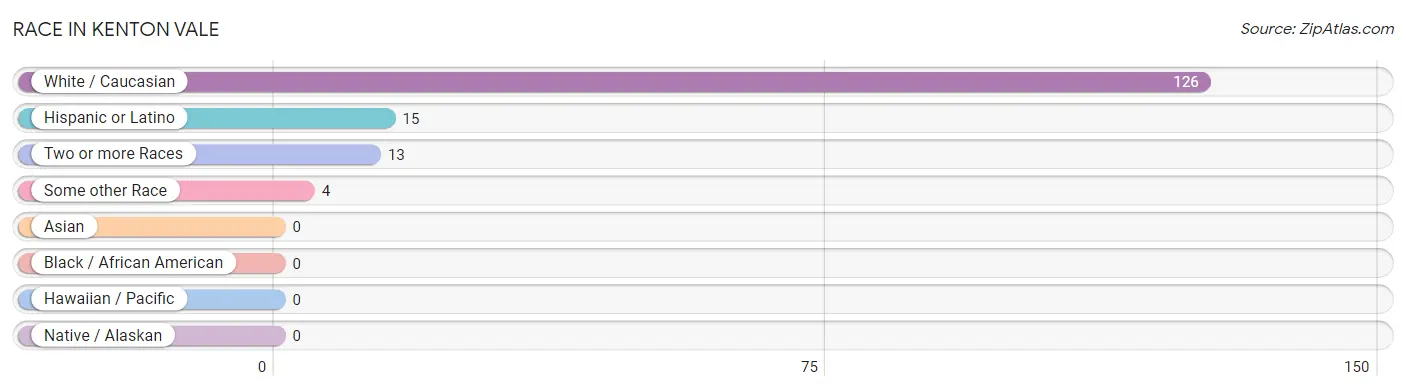
| Race | # Population | % Population |
| Asian | 0 | 0.0% |
| Black / African American | 0 | 0.0% |
| Hawaiian / Pacific | 0 | 0.0% |
| Hispanic or Latino | 15 | 10.5% |
| Native / Alaskan | 0 | 0.0% |
| White / Caucasian | 126 | 88.1% |
| Two or more Races | 13 | 9.1% |
| Some other Race | 4 | 2.8% |
| Total | 143 | 100.0% |
Ancestry in Kenton Vale
The most populous ancestries reported in Kenton Vale are German (41 | 28.7%), English (25 | 17.5%), Italian (10 | 7.0%), Scotch-Irish (10 | 7.0%), and Irish (9 | 6.3%), together accounting for 66.4% of all Kenton Vale residents.
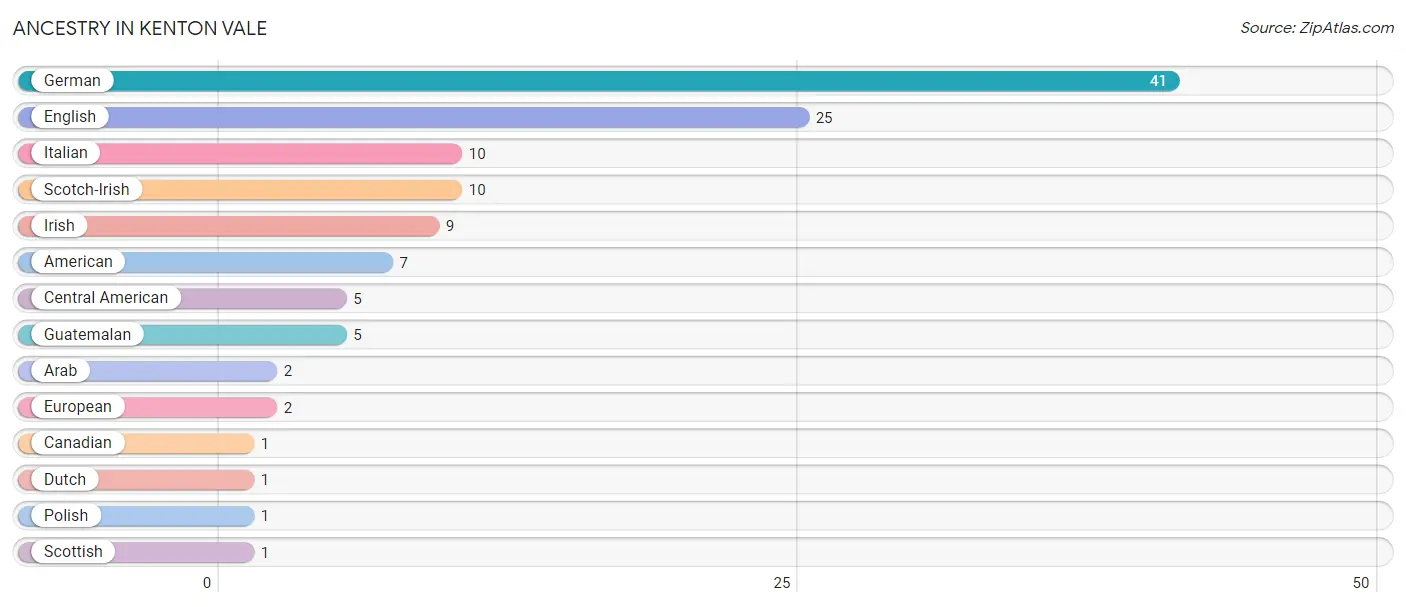
| Ancestry | # Population | % Population |
| American | 7 | 4.9% |
| Arab | 2 | 1.4% |
| Canadian | 1 | 0.7% |
| Central American | 5 | 3.5% |
| Dutch | 1 | 0.7% |
| English | 25 | 17.5% |
| European | 2 | 1.4% |
| German | 41 | 28.7% |
| Guatemalan | 5 | 3.5% |
| Irish | 9 | 6.3% |
| Italian | 10 | 7.0% |
| Polish | 1 | 0.7% |
| Scotch-Irish | 10 | 7.0% |
| Scottish | 1 | 0.7% | View All 14 Rows |
Immigrants in Kenton Vale

| Immigration Origin | # Population | % Population | View All 0 Rows |
Sex and Age in Kenton Vale
Sex and Age in Kenton Vale
The most populous age groups in Kenton Vale are 60 to 64 Years (12 | 18.5%) for men and 60 to 64 Years (15 | 19.2%) for women.
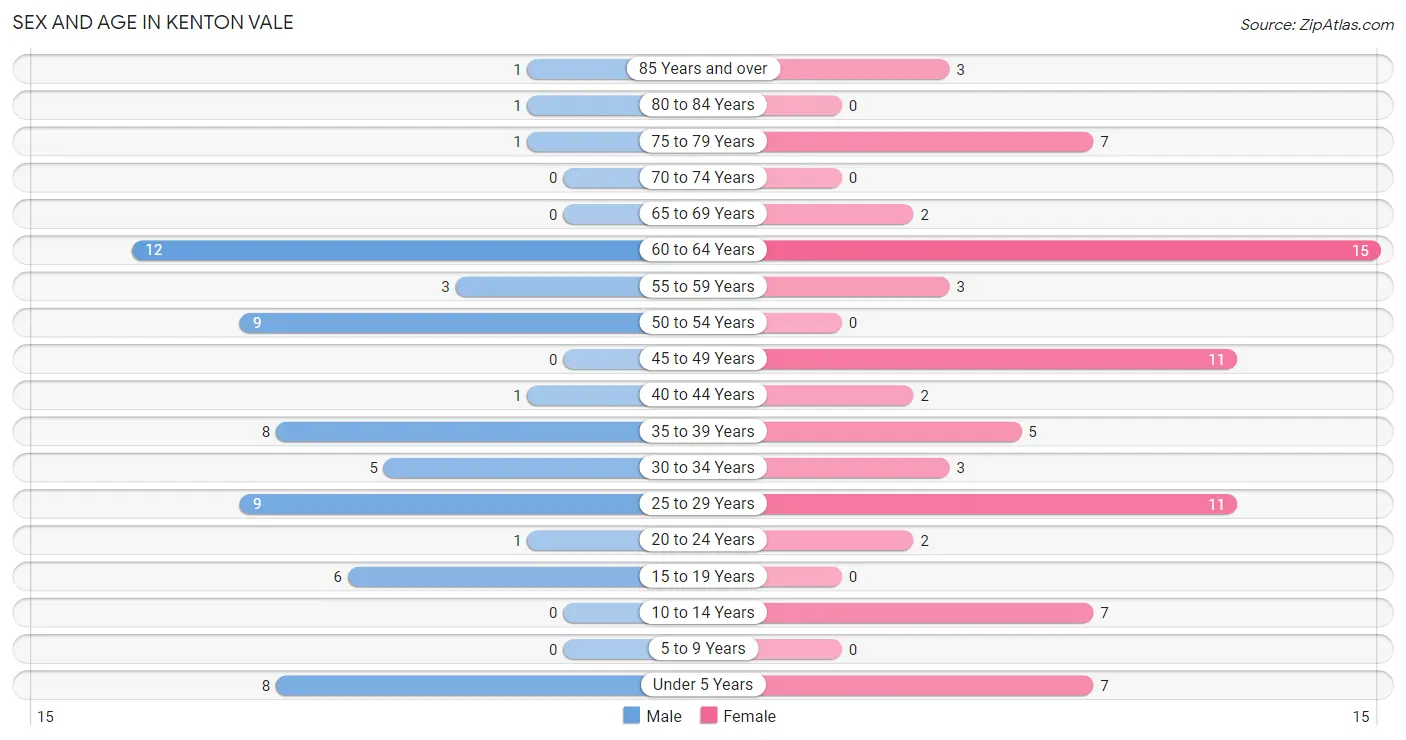
| Age Bracket | Male | Female |
| Under 5 Years | 8 (12.3%) | 7 (9.0%) |
| 5 to 9 Years | 0 (0.0%) | 0 (0.0%) |
| 10 to 14 Years | 0 (0.0%) | 7 (9.0%) |
| 15 to 19 Years | 6 (9.2%) | 0 (0.0%) |
| 20 to 24 Years | 1 (1.5%) | 2 (2.6%) |
| 25 to 29 Years | 9 (13.9%) | 11 (14.1%) |
| 30 to 34 Years | 5 (7.7%) | 3 (3.8%) |
| 35 to 39 Years | 8 (12.3%) | 5 (6.4%) |
| 40 to 44 Years | 1 (1.5%) | 2 (2.6%) |
| 45 to 49 Years | 0 (0.0%) | 11 (14.1%) |
| 50 to 54 Years | 9 (13.9%) | 0 (0.0%) |
| 55 to 59 Years | 3 (4.6%) | 3 (3.8%) |
| 60 to 64 Years | 12 (18.5%) | 15 (19.2%) |
| 65 to 69 Years | 0 (0.0%) | 2 (2.6%) |
| 70 to 74 Years | 0 (0.0%) | 0 (0.0%) |
| 75 to 79 Years | 1 (1.5%) | 7 (9.0%) |
| 80 to 84 Years | 1 (1.5%) | 0 (0.0%) |
| 85 Years and over | 1 (1.5%) | 3 (3.8%) |
| Total | 65 (100.0%) | 78 (100.0%) |
Families and Households in Kenton Vale
Median Family Size in Kenton Vale
The median family size in Kenton Vale is 2.49 persons per family, with single male/father families (5 | 12.2%) accounting for the largest median family size of 3 persons per family. On the other hand, single female/mother families (5 | 12.2%) represent the smallest median family size with 2.00 persons per family.
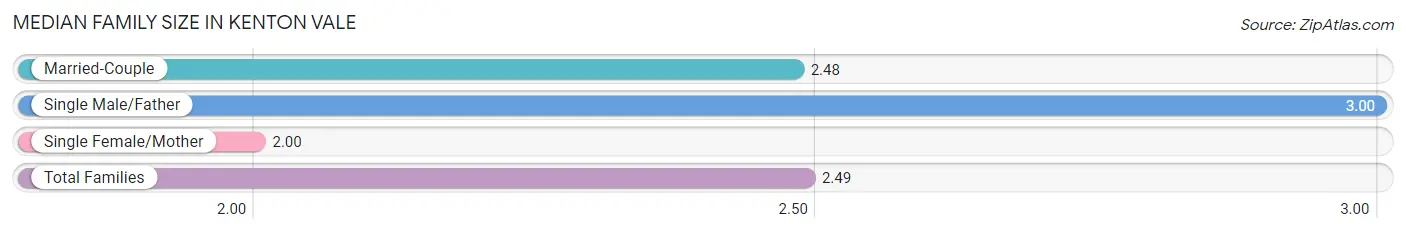
| Family Type | # Families | Family Size |
| Married-Couple | 31 (75.6%) | 2.48 |
| Single Male/Father | 5 (12.2%) | 3.00 |
| Single Female/Mother | 5 (12.2%) | 2.00 |
| Total Families | 41 (100.0%) | 2.49 |
Median Household Size in Kenton Vale
The median household size in Kenton Vale is 2.04 persons per household, with single male/father households (5 | 7.1%) accounting for the largest median household size of 3 persons per household. non-family households (29 | 41.4%) represent the smallest median household size with 1.34 persons per household.
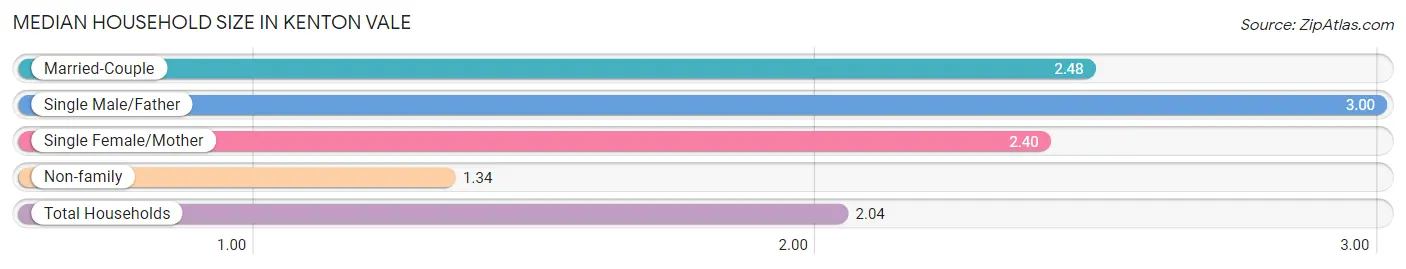
| Household Type | # Households | Household Size |
| Married-Couple | 31 (44.3%) | 2.48 |
| Single Male/Father | 5 (7.1%) | 3.00 |
| Single Female/Mother | 5 (7.1%) | 2.40 |
| Non-family | 29 (41.4%) | 1.34 |
| Total Households | 70 (100.0%) | 2.04 |
Household Size by Marriage Status in Kenton Vale
Out of a total of 70 households in Kenton Vale, 41 (58.6%) are family households, while 29 (41.4%) are nonfamily households. The most numerous type of family households are 2-person households, comprising 32, and the most common type of nonfamily households are 1-person households, comprising 21.
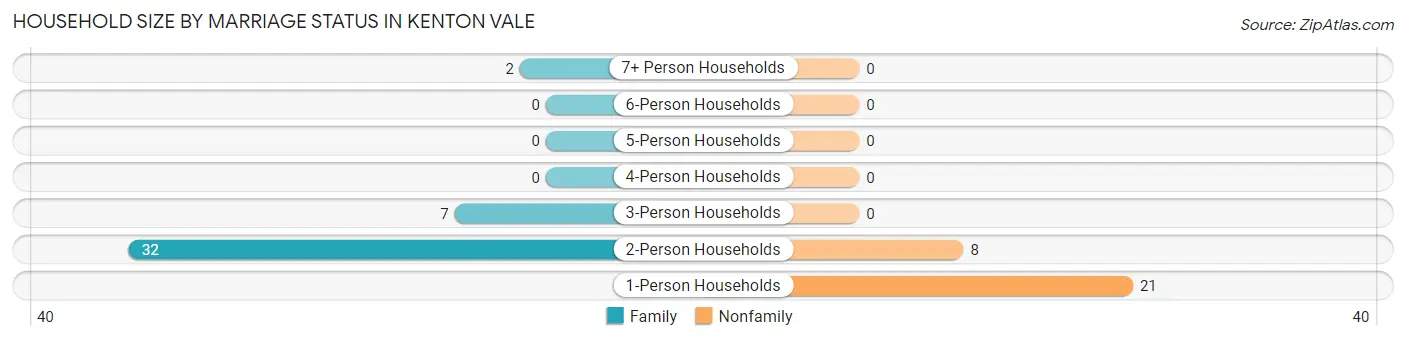
| Household Size | Family Households | Nonfamily Households |
| 1-Person Households | - | 21 (30.0%) |
| 2-Person Households | 32 (45.7%) | 8 (11.4%) |
| 3-Person Households | 7 (10.0%) | 0 (0.0%) |
| 4-Person Households | 0 (0.0%) | 0 (0.0%) |
| 5-Person Households | 0 (0.0%) | 0 (0.0%) |
| 6-Person Households | 0 (0.0%) | 0 (0.0%) |
| 7+ Person Households | 2 (2.9%) | 0 (0.0%) |
| Total | 41 (58.6%) | 29 (41.4%) |
Female Fertility in Kenton Vale
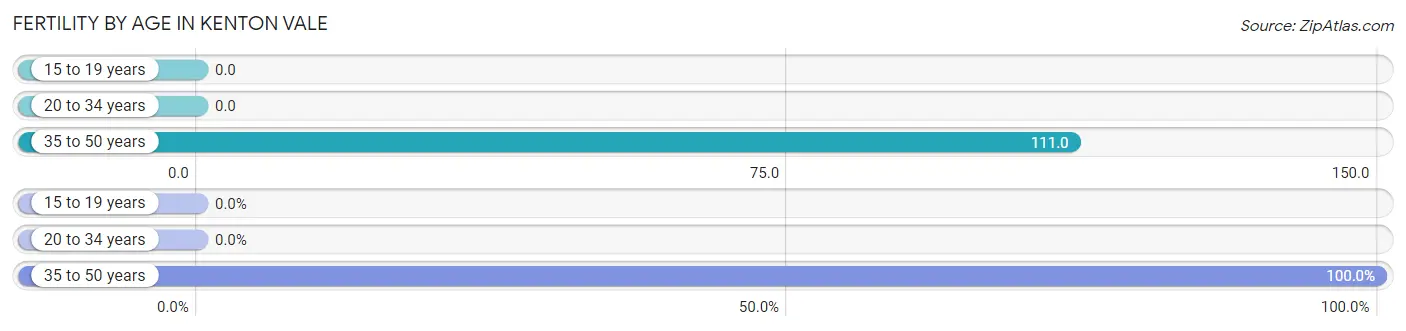
Fertility by Age in Kenton Vale
Average fertility rate in Kenton Vale is 59.0 births per 1,000 women. Women in the age bracket of 35 to 50 years have the highest fertility rate with 111.0 births per 1,000 women. Women in the age bracket of 35 to 50 years acount for 100.0% of all women with births.
| Age Bracket | Women with Births | Births / 1,000 Women |
| 15 to 19 years | 0 (0.0%) | 0.0 |
| 20 to 34 years | 0 (0.0%) | 0.0 |
| 35 to 50 years | 2 (100.0%) | 111.0 |
| Total | 2 (100.0%) | 59.0 |
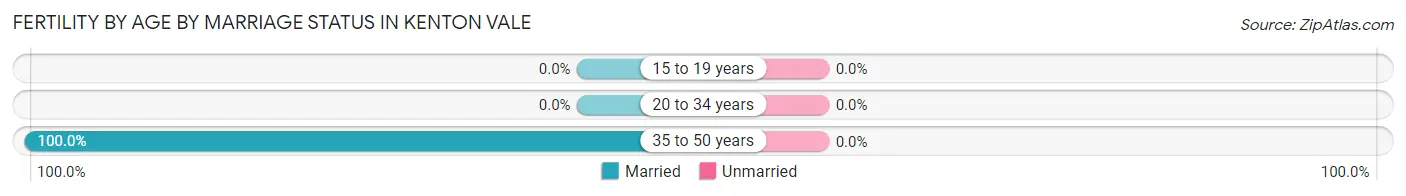
Fertility by Age by Marriage Status in Kenton Vale
| Age Bracket | Married | Unmarried |
| 15 to 19 years | 0 (0.0%) | 0 (0.0%) |
| 20 to 34 years | 0 (0.0%) | 0 (0.0%) |
| 35 to 50 years | 2 (100.0%) | 0 (0.0%) |
| Total | 2 (100.0%) | 0 (0.0%) |
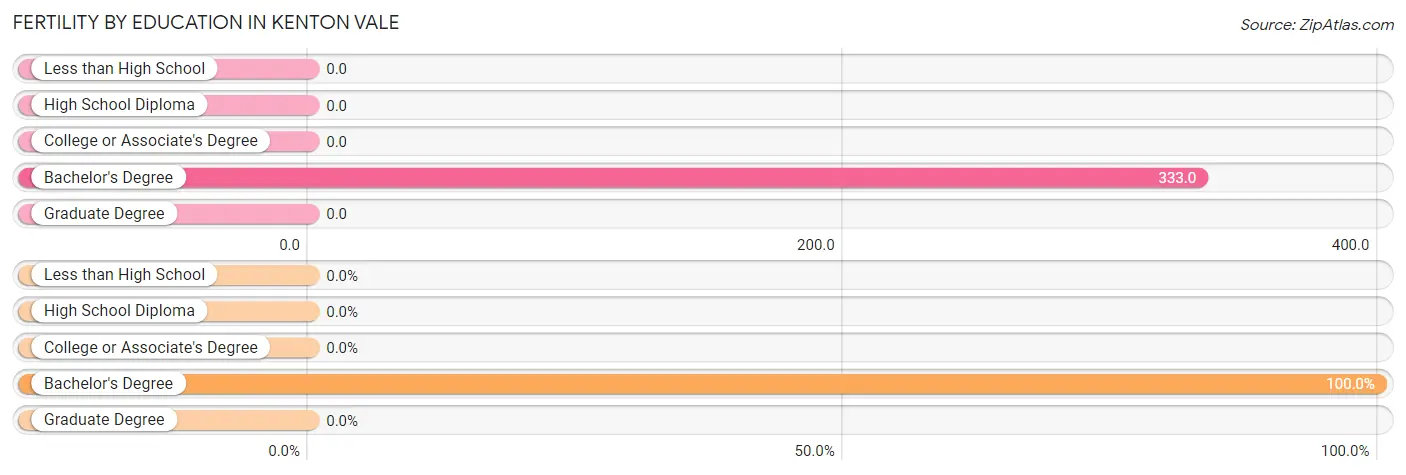
Fertility by Education in Kenton Vale
| Educational Attainment | Women with Births | Births / 1,000 Women |
| Less than High School | 0 (0.0%) | 0.0 |
| High School Diploma | 0 (0.0%) | 0.0 |
| College or Associate's Degree | 0 (0.0%) | 0.0 |
| Bachelor's Degree | 2 (100.0%) | 333.0 |
| Graduate Degree | 0 (0.0%) | 0.0 |
| Total | 2 (100.0%) | 59.0 |
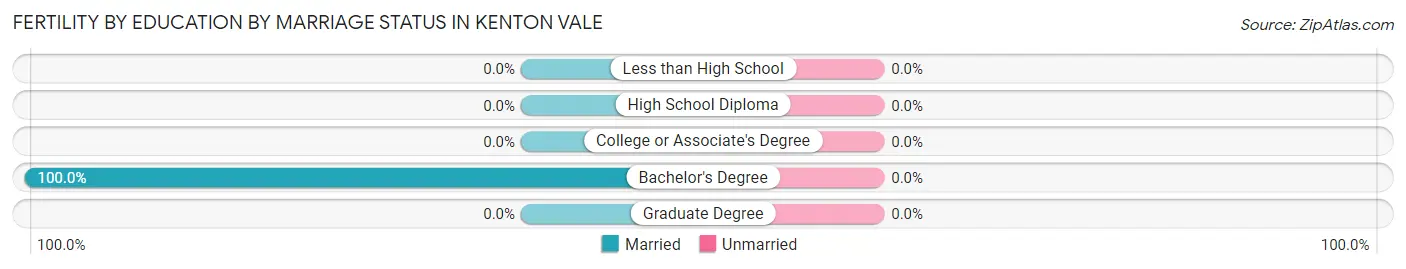
Fertility by Education by Marriage Status in Kenton Vale
| Educational Attainment | Married | Unmarried |
| Less than High School | 0 (0.0%) | 0 (0.0%) |
| High School Diploma | 0 (0.0%) | 0 (0.0%) |
| College or Associate's Degree | 0 (0.0%) | 0 (0.0%) |
| Bachelor's Degree | 2 (100.0%) | 0 (0.0%) |
| Graduate Degree | 0 (0.0%) | 0 (0.0%) |
| Total | 2 (100.0%) | 0 (0.0%) |
Employment Characteristics in Kenton Vale
Employment by Class of Employer in Kenton Vale
Among the 74 employed individuals in Kenton Vale, private company employees (58 | 78.4%), not-for-profit organizations (13 | 17.6%), and self-employed (incorporated) (1 | 1.3%) make up the most common classes of employment.
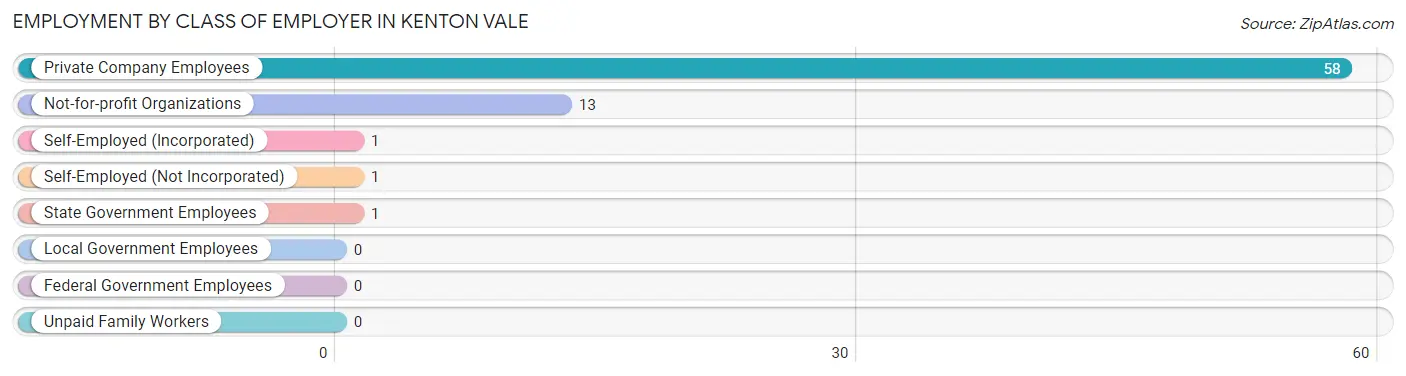
| Employer Class | # Employees | % Employees |
| Private Company Employees | 58 | 78.4% |
| Self-Employed (Incorporated) | 1 | 1.3% |
| Self-Employed (Not Incorporated) | 1 | 1.3% |
| Not-for-profit Organizations | 13 | 17.6% |
| Local Government Employees | 0 | 0.0% |
| State Government Employees | 1 | 1.3% |
| Federal Government Employees | 0 | 0.0% |
| Unpaid Family Workers | 0 | 0.0% |
| Total | 74 | 100.0% |
Employment Status by Age in Kenton Vale
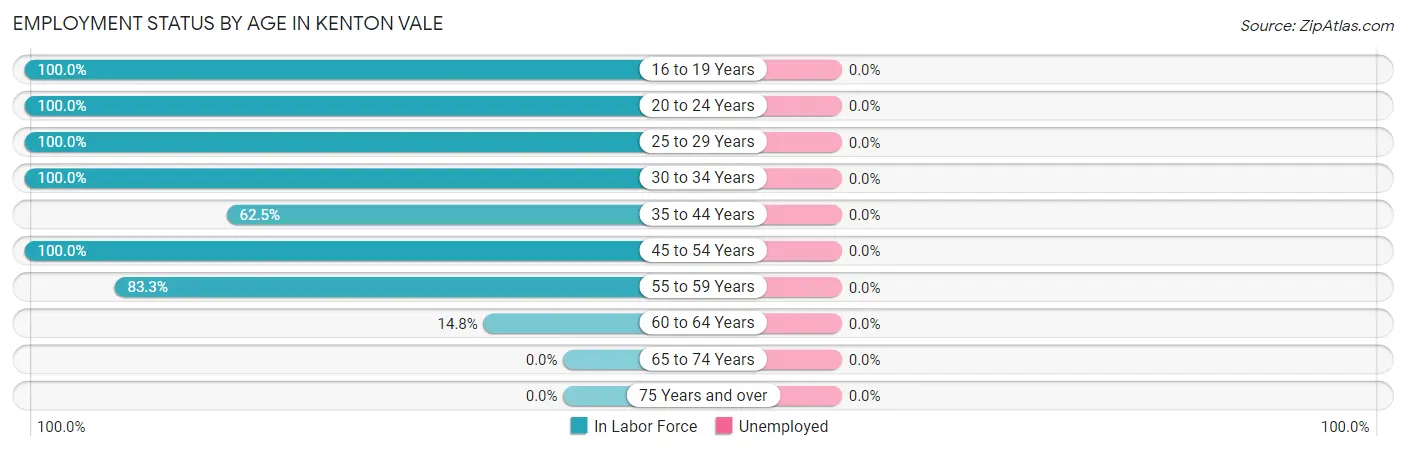
| Age Bracket | In Labor Force | Unemployed |
| 16 to 19 Years | 6 (100.0%) | 0 (0.0%) |
| 20 to 24 Years | 3 (100.0%) | 0 (0.0%) |
| 25 to 29 Years | 20 (100.0%) | 0 (0.0%) |
| 30 to 34 Years | 8 (100.0%) | 0 (0.0%) |
| 35 to 44 Years | 10 (62.5%) | 0 (0.0%) |
| 45 to 54 Years | 20 (100.0%) | 0 (0.0%) |
| 55 to 59 Years | 5 (83.3%) | 0 (0.0%) |
| 60 to 64 Years | 4 (14.8%) | 0 (0.0%) |
| 65 to 74 Years | 0 (0.0%) | 0 (0.0%) |
| 75 Years and over | 0 (0.0%) | 0 (0.0%) |
| Total | 76 (62.8%) | 0 (0.0%) |
Employment Status by Educational Attainment in Kenton Vale
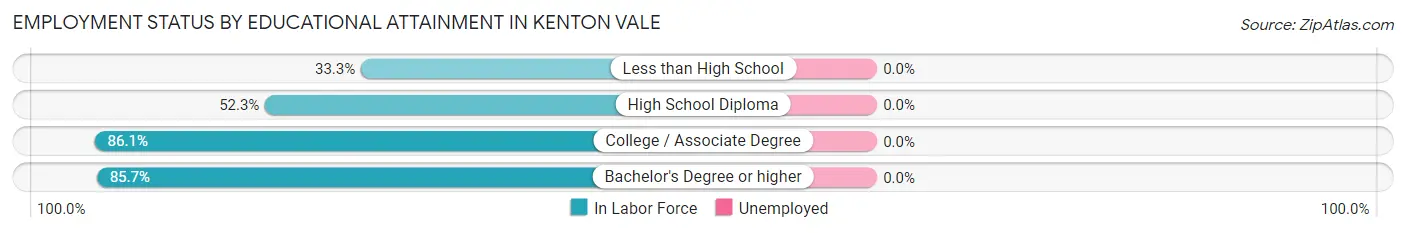
| Educational Attainment | In Labor Force | Unemployed |
| Less than High School | 1 (33.3%) | 0 (0.0%) |
| High School Diploma | 23 (52.3%) | 0 (0.0%) |
| College / Associate Degree | 31 (86.1%) | 0 (0.0%) |
| Bachelor's Degree or higher | 12 (85.7%) | 0 (0.0%) |
| Total | 67 (69.1%) | 0 (0.0%) |
Employment Occupations by Sex in Kenton Vale
Management, Business, Science and Arts Occupations
The most common Management, Business, Science and Arts occupations in Kenton Vale are Management (10 | 13.2%), Business & Financial (5 | 6.6%), Computers, Engineering & Science (3 | 4.0%), Health Diagnosing & Treating (3 | 4.0%), and Health Technologists (3 | 4.0%).
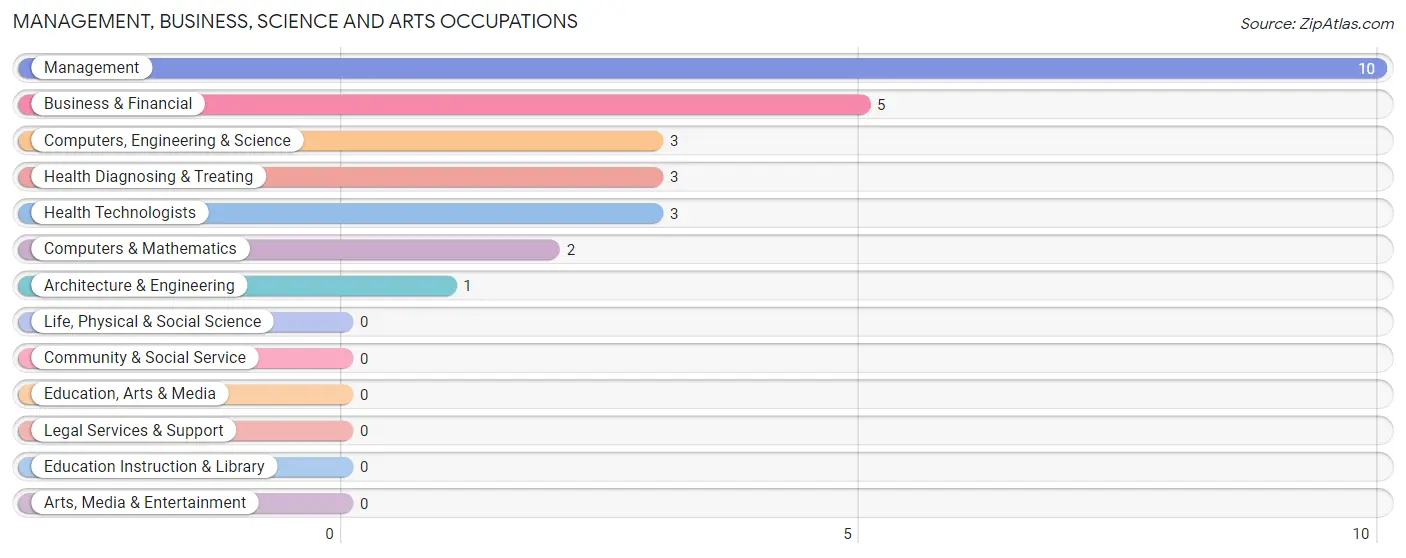
Management, Business, Science and Arts Occupations by Sex
Within the Management, Business, Science and Arts occupations in Kenton Vale, the most male-oriented occupations are Computers & Mathematics (100.0%), Management (80.0%), and Computers, Engineering & Science (66.7%), while the most female-oriented occupations are Architecture & Engineering (100.0%), Health Diagnosing & Treating (66.7%), and Health Technologists (66.7%).
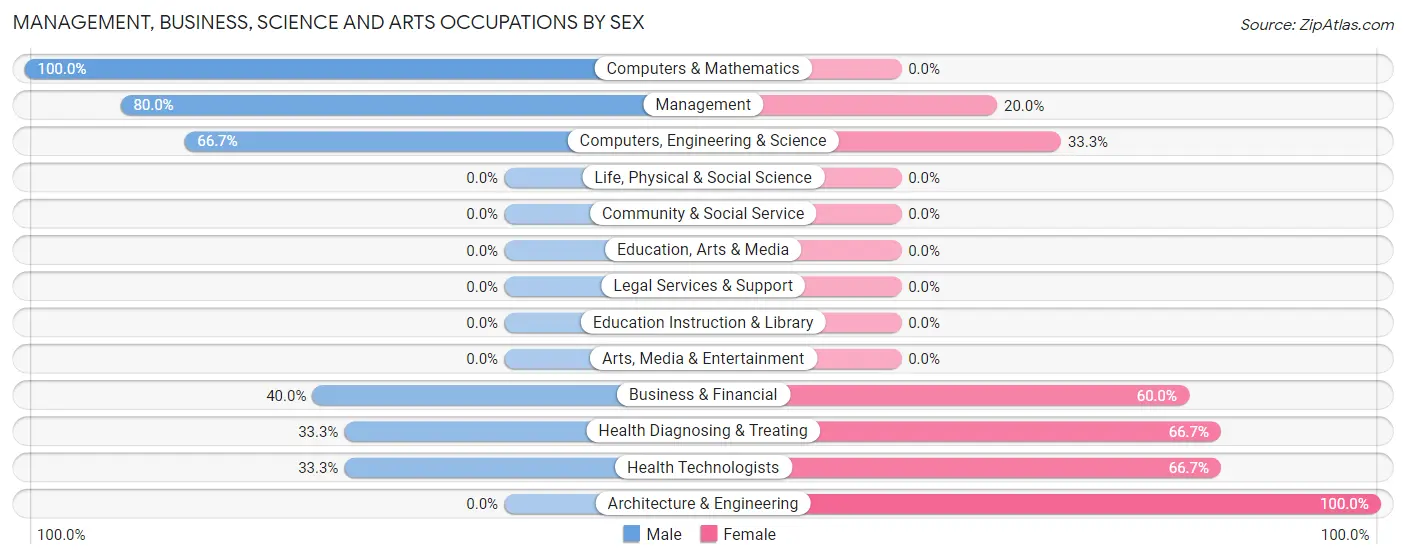
| Occupation | Male | Female |
| Management | 8 (80.0%) | 2 (20.0%) |
| Business & Financial | 2 (40.0%) | 3 (60.0%) |
| Computers, Engineering & Science | 2 (66.7%) | 1 (33.3%) |
| Computers & Mathematics | 2 (100.0%) | 0 (0.0%) |
| Architecture & Engineering | 0 (0.0%) | 1 (100.0%) |
| Life, Physical & Social Science | 0 (0.0%) | 0 (0.0%) |
| Community & Social Service | 0 (0.0%) | 0 (0.0%) |
| Education, Arts & Media | 0 (0.0%) | 0 (0.0%) |
| Legal Services & Support | 0 (0.0%) | 0 (0.0%) |
| Education Instruction & Library | 0 (0.0%) | 0 (0.0%) |
| Arts, Media & Entertainment | 0 (0.0%) | 0 (0.0%) |
| Health Diagnosing & Treating | 1 (33.3%) | 2 (66.7%) |
| Health Technologists | 1 (33.3%) | 2 (66.7%) |
| Total (Category) | 13 (61.9%) | 8 (38.1%) |
| Total (Overall) | 44 (57.9%) | 32 (42.1%) |
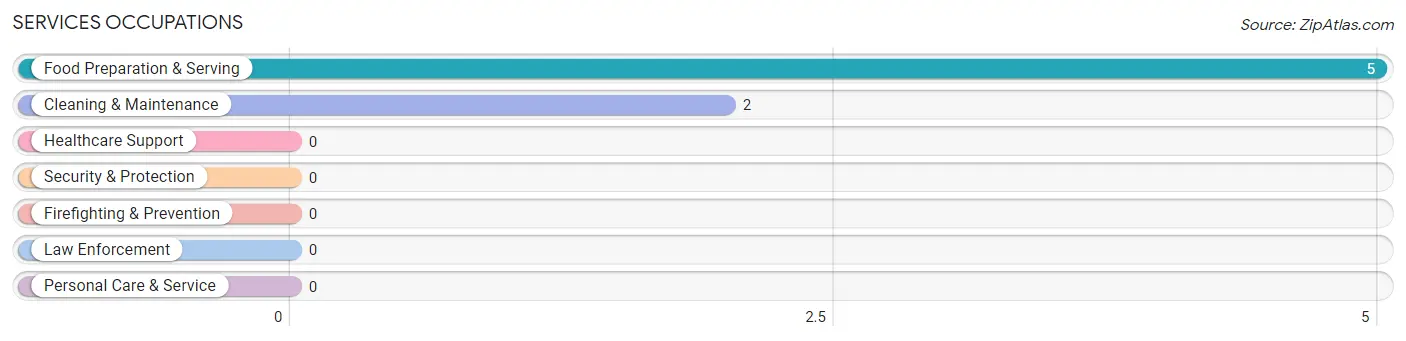
Services Occupations
The most common Services occupations in Kenton Vale are Food Preparation & Serving (5 | 6.6%), and Cleaning & Maintenance (2 | 2.6%).
Services Occupations by Sex
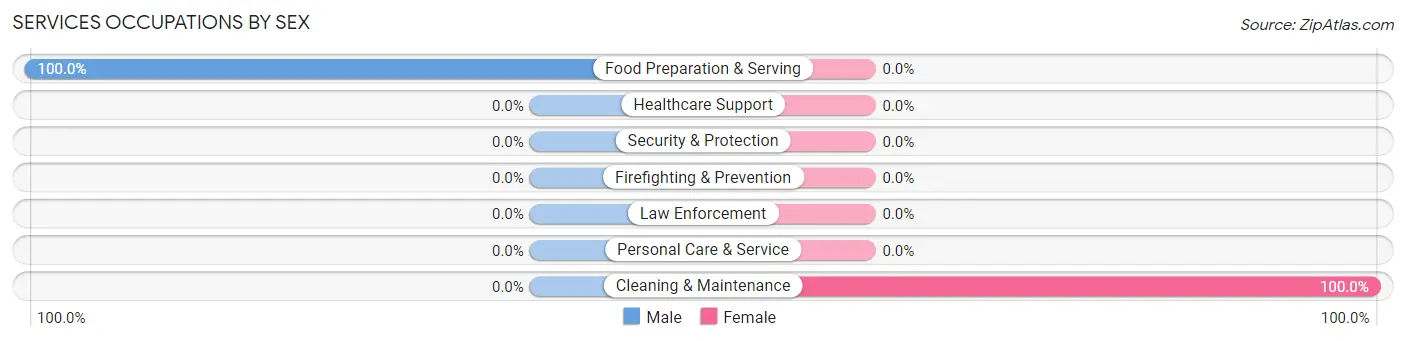
| Occupation | Male | Female |
| Healthcare Support | 0 (0.0%) | 0 (0.0%) |
| Security & Protection | 0 (0.0%) | 0 (0.0%) |
| Firefighting & Prevention | 0 (0.0%) | 0 (0.0%) |
| Law Enforcement | 0 (0.0%) | 0 (0.0%) |
| Food Preparation & Serving | 5 (100.0%) | 0 (0.0%) |
| Cleaning & Maintenance | 0 (0.0%) | 2 (100.0%) |
| Personal Care & Service | 0 (0.0%) | 0 (0.0%) |
| Total (Category) | 5 (71.4%) | 2 (28.6%) |
| Total (Overall) | 44 (57.9%) | 32 (42.1%) |
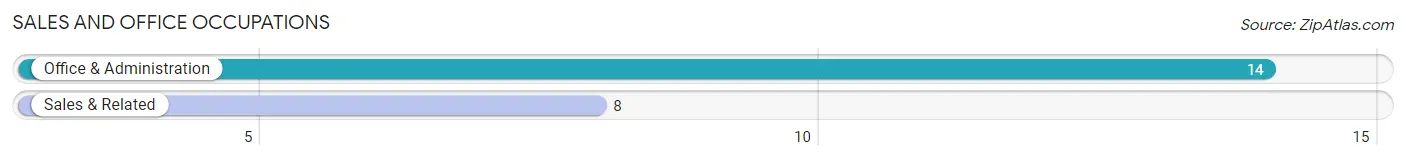
Sales and Office Occupations
The most common Sales and Office occupations in Kenton Vale are Office & Administration (14 | 18.4%), and Sales & Related (8 | 10.5%).
Sales and Office Occupations by Sex
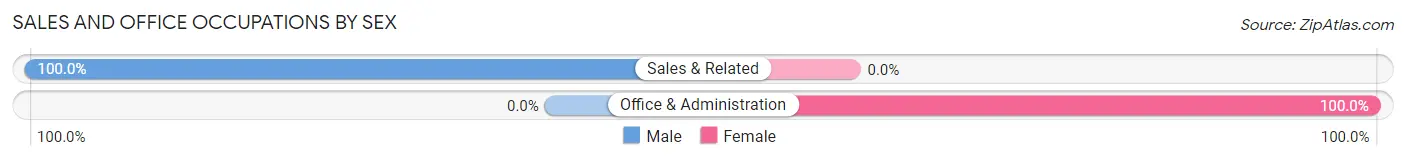
| Occupation | Male | Female |
| Sales & Related | 8 (100.0%) | 0 (0.0%) |
| Office & Administration | 0 (0.0%) | 14 (100.0%) |
| Total (Category) | 8 (36.4%) | 14 (63.6%) |
| Total (Overall) | 44 (57.9%) | 32 (42.1%) |
Natural Resources, Construction and Maintenance Occupations
The most common Natural Resources, Construction and Maintenance occupations in Kenton Vale are , and Construction & Extraction (8 | 10.5%).
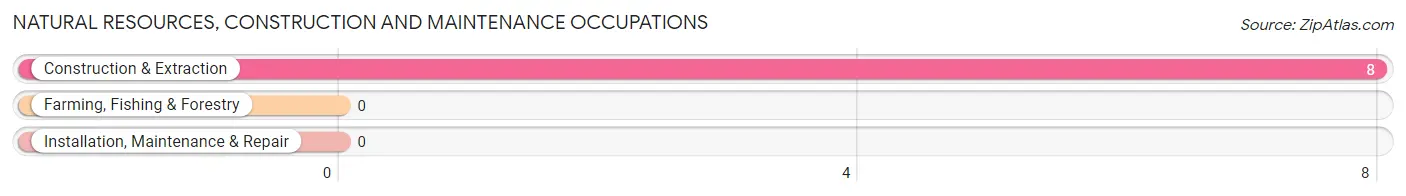
Natural Resources, Construction and Maintenance Occupations by Sex
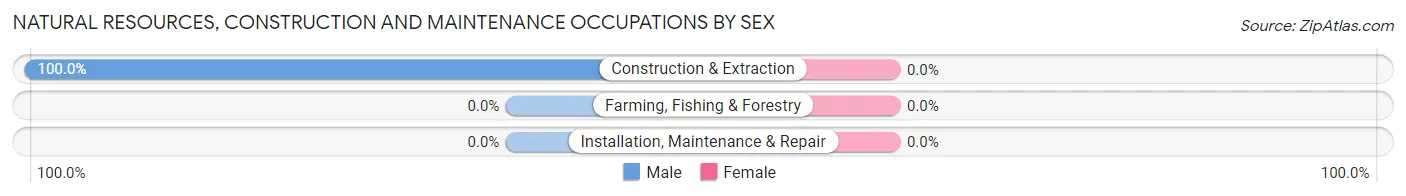
| Occupation | Male | Female |
| Farming, Fishing & Forestry | 0 (0.0%) | 0 (0.0%) |
| Construction & Extraction | 8 (100.0%) | 0 (0.0%) |
| Installation, Maintenance & Repair | 0 (0.0%) | 0 (0.0%) |
| Total (Category) | 8 (100.0%) | 0 (0.0%) |
| Total (Overall) | 44 (57.9%) | 32 (42.1%) |
Production, Transportation and Moving Occupations
The most common Production, Transportation and Moving occupations in Kenton Vale are Material Moving (10 | 13.2%), Transportation (6 | 7.9%), and Production (2 | 2.6%).
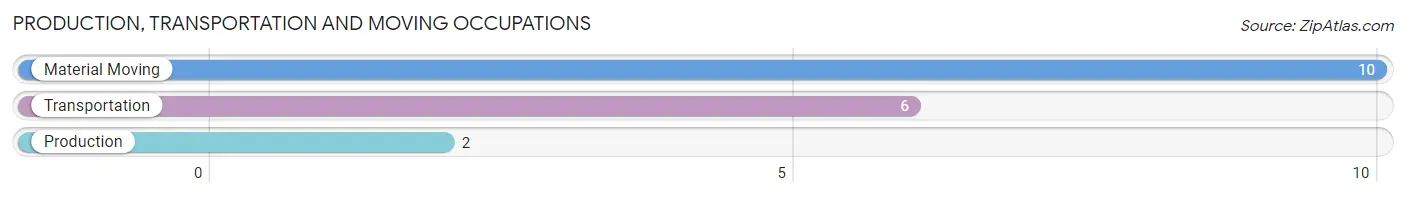
Production, Transportation and Moving Occupations by Sex
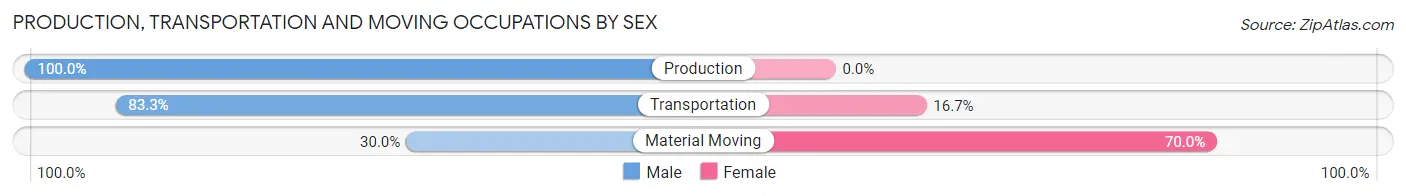
| Occupation | Male | Female |
| Production | 2 (100.0%) | 0 (0.0%) |
| Transportation | 5 (83.3%) | 1 (16.7%) |
| Material Moving | 3 (30.0%) | 7 (70.0%) |
| Total (Category) | 10 (55.6%) | 8 (44.4%) |
| Total (Overall) | 44 (57.9%) | 32 (42.1%) |
Employment Industries by Sex in Kenton Vale
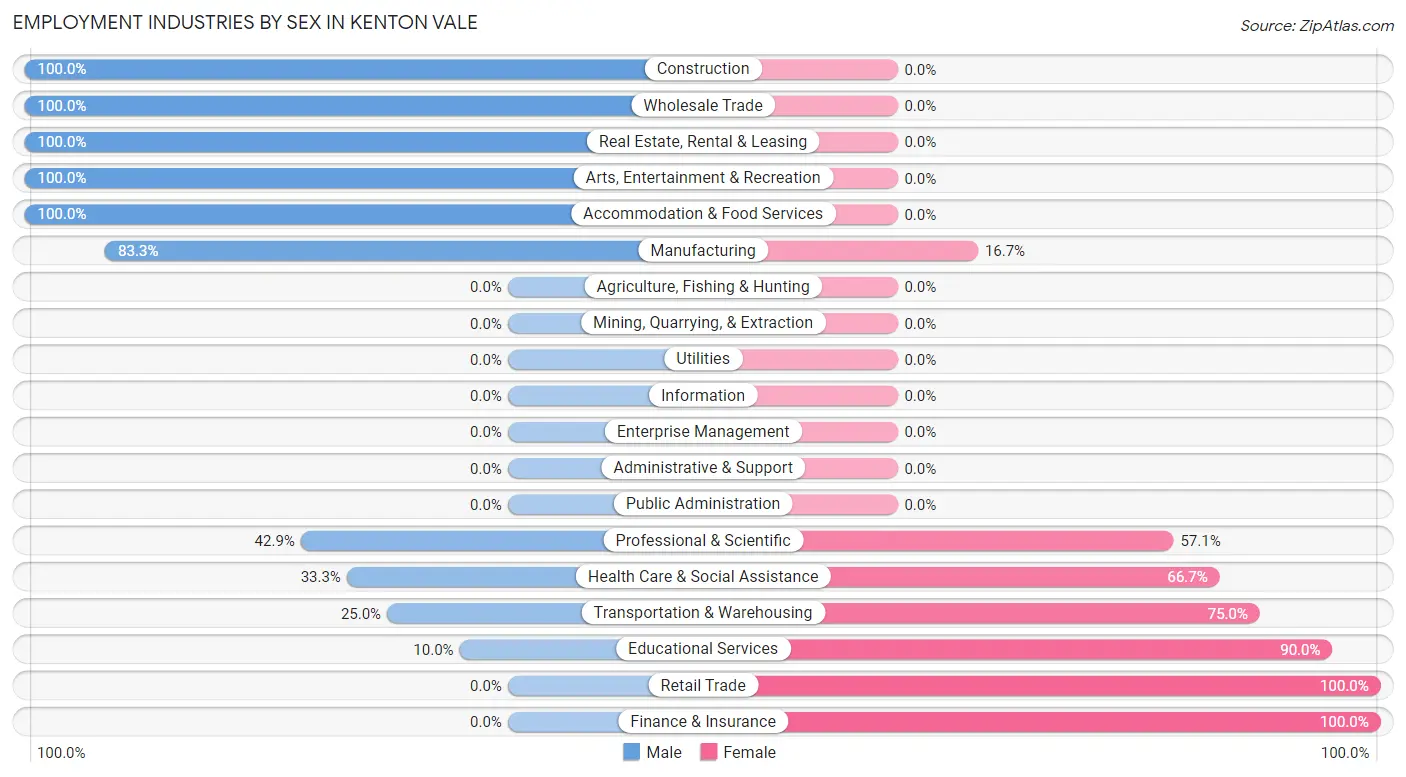
Employment Industries in Kenton Vale
The major employment industries in Kenton Vale include Transportation & Warehousing (12 | 15.8%), Construction (11 | 14.5%), Accommodation & Food Services (11 | 14.5%), Educational Services (10 | 13.2%), and Professional & Scientific (7 | 9.2%).
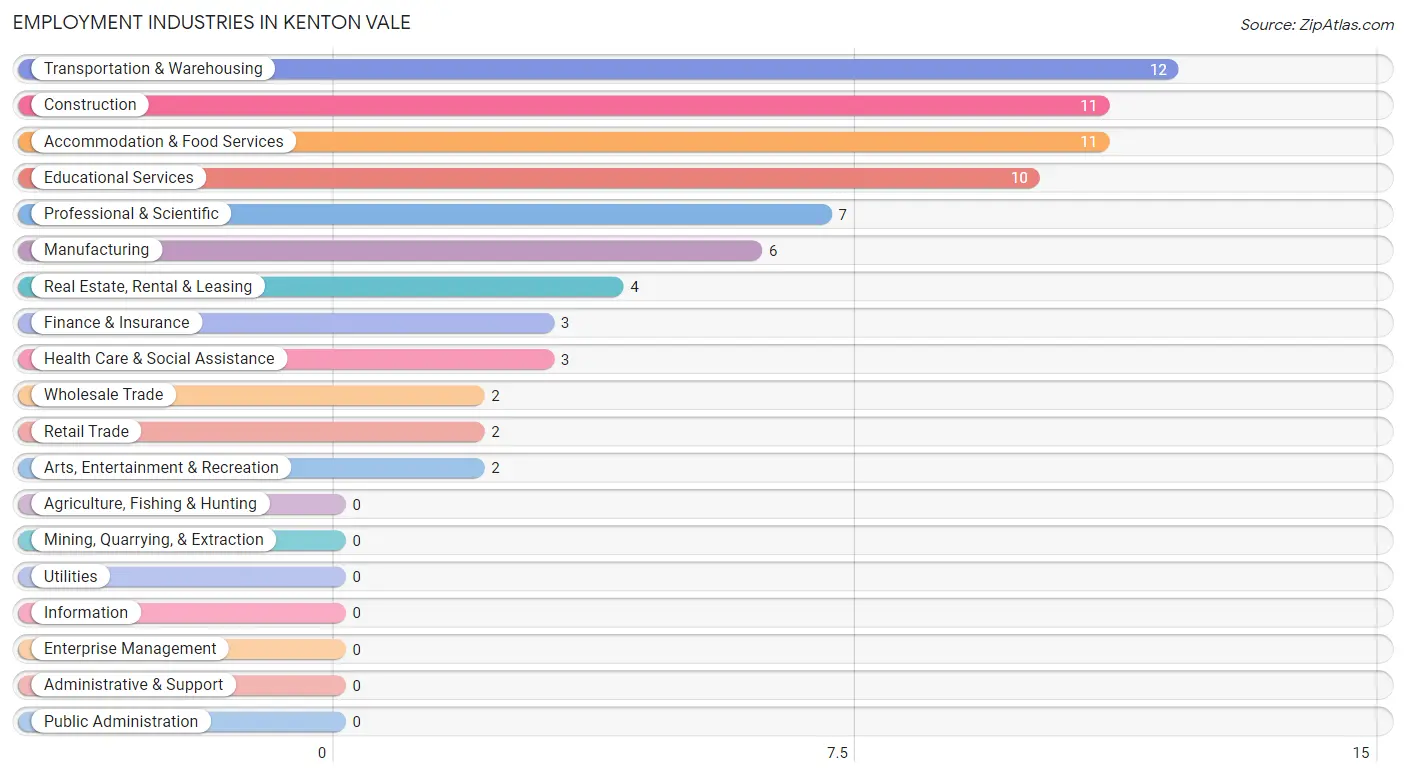
Employment Industries by Sex in Kenton Vale
The Kenton Vale industries that see more men than women are Construction (100.0%), Wholesale Trade (100.0%), and Real Estate, Rental & Leasing (100.0%), whereas the industries that tend to have a higher number of women are Retail Trade (100.0%), Finance & Insurance (100.0%), and Educational Services (90.0%).
| Industry | Male | Female |
| Agriculture, Fishing & Hunting | 0 (0.0%) | 0 (0.0%) |
| Mining, Quarrying, & Extraction | 0 (0.0%) | 0 (0.0%) |
| Construction | 11 (100.0%) | 0 (0.0%) |
| Manufacturing | 5 (83.3%) | 1 (16.7%) |
| Wholesale Trade | 2 (100.0%) | 0 (0.0%) |
| Retail Trade | 0 (0.0%) | 2 (100.0%) |
| Transportation & Warehousing | 3 (25.0%) | 9 (75.0%) |
| Utilities | 0 (0.0%) | 0 (0.0%) |
| Information | 0 (0.0%) | 0 (0.0%) |
| Finance & Insurance | 0 (0.0%) | 3 (100.0%) |
| Real Estate, Rental & Leasing | 4 (100.0%) | 0 (0.0%) |
| Professional & Scientific | 3 (42.9%) | 4 (57.1%) |
| Enterprise Management | 0 (0.0%) | 0 (0.0%) |
| Administrative & Support | 0 (0.0%) | 0 (0.0%) |
| Educational Services | 1 (10.0%) | 9 (90.0%) |
| Health Care & Social Assistance | 1 (33.3%) | 2 (66.7%) |
| Arts, Entertainment & Recreation | 2 (100.0%) | 0 (0.0%) |
| Accommodation & Food Services | 11 (100.0%) | 0 (0.0%) |
| Public Administration | 0 (0.0%) | 0 (0.0%) |
| Total | 44 (57.9%) | 32 (42.1%) |
Education in Kenton Vale
School Enrollment in Kenton Vale
The most common levels of schooling among the 21 students in Kenton Vale are high school (10 | 47.6%), nursery / preschool (4 | 19.1%), and college / undergraduate (4 | 19.1%).
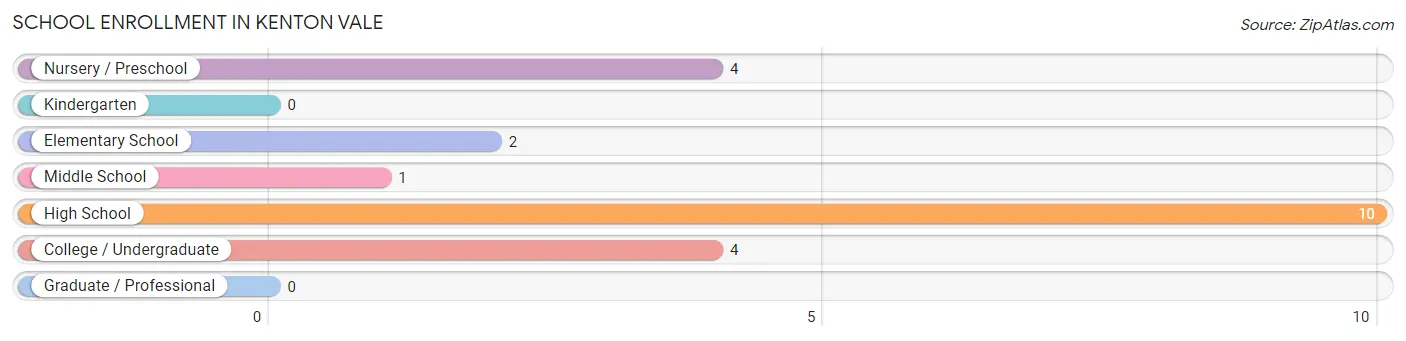
| School Level | # Students | % Students |
| Nursery / Preschool | 4 | 19.1% |
| Kindergarten | 0 | 0.0% |
| Elementary School | 2 | 9.5% |
| Middle School | 1 | 4.8% |
| High School | 10 | 47.6% |
| College / Undergraduate | 4 | 19.1% |
| Graduate / Professional | 0 | 0.0% |
| Total | 21 | 100.0% |
School Enrollment by Age by Funding Source in Kenton Vale
Out of a total of 21 students who are enrolled in schools in Kenton Vale, 6 (28.6%) attend a private institution, while the remaining 15 (71.4%) are enrolled in public schools. The age group of 3 to 4 year olds has the highest likelihood of being enrolled in private schools, with 4 (100.0% in the age bracket) enrolled. Conversely, the age group of 15 to 17 year olds has the lowest likelihood of being enrolled in a private school, with 6 (100.0% in the age bracket) attending a public institution.
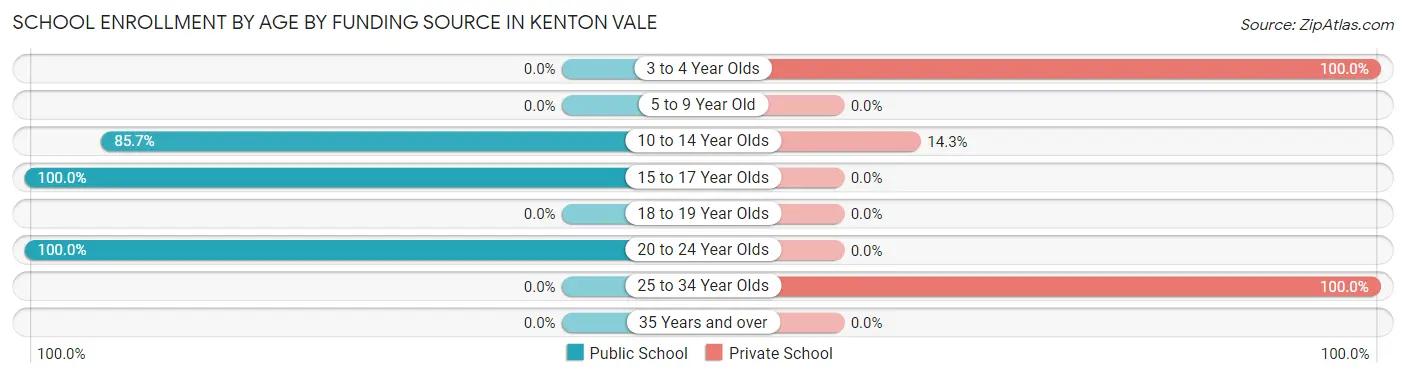
| Age Bracket | Public School | Private School |
| 3 to 4 Year Olds | 0 (0.0%) | 4 (100.0%) |
| 5 to 9 Year Old | 0 (0.0%) | 0 (0.0%) |
| 10 to 14 Year Olds | 6 (85.7%) | 1 (14.3%) |
| 15 to 17 Year Olds | 6 (100.0%) | 0 (0.0%) |
| 18 to 19 Year Olds | 0 (0.0%) | 0 (0.0%) |
| 20 to 24 Year Olds | 3 (100.0%) | 0 (0.0%) |
| 25 to 34 Year Olds | 0 (0.0%) | 1 (100.0%) |
| 35 Years and over | 0 (0.0%) | 0 (0.0%) |
| Total | 15 (71.4%) | 6 (28.6%) |
Educational Attainment by Field of Study in Kenton Vale
Business (6 | 37.5%), physical & health sciences (3 | 18.8%), science & technology (3 | 18.8%), social sciences (2 | 12.5%), and bio, nature & agricultural (1 | 6.2%) are the most common fields of study among 16 individuals in Kenton Vale who have obtained a bachelor's degree or higher.
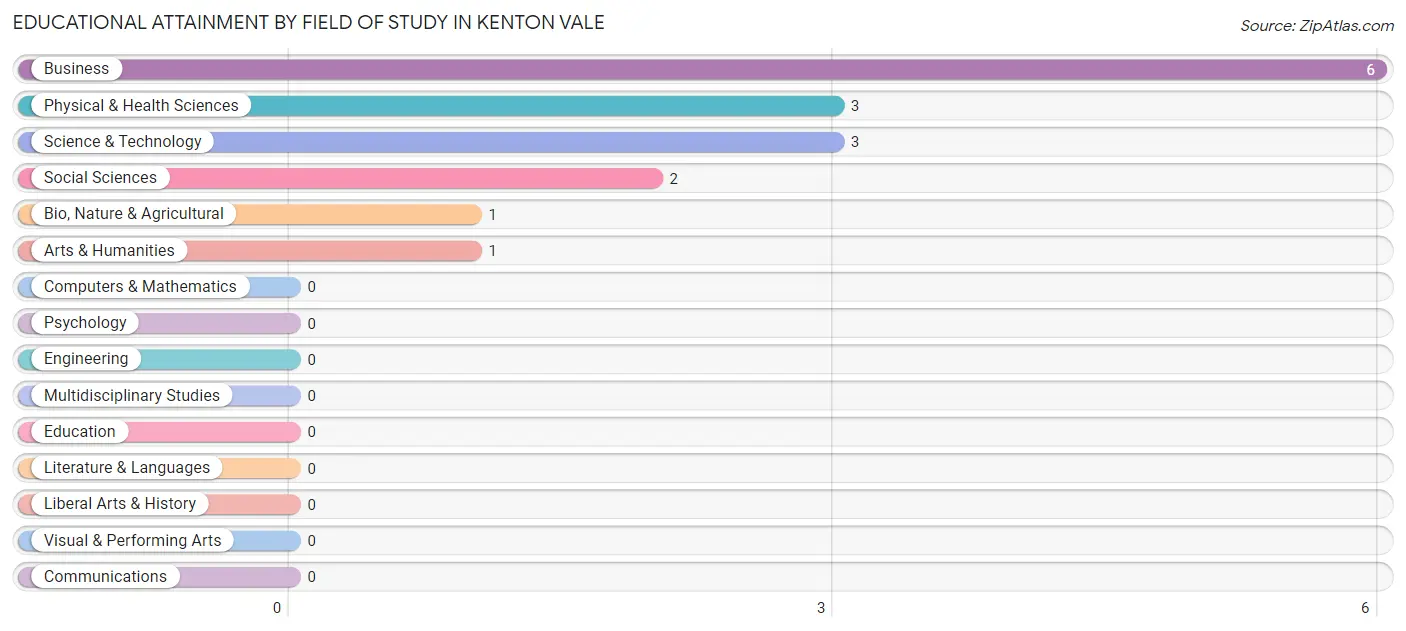
| Field of Study | # Graduates | % Graduates |
| Computers & Mathematics | 0 | 0.0% |
| Bio, Nature & Agricultural | 1 | 6.2% |
| Physical & Health Sciences | 3 | 18.8% |
| Psychology | 0 | 0.0% |
| Social Sciences | 2 | 12.5% |
| Engineering | 0 | 0.0% |
| Multidisciplinary Studies | 0 | 0.0% |
| Science & Technology | 3 | 18.8% |
| Business | 6 | 37.5% |
| Education | 0 | 0.0% |
| Literature & Languages | 0 | 0.0% |
| Liberal Arts & History | 0 | 0.0% |
| Visual & Performing Arts | 0 | 0.0% |
| Communications | 0 | 0.0% |
| Arts & Humanities | 1 | 6.2% |
| Total | 16 | 100.0% |
Transportation & Commute in Kenton Vale
Vehicle Availability by Sex in Kenton Vale
The most prevalent vehicle ownership categories in Kenton Vale are males with 2 vehicles (31, accounting for 70.5%) and females with 2 vehicles (16, making up 103.3%).
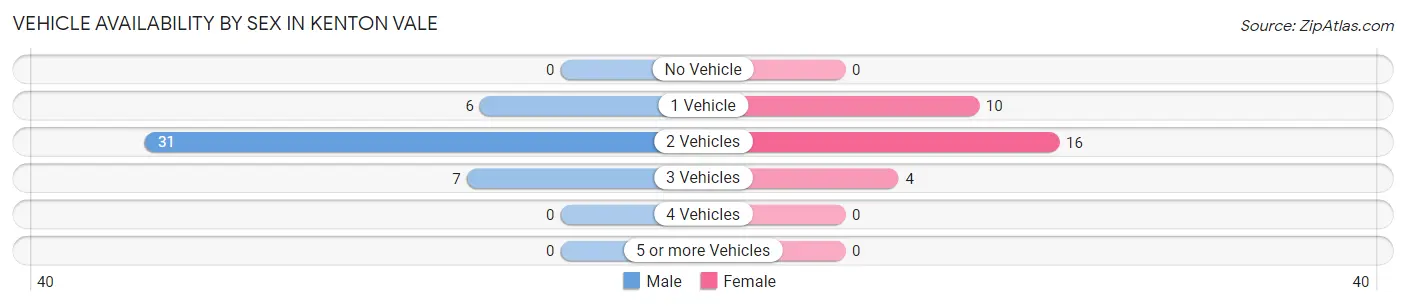
| Vehicles Available | Male | Female |
| No Vehicle | 0 (0.0%) | 0 (0.0%) |
| 1 Vehicle | 6 (13.6%) | 10 (33.3%) |
| 2 Vehicles | 31 (70.5%) | 16 (53.3%) |
| 3 Vehicles | 7 (15.9%) | 4 (13.3%) |
| 4 Vehicles | 0 (0.0%) | 0 (0.0%) |
| 5 or more Vehicles | 0 (0.0%) | 0 (0.0%) |
| Total | 44 (100.0%) | 30 (100.0%) |
Commute Time in Kenton Vale
The most frequently occuring commute durations in Kenton Vale are 45 to 59 minutes (18 commuters, 27.3%), 5 to 9 minutes (12 commuters, 18.2%), and 20 to 24 minutes (12 commuters, 18.2%).
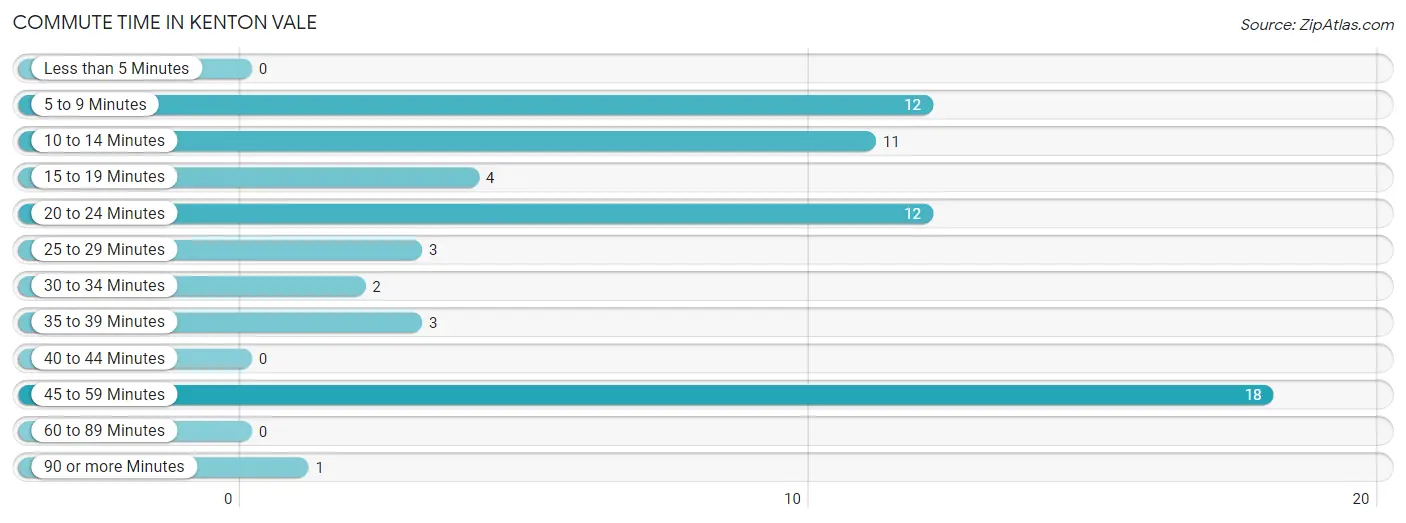
| Commute Time | # Commuters | % Commuters |
| Less than 5 Minutes | 0 | 0.0% |
| 5 to 9 Minutes | 12 | 18.2% |
| 10 to 14 Minutes | 11 | 16.7% |
| 15 to 19 Minutes | 4 | 6.1% |
| 20 to 24 Minutes | 12 | 18.2% |
| 25 to 29 Minutes | 3 | 4.5% |
| 30 to 34 Minutes | 2 | 3.0% |
| 35 to 39 Minutes | 3 | 4.5% |
| 40 to 44 Minutes | 0 | 0.0% |
| 45 to 59 Minutes | 18 | 27.3% |
| 60 to 89 Minutes | 0 | 0.0% |
| 90 or more Minutes | 1 | 1.5% |
Commute Time by Sex in Kenton Vale
The most common commute times in Kenton Vale are 45 to 59 minutes (17 commuters, 39.5%) for males and 10 to 14 minutes (9 commuters, 39.1%) for females.
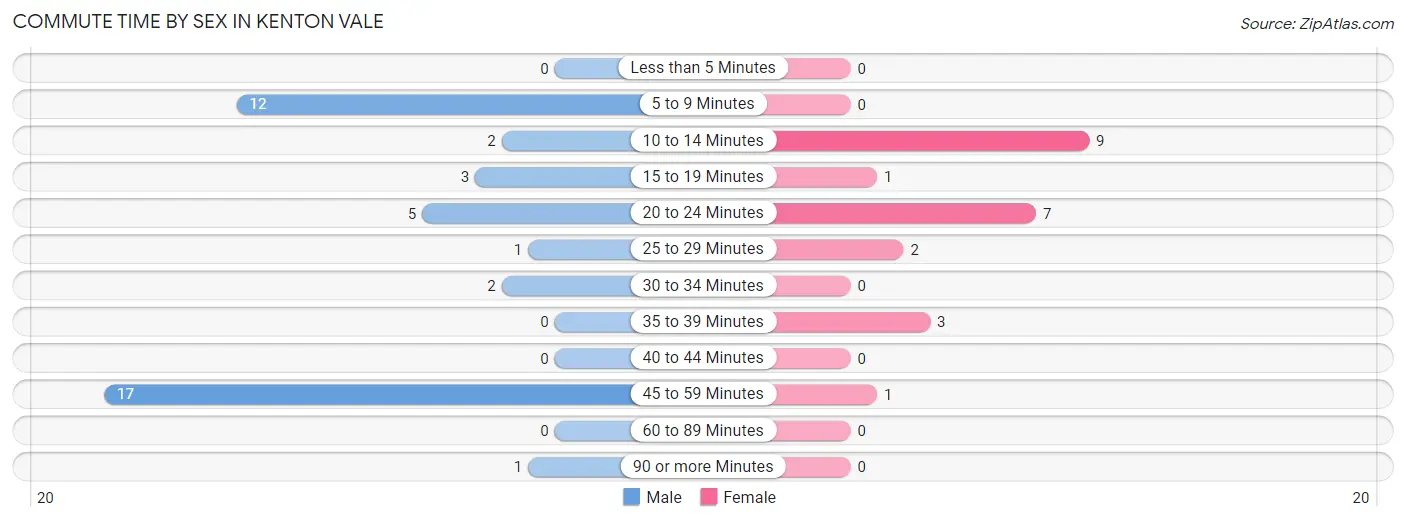
| Commute Time | Male | Female |
| Less than 5 Minutes | 0 (0.0%) | 0 (0.0%) |
| 5 to 9 Minutes | 12 (27.9%) | 0 (0.0%) |
| 10 to 14 Minutes | 2 (4.6%) | 9 (39.1%) |
| 15 to 19 Minutes | 3 (7.0%) | 1 (4.3%) |
| 20 to 24 Minutes | 5 (11.6%) | 7 (30.4%) |
| 25 to 29 Minutes | 1 (2.3%) | 2 (8.7%) |
| 30 to 34 Minutes | 2 (4.6%) | 0 (0.0%) |
| 35 to 39 Minutes | 0 (0.0%) | 3 (13.0%) |
| 40 to 44 Minutes | 0 (0.0%) | 0 (0.0%) |
| 45 to 59 Minutes | 17 (39.5%) | 1 (4.3%) |
| 60 to 89 Minutes | 0 (0.0%) | 0 (0.0%) |
| 90 or more Minutes | 1 (2.3%) | 0 (0.0%) |
Time of Departure to Work by Sex in Kenton Vale
The most frequent times of departure to work in Kenton Vale are 7:00 AM to 7:29 AM (16, 37.2%) for males and 7:30 AM to 7:59 AM (15, 65.2%) for females.
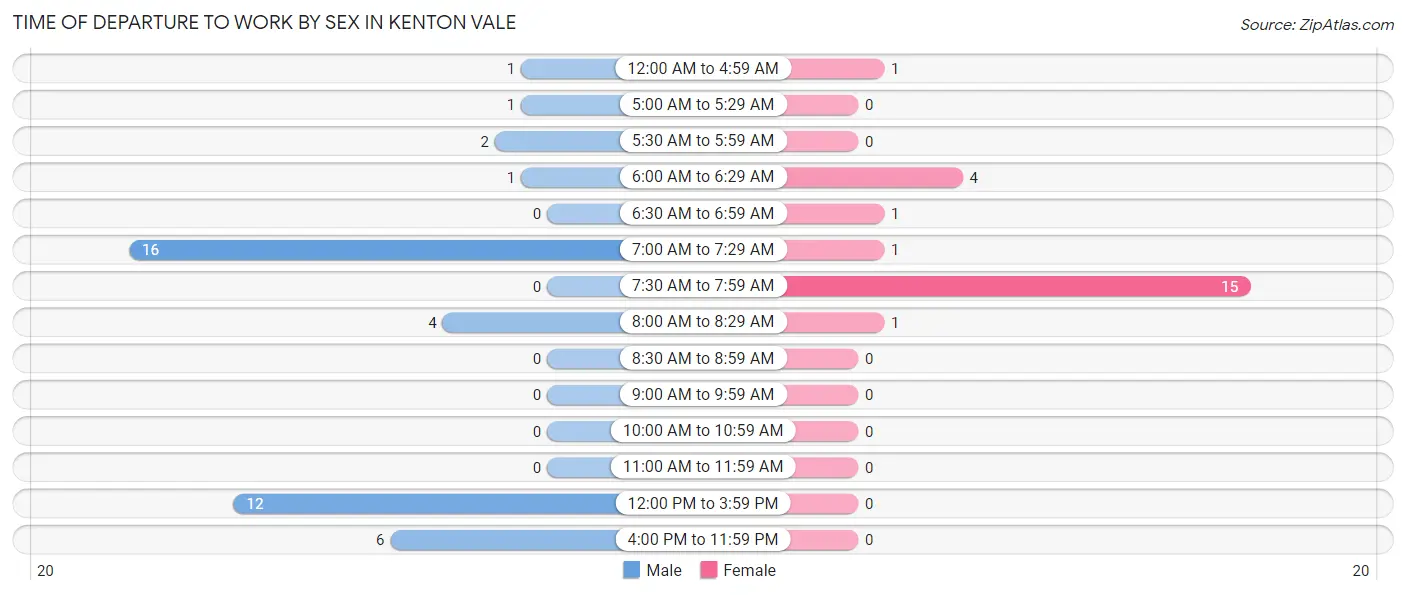
| Time of Departure | Male | Female |
| 12:00 AM to 4:59 AM | 1 (2.3%) | 1 (4.3%) |
| 5:00 AM to 5:29 AM | 1 (2.3%) | 0 (0.0%) |
| 5:30 AM to 5:59 AM | 2 (4.6%) | 0 (0.0%) |
| 6:00 AM to 6:29 AM | 1 (2.3%) | 4 (17.4%) |
| 6:30 AM to 6:59 AM | 0 (0.0%) | 1 (4.3%) |
| 7:00 AM to 7:29 AM | 16 (37.2%) | 1 (4.3%) |
| 7:30 AM to 7:59 AM | 0 (0.0%) | 15 (65.2%) |
| 8:00 AM to 8:29 AM | 4 (9.3%) | 1 (4.3%) |
| 8:30 AM to 8:59 AM | 0 (0.0%) | 0 (0.0%) |
| 9:00 AM to 9:59 AM | 0 (0.0%) | 0 (0.0%) |
| 10:00 AM to 10:59 AM | 0 (0.0%) | 0 (0.0%) |
| 11:00 AM to 11:59 AM | 0 (0.0%) | 0 (0.0%) |
| 12:00 PM to 3:59 PM | 12 (27.9%) | 0 (0.0%) |
| 4:00 PM to 11:59 PM | 6 (14.0%) | 0 (0.0%) |
| Total | 43 (100.0%) | 23 (100.0%) |
Housing Occupancy in Kenton Vale
Occupancy by Ownership in Kenton Vale
Of the total 70 dwellings in Kenton Vale, owner-occupied units account for 59 (84.3%), while renter-occupied units make up 11 (15.7%).
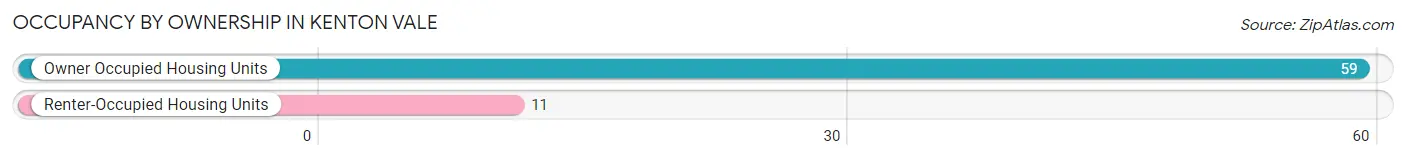
| Occupancy | # Housing Units | % Housing Units |
| Owner Occupied Housing Units | 59 | 84.3% |
| Renter-Occupied Housing Units | 11 | 15.7% |
| Total Occupied Housing Units | 70 | 100.0% |
Occupancy by Household Size in Kenton Vale
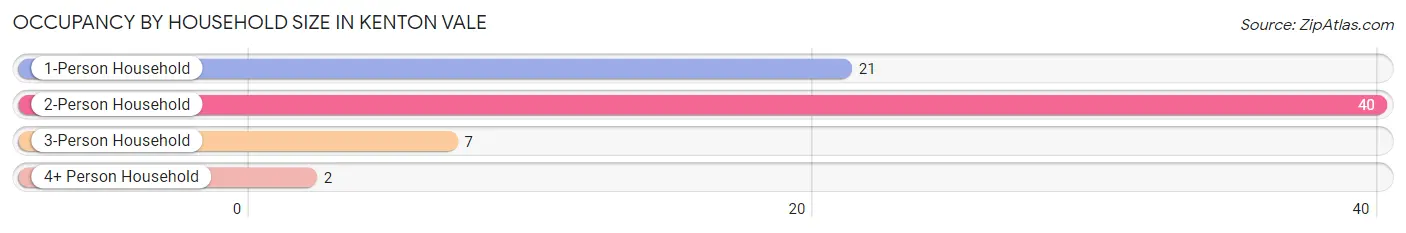
| Household Size | # Housing Units | % Housing Units |
| 1-Person Household | 21 | 30.0% |
| 2-Person Household | 40 | 57.1% |
| 3-Person Household | 7 | 10.0% |
| 4+ Person Household | 2 | 2.9% |
| Total Housing Units | 70 | 100.0% |
Occupancy by Ownership by Household Size in Kenton Vale
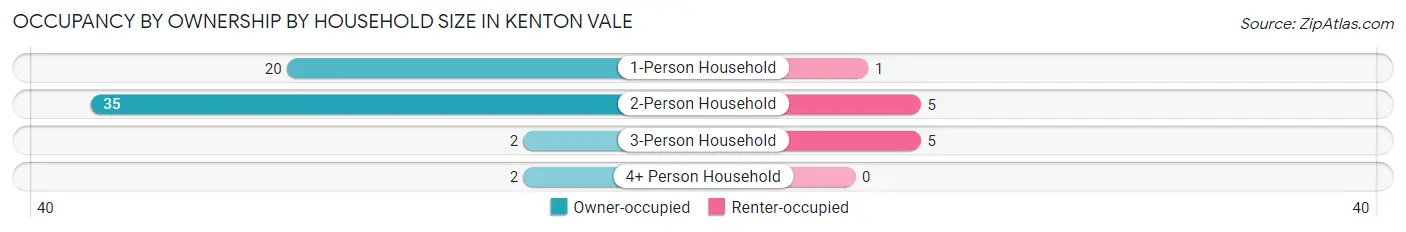
| Household Size | Owner-occupied | Renter-occupied |
| 1-Person Household | 20 (95.2%) | 1 (4.8%) |
| 2-Person Household | 35 (87.5%) | 5 (12.5%) |
| 3-Person Household | 2 (28.6%) | 5 (71.4%) |
| 4+ Person Household | 2 (100.0%) | 0 (0.0%) |
| Total Housing Units | 59 (84.3%) | 11 (15.7%) |
Occupancy by Educational Attainment in Kenton Vale
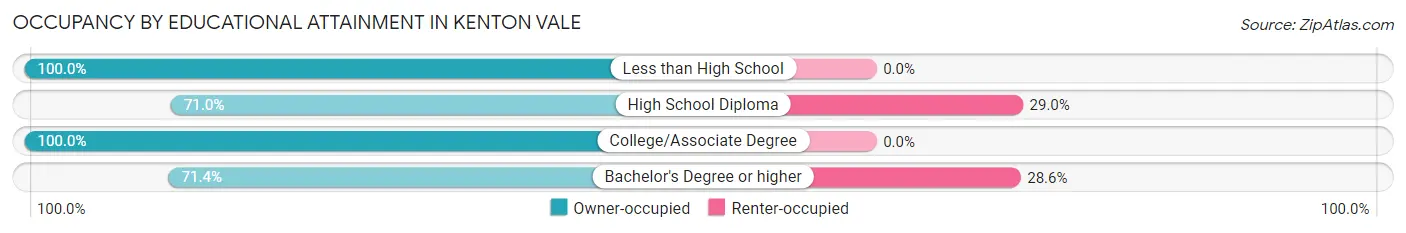
| Household Size | Owner-occupied | Renter-occupied |
| Less than High School | 1 (100.0%) | 0 (0.0%) |
| High School Diploma | 22 (71.0%) | 9 (29.0%) |
| College/Associate Degree | 31 (100.0%) | 0 (0.0%) |
| Bachelor's Degree or higher | 5 (71.4%) | 2 (28.6%) |
Occupancy by Age of Householder in Kenton Vale
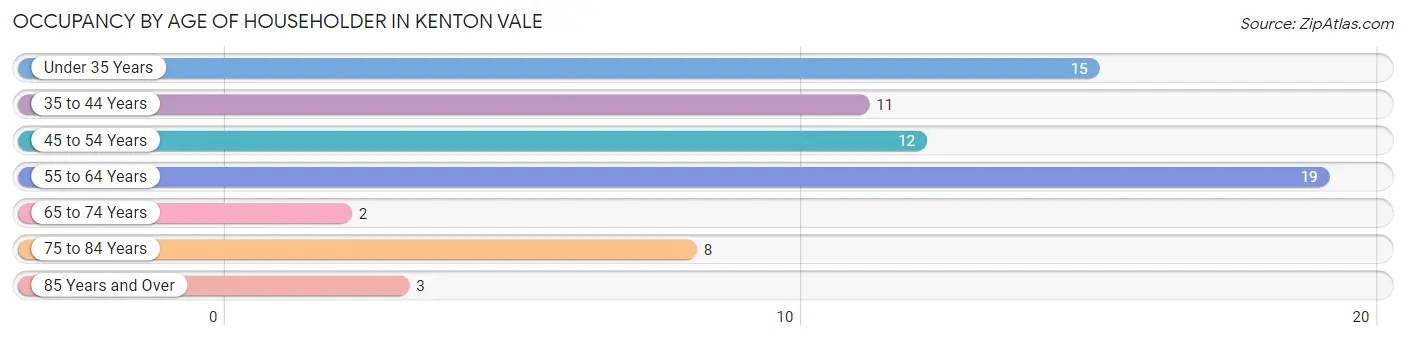
| Age Bracket | # Households | % Households |
| Under 35 Years | 15 | 21.4% |
| 35 to 44 Years | 11 | 15.7% |
| 45 to 54 Years | 12 | 17.1% |
| 55 to 64 Years | 19 | 27.1% |
| 65 to 74 Years | 2 | 2.9% |
| 75 to 84 Years | 8 | 11.4% |
| 85 Years and Over | 3 | 4.3% |
| Total | 70 | 100.0% |
Housing Finances in Kenton Vale
Median Income by Occupancy in Kenton Vale
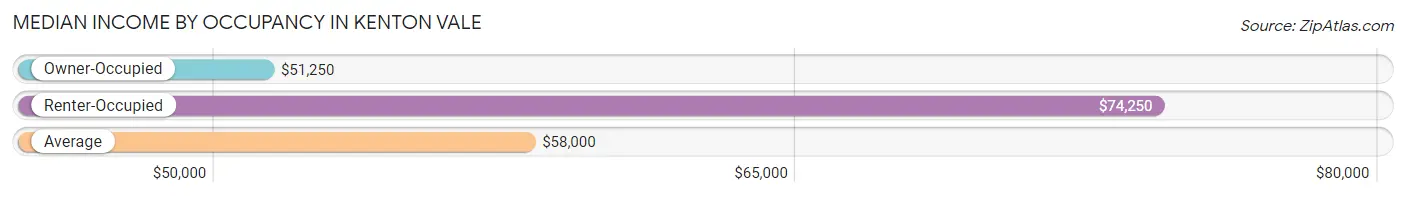
| Occupancy Type | # Households | Median Income |
| Owner-Occupied | 59 (84.3%) | $51,250 |
| Renter-Occupied | 11 (15.7%) | $74,250 |
| Average | 70 (100.0%) | $58,000 |
Occupancy by Householder Income Bracket in Kenton Vale
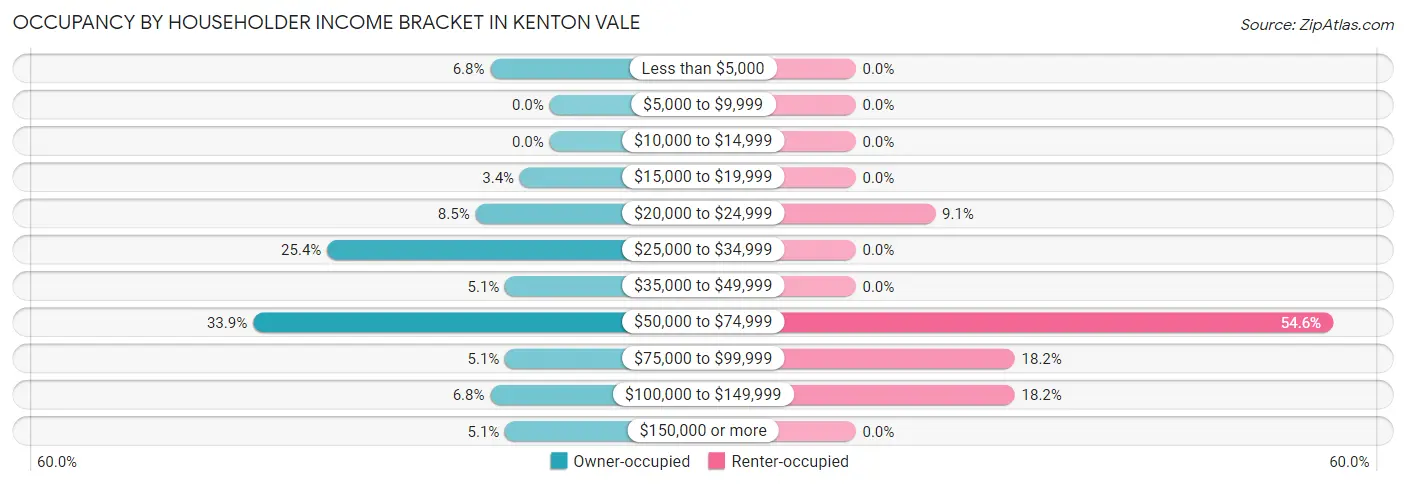
| Income Bracket | Owner-occupied | Renter-occupied |
| Less than $5,000 | 4 (6.8%) | 0 (0.0%) |
| $5,000 to $9,999 | 0 (0.0%) | 0 (0.0%) |
| $10,000 to $14,999 | 0 (0.0%) | 0 (0.0%) |
| $15,000 to $19,999 | 2 (3.4%) | 0 (0.0%) |
| $20,000 to $24,999 | 5 (8.5%) | 1 (9.1%) |
| $25,000 to $34,999 | 15 (25.4%) | 0 (0.0%) |
| $35,000 to $49,999 | 3 (5.1%) | 0 (0.0%) |
| $50,000 to $74,999 | 20 (33.9%) | 6 (54.5%) |
| $75,000 to $99,999 | 3 (5.1%) | 2 (18.2%) |
| $100,000 to $149,999 | 4 (6.8%) | 2 (18.2%) |
| $150,000 or more | 3 (5.1%) | 0 (0.0%) |
| Total | 59 (100.0%) | 11 (100.0%) |
Monthly Housing Cost Tiers in Kenton Vale
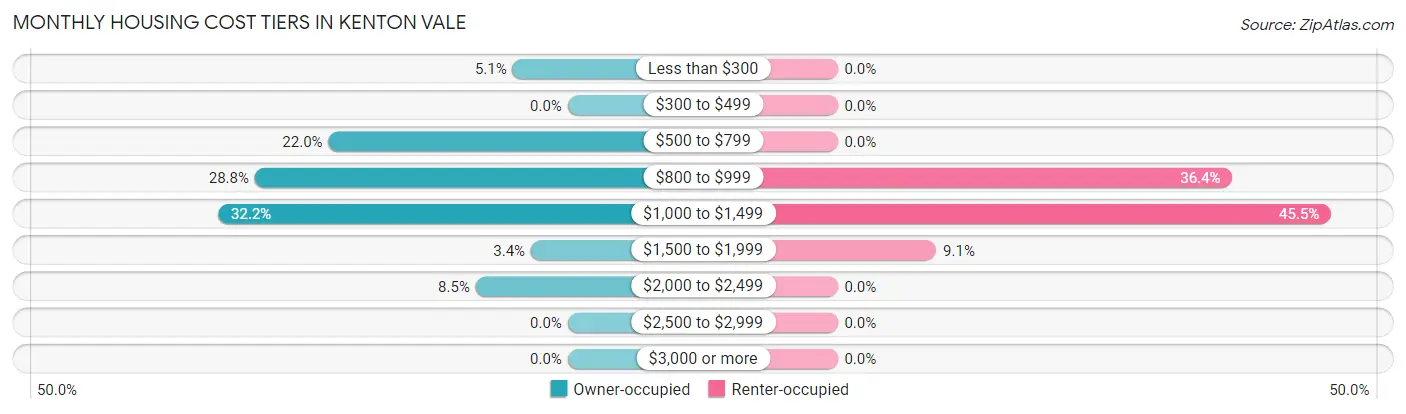
| Monthly Cost | Owner-occupied | Renter-occupied |
| Less than $300 | 3 (5.1%) | 0 (0.0%) |
| $300 to $499 | 0 (0.0%) | 0 (0.0%) |
| $500 to $799 | 13 (22.0%) | 0 (0.0%) |
| $800 to $999 | 17 (28.8%) | 4 (36.4%) |
| $1,000 to $1,499 | 19 (32.2%) | 5 (45.5%) |
| $1,500 to $1,999 | 2 (3.4%) | 1 (9.1%) |
| $2,000 to $2,499 | 5 (8.5%) | 0 (0.0%) |
| $2,500 to $2,999 | 0 (0.0%) | 0 (0.0%) |
| $3,000 or more | 0 (0.0%) | 0 (0.0%) |
| Total | 59 (100.0%) | 11 (100.0%) |
Physical Housing Characteristics in Kenton Vale
Housing Structures in Kenton Vale
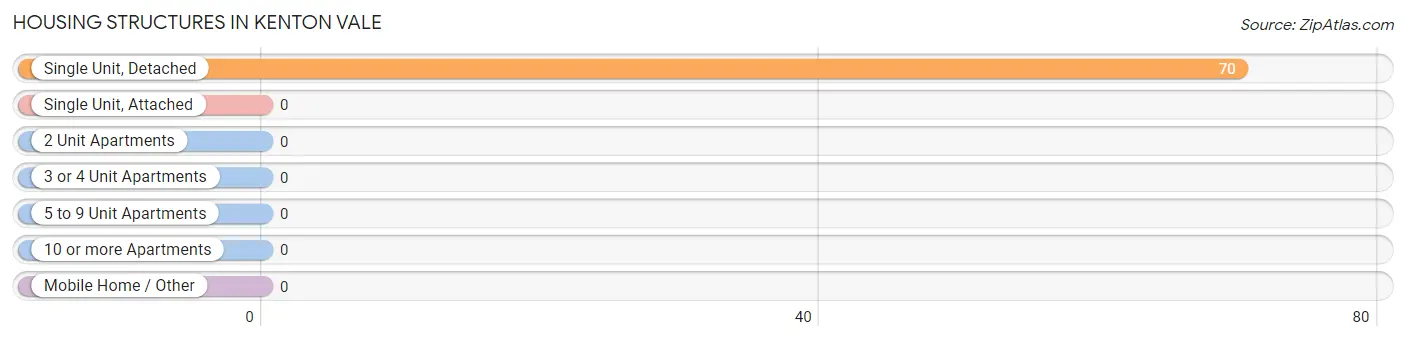
| Structure Type | # Housing Units | % Housing Units |
| Single Unit, Detached | 70 | 100.0% |
| Single Unit, Attached | 0 | 0.0% |
| 2 Unit Apartments | 0 | 0.0% |
| 3 or 4 Unit Apartments | 0 | 0.0% |
| 5 to 9 Unit Apartments | 0 | 0.0% |
| 10 or more Apartments | 0 | 0.0% |
| Mobile Home / Other | 0 | 0.0% |
| Total | 70 | 100.0% |
Housing Structures by Occupancy in Kenton Vale
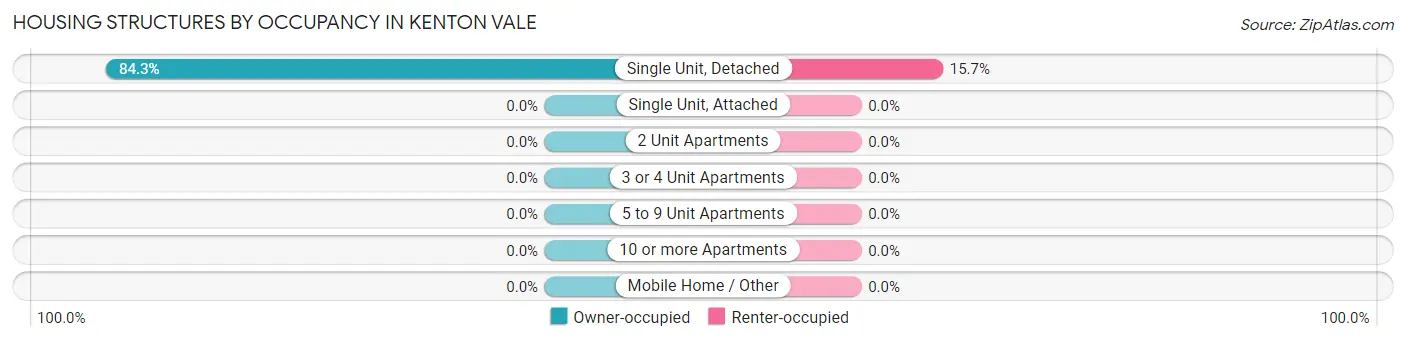
| Structure Type | Owner-occupied | Renter-occupied |
| Single Unit, Detached | 59 (84.3%) | 11 (15.7%) |
| Single Unit, Attached | 0 (0.0%) | 0 (0.0%) |
| 2 Unit Apartments | 0 (0.0%) | 0 (0.0%) |
| 3 or 4 Unit Apartments | 0 (0.0%) | 0 (0.0%) |
| 5 to 9 Unit Apartments | 0 (0.0%) | 0 (0.0%) |
| 10 or more Apartments | 0 (0.0%) | 0 (0.0%) |
| Mobile Home / Other | 0 (0.0%) | 0 (0.0%) |
| Total | 59 (84.3%) | 11 (15.7%) |
Housing Structures by Number of Rooms in Kenton Vale
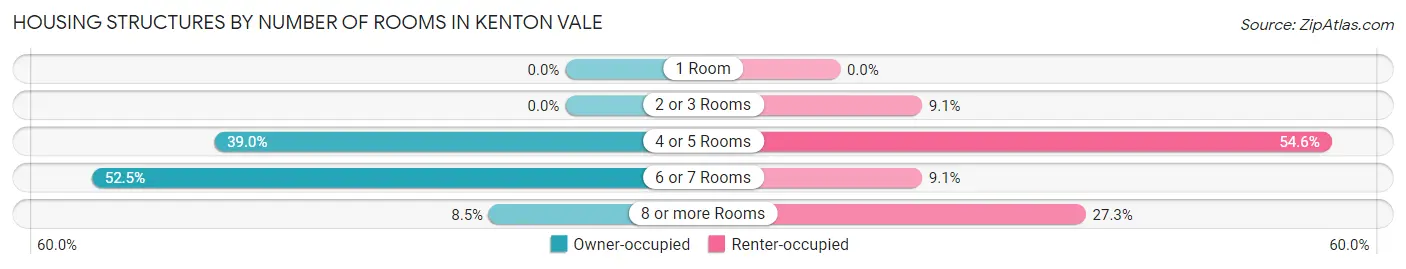
| Number of Rooms | Owner-occupied | Renter-occupied |
| 1 Room | 0 (0.0%) | 0 (0.0%) |
| 2 or 3 Rooms | 0 (0.0%) | 1 (9.1%) |
| 4 or 5 Rooms | 23 (39.0%) | 6 (54.5%) |
| 6 or 7 Rooms | 31 (52.5%) | 1 (9.1%) |
| 8 or more Rooms | 5 (8.5%) | 3 (27.3%) |
| Total | 59 (100.0%) | 11 (100.0%) |
Housing Structure by Heating Type in Kenton Vale
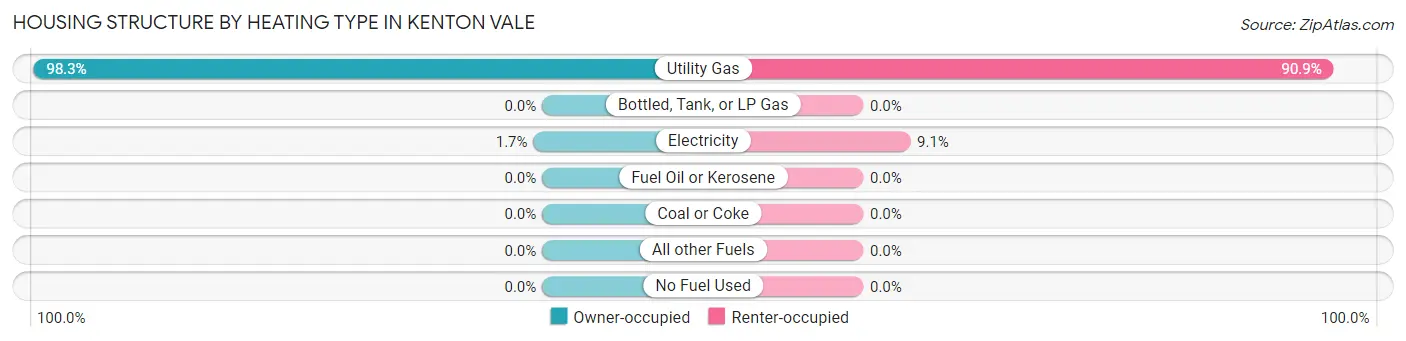
| Heating Type | Owner-occupied | Renter-occupied |
| Utility Gas | 58 (98.3%) | 10 (90.9%) |
| Bottled, Tank, or LP Gas | 0 (0.0%) | 0 (0.0%) |
| Electricity | 1 (1.7%) | 1 (9.1%) |
| Fuel Oil or Kerosene | 0 (0.0%) | 0 (0.0%) |
| Coal or Coke | 0 (0.0%) | 0 (0.0%) |
| All other Fuels | 0 (0.0%) | 0 (0.0%) |
| No Fuel Used | 0 (0.0%) | 0 (0.0%) |
| Total | 59 (100.0%) | 11 (100.0%) |
Household Vehicle Usage in Kenton Vale
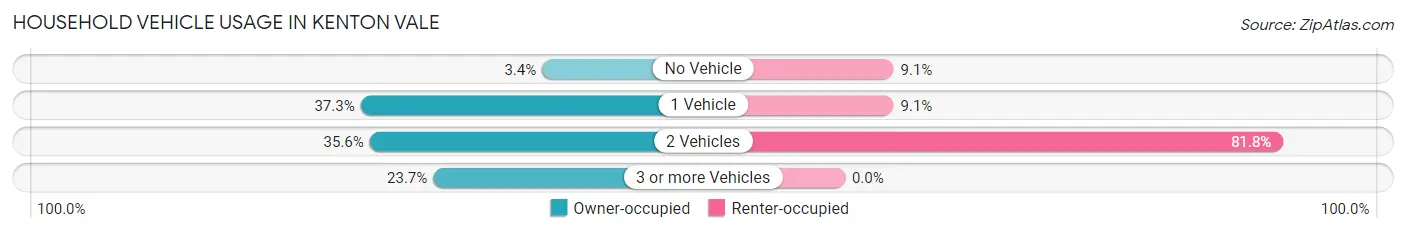
| Vehicles per Household | Owner-occupied | Renter-occupied |
| No Vehicle | 2 (3.4%) | 1 (9.1%) |
| 1 Vehicle | 22 (37.3%) | 1 (9.1%) |
| 2 Vehicles | 21 (35.6%) | 9 (81.8%) |
| 3 or more Vehicles | 14 (23.7%) | 0 (0.0%) |
| Total | 59 (100.0%) | 11 (100.0%) |
Real Estate & Mortgages in Kenton Vale
Real Estate and Mortgage Overview in Kenton Vale
| Characteristic | Without Mortgage | With Mortgage |
| Housing Units | 14 | 45 |
| Median Property Value | $116,700 | $137,500 |
| Median Household Income | $32,083 | $3 |
| Monthly Housing Costs | $650 | $0 |
| Real Estate Taxes | $1,063 | $1 |
Property Value by Mortgage Status in Kenton Vale
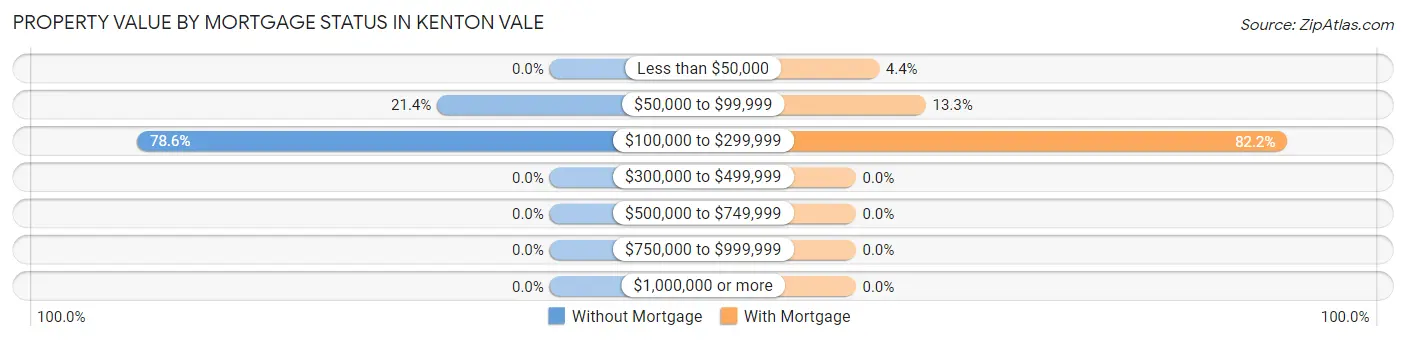
| Property Value | Without Mortgage | With Mortgage |
| Less than $50,000 | 0 (0.0%) | 2 (4.4%) |
| $50,000 to $99,999 | 3 (21.4%) | 6 (13.3%) |
| $100,000 to $299,999 | 11 (78.6%) | 37 (82.2%) |
| $300,000 to $499,999 | 0 (0.0%) | 0 (0.0%) |
| $500,000 to $749,999 | 0 (0.0%) | 0 (0.0%) |
| $750,000 to $999,999 | 0 (0.0%) | 0 (0.0%) |
| $1,000,000 or more | 0 (0.0%) | 0 (0.0%) |
| Total | 14 (100.0%) | 45 (100.0%) |
Household Income by Mortgage Status in Kenton Vale
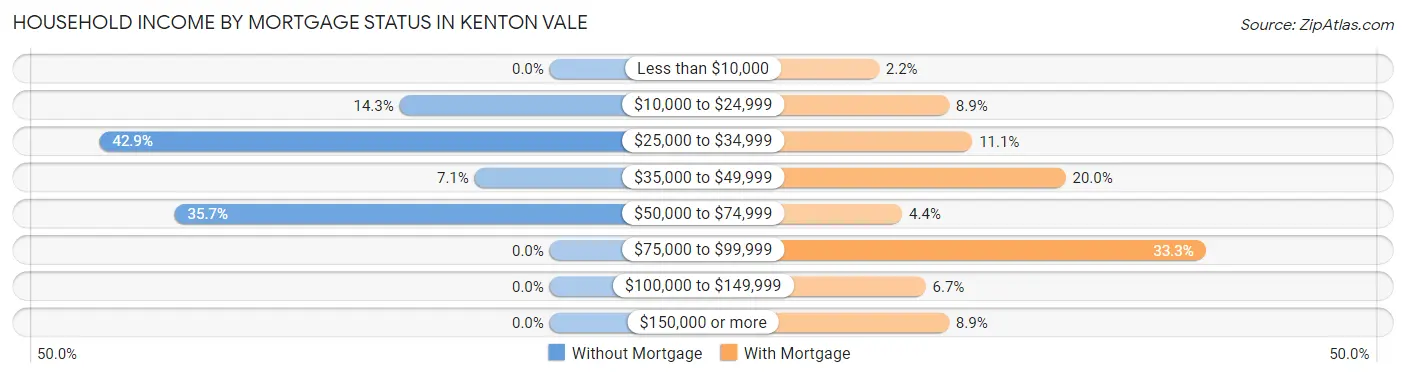
| Household Income | Without Mortgage | With Mortgage |
| Less than $10,000 | 0 (0.0%) | 1 (2.2%) |
| $10,000 to $24,999 | 2 (14.3%) | 4 (8.9%) |
| $25,000 to $34,999 | 6 (42.9%) | 5 (11.1%) |
| $35,000 to $49,999 | 1 (7.1%) | 9 (20.0%) |
| $50,000 to $74,999 | 5 (35.7%) | 2 (4.4%) |
| $75,000 to $99,999 | 0 (0.0%) | 15 (33.3%) |
| $100,000 to $149,999 | 0 (0.0%) | 3 (6.7%) |
| $150,000 or more | 0 (0.0%) | 4 (8.9%) |
| Total | 14 (100.0%) | 45 (100.0%) |
Property Value to Household Income Ratio in Kenton Vale
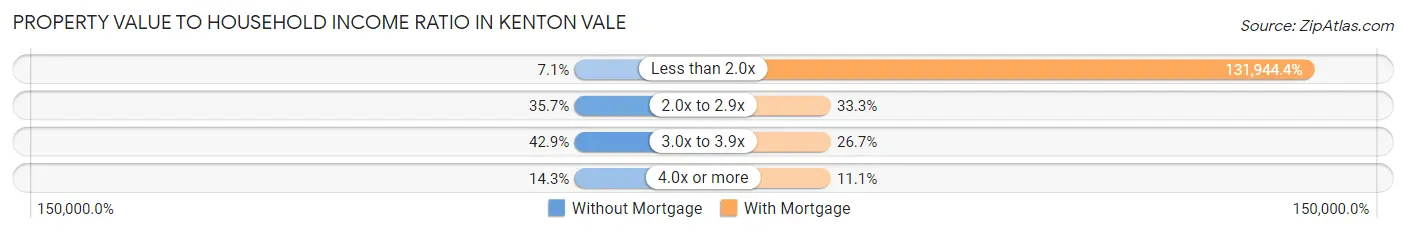
| Value-to-Income Ratio | Without Mortgage | With Mortgage |
| Less than 2.0x | 1 (7.1%) | 59,375 (131,944.4%) |
| 2.0x to 2.9x | 5 (35.7%) | 15 (33.3%) |
| 3.0x to 3.9x | 6 (42.9%) | 12 (26.7%) |
| 4.0x or more | 2 (14.3%) | 5 (11.1%) |
| Total | 14 (100.0%) | 45 (100.0%) |
Real Estate Taxes by Mortgage Status in Kenton Vale
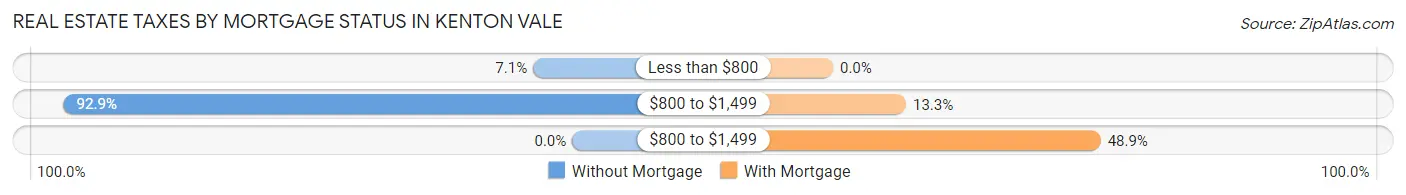
| Property Taxes | Without Mortgage | With Mortgage |
| Less than $800 | 1 (7.1%) | 0 (0.0%) |
| $800 to $1,499 | 13 (92.9%) | 6 (13.3%) |
| $800 to $1,499 | 0 (0.0%) | 22 (48.9%) |
| Total | 14 (100.0%) | 45 (100.0%) |
Health & Disability in Kenton Vale
Health Insurance Coverage by Age in Kenton Vale
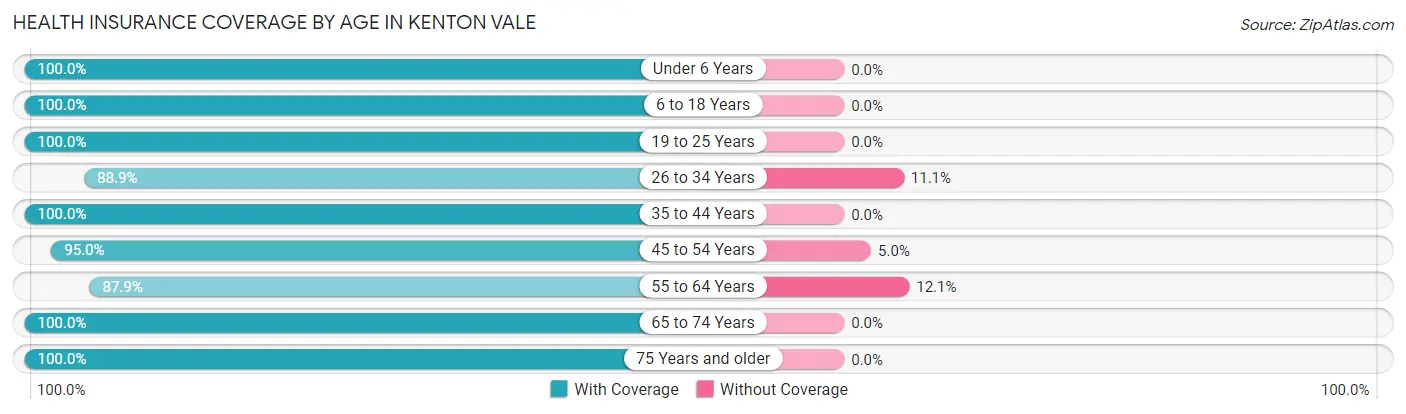
| Age Bracket | With Coverage | Without Coverage |
| Under 6 Years | 15 (100.0%) | 0 (0.0%) |
| 6 to 18 Years | 13 (100.0%) | 0 (0.0%) |
| 19 to 25 Years | 4 (100.0%) | 0 (0.0%) |
| 26 to 34 Years | 24 (88.9%) | 3 (11.1%) |
| 35 to 44 Years | 16 (100.0%) | 0 (0.0%) |
| 45 to 54 Years | 19 (95.0%) | 1 (5.0%) |
| 55 to 64 Years | 29 (87.9%) | 4 (12.1%) |
| 65 to 74 Years | 2 (100.0%) | 0 (0.0%) |
| 75 Years and older | 13 (100.0%) | 0 (0.0%) |
| Total | 135 (94.4%) | 8 (5.6%) |
Health Insurance Coverage by Citizenship Status in Kenton Vale
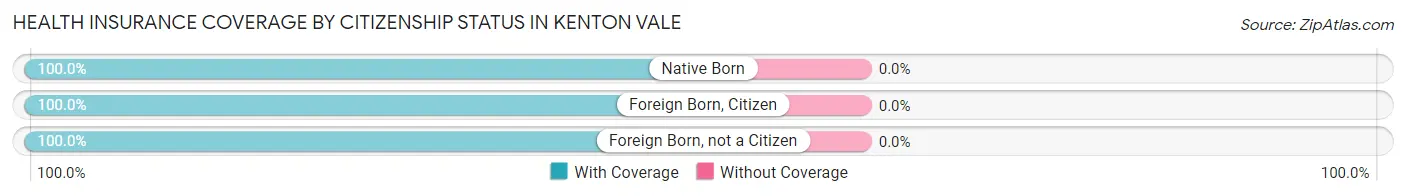
| Citizenship Status | With Coverage | Without Coverage |
| Native Born | 15 (100.0%) | 0 (0.0%) |
| Foreign Born, Citizen | 13 (100.0%) | 0 (0.0%) |
| Foreign Born, not a Citizen | 4 (100.0%) | 0 (0.0%) |
Health Insurance Coverage by Household Income in Kenton Vale
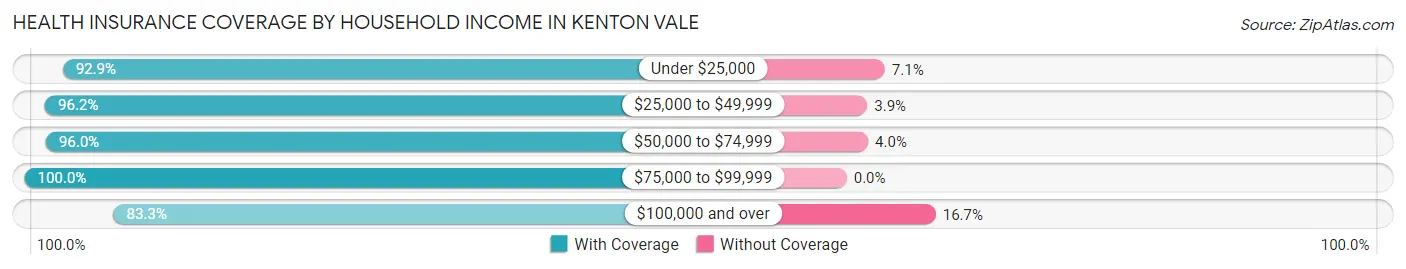
| Household Income | With Coverage | Without Coverage |
| Under $25,000 | 13 (92.9%) | 1 (7.1%) |
| $25,000 to $49,999 | 25 (96.2%) | 1 (3.8%) |
| $50,000 to $74,999 | 72 (96.0%) | 3 (4.0%) |
| $75,000 to $99,999 | 10 (100.0%) | 0 (0.0%) |
| $100,000 and over | 15 (83.3%) | 3 (16.7%) |
Public vs Private Health Insurance Coverage by Age in Kenton Vale
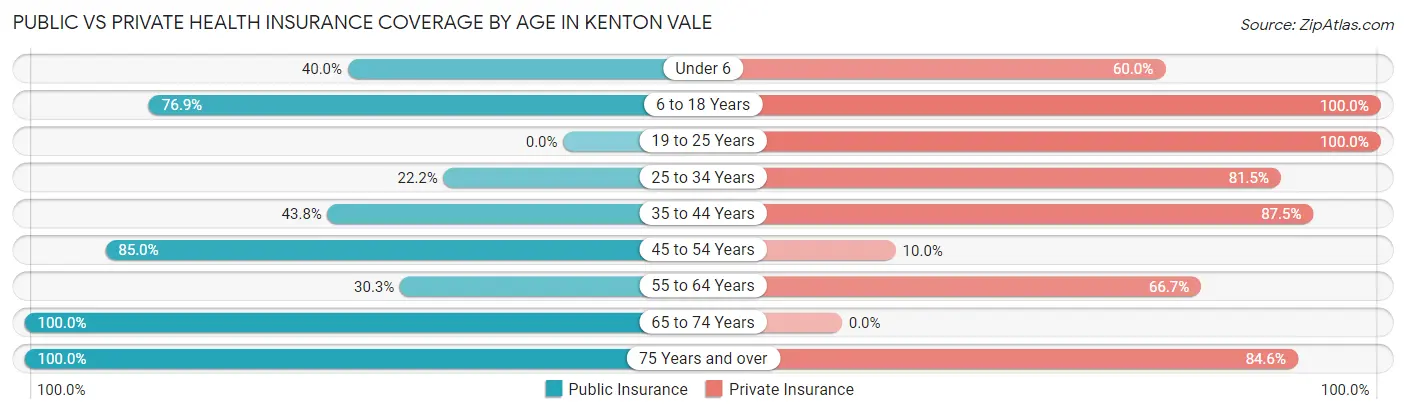
| Age Bracket | Public Insurance | Private Insurance |
| Under 6 | 6 (40.0%) | 9 (60.0%) |
| 6 to 18 Years | 10 (76.9%) | 13 (100.0%) |
| 19 to 25 Years | 0 (0.0%) | 4 (100.0%) |
| 25 to 34 Years | 6 (22.2%) | 22 (81.5%) |
| 35 to 44 Years | 7 (43.8%) | 14 (87.5%) |
| 45 to 54 Years | 17 (85.0%) | 2 (10.0%) |
| 55 to 64 Years | 10 (30.3%) | 22 (66.7%) |
| 65 to 74 Years | 2 (100.0%) | 0 (0.0%) |
| 75 Years and over | 13 (100.0%) | 11 (84.6%) |
| Total | 71 (49.6%) | 97 (67.8%) |
Disability Status by Sex by Age in Kenton Vale
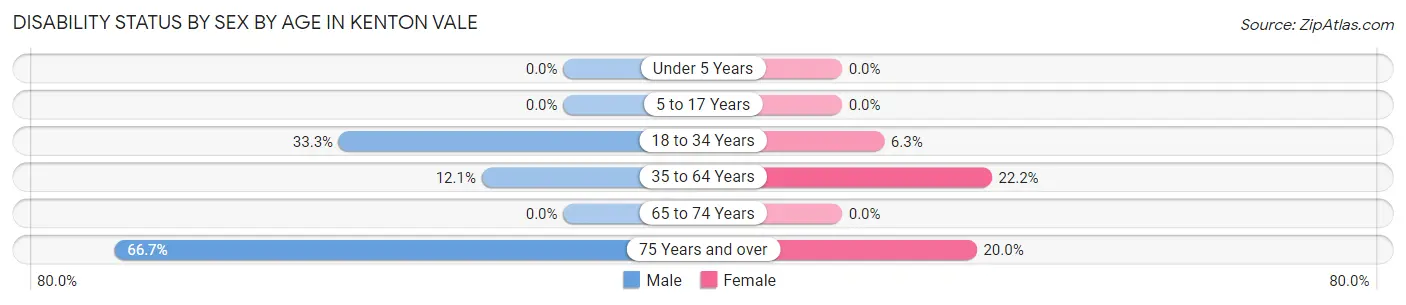
| Age Bracket | Male | Female |
| Under 5 Years | 0 (0.0%) | 0 (0.0%) |
| 5 to 17 Years | 0 (0.0%) | 0 (0.0%) |
| 18 to 34 Years | 5 (33.3%) | 1 (6.2%) |
| 35 to 64 Years | 4 (12.1%) | 8 (22.2%) |
| 65 to 74 Years | 0 (0.0%) | 0 (0.0%) |
| 75 Years and over | 2 (66.7%) | 2 (20.0%) |
Disability Class by Sex by Age in Kenton Vale
Disability Class: Hearing Difficulty
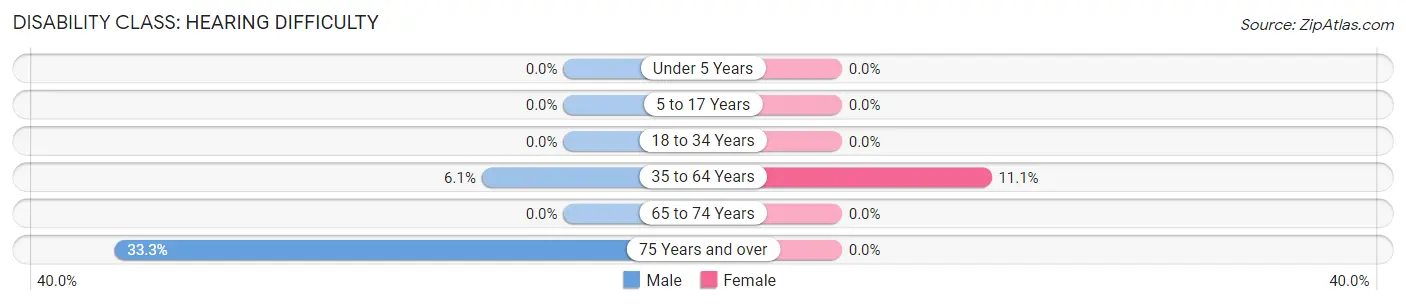
| Age Bracket | Male | Female |
| Under 5 Years | 0 (0.0%) | 0 (0.0%) |
| 5 to 17 Years | 0 (0.0%) | 0 (0.0%) |
| 18 to 34 Years | 0 (0.0%) | 0 (0.0%) |
| 35 to 64 Years | 2 (6.1%) | 4 (11.1%) |
| 65 to 74 Years | 0 (0.0%) | 0 (0.0%) |
| 75 Years and over | 1 (33.3%) | 0 (0.0%) |
Disability Class: Vision Difficulty
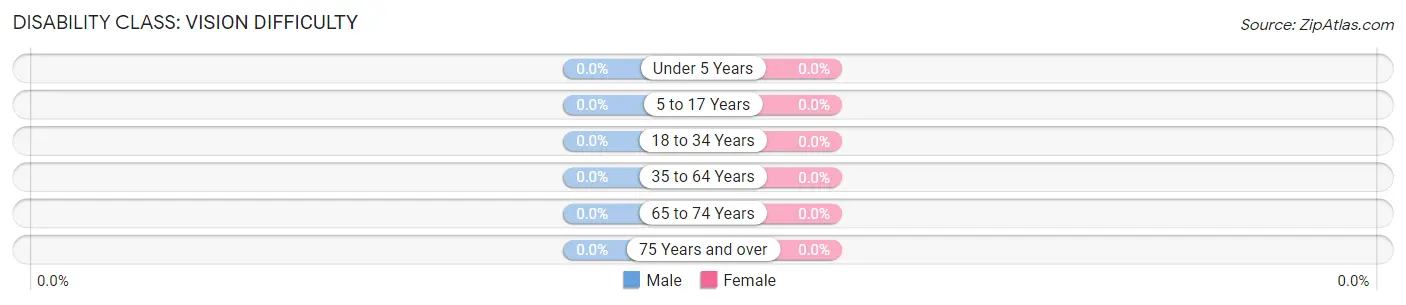
| Age Bracket | Male | Female |
| Under 5 Years | 0 (0.0%) | 0 (0.0%) |
| 5 to 17 Years | 0 (0.0%) | 0 (0.0%) |
| 18 to 34 Years | 0 (0.0%) | 0 (0.0%) |
| 35 to 64 Years | 0 (0.0%) | 0 (0.0%) |
| 65 to 74 Years | 0 (0.0%) | 0 (0.0%) |
| 75 Years and over | 0 (0.0%) | 0 (0.0%) |
Disability Class: Cognitive Difficulty
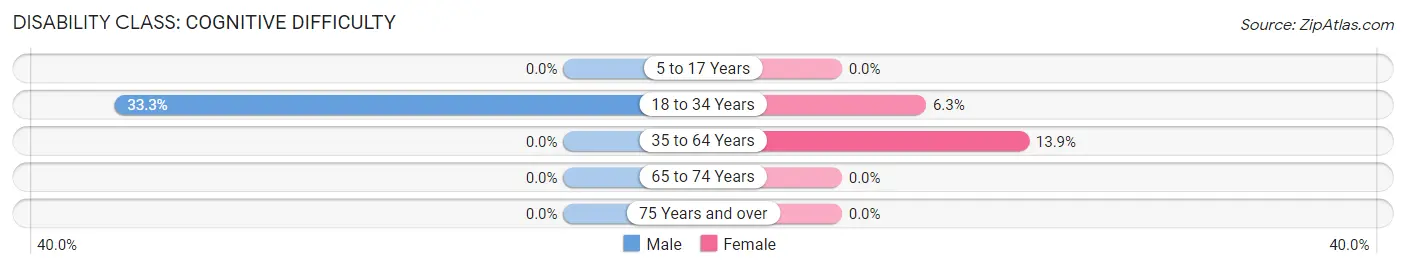
| Age Bracket | Male | Female |
| 5 to 17 Years | 0 (0.0%) | 0 (0.0%) |
| 18 to 34 Years | 5 (33.3%) | 1 (6.2%) |
| 35 to 64 Years | 0 (0.0%) | 5 (13.9%) |
| 65 to 74 Years | 0 (0.0%) | 0 (0.0%) |
| 75 Years and over | 0 (0.0%) | 0 (0.0%) |
Disability Class: Ambulatory Difficulty
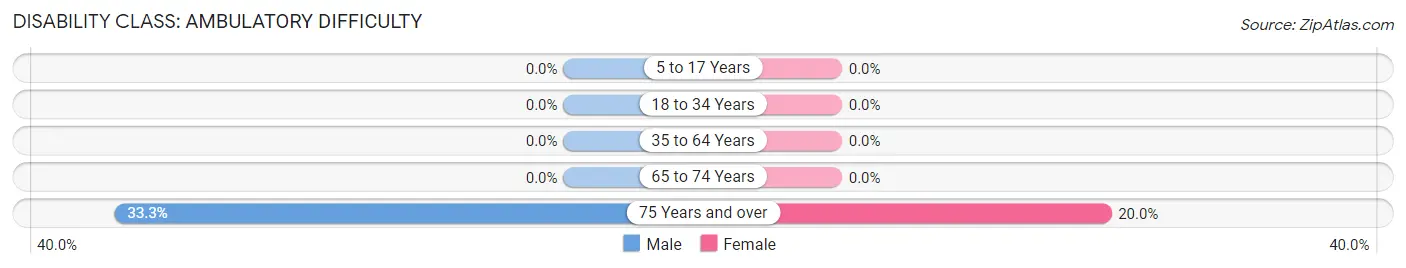
| Age Bracket | Male | Female |
| 5 to 17 Years | 0 (0.0%) | 0 (0.0%) |
| 18 to 34 Years | 0 (0.0%) | 0 (0.0%) |
| 35 to 64 Years | 0 (0.0%) | 0 (0.0%) |
| 65 to 74 Years | 0 (0.0%) | 0 (0.0%) |
| 75 Years and over | 1 (33.3%) | 2 (20.0%) |
Disability Class: Self-Care Difficulty
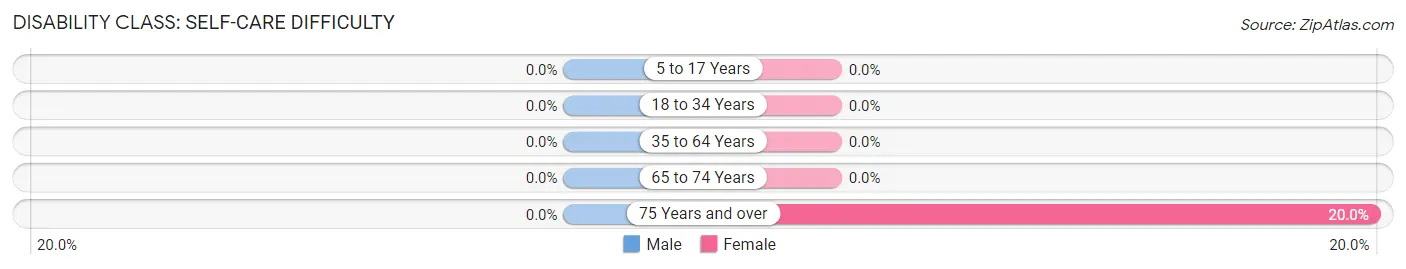
| Age Bracket | Male | Female |
| 5 to 17 Years | 0 (0.0%) | 0 (0.0%) |
| 18 to 34 Years | 0 (0.0%) | 0 (0.0%) |
| 35 to 64 Years | 0 (0.0%) | 0 (0.0%) |
| 65 to 74 Years | 0 (0.0%) | 0 (0.0%) |
| 75 Years and over | 0 (0.0%) | 2 (20.0%) |
Technology Access in Kenton Vale
Computing Device Access in Kenton Vale
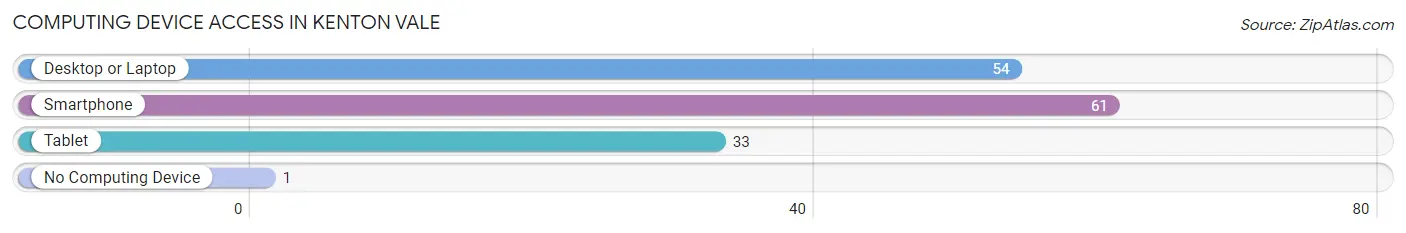
| Device Type | # Households | % Households |
| Desktop or Laptop | 54 | 77.1% |
| Smartphone | 61 | 87.1% |
| Tablet | 33 | 47.1% |
| No Computing Device | 1 | 1.4% |
| Total | 70 | 100.0% |
Internet Access in Kenton Vale
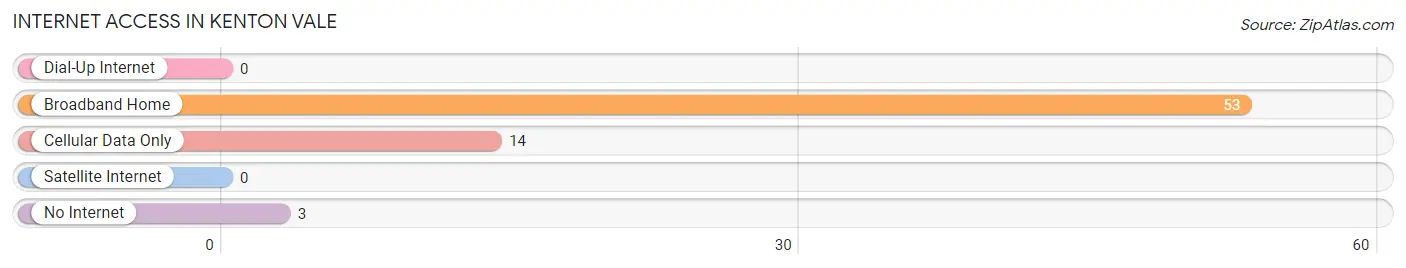
| Internet Type | # Households | % Households |
| Dial-Up Internet | 0 | 0.0% |
| Broadband Home | 53 | 75.7% |
| Cellular Data Only | 14 | 20.0% |
| Satellite Internet | 0 | 0.0% |
| No Internet | 3 | 4.3% |
| Total | 70 | 100.0% |
Kenton Vale Summary
Kenton Vale is a small town located in the state of Kentucky, United States. It is situated in the northern part of the state, in the foothills of the Appalachian Mountains. The town is located in the county of Kenton, and is part of the Cincinnati metropolitan area. The population of Kenton Vale was estimated to be 1,845 in the year 2020.
History
Kenton Vale was founded in 1820 by a group of settlers from the nearby town of Covington. The town was named after the county in which it is located, Kenton. The town was originally a farming community, and the main crops grown were corn, wheat, and tobacco. The town was also known for its production of whiskey, which was made from the local corn and wheat.
In the late 19th century, the town began to grow and develop. The railroad was built through the town, and the town became a popular stop for travelers. The town also became a popular destination for tourists, as it was close to the Ohio River and the Appalachian Mountains.
In the early 20th century, the town began to decline. The railroad was no longer used, and the town's economy began to suffer. The population of the town began to decline, and by the 1950s, the town was nearly abandoned.
In the late 20th century, the town began to experience a revival. The town was revitalized with the help of the local government, and the population began to grow again. The town is now a popular tourist destination, and is home to a variety of businesses and attractions.
Geography
Kenton Vale is located in the northern part of the state of Kentucky, in the foothills of the Appalachian Mountains. The town is situated in the county of Kenton, and is part of the Cincinnati metropolitan area. The town is located on the banks of the Ohio River, and is surrounded by rolling hills and forests.
The climate in Kenton Vale is humid subtropical, with hot summers and mild winters. The average temperature in the summer is around 80 degrees Fahrenheit, and the average temperature in the winter is around 40 degrees Fahrenheit. The town receives an average of 40 inches of rain per year.
Economy
Kenton Vale is a small town, and the economy is largely based on tourism. The town is home to a variety of attractions, including the Kenton County Historical Museum, the Kenton County Courthouse, and the Kenton County Fairgrounds. The town is also home to a variety of restaurants, shops, and other businesses.
The town is also home to a variety of manufacturing companies, including a furniture factory, a printing company, and a plastics factory. The town is also home to a variety of agricultural businesses, including a dairy farm, a poultry farm, and a vegetable farm.
Demographics
Kenton Vale is a small town, and the population was estimated to be 1,845 in the year 2020. The town is predominantly white, with a small percentage of African Americans, Hispanics, and Asians. The median household income in the town is around $45,000, and the median home value is around $150,000. The town has a low unemployment rate, and the majority of the population is employed in the tourism and manufacturing industries.
Common Questions
What is Per Capita Income in Kenton Vale?
Per Capita income in Kenton Vale is $28,220.
What is the Median Family Income in Kenton Vale?
Median Family Income in Kenton Vale is $60,694.
What is the Median Household income in Kenton Vale?
Median Household Income in Kenton Vale is $58,000.
What is Income or Wage Gap in Kenton Vale?
Income or Wage Gap in Kenton Vale is 41.4%.
Women in Kenton Vale earn 58.6 cents for every dollar earned by a man.
What is Inequality or Gini Index in Kenton Vale?
Inequality or Gini Index in Kenton Vale is 0.36.
What is the Total Population of Kenton Vale?
Total Population of Kenton Vale is 143.
What is the Total Male Population of Kenton Vale?
Total Male Population of Kenton Vale is 65.
What is the Total Female Population of Kenton Vale?
Total Female Population of Kenton Vale is 78.
What is the Ratio of Males per 100 Females in Kenton Vale?
There are 83.33 Males per 100 Females in Kenton Vale.
What is the Ratio of Females per 100 Males in Kenton Vale?
There are 120.00 Females per 100 Males in Kenton Vale.
What is the Median Population Age in Kenton Vale?
Median Population Age in Kenton Vale is 39.9 Years.
What is the Average Family Size in Kenton Vale
Average Family Size in Kenton Vale is 2.5 People.
What is the Average Household Size in Kenton Vale
Average Household Size in Kenton Vale is 2.0 People.
How Large is the Labor Force in Kenton Vale?
There are 76 People in the Labor Forcein in Kenton Vale.
What is the Percentage of People in the Labor Force in Kenton Vale?
62.8% of People are in the Labor Force in Kenton Vale.