Paintsville, KY Map & Demographics
Paintsville Map
Paintsville Overview
$20,487
PER CAPITA INCOME
$27,601
AVG HOUSEHOLD INCOME
7.7%
WAGE / INCOME GAP [ % ]
92.3¢/ $1
WAGE / INCOME GAP [ $ ]
0.51
INEQUALITY / GINI INDEX
4,277
TOTAL POPULATION
1,900
MALE POPULATION
2,377
FEMALE POPULATION
79.93
MALES / 100 FEMALES
125.11
FEMALES / 100 MALES
42.3
MEDIAN AGE
3.1
AVG FAMILY SIZE
2.4
AVG HOUSEHOLD SIZE
1,400
LABOR FORCE [ PEOPLE ]
41.2%
PERCENT IN LABOR FORCE
7.6%
UNEMPLOYMENT RATE
Paintsville Zip Codes
Paintsville Area Codes
Income in Paintsville
Income Overview in Paintsville
| Characteristic | Number | Measure |
| Per Capita Income | 4,277 | $20,487 |
| Median Family Income | 1,034 | $0 |
| Mean Family Income | 1,034 | $62,745 |
| Median Household Income | 1,615 | $27,601 |
| Mean Household Income | 1,615 | $52,056 |
| Income Deficit | 1,034 | $0 |
| Wage / Income Gap (%) | 4,277 | 7.74% |
| Wage / Income Gap ($) | 4,277 | 92.26¢ per $1 |
| Gini / Inequality Index | 4,277 | 0.51 |
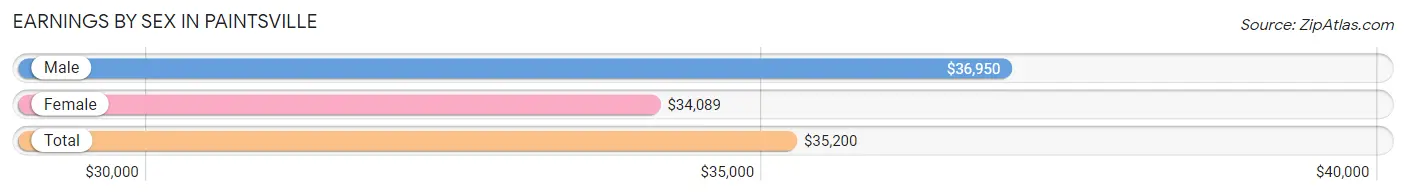
Earnings by Sex in Paintsville
Average Earnings in Paintsville are $35,200, $36,950 for men and $34,089 for women, a difference of 7.7%.
| Sex | Number | Average Earnings |
| Male | 853 (58.4%) | $36,950 |
| Female | 607 (41.6%) | $34,089 |
| Total | 1,460 (100.0%) | $35,200 |
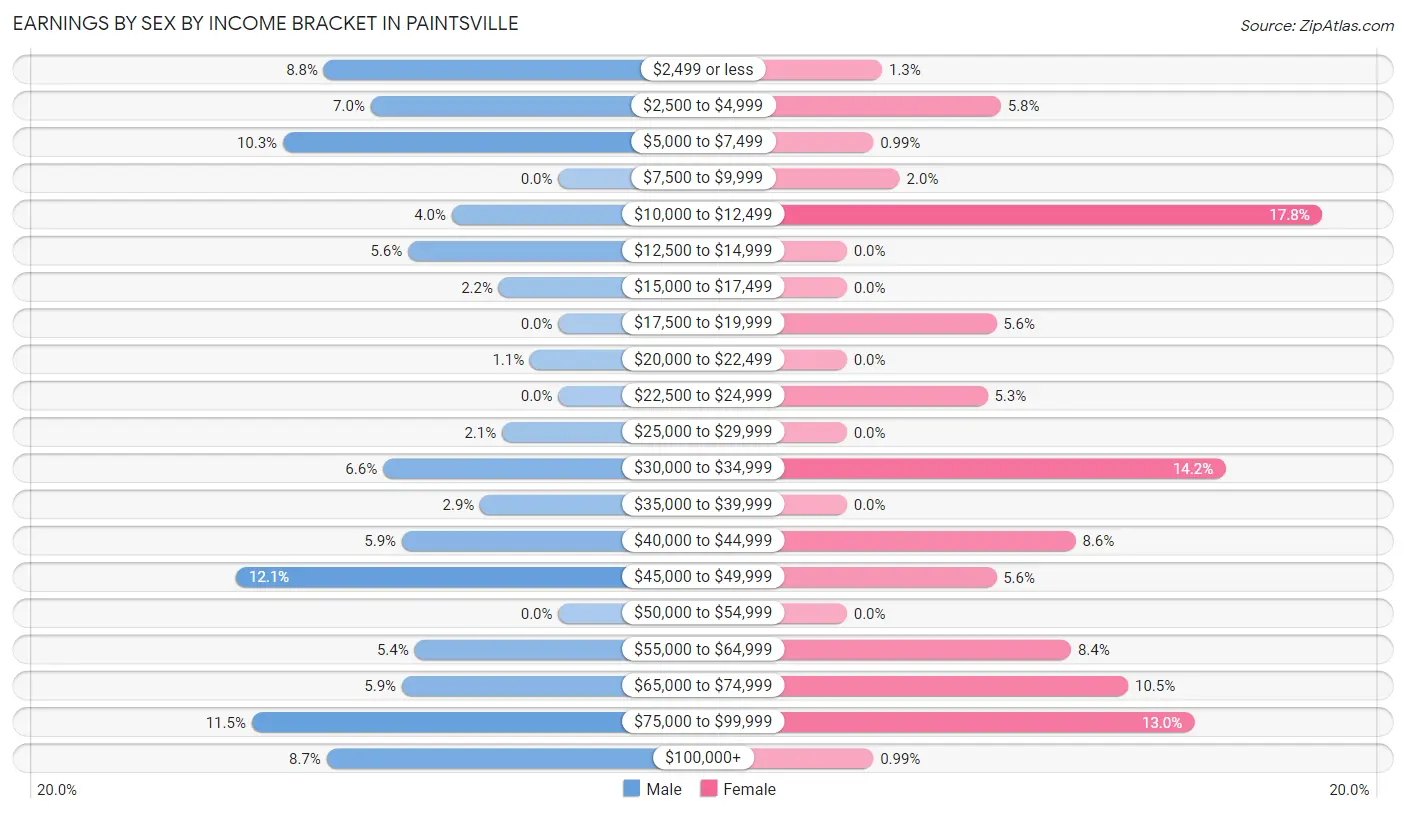
Earnings by Sex by Income Bracket in Paintsville
The most common earnings brackets in Paintsville are $45,000 to $49,999 for men (103 | 12.1%) and $10,000 to $12,499 for women (108 | 17.8%).
| Income | Male | Female |
| $2,499 or less | 75 (8.8%) | 8 (1.3%) |
| $2,500 to $4,999 | 60 (7.0%) | 35 (5.8%) |
| $5,000 to $7,499 | 88 (10.3%) | 6 (1.0%) |
| $7,500 to $9,999 | 0 (0.0%) | 12 (2.0%) |
| $10,000 to $12,499 | 34 (4.0%) | 108 (17.8%) |
| $12,500 to $14,999 | 48 (5.6%) | 0 (0.0%) |
| $15,000 to $17,499 | 19 (2.2%) | 0 (0.0%) |
| $17,500 to $19,999 | 0 (0.0%) | 34 (5.6%) |
| $20,000 to $22,499 | 9 (1.1%) | 0 (0.0%) |
| $22,500 to $24,999 | 0 (0.0%) | 32 (5.3%) |
| $25,000 to $29,999 | 18 (2.1%) | 0 (0.0%) |
| $30,000 to $34,999 | 56 (6.6%) | 86 (14.2%) |
| $35,000 to $39,999 | 25 (2.9%) | 0 (0.0%) |
| $40,000 to $44,999 | 50 (5.9%) | 52 (8.6%) |
| $45,000 to $49,999 | 103 (12.1%) | 34 (5.6%) |
| $50,000 to $54,999 | 0 (0.0%) | 0 (0.0%) |
| $55,000 to $64,999 | 46 (5.4%) | 51 (8.4%) |
| $65,000 to $74,999 | 50 (5.9%) | 64 (10.5%) |
| $75,000 to $99,999 | 98 (11.5%) | 79 (13.0%) |
| $100,000+ | 74 (8.7%) | 6 (1.0%) |
| Total | 853 (100.0%) | 607 (100.0%) |
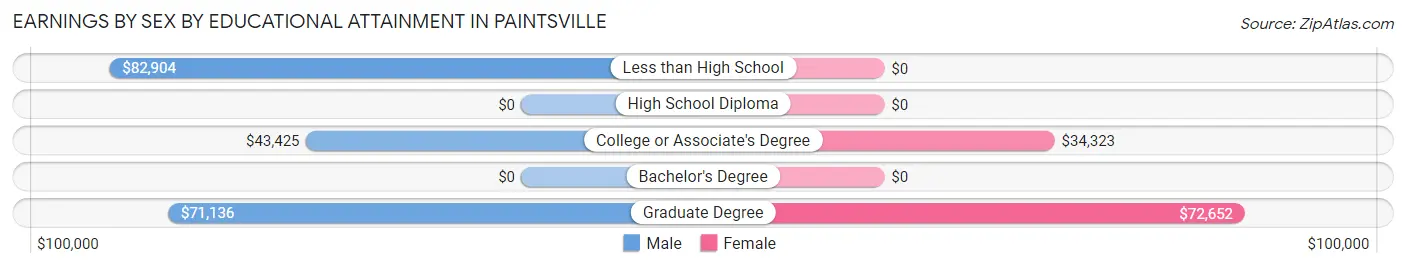
Earnings by Sex by Educational Attainment in Paintsville
Average earnings in Paintsville are $44,675 for men and $40,048 for women, a difference of 10.4%. Men with an educational attainment of less than high school enjoy the highest average annual earnings of $82,904, while those with college or associate's degree education earn the least with $43,425. Women with an educational attainment of graduate degree earn the most with the average annual earnings of $72,652, while those with college or associate's degree education have the smallest earnings of $34,323.
| Educational Attainment | Male Income | Female Income |
| Less than High School | $82,904 | $0 |
| High School Diploma | - | - |
| College or Associate's Degree | $43,425 | $34,323 |
| Bachelor's Degree | - | - |
| Graduate Degree | $71,136 | $72,652 |
| Total | $44,675 | $40,048 |
Family Income in Paintsville
Family Income Brackets in Paintsville
According to the Paintsville family income data, there are 214 families falling into the less than $10,000 income range, which is the most common income bracket and makes up 20.7% of all families.
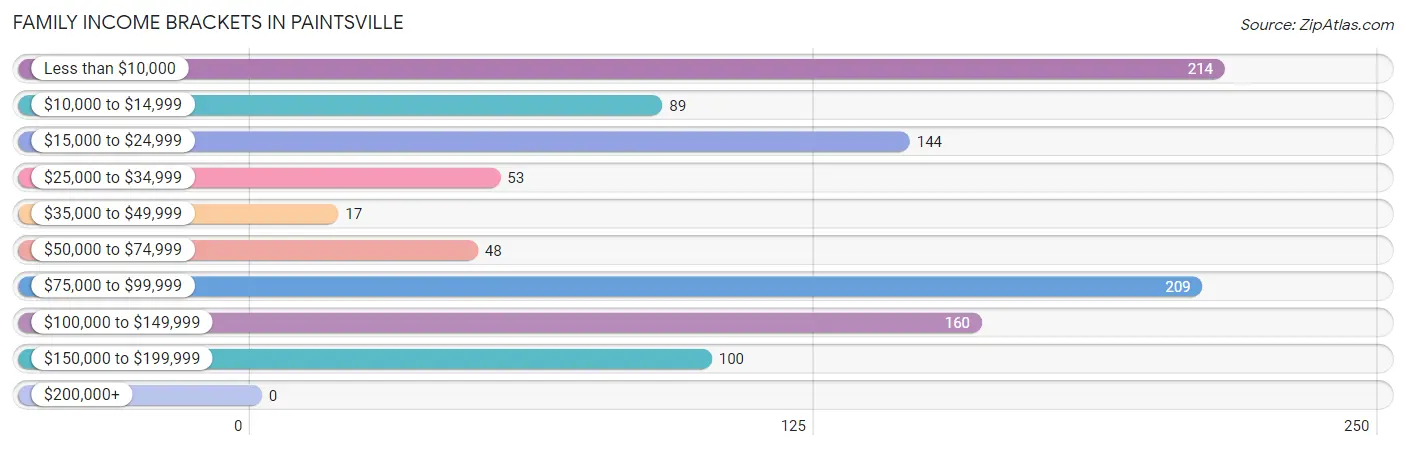
| Income Bracket | # Families | % Families |
| Less than $10,000 | 214 | 20.7% |
| $10,000 to $14,999 | 89 | 8.6% |
| $15,000 to $24,999 | 144 | 13.9% |
| $25,000 to $34,999 | 53 | 5.1% |
| $35,000 to $49,999 | 17 | 1.6% |
| $50,000 to $74,999 | 48 | 4.6% |
| $75,000 to $99,999 | 209 | 20.2% |
| $100,000 to $149,999 | 160 | 15.5% |
| $150,000 to $199,999 | 100 | 9.7% |
| $200,000+ | 0 | 0.0% |
Family Income by Famaliy Size in Paintsville
3-person families (73 | 7.1%) account for the highest median family income in Paintsville with $115,284 per family, while 3-person families (73 | 7.1%) have the highest median income of $38,428 per family member.
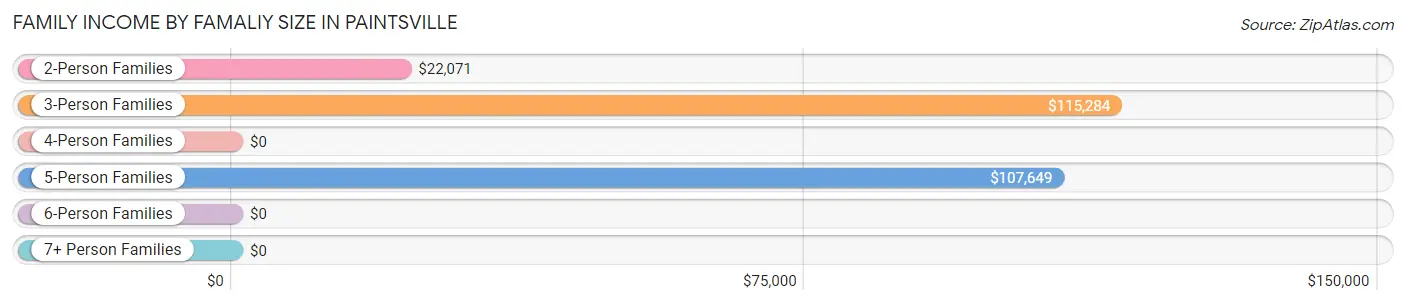
| Income Bracket | # Families | Median Income |
| 2-Person Families | 520 (50.3%) | $22,071 |
| 3-Person Families | 73 (7.1%) | $115,284 |
| 4-Person Families | 308 (29.8%) | $0 |
| 5-Person Families | 126 (12.2%) | $107,649 |
| 6-Person Families | 7 (0.7%) | $0 |
| 7+ Person Families | 0 (0.0%) | $0 |
| Total | 1,034 (100.0%) | $0 |
Family Income by Number of Earners in Paintsville
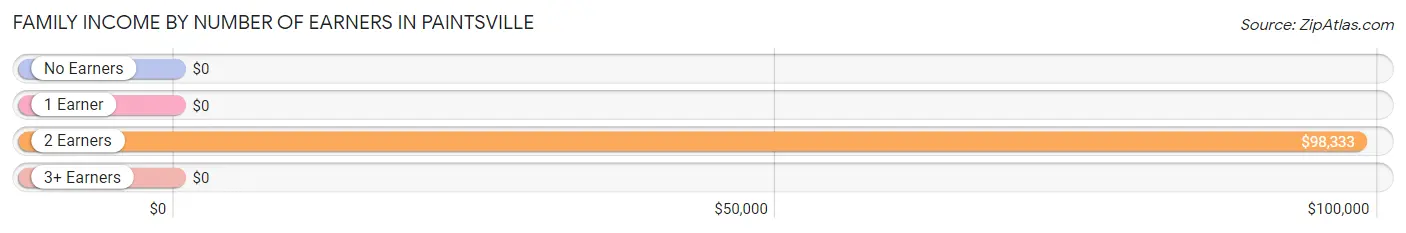
| Number of Earners | # Families | Median Income |
| No Earners | 308 (29.8%) | $0 |
| 1 Earner | 308 (29.8%) | $0 |
| 2 Earners | 344 (33.3%) | $98,333 |
| 3+ Earners | 74 (7.2%) | $0 |
| Total | 1,034 (100.0%) | $0 |
Household Income in Paintsville
Household Income Brackets in Paintsville
With 312 households falling in the category, the $15,000 to $24,999 income range is the most frequent in Paintsville, accounting for 19.3% of all households.
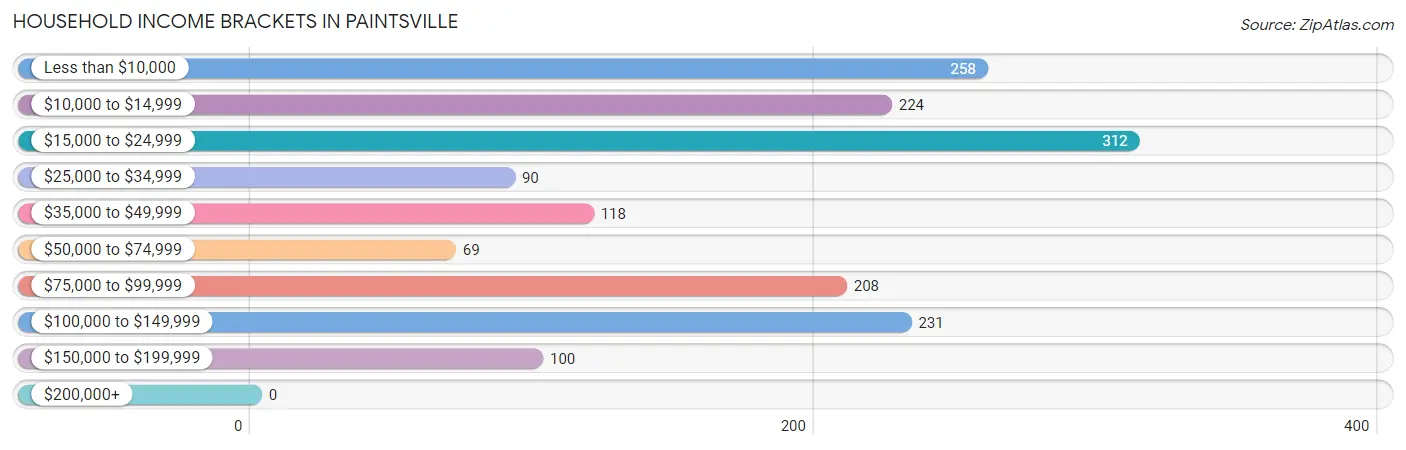
| Income Bracket | # Households | % Households |
| Less than $10,000 | 258 | 16.0% |
| $10,000 to $14,999 | 224 | 13.9% |
| $15,000 to $24,999 | 312 | 19.3% |
| $25,000 to $34,999 | 90 | 5.6% |
| $35,000 to $49,999 | 118 | 7.3% |
| $50,000 to $74,999 | 69 | 4.3% |
| $75,000 to $99,999 | 208 | 12.9% |
| $100,000 to $149,999 | 231 | 14.3% |
| $150,000 to $199,999 | 100 | 6.2% |
| $200,000+ | 0 | 0.0% |
Household Income by Householder Age in Paintsville
The median household income in Paintsville is $27,601, with the highest median household income of $82,143 found in the 25 to 44 years age bracket for the primary householder. A total of 226 households (14.0%) fall into this category. Meanwhile, the 15 to 24 years age bracket for the primary householder has the lowest median household income of $0, with 193 households (11.9%) in this group.
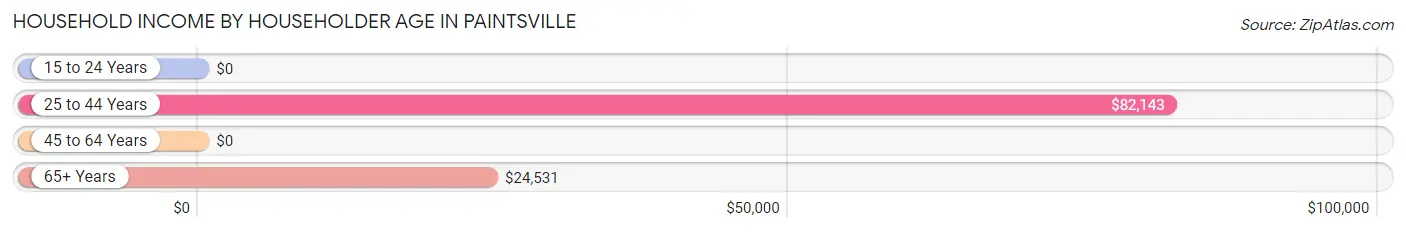
| Income Bracket | # Households | Median Income |
| 15 to 24 Years | 193 (11.9%) | $0 |
| 25 to 44 Years | 226 (14.0%) | $82,143 |
| 45 to 64 Years | 815 (50.5%) | $0 |
| 65+ Years | 381 (23.6%) | $24,531 |
| Total | 1,615 (100.0%) | $27,601 |
Poverty in Paintsville
Income Below Poverty by Sex and Age in Paintsville
With 17.4% poverty level for males and 39.6% for females among the residents of Paintsville, 75 year old and over males and 15 year old females are the most vulnerable to poverty, with 24 males (42.9%) and 9 females (100.0%) in their respective age groups living below the poverty level.
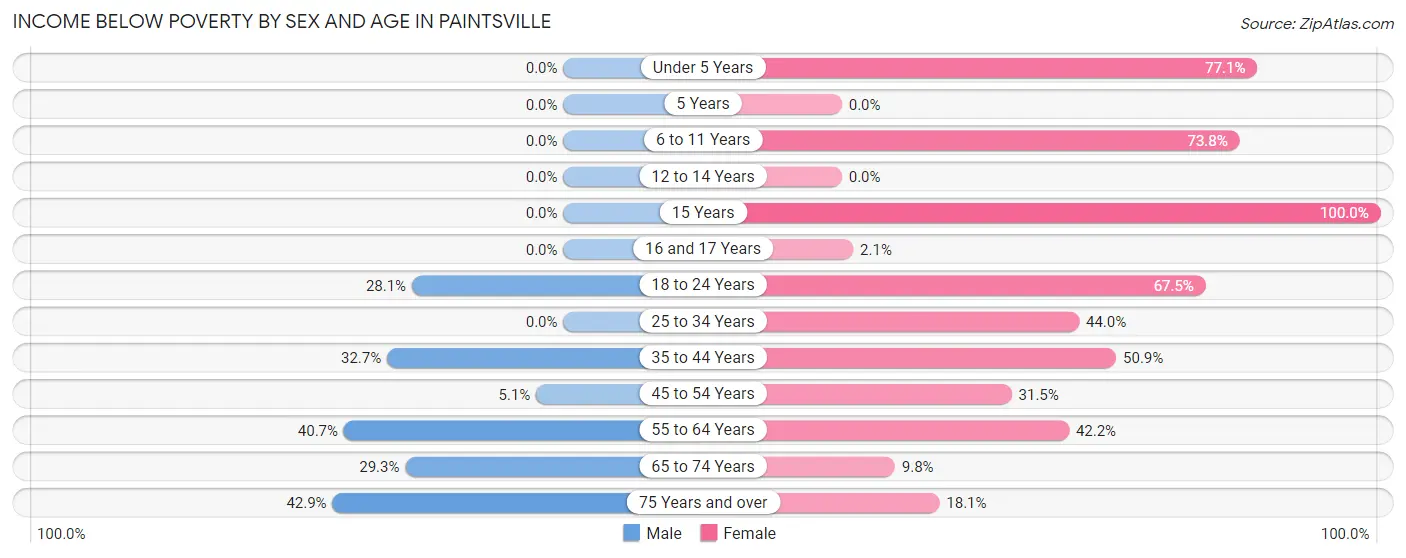
| Age Bracket | Male | Female |
| Under 5 Years | 0 (0.0%) | 91 (77.1%) |
| 5 Years | 0 (0.0%) | 0 (0.0%) |
| 6 to 11 Years | 0 (0.0%) | 172 (73.8%) |
| 12 to 14 Years | 0 (0.0%) | 0 (0.0%) |
| 15 Years | 0 (0.0%) | 9 (100.0%) |
| 16 and 17 Years | 0 (0.0%) | 2 (2.1%) |
| 18 to 24 Years | 77 (28.1%) | 77 (67.5%) |
| 25 to 34 Years | 0 (0.0%) | 70 (44.0%) |
| 35 to 44 Years | 54 (32.7%) | 138 (50.9%) |
| 45 to 54 Years | 15 (5.1%) | 81 (31.5%) |
| 55 to 64 Years | 99 (40.7%) | 199 (42.2%) |
| 65 to 74 Years | 22 (29.3%) | 30 (9.8%) |
| 75 Years and over | 24 (42.9%) | 23 (18.1%) |
| Total | 291 (17.4%) | 892 (39.6%) |
Income Above Poverty by Sex and Age in Paintsville
According to the poverty statistics in Paintsville, males aged under 5 years and females aged 5 years are the age groups that are most secure financially, with 100.0% of males and 100.0% of females in these age groups living above the poverty line.
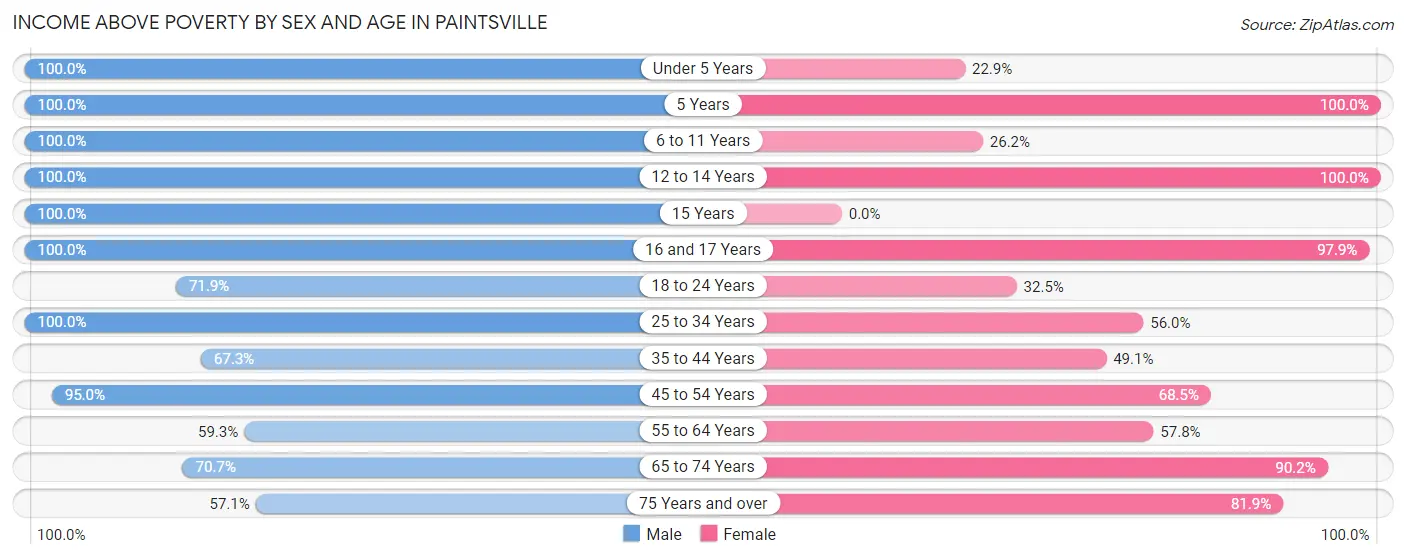
| Age Bracket | Male | Female |
| Under 5 Years | 66 (100.0%) | 27 (22.9%) |
| 5 Years | 23 (100.0%) | 11 (100.0%) |
| 6 to 11 Years | 199 (100.0%) | 61 (26.2%) |
| 12 to 14 Years | 90 (100.0%) | 81 (100.0%) |
| 15 Years | 49 (100.0%) | 0 (0.0%) |
| 16 and 17 Years | 24 (100.0%) | 93 (97.9%) |
| 18 to 24 Years | 197 (71.9%) | 37 (32.5%) |
| 25 to 34 Years | 114 (100.0%) | 89 (56.0%) |
| 35 to 44 Years | 111 (67.3%) | 133 (49.1%) |
| 45 to 54 Years | 282 (95.0%) | 176 (68.5%) |
| 55 to 64 Years | 144 (59.3%) | 273 (57.8%) |
| 65 to 74 Years | 53 (70.7%) | 275 (90.2%) |
| 75 Years and over | 32 (57.1%) | 104 (81.9%) |
| Total | 1,384 (82.6%) | 1,360 (60.4%) |
Income Below Poverty Among Married-Couple Families in Paintsville
The poverty statistics for married-couple families in Paintsville show that 11.9% or 83 of the total 698 families live below the poverty line. Families with no children have the highest poverty rate of 21.0%, comprising of 65 families. On the other hand, families with 3 or 4 children have the lowest poverty rate of 0.0%, which includes 0 families.
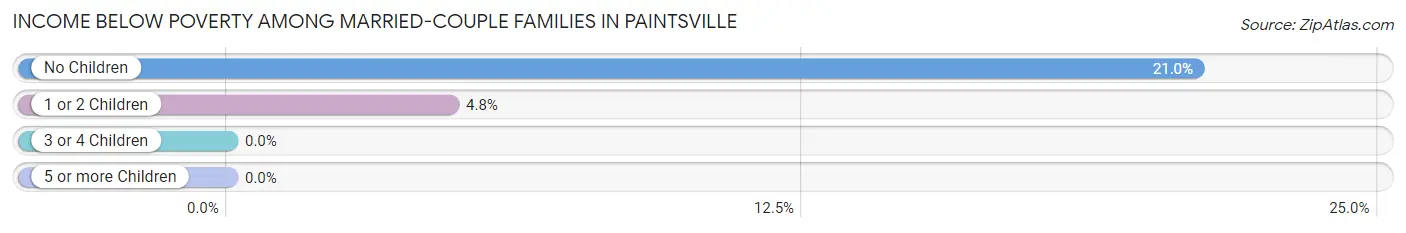
| Children | Above Poverty | Below Poverty |
| No Children | 244 (79.0%) | 65 (21.0%) |
| 1 or 2 Children | 356 (95.2%) | 18 (4.8%) |
| 3 or 4 Children | 15 (100.0%) | 0 (0.0%) |
| 5 or more Children | 0 (0.0%) | 0 (0.0%) |
| Total | 615 (88.1%) | 83 (11.9%) |
Income Below Poverty Among Single-Parent Households in Paintsville
According to the poverty data in Paintsville, 89.7% or 61 single-father households and 66.0% or 177 single-mother households are living below the poverty line. Among single-father households, those with no children have the highest poverty rate, with 61 households (100.0%) experiencing poverty. Likewise, among single-mother households, those with 3 or 4 children have the highest poverty rate, with 35 households (100.0%) falling below the poverty line.
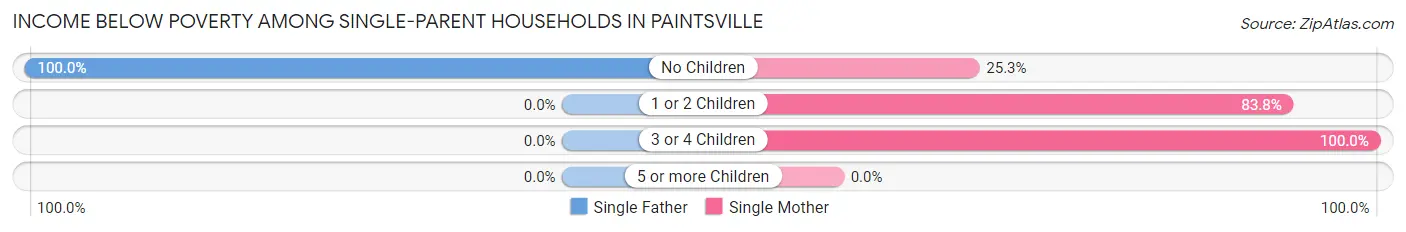
| Children | Single Father | Single Mother |
| No Children | 61 (100.0%) | 23 (25.3%) |
| 1 or 2 Children | 0 (0.0%) | 119 (83.8%) |
| 3 or 4 Children | 0 (0.0%) | 35 (100.0%) |
| 5 or more Children | 0 (0.0%) | 0 (0.0%) |
| Total | 61 (89.7%) | 177 (66.0%) |
Income Below Poverty Among Married-Couple vs Single-Parent Households in Paintsville
The poverty data for Paintsville shows that 83 of the married-couple family households (11.9%) and 238 of the single-parent households (70.8%) are living below the poverty level. Within the married-couple family households, those with no children have the highest poverty rate, with 65 households (21.0%) falling below the poverty line. Among the single-parent households, those with 3 or 4 children have the highest poverty rate, with 35 household (100.0%) living below poverty.
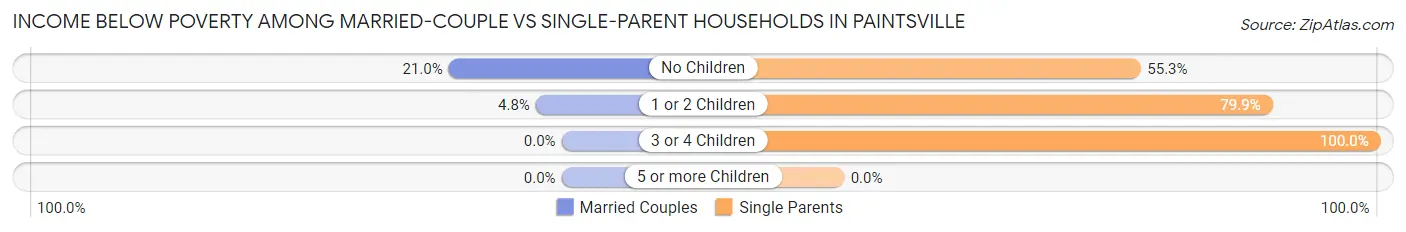
| Children | Married-Couple Families | Single-Parent Households |
| No Children | 65 (21.0%) | 84 (55.3%) |
| 1 or 2 Children | 18 (4.8%) | 119 (79.9%) |
| 3 or 4 Children | 0 (0.0%) | 35 (100.0%) |
| 5 or more Children | 0 (0.0%) | 0 (0.0%) |
| Total | 83 (11.9%) | 238 (70.8%) |
Race in Paintsville
The most populous races in Paintsville are White / Caucasian (4,037 | 94.4%), Asian (141 | 3.3%), and Two or more Races (63 | 1.5%).
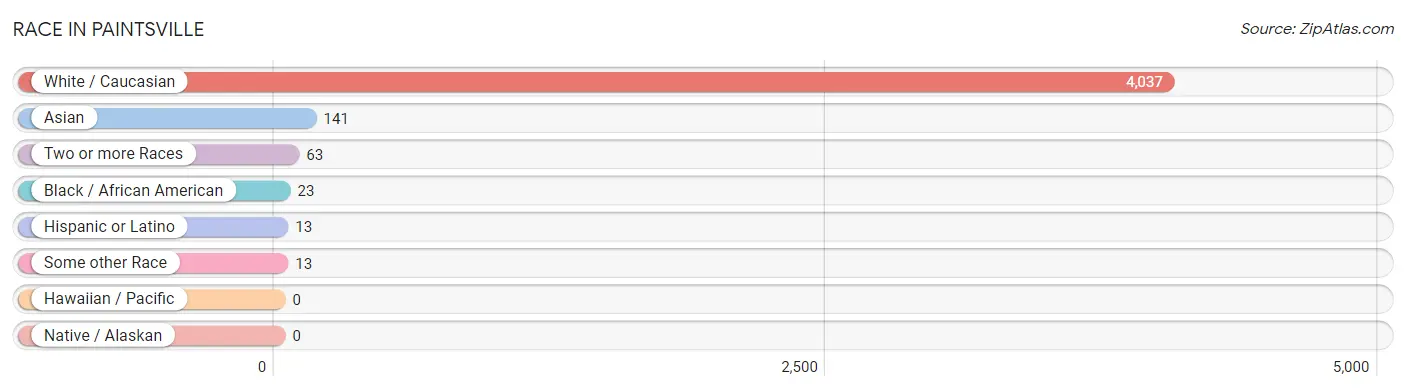
| Race | # Population | % Population |
| Asian | 141 | 3.3% |
| Black / African American | 23 | 0.5% |
| Hawaiian / Pacific | 0 | 0.0% |
| Hispanic or Latino | 13 | 0.3% |
| Native / Alaskan | 0 | 0.0% |
| White / Caucasian | 4,037 | 94.4% |
| Two or more Races | 63 | 1.5% |
| Some other Race | 13 | 0.3% |
| Total | 4,277 | 100.0% |
Ancestry in Paintsville
The most populous ancestries reported in Paintsville are American (1,157 | 27.1%), German (452 | 10.6%), English (428 | 10.0%), Irish (324 | 7.6%), and Indian (Asian) (141 | 3.3%), together accounting for 58.5% of all Paintsville residents.
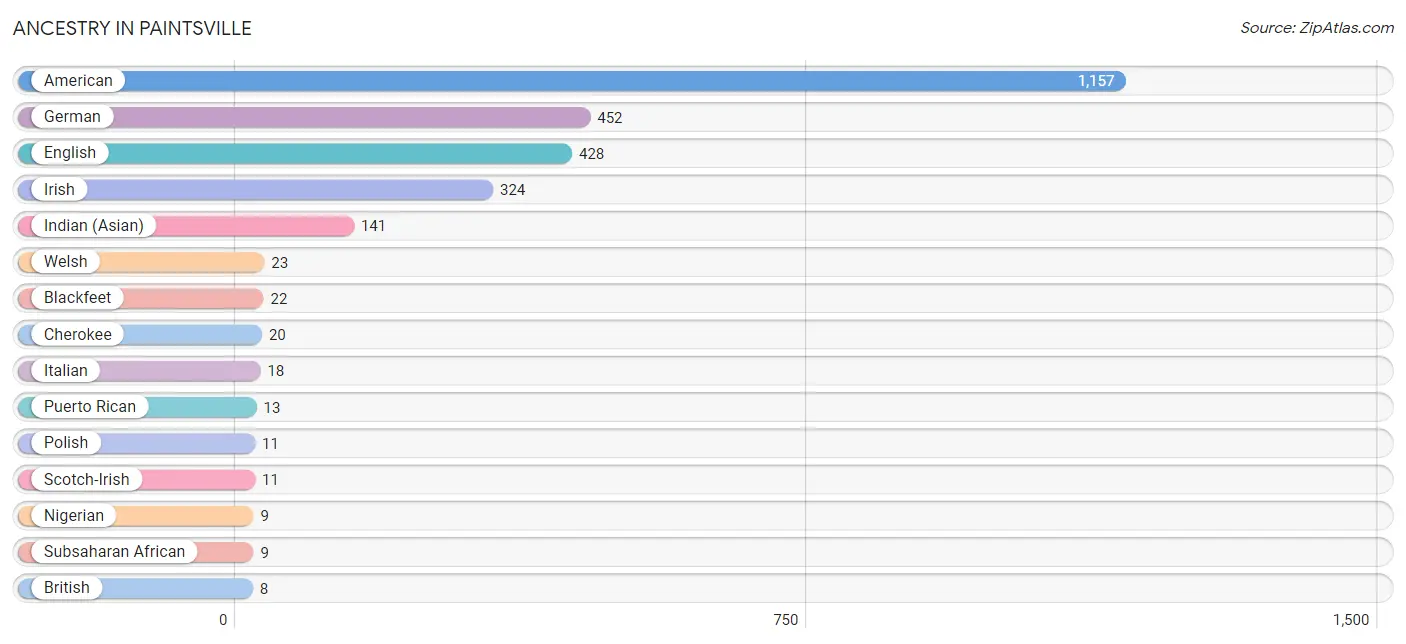
| Ancestry | # Population | % Population |
| American | 1,157 | 27.1% |
| Blackfeet | 22 | 0.5% |
| British | 8 | 0.2% |
| Cherokee | 20 | 0.5% |
| English | 428 | 10.0% |
| German | 452 | 10.6% |
| Indian (Asian) | 141 | 3.3% |
| Irish | 324 | 7.6% |
| Italian | 18 | 0.4% |
| Nigerian | 9 | 0.2% |
| Polish | 11 | 0.3% |
| Puerto Rican | 13 | 0.3% |
| Scotch-Irish | 11 | 0.3% |
| Subsaharan African | 9 | 0.2% |
| Welsh | 23 | 0.5% | View All 15 Rows |
Immigrants in Paintsville
The most numerous immigrant groups reported in Paintsville came from Asia (55 | 1.3%), China (55 | 1.3%), and Eastern Asia (55 | 1.3%), together accounting for 3.9% of all Paintsville residents.
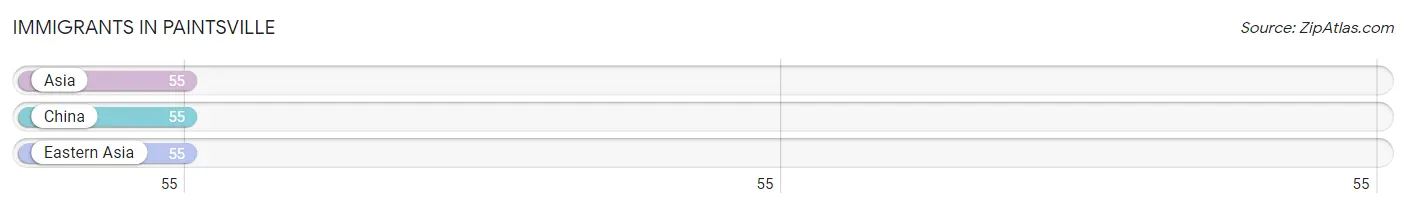
| Immigration Origin | # Population | % Population |
| Asia | 55 | 1.3% |
| China | 55 | 1.3% |
| Eastern Asia | 55 | 1.3% | View All 3 Rows |
Sex and Age in Paintsville
Sex and Age in Paintsville
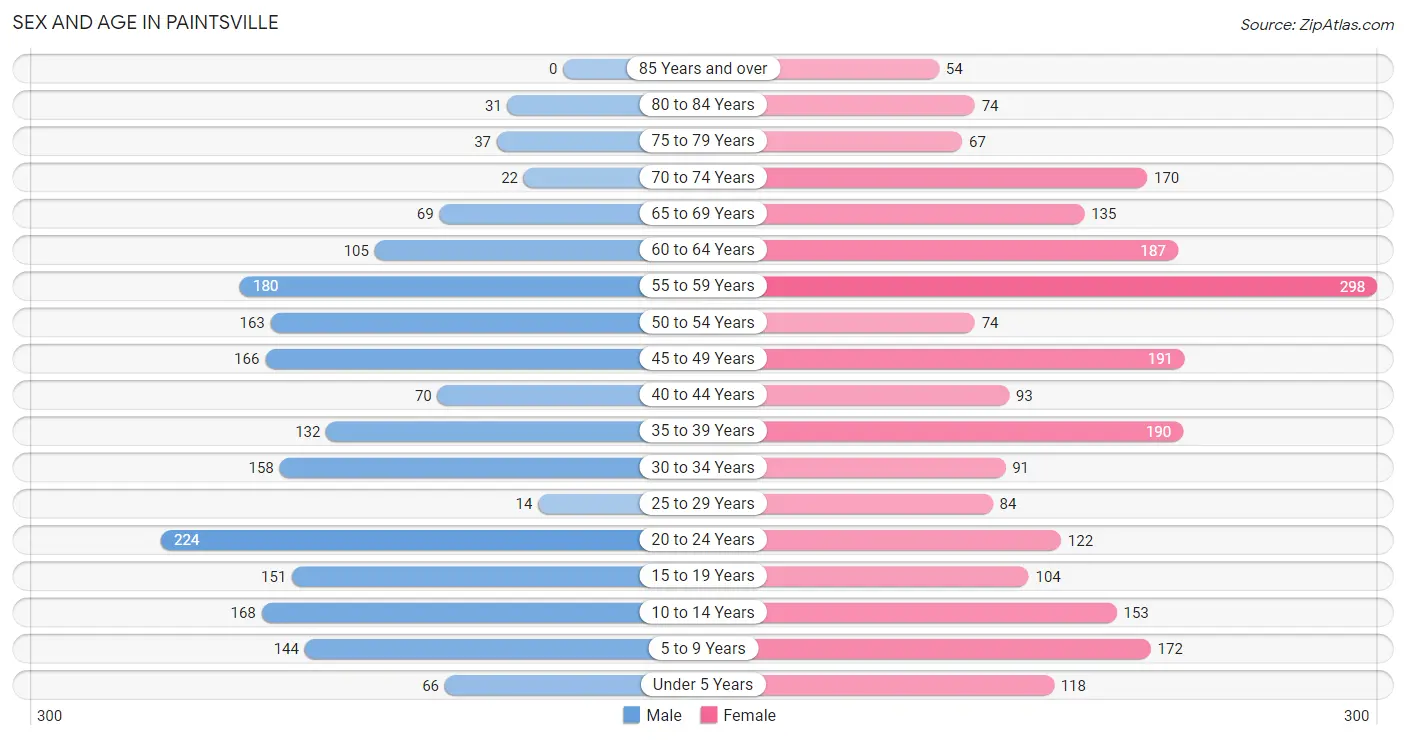
The most populous age groups in Paintsville are 20 to 24 Years (224 | 11.8%) for men and 55 to 59 Years (298 | 12.5%) for women.
| Age Bracket | Male | Female |
| Under 5 Years | 66 (3.5%) | 118 (5.0%) |
| 5 to 9 Years | 144 (7.6%) | 172 (7.2%) |
| 10 to 14 Years | 168 (8.8%) | 153 (6.4%) |
| 15 to 19 Years | 151 (8.0%) | 104 (4.4%) |
| 20 to 24 Years | 224 (11.8%) | 122 (5.1%) |
| 25 to 29 Years | 14 (0.7%) | 84 (3.5%) |
| 30 to 34 Years | 158 (8.3%) | 91 (3.8%) |
| 35 to 39 Years | 132 (7.0%) | 190 (8.0%) |
| 40 to 44 Years | 70 (3.7%) | 93 (3.9%) |
| 45 to 49 Years | 166 (8.7%) | 191 (8.0%) |
| 50 to 54 Years | 163 (8.6%) | 74 (3.1%) |
| 55 to 59 Years | 180 (9.5%) | 298 (12.5%) |
| 60 to 64 Years | 105 (5.5%) | 187 (7.9%) |
| 65 to 69 Years | 69 (3.6%) | 135 (5.7%) |
| 70 to 74 Years | 22 (1.2%) | 170 (7.1%) |
| 75 to 79 Years | 37 (1.9%) | 67 (2.8%) |
| 80 to 84 Years | 31 (1.6%) | 74 (3.1%) |
| 85 Years and over | 0 (0.0%) | 54 (2.3%) |
| Total | 1,900 (100.0%) | 2,377 (100.0%) |
Families and Households in Paintsville
Median Family Size in Paintsville
The median family size in Paintsville is 3.09 persons per family, with married-couple families (698 | 67.5%) accounting for the largest median family size of 3.3 persons per family. On the other hand, single male/father families (68 | 6.6%) represent the smallest median family size with 2.26 persons per family.
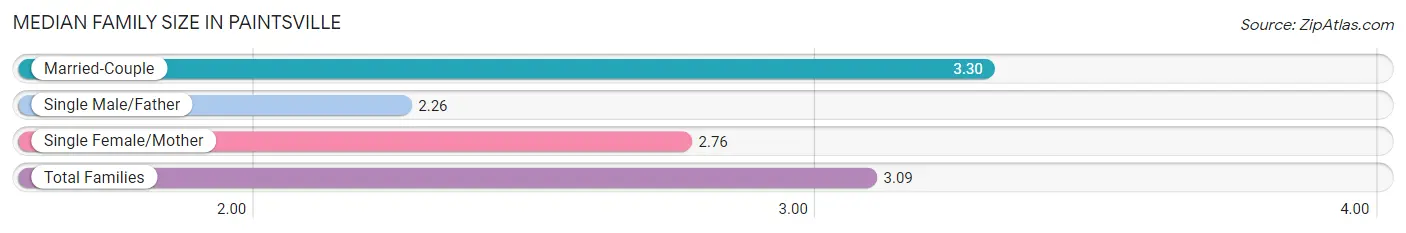
| Family Type | # Families | Family Size |
| Married-Couple | 698 (67.5%) | 3.30 |
| Single Male/Father | 68 (6.6%) | 2.26 |
| Single Female/Mother | 268 (25.9%) | 2.76 |
| Total Families | 1,034 (100.0%) | 3.09 |
Median Household Size in Paintsville
The median household size in Paintsville is 2.39 persons per household, with married-couple households (698 | 43.2%) accounting for the largest median household size of 3.3 persons per household. non-family households (581 | 36.0%) represent the smallest median household size with 1.11 persons per household.
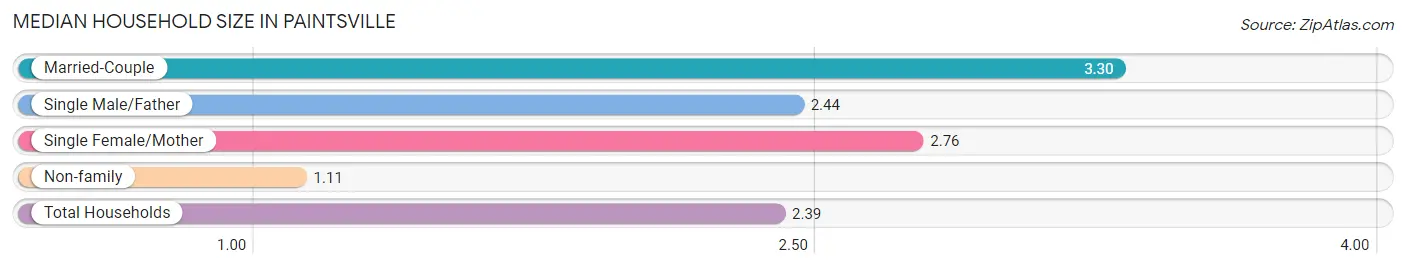
| Household Type | # Households | Household Size |
| Married-Couple | 698 (43.2%) | 3.30 |
| Single Male/Father | 68 (4.2%) | 2.44 |
| Single Female/Mother | 268 (16.6%) | 2.76 |
| Non-family | 581 (36.0%) | 1.11 |
| Total Households | 1,615 (100.0%) | 2.39 |
Household Size by Marriage Status in Paintsville
Out of a total of 1,615 households in Paintsville, 1,034 (64.0%) are family households, while 581 (36.0%) are nonfamily households. The most numerous type of family households are 2-person households, comprising 513, and the most common type of nonfamily households are 1-person households, comprising 525.
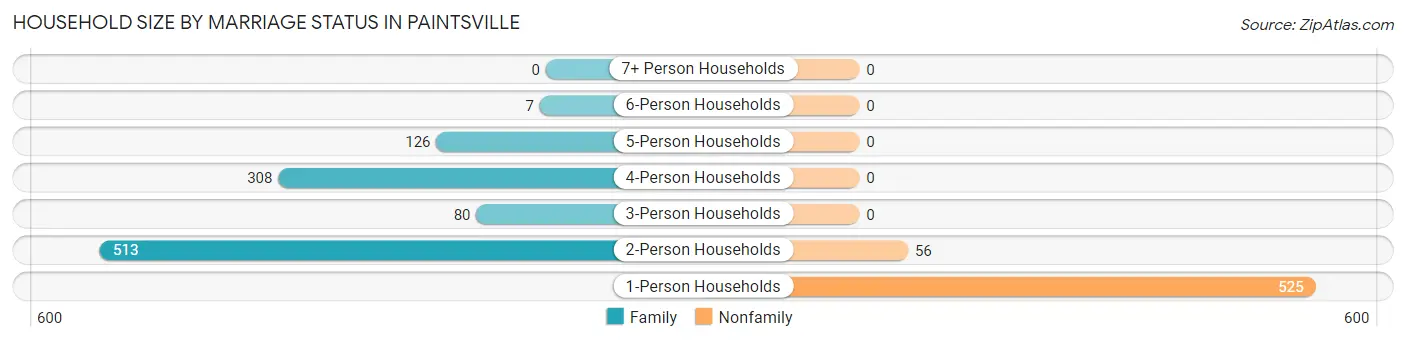
| Household Size | Family Households | Nonfamily Households |
| 1-Person Households | - | 525 (32.5%) |
| 2-Person Households | 513 (31.8%) | 56 (3.5%) |
| 3-Person Households | 80 (5.0%) | 0 (0.0%) |
| 4-Person Households | 308 (19.1%) | 0 (0.0%) |
| 5-Person Households | 126 (7.8%) | 0 (0.0%) |
| 6-Person Households | 7 (0.4%) | 0 (0.0%) |
| 7+ Person Households | 0 (0.0%) | 0 (0.0%) |
| Total | 1,034 (64.0%) | 581 (36.0%) |
Female Fertility in Paintsville
Fertility by Age in Paintsville
Average fertility rate in Paintsville is 82.0 births per 1,000 women. Women in the age bracket of 20 to 34 years have the highest fertility rate with 205.0 births per 1,000 women. Women in the age bracket of 20 to 34 years acount for 84.7% of all women with births.
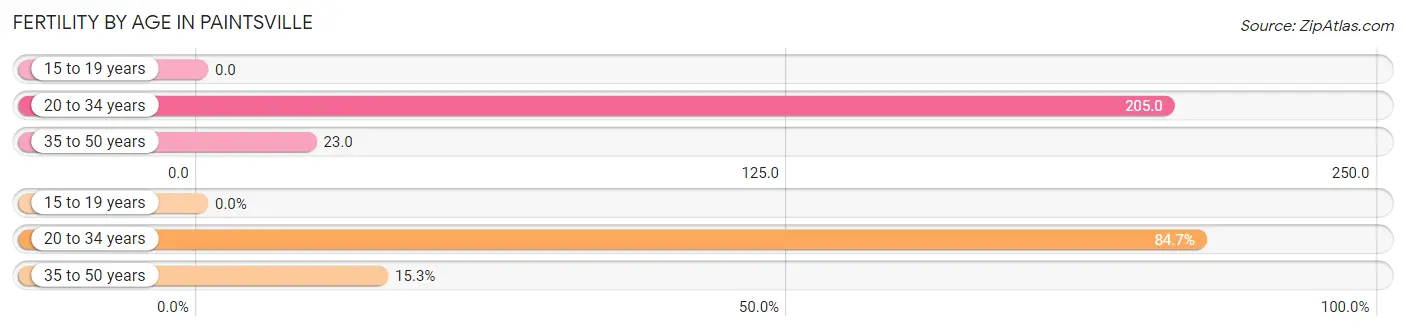
| Age Bracket | Women with Births | Births / 1,000 Women |
| 15 to 19 years | 0 (0.0%) | 0.0 |
| 20 to 34 years | 61 (84.7%) | 205.0 |
| 35 to 50 years | 11 (15.3%) | 23.0 |
| Total | 72 (100.0%) | 82.0 |
Fertility by Age by Marriage Status in Paintsville
15.3% of women with births (72) in Paintsville are married. The highest percentage of unmarried women with births falls into 20 to 34 years age bracket with 100.0% of them unmarried at the time of birth, while the lowest percentage of unmarried women with births belong to 35 to 50 years age bracket with 0.0% of them unmarried.
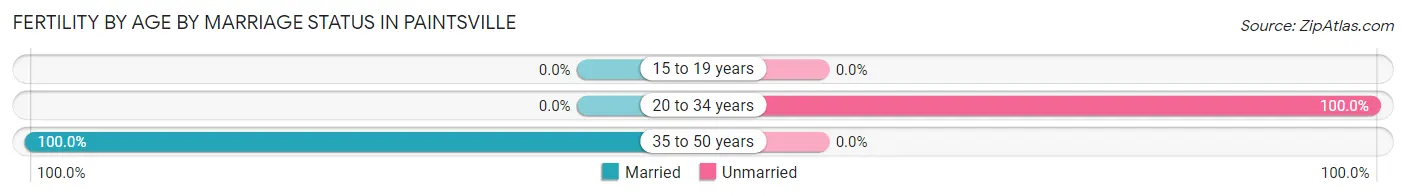
| Age Bracket | Married | Unmarried |
| 15 to 19 years | 0 (0.0%) | 0 (0.0%) |
| 20 to 34 years | 0 (0.0%) | 61 (100.0%) |
| 35 to 50 years | 11 (100.0%) | 0 (0.0%) |
| Total | 11 (15.3%) | 61 (84.7%) |
Fertility by Education in Paintsville
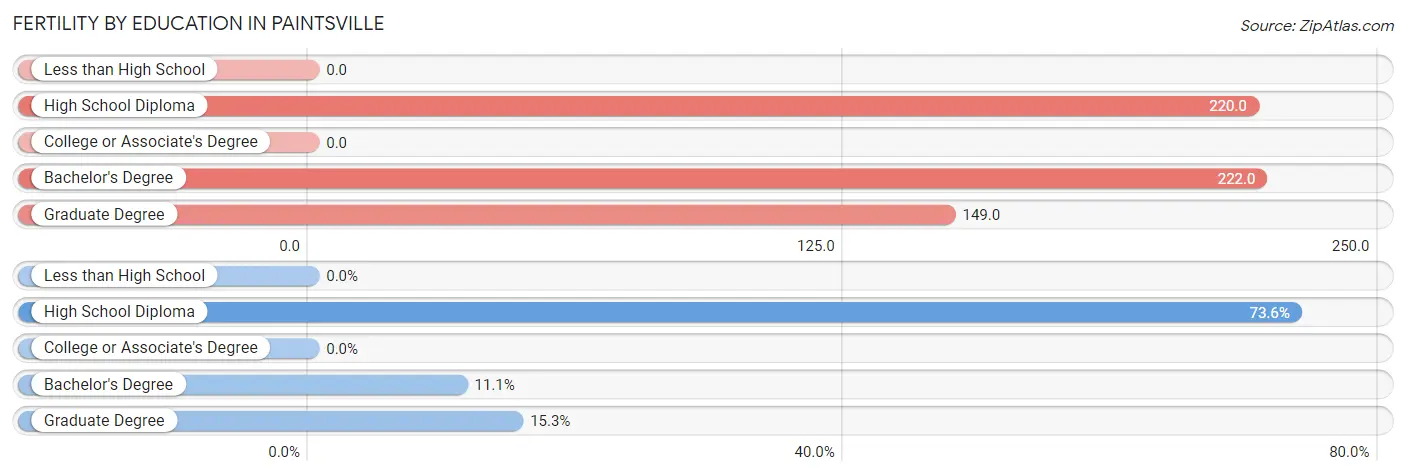
| Educational Attainment | Women with Births | Births / 1,000 Women |
| Less than High School | 0 (0.0%) | 0.0 |
| High School Diploma | 53 (73.6%) | 220.0 |
| College or Associate's Degree | 0 (0.0%) | 0.0 |
| Bachelor's Degree | 8 (11.1%) | 222.0 |
| Graduate Degree | 11 (15.3%) | 149.0 |
| Total | 72 (100.0%) | 82.0 |
Fertility by Education by Marriage Status in Paintsville
84.7% of women with births in Paintsville are unmarried. Women with the educational attainment of graduate degree are most likely to be married with 100.0% of them married at childbirth, while women with the educational attainment of high school diploma are least likely to be married with 100.0% of them unmarried at childbirth.
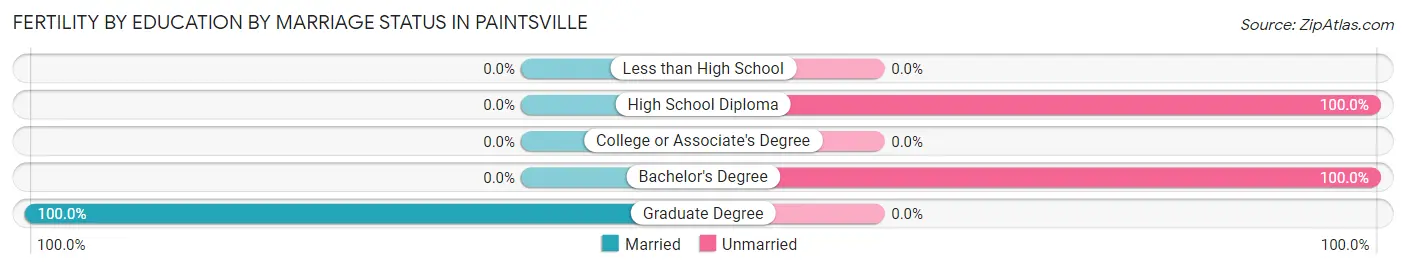
| Educational Attainment | Married | Unmarried |
| Less than High School | 0 (0.0%) | 0 (0.0%) |
| High School Diploma | 0 (0.0%) | 53 (100.0%) |
| College or Associate's Degree | 0 (0.0%) | 0 (0.0%) |
| Bachelor's Degree | 0 (0.0%) | 8 (100.0%) |
| Graduate Degree | 11 (100.0%) | 0 (0.0%) |
| Total | 11 (15.3%) | 61 (84.7%) |
Employment Characteristics in Paintsville
Employment by Class of Employer in Paintsville
Among the 1,212 employed individuals in Paintsville, private company employees (763 | 62.9%), not-for-profit organizations (147 | 12.1%), and local government employees (136 | 11.2%) make up the most common classes of employment.
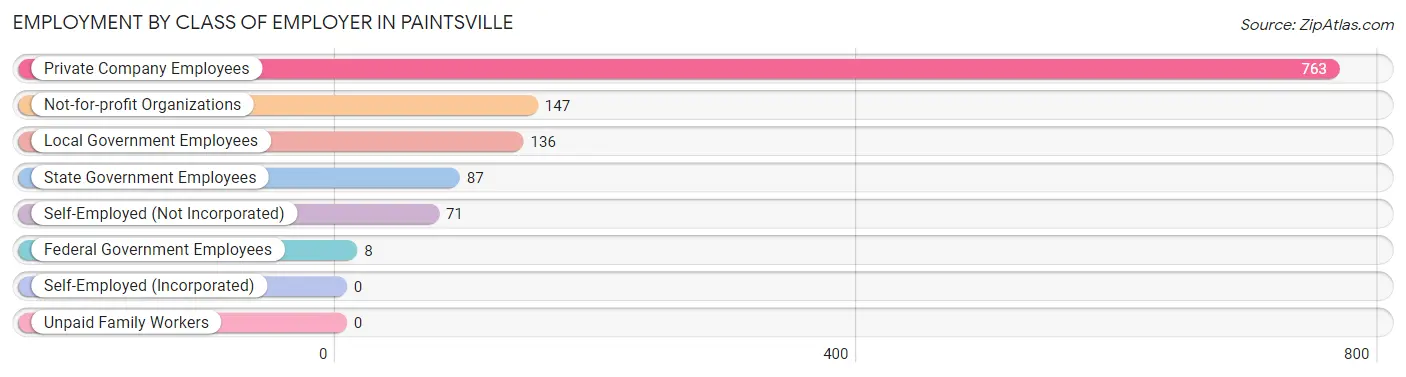
| Employer Class | # Employees | % Employees |
| Private Company Employees | 763 | 62.9% |
| Self-Employed (Incorporated) | 0 | 0.0% |
| Self-Employed (Not Incorporated) | 71 | 5.9% |
| Not-for-profit Organizations | 147 | 12.1% |
| Local Government Employees | 136 | 11.2% |
| State Government Employees | 87 | 7.2% |
| Federal Government Employees | 8 | 0.7% |
| Unpaid Family Workers | 0 | 0.0% |
| Total | 1,212 | 100.0% |
Employment Status by Age in Paintsville
According to the labor force statistics for Paintsville, out of the total population over 16 years of age (3,398), 41.2% or 1,400 individuals are in the labor force, with 7.6% or 106 of them unemployed. The age group with the highest labor force participation rate is 45 to 54 years, with 82.7% or 491 individuals in the labor force. Within the labor force, the 30 to 34 years age range has the highest percentage of unemployed individuals, with 34.5% or 60 of them being unemployed.
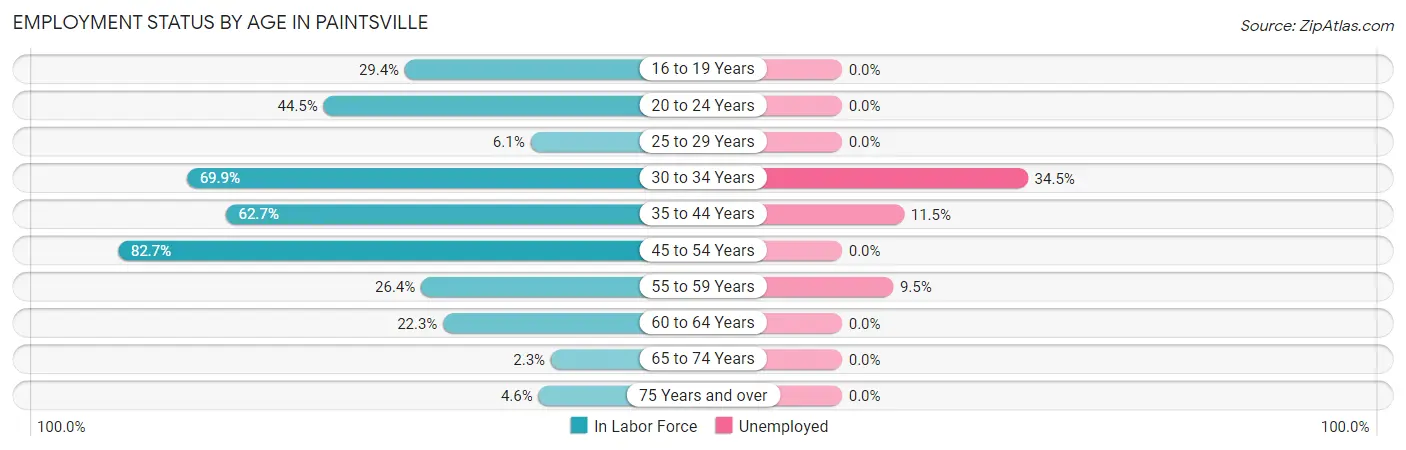
| Age Bracket | In Labor Force | Unemployed |
| 16 to 19 Years | 58 (29.4%) | 0 (0.0%) |
| 20 to 24 Years | 154 (44.5%) | 0 (0.0%) |
| 25 to 29 Years | 6 (6.1%) | 0 (0.0%) |
| 30 to 34 Years | 174 (69.9%) | 60 (34.5%) |
| 35 to 44 Years | 304 (62.7%) | 35 (11.5%) |
| 45 to 54 Years | 491 (82.7%) | 0 (0.0%) |
| 55 to 59 Years | 126 (26.4%) | 12 (9.5%) |
| 60 to 64 Years | 65 (22.3%) | 0 (0.0%) |
| 65 to 74 Years | 9 (2.3%) | 0 (0.0%) |
| 75 Years and over | 12 (4.6%) | 0 (0.0%) |
| Total | 1,400 (41.2%) | 106 (7.6%) |
Employment Status by Educational Attainment in Paintsville
According to labor force statistics for Paintsville, 53.1% of individuals (1,166) out of the total population between 25 and 64 years of age (2,196) are in the labor force, with 9.2% or 107 of them being unemployed. The group with the highest labor force participation rate are those with the educational attainment of bachelor's degree or higher, with 93.7% or 238 individuals in the labor force. Within the labor force, individuals with college / associate degree education have the highest percentage of unemployment, with 18.7% or 95 of them being unemployed.
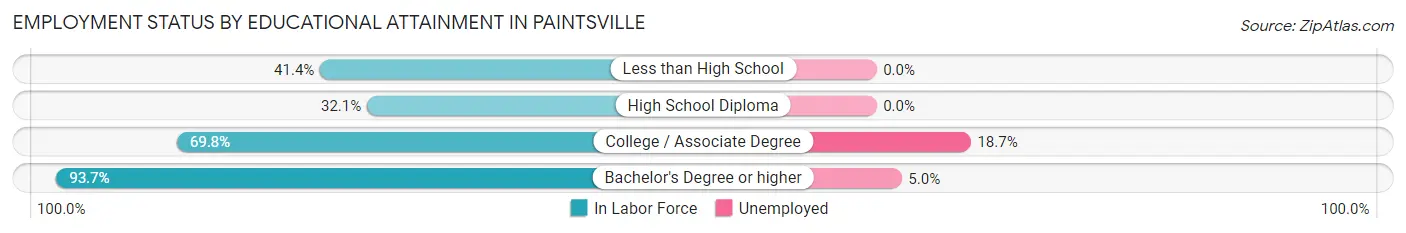
| Educational Attainment | In Labor Force | Unemployed |
| Less than High School | 133 (41.4%) | 0 (0.0%) |
| High School Diploma | 286 (32.1%) | 0 (0.0%) |
| College / Associate Degree | 509 (69.8%) | 136 (18.7%) |
| Bachelor's Degree or higher | 238 (93.7%) | 13 (5.0%) |
| Total | 1,166 (53.1%) | 202 (9.2%) |
Employment Occupations by Sex in Paintsville
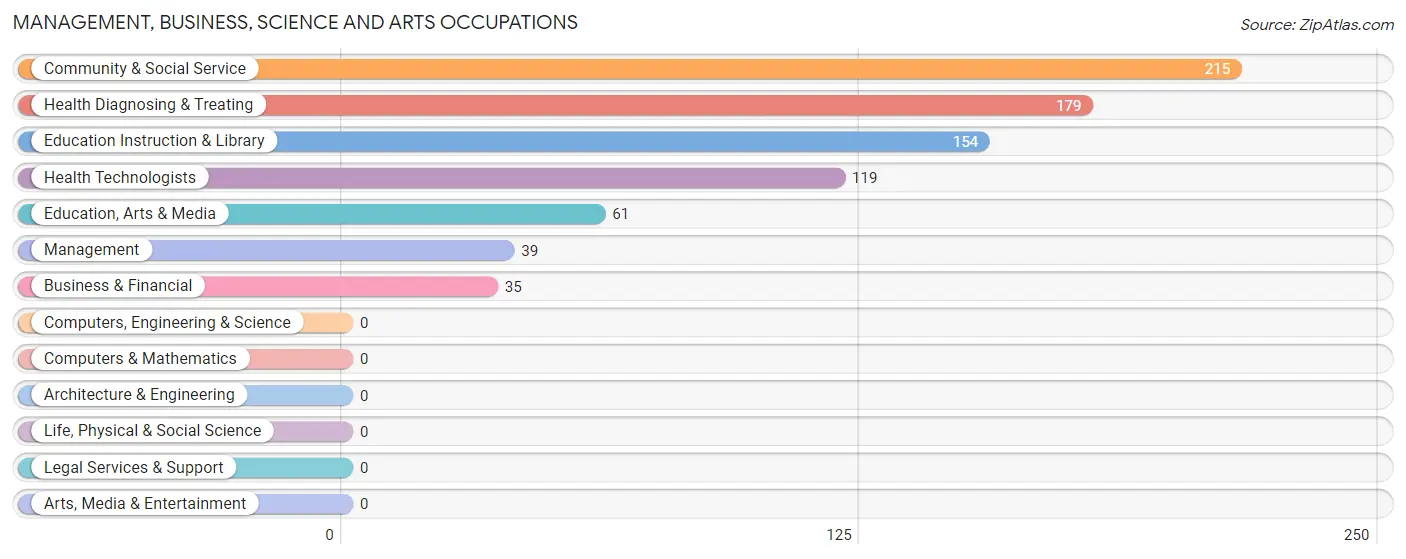
Management, Business, Science and Arts Occupations
The most common Management, Business, Science and Arts occupations in Paintsville are Community & Social Service (215 | 16.6%), Health Diagnosing & Treating (179 | 13.9%), Education Instruction & Library (154 | 11.9%), Health Technologists (119 | 9.2%), and Education, Arts & Media (61 | 4.7%).
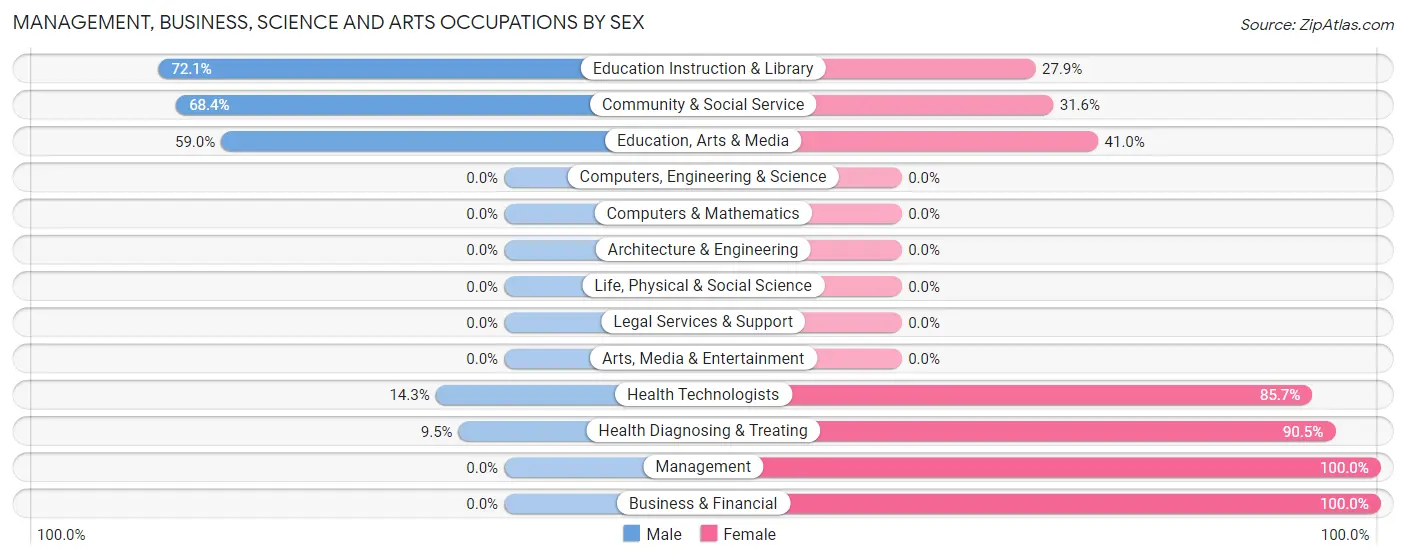
Management, Business, Science and Arts Occupations by Sex
Within the Management, Business, Science and Arts occupations in Paintsville, the most male-oriented occupations are Education Instruction & Library (72.1%), Community & Social Service (68.4%), and Education, Arts & Media (59.0%), while the most female-oriented occupations are Management (100.0%), Business & Financial (100.0%), and Health Diagnosing & Treating (90.5%).
| Occupation | Male | Female |
| Management | 0 (0.0%) | 39 (100.0%) |
| Business & Financial | 0 (0.0%) | 35 (100.0%) |
| Computers, Engineering & Science | 0 (0.0%) | 0 (0.0%) |
| Computers & Mathematics | 0 (0.0%) | 0 (0.0%) |
| Architecture & Engineering | 0 (0.0%) | 0 (0.0%) |
| Life, Physical & Social Science | 0 (0.0%) | 0 (0.0%) |
| Community & Social Service | 147 (68.4%) | 68 (31.6%) |
| Education, Arts & Media | 36 (59.0%) | 25 (41.0%) |
| Legal Services & Support | 0 (0.0%) | 0 (0.0%) |
| Education Instruction & Library | 111 (72.1%) | 43 (27.9%) |
| Arts, Media & Entertainment | 0 (0.0%) | 0 (0.0%) |
| Health Diagnosing & Treating | 17 (9.5%) | 162 (90.5%) |
| Health Technologists | 17 (14.3%) | 102 (85.7%) |
| Total (Category) | 164 (35.0%) | 304 (65.0%) |
| Total (Overall) | 742 (57.4%) | 550 (42.6%) |
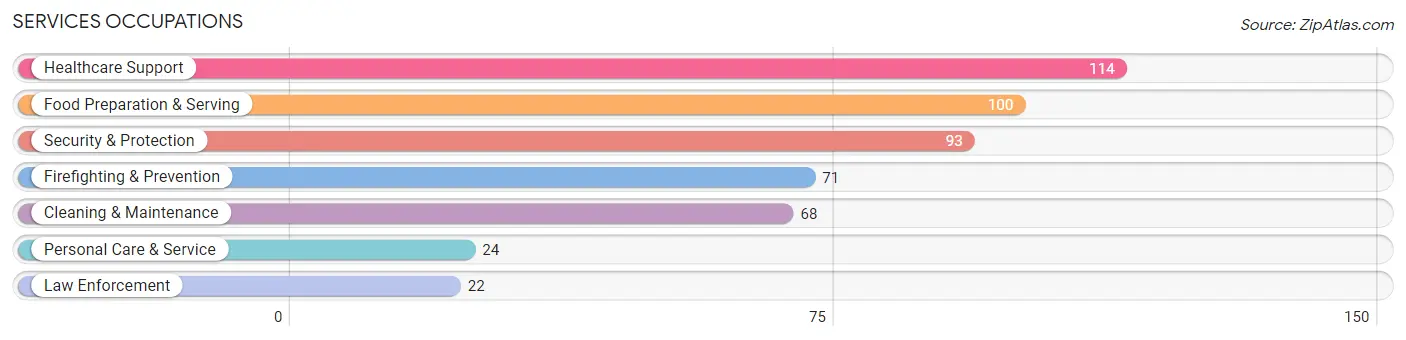
Services Occupations
The most common Services occupations in Paintsville are Healthcare Support (114 | 8.8%), Food Preparation & Serving (100 | 7.7%), Security & Protection (93 | 7.2%), Firefighting & Prevention (71 | 5.5%), and Cleaning & Maintenance (68 | 5.3%).
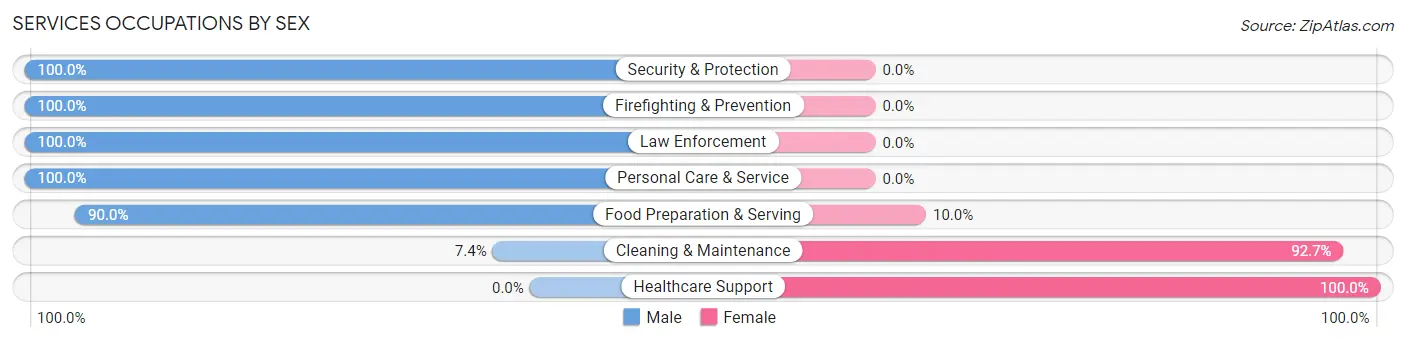
Services Occupations by Sex
Within the Services occupations in Paintsville, the most male-oriented occupations are Security & Protection (100.0%), Firefighting & Prevention (100.0%), and Law Enforcement (100.0%), while the most female-oriented occupations are Healthcare Support (100.0%), Cleaning & Maintenance (92.6%), and Food Preparation & Serving (10.0%).
| Occupation | Male | Female |
| Healthcare Support | 0 (0.0%) | 114 (100.0%) |
| Security & Protection | 93 (100.0%) | 0 (0.0%) |
| Firefighting & Prevention | 71 (100.0%) | 0 (0.0%) |
| Law Enforcement | 22 (100.0%) | 0 (0.0%) |
| Food Preparation & Serving | 90 (90.0%) | 10 (10.0%) |
| Cleaning & Maintenance | 5 (7.3%) | 63 (92.6%) |
| Personal Care & Service | 24 (100.0%) | 0 (0.0%) |
| Total (Category) | 212 (53.1%) | 187 (46.9%) |
| Total (Overall) | 742 (57.4%) | 550 (42.6%) |
Sales and Office Occupations
The most common Sales and Office occupations in Paintsville are Sales & Related (102 | 7.9%), and Office & Administration (85 | 6.6%).
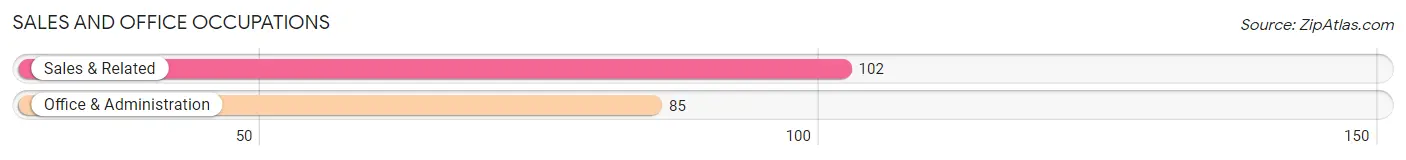
Sales and Office Occupations by Sex

| Occupation | Male | Female |
| Sales & Related | 102 (100.0%) | 0 (0.0%) |
| Office & Administration | 71 (83.5%) | 14 (16.5%) |
| Total (Category) | 173 (92.5%) | 14 (7.5%) |
| Total (Overall) | 742 (57.4%) | 550 (42.6%) |
Natural Resources, Construction and Maintenance Occupations
The most common Natural Resources, Construction and Maintenance occupations in Paintsville are , and Installation, Maintenance & Repair (18 | 1.4%).
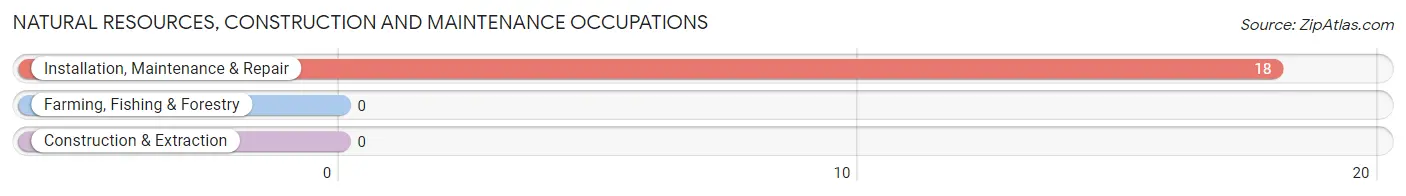
Natural Resources, Construction and Maintenance Occupations by Sex
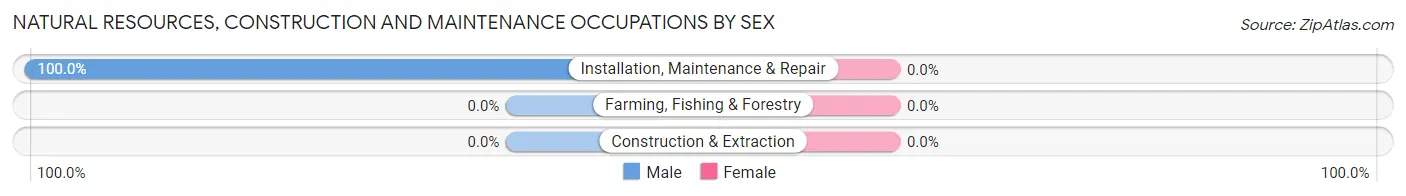
| Occupation | Male | Female |
| Farming, Fishing & Forestry | 0 (0.0%) | 0 (0.0%) |
| Construction & Extraction | 0 (0.0%) | 0 (0.0%) |
| Installation, Maintenance & Repair | 18 (100.0%) | 0 (0.0%) |
| Total (Category) | 18 (100.0%) | 0 (0.0%) |
| Total (Overall) | 742 (57.4%) | 550 (42.6%) |
Production, Transportation and Moving Occupations
The most common Production, Transportation and Moving occupations in Paintsville are Material Moving (134 | 10.4%), Production (62 | 4.8%), and Transportation (24 | 1.9%).
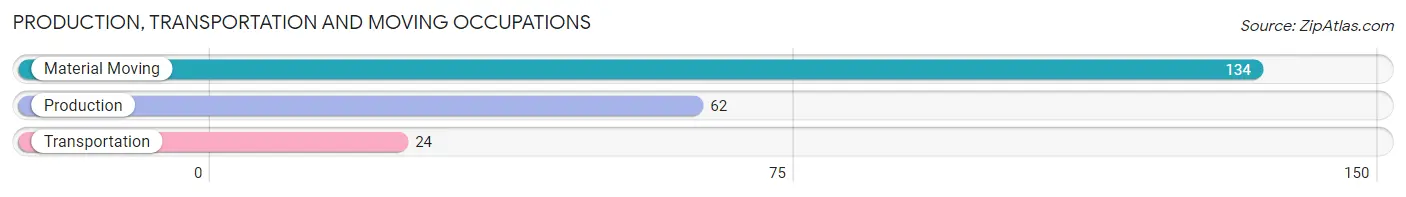
Production, Transportation and Moving Occupations by Sex
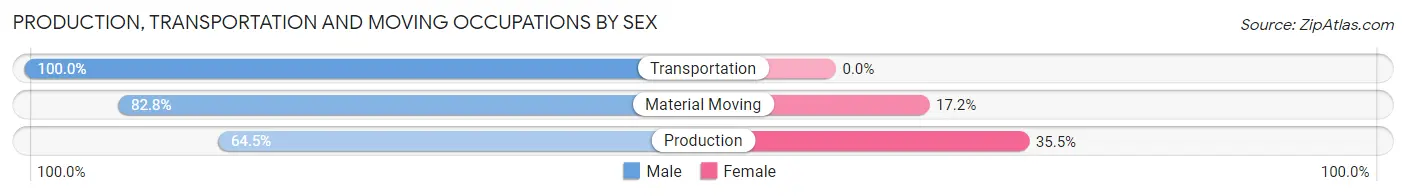
| Occupation | Male | Female |
| Production | 40 (64.5%) | 22 (35.5%) |
| Transportation | 24 (100.0%) | 0 (0.0%) |
| Material Moving | 111 (82.8%) | 23 (17.2%) |
| Total (Category) | 175 (79.5%) | 45 (20.4%) |
| Total (Overall) | 742 (57.4%) | 550 (42.6%) |
Employment Industries by Sex in Paintsville
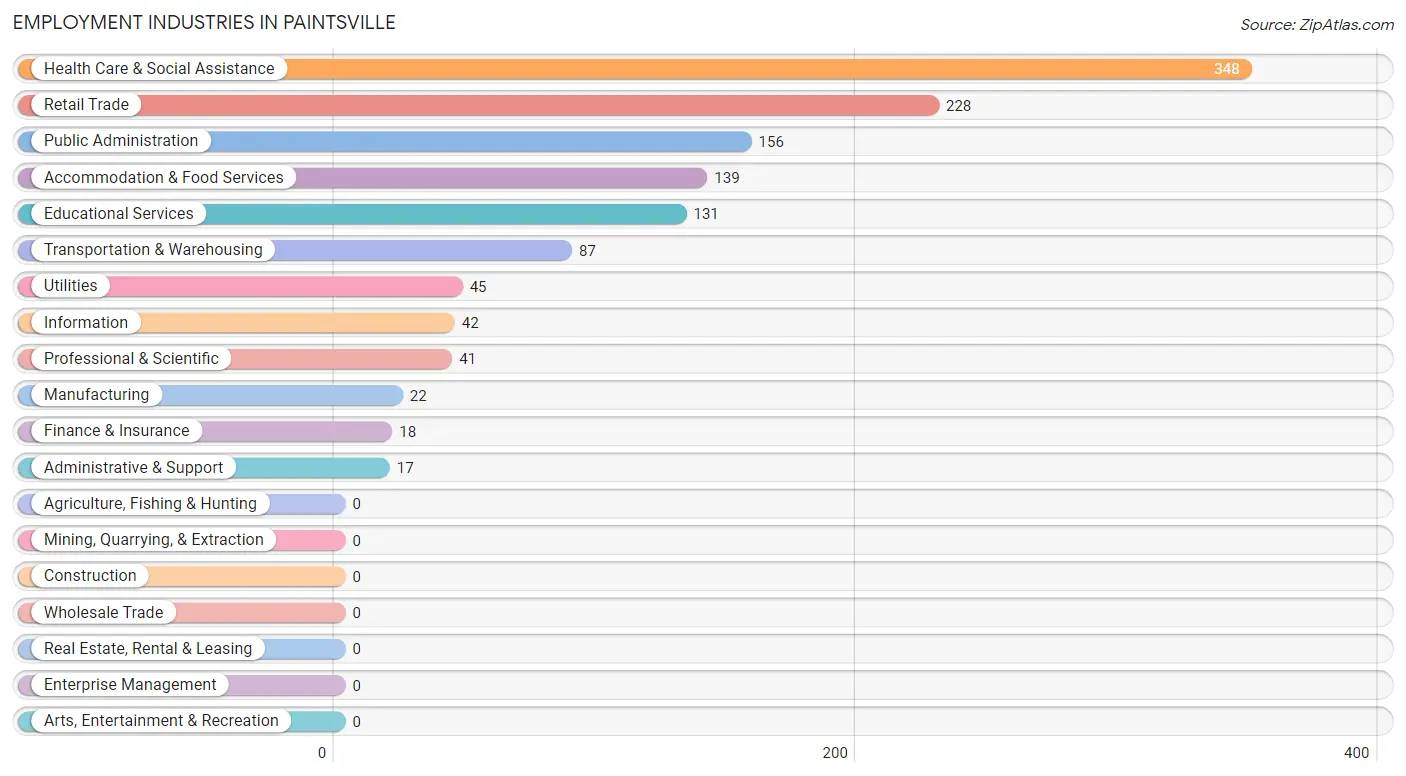
Employment Industries in Paintsville
The major employment industries in Paintsville include Health Care & Social Assistance (348 | 26.9%), Retail Trade (228 | 17.6%), Public Administration (156 | 12.1%), Accommodation & Food Services (139 | 10.8%), and Educational Services (131 | 10.1%).
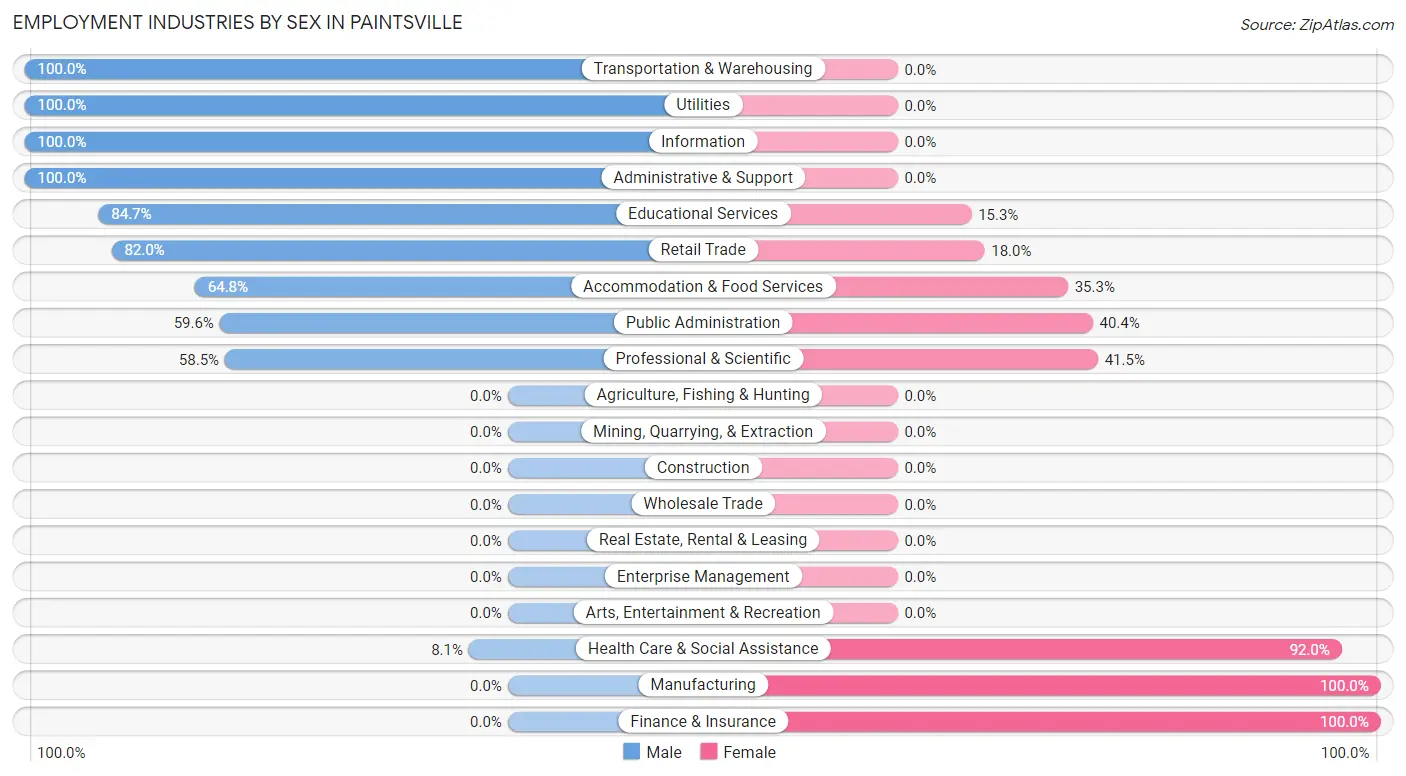
Employment Industries by Sex in Paintsville
The Paintsville industries that see more men than women are Transportation & Warehousing (100.0%), Utilities (100.0%), and Information (100.0%), whereas the industries that tend to have a higher number of women are Manufacturing (100.0%), Finance & Insurance (100.0%), and Health Care & Social Assistance (91.9%).
| Industry | Male | Female |
| Agriculture, Fishing & Hunting | 0 (0.0%) | 0 (0.0%) |
| Mining, Quarrying, & Extraction | 0 (0.0%) | 0 (0.0%) |
| Construction | 0 (0.0%) | 0 (0.0%) |
| Manufacturing | 0 (0.0%) | 22 (100.0%) |
| Wholesale Trade | 0 (0.0%) | 0 (0.0%) |
| Retail Trade | 187 (82.0%) | 41 (18.0%) |
| Transportation & Warehousing | 87 (100.0%) | 0 (0.0%) |
| Utilities | 45 (100.0%) | 0 (0.0%) |
| Information | 42 (100.0%) | 0 (0.0%) |
| Finance & Insurance | 0 (0.0%) | 18 (100.0%) |
| Real Estate, Rental & Leasing | 0 (0.0%) | 0 (0.0%) |
| Professional & Scientific | 24 (58.5%) | 17 (41.5%) |
| Enterprise Management | 0 (0.0%) | 0 (0.0%) |
| Administrative & Support | 17 (100.0%) | 0 (0.0%) |
| Educational Services | 111 (84.7%) | 20 (15.3%) |
| Health Care & Social Assistance | 28 (8.1%) | 320 (91.9%) |
| Arts, Entertainment & Recreation | 0 (0.0%) | 0 (0.0%) |
| Accommodation & Food Services | 90 (64.7%) | 49 (35.2%) |
| Public Administration | 93 (59.6%) | 63 (40.4%) |
| Total | 742 (57.4%) | 550 (42.6%) |
Education in Paintsville
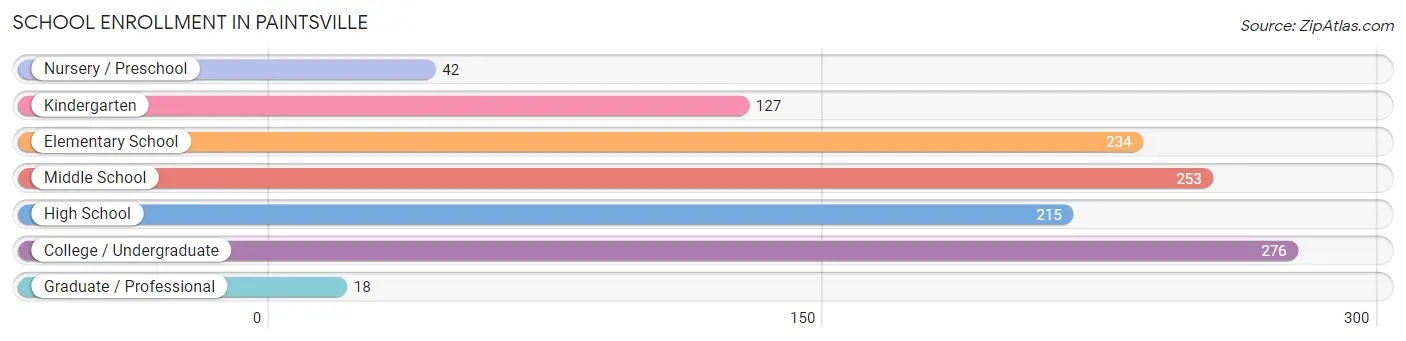
School Enrollment in Paintsville
The most common levels of schooling among the 1,165 students in Paintsville are college / undergraduate (276 | 23.7%), middle school (253 | 21.7%), and elementary school (234 | 20.1%).
| School Level | # Students | % Students |
| Nursery / Preschool | 42 | 3.6% |
| Kindergarten | 127 | 10.9% |
| Elementary School | 234 | 20.1% |
| Middle School | 253 | 21.7% |
| High School | 215 | 18.4% |
| College / Undergraduate | 276 | 23.7% |
| Graduate / Professional | 18 | 1.5% |
| Total | 1,165 | 100.0% |
School Enrollment by Age by Funding Source in Paintsville
Out of a total of 1,165 students who are enrolled in schools in Paintsville, 207 (17.8%) attend a private institution, while the remaining 958 (82.2%) are enrolled in public schools. The age group of 5 to 9 year old has the highest likelihood of being enrolled in private schools, with 95 (32.4% in the age bracket) enrolled. Conversely, the age group of 15 to 17 year olds has the lowest likelihood of being enrolled in a private school, with 177 (100.0% in the age bracket) attending a public institution.
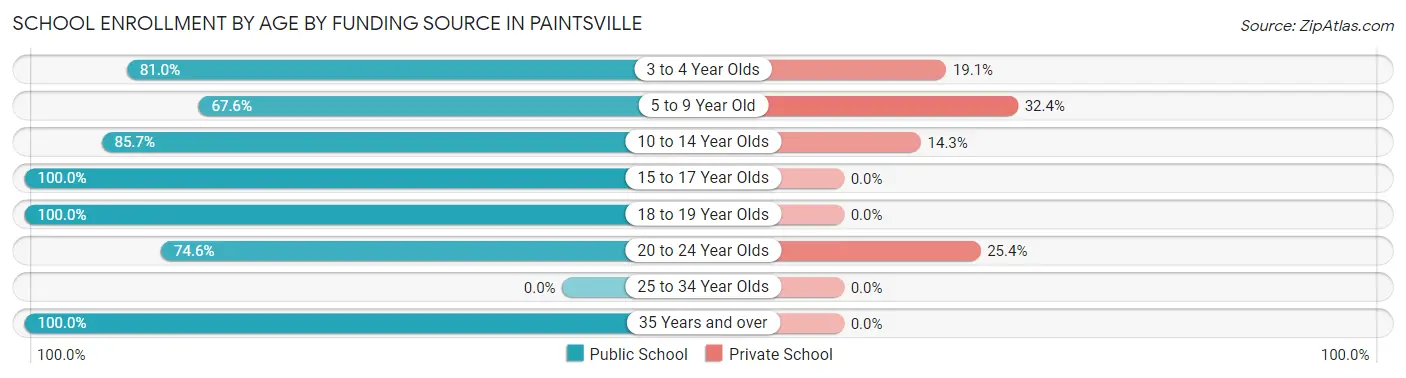
| Age Bracket | Public School | Private School |
| 3 to 4 Year Olds | 34 (80.9%) | 8 (19.1%) |
| 5 to 9 Year Old | 198 (67.6%) | 95 (32.4%) |
| 10 to 14 Year Olds | 275 (85.7%) | 46 (14.3%) |
| 15 to 17 Year Olds | 177 (100.0%) | 0 (0.0%) |
| 18 to 19 Year Olds | 38 (100.0%) | 0 (0.0%) |
| 20 to 24 Year Olds | 170 (74.6%) | 58 (25.4%) |
| 25 to 34 Year Olds | 0 (0.0%) | 0 (0.0%) |
| 35 Years and over | 66 (100.0%) | 0 (0.0%) |
| Total | 958 (82.2%) | 207 (17.8%) |
Educational Attainment by Field of Study in Paintsville
Education (89 | 21.7%), physical & health sciences (60 | 14.6%), arts & humanities (59 | 14.4%), bio, nature & agricultural (50 | 12.2%), and business (43 | 10.5%) are the most common fields of study among 410 individuals in Paintsville who have obtained a bachelor's degree or higher.
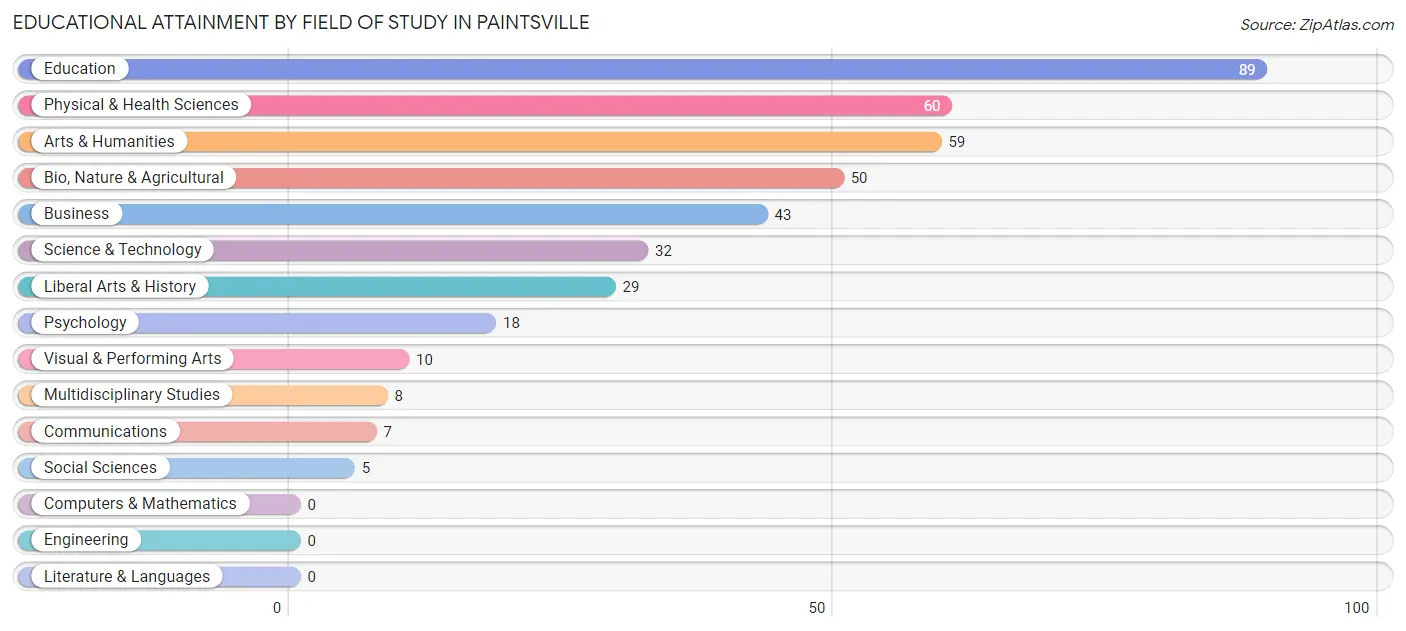
| Field of Study | # Graduates | % Graduates |
| Computers & Mathematics | 0 | 0.0% |
| Bio, Nature & Agricultural | 50 | 12.2% |
| Physical & Health Sciences | 60 | 14.6% |
| Psychology | 18 | 4.4% |
| Social Sciences | 5 | 1.2% |
| Engineering | 0 | 0.0% |
| Multidisciplinary Studies | 8 | 1.9% |
| Science & Technology | 32 | 7.8% |
| Business | 43 | 10.5% |
| Education | 89 | 21.7% |
| Literature & Languages | 0 | 0.0% |
| Liberal Arts & History | 29 | 7.1% |
| Visual & Performing Arts | 10 | 2.4% |
| Communications | 7 | 1.7% |
| Arts & Humanities | 59 | 14.4% |
| Total | 410 | 100.0% |
Transportation & Commute in Paintsville
Vehicle Availability by Sex in Paintsville
The most prevalent vehicle ownership categories in Paintsville are males with 2 vehicles (229, accounting for 35.4%) and females with 2 vehicles (222, making up 41.6%).
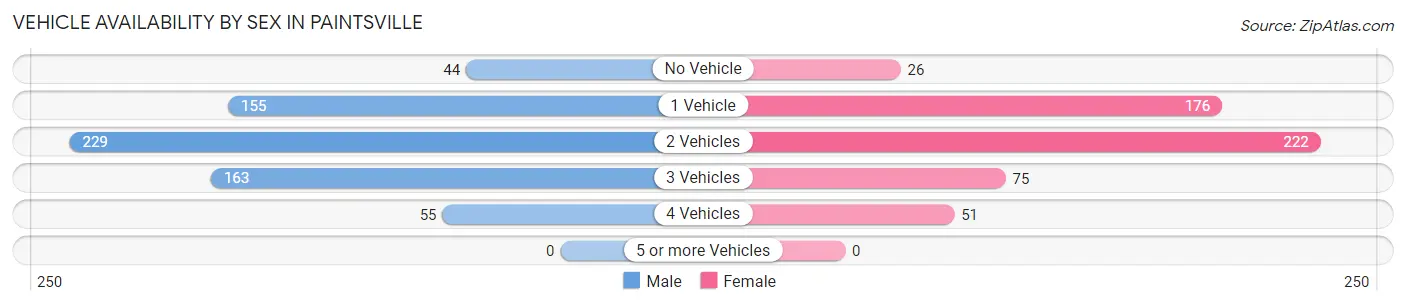
| Vehicles Available | Male | Female |
| No Vehicle | 44 (6.8%) | 26 (4.7%) |
| 1 Vehicle | 155 (24.0%) | 176 (32.0%) |
| 2 Vehicles | 229 (35.4%) | 222 (40.4%) |
| 3 Vehicles | 163 (25.2%) | 75 (13.6%) |
| 4 Vehicles | 55 (8.5%) | 51 (9.3%) |
| 5 or more Vehicles | 0 (0.0%) | 0 (0.0%) |
| Total | 646 (100.0%) | 550 (100.0%) |
Commute Time in Paintsville
The most frequently occuring commute durations in Paintsville are less than 5 minutes (244 commuters, 23.2%), 5 to 9 minutes (238 commuters, 22.7%), and 15 to 19 minutes (106 commuters, 10.1%).
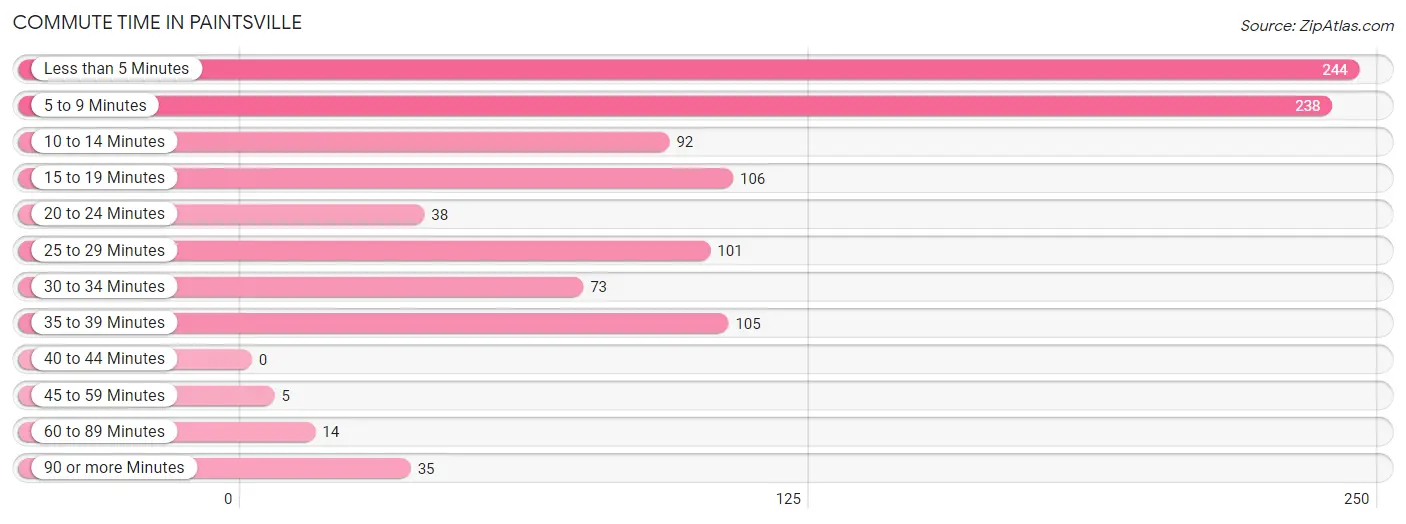
| Commute Time | # Commuters | % Commuters |
| Less than 5 Minutes | 244 | 23.2% |
| 5 to 9 Minutes | 238 | 22.7% |
| 10 to 14 Minutes | 92 | 8.7% |
| 15 to 19 Minutes | 106 | 10.1% |
| 20 to 24 Minutes | 38 | 3.6% |
| 25 to 29 Minutes | 101 | 9.6% |
| 30 to 34 Minutes | 73 | 7.0% |
| 35 to 39 Minutes | 105 | 10.0% |
| 40 to 44 Minutes | 0 | 0.0% |
| 45 to 59 Minutes | 5 | 0.5% |
| 60 to 89 Minutes | 14 | 1.3% |
| 90 or more Minutes | 35 | 3.3% |
Commute Time by Sex in Paintsville
The most common commute times in Paintsville are 5 to 9 minutes (138 commuters, 23.3%) for males and less than 5 minutes (154 commuters, 33.6%) for females.
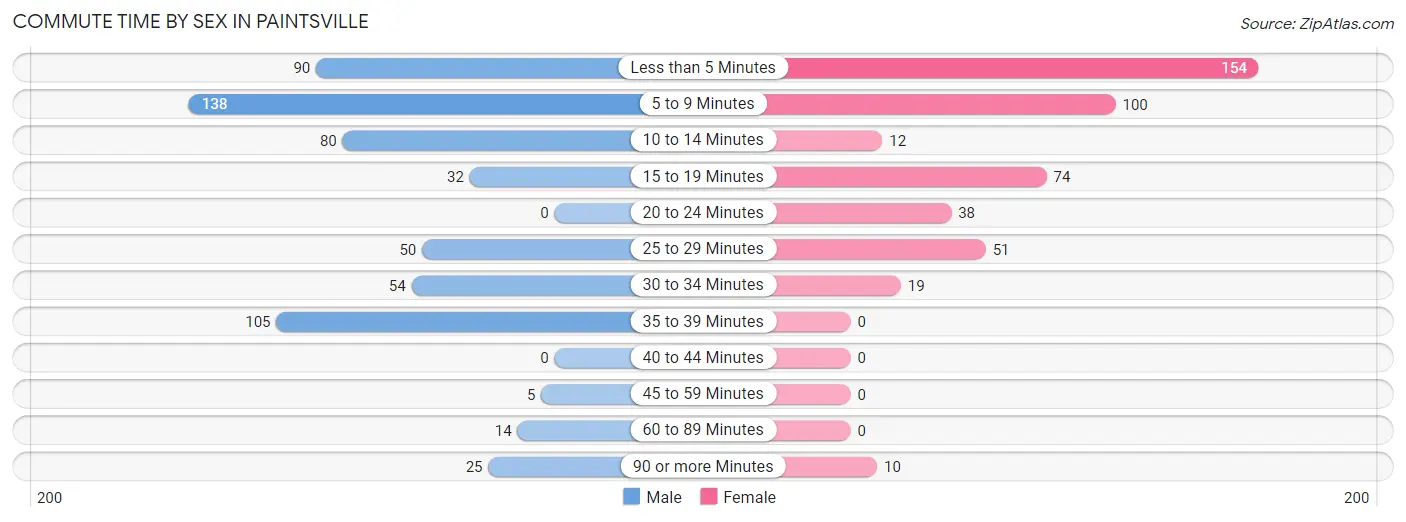
| Commute Time | Male | Female |
| Less than 5 Minutes | 90 (15.2%) | 154 (33.6%) |
| 5 to 9 Minutes | 138 (23.3%) | 100 (21.8%) |
| 10 to 14 Minutes | 80 (13.5%) | 12 (2.6%) |
| 15 to 19 Minutes | 32 (5.4%) | 74 (16.2%) |
| 20 to 24 Minutes | 0 (0.0%) | 38 (8.3%) |
| 25 to 29 Minutes | 50 (8.4%) | 51 (11.1%) |
| 30 to 34 Minutes | 54 (9.1%) | 19 (4.2%) |
| 35 to 39 Minutes | 105 (17.7%) | 0 (0.0%) |
| 40 to 44 Minutes | 0 (0.0%) | 0 (0.0%) |
| 45 to 59 Minutes | 5 (0.8%) | 0 (0.0%) |
| 60 to 89 Minutes | 14 (2.4%) | 0 (0.0%) |
| 90 or more Minutes | 25 (4.2%) | 10 (2.2%) |
Time of Departure to Work by Sex in Paintsville
The most frequent times of departure to work in Paintsville are 12:00 PM to 3:59 PM (113, 19.1%) for males and 7:30 AM to 7:59 AM (110, 24.0%) for females.
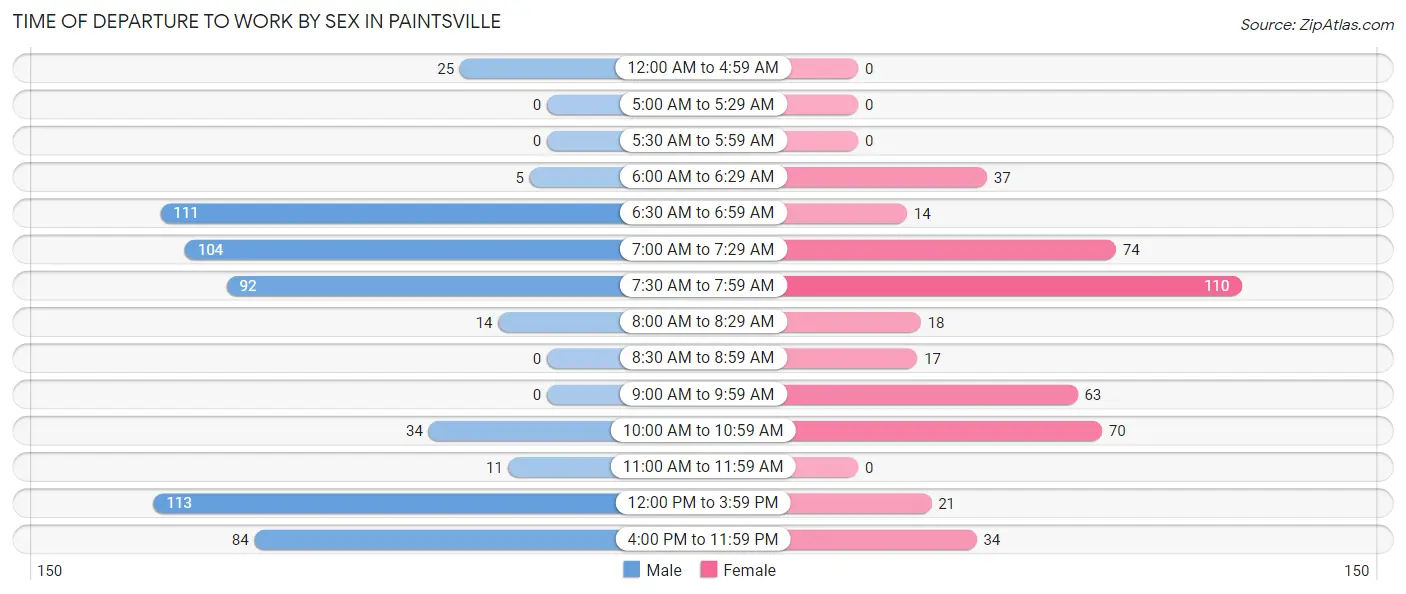
| Time of Departure | Male | Female |
| 12:00 AM to 4:59 AM | 25 (4.2%) | 0 (0.0%) |
| 5:00 AM to 5:29 AM | 0 (0.0%) | 0 (0.0%) |
| 5:30 AM to 5:59 AM | 0 (0.0%) | 0 (0.0%) |
| 6:00 AM to 6:29 AM | 5 (0.8%) | 37 (8.1%) |
| 6:30 AM to 6:59 AM | 111 (18.7%) | 14 (3.1%) |
| 7:00 AM to 7:29 AM | 104 (17.5%) | 74 (16.2%) |
| 7:30 AM to 7:59 AM | 92 (15.5%) | 110 (24.0%) |
| 8:00 AM to 8:29 AM | 14 (2.4%) | 18 (3.9%) |
| 8:30 AM to 8:59 AM | 0 (0.0%) | 17 (3.7%) |
| 9:00 AM to 9:59 AM | 0 (0.0%) | 63 (13.8%) |
| 10:00 AM to 10:59 AM | 34 (5.7%) | 70 (15.3%) |
| 11:00 AM to 11:59 AM | 11 (1.8%) | 0 (0.0%) |
| 12:00 PM to 3:59 PM | 113 (19.1%) | 21 (4.6%) |
| 4:00 PM to 11:59 PM | 84 (14.2%) | 34 (7.4%) |
| Total | 593 (100.0%) | 458 (100.0%) |
Housing Occupancy in Paintsville
Occupancy by Ownership in Paintsville
Of the total 1,615 dwellings in Paintsville, owner-occupied units account for 685 (42.4%), while renter-occupied units make up 930 (57.6%).
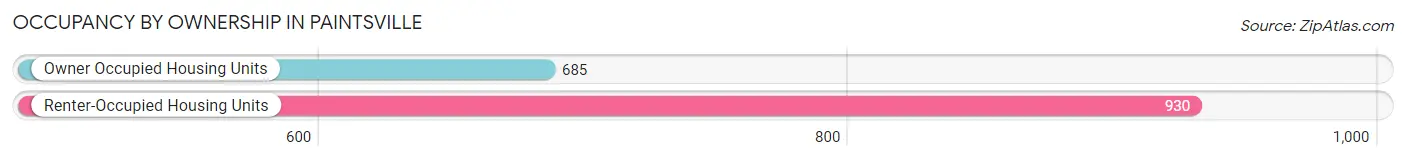
| Occupancy | # Housing Units | % Housing Units |
| Owner Occupied Housing Units | 685 | 42.4% |
| Renter-Occupied Housing Units | 930 | 57.6% |
| Total Occupied Housing Units | 1,615 | 100.0% |
Occupancy by Household Size in Paintsville
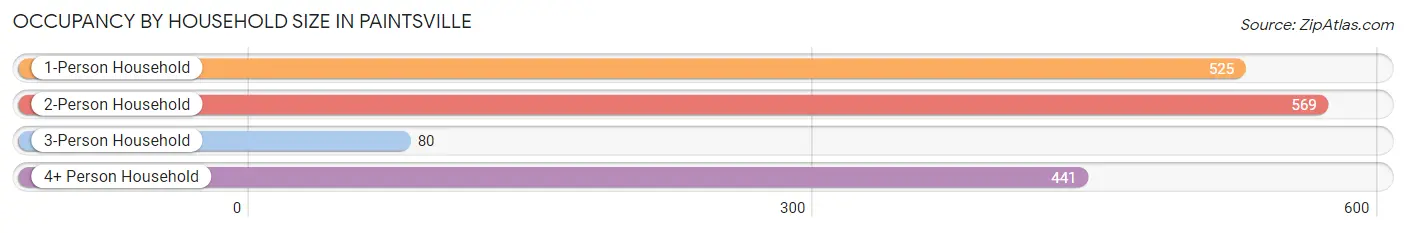
| Household Size | # Housing Units | % Housing Units |
| 1-Person Household | 525 | 32.5% |
| 2-Person Household | 569 | 35.2% |
| 3-Person Household | 80 | 5.0% |
| 4+ Person Household | 441 | 27.3% |
| Total Housing Units | 1,615 | 100.0% |
Occupancy by Ownership by Household Size in Paintsville
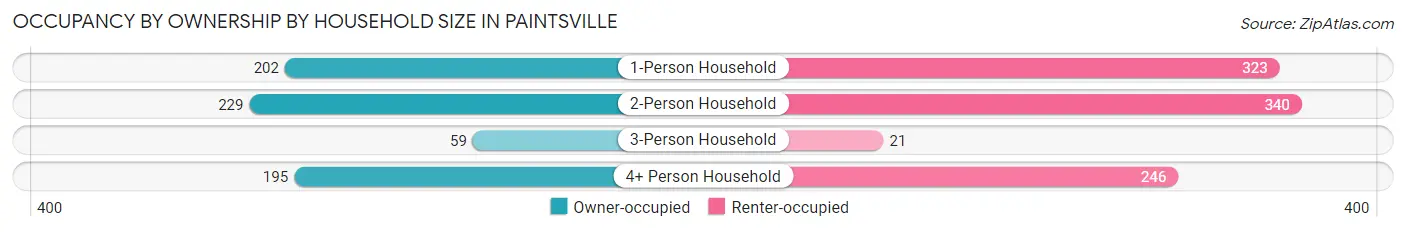
| Household Size | Owner-occupied | Renter-occupied |
| 1-Person Household | 202 (38.5%) | 323 (61.5%) |
| 2-Person Household | 229 (40.3%) | 340 (59.8%) |
| 3-Person Household | 59 (73.8%) | 21 (26.3%) |
| 4+ Person Household | 195 (44.2%) | 246 (55.8%) |
| Total Housing Units | 685 (42.4%) | 930 (57.6%) |
Occupancy by Educational Attainment in Paintsville
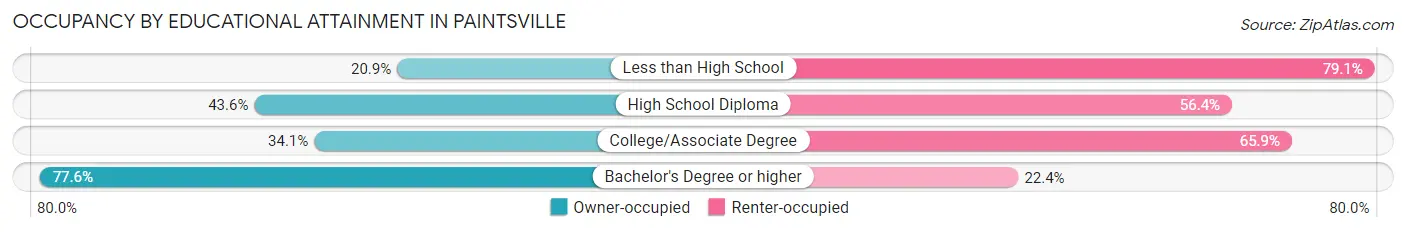
| Household Size | Owner-occupied | Renter-occupied |
| Less than High School | 54 (20.9%) | 204 (79.1%) |
| High School Diploma | 292 (43.6%) | 378 (56.4%) |
| College/Associate Degree | 152 (34.1%) | 294 (65.9%) |
| Bachelor's Degree or higher | 187 (77.6%) | 54 (22.4%) |
Occupancy by Age of Householder in Paintsville
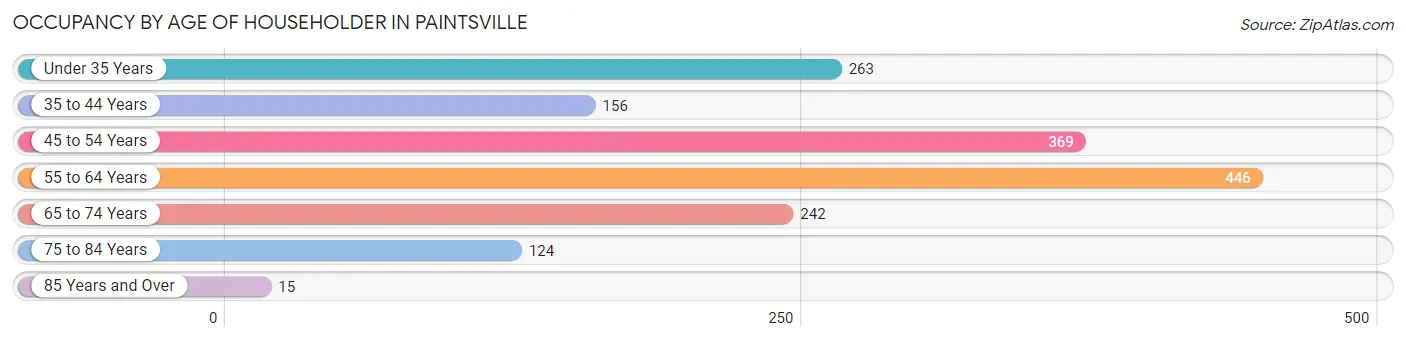
| Age Bracket | # Households | % Households |
| Under 35 Years | 263 | 16.3% |
| 35 to 44 Years | 156 | 9.7% |
| 45 to 54 Years | 369 | 22.9% |
| 55 to 64 Years | 446 | 27.6% |
| 65 to 74 Years | 242 | 15.0% |
| 75 to 84 Years | 124 | 7.7% |
| 85 Years and Over | 15 | 0.9% |
| Total | 1,615 | 100.0% |
Housing Finances in Paintsville
Median Income by Occupancy in Paintsville
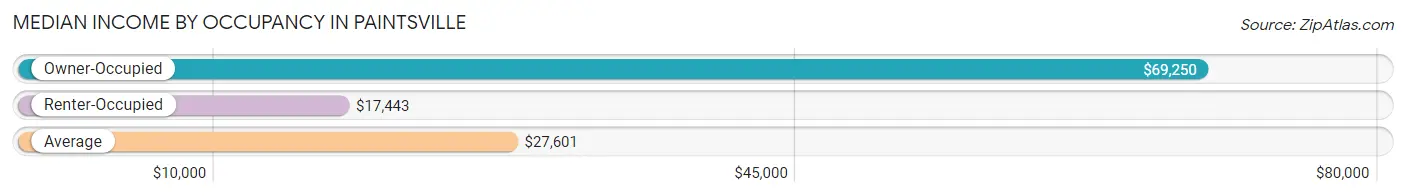
| Occupancy Type | # Households | Median Income |
| Owner-Occupied | 685 (42.4%) | $69,250 |
| Renter-Occupied | 930 (57.6%) | $17,443 |
| Average | 1,615 (100.0%) | $27,601 |
Occupancy by Householder Income Bracket in Paintsville
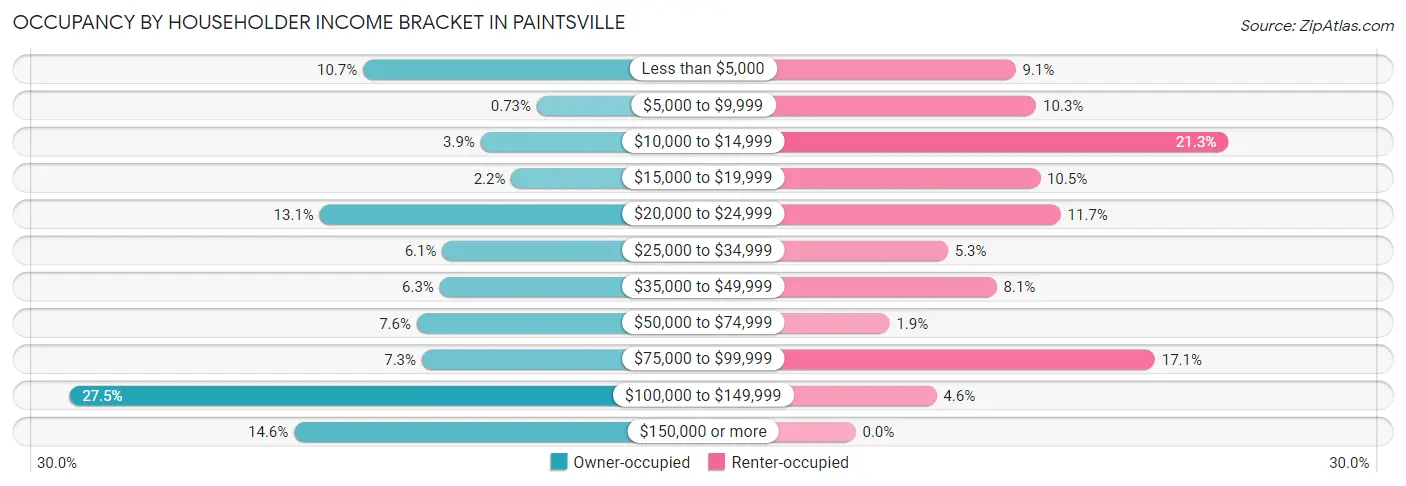
| Income Bracket | Owner-occupied | Renter-occupied |
| Less than $5,000 | 73 (10.7%) | 85 (9.1%) |
| $5,000 to $9,999 | 5 (0.7%) | 96 (10.3%) |
| $10,000 to $14,999 | 27 (3.9%) | 198 (21.3%) |
| $15,000 to $19,999 | 15 (2.2%) | 98 (10.5%) |
| $20,000 to $24,999 | 90 (13.1%) | 109 (11.7%) |
| $25,000 to $34,999 | 42 (6.1%) | 49 (5.3%) |
| $35,000 to $49,999 | 43 (6.3%) | 75 (8.1%) |
| $50,000 to $74,999 | 52 (7.6%) | 18 (1.9%) |
| $75,000 to $99,999 | 50 (7.3%) | 159 (17.1%) |
| $100,000 to $149,999 | 188 (27.5%) | 43 (4.6%) |
| $150,000 or more | 100 (14.6%) | 0 (0.0%) |
| Total | 685 (100.0%) | 930 (100.0%) |
Monthly Housing Cost Tiers in Paintsville
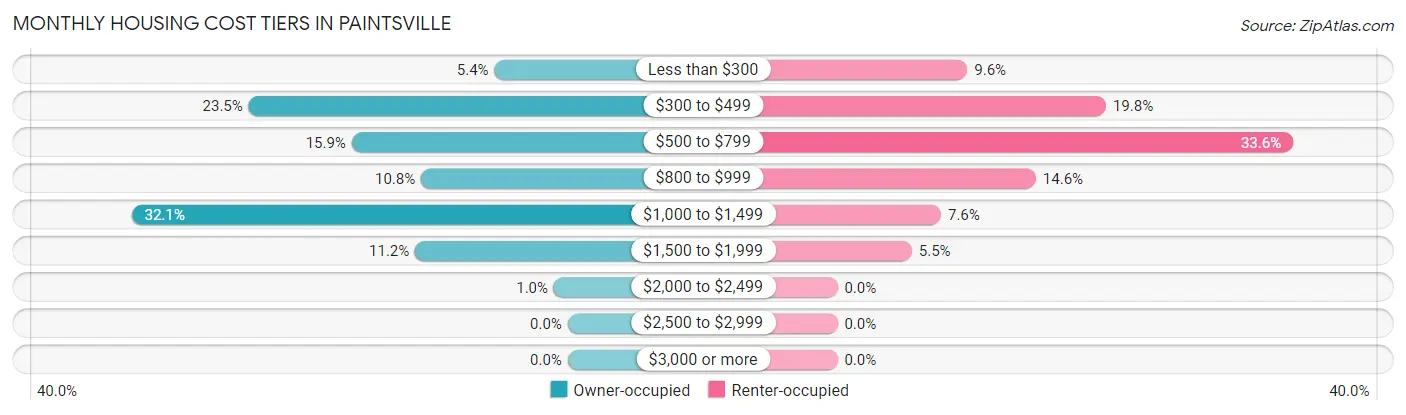
| Monthly Cost | Owner-occupied | Renter-occupied |
| Less than $300 | 37 (5.4%) | 89 (9.6%) |
| $300 to $499 | 161 (23.5%) | 184 (19.8%) |
| $500 to $799 | 109 (15.9%) | 312 (33.6%) |
| $800 to $999 | 74 (10.8%) | 136 (14.6%) |
| $1,000 to $1,499 | 220 (32.1%) | 71 (7.6%) |
| $1,500 to $1,999 | 77 (11.2%) | 51 (5.5%) |
| $2,000 to $2,499 | 7 (1.0%) | 0 (0.0%) |
| $2,500 to $2,999 | 0 (0.0%) | 0 (0.0%) |
| $3,000 or more | 0 (0.0%) | 0 (0.0%) |
| Total | 685 (100.0%) | 930 (100.0%) |
Physical Housing Characteristics in Paintsville
Housing Structures in Paintsville
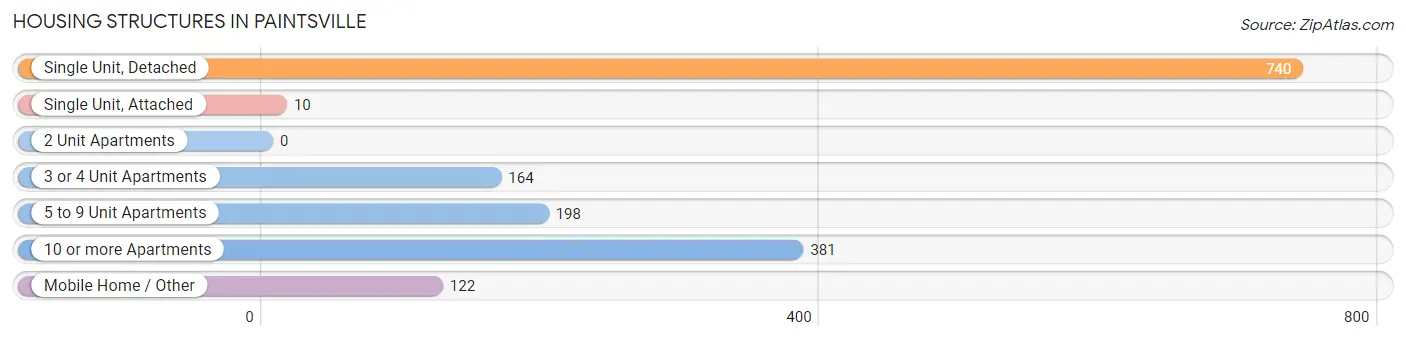
| Structure Type | # Housing Units | % Housing Units |
| Single Unit, Detached | 740 | 45.8% |
| Single Unit, Attached | 10 | 0.6% |
| 2 Unit Apartments | 0 | 0.0% |
| 3 or 4 Unit Apartments | 164 | 10.2% |
| 5 to 9 Unit Apartments | 198 | 12.3% |
| 10 or more Apartments | 381 | 23.6% |
| Mobile Home / Other | 122 | 7.5% |
| Total | 1,615 | 100.0% |
Housing Structures by Occupancy in Paintsville
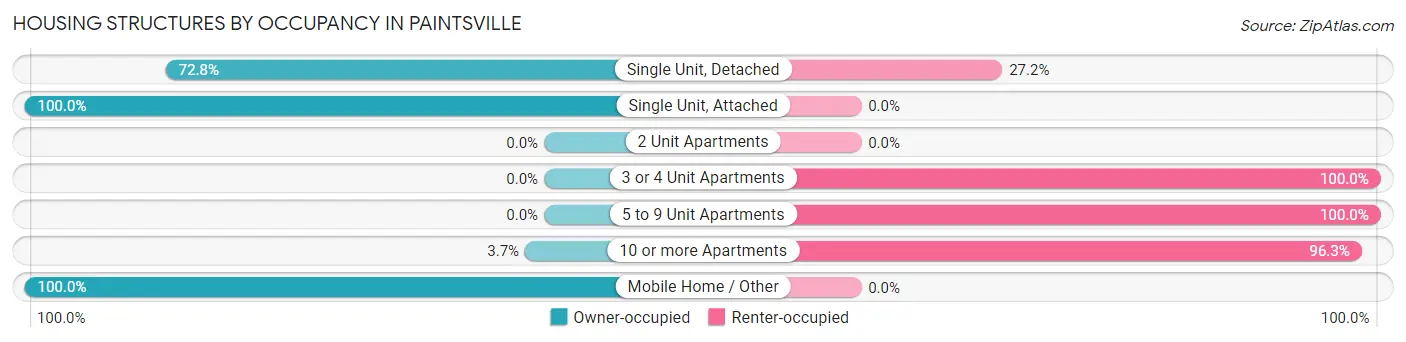
| Structure Type | Owner-occupied | Renter-occupied |
| Single Unit, Detached | 539 (72.8%) | 201 (27.2%) |
| Single Unit, Attached | 10 (100.0%) | 0 (0.0%) |
| 2 Unit Apartments | 0 (0.0%) | 0 (0.0%) |
| 3 or 4 Unit Apartments | 0 (0.0%) | 164 (100.0%) |
| 5 to 9 Unit Apartments | 0 (0.0%) | 198 (100.0%) |
| 10 or more Apartments | 14 (3.7%) | 367 (96.3%) |
| Mobile Home / Other | 122 (100.0%) | 0 (0.0%) |
| Total | 685 (42.4%) | 930 (57.6%) |
Housing Structures by Number of Rooms in Paintsville
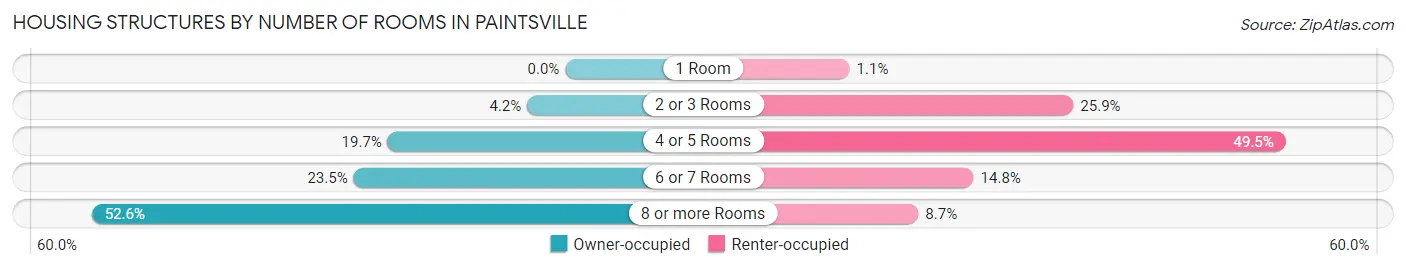
| Number of Rooms | Owner-occupied | Renter-occupied |
| 1 Room | 0 (0.0%) | 10 (1.1%) |
| 2 or 3 Rooms | 29 (4.2%) | 241 (25.9%) |
| 4 or 5 Rooms | 135 (19.7%) | 460 (49.5%) |
| 6 or 7 Rooms | 161 (23.5%) | 138 (14.8%) |
| 8 or more Rooms | 360 (52.5%) | 81 (8.7%) |
| Total | 685 (100.0%) | 930 (100.0%) |
Housing Structure by Heating Type in Paintsville
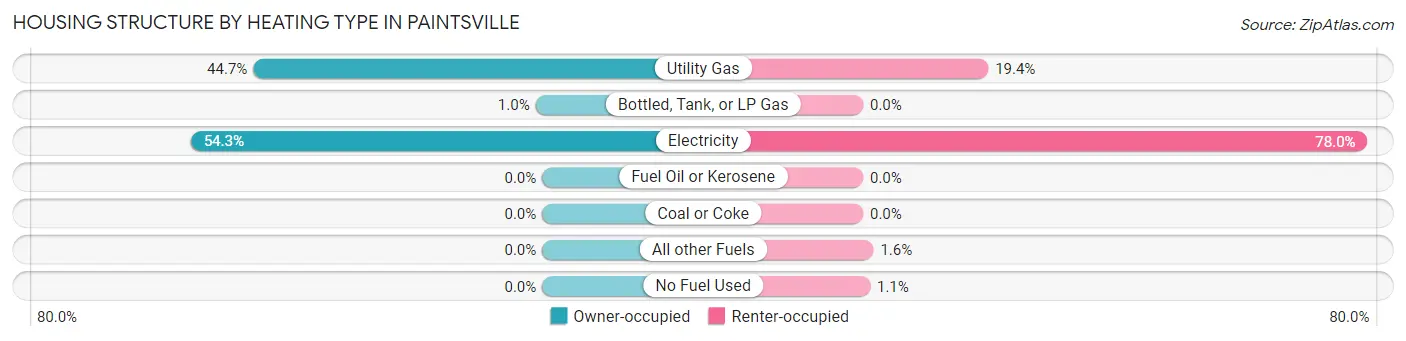
| Heating Type | Owner-occupied | Renter-occupied |
| Utility Gas | 306 (44.7%) | 180 (19.4%) |
| Bottled, Tank, or LP Gas | 7 (1.0%) | 0 (0.0%) |
| Electricity | 372 (54.3%) | 725 (78.0%) |
| Fuel Oil or Kerosene | 0 (0.0%) | 0 (0.0%) |
| Coal or Coke | 0 (0.0%) | 0 (0.0%) |
| All other Fuels | 0 (0.0%) | 15 (1.6%) |
| No Fuel Used | 0 (0.0%) | 10 (1.1%) |
| Total | 685 (100.0%) | 930 (100.0%) |
Household Vehicle Usage in Paintsville
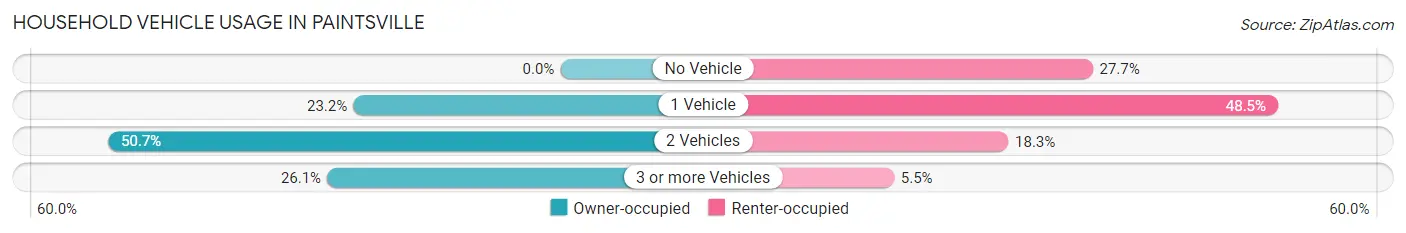
| Vehicles per Household | Owner-occupied | Renter-occupied |
| No Vehicle | 0 (0.0%) | 258 (27.7%) |
| 1 Vehicle | 159 (23.2%) | 451 (48.5%) |
| 2 Vehicles | 347 (50.7%) | 170 (18.3%) |
| 3 or more Vehicles | 179 (26.1%) | 51 (5.5%) |
| Total | 685 (100.0%) | 930 (100.0%) |
Real Estate & Mortgages in Paintsville
Real Estate and Mortgage Overview in Paintsville
| Characteristic | Without Mortgage | With Mortgage |
| Housing Units | 346 | 339 |
| Median Property Value | $67,500 | $190,400 |
| Median Household Income | $35,116 | $49 |
| Monthly Housing Costs | $490 | $0 |
| Real Estate Taxes | $837 | $14 |
Property Value by Mortgage Status in Paintsville
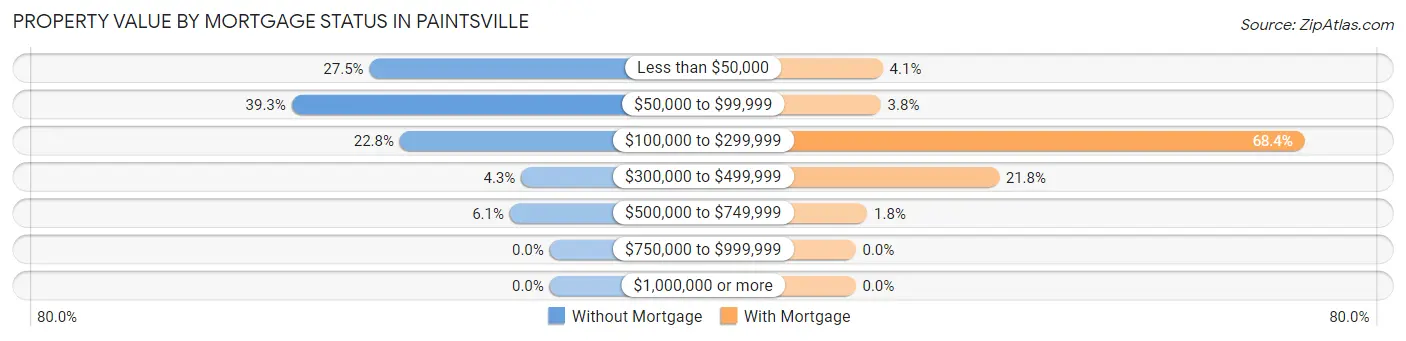
| Property Value | Without Mortgage | With Mortgage |
| Less than $50,000 | 95 (27.5%) | 14 (4.1%) |
| $50,000 to $99,999 | 136 (39.3%) | 13 (3.8%) |
| $100,000 to $299,999 | 79 (22.8%) | 232 (68.4%) |
| $300,000 to $499,999 | 15 (4.3%) | 74 (21.8%) |
| $500,000 to $749,999 | 21 (6.1%) | 6 (1.8%) |
| $750,000 to $999,999 | 0 (0.0%) | 0 (0.0%) |
| $1,000,000 or more | 0 (0.0%) | 0 (0.0%) |
| Total | 346 (100.0%) | 339 (100.0%) |
Household Income by Mortgage Status in Paintsville
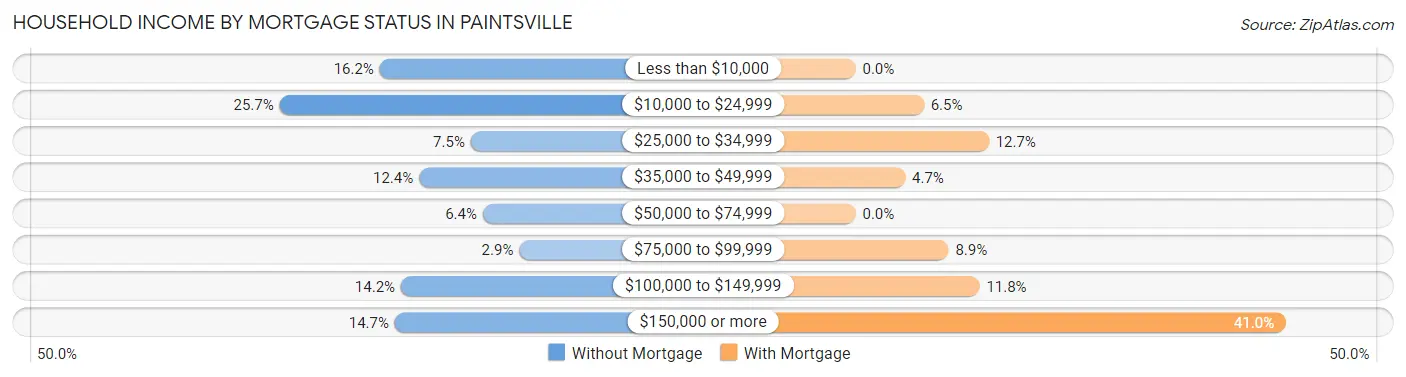
| Household Income | Without Mortgage | With Mortgage |
| Less than $10,000 | 56 (16.2%) | 0 (0.0%) |
| $10,000 to $24,999 | 89 (25.7%) | 22 (6.5%) |
| $25,000 to $34,999 | 26 (7.5%) | 43 (12.7%) |
| $35,000 to $49,999 | 43 (12.4%) | 16 (4.7%) |
| $50,000 to $74,999 | 22 (6.4%) | 0 (0.0%) |
| $75,000 to $99,999 | 10 (2.9%) | 30 (8.8%) |
| $100,000 to $149,999 | 49 (14.2%) | 40 (11.8%) |
| $150,000 or more | 51 (14.7%) | 139 (41.0%) |
| Total | 346 (100.0%) | 339 (100.0%) |
Property Value to Household Income Ratio in Paintsville
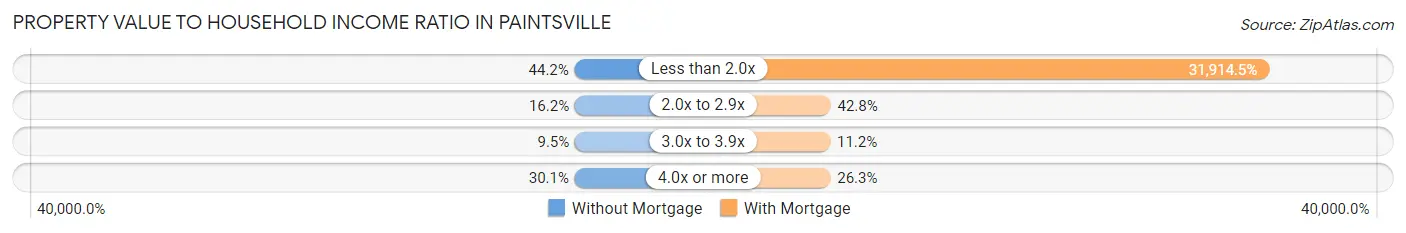
| Value-to-Income Ratio | Without Mortgage | With Mortgage |
| Less than 2.0x | 153 (44.2%) | 108,190 (31,914.4%) |
| 2.0x to 2.9x | 56 (16.2%) | 145 (42.8%) |
| 3.0x to 3.9x | 33 (9.5%) | 38 (11.2%) |
| 4.0x or more | 104 (30.1%) | 89 (26.3%) |
| Total | 346 (100.0%) | 339 (100.0%) |
Real Estate Taxes by Mortgage Status in Paintsville
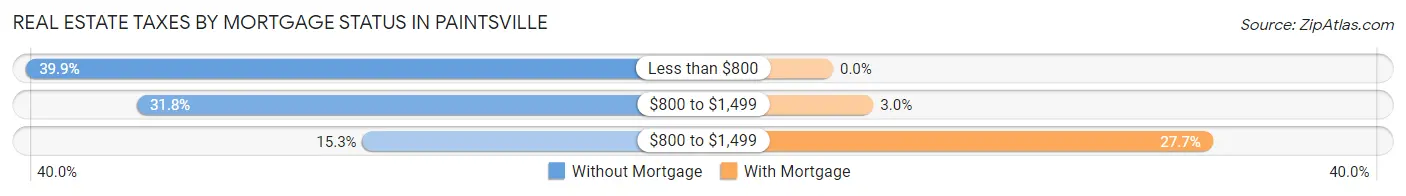
| Property Taxes | Without Mortgage | With Mortgage |
| Less than $800 | 138 (39.9%) | 0 (0.0%) |
| $800 to $1,499 | 110 (31.8%) | 10 (2.9%) |
| $800 to $1,499 | 53 (15.3%) | 94 (27.7%) |
| Total | 346 (100.0%) | 339 (100.0%) |
Health & Disability in Paintsville
Health Insurance Coverage by Age in Paintsville
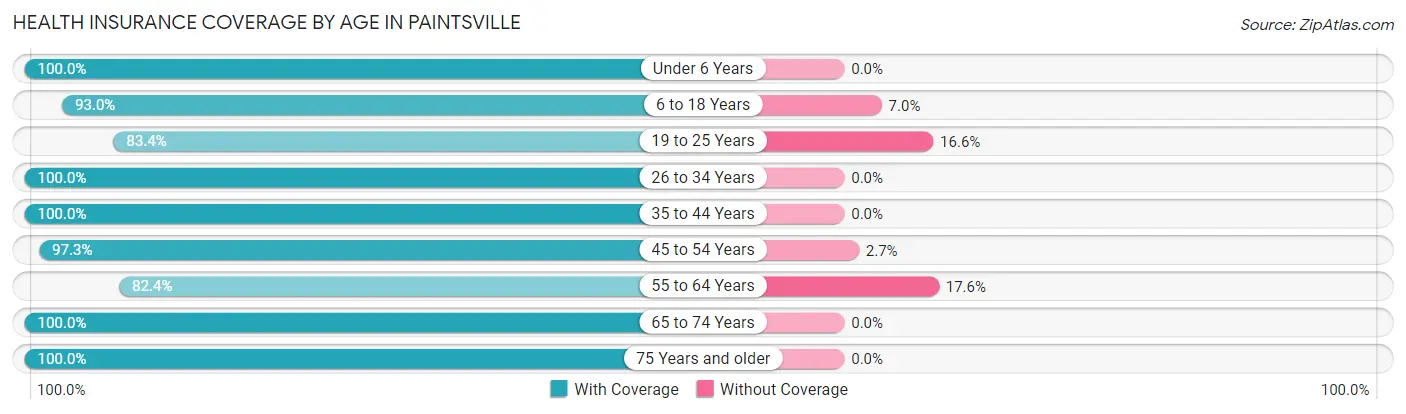
| Age Bracket | With Coverage | Without Coverage |
| Under 6 Years | 218 (100.0%) | 0 (0.0%) |
| 6 to 18 Years | 761 (93.0%) | 57 (7.0%) |
| 19 to 25 Years | 292 (83.4%) | 58 (16.6%) |
| 26 to 34 Years | 273 (100.0%) | 0 (0.0%) |
| 35 to 44 Years | 436 (100.0%) | 0 (0.0%) |
| 45 to 54 Years | 539 (97.3%) | 15 (2.7%) |
| 55 to 64 Years | 589 (82.4%) | 126 (17.6%) |
| 65 to 74 Years | 380 (100.0%) | 0 (0.0%) |
| 75 Years and older | 183 (100.0%) | 0 (0.0%) |
| Total | 3,671 (93.5%) | 256 (6.5%) |
Health Insurance Coverage by Citizenship Status in Paintsville
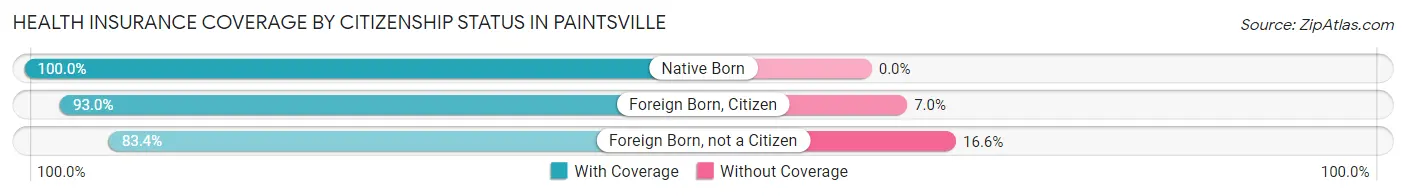
| Citizenship Status | With Coverage | Without Coverage |
| Native Born | 218 (100.0%) | 0 (0.0%) |
| Foreign Born, Citizen | 761 (93.0%) | 57 (7.0%) |
| Foreign Born, not a Citizen | 292 (83.4%) | 58 (16.6%) |
Health Insurance Coverage by Household Income in Paintsville
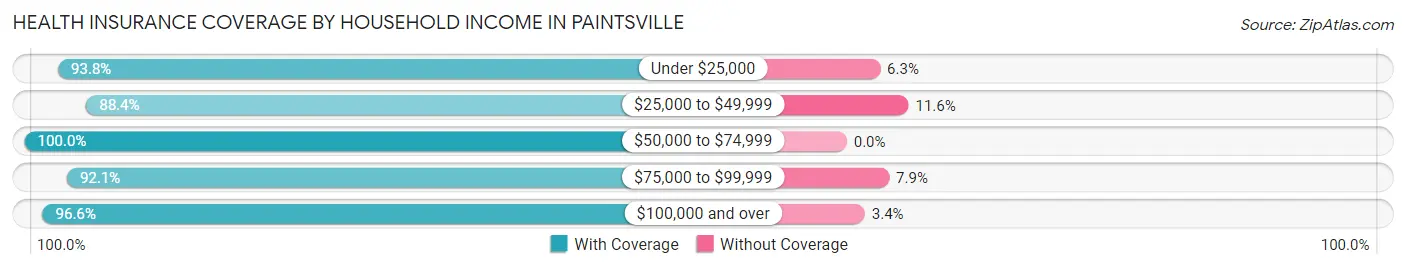
| Household Income | With Coverage | Without Coverage |
| Under $25,000 | 1,379 (93.8%) | 92 (6.2%) |
| $25,000 to $49,999 | 321 (88.4%) | 42 (11.6%) |
| $50,000 to $74,999 | 207 (100.0%) | 0 (0.0%) |
| $75,000 to $99,999 | 661 (92.1%) | 57 (7.9%) |
| $100,000 and over | 1,059 (96.6%) | 37 (3.4%) |
Public vs Private Health Insurance Coverage by Age in Paintsville
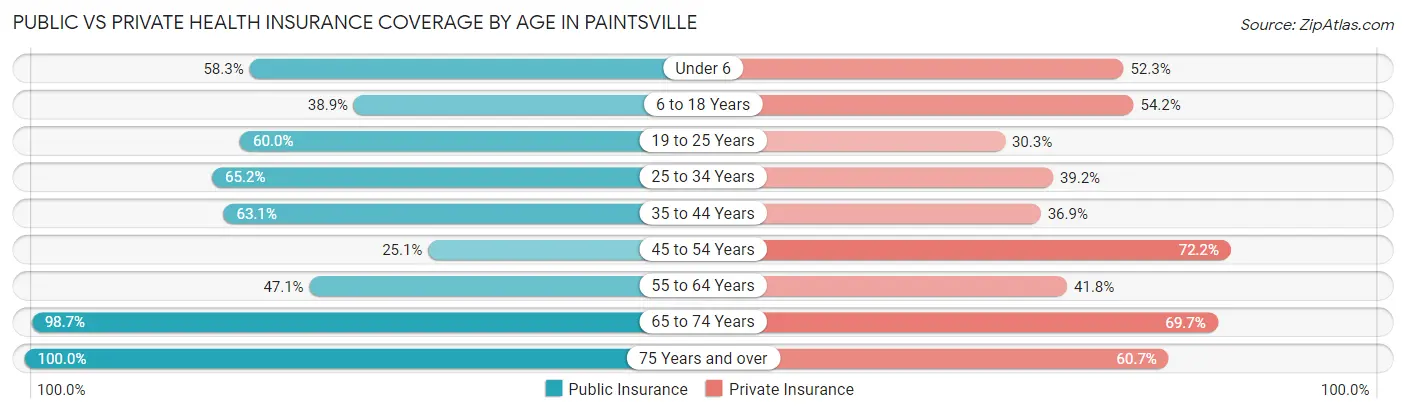
| Age Bracket | Public Insurance | Private Insurance |
| Under 6 | 127 (58.3%) | 114 (52.3%) |
| 6 to 18 Years | 318 (38.9%) | 443 (54.2%) |
| 19 to 25 Years | 210 (60.0%) | 106 (30.3%) |
| 25 to 34 Years | 178 (65.2%) | 107 (39.2%) |
| 35 to 44 Years | 275 (63.1%) | 161 (36.9%) |
| 45 to 54 Years | 139 (25.1%) | 400 (72.2%) |
| 55 to 64 Years | 337 (47.1%) | 299 (41.8%) |
| 65 to 74 Years | 375 (98.7%) | 265 (69.7%) |
| 75 Years and over | 183 (100.0%) | 111 (60.7%) |
| Total | 2,142 (54.5%) | 2,006 (51.1%) |
Disability Status by Sex by Age in Paintsville
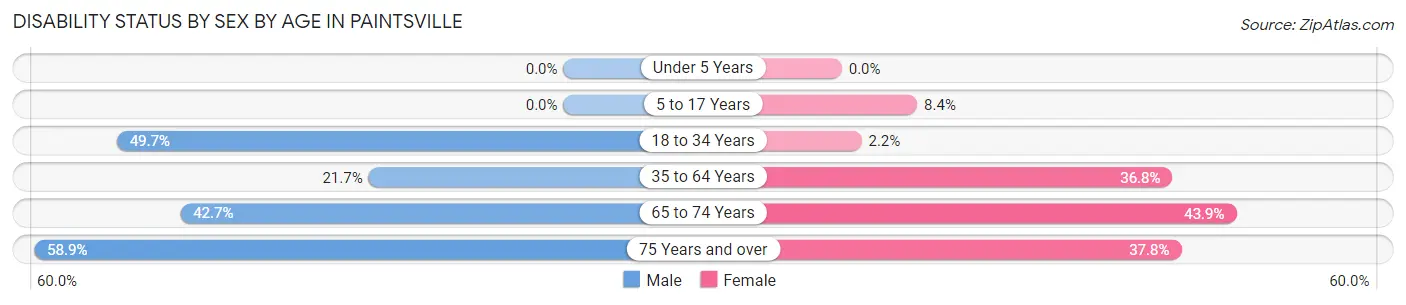
| Age Bracket | Male | Female |
| Under 5 Years | 0 (0.0%) | 0 (0.0%) |
| 5 to 17 Years | 0 (0.0%) | 36 (8.4%) |
| 18 to 34 Years | 193 (49.7%) | 6 (2.2%) |
| 35 to 64 Years | 153 (21.7%) | 368 (36.8%) |
| 65 to 74 Years | 32 (42.7%) | 134 (43.9%) |
| 75 Years and over | 33 (58.9%) | 48 (37.8%) |
Disability Class by Sex by Age in Paintsville
Disability Class: Hearing Difficulty
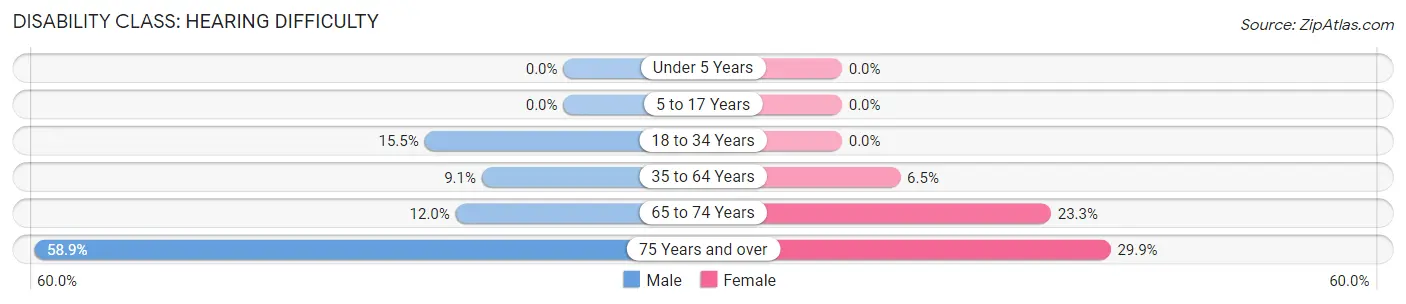
| Age Bracket | Male | Female |
| Under 5 Years | 0 (0.0%) | 0 (0.0%) |
| 5 to 17 Years | 0 (0.0%) | 0 (0.0%) |
| 18 to 34 Years | 60 (15.5%) | 0 (0.0%) |
| 35 to 64 Years | 64 (9.1%) | 65 (6.5%) |
| 65 to 74 Years | 9 (12.0%) | 71 (23.3%) |
| 75 Years and over | 33 (58.9%) | 38 (29.9%) |
Disability Class: Vision Difficulty
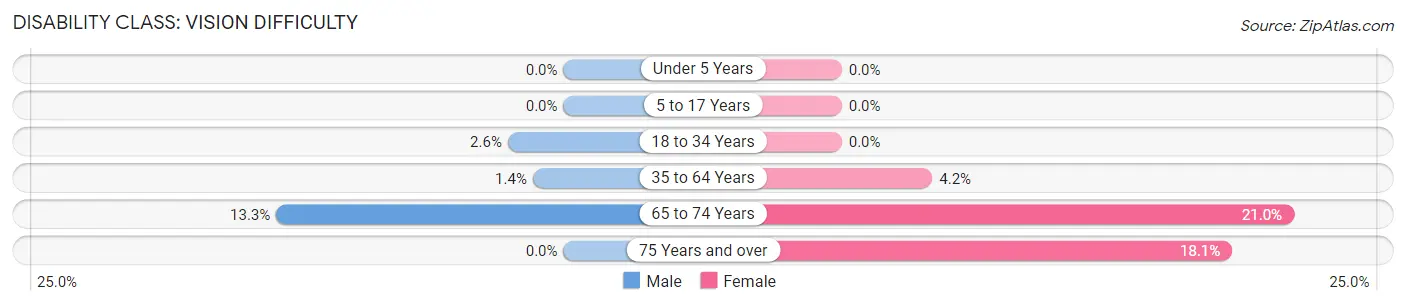
| Age Bracket | Male | Female |
| Under 5 Years | 0 (0.0%) | 0 (0.0%) |
| 5 to 17 Years | 0 (0.0%) | 0 (0.0%) |
| 18 to 34 Years | 10 (2.6%) | 0 (0.0%) |
| 35 to 64 Years | 10 (1.4%) | 42 (4.2%) |
| 65 to 74 Years | 10 (13.3%) | 64 (21.0%) |
| 75 Years and over | 0 (0.0%) | 23 (18.1%) |
Disability Class: Cognitive Difficulty
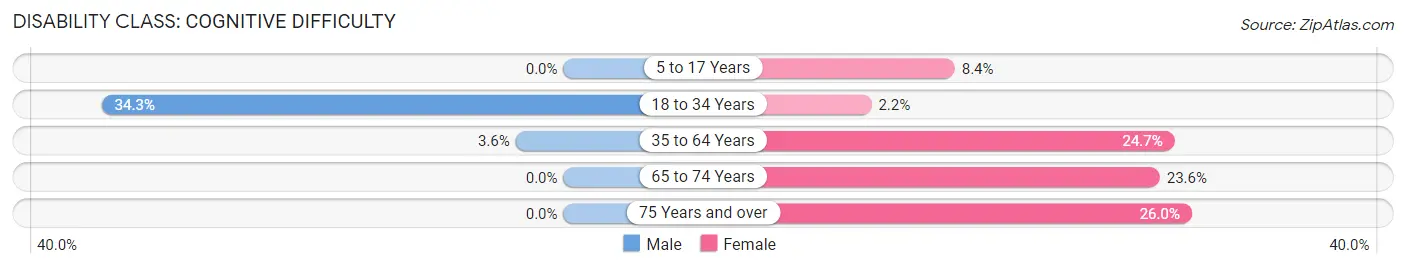
| Age Bracket | Male | Female |
| 5 to 17 Years | 0 (0.0%) | 36 (8.4%) |
| 18 to 34 Years | 133 (34.3%) | 6 (2.2%) |
| 35 to 64 Years | 25 (3.5%) | 247 (24.7%) |
| 65 to 74 Years | 0 (0.0%) | 72 (23.6%) |
| 75 Years and over | 0 (0.0%) | 33 (26.0%) |
Disability Class: Ambulatory Difficulty
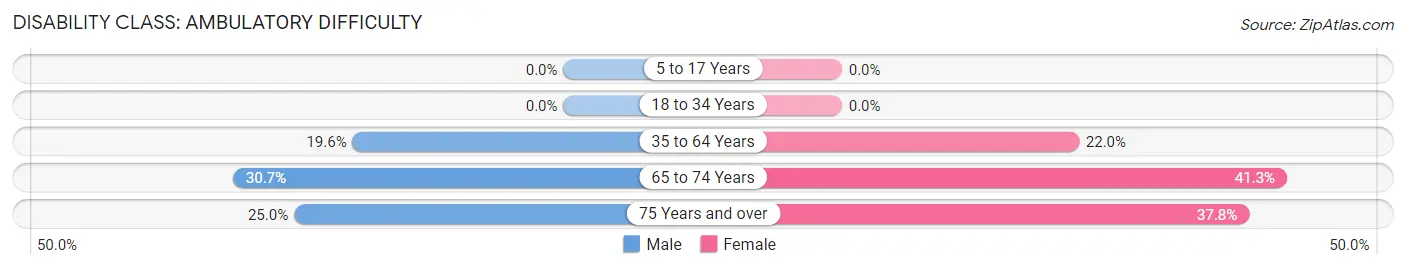
| Age Bracket | Male | Female |
| 5 to 17 Years | 0 (0.0%) | 0 (0.0%) |
| 18 to 34 Years | 0 (0.0%) | 0 (0.0%) |
| 35 to 64 Years | 138 (19.6%) | 220 (22.0%) |
| 65 to 74 Years | 23 (30.7%) | 126 (41.3%) |
| 75 Years and over | 14 (25.0%) | 48 (37.8%) |
Disability Class: Self-Care Difficulty
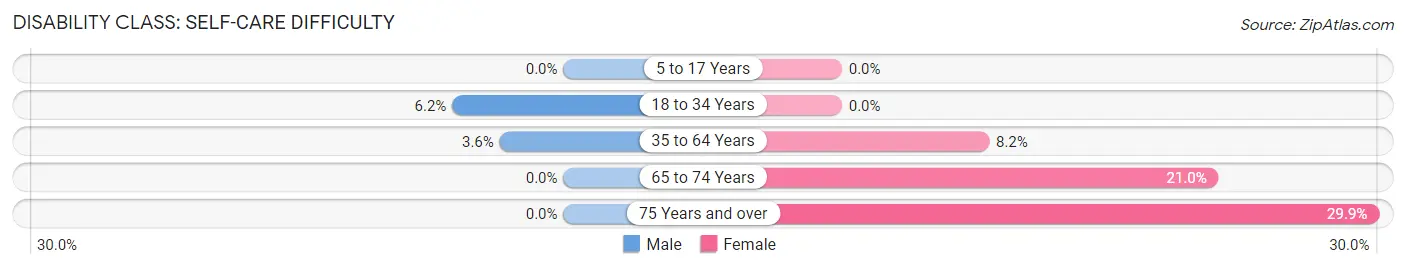
| Age Bracket | Male | Female |
| 5 to 17 Years | 0 (0.0%) | 0 (0.0%) |
| 18 to 34 Years | 24 (6.2%) | 0 (0.0%) |
| 35 to 64 Years | 25 (3.5%) | 82 (8.2%) |
| 65 to 74 Years | 0 (0.0%) | 64 (21.0%) |
| 75 Years and over | 0 (0.0%) | 38 (29.9%) |
Technology Access in Paintsville
Computing Device Access in Paintsville
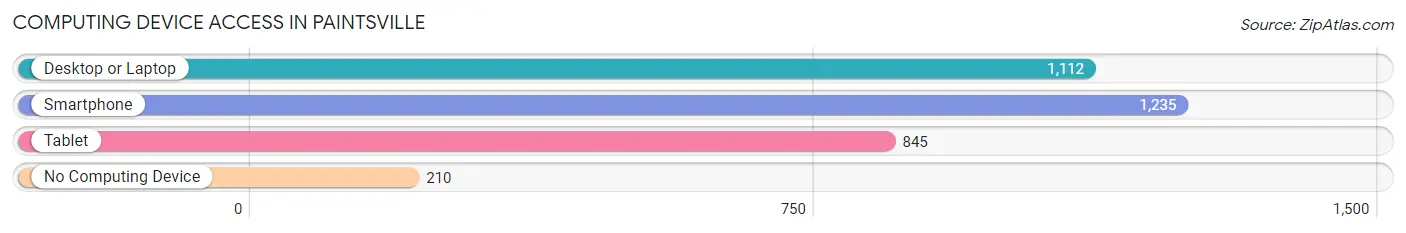
| Device Type | # Households | % Households |
| Desktop or Laptop | 1,112 | 68.9% |
| Smartphone | 1,235 | 76.5% |
| Tablet | 845 | 52.3% |
| No Computing Device | 210 | 13.0% |
| Total | 1,615 | 100.0% |
Internet Access in Paintsville
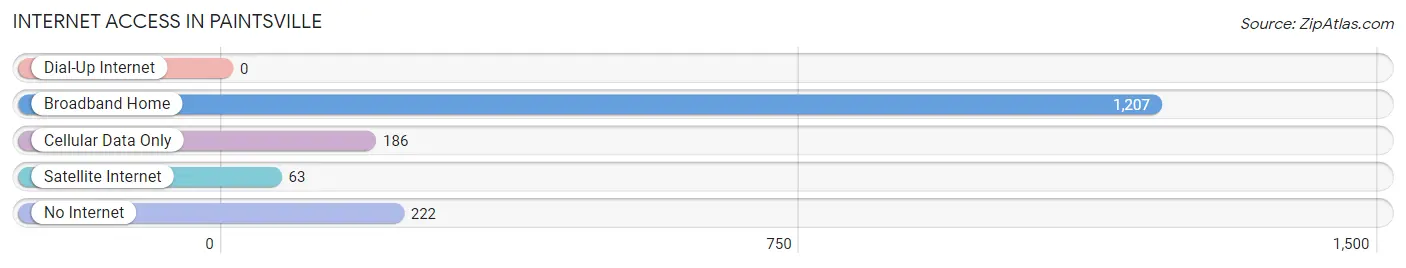
| Internet Type | # Households | % Households |
| Dial-Up Internet | 0 | 0.0% |
| Broadband Home | 1,207 | 74.7% |
| Cellular Data Only | 186 | 11.5% |
| Satellite Internet | 63 | 3.9% |
| No Internet | 222 | 13.8% |
| Total | 1,615 | 100.0% |
Paintsville Summary
Paintsville is a city located in Johnson County, Kentucky, United States. It is the county seat of Johnson County and the principal city of the Paintsville Micropolitan Statistical Area, which includes all of Johnson County. The population was 3,459 at the 2010 census.
History
Paintsville was founded in 1834 by William S. May, who named the town after his father, John May, who had painted the first house in the area. The city was incorporated in 1843.
Paintsville was the site of a major Civil War battle in 1862, when Confederate forces under General Humphrey Marshall attacked Union forces under General James A. Garfield. The battle resulted in a Confederate victory, but the Union forces were able to retreat and regroup.
Geography
Paintsville is located at the junction of US 23 and KY 40 in the foothills of the Appalachian Mountains. The city is situated in the Big Sandy Valley, which is part of the Cumberland Plateau. The city is surrounded by rolling hills and is located near the headwaters of the Levisa Fork of the Big Sandy River.
The climate in Paintsville is humid subtropical, with hot, humid summers and mild winters. The average annual temperature is 57°F (14°C), and the average annual precipitation is 45 inches (114 cm).
Economy
The economy of Paintsville is largely based on agriculture and tourism. The city is home to several large farms, as well as several small businesses. Tourism is also an important part of the local economy, with visitors coming to the area to enjoy the natural beauty of the Appalachian Mountains.
The city is also home to several manufacturing companies, including a furniture factory, a plastics factory, and a paper mill.
Demographics
As of the 2010 census, the population of Paintsville was 3,459. The racial makeup of the city was 95.3% White, 2.2% African American, 0.3% Native American, 0.2% Asian, 0.1% Pacific Islander, 0.7% from other races, and 1.3% from two or more races. Hispanic or Latino of any race were 1.7% of the population.
The median income for a household in Paintsville was $25,938, and the median income for a family was $32,813. The per capita income for the city was $14,945. About 17.2% of families and 20.3% of the population were below the poverty line, including 28.2% of those under age 18 and 16.2% of those age 65 or over.
Conclusion
Paintsville is a small city located in Johnson County, Kentucky. It is the county seat of Johnson County and the principal city of the Paintsville Micropolitan Statistical Area. The city has a long history, dating back to 1834, and is home to several large farms and small businesses. The economy of Paintsville is largely based on agriculture and tourism, and the city is also home to several manufacturing companies. The population of Paintsville was 3,459 at the 2010 census, and the median income for a household was $25,938.
Common Questions
What is Per Capita Income in Paintsville?
Per Capita income in Paintsville is $20,487.
What is the Median Household income in Paintsville?
Median Household Income in Paintsville is $27,601.
What is Income or Wage Gap in Paintsville?
Income or Wage Gap in Paintsville is 7.7%.
Women in Paintsville earn 92.3 cents for every dollar earned by a man.
What is Inequality or Gini Index in Paintsville?
Inequality or Gini Index in Paintsville is 0.51.
What is the Total Population of Paintsville?
Total Population of Paintsville is 4,277.
What is the Total Male Population of Paintsville?
Total Male Population of Paintsville is 1,900.
What is the Total Female Population of Paintsville?
Total Female Population of Paintsville is 2,377.
What is the Ratio of Males per 100 Females in Paintsville?
There are 79.93 Males per 100 Females in Paintsville.
What is the Ratio of Females per 100 Males in Paintsville?
There are 125.11 Females per 100 Males in Paintsville.
What is the Median Population Age in Paintsville?
Median Population Age in Paintsville is 42.3 Years.
What is the Average Family Size in Paintsville
Average Family Size in Paintsville is 3.1 People.
What is the Average Household Size in Paintsville
Average Household Size in Paintsville is 2.4 People.
How Large is the Labor Force in Paintsville?
There are 1,400 People in the Labor Forcein in Paintsville.
What is the Percentage of People in the Labor Force in Paintsville?
41.2% of People are in the Labor Force in Paintsville.
What is the Unemployment Rate in Paintsville?
Unemployment Rate in Paintsville is 7.6%.