Lewisport, KY Map & Demographics
Lewisport Map
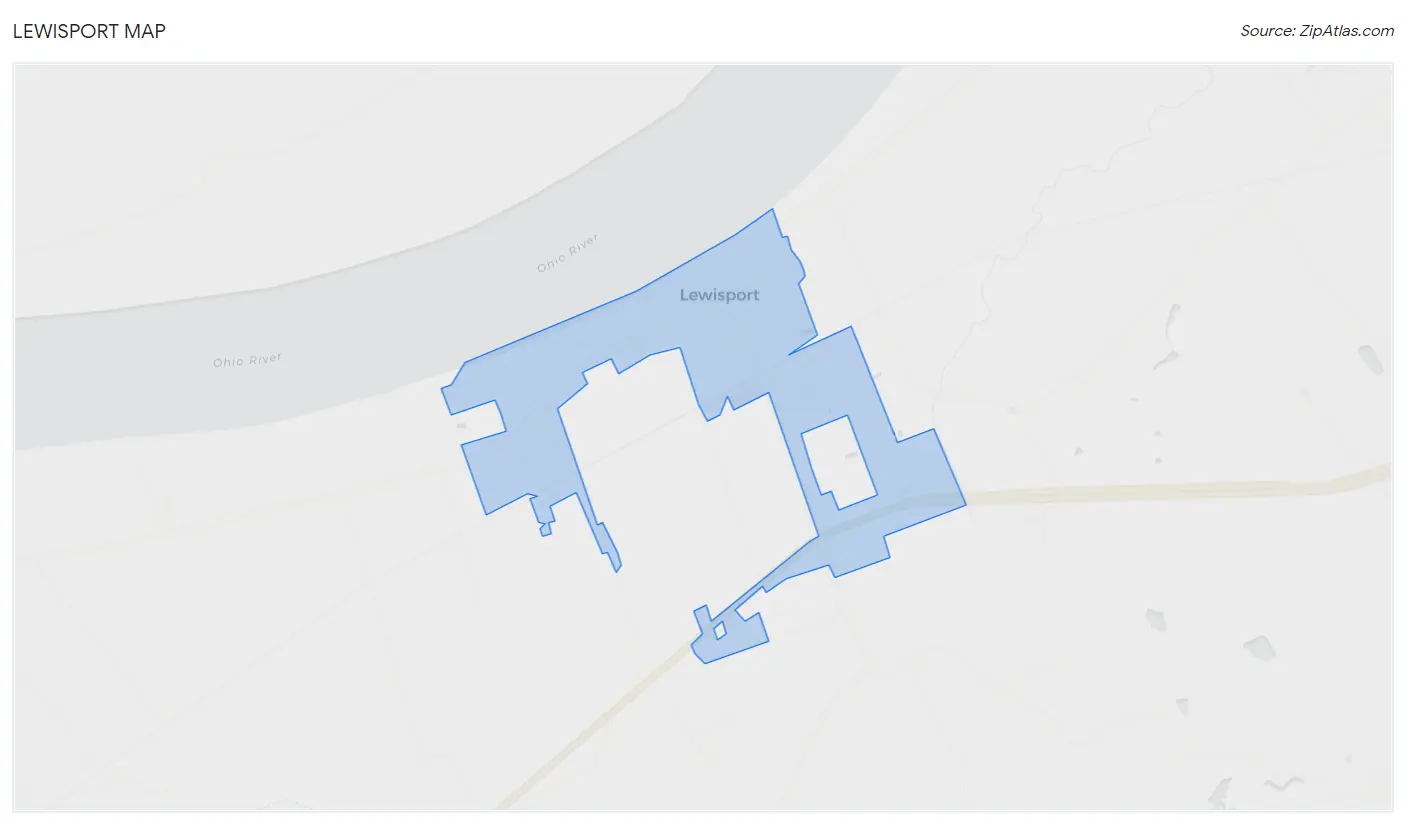
Lewisport Overview
$24,283
PER CAPITA INCOME
$65,000
AVG FAMILY INCOME
$49,545
AVG HOUSEHOLD INCOME
46.7%
WAGE / INCOME GAP [ % ]
53.3¢/ $1
WAGE / INCOME GAP [ $ ]
0.43
INEQUALITY / GINI INDEX
2,180
TOTAL POPULATION
1,063
MALE POPULATION
1,117
FEMALE POPULATION
95.17
MALES / 100 FEMALES
105.08
FEMALES / 100 MALES
34.6
MEDIAN AGE
3.2
AVG FAMILY SIZE
2.6
AVG HOUSEHOLD SIZE
897
LABOR FORCE [ PEOPLE ]
54.7%
PERCENT IN LABOR FORCE
4.7%
UNEMPLOYMENT RATE
Lewisport Zip Codes
Lewisport Area Codes
Income in Lewisport
Income Overview in Lewisport
Per Capita Income in Lewisport is $24,283, while median incomes of families and households are $65,000 and $49,545 respectively.
| Characteristic | Number | Measure |
| Per Capita Income | 2,180 | $24,283 |
| Median Family Income | 504 | $65,000 |
| Mean Family Income | 504 | $75,435 |
| Median Household Income | 800 | $49,545 |
| Mean Household Income | 800 | $62,464 |
| Income Deficit | 504 | $0 |
| Wage / Income Gap (%) | 2,180 | 46.69% |
| Wage / Income Gap ($) | 2,180 | 53.31¢ per $1 |
| Gini / Inequality Index | 2,180 | 0.43 |
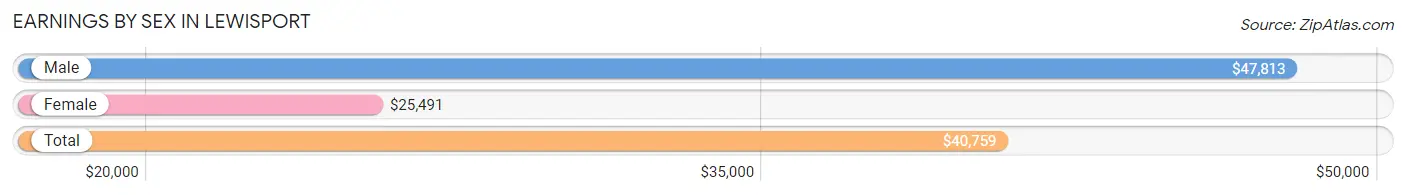
Earnings by Sex in Lewisport
Average Earnings in Lewisport are $40,759, $47,813 for men and $25,491 for women, a difference of 46.7%.
| Sex | Number | Average Earnings |
| Male | 502 (53.2%) | $47,813 |
| Female | 441 (46.8%) | $25,491 |
| Total | 943 (100.0%) | $40,759 |
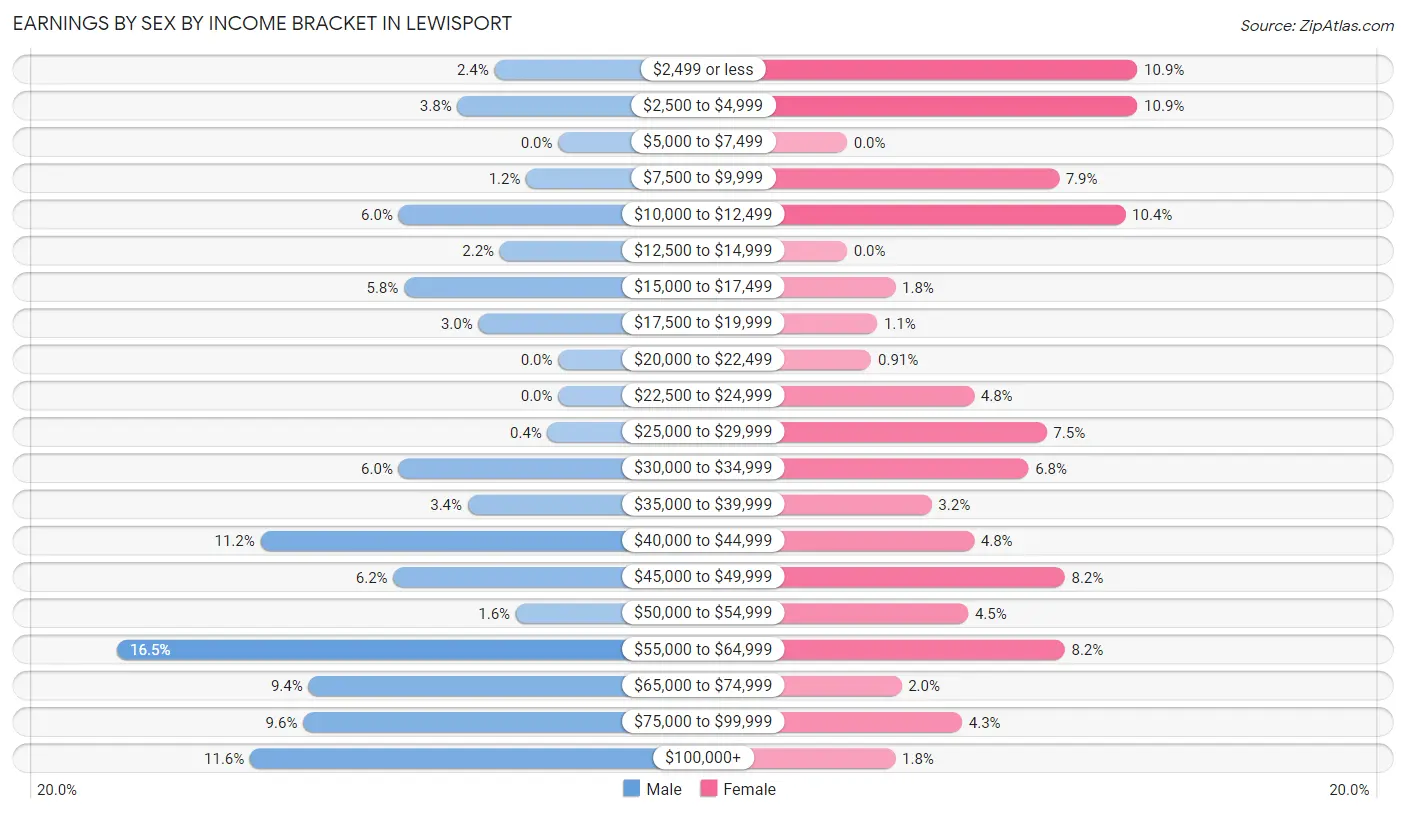
Earnings by Sex by Income Bracket in Lewisport
The most common earnings brackets in Lewisport are $55,000 to $64,999 for men (83 | 16.5%) and $2,499 or less for women (48 | 10.9%).
| Income | Male | Female |
| $2,499 or less | 12 (2.4%) | 48 (10.9%) |
| $2,500 to $4,999 | 19 (3.8%) | 48 (10.9%) |
| $5,000 to $7,499 | 0 (0.0%) | 0 (0.0%) |
| $7,500 to $9,999 | 6 (1.2%) | 35 (7.9%) |
| $10,000 to $12,499 | 30 (6.0%) | 46 (10.4%) |
| $12,500 to $14,999 | 11 (2.2%) | 0 (0.0%) |
| $15,000 to $17,499 | 29 (5.8%) | 8 (1.8%) |
| $17,500 to $19,999 | 15 (3.0%) | 5 (1.1%) |
| $20,000 to $22,499 | 0 (0.0%) | 4 (0.9%) |
| $22,500 to $24,999 | 0 (0.0%) | 21 (4.8%) |
| $25,000 to $29,999 | 2 (0.4%) | 33 (7.5%) |
| $30,000 to $34,999 | 30 (6.0%) | 30 (6.8%) |
| $35,000 to $39,999 | 17 (3.4%) | 14 (3.2%) |
| $40,000 to $44,999 | 56 (11.2%) | 21 (4.8%) |
| $45,000 to $49,999 | 31 (6.2%) | 36 (8.2%) |
| $50,000 to $54,999 | 8 (1.6%) | 20 (4.5%) |
| $55,000 to $64,999 | 83 (16.5%) | 36 (8.2%) |
| $65,000 to $74,999 | 47 (9.4%) | 9 (2.0%) |
| $75,000 to $99,999 | 48 (9.6%) | 19 (4.3%) |
| $100,000+ | 58 (11.6%) | 8 (1.8%) |
| Total | 502 (100.0%) | 441 (100.0%) |
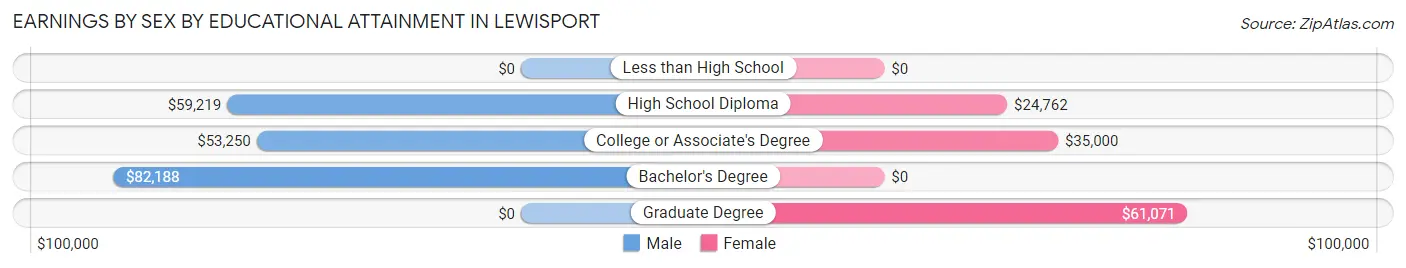
Earnings by Sex by Educational Attainment in Lewisport
Average earnings in Lewisport are $58,125 for men and $31,429 for women, a difference of 45.9%. Men with an educational attainment of bachelor's degree enjoy the highest average annual earnings of $82,188, while those with college or associate's degree education earn the least with $53,250. Women with an educational attainment of graduate degree earn the most with the average annual earnings of $61,071, while those with high school diploma education have the smallest earnings of $24,762.
| Educational Attainment | Male Income | Female Income |
| Less than High School | - | - |
| High School Diploma | $59,219 | $24,762 |
| College or Associate's Degree | $53,250 | $35,000 |
| Bachelor's Degree | $82,188 | $0 |
| Graduate Degree | - | - |
| Total | $58,125 | $31,429 |
Family Income in Lewisport
Family Income Brackets in Lewisport
According to the Lewisport family income data, there are 130 families falling into the $100,000 to $149,999 income range, which is the most common income bracket and makes up 25.8% of all families.
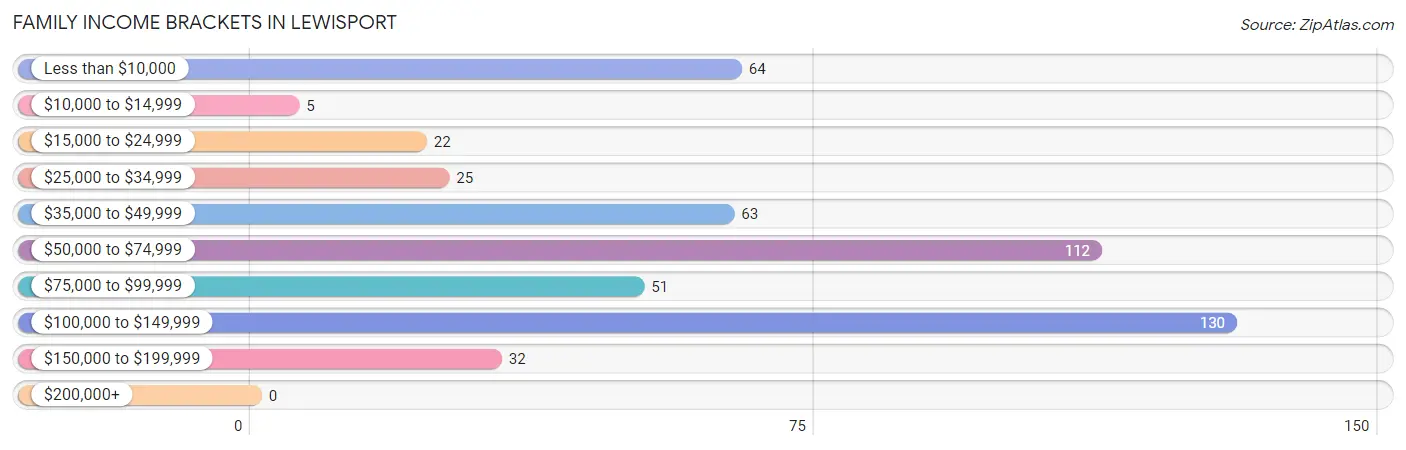
| Income Bracket | # Families | % Families |
| Less than $10,000 | 64 | 12.7% |
| $10,000 to $14,999 | 5 | 1.0% |
| $15,000 to $24,999 | 22 | 4.4% |
| $25,000 to $34,999 | 25 | 5.0% |
| $35,000 to $49,999 | 63 | 12.5% |
| $50,000 to $74,999 | 112 | 22.2% |
| $75,000 to $99,999 | 51 | 10.1% |
| $100,000 to $149,999 | 130 | 25.8% |
| $150,000 to $199,999 | 32 | 6.3% |
| $200,000+ | 0 | 0.0% |
Family Income by Famaliy Size in Lewisport
6-person families (34 | 6.8%) account for the highest median family income in Lewisport with $123,068 per family, while 2-person families (264 | 52.4%) have the highest median income of $31,250 per family member.
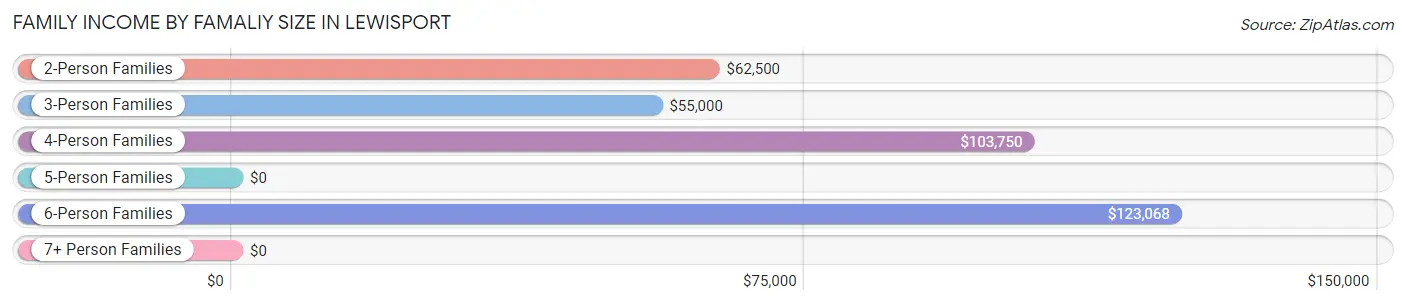
| Income Bracket | # Families | Median Income |
| 2-Person Families | 264 (52.4%) | $62,500 |
| 3-Person Families | 90 (17.9%) | $55,000 |
| 4-Person Families | 96 (19.1%) | $103,750 |
| 5-Person Families | 11 (2.2%) | $0 |
| 6-Person Families | 34 (6.8%) | $123,068 |
| 7+ Person Families | 9 (1.8%) | $0 |
| Total | 504 (100.0%) | $65,000 |
Family Income by Number of Earners in Lewisport
The median family income in Lewisport is $65,000, with families comprising 2 earners (194) having the highest median family income of $110,833, while families with no earners (82) have the lowest median family income of $40,625, accounting for 38.5% and 16.3% of families, respectively.
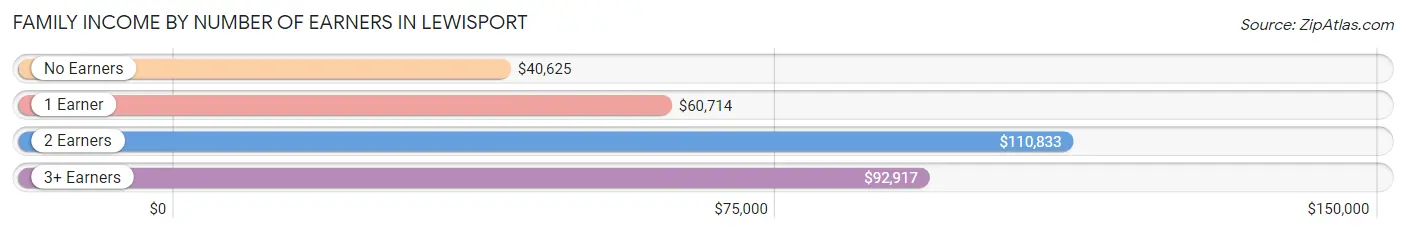
| Number of Earners | # Families | Median Income |
| No Earners | 82 (16.3%) | $40,625 |
| 1 Earner | 200 (39.7%) | $60,714 |
| 2 Earners | 194 (38.5%) | $110,833 |
| 3+ Earners | 28 (5.6%) | $92,917 |
| Total | 504 (100.0%) | $65,000 |
Household Income in Lewisport
Household Income Brackets in Lewisport
With 152 households falling in the category, the $100,000 to $149,999 income range is the most frequent in Lewisport, accounting for 19.0% of all households.
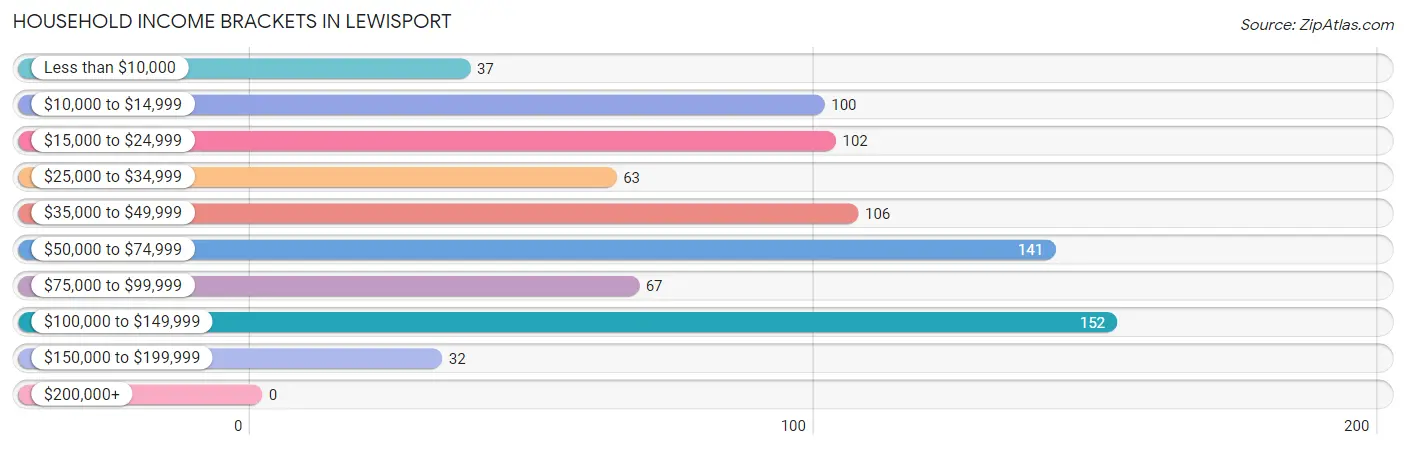
| Income Bracket | # Households | % Households |
| Less than $10,000 | 37 | 4.6% |
| $10,000 to $14,999 | 100 | 12.5% |
| $15,000 to $24,999 | 102 | 12.8% |
| $25,000 to $34,999 | 63 | 7.9% |
| $35,000 to $49,999 | 106 | 13.3% |
| $50,000 to $74,999 | 141 | 17.6% |
| $75,000 to $99,999 | 67 | 8.4% |
| $100,000 to $149,999 | 152 | 19.0% |
| $150,000 to $199,999 | 32 | 4.0% |
| $200,000+ | 0 | 0.0% |
Household Income by Householder Age in Lewisport
The median household income in Lewisport is $49,545, with the highest median household income of $71,563 found in the 25 to 44 years age bracket for the primary householder. A total of 282 households (35.2%) fall into this category. Meanwhile, the 65+ years age bracket for the primary householder has the lowest median household income of $33,162, with 131 households (16.4%) in this group.
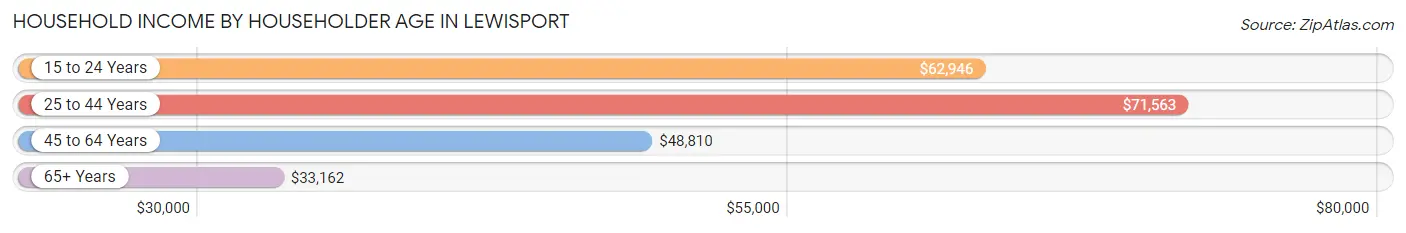
| Income Bracket | # Households | Median Income |
| 15 to 24 Years | 59 (7.4%) | $62,946 |
| 25 to 44 Years | 282 (35.2%) | $71,563 |
| 45 to 64 Years | 328 (41.0%) | $48,810 |
| 65+ Years | 131 (16.4%) | $33,162 |
| Total | 800 (100.0%) | $49,545 |
Poverty in Lewisport
Income Below Poverty by Sex and Age in Lewisport
With 17.9% poverty level for males and 21.8% for females among the residents of Lewisport, 16 and 17 year old males and 5 year old females are the most vulnerable to poverty, with 25 males (54.3%) and 15 females (53.6%) in their respective age groups living below the poverty level.
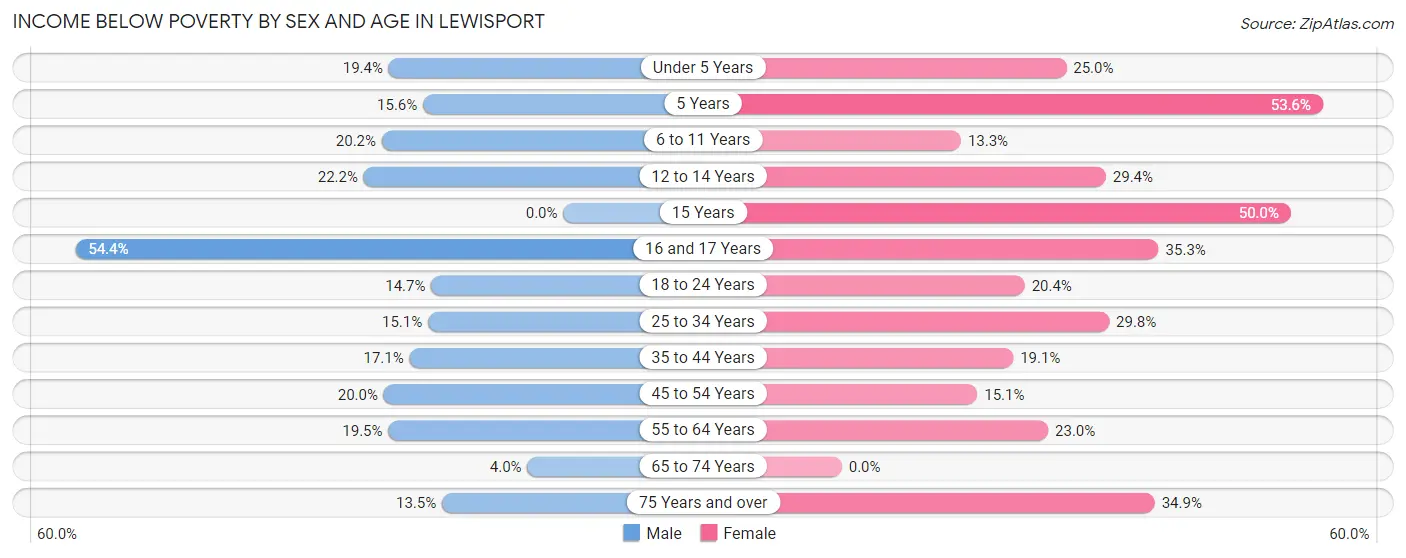
| Age Bracket | Male | Female |
| Under 5 Years | 7 (19.4%) | 18 (25.0%) |
| 5 Years | 5 (15.6%) | 15 (53.6%) |
| 6 to 11 Years | 19 (20.2%) | 15 (13.3%) |
| 12 to 14 Years | 4 (22.2%) | 15 (29.4%) |
| 15 Years | 0 (0.0%) | 6 (50.0%) |
| 16 and 17 Years | 25 (54.3%) | 6 (35.3%) |
| 18 to 24 Years | 15 (14.7%) | 22 (20.4%) |
| 25 to 34 Years | 22 (15.1%) | 39 (29.8%) |
| 35 to 44 Years | 31 (17.1%) | 21 (19.1%) |
| 45 to 54 Years | 13 (20.0%) | 16 (15.1%) |
| 55 to 64 Years | 23 (19.5%) | 37 (23.0%) |
| 65 to 74 Years | 2 (4.0%) | 0 (0.0%) |
| 75 Years and over | 5 (13.5%) | 23 (34.8%) |
| Total | 171 (17.9%) | 233 (21.8%) |
Income Above Poverty by Sex and Age in Lewisport
According to the poverty statistics in Lewisport, males aged 15 years and females aged 65 to 74 years are the age groups that are most secure financially, with 100.0% of males and 100.0% of females in these age groups living above the poverty line.
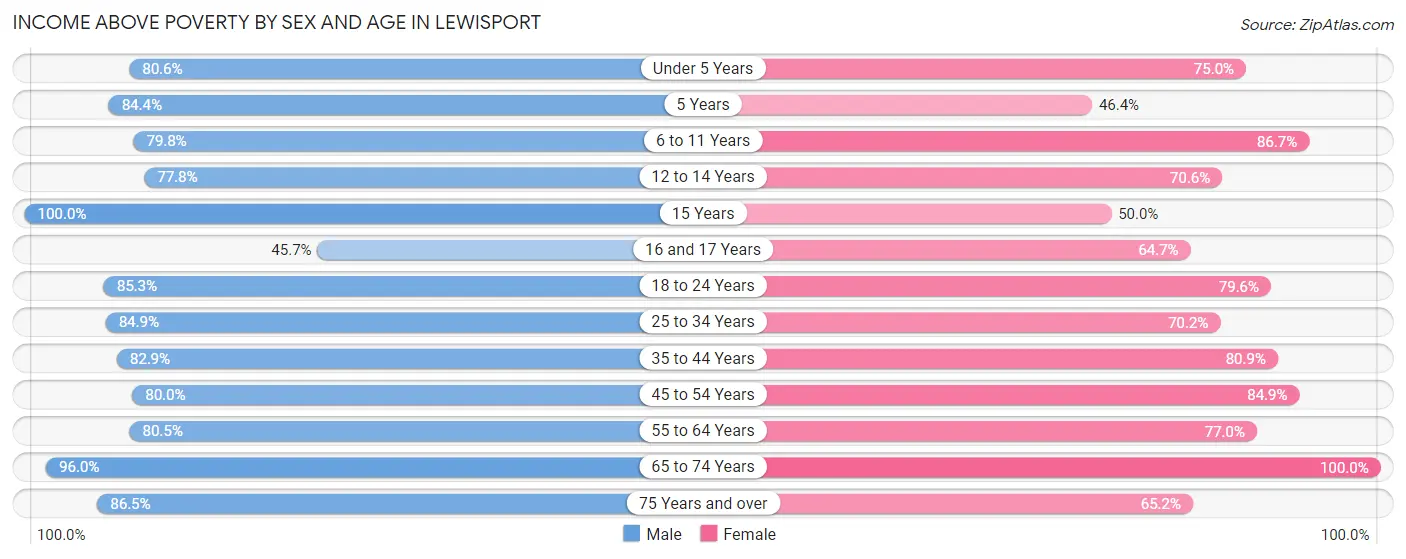
| Age Bracket | Male | Female |
| Under 5 Years | 29 (80.6%) | 54 (75.0%) |
| 5 Years | 27 (84.4%) | 13 (46.4%) |
| 6 to 11 Years | 75 (79.8%) | 98 (86.7%) |
| 12 to 14 Years | 14 (77.8%) | 36 (70.6%) |
| 15 Years | 32 (100.0%) | 6 (50.0%) |
| 16 and 17 Years | 21 (45.7%) | 11 (64.7%) |
| 18 to 24 Years | 87 (85.3%) | 86 (79.6%) |
| 25 to 34 Years | 124 (84.9%) | 92 (70.2%) |
| 35 to 44 Years | 150 (82.9%) | 89 (80.9%) |
| 45 to 54 Years | 52 (80.0%) | 90 (84.9%) |
| 55 to 64 Years | 95 (80.5%) | 124 (77.0%) |
| 65 to 74 Years | 48 (96.0%) | 96 (100.0%) |
| 75 Years and over | 32 (86.5%) | 43 (65.1%) |
| Total | 786 (82.1%) | 838 (78.2%) |
Income Below Poverty Among Married-Couple Families in Lewisport
The poverty statistics for married-couple families in Lewisport show that 3.8% or 13 of the total 346 families live below the poverty line. Families with no children have the highest poverty rate of 4.4%, comprising of 9 families. On the other hand, families with 3 or 4 children have the lowest poverty rate of 0.0%, which includes 0 families.
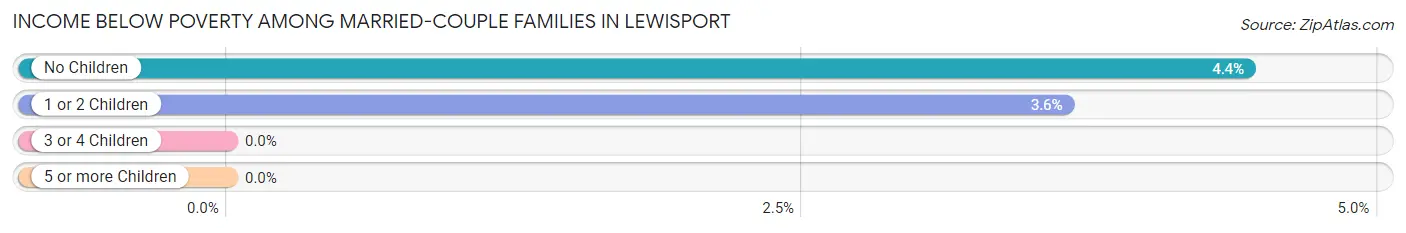
| Children | Above Poverty | Below Poverty |
| No Children | 194 (95.6%) | 9 (4.4%) |
| 1 or 2 Children | 106 (96.4%) | 4 (3.6%) |
| 3 or 4 Children | 33 (100.0%) | 0 (0.0%) |
| 5 or more Children | 0 (0.0%) | 0 (0.0%) |
| Total | 333 (96.2%) | 13 (3.8%) |
Income Below Poverty Among Single-Parent Households in Lewisport
According to the poverty data in Lewisport, 6.9% or 4 single-father households and 64.0% or 64 single-mother households are living below the poverty line. Among single-father households, those with no children have the highest poverty rate, with 4 households (23.5%) experiencing poverty. Likewise, among single-mother households, those with 3 or 4 children have the highest poverty rate, with 19 households (100.0%) falling below the poverty line.
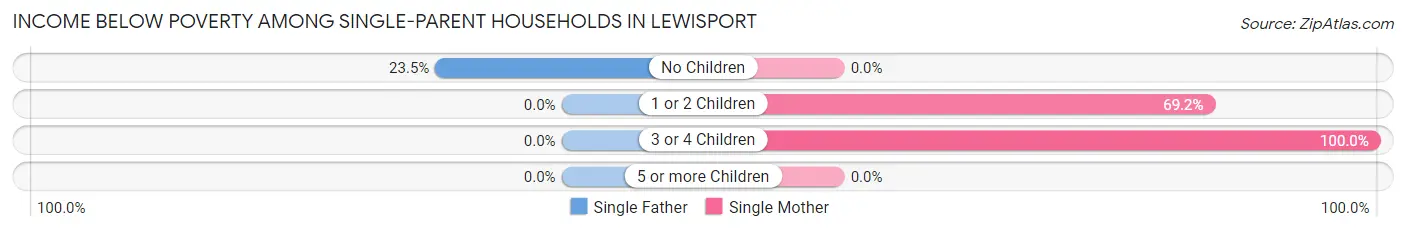
| Children | Single Father | Single Mother |
| No Children | 4 (23.5%) | 0 (0.0%) |
| 1 or 2 Children | 0 (0.0%) | 45 (69.2%) |
| 3 or 4 Children | 0 (0.0%) | 19 (100.0%) |
| 5 or more Children | 0 (0.0%) | 0 (0.0%) |
| Total | 4 (6.9%) | 64 (64.0%) |
Income Below Poverty Among Married-Couple vs Single-Parent Households in Lewisport
The poverty data for Lewisport shows that 13 of the married-couple family households (3.8%) and 68 of the single-parent households (43.0%) are living below the poverty level. Within the married-couple family households, those with no children have the highest poverty rate, with 9 households (4.4%) falling below the poverty line. Among the single-parent households, those with 3 or 4 children have the highest poverty rate, with 19 household (82.6%) living below poverty.
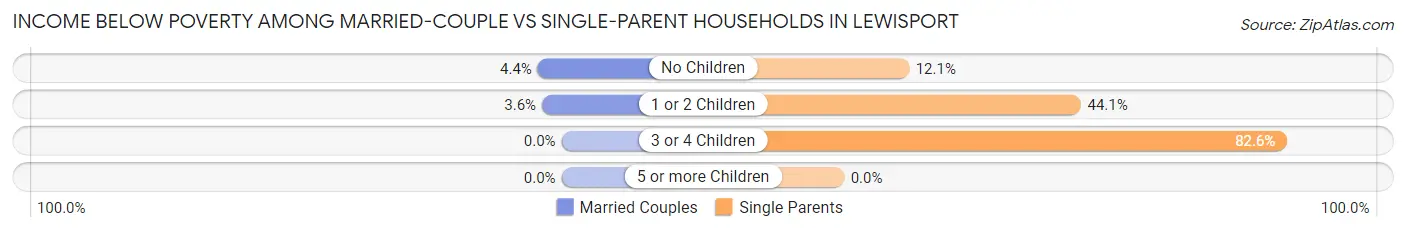
| Children | Married-Couple Families | Single-Parent Households |
| No Children | 9 (4.4%) | 4 (12.1%) |
| 1 or 2 Children | 4 (3.6%) | 45 (44.1%) |
| 3 or 4 Children | 0 (0.0%) | 19 (82.6%) |
| 5 or more Children | 0 (0.0%) | 0 (0.0%) |
| Total | 13 (3.8%) | 68 (43.0%) |
Race in Lewisport
The most populous races in Lewisport are White / Caucasian (1,944 | 89.2%), Some other Race (113 | 5.2%), and Hispanic or Latino (101 | 4.6%).
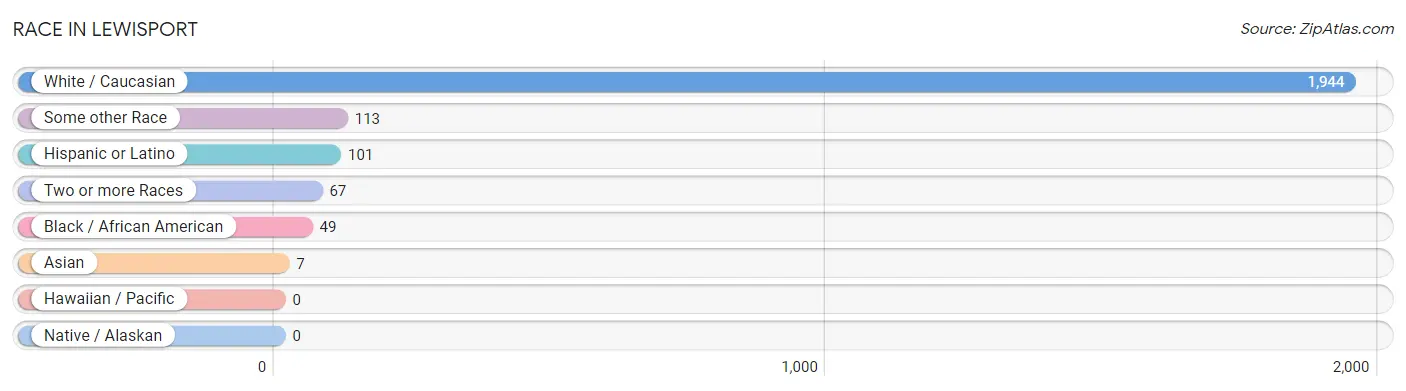
| Race | # Population | % Population |
| Asian | 7 | 0.3% |
| Black / African American | 49 | 2.2% |
| Hawaiian / Pacific | 0 | 0.0% |
| Hispanic or Latino | 101 | 4.6% |
| Native / Alaskan | 0 | 0.0% |
| White / Caucasian | 1,944 | 89.2% |
| Two or more Races | 67 | 3.1% |
| Some other Race | 113 | 5.2% |
| Total | 2,180 | 100.0% |
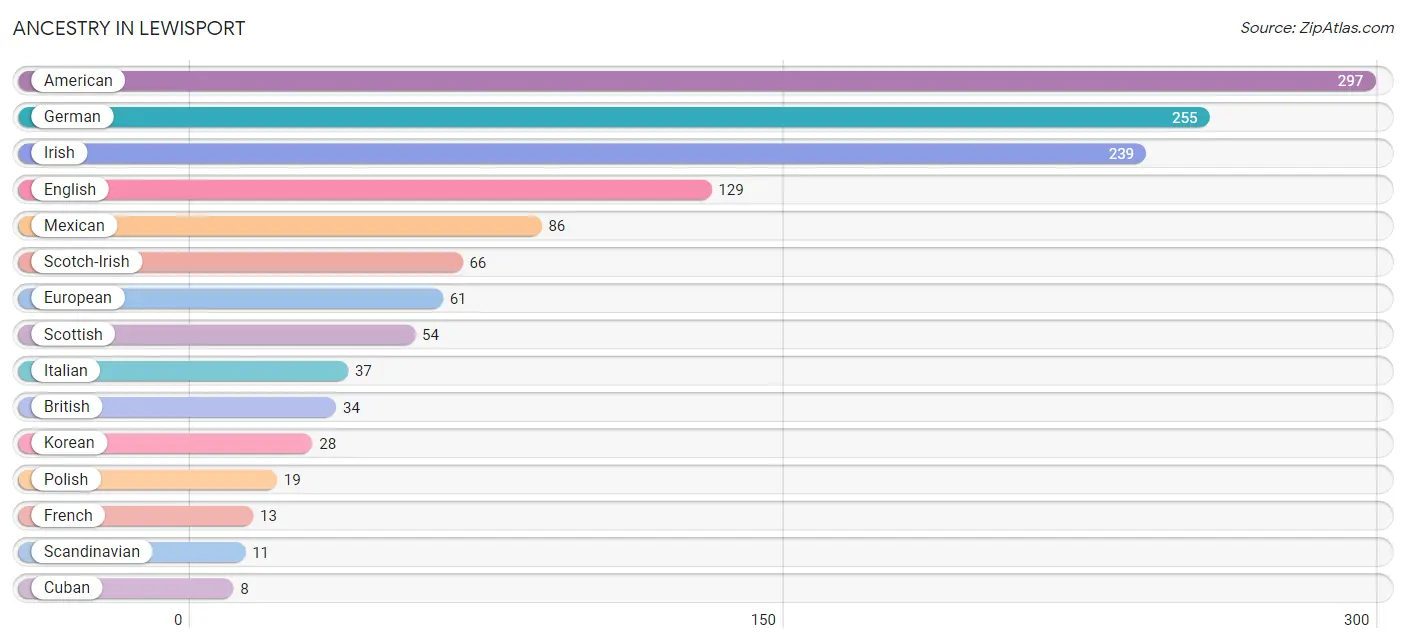
Ancestry in Lewisport
The most populous ancestries reported in Lewisport are American (297 | 13.6%), German (255 | 11.7%), Irish (239 | 11.0%), English (129 | 5.9%), and Mexican (86 | 3.9%), together accounting for 46.1% of all Lewisport residents.
| Ancestry | # Population | % Population |
| African | 4 | 0.2% |
| American | 297 | 13.6% |
| British | 34 | 1.6% |
| Canadian | 7 | 0.3% |
| Cuban | 8 | 0.4% |
| Dutch | 7 | 0.3% |
| English | 129 | 5.9% |
| European | 61 | 2.8% |
| French | 13 | 0.6% |
| German | 255 | 11.7% |
| Irish | 239 | 11.0% |
| Italian | 37 | 1.7% |
| Korean | 28 | 1.3% |
| Mexican | 86 | 3.9% |
| Polish | 19 | 0.9% |
| Puerto Rican | 7 | 0.3% |
| Russian | 4 | 0.2% |
| Scandinavian | 11 | 0.5% |
| Scotch-Irish | 66 | 3.0% |
| Scottish | 54 | 2.5% |
| Subsaharan African | 4 | 0.2% |
| Welsh | 7 | 0.3% | View All 22 Rows |
Immigrants in Lewisport
The most numerous immigrant groups reported in Lewisport came from Europe (27 | 1.2%), Northern Europe (27 | 1.2%), Scotland (19 | 0.9%), Caribbean (8 | 0.4%), and Cuba (8 | 0.4%), together accounting for 4.1% of all Lewisport residents.
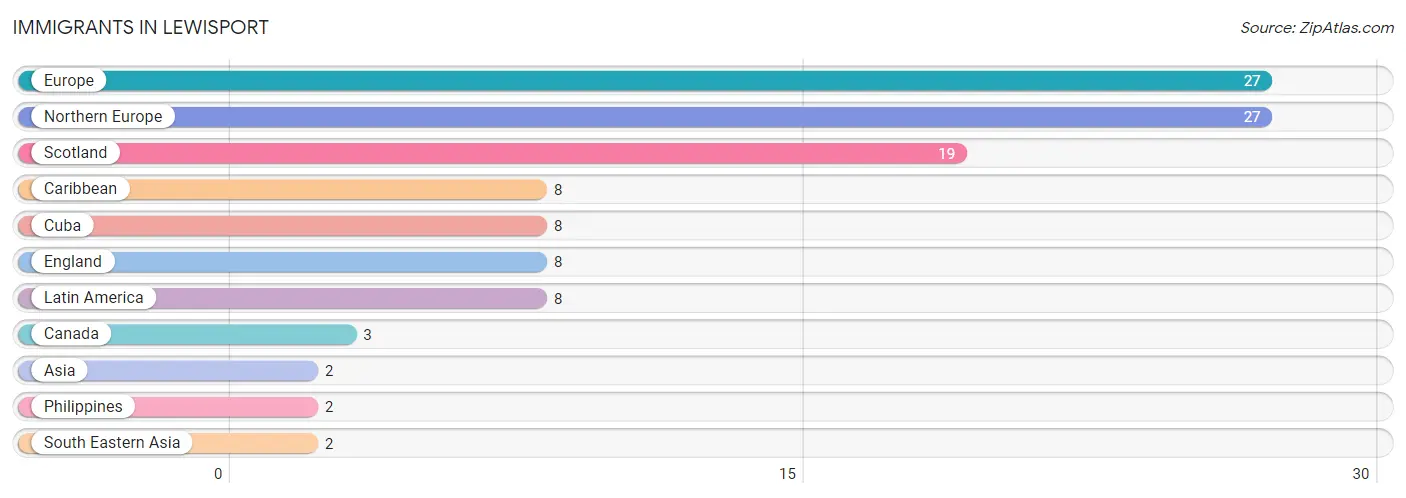
| Immigration Origin | # Population | % Population |
| Asia | 2 | 0.1% |
| Canada | 3 | 0.1% |
| Caribbean | 8 | 0.4% |
| Cuba | 8 | 0.4% |
| England | 8 | 0.4% |
| Europe | 27 | 1.2% |
| Latin America | 8 | 0.4% |
| Northern Europe | 27 | 1.2% |
| Philippines | 2 | 0.1% |
| Scotland | 19 | 0.9% |
| South Eastern Asia | 2 | 0.1% | View All 11 Rows |
Sex and Age in Lewisport
Sex and Age in Lewisport
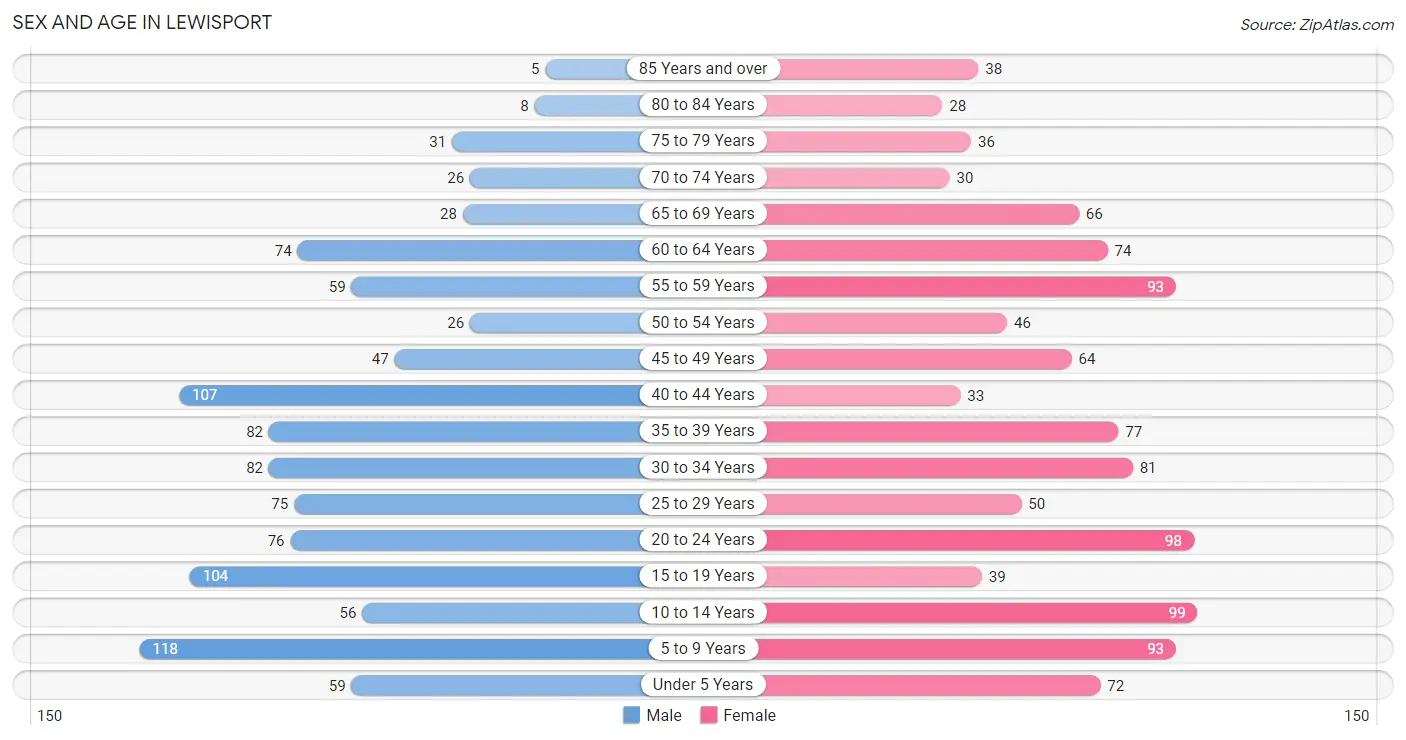
The most populous age groups in Lewisport are 5 to 9 Years (118 | 11.1%) for men and 10 to 14 Years (99 | 8.9%) for women.
| Age Bracket | Male | Female |
| Under 5 Years | 59 (5.6%) | 72 (6.5%) |
| 5 to 9 Years | 118 (11.1%) | 93 (8.3%) |
| 10 to 14 Years | 56 (5.3%) | 99 (8.9%) |
| 15 to 19 Years | 104 (9.8%) | 39 (3.5%) |
| 20 to 24 Years | 76 (7.1%) | 98 (8.8%) |
| 25 to 29 Years | 75 (7.1%) | 50 (4.5%) |
| 30 to 34 Years | 82 (7.7%) | 81 (7.2%) |
| 35 to 39 Years | 82 (7.7%) | 77 (6.9%) |
| 40 to 44 Years | 107 (10.1%) | 33 (2.9%) |
| 45 to 49 Years | 47 (4.4%) | 64 (5.7%) |
| 50 to 54 Years | 26 (2.5%) | 46 (4.1%) |
| 55 to 59 Years | 59 (5.6%) | 93 (8.3%) |
| 60 to 64 Years | 74 (7.0%) | 74 (6.6%) |
| 65 to 69 Years | 28 (2.6%) | 66 (5.9%) |
| 70 to 74 Years | 26 (2.5%) | 30 (2.7%) |
| 75 to 79 Years | 31 (2.9%) | 36 (3.2%) |
| 80 to 84 Years | 8 (0.7%) | 28 (2.5%) |
| 85 Years and over | 5 (0.5%) | 38 (3.4%) |
| Total | 1,063 (100.0%) | 1,117 (100.0%) |
Families and Households in Lewisport
Median Family Size in Lewisport
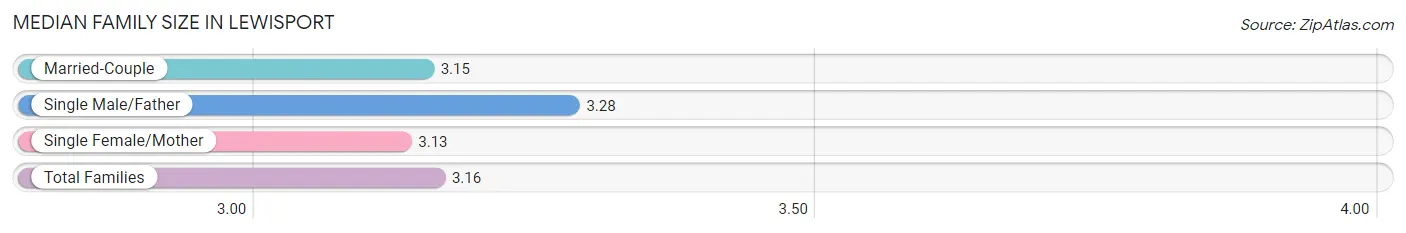
The median family size in Lewisport is 3.16 persons per family, with single male/father families (58 | 11.5%) accounting for the largest median family size of 3.28 persons per family. On the other hand, single female/mother families (100 | 19.8%) represent the smallest median family size with 3.13 persons per family.
| Family Type | # Families | Family Size |
| Married-Couple | 346 (68.6%) | 3.15 |
| Single Male/Father | 58 (11.5%) | 3.28 |
| Single Female/Mother | 100 (19.8%) | 3.13 |
| Total Families | 504 (100.0%) | 3.16 |
Median Household Size in Lewisport
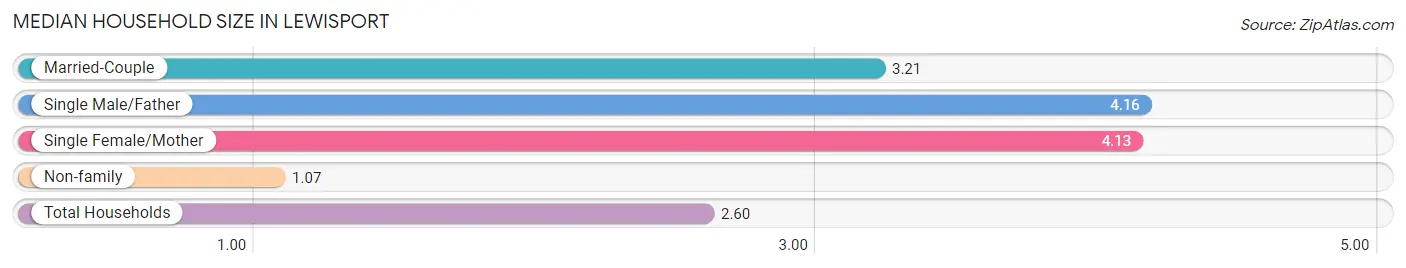
The median household size in Lewisport is 2.60 persons per household, with single male/father households (58 | 7.2%) accounting for the largest median household size of 4.16 persons per household. non-family households (296 | 37.0%) represent the smallest median household size with 1.07 persons per household.
| Household Type | # Households | Household Size |
| Married-Couple | 346 (43.2%) | 3.21 |
| Single Male/Father | 58 (7.2%) | 4.16 |
| Single Female/Mother | 100 (12.5%) | 4.13 |
| Non-family | 296 (37.0%) | 1.07 |
| Total Households | 800 (100.0%) | 2.60 |
Household Size by Marriage Status in Lewisport
Out of a total of 800 households in Lewisport, 504 (63.0%) are family households, while 296 (37.0%) are nonfamily households. The most numerous type of family households are 2-person households, comprising 220, and the most common type of nonfamily households are 1-person households, comprising 272.
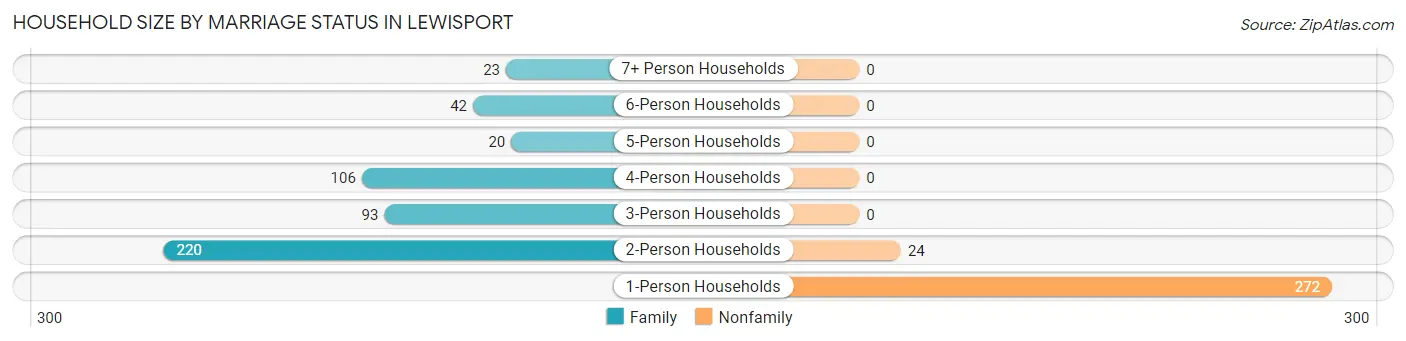
| Household Size | Family Households | Nonfamily Households |
| 1-Person Households | - | 272 (34.0%) |
| 2-Person Households | 220 (27.5%) | 24 (3.0%) |
| 3-Person Households | 93 (11.6%) | 0 (0.0%) |
| 4-Person Households | 106 (13.3%) | 0 (0.0%) |
| 5-Person Households | 20 (2.5%) | 0 (0.0%) |
| 6-Person Households | 42 (5.2%) | 0 (0.0%) |
| 7+ Person Households | 23 (2.9%) | 0 (0.0%) |
| Total | 504 (63.0%) | 296 (37.0%) |
Female Fertility in Lewisport
Fertility by Age in Lewisport
Average fertility rate in Lewisport is 36.0 births per 1,000 women. Women in the age bracket of 20 to 34 years have the highest fertility rate with 70.0 births per 1,000 women. Women in the age bracket of 20 to 34 years acount for 100.0% of all women with births.
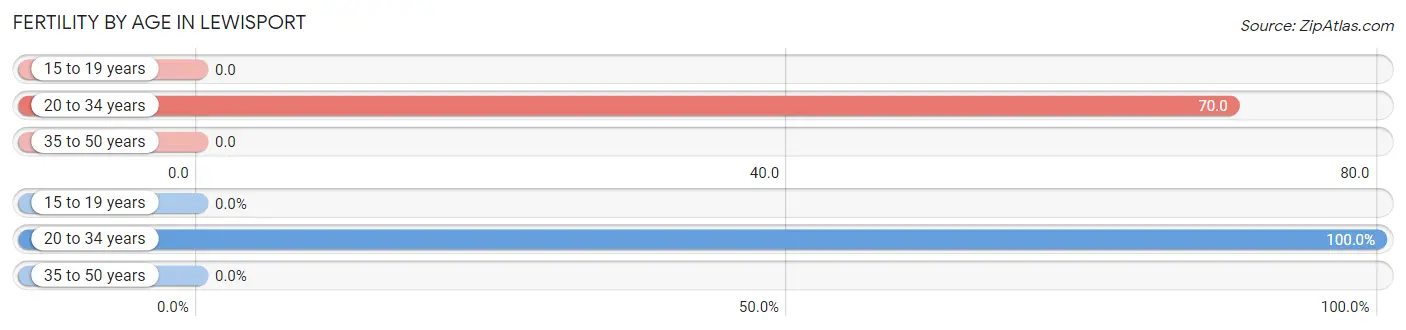
| Age Bracket | Women with Births | Births / 1,000 Women |
| 15 to 19 years | 0 (0.0%) | 0.0 |
| 20 to 34 years | 16 (100.0%) | 70.0 |
| 35 to 50 years | 0 (0.0%) | 0.0 |
| Total | 16 (100.0%) | 36.0 |
Fertility by Age by Marriage Status in Lewisport
87.5% of women with births (16) in Lewisport are married. The highest percentage of unmarried women with births falls into 20 to 34 years age bracket with 12.5% of them unmarried at the time of birth, while the lowest percentage of unmarried women with births belong to 20 to 34 years age bracket with 12.5% of them unmarried.
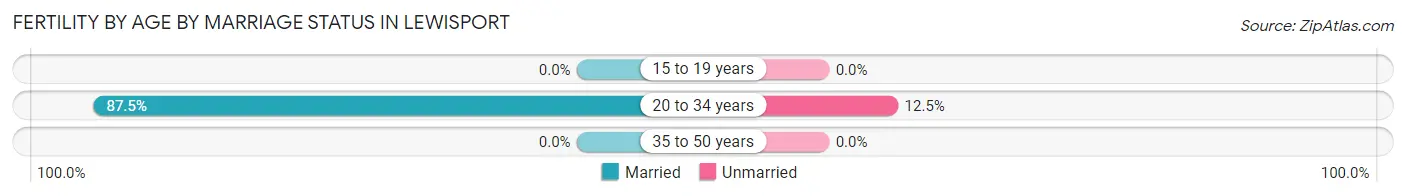
| Age Bracket | Married | Unmarried |
| 15 to 19 years | 0 (0.0%) | 0 (0.0%) |
| 20 to 34 years | 14 (87.5%) | 2 (12.5%) |
| 35 to 50 years | 0 (0.0%) | 0 (0.0%) |
| Total | 14 (87.5%) | 2 (12.5%) |
Fertility by Education in Lewisport
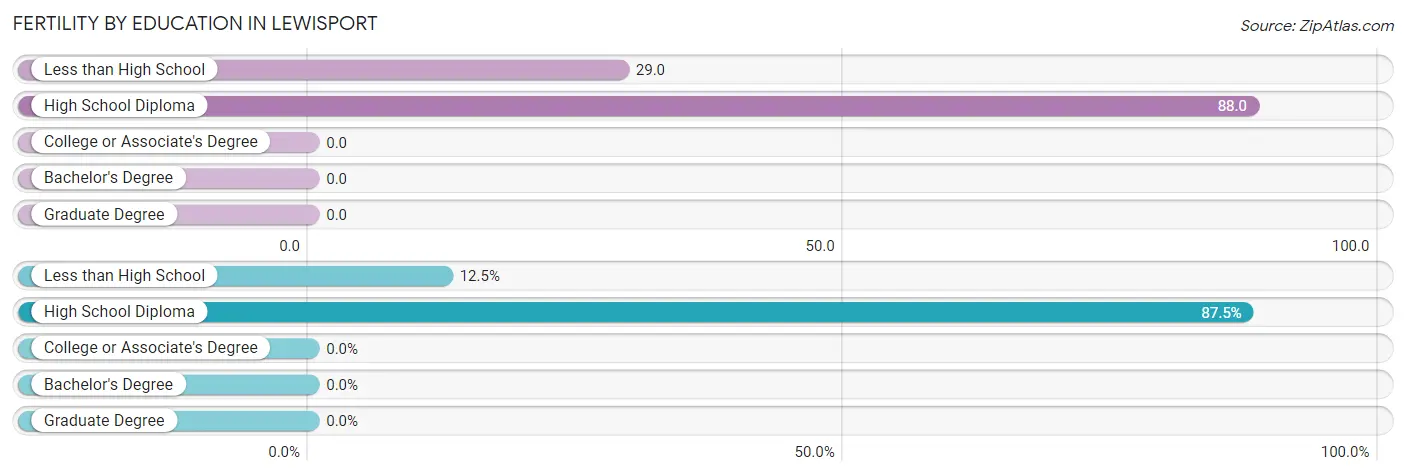
| Educational Attainment | Women with Births | Births / 1,000 Women |
| Less than High School | 2 (12.5%) | 29.0 |
| High School Diploma | 14 (87.5%) | 88.0 |
| College or Associate's Degree | 0 (0.0%) | 0.0 |
| Bachelor's Degree | 0 (0.0%) | 0.0 |
| Graduate Degree | 0 (0.0%) | 0.0 |
| Total | 16 (100.0%) | 36.0 |
Fertility by Education by Marriage Status in Lewisport
12.5% of women with births in Lewisport are unmarried. Women with the educational attainment of high school diploma are most likely to be married with 100.0% of them married at childbirth, while women with the educational attainment of less than high school are least likely to be married with 100.0% of them unmarried at childbirth.
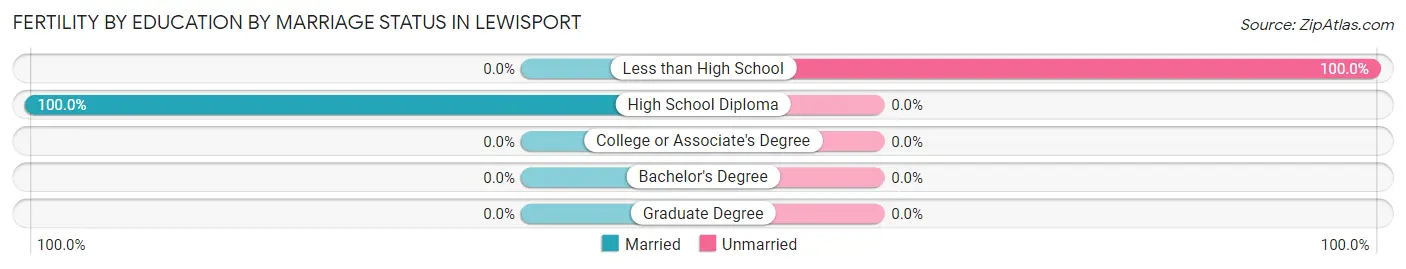
| Educational Attainment | Married | Unmarried |
| Less than High School | 0 (0.0%) | 2 (100.0%) |
| High School Diploma | 14 (100.0%) | 0 (0.0%) |
| College or Associate's Degree | 0 (0.0%) | 0 (0.0%) |
| Bachelor's Degree | 0 (0.0%) | 0 (0.0%) |
| Graduate Degree | 0 (0.0%) | 0 (0.0%) |
| Total | 14 (87.5%) | 2 (12.5%) |
Employment Characteristics in Lewisport
Employment by Class of Employer in Lewisport
Among the 833 employed individuals in Lewisport, private company employees (645 | 77.4%), local government employees (80 | 9.6%), and not-for-profit organizations (42 | 5.0%) make up the most common classes of employment.
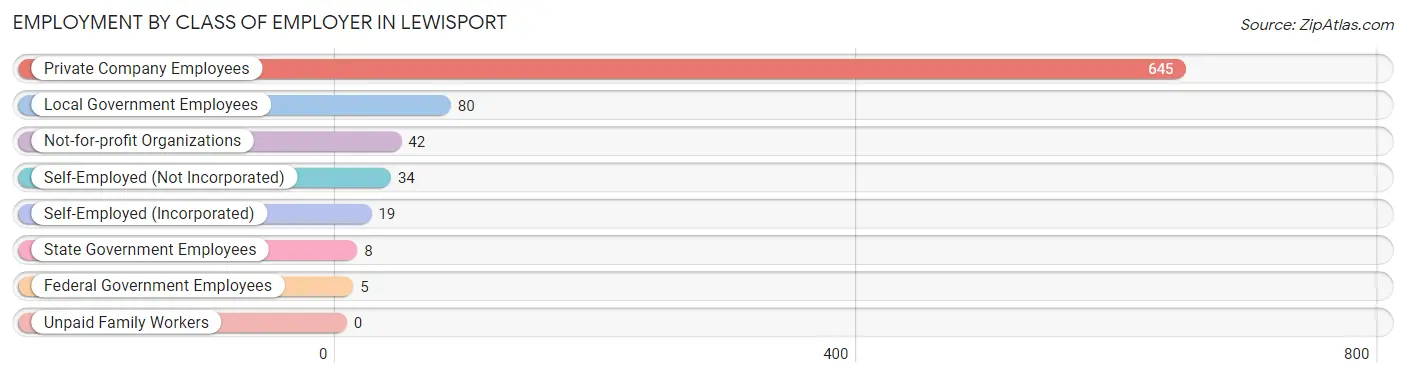
| Employer Class | # Employees | % Employees |
| Private Company Employees | 645 | 77.4% |
| Self-Employed (Incorporated) | 19 | 2.3% |
| Self-Employed (Not Incorporated) | 34 | 4.1% |
| Not-for-profit Organizations | 42 | 5.0% |
| Local Government Employees | 80 | 9.6% |
| State Government Employees | 8 | 1.0% |
| Federal Government Employees | 5 | 0.6% |
| Unpaid Family Workers | 0 | 0.0% |
| Total | 833 | 100.0% |
Employment Status by Age in Lewisport
According to the labor force statistics for Lewisport, out of the total population over 16 years of age (1,639), 54.7% or 897 individuals are in the labor force, with 4.7% or 42 of them unemployed. The age group with the highest labor force participation rate is 25 to 29 years, with 85.6% or 107 individuals in the labor force. Within the labor force, the 16 to 19 years age range has the highest percentage of unemployed individuals, with 42.9% or 18 of them being unemployed.
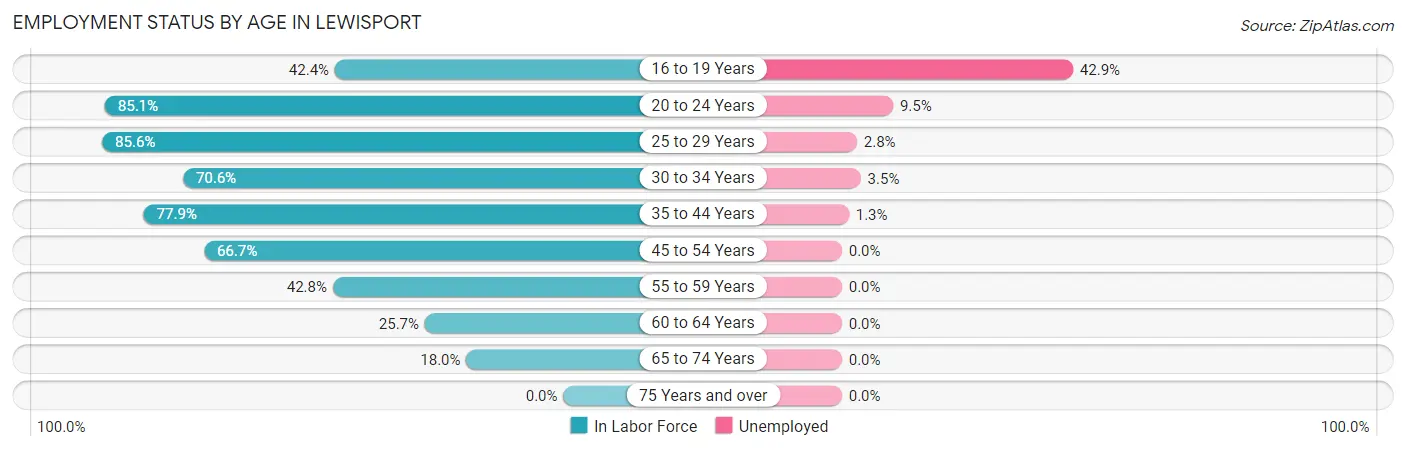
| Age Bracket | In Labor Force | Unemployed |
| 16 to 19 Years | 42 (42.4%) | 18 (42.9%) |
| 20 to 24 Years | 148 (85.1%) | 14 (9.5%) |
| 25 to 29 Years | 107 (85.6%) | 3 (2.8%) |
| 30 to 34 Years | 115 (70.6%) | 4 (3.5%) |
| 35 to 44 Years | 233 (77.9%) | 3 (1.3%) |
| 45 to 54 Years | 122 (66.7%) | 0 (0.0%) |
| 55 to 59 Years | 65 (42.8%) | 0 (0.0%) |
| 60 to 64 Years | 38 (25.7%) | 0 (0.0%) |
| 65 to 74 Years | 27 (18.0%) | 0 (0.0%) |
| 75 Years and over | 0 (0.0%) | 0 (0.0%) |
| Total | 897 (54.7%) | 42 (4.7%) |
Employment Status by Educational Attainment in Lewisport
According to labor force statistics for Lewisport, 63.6% of individuals (681) out of the total population between 25 and 64 years of age (1,070) are in the labor force, with 1.5% or 10 of them being unemployed. The group with the highest labor force participation rate are those with the educational attainment of bachelor's degree or higher, with 88.7% or 181 individuals in the labor force. Within the labor force, individuals with high school diploma education have the highest percentage of unemployment, with 3.0% or 7 of them being unemployed.
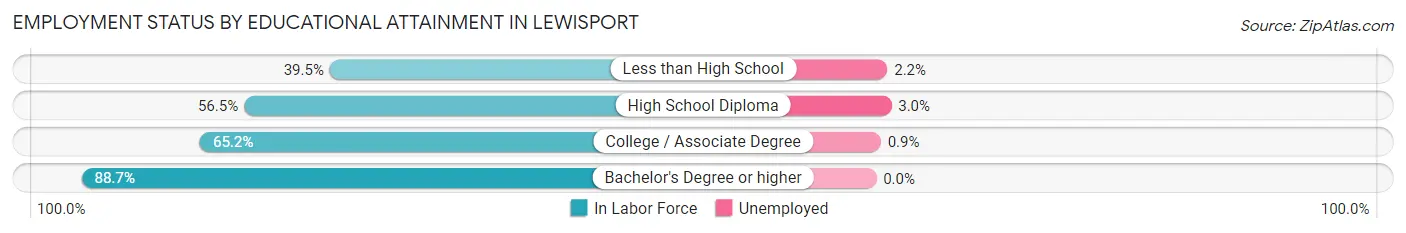
| Educational Attainment | In Labor Force | Unemployed |
| Less than High School | 45 (39.5%) | 3 (2.2%) |
| High School Diploma | 235 (56.5%) | 12 (3.0%) |
| College / Associate Degree | 219 (65.2%) | 3 (0.9%) |
| Bachelor's Degree or higher | 181 (88.7%) | 0 (0.0%) |
| Total | 681 (63.6%) | 16 (1.5%) |
Employment Occupations by Sex in Lewisport
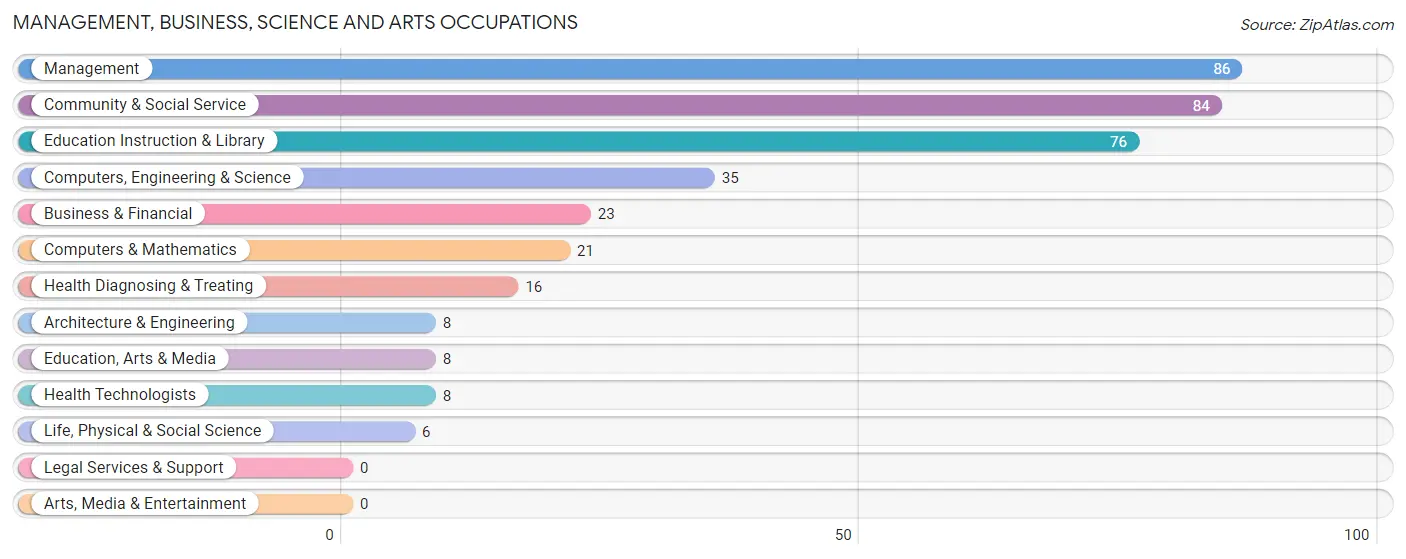
Management, Business, Science and Arts Occupations
The most common Management, Business, Science and Arts occupations in Lewisport are Management (86 | 10.1%), Community & Social Service (84 | 9.8%), Education Instruction & Library (76 | 8.9%), Computers, Engineering & Science (35 | 4.1%), and Business & Financial (23 | 2.7%).
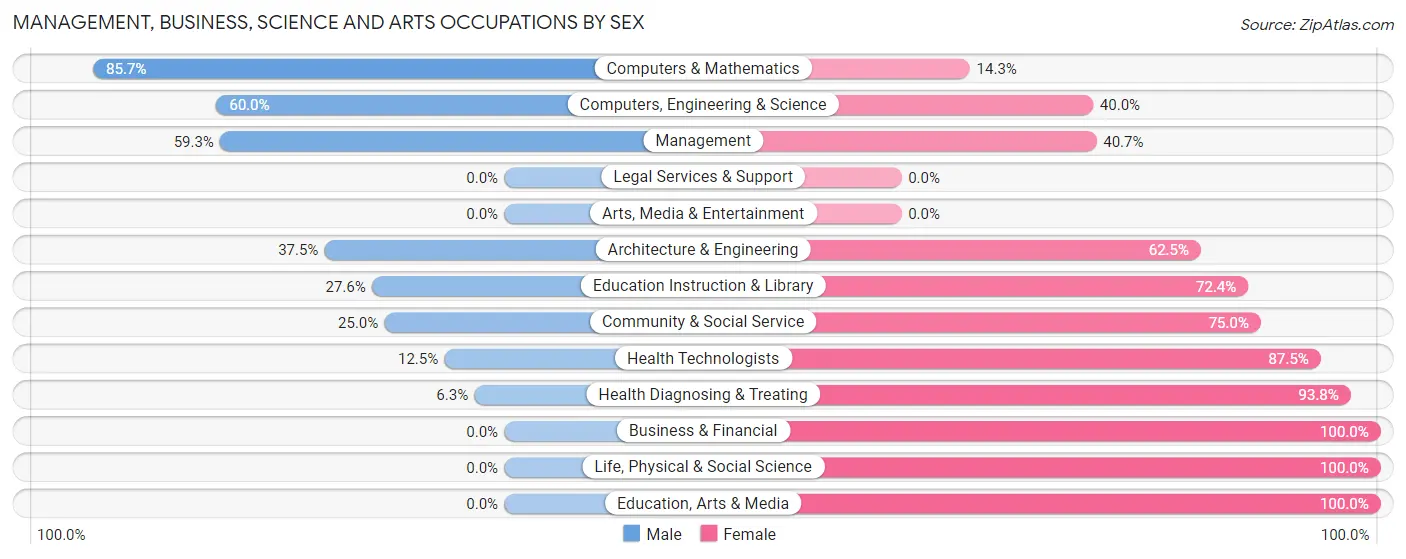
Management, Business, Science and Arts Occupations by Sex
Within the Management, Business, Science and Arts occupations in Lewisport, the most male-oriented occupations are Computers & Mathematics (85.7%), Computers, Engineering & Science (60.0%), and Management (59.3%), while the most female-oriented occupations are Business & Financial (100.0%), Life, Physical & Social Science (100.0%), and Education, Arts & Media (100.0%).
| Occupation | Male | Female |
| Management | 51 (59.3%) | 35 (40.7%) |
| Business & Financial | 0 (0.0%) | 23 (100.0%) |
| Computers, Engineering & Science | 21 (60.0%) | 14 (40.0%) |
| Computers & Mathematics | 18 (85.7%) | 3 (14.3%) |
| Architecture & Engineering | 3 (37.5%) | 5 (62.5%) |
| Life, Physical & Social Science | 0 (0.0%) | 6 (100.0%) |
| Community & Social Service | 21 (25.0%) | 63 (75.0%) |
| Education, Arts & Media | 0 (0.0%) | 8 (100.0%) |
| Legal Services & Support | 0 (0.0%) | 0 (0.0%) |
| Education Instruction & Library | 21 (27.6%) | 55 (72.4%) |
| Arts, Media & Entertainment | 0 (0.0%) | 0 (0.0%) |
| Health Diagnosing & Treating | 1 (6.2%) | 15 (93.8%) |
| Health Technologists | 1 (12.5%) | 7 (87.5%) |
| Total (Category) | 94 (38.5%) | 150 (61.5%) |
| Total (Overall) | 454 (53.1%) | 401 (46.9%) |
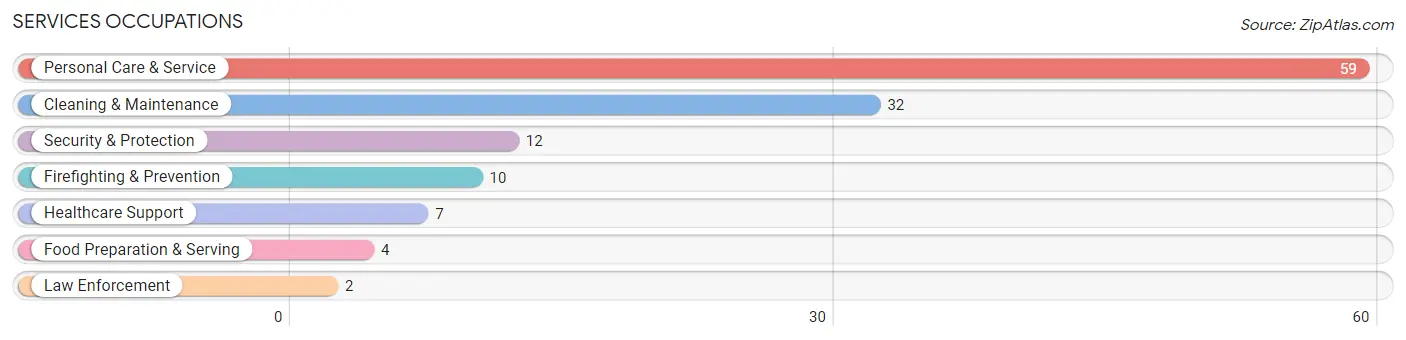
Services Occupations
The most common Services occupations in Lewisport are Personal Care & Service (59 | 6.9%), Cleaning & Maintenance (32 | 3.7%), Security & Protection (12 | 1.4%), Firefighting & Prevention (10 | 1.2%), and Healthcare Support (7 | 0.8%).
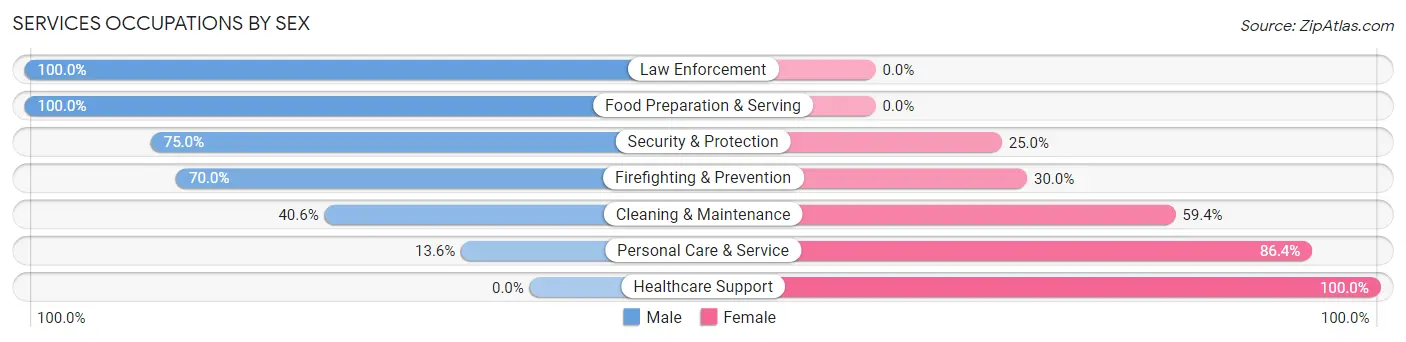
Services Occupations by Sex
Within the Services occupations in Lewisport, the most male-oriented occupations are Law Enforcement (100.0%), Food Preparation & Serving (100.0%), and Security & Protection (75.0%), while the most female-oriented occupations are Healthcare Support (100.0%), Personal Care & Service (86.4%), and Cleaning & Maintenance (59.4%).
| Occupation | Male | Female |
| Healthcare Support | 0 (0.0%) | 7 (100.0%) |
| Security & Protection | 9 (75.0%) | 3 (25.0%) |
| Firefighting & Prevention | 7 (70.0%) | 3 (30.0%) |
| Law Enforcement | 2 (100.0%) | 0 (0.0%) |
| Food Preparation & Serving | 4 (100.0%) | 0 (0.0%) |
| Cleaning & Maintenance | 13 (40.6%) | 19 (59.4%) |
| Personal Care & Service | 8 (13.6%) | 51 (86.4%) |
| Total (Category) | 34 (29.8%) | 80 (70.2%) |
| Total (Overall) | 454 (53.1%) | 401 (46.9%) |
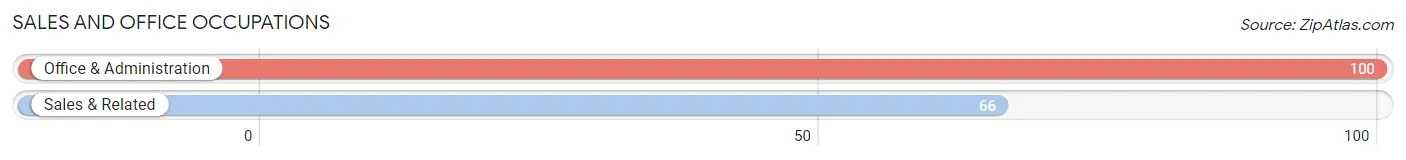
Sales and Office Occupations
The most common Sales and Office occupations in Lewisport are Office & Administration (100 | 11.7%), and Sales & Related (66 | 7.7%).
Sales and Office Occupations by Sex
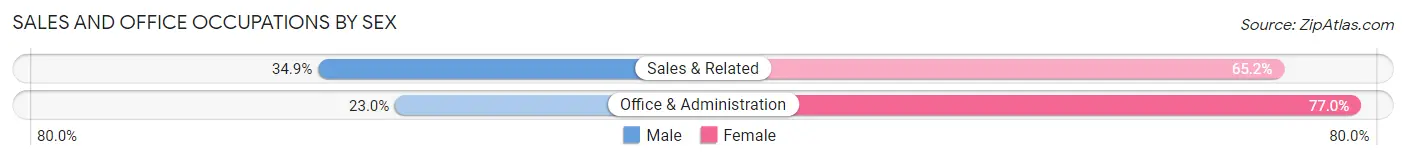
| Occupation | Male | Female |
| Sales & Related | 23 (34.8%) | 43 (65.1%) |
| Office & Administration | 23 (23.0%) | 77 (77.0%) |
| Total (Category) | 46 (27.7%) | 120 (72.3%) |
| Total (Overall) | 454 (53.1%) | 401 (46.9%) |
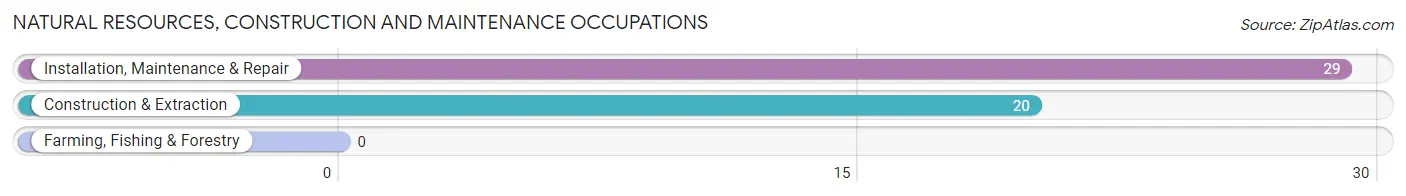
Natural Resources, Construction and Maintenance Occupations
The most common Natural Resources, Construction and Maintenance occupations in Lewisport are Installation, Maintenance & Repair (29 | 3.4%), and Construction & Extraction (20 | 2.3%).
Natural Resources, Construction and Maintenance Occupations by Sex
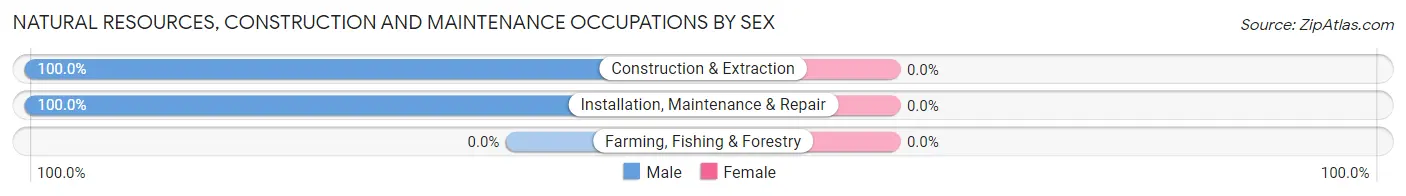
| Occupation | Male | Female |
| Farming, Fishing & Forestry | 0 (0.0%) | 0 (0.0%) |
| Construction & Extraction | 20 (100.0%) | 0 (0.0%) |
| Installation, Maintenance & Repair | 29 (100.0%) | 0 (0.0%) |
| Total (Category) | 49 (100.0%) | 0 (0.0%) |
| Total (Overall) | 454 (53.1%) | 401 (46.9%) |
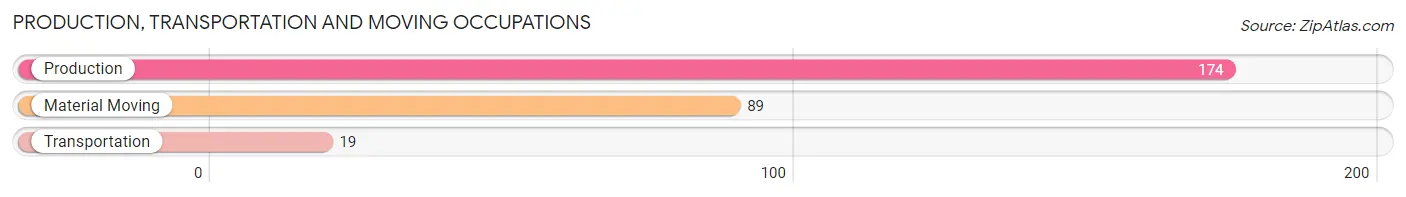
Production, Transportation and Moving Occupations
The most common Production, Transportation and Moving occupations in Lewisport are Production (174 | 20.3%), Material Moving (89 | 10.4%), and Transportation (19 | 2.2%).
Production, Transportation and Moving Occupations by Sex
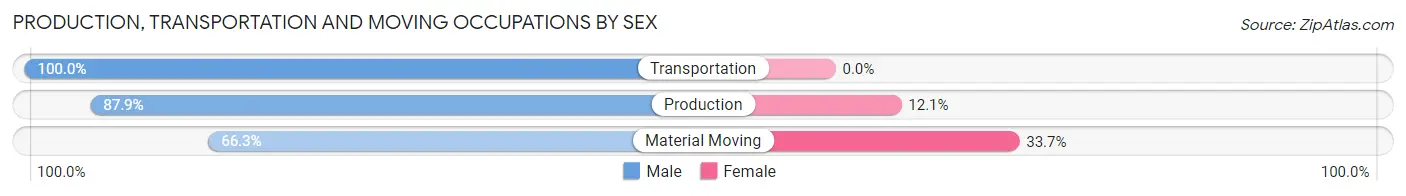
| Occupation | Male | Female |
| Production | 153 (87.9%) | 21 (12.1%) |
| Transportation | 19 (100.0%) | 0 (0.0%) |
| Material Moving | 59 (66.3%) | 30 (33.7%) |
| Total (Category) | 231 (81.9%) | 51 (18.1%) |
| Total (Overall) | 454 (53.1%) | 401 (46.9%) |
Employment Industries by Sex in Lewisport
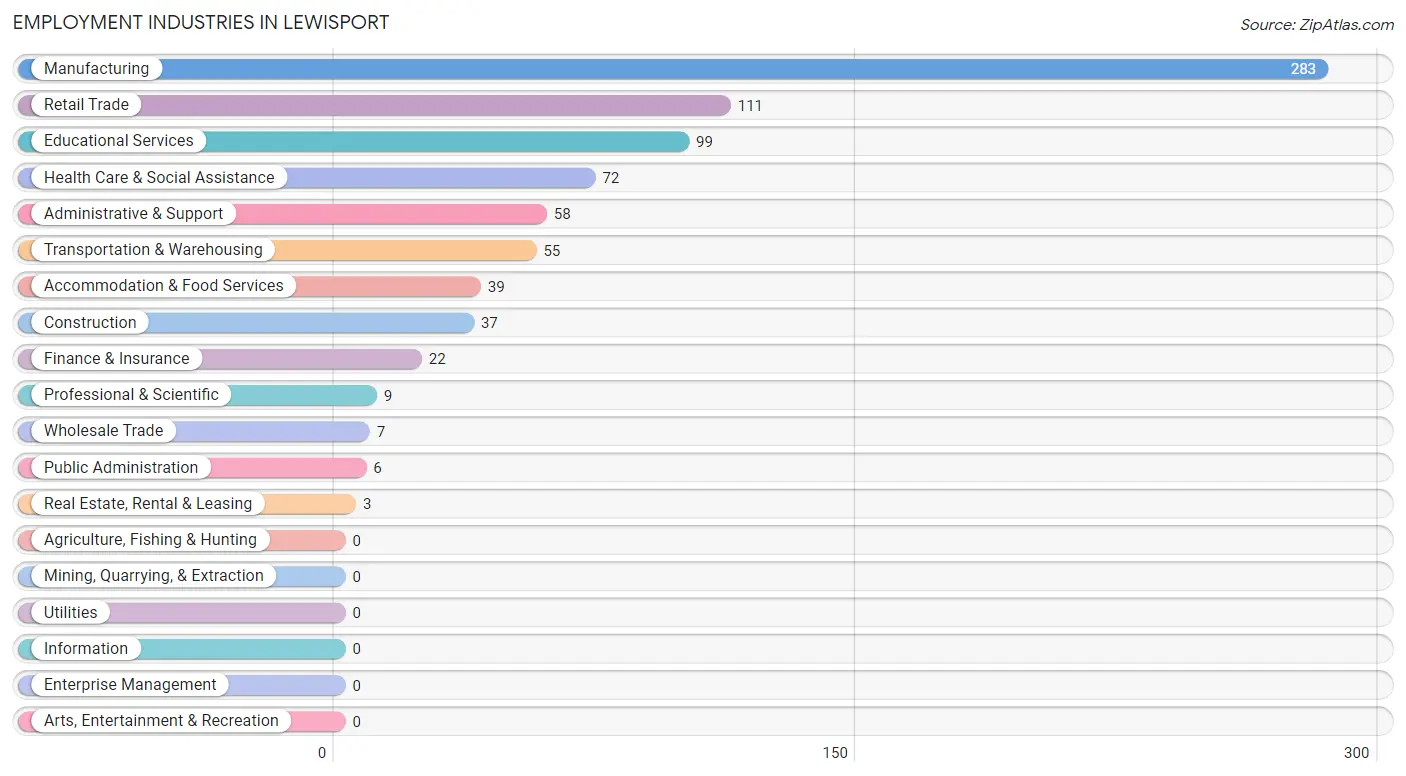
Employment Industries in Lewisport
The major employment industries in Lewisport include Manufacturing (283 | 33.1%), Retail Trade (111 | 13.0%), Educational Services (99 | 11.6%), Health Care & Social Assistance (72 | 8.4%), and Administrative & Support (58 | 6.8%).
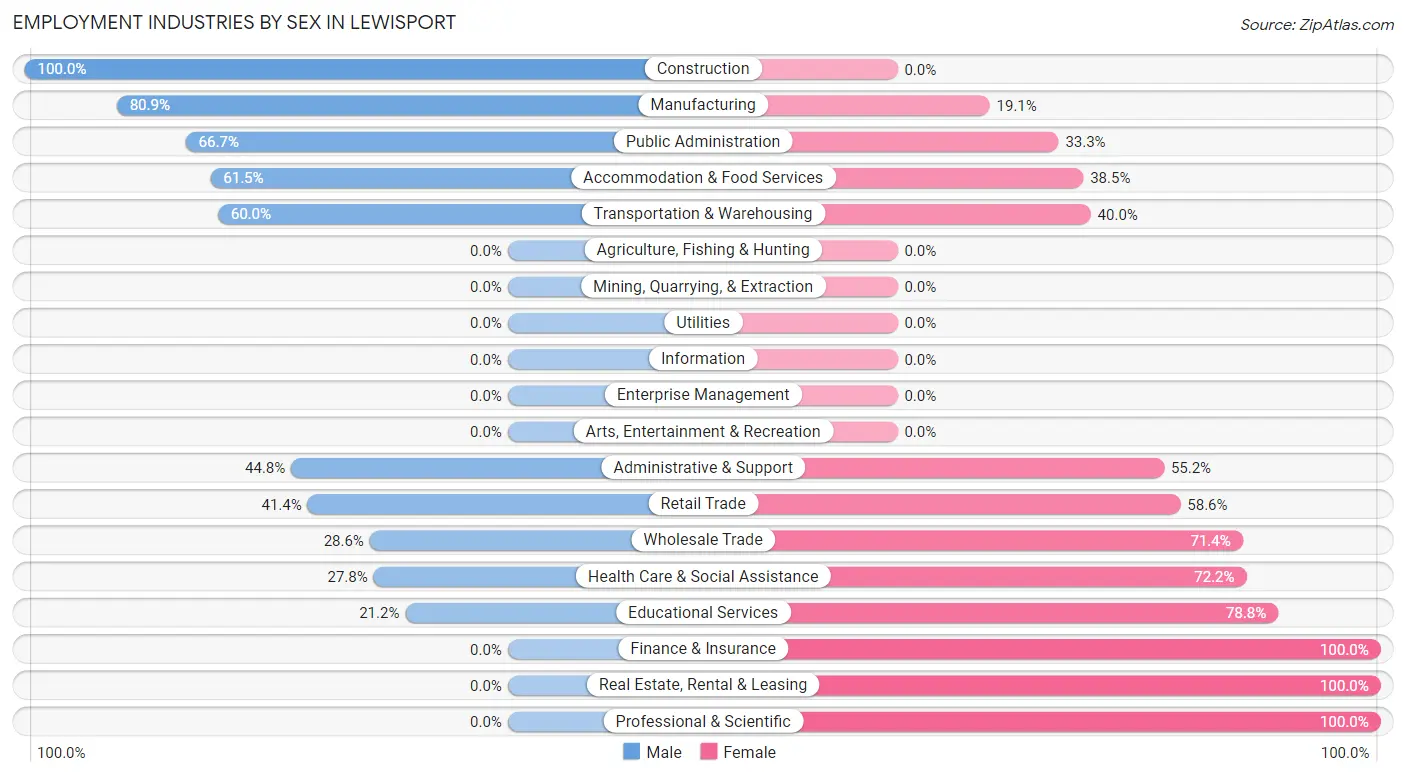
Employment Industries by Sex in Lewisport
The Lewisport industries that see more men than women are Construction (100.0%), Manufacturing (80.9%), and Public Administration (66.7%), whereas the industries that tend to have a higher number of women are Finance & Insurance (100.0%), Real Estate, Rental & Leasing (100.0%), and Professional & Scientific (100.0%).
| Industry | Male | Female |
| Agriculture, Fishing & Hunting | 0 (0.0%) | 0 (0.0%) |
| Mining, Quarrying, & Extraction | 0 (0.0%) | 0 (0.0%) |
| Construction | 37 (100.0%) | 0 (0.0%) |
| Manufacturing | 229 (80.9%) | 54 (19.1%) |
| Wholesale Trade | 2 (28.6%) | 5 (71.4%) |
| Retail Trade | 46 (41.4%) | 65 (58.6%) |
| Transportation & Warehousing | 33 (60.0%) | 22 (40.0%) |
| Utilities | 0 (0.0%) | 0 (0.0%) |
| Information | 0 (0.0%) | 0 (0.0%) |
| Finance & Insurance | 0 (0.0%) | 22 (100.0%) |
| Real Estate, Rental & Leasing | 0 (0.0%) | 3 (100.0%) |
| Professional & Scientific | 0 (0.0%) | 9 (100.0%) |
| Enterprise Management | 0 (0.0%) | 0 (0.0%) |
| Administrative & Support | 26 (44.8%) | 32 (55.2%) |
| Educational Services | 21 (21.2%) | 78 (78.8%) |
| Health Care & Social Assistance | 20 (27.8%) | 52 (72.2%) |
| Arts, Entertainment & Recreation | 0 (0.0%) | 0 (0.0%) |
| Accommodation & Food Services | 24 (61.5%) | 15 (38.5%) |
| Public Administration | 4 (66.7%) | 2 (33.3%) |
| Total | 454 (53.1%) | 401 (46.9%) |
Education in Lewisport
School Enrollment in Lewisport
The most common levels of schooling among the 580 students in Lewisport are elementary school (123 | 21.2%), middle school (121 | 20.9%), and high school (117 | 20.2%).
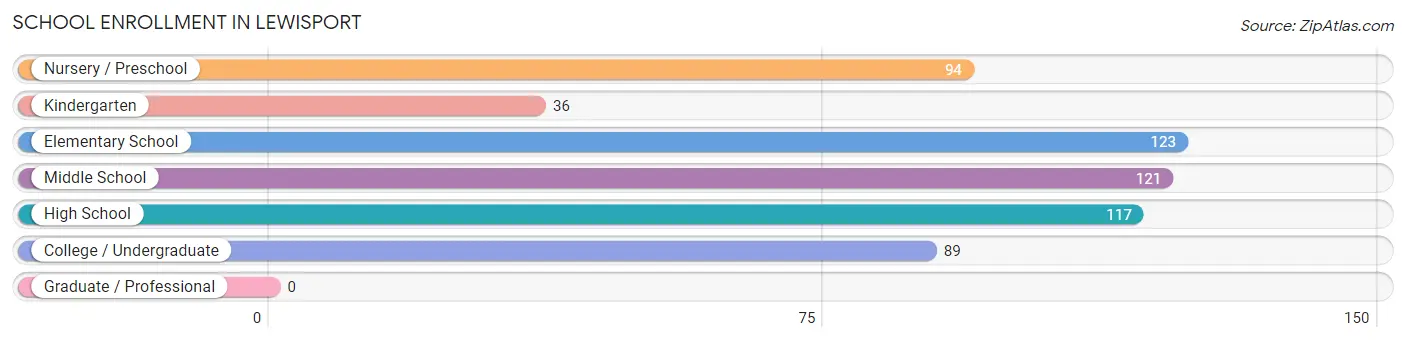
| School Level | # Students | % Students |
| Nursery / Preschool | 94 | 16.2% |
| Kindergarten | 36 | 6.2% |
| Elementary School | 123 | 21.2% |
| Middle School | 121 | 20.9% |
| High School | 117 | 20.2% |
| College / Undergraduate | 89 | 15.3% |
| Graduate / Professional | 0 | 0.0% |
| Total | 580 | 100.0% |
School Enrollment by Age by Funding Source in Lewisport
Out of a total of 580 students who are enrolled in schools in Lewisport, 25 (4.3%) attend a private institution, while the remaining 555 (95.7%) are enrolled in public schools. The age group of 20 to 24 year olds has the highest likelihood of being enrolled in private schools, with 14 (35.0% in the age bracket) enrolled. Conversely, the age group of 3 to 4 year olds has the lowest likelihood of being enrolled in a private school, with 58 (100.0% in the age bracket) attending a public institution.
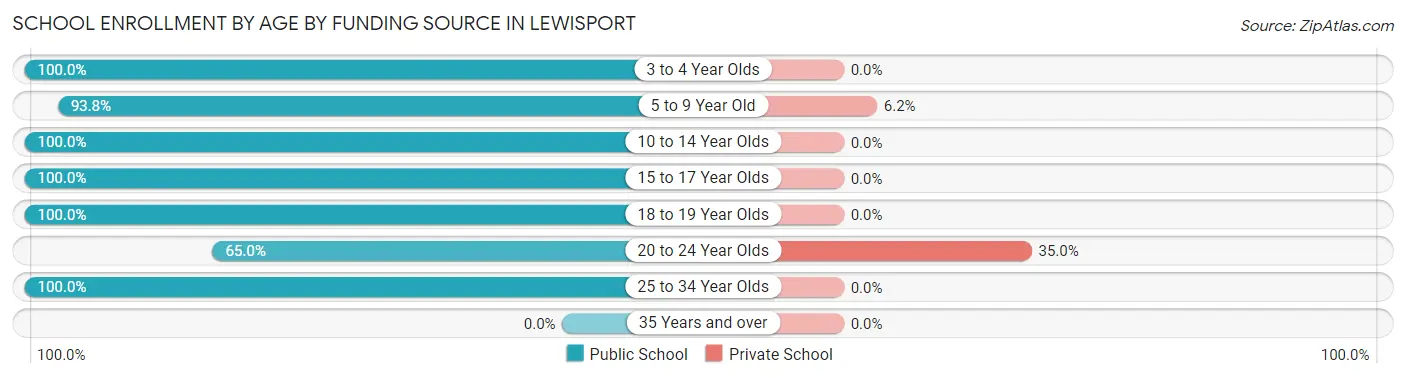
| Age Bracket | Public School | Private School |
| 3 to 4 Year Olds | 58 (100.0%) | 0 (0.0%) |
| 5 to 9 Year Old | 167 (93.8%) | 11 (6.2%) |
| 10 to 14 Year Olds | 138 (100.0%) | 0 (0.0%) |
| 15 to 17 Year Olds | 107 (100.0%) | 0 (0.0%) |
| 18 to 19 Year Olds | 33 (100.0%) | 0 (0.0%) |
| 20 to 24 Year Olds | 26 (65.0%) | 14 (35.0%) |
| 25 to 34 Year Olds | 26 (100.0%) | 0 (0.0%) |
| 35 Years and over | 0 (0.0%) | 0 (0.0%) |
| Total | 555 (95.7%) | 25 (4.3%) |
Educational Attainment by Field of Study in Lewisport
Education (91 | 29.3%), business (43 | 13.8%), psychology (33 | 10.6%), bio, nature & agricultural (25 | 8.0%), and physical & health sciences (25 | 8.0%) are the most common fields of study among 311 individuals in Lewisport who have obtained a bachelor's degree or higher.
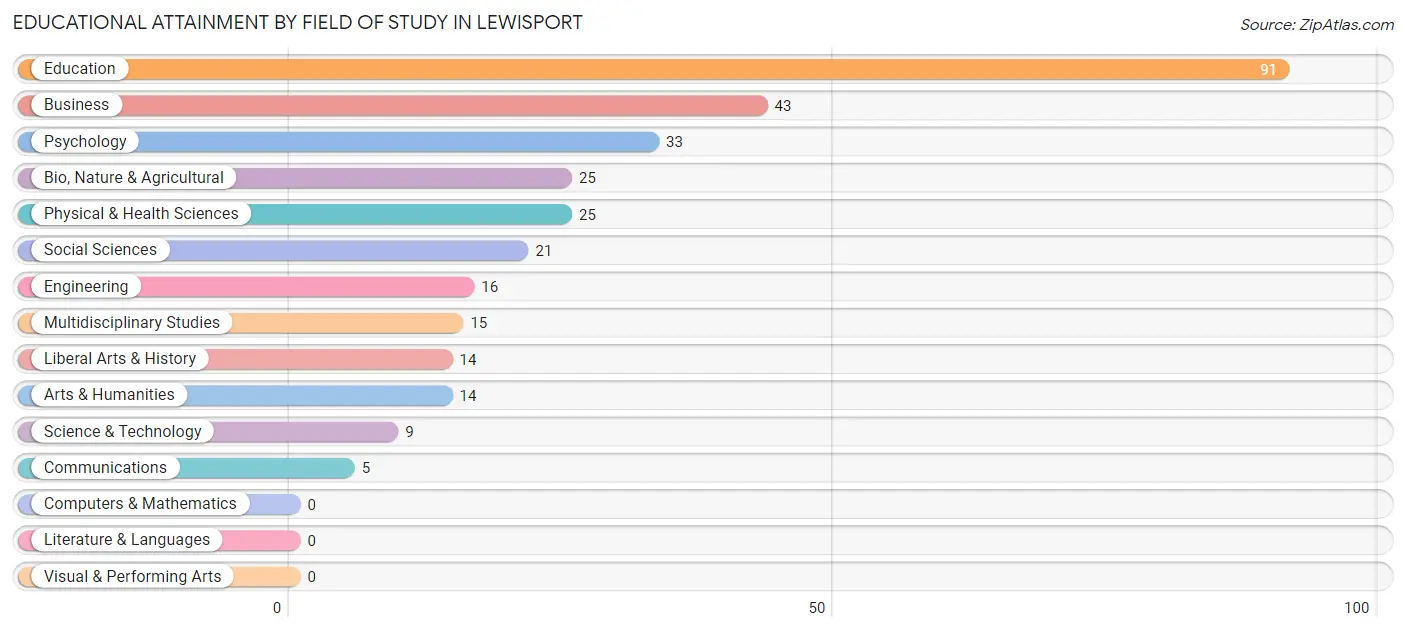
| Field of Study | # Graduates | % Graduates |
| Computers & Mathematics | 0 | 0.0% |
| Bio, Nature & Agricultural | 25 | 8.0% |
| Physical & Health Sciences | 25 | 8.0% |
| Psychology | 33 | 10.6% |
| Social Sciences | 21 | 6.8% |
| Engineering | 16 | 5.1% |
| Multidisciplinary Studies | 15 | 4.8% |
| Science & Technology | 9 | 2.9% |
| Business | 43 | 13.8% |
| Education | 91 | 29.3% |
| Literature & Languages | 0 | 0.0% |
| Liberal Arts & History | 14 | 4.5% |
| Visual & Performing Arts | 0 | 0.0% |
| Communications | 5 | 1.6% |
| Arts & Humanities | 14 | 4.5% |
| Total | 311 | 100.0% |
Transportation & Commute in Lewisport
Vehicle Availability by Sex in Lewisport
The most prevalent vehicle ownership categories in Lewisport are males with 2 vehicles (214, accounting for 49.2%) and females with 2 vehicles (153, making up 53.8%).
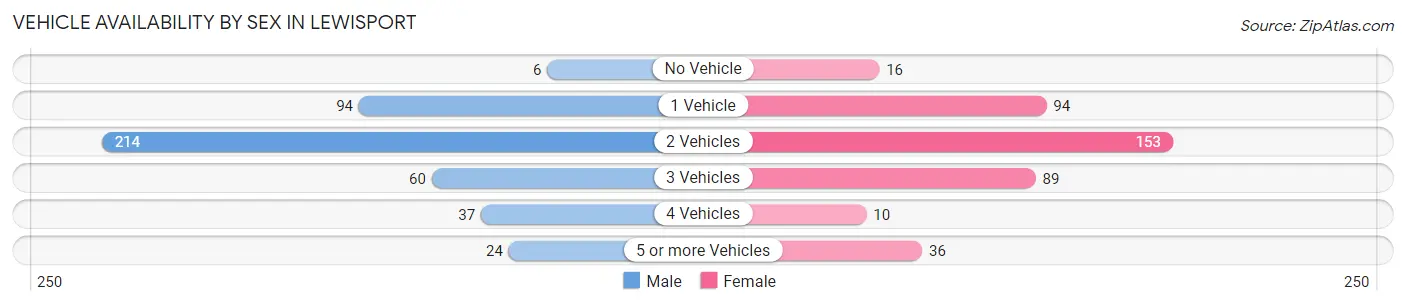
| Vehicles Available | Male | Female |
| No Vehicle | 6 (1.4%) | 16 (4.0%) |
| 1 Vehicle | 94 (21.6%) | 94 (23.6%) |
| 2 Vehicles | 214 (49.2%) | 153 (38.4%) |
| 3 Vehicles | 60 (13.8%) | 89 (22.4%) |
| 4 Vehicles | 37 (8.5%) | 10 (2.5%) |
| 5 or more Vehicles | 24 (5.5%) | 36 (9.0%) |
| Total | 435 (100.0%) | 398 (100.0%) |
Commute Time in Lewisport
The most frequently occuring commute durations in Lewisport are 20 to 24 minutes (149 commuters, 18.6%), 10 to 14 minutes (136 commuters, 17.0%), and 30 to 34 minutes (102 commuters, 12.7%).
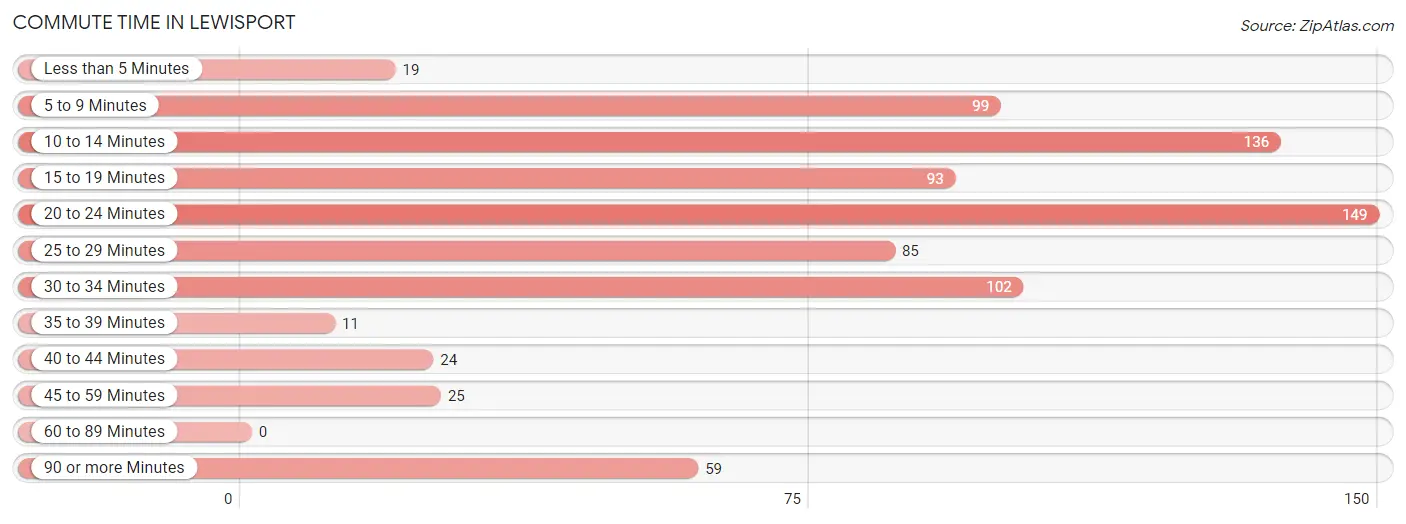
| Commute Time | # Commuters | % Commuters |
| Less than 5 Minutes | 19 | 2.4% |
| 5 to 9 Minutes | 99 | 12.3% |
| 10 to 14 Minutes | 136 | 17.0% |
| 15 to 19 Minutes | 93 | 11.6% |
| 20 to 24 Minutes | 149 | 18.6% |
| 25 to 29 Minutes | 85 | 10.6% |
| 30 to 34 Minutes | 102 | 12.7% |
| 35 to 39 Minutes | 11 | 1.4% |
| 40 to 44 Minutes | 24 | 3.0% |
| 45 to 59 Minutes | 25 | 3.1% |
| 60 to 89 Minutes | 0 | 0.0% |
| 90 or more Minutes | 59 | 7.4% |
Commute Time by Sex in Lewisport
The most common commute times in Lewisport are 10 to 14 minutes (90 commuters, 21.0%) for males and 30 to 34 minutes (69 commuters, 18.5%) for females.
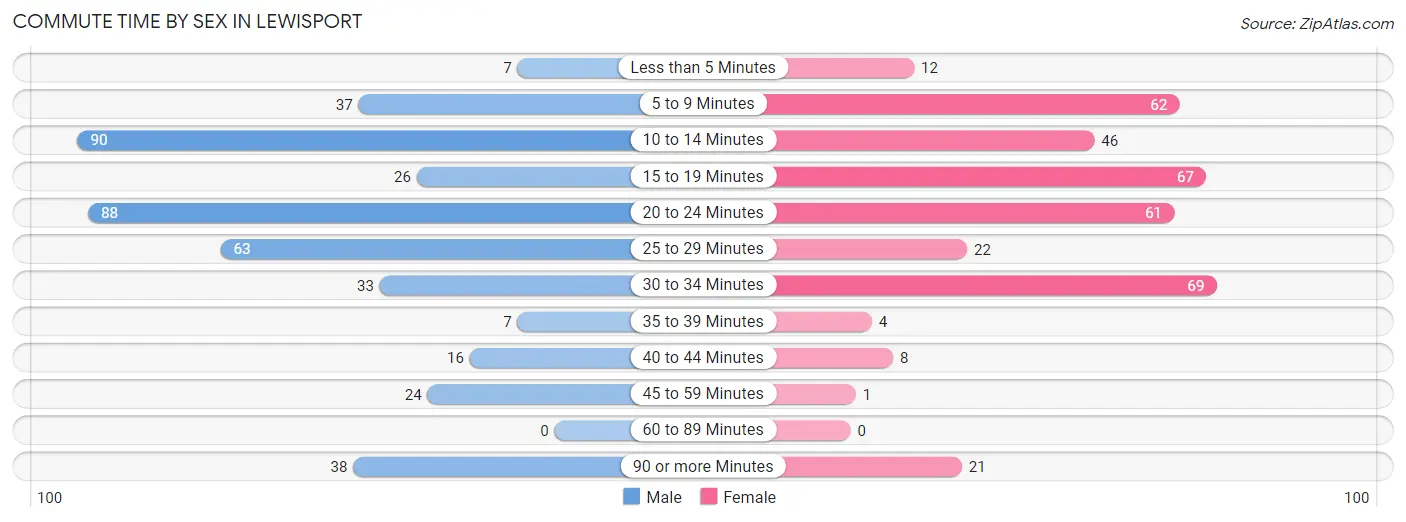
| Commute Time | Male | Female |
| Less than 5 Minutes | 7 (1.6%) | 12 (3.2%) |
| 5 to 9 Minutes | 37 (8.6%) | 62 (16.6%) |
| 10 to 14 Minutes | 90 (21.0%) | 46 (12.3%) |
| 15 to 19 Minutes | 26 (6.1%) | 67 (18.0%) |
| 20 to 24 Minutes | 88 (20.5%) | 61 (16.4%) |
| 25 to 29 Minutes | 63 (14.7%) | 22 (5.9%) |
| 30 to 34 Minutes | 33 (7.7%) | 69 (18.5%) |
| 35 to 39 Minutes | 7 (1.6%) | 4 (1.1%) |
| 40 to 44 Minutes | 16 (3.7%) | 8 (2.1%) |
| 45 to 59 Minutes | 24 (5.6%) | 1 (0.3%) |
| 60 to 89 Minutes | 0 (0.0%) | 0 (0.0%) |
| 90 or more Minutes | 38 (8.9%) | 21 (5.6%) |
Time of Departure to Work by Sex in Lewisport
The most frequent times of departure to work in Lewisport are 6:30 AM to 6:59 AM (87, 20.3%) for males and 7:30 AM to 7:59 AM (96, 25.7%) for females.
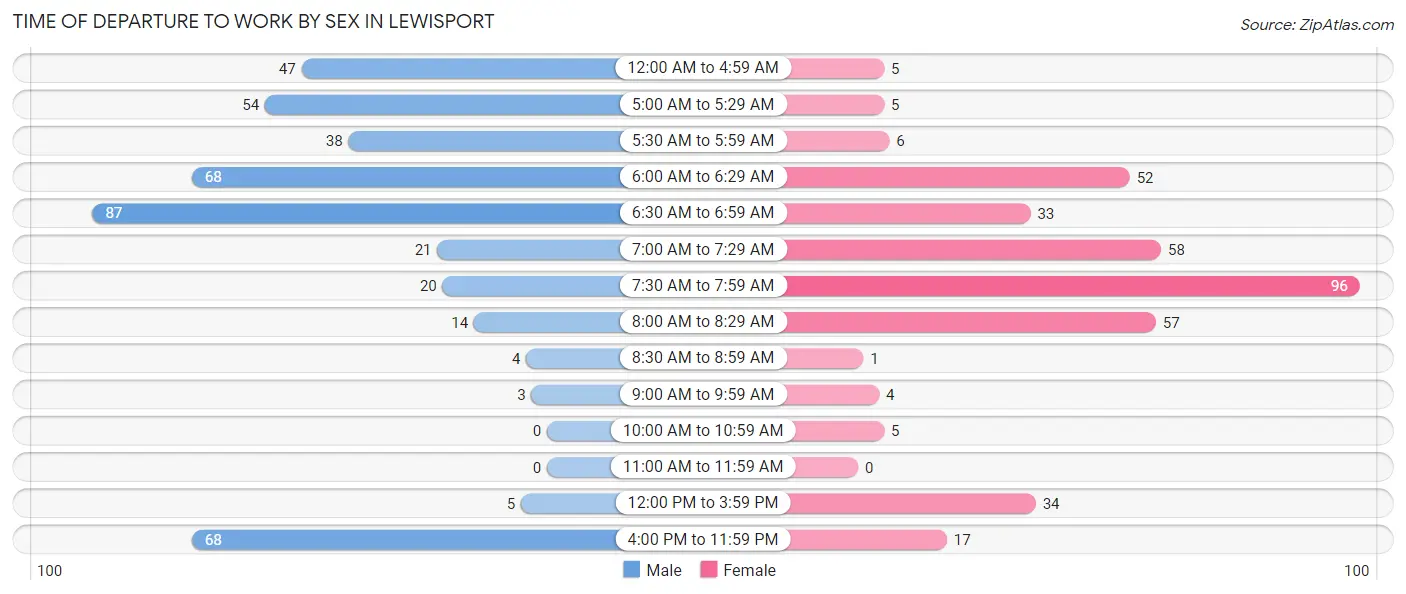
| Time of Departure | Male | Female |
| 12:00 AM to 4:59 AM | 47 (11.0%) | 5 (1.3%) |
| 5:00 AM to 5:29 AM | 54 (12.6%) | 5 (1.3%) |
| 5:30 AM to 5:59 AM | 38 (8.9%) | 6 (1.6%) |
| 6:00 AM to 6:29 AM | 68 (15.9%) | 52 (13.9%) |
| 6:30 AM to 6:59 AM | 87 (20.3%) | 33 (8.8%) |
| 7:00 AM to 7:29 AM | 21 (4.9%) | 58 (15.5%) |
| 7:30 AM to 7:59 AM | 20 (4.7%) | 96 (25.7%) |
| 8:00 AM to 8:29 AM | 14 (3.3%) | 57 (15.3%) |
| 8:30 AM to 8:59 AM | 4 (0.9%) | 1 (0.3%) |
| 9:00 AM to 9:59 AM | 3 (0.7%) | 4 (1.1%) |
| 10:00 AM to 10:59 AM | 0 (0.0%) | 5 (1.3%) |
| 11:00 AM to 11:59 AM | 0 (0.0%) | 0 (0.0%) |
| 12:00 PM to 3:59 PM | 5 (1.2%) | 34 (9.1%) |
| 4:00 PM to 11:59 PM | 68 (15.9%) | 17 (4.6%) |
| Total | 429 (100.0%) | 373 (100.0%) |
Housing Occupancy in Lewisport
Occupancy by Ownership in Lewisport
Of the total 800 dwellings in Lewisport, owner-occupied units account for 431 (53.9%), while renter-occupied units make up 369 (46.1%).
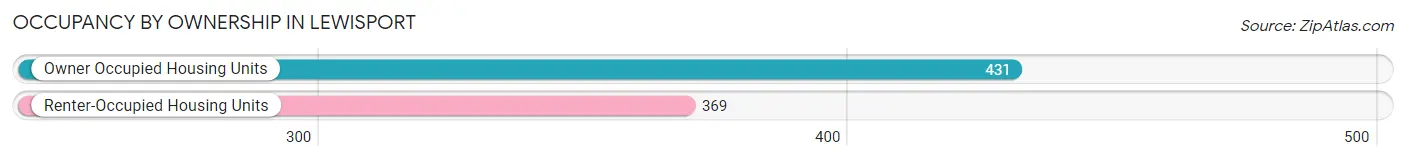
| Occupancy | # Housing Units | % Housing Units |
| Owner Occupied Housing Units | 431 | 53.9% |
| Renter-Occupied Housing Units | 369 | 46.1% |
| Total Occupied Housing Units | 800 | 100.0% |
Occupancy by Household Size in Lewisport
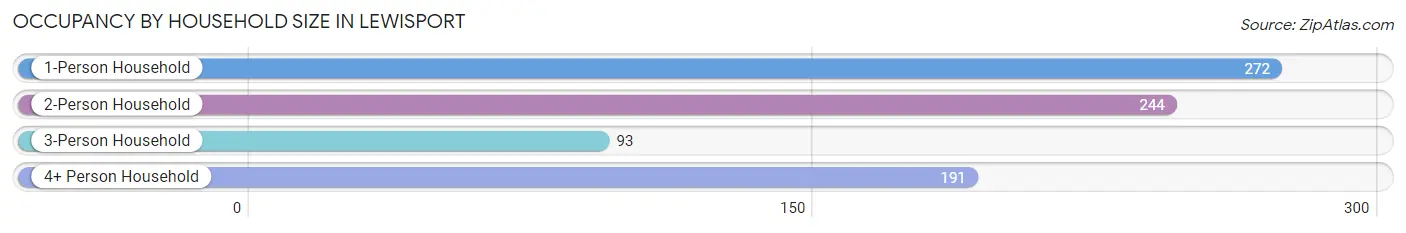
| Household Size | # Housing Units | % Housing Units |
| 1-Person Household | 272 | 34.0% |
| 2-Person Household | 244 | 30.5% |
| 3-Person Household | 93 | 11.6% |
| 4+ Person Household | 191 | 23.9% |
| Total Housing Units | 800 | 100.0% |
Occupancy by Ownership by Household Size in Lewisport
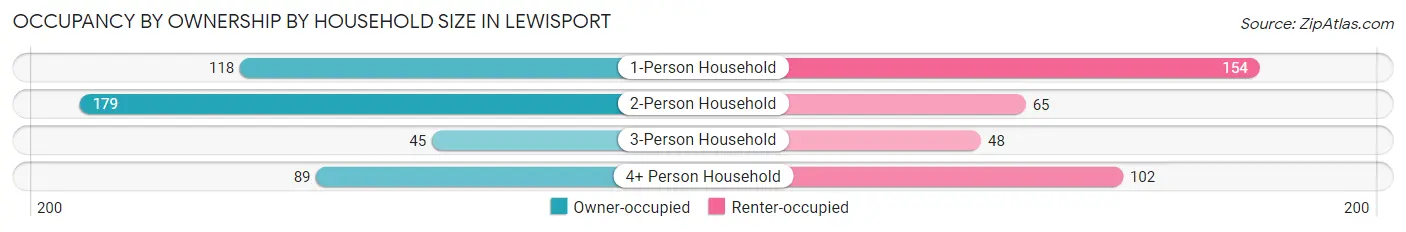
| Household Size | Owner-occupied | Renter-occupied |
| 1-Person Household | 118 (43.4%) | 154 (56.6%) |
| 2-Person Household | 179 (73.4%) | 65 (26.6%) |
| 3-Person Household | 45 (48.4%) | 48 (51.6%) |
| 4+ Person Household | 89 (46.6%) | 102 (53.4%) |
| Total Housing Units | 431 (53.9%) | 369 (46.1%) |
Occupancy by Educational Attainment in Lewisport
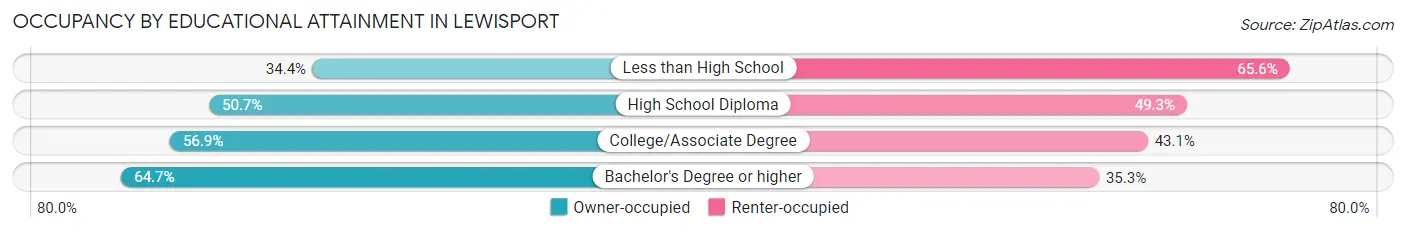
| Household Size | Owner-occupied | Renter-occupied |
| Less than High School | 21 (34.4%) | 40 (65.6%) |
| High School Diploma | 172 (50.7%) | 167 (49.3%) |
| College/Associate Degree | 152 (56.9%) | 115 (43.1%) |
| Bachelor's Degree or higher | 86 (64.7%) | 47 (35.3%) |
Occupancy by Age of Householder in Lewisport
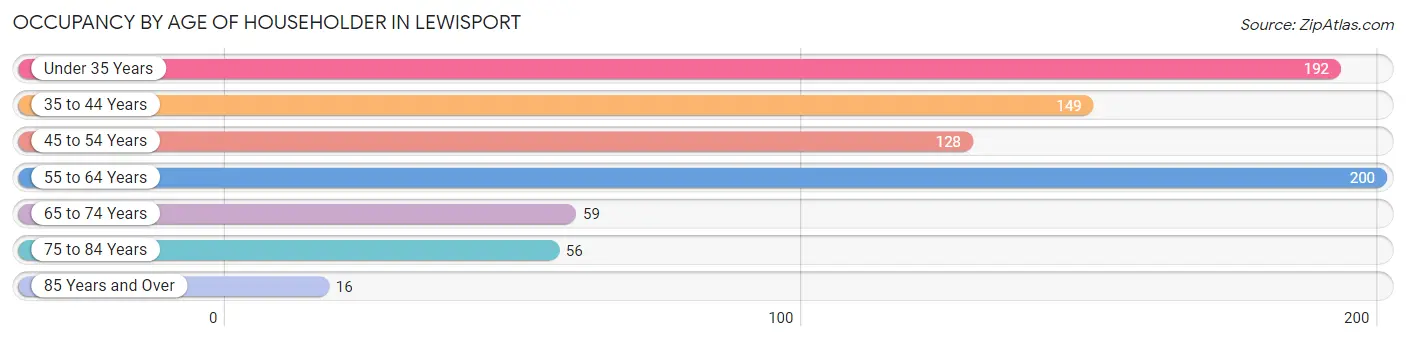
| Age Bracket | # Households | % Households |
| Under 35 Years | 192 | 24.0% |
| 35 to 44 Years | 149 | 18.6% |
| 45 to 54 Years | 128 | 16.0% |
| 55 to 64 Years | 200 | 25.0% |
| 65 to 74 Years | 59 | 7.4% |
| 75 to 84 Years | 56 | 7.0% |
| 85 Years and Over | 16 | 2.0% |
| Total | 800 | 100.0% |
Housing Finances in Lewisport
Median Income by Occupancy in Lewisport
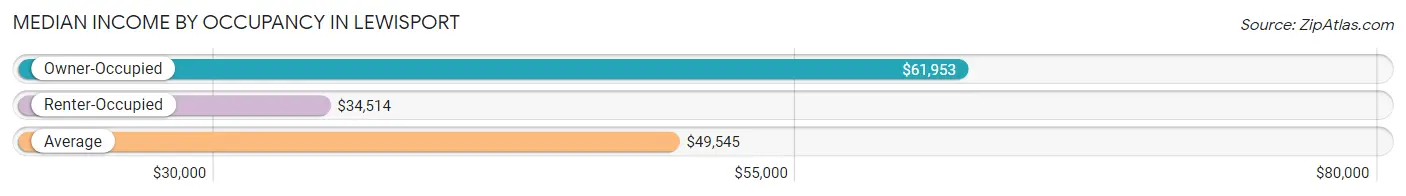
| Occupancy Type | # Households | Median Income |
| Owner-Occupied | 431 (53.9%) | $61,953 |
| Renter-Occupied | 369 (46.1%) | $34,514 |
| Average | 800 (100.0%) | $49,545 |
Occupancy by Householder Income Bracket in Lewisport
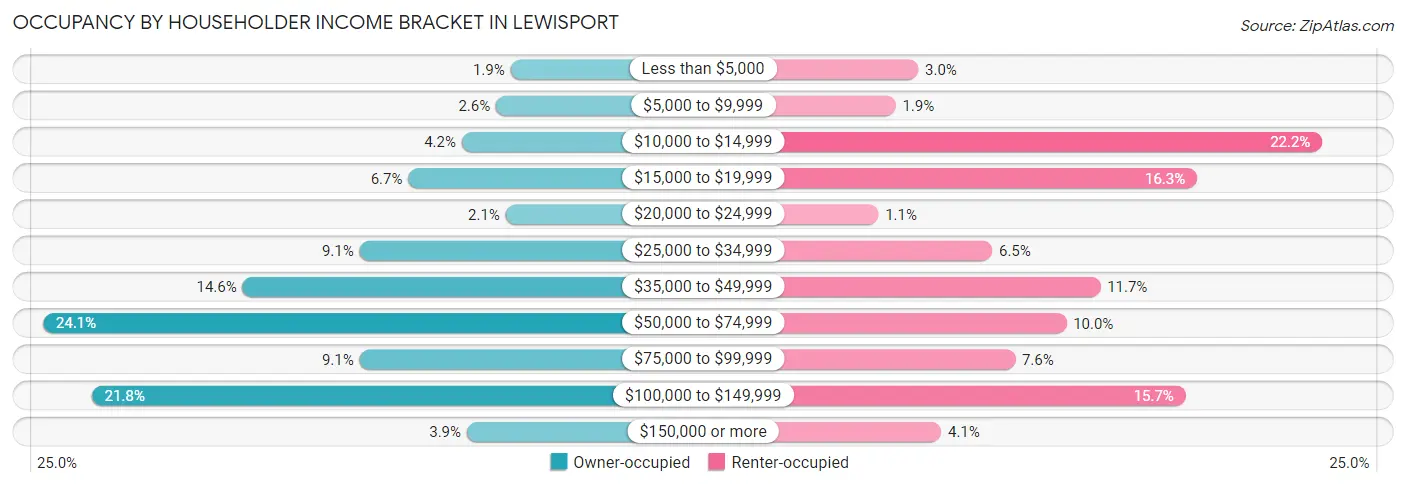
| Income Bracket | Owner-occupied | Renter-occupied |
| Less than $5,000 | 8 (1.9%) | 11 (3.0%) |
| $5,000 to $9,999 | 11 (2.5%) | 7 (1.9%) |
| $10,000 to $14,999 | 18 (4.2%) | 82 (22.2%) |
| $15,000 to $19,999 | 29 (6.7%) | 60 (16.3%) |
| $20,000 to $24,999 | 9 (2.1%) | 4 (1.1%) |
| $25,000 to $34,999 | 39 (9.0%) | 24 (6.5%) |
| $35,000 to $49,999 | 63 (14.6%) | 43 (11.7%) |
| $50,000 to $74,999 | 104 (24.1%) | 37 (10.0%) |
| $75,000 to $99,999 | 39 (9.0%) | 28 (7.6%) |
| $100,000 to $149,999 | 94 (21.8%) | 58 (15.7%) |
| $150,000 or more | 17 (3.9%) | 15 (4.1%) |
| Total | 431 (100.0%) | 369 (100.0%) |
Monthly Housing Cost Tiers in Lewisport
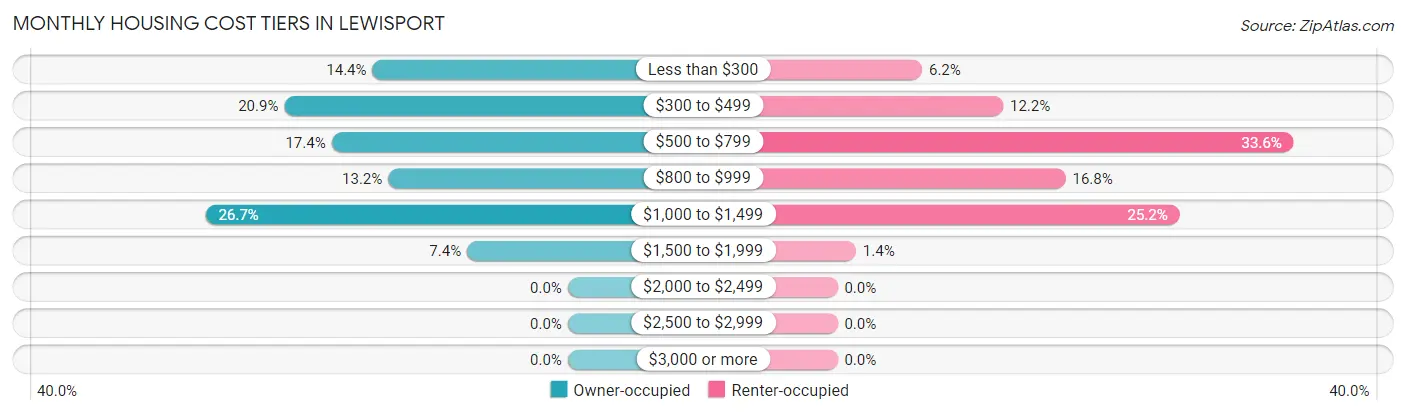
| Monthly Cost | Owner-occupied | Renter-occupied |
| Less than $300 | 62 (14.4%) | 23 (6.2%) |
| $300 to $499 | 90 (20.9%) | 45 (12.2%) |
| $500 to $799 | 75 (17.4%) | 124 (33.6%) |
| $800 to $999 | 57 (13.2%) | 62 (16.8%) |
| $1,000 to $1,499 | 115 (26.7%) | 93 (25.2%) |
| $1,500 to $1,999 | 32 (7.4%) | 5 (1.4%) |
| $2,000 to $2,499 | 0 (0.0%) | 0 (0.0%) |
| $2,500 to $2,999 | 0 (0.0%) | 0 (0.0%) |
| $3,000 or more | 0 (0.0%) | 0 (0.0%) |
| Total | 431 (100.0%) | 369 (100.0%) |
Physical Housing Characteristics in Lewisport
Housing Structures in Lewisport
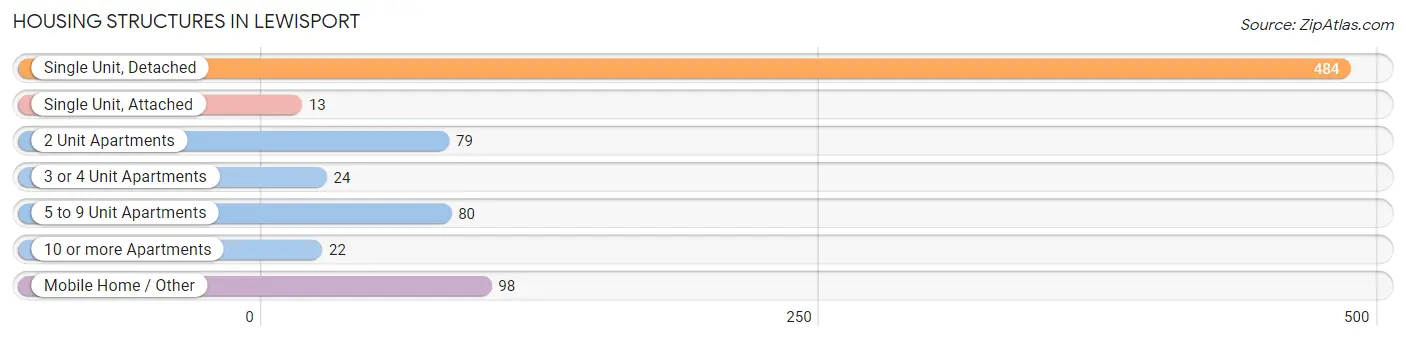
| Structure Type | # Housing Units | % Housing Units |
| Single Unit, Detached | 484 | 60.5% |
| Single Unit, Attached | 13 | 1.6% |
| 2 Unit Apartments | 79 | 9.9% |
| 3 or 4 Unit Apartments | 24 | 3.0% |
| 5 to 9 Unit Apartments | 80 | 10.0% |
| 10 or more Apartments | 22 | 2.8% |
| Mobile Home / Other | 98 | 12.2% |
| Total | 800 | 100.0% |
Housing Structures by Occupancy in Lewisport
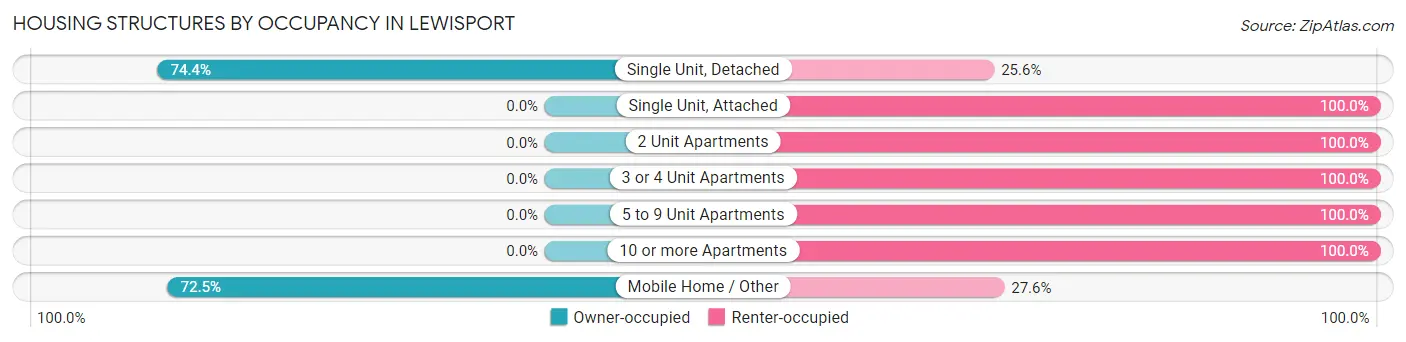
| Structure Type | Owner-occupied | Renter-occupied |
| Single Unit, Detached | 360 (74.4%) | 124 (25.6%) |
| Single Unit, Attached | 0 (0.0%) | 13 (100.0%) |
| 2 Unit Apartments | 0 (0.0%) | 79 (100.0%) |
| 3 or 4 Unit Apartments | 0 (0.0%) | 24 (100.0%) |
| 5 to 9 Unit Apartments | 0 (0.0%) | 80 (100.0%) |
| 10 or more Apartments | 0 (0.0%) | 22 (100.0%) |
| Mobile Home / Other | 71 (72.5%) | 27 (27.6%) |
| Total | 431 (53.9%) | 369 (46.1%) |
Housing Structures by Number of Rooms in Lewisport
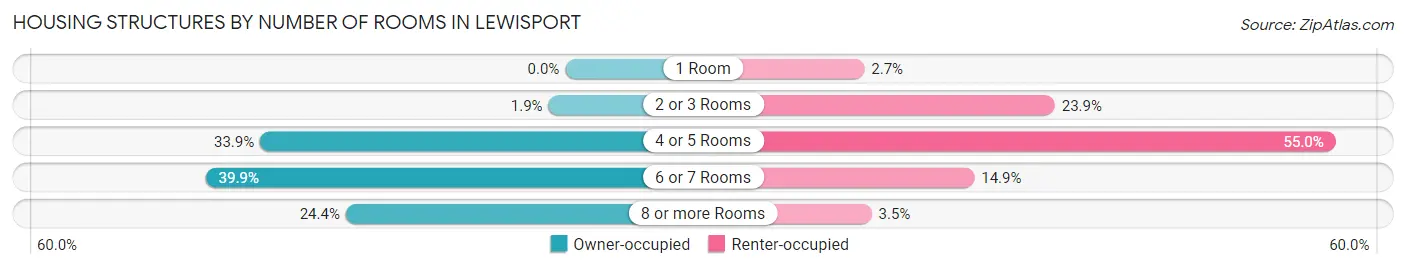
| Number of Rooms | Owner-occupied | Renter-occupied |
| 1 Room | 0 (0.0%) | 10 (2.7%) |
| 2 or 3 Rooms | 8 (1.9%) | 88 (23.8%) |
| 4 or 5 Rooms | 146 (33.9%) | 203 (55.0%) |
| 6 or 7 Rooms | 172 (39.9%) | 55 (14.9%) |
| 8 or more Rooms | 105 (24.4%) | 13 (3.5%) |
| Total | 431 (100.0%) | 369 (100.0%) |
Housing Structure by Heating Type in Lewisport
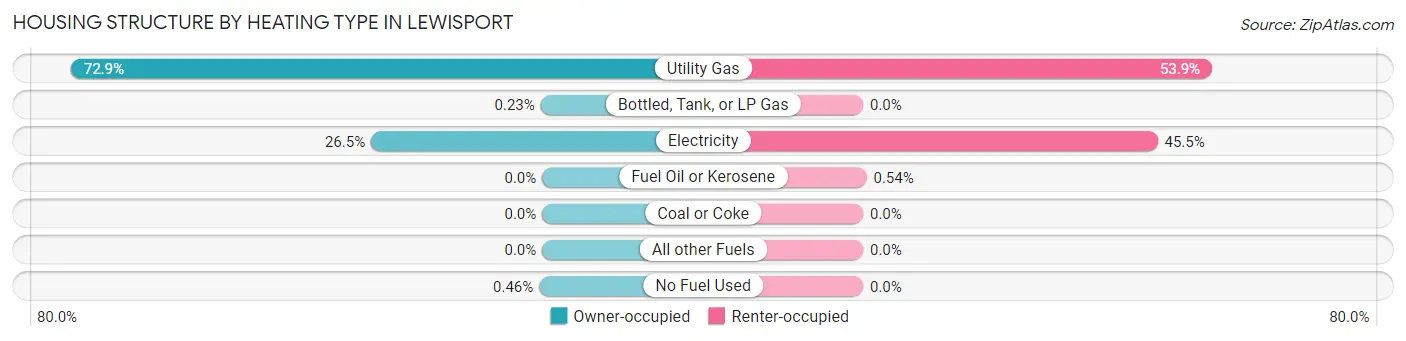
| Heating Type | Owner-occupied | Renter-occupied |
| Utility Gas | 314 (72.9%) | 199 (53.9%) |
| Bottled, Tank, or LP Gas | 1 (0.2%) | 0 (0.0%) |
| Electricity | 114 (26.5%) | 168 (45.5%) |
| Fuel Oil or Kerosene | 0 (0.0%) | 2 (0.5%) |
| Coal or Coke | 0 (0.0%) | 0 (0.0%) |
| All other Fuels | 0 (0.0%) | 0 (0.0%) |
| No Fuel Used | 2 (0.5%) | 0 (0.0%) |
| Total | 431 (100.0%) | 369 (100.0%) |
Household Vehicle Usage in Lewisport
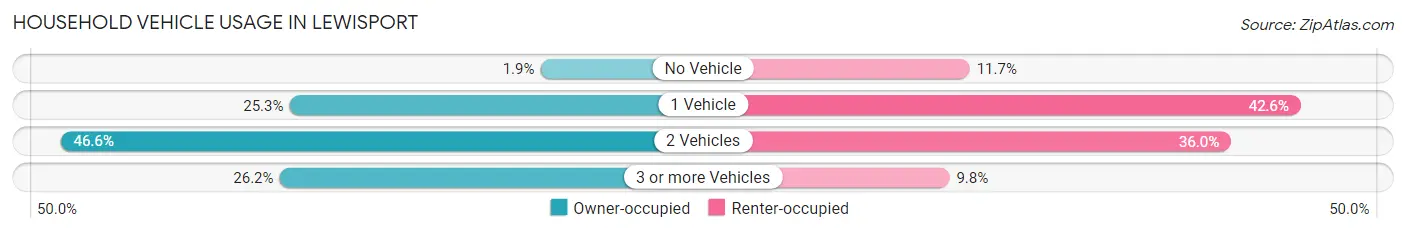
| Vehicles per Household | Owner-occupied | Renter-occupied |
| No Vehicle | 8 (1.9%) | 43 (11.7%) |
| 1 Vehicle | 109 (25.3%) | 157 (42.5%) |
| 2 Vehicles | 201 (46.6%) | 133 (36.0%) |
| 3 or more Vehicles | 113 (26.2%) | 36 (9.8%) |
| Total | 431 (100.0%) | 369 (100.0%) |
Real Estate & Mortgages in Lewisport
Real Estate and Mortgage Overview in Lewisport
| Characteristic | Without Mortgage | With Mortgage |
| Housing Units | 203 | 228 |
| Median Property Value | $100,400 | $117,900 |
| Median Household Income | $49,250 | $12 |
| Monthly Housing Costs | $380 | $0 |
| Real Estate Taxes | $781 | $6 |
Property Value by Mortgage Status in Lewisport
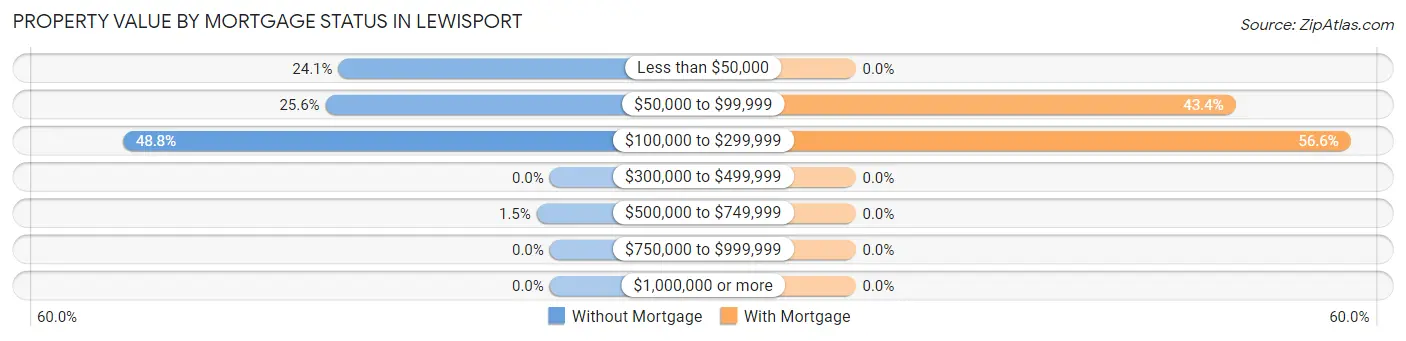
| Property Value | Without Mortgage | With Mortgage |
| Less than $50,000 | 49 (24.1%) | 0 (0.0%) |
| $50,000 to $99,999 | 52 (25.6%) | 99 (43.4%) |
| $100,000 to $299,999 | 99 (48.8%) | 129 (56.6%) |
| $300,000 to $499,999 | 0 (0.0%) | 0 (0.0%) |
| $500,000 to $749,999 | 3 (1.5%) | 0 (0.0%) |
| $750,000 to $999,999 | 0 (0.0%) | 0 (0.0%) |
| $1,000,000 or more | 0 (0.0%) | 0 (0.0%) |
| Total | 203 (100.0%) | 228 (100.0%) |
Household Income by Mortgage Status in Lewisport
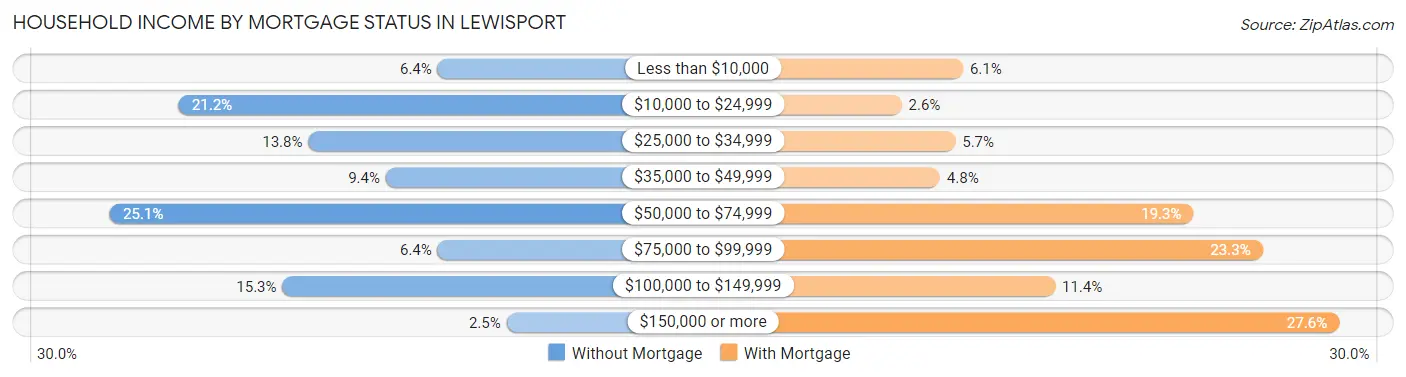
| Household Income | Without Mortgage | With Mortgage |
| Less than $10,000 | 13 (6.4%) | 14 (6.1%) |
| $10,000 to $24,999 | 43 (21.2%) | 6 (2.6%) |
| $25,000 to $34,999 | 28 (13.8%) | 13 (5.7%) |
| $35,000 to $49,999 | 19 (9.4%) | 11 (4.8%) |
| $50,000 to $74,999 | 51 (25.1%) | 44 (19.3%) |
| $75,000 to $99,999 | 13 (6.4%) | 53 (23.3%) |
| $100,000 to $149,999 | 31 (15.3%) | 26 (11.4%) |
| $150,000 or more | 5 (2.5%) | 63 (27.6%) |
| Total | 203 (100.0%) | 228 (100.0%) |
Property Value to Household Income Ratio in Lewisport
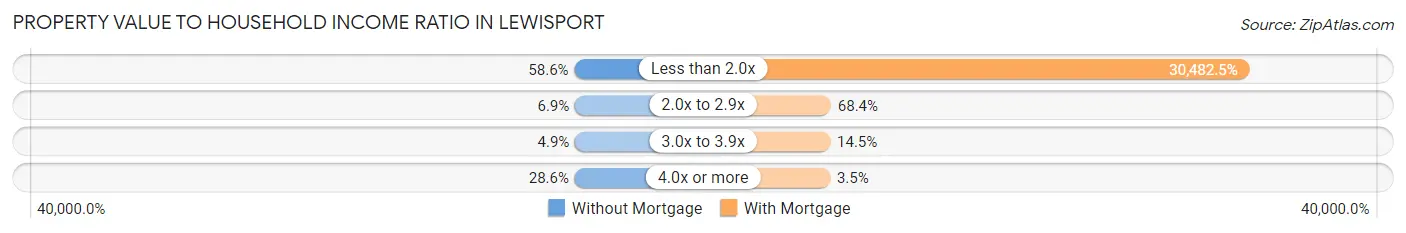
| Value-to-Income Ratio | Without Mortgage | With Mortgage |
| Less than 2.0x | 119 (58.6%) | 69,500 (30,482.5%) |
| 2.0x to 2.9x | 14 (6.9%) | 156 (68.4%) |
| 3.0x to 3.9x | 10 (4.9%) | 33 (14.5%) |
| 4.0x or more | 58 (28.6%) | 8 (3.5%) |
| Total | 203 (100.0%) | 228 (100.0%) |
Real Estate Taxes by Mortgage Status in Lewisport
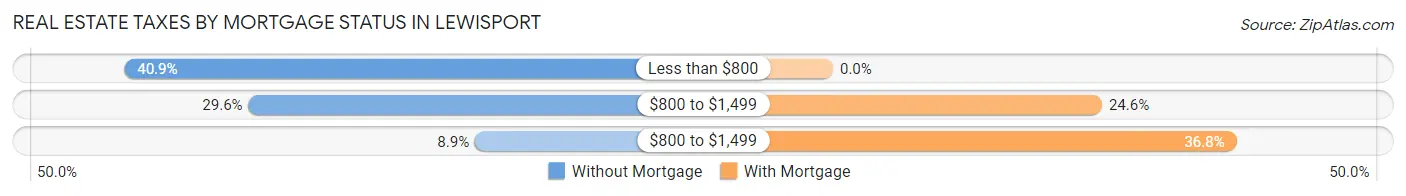
| Property Taxes | Without Mortgage | With Mortgage |
| Less than $800 | 83 (40.9%) | 0 (0.0%) |
| $800 to $1,499 | 60 (29.6%) | 56 (24.6%) |
| $800 to $1,499 | 18 (8.9%) | 84 (36.8%) |
| Total | 203 (100.0%) | 228 (100.0%) |
Health & Disability in Lewisport
Health Insurance Coverage by Age in Lewisport
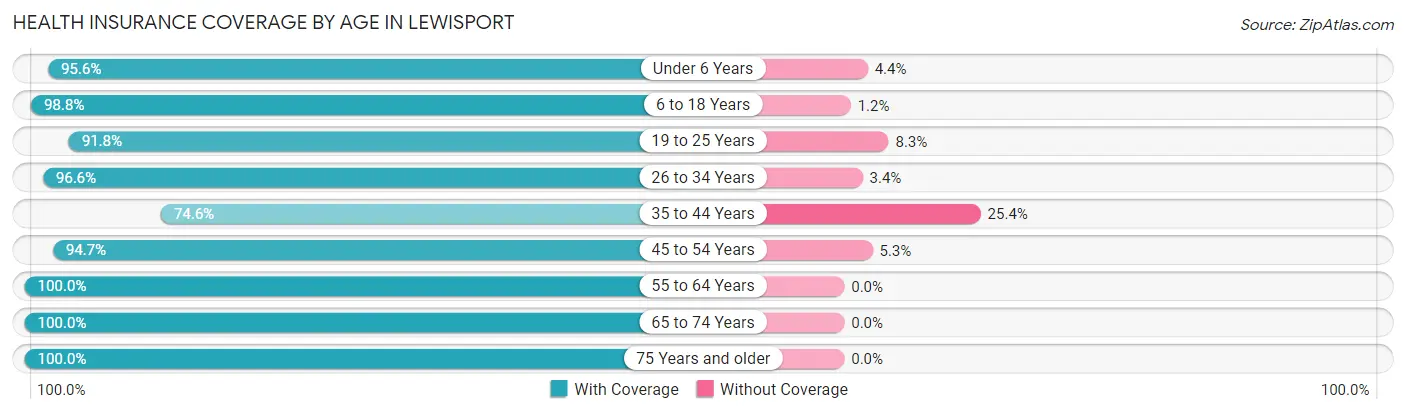
| Age Bracket | With Coverage | Without Coverage |
| Under 6 Years | 197 (95.6%) | 9 (4.4%) |
| 6 to 18 Years | 410 (98.8%) | 5 (1.2%) |
| 19 to 25 Years | 189 (91.7%) | 17 (8.3%) |
| 26 to 34 Years | 255 (96.6%) | 9 (3.4%) |
| 35 to 44 Years | 217 (74.6%) | 74 (25.4%) |
| 45 to 54 Years | 162 (94.7%) | 9 (5.3%) |
| 55 to 64 Years | 279 (100.0%) | 0 (0.0%) |
| 65 to 74 Years | 146 (100.0%) | 0 (0.0%) |
| 75 Years and older | 103 (100.0%) | 0 (0.0%) |
| Total | 1,958 (94.1%) | 123 (5.9%) |
Health Insurance Coverage by Citizenship Status in Lewisport

| Citizenship Status | With Coverage | Without Coverage |
| Native Born | 197 (95.6%) | 9 (4.4%) |
| Foreign Born, Citizen | 410 (98.8%) | 5 (1.2%) |
| Foreign Born, not a Citizen | 189 (91.7%) | 17 (8.3%) |
Health Insurance Coverage by Household Income in Lewisport
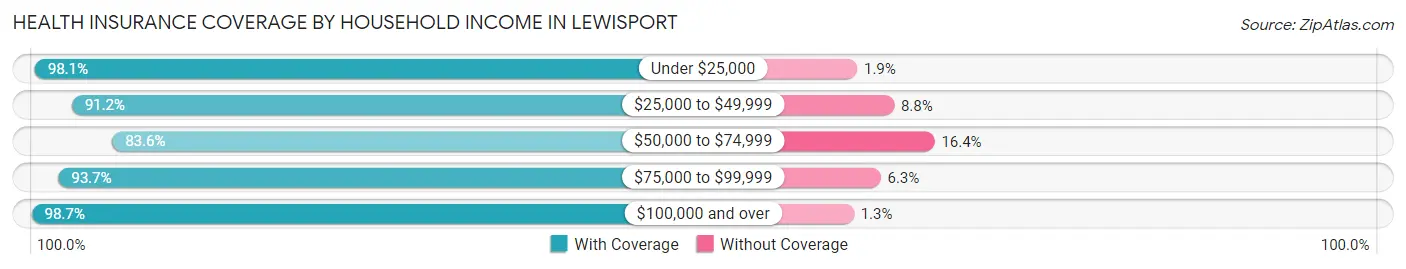
| Household Income | With Coverage | Without Coverage |
| Under $25,000 | 409 (98.1%) | 8 (1.9%) |
| $25,000 to $49,999 | 289 (91.2%) | 28 (8.8%) |
| $50,000 to $74,999 | 336 (83.6%) | 66 (16.4%) |
| $75,000 to $99,999 | 163 (93.7%) | 11 (6.3%) |
| $100,000 and over | 761 (98.7%) | 10 (1.3%) |
Public vs Private Health Insurance Coverage by Age in Lewisport
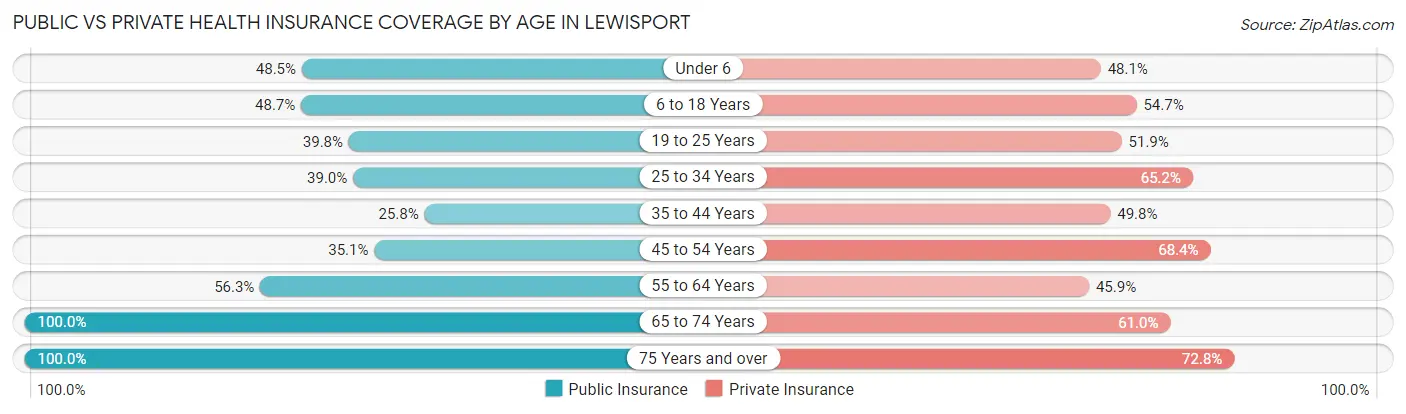
| Age Bracket | Public Insurance | Private Insurance |
| Under 6 | 100 (48.5%) | 99 (48.1%) |
| 6 to 18 Years | 202 (48.7%) | 227 (54.7%) |
| 19 to 25 Years | 82 (39.8%) | 107 (51.9%) |
| 25 to 34 Years | 103 (39.0%) | 172 (65.1%) |
| 35 to 44 Years | 75 (25.8%) | 145 (49.8%) |
| 45 to 54 Years | 60 (35.1%) | 117 (68.4%) |
| 55 to 64 Years | 157 (56.3%) | 128 (45.9%) |
| 65 to 74 Years | 146 (100.0%) | 89 (61.0%) |
| 75 Years and over | 103 (100.0%) | 75 (72.8%) |
| Total | 1,028 (49.4%) | 1,159 (55.7%) |
Disability Status by Sex by Age in Lewisport
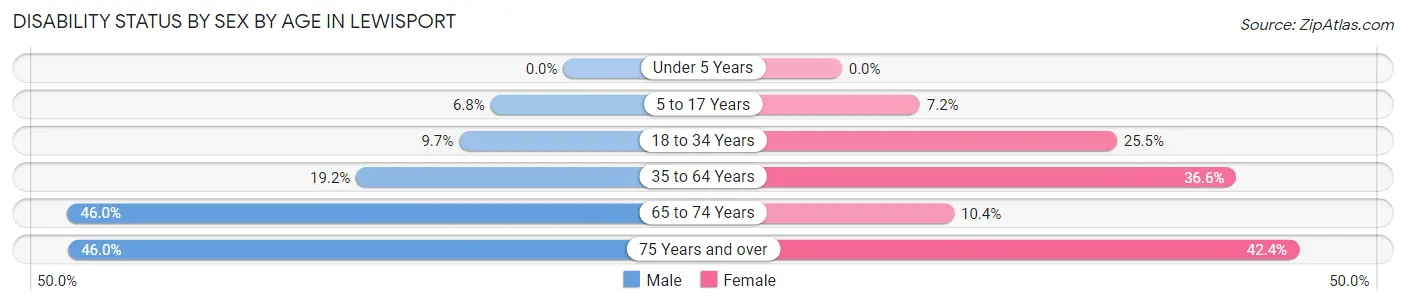
| Age Bracket | Male | Female |
| Under 5 Years | 0 (0.0%) | 0 (0.0%) |
| 5 to 17 Years | 17 (6.8%) | 16 (7.2%) |
| 18 to 34 Years | 24 (9.7%) | 61 (25.5%) |
| 35 to 64 Years | 70 (19.2%) | 138 (36.6%) |
| 65 to 74 Years | 23 (46.0%) | 10 (10.4%) |
| 75 Years and over | 17 (46.0%) | 28 (42.4%) |
Disability Class by Sex by Age in Lewisport
Disability Class: Hearing Difficulty
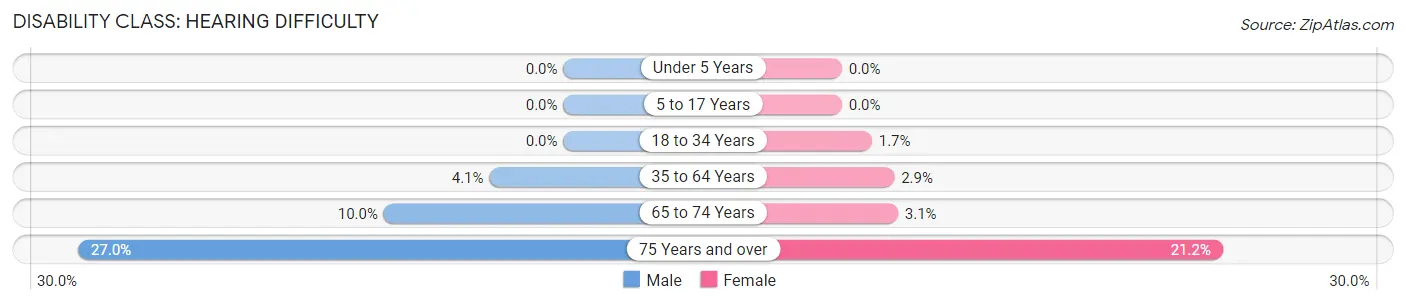
| Age Bracket | Male | Female |
| Under 5 Years | 0 (0.0%) | 0 (0.0%) |
| 5 to 17 Years | 0 (0.0%) | 0 (0.0%) |
| 18 to 34 Years | 0 (0.0%) | 4 (1.7%) |
| 35 to 64 Years | 15 (4.1%) | 11 (2.9%) |
| 65 to 74 Years | 5 (10.0%) | 3 (3.1%) |
| 75 Years and over | 10 (27.0%) | 14 (21.2%) |
Disability Class: Vision Difficulty
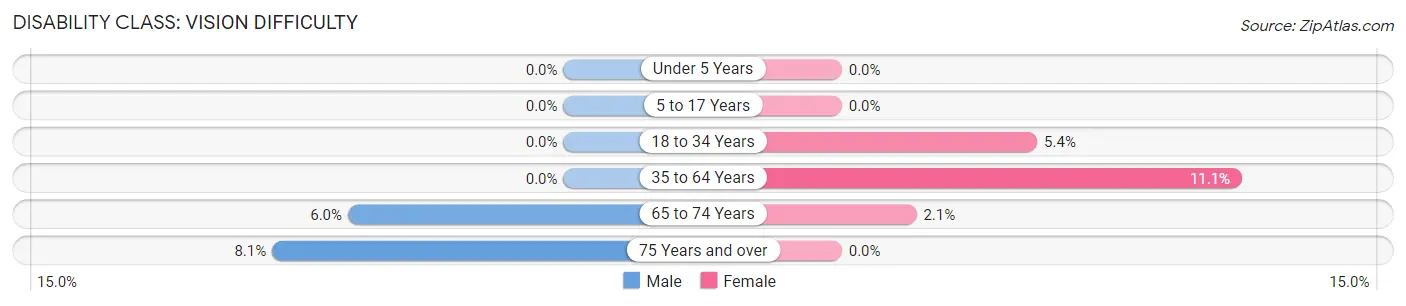
| Age Bracket | Male | Female |
| Under 5 Years | 0 (0.0%) | 0 (0.0%) |
| 5 to 17 Years | 0 (0.0%) | 0 (0.0%) |
| 18 to 34 Years | 0 (0.0%) | 13 (5.4%) |
| 35 to 64 Years | 0 (0.0%) | 42 (11.1%) |
| 65 to 74 Years | 3 (6.0%) | 2 (2.1%) |
| 75 Years and over | 3 (8.1%) | 0 (0.0%) |
Disability Class: Cognitive Difficulty
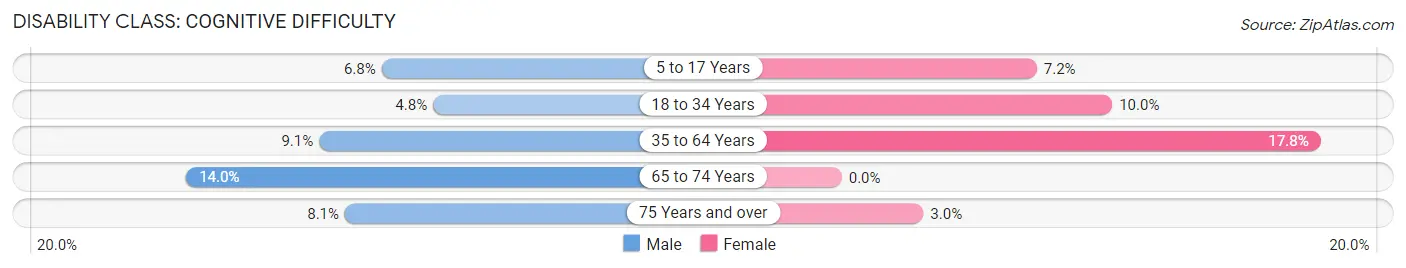
| Age Bracket | Male | Female |
| 5 to 17 Years | 17 (6.8%) | 16 (7.2%) |
| 18 to 34 Years | 12 (4.8%) | 24 (10.0%) |
| 35 to 64 Years | 33 (9.1%) | 67 (17.8%) |
| 65 to 74 Years | 7 (14.0%) | 0 (0.0%) |
| 75 Years and over | 3 (8.1%) | 2 (3.0%) |
Disability Class: Ambulatory Difficulty
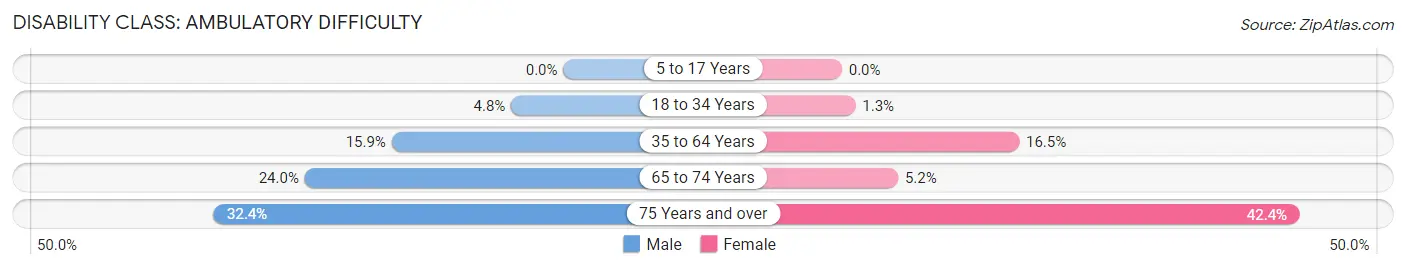
| Age Bracket | Male | Female |
| 5 to 17 Years | 0 (0.0%) | 0 (0.0%) |
| 18 to 34 Years | 12 (4.8%) | 3 (1.3%) |
| 35 to 64 Years | 58 (15.9%) | 62 (16.5%) |
| 65 to 74 Years | 12 (24.0%) | 5 (5.2%) |
| 75 Years and over | 12 (32.4%) | 28 (42.4%) |
Disability Class: Self-Care Difficulty
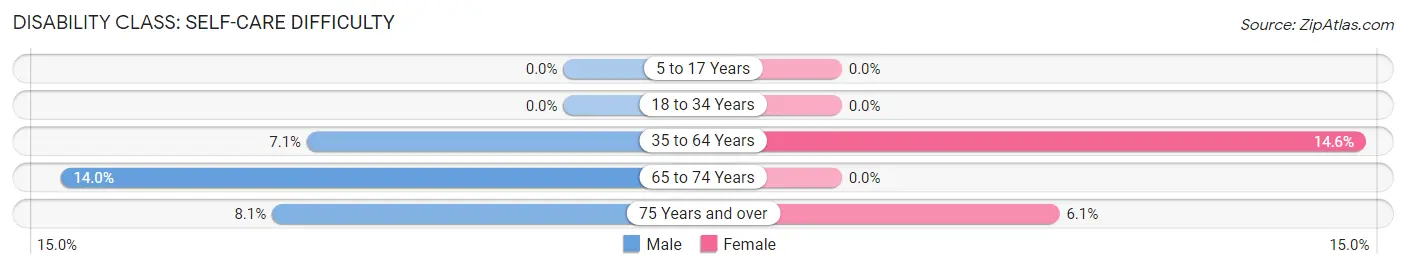
| Age Bracket | Male | Female |
| 5 to 17 Years | 0 (0.0%) | 0 (0.0%) |
| 18 to 34 Years | 0 (0.0%) | 0 (0.0%) |
| 35 to 64 Years | 26 (7.1%) | 55 (14.6%) |
| 65 to 74 Years | 7 (14.0%) | 0 (0.0%) |
| 75 Years and over | 3 (8.1%) | 4 (6.1%) |
Technology Access in Lewisport
Computing Device Access in Lewisport
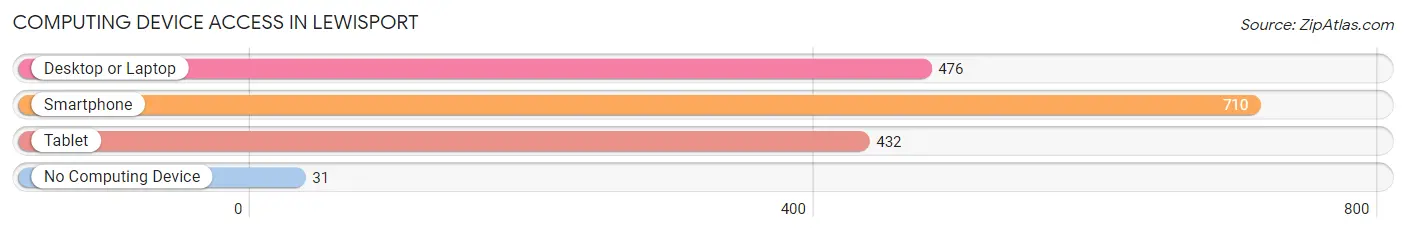
| Device Type | # Households | % Households |
| Desktop or Laptop | 476 | 59.5% |
| Smartphone | 710 | 88.7% |
| Tablet | 432 | 54.0% |
| No Computing Device | 31 | 3.9% |
| Total | 800 | 100.0% |
Internet Access in Lewisport
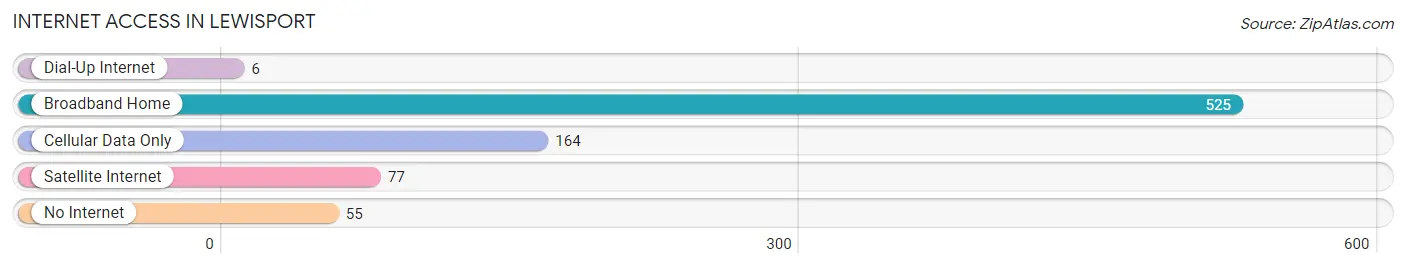
| Internet Type | # Households | % Households |
| Dial-Up Internet | 6 | 0.7% |
| Broadband Home | 525 | 65.6% |
| Cellular Data Only | 164 | 20.5% |
| Satellite Internet | 77 | 9.6% |
| No Internet | 55 | 6.9% |
| Total | 800 | 100.0% |
Lewisport Summary
History
Lewisport is a small city located in Hancock County, Kentucky. It is situated on the banks of the Ohio River, and is part of the Owensboro metropolitan area. The city was founded in 1818 by William Lewis, who named it after himself. Lewisport was originally a small farming community, but it grew rapidly in the late 19th and early 20th centuries due to its location on the Ohio River. The city was incorporated in 1891, and it has since become a major industrial center.
Lewisport has a rich history that dates back to the early 19th century. The city was a major stop on the Underground Railroad, and it was also the site of a major Civil War battle in 1862. The city was also home to a large number of German immigrants in the late 19th and early 20th centuries. These immigrants helped to shape the city’s culture and economy, and many of their descendants still live in Lewisport today.
Geography
Lewisport is located in the western part of Hancock County, Kentucky. It is situated on the banks of the Ohio River, and is part of the Owensboro metropolitan area. The city covers an area of 4.2 square miles, and has a population of approximately 2,500 people.
The city is located in a hilly region, and is surrounded by rolling hills and forests. The climate in Lewisport is humid subtropical, with hot summers and mild winters. The average annual temperature is around 60 degrees Fahrenheit, and the average annual precipitation is around 40 inches.
Economy
Lewisport’s economy is largely based on manufacturing and agriculture. The city is home to several large manufacturing plants, including a steel mill, a paper mill, and a chemical plant. These plants provide jobs for many of the city’s residents.
Agriculture is also an important part of the local economy. The city is home to several large farms, and the surrounding area is known for its production of corn, soybeans, and other crops.
Demographics
As of the 2010 census, the population of Lewisport was 2,500. The racial makeup of the city was 95.2% White, 2.2% African American, 0.4% Native American, 0.4% Asian, and 1.8% from other races. The median household income was $37,500, and the median family income was $45,000.
The city is home to a large number of German immigrants and their descendants. The city also has a small Hispanic population, and a small number of Asian immigrants.
Conclusion
Lewisport is a small city located in Hancock County, Kentucky. It is situated on the banks of the Ohio River, and is part of the Owensboro metropolitan area. The city was founded in 1818 by William Lewis, and it has since become a major industrial center. Lewisport has a rich history that dates back to the early 19th century, and it is home to a diverse population. The city’s economy is largely based on manufacturing and agriculture, and it is also home to several large farms.
Common Questions
What is Per Capita Income in Lewisport?
Per Capita income in Lewisport is $24,283.
What is the Median Family Income in Lewisport?
Median Family Income in Lewisport is $65,000.
What is the Median Household income in Lewisport?
Median Household Income in Lewisport is $49,545.
What is Income or Wage Gap in Lewisport?
Income or Wage Gap in Lewisport is 46.7%.
Women in Lewisport earn 53.3 cents for every dollar earned by a man.
What is Inequality or Gini Index in Lewisport?
Inequality or Gini Index in Lewisport is 0.43.
What is the Total Population of Lewisport?
Total Population of Lewisport is 2,180.
What is the Total Male Population of Lewisport?
Total Male Population of Lewisport is 1,063.
What is the Total Female Population of Lewisport?
Total Female Population of Lewisport is 1,117.
What is the Ratio of Males per 100 Females in Lewisport?
There are 95.17 Males per 100 Females in Lewisport.
What is the Ratio of Females per 100 Males in Lewisport?
There are 105.08 Females per 100 Males in Lewisport.
What is the Median Population Age in Lewisport?
Median Population Age in Lewisport is 34.6 Years.
What is the Average Family Size in Lewisport
Average Family Size in Lewisport is 3.2 People.
What is the Average Household Size in Lewisport
Average Household Size in Lewisport is 2.6 People.
How Large is the Labor Force in Lewisport?
There are 897 People in the Labor Forcein in Lewisport.
What is the Percentage of People in the Labor Force in Lewisport?
54.7% of People are in the Labor Force in Lewisport.
What is the Unemployment Rate in Lewisport?
Unemployment Rate in Lewisport is 4.7%.