Columbia, KY Map & Demographics
Columbia Map
Columbia Overview
$25,563
PER CAPITA INCOME
$64,360
AVG FAMILY INCOME
$45,163
AVG HOUSEHOLD INCOME
45.5%
WAGE / INCOME GAP [ % ]
54.5¢/ $1
WAGE / INCOME GAP [ $ ]
$7,927
FAMILY INCOME DEFICIT
0.53
INEQUALITY / GINI INDEX
4,811
TOTAL POPULATION
2,220
MALE POPULATION
2,591
FEMALE POPULATION
85.68
MALES / 100 FEMALES
116.71
FEMALES / 100 MALES
27.6
MEDIAN AGE
3.0
AVG FAMILY SIZE
2.3
AVG HOUSEHOLD SIZE
2,172
LABOR FORCE [ PEOPLE ]
52.3%
PERCENT IN LABOR FORCE
5.8%
UNEMPLOYMENT RATE
Columbia Zip Codes
Columbia Area Codes
Income in Columbia
Income Overview in Columbia
Per Capita Income in Columbia is $25,563, while median incomes of families and households are $64,360 and $45,163 respectively.
| Characteristic | Number | Measure |
| Per Capita Income | 4,811 | $25,563 |
| Median Family Income | 924 | $64,360 |
| Mean Family Income | 924 | $93,858 |
| Median Household Income | 1,557 | $45,163 |
| Mean Household Income | 1,557 | $68,487 |
| Income Deficit | 924 | $7,927 |
| Wage / Income Gap (%) | 4,811 | 45.49% |
| Wage / Income Gap ($) | 4,811 | 54.51¢ per $1 |
| Gini / Inequality Index | 4,811 | 0.53 |
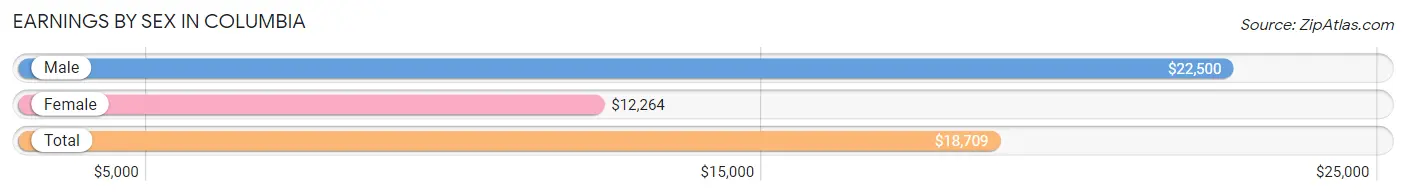
Earnings by Sex in Columbia
Average Earnings in Columbia are $18,709, $22,500 for men and $12,264 for women, a difference of 45.5%.
| Sex | Number | Average Earnings |
| Male | 1,140 (42.3%) | $22,500 |
| Female | 1,557 (57.7%) | $12,264 |
| Total | 2,697 (100.0%) | $18,709 |
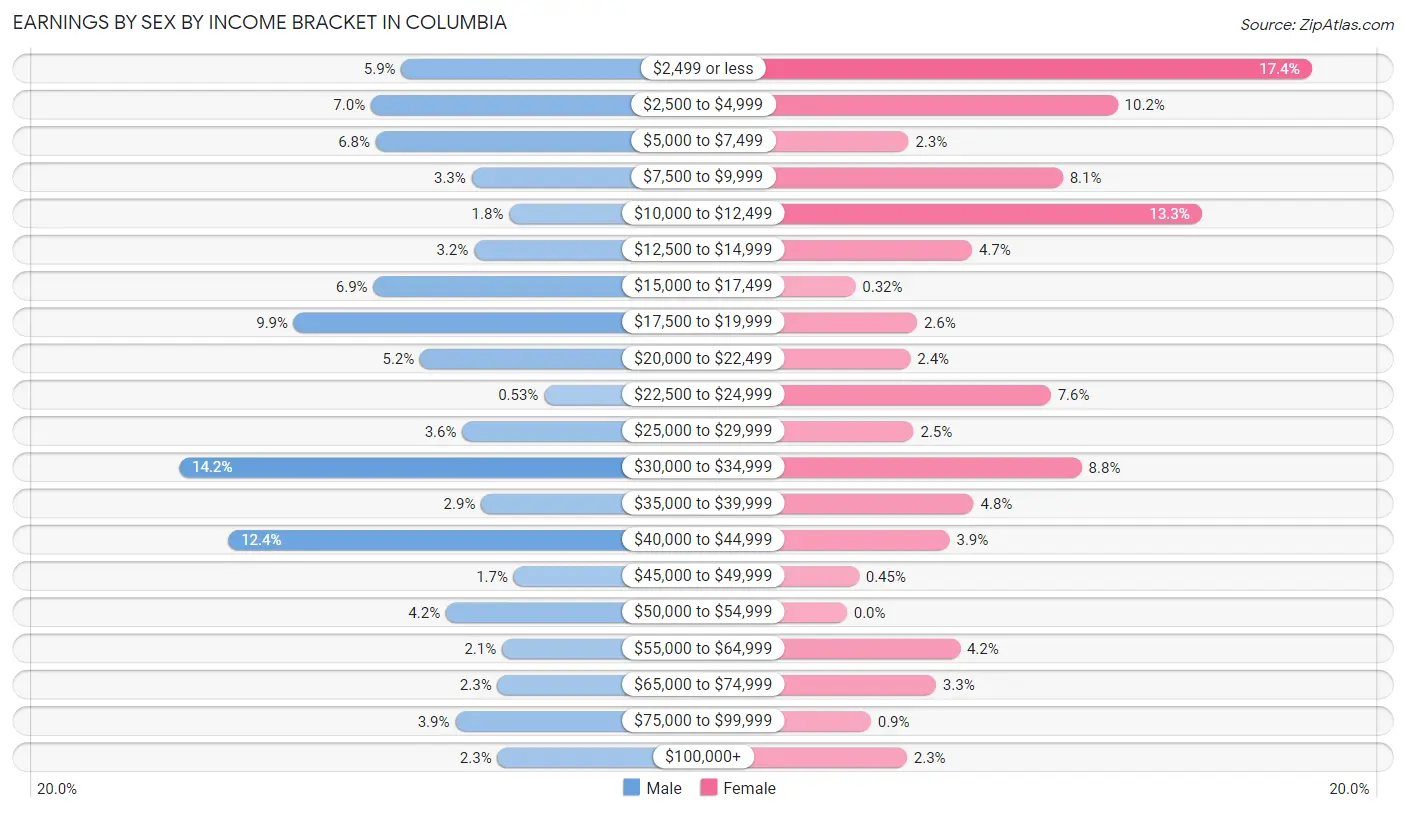
Earnings by Sex by Income Bracket in Columbia
The most common earnings brackets in Columbia are $30,000 to $34,999 for men (162 | 14.2%) and $2,499 or less for women (271 | 17.4%).
| Income | Male | Female |
| $2,499 or less | 67 (5.9%) | 271 (17.4%) |
| $2,500 to $4,999 | 80 (7.0%) | 158 (10.2%) |
| $5,000 to $7,499 | 78 (6.8%) | 36 (2.3%) |
| $7,500 to $9,999 | 37 (3.3%) | 126 (8.1%) |
| $10,000 to $12,499 | 21 (1.8%) | 207 (13.3%) |
| $12,500 to $14,999 | 36 (3.2%) | 73 (4.7%) |
| $15,000 to $17,499 | 79 (6.9%) | 5 (0.3%) |
| $17,500 to $19,999 | 113 (9.9%) | 41 (2.6%) |
| $20,000 to $22,499 | 59 (5.2%) | 37 (2.4%) |
| $22,500 to $24,999 | 6 (0.5%) | 119 (7.6%) |
| $25,000 to $29,999 | 41 (3.6%) | 39 (2.5%) |
| $30,000 to $34,999 | 162 (14.2%) | 137 (8.8%) |
| $35,000 to $39,999 | 33 (2.9%) | 74 (4.8%) |
| $40,000 to $44,999 | 141 (12.4%) | 60 (3.8%) |
| $45,000 to $49,999 | 19 (1.7%) | 7 (0.4%) |
| $50,000 to $54,999 | 48 (4.2%) | 0 (0.0%) |
| $55,000 to $64,999 | 24 (2.1%) | 66 (4.2%) |
| $65,000 to $74,999 | 26 (2.3%) | 52 (3.3%) |
| $75,000 to $99,999 | 44 (3.9%) | 14 (0.9%) |
| $100,000+ | 26 (2.3%) | 35 (2.2%) |
| Total | 1,140 (100.0%) | 1,557 (100.0%) |
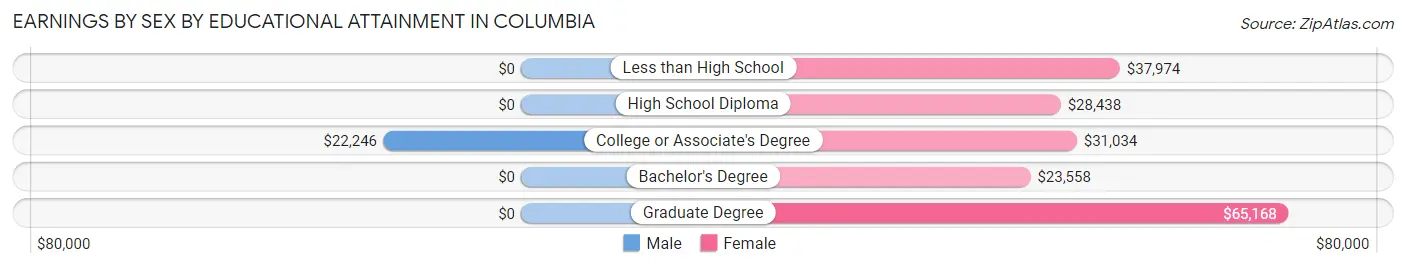
Earnings by Sex by Educational Attainment in Columbia
Average earnings in Columbia are $26,359 for men and $32,276 for women, a difference of 18.3%. Men with an educational attainment of college or associate's degree enjoy the highest average annual earnings of $22,246, while those with college or associate's degree education earn the least with $22,246. Women with an educational attainment of graduate degree earn the most with the average annual earnings of $65,168, while those with bachelor's degree education have the smallest earnings of $23,558.
| Educational Attainment | Male Income | Female Income |
| Less than High School | - | - |
| High School Diploma | - | - |
| College or Associate's Degree | $22,246 | $31,034 |
| Bachelor's Degree | - | - |
| Graduate Degree | - | - |
| Total | $26,359 | $32,276 |
Family Income in Columbia
Family Income Brackets in Columbia
According to the Columbia family income data, there are 217 families falling into the $50,000 to $74,999 income range, which is the most common income bracket and makes up 23.5% of all families. Conversely, the less than $10,000 income bracket is the least frequent group with only 23 families (2.5%) belonging to this category.
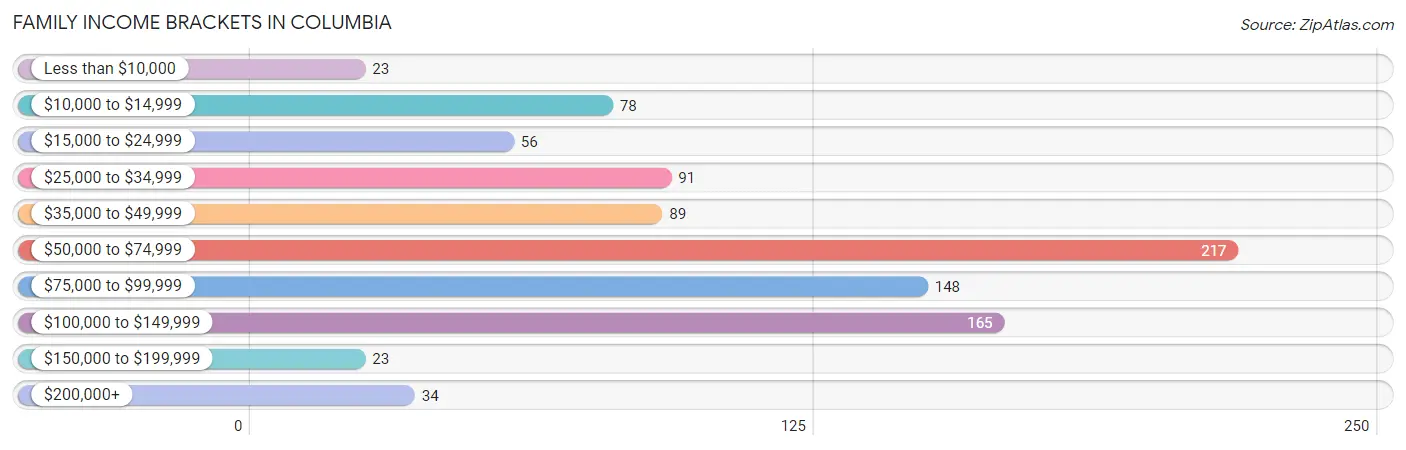
| Income Bracket | # Families | % Families |
| Less than $10,000 | 23 | 2.5% |
| $10,000 to $14,999 | 78 | 8.4% |
| $15,000 to $24,999 | 56 | 6.1% |
| $25,000 to $34,999 | 91 | 9.8% |
| $35,000 to $49,999 | 89 | 9.6% |
| $50,000 to $74,999 | 217 | 23.5% |
| $75,000 to $99,999 | 148 | 16.0% |
| $100,000 to $149,999 | 165 | 17.9% |
| $150,000 to $199,999 | 23 | 2.5% |
| $200,000+ | 34 | 3.7% |
Family Income by Famaliy Size in Columbia
4-person families (205 | 22.2%) account for the highest median family income in Columbia with $85,817 per family, while 2-person families (557 | 60.3%) have the highest median income of $34,279 per family member.
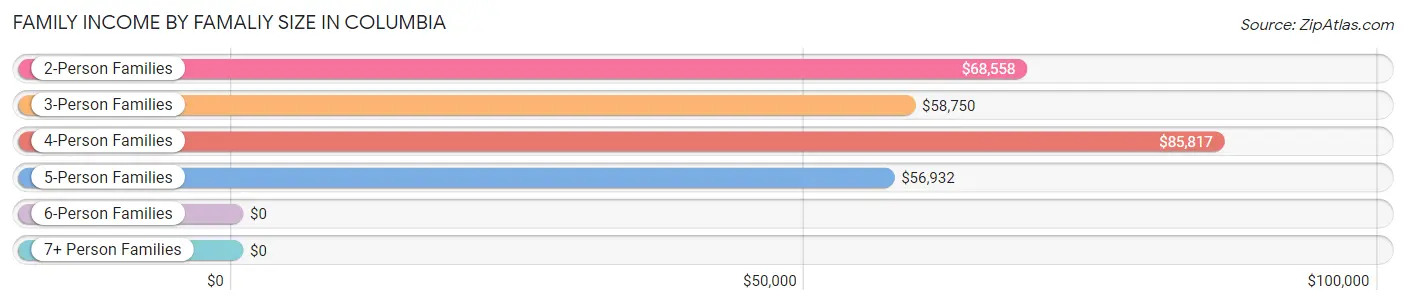
| Income Bracket | # Families | Median Income |
| 2-Person Families | 557 (60.3%) | $68,558 |
| 3-Person Families | 114 (12.3%) | $58,750 |
| 4-Person Families | 205 (22.2%) | $85,817 |
| 5-Person Families | 33 (3.6%) | $56,932 |
| 6-Person Families | 15 (1.6%) | $0 |
| 7+ Person Families | 0 (0.0%) | $0 |
| Total | 924 (100.0%) | $64,360 |
Family Income by Number of Earners in Columbia
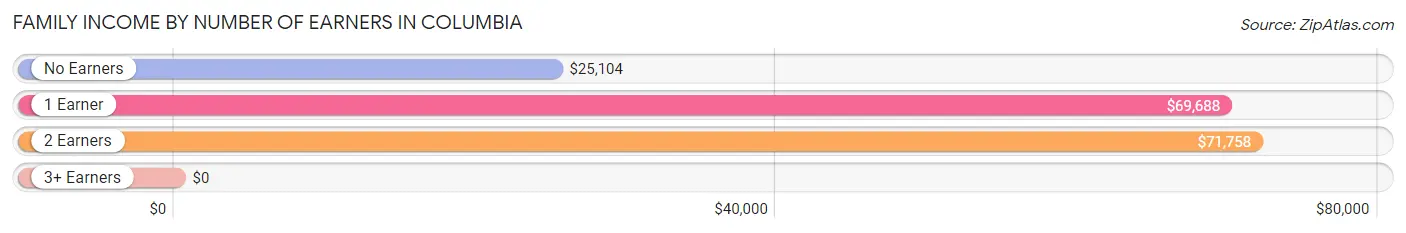
| Number of Earners | # Families | Median Income |
| No Earners | 198 (21.4%) | $25,104 |
| 1 Earner | 218 (23.6%) | $69,688 |
| 2 Earners | 479 (51.8%) | $71,758 |
| 3+ Earners | 29 (3.1%) | $0 |
| Total | 924 (100.0%) | $64,360 |
Household Income in Columbia
Household Income Brackets in Columbia
With 338 households falling in the category, the $35,000 to $49,999 income range is the most frequent in Columbia, accounting for 21.7% of all households. In contrast, only 23 households (1.5%) fall into the $150,000 to $199,999 income bracket, making it the least populous group.
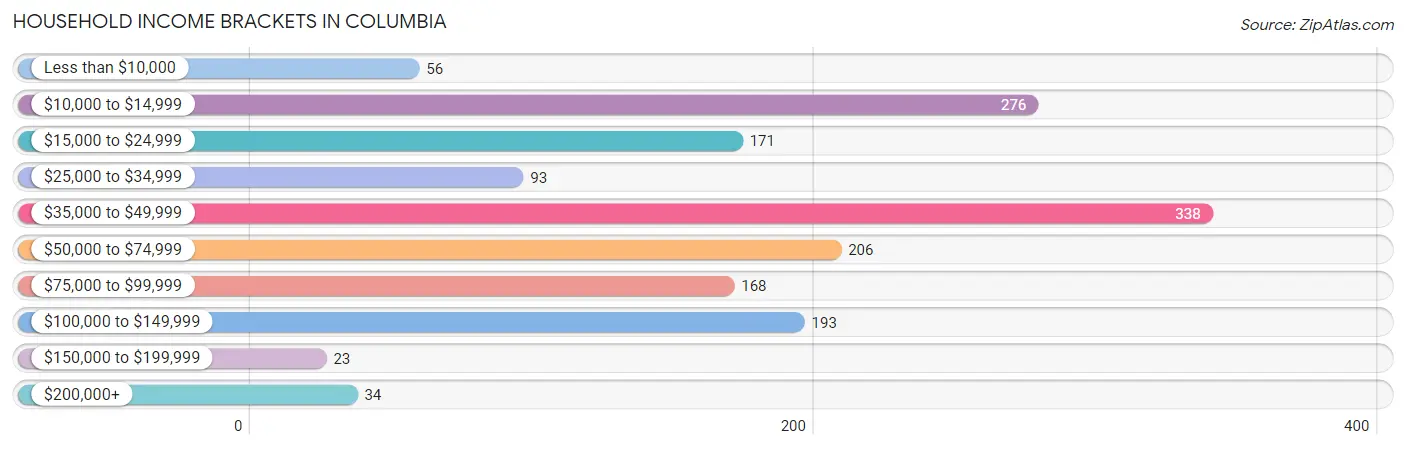
| Income Bracket | # Households | % Households |
| Less than $10,000 | 56 | 3.6% |
| $10,000 to $14,999 | 276 | 17.7% |
| $15,000 to $24,999 | 171 | 11.0% |
| $25,000 to $34,999 | 93 | 6.0% |
| $35,000 to $49,999 | 338 | 21.7% |
| $50,000 to $74,999 | 206 | 13.2% |
| $75,000 to $99,999 | 168 | 10.8% |
| $100,000 to $149,999 | 193 | 12.4% |
| $150,000 to $199,999 | 23 | 1.5% |
| $200,000+ | 34 | 2.2% |
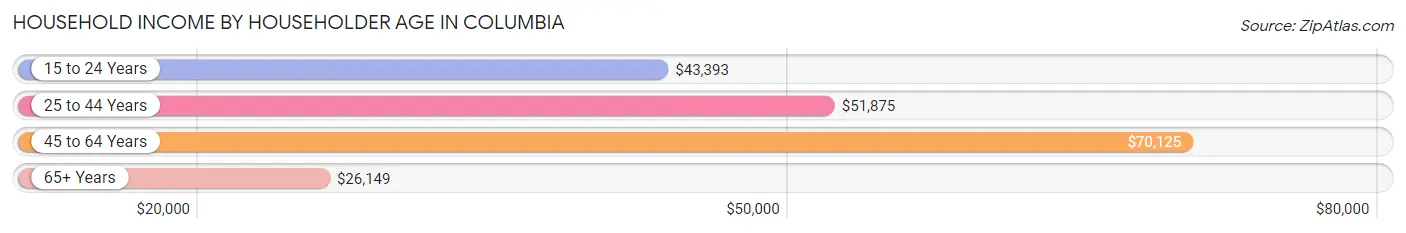
Household Income by Householder Age in Columbia
The median household income in Columbia is $45,163, with the highest median household income of $70,125 found in the 45 to 64 years age bracket for the primary householder. A total of 500 households (32.1%) fall into this category. Meanwhile, the 65+ years age bracket for the primary householder has the lowest median household income of $26,149, with 372 households (23.9%) in this group.
| Income Bracket | # Households | Median Income |
| 15 to 24 Years | 177 (11.4%) | $43,393 |
| 25 to 44 Years | 508 (32.6%) | $51,875 |
| 45 to 64 Years | 500 (32.1%) | $70,125 |
| 65+ Years | 372 (23.9%) | $26,149 |
| Total | 1,557 (100.0%) | $45,163 |
Poverty in Columbia
Income Below Poverty by Sex and Age in Columbia
With 11.2% poverty level for males and 25.2% for females among the residents of Columbia, 12 to 14 year old males and 12 to 14 year old females are the most vulnerable to poverty, with 19 males (28.8%) and 7 females (100.0%) in their respective age groups living below the poverty level.
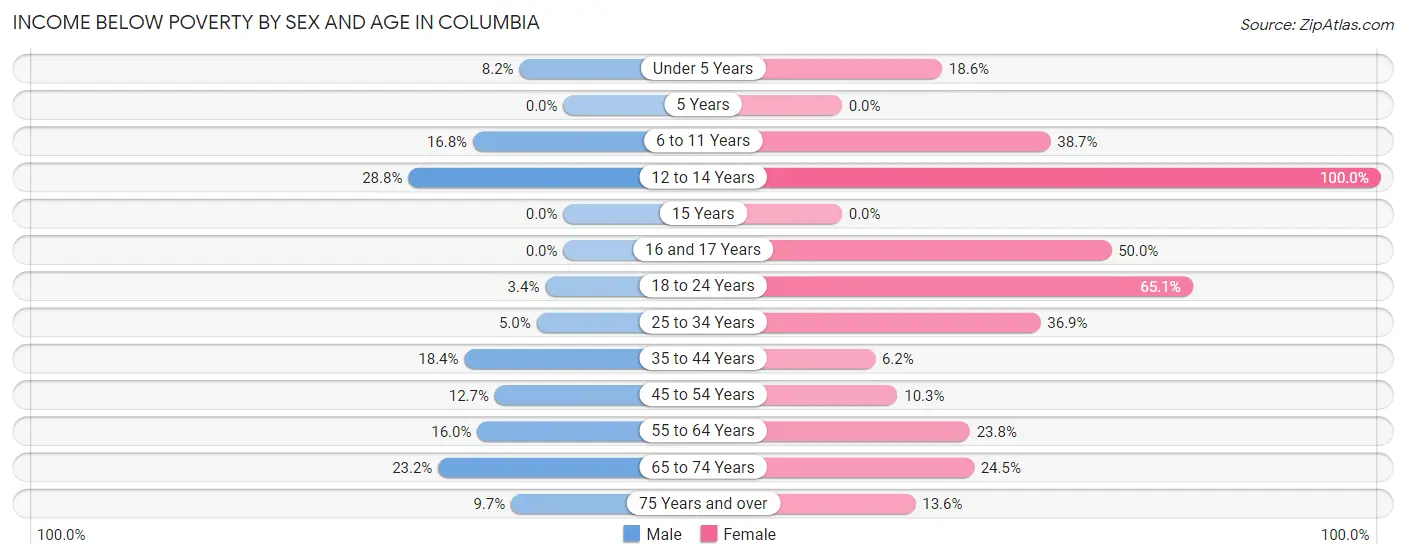
| Age Bracket | Male | Female |
| Under 5 Years | 11 (8.2%) | 21 (18.6%) |
| 5 Years | 0 (0.0%) | 0 (0.0%) |
| 6 to 11 Years | 25 (16.8%) | 48 (38.7%) |
| 12 to 14 Years | 19 (28.8%) | 7 (100.0%) |
| 15 Years | 0 (0.0%) | 0 (0.0%) |
| 16 and 17 Years | 0 (0.0%) | 11 (50.0%) |
| 18 to 24 Years | 11 (3.4%) | 97 (65.1%) |
| 25 to 34 Years | 12 (5.0%) | 101 (36.9%) |
| 35 to 44 Years | 27 (18.4%) | 15 (6.1%) |
| 45 to 54 Years | 21 (12.7%) | 23 (10.3%) |
| 55 to 64 Years | 27 (16.0%) | 62 (23.7%) |
| 65 to 74 Years | 36 (23.2%) | 36 (24.5%) |
| 75 Years and over | 17 (9.7%) | 27 (13.6%) |
| Total | 206 (11.2%) | 448 (25.2%) |
Income Above Poverty by Sex and Age in Columbia
According to the poverty statistics in Columbia, males aged 5 years and females aged 5 years are the age groups that are most secure financially, with 100.0% of males and 100.0% of females in these age groups living above the poverty line.
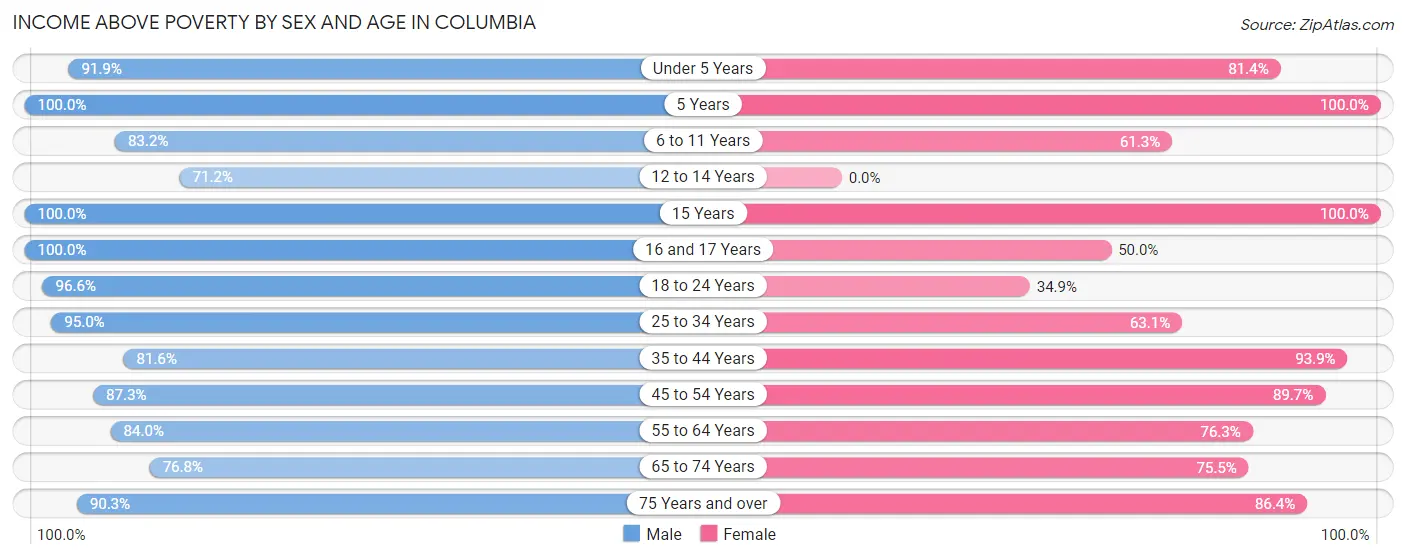
| Age Bracket | Male | Female |
| Under 5 Years | 124 (91.8%) | 92 (81.4%) |
| 5 Years | 34 (100.0%) | 7 (100.0%) |
| 6 to 11 Years | 124 (83.2%) | 76 (61.3%) |
| 12 to 14 Years | 47 (71.2%) | 0 (0.0%) |
| 15 Years | 13 (100.0%) | 10 (100.0%) |
| 16 and 17 Years | 65 (100.0%) | 11 (50.0%) |
| 18 to 24 Years | 316 (96.6%) | 52 (34.9%) |
| 25 to 34 Years | 229 (95.0%) | 173 (63.1%) |
| 35 to 44 Years | 120 (81.6%) | 229 (93.9%) |
| 45 to 54 Years | 144 (87.3%) | 200 (89.7%) |
| 55 to 64 Years | 142 (84.0%) | 199 (76.2%) |
| 65 to 74 Years | 119 (76.8%) | 111 (75.5%) |
| 75 Years and over | 158 (90.3%) | 171 (86.4%) |
| Total | 1,635 (88.8%) | 1,331 (74.8%) |
Income Below Poverty Among Married-Couple Families in Columbia
The poverty statistics for married-couple families in Columbia show that 6.4% or 41 of the total 643 families live below the poverty line. Families with 3 or 4 children have the highest poverty rate of 16.7%, comprising of 8 families. On the other hand, families with no children have the lowest poverty rate of 5.2%, which includes 18 families.
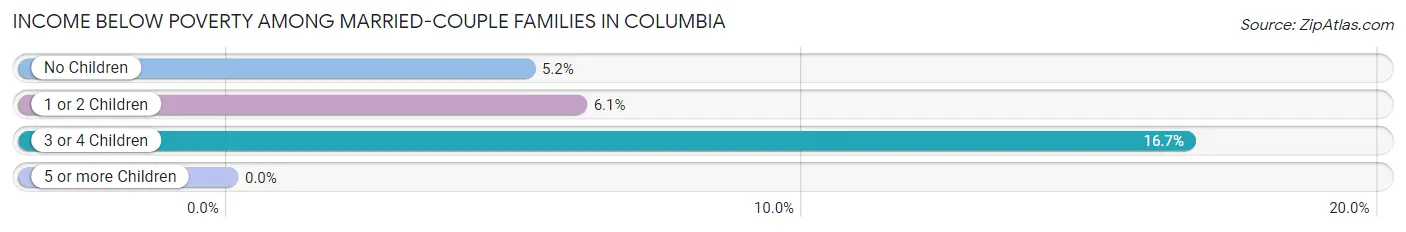
| Children | Above Poverty | Below Poverty |
| No Children | 330 (94.8%) | 18 (5.2%) |
| 1 or 2 Children | 232 (93.9%) | 15 (6.1%) |
| 3 or 4 Children | 40 (83.3%) | 8 (16.7%) |
| 5 or more Children | 0 (0.0%) | 0 (0.0%) |
| Total | 602 (93.6%) | 41 (6.4%) |
Income Below Poverty Among Single-Parent Households in Columbia
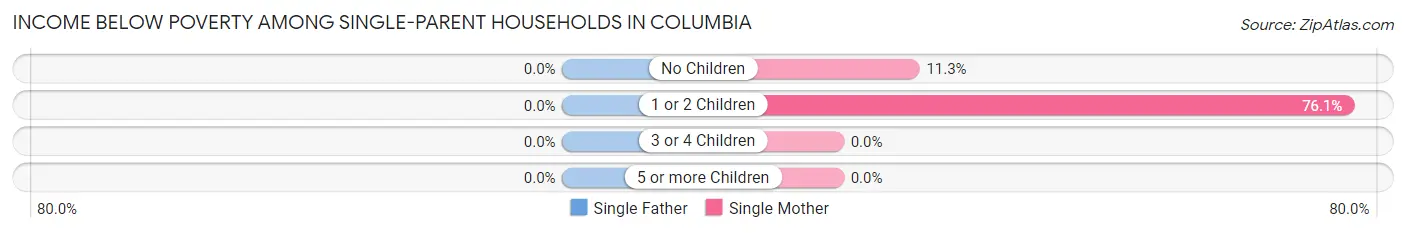
| Children | Single Father | Single Mother |
| No Children | 0 (0.0%) | 7 (11.3%) |
| 1 or 2 Children | 0 (0.0%) | 89 (76.1%) |
| 3 or 4 Children | 0 (0.0%) | 0 (0.0%) |
| 5 or more Children | 0 (0.0%) | 0 (0.0%) |
| Total | 0 (0.0%) | 96 (53.6%) |
Income Below Poverty Among Married-Couple vs Single-Parent Households in Columbia
The poverty data for Columbia shows that 41 of the married-couple family households (6.4%) and 96 of the single-parent households (34.2%) are living below the poverty level. Within the married-couple family households, those with 3 or 4 children have the highest poverty rate, with 8 households (16.7%) falling below the poverty line. Among the single-parent households, those with 1 or 2 children have the highest poverty rate, with 89 household (52.7%) living below poverty.
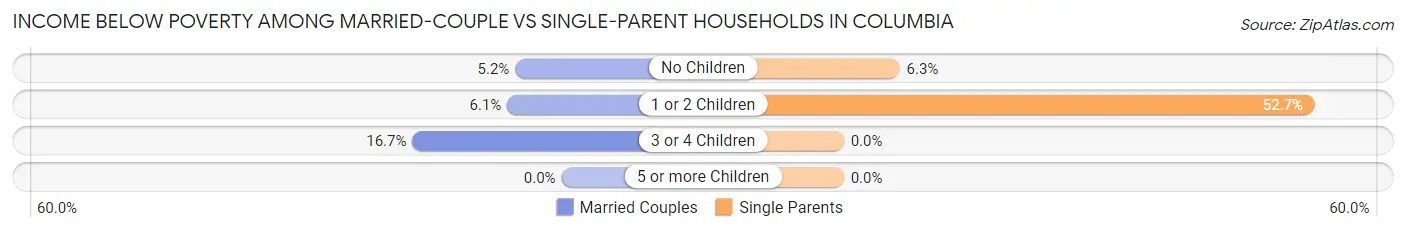
| Children | Married-Couple Families | Single-Parent Households |
| No Children | 18 (5.2%) | 7 (6.2%) |
| 1 or 2 Children | 15 (6.1%) | 89 (52.7%) |
| 3 or 4 Children | 8 (16.7%) | 0 (0.0%) |
| 5 or more Children | 0 (0.0%) | 0 (0.0%) |
| Total | 41 (6.4%) | 96 (34.2%) |
Race in Columbia
The most populous races in Columbia are White / Caucasian (4,336 | 90.1%), Two or more Races (342 | 7.1%), and Hispanic or Latino (276 | 5.7%).
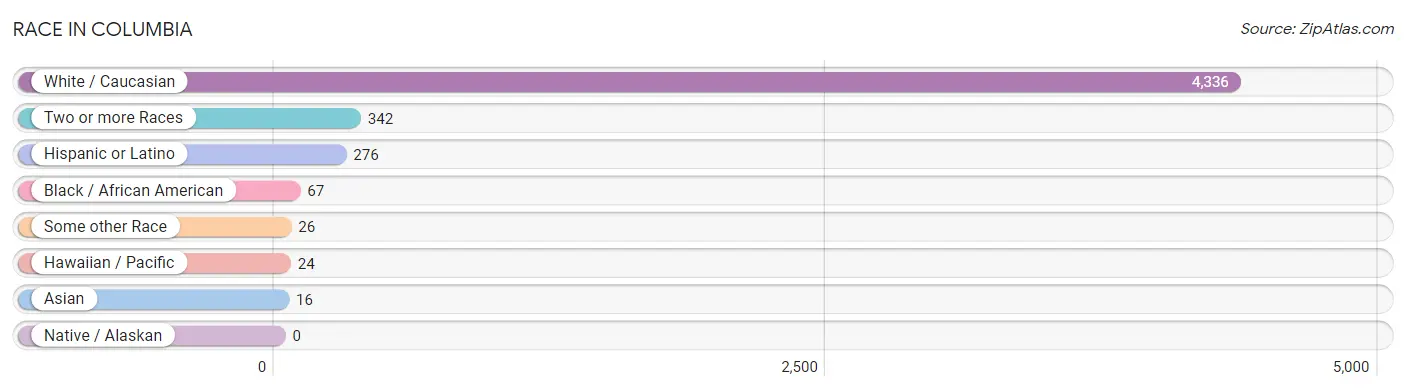
| Race | # Population | % Population |
| Asian | 16 | 0.3% |
| Black / African American | 67 | 1.4% |
| Hawaiian / Pacific | 24 | 0.5% |
| Hispanic or Latino | 276 | 5.7% |
| Native / Alaskan | 0 | 0.0% |
| White / Caucasian | 4,336 | 90.1% |
| Two or more Races | 342 | 7.1% |
| Some other Race | 26 | 0.5% |
| Total | 4,811 | 100.0% |
Ancestry in Columbia
The most populous ancestries reported in Columbia are English (584 | 12.1%), American (480 | 10.0%), German (395 | 8.2%), Irish (311 | 6.5%), and Mexican (251 | 5.2%), together accounting for 42.0% of all Columbia residents.
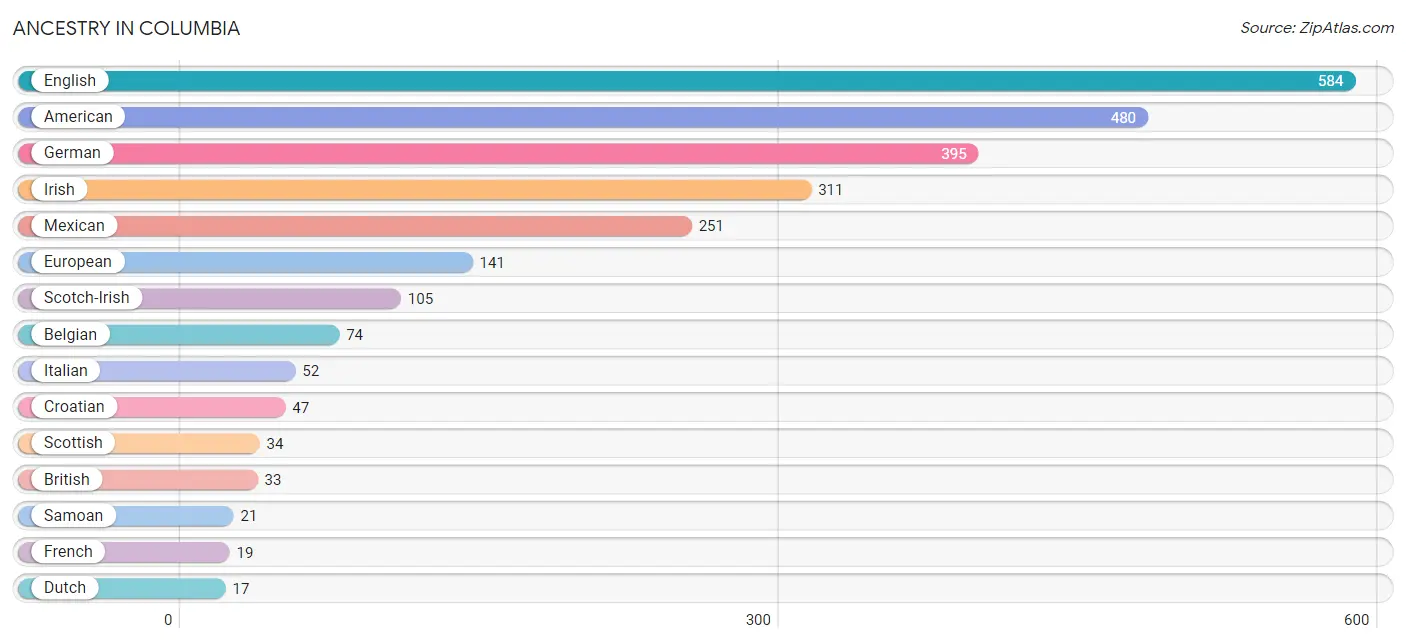
| Ancestry | # Population | % Population |
| African | 8 | 0.2% |
| American | 480 | 10.0% |
| Belgian | 74 | 1.5% |
| Bhutanese | 11 | 0.2% |
| British | 33 | 0.7% |
| Central American | 12 | 0.3% |
| Cherokee | 6 | 0.1% |
| Colombian | 7 | 0.2% |
| Croatian | 47 | 1.0% |
| Czechoslovakian | 8 | 0.2% |
| Dutch | 17 | 0.4% |
| English | 584 | 12.1% |
| European | 141 | 2.9% |
| French | 19 | 0.4% |
| French Canadian | 3 | 0.1% |
| German | 395 | 8.2% |
| Guatemalan | 12 | 0.3% |
| Iranian | 5 | 0.1% |
| Irish | 311 | 6.5% |
| Italian | 52 | 1.1% |
| Lumbee | 2 | 0.0% |
| Mexican | 251 | 5.2% |
| Norwegian | 10 | 0.2% |
| Polish | 14 | 0.3% |
| Portuguese | 1 | 0.0% |
| Samoan | 21 | 0.4% |
| Scotch-Irish | 105 | 2.2% |
| Scottish | 34 | 0.7% |
| South American | 7 | 0.2% |
| Spaniard | 2 | 0.0% |
| Subsaharan African | 9 | 0.2% |
| Swedish | 13 | 0.3% |
| Thai | 5 | 0.1% |
| Ugandan | 1 | 0.0% | View All 34 Rows |
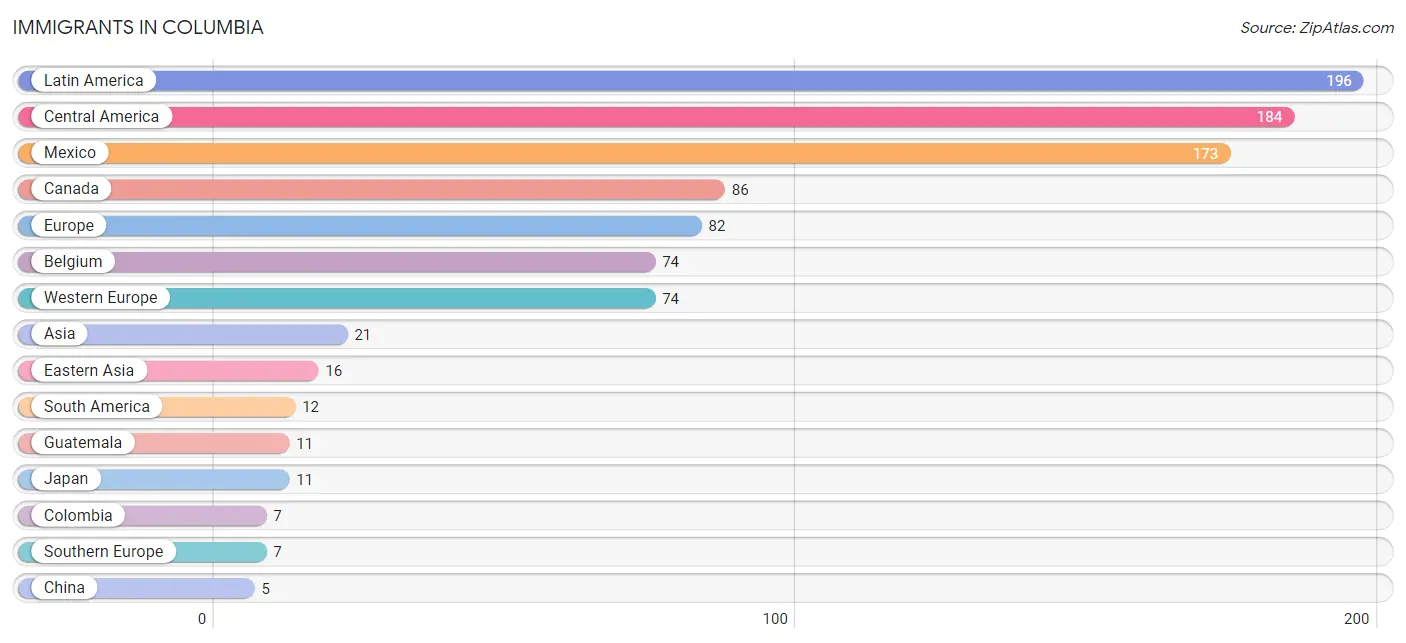
Immigrants in Columbia
The most numerous immigrant groups reported in Columbia came from Latin America (196 | 4.1%), Central America (184 | 3.8%), Mexico (173 | 3.6%), Canada (86 | 1.8%), and Europe (82 | 1.7%), together accounting for 15.0% of all Columbia residents.
| Immigration Origin | # Population | % Population |
| Africa | 1 | 0.0% |
| Asia | 21 | 0.4% |
| Belgium | 74 | 1.5% |
| Canada | 86 | 1.8% |
| Central America | 184 | 3.8% |
| China | 5 | 0.1% |
| Colombia | 7 | 0.2% |
| Eastern Africa | 1 | 0.0% |
| Eastern Asia | 16 | 0.3% |
| England | 1 | 0.0% |
| Europe | 82 | 1.7% |
| Guatemala | 11 | 0.2% |
| Iran | 5 | 0.1% |
| Italy | 4 | 0.1% |
| Japan | 11 | 0.2% |
| Latin America | 196 | 4.1% |
| Mexico | 173 | 3.6% |
| Northern Europe | 1 | 0.0% |
| Portugal | 1 | 0.0% |
| South America | 12 | 0.3% |
| South Central Asia | 5 | 0.1% |
| Southern Europe | 7 | 0.2% |
| Spain | 2 | 0.0% |
| Uganda | 1 | 0.0% |
| Venezuela | 5 | 0.1% |
| Western Europe | 74 | 1.5% | View All 26 Rows |
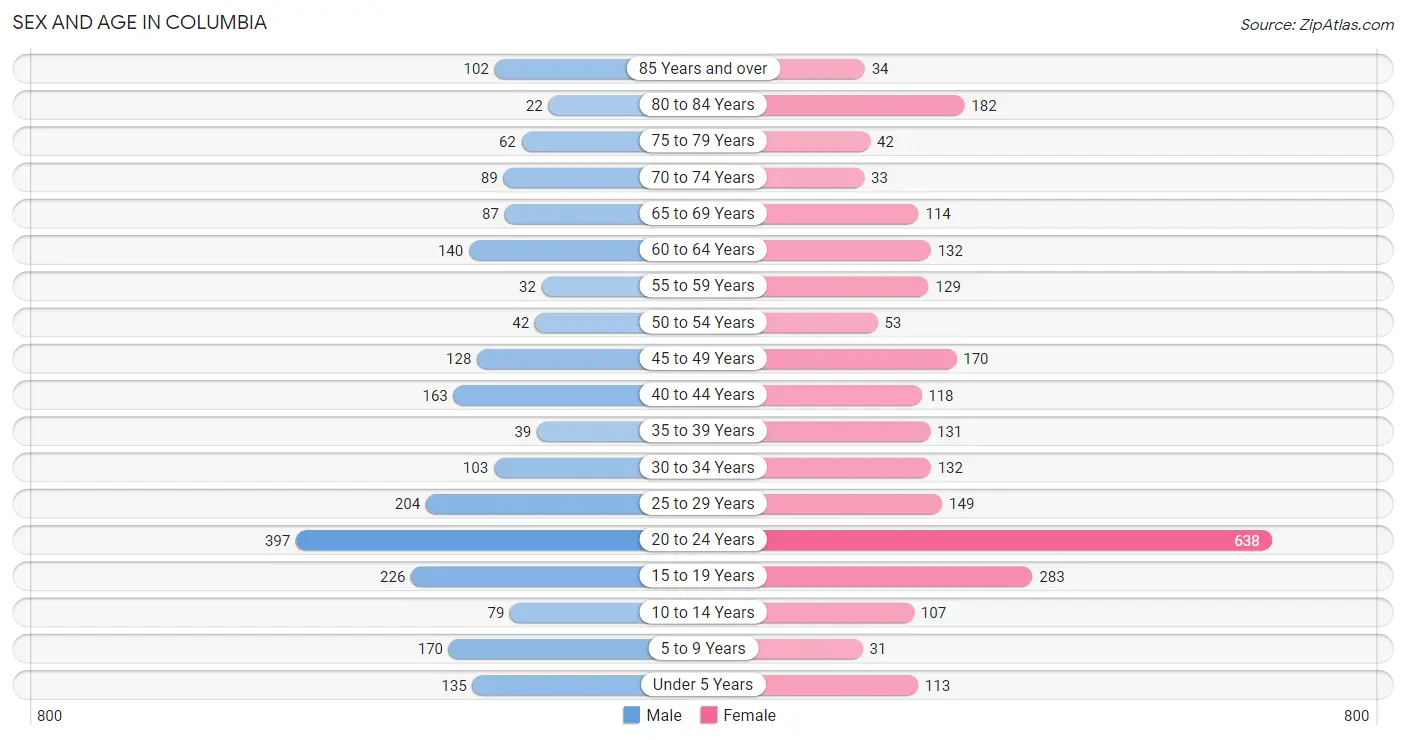
Sex and Age in Columbia
Sex and Age in Columbia
The most populous age groups in Columbia are 20 to 24 Years (397 | 17.9%) for men and 20 to 24 Years (638 | 24.6%) for women.
| Age Bracket | Male | Female |
| Under 5 Years | 135 (6.1%) | 113 (4.4%) |
| 5 to 9 Years | 170 (7.7%) | 31 (1.2%) |
| 10 to 14 Years | 79 (3.6%) | 107 (4.1%) |
| 15 to 19 Years | 226 (10.2%) | 283 (10.9%) |
| 20 to 24 Years | 397 (17.9%) | 638 (24.6%) |
| 25 to 29 Years | 204 (9.2%) | 149 (5.8%) |
| 30 to 34 Years | 103 (4.6%) | 132 (5.1%) |
| 35 to 39 Years | 39 (1.8%) | 131 (5.1%) |
| 40 to 44 Years | 163 (7.3%) | 118 (4.5%) |
| 45 to 49 Years | 128 (5.8%) | 170 (6.6%) |
| 50 to 54 Years | 42 (1.9%) | 53 (2.1%) |
| 55 to 59 Years | 32 (1.4%) | 129 (5.0%) |
| 60 to 64 Years | 140 (6.3%) | 132 (5.1%) |
| 65 to 69 Years | 87 (3.9%) | 114 (4.4%) |
| 70 to 74 Years | 89 (4.0%) | 33 (1.3%) |
| 75 to 79 Years | 62 (2.8%) | 42 (1.6%) |
| 80 to 84 Years | 22 (1.0%) | 182 (7.0%) |
| 85 Years and over | 102 (4.6%) | 34 (1.3%) |
| Total | 2,220 (100.0%) | 2,591 (100.0%) |
Families and Households in Columbia
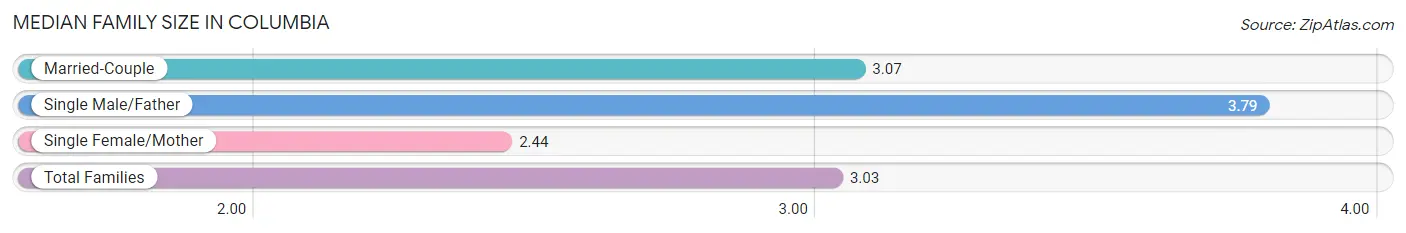
Median Family Size in Columbia
The median family size in Columbia is 3.03 persons per family, with single male/father families (102 | 11.0%) accounting for the largest median family size of 3.79 persons per family. On the other hand, single female/mother families (179 | 19.4%) represent the smallest median family size with 2.44 persons per family.
| Family Type | # Families | Family Size |
| Married-Couple | 643 (69.6%) | 3.07 |
| Single Male/Father | 102 (11.0%) | 3.79 |
| Single Female/Mother | 179 (19.4%) | 2.44 |
| Total Families | 924 (100.0%) | 3.03 |
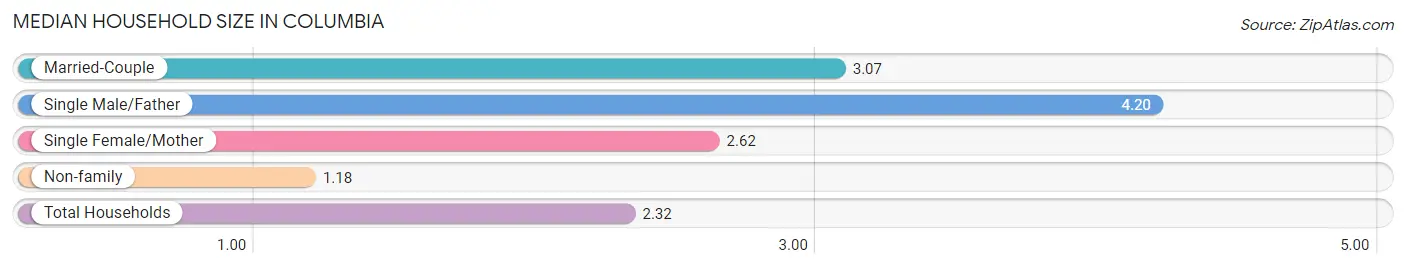
Median Household Size in Columbia
The median household size in Columbia is 2.32 persons per household, with single male/father households (102 | 6.6%) accounting for the largest median household size of 4.2 persons per household. non-family households (633 | 40.7%) represent the smallest median household size with 1.18 persons per household.
| Household Type | # Households | Household Size |
| Married-Couple | 643 (41.3%) | 3.07 |
| Single Male/Father | 102 (6.6%) | 4.20 |
| Single Female/Mother | 179 (11.5%) | 2.62 |
| Non-family | 633 (40.7%) | 1.18 |
| Total Households | 1,557 (100.0%) | 2.32 |
Household Size by Marriage Status in Columbia
Out of a total of 1,557 households in Columbia, 924 (59.3%) are family households, while 633 (40.7%) are nonfamily households. The most numerous type of family households are 2-person households, comprising 512, and the most common type of nonfamily households are 1-person households, comprising 531.
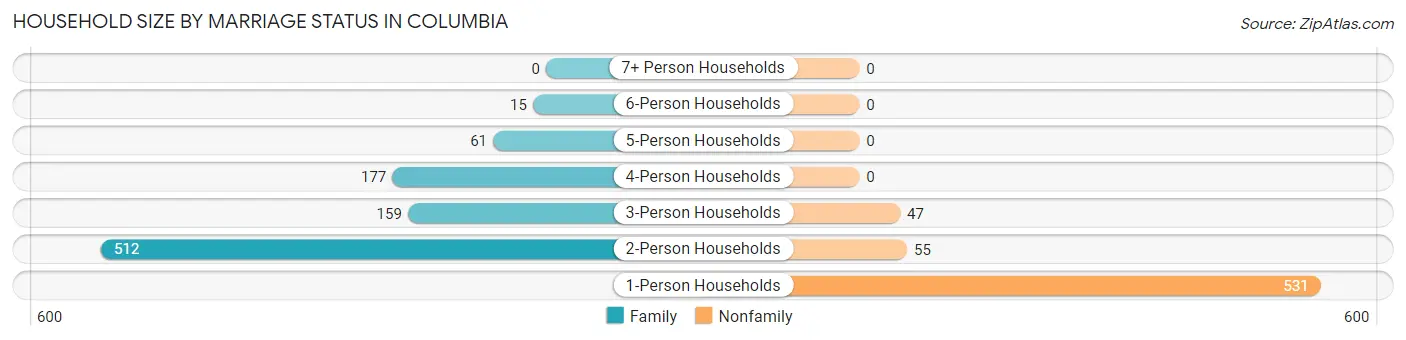
| Household Size | Family Households | Nonfamily Households |
| 1-Person Households | - | 531 (34.1%) |
| 2-Person Households | 512 (32.9%) | 55 (3.5%) |
| 3-Person Households | 159 (10.2%) | 47 (3.0%) |
| 4-Person Households | 177 (11.4%) | 0 (0.0%) |
| 5-Person Households | 61 (3.9%) | 0 (0.0%) |
| 6-Person Households | 15 (1.0%) | 0 (0.0%) |
| 7+ Person Households | 0 (0.0%) | 0 (0.0%) |
| Total | 924 (59.3%) | 633 (40.7%) |
Female Fertility in Columbia
Fertility by Age in Columbia
Average fertility rate in Columbia is 19.0 births per 1,000 women. Women in the age bracket of 20 to 34 years have the highest fertility rate with 23.0 births per 1,000 women. Women in the age bracket of 20 to 34 years acount for 70.0% of all women with births.
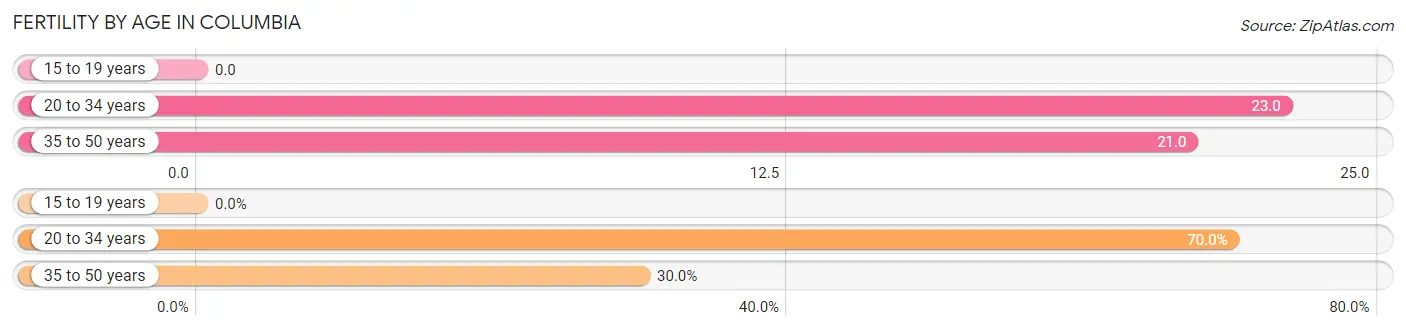
| Age Bracket | Women with Births | Births / 1,000 Women |
| 15 to 19 years | 0 (0.0%) | 0.0 |
| 20 to 34 years | 21 (70.0%) | 23.0 |
| 35 to 50 years | 9 (30.0%) | 21.0 |
| Total | 30 (100.0%) | 19.0 |
Fertility by Age by Marriage Status in Columbia
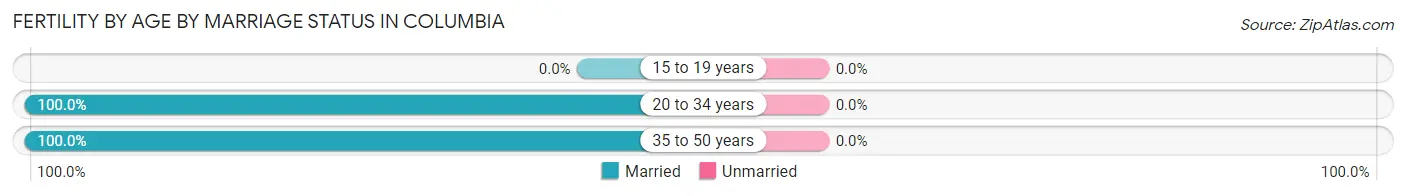
| Age Bracket | Married | Unmarried |
| 15 to 19 years | 0 (0.0%) | 0 (0.0%) |
| 20 to 34 years | 21 (100.0%) | 0 (0.0%) |
| 35 to 50 years | 9 (100.0%) | 0 (0.0%) |
| Total | 30 (100.0%) | 0 (0.0%) |
Fertility by Education in Columbia
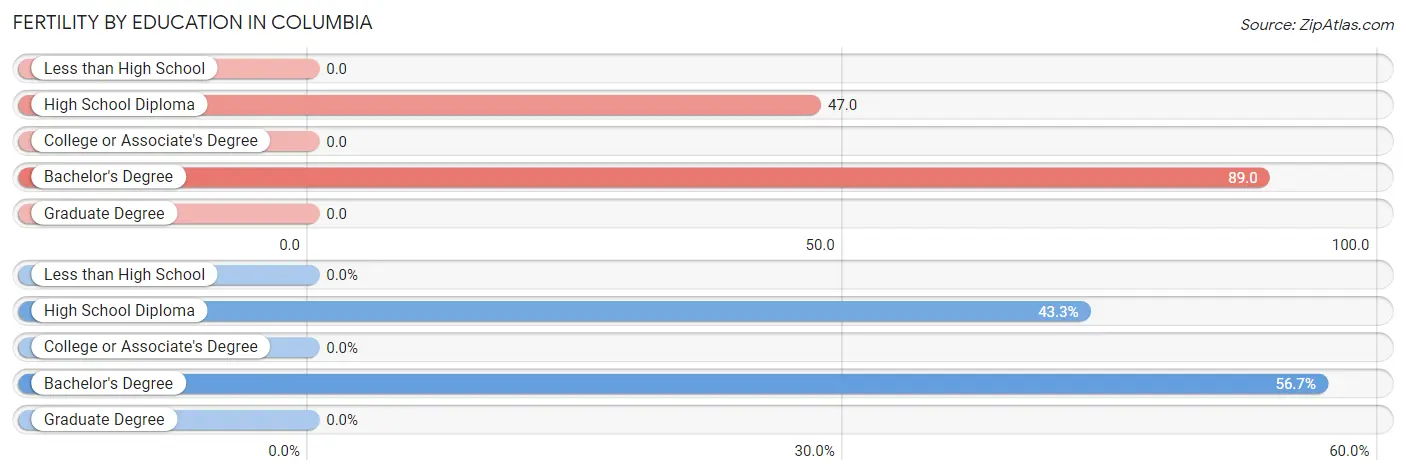
| Educational Attainment | Women with Births | Births / 1,000 Women |
| Less than High School | 0 (0.0%) | 0.0 |
| High School Diploma | 13 (43.3%) | 47.0 |
| College or Associate's Degree | 0 (0.0%) | 0.0 |
| Bachelor's Degree | 17 (56.7%) | 89.0 |
| Graduate Degree | 0 (0.0%) | 0.0 |
| Total | 30 (100.0%) | 19.0 |
Fertility by Education by Marriage Status in Columbia
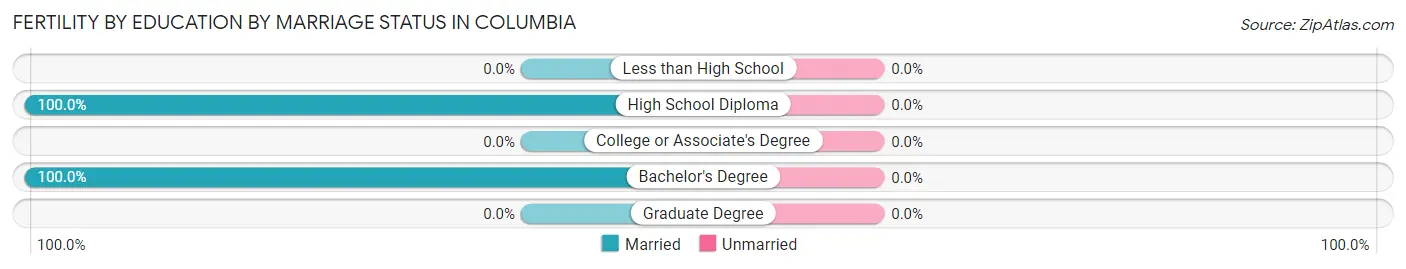
| Educational Attainment | Married | Unmarried |
| Less than High School | 0 (0.0%) | 0 (0.0%) |
| High School Diploma | 13 (100.0%) | 0 (0.0%) |
| College or Associate's Degree | 0 (0.0%) | 0 (0.0%) |
| Bachelor's Degree | 17 (100.0%) | 0 (0.0%) |
| Graduate Degree | 0 (0.0%) | 0 (0.0%) |
| Total | 30 (100.0%) | 0 (0.0%) |
Employment Characteristics in Columbia
Employment by Class of Employer in Columbia
Among the 1,972 employed individuals in Columbia, private company employees (1,319 | 66.9%), state government employees (245 | 12.4%), and not-for-profit organizations (173 | 8.8%) make up the most common classes of employment.
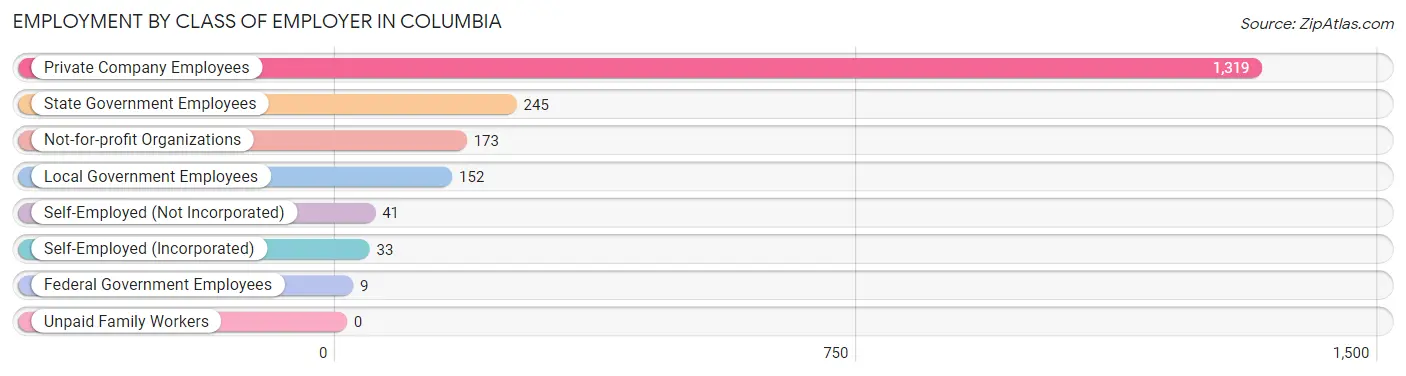
| Employer Class | # Employees | % Employees |
| Private Company Employees | 1,319 | 66.9% |
| Self-Employed (Incorporated) | 33 | 1.7% |
| Self-Employed (Not Incorporated) | 41 | 2.1% |
| Not-for-profit Organizations | 173 | 8.8% |
| Local Government Employees | 152 | 7.7% |
| State Government Employees | 245 | 12.4% |
| Federal Government Employees | 9 | 0.5% |
| Unpaid Family Workers | 0 | 0.0% |
| Total | 1,972 | 100.0% |
Employment Status by Age in Columbia
According to the labor force statistics for Columbia, out of the total population over 16 years of age (4,153), 52.3% or 2,172 individuals are in the labor force, with 5.8% or 126 of them unemployed. The age group with the highest labor force participation rate is 45 to 54 years, with 84.7% or 333 individuals in the labor force. Within the labor force, the 20 to 24 years age range has the highest percentage of unemployed individuals, with 10.7% or 63 of them being unemployed.
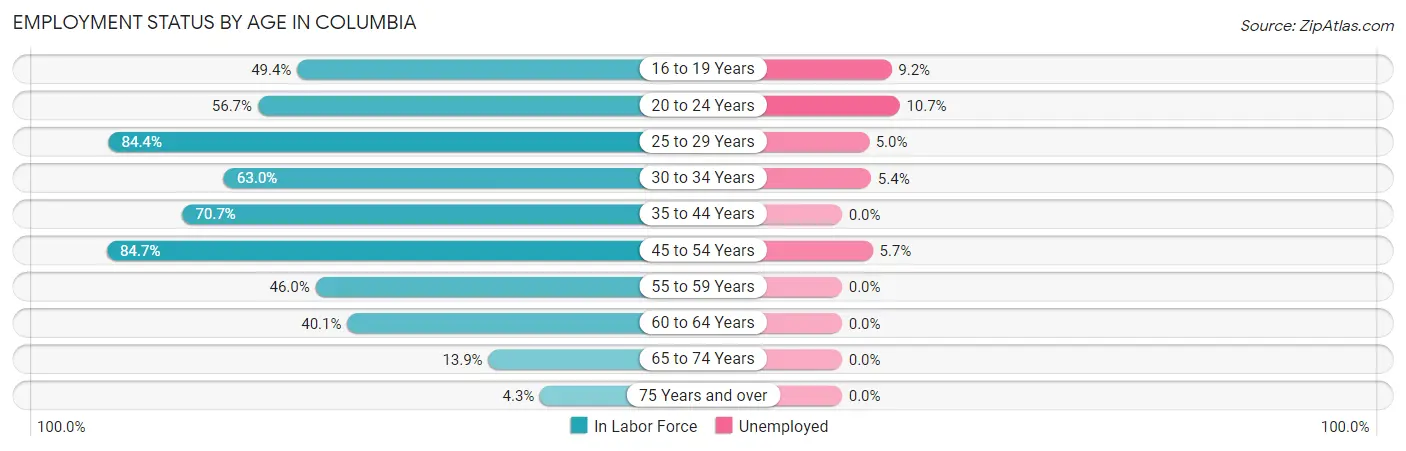
| Age Bracket | In Labor Force | Unemployed |
| 16 to 19 Years | 240 (49.4%) | 22 (9.2%) |
| 20 to 24 Years | 587 (56.7%) | 63 (10.7%) |
| 25 to 29 Years | 298 (84.4%) | 15 (5.0%) |
| 30 to 34 Years | 148 (63.0%) | 8 (5.4%) |
| 35 to 44 Years | 319 (70.7%) | 0 (0.0%) |
| 45 to 54 Years | 333 (84.7%) | 19 (5.7%) |
| 55 to 59 Years | 74 (46.0%) | 0 (0.0%) |
| 60 to 64 Years | 109 (40.1%) | 0 (0.0%) |
| 65 to 74 Years | 45 (13.9%) | 0 (0.0%) |
| 75 Years and over | 19 (4.3%) | 0 (0.0%) |
| Total | 2,172 (52.3%) | 126 (5.8%) |
Employment Status by Educational Attainment in Columbia
According to labor force statistics for Columbia, 68.7% of individuals (1,281) out of the total population between 25 and 64 years of age (1,865) are in the labor force, with 3.3% or 42 of them being unemployed. The group with the highest labor force participation rate are those with the educational attainment of bachelor's degree or higher, with 89.4% or 261 individuals in the labor force. Within the labor force, individuals with bachelor's degree or higher education have the highest percentage of unemployment, with 4.2% or 11 of them being unemployed.
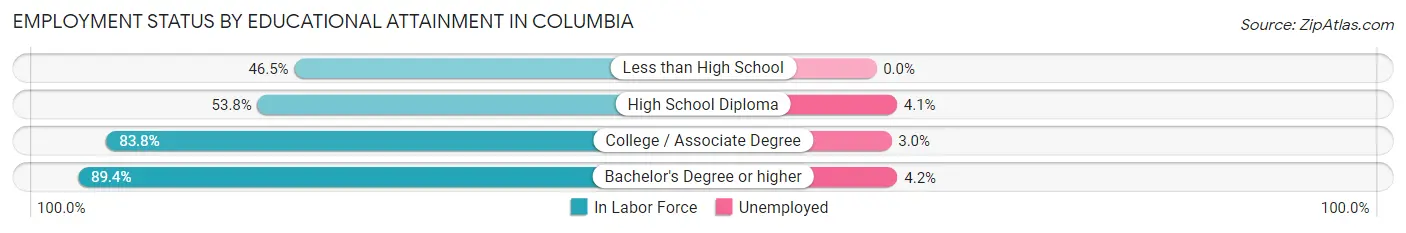
| Educational Attainment | In Labor Force | Unemployed |
| Less than High School | 119 (46.5%) | 0 (0.0%) |
| High School Diploma | 364 (53.8%) | 28 (4.1%) |
| College / Associate Degree | 537 (83.8%) | 19 (3.0%) |
| Bachelor's Degree or higher | 261 (89.4%) | 12 (4.2%) |
| Total | 1,281 (68.7%) | 62 (3.3%) |
Employment Occupations by Sex in Columbia
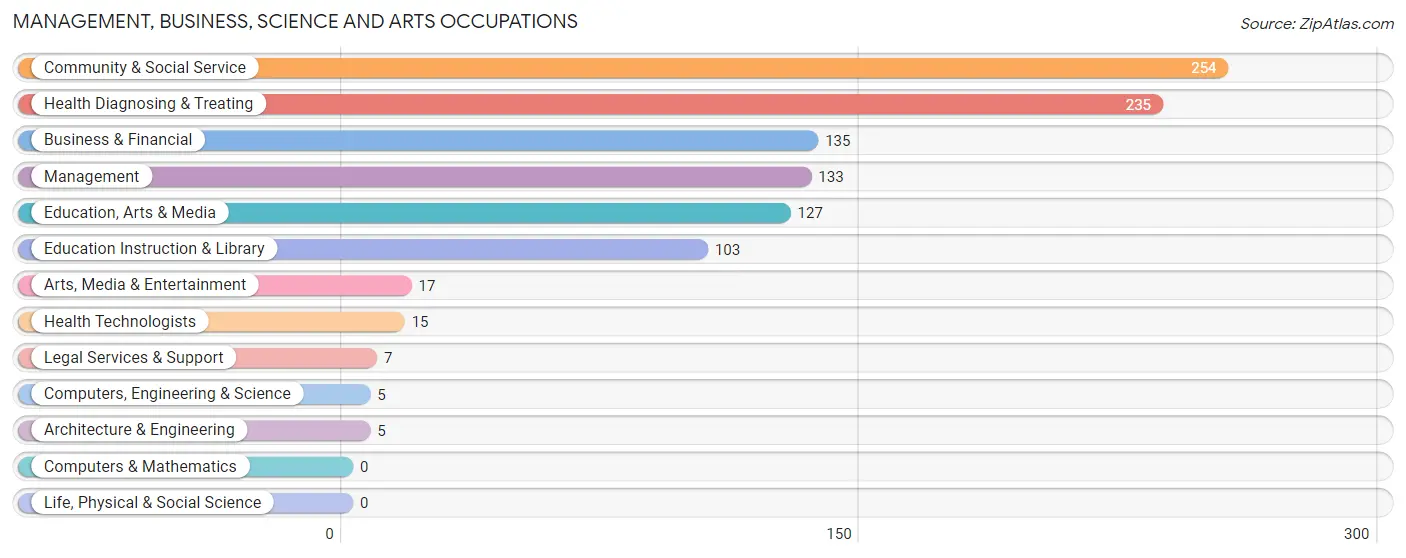
Management, Business, Science and Arts Occupations
The most common Management, Business, Science and Arts occupations in Columbia are Community & Social Service (254 | 12.4%), Health Diagnosing & Treating (235 | 11.5%), Business & Financial (135 | 6.6%), Management (133 | 6.5%), and Education, Arts & Media (127 | 6.2%).
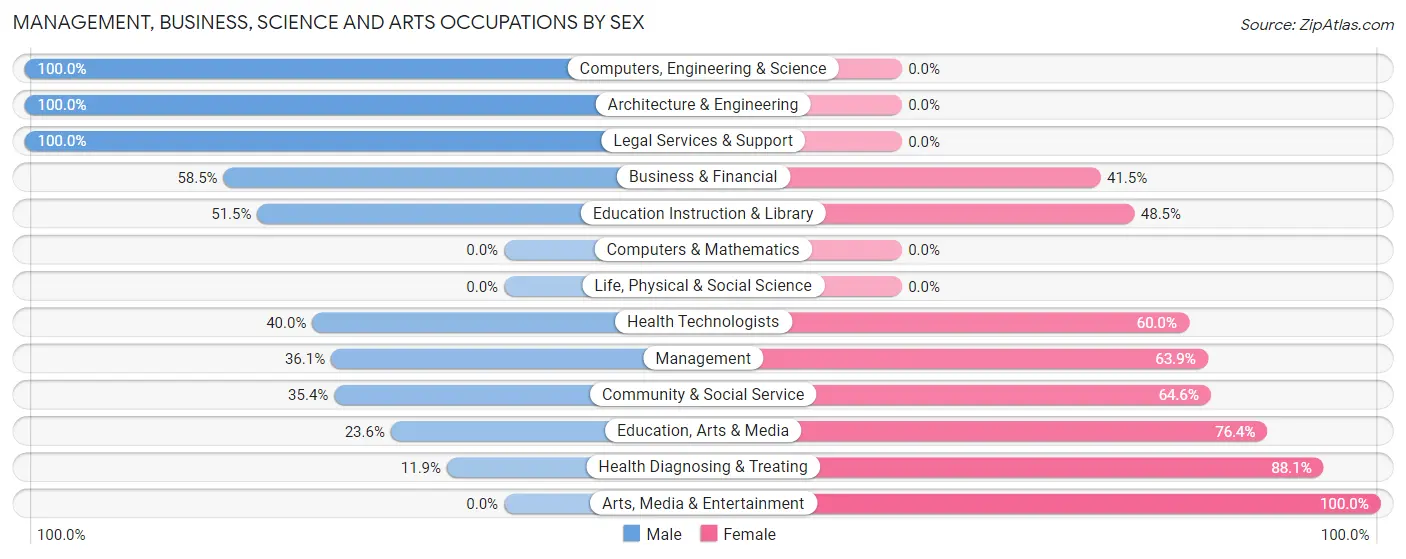
Management, Business, Science and Arts Occupations by Sex
Within the Management, Business, Science and Arts occupations in Columbia, the most male-oriented occupations are Computers, Engineering & Science (100.0%), Architecture & Engineering (100.0%), and Legal Services & Support (100.0%), while the most female-oriented occupations are Arts, Media & Entertainment (100.0%), Health Diagnosing & Treating (88.1%), and Education, Arts & Media (76.4%).
| Occupation | Male | Female |
| Management | 48 (36.1%) | 85 (63.9%) |
| Business & Financial | 79 (58.5%) | 56 (41.5%) |
| Computers, Engineering & Science | 5 (100.0%) | 0 (0.0%) |
| Computers & Mathematics | 0 (0.0%) | 0 (0.0%) |
| Architecture & Engineering | 5 (100.0%) | 0 (0.0%) |
| Life, Physical & Social Science | 0 (0.0%) | 0 (0.0%) |
| Community & Social Service | 90 (35.4%) | 164 (64.6%) |
| Education, Arts & Media | 30 (23.6%) | 97 (76.4%) |
| Legal Services & Support | 7 (100.0%) | 0 (0.0%) |
| Education Instruction & Library | 53 (51.5%) | 50 (48.5%) |
| Arts, Media & Entertainment | 0 (0.0%) | 17 (100.0%) |
| Health Diagnosing & Treating | 28 (11.9%) | 207 (88.1%) |
| Health Technologists | 6 (40.0%) | 9 (60.0%) |
| Total (Category) | 250 (32.8%) | 512 (67.2%) |
| Total (Overall) | 912 (44.6%) | 1,133 (55.4%) |
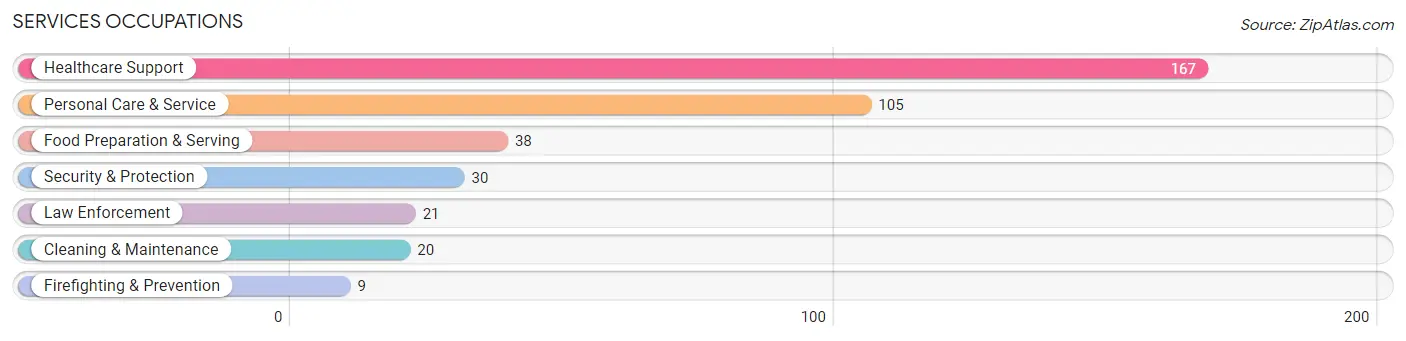
Services Occupations
The most common Services occupations in Columbia are Healthcare Support (167 | 8.2%), Personal Care & Service (105 | 5.1%), Food Preparation & Serving (38 | 1.9%), Security & Protection (30 | 1.5%), and Law Enforcement (21 | 1.0%).
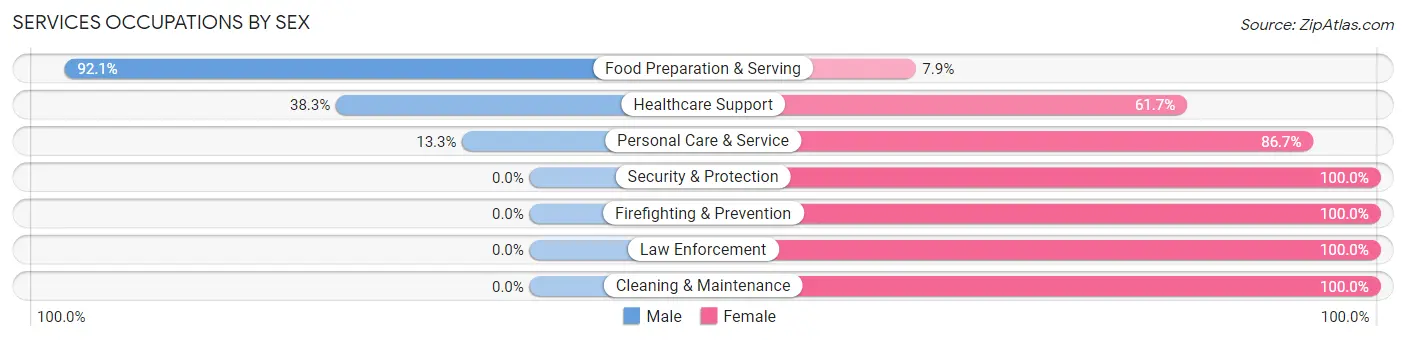
Services Occupations by Sex
Within the Services occupations in Columbia, the most male-oriented occupations are Food Preparation & Serving (92.1%), Healthcare Support (38.3%), and Personal Care & Service (13.3%), while the most female-oriented occupations are Security & Protection (100.0%), Firefighting & Prevention (100.0%), and Law Enforcement (100.0%).
| Occupation | Male | Female |
| Healthcare Support | 64 (38.3%) | 103 (61.7%) |
| Security & Protection | 0 (0.0%) | 30 (100.0%) |
| Firefighting & Prevention | 0 (0.0%) | 9 (100.0%) |
| Law Enforcement | 0 (0.0%) | 21 (100.0%) |
| Food Preparation & Serving | 35 (92.1%) | 3 (7.9%) |
| Cleaning & Maintenance | 0 (0.0%) | 20 (100.0%) |
| Personal Care & Service | 14 (13.3%) | 91 (86.7%) |
| Total (Category) | 113 (31.4%) | 247 (68.6%) |
| Total (Overall) | 912 (44.6%) | 1,133 (55.4%) |
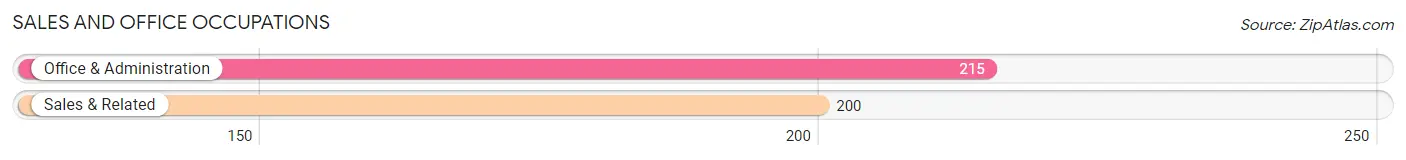
Sales and Office Occupations
The most common Sales and Office occupations in Columbia are Office & Administration (215 | 10.5%), and Sales & Related (200 | 9.8%).
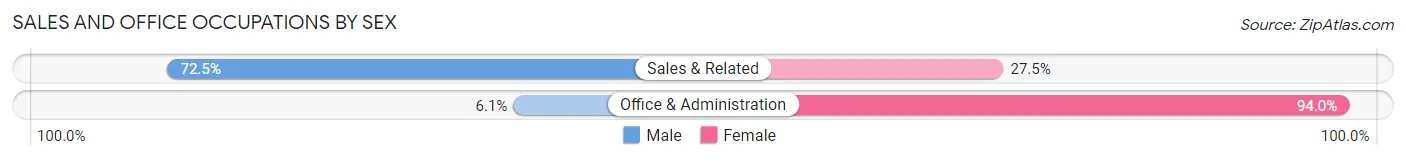
Sales and Office Occupations by Sex
| Occupation | Male | Female |
| Sales & Related | 145 (72.5%) | 55 (27.5%) |
| Office & Administration | 13 (6.0%) | 202 (94.0%) |
| Total (Category) | 158 (38.1%) | 257 (61.9%) |
| Total (Overall) | 912 (44.6%) | 1,133 (55.4%) |
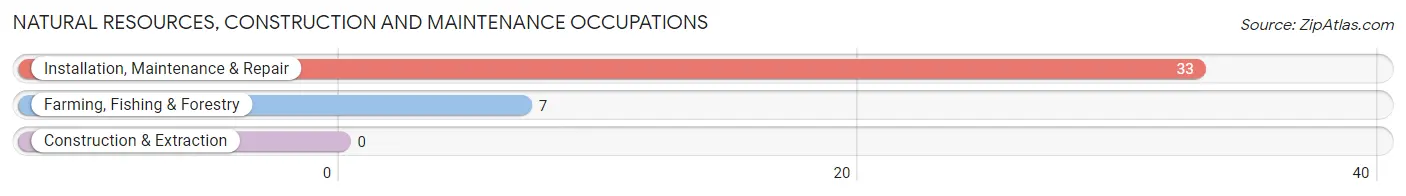
Natural Resources, Construction and Maintenance Occupations
The most common Natural Resources, Construction and Maintenance occupations in Columbia are Installation, Maintenance & Repair (33 | 1.6%), and Farming, Fishing & Forestry (7 | 0.3%).
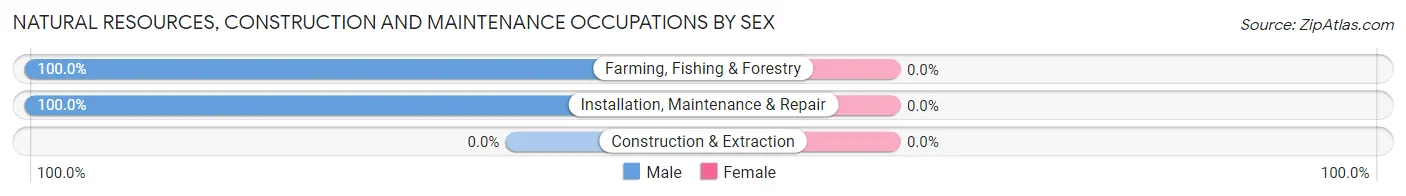
Natural Resources, Construction and Maintenance Occupations by Sex
| Occupation | Male | Female |
| Farming, Fishing & Forestry | 7 (100.0%) | 0 (0.0%) |
| Construction & Extraction | 0 (0.0%) | 0 (0.0%) |
| Installation, Maintenance & Repair | 33 (100.0%) | 0 (0.0%) |
| Total (Category) | 40 (100.0%) | 0 (0.0%) |
| Total (Overall) | 912 (44.6%) | 1,133 (55.4%) |
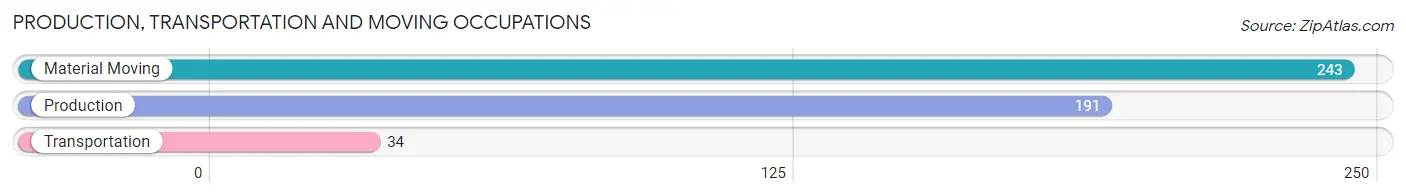
Production, Transportation and Moving Occupations
The most common Production, Transportation and Moving occupations in Columbia are Material Moving (243 | 11.9%), Production (191 | 9.3%), and Transportation (34 | 1.7%).
Production, Transportation and Moving Occupations by Sex
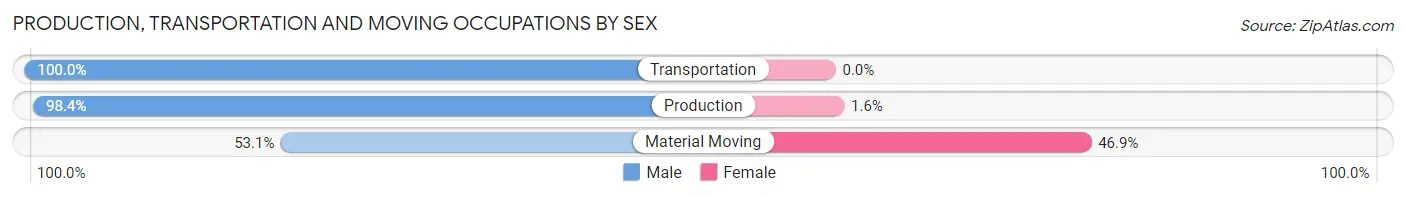
| Occupation | Male | Female |
| Production | 188 (98.4%) | 3 (1.6%) |
| Transportation | 34 (100.0%) | 0 (0.0%) |
| Material Moving | 129 (53.1%) | 114 (46.9%) |
| Total (Category) | 351 (75.0%) | 117 (25.0%) |
| Total (Overall) | 912 (44.6%) | 1,133 (55.4%) |
Employment Industries by Sex in Columbia
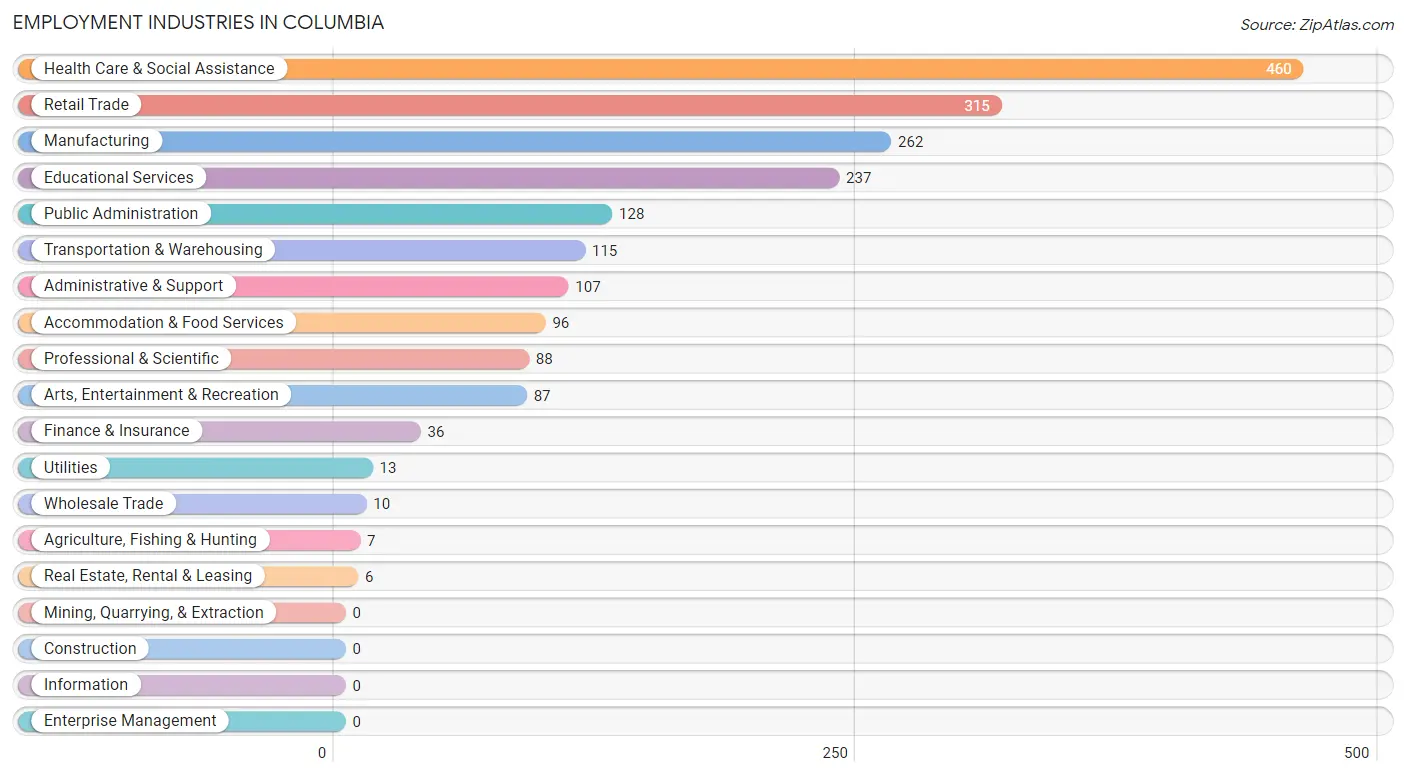
Employment Industries in Columbia
The major employment industries in Columbia include Health Care & Social Assistance (460 | 22.5%), Retail Trade (315 | 15.4%), Manufacturing (262 | 12.8%), Educational Services (237 | 11.6%), and Public Administration (128 | 6.3%).
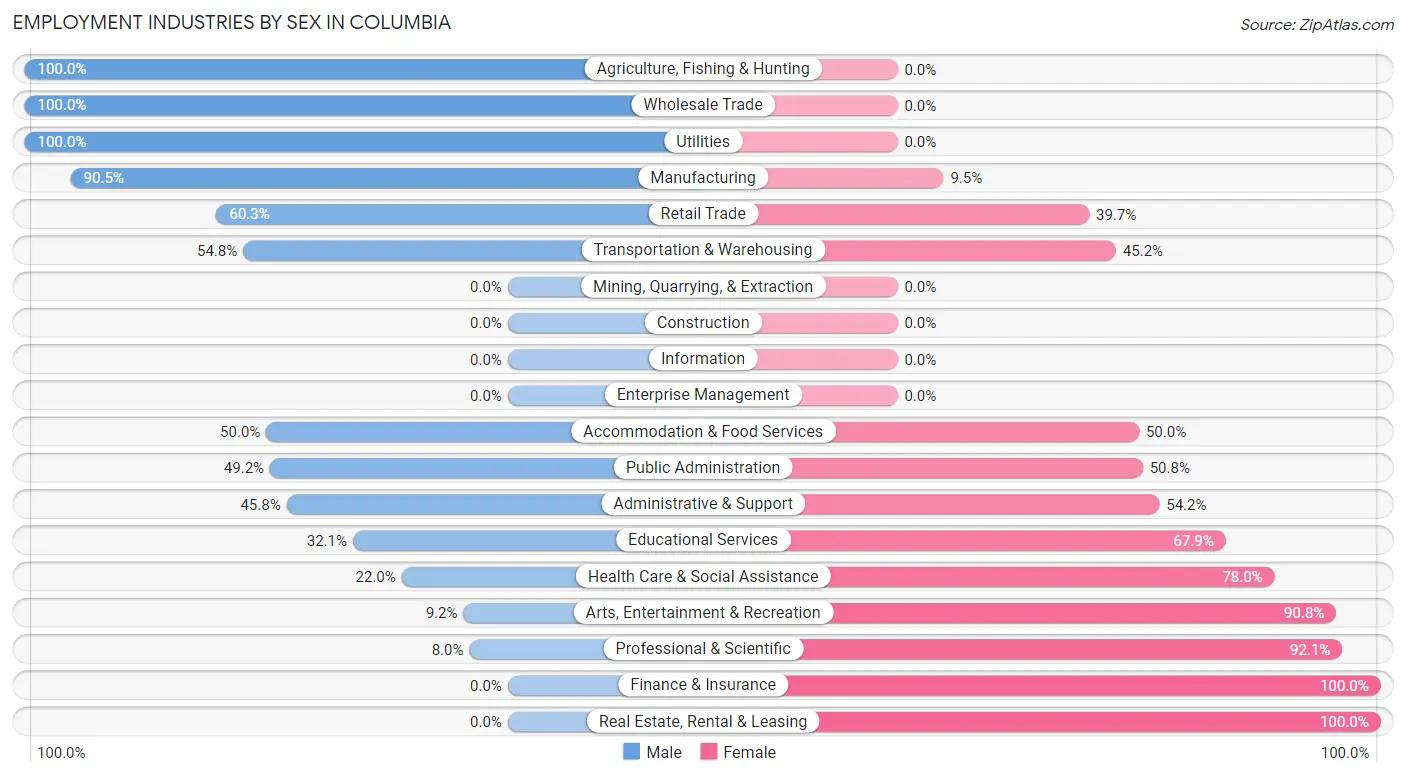
Employment Industries by Sex in Columbia
The Columbia industries that see more men than women are Agriculture, Fishing & Hunting (100.0%), Wholesale Trade (100.0%), and Utilities (100.0%), whereas the industries that tend to have a higher number of women are Finance & Insurance (100.0%), Real Estate, Rental & Leasing (100.0%), and Professional & Scientific (92.0%).
| Industry | Male | Female |
| Agriculture, Fishing & Hunting | 7 (100.0%) | 0 (0.0%) |
| Mining, Quarrying, & Extraction | 0 (0.0%) | 0 (0.0%) |
| Construction | 0 (0.0%) | 0 (0.0%) |
| Manufacturing | 237 (90.5%) | 25 (9.5%) |
| Wholesale Trade | 10 (100.0%) | 0 (0.0%) |
| Retail Trade | 190 (60.3%) | 125 (39.7%) |
| Transportation & Warehousing | 63 (54.8%) | 52 (45.2%) |
| Utilities | 13 (100.0%) | 0 (0.0%) |
| Information | 0 (0.0%) | 0 (0.0%) |
| Finance & Insurance | 0 (0.0%) | 36 (100.0%) |
| Real Estate, Rental & Leasing | 0 (0.0%) | 6 (100.0%) |
| Professional & Scientific | 7 (8.0%) | 81 (92.0%) |
| Enterprise Management | 0 (0.0%) | 0 (0.0%) |
| Administrative & Support | 49 (45.8%) | 58 (54.2%) |
| Educational Services | 76 (32.1%) | 161 (67.9%) |
| Health Care & Social Assistance | 101 (22.0%) | 359 (78.0%) |
| Arts, Entertainment & Recreation | 8 (9.2%) | 79 (90.8%) |
| Accommodation & Food Services | 48 (50.0%) | 48 (50.0%) |
| Public Administration | 63 (49.2%) | 65 (50.8%) |
| Total | 912 (44.6%) | 1,133 (55.4%) |
Education in Columbia
School Enrollment in Columbia
The most common levels of schooling among the 1,787 students in Columbia are college / undergraduate (1,148 | 64.2%), graduate / professional (175 | 9.8%), and middle school (166 | 9.3%).
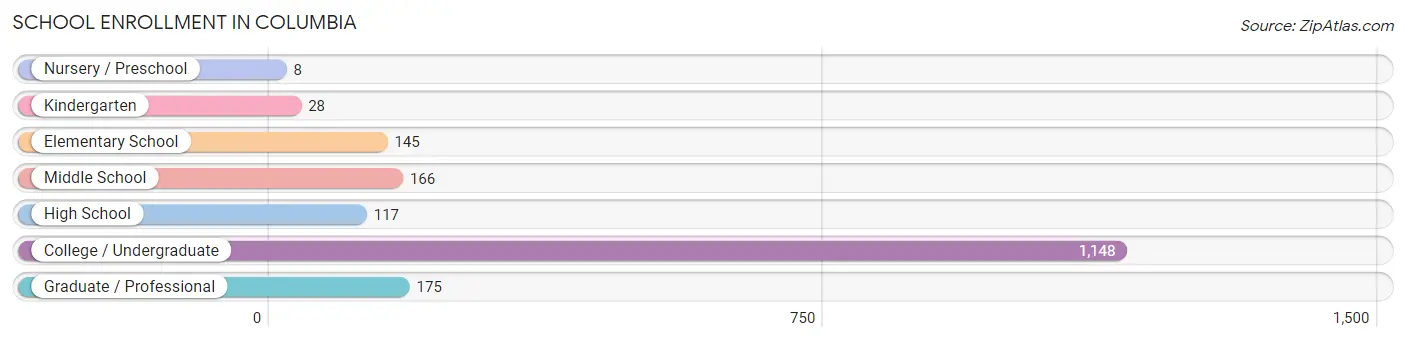
| School Level | # Students | % Students |
| Nursery / Preschool | 8 | 0.4% |
| Kindergarten | 28 | 1.6% |
| Elementary School | 145 | 8.1% |
| Middle School | 166 | 9.3% |
| High School | 117 | 6.6% |
| College / Undergraduate | 1,148 | 64.2% |
| Graduate / Professional | 175 | 9.8% |
| Total | 1,787 | 100.0% |
School Enrollment by Age by Funding Source in Columbia
Out of a total of 1,787 students who are enrolled in schools in Columbia, 1,049 (58.7%) attend a private institution, while the remaining 738 (41.3%) are enrolled in public schools. The age group of 20 to 24 year olds has the highest likelihood of being enrolled in private schools, with 684 (84.6% in the age bracket) enrolled. Conversely, the age group of 3 to 4 year olds has the lowest likelihood of being enrolled in a private school, with 8 (100.0% in the age bracket) attending a public institution.
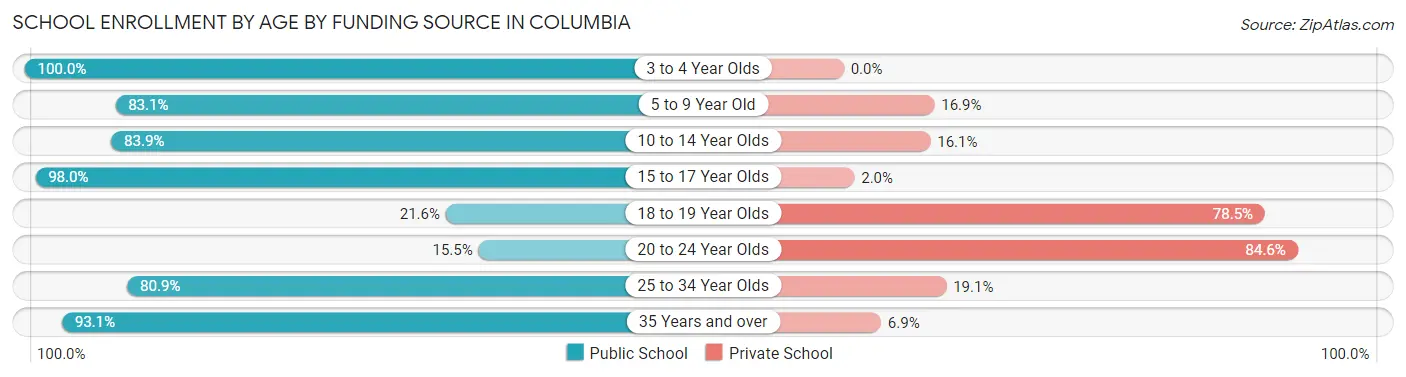
| Age Bracket | Public School | Private School |
| 3 to 4 Year Olds | 8 (100.0%) | 0 (0.0%) |
| 5 to 9 Year Old | 133 (83.1%) | 27 (16.9%) |
| 10 to 14 Year Olds | 156 (83.9%) | 30 (16.1%) |
| 15 to 17 Year Olds | 99 (98.0%) | 2 (2.0%) |
| 18 to 19 Year Olds | 78 (21.5%) | 284 (78.4%) |
| 20 to 24 Year Olds | 125 (15.4%) | 684 (84.6%) |
| 25 to 34 Year Olds | 72 (80.9%) | 17 (19.1%) |
| 35 Years and over | 67 (93.1%) | 5 (6.9%) |
| Total | 738 (41.3%) | 1,049 (58.7%) |
Educational Attainment by Field of Study in Columbia
Education (212 | 38.6%), physical & health sciences (81 | 14.7%), arts & humanities (58 | 10.6%), business (53 | 9.7%), and social sciences (33 | 6.0%) are the most common fields of study among 549 individuals in Columbia who have obtained a bachelor's degree or higher.
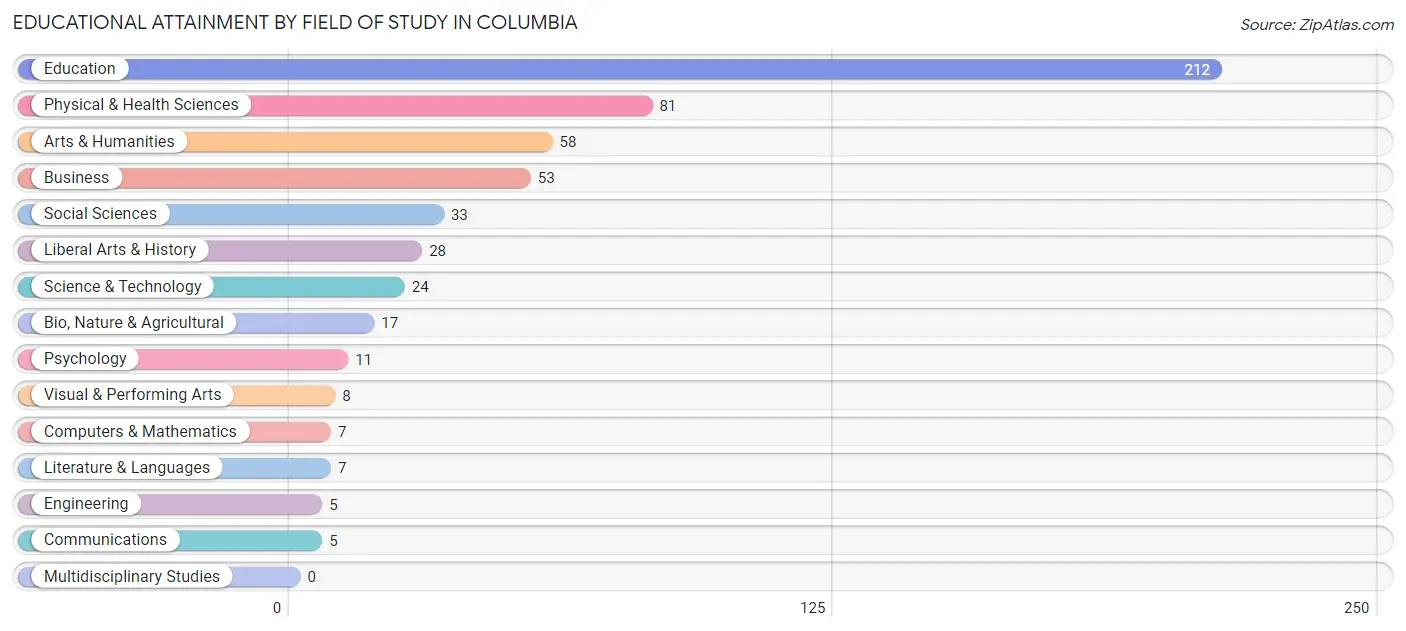
| Field of Study | # Graduates | % Graduates |
| Computers & Mathematics | 7 | 1.3% |
| Bio, Nature & Agricultural | 17 | 3.1% |
| Physical & Health Sciences | 81 | 14.7% |
| Psychology | 11 | 2.0% |
| Social Sciences | 33 | 6.0% |
| Engineering | 5 | 0.9% |
| Multidisciplinary Studies | 0 | 0.0% |
| Science & Technology | 24 | 4.4% |
| Business | 53 | 9.7% |
| Education | 212 | 38.6% |
| Literature & Languages | 7 | 1.3% |
| Liberal Arts & History | 28 | 5.1% |
| Visual & Performing Arts | 8 | 1.5% |
| Communications | 5 | 0.9% |
| Arts & Humanities | 58 | 10.6% |
| Total | 549 | 100.0% |
Transportation & Commute in Columbia
Vehicle Availability by Sex in Columbia
The most prevalent vehicle ownership categories in Columbia are males with 2 vehicles (422, accounting for 55.4%) and females with 2 vehicles (367, making up 53.8%).
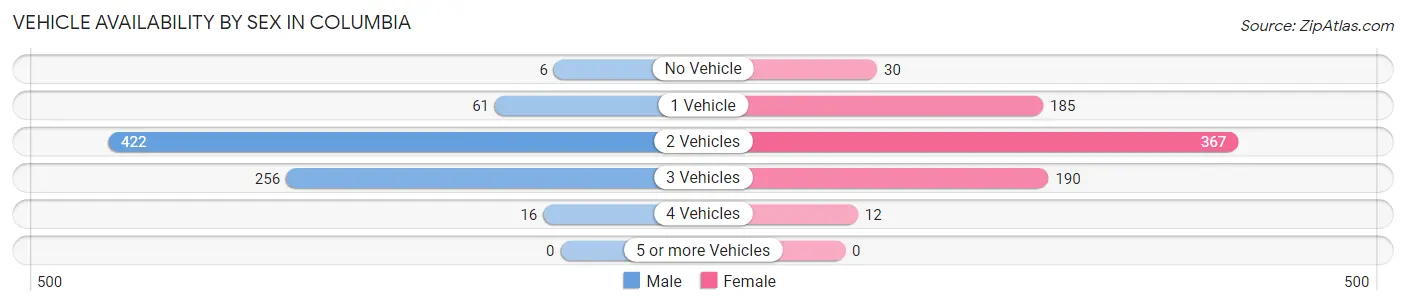
| Vehicles Available | Male | Female |
| No Vehicle | 6 (0.8%) | 30 (3.8%) |
| 1 Vehicle | 61 (8.0%) | 185 (23.6%) |
| 2 Vehicles | 422 (55.4%) | 367 (46.8%) |
| 3 Vehicles | 256 (33.6%) | 190 (24.2%) |
| 4 Vehicles | 16 (2.1%) | 12 (1.5%) |
| 5 or more Vehicles | 0 (0.0%) | 0 (0.0%) |
| Total | 761 (100.0%) | 784 (100.0%) |
Commute Time in Columbia
The most frequently occuring commute durations in Columbia are 5 to 9 minutes (437 commuters, 26.4%), less than 5 minutes (338 commuters, 20.4%), and 25 to 29 minutes (206 commuters, 12.4%).
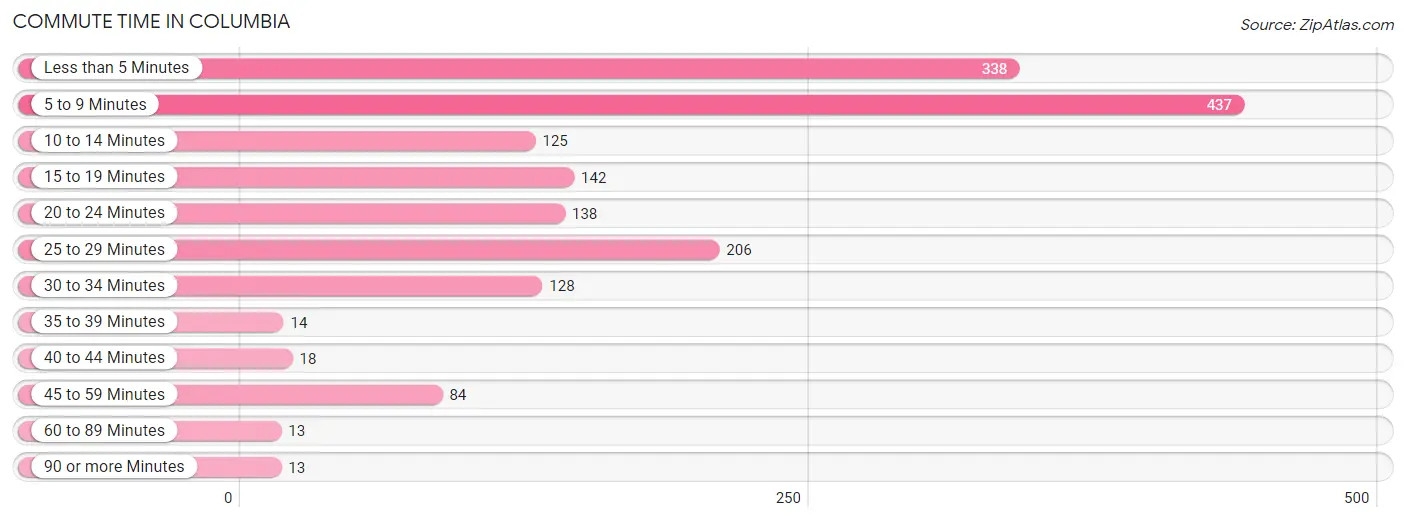
| Commute Time | # Commuters | % Commuters |
| Less than 5 Minutes | 338 | 20.4% |
| 5 to 9 Minutes | 437 | 26.4% |
| 10 to 14 Minutes | 125 | 7.5% |
| 15 to 19 Minutes | 142 | 8.6% |
| 20 to 24 Minutes | 138 | 8.3% |
| 25 to 29 Minutes | 206 | 12.4% |
| 30 to 34 Minutes | 128 | 7.7% |
| 35 to 39 Minutes | 14 | 0.9% |
| 40 to 44 Minutes | 18 | 1.1% |
| 45 to 59 Minutes | 84 | 5.1% |
| 60 to 89 Minutes | 13 | 0.8% |
| 90 or more Minutes | 13 | 0.8% |
Commute Time by Sex in Columbia
The most common commute times in Columbia are 5 to 9 minutes (217 commuters, 29.0%) for males and 5 to 9 minutes (220 commuters, 24.3%) for females.
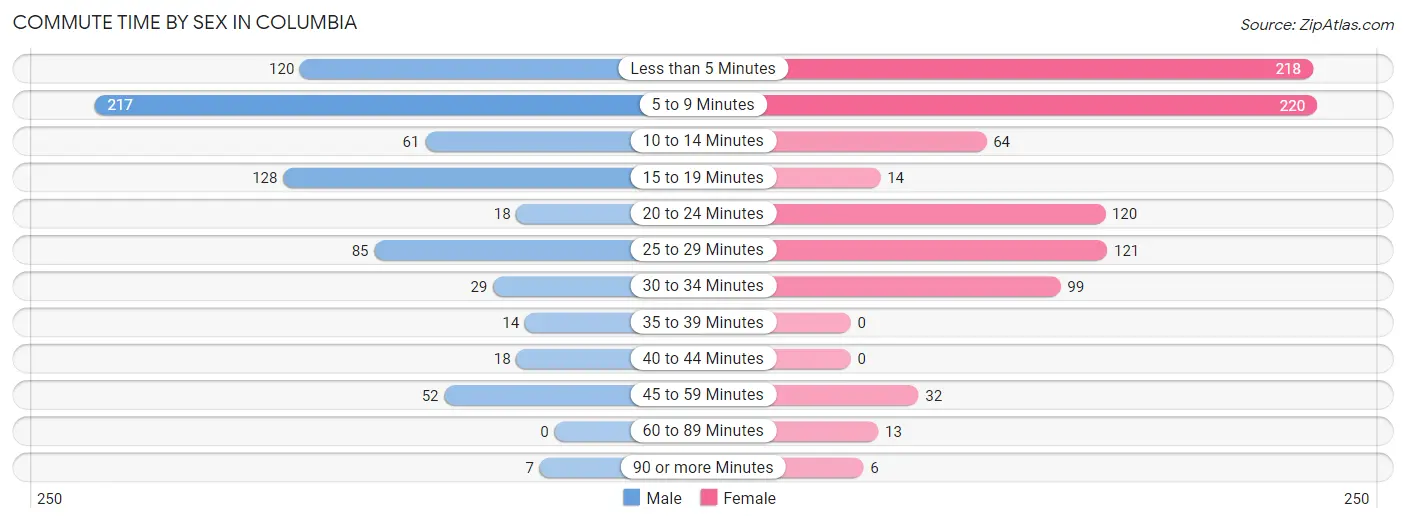
| Commute Time | Male | Female |
| Less than 5 Minutes | 120 (16.0%) | 218 (24.0%) |
| 5 to 9 Minutes | 217 (29.0%) | 220 (24.3%) |
| 10 to 14 Minutes | 61 (8.1%) | 64 (7.1%) |
| 15 to 19 Minutes | 128 (17.1%) | 14 (1.5%) |
| 20 to 24 Minutes | 18 (2.4%) | 120 (13.2%) |
| 25 to 29 Minutes | 85 (11.4%) | 121 (13.3%) |
| 30 to 34 Minutes | 29 (3.9%) | 99 (10.9%) |
| 35 to 39 Minutes | 14 (1.9%) | 0 (0.0%) |
| 40 to 44 Minutes | 18 (2.4%) | 0 (0.0%) |
| 45 to 59 Minutes | 52 (6.9%) | 32 (3.5%) |
| 60 to 89 Minutes | 0 (0.0%) | 13 (1.4%) |
| 90 or more Minutes | 7 (0.9%) | 6 (0.7%) |
Time of Departure to Work by Sex in Columbia
The most frequent times of departure to work in Columbia are 4:00 PM to 11:59 PM (175, 23.4%) for males and 12:00 PM to 3:59 PM (196, 21.6%) for females.
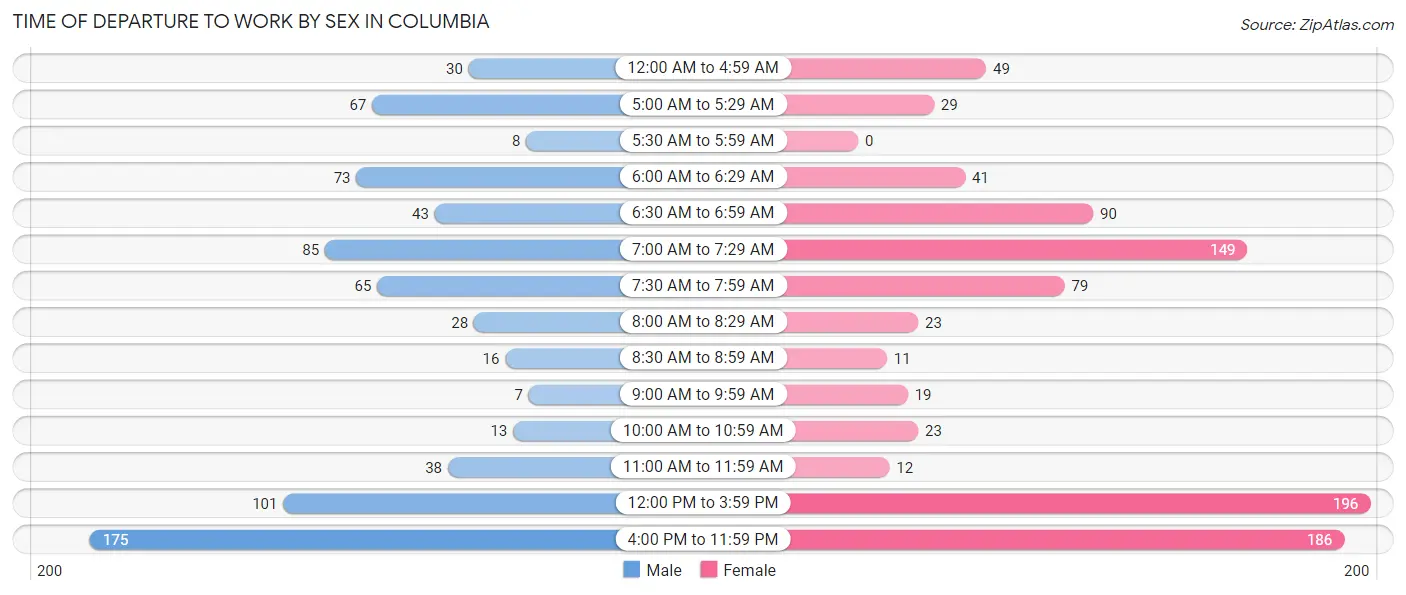
| Time of Departure | Male | Female |
| 12:00 AM to 4:59 AM | 30 (4.0%) | 49 (5.4%) |
| 5:00 AM to 5:29 AM | 67 (8.9%) | 29 (3.2%) |
| 5:30 AM to 5:59 AM | 8 (1.1%) | 0 (0.0%) |
| 6:00 AM to 6:29 AM | 73 (9.8%) | 41 (4.5%) |
| 6:30 AM to 6:59 AM | 43 (5.7%) | 90 (9.9%) |
| 7:00 AM to 7:29 AM | 85 (11.4%) | 149 (16.4%) |
| 7:30 AM to 7:59 AM | 65 (8.7%) | 79 (8.7%) |
| 8:00 AM to 8:29 AM | 28 (3.7%) | 23 (2.5%) |
| 8:30 AM to 8:59 AM | 16 (2.1%) | 11 (1.2%) |
| 9:00 AM to 9:59 AM | 7 (0.9%) | 19 (2.1%) |
| 10:00 AM to 10:59 AM | 13 (1.7%) | 23 (2.5%) |
| 11:00 AM to 11:59 AM | 38 (5.1%) | 12 (1.3%) |
| 12:00 PM to 3:59 PM | 101 (13.5%) | 196 (21.6%) |
| 4:00 PM to 11:59 PM | 175 (23.4%) | 186 (20.5%) |
| Total | 749 (100.0%) | 907 (100.0%) |
Housing Occupancy in Columbia
Occupancy by Ownership in Columbia
Of the total 1,557 dwellings in Columbia, owner-occupied units account for 705 (45.3%), while renter-occupied units make up 852 (54.7%).
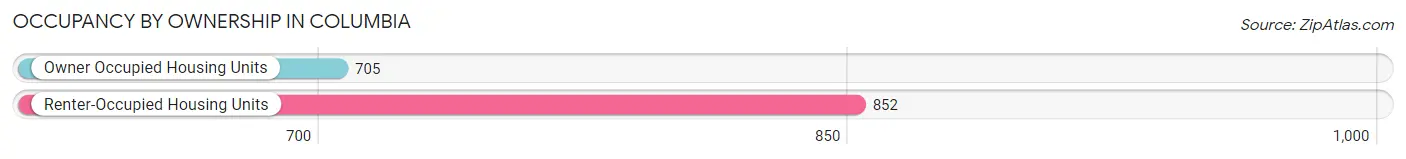
| Occupancy | # Housing Units | % Housing Units |
| Owner Occupied Housing Units | 705 | 45.3% |
| Renter-Occupied Housing Units | 852 | 54.7% |
| Total Occupied Housing Units | 1,557 | 100.0% |
Occupancy by Household Size in Columbia
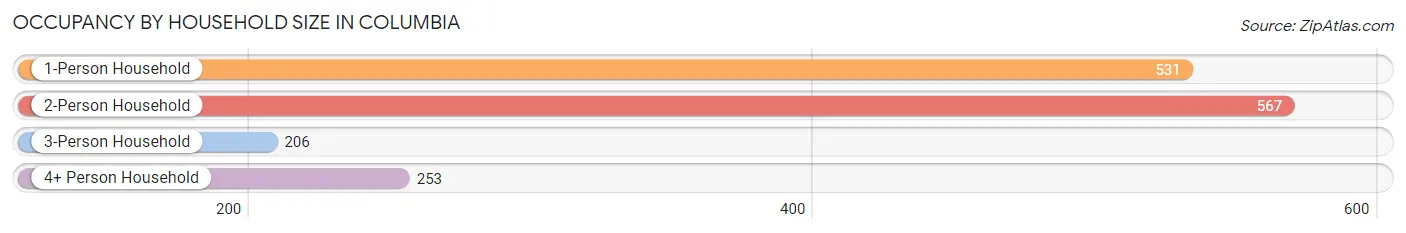
| Household Size | # Housing Units | % Housing Units |
| 1-Person Household | 531 | 34.1% |
| 2-Person Household | 567 | 36.4% |
| 3-Person Household | 206 | 13.2% |
| 4+ Person Household | 253 | 16.3% |
| Total Housing Units | 1,557 | 100.0% |
Occupancy by Ownership by Household Size in Columbia

| Household Size | Owner-occupied | Renter-occupied |
| 1-Person Household | 223 (42.0%) | 308 (58.0%) |
| 2-Person Household | 331 (58.4%) | 236 (41.6%) |
| 3-Person Household | 57 (27.7%) | 149 (72.3%) |
| 4+ Person Household | 94 (37.1%) | 159 (62.8%) |
| Total Housing Units | 705 (45.3%) | 852 (54.7%) |
Occupancy by Educational Attainment in Columbia
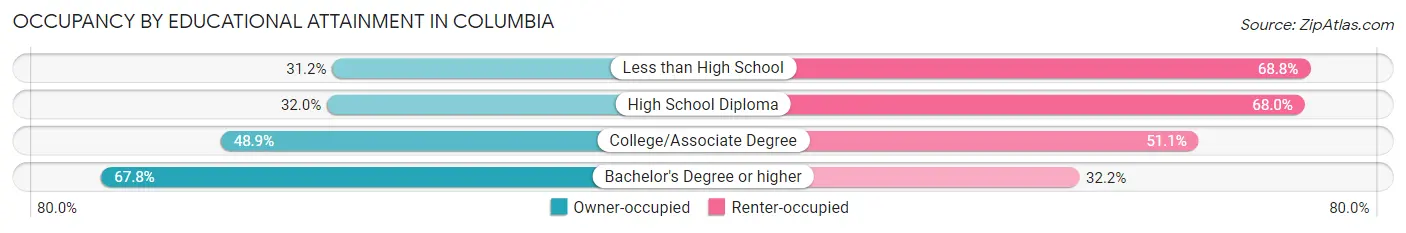
| Household Size | Owner-occupied | Renter-occupied |
| Less than High School | 63 (31.2%) | 139 (68.8%) |
| High School Diploma | 165 (32.0%) | 350 (68.0%) |
| College/Associate Degree | 239 (48.9%) | 250 (51.1%) |
| Bachelor's Degree or higher | 238 (67.8%) | 113 (32.2%) |
Occupancy by Age of Householder in Columbia
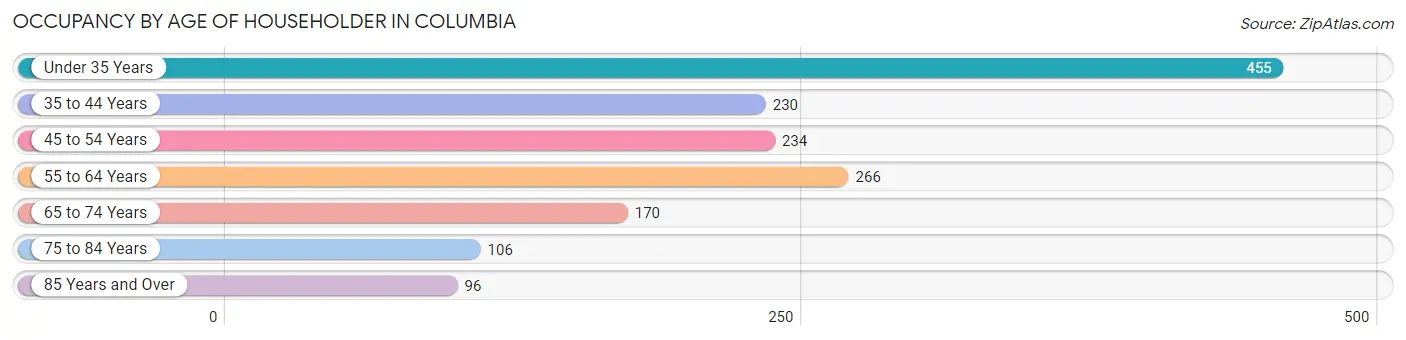
| Age Bracket | # Households | % Households |
| Under 35 Years | 455 | 29.2% |
| 35 to 44 Years | 230 | 14.8% |
| 45 to 54 Years | 234 | 15.0% |
| 55 to 64 Years | 266 | 17.1% |
| 65 to 74 Years | 170 | 10.9% |
| 75 to 84 Years | 106 | 6.8% |
| 85 Years and Over | 96 | 6.2% |
| Total | 1,557 | 100.0% |
Housing Finances in Columbia
Median Income by Occupancy in Columbia
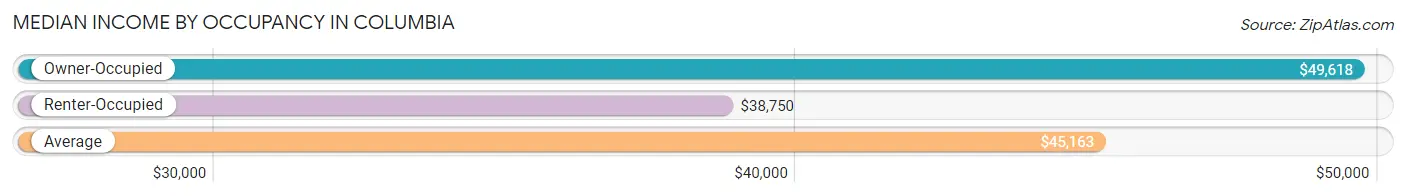
| Occupancy Type | # Households | Median Income |
| Owner-Occupied | 705 (45.3%) | $49,618 |
| Renter-Occupied | 852 (54.7%) | $38,750 |
| Average | 1,557 (100.0%) | $45,163 |
Occupancy by Householder Income Bracket in Columbia
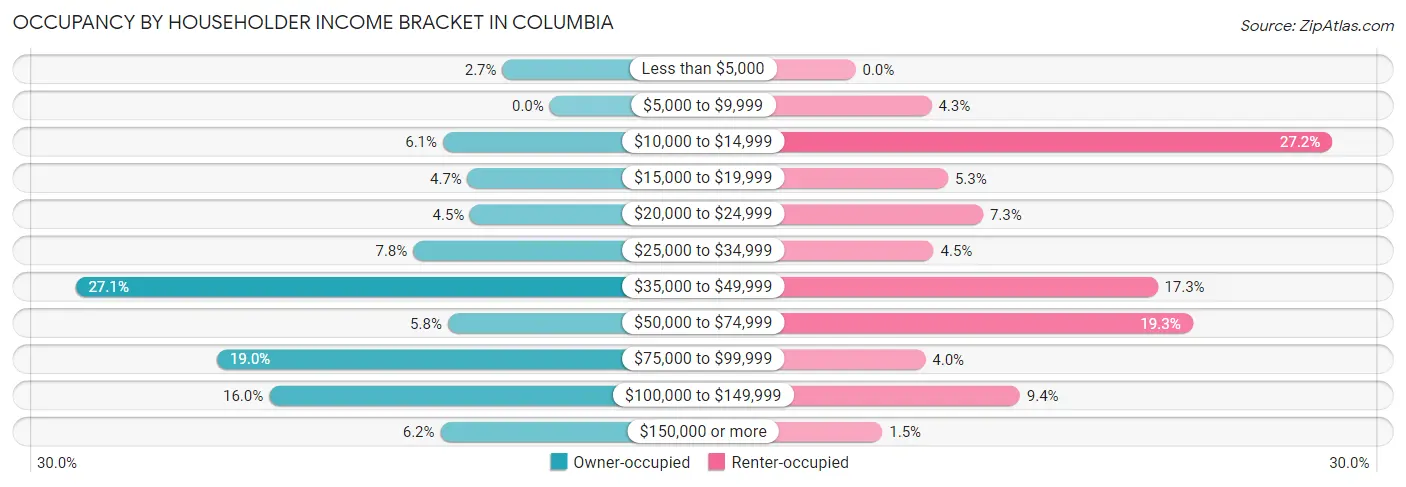
| Income Bracket | Owner-occupied | Renter-occupied |
| Less than $5,000 | 19 (2.7%) | 0 (0.0%) |
| $5,000 to $9,999 | 0 (0.0%) | 37 (4.3%) |
| $10,000 to $14,999 | 43 (6.1%) | 232 (27.2%) |
| $15,000 to $19,999 | 33 (4.7%) | 45 (5.3%) |
| $20,000 to $24,999 | 32 (4.5%) | 62 (7.3%) |
| $25,000 to $34,999 | 55 (7.8%) | 38 (4.5%) |
| $35,000 to $49,999 | 191 (27.1%) | 147 (17.2%) |
| $50,000 to $74,999 | 41 (5.8%) | 164 (19.3%) |
| $75,000 to $99,999 | 134 (19.0%) | 34 (4.0%) |
| $100,000 to $149,999 | 113 (16.0%) | 80 (9.4%) |
| $150,000 or more | 44 (6.2%) | 13 (1.5%) |
| Total | 705 (100.0%) | 852 (100.0%) |
Monthly Housing Cost Tiers in Columbia
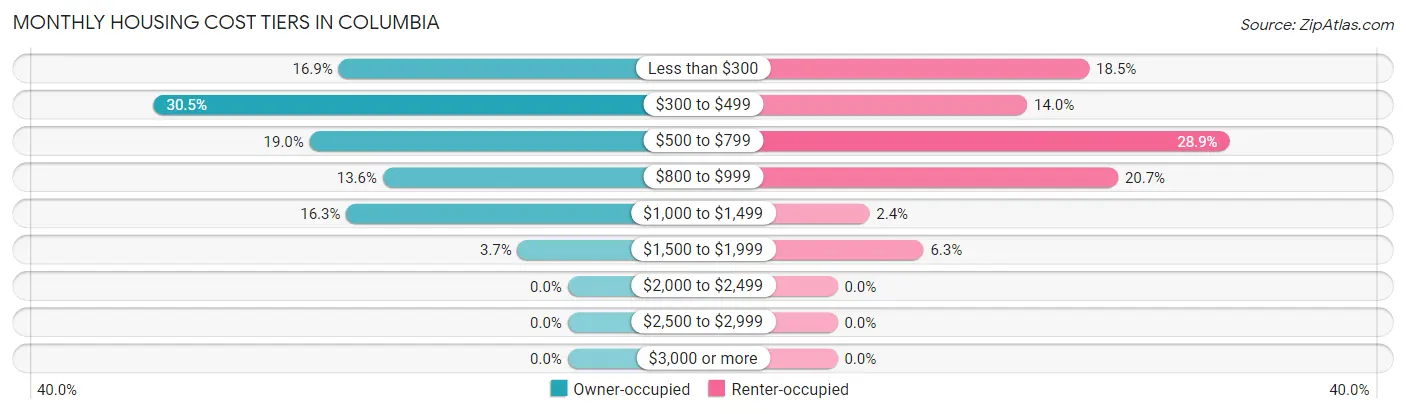
| Monthly Cost | Owner-occupied | Renter-occupied |
| Less than $300 | 119 (16.9%) | 158 (18.5%) |
| $300 to $499 | 215 (30.5%) | 119 (14.0%) |
| $500 to $799 | 134 (19.0%) | 246 (28.9%) |
| $800 to $999 | 96 (13.6%) | 176 (20.7%) |
| $1,000 to $1,499 | 115 (16.3%) | 20 (2.4%) |
| $1,500 to $1,999 | 26 (3.7%) | 54 (6.3%) |
| $2,000 to $2,499 | 0 (0.0%) | 0 (0.0%) |
| $2,500 to $2,999 | 0 (0.0%) | 0 (0.0%) |
| $3,000 or more | 0 (0.0%) | 0 (0.0%) |
| Total | 705 (100.0%) | 852 (100.0%) |
Physical Housing Characteristics in Columbia
Housing Structures in Columbia
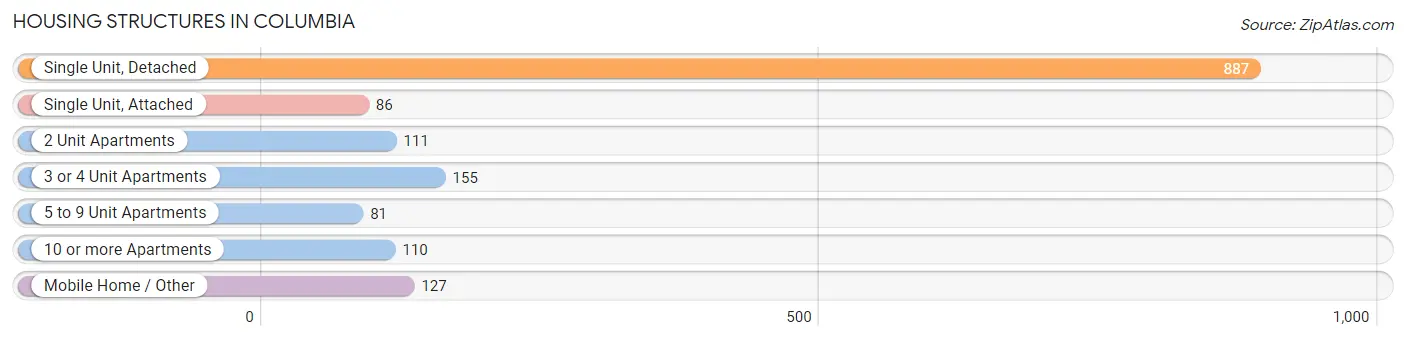
| Structure Type | # Housing Units | % Housing Units |
| Single Unit, Detached | 887 | 57.0% |
| Single Unit, Attached | 86 | 5.5% |
| 2 Unit Apartments | 111 | 7.1% |
| 3 or 4 Unit Apartments | 155 | 10.0% |
| 5 to 9 Unit Apartments | 81 | 5.2% |
| 10 or more Apartments | 110 | 7.1% |
| Mobile Home / Other | 127 | 8.2% |
| Total | 1,557 | 100.0% |
Housing Structures by Occupancy in Columbia
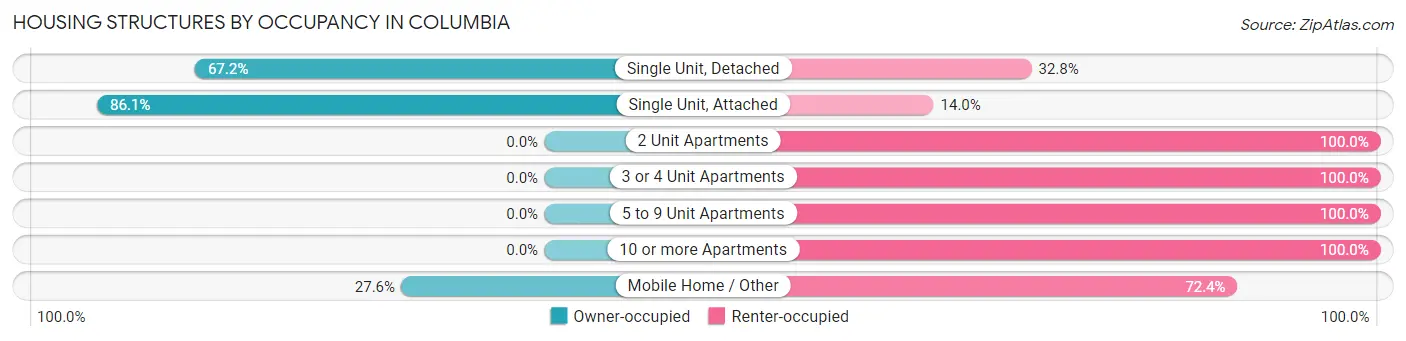
| Structure Type | Owner-occupied | Renter-occupied |
| Single Unit, Detached | 596 (67.2%) | 291 (32.8%) |
| Single Unit, Attached | 74 (86.1%) | 12 (14.0%) |
| 2 Unit Apartments | 0 (0.0%) | 111 (100.0%) |
| 3 or 4 Unit Apartments | 0 (0.0%) | 155 (100.0%) |
| 5 to 9 Unit Apartments | 0 (0.0%) | 81 (100.0%) |
| 10 or more Apartments | 0 (0.0%) | 110 (100.0%) |
| Mobile Home / Other | 35 (27.6%) | 92 (72.4%) |
| Total | 705 (45.3%) | 852 (54.7%) |
Housing Structures by Number of Rooms in Columbia
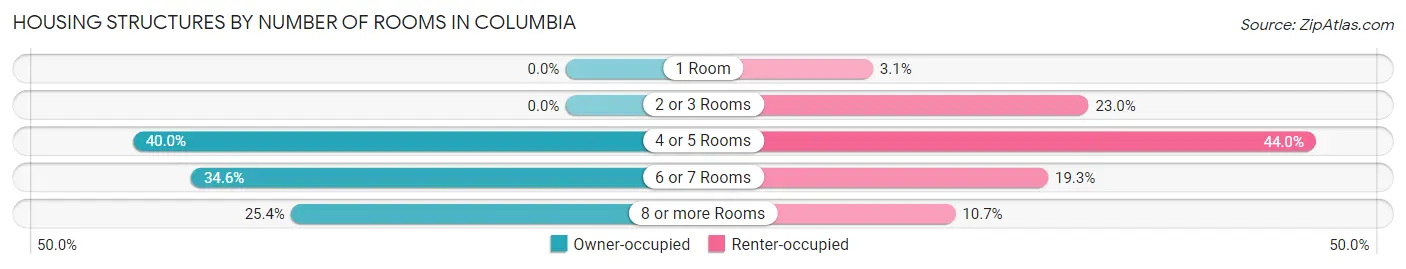
| Number of Rooms | Owner-occupied | Renter-occupied |
| 1 Room | 0 (0.0%) | 26 (3.0%) |
| 2 or 3 Rooms | 0 (0.0%) | 196 (23.0%) |
| 4 or 5 Rooms | 282 (40.0%) | 375 (44.0%) |
| 6 or 7 Rooms | 244 (34.6%) | 164 (19.3%) |
| 8 or more Rooms | 179 (25.4%) | 91 (10.7%) |
| Total | 705 (100.0%) | 852 (100.0%) |
Housing Structure by Heating Type in Columbia
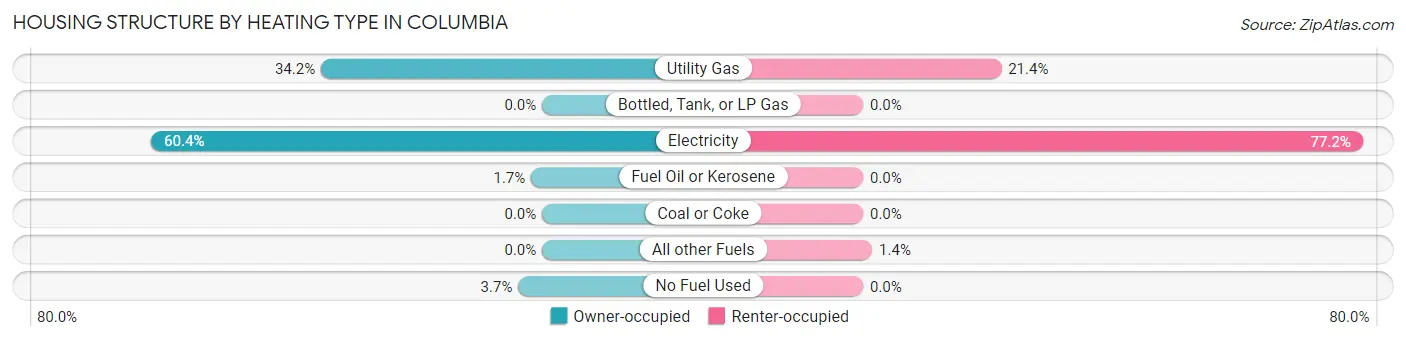
| Heating Type | Owner-occupied | Renter-occupied |
| Utility Gas | 241 (34.2%) | 182 (21.4%) |
| Bottled, Tank, or LP Gas | 0 (0.0%) | 0 (0.0%) |
| Electricity | 426 (60.4%) | 658 (77.2%) |
| Fuel Oil or Kerosene | 12 (1.7%) | 0 (0.0%) |
| Coal or Coke | 0 (0.0%) | 0 (0.0%) |
| All other Fuels | 0 (0.0%) | 12 (1.4%) |
| No Fuel Used | 26 (3.7%) | 0 (0.0%) |
| Total | 705 (100.0%) | 852 (100.0%) |
Household Vehicle Usage in Columbia
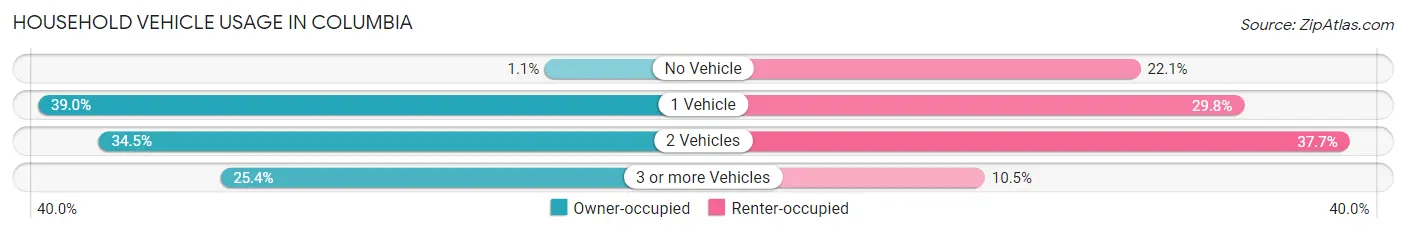
| Vehicles per Household | Owner-occupied | Renter-occupied |
| No Vehicle | 8 (1.1%) | 188 (22.1%) |
| 1 Vehicle | 275 (39.0%) | 254 (29.8%) |
| 2 Vehicles | 243 (34.5%) | 321 (37.7%) |
| 3 or more Vehicles | 179 (25.4%) | 89 (10.4%) |
| Total | 705 (100.0%) | 852 (100.0%) |
Real Estate & Mortgages in Columbia
Real Estate and Mortgage Overview in Columbia
| Characteristic | Without Mortgage | With Mortgage |
| Housing Units | 406 | 299 |
| Median Property Value | $117,500 | $140,900 |
| Median Household Income | $49,054 | $7 |
| Monthly Housing Costs | $380 | $0 |
| Real Estate Taxes | $607 | $7 |
Property Value by Mortgage Status in Columbia
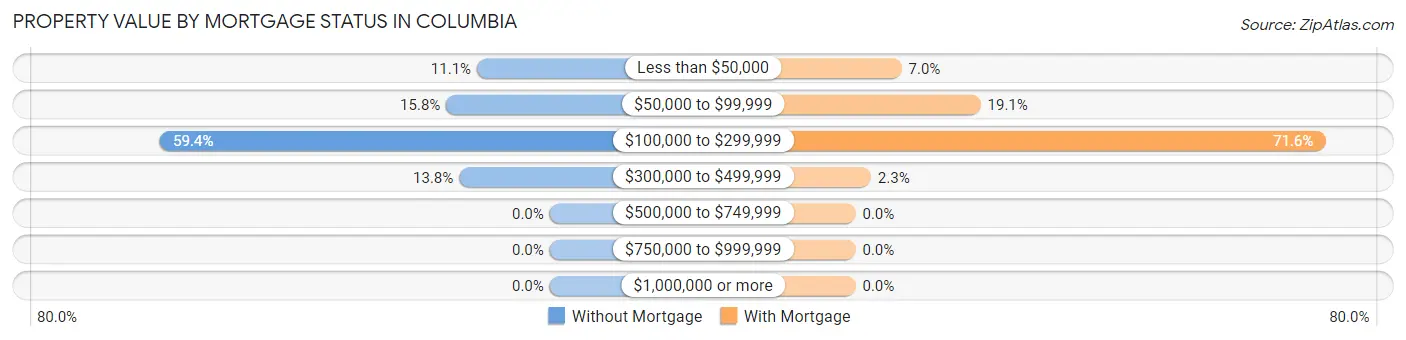
| Property Value | Without Mortgage | With Mortgage |
| Less than $50,000 | 45 (11.1%) | 21 (7.0%) |
| $50,000 to $99,999 | 64 (15.8%) | 57 (19.1%) |
| $100,000 to $299,999 | 241 (59.4%) | 214 (71.6%) |
| $300,000 to $499,999 | 56 (13.8%) | 7 (2.3%) |
| $500,000 to $749,999 | 0 (0.0%) | 0 (0.0%) |
| $750,000 to $999,999 | 0 (0.0%) | 0 (0.0%) |
| $1,000,000 or more | 0 (0.0%) | 0 (0.0%) |
| Total | 406 (100.0%) | 299 (100.0%) |
Household Income by Mortgage Status in Columbia
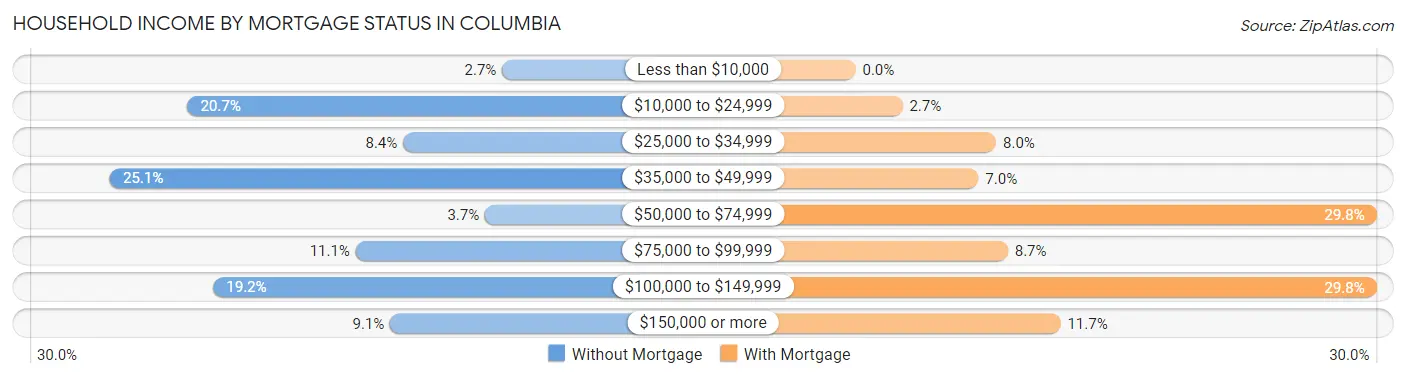
| Household Income | Without Mortgage | With Mortgage |
| Less than $10,000 | 11 (2.7%) | 0 (0.0%) |
| $10,000 to $24,999 | 84 (20.7%) | 8 (2.7%) |
| $25,000 to $34,999 | 34 (8.4%) | 24 (8.0%) |
| $35,000 to $49,999 | 102 (25.1%) | 21 (7.0%) |
| $50,000 to $74,999 | 15 (3.7%) | 89 (29.8%) |
| $75,000 to $99,999 | 45 (11.1%) | 26 (8.7%) |
| $100,000 to $149,999 | 78 (19.2%) | 89 (29.8%) |
| $150,000 or more | 37 (9.1%) | 35 (11.7%) |
| Total | 406 (100.0%) | 299 (100.0%) |
Property Value to Household Income Ratio in Columbia
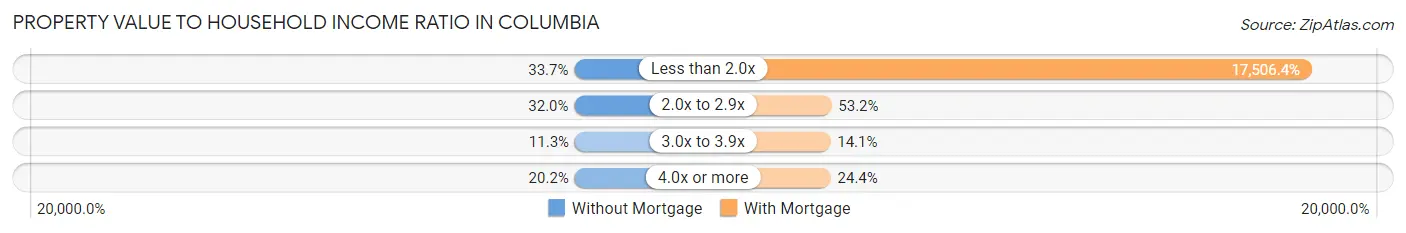
| Value-to-Income Ratio | Without Mortgage | With Mortgage |
| Less than 2.0x | 137 (33.7%) | 52,344 (17,506.4%) |
| 2.0x to 2.9x | 130 (32.0%) | 159 (53.2%) |
| 3.0x to 3.9x | 46 (11.3%) | 42 (14.1%) |
| 4.0x or more | 82 (20.2%) | 73 (24.4%) |
| Total | 406 (100.0%) | 299 (100.0%) |
Real Estate Taxes by Mortgage Status in Columbia
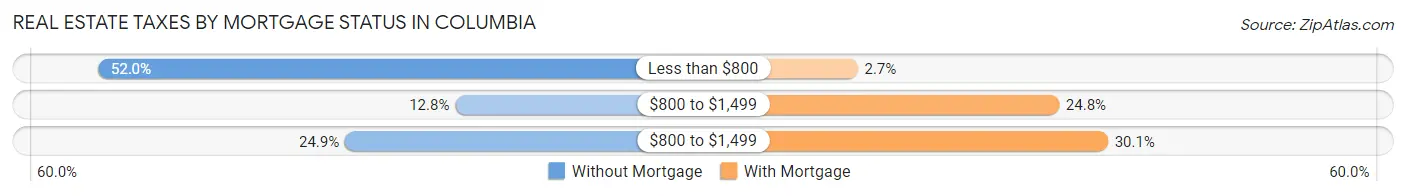
| Property Taxes | Without Mortgage | With Mortgage |
| Less than $800 | 211 (52.0%) | 8 (2.7%) |
| $800 to $1,499 | 52 (12.8%) | 74 (24.7%) |
| $800 to $1,499 | 101 (24.9%) | 90 (30.1%) |
| Total | 406 (100.0%) | 299 (100.0%) |
Health & Disability in Columbia
Health Insurance Coverage by Age in Columbia
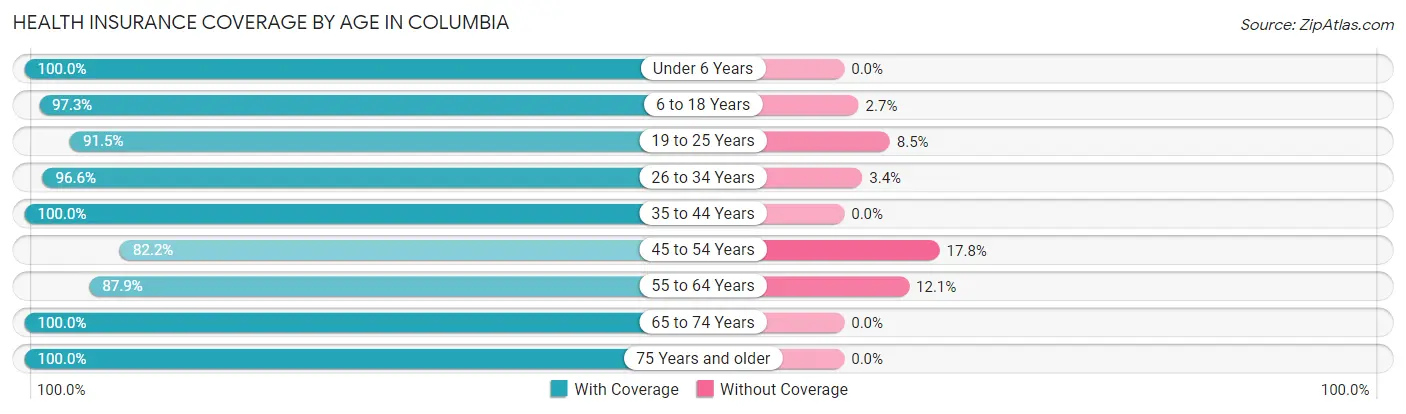
| Age Bracket | With Coverage | Without Coverage |
| Under 6 Years | 289 (100.0%) | 0 (0.0%) |
| 6 to 18 Years | 580 (97.3%) | 16 (2.7%) |
| 19 to 25 Years | 1,228 (91.5%) | 114 (8.5%) |
| 26 to 34 Years | 459 (96.6%) | 16 (3.4%) |
| 35 to 44 Years | 396 (100.0%) | 0 (0.0%) |
| 45 to 54 Years | 319 (82.2%) | 69 (17.8%) |
| 55 to 64 Years | 378 (87.9%) | 52 (12.1%) |
| 65 to 74 Years | 302 (100.0%) | 0 (0.0%) |
| 75 Years and older | 373 (100.0%) | 0 (0.0%) |
| Total | 4,324 (94.2%) | 267 (5.8%) |
Health Insurance Coverage by Citizenship Status in Columbia
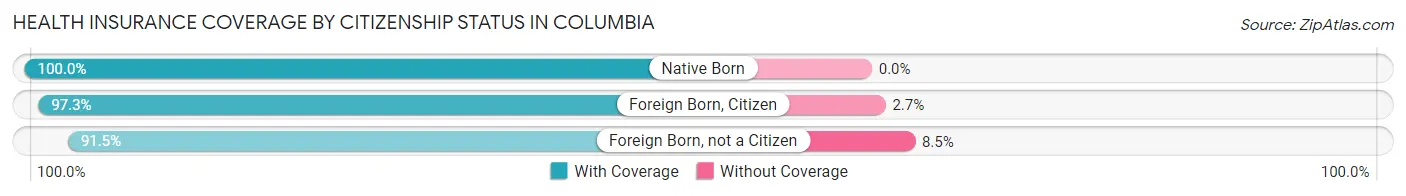
| Citizenship Status | With Coverage | Without Coverage |
| Native Born | 289 (100.0%) | 0 (0.0%) |
| Foreign Born, Citizen | 580 (97.3%) | 16 (2.7%) |
| Foreign Born, not a Citizen | 1,228 (91.5%) | 114 (8.5%) |
Health Insurance Coverage by Household Income in Columbia
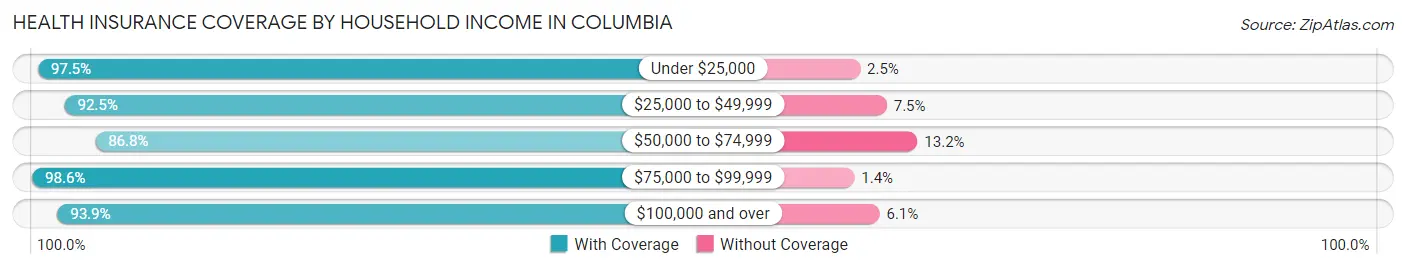
| Household Income | With Coverage | Without Coverage |
| Under $25,000 | 783 (97.5%) | 20 (2.5%) |
| $25,000 to $49,999 | 716 (92.5%) | 58 (7.5%) |
| $50,000 to $74,999 | 597 (86.8%) | 91 (13.2%) |
| $75,000 to $99,999 | 417 (98.6%) | 6 (1.4%) |
| $100,000 and over | 871 (93.9%) | 57 (6.1%) |
Public vs Private Health Insurance Coverage by Age in Columbia
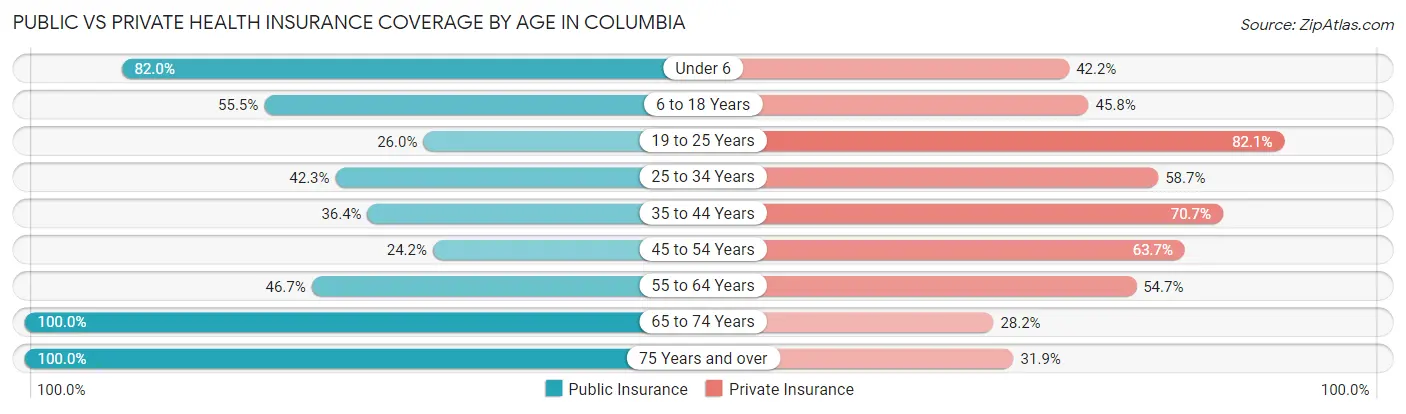
| Age Bracket | Public Insurance | Private Insurance |
| Under 6 | 237 (82.0%) | 122 (42.2%) |
| 6 to 18 Years | 331 (55.5%) | 273 (45.8%) |
| 19 to 25 Years | 349 (26.0%) | 1,102 (82.1%) |
| 25 to 34 Years | 201 (42.3%) | 279 (58.7%) |
| 35 to 44 Years | 144 (36.4%) | 280 (70.7%) |
| 45 to 54 Years | 94 (24.2%) | 247 (63.7%) |
| 55 to 64 Years | 201 (46.7%) | 235 (54.6%) |
| 65 to 74 Years | 302 (100.0%) | 85 (28.1%) |
| 75 Years and over | 373 (100.0%) | 119 (31.9%) |
| Total | 2,232 (48.6%) | 2,742 (59.7%) |
Disability Status by Sex by Age in Columbia
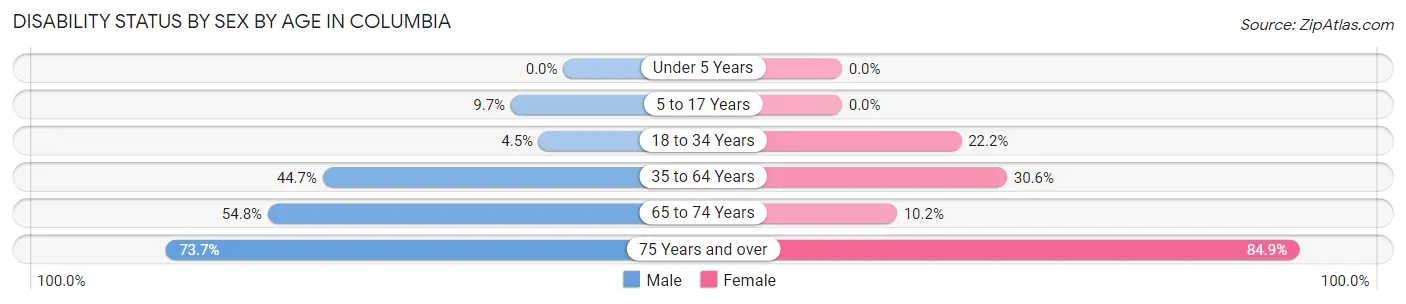
| Age Bracket | Male | Female |
| Under 5 Years | 0 (0.0%) | 0 (0.0%) |
| 5 to 17 Years | 32 (9.7%) | 0 (0.0%) |
| 18 to 34 Years | 36 (4.5%) | 257 (22.2%) |
| 35 to 64 Years | 217 (44.7%) | 223 (30.6%) |
| 65 to 74 Years | 85 (54.8%) | 15 (10.2%) |
| 75 Years and over | 129 (73.7%) | 168 (84.9%) |
Disability Class by Sex by Age in Columbia
Disability Class: Hearing Difficulty
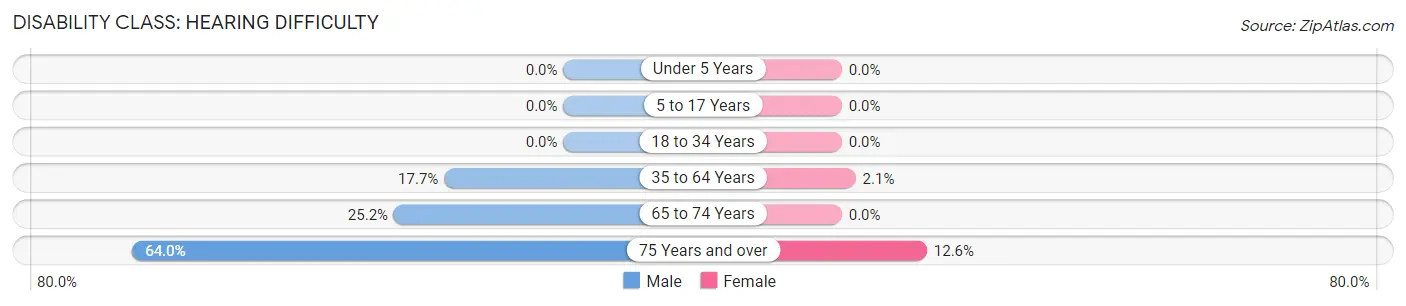
| Age Bracket | Male | Female |
| Under 5 Years | 0 (0.0%) | 0 (0.0%) |
| 5 to 17 Years | 0 (0.0%) | 0 (0.0%) |
| 18 to 34 Years | 0 (0.0%) | 0 (0.0%) |
| 35 to 64 Years | 86 (17.7%) | 15 (2.1%) |
| 65 to 74 Years | 39 (25.2%) | 0 (0.0%) |
| 75 Years and over | 112 (64.0%) | 25 (12.6%) |
Disability Class: Vision Difficulty
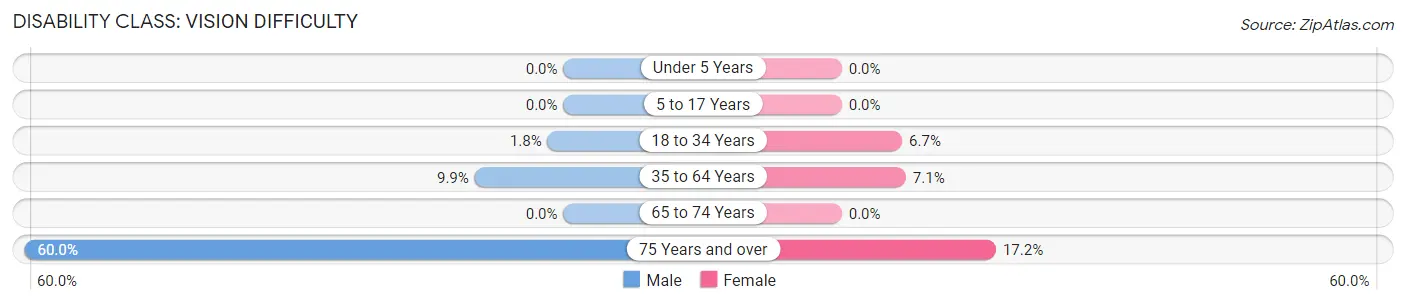
| Age Bracket | Male | Female |
| Under 5 Years | 0 (0.0%) | 0 (0.0%) |
| 5 to 17 Years | 0 (0.0%) | 0 (0.0%) |
| 18 to 34 Years | 14 (1.8%) | 78 (6.7%) |
| 35 to 64 Years | 48 (9.9%) | 52 (7.1%) |
| 65 to 74 Years | 0 (0.0%) | 0 (0.0%) |
| 75 Years and over | 105 (60.0%) | 34 (17.2%) |
Disability Class: Cognitive Difficulty
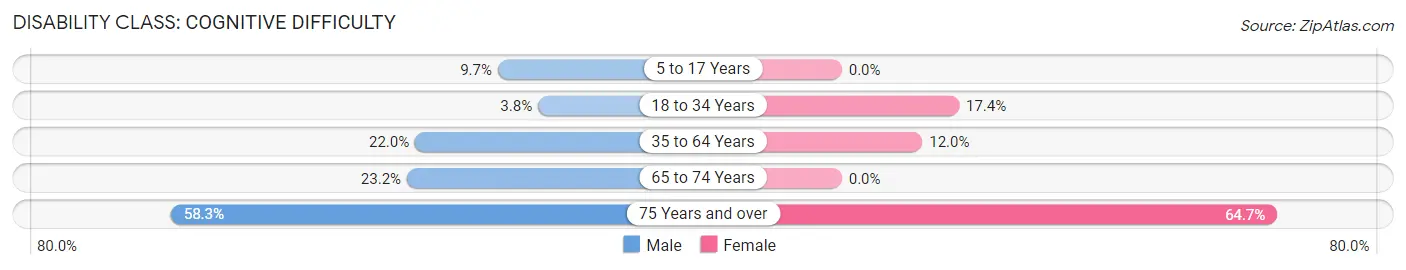
| Age Bracket | Male | Female |
| 5 to 17 Years | 32 (9.7%) | 0 (0.0%) |
| 18 to 34 Years | 30 (3.8%) | 202 (17.4%) |
| 35 to 64 Years | 107 (22.0%) | 87 (11.9%) |
| 65 to 74 Years | 36 (23.2%) | 0 (0.0%) |
| 75 Years and over | 102 (58.3%) | 128 (64.6%) |
Disability Class: Ambulatory Difficulty
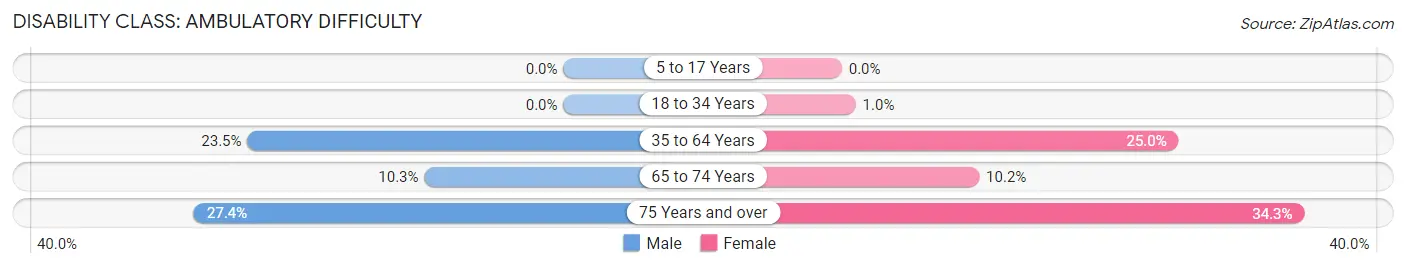
| Age Bracket | Male | Female |
| 5 to 17 Years | 0 (0.0%) | 0 (0.0%) |
| 18 to 34 Years | 0 (0.0%) | 12 (1.0%) |
| 35 to 64 Years | 114 (23.5%) | 182 (25.0%) |
| 65 to 74 Years | 16 (10.3%) | 15 (10.2%) |
| 75 Years and over | 48 (27.4%) | 68 (34.3%) |
Disability Class: Self-Care Difficulty
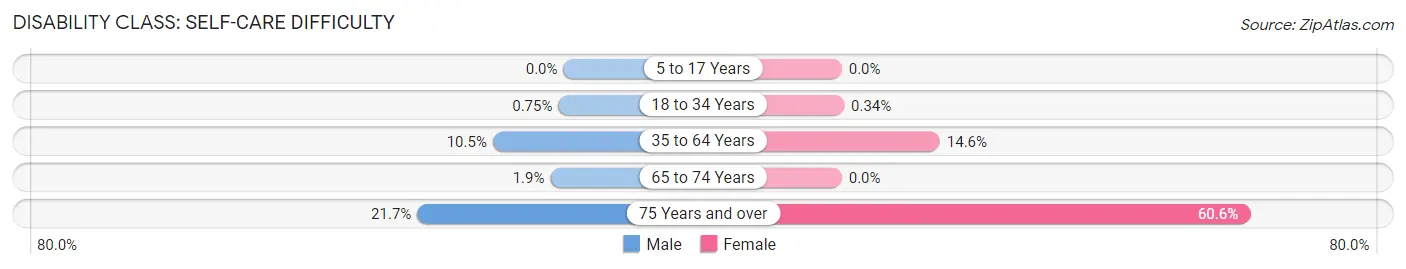
| Age Bracket | Male | Female |
| 5 to 17 Years | 0 (0.0%) | 0 (0.0%) |
| 18 to 34 Years | 6 (0.7%) | 4 (0.3%) |
| 35 to 64 Years | 51 (10.5%) | 106 (14.6%) |
| 65 to 74 Years | 3 (1.9%) | 0 (0.0%) |
| 75 Years and over | 38 (21.7%) | 120 (60.6%) |
Technology Access in Columbia
Computing Device Access in Columbia
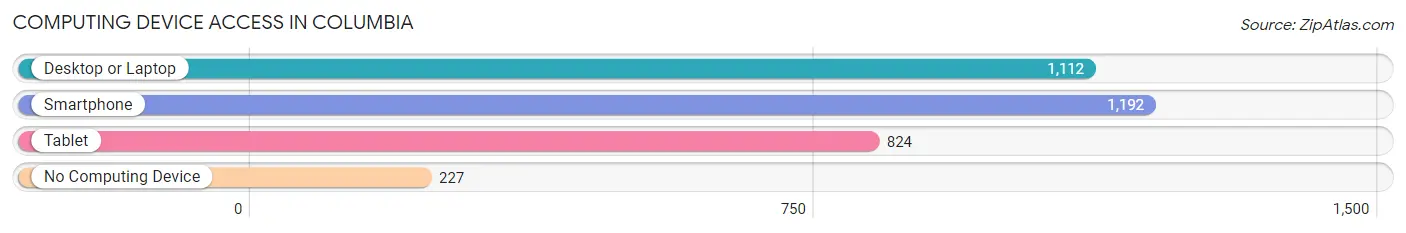
| Device Type | # Households | % Households |
| Desktop or Laptop | 1,112 | 71.4% |
| Smartphone | 1,192 | 76.6% |
| Tablet | 824 | 52.9% |
| No Computing Device | 227 | 14.6% |
| Total | 1,557 | 100.0% |
Internet Access in Columbia
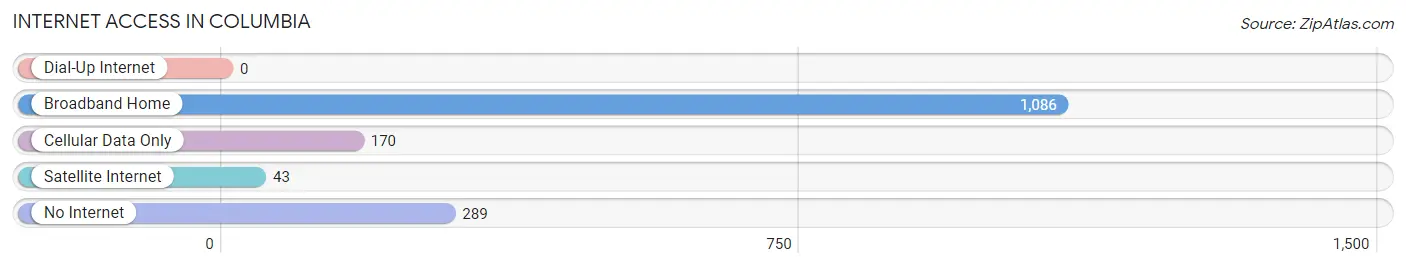
| Internet Type | # Households | % Households |
| Dial-Up Internet | 0 | 0.0% |
| Broadband Home | 1,086 | 69.8% |
| Cellular Data Only | 170 | 10.9% |
| Satellite Internet | 43 | 2.8% |
| No Internet | 289 | 18.6% |
| Total | 1,557 | 100.0% |
Columbia Summary
Columbia, Kentucky is a small city located in Adair County in the south-central part of the state. It is the county seat and the largest city in the county. The city is situated on the banks of the Green River and is surrounded by rolling hills and farmland. The population of Columbia was 4,452 at the 2010 census.
History
The area that is now Columbia was first settled in the early 1800s by a group of settlers from Virginia. The town was originally known as “The Crossroads” due to its location at the intersection of two major roads. In 1802, the town was officially incorporated and renamed Columbia in honor of Christopher Columbus.
In the early 19th century, Columbia was a thriving river port and a major stop on the stagecoach route between Louisville and Nashville. The town was also a major center for the production of hemp and tobacco. During the Civil War, Columbia was the site of a major battle between Confederate and Union forces.
Geography
Columbia is located in Adair County in south-central Kentucky. It is situated on the banks of the Green River and is surrounded by rolling hills and farmland. The city is located approximately 70 miles south of Louisville and 90 miles north of Nashville.
The climate in Columbia is humid subtropical, with hot summers and mild winters. The average annual temperature is around 60 degrees Fahrenheit. The average annual precipitation is around 45 inches.
Economy
The economy of Columbia is largely based on agriculture and manufacturing. The city is home to several large manufacturing plants, including a General Motors plant and a Tyson Foods plant. The city is also home to several small businesses, including restaurants, retail stores, and service providers.
The unemployment rate in Columbia is slightly higher than the national average, but the city has seen a steady increase in job growth in recent years. The median household income in Columbia is around $35,000, which is slightly lower than the national average.
Demographics
As of the 2010 census, the population of Columbia was 4,452. The racial makeup of the city was 87.3% White, 8.7% African American, 0.3% Native American, 0.7% Asian, and 2.9% from other races. The median age in Columbia was 38.7 years.
The median household income in Columbia was $35,000, and the median family income was $41,000. The per capita income in Columbia was $17,000. Around 17.3% of the population was below the poverty line.
Conclusion
Columbia, Kentucky is a small city located in Adair County in the south-central part of the state. It is the county seat and the largest city in the county. The city is situated on the banks of the Green River and is surrounded by rolling hills and farmland. The economy of Columbia is largely based on agriculture and manufacturing, and the city has seen a steady increase in job growth in recent years. The population of Columbia was 4,452 at the 2010 census, and the median household income was around $35,000.
Common Questions
What is Per Capita Income in Columbia?
Per Capita income in Columbia is $25,563.
What is the Median Family Income in Columbia?
Median Family Income in Columbia is $64,360.
What is the Median Household income in Columbia?
Median Household Income in Columbia is $45,163.
What is Income or Wage Gap in Columbia?
Income or Wage Gap in Columbia is 45.5%.
Women in Columbia earn 54.5 cents for every dollar earned by a man.
What is Family Income Deficit in Columbia?
Family Income Deficit in Columbia is $7,927.
Families that are below poverty line in Columbia earn $7,927 less on average than the poverty threshold level.
What is Inequality or Gini Index in Columbia?
Inequality or Gini Index in Columbia is 0.53.
What is the Total Population of Columbia?
Total Population of Columbia is 4,811.
What is the Total Male Population of Columbia?
Total Male Population of Columbia is 2,220.
What is the Total Female Population of Columbia?
Total Female Population of Columbia is 2,591.
What is the Ratio of Males per 100 Females in Columbia?
There are 85.68 Males per 100 Females in Columbia.
What is the Ratio of Females per 100 Males in Columbia?
There are 116.71 Females per 100 Males in Columbia.
What is the Median Population Age in Columbia?
Median Population Age in Columbia is 27.6 Years.
What is the Average Family Size in Columbia
Average Family Size in Columbia is 3.0 People.
What is the Average Household Size in Columbia
Average Household Size in Columbia is 2.3 People.
How Large is the Labor Force in Columbia?
There are 2,172 People in the Labor Forcein in Columbia.
What is the Percentage of People in the Labor Force in Columbia?
52.3% of People are in the Labor Force in Columbia.
What is the Unemployment Rate in Columbia?
Unemployment Rate in Columbia is 5.8%.