Science Hill, KY Map & Demographics
Science Hill Map
Science Hill Overview
$18,627
PER CAPITA INCOME
$60,500
AVG FAMILY INCOME
$36,250
AVG HOUSEHOLD INCOME
30.3%
WAGE / INCOME GAP [ % ]
69.7¢/ $1
WAGE / INCOME GAP [ $ ]
$12,880
FAMILY INCOME DEFICIT
0.45
INEQUALITY / GINI INDEX
714
TOTAL POPULATION
289
MALE POPULATION
425
FEMALE POPULATION
68.00
MALES / 100 FEMALES
147.06
FEMALES / 100 MALES
33.1
MEDIAN AGE
3.4
AVG FAMILY SIZE
2.8
AVG HOUSEHOLD SIZE
288
LABOR FORCE [ PEOPLE ]
53.3%
PERCENT IN LABOR FORCE
6.6%
UNEMPLOYMENT RATE
Science Hill Zip Codes
Science Hill Area Codes
Income in Science Hill
Income Overview in Science Hill
Per Capita Income in Science Hill is $18,627, while median incomes of families and households are $60,500 and $36,250 respectively.
| Characteristic | Number | Measure |
| Per Capita Income | 714 | $18,627 |
| Median Family Income | 178 | $60,500 |
| Mean Family Income | 178 | $59,295 |
| Median Household Income | 260 | $36,250 |
| Mean Household Income | 260 | $49,858 |
| Income Deficit | 178 | $12,880 |
| Wage / Income Gap (%) | 714 | 30.27% |
| Wage / Income Gap ($) | 714 | 69.73¢ per $1 |
| Gini / Inequality Index | 714 | 0.45 |
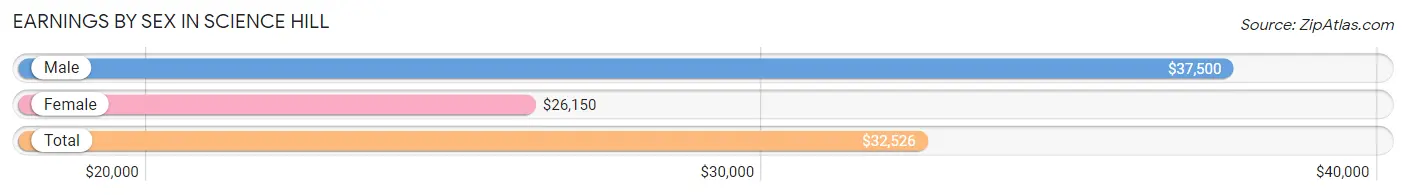
Earnings by Sex in Science Hill
Average Earnings in Science Hill are $32,526, $37,500 for men and $26,150 for women, a difference of 30.3%.
| Sex | Number | Average Earnings |
| Male | 144 (46.6%) | $37,500 |
| Female | 165 (53.4%) | $26,150 |
| Total | 309 (100.0%) | $32,526 |
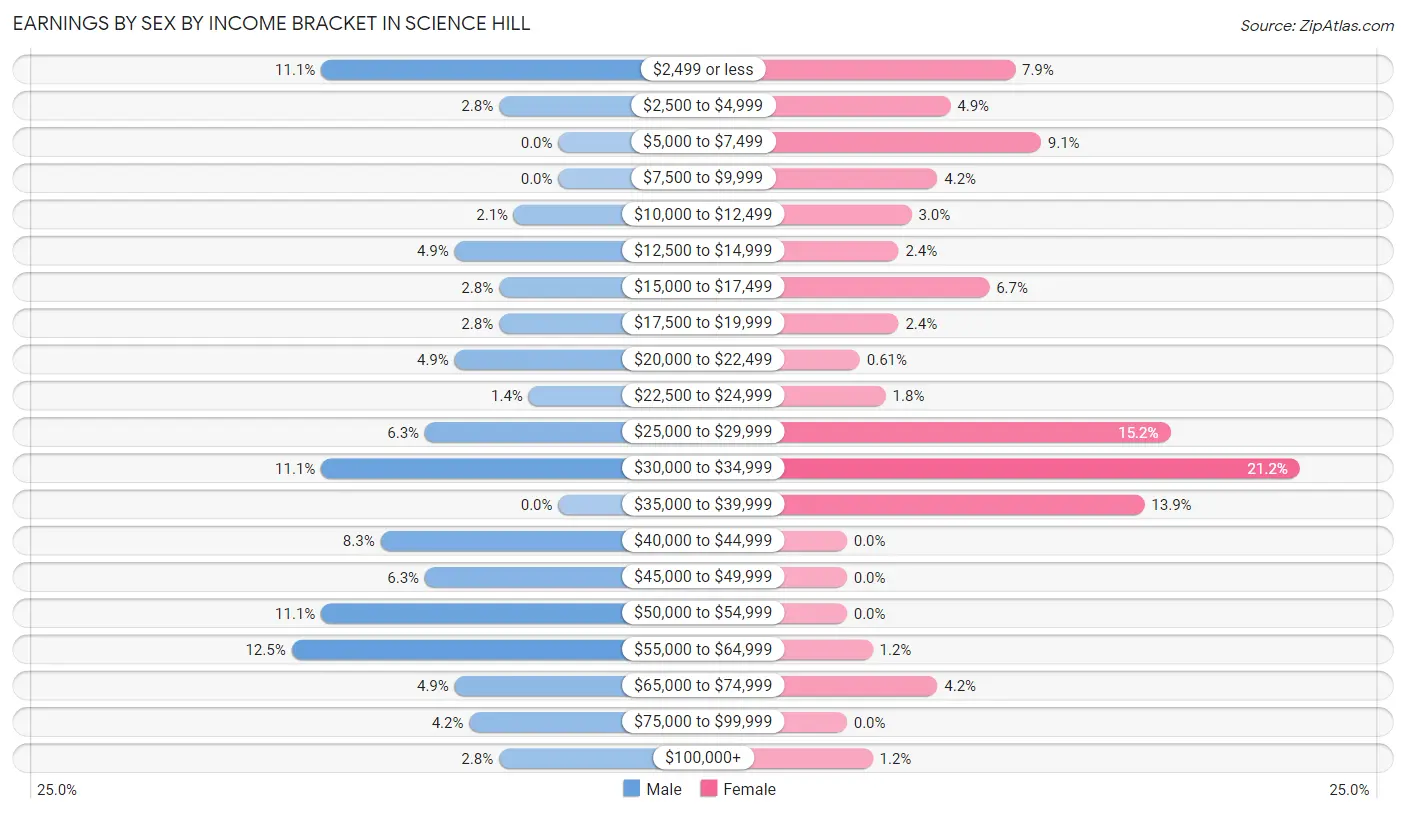
Earnings by Sex by Income Bracket in Science Hill
The most common earnings brackets in Science Hill are $55,000 to $64,999 for men (18 | 12.5%) and $30,000 to $34,999 for women (35 | 21.2%).
| Income | Male | Female |
| $2,499 or less | 16 (11.1%) | 13 (7.9%) |
| $2,500 to $4,999 | 4 (2.8%) | 8 (4.9%) |
| $5,000 to $7,499 | 0 (0.0%) | 15 (9.1%) |
| $7,500 to $9,999 | 0 (0.0%) | 7 (4.2%) |
| $10,000 to $12,499 | 3 (2.1%) | 5 (3.0%) |
| $12,500 to $14,999 | 7 (4.9%) | 4 (2.4%) |
| $15,000 to $17,499 | 4 (2.8%) | 11 (6.7%) |
| $17,500 to $19,999 | 4 (2.8%) | 4 (2.4%) |
| $20,000 to $22,499 | 7 (4.9%) | 1 (0.6%) |
| $22,500 to $24,999 | 2 (1.4%) | 3 (1.8%) |
| $25,000 to $29,999 | 9 (6.2%) | 25 (15.1%) |
| $30,000 to $34,999 | 16 (11.1%) | 35 (21.2%) |
| $35,000 to $39,999 | 0 (0.0%) | 23 (13.9%) |
| $40,000 to $44,999 | 12 (8.3%) | 0 (0.0%) |
| $45,000 to $49,999 | 9 (6.2%) | 0 (0.0%) |
| $50,000 to $54,999 | 16 (11.1%) | 0 (0.0%) |
| $55,000 to $64,999 | 18 (12.5%) | 2 (1.2%) |
| $65,000 to $74,999 | 7 (4.9%) | 7 (4.2%) |
| $75,000 to $99,999 | 6 (4.2%) | 0 (0.0%) |
| $100,000+ | 4 (2.8%) | 2 (1.2%) |
| Total | 144 (100.0%) | 165 (100.0%) |
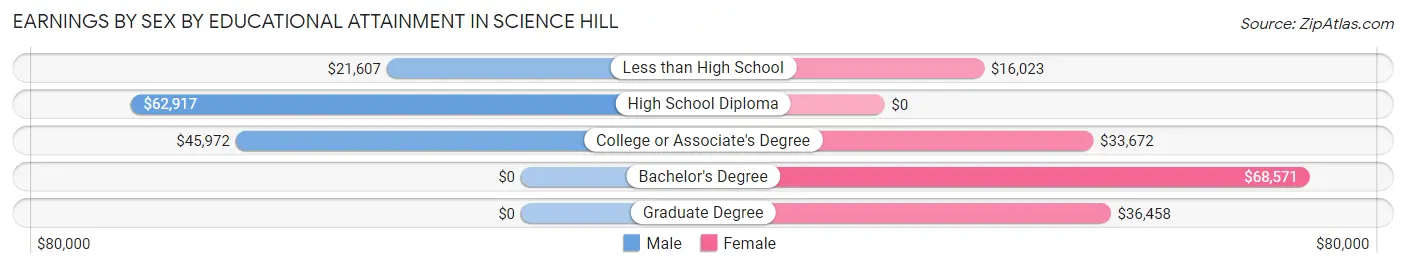
Earnings by Sex by Educational Attainment in Science Hill
Average earnings in Science Hill are $47,361 for men and $27,396 for women, a difference of 42.1%. Men with an educational attainment of high school diploma enjoy the highest average annual earnings of $62,917, while those with less than high school education earn the least with $21,607. Women with an educational attainment of bachelor's degree earn the most with the average annual earnings of $68,571, while those with less than high school education have the smallest earnings of $16,023.
| Educational Attainment | Male Income | Female Income |
| Less than High School | $21,607 | $16,023 |
| High School Diploma | $62,917 | $0 |
| College or Associate's Degree | $45,972 | $33,672 |
| Bachelor's Degree | - | - |
| Graduate Degree | - | - |
| Total | $47,361 | $27,396 |
Family Income in Science Hill
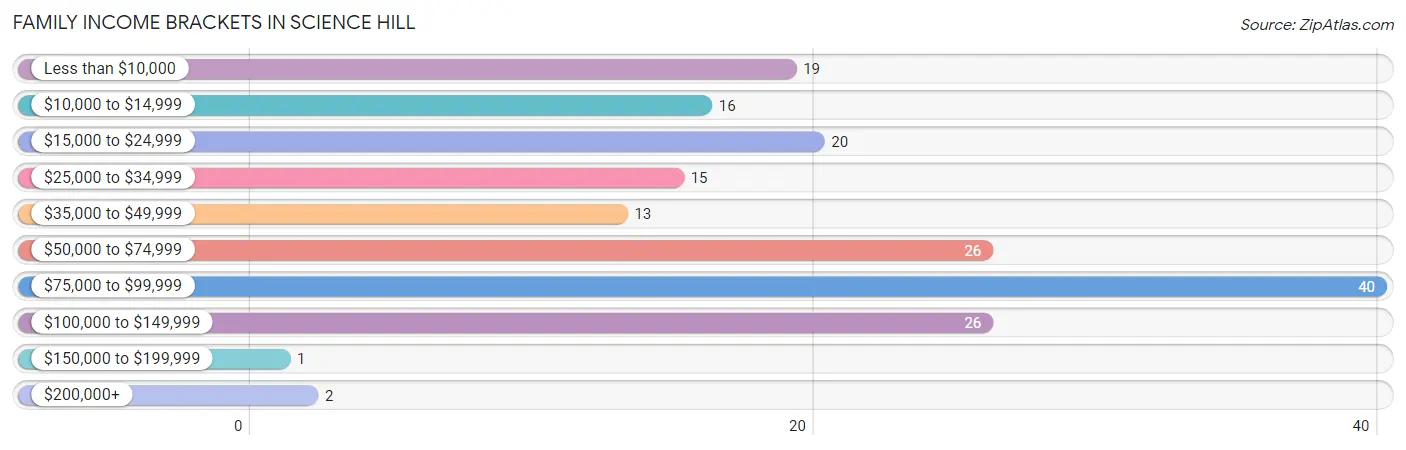
Family Income Brackets in Science Hill
According to the Science Hill family income data, there are 40 families falling into the $75,000 to $99,999 income range, which is the most common income bracket and makes up 22.5% of all families. Conversely, the $150,000 to $199,999 income bracket is the least frequent group with only 1 families (0.6%) belonging to this category.
| Income Bracket | # Families | % Families |
| Less than $10,000 | 19 | 10.7% |
| $10,000 to $14,999 | 16 | 9.0% |
| $15,000 to $24,999 | 20 | 11.2% |
| $25,000 to $34,999 | 15 | 8.4% |
| $35,000 to $49,999 | 13 | 7.3% |
| $50,000 to $74,999 | 26 | 14.6% |
| $75,000 to $99,999 | 40 | 22.5% |
| $100,000 to $149,999 | 26 | 14.6% |
| $150,000 to $199,999 | 1 | 0.6% |
| $200,000+ | 2 | 1.1% |
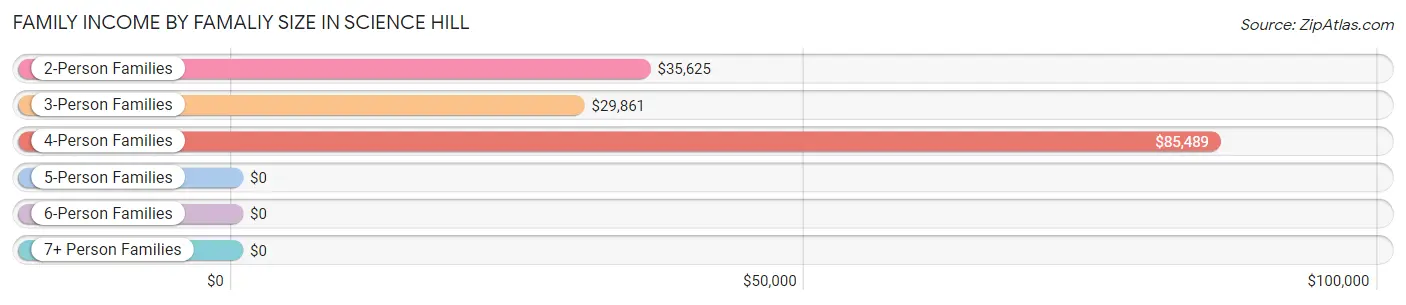
Family Income by Famaliy Size in Science Hill
4-person families (67 | 37.6%) account for the highest median family income in Science Hill with $85,489 per family, while 4-person families (67 | 37.6%) have the highest median income of $21,372 per family member.
| Income Bracket | # Families | Median Income |
| 2-Person Families | 55 (30.9%) | $35,625 |
| 3-Person Families | 41 (23.0%) | $29,861 |
| 4-Person Families | 67 (37.6%) | $85,489 |
| 5-Person Families | 10 (5.6%) | $0 |
| 6-Person Families | 0 (0.0%) | $0 |
| 7+ Person Families | 5 (2.8%) | $0 |
| Total | 178 (100.0%) | $60,500 |
Family Income by Number of Earners in Science Hill
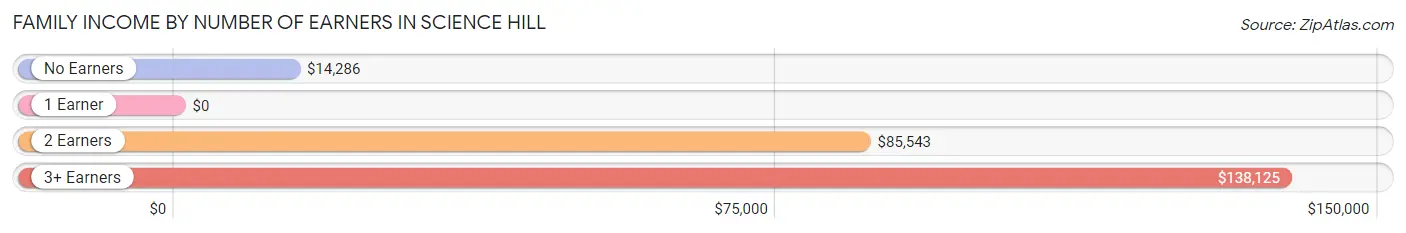
| Number of Earners | # Families | Median Income |
| No Earners | 48 (27.0%) | $14,286 |
| 1 Earner | 40 (22.5%) | $0 |
| 2 Earners | 74 (41.6%) | $85,543 |
| 3+ Earners | 16 (9.0%) | $138,125 |
| Total | 178 (100.0%) | $60,500 |
Household Income in Science Hill
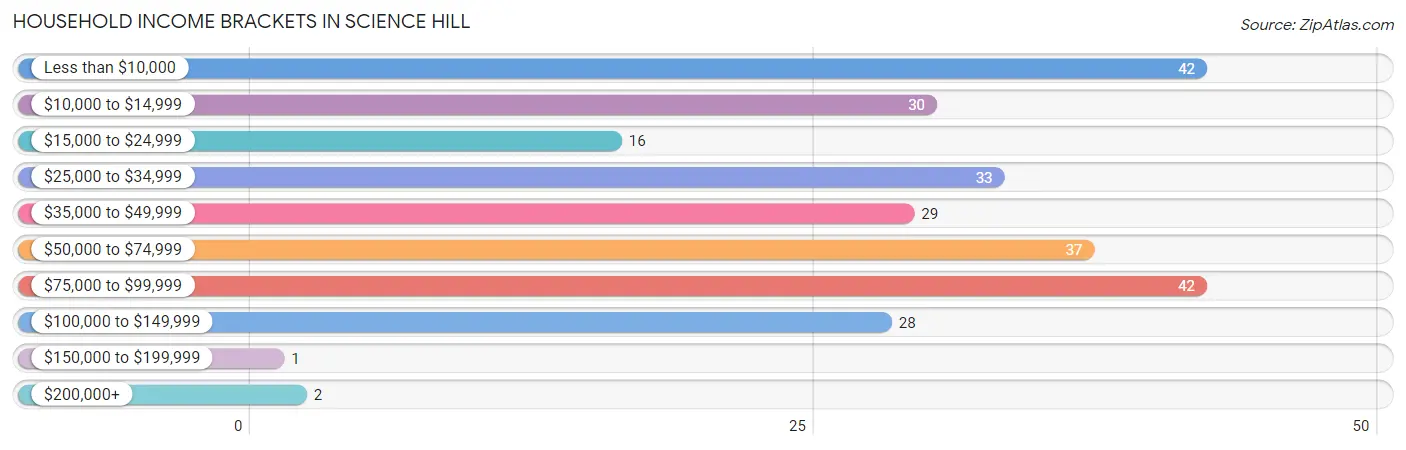
Household Income Brackets in Science Hill
With 42 households falling in the category, the less than $10,000 income range is the most frequent in Science Hill, accounting for 16.2% of all households. In contrast, only 1 households (0.4%) fall into the $150,000 to $199,999 income bracket, making it the least populous group.
| Income Bracket | # Households | % Households |
| Less than $10,000 | 42 | 16.2% |
| $10,000 to $14,999 | 30 | 11.5% |
| $15,000 to $24,999 | 16 | 6.2% |
| $25,000 to $34,999 | 33 | 12.7% |
| $35,000 to $49,999 | 29 | 11.2% |
| $50,000 to $74,999 | 37 | 14.2% |
| $75,000 to $99,999 | 42 | 16.2% |
| $100,000 to $149,999 | 28 | 10.8% |
| $150,000 to $199,999 | 1 | 0.4% |
| $200,000+ | 2 | 0.8% |
Household Income by Householder Age in Science Hill
The median household income in Science Hill is $36,250, with the highest median household income of $78,750 found in the 25 to 44 years age bracket for the primary householder. A total of 89 households (34.2%) fall into this category. Meanwhile, the 45 to 64 years age bracket for the primary householder has the lowest median household income of $29,500, with 86 households (33.1%) in this group.
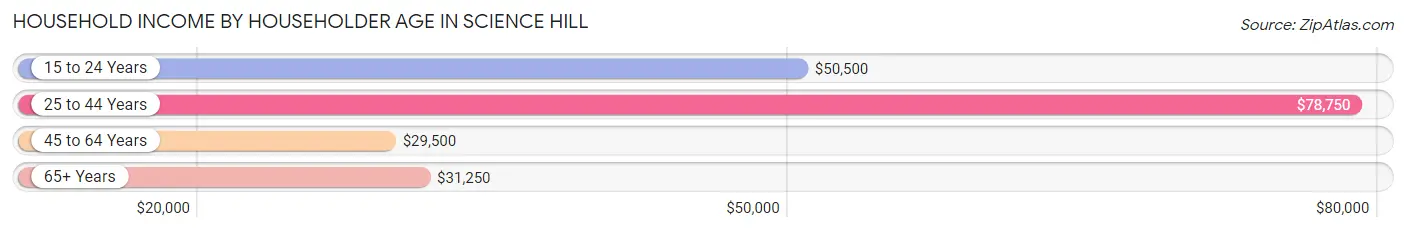
| Income Bracket | # Households | Median Income |
| 15 to 24 Years | 8 (3.1%) | $50,500 |
| 25 to 44 Years | 89 (34.2%) | $78,750 |
| 45 to 64 Years | 86 (33.1%) | $29,500 |
| 65+ Years | 77 (29.6%) | $31,250 |
| Total | 260 (100.0%) | $36,250 |
Poverty in Science Hill
Income Below Poverty by Sex and Age in Science Hill
With 22.2% poverty level for males and 26.4% for females among the residents of Science Hill, 5 year old males and 6 to 11 year old females are the most vulnerable to poverty, with 6 males (66.7%) and 8 females (72.7%) in their respective age groups living below the poverty level.
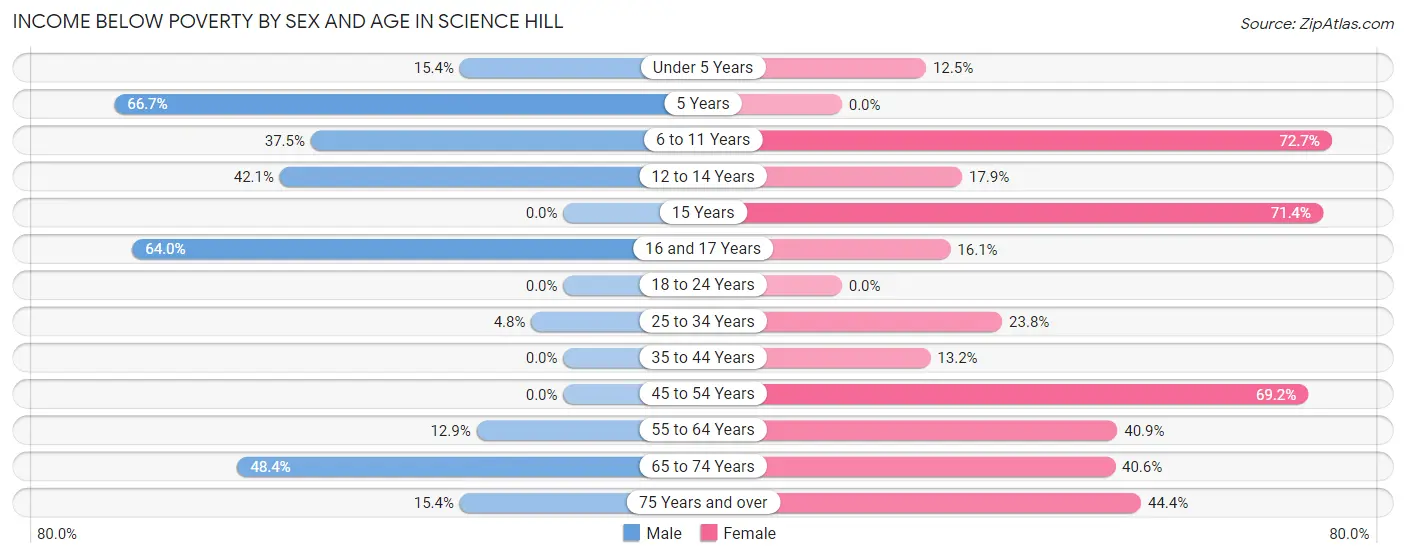
| Age Bracket | Male | Female |
| Under 5 Years | 6 (15.4%) | 5 (12.5%) |
| 5 Years | 6 (66.7%) | 0 (0.0%) |
| 6 to 11 Years | 6 (37.5%) | 8 (72.7%) |
| 12 to 14 Years | 8 (42.1%) | 5 (17.9%) |
| 15 Years | 0 (0.0%) | 5 (71.4%) |
| 16 and 17 Years | 16 (64.0%) | 5 (16.1%) |
| 18 to 24 Years | 0 (0.0%) | 0 (0.0%) |
| 25 to 34 Years | 1 (4.8%) | 15 (23.8%) |
| 35 to 44 Years | 0 (0.0%) | 10 (13.2%) |
| 45 to 54 Years | 0 (0.0%) | 9 (69.2%) |
| 55 to 64 Years | 4 (12.9%) | 18 (40.9%) |
| 65 to 74 Years | 15 (48.4%) | 28 (40.6%) |
| 75 Years and over | 2 (15.4%) | 4 (44.4%) |
| Total | 64 (22.2%) | 112 (26.4%) |
Income Above Poverty by Sex and Age in Science Hill
According to the poverty statistics in Science Hill, males aged 18 to 24 years and females aged 5 years are the age groups that are most secure financially, with 100.0% of males and 100.0% of females in these age groups living above the poverty line.
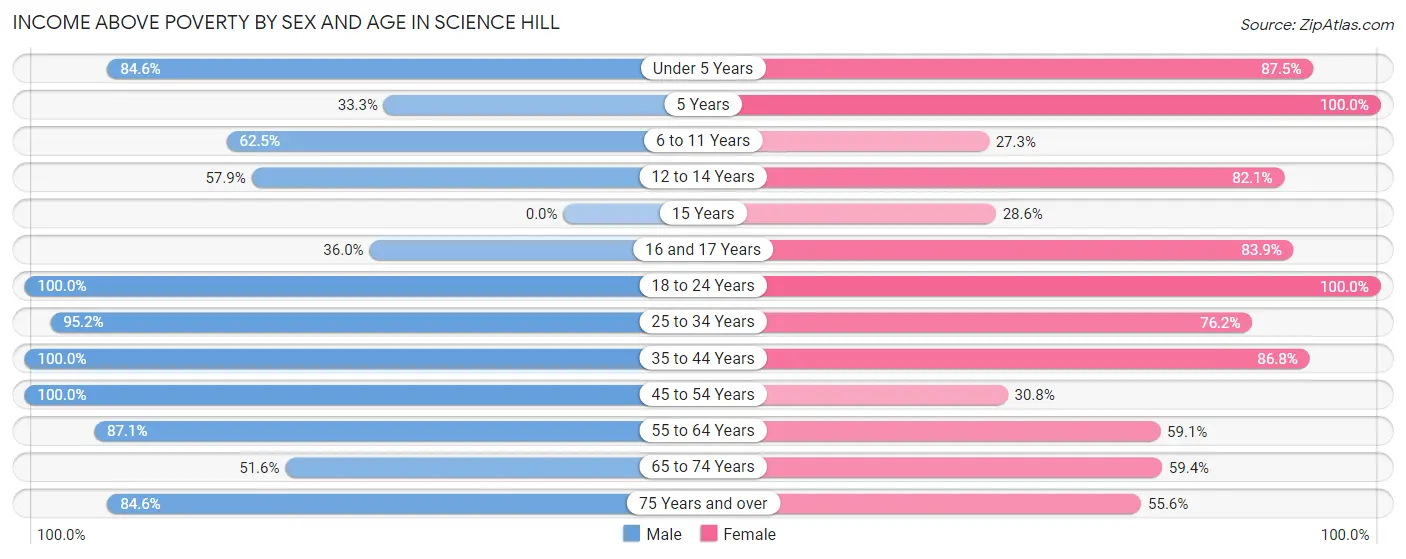
| Age Bracket | Male | Female |
| Under 5 Years | 33 (84.6%) | 35 (87.5%) |
| 5 Years | 3 (33.3%) | 3 (100.0%) |
| 6 to 11 Years | 10 (62.5%) | 3 (27.3%) |
| 12 to 14 Years | 11 (57.9%) | 23 (82.1%) |
| 15 Years | 0 (0.0%) | 2 (28.6%) |
| 16 and 17 Years | 9 (36.0%) | 26 (83.9%) |
| 18 to 24 Years | 26 (100.0%) | 30 (100.0%) |
| 25 to 34 Years | 20 (95.2%) | 48 (76.2%) |
| 35 to 44 Years | 35 (100.0%) | 66 (86.8%) |
| 45 to 54 Years | 23 (100.0%) | 4 (30.8%) |
| 55 to 64 Years | 27 (87.1%) | 26 (59.1%) |
| 65 to 74 Years | 16 (51.6%) | 41 (59.4%) |
| 75 Years and over | 11 (84.6%) | 5 (55.6%) |
| Total | 224 (77.8%) | 312 (73.6%) |
Income Below Poverty Among Married-Couple Families in Science Hill
The poverty statistics for married-couple families in Science Hill show that 11.2% or 12 of the total 107 families live below the poverty line. Families with 5 or more children have the highest poverty rate of 100.0%, comprising of 1 families. On the other hand, families with 3 or 4 children have the lowest poverty rate of 0.0%, which includes 0 families.
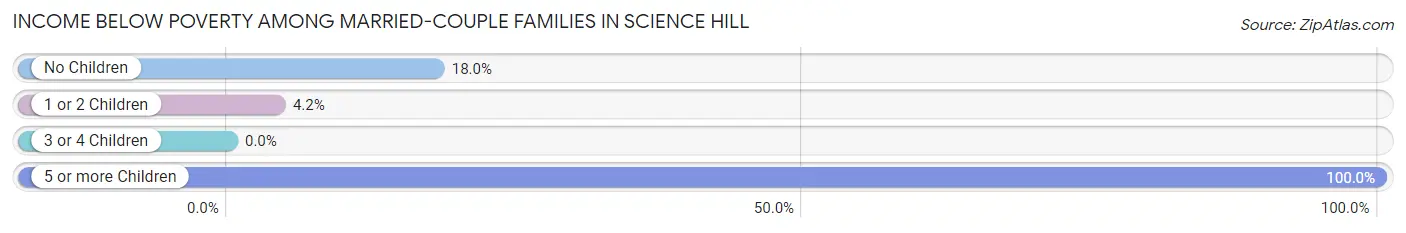
| Children | Above Poverty | Below Poverty |
| No Children | 41 (82.0%) | 9 (18.0%) |
| 1 or 2 Children | 46 (95.8%) | 2 (4.2%) |
| 3 or 4 Children | 8 (100.0%) | 0 (0.0%) |
| 5 or more Children | 0 (0.0%) | 1 (100.0%) |
| Total | 95 (88.8%) | 12 (11.2%) |
Income Below Poverty Among Single-Parent Households in Science Hill
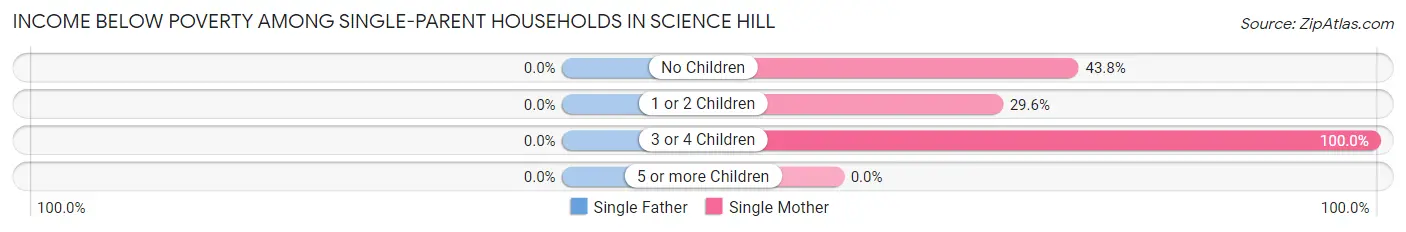
| Children | Single Father | Single Mother |
| No Children | 0 (0.0%) | 7 (43.8%) |
| 1 or 2 Children | 0 (0.0%) | 8 (29.6%) |
| 3 or 4 Children | 0 (0.0%) | 18 (100.0%) |
| 5 or more Children | 0 (0.0%) | 0 (0.0%) |
| Total | 0 (0.0%) | 33 (54.1%) |
Income Below Poverty Among Married-Couple vs Single-Parent Households in Science Hill
The poverty data for Science Hill shows that 12 of the married-couple family households (11.2%) and 33 of the single-parent households (46.5%) are living below the poverty level. Within the married-couple family households, those with 5 or more children have the highest poverty rate, with 1 households (100.0%) falling below the poverty line. Among the single-parent households, those with 3 or 4 children have the highest poverty rate, with 18 household (100.0%) living below poverty.
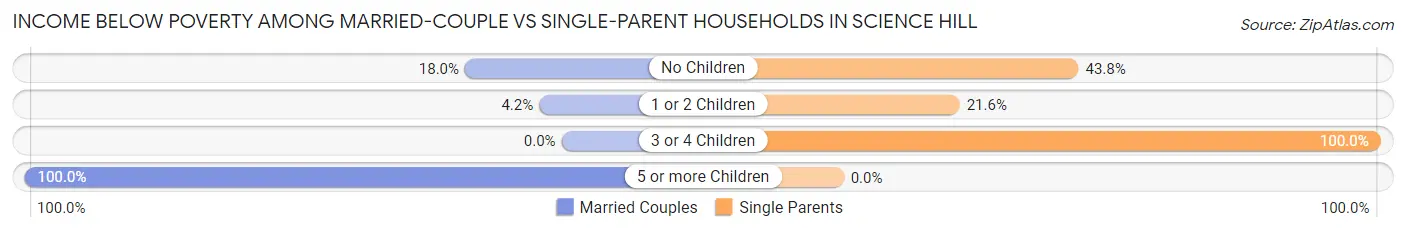
| Children | Married-Couple Families | Single-Parent Households |
| No Children | 9 (18.0%) | 7 (43.8%) |
| 1 or 2 Children | 2 (4.2%) | 8 (21.6%) |
| 3 or 4 Children | 0 (0.0%) | 18 (100.0%) |
| 5 or more Children | 1 (100.0%) | 0 (0.0%) |
| Total | 12 (11.2%) | 33 (46.5%) |
Race in Science Hill
The most populous races in Science Hill are White / Caucasian (693 | 97.1%), Two or more Races (19 | 2.7%), and Hispanic or Latino (11 | 1.5%).
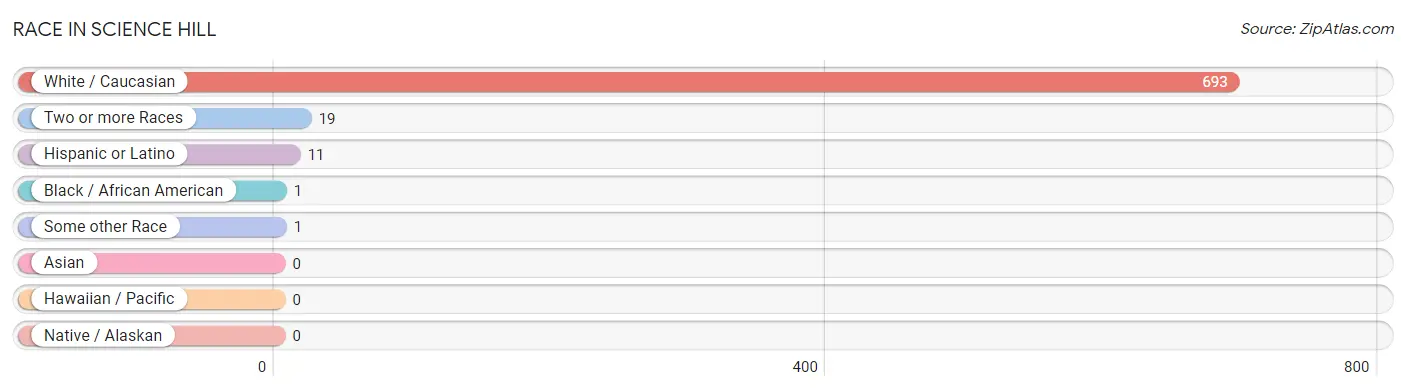
| Race | # Population | % Population |
| Asian | 0 | 0.0% |
| Black / African American | 1 | 0.1% |
| Hawaiian / Pacific | 0 | 0.0% |
| Hispanic or Latino | 11 | 1.5% |
| Native / Alaskan | 0 | 0.0% |
| White / Caucasian | 693 | 97.1% |
| Two or more Races | 19 | 2.7% |
| Some other Race | 1 | 0.1% |
| Total | 714 | 100.0% |
Ancestry in Science Hill
The most populous ancestries reported in Science Hill are American (132 | 18.5%), Irish (125 | 17.5%), English (101 | 14.1%), German (69 | 9.7%), and Scottish (33 | 4.6%), together accounting for 64.4% of all Science Hill residents.
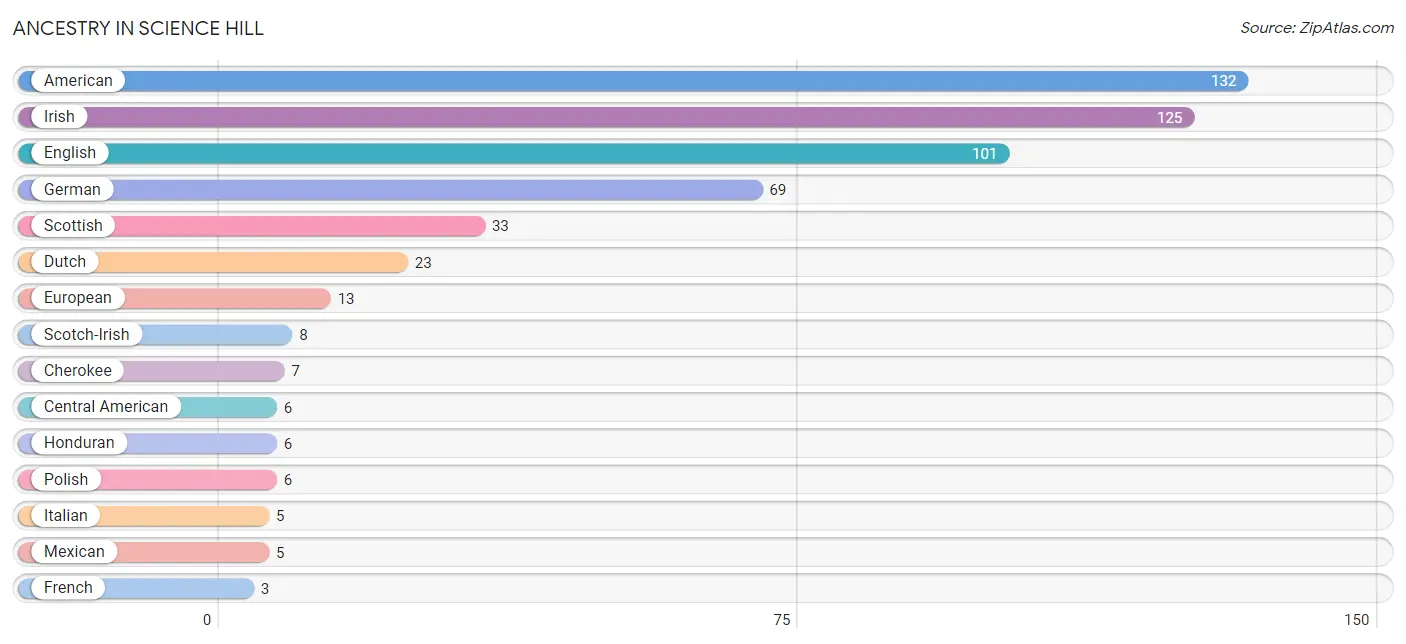
| Ancestry | # Population | % Population |
| American | 132 | 18.5% |
| Belgian | 2 | 0.3% |
| Central American | 6 | 0.8% |
| Cherokee | 7 | 1.0% |
| Dutch | 23 | 3.2% |
| English | 101 | 14.1% |
| European | 13 | 1.8% |
| French | 3 | 0.4% |
| German | 69 | 9.7% |
| Honduran | 6 | 0.8% |
| Irish | 125 | 17.5% |
| Italian | 5 | 0.7% |
| Mexican | 5 | 0.7% |
| Polish | 6 | 0.8% |
| Scotch-Irish | 8 | 1.1% |
| Scottish | 33 | 4.6% | View All 16 Rows |
Immigrants in Science Hill
The most numerous immigrant groups reported in Science Hill came from Central America (1 | 0.1%), Latin America (1 | 0.1%), and Mexico (1 | 0.1%), together accounting for 0.4% of all Science Hill residents.
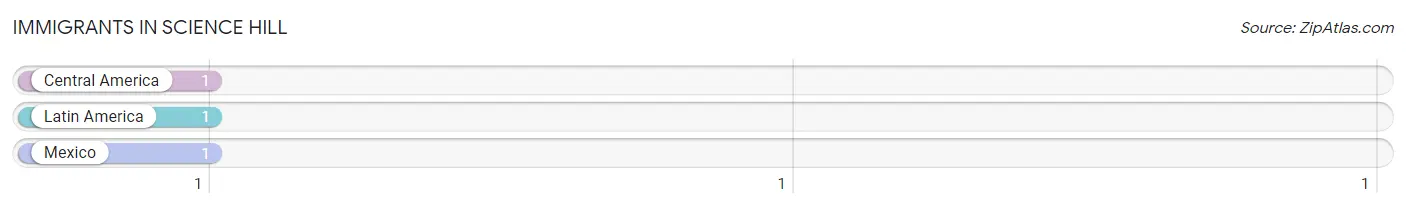
| Immigration Origin | # Population | % Population |
| Central America | 1 | 0.1% |
| Latin America | 1 | 0.1% |
| Mexico | 1 | 0.1% | View All 3 Rows |
Sex and Age in Science Hill
Sex and Age in Science Hill
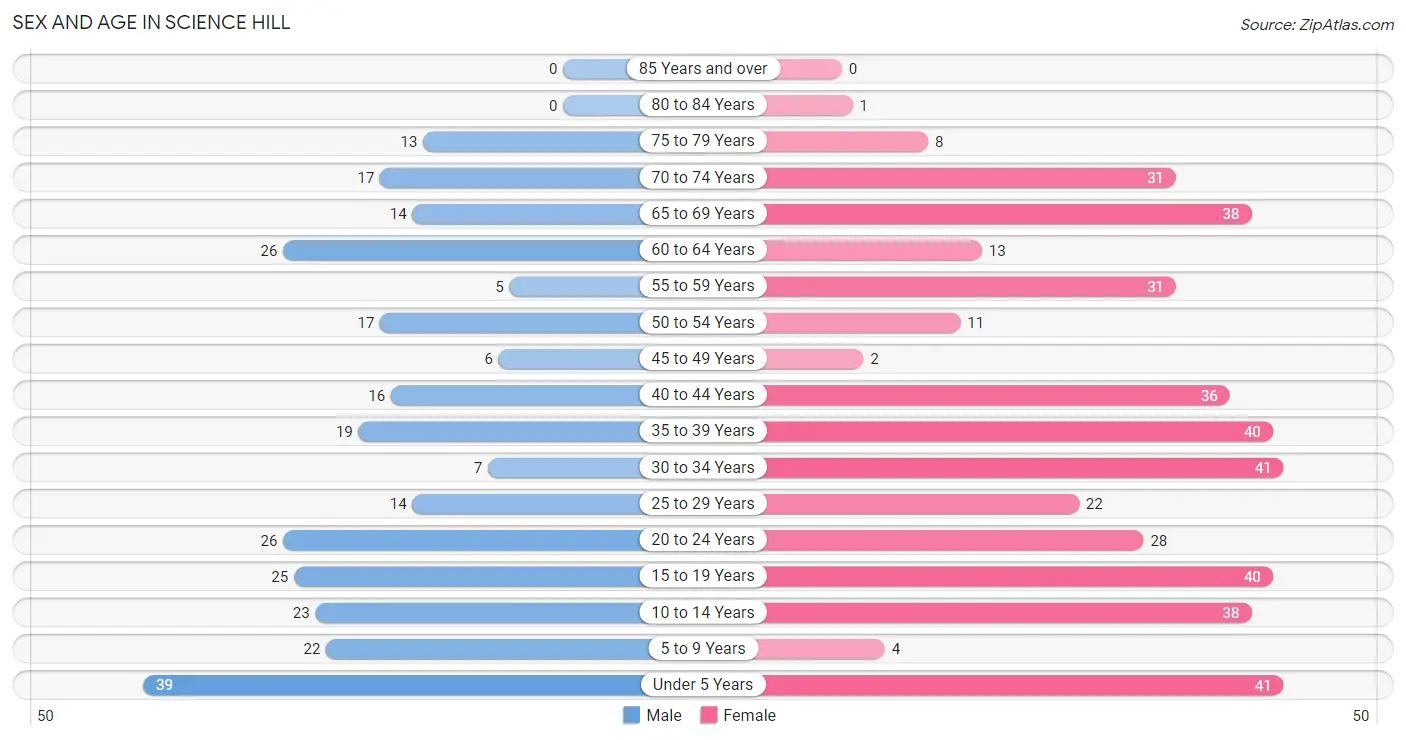
The most populous age groups in Science Hill are Under 5 Years (39 | 13.5%) for men and Under 5 Years (41 | 9.7%) for women.
| Age Bracket | Male | Female |
| Under 5 Years | 39 (13.5%) | 41 (9.7%) |
| 5 to 9 Years | 22 (7.6%) | 4 (0.9%) |
| 10 to 14 Years | 23 (8.0%) | 38 (8.9%) |
| 15 to 19 Years | 25 (8.6%) | 40 (9.4%) |
| 20 to 24 Years | 26 (9.0%) | 28 (6.6%) |
| 25 to 29 Years | 14 (4.8%) | 22 (5.2%) |
| 30 to 34 Years | 7 (2.4%) | 41 (9.7%) |
| 35 to 39 Years | 19 (6.6%) | 40 (9.4%) |
| 40 to 44 Years | 16 (5.5%) | 36 (8.5%) |
| 45 to 49 Years | 6 (2.1%) | 2 (0.5%) |
| 50 to 54 Years | 17 (5.9%) | 11 (2.6%) |
| 55 to 59 Years | 5 (1.7%) | 31 (7.3%) |
| 60 to 64 Years | 26 (9.0%) | 13 (3.1%) |
| 65 to 69 Years | 14 (4.8%) | 38 (8.9%) |
| 70 to 74 Years | 17 (5.9%) | 31 (7.3%) |
| 75 to 79 Years | 13 (4.5%) | 8 (1.9%) |
| 80 to 84 Years | 0 (0.0%) | 1 (0.2%) |
| 85 Years and over | 0 (0.0%) | 0 (0.0%) |
| Total | 289 (100.0%) | 425 (100.0%) |
Families and Households in Science Hill
Median Family Size in Science Hill
The median family size in Science Hill is 3.39 persons per family, with married-couple families (107 | 60.1%) accounting for the largest median family size of 3.65 persons per family. On the other hand, single male/father families (10 | 5.6%) represent the smallest median family size with 2.10 persons per family.
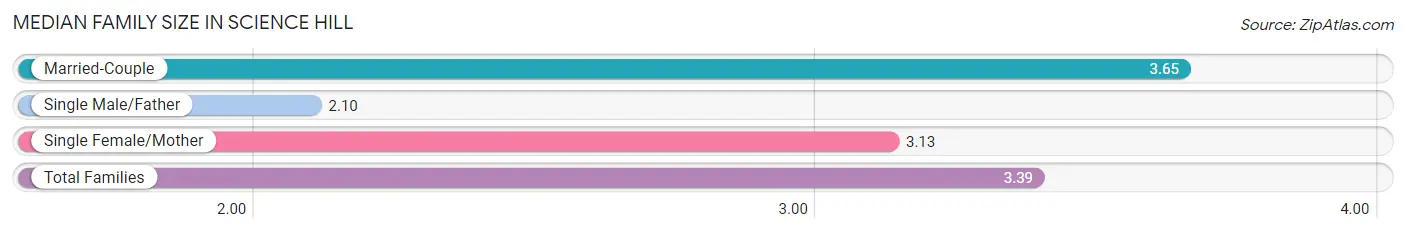
| Family Type | # Families | Family Size |
| Married-Couple | 107 (60.1%) | 3.65 |
| Single Male/Father | 10 (5.6%) | 2.10 |
| Single Female/Mother | 61 (34.3%) | 3.13 |
| Total Families | 178 (100.0%) | 3.39 |
Median Household Size in Science Hill
The median household size in Science Hill is 2.75 persons per household, with married-couple households (107 | 41.1%) accounting for the largest median household size of 3.68 persons per household. non-family households (82 | 31.5%) represent the smallest median household size with 1.16 persons per household.
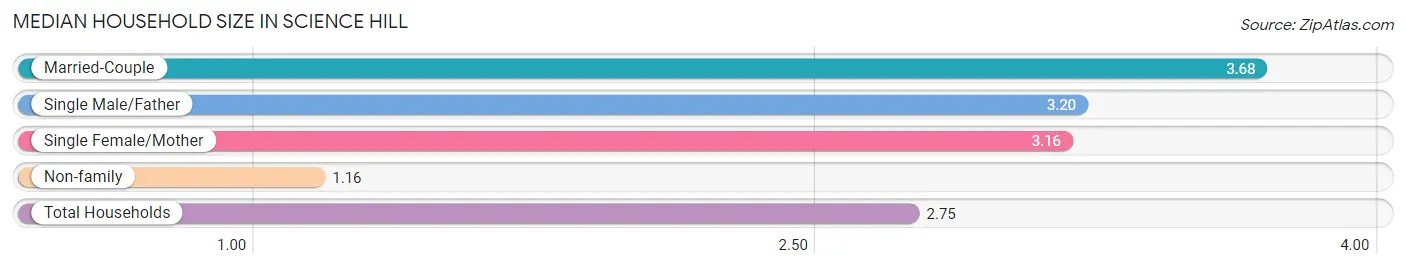
| Household Type | # Households | Household Size |
| Married-Couple | 107 (41.1%) | 3.68 |
| Single Male/Father | 10 (3.8%) | 3.20 |
| Single Female/Mother | 61 (23.5%) | 3.16 |
| Non-family | 82 (31.5%) | 1.16 |
| Total Households | 260 (100.0%) | 2.75 |
Household Size by Marriage Status in Science Hill
Out of a total of 260 households in Science Hill, 178 (68.5%) are family households, while 82 (31.5%) are nonfamily households. The most numerous type of family households are 4-person households, comprising 66, and the most common type of nonfamily households are 1-person households, comprising 73.
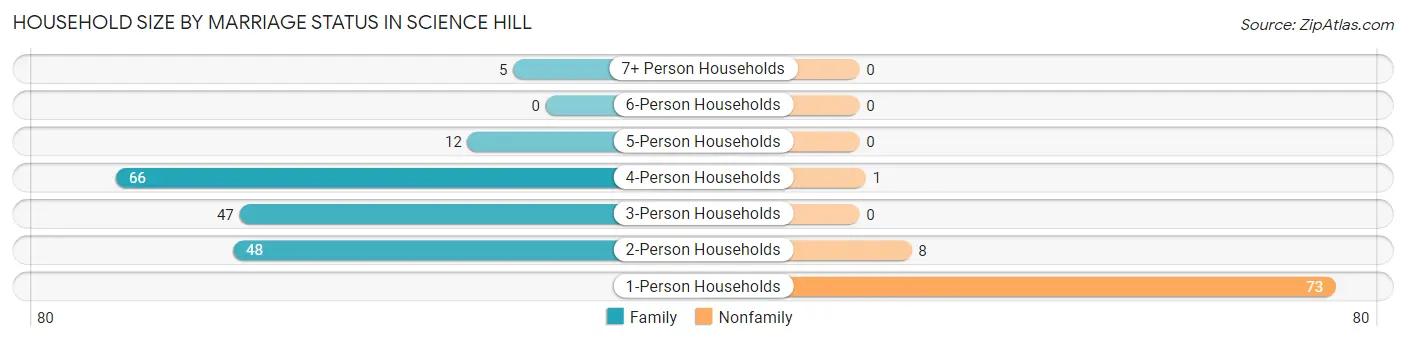
| Household Size | Family Households | Nonfamily Households |
| 1-Person Households | - | 73 (28.1%) |
| 2-Person Households | 48 (18.5%) | 8 (3.1%) |
| 3-Person Households | 47 (18.1%) | 0 (0.0%) |
| 4-Person Households | 66 (25.4%) | 1 (0.4%) |
| 5-Person Households | 12 (4.6%) | 0 (0.0%) |
| 6-Person Households | 0 (0.0%) | 0 (0.0%) |
| 7+ Person Households | 5 (1.9%) | 0 (0.0%) |
| Total | 178 (68.5%) | 82 (31.5%) |
Female Fertility in Science Hill
Fertility by Age in Science Hill
Average fertility rate in Science Hill is 74.0 births per 1,000 women. Women in the age bracket of 20 to 34 years have the highest fertility rate with 143.0 births per 1,000 women. Women in the age bracket of 20 to 34 years acount for 81.2% of all women with births.
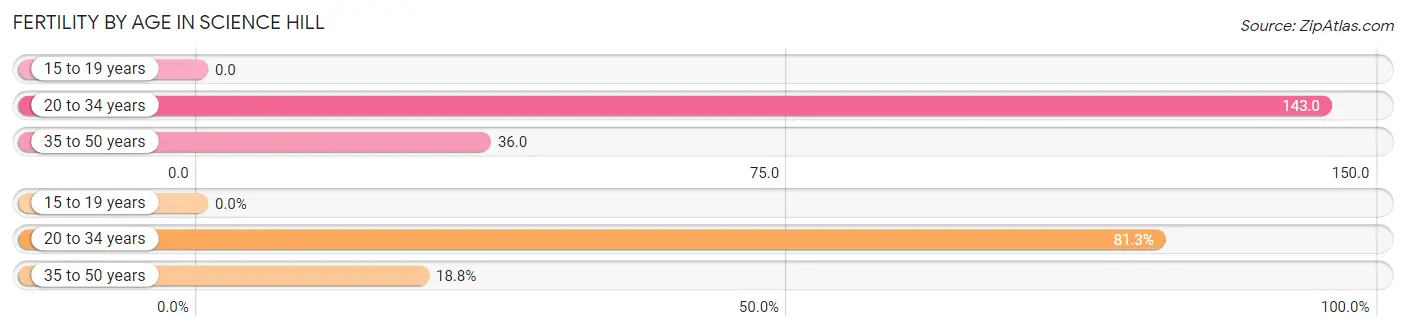
| Age Bracket | Women with Births | Births / 1,000 Women |
| 15 to 19 years | 0 (0.0%) | 0.0 |
| 20 to 34 years | 13 (81.2%) | 143.0 |
| 35 to 50 years | 3 (18.8%) | 36.0 |
| Total | 16 (100.0%) | 74.0 |
Fertility by Age by Marriage Status in Science Hill
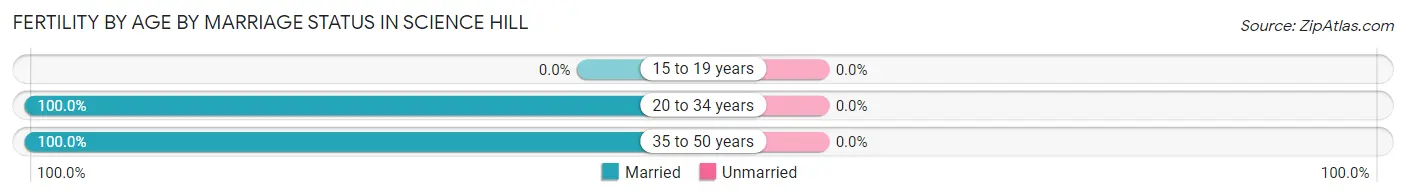
| Age Bracket | Married | Unmarried |
| 15 to 19 years | 0 (0.0%) | 0 (0.0%) |
| 20 to 34 years | 13 (100.0%) | 0 (0.0%) |
| 35 to 50 years | 3 (100.0%) | 0 (0.0%) |
| Total | 16 (100.0%) | 0 (0.0%) |
Fertility by Education in Science Hill
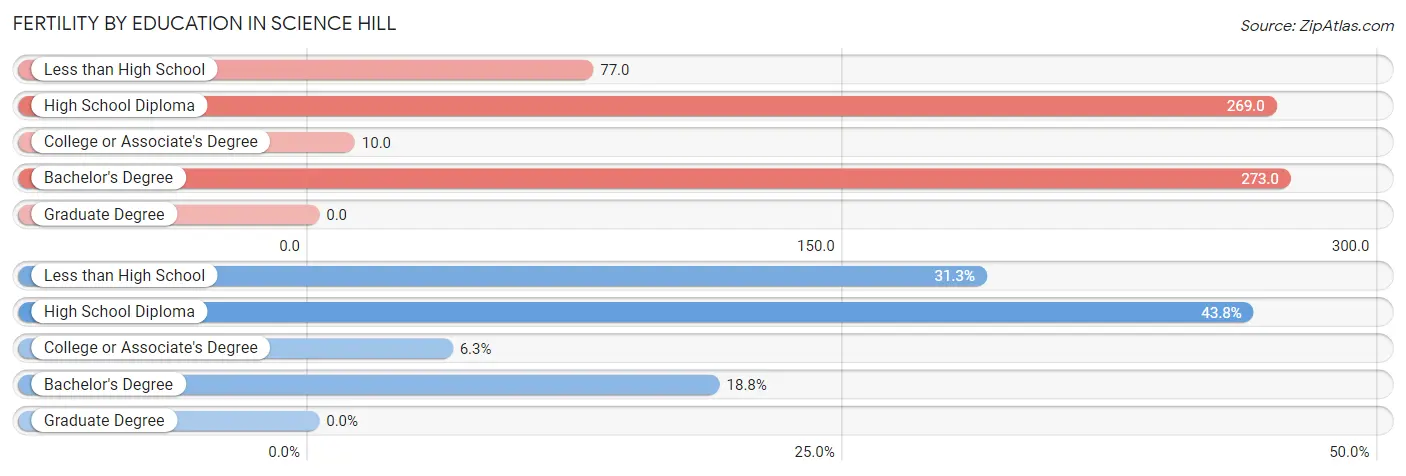
| Educational Attainment | Women with Births | Births / 1,000 Women |
| Less than High School | 5 (31.2%) | 77.0 |
| High School Diploma | 7 (43.8%) | 269.0 |
| College or Associate's Degree | 1 (6.2%) | 10.0 |
| Bachelor's Degree | 3 (18.8%) | 273.0 |
| Graduate Degree | 0 (0.0%) | 0.0 |
| Total | 16 (100.0%) | 74.0 |
Fertility by Education by Marriage Status in Science Hill
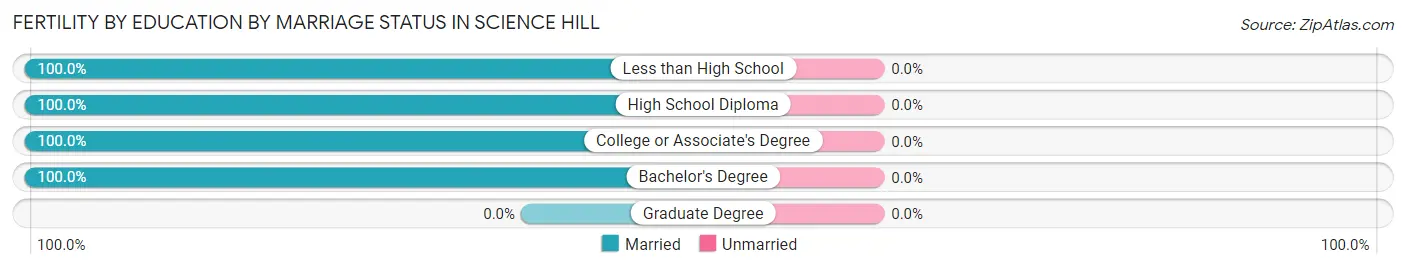
| Educational Attainment | Married | Unmarried |
| Less than High School | 5 (100.0%) | 0 (0.0%) |
| High School Diploma | 7 (100.0%) | 0 (0.0%) |
| College or Associate's Degree | 1 (100.0%) | 0 (0.0%) |
| Bachelor's Degree | 3 (100.0%) | 0 (0.0%) |
| Graduate Degree | 0 (0.0%) | 0 (0.0%) |
| Total | 16 (100.0%) | 0 (0.0%) |
Employment Characteristics in Science Hill
Employment by Class of Employer in Science Hill
Among the 269 employed individuals in Science Hill, private company employees (176 | 65.4%), not-for-profit organizations (41 | 15.2%), and local government employees (21 | 7.8%) make up the most common classes of employment.
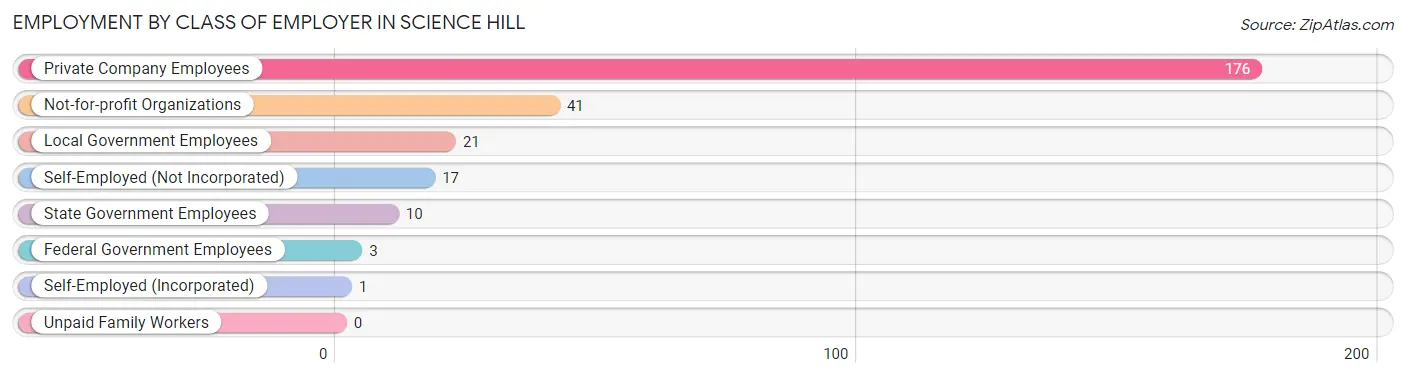
| Employer Class | # Employees | % Employees |
| Private Company Employees | 176 | 65.4% |
| Self-Employed (Incorporated) | 1 | 0.4% |
| Self-Employed (Not Incorporated) | 17 | 6.3% |
| Not-for-profit Organizations | 41 | 15.2% |
| Local Government Employees | 21 | 7.8% |
| State Government Employees | 10 | 3.7% |
| Federal Government Employees | 3 | 1.1% |
| Unpaid Family Workers | 0 | 0.0% |
| Total | 269 | 100.0% |
Employment Status by Age in Science Hill
According to the labor force statistics for Science Hill, out of the total population over 16 years of age (540), 53.3% or 288 individuals are in the labor force, with 6.6% or 19 of them unemployed. The age group with the highest labor force participation rate is 35 to 44 years, with 93.7% or 104 individuals in the labor force. Within the labor force, the 60 to 64 years age range has the highest percentage of unemployed individuals, with 19.0% or 4 of them being unemployed.
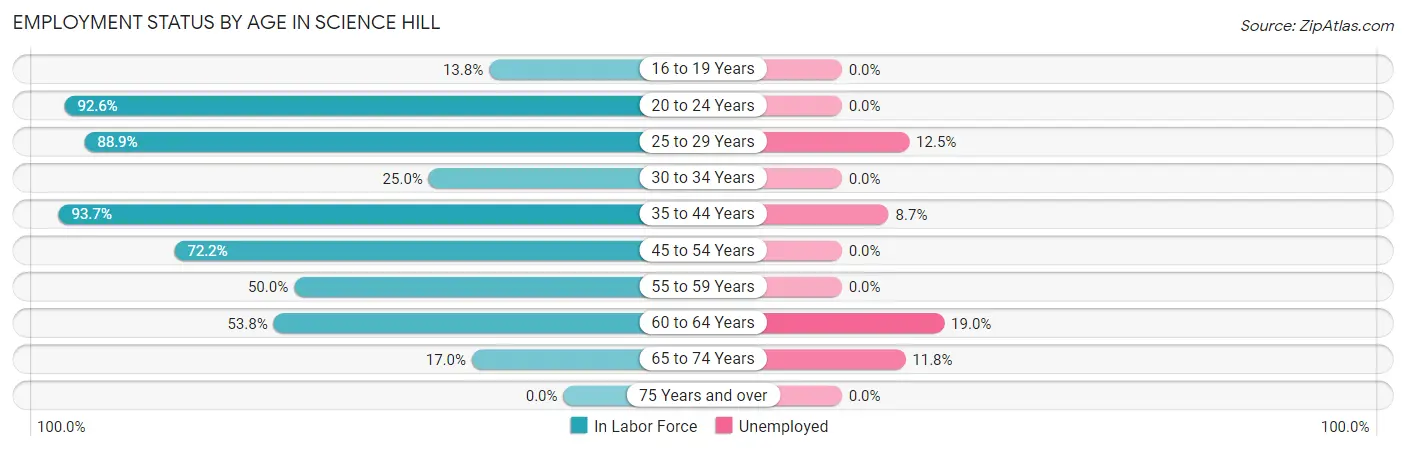
| Age Bracket | In Labor Force | Unemployed |
| 16 to 19 Years | 8 (13.8%) | 0 (0.0%) |
| 20 to 24 Years | 50 (92.6%) | 0 (0.0%) |
| 25 to 29 Years | 32 (88.9%) | 4 (12.5%) |
| 30 to 34 Years | 12 (25.0%) | 0 (0.0%) |
| 35 to 44 Years | 104 (93.7%) | 9 (8.7%) |
| 45 to 54 Years | 26 (72.2%) | 0 (0.0%) |
| 55 to 59 Years | 18 (50.0%) | 0 (0.0%) |
| 60 to 64 Years | 21 (53.8%) | 4 (19.0%) |
| 65 to 74 Years | 17 (17.0%) | 2 (11.8%) |
| 75 Years and over | 0 (0.0%) | 0 (0.0%) |
| Total | 288 (53.3%) | 19 (6.6%) |
Employment Status by Educational Attainment in Science Hill
According to labor force statistics for Science Hill, 69.6% of individuals (213) out of the total population between 25 and 64 years of age (306) are in the labor force, with 8.0% or 17 of them being unemployed. The group with the highest labor force participation rate are those with the educational attainment of college / associate degree, with 73.0% or 111 individuals in the labor force. Within the labor force, individuals with college / associate degree education have the highest percentage of unemployment, with 9.9% or 11 of them being unemployed.
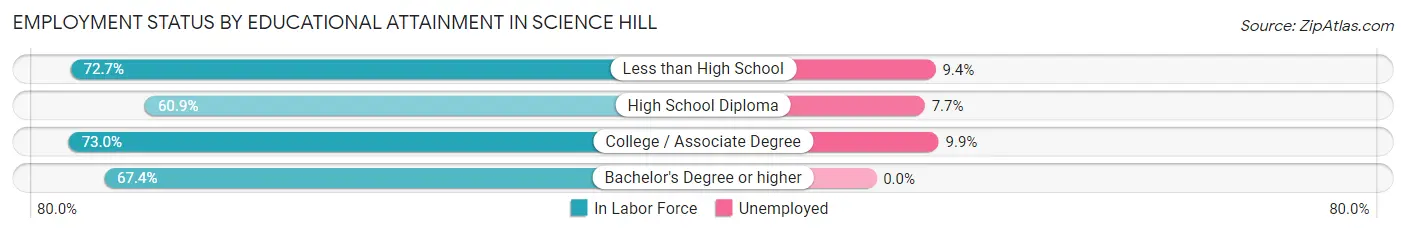
| Educational Attainment | In Labor Force | Unemployed |
| Less than High School | 32 (72.7%) | 4 (9.4%) |
| High School Diploma | 39 (60.9%) | 5 (7.7%) |
| College / Associate Degree | 111 (73.0%) | 15 (9.9%) |
| Bachelor's Degree or higher | 31 (67.4%) | 0 (0.0%) |
| Total | 213 (69.6%) | 24 (8.0%) |
Employment Occupations by Sex in Science Hill
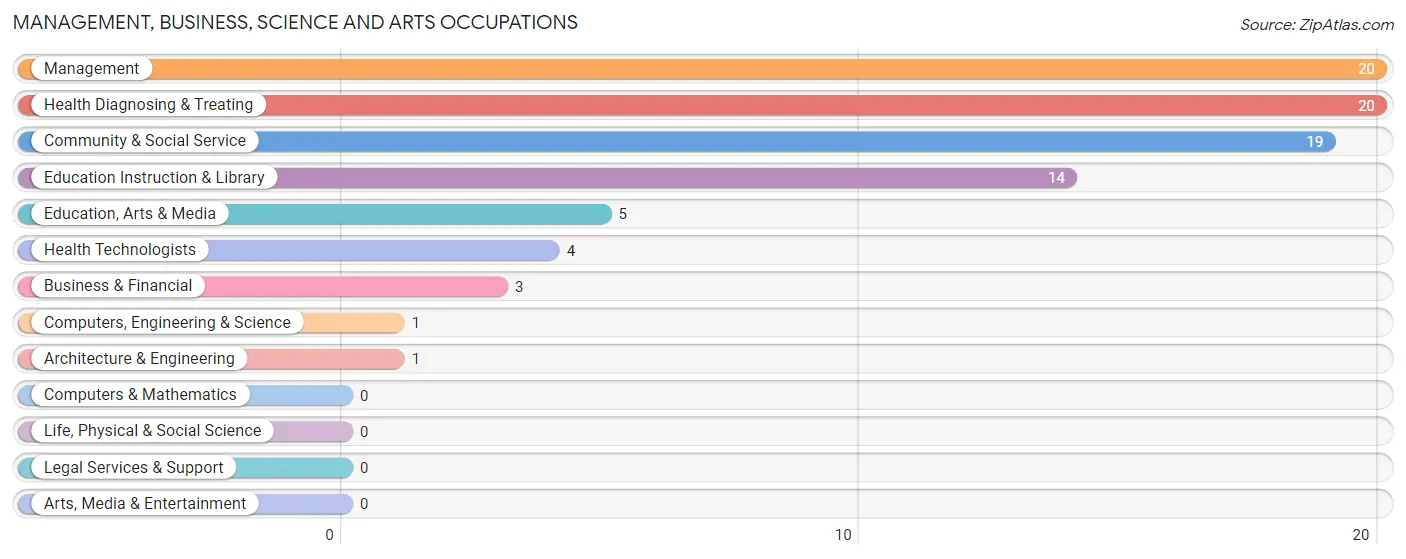
Management, Business, Science and Arts Occupations
The most common Management, Business, Science and Arts occupations in Science Hill are Management (20 | 7.4%), Health Diagnosing & Treating (20 | 7.4%), Community & Social Service (19 | 7.1%), Education Instruction & Library (14 | 5.2%), and Education, Arts & Media (5 | 1.9%).
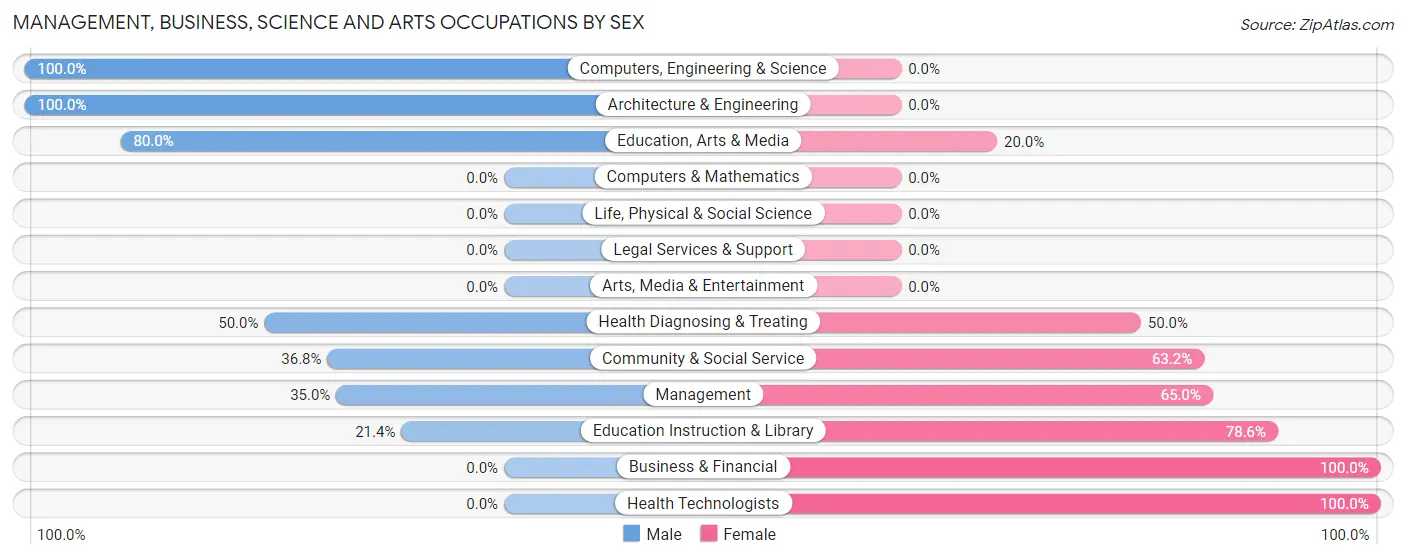
Management, Business, Science and Arts Occupations by Sex
Within the Management, Business, Science and Arts occupations in Science Hill, the most male-oriented occupations are Computers, Engineering & Science (100.0%), Architecture & Engineering (100.0%), and Education, Arts & Media (80.0%), while the most female-oriented occupations are Business & Financial (100.0%), Health Technologists (100.0%), and Education Instruction & Library (78.6%).
| Occupation | Male | Female |
| Management | 7 (35.0%) | 13 (65.0%) |
| Business & Financial | 0 (0.0%) | 3 (100.0%) |
| Computers, Engineering & Science | 1 (100.0%) | 0 (0.0%) |
| Computers & Mathematics | 0 (0.0%) | 0 (0.0%) |
| Architecture & Engineering | 1 (100.0%) | 0 (0.0%) |
| Life, Physical & Social Science | 0 (0.0%) | 0 (0.0%) |
| Community & Social Service | 7 (36.8%) | 12 (63.2%) |
| Education, Arts & Media | 4 (80.0%) | 1 (20.0%) |
| Legal Services & Support | 0 (0.0%) | 0 (0.0%) |
| Education Instruction & Library | 3 (21.4%) | 11 (78.6%) |
| Arts, Media & Entertainment | 0 (0.0%) | 0 (0.0%) |
| Health Diagnosing & Treating | 10 (50.0%) | 10 (50.0%) |
| Health Technologists | 0 (0.0%) | 4 (100.0%) |
| Total (Category) | 25 (39.7%) | 38 (60.3%) |
| Total (Overall) | 120 (44.6%) | 149 (55.4%) |
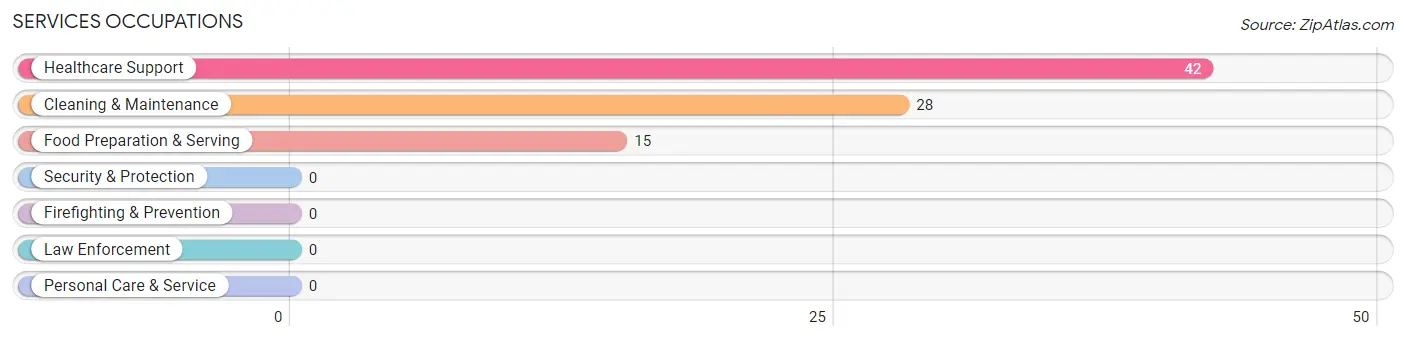
Services Occupations
The most common Services occupations in Science Hill are Healthcare Support (42 | 15.6%), Cleaning & Maintenance (28 | 10.4%), and Food Preparation & Serving (15 | 5.6%).
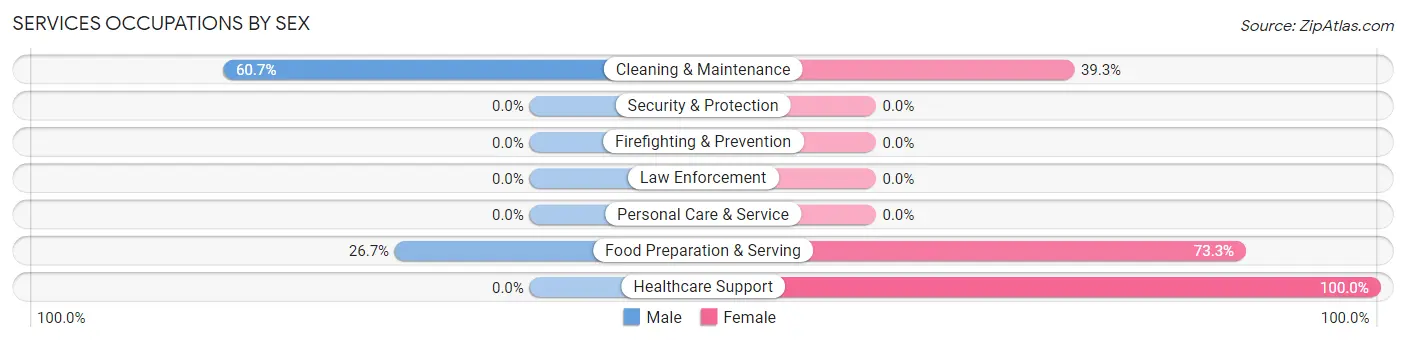
Services Occupations by Sex
Within the Services occupations in Science Hill, the most male-oriented occupations are Cleaning & Maintenance (60.7%), and Food Preparation & Serving (26.7%), while the most female-oriented occupations are Healthcare Support (100.0%), Food Preparation & Serving (73.3%), and Cleaning & Maintenance (39.3%).
| Occupation | Male | Female |
| Healthcare Support | 0 (0.0%) | 42 (100.0%) |
| Security & Protection | 0 (0.0%) | 0 (0.0%) |
| Firefighting & Prevention | 0 (0.0%) | 0 (0.0%) |
| Law Enforcement | 0 (0.0%) | 0 (0.0%) |
| Food Preparation & Serving | 4 (26.7%) | 11 (73.3%) |
| Cleaning & Maintenance | 17 (60.7%) | 11 (39.3%) |
| Personal Care & Service | 0 (0.0%) | 0 (0.0%) |
| Total (Category) | 21 (24.7%) | 64 (75.3%) |
| Total (Overall) | 120 (44.6%) | 149 (55.4%) |
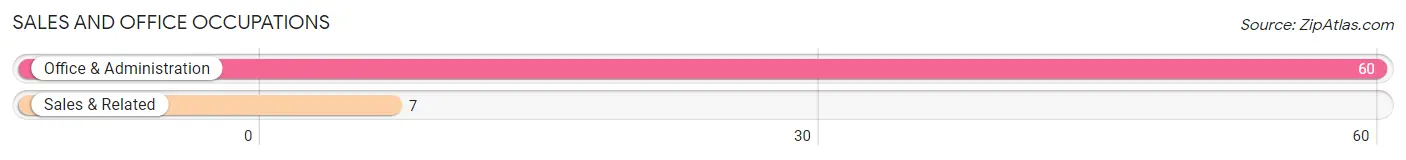
Sales and Office Occupations
The most common Sales and Office occupations in Science Hill are Office & Administration (60 | 22.3%), and Sales & Related (7 | 2.6%).
Sales and Office Occupations by Sex
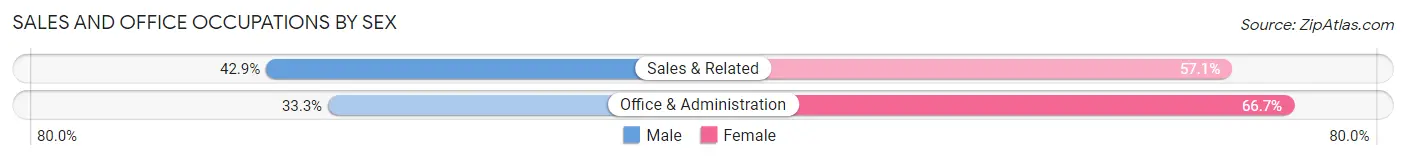
| Occupation | Male | Female |
| Sales & Related | 3 (42.9%) | 4 (57.1%) |
| Office & Administration | 20 (33.3%) | 40 (66.7%) |
| Total (Category) | 23 (34.3%) | 44 (65.7%) |
| Total (Overall) | 120 (44.6%) | 149 (55.4%) |
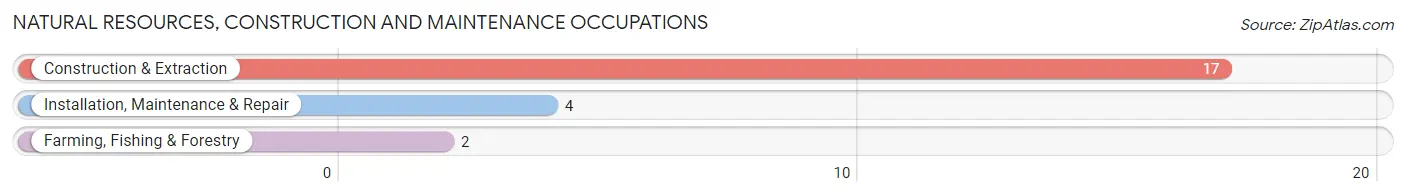
Natural Resources, Construction and Maintenance Occupations
The most common Natural Resources, Construction and Maintenance occupations in Science Hill are Construction & Extraction (17 | 6.3%), Installation, Maintenance & Repair (4 | 1.5%), and Farming, Fishing & Forestry (2 | 0.7%).
Natural Resources, Construction and Maintenance Occupations by Sex
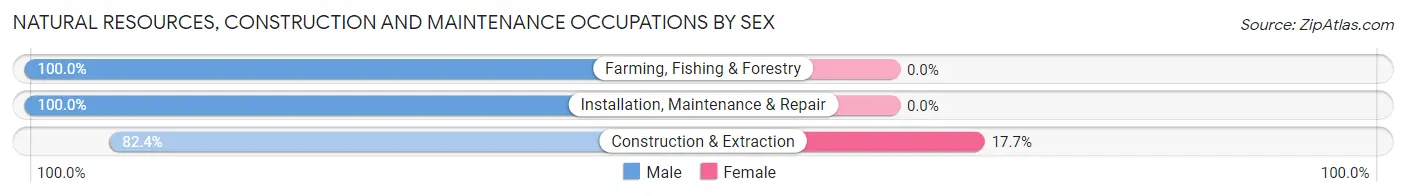
| Occupation | Male | Female |
| Farming, Fishing & Forestry | 2 (100.0%) | 0 (0.0%) |
| Construction & Extraction | 14 (82.4%) | 3 (17.6%) |
| Installation, Maintenance & Repair | 4 (100.0%) | 0 (0.0%) |
| Total (Category) | 20 (87.0%) | 3 (13.0%) |
| Total (Overall) | 120 (44.6%) | 149 (55.4%) |
Production, Transportation and Moving Occupations
The most common Production, Transportation and Moving occupations in Science Hill are Production (29 | 10.8%), and Transportation (2 | 0.7%).
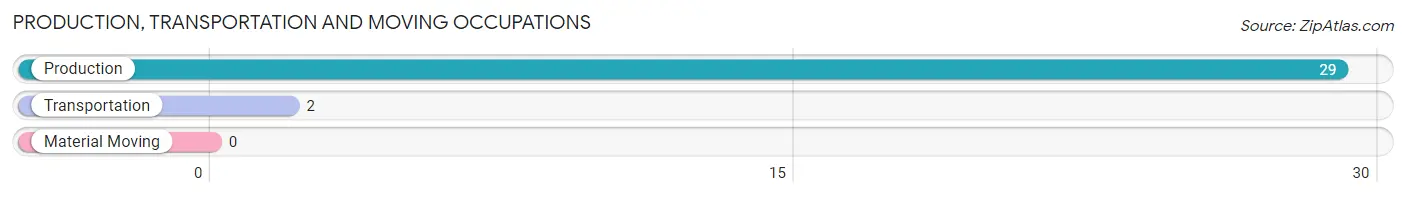
Production, Transportation and Moving Occupations by Sex
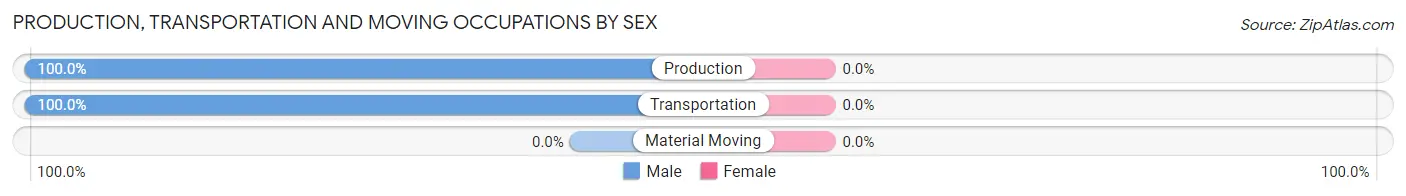
| Occupation | Male | Female |
| Production | 29 (100.0%) | 0 (0.0%) |
| Transportation | 2 (100.0%) | 0 (0.0%) |
| Material Moving | 0 (0.0%) | 0 (0.0%) |
| Total (Category) | 31 (100.0%) | 0 (0.0%) |
| Total (Overall) | 120 (44.6%) | 149 (55.4%) |
Employment Industries by Sex in Science Hill
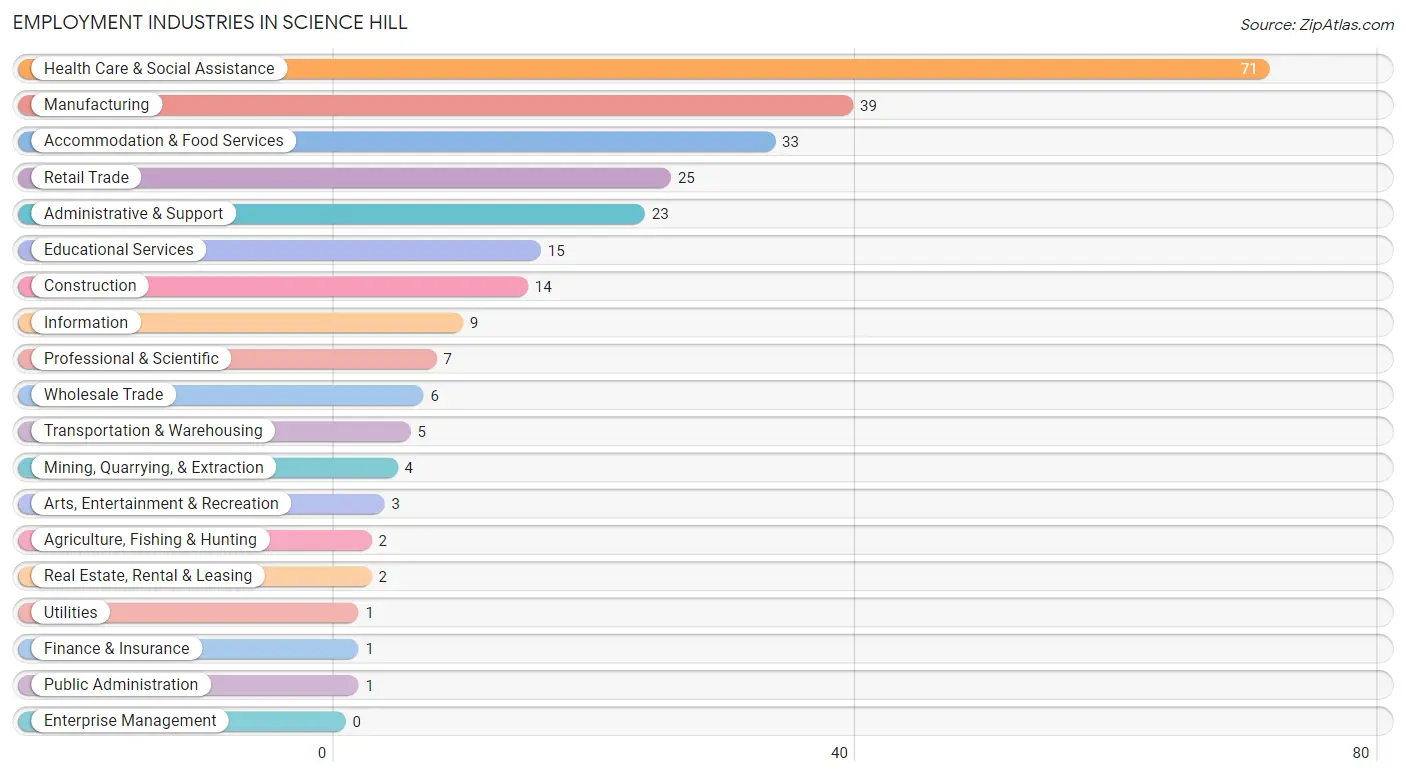
Employment Industries in Science Hill
The major employment industries in Science Hill include Health Care & Social Assistance (71 | 26.4%), Manufacturing (39 | 14.5%), Accommodation & Food Services (33 | 12.3%), Retail Trade (25 | 9.3%), and Administrative & Support (23 | 8.6%).
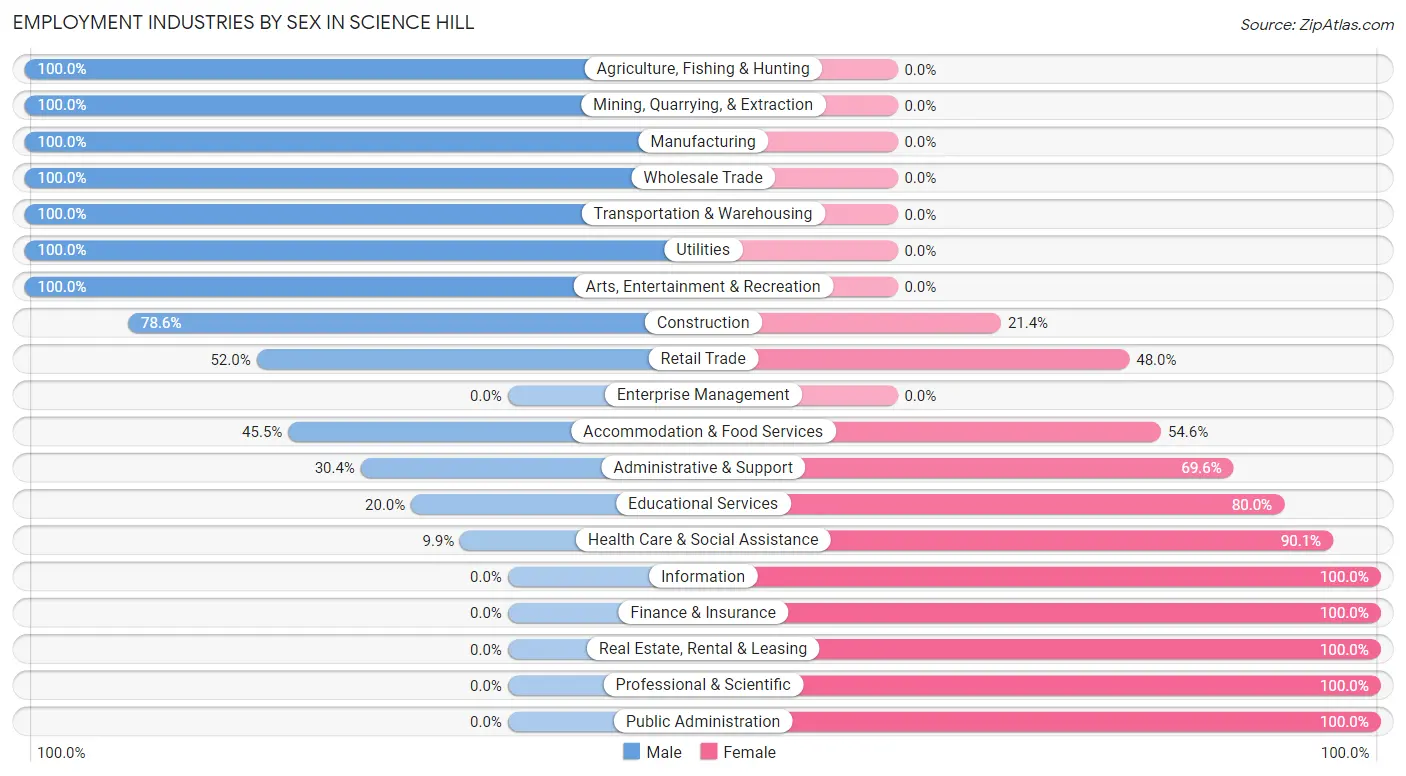
Employment Industries by Sex in Science Hill
The Science Hill industries that see more men than women are Agriculture, Fishing & Hunting (100.0%), Mining, Quarrying, & Extraction (100.0%), and Manufacturing (100.0%), whereas the industries that tend to have a higher number of women are Information (100.0%), Finance & Insurance (100.0%), and Real Estate, Rental & Leasing (100.0%).
| Industry | Male | Female |
| Agriculture, Fishing & Hunting | 2 (100.0%) | 0 (0.0%) |
| Mining, Quarrying, & Extraction | 4 (100.0%) | 0 (0.0%) |
| Construction | 11 (78.6%) | 3 (21.4%) |
| Manufacturing | 39 (100.0%) | 0 (0.0%) |
| Wholesale Trade | 6 (100.0%) | 0 (0.0%) |
| Retail Trade | 13 (52.0%) | 12 (48.0%) |
| Transportation & Warehousing | 5 (100.0%) | 0 (0.0%) |
| Utilities | 1 (100.0%) | 0 (0.0%) |
| Information | 0 (0.0%) | 9 (100.0%) |
| Finance & Insurance | 0 (0.0%) | 1 (100.0%) |
| Real Estate, Rental & Leasing | 0 (0.0%) | 2 (100.0%) |
| Professional & Scientific | 0 (0.0%) | 7 (100.0%) |
| Enterprise Management | 0 (0.0%) | 0 (0.0%) |
| Administrative & Support | 7 (30.4%) | 16 (69.6%) |
| Educational Services | 3 (20.0%) | 12 (80.0%) |
| Health Care & Social Assistance | 7 (9.9%) | 64 (90.1%) |
| Arts, Entertainment & Recreation | 3 (100.0%) | 0 (0.0%) |
| Accommodation & Food Services | 15 (45.5%) | 18 (54.5%) |
| Public Administration | 0 (0.0%) | 1 (100.0%) |
| Total | 120 (44.6%) | 149 (55.4%) |
Education in Science Hill
School Enrollment in Science Hill
The most common levels of schooling among the 215 students in Science Hill are high school (71 | 33.0%), nursery / preschool (52 | 24.2%), and middle school (52 | 24.2%).
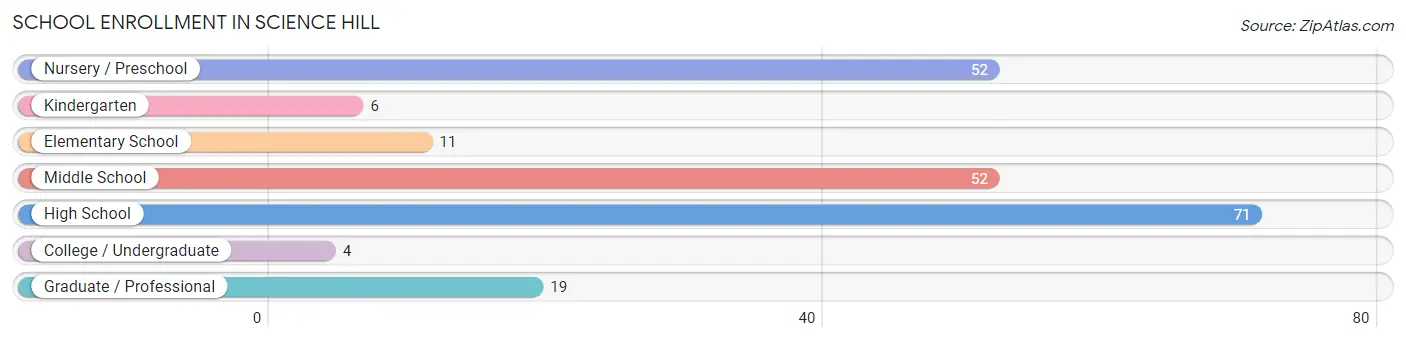
| School Level | # Students | % Students |
| Nursery / Preschool | 52 | 24.2% |
| Kindergarten | 6 | 2.8% |
| Elementary School | 11 | 5.1% |
| Middle School | 52 | 24.2% |
| High School | 71 | 33.0% |
| College / Undergraduate | 4 | 1.9% |
| Graduate / Professional | 19 | 8.8% |
| Total | 215 | 100.0% |
School Enrollment by Age by Funding Source in Science Hill
Out of a total of 215 students who are enrolled in schools in Science Hill, 31 (14.4%) attend a private institution, while the remaining 184 (85.6%) are enrolled in public schools. The age group of 3 to 4 year olds has the highest likelihood of being enrolled in private schools, with 28 (65.1% in the age bracket) enrolled. Conversely, the age group of 5 to 9 year old has the lowest likelihood of being enrolled in a private school, with 26 (100.0% in the age bracket) attending a public institution.
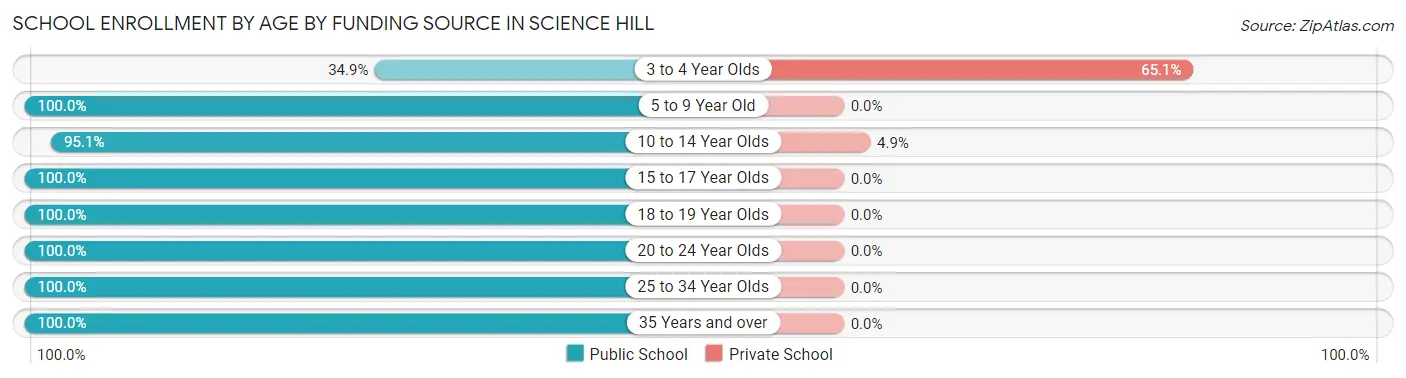
| Age Bracket | Public School | Private School |
| 3 to 4 Year Olds | 15 (34.9%) | 28 (65.1%) |
| 5 to 9 Year Old | 26 (100.0%) | 0 (0.0%) |
| 10 to 14 Year Olds | 58 (95.1%) | 3 (4.9%) |
| 15 to 17 Year Olds | 60 (100.0%) | 0 (0.0%) |
| 18 to 19 Year Olds | 2 (100.0%) | 0 (0.0%) |
| 20 to 24 Year Olds | 11 (100.0%) | 0 (0.0%) |
| 25 to 34 Year Olds | 6 (100.0%) | 0 (0.0%) |
| 35 Years and over | 6 (100.0%) | 0 (0.0%) |
| Total | 184 (85.6%) | 31 (14.4%) |
Educational Attainment by Field of Study in Science Hill
Education (20 | 32.3%), science & technology (12 | 19.4%), arts & humanities (9 | 14.5%), psychology (6 | 9.7%), and business (6 | 9.7%) are the most common fields of study among 62 individuals in Science Hill who have obtained a bachelor's degree or higher.
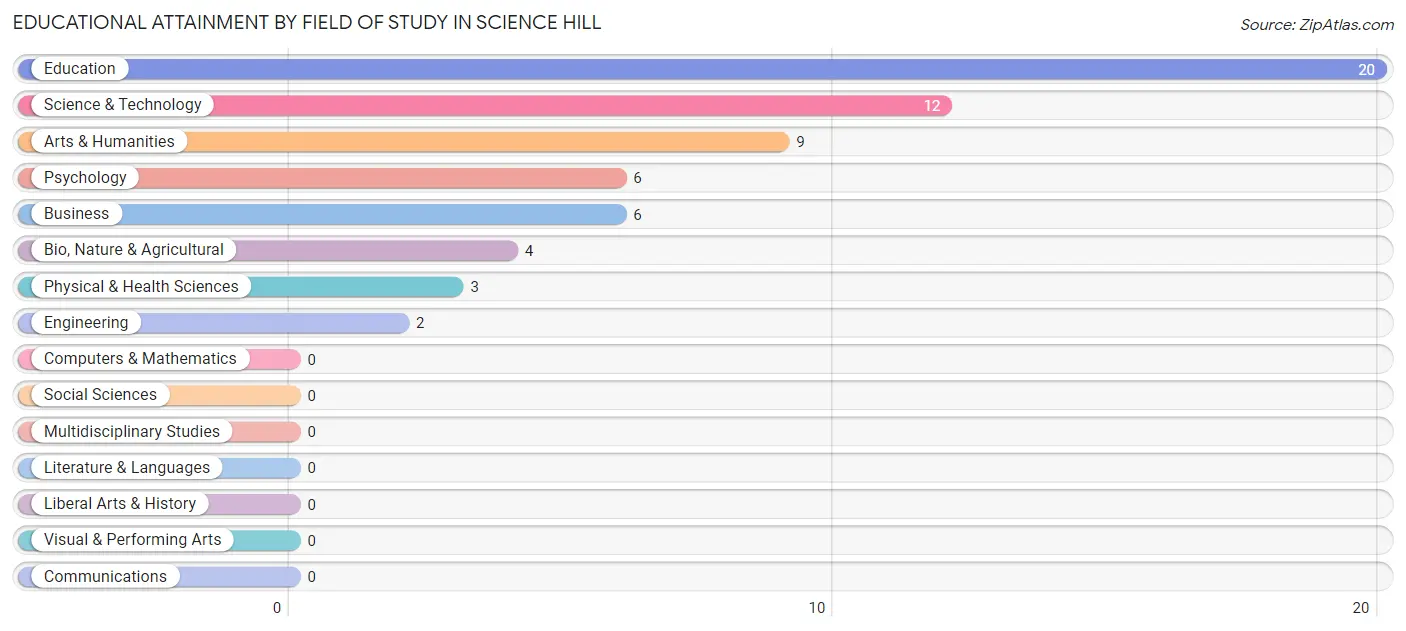
| Field of Study | # Graduates | % Graduates |
| Computers & Mathematics | 0 | 0.0% |
| Bio, Nature & Agricultural | 4 | 6.5% |
| Physical & Health Sciences | 3 | 4.8% |
| Psychology | 6 | 9.7% |
| Social Sciences | 0 | 0.0% |
| Engineering | 2 | 3.2% |
| Multidisciplinary Studies | 0 | 0.0% |
| Science & Technology | 12 | 19.4% |
| Business | 6 | 9.7% |
| Education | 20 | 32.3% |
| Literature & Languages | 0 | 0.0% |
| Liberal Arts & History | 0 | 0.0% |
| Visual & Performing Arts | 0 | 0.0% |
| Communications | 0 | 0.0% |
| Arts & Humanities | 9 | 14.5% |
| Total | 62 | 100.0% |
Transportation & Commute in Science Hill
Vehicle Availability by Sex in Science Hill
The most prevalent vehicle ownership categories in Science Hill are males with 2 vehicles (45, accounting for 37.5%) and females with 2 vehicles (62, making up 30.2%).
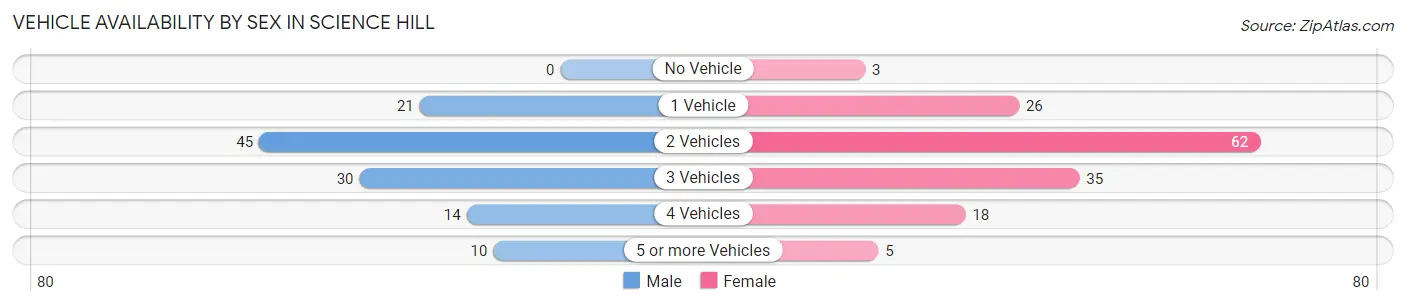
| Vehicles Available | Male | Female |
| No Vehicle | 0 (0.0%) | 3 (2.0%) |
| 1 Vehicle | 21 (17.5%) | 26 (17.4%) |
| 2 Vehicles | 45 (37.5%) | 62 (41.6%) |
| 3 Vehicles | 30 (25.0%) | 35 (23.5%) |
| 4 Vehicles | 14 (11.7%) | 18 (12.1%) |
| 5 or more Vehicles | 10 (8.3%) | 5 (3.4%) |
| Total | 120 (100.0%) | 149 (100.0%) |
Commute Time in Science Hill
The most frequently occuring commute durations in Science Hill are 15 to 19 minutes (97 commuters, 38.0%), 20 to 24 minutes (69 commuters, 27.1%), and 30 to 34 minutes (49 commuters, 19.2%).
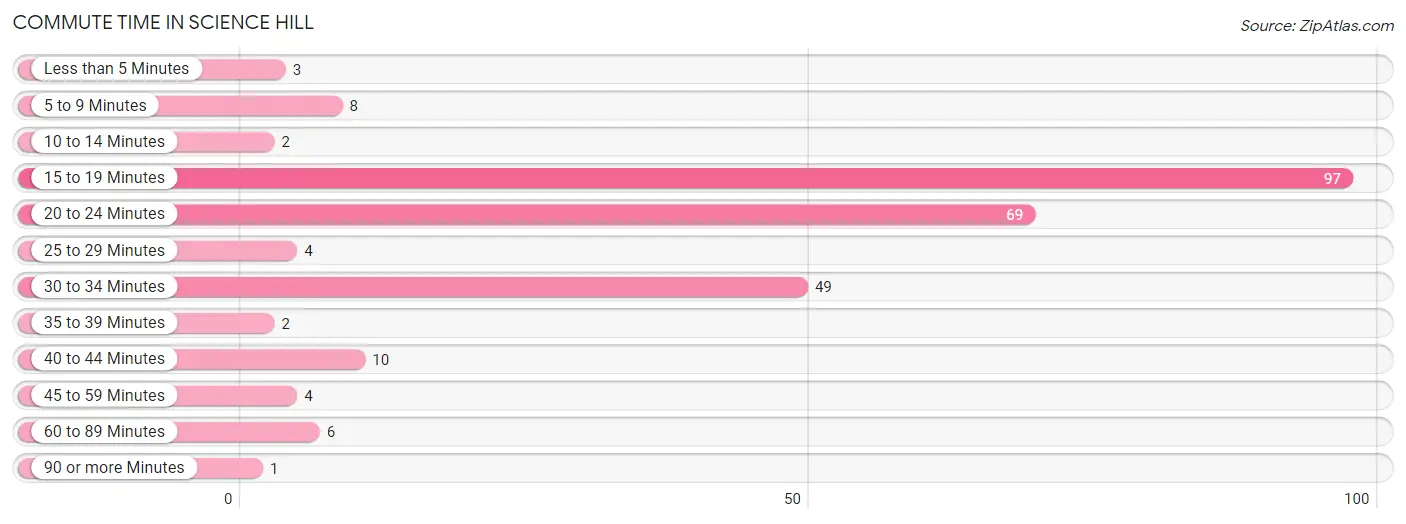
| Commute Time | # Commuters | % Commuters |
| Less than 5 Minutes | 3 | 1.2% |
| 5 to 9 Minutes | 8 | 3.1% |
| 10 to 14 Minutes | 2 | 0.8% |
| 15 to 19 Minutes | 97 | 38.0% |
| 20 to 24 Minutes | 69 | 27.1% |
| 25 to 29 Minutes | 4 | 1.6% |
| 30 to 34 Minutes | 49 | 19.2% |
| 35 to 39 Minutes | 2 | 0.8% |
| 40 to 44 Minutes | 10 | 3.9% |
| 45 to 59 Minutes | 4 | 1.6% |
| 60 to 89 Minutes | 6 | 2.4% |
| 90 or more Minutes | 1 | 0.4% |
Commute Time by Sex in Science Hill
The most common commute times in Science Hill are 15 to 19 minutes (59 commuters, 51.7%) for males and 20 to 24 minutes (42 commuters, 29.8%) for females.
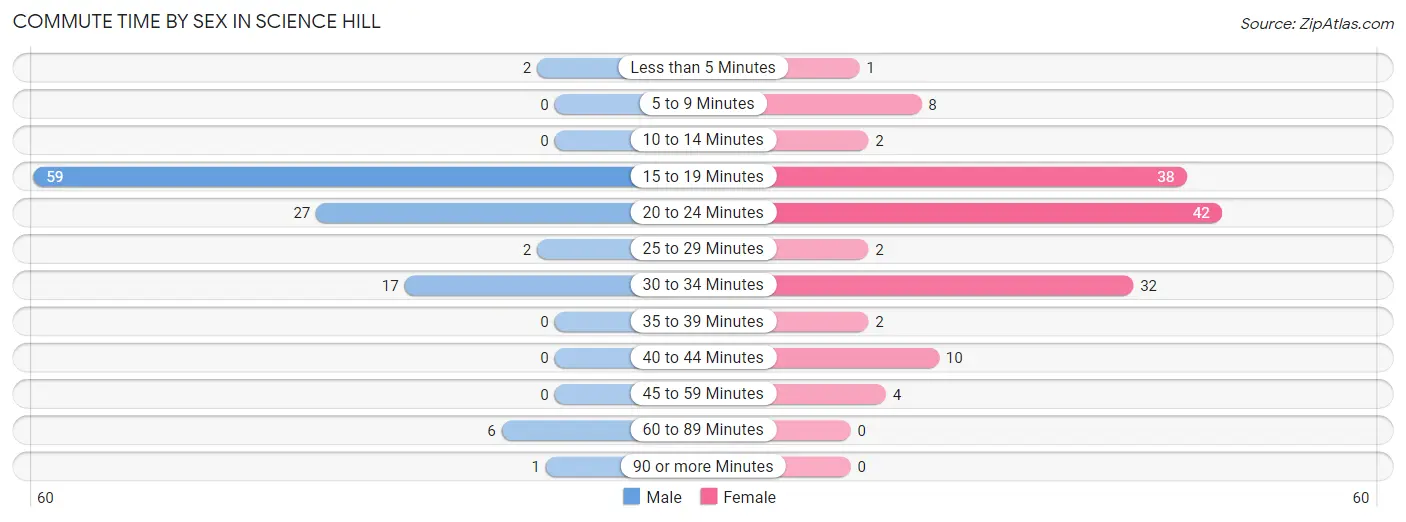
| Commute Time | Male | Female |
| Less than 5 Minutes | 2 (1.8%) | 1 (0.7%) |
| 5 to 9 Minutes | 0 (0.0%) | 8 (5.7%) |
| 10 to 14 Minutes | 0 (0.0%) | 2 (1.4%) |
| 15 to 19 Minutes | 59 (51.7%) | 38 (27.0%) |
| 20 to 24 Minutes | 27 (23.7%) | 42 (29.8%) |
| 25 to 29 Minutes | 2 (1.8%) | 2 (1.4%) |
| 30 to 34 Minutes | 17 (14.9%) | 32 (22.7%) |
| 35 to 39 Minutes | 0 (0.0%) | 2 (1.4%) |
| 40 to 44 Minutes | 0 (0.0%) | 10 (7.1%) |
| 45 to 59 Minutes | 0 (0.0%) | 4 (2.8%) |
| 60 to 89 Minutes | 6 (5.3%) | 0 (0.0%) |
| 90 or more Minutes | 1 (0.9%) | 0 (0.0%) |
Time of Departure to Work by Sex in Science Hill
The most frequent times of departure to work in Science Hill are 12:00 AM to 4:59 AM (19, 16.7%) for males and 8:00 AM to 8:29 AM (52, 36.9%) for females.
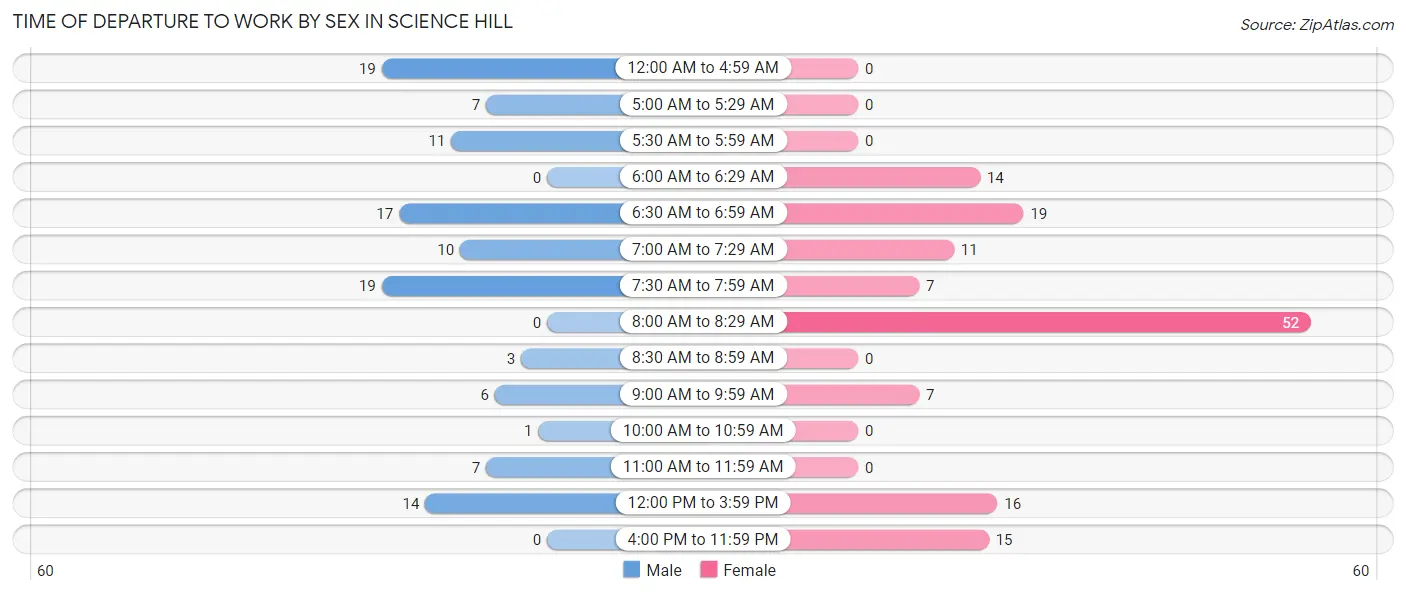
| Time of Departure | Male | Female |
| 12:00 AM to 4:59 AM | 19 (16.7%) | 0 (0.0%) |
| 5:00 AM to 5:29 AM | 7 (6.1%) | 0 (0.0%) |
| 5:30 AM to 5:59 AM | 11 (9.7%) | 0 (0.0%) |
| 6:00 AM to 6:29 AM | 0 (0.0%) | 14 (9.9%) |
| 6:30 AM to 6:59 AM | 17 (14.9%) | 19 (13.5%) |
| 7:00 AM to 7:29 AM | 10 (8.8%) | 11 (7.8%) |
| 7:30 AM to 7:59 AM | 19 (16.7%) | 7 (5.0%) |
| 8:00 AM to 8:29 AM | 0 (0.0%) | 52 (36.9%) |
| 8:30 AM to 8:59 AM | 3 (2.6%) | 0 (0.0%) |
| 9:00 AM to 9:59 AM | 6 (5.3%) | 7 (5.0%) |
| 10:00 AM to 10:59 AM | 1 (0.9%) | 0 (0.0%) |
| 11:00 AM to 11:59 AM | 7 (6.1%) | 0 (0.0%) |
| 12:00 PM to 3:59 PM | 14 (12.3%) | 16 (11.4%) |
| 4:00 PM to 11:59 PM | 0 (0.0%) | 15 (10.6%) |
| Total | 114 (100.0%) | 141 (100.0%) |
Housing Occupancy in Science Hill
Occupancy by Ownership in Science Hill
Of the total 260 dwellings in Science Hill, owner-occupied units account for 188 (72.3%), while renter-occupied units make up 72 (27.7%).
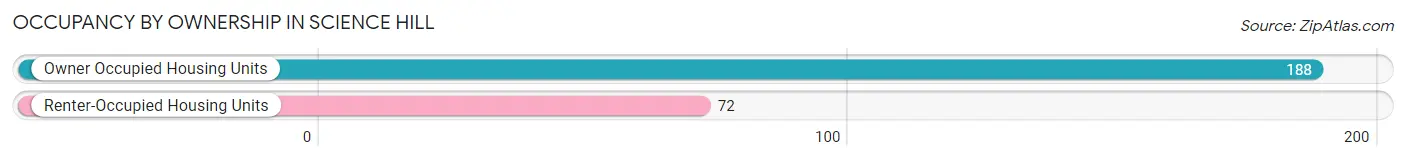
| Occupancy | # Housing Units | % Housing Units |
| Owner Occupied Housing Units | 188 | 72.3% |
| Renter-Occupied Housing Units | 72 | 27.7% |
| Total Occupied Housing Units | 260 | 100.0% |
Occupancy by Household Size in Science Hill
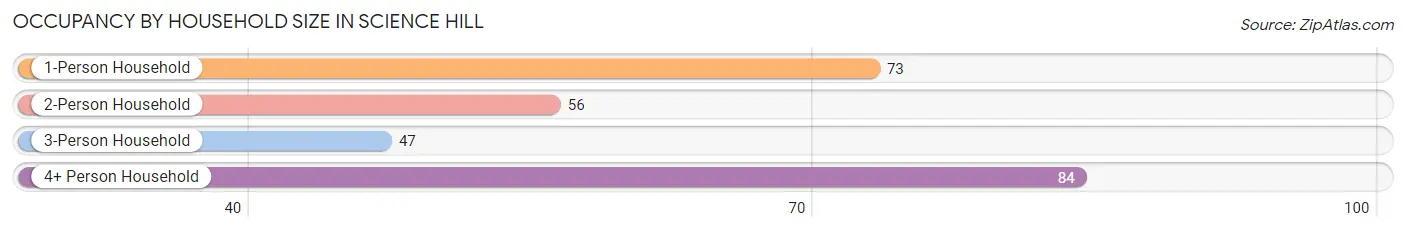
| Household Size | # Housing Units | % Housing Units |
| 1-Person Household | 73 | 28.1% |
| 2-Person Household | 56 | 21.5% |
| 3-Person Household | 47 | 18.1% |
| 4+ Person Household | 84 | 32.3% |
| Total Housing Units | 260 | 100.0% |
Occupancy by Ownership by Household Size in Science Hill
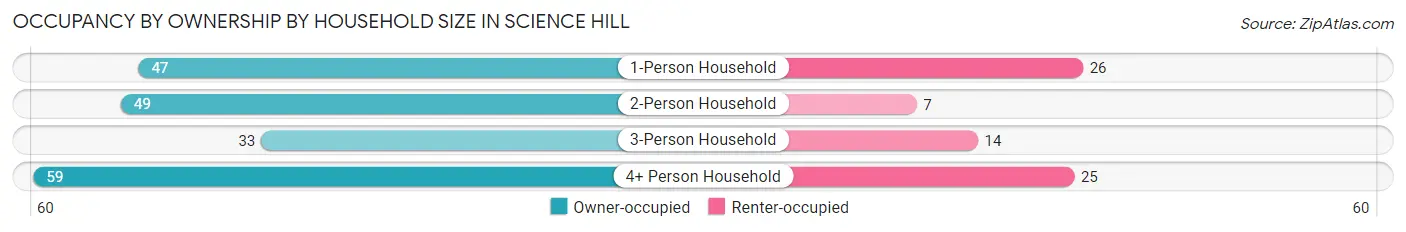
| Household Size | Owner-occupied | Renter-occupied |
| 1-Person Household | 47 (64.4%) | 26 (35.6%) |
| 2-Person Household | 49 (87.5%) | 7 (12.5%) |
| 3-Person Household | 33 (70.2%) | 14 (29.8%) |
| 4+ Person Household | 59 (70.2%) | 25 (29.8%) |
| Total Housing Units | 188 (72.3%) | 72 (27.7%) |
Occupancy by Educational Attainment in Science Hill
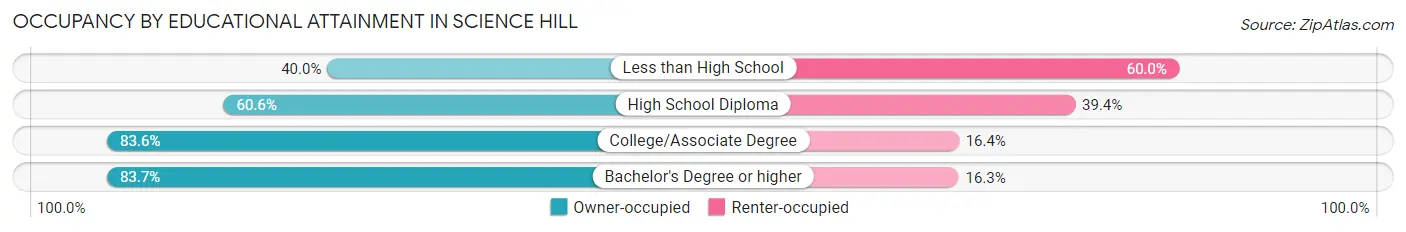
| Household Size | Owner-occupied | Renter-occupied |
| Less than High School | 12 (40.0%) | 18 (60.0%) |
| High School Diploma | 43 (60.6%) | 28 (39.4%) |
| College/Associate Degree | 92 (83.6%) | 18 (16.4%) |
| Bachelor's Degree or higher | 41 (83.7%) | 8 (16.3%) |
Occupancy by Age of Householder in Science Hill
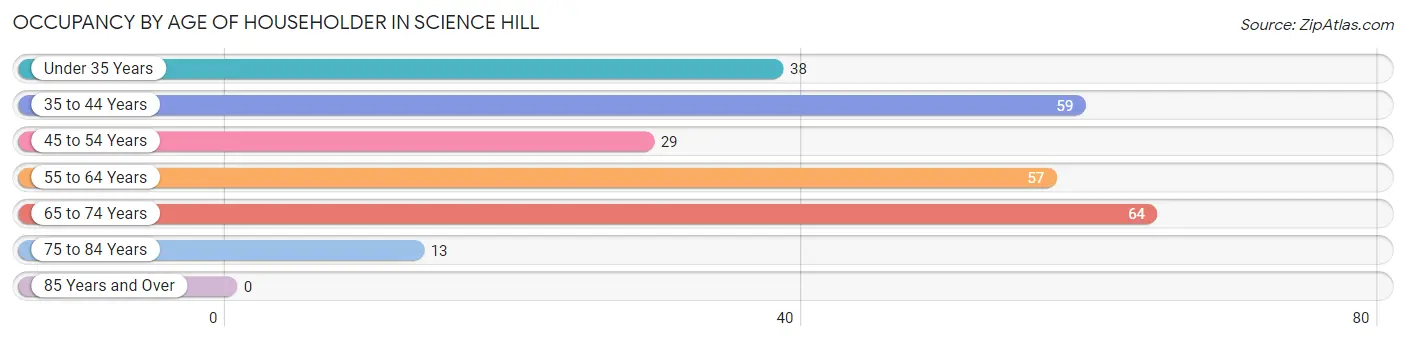
| Age Bracket | # Households | % Households |
| Under 35 Years | 38 | 14.6% |
| 35 to 44 Years | 59 | 22.7% |
| 45 to 54 Years | 29 | 11.2% |
| 55 to 64 Years | 57 | 21.9% |
| 65 to 74 Years | 64 | 24.6% |
| 75 to 84 Years | 13 | 5.0% |
| 85 Years and Over | 0 | 0.0% |
| Total | 260 | 100.0% |
Housing Finances in Science Hill
Median Income by Occupancy in Science Hill
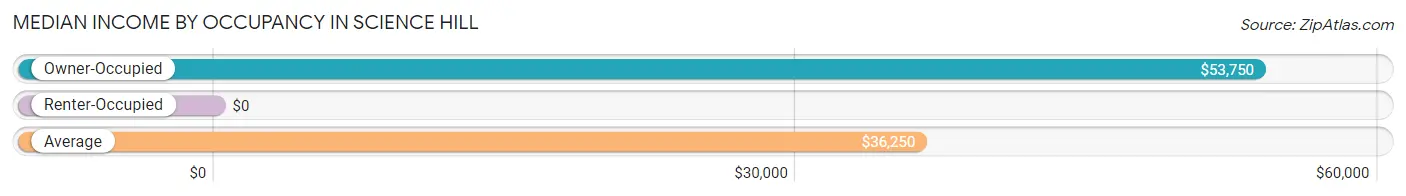
| Occupancy Type | # Households | Median Income |
| Owner-Occupied | 188 (72.3%) | $53,750 |
| Renter-Occupied | 72 (27.7%) | $0 |
| Average | 260 (100.0%) | $36,250 |
Occupancy by Householder Income Bracket in Science Hill
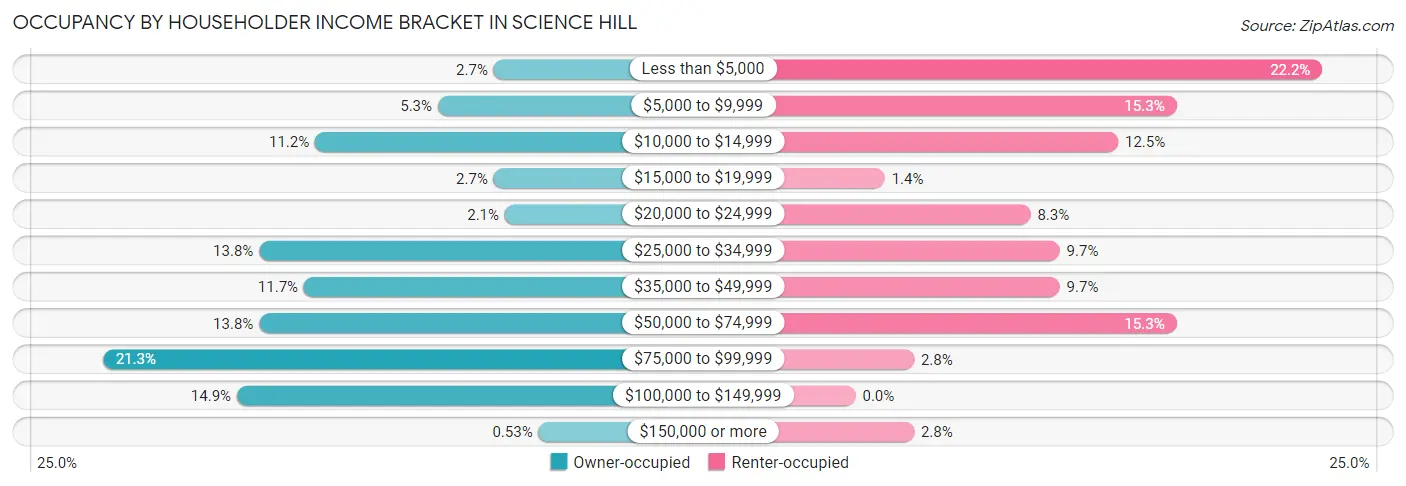
| Income Bracket | Owner-occupied | Renter-occupied |
| Less than $5,000 | 5 (2.7%) | 16 (22.2%) |
| $5,000 to $9,999 | 10 (5.3%) | 11 (15.3%) |
| $10,000 to $14,999 | 21 (11.2%) | 9 (12.5%) |
| $15,000 to $19,999 | 5 (2.7%) | 1 (1.4%) |
| $20,000 to $24,999 | 4 (2.1%) | 6 (8.3%) |
| $25,000 to $34,999 | 26 (13.8%) | 7 (9.7%) |
| $35,000 to $49,999 | 22 (11.7%) | 7 (9.7%) |
| $50,000 to $74,999 | 26 (13.8%) | 11 (15.3%) |
| $75,000 to $99,999 | 40 (21.3%) | 2 (2.8%) |
| $100,000 to $149,999 | 28 (14.9%) | 0 (0.0%) |
| $150,000 or more | 1 (0.5%) | 2 (2.8%) |
| Total | 188 (100.0%) | 72 (100.0%) |
Monthly Housing Cost Tiers in Science Hill
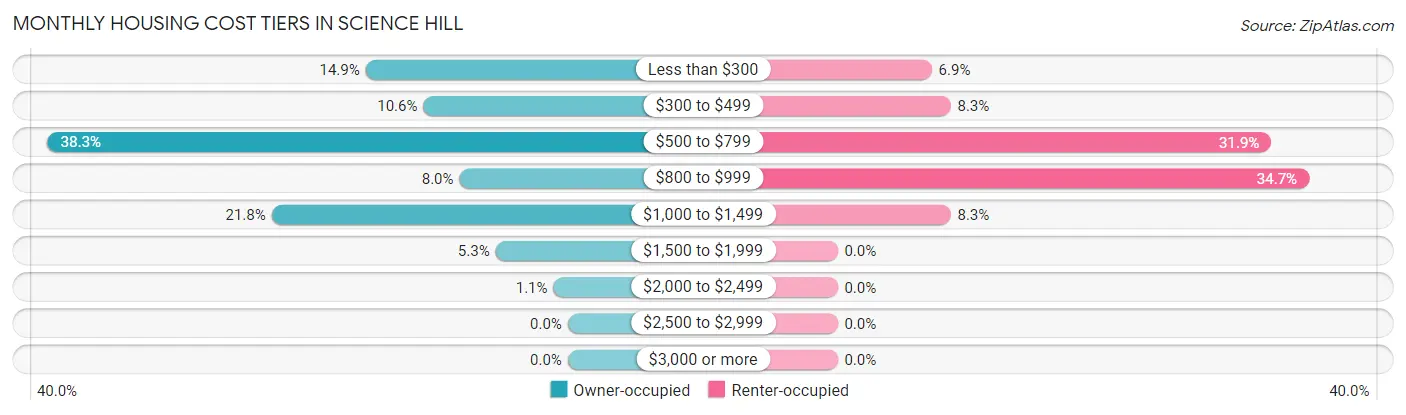
| Monthly Cost | Owner-occupied | Renter-occupied |
| Less than $300 | 28 (14.9%) | 5 (6.9%) |
| $300 to $499 | 20 (10.6%) | 6 (8.3%) |
| $500 to $799 | 72 (38.3%) | 23 (31.9%) |
| $800 to $999 | 15 (8.0%) | 25 (34.7%) |
| $1,000 to $1,499 | 41 (21.8%) | 6 (8.3%) |
| $1,500 to $1,999 | 10 (5.3%) | 0 (0.0%) |
| $2,000 to $2,499 | 2 (1.1%) | 0 (0.0%) |
| $2,500 to $2,999 | 0 (0.0%) | 0 (0.0%) |
| $3,000 or more | 0 (0.0%) | 0 (0.0%) |
| Total | 188 (100.0%) | 72 (100.0%) |
Physical Housing Characteristics in Science Hill
Housing Structures in Science Hill
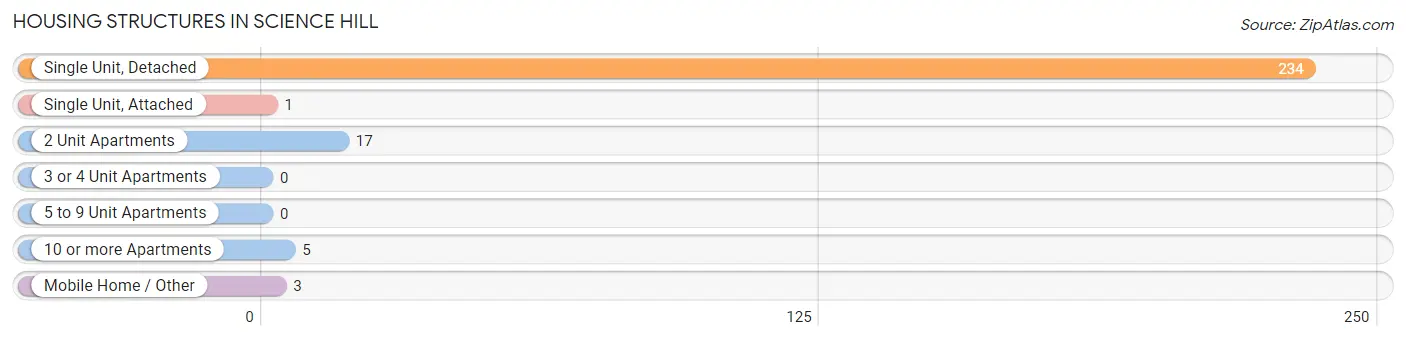
| Structure Type | # Housing Units | % Housing Units |
| Single Unit, Detached | 234 | 90.0% |
| Single Unit, Attached | 1 | 0.4% |
| 2 Unit Apartments | 17 | 6.5% |
| 3 or 4 Unit Apartments | 0 | 0.0% |
| 5 to 9 Unit Apartments | 0 | 0.0% |
| 10 or more Apartments | 5 | 1.9% |
| Mobile Home / Other | 3 | 1.1% |
| Total | 260 | 100.0% |
Housing Structures by Occupancy in Science Hill
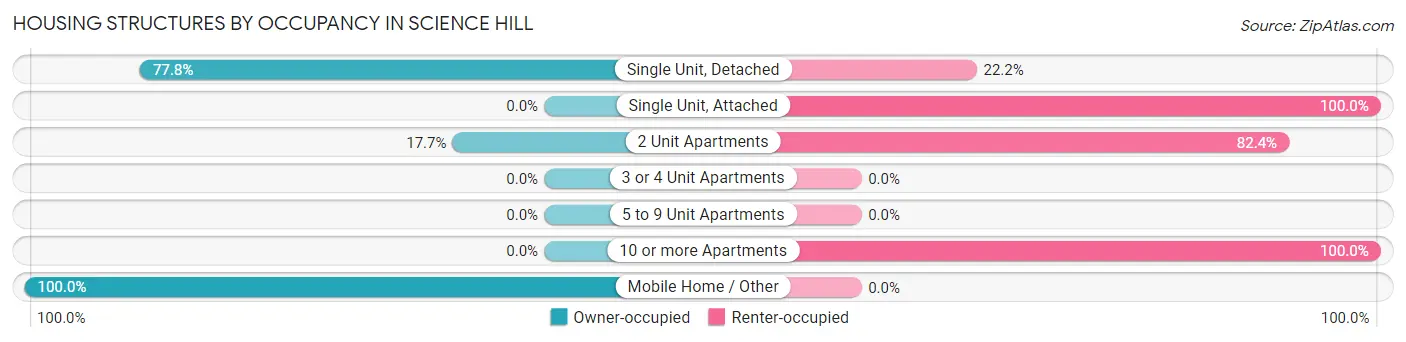
| Structure Type | Owner-occupied | Renter-occupied |
| Single Unit, Detached | 182 (77.8%) | 52 (22.2%) |
| Single Unit, Attached | 0 (0.0%) | 1 (100.0%) |
| 2 Unit Apartments | 3 (17.6%) | 14 (82.4%) |
| 3 or 4 Unit Apartments | 0 (0.0%) | 0 (0.0%) |
| 5 to 9 Unit Apartments | 0 (0.0%) | 0 (0.0%) |
| 10 or more Apartments | 0 (0.0%) | 5 (100.0%) |
| Mobile Home / Other | 3 (100.0%) | 0 (0.0%) |
| Total | 188 (72.3%) | 72 (27.7%) |
Housing Structures by Number of Rooms in Science Hill
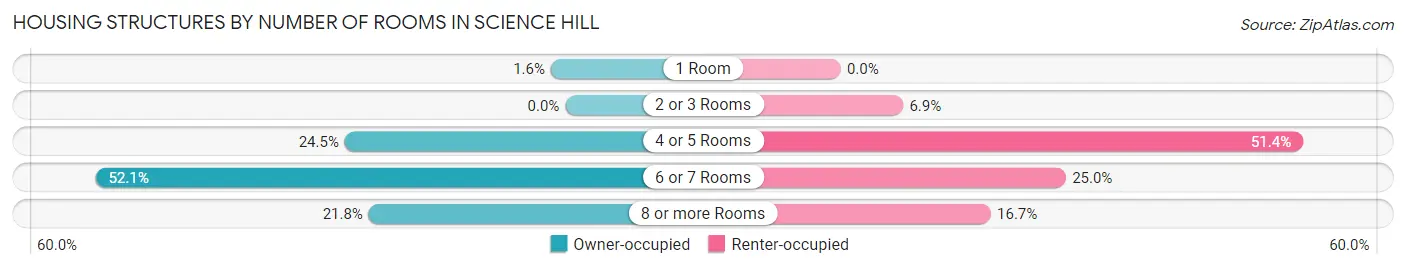
| Number of Rooms | Owner-occupied | Renter-occupied |
| 1 Room | 3 (1.6%) | 0 (0.0%) |
| 2 or 3 Rooms | 0 (0.0%) | 5 (6.9%) |
| 4 or 5 Rooms | 46 (24.5%) | 37 (51.4%) |
| 6 or 7 Rooms | 98 (52.1%) | 18 (25.0%) |
| 8 or more Rooms | 41 (21.8%) | 12 (16.7%) |
| Total | 188 (100.0%) | 72 (100.0%) |
Housing Structure by Heating Type in Science Hill
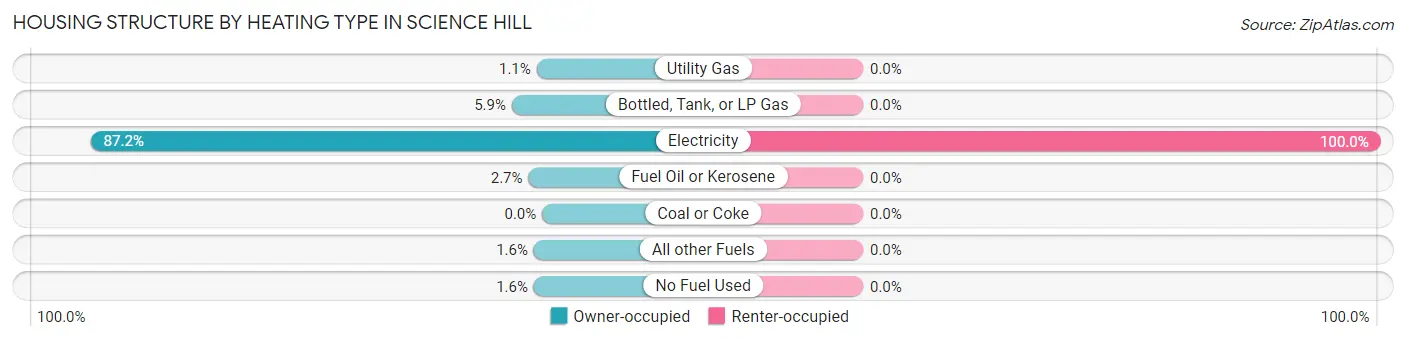
| Heating Type | Owner-occupied | Renter-occupied |
| Utility Gas | 2 (1.1%) | 0 (0.0%) |
| Bottled, Tank, or LP Gas | 11 (5.9%) | 0 (0.0%) |
| Electricity | 164 (87.2%) | 72 (100.0%) |
| Fuel Oil or Kerosene | 5 (2.7%) | 0 (0.0%) |
| Coal or Coke | 0 (0.0%) | 0 (0.0%) |
| All other Fuels | 3 (1.6%) | 0 (0.0%) |
| No Fuel Used | 3 (1.6%) | 0 (0.0%) |
| Total | 188 (100.0%) | 72 (100.0%) |
Household Vehicle Usage in Science Hill
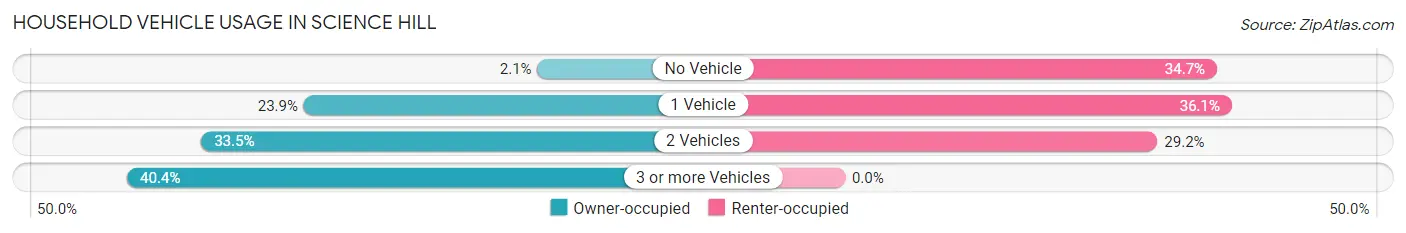
| Vehicles per Household | Owner-occupied | Renter-occupied |
| No Vehicle | 4 (2.1%) | 25 (34.7%) |
| 1 Vehicle | 45 (23.9%) | 26 (36.1%) |
| 2 Vehicles | 63 (33.5%) | 21 (29.2%) |
| 3 or more Vehicles | 76 (40.4%) | 0 (0.0%) |
| Total | 188 (100.0%) | 72 (100.0%) |
Real Estate & Mortgages in Science Hill
Real Estate and Mortgage Overview in Science Hill
| Characteristic | Without Mortgage | With Mortgage |
| Housing Units | 80 | 108 |
| Median Property Value | $139,100 | $112,500 |
| Median Household Income | - | - |
| Monthly Housing Costs | $420 | $0 |
| Real Estate Taxes | $1,195 | $0 |
Property Value by Mortgage Status in Science Hill
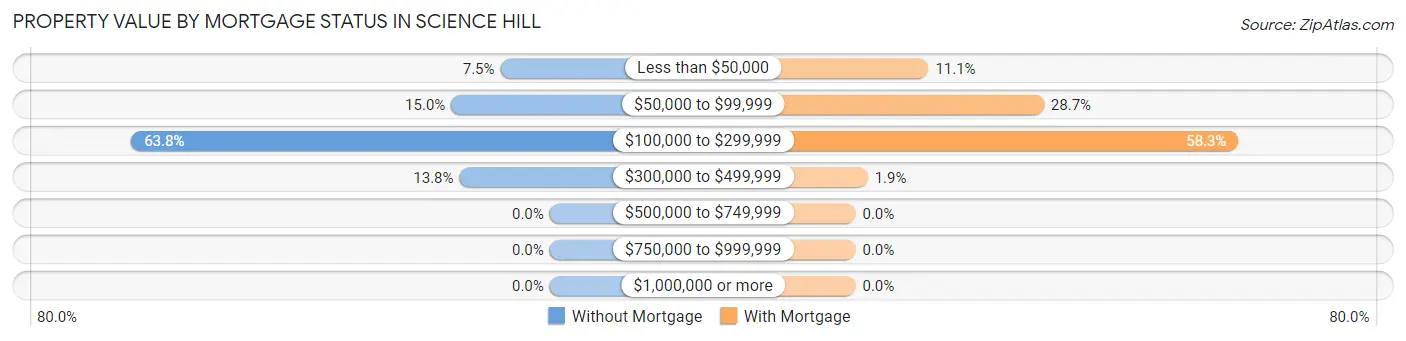
| Property Value | Without Mortgage | With Mortgage |
| Less than $50,000 | 6 (7.5%) | 12 (11.1%) |
| $50,000 to $99,999 | 12 (15.0%) | 31 (28.7%) |
| $100,000 to $299,999 | 51 (63.7%) | 63 (58.3%) |
| $300,000 to $499,999 | 11 (13.8%) | 2 (1.8%) |
| $500,000 to $749,999 | 0 (0.0%) | 0 (0.0%) |
| $750,000 to $999,999 | 0 (0.0%) | 0 (0.0%) |
| $1,000,000 or more | 0 (0.0%) | 0 (0.0%) |
| Total | 80 (100.0%) | 108 (100.0%) |
Household Income by Mortgage Status in Science Hill
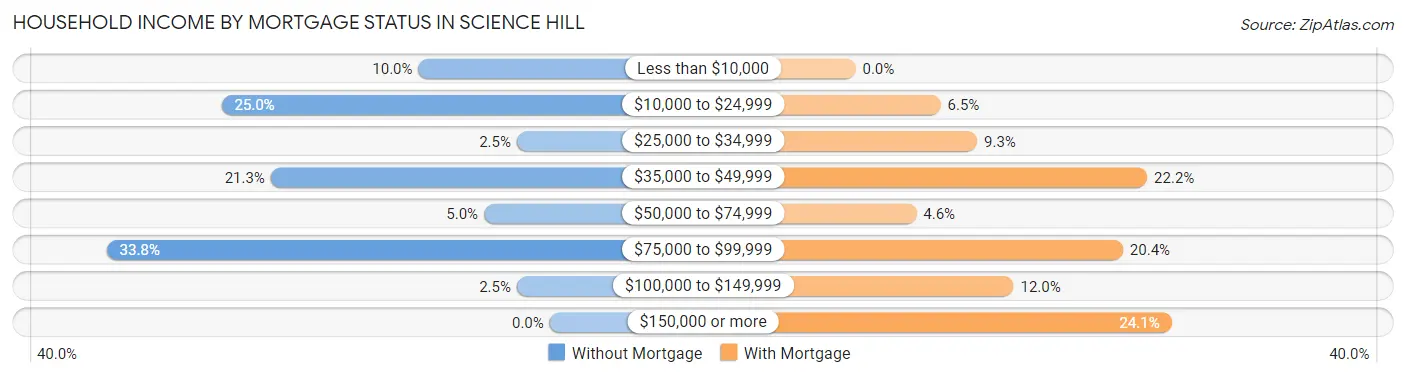
| Household Income | Without Mortgage | With Mortgage |
| Less than $10,000 | 8 (10.0%) | 0 (0.0%) |
| $10,000 to $24,999 | 20 (25.0%) | 7 (6.5%) |
| $25,000 to $34,999 | 2 (2.5%) | 10 (9.3%) |
| $35,000 to $49,999 | 17 (21.2%) | 24 (22.2%) |
| $50,000 to $74,999 | 4 (5.0%) | 5 (4.6%) |
| $75,000 to $99,999 | 27 (33.8%) | 22 (20.4%) |
| $100,000 to $149,999 | 2 (2.5%) | 13 (12.0%) |
| $150,000 or more | 0 (0.0%) | 26 (24.1%) |
| Total | 80 (100.0%) | 108 (100.0%) |
Property Value to Household Income Ratio in Science Hill
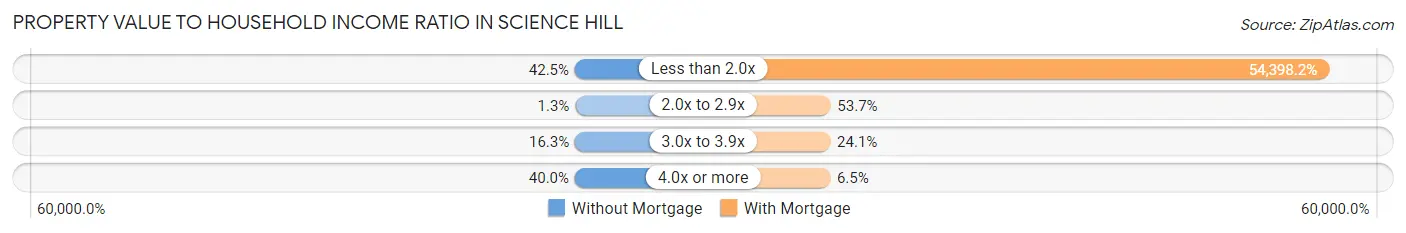
| Value-to-Income Ratio | Without Mortgage | With Mortgage |
| Less than 2.0x | 34 (42.5%) | 58,750 (54,398.1%) |
| 2.0x to 2.9x | 1 (1.3%) | 58 (53.7%) |
| 3.0x to 3.9x | 13 (16.3%) | 26 (24.1%) |
| 4.0x or more | 32 (40.0%) | 7 (6.5%) |
| Total | 80 (100.0%) | 108 (100.0%) |
Real Estate Taxes by Mortgage Status in Science Hill
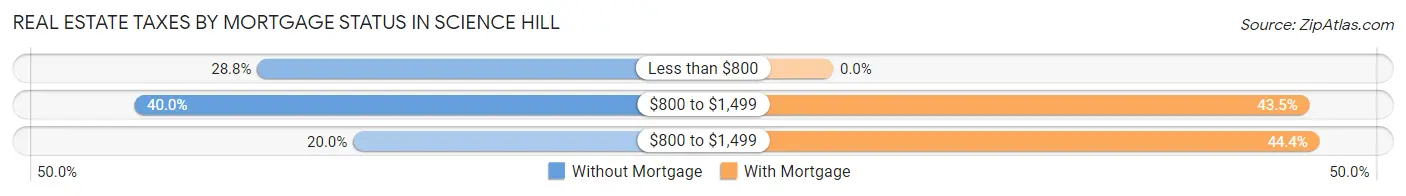
| Property Taxes | Without Mortgage | With Mortgage |
| Less than $800 | 23 (28.7%) | 0 (0.0%) |
| $800 to $1,499 | 32 (40.0%) | 47 (43.5%) |
| $800 to $1,499 | 16 (20.0%) | 48 (44.4%) |
| Total | 80 (100.0%) | 108 (100.0%) |
Health & Disability in Science Hill
Health Insurance Coverage by Age in Science Hill
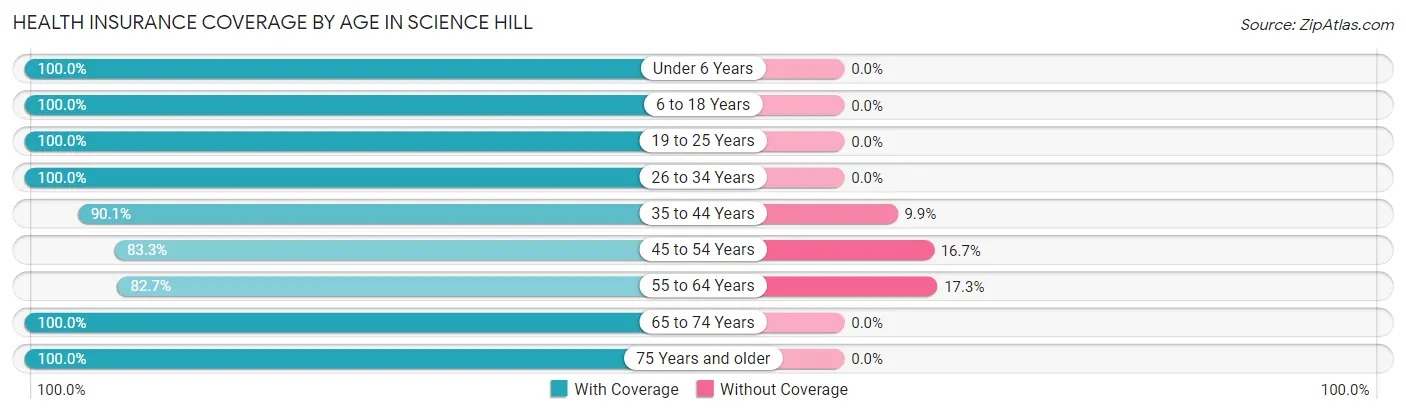
| Age Bracket | With Coverage | Without Coverage |
| Under 6 Years | 93 (100.0%) | 0 (0.0%) |
| 6 to 18 Years | 139 (100.0%) | 0 (0.0%) |
| 19 to 25 Years | 69 (100.0%) | 0 (0.0%) |
| 26 to 34 Years | 69 (100.0%) | 0 (0.0%) |
| 35 to 44 Years | 100 (90.1%) | 11 (9.9%) |
| 45 to 54 Years | 30 (83.3%) | 6 (16.7%) |
| 55 to 64 Years | 62 (82.7%) | 13 (17.3%) |
| 65 to 74 Years | 100 (100.0%) | 0 (0.0%) |
| 75 Years and older | 22 (100.0%) | 0 (0.0%) |
| Total | 684 (95.8%) | 30 (4.2%) |
Health Insurance Coverage by Citizenship Status in Science Hill
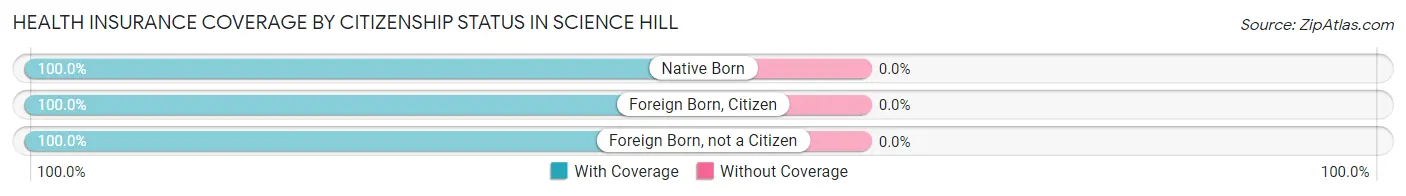
| Citizenship Status | With Coverage | Without Coverage |
| Native Born | 93 (100.0%) | 0 (0.0%) |
| Foreign Born, Citizen | 139 (100.0%) | 0 (0.0%) |
| Foreign Born, not a Citizen | 69 (100.0%) | 0 (0.0%) |
Health Insurance Coverage by Household Income in Science Hill
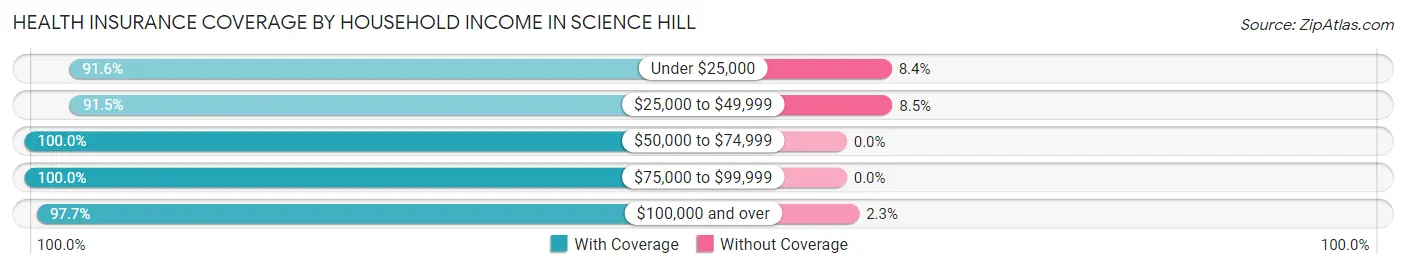
| Household Income | With Coverage | Without Coverage |
| Under $25,000 | 174 (91.6%) | 16 (8.4%) |
| $25,000 to $49,999 | 118 (91.5%) | 11 (8.5%) |
| $50,000 to $74,999 | 134 (100.0%) | 0 (0.0%) |
| $75,000 to $99,999 | 132 (100.0%) | 0 (0.0%) |
| $100,000 and over | 126 (97.7%) | 3 (2.3%) |
Public vs Private Health Insurance Coverage by Age in Science Hill
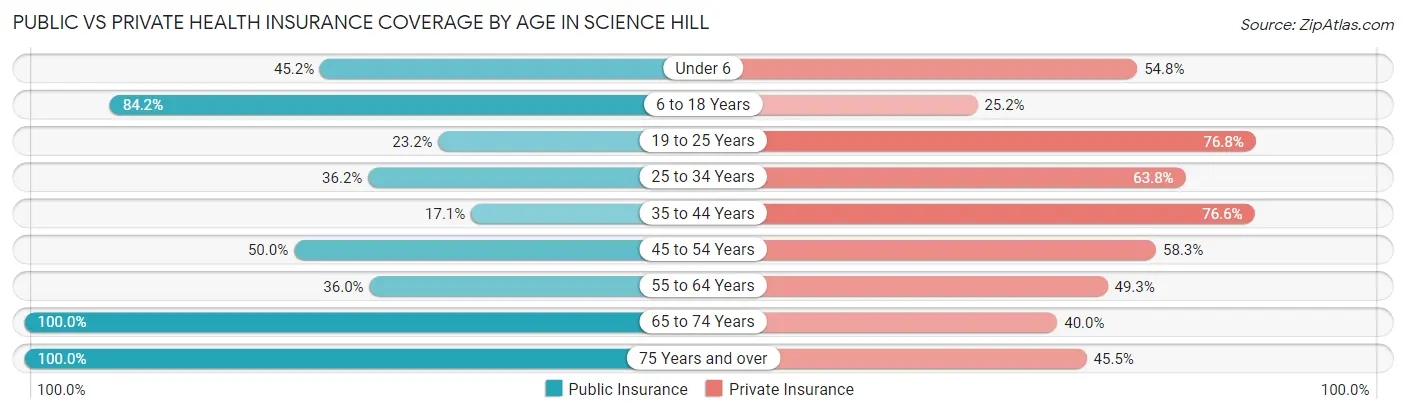
| Age Bracket | Public Insurance | Private Insurance |
| Under 6 | 42 (45.2%) | 51 (54.8%) |
| 6 to 18 Years | 117 (84.2%) | 35 (25.2%) |
| 19 to 25 Years | 16 (23.2%) | 53 (76.8%) |
| 25 to 34 Years | 25 (36.2%) | 44 (63.8%) |
| 35 to 44 Years | 19 (17.1%) | 85 (76.6%) |
| 45 to 54 Years | 18 (50.0%) | 21 (58.3%) |
| 55 to 64 Years | 27 (36.0%) | 37 (49.3%) |
| 65 to 74 Years | 100 (100.0%) | 40 (40.0%) |
| 75 Years and over | 22 (100.0%) | 10 (45.5%) |
| Total | 386 (54.1%) | 376 (52.7%) |
Disability Status by Sex by Age in Science Hill
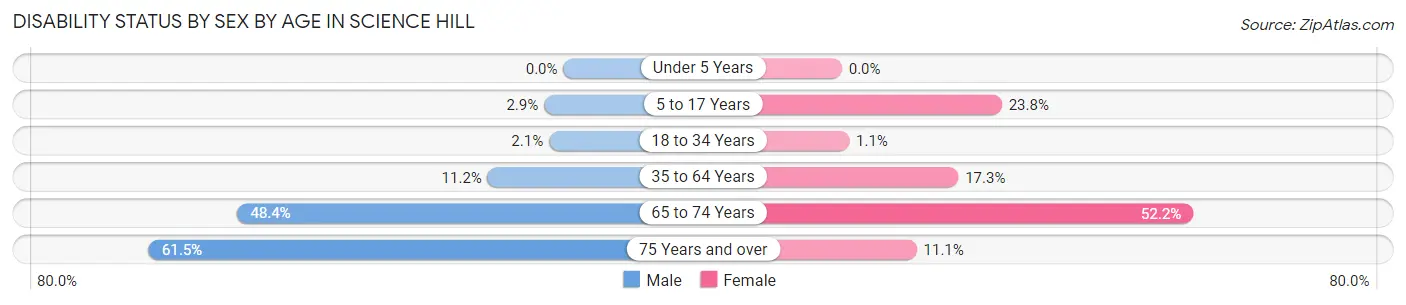
| Age Bracket | Male | Female |
| Under 5 Years | 0 (0.0%) | 0 (0.0%) |
| 5 to 17 Years | 2 (2.9%) | 19 (23.7%) |
| 18 to 34 Years | 1 (2.1%) | 1 (1.1%) |
| 35 to 64 Years | 10 (11.2%) | 23 (17.3%) |
| 65 to 74 Years | 15 (48.4%) | 36 (52.2%) |
| 75 Years and over | 8 (61.5%) | 1 (11.1%) |
Disability Class by Sex by Age in Science Hill
Disability Class: Hearing Difficulty
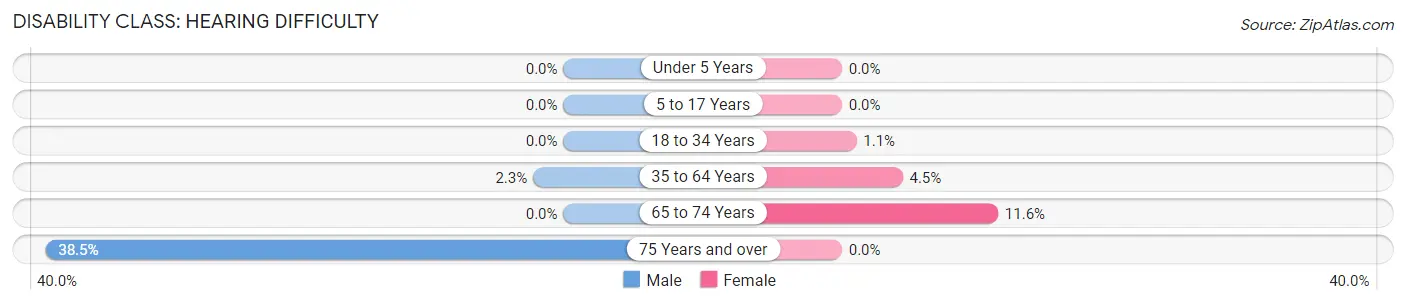
| Age Bracket | Male | Female |
| Under 5 Years | 0 (0.0%) | 0 (0.0%) |
| 5 to 17 Years | 0 (0.0%) | 0 (0.0%) |
| 18 to 34 Years | 0 (0.0%) | 1 (1.1%) |
| 35 to 64 Years | 2 (2.2%) | 6 (4.5%) |
| 65 to 74 Years | 0 (0.0%) | 8 (11.6%) |
| 75 Years and over | 5 (38.5%) | 0 (0.0%) |
Disability Class: Vision Difficulty
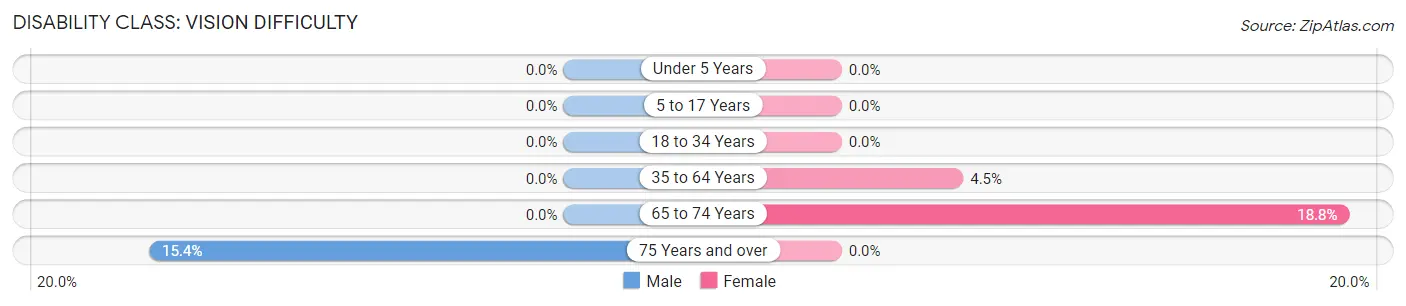
| Age Bracket | Male | Female |
| Under 5 Years | 0 (0.0%) | 0 (0.0%) |
| 5 to 17 Years | 0 (0.0%) | 0 (0.0%) |
| 18 to 34 Years | 0 (0.0%) | 0 (0.0%) |
| 35 to 64 Years | 0 (0.0%) | 6 (4.5%) |
| 65 to 74 Years | 0 (0.0%) | 13 (18.8%) |
| 75 Years and over | 2 (15.4%) | 0 (0.0%) |
Disability Class: Cognitive Difficulty
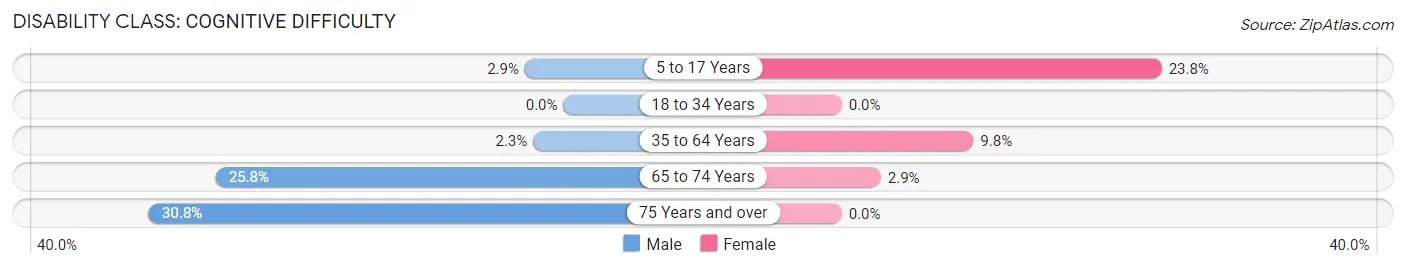
| Age Bracket | Male | Female |
| 5 to 17 Years | 2 (2.9%) | 19 (23.7%) |
| 18 to 34 Years | 0 (0.0%) | 0 (0.0%) |
| 35 to 64 Years | 2 (2.2%) | 13 (9.8%) |
| 65 to 74 Years | 8 (25.8%) | 2 (2.9%) |
| 75 Years and over | 4 (30.8%) | 0 (0.0%) |
Disability Class: Ambulatory Difficulty
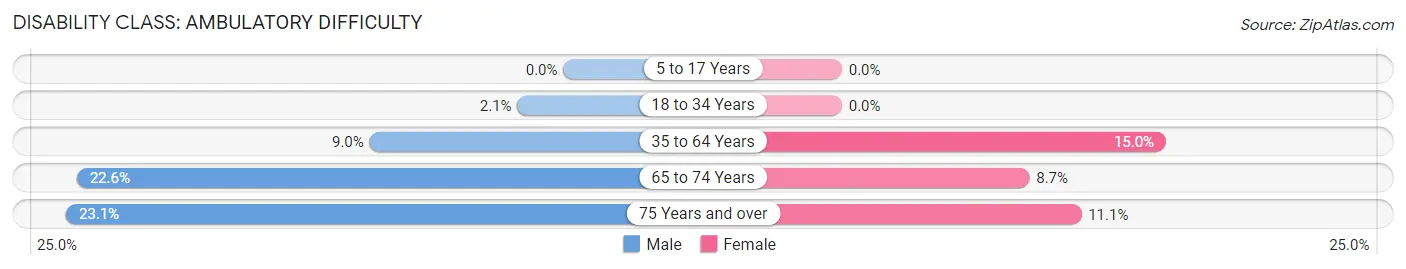
| Age Bracket | Male | Female |
| 5 to 17 Years | 0 (0.0%) | 0 (0.0%) |
| 18 to 34 Years | 1 (2.1%) | 0 (0.0%) |
| 35 to 64 Years | 8 (9.0%) | 20 (15.0%) |
| 65 to 74 Years | 7 (22.6%) | 6 (8.7%) |
| 75 Years and over | 3 (23.1%) | 1 (11.1%) |
Disability Class: Self-Care Difficulty
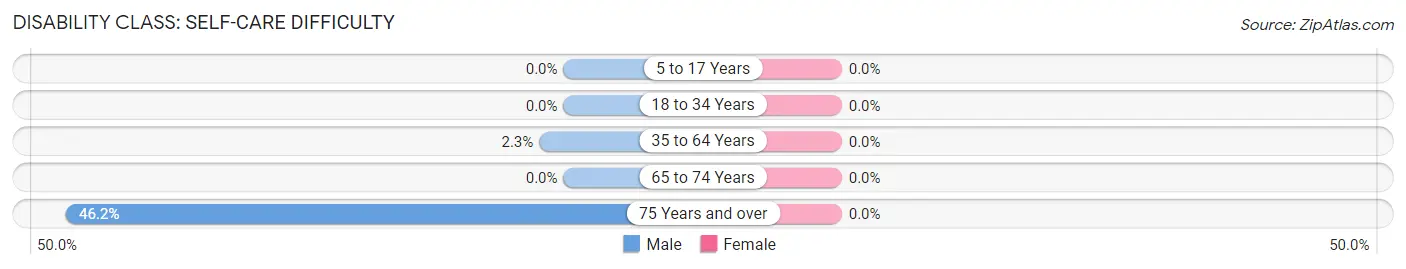
| Age Bracket | Male | Female |
| 5 to 17 Years | 0 (0.0%) | 0 (0.0%) |
| 18 to 34 Years | 0 (0.0%) | 0 (0.0%) |
| 35 to 64 Years | 2 (2.2%) | 0 (0.0%) |
| 65 to 74 Years | 0 (0.0%) | 0 (0.0%) |
| 75 Years and over | 6 (46.2%) | 0 (0.0%) |
Technology Access in Science Hill
Computing Device Access in Science Hill
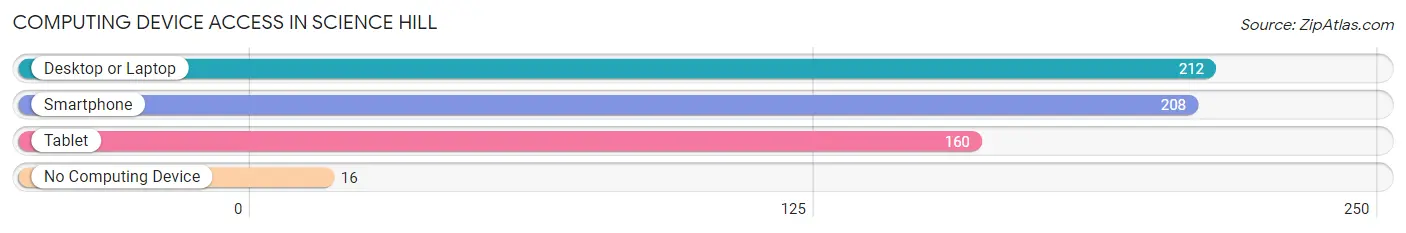
| Device Type | # Households | % Households |
| Desktop or Laptop | 212 | 81.5% |
| Smartphone | 208 | 80.0% |
| Tablet | 160 | 61.5% |
| No Computing Device | 16 | 6.1% |
| Total | 260 | 100.0% |
Internet Access in Science Hill
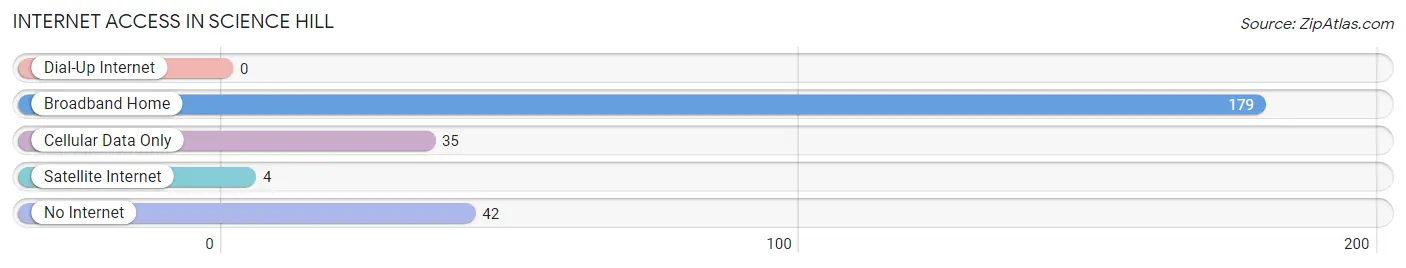
| Internet Type | # Households | % Households |
| Dial-Up Internet | 0 | 0.0% |
| Broadband Home | 179 | 68.9% |
| Cellular Data Only | 35 | 13.5% |
| Satellite Internet | 4 | 1.5% |
| No Internet | 42 | 16.2% |
| Total | 260 | 100.0% |
Science Hill Summary
History
Science Hill is a small unincorporated community located in Pulaski County, Kentucky. It is situated in the foothills of the Appalachian Mountains, approximately 10 miles south of Somerset. The area was first settled in the early 1800s by a group of settlers from North Carolina. The community was named after the nearby Science Hill Academy, which was established in 1820.
The area was primarily agricultural, with tobacco, corn, and wheat being the main crops. In the late 1800s, the area began to develop into a small industrial center, with the establishment of a sawmill, gristmill, and a brickyard. The area also had a number of small businesses, including a general store, a blacksmith shop, and a post office.
In the early 1900s, the area began to experience a population boom, as many people moved to the area to work in the coal mines. The population of Science Hill peaked in the 1950s, with over 1,000 people living in the area.
Geography
Science Hill is located in Pulaski County, Kentucky, in the foothills of the Appalachian Mountains. It is situated approximately 10 miles south of Somerset, and is bordered by the towns of Nancy and Burnside. The area is characterized by rolling hills and valleys, with the highest point being the summit of Science Hill, which is 1,000 feet above sea level.
The climate in Science Hill is temperate, with hot summers and cold winters. The average annual temperature is around 60 degrees Fahrenheit, with the average high in the summer months being around 85 degrees Fahrenheit.
Economy
The economy of Science Hill is primarily based on agriculture and tourism. The area is home to a number of small farms, which produce a variety of crops, including tobacco, corn, and wheat. The area also has a number of small businesses, including a general store, a blacksmith shop, and a post office.
In recent years, the area has seen an increase in tourism, as people come to the area to enjoy the natural beauty of the Appalachian Mountains. The area is also home to a number of outdoor recreation activities, including hiking, camping, fishing, and hunting.
Demographics
As of the 2010 census, the population of Science Hill was 1,072. The population is primarily white (97.2%), with a small percentage of African Americans (1.2%) and Hispanics (1.6%). The median household income is $35,000, and the median age is 42. The area is served by the Pulaski County School District.
Common Questions
What is Per Capita Income in Science Hill?
Per Capita income in Science Hill is $18,627.
What is the Median Family Income in Science Hill?
Median Family Income in Science Hill is $60,500.
What is the Median Household income in Science Hill?
Median Household Income in Science Hill is $36,250.
What is Income or Wage Gap in Science Hill?
Income or Wage Gap in Science Hill is 30.3%.
Women in Science Hill earn 69.7 cents for every dollar earned by a man.
What is Family Income Deficit in Science Hill?
Family Income Deficit in Science Hill is $12,880.
Families that are below poverty line in Science Hill earn $12,880 less on average than the poverty threshold level.
What is Inequality or Gini Index in Science Hill?
Inequality or Gini Index in Science Hill is 0.45.
What is the Total Population of Science Hill?
Total Population of Science Hill is 714.
What is the Total Male Population of Science Hill?
Total Male Population of Science Hill is 289.
What is the Total Female Population of Science Hill?
Total Female Population of Science Hill is 425.
What is the Ratio of Males per 100 Females in Science Hill?
There are 68.00 Males per 100 Females in Science Hill.
What is the Ratio of Females per 100 Males in Science Hill?
There are 147.06 Females per 100 Males in Science Hill.
What is the Median Population Age in Science Hill?
Median Population Age in Science Hill is 33.1 Years.
What is the Average Family Size in Science Hill
Average Family Size in Science Hill is 3.4 People.
What is the Average Household Size in Science Hill
Average Household Size in Science Hill is 2.8 People.
How Large is the Labor Force in Science Hill?
There are 288 People in the Labor Forcein in Science Hill.
What is the Percentage of People in the Labor Force in Science Hill?
53.3% of People are in the Labor Force in Science Hill.
What is the Unemployment Rate in Science Hill?
Unemployment Rate in Science Hill is 6.6%.