Cannonsburg, KY Map & Demographics
Cannonsburg Map
Cannonsburg Overview
$33,649
PER CAPITA INCOME
$81,349
AVG FAMILY INCOME
$80,271
AVG HOUSEHOLD INCOME
28.1%
WAGE / INCOME GAP [ % ]
71.9¢/ $1
WAGE / INCOME GAP [ $ ]
0.34
INEQUALITY / GINI INDEX
1,032
TOTAL POPULATION
406
MALE POPULATION
626
FEMALE POPULATION
64.86
MALES / 100 FEMALES
154.19
FEMALES / 100 MALES
28.7
MEDIAN AGE
2.9
AVG FAMILY SIZE
2.4
AVG HOUSEHOLD SIZE
547
LABOR FORCE [ PEOPLE ]
81.0%
PERCENT IN LABOR FORCE
6.2%
UNEMPLOYMENT RATE
Income in Cannonsburg
Income Overview in Cannonsburg
Per Capita Income in Cannonsburg is $33,649, while median incomes of families and households are $81,349 and $80,271 respectively.
| Characteristic | Number | Measure |
| Per Capita Income | 1,032 | $33,649 |
| Median Family Income | 303 | $81,349 |
| Mean Family Income | 303 | $99,324 |
| Median Household Income | 436 | $80,271 |
| Mean Household Income | 436 | $81,788 |
| Income Deficit | 303 | $0 |
| Wage / Income Gap (%) | 1,032 | 28.14% |
| Wage / Income Gap ($) | 1,032 | 71.86¢ per $1 |
| Gini / Inequality Index | 1,032 | 0.34 |
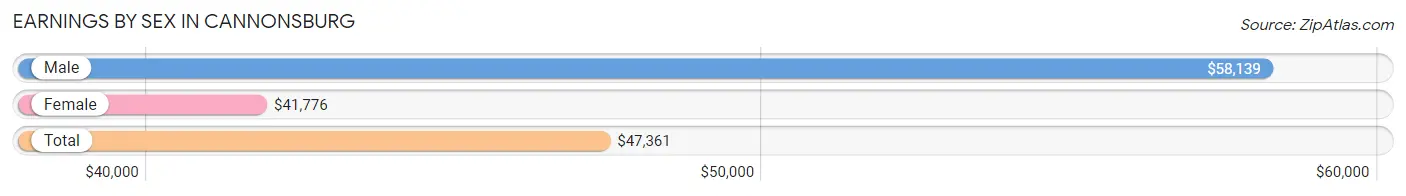
Earnings by Sex in Cannonsburg
Average Earnings in Cannonsburg are $47,361, $58,139 for men and $41,776 for women, a difference of 28.1%.
| Sex | Number | Average Earnings |
| Male | 313 (59.5%) | $58,139 |
| Female | 213 (40.5%) | $41,776 |
| Total | 526 (100.0%) | $47,361 |
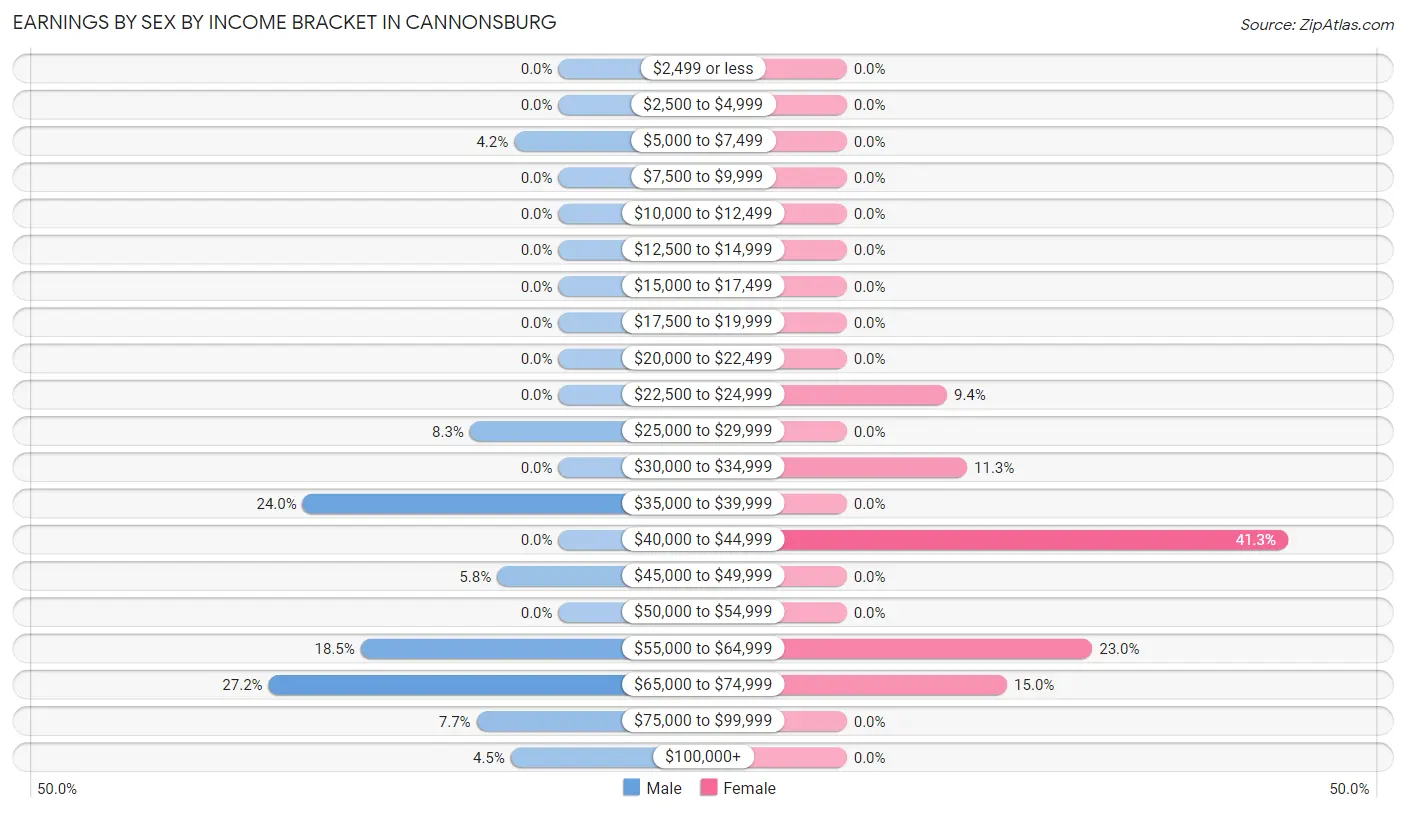
Earnings by Sex by Income Bracket in Cannonsburg
The most common earnings brackets in Cannonsburg are $65,000 to $74,999 for men (85 | 27.2%) and $40,000 to $44,999 for women (88 | 41.3%).
| Income | Male | Female |
| $2,499 or less | 0 (0.0%) | 0 (0.0%) |
| $2,500 to $4,999 | 0 (0.0%) | 0 (0.0%) |
| $5,000 to $7,499 | 13 (4.2%) | 0 (0.0%) |
| $7,500 to $9,999 | 0 (0.0%) | 0 (0.0%) |
| $10,000 to $12,499 | 0 (0.0%) | 0 (0.0%) |
| $12,500 to $14,999 | 0 (0.0%) | 0 (0.0%) |
| $15,000 to $17,499 | 0 (0.0%) | 0 (0.0%) |
| $17,500 to $19,999 | 0 (0.0%) | 0 (0.0%) |
| $20,000 to $22,499 | 0 (0.0%) | 0 (0.0%) |
| $22,500 to $24,999 | 0 (0.0%) | 20 (9.4%) |
| $25,000 to $29,999 | 26 (8.3%) | 0 (0.0%) |
| $30,000 to $34,999 | 0 (0.0%) | 24 (11.3%) |
| $35,000 to $39,999 | 75 (24.0%) | 0 (0.0%) |
| $40,000 to $44,999 | 0 (0.0%) | 88 (41.3%) |
| $45,000 to $49,999 | 18 (5.8%) | 0 (0.0%) |
| $50,000 to $54,999 | 0 (0.0%) | 0 (0.0%) |
| $55,000 to $64,999 | 58 (18.5%) | 49 (23.0%) |
| $65,000 to $74,999 | 85 (27.2%) | 32 (15.0%) |
| $75,000 to $99,999 | 24 (7.7%) | 0 (0.0%) |
| $100,000+ | 14 (4.5%) | 0 (0.0%) |
| Total | 313 (100.0%) | 213 (100.0%) |
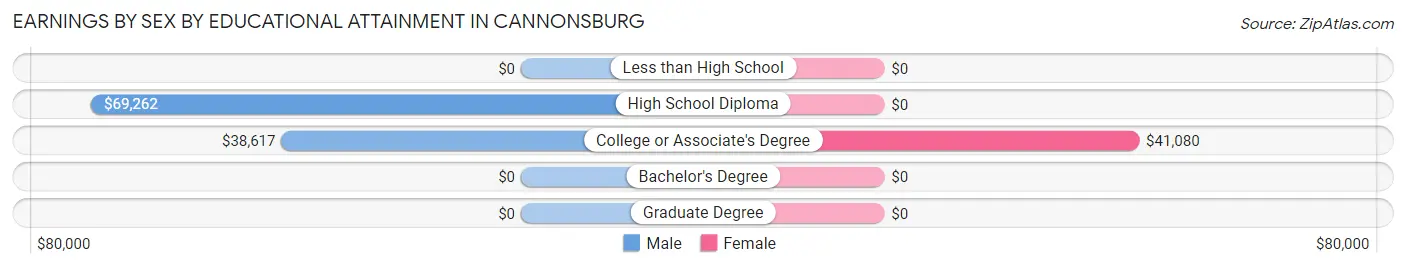
Earnings by Sex by Educational Attainment in Cannonsburg
Average earnings in Cannonsburg are $58,139 for men and $41,776 for women, a difference of 28.1%. Men with an educational attainment of high school diploma enjoy the highest average annual earnings of $69,262, while those with college or associate's degree education earn the least with $38,617. Women with an educational attainment of college or associate's degree earn the most with the average annual earnings of $41,080, while those with college or associate's degree education have the smallest earnings of $41,080.
| Educational Attainment | Male Income | Female Income |
| Less than High School | - | - |
| High School Diploma | $69,262 | $0 |
| College or Associate's Degree | $38,617 | $41,080 |
| Bachelor's Degree | - | - |
| Graduate Degree | - | - |
| Total | $58,139 | $41,776 |
Family Income in Cannonsburg
Family Income Brackets in Cannonsburg
According to the Cannonsburg family income data, there are 108 families falling into the $75,000 to $99,999 income range, which is the most common income bracket and makes up 35.6% of all families.
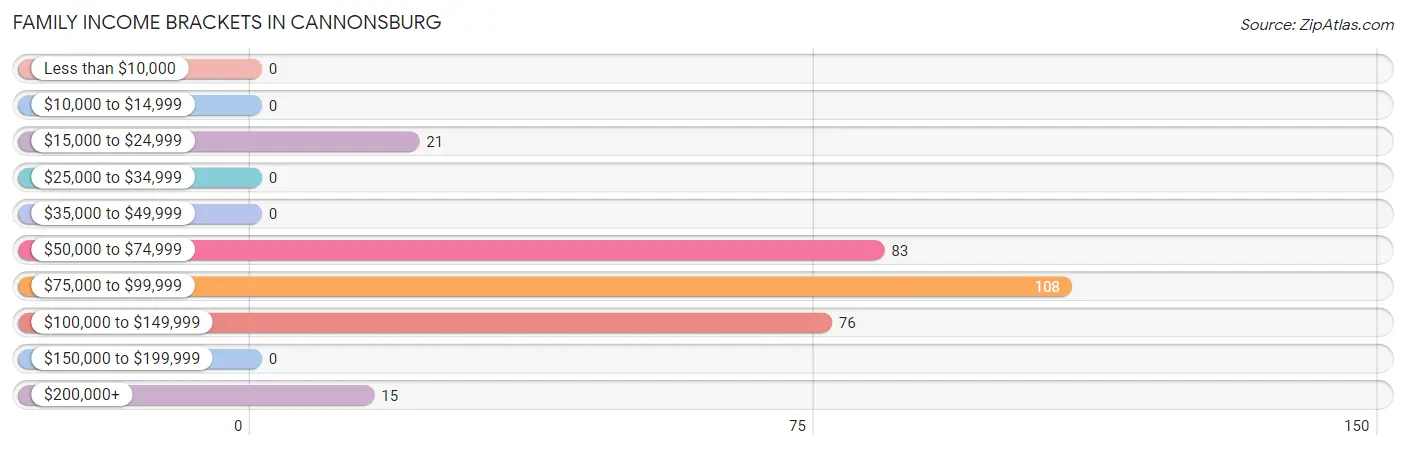
| Income Bracket | # Families | % Families |
| Less than $10,000 | 0 | 0.0% |
| $10,000 to $14,999 | 0 | 0.0% |
| $15,000 to $24,999 | 21 | 6.9% |
| $25,000 to $34,999 | 0 | 0.0% |
| $35,000 to $49,999 | 0 | 0.0% |
| $50,000 to $74,999 | 83 | 27.4% |
| $75,000 to $99,999 | 108 | 35.6% |
| $100,000 to $149,999 | 76 | 25.1% |
| $150,000 to $199,999 | 0 | 0.0% |
| $200,000+ | 15 | 5.0% |
Family Income by Famaliy Size in Cannonsburg
3-person families (209 | 69.0%) account for the highest median family income in Cannonsburg with $81,690 per family, while 2-person families (53 | 17.5%) have the highest median income of $35,651 per family member.
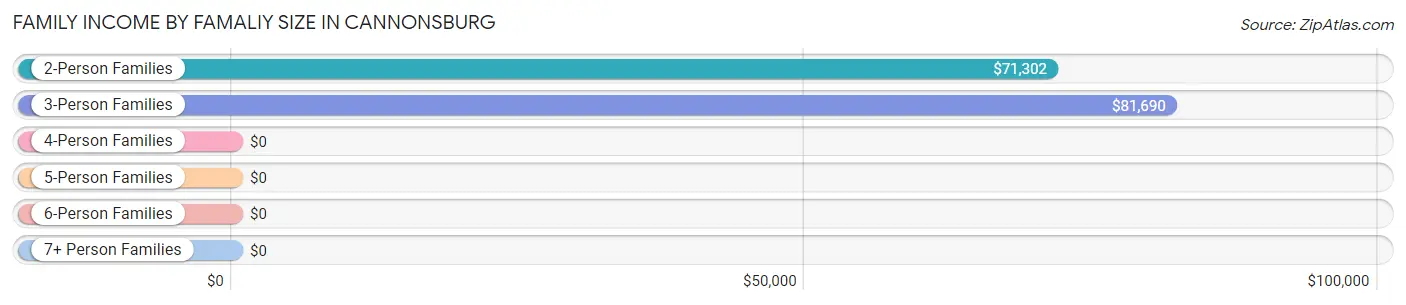
| Income Bracket | # Families | Median Income |
| 2-Person Families | 53 (17.5%) | $71,302 |
| 3-Person Families | 209 (69.0%) | $81,690 |
| 4-Person Families | 41 (13.5%) | $0 |
| 5-Person Families | 0 (0.0%) | $0 |
| 6-Person Families | 0 (0.0%) | $0 |
| 7+ Person Families | 0 (0.0%) | $0 |
| Total | 303 (100.0%) | $81,349 |
Family Income by Number of Earners in Cannonsburg
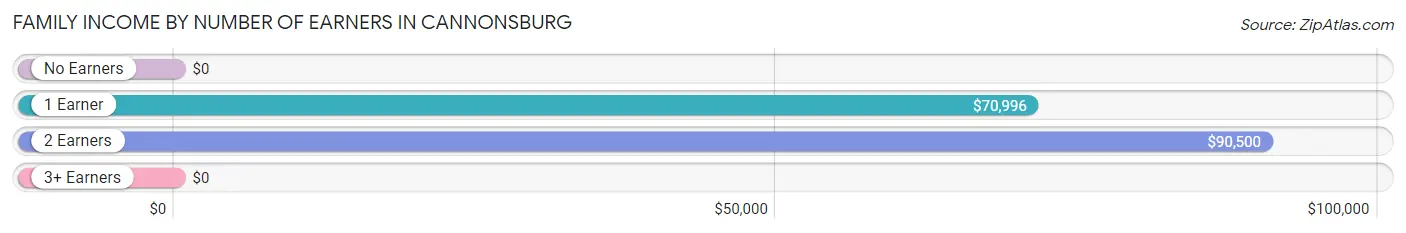
| Number of Earners | # Families | Median Income |
| No Earners | 36 (11.9%) | $0 |
| 1 Earner | 83 (27.4%) | $70,996 |
| 2 Earners | 184 (60.7%) | $90,500 |
| 3+ Earners | 0 (0.0%) | $0 |
| Total | 303 (100.0%) | $81,349 |
Household Income in Cannonsburg
Household Income Brackets in Cannonsburg
With 140 households falling in the category, the $75,000 to $99,999 income range is the most frequent in Cannonsburg, accounting for 32.1% of all households.
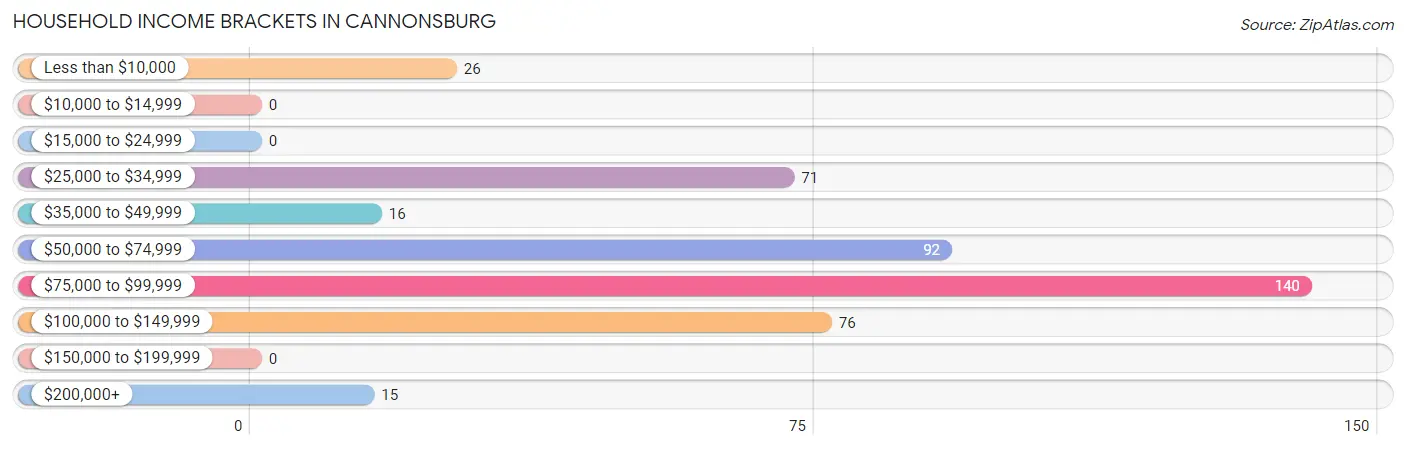
| Income Bracket | # Households | % Households |
| Less than $10,000 | 26 | 6.0% |
| $10,000 to $14,999 | 0 | 0.0% |
| $15,000 to $24,999 | 0 | 0.0% |
| $25,000 to $34,999 | 71 | 16.3% |
| $35,000 to $49,999 | 16 | 3.7% |
| $50,000 to $74,999 | 92 | 21.1% |
| $75,000 to $99,999 | 140 | 32.1% |
| $100,000 to $149,999 | 76 | 17.4% |
| $150,000 to $199,999 | 0 | 0.0% |
| $200,000+ | 15 | 3.4% |
Household Income by Householder Age in Cannonsburg
The median household income in Cannonsburg is $80,271, with the highest median household income of $72,355 found in the 25 to 44 years age bracket for the primary householder. A total of 224 households (51.4%) fall into this category.
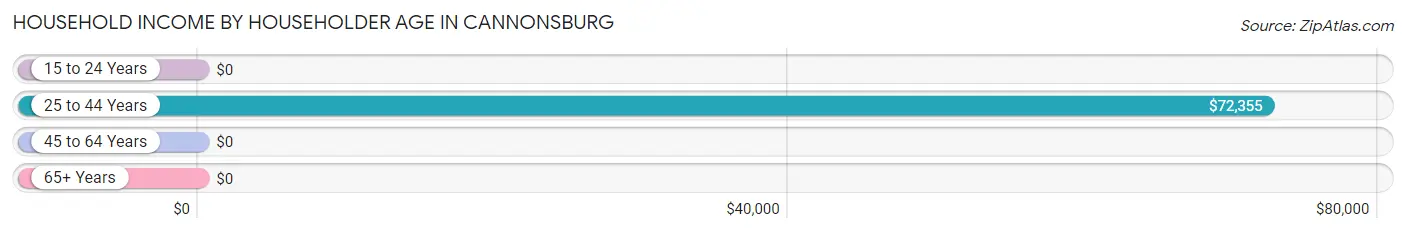
| Income Bracket | # Households | Median Income |
| 15 to 24 Years | 0 (0.0%) | $0 |
| 25 to 44 Years | 224 (51.4%) | $72,355 |
| 45 to 64 Years | 188 (43.1%) | $0 |
| 65+ Years | 24 (5.5%) | $0 |
| Total | 436 (100.0%) | $80,271 |
Poverty in Cannonsburg
Income Below Poverty by Sex and Age in Cannonsburg
With 7.1% poverty level for males and 14.1% for females among the residents of Cannonsburg, 5 year old males and 6 to 11 year old females are the most vulnerable to poverty, with 16 males (100.0%) and 21 females (100.0%) in their respective age groups living below the poverty level.
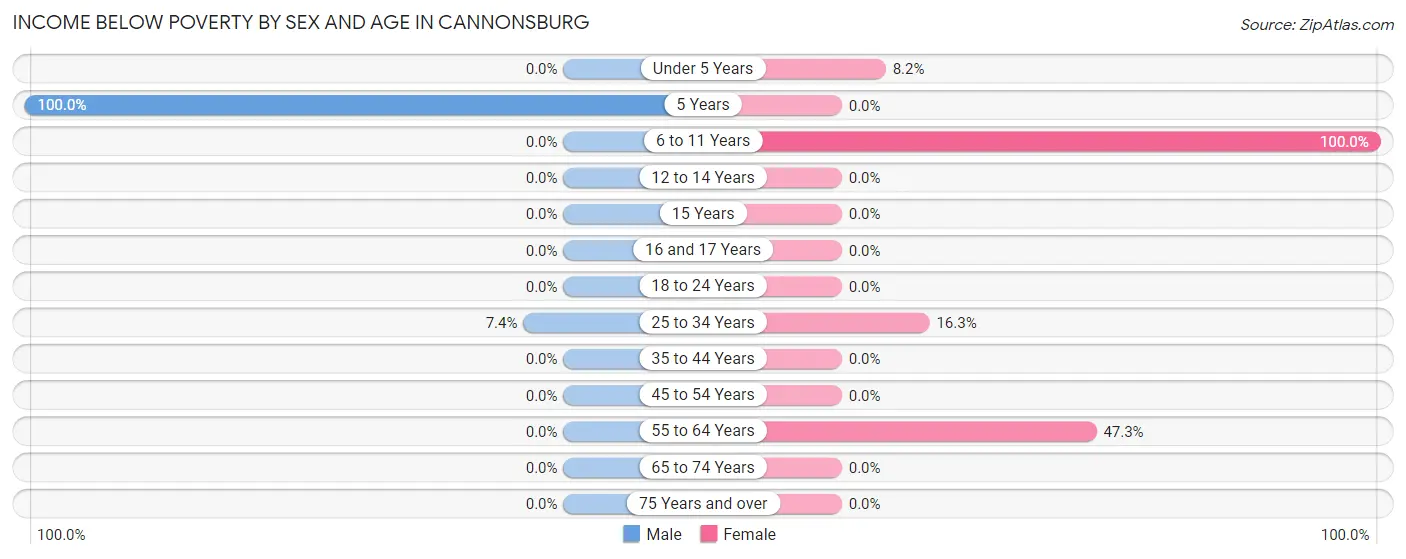
| Age Bracket | Male | Female |
| Under 5 Years | 0 (0.0%) | 20 (8.2%) |
| 5 Years | 16 (100.0%) | 0 (0.0%) |
| 6 to 11 Years | 0 (0.0%) | 21 (100.0%) |
| 12 to 14 Years | 0 (0.0%) | 0 (0.0%) |
| 15 Years | 0 (0.0%) | 0 (0.0%) |
| 16 and 17 Years | 0 (0.0%) | 0 (0.0%) |
| 18 to 24 Years | 0 (0.0%) | 0 (0.0%) |
| 25 to 34 Years | 13 (7.4%) | 21 (16.3%) |
| 35 to 44 Years | 0 (0.0%) | 0 (0.0%) |
| 45 to 54 Years | 0 (0.0%) | 0 (0.0%) |
| 55 to 64 Years | 0 (0.0%) | 26 (47.3%) |
| 65 to 74 Years | 0 (0.0%) | 0 (0.0%) |
| 75 Years and over | 0 (0.0%) | 0 (0.0%) |
| Total | 29 (7.1%) | 88 (14.1%) |
Income Above Poverty by Sex and Age in Cannonsburg
According to the poverty statistics in Cannonsburg, males aged 12 to 14 years and females aged 5 years are the age groups that are most secure financially, with 100.0% of males and 100.0% of females in these age groups living above the poverty line.
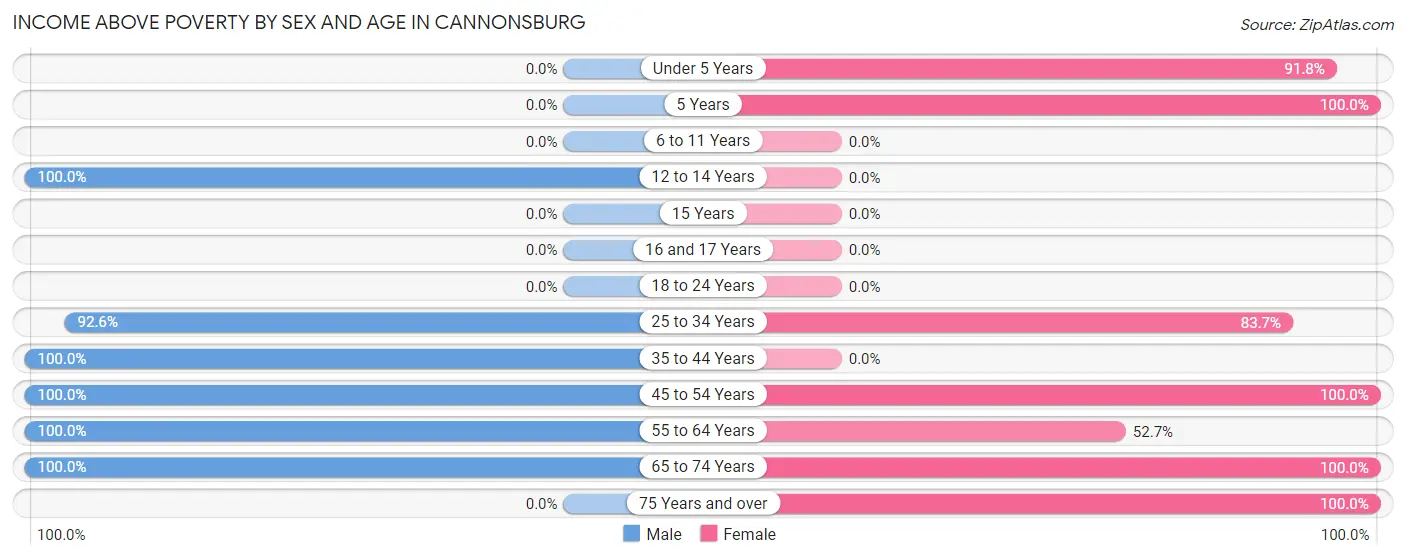
| Age Bracket | Male | Female |
| Under 5 Years | 0 (0.0%) | 225 (91.8%) |
| 5 Years | 0 (0.0%) | 29 (100.0%) |
| 6 to 11 Years | 0 (0.0%) | 0 (0.0%) |
| 12 to 14 Years | 46 (100.0%) | 0 (0.0%) |
| 15 Years | 0 (0.0%) | 0 (0.0%) |
| 16 and 17 Years | 0 (0.0%) | 0 (0.0%) |
| 18 to 24 Years | 0 (0.0%) | 0 (0.0%) |
| 25 to 34 Years | 162 (92.6%) | 108 (83.7%) |
| 35 to 44 Years | 50 (100.0%) | 0 (0.0%) |
| 45 to 54 Years | 61 (100.0%) | 124 (100.0%) |
| 55 to 64 Years | 43 (100.0%) | 29 (52.7%) |
| 65 to 74 Years | 15 (100.0%) | 14 (100.0%) |
| 75 Years and over | 0 (0.0%) | 9 (100.0%) |
| Total | 377 (92.9%) | 538 (85.9%) |
Income Below Poverty Among Married-Couple Families in Cannonsburg
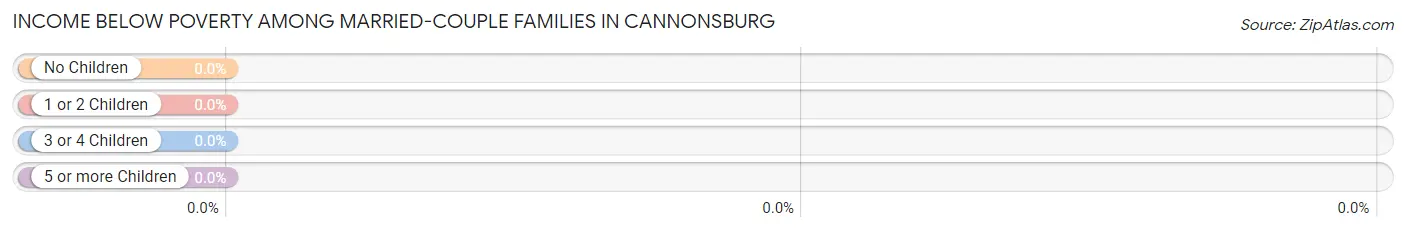
| Children | Above Poverty | Below Poverty |
| No Children | 68 (100.0%) | 0 (0.0%) |
| 1 or 2 Children | 169 (100.0%) | 0 (0.0%) |
| 3 or 4 Children | 0 (0.0%) | 0 (0.0%) |
| 5 or more Children | 0 (0.0%) | 0 (0.0%) |
| Total | 237 (100.0%) | 0 (0.0%) |
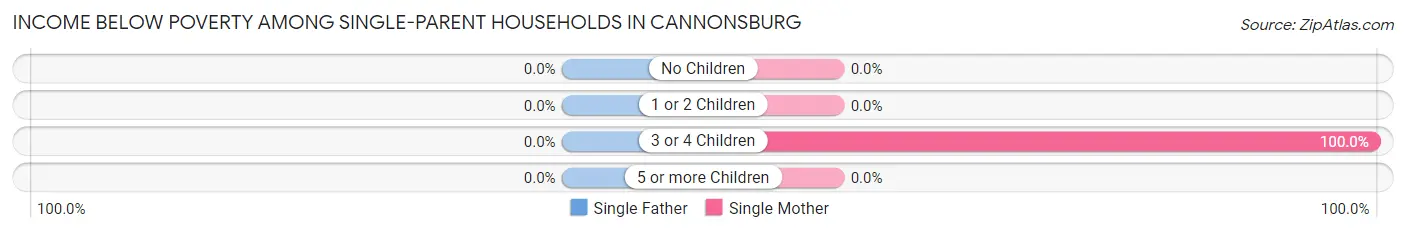
Income Below Poverty Among Single-Parent Households in Cannonsburg
| Children | Single Father | Single Mother |
| No Children | 0 (0.0%) | 0 (0.0%) |
| 1 or 2 Children | 0 (0.0%) | 0 (0.0%) |
| 3 or 4 Children | 0 (0.0%) | 21 (100.0%) |
| 5 or more Children | 0 (0.0%) | 0 (0.0%) |
| Total | 0 (0.0%) | 21 (100.0%) |
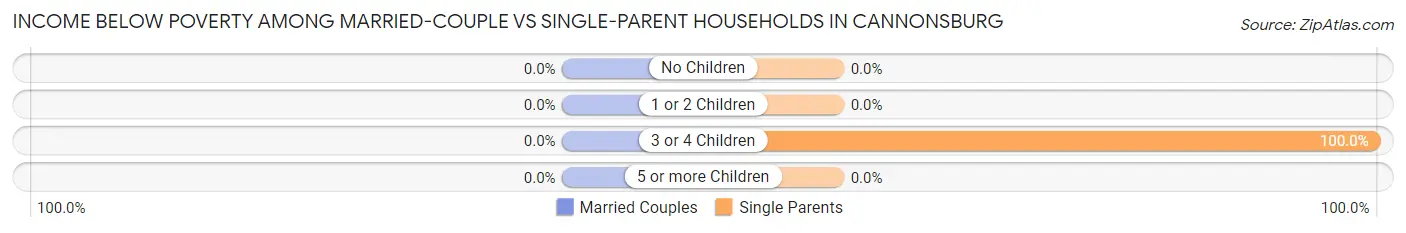
Income Below Poverty Among Married-Couple vs Single-Parent Households in Cannonsburg
| Children | Married-Couple Families | Single-Parent Households |
| No Children | 0 (0.0%) | 0 (0.0%) |
| 1 or 2 Children | 0 (0.0%) | 0 (0.0%) |
| 3 or 4 Children | 0 (0.0%) | 21 (100.0%) |
| 5 or more Children | 0 (0.0%) | 0 (0.0%) |
| Total | 0 (0.0%) | 21 (31.8%) |
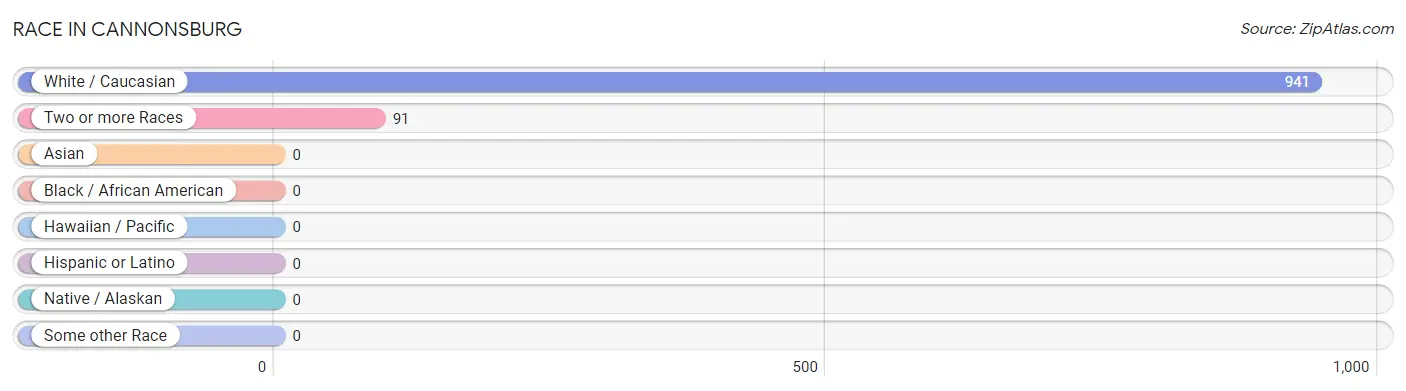
Race in Cannonsburg
The most populous races in Cannonsburg are White / Caucasian (941 | 91.2%), and Two or more Races (91 | 8.8%).
| Race | # Population | % Population |
| Asian | 0 | 0.0% |
| Black / African American | 0 | 0.0% |
| Hawaiian / Pacific | 0 | 0.0% |
| Hispanic or Latino | 0 | 0.0% |
| Native / Alaskan | 0 | 0.0% |
| White / Caucasian | 941 | 91.2% |
| Two or more Races | 91 | 8.8% |
| Some other Race | 0 | 0.0% |
| Total | 1,032 | 100.0% |
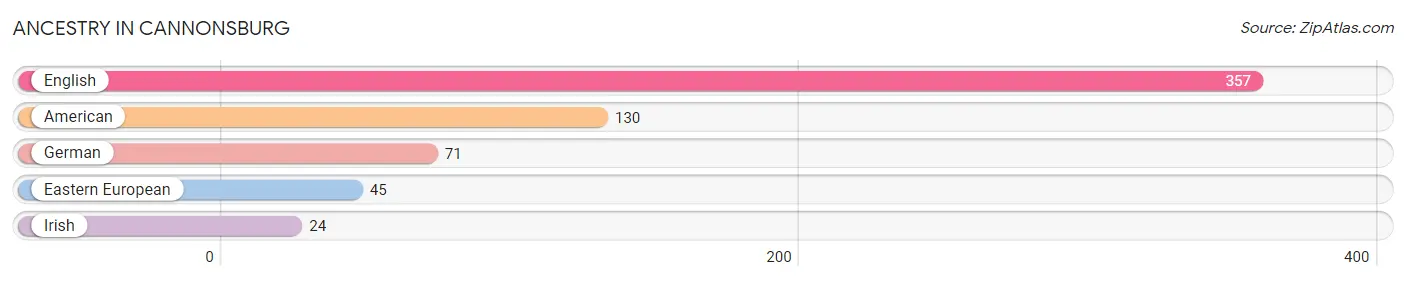
Ancestry in Cannonsburg
The most populous ancestries reported in Cannonsburg are English (357 | 34.6%), American (130 | 12.6%), German (71 | 6.9%), Eastern European (45 | 4.4%), and Irish (24 | 2.3%), together accounting for 60.8% of all Cannonsburg residents.
| Ancestry | # Population | % Population |
| American | 130 | 12.6% |
| Eastern European | 45 | 4.4% |
| English | 357 | 34.6% |
| German | 71 | 6.9% |
| Irish | 24 | 2.3% | View All 5 Rows |
Immigrants in Cannonsburg

| Immigration Origin | # Population | % Population | View All 0 Rows |
Sex and Age in Cannonsburg
Sex and Age in Cannonsburg
The most populous age groups in Cannonsburg are 25 to 29 Years (99 | 24.4%) for men and Under 5 Years (245 | 39.1%) for women.
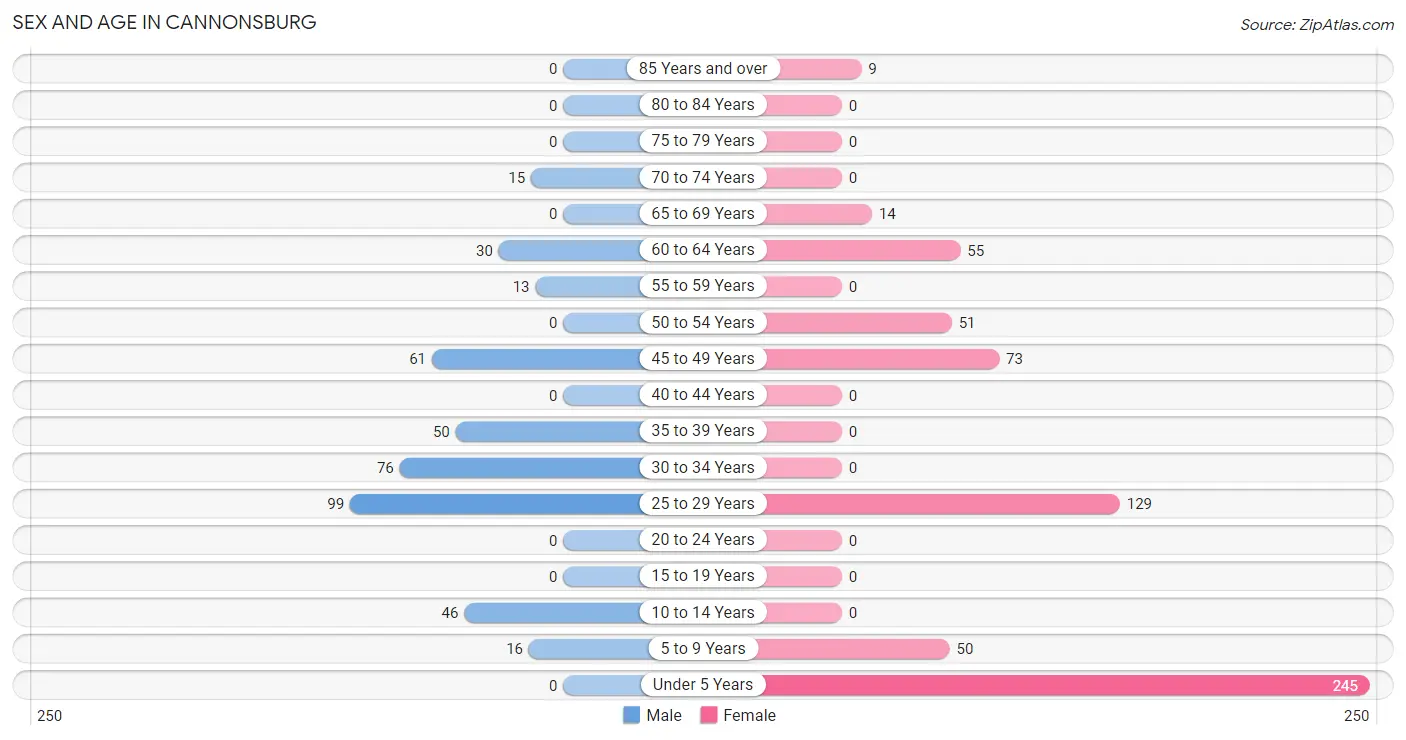
| Age Bracket | Male | Female |
| Under 5 Years | 0 (0.0%) | 245 (39.1%) |
| 5 to 9 Years | 16 (3.9%) | 50 (8.0%) |
| 10 to 14 Years | 46 (11.3%) | 0 (0.0%) |
| 15 to 19 Years | 0 (0.0%) | 0 (0.0%) |
| 20 to 24 Years | 0 (0.0%) | 0 (0.0%) |
| 25 to 29 Years | 99 (24.4%) | 129 (20.6%) |
| 30 to 34 Years | 76 (18.7%) | 0 (0.0%) |
| 35 to 39 Years | 50 (12.3%) | 0 (0.0%) |
| 40 to 44 Years | 0 (0.0%) | 0 (0.0%) |
| 45 to 49 Years | 61 (15.0%) | 73 (11.7%) |
| 50 to 54 Years | 0 (0.0%) | 51 (8.2%) |
| 55 to 59 Years | 13 (3.2%) | 0 (0.0%) |
| 60 to 64 Years | 30 (7.4%) | 55 (8.8%) |
| 65 to 69 Years | 0 (0.0%) | 14 (2.2%) |
| 70 to 74 Years | 15 (3.7%) | 0 (0.0%) |
| 75 to 79 Years | 0 (0.0%) | 0 (0.0%) |
| 80 to 84 Years | 0 (0.0%) | 0 (0.0%) |
| 85 Years and over | 0 (0.0%) | 9 (1.4%) |
| Total | 406 (100.0%) | 626 (100.0%) |
Families and Households in Cannonsburg
Median Family Size in Cannonsburg
The median family size in Cannonsburg is 2.92 persons per family, with single male/father families (45 | 14.8%) accounting for the largest median family size of 3.89 persons per family. On the other hand, married-couple families (237 | 78.2%) represent the smallest median family size with 2.67 persons per family.
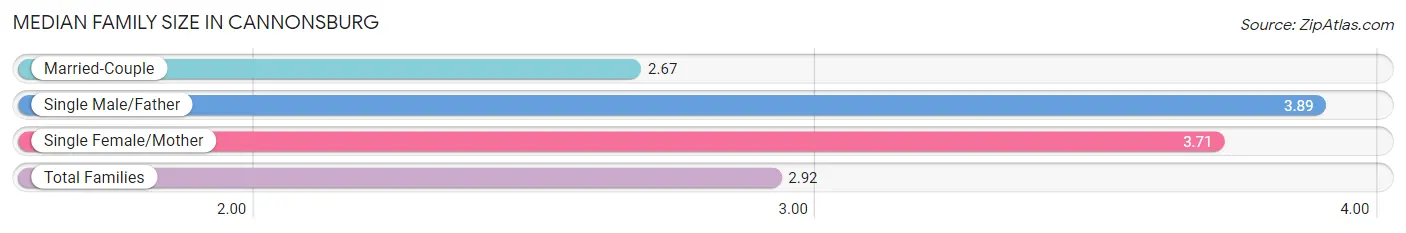
| Family Type | # Families | Family Size |
| Married-Couple | 237 (78.2%) | 2.67 |
| Single Male/Father | 45 (14.8%) | 3.89 |
| Single Female/Mother | 21 (6.9%) | 3.71 |
| Total Families | 303 (100.0%) | 2.92 |
Median Household Size in Cannonsburg
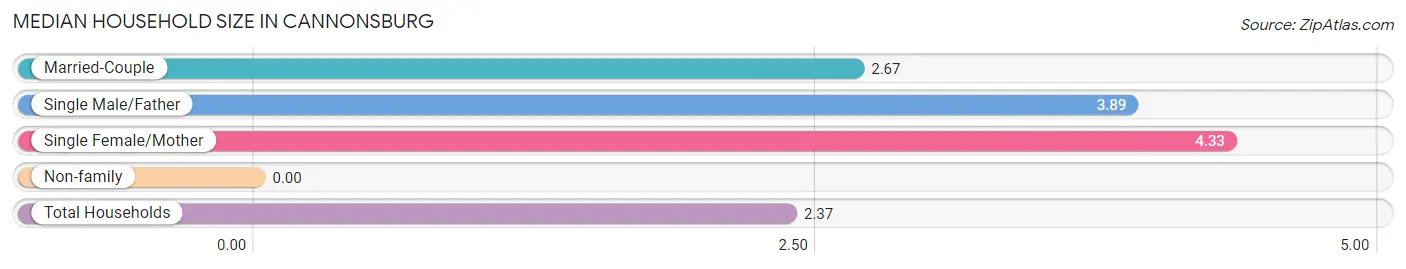
| Household Type | # Households | Household Size |
| Married-Couple | 237 (54.4%) | 2.67 |
| Single Male/Father | 45 (10.3%) | 3.89 |
| Single Female/Mother | 21 (4.8%) | 4.33 |
| Non-family | 133 (30.5%) | - |
| Total Households | 436 (100.0%) | 2.37 |
Household Size by Marriage Status in Cannonsburg
Out of a total of 436 households in Cannonsburg, 303 (69.5%) are family households, while 133 (30.5%) are nonfamily households. The most numerous type of family households are 3-person households, comprising 209, and the most common type of nonfamily households are 1-person households, comprising 133.
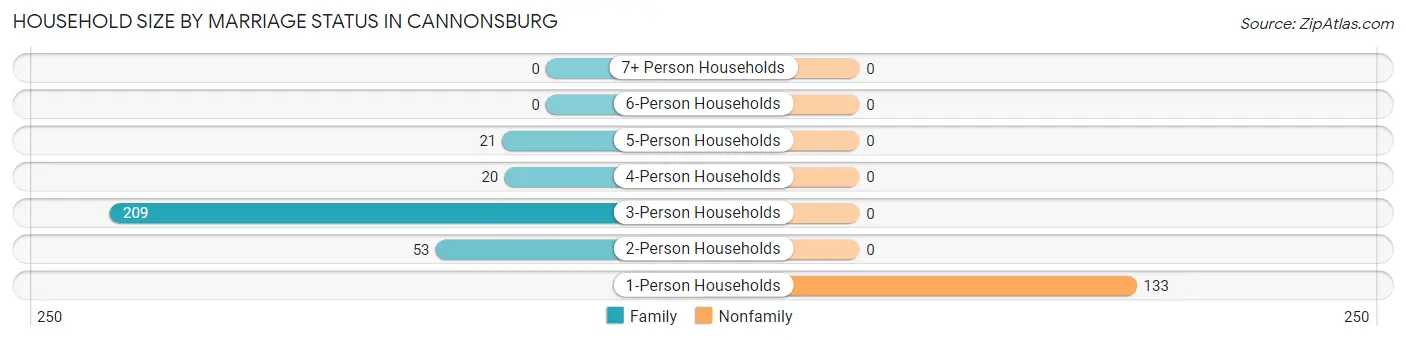
| Household Size | Family Households | Nonfamily Households |
| 1-Person Households | - | 133 (30.5%) |
| 2-Person Households | 53 (12.2%) | 0 (0.0%) |
| 3-Person Households | 209 (47.9%) | 0 (0.0%) |
| 4-Person Households | 20 (4.6%) | 0 (0.0%) |
| 5-Person Households | 21 (4.8%) | 0 (0.0%) |
| 6-Person Households | 0 (0.0%) | 0 (0.0%) |
| 7+ Person Households | 0 (0.0%) | 0 (0.0%) |
| Total | 303 (69.5%) | 133 (30.5%) |
Female Fertility in Cannonsburg
Fertility by Age in Cannonsburg
Average fertility rate in Cannonsburg is 535.0 births per 1,000 women. Women in the age bracket of 20 to 34 years have the highest fertility rate with 837.0 births per 1,000 women. Women in the age bracket of 20 to 34 years acount for 100.0% of all women with births.
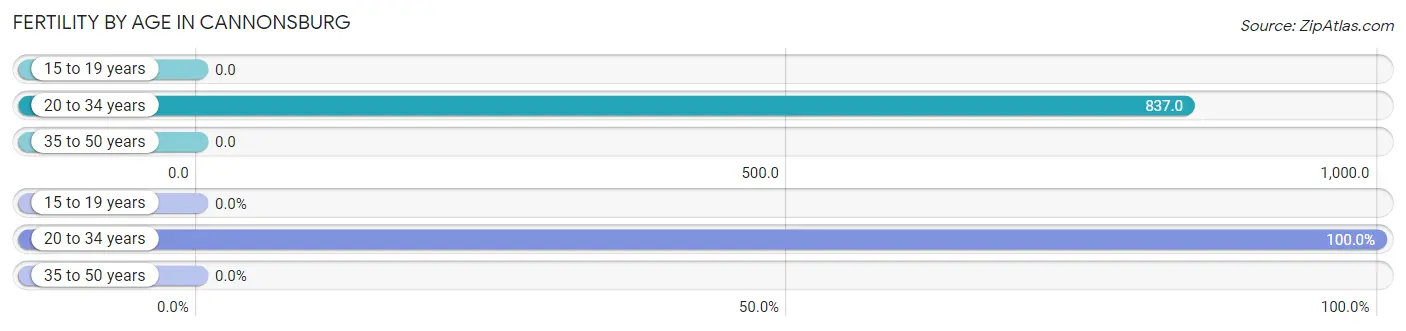
| Age Bracket | Women with Births | Births / 1,000 Women |
| 15 to 19 years | 0 (0.0%) | 0.0 |
| 20 to 34 years | 108 (100.0%) | 837.0 |
| 35 to 50 years | 0 (0.0%) | 0.0 |
| Total | 108 (100.0%) | 535.0 |
Fertility by Age by Marriage Status in Cannonsburg
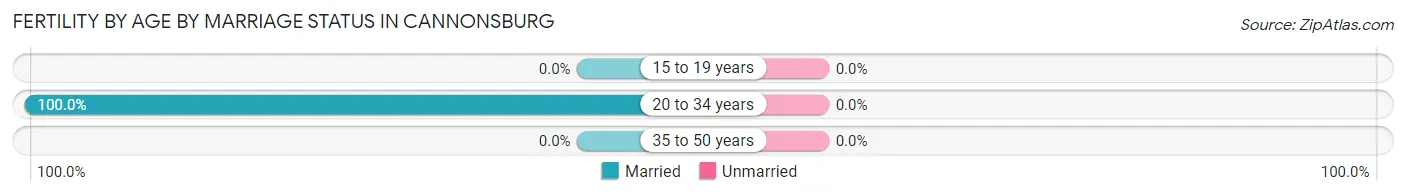
| Age Bracket | Married | Unmarried |
| 15 to 19 years | 0 (0.0%) | 0 (0.0%) |
| 20 to 34 years | 108 (100.0%) | 0 (0.0%) |
| 35 to 50 years | 0 (0.0%) | 0 (0.0%) |
| Total | 108 (100.0%) | 0 (0.0%) |
Fertility by Education in Cannonsburg
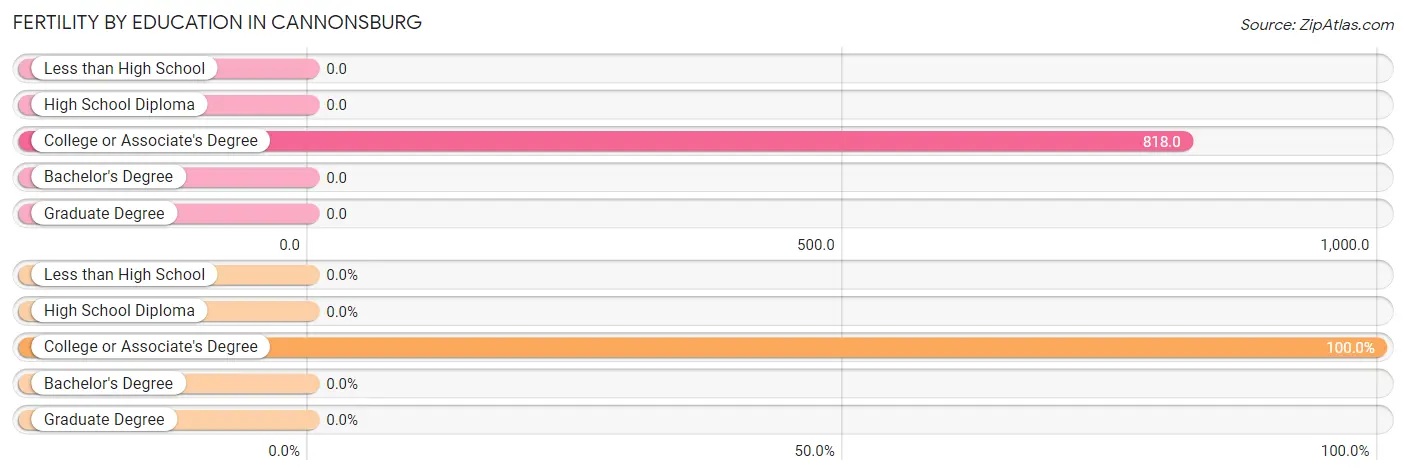
| Educational Attainment | Women with Births | Births / 1,000 Women |
| Less than High School | 0 (0.0%) | 0.0 |
| High School Diploma | 0 (0.0%) | 0.0 |
| College or Associate's Degree | 108 (100.0%) | 818.0 |
| Bachelor's Degree | 0 (0.0%) | 0.0 |
| Graduate Degree | 0 (0.0%) | 0.0 |
| Total | 108 (100.0%) | 535.0 |
Fertility by Education by Marriage Status in Cannonsburg
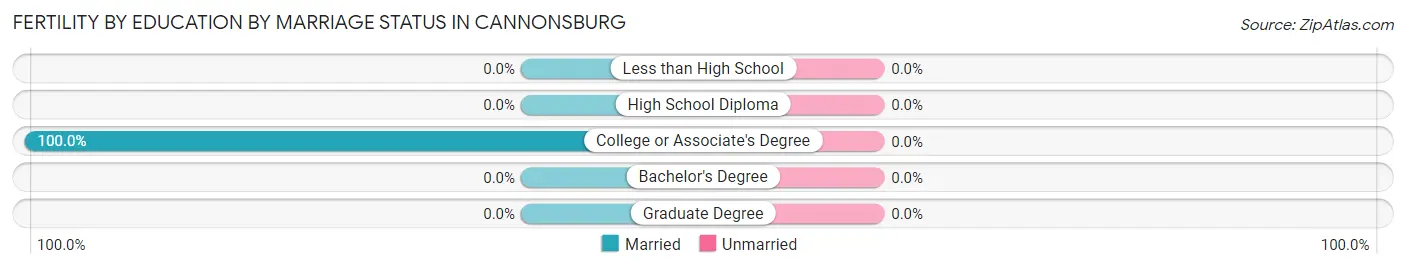
| Educational Attainment | Married | Unmarried |
| Less than High School | 0 (0.0%) | 0 (0.0%) |
| High School Diploma | 0 (0.0%) | 0 (0.0%) |
| College or Associate's Degree | 108 (100.0%) | 0 (0.0%) |
| Bachelor's Degree | 0 (0.0%) | 0 (0.0%) |
| Graduate Degree | 0 (0.0%) | 0 (0.0%) |
| Total | 108 (100.0%) | 0 (0.0%) |
Employment Characteristics in Cannonsburg
Employment by Class of Employer in Cannonsburg
Among the 513 employed individuals in Cannonsburg, private company employees (373 | 72.7%), not-for-profit organizations (75 | 14.6%), and local government employees (65 | 12.7%) make up the most common classes of employment.

| Employer Class | # Employees | % Employees |
| Private Company Employees | 373 | 72.7% |
| Self-Employed (Incorporated) | 0 | 0.0% |
| Self-Employed (Not Incorporated) | 0 | 0.0% |
| Not-for-profit Organizations | 75 | 14.6% |
| Local Government Employees | 65 | 12.7% |
| State Government Employees | 0 | 0.0% |
| Federal Government Employees | 0 | 0.0% |
| Unpaid Family Workers | 0 | 0.0% |
| Total | 513 | 100.0% |
Employment Status by Age in Cannonsburg
According to the labor force statistics for Cannonsburg, out of the total population over 16 years of age (675), 81.0% or 547 individuals are in the labor force, with 6.2% or 34 of them unemployed. The age group with the highest labor force participation rate is 25 to 29 years, with 100.0% or 228 individuals in the labor force. Within the labor force, the 30 to 34 years age range has the highest percentage of unemployed individuals, with 17.1% or 13 of them being unemployed.
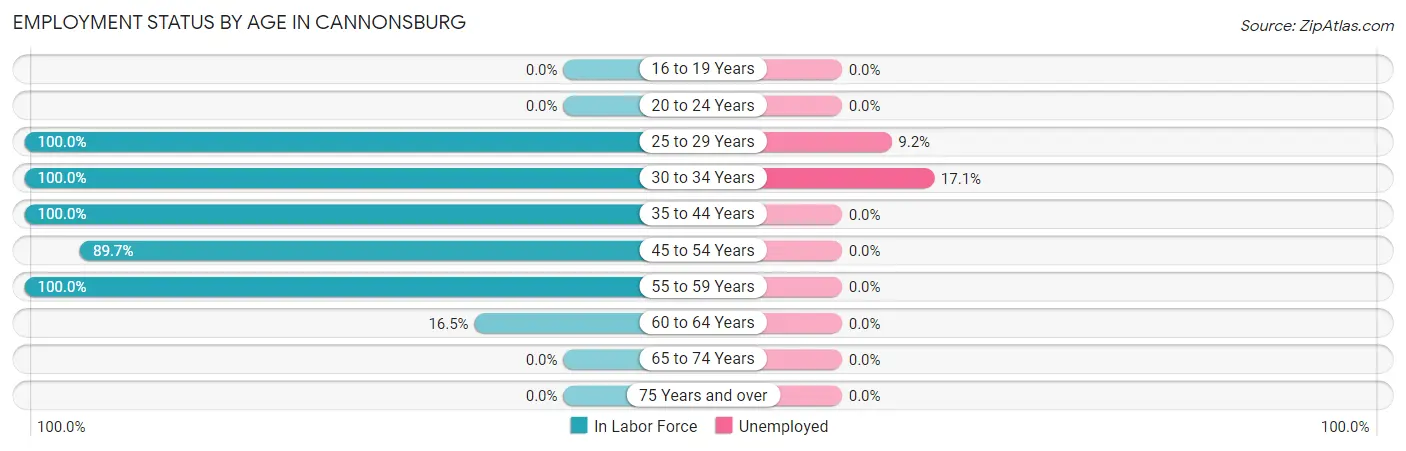
| Age Bracket | In Labor Force | Unemployed |
| 16 to 19 Years | 0 (0.0%) | 0 (0.0%) |
| 20 to 24 Years | 0 (0.0%) | 0 (0.0%) |
| 25 to 29 Years | 228 (100.0%) | 21 (9.2%) |
| 30 to 34 Years | 76 (100.0%) | 13 (17.1%) |
| 35 to 44 Years | 50 (100.0%) | 0 (0.0%) |
| 45 to 54 Years | 166 (89.7%) | 0 (0.0%) |
| 55 to 59 Years | 13 (100.0%) | 0 (0.0%) |
| 60 to 64 Years | 14 (16.5%) | 0 (0.0%) |
| 65 to 74 Years | 0 (0.0%) | 0 (0.0%) |
| 75 Years and over | 0 (0.0%) | 0 (0.0%) |
| Total | 547 (81.0%) | 34 (6.2%) |
Employment Status by Educational Attainment in Cannonsburg
According to labor force statistics for Cannonsburg, 85.9% of individuals (547) out of the total population between 25 and 64 years of age (637) are in the labor force, with 6.2% or 34 of them being unemployed. The group with the highest labor force participation rate are those with the educational attainment of less than high school, with 100.0% or 34 individuals in the labor force. Within the labor force, individuals with less than high school education have the highest percentage of unemployment, with 100.0% or 34 of them being unemployed.
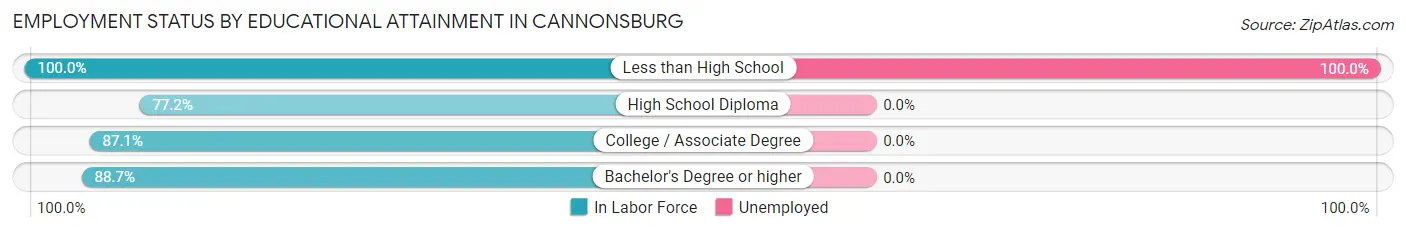
| Educational Attainment | In Labor Force | Unemployed |
| Less than High School | 34 (100.0%) | 34 (100.0%) |
| High School Diploma | 112 (77.2%) | 0 (0.0%) |
| College / Associate Degree | 283 (87.1%) | 0 (0.0%) |
| Bachelor's Degree or higher | 118 (88.7%) | 0 (0.0%) |
| Total | 547 (85.9%) | 39 (6.2%) |
Employment Occupations by Sex in Cannonsburg
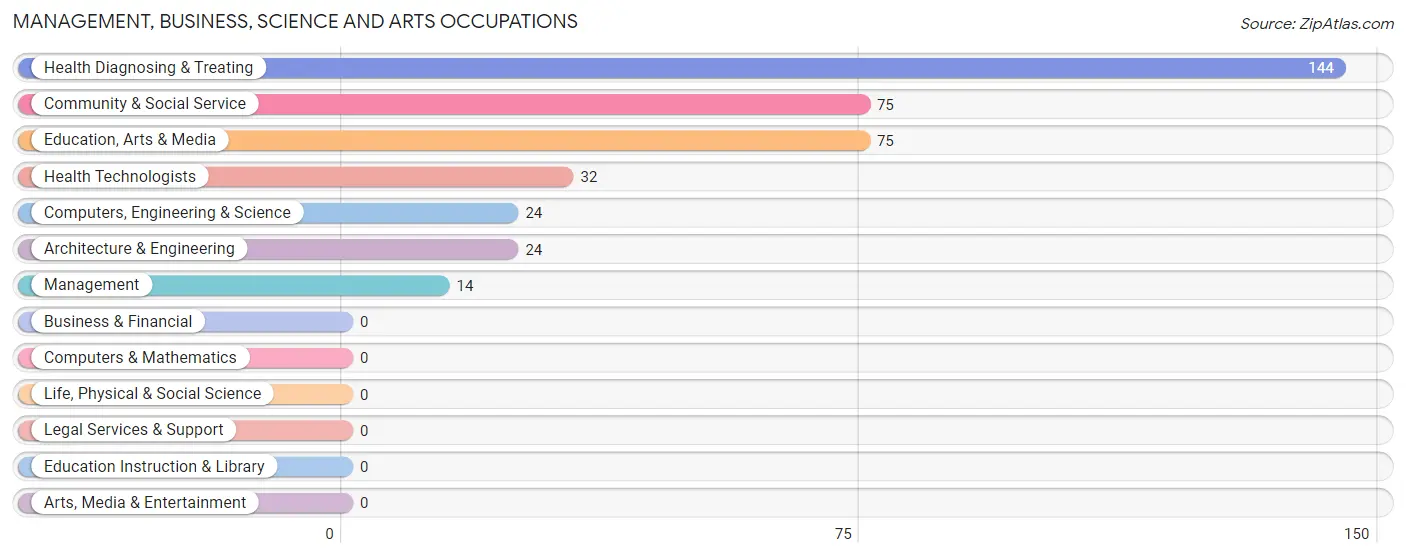
Management, Business, Science and Arts Occupations
The most common Management, Business, Science and Arts occupations in Cannonsburg are Health Diagnosing & Treating (144 | 28.1%), Community & Social Service (75 | 14.6%), Education, Arts & Media (75 | 14.6%), Health Technologists (32 | 6.2%), and Computers, Engineering & Science (24 | 4.7%).
Management, Business, Science and Arts Occupations by Sex
Within the Management, Business, Science and Arts occupations in Cannonsburg, the most male-oriented occupations are Management (100.0%), Computers, Engineering & Science (100.0%), and Architecture & Engineering (100.0%), while the most female-oriented occupations are Health Diagnosing & Treating (100.0%), Health Technologists (100.0%), and Community & Social Service (65.3%).
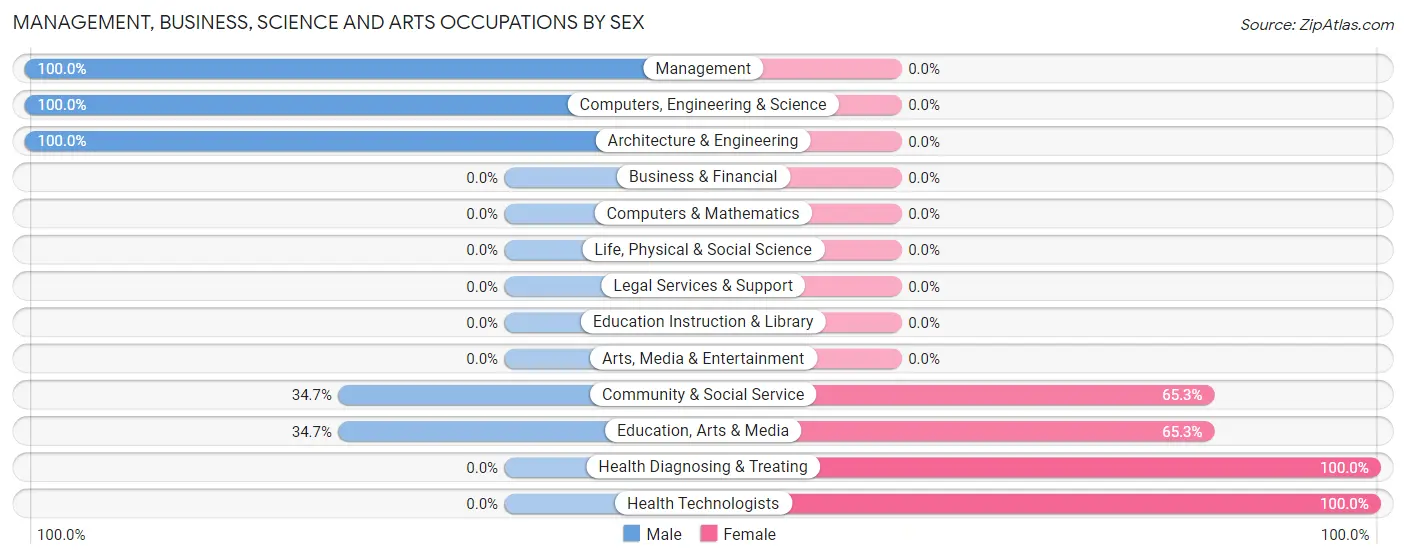
| Occupation | Male | Female |
| Management | 14 (100.0%) | 0 (0.0%) |
| Business & Financial | 0 (0.0%) | 0 (0.0%) |
| Computers, Engineering & Science | 24 (100.0%) | 0 (0.0%) |
| Computers & Mathematics | 0 (0.0%) | 0 (0.0%) |
| Architecture & Engineering | 24 (100.0%) | 0 (0.0%) |
| Life, Physical & Social Science | 0 (0.0%) | 0 (0.0%) |
| Community & Social Service | 26 (34.7%) | 49 (65.3%) |
| Education, Arts & Media | 26 (34.7%) | 49 (65.3%) |
| Legal Services & Support | 0 (0.0%) | 0 (0.0%) |
| Education Instruction & Library | 0 (0.0%) | 0 (0.0%) |
| Arts, Media & Entertainment | 0 (0.0%) | 0 (0.0%) |
| Health Diagnosing & Treating | 0 (0.0%) | 144 (100.0%) |
| Health Technologists | 0 (0.0%) | 32 (100.0%) |
| Total (Category) | 64 (24.9%) | 193 (75.1%) |
| Total (Overall) | 300 (58.5%) | 213 (41.5%) |
Services Occupations
The most common Services occupations in Cannonsburg are Healthcare Support (75 | 14.6%), Security & Protection (45 | 8.8%), and Law Enforcement (45 | 8.8%).
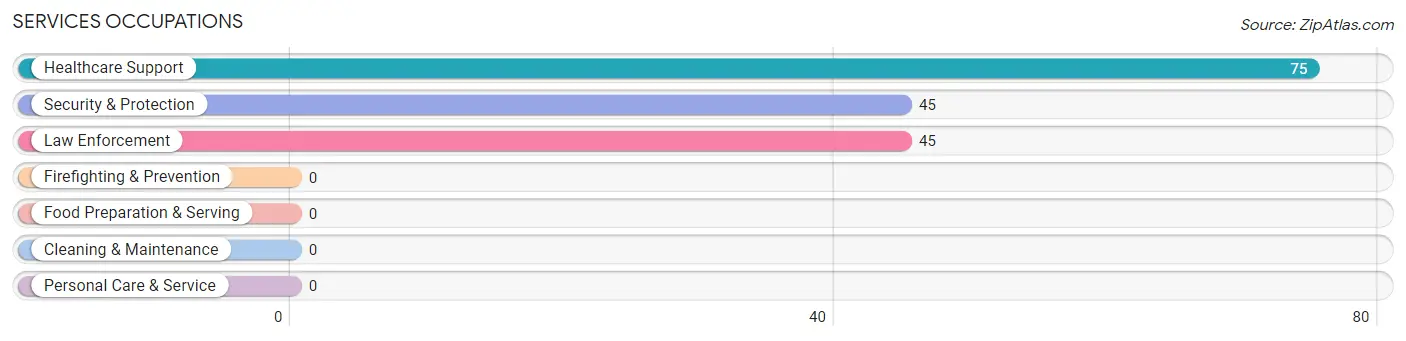
Services Occupations by Sex
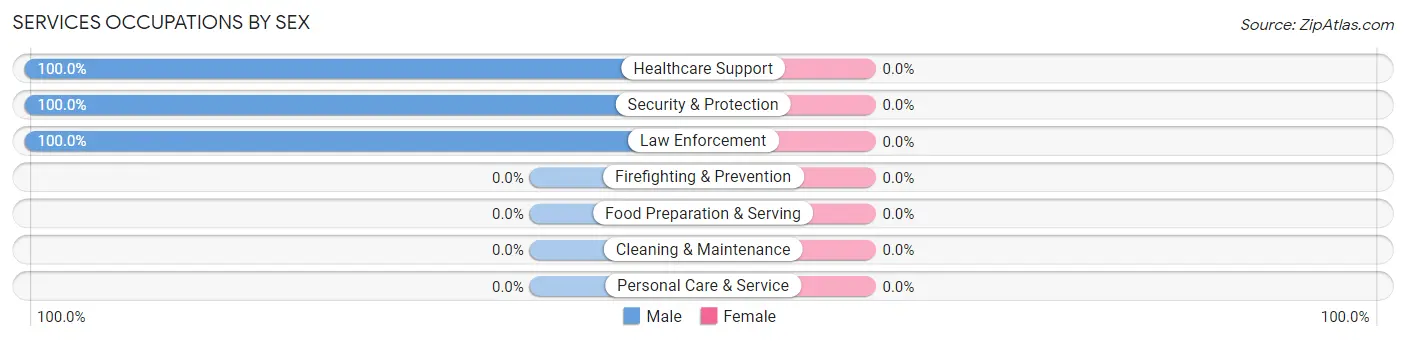
| Occupation | Male | Female |
| Healthcare Support | 75 (100.0%) | 0 (0.0%) |
| Security & Protection | 45 (100.0%) | 0 (0.0%) |
| Firefighting & Prevention | 0 (0.0%) | 0 (0.0%) |
| Law Enforcement | 45 (100.0%) | 0 (0.0%) |
| Food Preparation & Serving | 0 (0.0%) | 0 (0.0%) |
| Cleaning & Maintenance | 0 (0.0%) | 0 (0.0%) |
| Personal Care & Service | 0 (0.0%) | 0 (0.0%) |
| Total (Category) | 120 (100.0%) | 0 (0.0%) |
| Total (Overall) | 300 (58.5%) | 213 (41.5%) |
Sales and Office Occupations
The most common Sales and Office occupations in Cannonsburg are , and Office & Administration (20 | 3.9%).
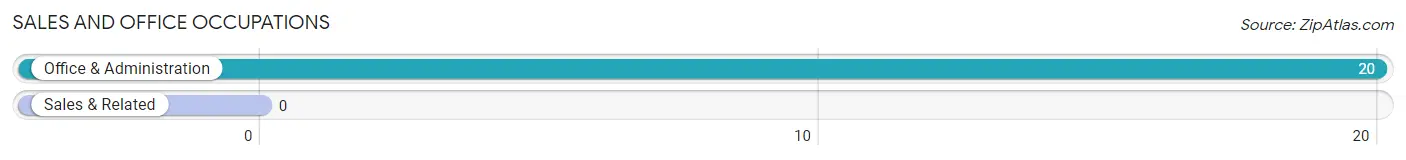
Sales and Office Occupations by Sex
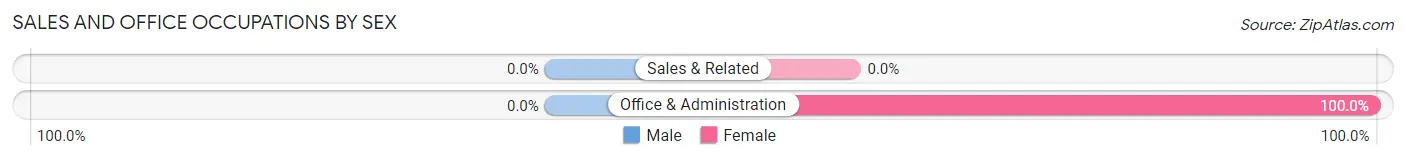
| Occupation | Male | Female |
| Sales & Related | 0 (0.0%) | 0 (0.0%) |
| Office & Administration | 0 (0.0%) | 20 (100.0%) |
| Total (Category) | 0 (0.0%) | 20 (100.0%) |
| Total (Overall) | 300 (58.5%) | 213 (41.5%) |
Natural Resources, Construction and Maintenance Occupations
The most common Natural Resources, Construction and Maintenance occupations in Cannonsburg are , and Installation, Maintenance & Repair (18 | 3.5%).
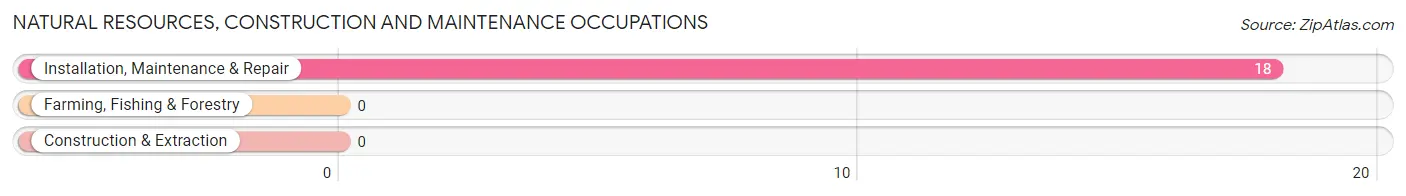
Natural Resources, Construction and Maintenance Occupations by Sex
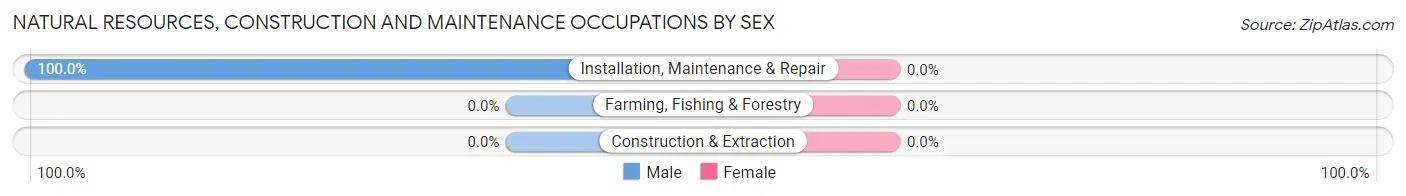
| Occupation | Male | Female |
| Farming, Fishing & Forestry | 0 (0.0%) | 0 (0.0%) |
| Construction & Extraction | 0 (0.0%) | 0 (0.0%) |
| Installation, Maintenance & Repair | 18 (100.0%) | 0 (0.0%) |
| Total (Category) | 18 (100.0%) | 0 (0.0%) |
| Total (Overall) | 300 (58.5%) | 213 (41.5%) |
Production, Transportation and Moving Occupations
The most common Production, Transportation and Moving occupations in Cannonsburg are Production (85 | 16.6%), and Material Moving (13 | 2.5%).
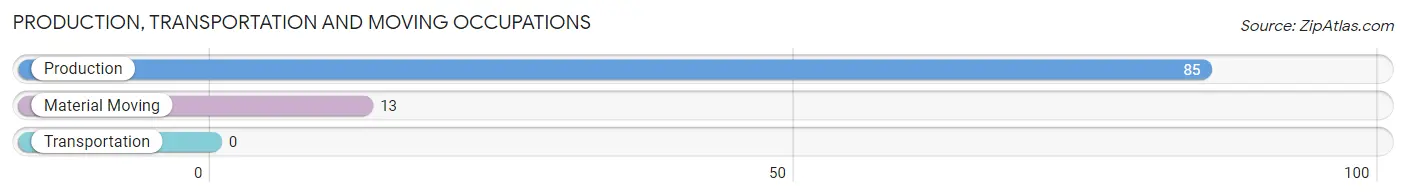
Production, Transportation and Moving Occupations by Sex
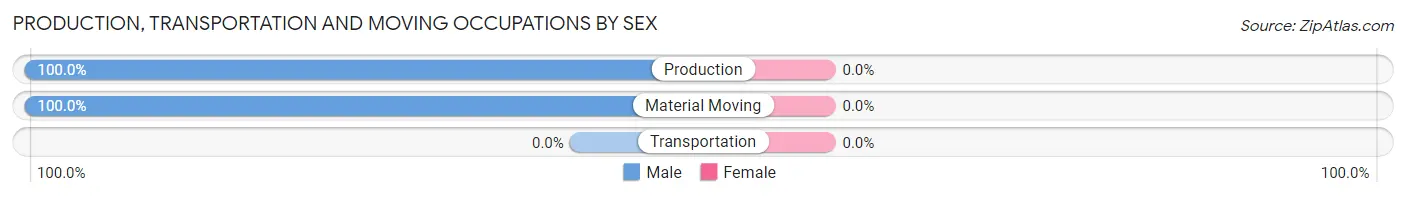
| Occupation | Male | Female |
| Production | 85 (100.0%) | 0 (0.0%) |
| Transportation | 0 (0.0%) | 0 (0.0%) |
| Material Moving | 13 (100.0%) | 0 (0.0%) |
| Total (Category) | 98 (100.0%) | 0 (0.0%) |
| Total (Overall) | 300 (58.5%) | 213 (41.5%) |
Employment Industries by Sex in Cannonsburg
Employment Industries in Cannonsburg
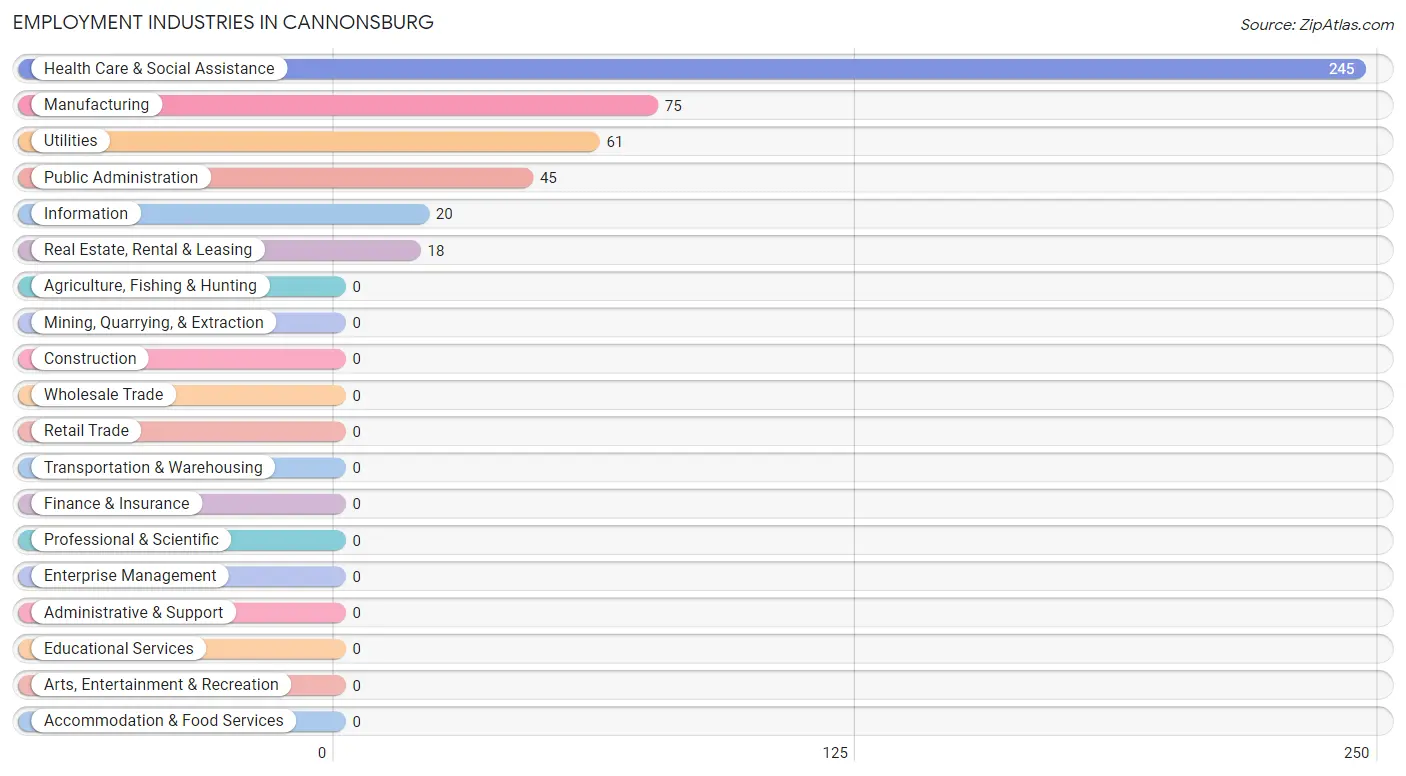
The major employment industries in Cannonsburg include Health Care & Social Assistance (245 | 47.8%), Manufacturing (75 | 14.6%), Utilities (61 | 11.9%), Public Administration (45 | 8.8%), and Information (20 | 3.9%).
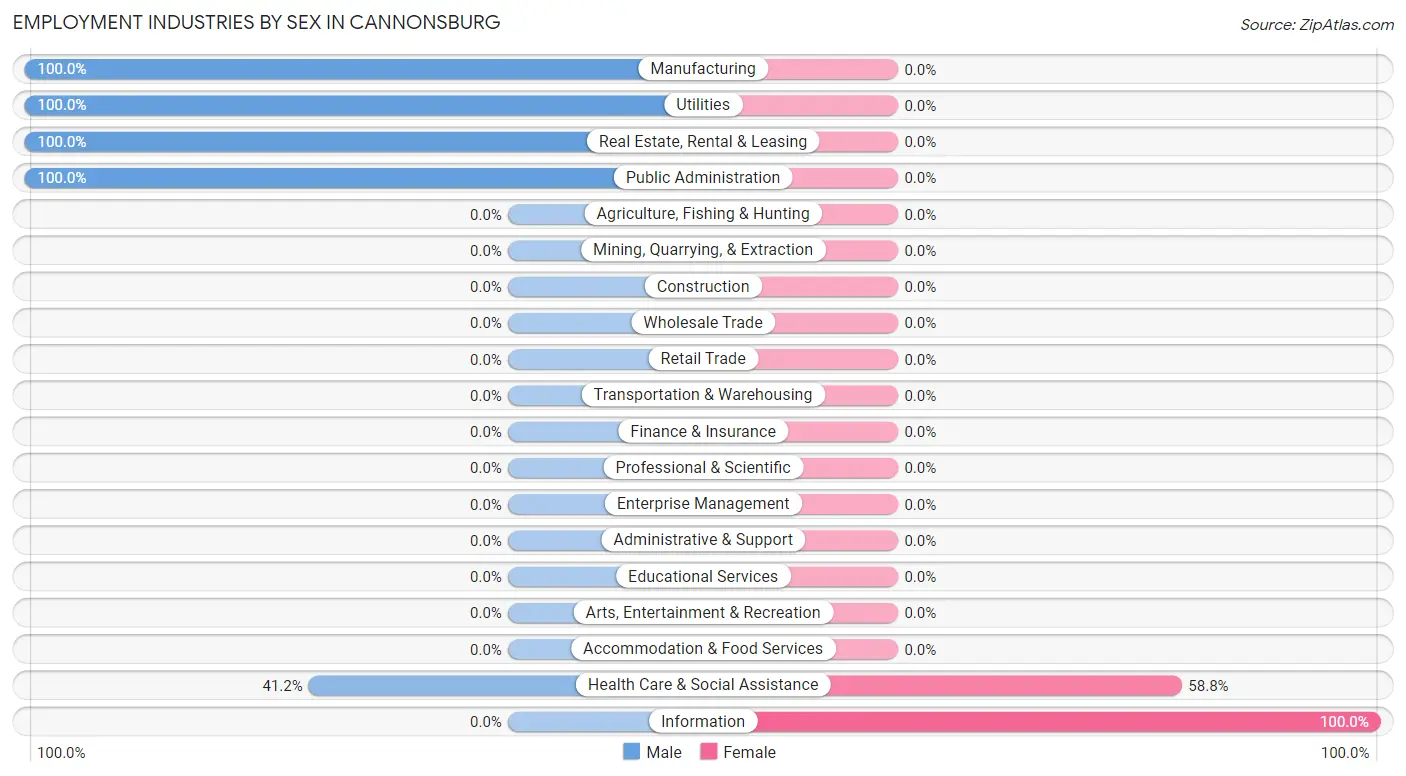
Employment Industries by Sex in Cannonsburg
The Cannonsburg industries that see more men than women are Manufacturing (100.0%), Utilities (100.0%), and Real Estate, Rental & Leasing (100.0%), whereas the industries that tend to have a higher number of women are Information (100.0%), and Health Care & Social Assistance (58.8%).
| Industry | Male | Female |
| Agriculture, Fishing & Hunting | 0 (0.0%) | 0 (0.0%) |
| Mining, Quarrying, & Extraction | 0 (0.0%) | 0 (0.0%) |
| Construction | 0 (0.0%) | 0 (0.0%) |
| Manufacturing | 75 (100.0%) | 0 (0.0%) |
| Wholesale Trade | 0 (0.0%) | 0 (0.0%) |
| Retail Trade | 0 (0.0%) | 0 (0.0%) |
| Transportation & Warehousing | 0 (0.0%) | 0 (0.0%) |
| Utilities | 61 (100.0%) | 0 (0.0%) |
| Information | 0 (0.0%) | 20 (100.0%) |
| Finance & Insurance | 0 (0.0%) | 0 (0.0%) |
| Real Estate, Rental & Leasing | 18 (100.0%) | 0 (0.0%) |
| Professional & Scientific | 0 (0.0%) | 0 (0.0%) |
| Enterprise Management | 0 (0.0%) | 0 (0.0%) |
| Administrative & Support | 0 (0.0%) | 0 (0.0%) |
| Educational Services | 0 (0.0%) | 0 (0.0%) |
| Health Care & Social Assistance | 101 (41.2%) | 144 (58.8%) |
| Arts, Entertainment & Recreation | 0 (0.0%) | 0 (0.0%) |
| Accommodation & Food Services | 0 (0.0%) | 0 (0.0%) |
| Public Administration | 45 (100.0%) | 0 (0.0%) |
| Total | 300 (58.5%) | 213 (41.5%) |
Education in Cannonsburg
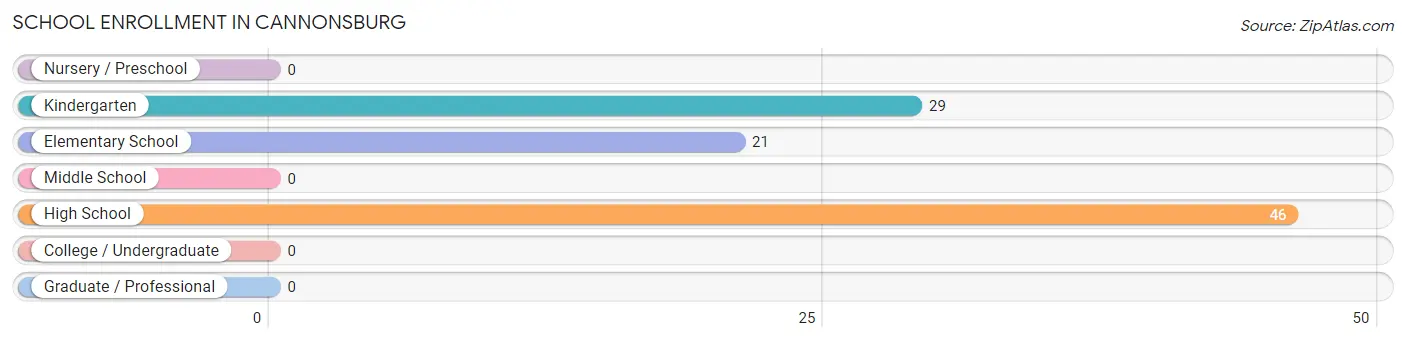
School Enrollment in Cannonsburg
The most common levels of schooling among the 96 students in Cannonsburg are high school (46 | 47.9%), kindergarten (29 | 30.2%), and elementary school (21 | 21.9%).
| School Level | # Students | % Students |
| Nursery / Preschool | 0 | 0.0% |
| Kindergarten | 29 | 30.2% |
| Elementary School | 21 | 21.9% |
| Middle School | 0 | 0.0% |
| High School | 46 | 47.9% |
| College / Undergraduate | 0 | 0.0% |
| Graduate / Professional | 0 | 0.0% |
| Total | 96 | 100.0% |
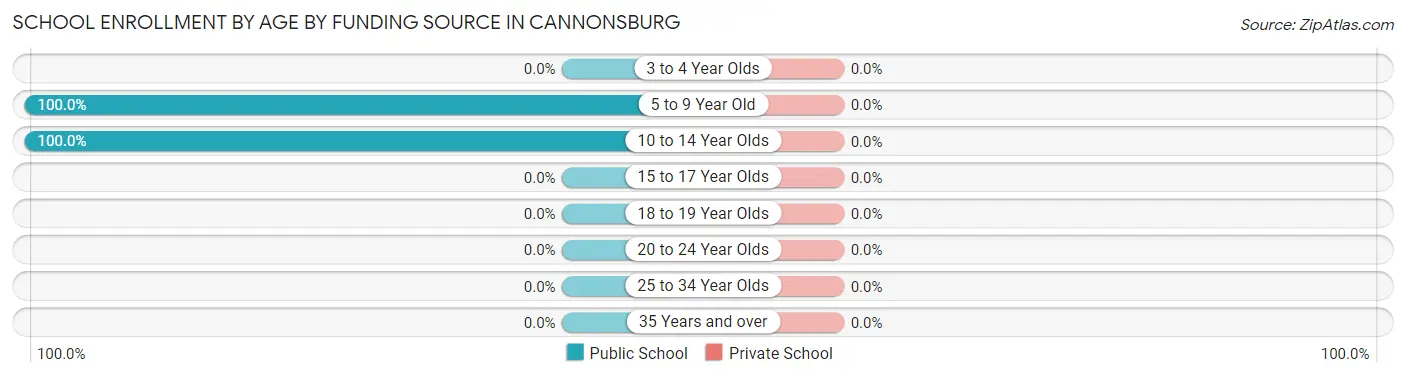
School Enrollment by Age by Funding Source in Cannonsburg
| Age Bracket | Public School | Private School |
| 3 to 4 Year Olds | 0 (0.0%) | 0 (0.0%) |
| 5 to 9 Year Old | 50 (100.0%) | 0 (0.0%) |
| 10 to 14 Year Olds | 46 (100.0%) | 0 (0.0%) |
| 15 to 17 Year Olds | 0 (0.0%) | 0 (0.0%) |
| 18 to 19 Year Olds | 0 (0.0%) | 0 (0.0%) |
| 20 to 24 Year Olds | 0 (0.0%) | 0 (0.0%) |
| 25 to 34 Year Olds | 0 (0.0%) | 0 (0.0%) |
| 35 Years and over | 0 (0.0%) | 0 (0.0%) |
| Total | 96 (100.0%) | 0 (0.0%) |
Educational Attainment by Field of Study in Cannonsburg
Science & technology (63 | 35.6%), business (45 | 25.4%), engineering (24 | 13.6%), bio, nature & agricultural (15 | 8.5%), and physical & health sciences (15 | 8.5%) are the most common fields of study among 177 individuals in Cannonsburg who have obtained a bachelor's degree or higher.
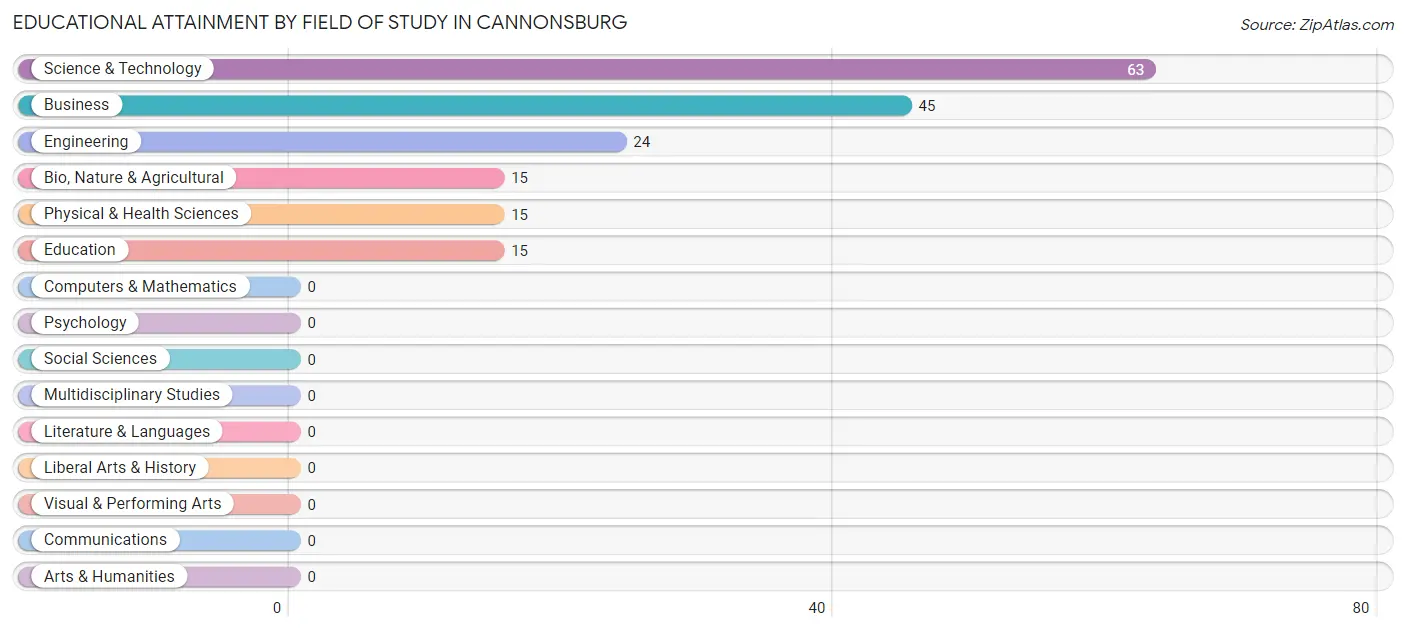
| Field of Study | # Graduates | % Graduates |
| Computers & Mathematics | 0 | 0.0% |
| Bio, Nature & Agricultural | 15 | 8.5% |
| Physical & Health Sciences | 15 | 8.5% |
| Psychology | 0 | 0.0% |
| Social Sciences | 0 | 0.0% |
| Engineering | 24 | 13.6% |
| Multidisciplinary Studies | 0 | 0.0% |
| Science & Technology | 63 | 35.6% |
| Business | 45 | 25.4% |
| Education | 15 | 8.5% |
| Literature & Languages | 0 | 0.0% |
| Liberal Arts & History | 0 | 0.0% |
| Visual & Performing Arts | 0 | 0.0% |
| Communications | 0 | 0.0% |
| Arts & Humanities | 0 | 0.0% |
| Total | 177 | 100.0% |
Transportation & Commute in Cannonsburg
Vehicle Availability by Sex in Cannonsburg
The most prevalent vehicle ownership categories in Cannonsburg are males with 2 vehicles (160, accounting for 53.3%) and females with 2 vehicles (137, making up 75.1%).
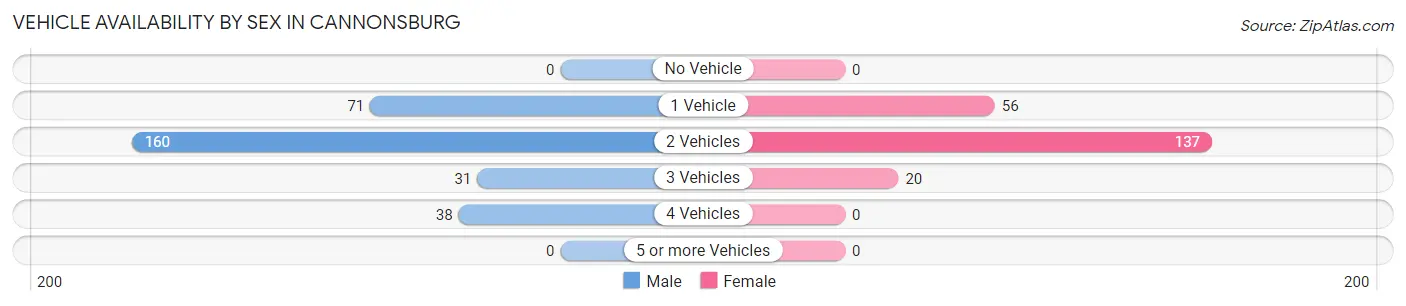
| Vehicles Available | Male | Female |
| No Vehicle | 0 (0.0%) | 0 (0.0%) |
| 1 Vehicle | 71 (23.7%) | 56 (26.3%) |
| 2 Vehicles | 160 (53.3%) | 137 (64.3%) |
| 3 Vehicles | 31 (10.3%) | 20 (9.4%) |
| 4 Vehicles | 38 (12.7%) | 0 (0.0%) |
| 5 or more Vehicles | 0 (0.0%) | 0 (0.0%) |
| Total | 300 (100.0%) | 213 (100.0%) |
Commute Time in Cannonsburg
The most frequently occuring commute durations in Cannonsburg are 20 to 24 minutes (240 commuters, 46.8%), 30 to 34 minutes (93 commuters, 18.1%), and 10 to 14 minutes (75 commuters, 14.6%).
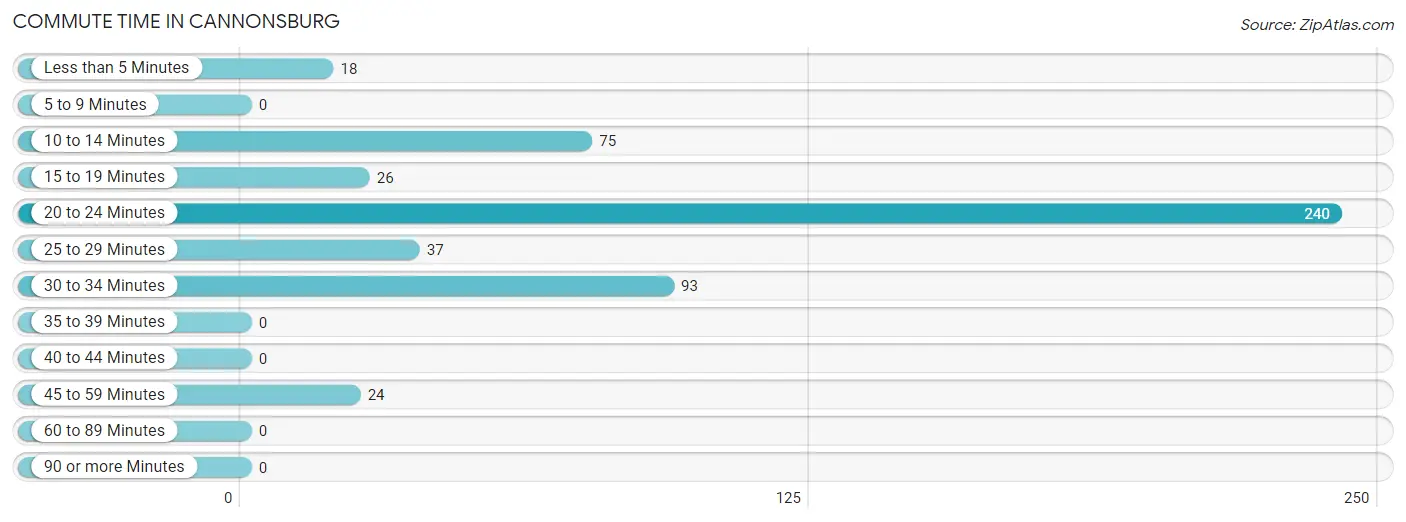
| Commute Time | # Commuters | % Commuters |
| Less than 5 Minutes | 18 | 3.5% |
| 5 to 9 Minutes | 0 | 0.0% |
| 10 to 14 Minutes | 75 | 14.6% |
| 15 to 19 Minutes | 26 | 5.1% |
| 20 to 24 Minutes | 240 | 46.8% |
| 25 to 29 Minutes | 37 | 7.2% |
| 30 to 34 Minutes | 93 | 18.1% |
| 35 to 39 Minutes | 0 | 0.0% |
| 40 to 44 Minutes | 0 | 0.0% |
| 45 to 59 Minutes | 24 | 4.7% |
| 60 to 89 Minutes | 0 | 0.0% |
| 90 or more Minutes | 0 | 0.0% |
Commute Time by Sex in Cannonsburg
The most common commute times in Cannonsburg are 20 to 24 minutes (83 commuters, 27.7%) for males and 20 to 24 minutes (157 commuters, 73.7%) for females.
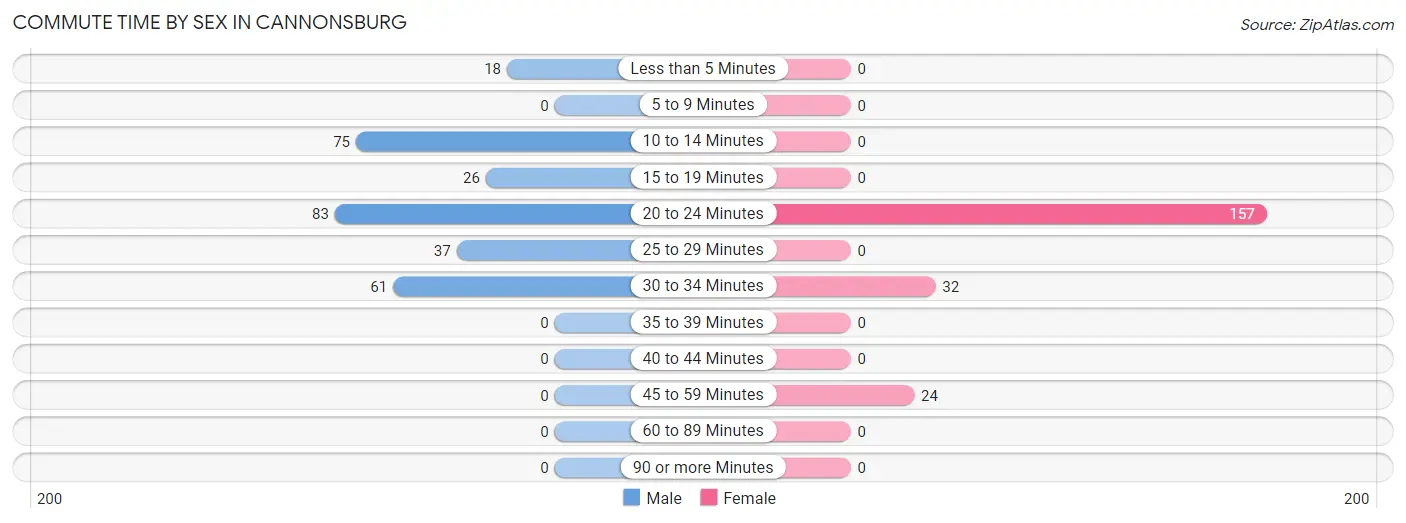
| Commute Time | Male | Female |
| Less than 5 Minutes | 18 (6.0%) | 0 (0.0%) |
| 5 to 9 Minutes | 0 (0.0%) | 0 (0.0%) |
| 10 to 14 Minutes | 75 (25.0%) | 0 (0.0%) |
| 15 to 19 Minutes | 26 (8.7%) | 0 (0.0%) |
| 20 to 24 Minutes | 83 (27.7%) | 157 (73.7%) |
| 25 to 29 Minutes | 37 (12.3%) | 0 (0.0%) |
| 30 to 34 Minutes | 61 (20.3%) | 32 (15.0%) |
| 35 to 39 Minutes | 0 (0.0%) | 0 (0.0%) |
| 40 to 44 Minutes | 0 (0.0%) | 0 (0.0%) |
| 45 to 59 Minutes | 0 (0.0%) | 24 (11.3%) |
| 60 to 89 Minutes | 0 (0.0%) | 0 (0.0%) |
| 90 or more Minutes | 0 (0.0%) | 0 (0.0%) |
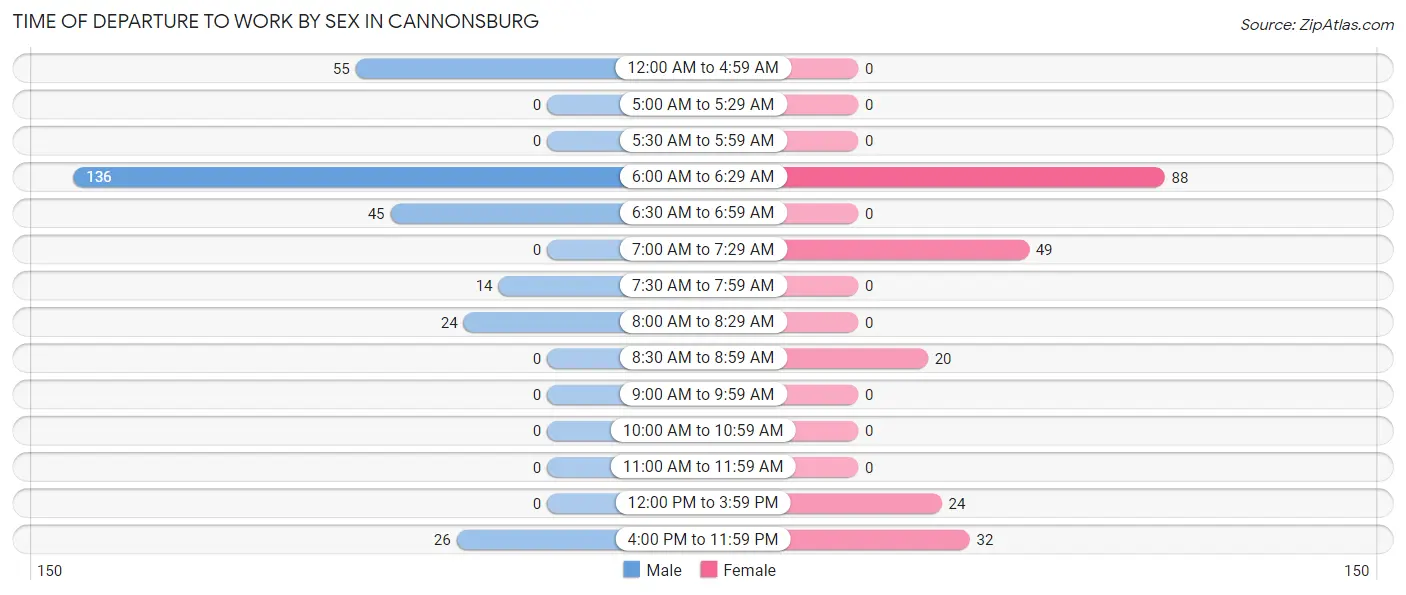
Time of Departure to Work by Sex in Cannonsburg
The most frequent times of departure to work in Cannonsburg are 6:00 AM to 6:29 AM (136, 45.3%) for males and 6:00 AM to 6:29 AM (88, 41.3%) for females.
| Time of Departure | Male | Female |
| 12:00 AM to 4:59 AM | 55 (18.3%) | 0 (0.0%) |
| 5:00 AM to 5:29 AM | 0 (0.0%) | 0 (0.0%) |
| 5:30 AM to 5:59 AM | 0 (0.0%) | 0 (0.0%) |
| 6:00 AM to 6:29 AM | 136 (45.3%) | 88 (41.3%) |
| 6:30 AM to 6:59 AM | 45 (15.0%) | 0 (0.0%) |
| 7:00 AM to 7:29 AM | 0 (0.0%) | 49 (23.0%) |
| 7:30 AM to 7:59 AM | 14 (4.7%) | 0 (0.0%) |
| 8:00 AM to 8:29 AM | 24 (8.0%) | 0 (0.0%) |
| 8:30 AM to 8:59 AM | 0 (0.0%) | 20 (9.4%) |
| 9:00 AM to 9:59 AM | 0 (0.0%) | 0 (0.0%) |
| 10:00 AM to 10:59 AM | 0 (0.0%) | 0 (0.0%) |
| 11:00 AM to 11:59 AM | 0 (0.0%) | 0 (0.0%) |
| 12:00 PM to 3:59 PM | 0 (0.0%) | 24 (11.3%) |
| 4:00 PM to 11:59 PM | 26 (8.7%) | 32 (15.0%) |
| Total | 300 (100.0%) | 213 (100.0%) |
Housing Occupancy in Cannonsburg
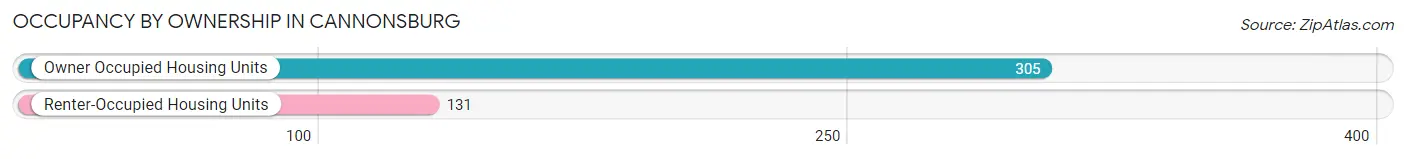
Occupancy by Ownership in Cannonsburg
Of the total 436 dwellings in Cannonsburg, owner-occupied units account for 305 (70.0%), while renter-occupied units make up 131 (30.0%).
| Occupancy | # Housing Units | % Housing Units |
| Owner Occupied Housing Units | 305 | 70.0% |
| Renter-Occupied Housing Units | 131 | 30.0% |
| Total Occupied Housing Units | 436 | 100.0% |
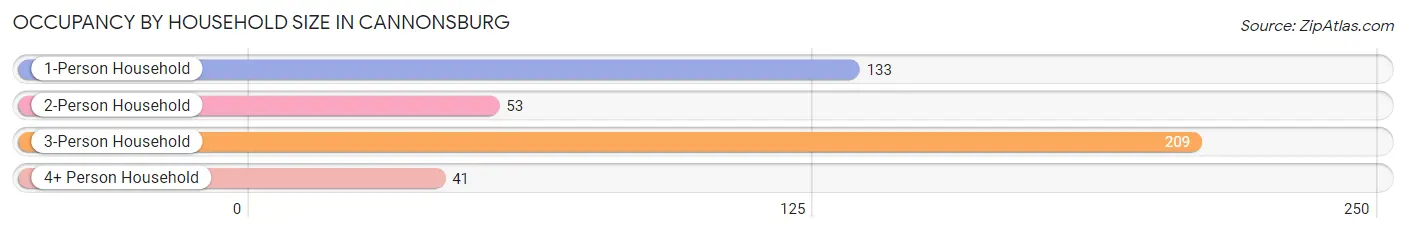
Occupancy by Household Size in Cannonsburg
| Household Size | # Housing Units | % Housing Units |
| 1-Person Household | 133 | 30.5% |
| 2-Person Household | 53 | 12.2% |
| 3-Person Household | 209 | 47.9% |
| 4+ Person Household | 41 | 9.4% |
| Total Housing Units | 436 | 100.0% |
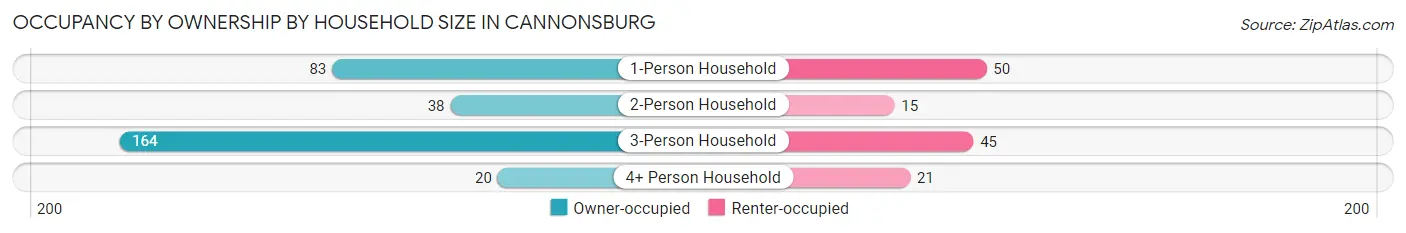
Occupancy by Ownership by Household Size in Cannonsburg
| Household Size | Owner-occupied | Renter-occupied |
| 1-Person Household | 83 (62.4%) | 50 (37.6%) |
| 2-Person Household | 38 (71.7%) | 15 (28.3%) |
| 3-Person Household | 164 (78.5%) | 45 (21.5%) |
| 4+ Person Household | 20 (48.8%) | 21 (51.2%) |
| Total Housing Units | 305 (70.0%) | 131 (30.0%) |
Occupancy by Educational Attainment in Cannonsburg
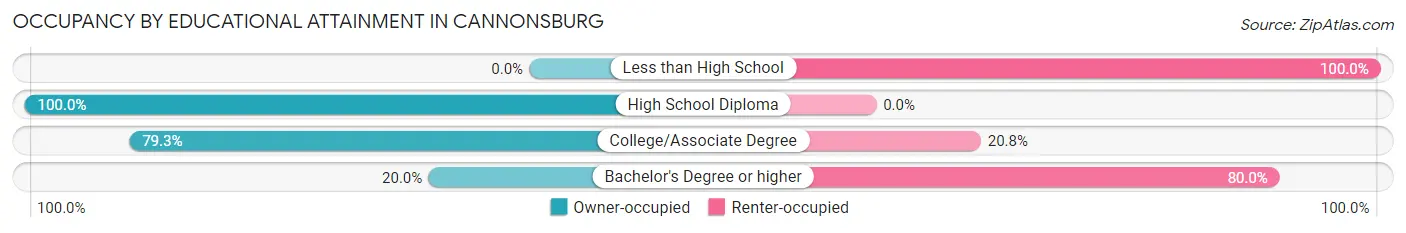
| Household Size | Owner-occupied | Renter-occupied |
| Less than High School | 0 (0.0%) | 21 (100.0%) |
| High School Diploma | 99 (100.0%) | 0 (0.0%) |
| College/Associate Degree | 191 (79.2%) | 50 (20.7%) |
| Bachelor's Degree or higher | 15 (20.0%) | 60 (80.0%) |
Occupancy by Age of Householder in Cannonsburg
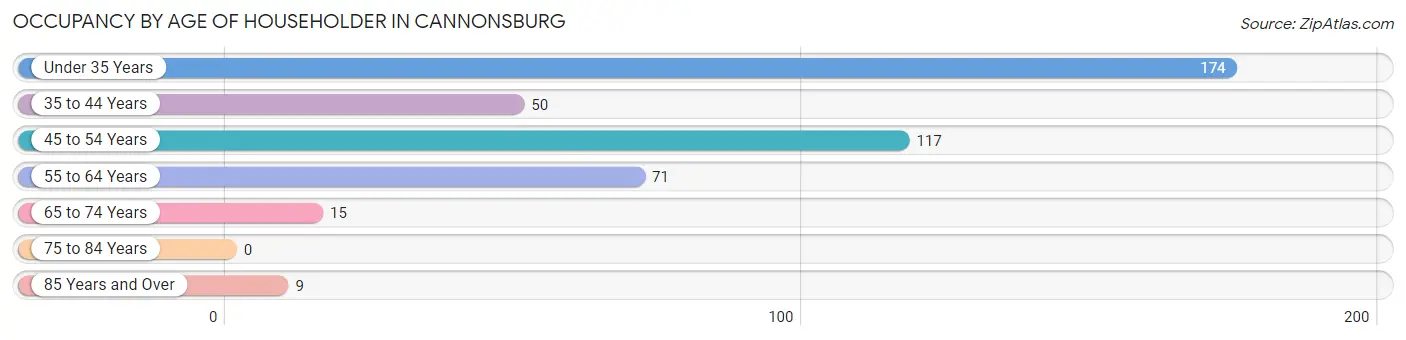
| Age Bracket | # Households | % Households |
| Under 35 Years | 174 | 39.9% |
| 35 to 44 Years | 50 | 11.5% |
| 45 to 54 Years | 117 | 26.8% |
| 55 to 64 Years | 71 | 16.3% |
| 65 to 74 Years | 15 | 3.4% |
| 75 to 84 Years | 0 | 0.0% |
| 85 Years and Over | 9 | 2.1% |
| Total | 436 | 100.0% |
Housing Finances in Cannonsburg
Median Income by Occupancy in Cannonsburg
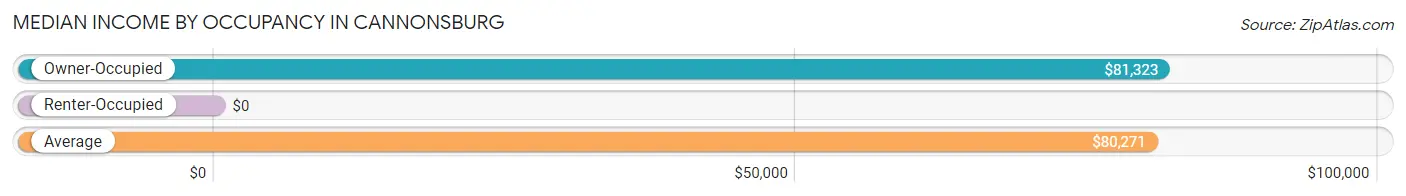
| Occupancy Type | # Households | Median Income |
| Owner-Occupied | 305 (70.0%) | $81,323 |
| Renter-Occupied | 131 (30.0%) | $0 |
| Average | 436 (100.0%) | $80,271 |
Occupancy by Householder Income Bracket in Cannonsburg
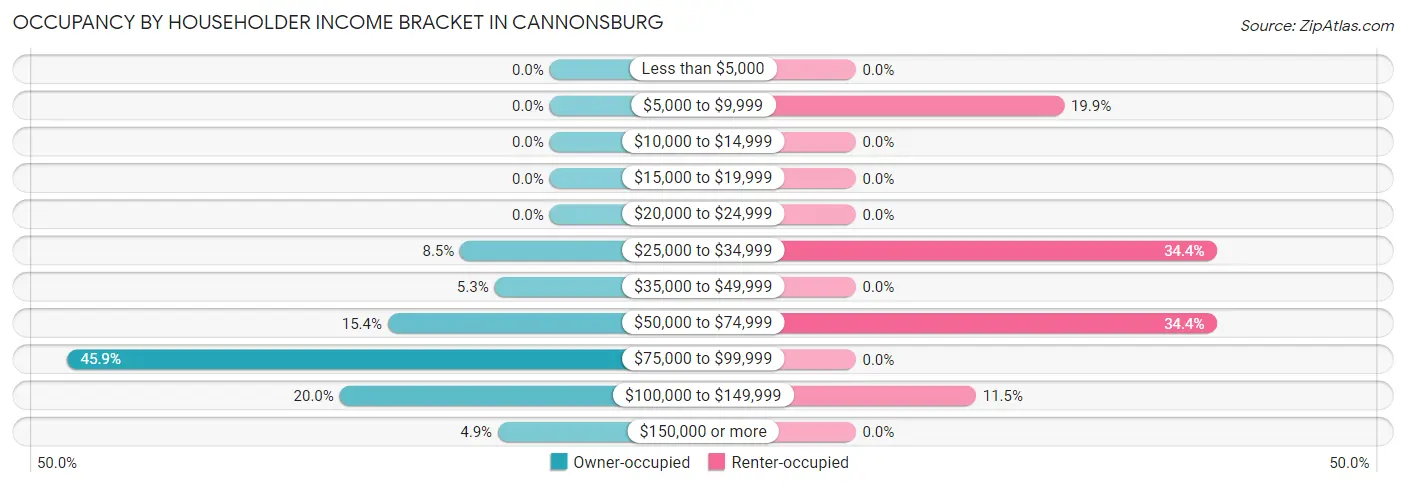
| Income Bracket | Owner-occupied | Renter-occupied |
| Less than $5,000 | 0 (0.0%) | 0 (0.0%) |
| $5,000 to $9,999 | 0 (0.0%) | 26 (19.9%) |
| $10,000 to $14,999 | 0 (0.0%) | 0 (0.0%) |
| $15,000 to $19,999 | 0 (0.0%) | 0 (0.0%) |
| $20,000 to $24,999 | 0 (0.0%) | 0 (0.0%) |
| $25,000 to $34,999 | 26 (8.5%) | 45 (34.4%) |
| $35,000 to $49,999 | 16 (5.2%) | 0 (0.0%) |
| $50,000 to $74,999 | 47 (15.4%) | 45 (34.4%) |
| $75,000 to $99,999 | 140 (45.9%) | 0 (0.0%) |
| $100,000 to $149,999 | 61 (20.0%) | 15 (11.5%) |
| $150,000 or more | 15 (4.9%) | 0 (0.0%) |
| Total | 305 (100.0%) | 131 (100.0%) |
Monthly Housing Cost Tiers in Cannonsburg
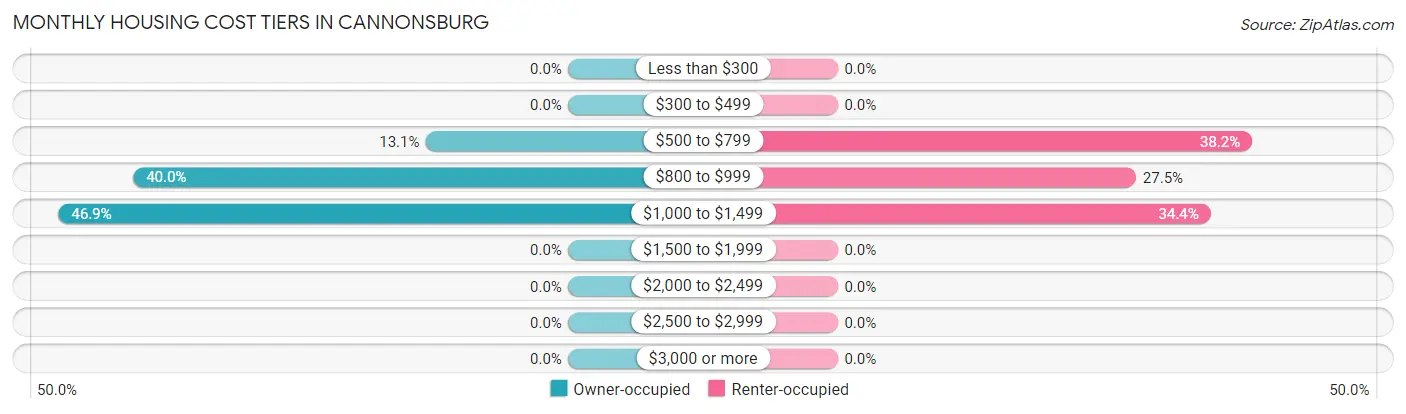
| Monthly Cost | Owner-occupied | Renter-occupied |
| Less than $300 | 0 (0.0%) | 0 (0.0%) |
| $300 to $499 | 0 (0.0%) | 0 (0.0%) |
| $500 to $799 | 40 (13.1%) | 50 (38.2%) |
| $800 to $999 | 122 (40.0%) | 36 (27.5%) |
| $1,000 to $1,499 | 143 (46.9%) | 45 (34.4%) |
| $1,500 to $1,999 | 0 (0.0%) | 0 (0.0%) |
| $2,000 to $2,499 | 0 (0.0%) | 0 (0.0%) |
| $2,500 to $2,999 | 0 (0.0%) | 0 (0.0%) |
| $3,000 or more | 0 (0.0%) | 0 (0.0%) |
| Total | 305 (100.0%) | 131 (100.0%) |
Physical Housing Characteristics in Cannonsburg
Housing Structures in Cannonsburg
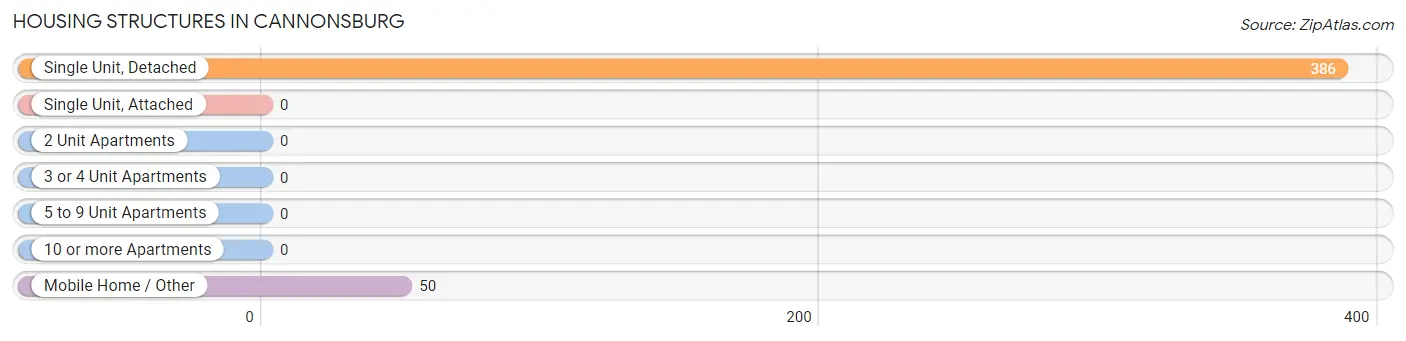
| Structure Type | # Housing Units | % Housing Units |
| Single Unit, Detached | 386 | 88.5% |
| Single Unit, Attached | 0 | 0.0% |
| 2 Unit Apartments | 0 | 0.0% |
| 3 or 4 Unit Apartments | 0 | 0.0% |
| 5 to 9 Unit Apartments | 0 | 0.0% |
| 10 or more Apartments | 0 | 0.0% |
| Mobile Home / Other | 50 | 11.5% |
| Total | 436 | 100.0% |
Housing Structures by Occupancy in Cannonsburg
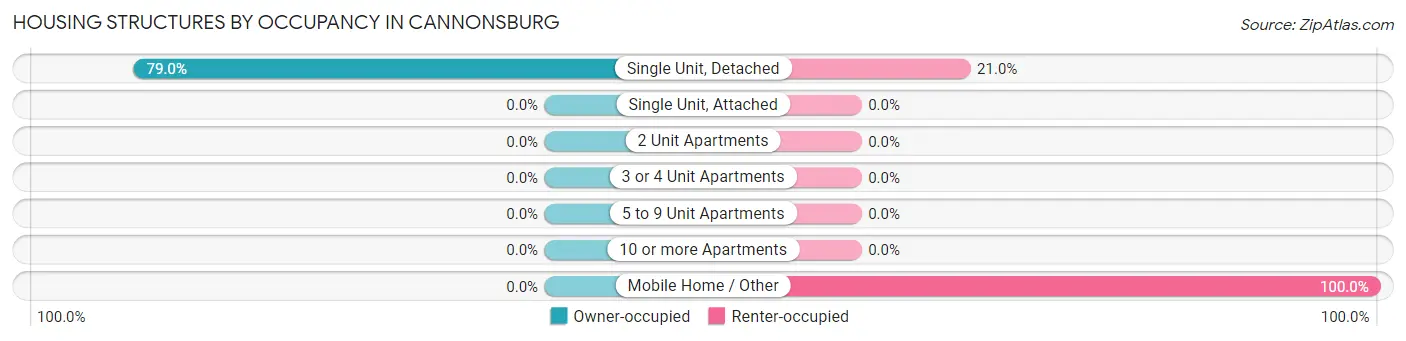
| Structure Type | Owner-occupied | Renter-occupied |
| Single Unit, Detached | 305 (79.0%) | 81 (21.0%) |
| Single Unit, Attached | 0 (0.0%) | 0 (0.0%) |
| 2 Unit Apartments | 0 (0.0%) | 0 (0.0%) |
| 3 or 4 Unit Apartments | 0 (0.0%) | 0 (0.0%) |
| 5 to 9 Unit Apartments | 0 (0.0%) | 0 (0.0%) |
| 10 or more Apartments | 0 (0.0%) | 0 (0.0%) |
| Mobile Home / Other | 0 (0.0%) | 50 (100.0%) |
| Total | 305 (70.0%) | 131 (30.0%) |
Housing Structures by Number of Rooms in Cannonsburg
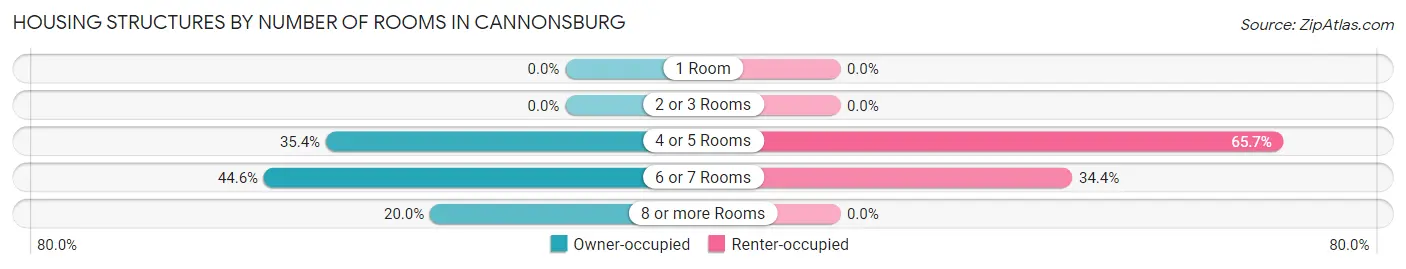
| Number of Rooms | Owner-occupied | Renter-occupied |
| 1 Room | 0 (0.0%) | 0 (0.0%) |
| 2 or 3 Rooms | 0 (0.0%) | 0 (0.0%) |
| 4 or 5 Rooms | 108 (35.4%) | 86 (65.6%) |
| 6 or 7 Rooms | 136 (44.6%) | 45 (34.4%) |
| 8 or more Rooms | 61 (20.0%) | 0 (0.0%) |
| Total | 305 (100.0%) | 131 (100.0%) |
Housing Structure by Heating Type in Cannonsburg
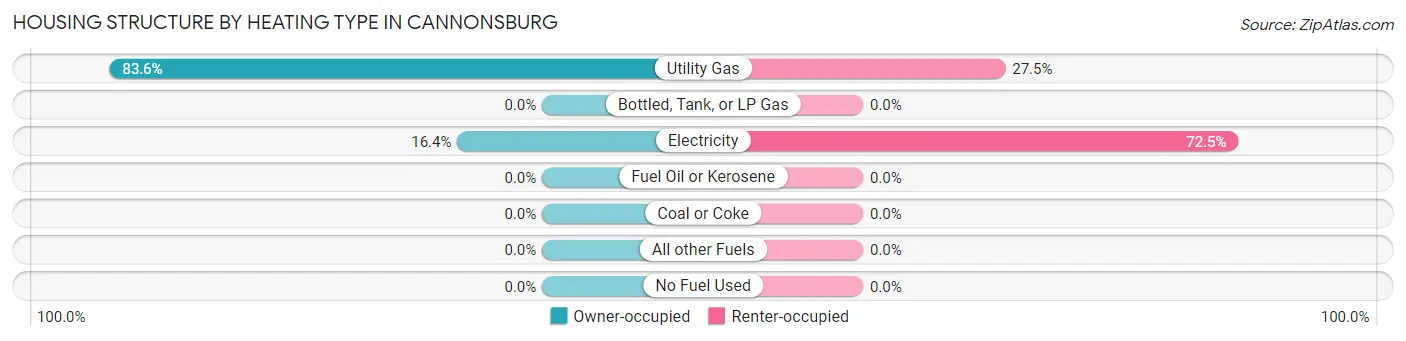
| Heating Type | Owner-occupied | Renter-occupied |
| Utility Gas | 255 (83.6%) | 36 (27.5%) |
| Bottled, Tank, or LP Gas | 0 (0.0%) | 0 (0.0%) |
| Electricity | 50 (16.4%) | 95 (72.5%) |
| Fuel Oil or Kerosene | 0 (0.0%) | 0 (0.0%) |
| Coal or Coke | 0 (0.0%) | 0 (0.0%) |
| All other Fuels | 0 (0.0%) | 0 (0.0%) |
| No Fuel Used | 0 (0.0%) | 0 (0.0%) |
| Total | 305 (100.0%) | 131 (100.0%) |
Household Vehicle Usage in Cannonsburg
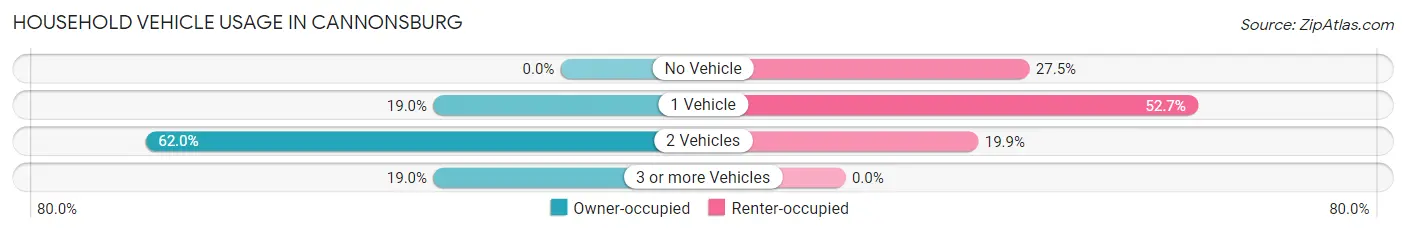
| Vehicles per Household | Owner-occupied | Renter-occupied |
| No Vehicle | 0 (0.0%) | 36 (27.5%) |
| 1 Vehicle | 58 (19.0%) | 69 (52.7%) |
| 2 Vehicles | 189 (62.0%) | 26 (19.9%) |
| 3 or more Vehicles | 58 (19.0%) | 0 (0.0%) |
| Total | 305 (100.0%) | 131 (100.0%) |
Real Estate & Mortgages in Cannonsburg
Real Estate and Mortgage Overview in Cannonsburg
| Characteristic | Without Mortgage | With Mortgage |
| Housing Units | 40 | 265 |
| Median Property Value | $157,800 | $181,100 |
| Median Household Income | - | - |
| Monthly Housing Costs | $680 | $0 |
| Real Estate Taxes | $2,167 | $0 |
Property Value by Mortgage Status in Cannonsburg
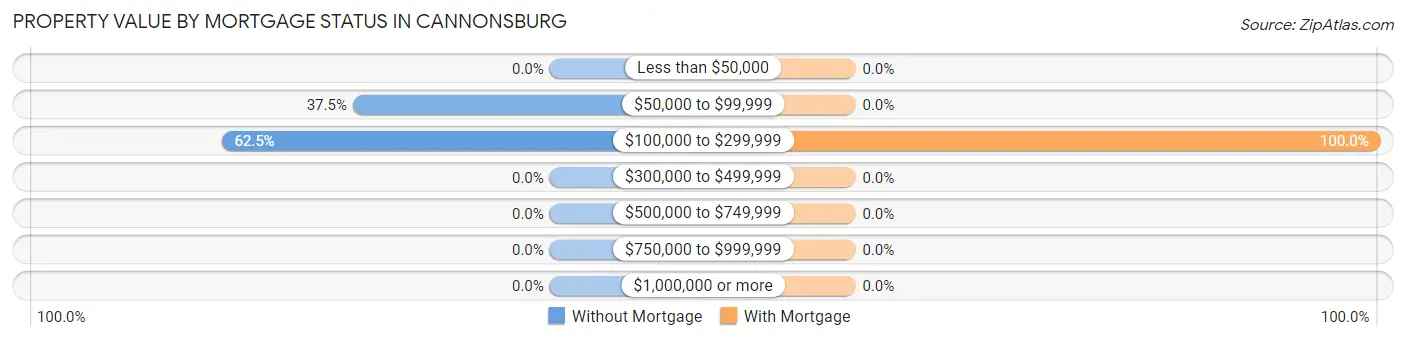
| Property Value | Without Mortgage | With Mortgage |
| Less than $50,000 | 0 (0.0%) | 0 (0.0%) |
| $50,000 to $99,999 | 15 (37.5%) | 0 (0.0%) |
| $100,000 to $299,999 | 25 (62.5%) | 265 (100.0%) |
| $300,000 to $499,999 | 0 (0.0%) | 0 (0.0%) |
| $500,000 to $749,999 | 0 (0.0%) | 0 (0.0%) |
| $750,000 to $999,999 | 0 (0.0%) | 0 (0.0%) |
| $1,000,000 or more | 0 (0.0%) | 0 (0.0%) |
| Total | 40 (100.0%) | 265 (100.0%) |
Household Income by Mortgage Status in Cannonsburg
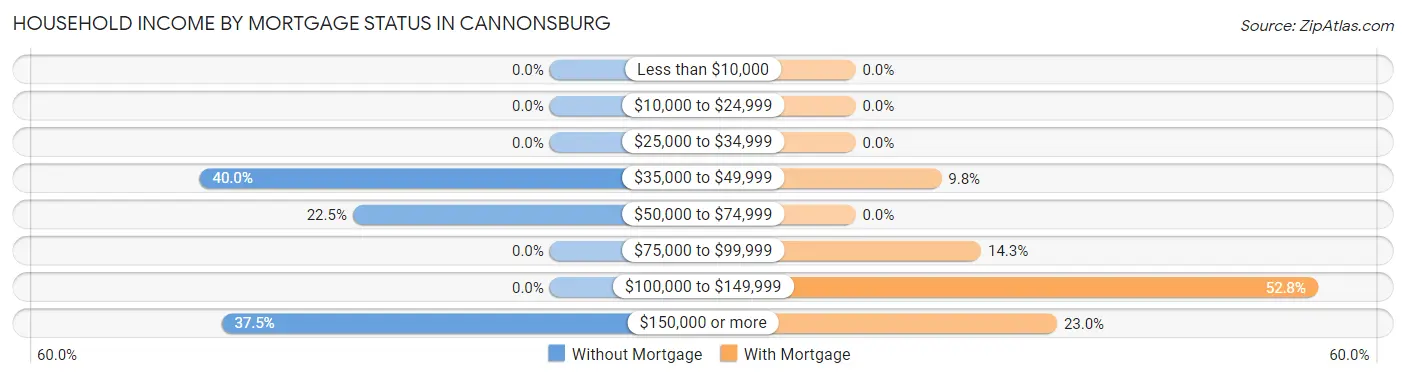
| Household Income | Without Mortgage | With Mortgage |
| Less than $10,000 | 0 (0.0%) | 0 (0.0%) |
| $10,000 to $24,999 | 0 (0.0%) | 0 (0.0%) |
| $25,000 to $34,999 | 0 (0.0%) | 0 (0.0%) |
| $35,000 to $49,999 | 16 (40.0%) | 26 (9.8%) |
| $50,000 to $74,999 | 9 (22.5%) | 0 (0.0%) |
| $75,000 to $99,999 | 0 (0.0%) | 38 (14.3%) |
| $100,000 to $149,999 | 0 (0.0%) | 140 (52.8%) |
| $150,000 or more | 15 (37.5%) | 61 (23.0%) |
| Total | 40 (100.0%) | 265 (100.0%) |
Property Value to Household Income Ratio in Cannonsburg
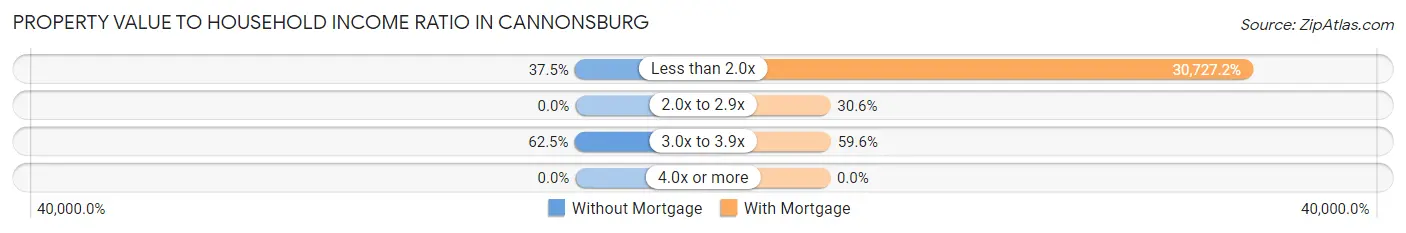
| Value-to-Income Ratio | Without Mortgage | With Mortgage |
| Less than 2.0x | 15 (37.5%) | 81,427 (30,727.2%) |
| 2.0x to 2.9x | 0 (0.0%) | 81 (30.6%) |
| 3.0x to 3.9x | 25 (62.5%) | 158 (59.6%) |
| 4.0x or more | 0 (0.0%) | 0 (0.0%) |
| Total | 40 (100.0%) | 265 (100.0%) |
Real Estate Taxes by Mortgage Status in Cannonsburg
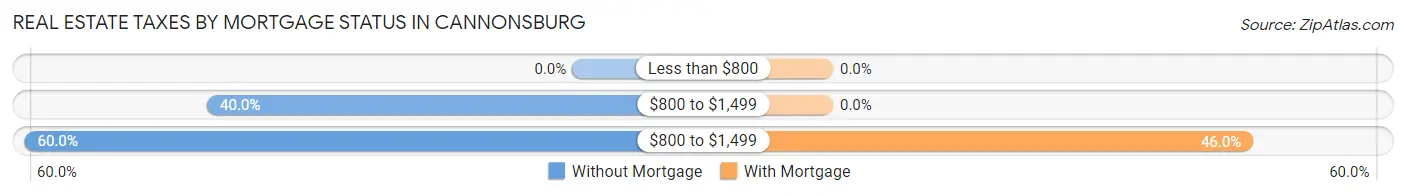
| Property Taxes | Without Mortgage | With Mortgage |
| Less than $800 | 0 (0.0%) | 0 (0.0%) |
| $800 to $1,499 | 16 (40.0%) | 0 (0.0%) |
| $800 to $1,499 | 24 (60.0%) | 122 (46.0%) |
| Total | 40 (100.0%) | 265 (100.0%) |
Health & Disability in Cannonsburg
Health Insurance Coverage by Age in Cannonsburg
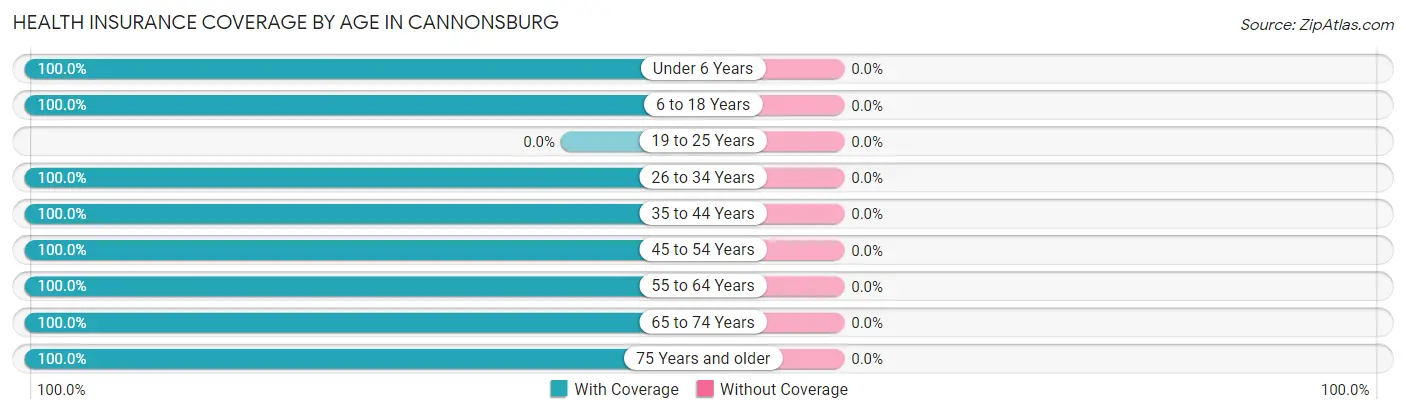
| Age Bracket | With Coverage | Without Coverage |
| Under 6 Years | 290 (100.0%) | 0 (0.0%) |
| 6 to 18 Years | 67 (100.0%) | 0 (0.0%) |
| 19 to 25 Years | 0 (0.0%) | 0 (0.0%) |
| 26 to 34 Years | 304 (100.0%) | 0 (0.0%) |
| 35 to 44 Years | 50 (100.0%) | 0 (0.0%) |
| 45 to 54 Years | 185 (100.0%) | 0 (0.0%) |
| 55 to 64 Years | 98 (100.0%) | 0 (0.0%) |
| 65 to 74 Years | 29 (100.0%) | 0 (0.0%) |
| 75 Years and older | 9 (100.0%) | 0 (0.0%) |
| Total | 1,032 (100.0%) | 0 (0.0%) |
Health Insurance Coverage by Citizenship Status in Cannonsburg
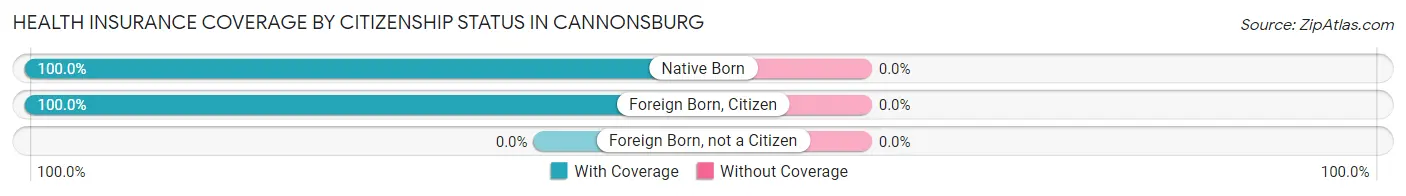
| Citizenship Status | With Coverage | Without Coverage |
| Native Born | 290 (100.0%) | 0 (0.0%) |
| Foreign Born, Citizen | 67 (100.0%) | 0 (0.0%) |
| Foreign Born, not a Citizen | 0 (0.0%) | 0 (0.0%) |
Health Insurance Coverage by Household Income in Cannonsburg
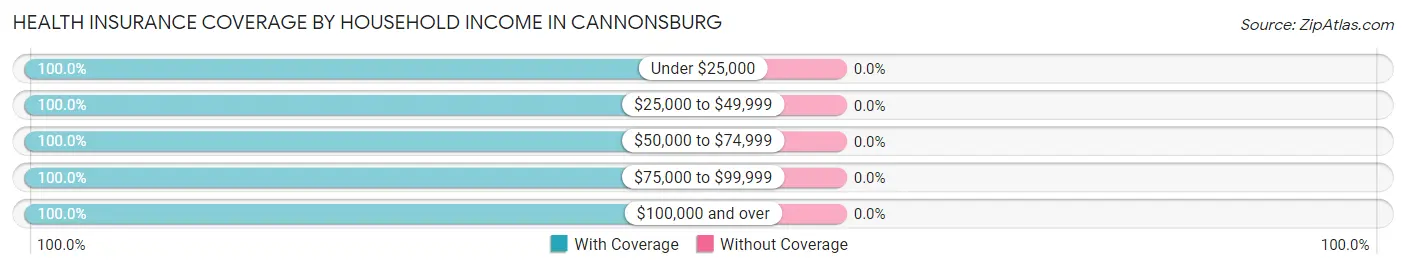
| Household Income | With Coverage | Without Coverage |
| Under $25,000 | 26 (100.0%) | 0 (0.0%) |
| $25,000 to $49,999 | 157 (100.0%) | 0 (0.0%) |
| $50,000 to $74,999 | 254 (100.0%) | 0 (0.0%) |
| $75,000 to $99,999 | 357 (100.0%) | 0 (0.0%) |
| $100,000 and over | 238 (100.0%) | 0 (0.0%) |
Public vs Private Health Insurance Coverage by Age in Cannonsburg
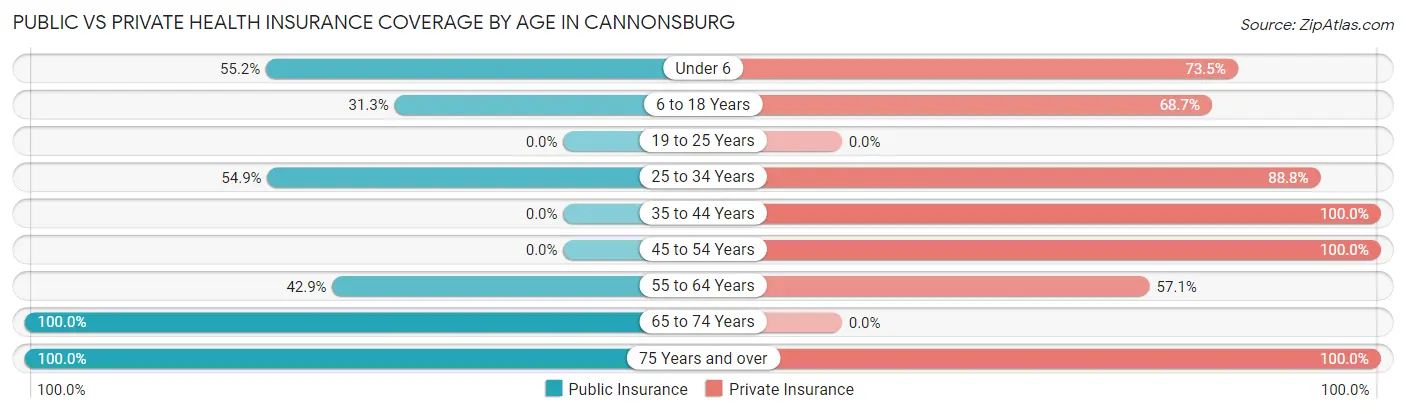
| Age Bracket | Public Insurance | Private Insurance |
| Under 6 | 160 (55.2%) | 213 (73.5%) |
| 6 to 18 Years | 21 (31.3%) | 46 (68.7%) |
| 19 to 25 Years | 0 (0.0%) | 0 (0.0%) |
| 25 to 34 Years | 167 (54.9%) | 270 (88.8%) |
| 35 to 44 Years | 0 (0.0%) | 50 (100.0%) |
| 45 to 54 Years | 0 (0.0%) | 185 (100.0%) |
| 55 to 64 Years | 42 (42.9%) | 56 (57.1%) |
| 65 to 74 Years | 29 (100.0%) | 0 (0.0%) |
| 75 Years and over | 9 (100.0%) | 9 (100.0%) |
| Total | 428 (41.5%) | 829 (80.3%) |
Disability Status by Sex by Age in Cannonsburg
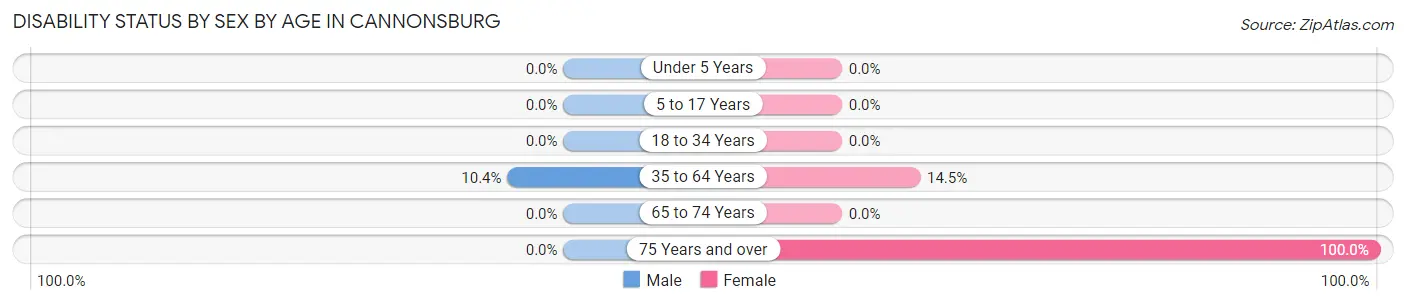
| Age Bracket | Male | Female |
| Under 5 Years | 0 (0.0%) | 0 (0.0%) |
| 5 to 17 Years | 0 (0.0%) | 0 (0.0%) |
| 18 to 34 Years | 0 (0.0%) | 0 (0.0%) |
| 35 to 64 Years | 16 (10.4%) | 26 (14.5%) |
| 65 to 74 Years | 0 (0.0%) | 0 (0.0%) |
| 75 Years and over | 0 (0.0%) | 9 (100.0%) |
Disability Class by Sex by Age in Cannonsburg
Disability Class: Hearing Difficulty
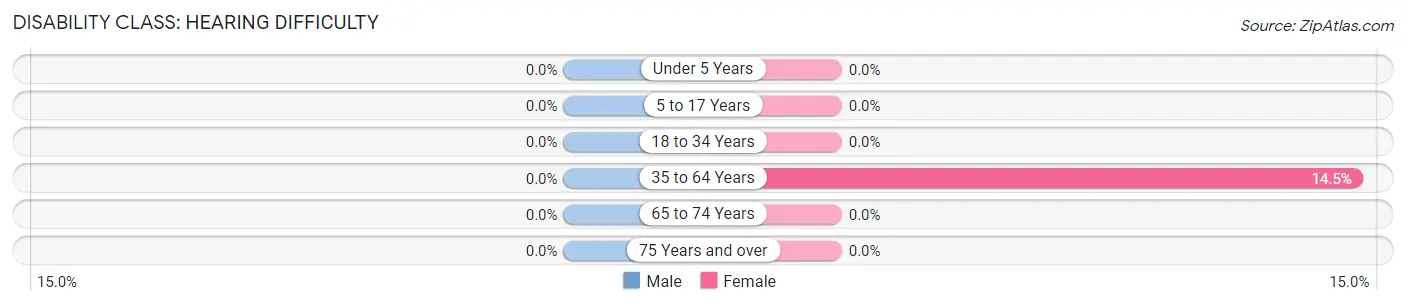
| Age Bracket | Male | Female |
| Under 5 Years | 0 (0.0%) | 0 (0.0%) |
| 5 to 17 Years | 0 (0.0%) | 0 (0.0%) |
| 18 to 34 Years | 0 (0.0%) | 0 (0.0%) |
| 35 to 64 Years | 0 (0.0%) | 26 (14.5%) |
| 65 to 74 Years | 0 (0.0%) | 0 (0.0%) |
| 75 Years and over | 0 (0.0%) | 0 (0.0%) |
Disability Class: Vision Difficulty
| Age Bracket | Male | Female |
| Under 5 Years | 0 (0.0%) | 0 (0.0%) |
| 5 to 17 Years | 0 (0.0%) | 0 (0.0%) |
| 18 to 34 Years | 0 (0.0%) | 0 (0.0%) |
| 35 to 64 Years | 0 (0.0%) | 0 (0.0%) |
| 65 to 74 Years | 0 (0.0%) | 0 (0.0%) |
| 75 Years and over | 0 (0.0%) | 0 (0.0%) |
Disability Class: Cognitive Difficulty
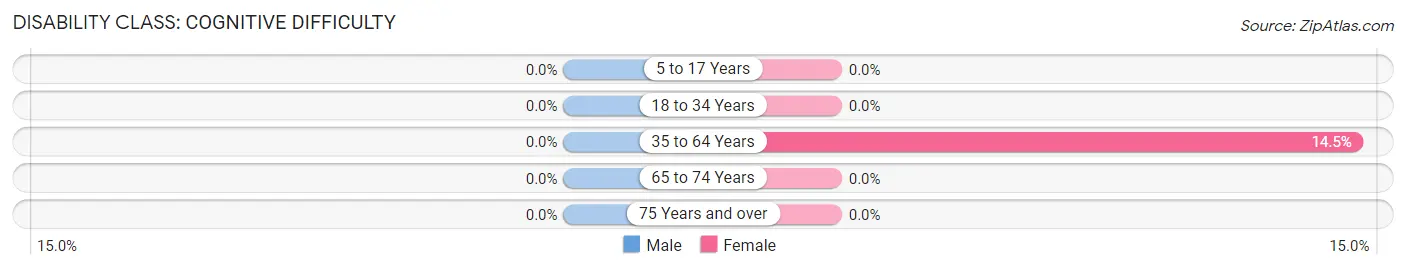
| Age Bracket | Male | Female |
| 5 to 17 Years | 0 (0.0%) | 0 (0.0%) |
| 18 to 34 Years | 0 (0.0%) | 0 (0.0%) |
| 35 to 64 Years | 0 (0.0%) | 26 (14.5%) |
| 65 to 74 Years | 0 (0.0%) | 0 (0.0%) |
| 75 Years and over | 0 (0.0%) | 0 (0.0%) |
Disability Class: Ambulatory Difficulty
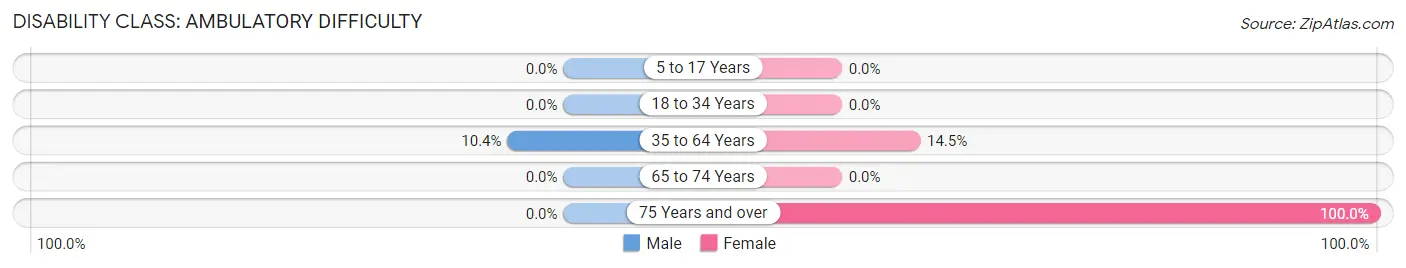
| Age Bracket | Male | Female |
| 5 to 17 Years | 0 (0.0%) | 0 (0.0%) |
| 18 to 34 Years | 0 (0.0%) | 0 (0.0%) |
| 35 to 64 Years | 16 (10.4%) | 26 (14.5%) |
| 65 to 74 Years | 0 (0.0%) | 0 (0.0%) |
| 75 Years and over | 0 (0.0%) | 9 (100.0%) |
Disability Class: Self-Care Difficulty
| Age Bracket | Male | Female |
| 5 to 17 Years | 0 (0.0%) | 0 (0.0%) |
| 18 to 34 Years | 0 (0.0%) | 0 (0.0%) |
| 35 to 64 Years | 0 (0.0%) | 0 (0.0%) |
| 65 to 74 Years | 0 (0.0%) | 0 (0.0%) |
| 75 Years and over | 0 (0.0%) | 0 (0.0%) |
Technology Access in Cannonsburg
Computing Device Access in Cannonsburg
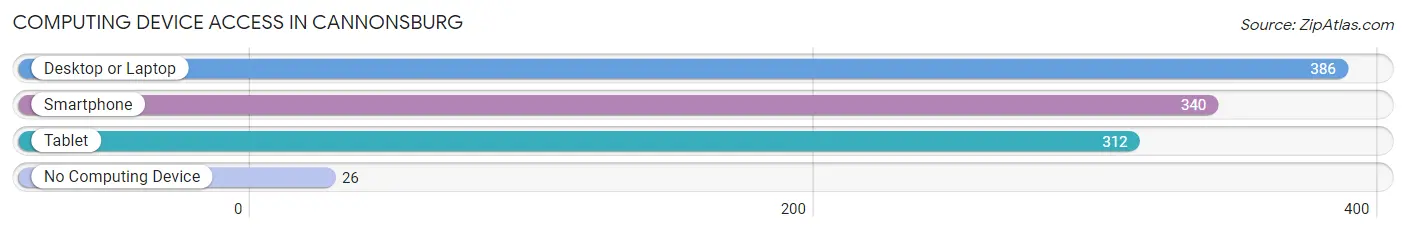
| Device Type | # Households | % Households |
| Desktop or Laptop | 386 | 88.5% |
| Smartphone | 340 | 78.0% |
| Tablet | 312 | 71.6% |
| No Computing Device | 26 | 6.0% |
| Total | 436 | 100.0% |
Internet Access in Cannonsburg
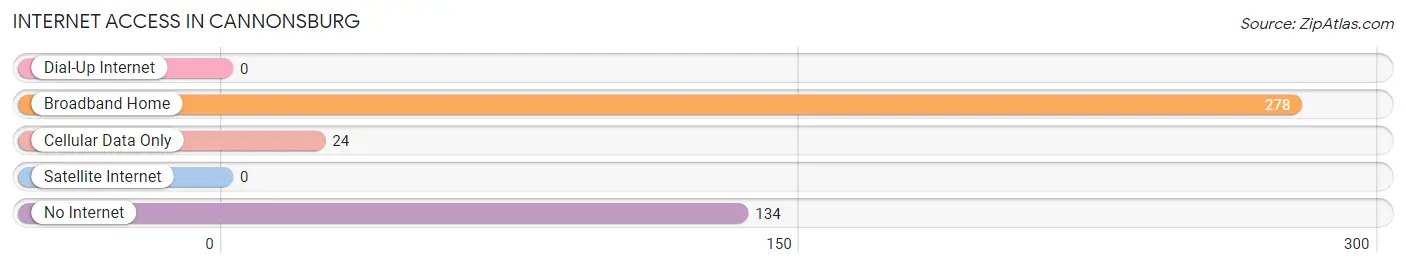
| Internet Type | # Households | % Households |
| Dial-Up Internet | 0 | 0.0% |
| Broadband Home | 278 | 63.8% |
| Cellular Data Only | 24 | 5.5% |
| Satellite Internet | 0 | 0.0% |
| No Internet | 134 | 30.7% |
| Total | 436 | 100.0% |
Cannonsburg Summary
Cannonsburg is a small unincorporated community located in the northern part of Kenton County, Kentucky. It is situated on the banks of the Ohio River, just south of the city of Covington. The community is named after the Cannon family, who were early settlers in the area.
History
The area that is now Cannonsburg was first settled in the late 1700s by the Cannon family. The family had come to the area from Virginia and established a farm on the banks of the Ohio River. The family was well-known in the area and the community that grew up around their farm was eventually named after them.
In the early 1800s, the area was home to a number of small industries, including a grist mill, a saw mill, and a distillery. The distillery was owned by the Cannon family and was one of the first in the area. The distillery was in operation until the early 1900s.
In the late 1800s, the area was home to a number of small businesses, including a general store, a blacksmith shop, and a post office. The post office was established in 1883 and was in operation until the early 1900s.
Geography
Cannonsburg is located in the northern part of Kenton County, Kentucky. It is situated on the banks of the Ohio River, just south of the city of Covington. The community is located in a rural area and is surrounded by rolling hills and farmland.
The climate in Cannonsburg is humid subtropical, with hot summers and mild winters. The average annual temperature is around 60 degrees Fahrenheit. The average annual precipitation is around 40 inches.
Economy
The economy of Cannonsburg is largely based on agriculture. The area is home to a number of small farms, which produce a variety of crops, including corn, soybeans, and wheat. The area is also home to a number of small businesses, including a general store, a blacksmith shop, and a post office.
Demographics
As of the 2010 census, the population of Cannonsburg was 1,072. The racial makeup of the community was 97.3% White, 0.9% African American, 0.2% Native American, 0.2% Asian, and 1.4% from other races. The median household income was $41,250, and the median family income was $50,000.
Conclusion
Cannonsburg is a small unincorporated community located in the northern part of Kenton County, Kentucky. It is situated on the banks of the Ohio River, just south of the city of Covington. The community is named after the Cannon family, who were early settlers in the area. The economy of Cannonsburg is largely based on agriculture, and the area is home to a number of small businesses. As of the 2010 census, the population of Cannonsburg was 1,072. The racial makeup of the community was 97.3% White, 0.9% African American, 0.2% Native American, 0.2% Asian, and 1.4% from other races.
Common Questions
What is Per Capita Income in Cannonsburg?
Per Capita income in Cannonsburg is $33,649.
What is the Median Family Income in Cannonsburg?
Median Family Income in Cannonsburg is $81,349.
What is the Median Household income in Cannonsburg?
Median Household Income in Cannonsburg is $80,271.
What is Income or Wage Gap in Cannonsburg?
Income or Wage Gap in Cannonsburg is 28.1%.
Women in Cannonsburg earn 71.9 cents for every dollar earned by a man.
What is Inequality or Gini Index in Cannonsburg?
Inequality or Gini Index in Cannonsburg is 0.34.
What is the Total Population of Cannonsburg?
Total Population of Cannonsburg is 1,032.
What is the Total Male Population of Cannonsburg?
Total Male Population of Cannonsburg is 406.
What is the Total Female Population of Cannonsburg?
Total Female Population of Cannonsburg is 626.
What is the Ratio of Males per 100 Females in Cannonsburg?
There are 64.86 Males per 100 Females in Cannonsburg.
What is the Ratio of Females per 100 Males in Cannonsburg?
There are 154.19 Females per 100 Males in Cannonsburg.
What is the Median Population Age in Cannonsburg?
Median Population Age in Cannonsburg is 28.7 Years.
What is the Average Family Size in Cannonsburg
Average Family Size in Cannonsburg is 2.9 People.
What is the Average Household Size in Cannonsburg
Average Household Size in Cannonsburg is 2.4 People.
How Large is the Labor Force in Cannonsburg?
There are 547 People in the Labor Forcein in Cannonsburg.
What is the Percentage of People in the Labor Force in Cannonsburg?
81.0% of People are in the Labor Force in Cannonsburg.
What is the Unemployment Rate in Cannonsburg?
Unemployment Rate in Cannonsburg is 6.2%.