Glasgow, KY Map & Demographics
Glasgow Map
Glasgow Overview
$29,661
PER CAPITA INCOME
$54,183
AVG FAMILY INCOME
$44,125
AVG HOUSEHOLD INCOME
10.1%
WAGE / INCOME GAP [ % ]
89.9¢/ $1
WAGE / INCOME GAP [ $ ]
$9,794
FAMILY INCOME DEFICIT
0.53
INEQUALITY / GINI INDEX
15,043
TOTAL POPULATION
7,096
MALE POPULATION
7,947
FEMALE POPULATION
89.29
MALES / 100 FEMALES
111.99
FEMALES / 100 MALES
42.3
MEDIAN AGE
2.9
AVG FAMILY SIZE
2.3
AVG HOUSEHOLD SIZE
6,091
LABOR FORCE [ PEOPLE ]
50.4%
PERCENT IN LABOR FORCE
5.1%
UNEMPLOYMENT RATE
Glasgow Zip Codes
Glasgow Area Codes
Income in Glasgow
Income Overview in Glasgow
Per Capita Income in Glasgow is $29,661, while median incomes of families and households are $54,183 and $44,125 respectively.
| Characteristic | Number | Measure |
| Per Capita Income | 15,043 | $29,661 |
| Median Family Income | 3,862 | $54,183 |
| Mean Family Income | 3,862 | $88,938 |
| Median Household Income | 6,222 | $44,125 |
| Mean Household Income | 6,222 | $68,890 |
| Income Deficit | 3,862 | $9,794 |
| Wage / Income Gap (%) | 15,043 | 10.05% |
| Wage / Income Gap ($) | 15,043 | 89.95¢ per $1 |
| Gini / Inequality Index | 15,043 | 0.53 |
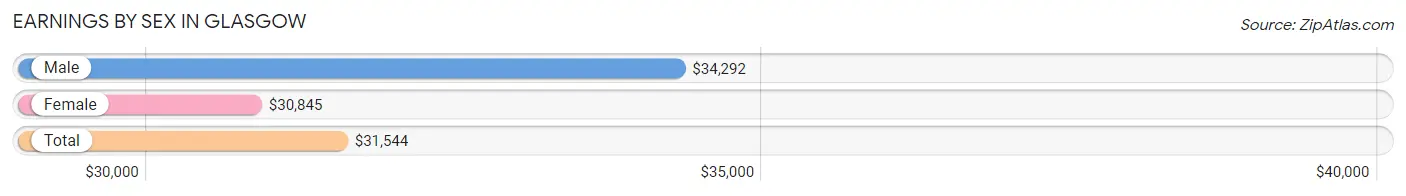
Earnings by Sex in Glasgow
Average Earnings in Glasgow are $31,544, $34,292 for men and $30,845 for women, a difference of 10.1%.
| Sex | Number | Average Earnings |
| Male | 3,202 (50.1%) | $34,292 |
| Female | 3,190 (49.9%) | $30,845 |
| Total | 6,392 (100.0%) | $31,544 |
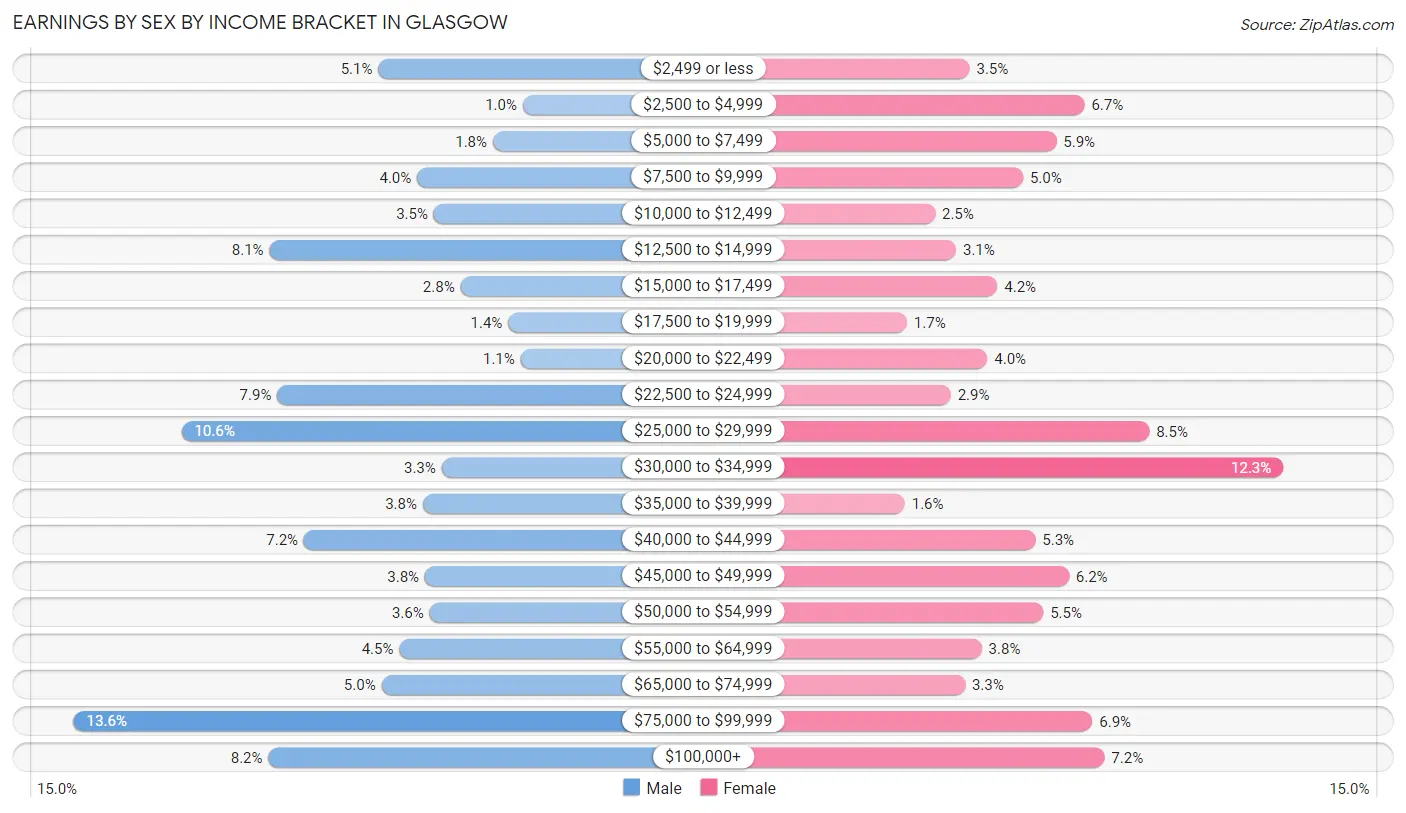
Earnings by Sex by Income Bracket in Glasgow
The most common earnings brackets in Glasgow are $75,000 to $99,999 for men (436 | 13.6%) and $30,000 to $34,999 for women (391 | 12.3%).
| Income | Male | Female |
| $2,499 or less | 162 (5.1%) | 110 (3.5%) |
| $2,500 to $4,999 | 32 (1.0%) | 213 (6.7%) |
| $5,000 to $7,499 | 59 (1.8%) | 188 (5.9%) |
| $7,500 to $9,999 | 127 (4.0%) | 158 (5.0%) |
| $10,000 to $12,499 | 112 (3.5%) | 79 (2.5%) |
| $12,500 to $14,999 | 260 (8.1%) | 98 (3.1%) |
| $15,000 to $17,499 | 88 (2.8%) | 135 (4.2%) |
| $17,500 to $19,999 | 45 (1.4%) | 54 (1.7%) |
| $20,000 to $22,499 | 34 (1.1%) | 126 (4.0%) |
| $22,500 to $24,999 | 253 (7.9%) | 93 (2.9%) |
| $25,000 to $29,999 | 339 (10.6%) | 271 (8.5%) |
| $30,000 to $34,999 | 105 (3.3%) | 391 (12.3%) |
| $35,000 to $39,999 | 122 (3.8%) | 52 (1.6%) |
| $40,000 to $44,999 | 229 (7.1%) | 169 (5.3%) |
| $45,000 to $49,999 | 120 (3.7%) | 199 (6.2%) |
| $50,000 to $54,999 | 116 (3.6%) | 176 (5.5%) |
| $55,000 to $64,999 | 143 (4.5%) | 121 (3.8%) |
| $65,000 to $74,999 | 159 (5.0%) | 106 (3.3%) |
| $75,000 to $99,999 | 436 (13.6%) | 220 (6.9%) |
| $100,000+ | 261 (8.2%) | 231 (7.2%) |
| Total | 3,202 (100.0%) | 3,190 (100.0%) |
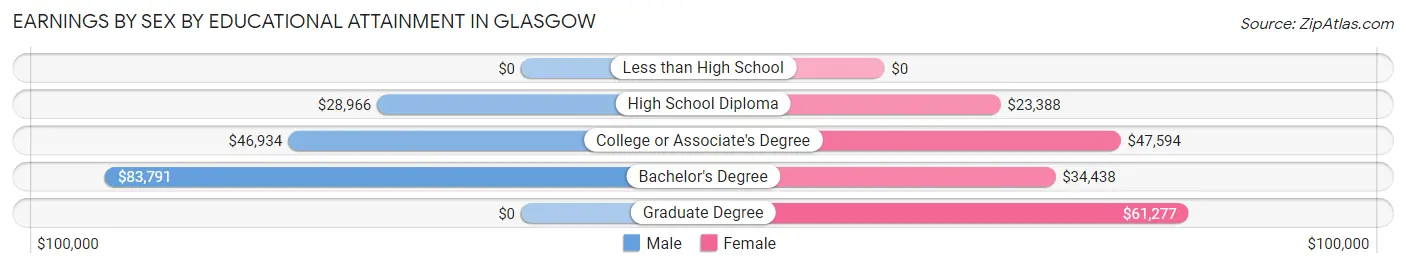
Earnings by Sex by Educational Attainment in Glasgow
Average earnings in Glasgow are $42,049 for men and $33,222 for women, a difference of 21.0%. Men with an educational attainment of bachelor's degree enjoy the highest average annual earnings of $83,791, while those with high school diploma education earn the least with $28,966. Women with an educational attainment of graduate degree earn the most with the average annual earnings of $61,277, while those with high school diploma education have the smallest earnings of $23,388.
| Educational Attainment | Male Income | Female Income |
| Less than High School | - | - |
| High School Diploma | $28,966 | $23,388 |
| College or Associate's Degree | $46,934 | $47,594 |
| Bachelor's Degree | $83,791 | $34,438 |
| Graduate Degree | - | - |
| Total | $42,049 | $33,222 |
Family Income in Glasgow
Family Income Brackets in Glasgow
According to the Glasgow family income data, there are 637 families falling into the $35,000 to $49,999 income range, which is the most common income bracket and makes up 16.5% of all families. Conversely, the $150,000 to $199,999 income bracket is the least frequent group with only 147 families (3.8%) belonging to this category.
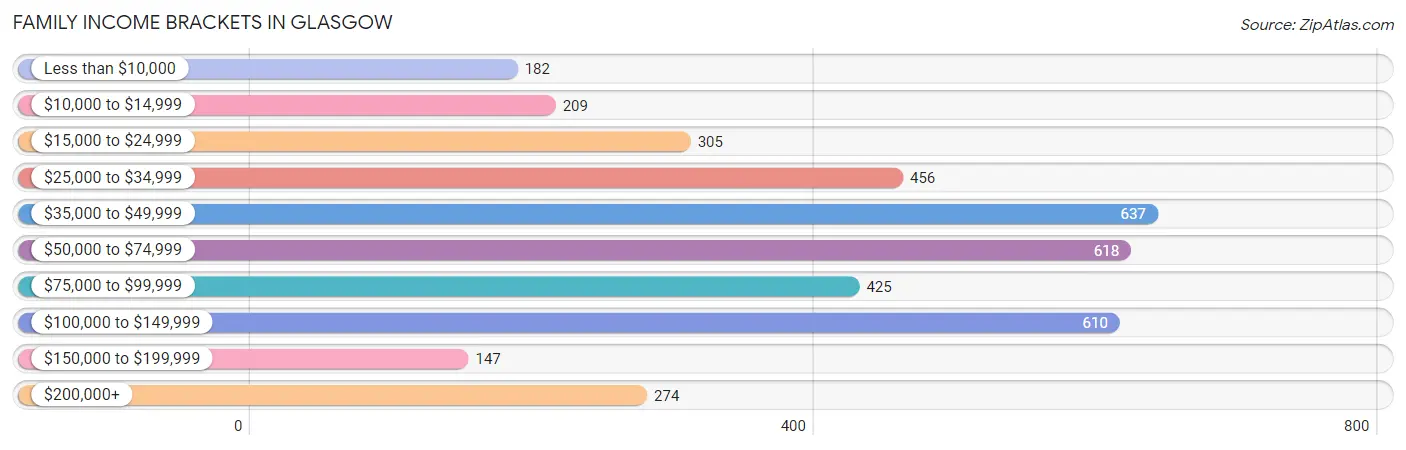
| Income Bracket | # Families | % Families |
| Less than $10,000 | 182 | 4.7% |
| $10,000 to $14,999 | 209 | 5.4% |
| $15,000 to $24,999 | 305 | 7.9% |
| $25,000 to $34,999 | 456 | 11.8% |
| $35,000 to $49,999 | 637 | 16.5% |
| $50,000 to $74,999 | 618 | 16.0% |
| $75,000 to $99,999 | 425 | 11.0% |
| $100,000 to $149,999 | 610 | 15.8% |
| $150,000 to $199,999 | 147 | 3.8% |
| $200,000+ | 274 | 7.1% |
Family Income by Famaliy Size in Glasgow
4-person families (371 | 9.6%) account for the highest median family income in Glasgow with $95,662 per family, while 2-person families (2,086 | 54.0%) have the highest median income of $25,968 per family member.
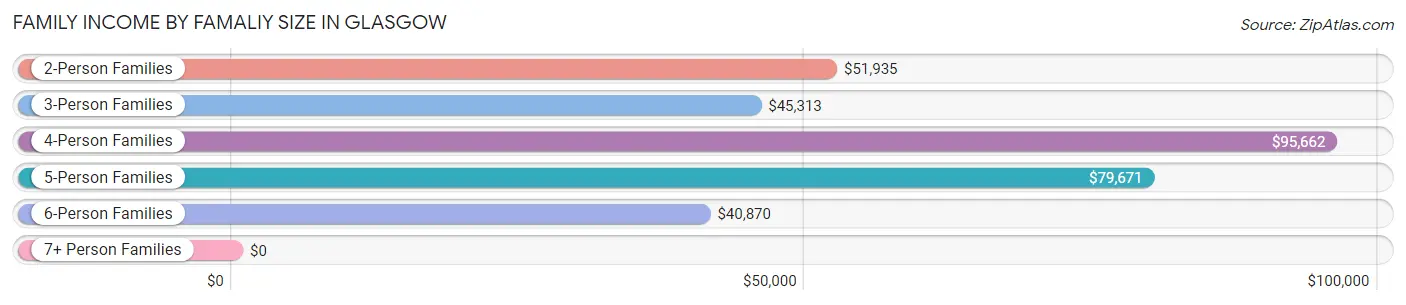
| Income Bracket | # Families | Median Income |
| 2-Person Families | 2,086 (54.0%) | $51,935 |
| 3-Person Families | 909 (23.5%) | $45,313 |
| 4-Person Families | 371 (9.6%) | $95,662 |
| 5-Person Families | 371 (9.6%) | $79,671 |
| 6-Person Families | 82 (2.1%) | $40,870 |
| 7+ Person Families | 43 (1.1%) | $0 |
| Total | 3,862 (100.0%) | $54,183 |
Family Income by Number of Earners in Glasgow
The median family income in Glasgow is $54,183, with families comprising 3+ earners (125) having the highest median family income of $137,750, while families with no earners (840) have the lowest median family income of $32,961, accounting for 3.2% and 21.7% of families, respectively.
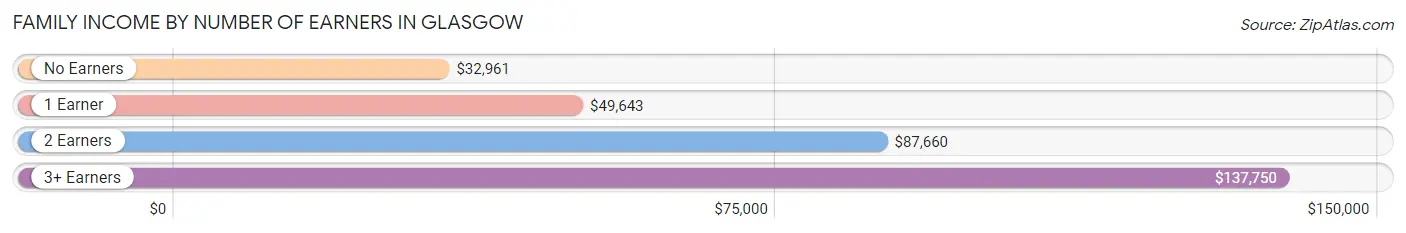
| Number of Earners | # Families | Median Income |
| No Earners | 840 (21.7%) | $32,961 |
| 1 Earner | 1,526 (39.5%) | $49,643 |
| 2 Earners | 1,371 (35.5%) | $87,660 |
| 3+ Earners | 125 (3.2%) | $137,750 |
| Total | 3,862 (100.0%) | $54,183 |
Household Income in Glasgow
Household Income Brackets in Glasgow
With 1,045 households falling in the category, the $35,000 to $49,999 income range is the most frequent in Glasgow, accounting for 16.8% of all households. In contrast, only 174 households (2.8%) fall into the $150,000 to $199,999 income bracket, making it the least populous group.
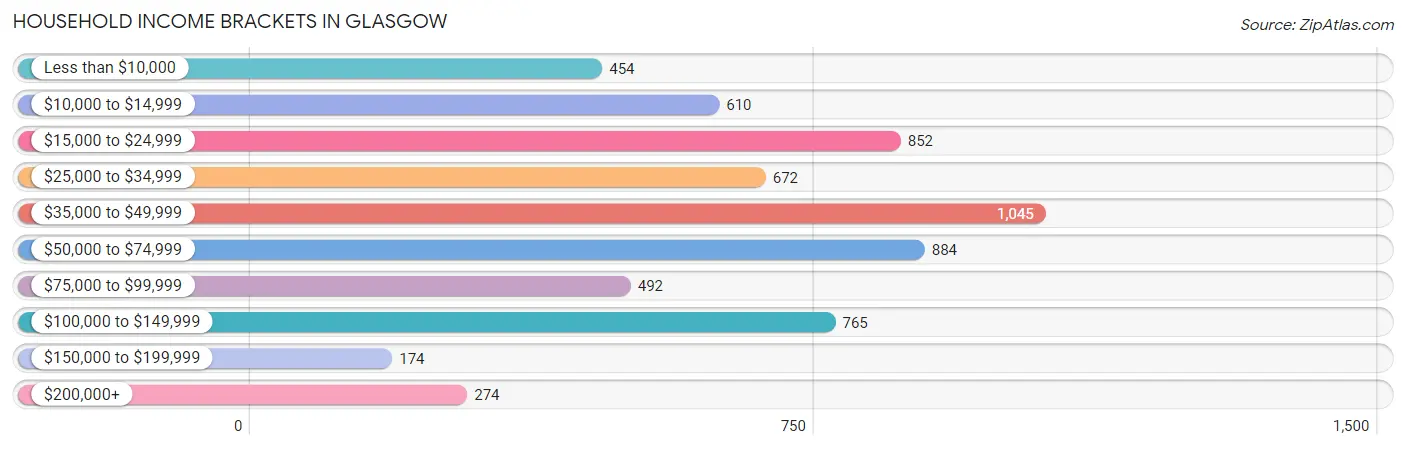
| Income Bracket | # Households | % Households |
| Less than $10,000 | 454 | 7.3% |
| $10,000 to $14,999 | 610 | 9.8% |
| $15,000 to $24,999 | 852 | 13.7% |
| $25,000 to $34,999 | 672 | 10.8% |
| $35,000 to $49,999 | 1,045 | 16.8% |
| $50,000 to $74,999 | 884 | 14.2% |
| $75,000 to $99,999 | 492 | 7.9% |
| $100,000 to $149,999 | 765 | 12.3% |
| $150,000 to $199,999 | 174 | 2.8% |
| $200,000+ | 274 | 4.4% |
Household Income by Householder Age in Glasgow
The median household income in Glasgow is $44,125, with the highest median household income of $47,618 found in the 45 to 64 years age bracket for the primary householder. A total of 2,212 households (35.5%) fall into this category. Meanwhile, the 65+ years age bracket for the primary householder has the lowest median household income of $34,730, with 1,997 households (32.1%) in this group.
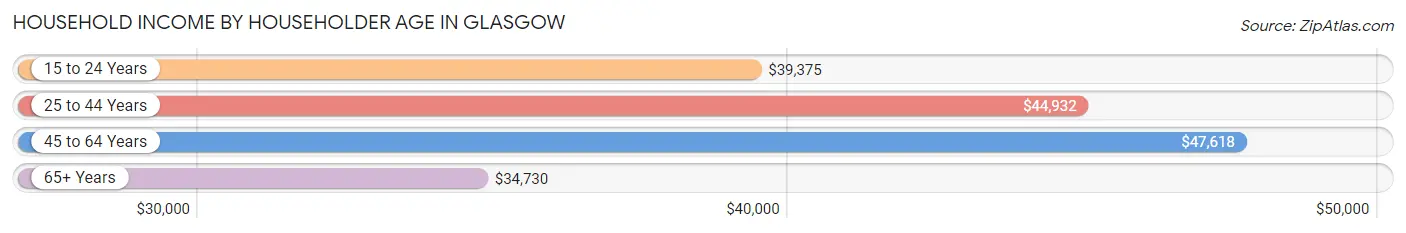
| Income Bracket | # Households | Median Income |
| 15 to 24 Years | 391 (6.3%) | $39,375 |
| 25 to 44 Years | 1,622 (26.1%) | $44,932 |
| 45 to 64 Years | 2,212 (35.5%) | $47,618 |
| 65+ Years | 1,997 (32.1%) | $34,730 |
| Total | 6,222 (100.0%) | $44,125 |
Poverty in Glasgow
Income Below Poverty by Sex and Age in Glasgow
With 20.9% poverty level for males and 20.6% for females among the residents of Glasgow, 16 and 17 year old males and under 5 year old females are the most vulnerable to poverty, with 144 males (67.6%) and 114 females (34.1%) in their respective age groups living below the poverty level.
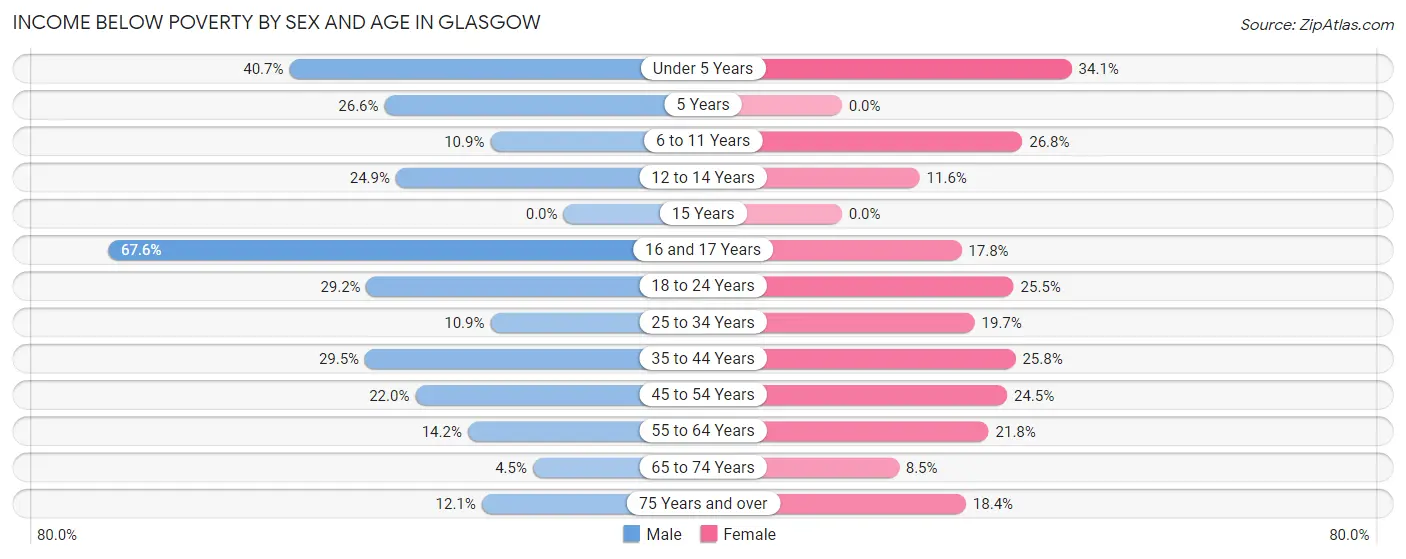
| Age Bracket | Male | Female |
| Under 5 Years | 208 (40.7%) | 114 (34.1%) |
| 5 Years | 21 (26.6%) | 0 (0.0%) |
| 6 to 11 Years | 49 (10.9%) | 160 (26.8%) |
| 12 to 14 Years | 107 (24.9%) | 54 (11.6%) |
| 15 Years | 0 (0.0%) | 0 (0.0%) |
| 16 and 17 Years | 144 (67.6%) | 57 (17.8%) |
| 18 to 24 Years | 150 (29.2%) | 146 (25.5%) |
| 25 to 34 Years | 89 (10.8%) | 155 (19.7%) |
| 35 to 44 Years | 271 (29.5%) | 196 (25.8%) |
| 45 to 54 Years | 186 (22.0%) | 215 (24.5%) |
| 55 to 64 Years | 118 (14.2%) | 235 (21.8%) |
| 65 to 74 Years | 37 (4.5%) | 69 (8.5%) |
| 75 Years and over | 51 (12.1%) | 160 (18.4%) |
| Total | 1,431 (20.9%) | 1,561 (20.6%) |
Income Above Poverty by Sex and Age in Glasgow
According to the poverty statistics in Glasgow, males aged 15 years and females aged 5 years are the age groups that are most secure financially, with 100.0% of males and 100.0% of females in these age groups living above the poverty line.
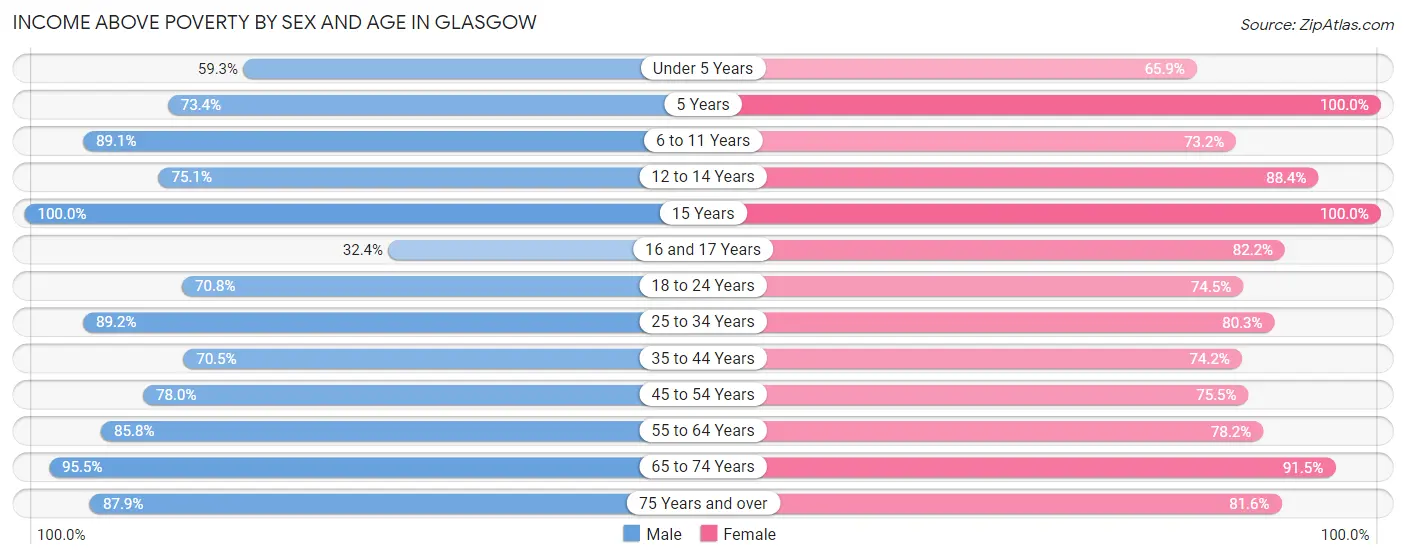
| Age Bracket | Male | Female |
| Under 5 Years | 303 (59.3%) | 220 (65.9%) |
| 5 Years | 58 (73.4%) | 61 (100.0%) |
| 6 to 11 Years | 402 (89.1%) | 437 (73.2%) |
| 12 to 14 Years | 323 (75.1%) | 413 (88.4%) |
| 15 Years | 2 (100.0%) | 25 (100.0%) |
| 16 and 17 Years | 69 (32.4%) | 264 (82.2%) |
| 18 to 24 Years | 363 (70.8%) | 426 (74.5%) |
| 25 to 34 Years | 731 (89.1%) | 631 (80.3%) |
| 35 to 44 Years | 649 (70.5%) | 564 (74.2%) |
| 45 to 54 Years | 660 (78.0%) | 661 (75.5%) |
| 55 to 64 Years | 713 (85.8%) | 843 (78.2%) |
| 65 to 74 Years | 778 (95.5%) | 747 (91.5%) |
| 75 Years and over | 369 (87.9%) | 708 (81.6%) |
| Total | 5,420 (79.1%) | 6,000 (79.3%) |
Income Below Poverty Among Married-Couple Families in Glasgow
The poverty statistics for married-couple families in Glasgow show that 2.7% or 67 of the total 2,513 families live below the poverty line. Families with 3 or 4 children have the highest poverty rate of 20.9%, comprising of 52 families. On the other hand, families with no children have the lowest poverty rate of 0.3%, which includes 4 families.
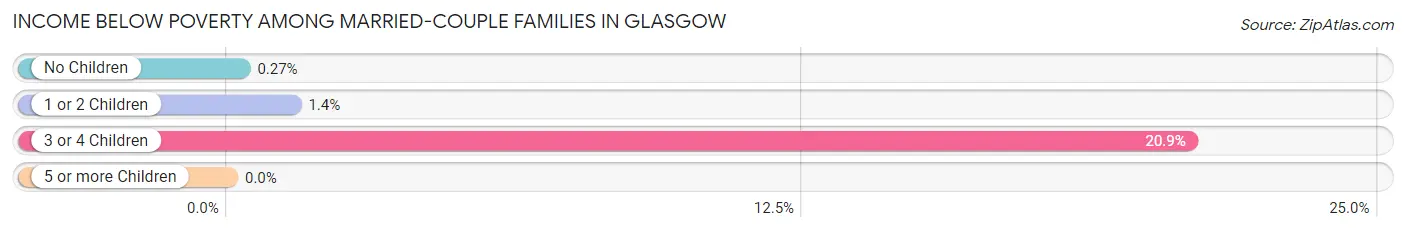
| Children | Above Poverty | Below Poverty |
| No Children | 1,461 (99.7%) | 4 (0.3%) |
| 1 or 2 Children | 788 (98.6%) | 11 (1.4%) |
| 3 or 4 Children | 197 (79.1%) | 52 (20.9%) |
| 5 or more Children | 0 (0.0%) | 0 (0.0%) |
| Total | 2,446 (97.3%) | 67 (2.7%) |
Income Below Poverty Among Single-Parent Households in Glasgow
According to the poverty data in Glasgow, 31.2% or 154 single-father households and 45.2% or 387 single-mother households are living below the poverty line. Among single-father households, those with no children have the highest poverty rate, with 51 households (39.8%) experiencing poverty. Likewise, among single-mother households, those with 3 or 4 children have the highest poverty rate, with 84 households (64.6%) falling below the poverty line.
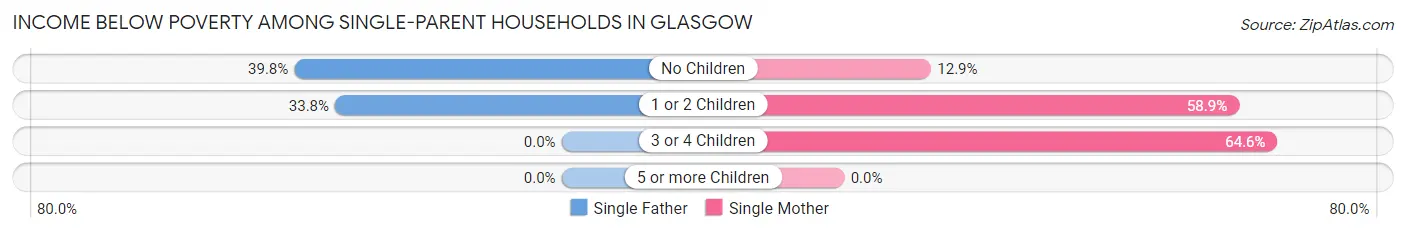
| Children | Single Father | Single Mother |
| No Children | 51 (39.8%) | 35 (12.9%) |
| 1 or 2 Children | 103 (33.8%) | 268 (58.9%) |
| 3 or 4 Children | 0 (0.0%) | 84 (64.6%) |
| 5 or more Children | 0 (0.0%) | 0 (0.0%) |
| Total | 154 (31.2%) | 387 (45.2%) |
Income Below Poverty Among Married-Couple vs Single-Parent Households in Glasgow
The poverty data for Glasgow shows that 67 of the married-couple family households (2.7%) and 541 of the single-parent households (40.1%) are living below the poverty level. Within the married-couple family households, those with 3 or 4 children have the highest poverty rate, with 52 households (20.9%) falling below the poverty line. Among the single-parent households, those with 3 or 4 children have the highest poverty rate, with 84 household (50.3%) living below poverty.
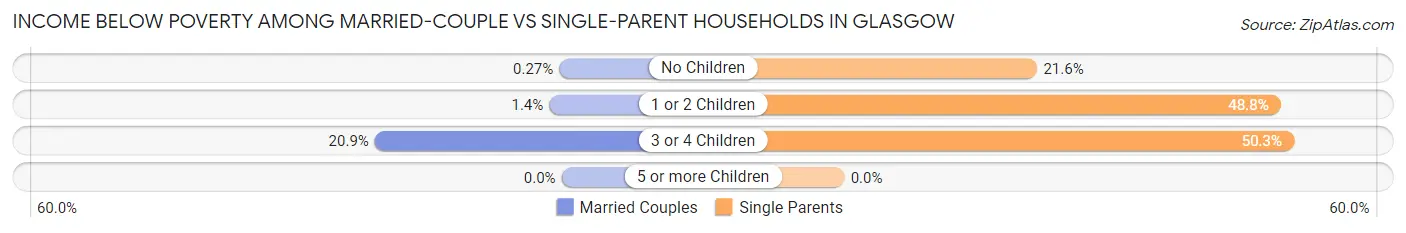
| Children | Married-Couple Families | Single-Parent Households |
| No Children | 4 (0.3%) | 86 (21.5%) |
| 1 or 2 Children | 11 (1.4%) | 371 (48.8%) |
| 3 or 4 Children | 52 (20.9%) | 84 (50.3%) |
| 5 or more Children | 0 (0.0%) | 0 (0.0%) |
| Total | 67 (2.7%) | 541 (40.1%) |
Race in Glasgow
The most populous races in Glasgow are White / Caucasian (12,398 | 82.4%), Black / African American (1,149 | 7.6%), and Hispanic or Latino (988 | 6.6%).
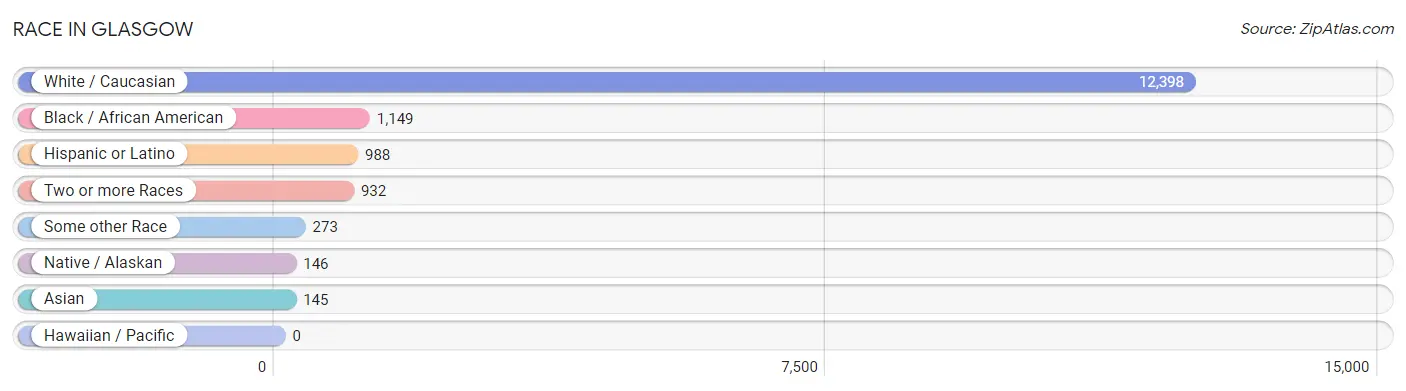
| Race | # Population | % Population |
| Asian | 145 | 1.0% |
| Black / African American | 1,149 | 7.6% |
| Hawaiian / Pacific | 0 | 0.0% |
| Hispanic or Latino | 988 | 6.6% |
| Native / Alaskan | 146 | 1.0% |
| White / Caucasian | 12,398 | 82.4% |
| Two or more Races | 932 | 6.2% |
| Some other Race | 273 | 1.8% |
| Total | 15,043 | 100.0% |
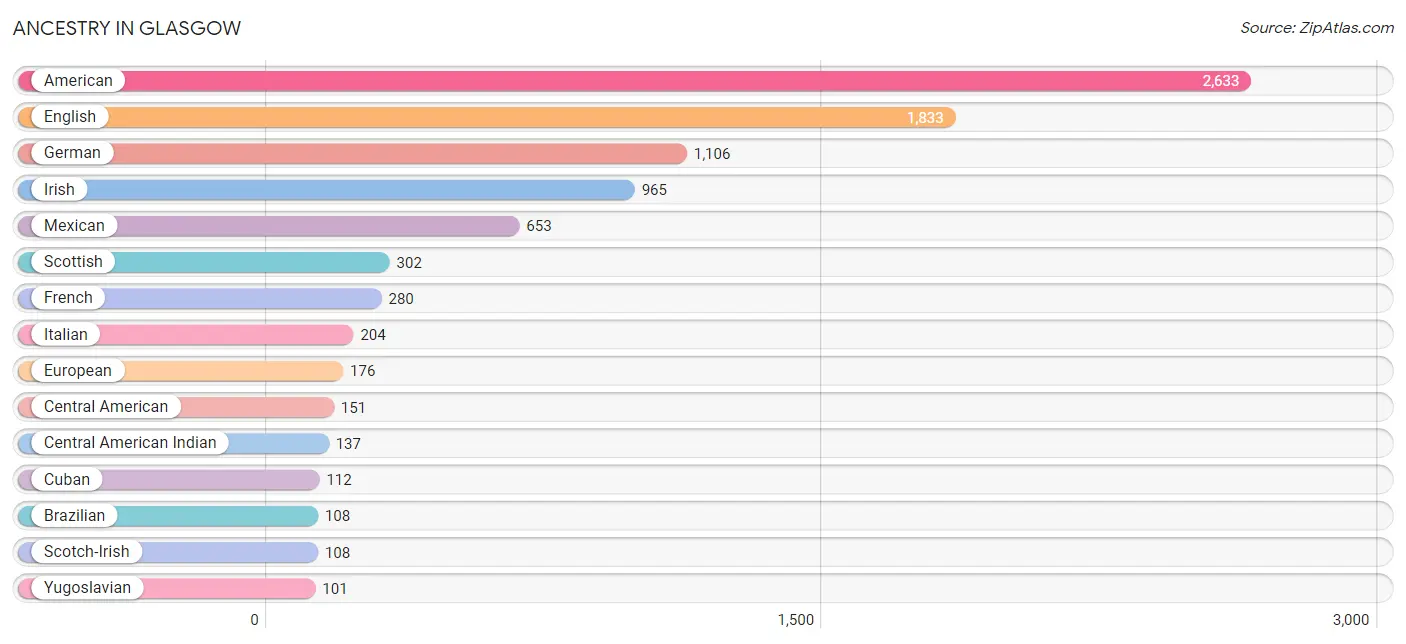
Ancestry in Glasgow
The most populous ancestries reported in Glasgow are American (2,633 | 17.5%), English (1,833 | 12.2%), German (1,106 | 7.3%), Irish (965 | 6.4%), and Mexican (653 | 4.3%), together accounting for 47.8% of all Glasgow residents.
| Ancestry | # Population | % Population |
| African | 19 | 0.1% |
| American | 2,633 | 17.5% |
| Apache | 7 | 0.1% |
| Arab | 9 | 0.1% |
| Bhutanese | 26 | 0.2% |
| Blackfeet | 8 | 0.1% |
| Brazilian | 108 | 0.7% |
| British | 59 | 0.4% |
| Burmese | 10 | 0.1% |
| Central American | 151 | 1.0% |
| Central American Indian | 137 | 0.9% |
| Cherokee | 21 | 0.1% |
| Chippewa | 13 | 0.1% |
| Costa Rican | 23 | 0.2% |
| Cuban | 112 | 0.7% |
| Danish | 12 | 0.1% |
| Dutch | 38 | 0.3% |
| Eastern European | 91 | 0.6% |
| English | 1,833 | 12.2% |
| European | 176 | 1.2% |
| Finnish | 31 | 0.2% |
| French | 280 | 1.9% |
| German | 1,106 | 7.3% |
| Guatemalan | 28 | 0.2% |
| Honduran | 100 | 0.7% |
| Indian (Asian) | 69 | 0.5% |
| Irish | 965 | 6.4% |
| Iroquois | 9 | 0.1% |
| Italian | 204 | 1.4% |
| Korean | 72 | 0.5% |
| Lebanese | 9 | 0.1% |
| Lithuanian | 13 | 0.1% |
| Mexican | 653 | 4.3% |
| Norwegian | 7 | 0.1% |
| Polish | 47 | 0.3% |
| Portuguese | 26 | 0.2% |
| Puerto Rican | 36 | 0.2% |
| Russian | 23 | 0.2% |
| Scotch-Irish | 108 | 0.7% |
| Scottish | 302 | 2.0% |
| Spaniard | 36 | 0.2% |
| Subsaharan African | 19 | 0.1% |
| Swedish | 31 | 0.2% |
| Swiss | 9 | 0.1% |
| Ukrainian | 7 | 0.1% |
| Welsh | 83 | 0.5% |
| Yugoslavian | 101 | 0.7% | View All 47 Rows |
Immigrants in Glasgow
The most numerous immigrant groups reported in Glasgow came from Latin America (426 | 2.8%), Central America (425 | 2.8%), Mexico (296 | 2.0%), Europe (155 | 1.0%), and Asia (131 | 0.9%), together accounting for 9.5% of all Glasgow residents.
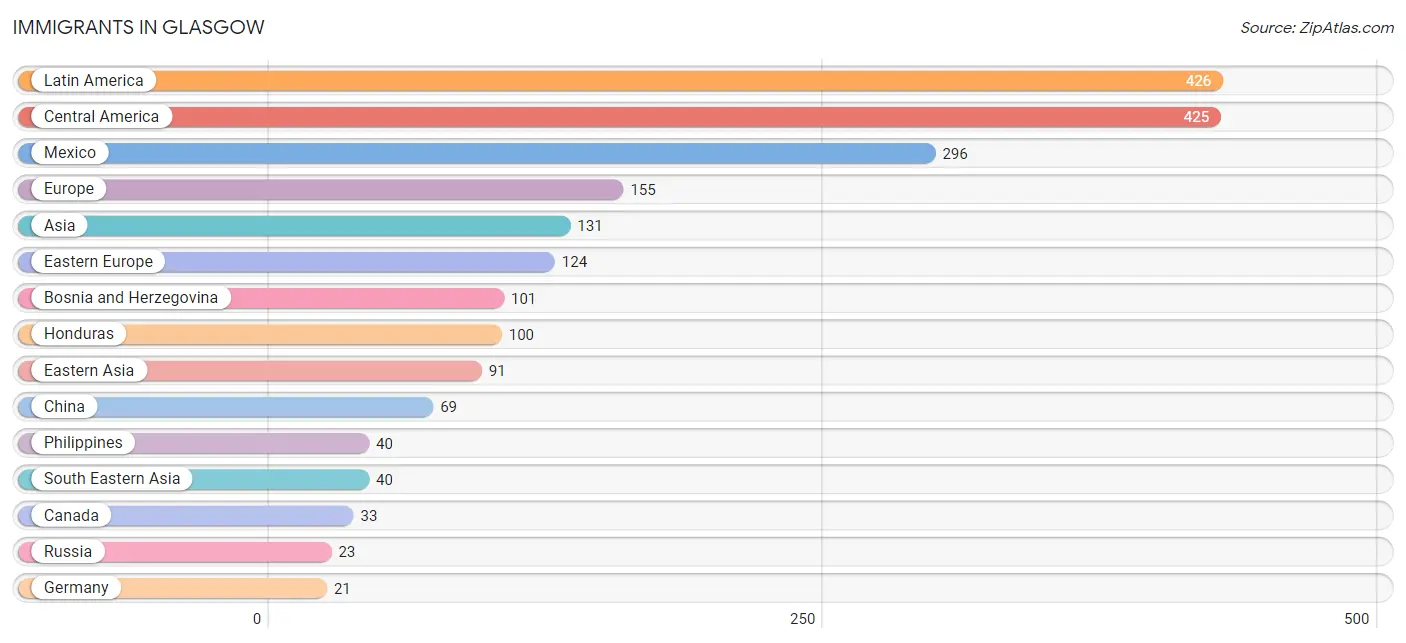
| Immigration Origin | # Population | % Population |
| Asia | 131 | 0.9% |
| Bosnia and Herzegovina | 101 | 0.7% |
| Brazil | 1 | 0.0% |
| Canada | 33 | 0.2% |
| Central America | 425 | 2.8% |
| China | 69 | 0.5% |
| Costa Rica | 9 | 0.1% |
| Eastern Asia | 91 | 0.6% |
| Eastern Europe | 124 | 0.8% |
| England | 10 | 0.1% |
| Europe | 155 | 1.0% |
| Germany | 21 | 0.1% |
| Guatemala | 20 | 0.1% |
| Honduras | 100 | 0.7% |
| Japan | 12 | 0.1% |
| Korea | 10 | 0.1% |
| Latin America | 426 | 2.8% |
| Mexico | 296 | 2.0% |
| Northern Europe | 10 | 0.1% |
| Philippines | 40 | 0.3% |
| Russia | 23 | 0.2% |
| South America | 1 | 0.0% |
| South Eastern Asia | 40 | 0.3% |
| Western Europe | 21 | 0.1% | View All 24 Rows |
Sex and Age in Glasgow
Sex and Age in Glasgow
The most populous age groups in Glasgow are 10 to 14 Years (647 | 9.1%) for men and 60 to 64 Years (732 | 9.2%) for women.
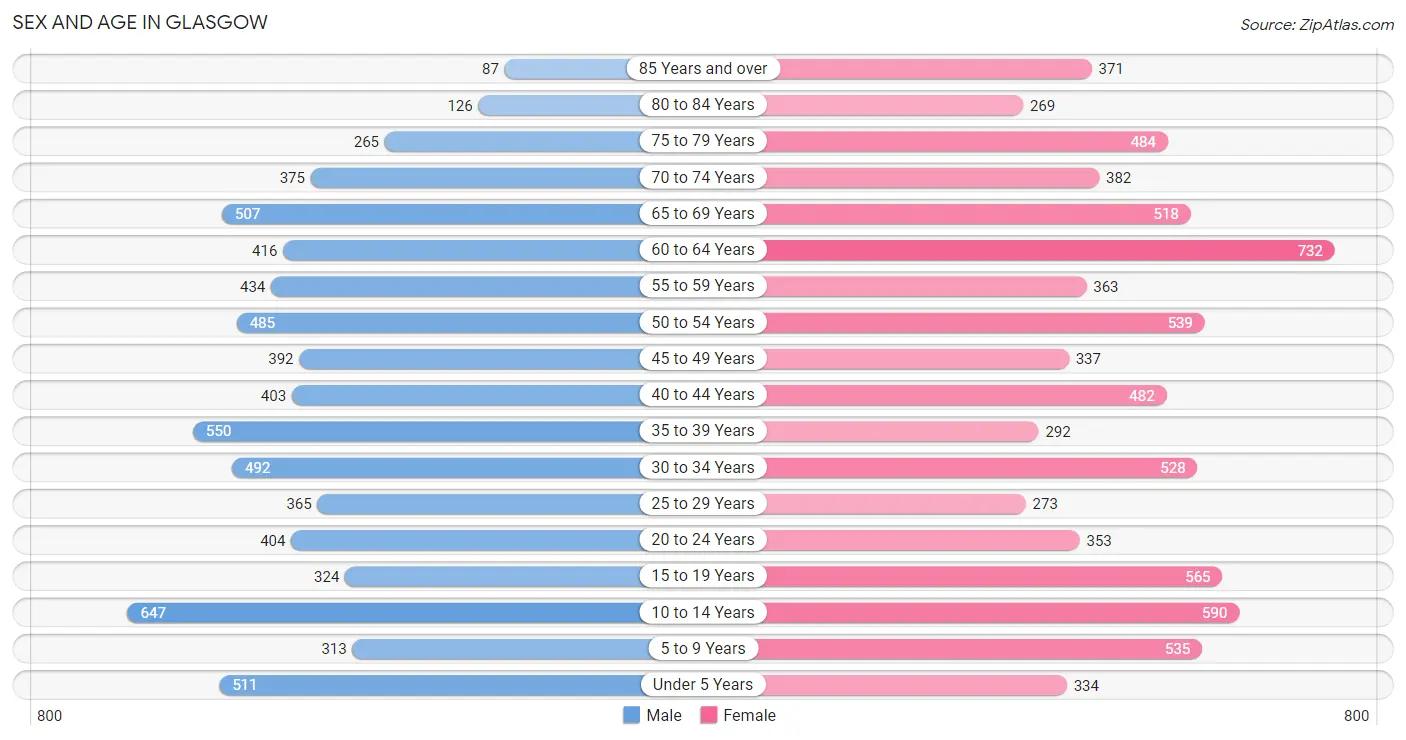
| Age Bracket | Male | Female |
| Under 5 Years | 511 (7.2%) | 334 (4.2%) |
| 5 to 9 Years | 313 (4.4%) | 535 (6.7%) |
| 10 to 14 Years | 647 (9.1%) | 590 (7.4%) |
| 15 to 19 Years | 324 (4.6%) | 565 (7.1%) |
| 20 to 24 Years | 404 (5.7%) | 353 (4.4%) |
| 25 to 29 Years | 365 (5.1%) | 273 (3.4%) |
| 30 to 34 Years | 492 (6.9%) | 528 (6.6%) |
| 35 to 39 Years | 550 (7.7%) | 292 (3.7%) |
| 40 to 44 Years | 403 (5.7%) | 482 (6.1%) |
| 45 to 49 Years | 392 (5.5%) | 337 (4.2%) |
| 50 to 54 Years | 485 (6.8%) | 539 (6.8%) |
| 55 to 59 Years | 434 (6.1%) | 363 (4.6%) |
| 60 to 64 Years | 416 (5.9%) | 732 (9.2%) |
| 65 to 69 Years | 507 (7.1%) | 518 (6.5%) |
| 70 to 74 Years | 375 (5.3%) | 382 (4.8%) |
| 75 to 79 Years | 265 (3.7%) | 484 (6.1%) |
| 80 to 84 Years | 126 (1.8%) | 269 (3.4%) |
| 85 Years and over | 87 (1.2%) | 371 (4.7%) |
| Total | 7,096 (100.0%) | 7,947 (100.0%) |
Families and Households in Glasgow
Median Family Size in Glasgow
The median family size in Glasgow is 2.91 persons per family, with single female/mother families (856 | 22.2%) accounting for the largest median family size of 3.06 persons per family. On the other hand, single male/father families (493 | 12.8%) represent the smallest median family size with 2.74 persons per family.
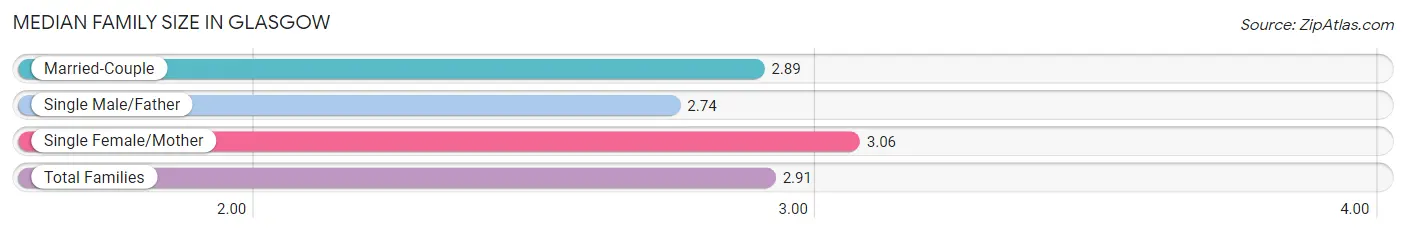
| Family Type | # Families | Family Size |
| Married-Couple | 2,513 (65.1%) | 2.89 |
| Single Male/Father | 493 (12.8%) | 2.74 |
| Single Female/Mother | 856 (22.2%) | 3.06 |
| Total Families | 3,862 (100.0%) | 2.91 |
Median Household Size in Glasgow
The median household size in Glasgow is 2.31 persons per household, with single female/mother households (856 | 13.8%) accounting for the largest median household size of 3.24 persons per household. non-family households (2,360 | 37.9%) represent the smallest median household size with 1.18 persons per household.
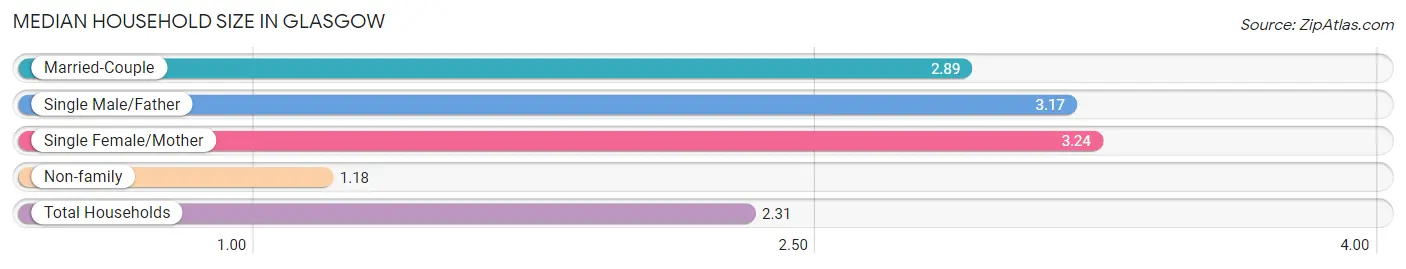
| Household Type | # Households | Household Size |
| Married-Couple | 2,513 (40.4%) | 2.89 |
| Single Male/Father | 493 (7.9%) | 3.17 |
| Single Female/Mother | 856 (13.8%) | 3.24 |
| Non-family | 2,360 (37.9%) | 1.18 |
| Total Households | 6,222 (100.0%) | 2.31 |
Household Size by Marriage Status in Glasgow
Out of a total of 6,222 households in Glasgow, 3,862 (62.1%) are family households, while 2,360 (37.9%) are nonfamily households. The most numerous type of family households are 2-person households, comprising 1,912, and the most common type of nonfamily households are 1-person households, comprising 2,023.
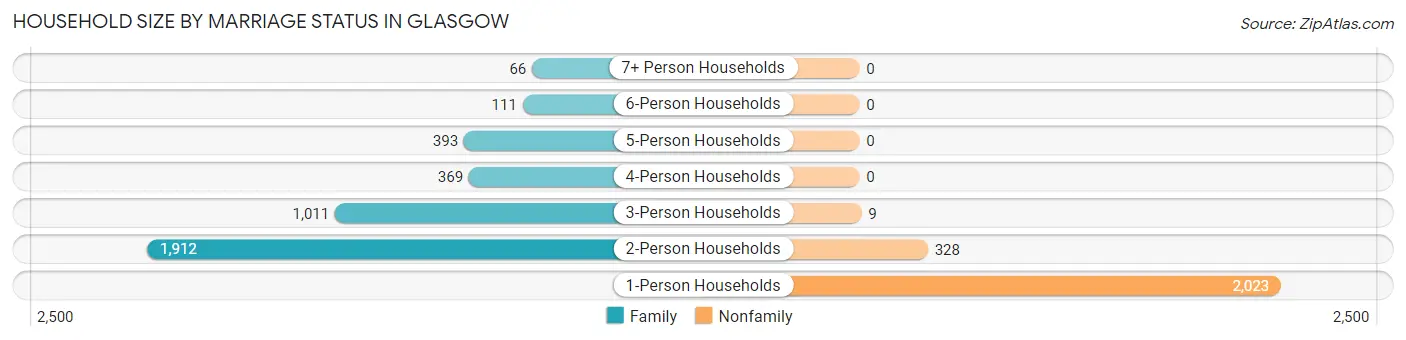
| Household Size | Family Households | Nonfamily Households |
| 1-Person Households | - | 2,023 (32.5%) |
| 2-Person Households | 1,912 (30.7%) | 328 (5.3%) |
| 3-Person Households | 1,011 (16.3%) | 9 (0.1%) |
| 4-Person Households | 369 (5.9%) | 0 (0.0%) |
| 5-Person Households | 393 (6.3%) | 0 (0.0%) |
| 6-Person Households | 111 (1.8%) | 0 (0.0%) |
| 7+ Person Households | 66 (1.1%) | 0 (0.0%) |
| Total | 3,862 (62.1%) | 2,360 (37.9%) |
Female Fertility in Glasgow
Fertility by Age in Glasgow
Average fertility rate in Glasgow is 74.0 births per 1,000 women. Women in the age bracket of 20 to 34 years have the highest fertility rate with 186.0 births per 1,000 women. Women in the age bracket of 20 to 34 years acount for 96.4% of all women with births.
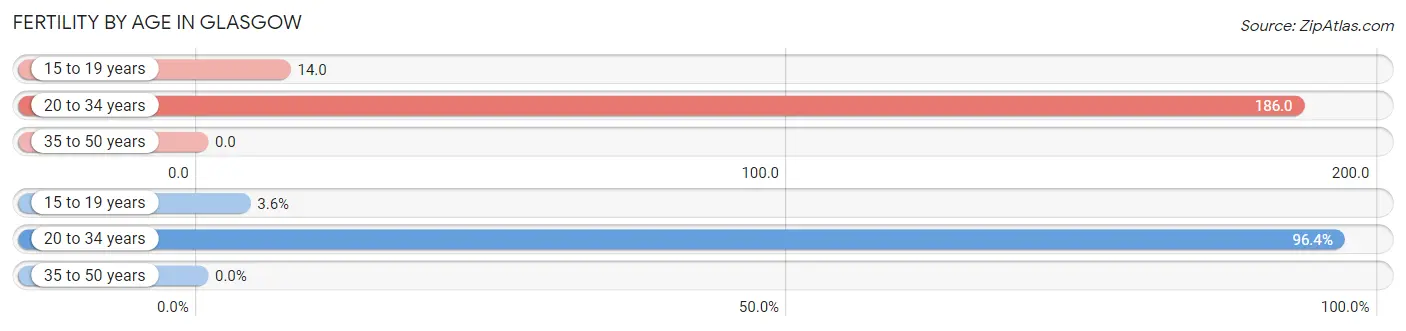
| Age Bracket | Women with Births | Births / 1,000 Women |
| 15 to 19 years | 8 (3.6%) | 14.0 |
| 20 to 34 years | 215 (96.4%) | 186.0 |
| 35 to 50 years | 0 (0.0%) | 0.0 |
| Total | 223 (100.0%) | 74.0 |
Fertility by Age by Marriage Status in Glasgow
25.6% of women with births (223) in Glasgow are married. The highest percentage of unmarried women with births falls into 15 to 19 years age bracket with 100.0% of them unmarried at the time of birth, while the lowest percentage of unmarried women with births belong to 20 to 34 years age bracket with 73.5% of them unmarried.
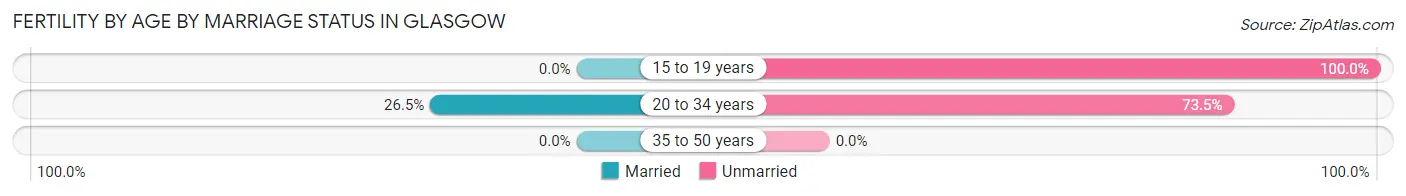
| Age Bracket | Married | Unmarried |
| 15 to 19 years | 0 (0.0%) | 8 (100.0%) |
| 20 to 34 years | 57 (26.5%) | 158 (73.5%) |
| 35 to 50 years | 0 (0.0%) | 0 (0.0%) |
| Total | 57 (25.6%) | 166 (74.4%) |
Fertility by Education in Glasgow
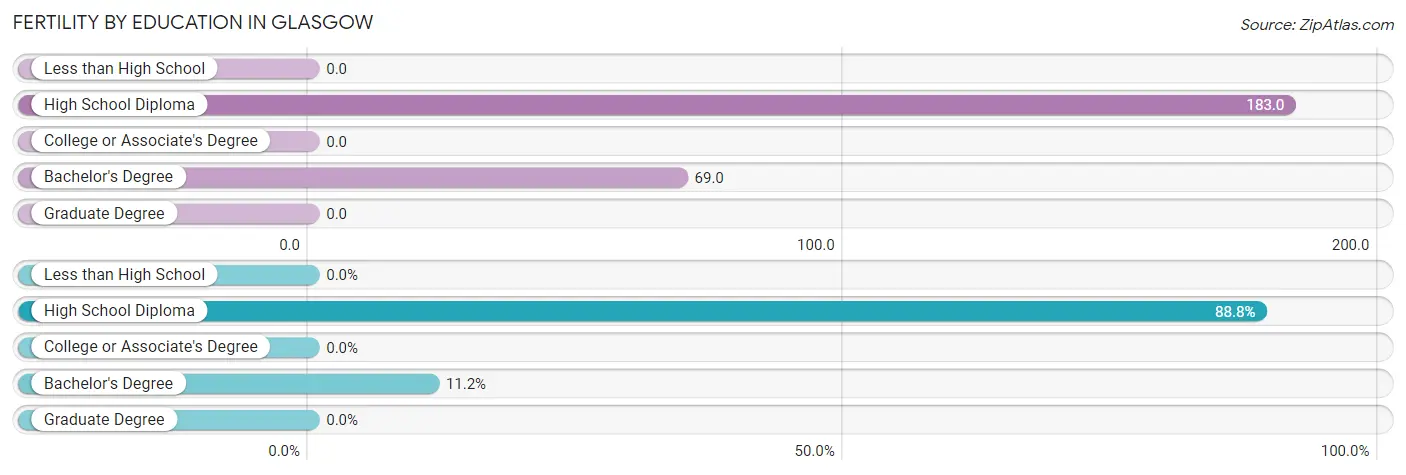
| Educational Attainment | Women with Births | Births / 1,000 Women |
| Less than High School | 0 (0.0%) | 0.0 |
| High School Diploma | 198 (88.8%) | 183.0 |
| College or Associate's Degree | 0 (0.0%) | 0.0 |
| Bachelor's Degree | 25 (11.2%) | 69.0 |
| Graduate Degree | 0 (0.0%) | 0.0 |
| Total | 223 (100.0%) | 74.0 |
Fertility by Education by Marriage Status in Glasgow
74.4% of women with births in Glasgow are unmarried. Women with the educational attainment of bachelor's degree are most likely to be married with 100.0% of them married at childbirth, while women with the educational attainment of high school diploma are least likely to be married with 83.8% of them unmarried at childbirth.
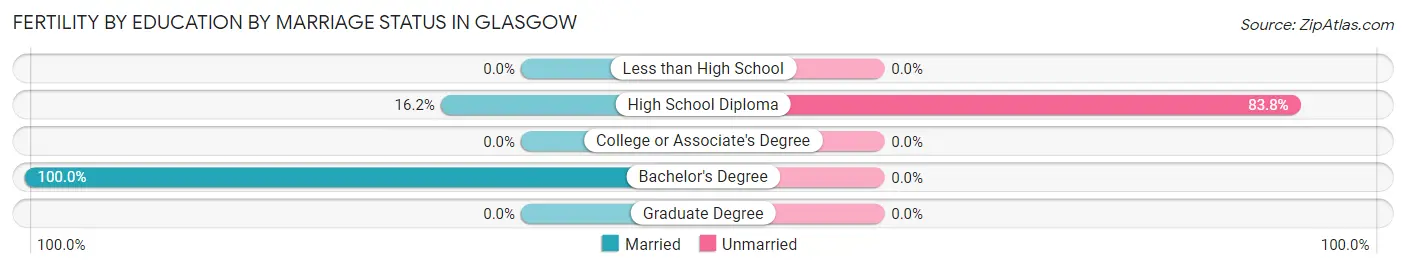
| Educational Attainment | Married | Unmarried |
| Less than High School | 0 (0.0%) | 0 (0.0%) |
| High School Diploma | 32 (16.2%) | 166 (83.8%) |
| College or Associate's Degree | 0 (0.0%) | 0 (0.0%) |
| Bachelor's Degree | 25 (100.0%) | 0 (0.0%) |
| Graduate Degree | 0 (0.0%) | 0 (0.0%) |
| Total | 57 (25.6%) | 166 (74.4%) |
Employment Characteristics in Glasgow
Employment by Class of Employer in Glasgow
Among the 5,726 employed individuals in Glasgow, private company employees (4,002 | 69.9%), not-for-profit organizations (423 | 7.4%), and self-employed (not incorporated) (386 | 6.7%) make up the most common classes of employment.
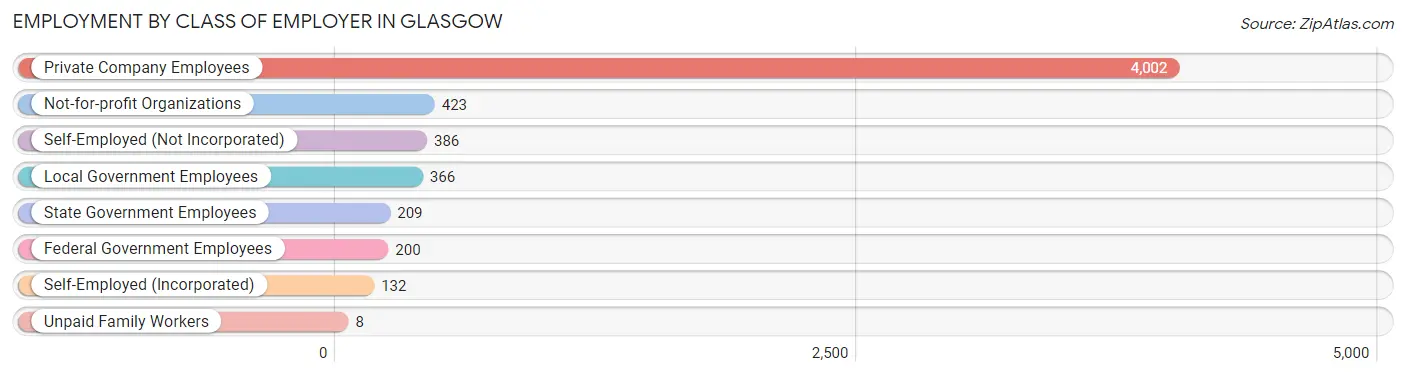
| Employer Class | # Employees | % Employees |
| Private Company Employees | 4,002 | 69.9% |
| Self-Employed (Incorporated) | 132 | 2.3% |
| Self-Employed (Not Incorporated) | 386 | 6.7% |
| Not-for-profit Organizations | 423 | 7.4% |
| Local Government Employees | 366 | 6.4% |
| State Government Employees | 209 | 3.6% |
| Federal Government Employees | 200 | 3.5% |
| Unpaid Family Workers | 8 | 0.1% |
| Total | 5,726 | 100.0% |
Employment Status by Age in Glasgow
According to the labor force statistics for Glasgow, out of the total population over 16 years of age (12,086), 50.4% or 6,091 individuals are in the labor force, with 5.1% or 311 of them unemployed. The age group with the highest labor force participation rate is 20 to 24 years, with 95.1% or 720 individuals in the labor force. Within the labor force, the 16 to 19 years age range has the highest percentage of unemployed individuals, with 15.5% or 47 of them being unemployed.
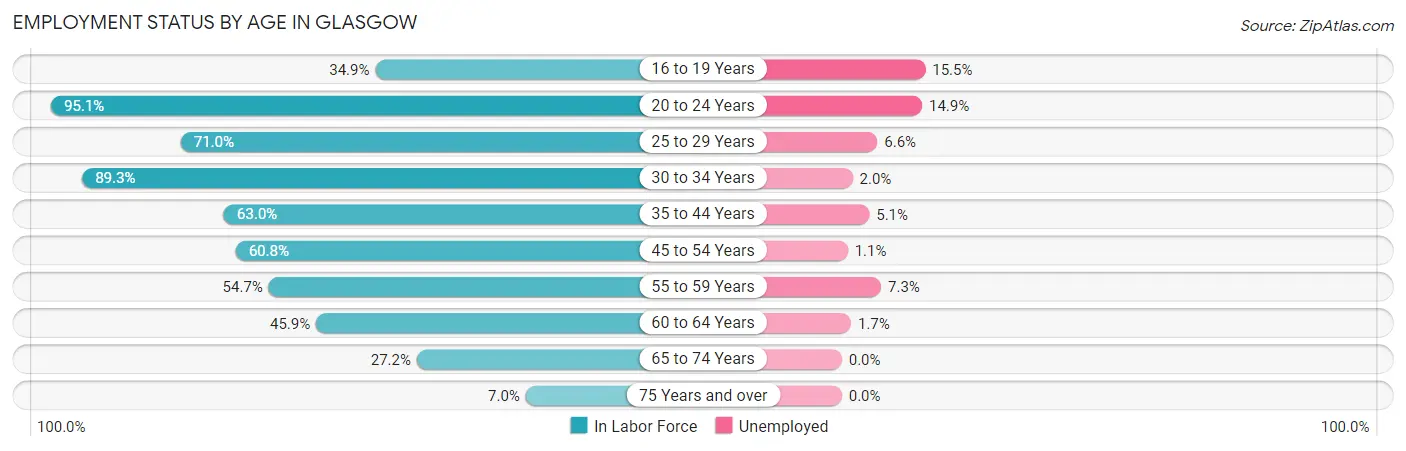
| Age Bracket | In Labor Force | Unemployed |
| 16 to 19 Years | 301 (34.9%) | 47 (15.5%) |
| 20 to 24 Years | 720 (95.1%) | 107 (14.9%) |
| 25 to 29 Years | 453 (71.0%) | 30 (6.6%) |
| 30 to 34 Years | 911 (89.3%) | 18 (2.0%) |
| 35 to 44 Years | 1,088 (63.0%) | 55 (5.1%) |
| 45 to 54 Years | 1,066 (60.8%) | 12 (1.1%) |
| 55 to 59 Years | 436 (54.7%) | 32 (7.3%) |
| 60 to 64 Years | 527 (45.9%) | 9 (1.7%) |
| 65 to 74 Years | 485 (27.2%) | 0 (0.0%) |
| 75 Years and over | 112 (7.0%) | 0 (0.0%) |
| Total | 6,091 (50.4%) | 311 (5.1%) |
Employment Status by Educational Attainment in Glasgow
According to labor force statistics for Glasgow, 63.3% of individuals (4,484) out of the total population between 25 and 64 years of age (7,083) are in the labor force, with 3.5% or 157 of them being unemployed. The group with the highest labor force participation rate are those with the educational attainment of bachelor's degree or higher, with 75.0% or 1,338 individuals in the labor force. Within the labor force, individuals with less than high school education have the highest percentage of unemployment, with 9.2% or 32 of them being unemployed.
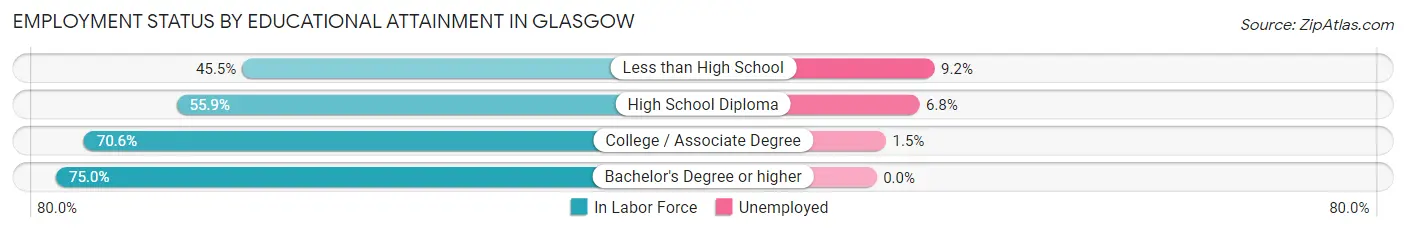
| Educational Attainment | In Labor Force | Unemployed |
| Less than High School | 348 (45.5%) | 70 (9.2%) |
| High School Diploma | 1,547 (55.9%) | 188 (6.8%) |
| College / Associate Degree | 1,247 (70.6%) | 26 (1.5%) |
| Bachelor's Degree or higher | 1,338 (75.0%) | 0 (0.0%) |
| Total | 4,484 (63.3%) | 248 (3.5%) |
Employment Occupations by Sex in Glasgow
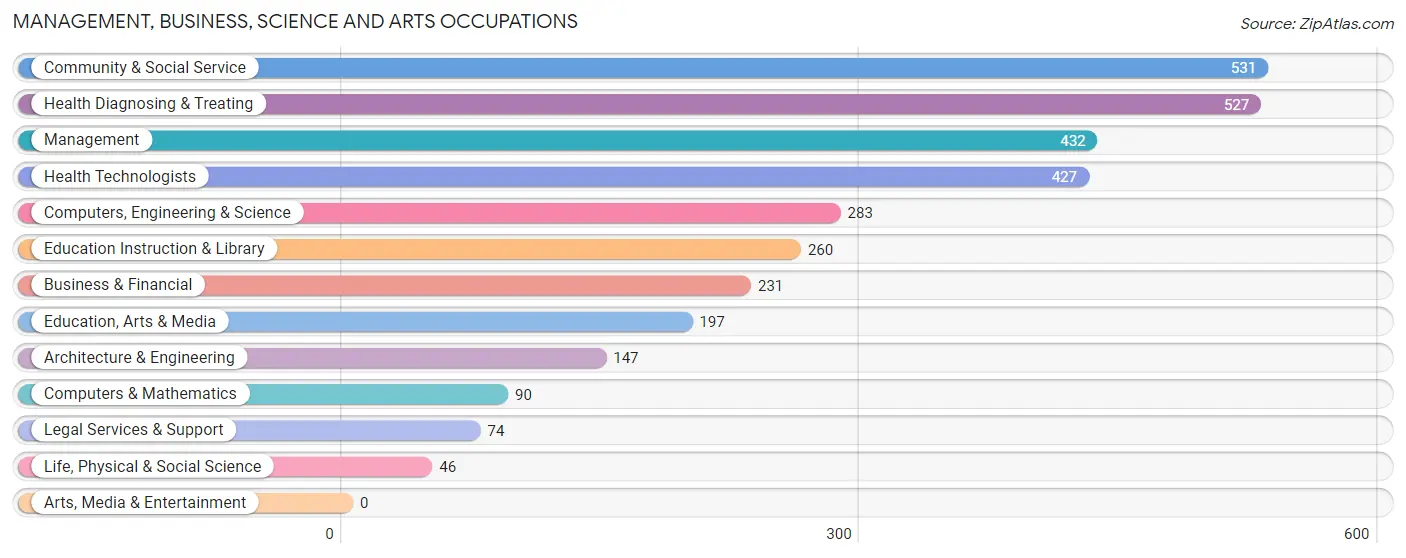
Management, Business, Science and Arts Occupations
The most common Management, Business, Science and Arts occupations in Glasgow are Community & Social Service (531 | 9.2%), Health Diagnosing & Treating (527 | 9.1%), Management (432 | 7.5%), Health Technologists (427 | 7.4%), and Computers, Engineering & Science (283 | 4.9%).
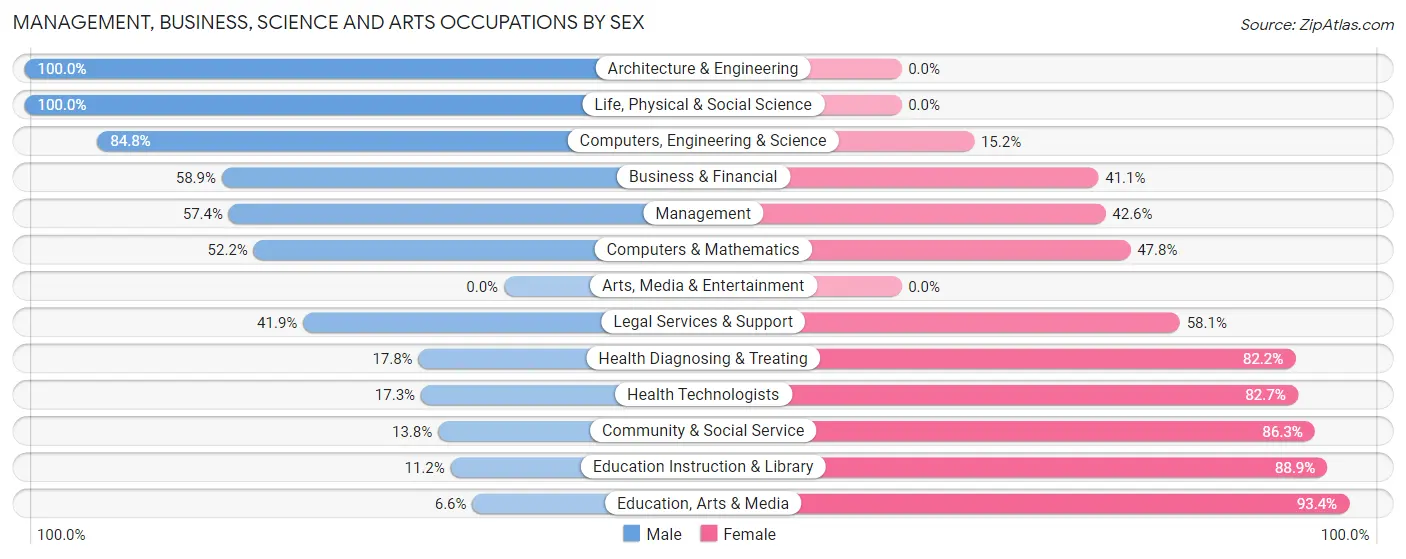
Management, Business, Science and Arts Occupations by Sex
Within the Management, Business, Science and Arts occupations in Glasgow, the most male-oriented occupations are Architecture & Engineering (100.0%), Life, Physical & Social Science (100.0%), and Computers, Engineering & Science (84.8%), while the most female-oriented occupations are Education, Arts & Media (93.4%), Education Instruction & Library (88.8%), and Community & Social Service (86.3%).
| Occupation | Male | Female |
| Management | 248 (57.4%) | 184 (42.6%) |
| Business & Financial | 136 (58.9%) | 95 (41.1%) |
| Computers, Engineering & Science | 240 (84.8%) | 43 (15.2%) |
| Computers & Mathematics | 47 (52.2%) | 43 (47.8%) |
| Architecture & Engineering | 147 (100.0%) | 0 (0.0%) |
| Life, Physical & Social Science | 46 (100.0%) | 0 (0.0%) |
| Community & Social Service | 73 (13.8%) | 458 (86.3%) |
| Education, Arts & Media | 13 (6.6%) | 184 (93.4%) |
| Legal Services & Support | 31 (41.9%) | 43 (58.1%) |
| Education Instruction & Library | 29 (11.2%) | 231 (88.8%) |
| Arts, Media & Entertainment | 0 (0.0%) | 0 (0.0%) |
| Health Diagnosing & Treating | 94 (17.8%) | 433 (82.2%) |
| Health Technologists | 74 (17.3%) | 353 (82.7%) |
| Total (Category) | 791 (39.5%) | 1,213 (60.5%) |
| Total (Overall) | 2,944 (50.9%) | 2,834 (49.0%) |
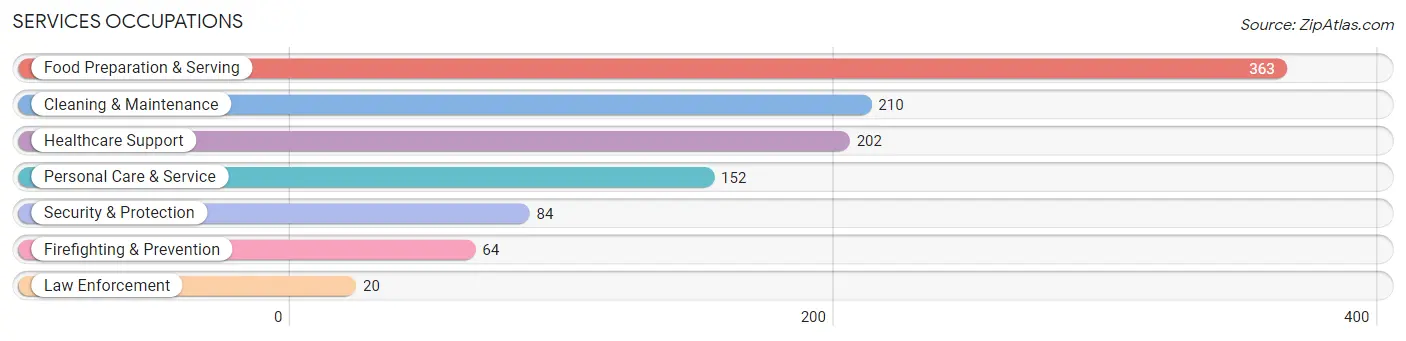
Services Occupations
The most common Services occupations in Glasgow are Food Preparation & Serving (363 | 6.3%), Cleaning & Maintenance (210 | 3.6%), Healthcare Support (202 | 3.5%), Personal Care & Service (152 | 2.6%), and Security & Protection (84 | 1.5%).
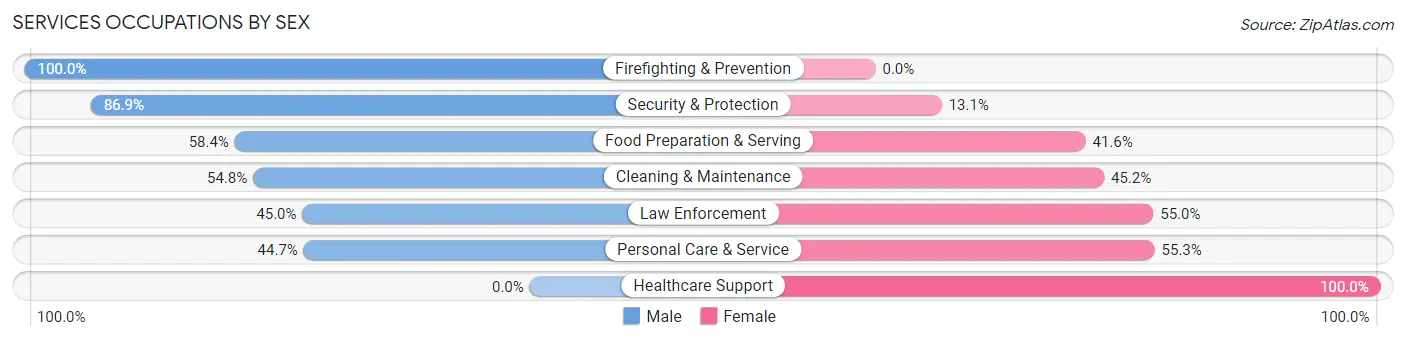
Services Occupations by Sex
Within the Services occupations in Glasgow, the most male-oriented occupations are Firefighting & Prevention (100.0%), Security & Protection (86.9%), and Food Preparation & Serving (58.4%), while the most female-oriented occupations are Healthcare Support (100.0%), Personal Care & Service (55.3%), and Law Enforcement (55.0%).
| Occupation | Male | Female |
| Healthcare Support | 0 (0.0%) | 202 (100.0%) |
| Security & Protection | 73 (86.9%) | 11 (13.1%) |
| Firefighting & Prevention | 64 (100.0%) | 0 (0.0%) |
| Law Enforcement | 9 (45.0%) | 11 (55.0%) |
| Food Preparation & Serving | 212 (58.4%) | 151 (41.6%) |
| Cleaning & Maintenance | 115 (54.8%) | 95 (45.2%) |
| Personal Care & Service | 68 (44.7%) | 84 (55.3%) |
| Total (Category) | 468 (46.3%) | 543 (53.7%) |
| Total (Overall) | 2,944 (50.9%) | 2,834 (49.0%) |
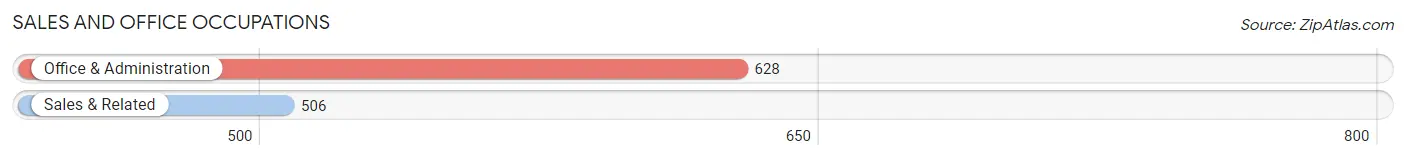
Sales and Office Occupations
The most common Sales and Office occupations in Glasgow are Office & Administration (628 | 10.9%), and Sales & Related (506 | 8.8%).
Sales and Office Occupations by Sex
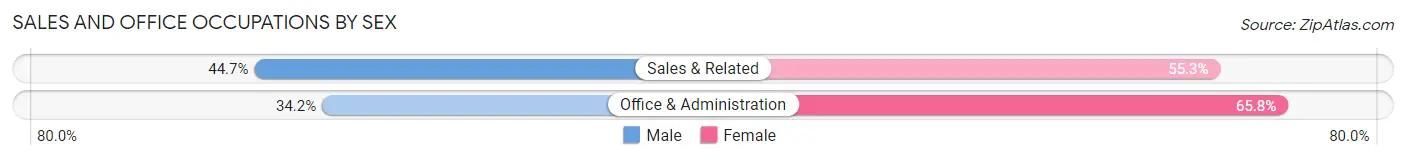
| Occupation | Male | Female |
| Sales & Related | 226 (44.7%) | 280 (55.3%) |
| Office & Administration | 215 (34.2%) | 413 (65.8%) |
| Total (Category) | 441 (38.9%) | 693 (61.1%) |
| Total (Overall) | 2,944 (50.9%) | 2,834 (49.0%) |
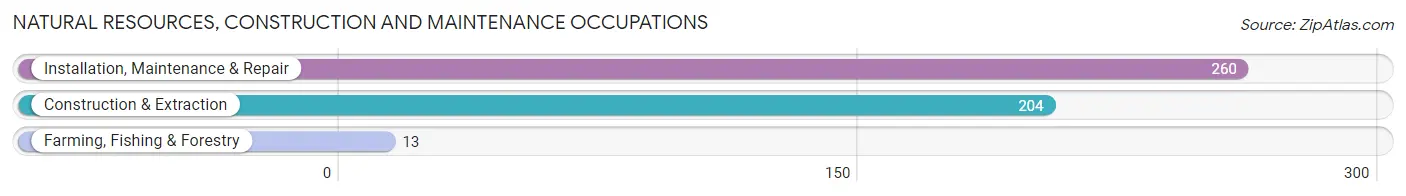
Natural Resources, Construction and Maintenance Occupations
The most common Natural Resources, Construction and Maintenance occupations in Glasgow are Installation, Maintenance & Repair (260 | 4.5%), Construction & Extraction (204 | 3.5%), and Farming, Fishing & Forestry (13 | 0.2%).
Natural Resources, Construction and Maintenance Occupations by Sex
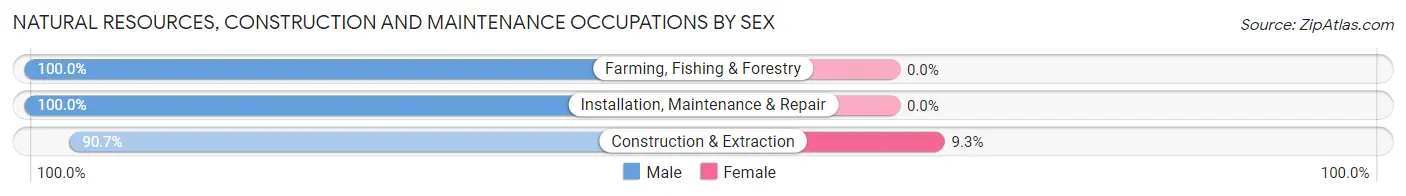
| Occupation | Male | Female |
| Farming, Fishing & Forestry | 13 (100.0%) | 0 (0.0%) |
| Construction & Extraction | 185 (90.7%) | 19 (9.3%) |
| Installation, Maintenance & Repair | 260 (100.0%) | 0 (0.0%) |
| Total (Category) | 458 (96.0%) | 19 (4.0%) |
| Total (Overall) | 2,944 (50.9%) | 2,834 (49.0%) |
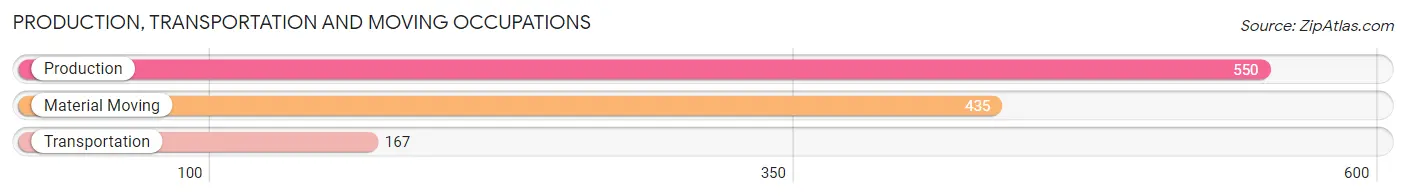
Production, Transportation and Moving Occupations
The most common Production, Transportation and Moving occupations in Glasgow are Production (550 | 9.5%), Material Moving (435 | 7.5%), and Transportation (167 | 2.9%).
Production, Transportation and Moving Occupations by Sex
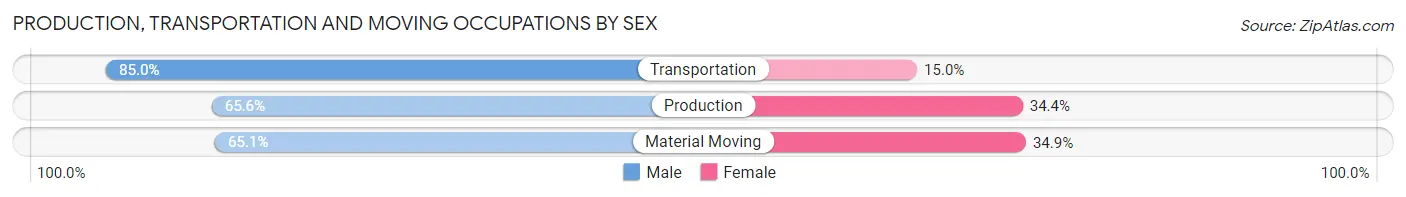
| Occupation | Male | Female |
| Production | 361 (65.6%) | 189 (34.4%) |
| Transportation | 142 (85.0%) | 25 (15.0%) |
| Material Moving | 283 (65.1%) | 152 (34.9%) |
| Total (Category) | 786 (68.2%) | 366 (31.8%) |
| Total (Overall) | 2,944 (50.9%) | 2,834 (49.0%) |
Employment Industries by Sex in Glasgow
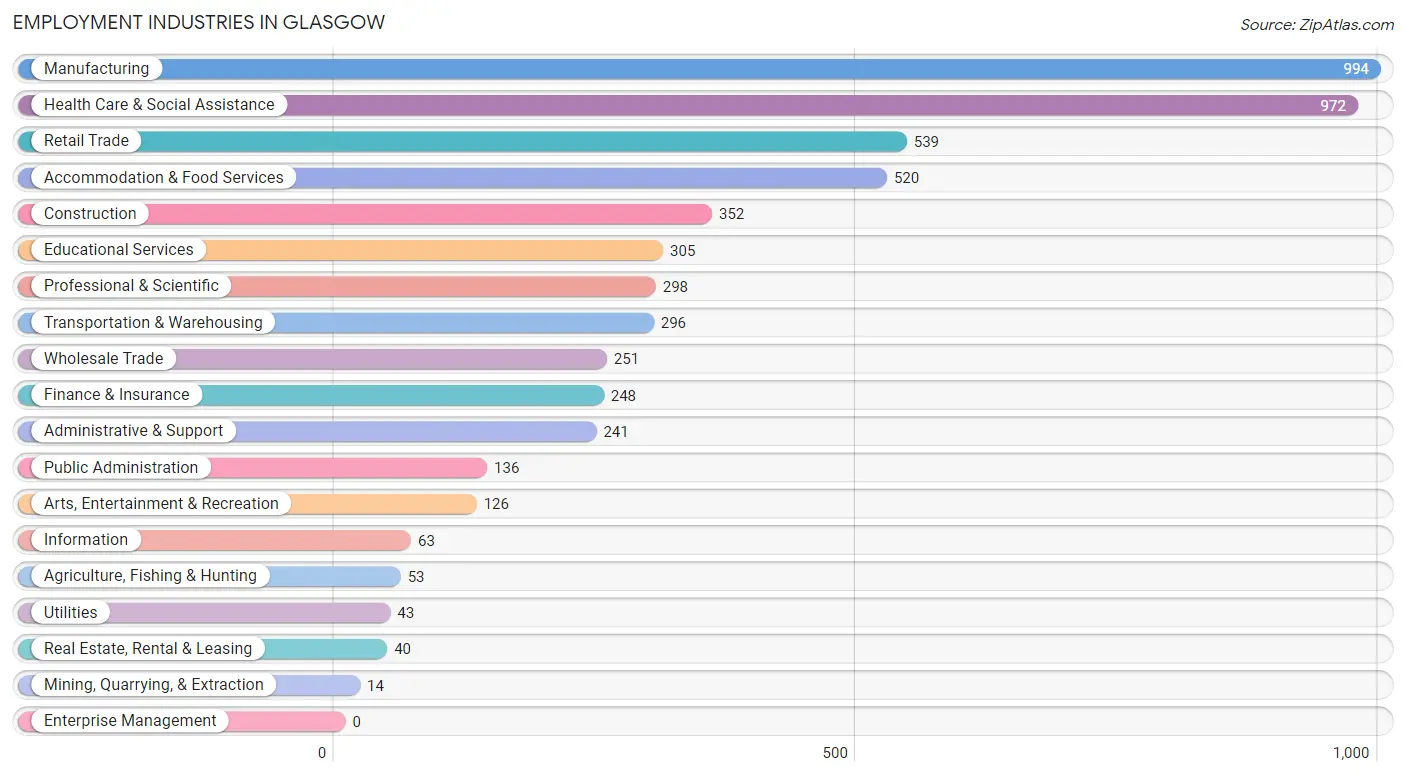
Employment Industries in Glasgow
The major employment industries in Glasgow include Manufacturing (994 | 17.2%), Health Care & Social Assistance (972 | 16.8%), Retail Trade (539 | 9.3%), Accommodation & Food Services (520 | 9.0%), and Construction (352 | 6.1%).
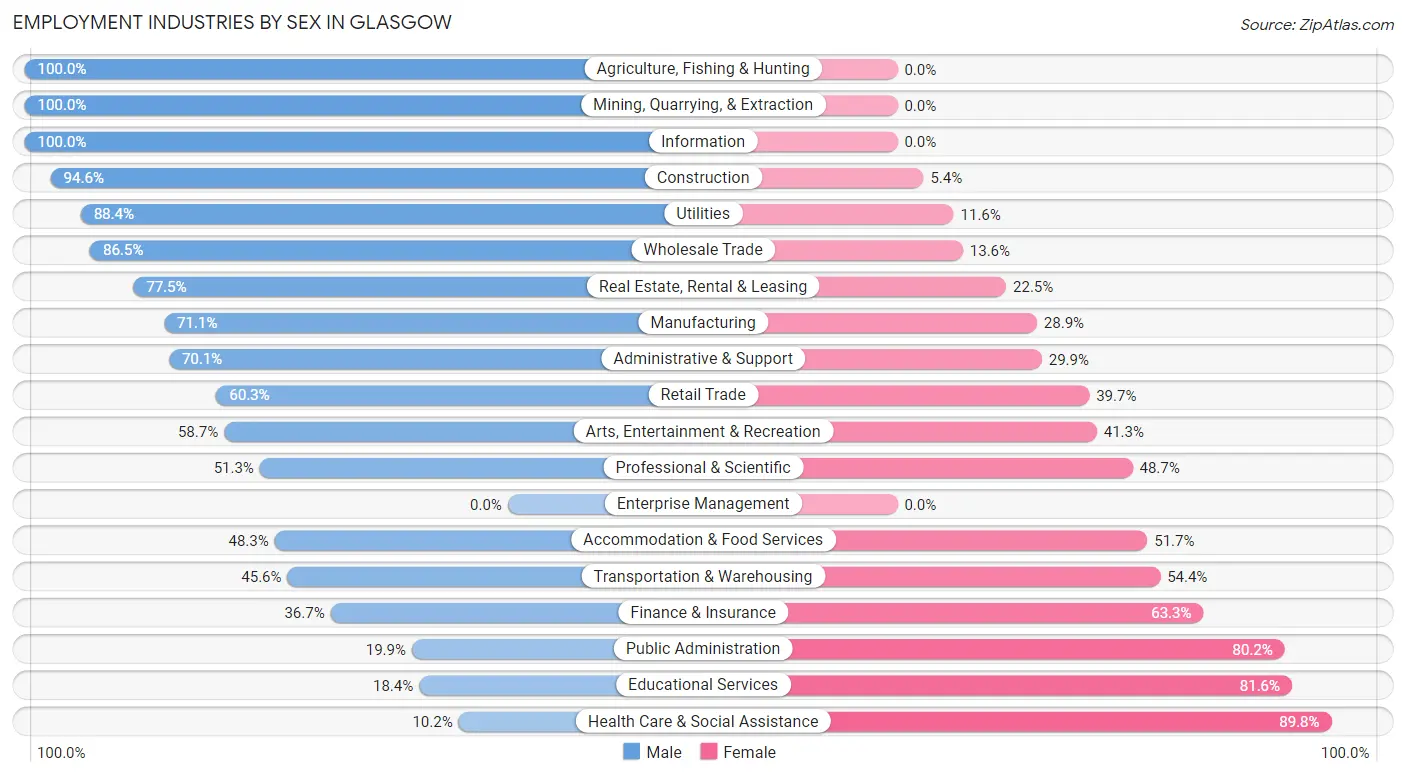
Employment Industries by Sex in Glasgow
The Glasgow industries that see more men than women are Agriculture, Fishing & Hunting (100.0%), Mining, Quarrying, & Extraction (100.0%), and Information (100.0%), whereas the industries that tend to have a higher number of women are Health Care & Social Assistance (89.8%), Educational Services (81.6%), and Public Administration (80.1%).
| Industry | Male | Female |
| Agriculture, Fishing & Hunting | 53 (100.0%) | 0 (0.0%) |
| Mining, Quarrying, & Extraction | 14 (100.0%) | 0 (0.0%) |
| Construction | 333 (94.6%) | 19 (5.4%) |
| Manufacturing | 707 (71.1%) | 287 (28.9%) |
| Wholesale Trade | 217 (86.5%) | 34 (13.6%) |
| Retail Trade | 325 (60.3%) | 214 (39.7%) |
| Transportation & Warehousing | 135 (45.6%) | 161 (54.4%) |
| Utilities | 38 (88.4%) | 5 (11.6%) |
| Information | 63 (100.0%) | 0 (0.0%) |
| Finance & Insurance | 91 (36.7%) | 157 (63.3%) |
| Real Estate, Rental & Leasing | 31 (77.5%) | 9 (22.5%) |
| Professional & Scientific | 153 (51.3%) | 145 (48.7%) |
| Enterprise Management | 0 (0.0%) | 0 (0.0%) |
| Administrative & Support | 169 (70.1%) | 72 (29.9%) |
| Educational Services | 56 (18.4%) | 249 (81.6%) |
| Health Care & Social Assistance | 99 (10.2%) | 873 (89.8%) |
| Arts, Entertainment & Recreation | 74 (58.7%) | 52 (41.3%) |
| Accommodation & Food Services | 251 (48.3%) | 269 (51.7%) |
| Public Administration | 27 (19.9%) | 109 (80.1%) |
| Total | 2,944 (50.9%) | 2,834 (49.0%) |
Education in Glasgow
School Enrollment in Glasgow
The most common levels of schooling among the 3,032 students in Glasgow are middle school (866 | 28.6%), elementary school (846 | 27.9%), and high school (675 | 22.3%).
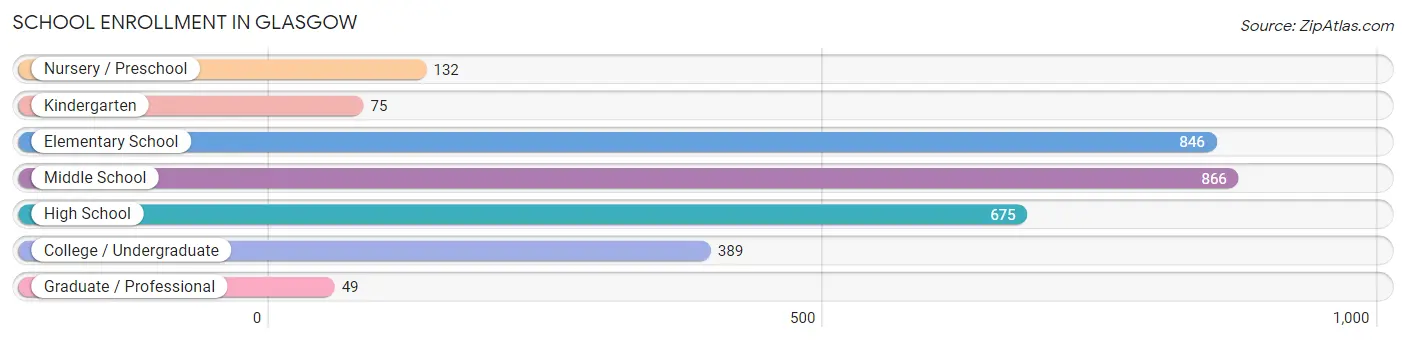
| School Level | # Students | % Students |
| Nursery / Preschool | 132 | 4.3% |
| Kindergarten | 75 | 2.5% |
| Elementary School | 846 | 27.9% |
| Middle School | 866 | 28.6% |
| High School | 675 | 22.3% |
| College / Undergraduate | 389 | 12.8% |
| Graduate / Professional | 49 | 1.6% |
| Total | 3,032 | 100.0% |
School Enrollment by Age by Funding Source in Glasgow
Out of a total of 3,032 students who are enrolled in schools in Glasgow, 418 (13.8%) attend a private institution, while the remaining 2,614 (86.2%) are enrolled in public schools. The age group of 25 to 34 year olds has the highest likelihood of being enrolled in private schools, with 76 (55.9% in the age bracket) enrolled. Conversely, the age group of 3 to 4 year olds has the lowest likelihood of being enrolled in a private school, with 108 (100.0% in the age bracket) attending a public institution.
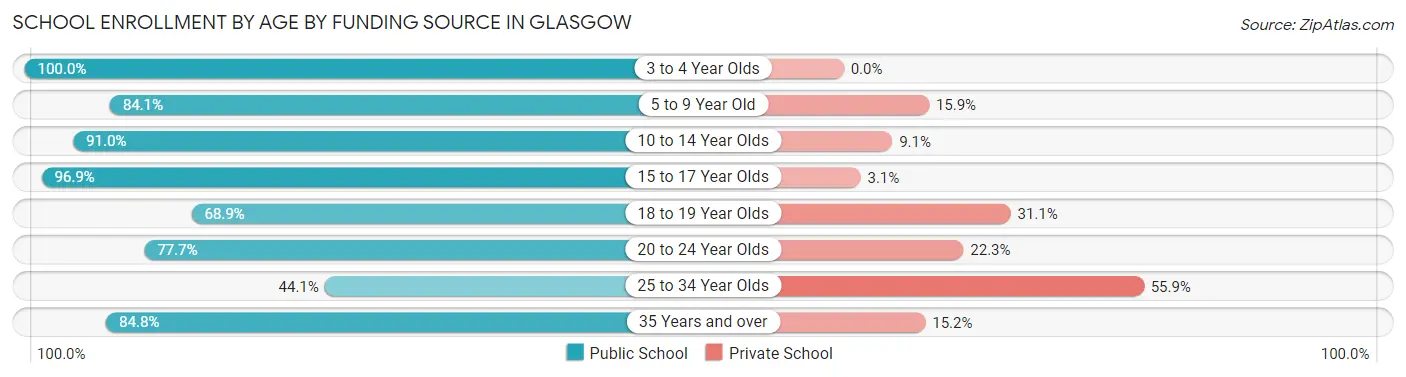
| Age Bracket | Public School | Private School |
| 3 to 4 Year Olds | 108 (100.0%) | 0 (0.0%) |
| 5 to 9 Year Old | 673 (84.1%) | 127 (15.9%) |
| 10 to 14 Year Olds | 975 (90.9%) | 97 (9.0%) |
| 15 to 17 Year Olds | 462 (96.9%) | 15 (3.1%) |
| 18 to 19 Year Olds | 102 (68.9%) | 46 (31.1%) |
| 20 to 24 Year Olds | 129 (77.7%) | 37 (22.3%) |
| 25 to 34 Year Olds | 60 (44.1%) | 76 (55.9%) |
| 35 Years and over | 106 (84.8%) | 19 (15.2%) |
| Total | 2,614 (86.2%) | 418 (13.8%) |
Educational Attainment by Field of Study in Glasgow
Education (420 | 16.5%), science & technology (358 | 14.0%), business (358 | 14.0%), bio, nature & agricultural (276 | 10.8%), and social sciences (210 | 8.2%) are the most common fields of study among 2,551 individuals in Glasgow who have obtained a bachelor's degree or higher.
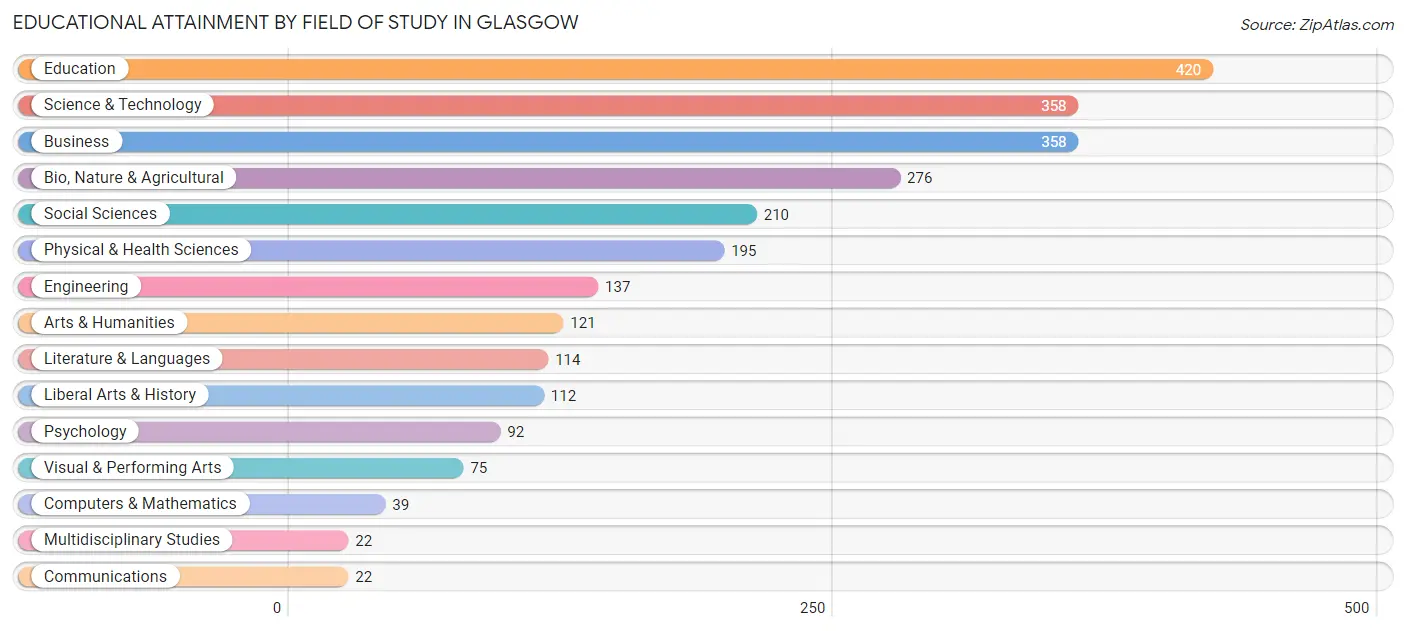
| Field of Study | # Graduates | % Graduates |
| Computers & Mathematics | 39 | 1.5% |
| Bio, Nature & Agricultural | 276 | 10.8% |
| Physical & Health Sciences | 195 | 7.6% |
| Psychology | 92 | 3.6% |
| Social Sciences | 210 | 8.2% |
| Engineering | 137 | 5.4% |
| Multidisciplinary Studies | 22 | 0.9% |
| Science & Technology | 358 | 14.0% |
| Business | 358 | 14.0% |
| Education | 420 | 16.5% |
| Literature & Languages | 114 | 4.5% |
| Liberal Arts & History | 112 | 4.4% |
| Visual & Performing Arts | 75 | 2.9% |
| Communications | 22 | 0.9% |
| Arts & Humanities | 121 | 4.7% |
| Total | 2,551 | 100.0% |
Transportation & Commute in Glasgow
Vehicle Availability by Sex in Glasgow
The most prevalent vehicle ownership categories in Glasgow are males with 2 vehicles (1,099, accounting for 37.8%) and females with 2 vehicles (1,252, making up 39.0%).
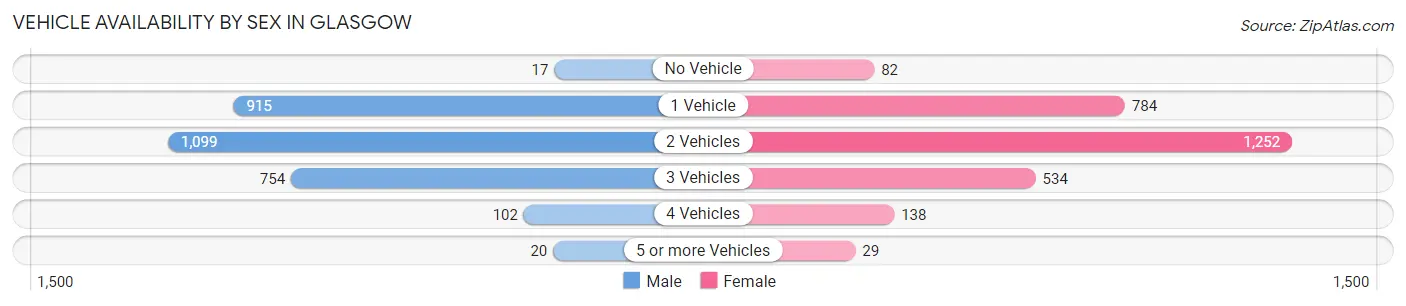
| Vehicles Available | Male | Female |
| No Vehicle | 17 (0.6%) | 82 (2.9%) |
| 1 Vehicle | 915 (31.5%) | 784 (27.8%) |
| 2 Vehicles | 1,099 (37.8%) | 1,252 (44.4%) |
| 3 Vehicles | 754 (25.9%) | 534 (18.9%) |
| 4 Vehicles | 102 (3.5%) | 138 (4.9%) |
| 5 or more Vehicles | 20 (0.7%) | 29 (1.0%) |
| Total | 2,907 (100.0%) | 2,819 (100.0%) |
Commute Time in Glasgow
The most frequently occuring commute durations in Glasgow are 5 to 9 minutes (1,510 commuters, 27.3%), 10 to 14 minutes (1,282 commuters, 23.1%), and 30 to 34 minutes (772 commuters, 13.9%).
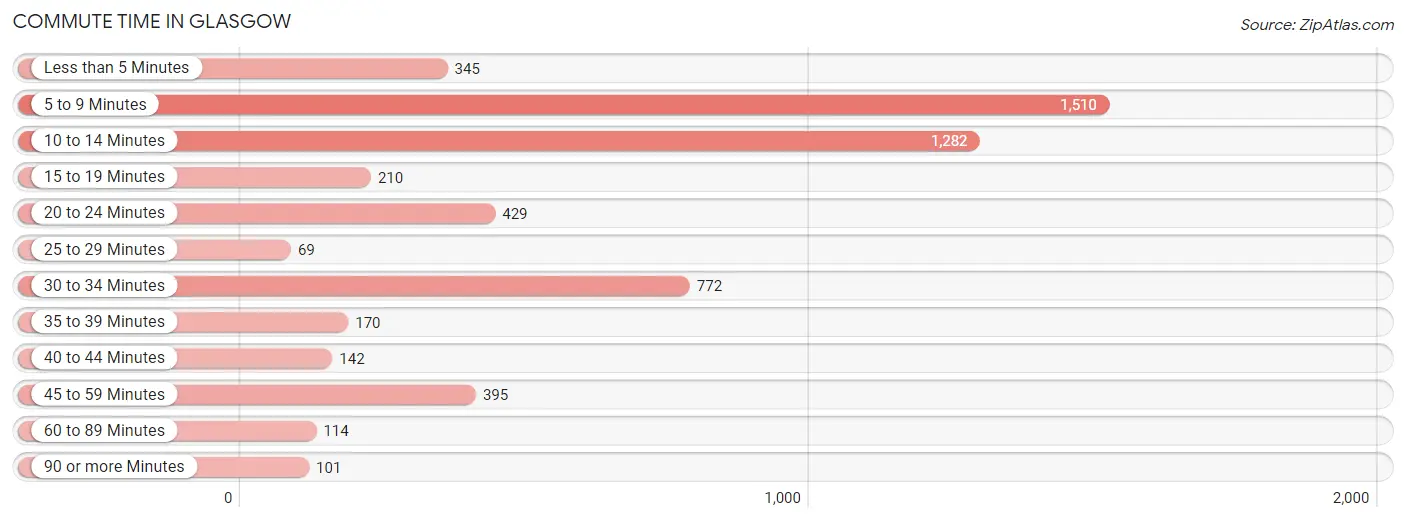
| Commute Time | # Commuters | % Commuters |
| Less than 5 Minutes | 345 | 6.2% |
| 5 to 9 Minutes | 1,510 | 27.3% |
| 10 to 14 Minutes | 1,282 | 23.1% |
| 15 to 19 Minutes | 210 | 3.8% |
| 20 to 24 Minutes | 429 | 7.7% |
| 25 to 29 Minutes | 69 | 1.3% |
| 30 to 34 Minutes | 772 | 13.9% |
| 35 to 39 Minutes | 170 | 3.1% |
| 40 to 44 Minutes | 142 | 2.6% |
| 45 to 59 Minutes | 395 | 7.1% |
| 60 to 89 Minutes | 114 | 2.1% |
| 90 or more Minutes | 101 | 1.8% |
Commute Time by Sex in Glasgow
The most common commute times in Glasgow are 10 to 14 minutes (593 commuters, 21.0%) for males and 5 to 9 minutes (932 commuters, 34.3%) for females.
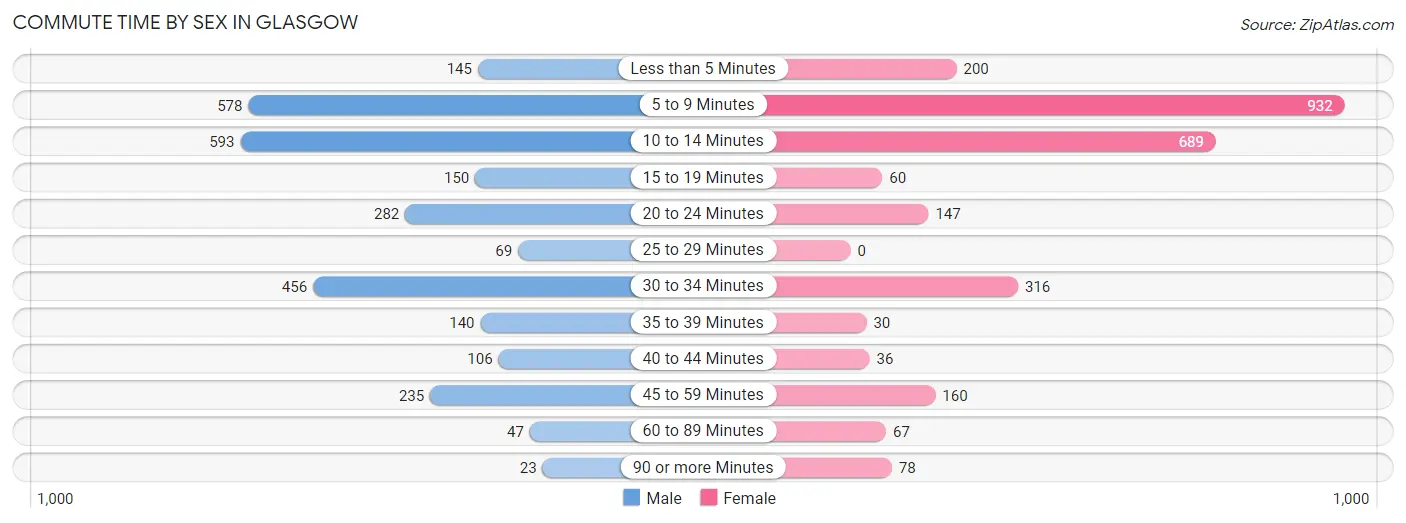
| Commute Time | Male | Female |
| Less than 5 Minutes | 145 (5.1%) | 200 (7.4%) |
| 5 to 9 Minutes | 578 (20.5%) | 932 (34.3%) |
| 10 to 14 Minutes | 593 (21.0%) | 689 (25.4%) |
| 15 to 19 Minutes | 150 (5.3%) | 60 (2.2%) |
| 20 to 24 Minutes | 282 (10.0%) | 147 (5.4%) |
| 25 to 29 Minutes | 69 (2.4%) | 0 (0.0%) |
| 30 to 34 Minutes | 456 (16.2%) | 316 (11.6%) |
| 35 to 39 Minutes | 140 (5.0%) | 30 (1.1%) |
| 40 to 44 Minutes | 106 (3.7%) | 36 (1.3%) |
| 45 to 59 Minutes | 235 (8.3%) | 160 (5.9%) |
| 60 to 89 Minutes | 47 (1.7%) | 67 (2.5%) |
| 90 or more Minutes | 23 (0.8%) | 78 (2.9%) |
Time of Departure to Work by Sex in Glasgow
The most frequent times of departure to work in Glasgow are 7:00 AM to 7:29 AM (496, 17.6%) for males and 6:30 AM to 6:59 AM (581, 21.4%) for females.
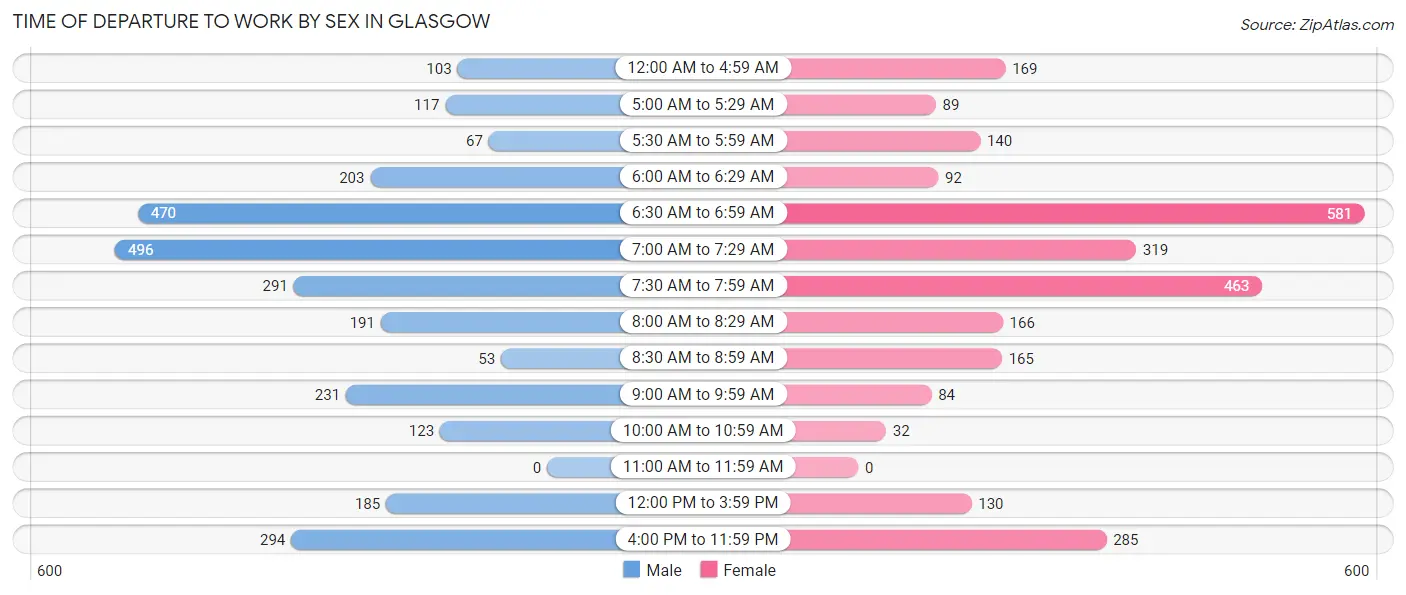
| Time of Departure | Male | Female |
| 12:00 AM to 4:59 AM | 103 (3.6%) | 169 (6.2%) |
| 5:00 AM to 5:29 AM | 117 (4.1%) | 89 (3.3%) |
| 5:30 AM to 5:59 AM | 67 (2.4%) | 140 (5.2%) |
| 6:00 AM to 6:29 AM | 203 (7.2%) | 92 (3.4%) |
| 6:30 AM to 6:59 AM | 470 (16.6%) | 581 (21.4%) |
| 7:00 AM to 7:29 AM | 496 (17.6%) | 319 (11.7%) |
| 7:30 AM to 7:59 AM | 291 (10.3%) | 463 (17.1%) |
| 8:00 AM to 8:29 AM | 191 (6.8%) | 166 (6.1%) |
| 8:30 AM to 8:59 AM | 53 (1.9%) | 165 (6.1%) |
| 9:00 AM to 9:59 AM | 231 (8.2%) | 84 (3.1%) |
| 10:00 AM to 10:59 AM | 123 (4.4%) | 32 (1.2%) |
| 11:00 AM to 11:59 AM | 0 (0.0%) | 0 (0.0%) |
| 12:00 PM to 3:59 PM | 185 (6.6%) | 130 (4.8%) |
| 4:00 PM to 11:59 PM | 294 (10.4%) | 285 (10.5%) |
| Total | 2,824 (100.0%) | 2,715 (100.0%) |
Housing Occupancy in Glasgow
Occupancy by Ownership in Glasgow
Of the total 6,222 dwellings in Glasgow, owner-occupied units account for 3,204 (51.5%), while renter-occupied units make up 3,018 (48.5%).
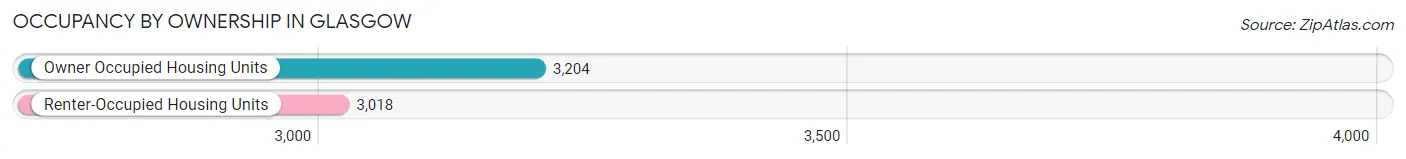
| Occupancy | # Housing Units | % Housing Units |
| Owner Occupied Housing Units | 3,204 | 51.5% |
| Renter-Occupied Housing Units | 3,018 | 48.5% |
| Total Occupied Housing Units | 6,222 | 100.0% |
Occupancy by Household Size in Glasgow
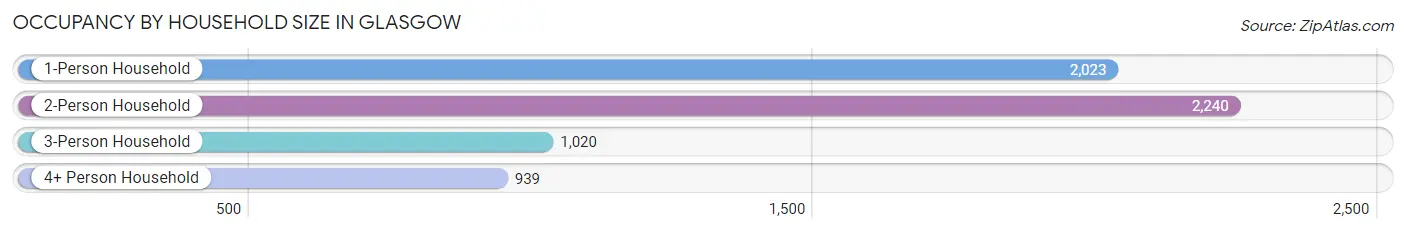
| Household Size | # Housing Units | % Housing Units |
| 1-Person Household | 2,023 | 32.5% |
| 2-Person Household | 2,240 | 36.0% |
| 3-Person Household | 1,020 | 16.4% |
| 4+ Person Household | 939 | 15.1% |
| Total Housing Units | 6,222 | 100.0% |
Occupancy by Ownership by Household Size in Glasgow
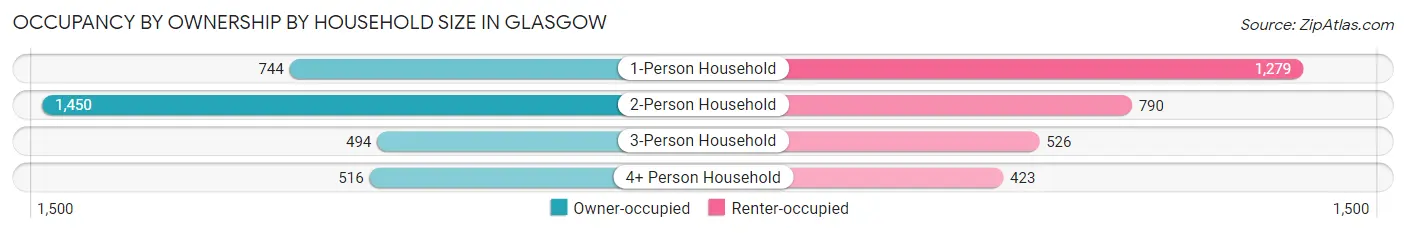
| Household Size | Owner-occupied | Renter-occupied |
| 1-Person Household | 744 (36.8%) | 1,279 (63.2%) |
| 2-Person Household | 1,450 (64.7%) | 790 (35.3%) |
| 3-Person Household | 494 (48.4%) | 526 (51.6%) |
| 4+ Person Household | 516 (54.9%) | 423 (45.1%) |
| Total Housing Units | 3,204 (51.5%) | 3,018 (48.5%) |
Occupancy by Educational Attainment in Glasgow
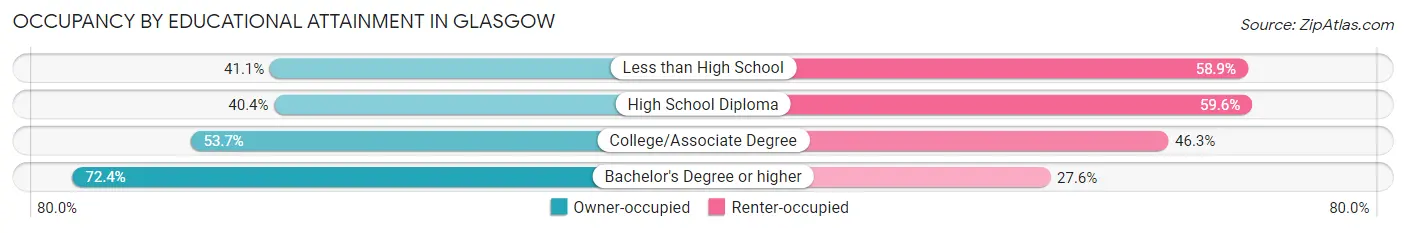
| Household Size | Owner-occupied | Renter-occupied |
| Less than High School | 255 (41.1%) | 366 (58.9%) |
| High School Diploma | 1,038 (40.4%) | 1,532 (59.6%) |
| College/Associate Degree | 814 (53.7%) | 702 (46.3%) |
| Bachelor's Degree or higher | 1,097 (72.4%) | 418 (27.6%) |
Occupancy by Age of Householder in Glasgow
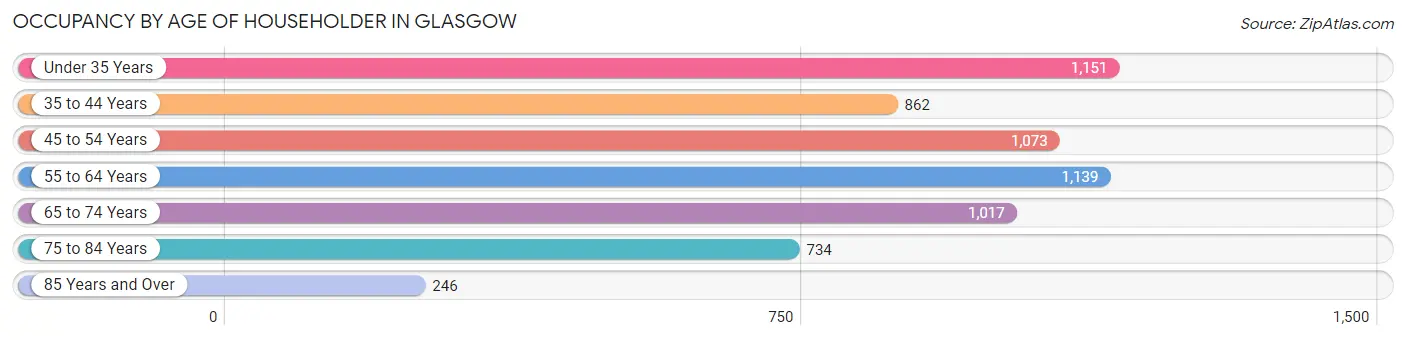
| Age Bracket | # Households | % Households |
| Under 35 Years | 1,151 | 18.5% |
| 35 to 44 Years | 862 | 13.9% |
| 45 to 54 Years | 1,073 | 17.2% |
| 55 to 64 Years | 1,139 | 18.3% |
| 65 to 74 Years | 1,017 | 16.4% |
| 75 to 84 Years | 734 | 11.8% |
| 85 Years and Over | 246 | 4.0% |
| Total | 6,222 | 100.0% |
Housing Finances in Glasgow
Median Income by Occupancy in Glasgow
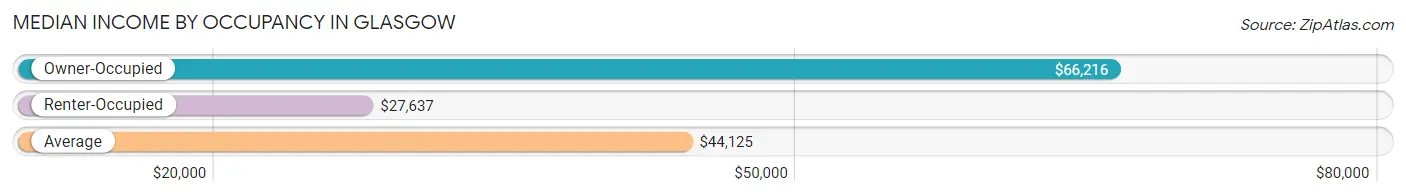
| Occupancy Type | # Households | Median Income |
| Owner-Occupied | 3,204 (51.5%) | $66,216 |
| Renter-Occupied | 3,018 (48.5%) | $27,637 |
| Average | 6,222 (100.0%) | $44,125 |
Occupancy by Householder Income Bracket in Glasgow
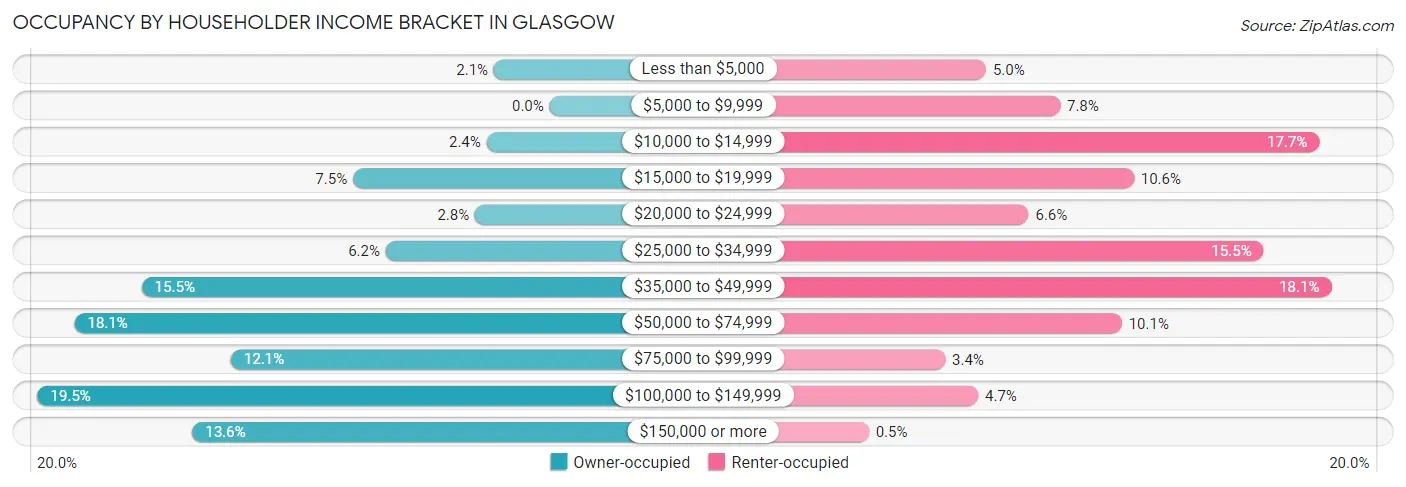
| Income Bracket | Owner-occupied | Renter-occupied |
| Less than $5,000 | 68 (2.1%) | 150 (5.0%) |
| $5,000 to $9,999 | 0 (0.0%) | 235 (7.8%) |
| $10,000 to $14,999 | 77 (2.4%) | 533 (17.7%) |
| $15,000 to $19,999 | 240 (7.5%) | 320 (10.6%) |
| $20,000 to $24,999 | 91 (2.8%) | 199 (6.6%) |
| $25,000 to $34,999 | 200 (6.2%) | 469 (15.5%) |
| $35,000 to $49,999 | 498 (15.5%) | 547 (18.1%) |
| $50,000 to $74,999 | 580 (18.1%) | 306 (10.1%) |
| $75,000 to $99,999 | 389 (12.1%) | 103 (3.4%) |
| $100,000 to $149,999 | 625 (19.5%) | 141 (4.7%) |
| $150,000 or more | 436 (13.6%) | 15 (0.5%) |
| Total | 3,204 (100.0%) | 3,018 (100.0%) |
Monthly Housing Cost Tiers in Glasgow
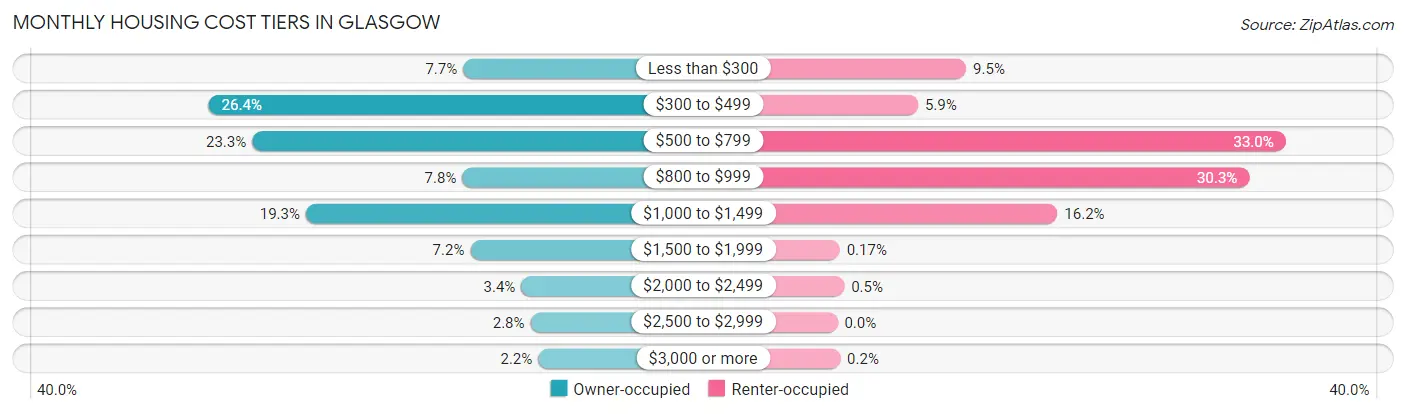
| Monthly Cost | Owner-occupied | Renter-occupied |
| Less than $300 | 247 (7.7%) | 286 (9.5%) |
| $300 to $499 | 847 (26.4%) | 179 (5.9%) |
| $500 to $799 | 745 (23.3%) | 996 (33.0%) |
| $800 to $999 | 249 (7.8%) | 915 (30.3%) |
| $1,000 to $1,499 | 618 (19.3%) | 489 (16.2%) |
| $1,500 to $1,999 | 230 (7.2%) | 5 (0.2%) |
| $2,000 to $2,499 | 110 (3.4%) | 15 (0.5%) |
| $2,500 to $2,999 | 88 (2.8%) | 0 (0.0%) |
| $3,000 or more | 70 (2.2%) | 6 (0.2%) |
| Total | 3,204 (100.0%) | 3,018 (100.0%) |
Physical Housing Characteristics in Glasgow
Housing Structures in Glasgow
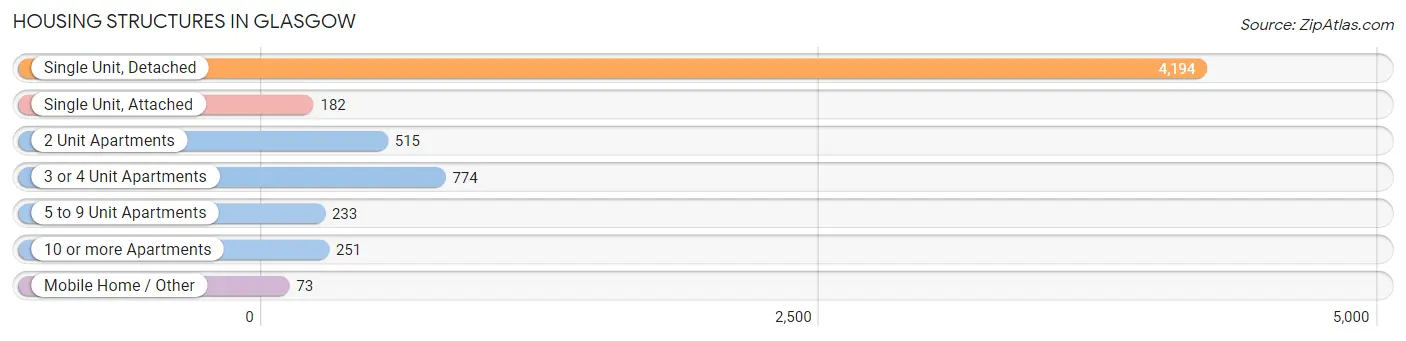
| Structure Type | # Housing Units | % Housing Units |
| Single Unit, Detached | 4,194 | 67.4% |
| Single Unit, Attached | 182 | 2.9% |
| 2 Unit Apartments | 515 | 8.3% |
| 3 or 4 Unit Apartments | 774 | 12.4% |
| 5 to 9 Unit Apartments | 233 | 3.7% |
| 10 or more Apartments | 251 | 4.0% |
| Mobile Home / Other | 73 | 1.2% |
| Total | 6,222 | 100.0% |
Housing Structures by Occupancy in Glasgow
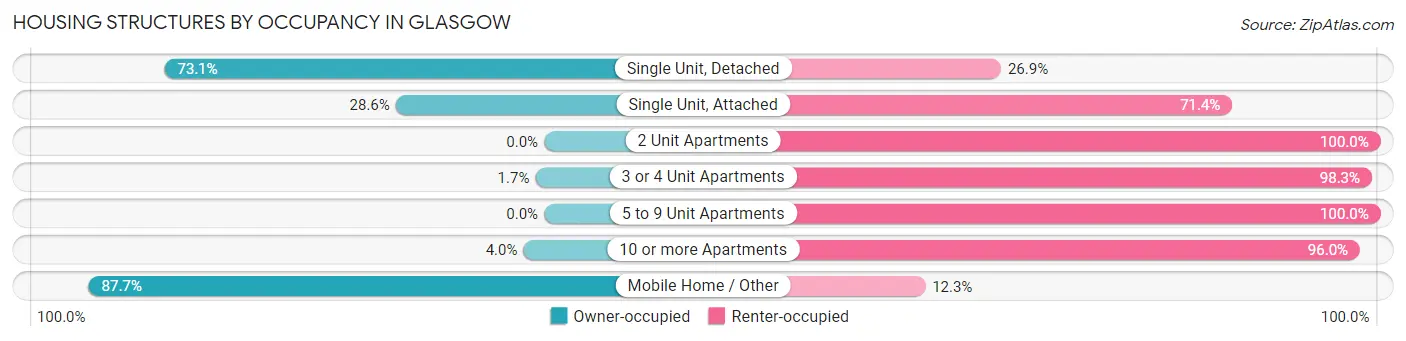
| Structure Type | Owner-occupied | Renter-occupied |
| Single Unit, Detached | 3,065 (73.1%) | 1,129 (26.9%) |
| Single Unit, Attached | 52 (28.6%) | 130 (71.4%) |
| 2 Unit Apartments | 0 (0.0%) | 515 (100.0%) |
| 3 or 4 Unit Apartments | 13 (1.7%) | 761 (98.3%) |
| 5 to 9 Unit Apartments | 0 (0.0%) | 233 (100.0%) |
| 10 or more Apartments | 10 (4.0%) | 241 (96.0%) |
| Mobile Home / Other | 64 (87.7%) | 9 (12.3%) |
| Total | 3,204 (51.5%) | 3,018 (48.5%) |
Housing Structures by Number of Rooms in Glasgow
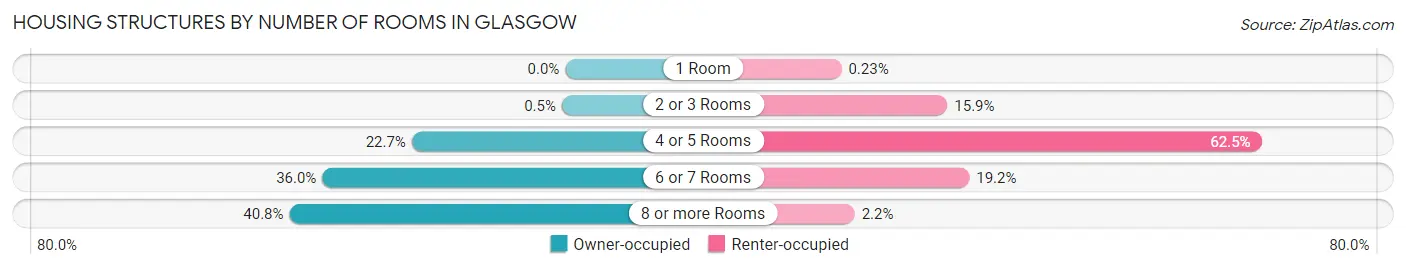
| Number of Rooms | Owner-occupied | Renter-occupied |
| 1 Room | 0 (0.0%) | 7 (0.2%) |
| 2 or 3 Rooms | 16 (0.5%) | 480 (15.9%) |
| 4 or 5 Rooms | 728 (22.7%) | 1,887 (62.5%) |
| 6 or 7 Rooms | 1,152 (36.0%) | 578 (19.2%) |
| 8 or more Rooms | 1,308 (40.8%) | 66 (2.2%) |
| Total | 3,204 (100.0%) | 3,018 (100.0%) |
Housing Structure by Heating Type in Glasgow
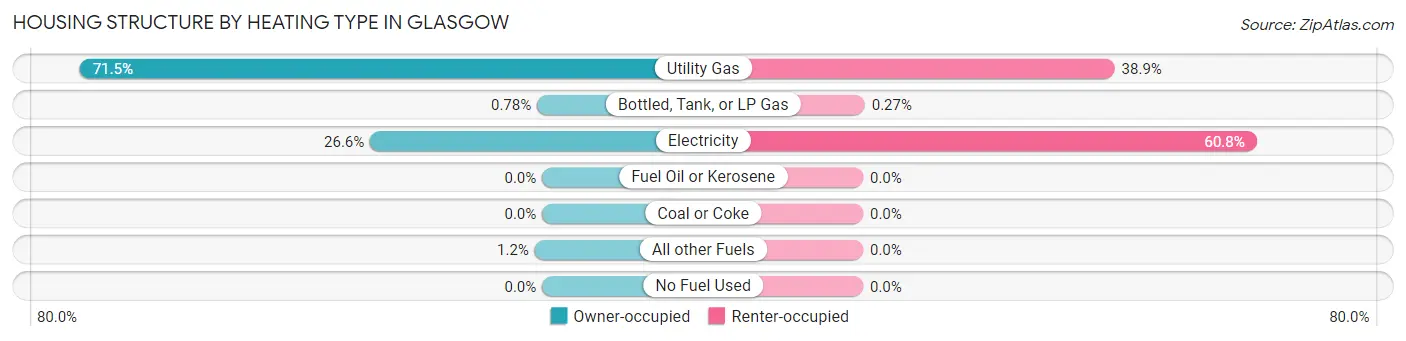
| Heating Type | Owner-occupied | Renter-occupied |
| Utility Gas | 2,290 (71.5%) | 1,174 (38.9%) |
| Bottled, Tank, or LP Gas | 25 (0.8%) | 8 (0.3%) |
| Electricity | 852 (26.6%) | 1,836 (60.8%) |
| Fuel Oil or Kerosene | 0 (0.0%) | 0 (0.0%) |
| Coal or Coke | 0 (0.0%) | 0 (0.0%) |
| All other Fuels | 37 (1.1%) | 0 (0.0%) |
| No Fuel Used | 0 (0.0%) | 0 (0.0%) |
| Total | 3,204 (100.0%) | 3,018 (100.0%) |
Household Vehicle Usage in Glasgow
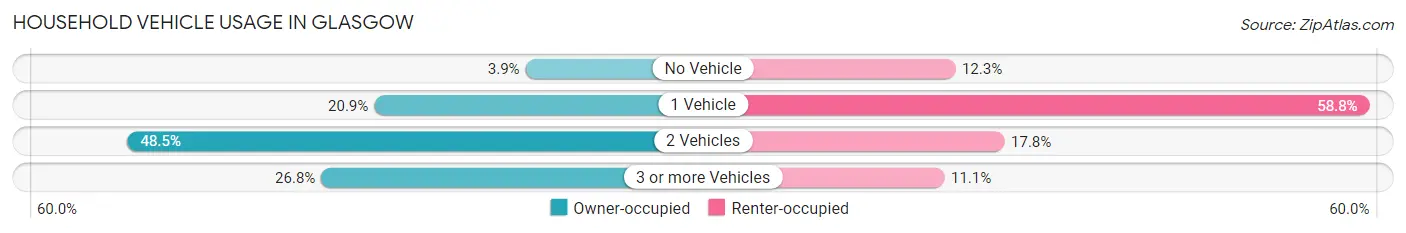
| Vehicles per Household | Owner-occupied | Renter-occupied |
| No Vehicle | 125 (3.9%) | 372 (12.3%) |
| 1 Vehicle | 668 (20.8%) | 1,773 (58.8%) |
| 2 Vehicles | 1,553 (48.5%) | 538 (17.8%) |
| 3 or more Vehicles | 858 (26.8%) | 335 (11.1%) |
| Total | 3,204 (100.0%) | 3,018 (100.0%) |
Real Estate & Mortgages in Glasgow
Real Estate and Mortgage Overview in Glasgow
| Characteristic | Without Mortgage | With Mortgage |
| Housing Units | 1,653 | 1,551 |
| Median Property Value | $124,400 | $151,500 |
| Median Household Income | $54,745 | $295 |
| Monthly Housing Costs | $432 | $70 |
| Real Estate Taxes | $994 | $0 |
Property Value by Mortgage Status in Glasgow
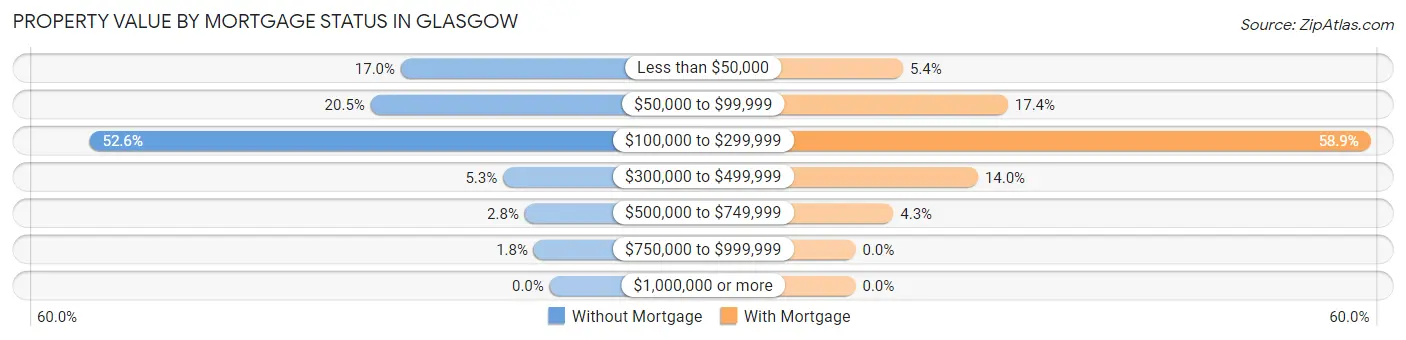
| Property Value | Without Mortgage | With Mortgage |
| Less than $50,000 | 281 (17.0%) | 84 (5.4%) |
| $50,000 to $99,999 | 338 (20.4%) | 270 (17.4%) |
| $100,000 to $299,999 | 869 (52.6%) | 913 (58.9%) |
| $300,000 to $499,999 | 88 (5.3%) | 217 (14.0%) |
| $500,000 to $749,999 | 47 (2.8%) | 67 (4.3%) |
| $750,000 to $999,999 | 30 (1.8%) | 0 (0.0%) |
| $1,000,000 or more | 0 (0.0%) | 0 (0.0%) |
| Total | 1,653 (100.0%) | 1,551 (100.0%) |
Household Income by Mortgage Status in Glasgow
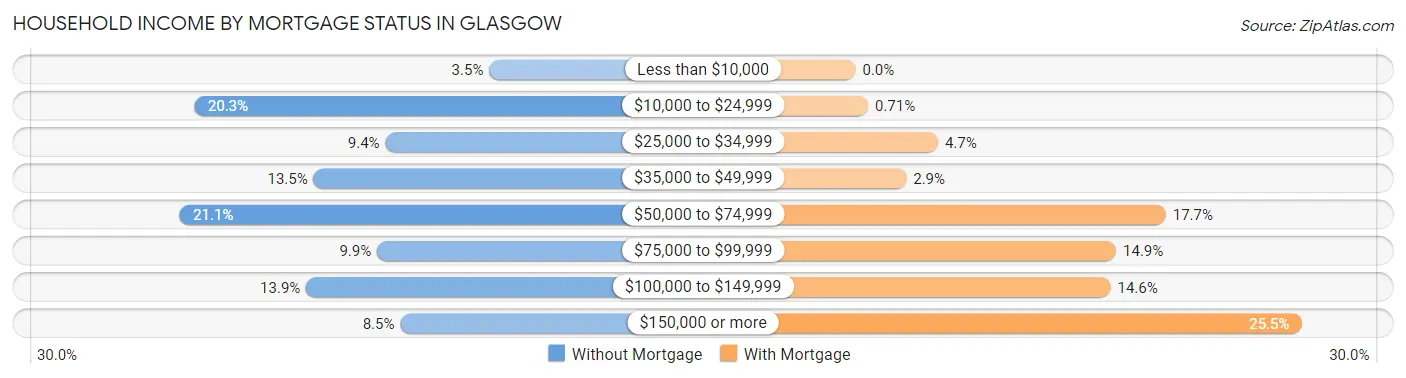
| Household Income | Without Mortgage | With Mortgage |
| Less than $10,000 | 57 (3.5%) | 0 (0.0%) |
| $10,000 to $24,999 | 335 (20.3%) | 11 (0.7%) |
| $25,000 to $34,999 | 155 (9.4%) | 73 (4.7%) |
| $35,000 to $49,999 | 223 (13.5%) | 45 (2.9%) |
| $50,000 to $74,999 | 349 (21.1%) | 275 (17.7%) |
| $75,000 to $99,999 | 163 (9.9%) | 231 (14.9%) |
| $100,000 to $149,999 | 230 (13.9%) | 226 (14.6%) |
| $150,000 or more | 141 (8.5%) | 395 (25.5%) |
| Total | 1,653 (100.0%) | 1,551 (100.0%) |
Property Value to Household Income Ratio in Glasgow
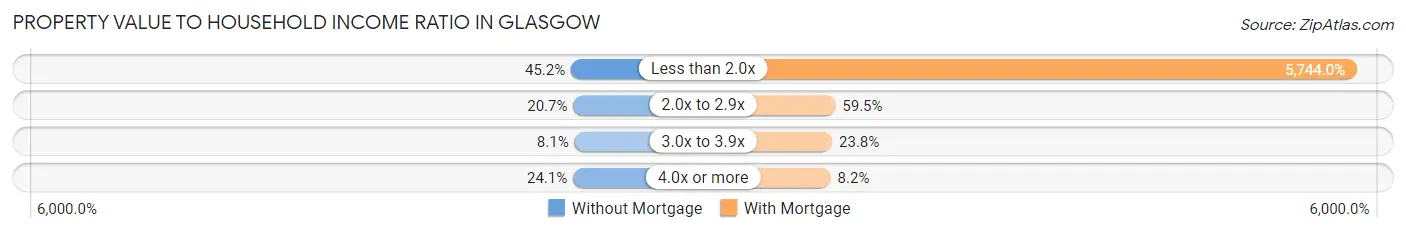
| Value-to-Income Ratio | Without Mortgage | With Mortgage |
| Less than 2.0x | 747 (45.2%) | 89,090 (5,744.0%) |
| 2.0x to 2.9x | 342 (20.7%) | 922 (59.5%) |
| 3.0x to 3.9x | 133 (8.1%) | 369 (23.8%) |
| 4.0x or more | 398 (24.1%) | 127 (8.2%) |
| Total | 1,653 (100.0%) | 1,551 (100.0%) |
Real Estate Taxes by Mortgage Status in Glasgow
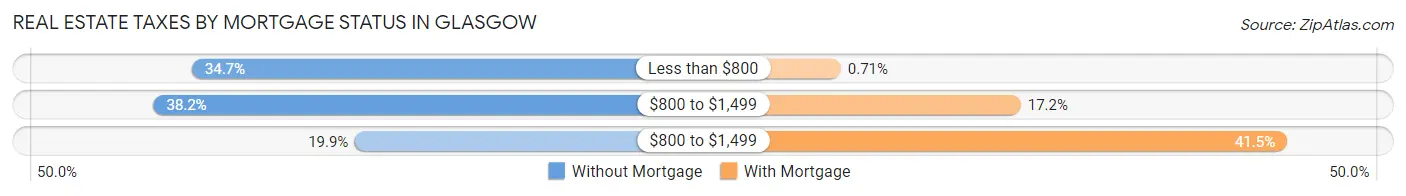
| Property Taxes | Without Mortgage | With Mortgage |
| Less than $800 | 574 (34.7%) | 11 (0.7%) |
| $800 to $1,499 | 632 (38.2%) | 266 (17.2%) |
| $800 to $1,499 | 329 (19.9%) | 643 (41.5%) |
| Total | 1,653 (100.0%) | 1,551 (100.0%) |
Health & Disability in Glasgow
Health Insurance Coverage by Age in Glasgow
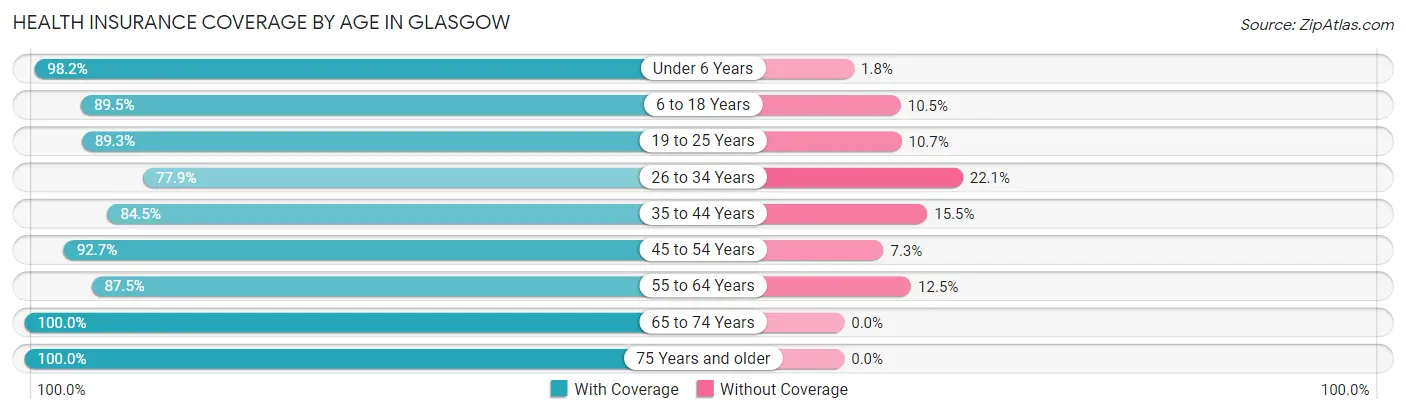
| Age Bracket | With Coverage | Without Coverage |
| Under 6 Years | 967 (98.2%) | 18 (1.8%) |
| 6 to 18 Years | 2,368 (89.5%) | 279 (10.5%) |
| 19 to 25 Years | 954 (89.3%) | 114 (10.7%) |
| 26 to 34 Years | 1,146 (77.9%) | 325 (22.1%) |
| 35 to 44 Years | 1,420 (84.5%) | 260 (15.5%) |
| 45 to 54 Years | 1,596 (92.7%) | 126 (7.3%) |
| 55 to 64 Years | 1,671 (87.5%) | 238 (12.5%) |
| 65 to 74 Years | 1,631 (100.0%) | 0 (0.0%) |
| 75 Years and older | 1,288 (100.0%) | 0 (0.0%) |
| Total | 13,041 (90.6%) | 1,360 (9.4%) |
Health Insurance Coverage by Citizenship Status in Glasgow
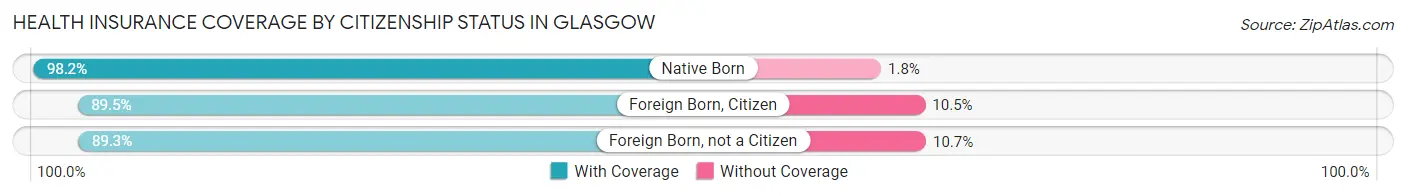
| Citizenship Status | With Coverage | Without Coverage |
| Native Born | 967 (98.2%) | 18 (1.8%) |
| Foreign Born, Citizen | 2,368 (89.5%) | 279 (10.5%) |
| Foreign Born, not a Citizen | 954 (89.3%) | 114 (10.7%) |
Health Insurance Coverage by Household Income in Glasgow
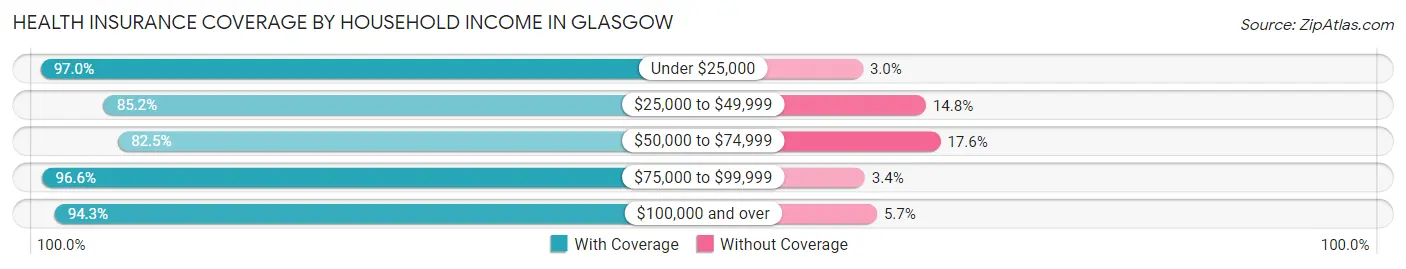
| Household Income | With Coverage | Without Coverage |
| Under $25,000 | 2,885 (97.0%) | 90 (3.0%) |
| $25,000 to $49,999 | 3,507 (85.2%) | 611 (14.8%) |
| $50,000 to $74,999 | 1,903 (82.5%) | 405 (17.5%) |
| $75,000 to $99,999 | 1,198 (96.6%) | 42 (3.4%) |
| $100,000 and over | 3,533 (94.3%) | 212 (5.7%) |
Public vs Private Health Insurance Coverage by Age in Glasgow
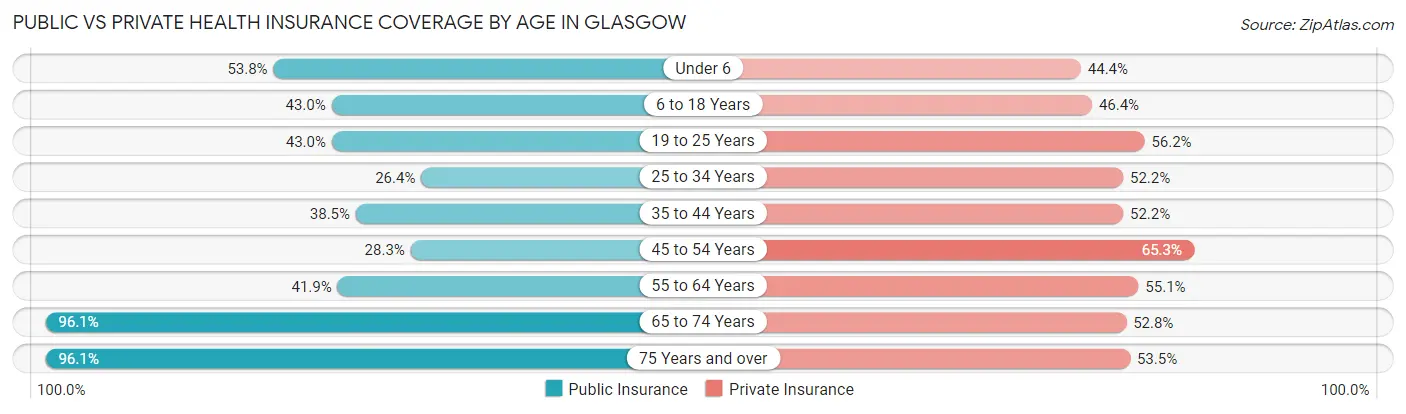
| Age Bracket | Public Insurance | Private Insurance |
| Under 6 | 530 (53.8%) | 437 (44.4%) |
| 6 to 18 Years | 1,139 (43.0%) | 1,229 (46.4%) |
| 19 to 25 Years | 459 (43.0%) | 600 (56.2%) |
| 25 to 34 Years | 388 (26.4%) | 768 (52.2%) |
| 35 to 44 Years | 647 (38.5%) | 877 (52.2%) |
| 45 to 54 Years | 488 (28.3%) | 1,125 (65.3%) |
| 55 to 64 Years | 800 (41.9%) | 1,051 (55.1%) |
| 65 to 74 Years | 1,568 (96.1%) | 861 (52.8%) |
| 75 Years and over | 1,238 (96.1%) | 689 (53.5%) |
| Total | 7,257 (50.4%) | 7,637 (53.0%) |
Disability Status by Sex by Age in Glasgow
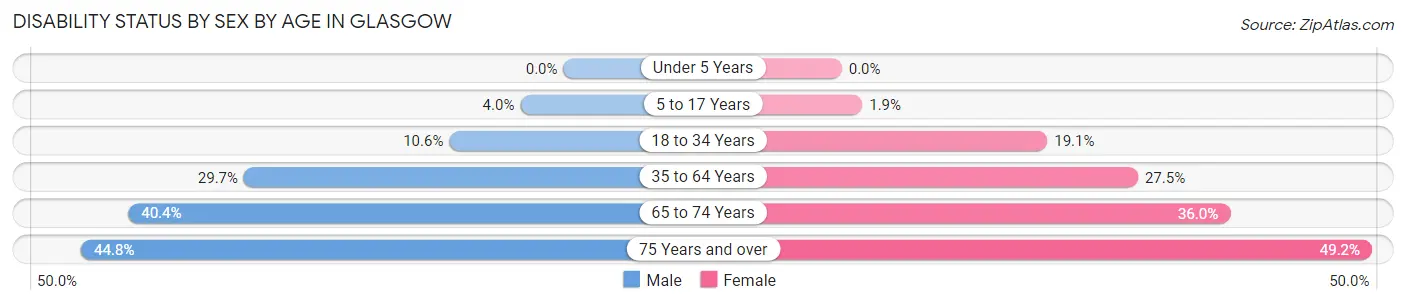
| Age Bracket | Male | Female |
| Under 5 Years | 0 (0.0%) | 0 (0.0%) |
| 5 to 17 Years | 47 (4.0%) | 28 (1.9%) |
| 18 to 34 Years | 140 (10.6%) | 259 (19.1%) |
| 35 to 64 Years | 770 (29.6%) | 746 (27.5%) |
| 65 to 74 Years | 329 (40.4%) | 294 (36.0%) |
| 75 Years and over | 188 (44.8%) | 427 (49.2%) |
Disability Class by Sex by Age in Glasgow
Disability Class: Hearing Difficulty
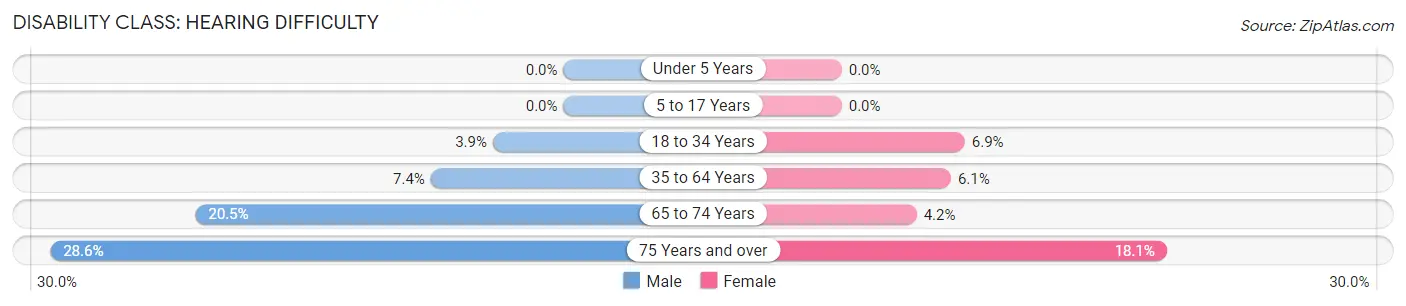
| Age Bracket | Male | Female |
| Under 5 Years | 0 (0.0%) | 0 (0.0%) |
| 5 to 17 Years | 0 (0.0%) | 0 (0.0%) |
| 18 to 34 Years | 52 (3.9%) | 93 (6.9%) |
| 35 to 64 Years | 192 (7.4%) | 165 (6.1%) |
| 65 to 74 Years | 167 (20.5%) | 34 (4.2%) |
| 75 Years and over | 120 (28.6%) | 157 (18.1%) |
Disability Class: Vision Difficulty
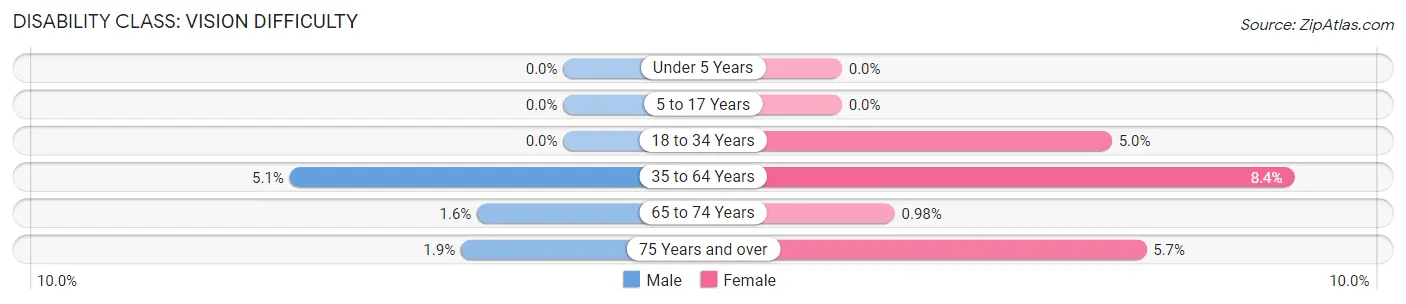
| Age Bracket | Male | Female |
| Under 5 Years | 0 (0.0%) | 0 (0.0%) |
| 5 to 17 Years | 0 (0.0%) | 0 (0.0%) |
| 18 to 34 Years | 0 (0.0%) | 68 (5.0%) |
| 35 to 64 Years | 132 (5.1%) | 228 (8.4%) |
| 65 to 74 Years | 13 (1.6%) | 8 (1.0%) |
| 75 Years and over | 8 (1.9%) | 49 (5.7%) |
Disability Class: Cognitive Difficulty
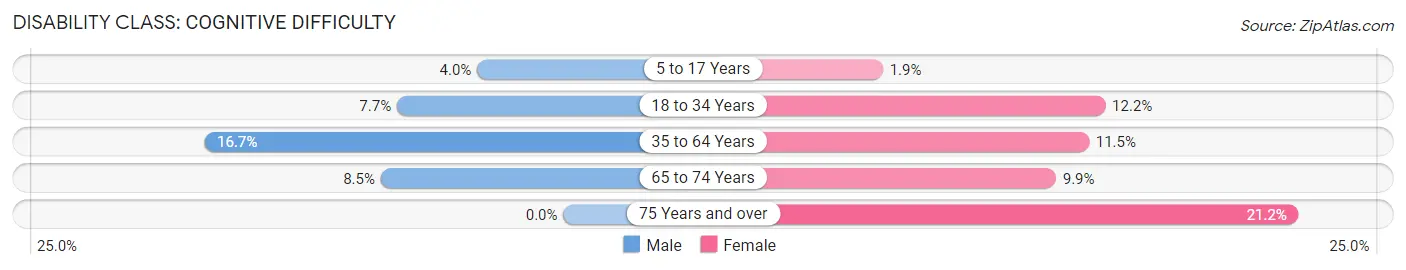
| Age Bracket | Male | Female |
| 5 to 17 Years | 47 (4.0%) | 28 (1.9%) |
| 18 to 34 Years | 102 (7.7%) | 166 (12.2%) |
| 35 to 64 Years | 433 (16.7%) | 311 (11.5%) |
| 65 to 74 Years | 69 (8.5%) | 81 (9.9%) |
| 75 Years and over | 0 (0.0%) | 184 (21.2%) |
Disability Class: Ambulatory Difficulty
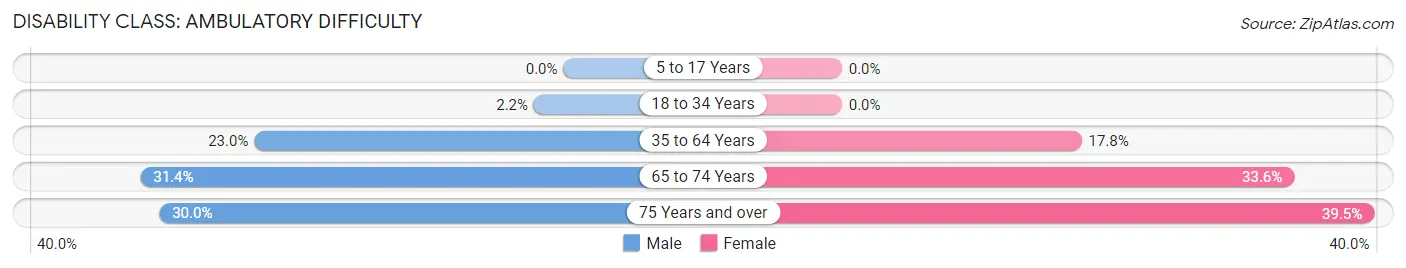
| Age Bracket | Male | Female |
| 5 to 17 Years | 0 (0.0%) | 0 (0.0%) |
| 18 to 34 Years | 29 (2.2%) | 0 (0.0%) |
| 35 to 64 Years | 596 (23.0%) | 483 (17.8%) |
| 65 to 74 Years | 256 (31.4%) | 274 (33.6%) |
| 75 Years and over | 126 (30.0%) | 343 (39.5%) |
Disability Class: Self-Care Difficulty
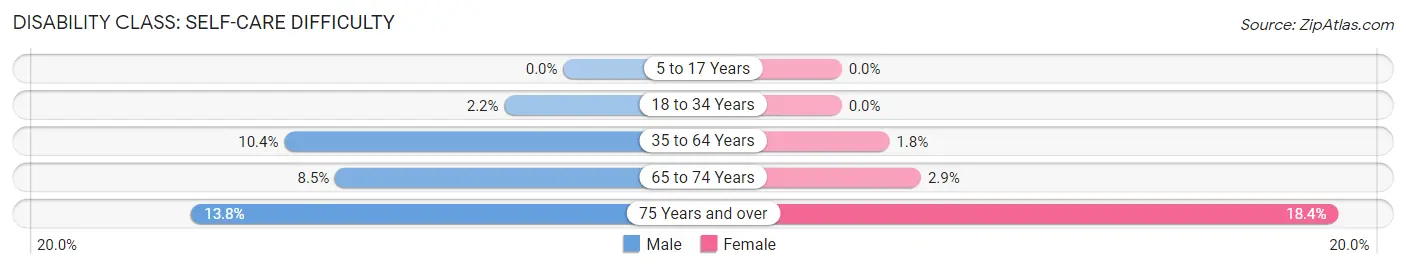
| Age Bracket | Male | Female |
| 5 to 17 Years | 0 (0.0%) | 0 (0.0%) |
| 18 to 34 Years | 29 (2.2%) | 0 (0.0%) |
| 35 to 64 Years | 269 (10.4%) | 48 (1.8%) |
| 65 to 74 Years | 69 (8.5%) | 24 (2.9%) |
| 75 Years and over | 58 (13.8%) | 160 (18.4%) |
Technology Access in Glasgow
Computing Device Access in Glasgow
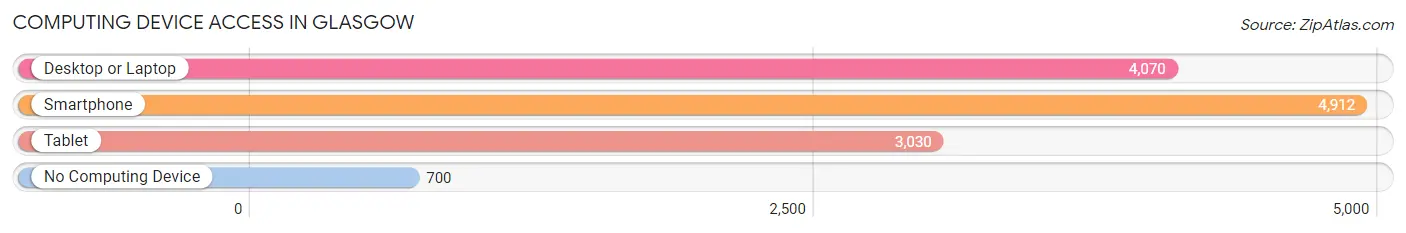
| Device Type | # Households | % Households |
| Desktop or Laptop | 4,070 | 65.4% |
| Smartphone | 4,912 | 78.9% |
| Tablet | 3,030 | 48.7% |
| No Computing Device | 700 | 11.3% |
| Total | 6,222 | 100.0% |
Internet Access in Glasgow
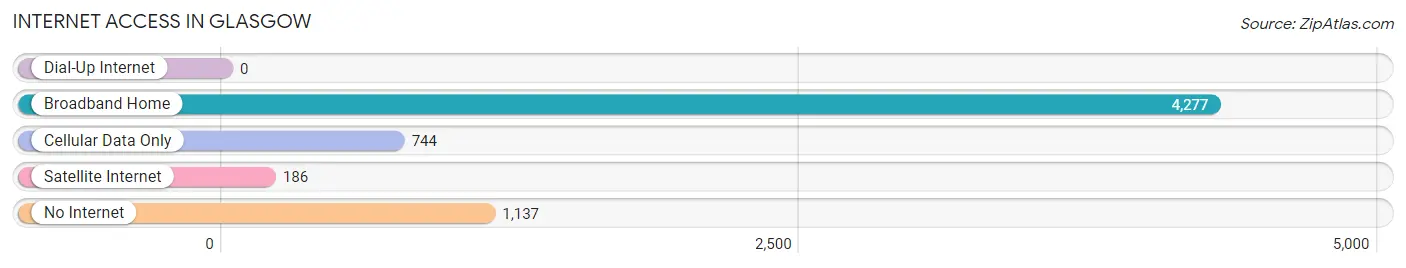
| Internet Type | # Households | % Households |
| Dial-Up Internet | 0 | 0.0% |
| Broadband Home | 4,277 | 68.7% |
| Cellular Data Only | 744 | 12.0% |
| Satellite Internet | 186 | 3.0% |
| No Internet | 1,137 | 18.3% |
| Total | 6,222 | 100.0% |
Glasgow Summary
Glasgow, Kentucky is a small city located in Barren County in the south-central part of the state. It is the county seat and the largest city in the county. Glasgow is situated on the Barren River, which is a tributary of the Green River. The city is located about 80 miles south of Louisville and about 90 miles north of Nashville, Tennessee. The population of Glasgow was 14,028 at the 2010 census.
History
The area that is now Glasgow was first settled in the late 1700s by Scots-Irish immigrants. The city was officially founded in 1799 and was named after Glasgow, Scotland. The city was incorporated in 1809 and was made the county seat of Barren County in 1810.
During the Civil War, Glasgow was a major supply center for the Confederate Army. The city was the site of a major battle in 1862, when Union forces under General William T. Sherman attacked the city. The Union forces were eventually defeated, but the city was heavily damaged in the battle.
Geography
Glasgow is located in south-central Kentucky, about 80 miles south of Louisville and 90 miles north of Nashville, Tennessee. The city is situated on the Barren River, which is a tributary of the Green River. The city has a total area of 8.3 square miles, all of which is land.
The climate in Glasgow is humid subtropical, with hot, humid summers and mild winters. The average annual temperature is around 60 degrees Fahrenheit. The average annual precipitation is around 45 inches.
Economy
The economy of Glasgow is largely based on manufacturing and agriculture. The city is home to several manufacturing plants, including a General Motors plant and a Toyota plant. The city is also home to several agricultural businesses, including a large poultry processing plant.
The city is also home to several retail stores, restaurants, and other businesses. The city is served by several major highways, including Interstate 65 and U.S. Route 31.
Demographics
As of the 2010 census, the population of Glasgow was 14,028. The racial makeup of the city was 87.3% White, 8.7% African American, 0.3% Native American, 0.7% Asian, 0.1% Pacific Islander, 1.2% from other races, and 1.9% from two or more races. Hispanic or Latino of any race were 2.7% of the population.
The median income for a household in Glasgow was $30,945, and the median income for a family was $37,941. The per capita income for the city was $17,845. About 17.2% of the population was below the poverty line.
Common Questions
What is Per Capita Income in Glasgow?
Per Capita income in Glasgow is $29,661.
What is the Median Family Income in Glasgow?
Median Family Income in Glasgow is $54,183.
What is the Median Household income in Glasgow?
Median Household Income in Glasgow is $44,125.
What is Income or Wage Gap in Glasgow?
Income or Wage Gap in Glasgow is 10.1%.
Women in Glasgow earn 89.9 cents for every dollar earned by a man.
What is Family Income Deficit in Glasgow?
Family Income Deficit in Glasgow is $9,794.
Families that are below poverty line in Glasgow earn $9,794 less on average than the poverty threshold level.
What is Inequality or Gini Index in Glasgow?
Inequality or Gini Index in Glasgow is 0.53.
What is the Total Population of Glasgow?
Total Population of Glasgow is 15,043.
What is the Total Male Population of Glasgow?
Total Male Population of Glasgow is 7,096.
What is the Total Female Population of Glasgow?
Total Female Population of Glasgow is 7,947.
What is the Ratio of Males per 100 Females in Glasgow?
There are 89.29 Males per 100 Females in Glasgow.
What is the Ratio of Females per 100 Males in Glasgow?
There are 111.99 Females per 100 Males in Glasgow.
What is the Median Population Age in Glasgow?
Median Population Age in Glasgow is 42.3 Years.
What is the Average Family Size in Glasgow
Average Family Size in Glasgow is 2.9 People.
What is the Average Household Size in Glasgow
Average Household Size in Glasgow is 2.3 People.
How Large is the Labor Force in Glasgow?
There are 6,091 People in the Labor Forcein in Glasgow.
What is the Percentage of People in the Labor Force in Glasgow?
50.4% of People are in the Labor Force in Glasgow.
What is the Unemployment Rate in Glasgow?
Unemployment Rate in Glasgow is 5.1%.