Clinton, KY Map & Demographics
Clinton Map
Clinton Overview
$16,962
PER CAPITA INCOME
$37,292
AVG FAMILY INCOME
$31,100
AVG HOUSEHOLD INCOME
5.7%
WAGE / INCOME GAP [ % ]
94.3¢/ $1
WAGE / INCOME GAP [ $ ]
0.37
INEQUALITY / GINI INDEX
1,173
TOTAL POPULATION
510
MALE POPULATION
663
FEMALE POPULATION
76.92
MALES / 100 FEMALES
130.00
FEMALES / 100 MALES
47.2
MEDIAN AGE
3.2
AVG FAMILY SIZE
2.2
AVG HOUSEHOLD SIZE
391
LABOR FORCE [ PEOPLE ]
39.5%
PERCENT IN LABOR FORCE
13.3%
UNEMPLOYMENT RATE
Clinton Zip Codes
Clinton Area Codes
Income in Clinton
Income Overview in Clinton
Per Capita Income in Clinton is $16,962, while median incomes of families and households are $37,292 and $31,100 respectively.
| Characteristic | Number | Measure |
| Per Capita Income | 1,173 | $16,962 |
| Median Family Income | 221 | $37,292 |
| Mean Family Income | 221 | $46,779 |
| Median Household Income | 466 | $31,100 |
| Mean Household Income | 466 | $38,358 |
| Income Deficit | 221 | $0 |
| Wage / Income Gap (%) | 1,173 | 5.72% |
| Wage / Income Gap ($) | 1,173 | 94.28¢ per $1 |
| Gini / Inequality Index | 1,173 | 0.37 |
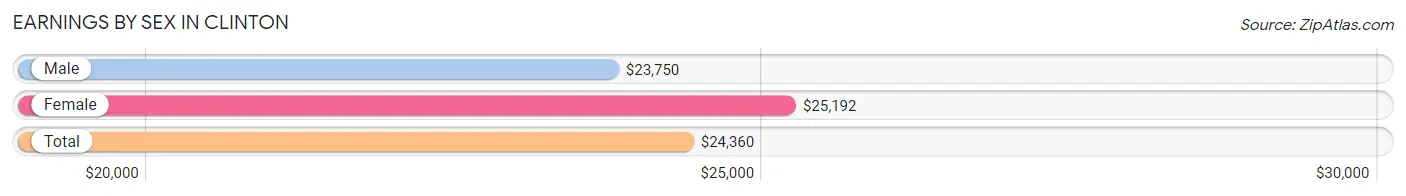
Earnings by Sex in Clinton
Average Earnings in Clinton are $24,360, $23,750 for men and $25,192 for women, a difference of 5.7%.
| Sex | Number | Average Earnings |
| Male | 212 (51.7%) | $23,750 |
| Female | 198 (48.3%) | $25,192 |
| Total | 410 (100.0%) | $24,360 |
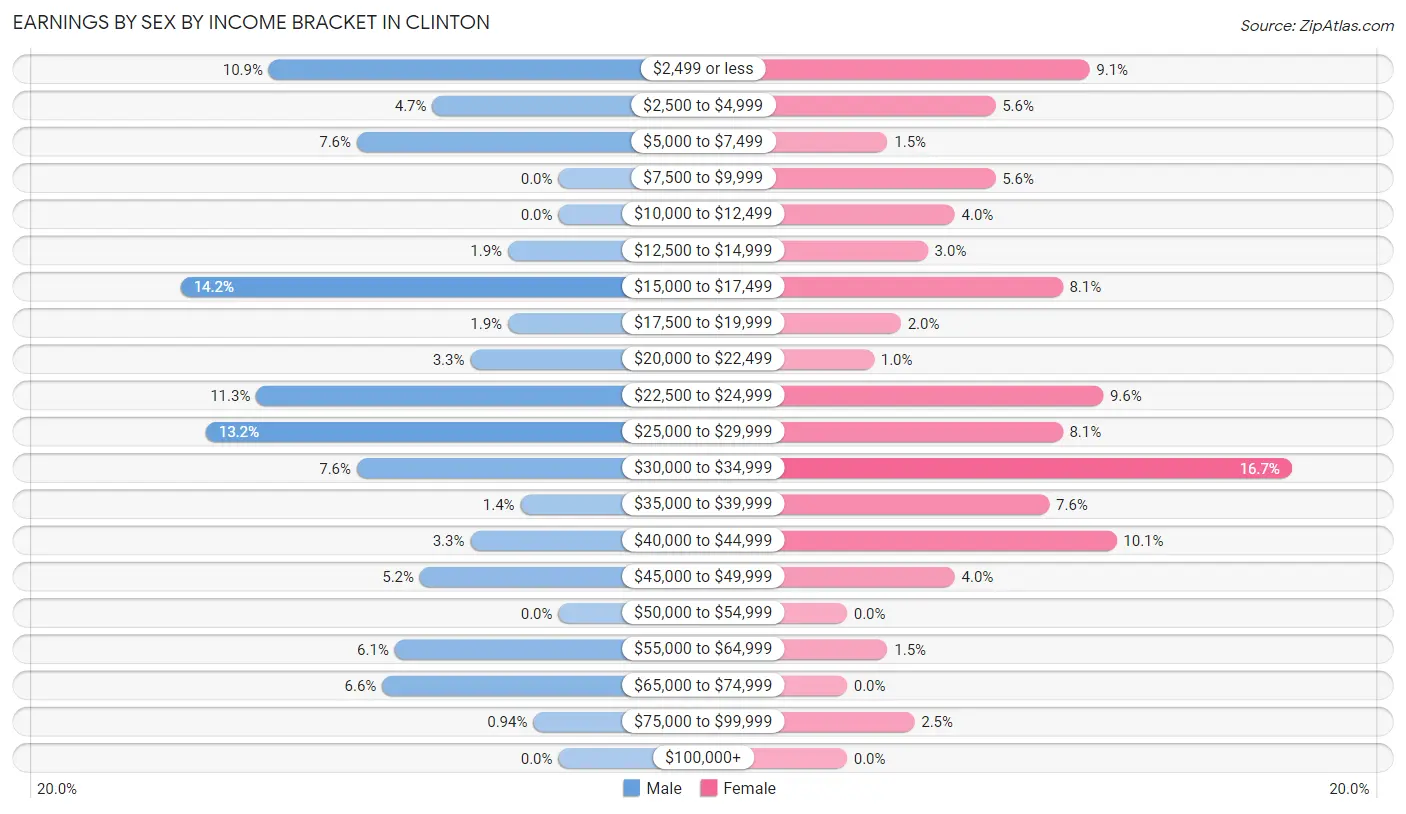
Earnings by Sex by Income Bracket in Clinton
The most common earnings brackets in Clinton are $15,000 to $17,499 for men (30 | 14.1%) and $30,000 to $34,999 for women (33 | 16.7%).
| Income | Male | Female |
| $2,499 or less | 23 (10.8%) | 18 (9.1%) |
| $2,500 to $4,999 | 10 (4.7%) | 11 (5.6%) |
| $5,000 to $7,499 | 16 (7.5%) | 3 (1.5%) |
| $7,500 to $9,999 | 0 (0.0%) | 11 (5.6%) |
| $10,000 to $12,499 | 0 (0.0%) | 8 (4.0%) |
| $12,500 to $14,999 | 4 (1.9%) | 6 (3.0%) |
| $15,000 to $17,499 | 30 (14.1%) | 16 (8.1%) |
| $17,500 to $19,999 | 4 (1.9%) | 4 (2.0%) |
| $20,000 to $22,499 | 7 (3.3%) | 2 (1.0%) |
| $22,500 to $24,999 | 24 (11.3%) | 19 (9.6%) |
| $25,000 to $29,999 | 28 (13.2%) | 16 (8.1%) |
| $30,000 to $34,999 | 16 (7.5%) | 33 (16.7%) |
| $35,000 to $39,999 | 3 (1.4%) | 15 (7.6%) |
| $40,000 to $44,999 | 7 (3.3%) | 20 (10.1%) |
| $45,000 to $49,999 | 11 (5.2%) | 8 (4.0%) |
| $50,000 to $54,999 | 0 (0.0%) | 0 (0.0%) |
| $55,000 to $64,999 | 13 (6.1%) | 3 (1.5%) |
| $65,000 to $74,999 | 14 (6.6%) | 0 (0.0%) |
| $75,000 to $99,999 | 2 (0.9%) | 5 (2.5%) |
| $100,000+ | 0 (0.0%) | 0 (0.0%) |
| Total | 212 (100.0%) | 198 (100.0%) |
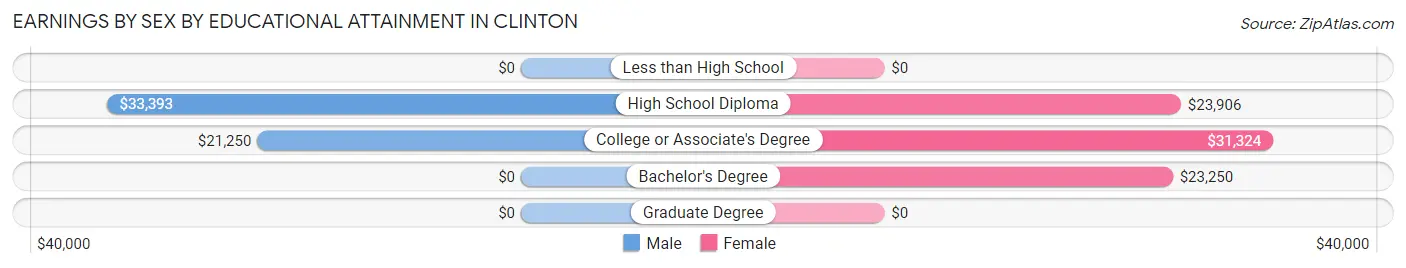
Earnings by Sex by Educational Attainment in Clinton
Average earnings in Clinton are $25,568 for men and $27,019 for women, a difference of 5.4%. Men with an educational attainment of high school diploma enjoy the highest average annual earnings of $33,393, while those with college or associate's degree education earn the least with $21,250. Women with an educational attainment of college or associate's degree earn the most with the average annual earnings of $31,324, while those with bachelor's degree education have the smallest earnings of $23,250.
| Educational Attainment | Male Income | Female Income |
| Less than High School | - | - |
| High School Diploma | $33,393 | $23,906 |
| College or Associate's Degree | $21,250 | $31,324 |
| Bachelor's Degree | - | - |
| Graduate Degree | - | - |
| Total | $25,568 | $27,019 |
Family Income in Clinton
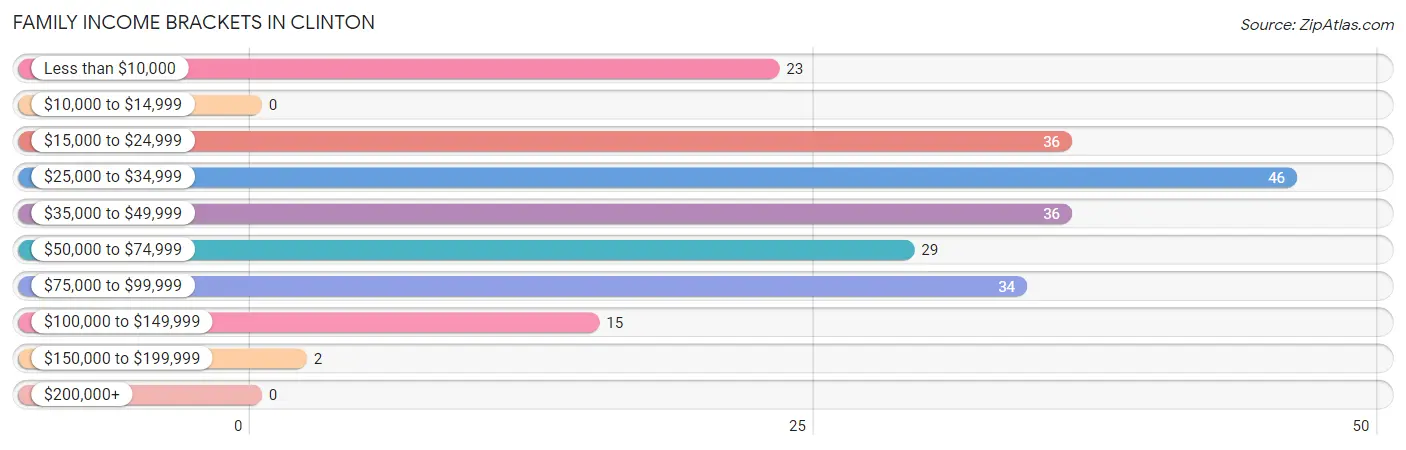
Family Income Brackets in Clinton
According to the Clinton family income data, there are 46 families falling into the $25,000 to $34,999 income range, which is the most common income bracket and makes up 20.8% of all families.
| Income Bracket | # Families | % Families |
| Less than $10,000 | 23 | 10.4% |
| $10,000 to $14,999 | 0 | 0.0% |
| $15,000 to $24,999 | 36 | 16.3% |
| $25,000 to $34,999 | 46 | 20.8% |
| $35,000 to $49,999 | 36 | 16.3% |
| $50,000 to $74,999 | 29 | 13.1% |
| $75,000 to $99,999 | 34 | 15.4% |
| $100,000 to $149,999 | 15 | 6.8% |
| $150,000 to $199,999 | 2 | 0.9% |
| $200,000+ | 0 | 0.0% |
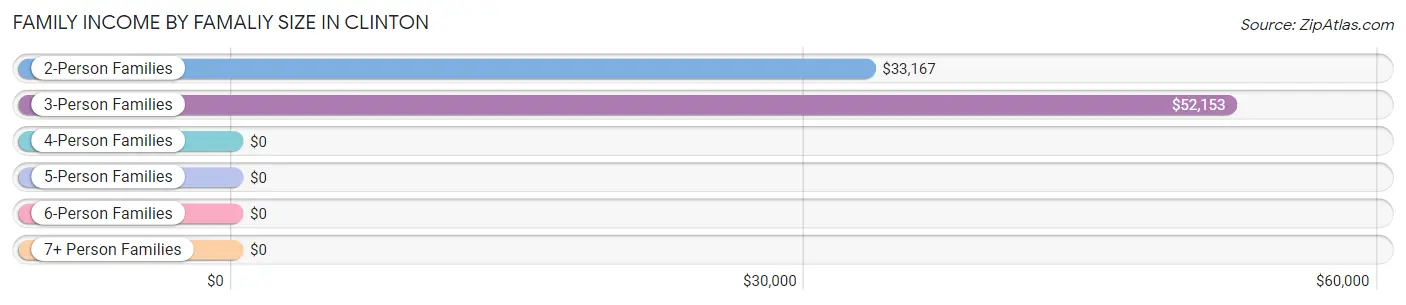
Family Income by Famaliy Size in Clinton
3-person families (73 | 33.0%) account for the highest median family income in Clinton with $52,153 per family, while 3-person families (73 | 33.0%) have the highest median income of $17,384 per family member.
| Income Bracket | # Families | Median Income |
| 2-Person Families | 108 (48.9%) | $33,167 |
| 3-Person Families | 73 (33.0%) | $52,153 |
| 4-Person Families | 6 (2.7%) | $0 |
| 5-Person Families | 29 (13.1%) | $0 |
| 6-Person Families | 0 (0.0%) | $0 |
| 7+ Person Families | 5 (2.3%) | $0 |
| Total | 221 (100.0%) | $37,292 |
Family Income by Number of Earners in Clinton
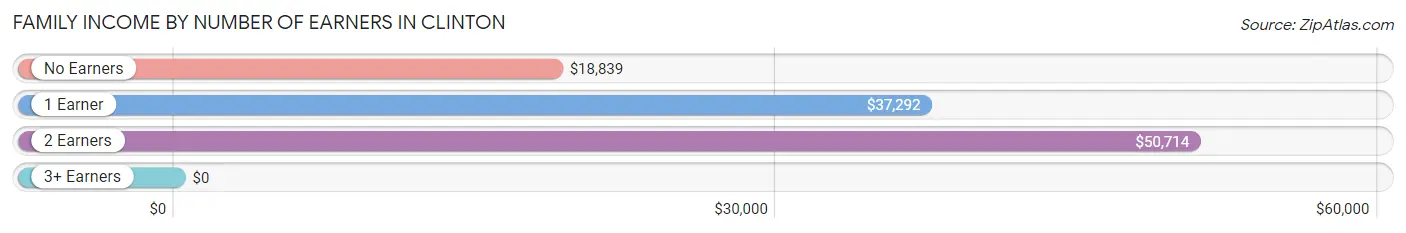
| Number of Earners | # Families | Median Income |
| No Earners | 53 (24.0%) | $18,839 |
| 1 Earner | 79 (35.7%) | $37,292 |
| 2 Earners | 82 (37.1%) | $50,714 |
| 3+ Earners | 7 (3.2%) | $0 |
| Total | 221 (100.0%) | $37,292 |
Household Income in Clinton
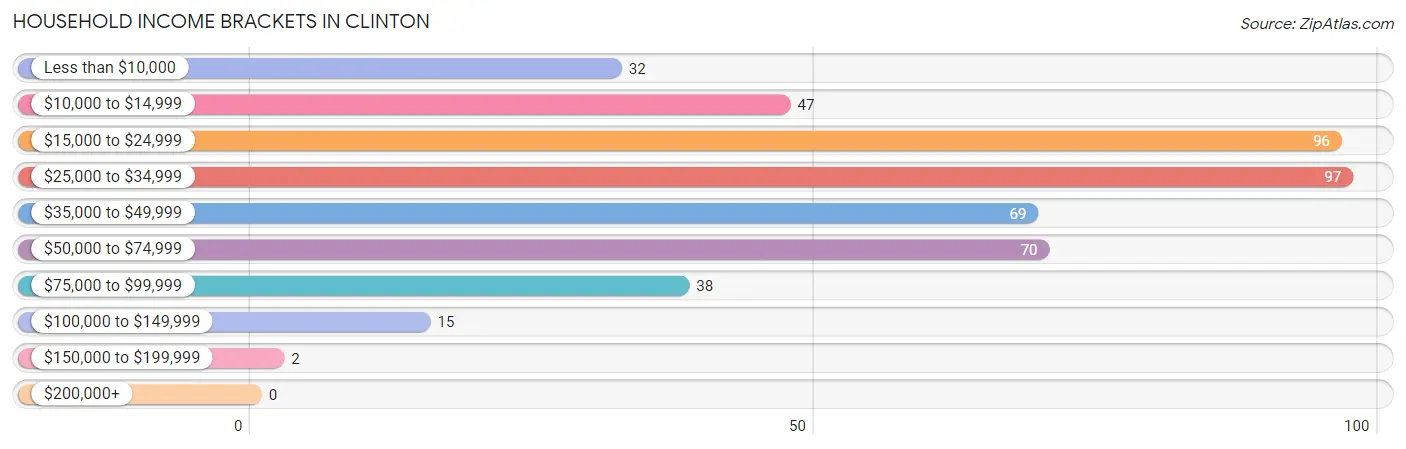
Household Income Brackets in Clinton
With 97 households falling in the category, the $25,000 to $34,999 income range is the most frequent in Clinton, accounting for 20.8% of all households.
| Income Bracket | # Households | % Households |
| Less than $10,000 | 32 | 6.9% |
| $10,000 to $14,999 | 47 | 10.1% |
| $15,000 to $24,999 | 96 | 20.6% |
| $25,000 to $34,999 | 97 | 20.8% |
| $35,000 to $49,999 | 69 | 14.8% |
| $50,000 to $74,999 | 70 | 15.0% |
| $75,000 to $99,999 | 38 | 8.2% |
| $100,000 to $149,999 | 15 | 3.2% |
| $150,000 to $199,999 | 2 | 0.4% |
| $200,000+ | 0 | 0.0% |
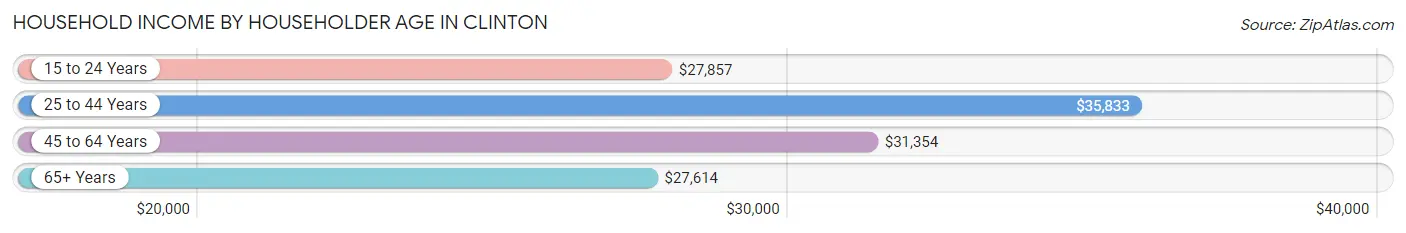
Household Income by Householder Age in Clinton
The median household income in Clinton is $31,100, with the highest median household income of $35,833 found in the 25 to 44 years age bracket for the primary householder. A total of 90 households (19.3%) fall into this category. Meanwhile, the 65+ years age bracket for the primary householder has the lowest median household income of $27,614, with 139 households (29.8%) in this group.
| Income Bracket | # Households | Median Income |
| 15 to 24 Years | 24 (5.1%) | $27,857 |
| 25 to 44 Years | 90 (19.3%) | $35,833 |
| 45 to 64 Years | 213 (45.7%) | $31,354 |
| 65+ Years | 139 (29.8%) | $27,614 |
| Total | 466 (100.0%) | $31,100 |
Poverty in Clinton
Income Below Poverty by Sex and Age in Clinton
With 39.5% poverty level for males and 33.8% for females among the residents of Clinton, 12 to 14 year old males and 5 year old females are the most vulnerable to poverty, with 4 males (100.0%) and 6 females (60.0%) in their respective age groups living below the poverty level.
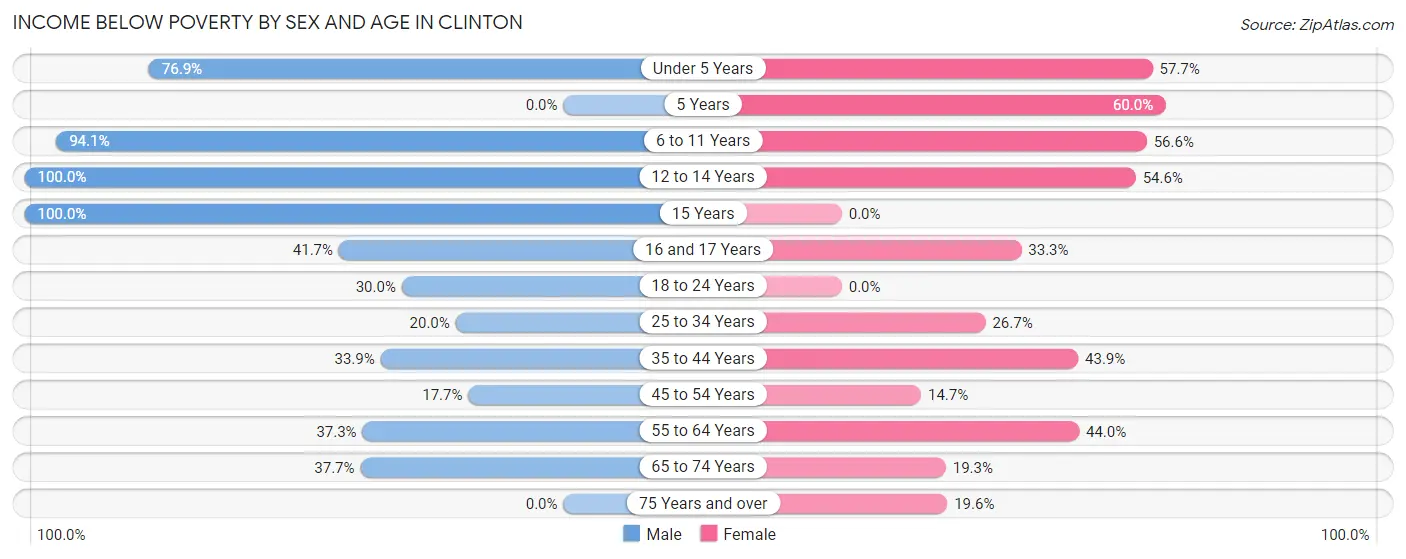
| Age Bracket | Male | Female |
| Under 5 Years | 20 (76.9%) | 15 (57.7%) |
| 5 Years | 0 (0.0%) | 6 (60.0%) |
| 6 to 11 Years | 32 (94.1%) | 30 (56.6%) |
| 12 to 14 Years | 4 (100.0%) | 6 (54.5%) |
| 15 Years | 14 (100.0%) | 0 (0.0%) |
| 16 and 17 Years | 5 (41.7%) | 8 (33.3%) |
| 18 to 24 Years | 30 (30.0%) | 0 (0.0%) |
| 25 to 34 Years | 8 (20.0%) | 12 (26.7%) |
| 35 to 44 Years | 19 (33.9%) | 25 (43.9%) |
| 45 to 54 Years | 9 (17.6%) | 10 (14.7%) |
| 55 to 64 Years | 22 (37.3%) | 59 (44.0%) |
| 65 to 74 Years | 26 (37.7%) | 11 (19.3%) |
| 75 Years and over | 0 (0.0%) | 9 (19.6%) |
| Total | 189 (39.5%) | 191 (33.8%) |
Income Above Poverty by Sex and Age in Clinton
According to the poverty statistics in Clinton, males aged 75 years and over and females aged 15 years are the age groups that are most secure financially, with 100.0% of males and 100.0% of females in these age groups living above the poverty line.
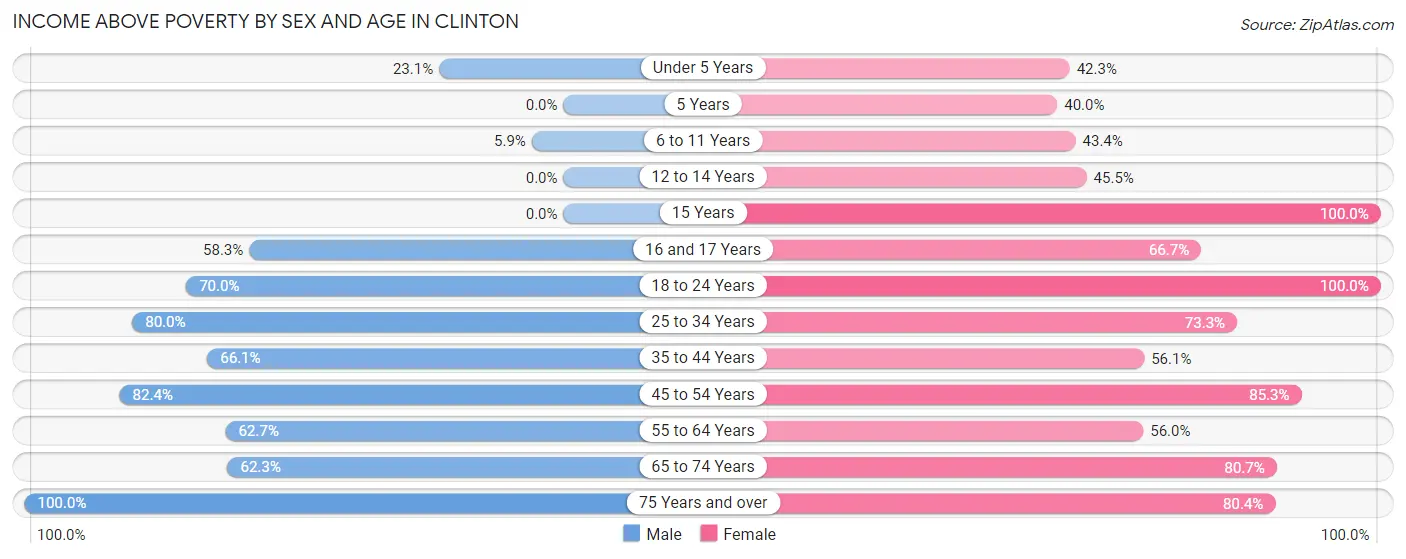
| Age Bracket | Male | Female |
| Under 5 Years | 6 (23.1%) | 11 (42.3%) |
| 5 Years | 0 (0.0%) | 4 (40.0%) |
| 6 to 11 Years | 2 (5.9%) | 23 (43.4%) |
| 12 to 14 Years | 0 (0.0%) | 5 (45.5%) |
| 15 Years | 0 (0.0%) | 6 (100.0%) |
| 16 and 17 Years | 7 (58.3%) | 16 (66.7%) |
| 18 to 24 Years | 70 (70.0%) | 28 (100.0%) |
| 25 to 34 Years | 32 (80.0%) | 33 (73.3%) |
| 35 to 44 Years | 37 (66.1%) | 32 (56.1%) |
| 45 to 54 Years | 42 (82.4%) | 58 (85.3%) |
| 55 to 64 Years | 37 (62.7%) | 75 (56.0%) |
| 65 to 74 Years | 43 (62.3%) | 46 (80.7%) |
| 75 Years and over | 13 (100.0%) | 37 (80.4%) |
| Total | 289 (60.5%) | 374 (66.2%) |
Income Below Poverty Among Married-Couple Families in Clinton
The poverty statistics for married-couple families in Clinton show that 24.4% or 32 of the total 131 families live below the poverty line. Families with 3 or 4 children have the highest poverty rate of 81.8%, comprising of 9 families. On the other hand, families with 1 or 2 children have the lowest poverty rate of 0.0%, which includes 0 families.
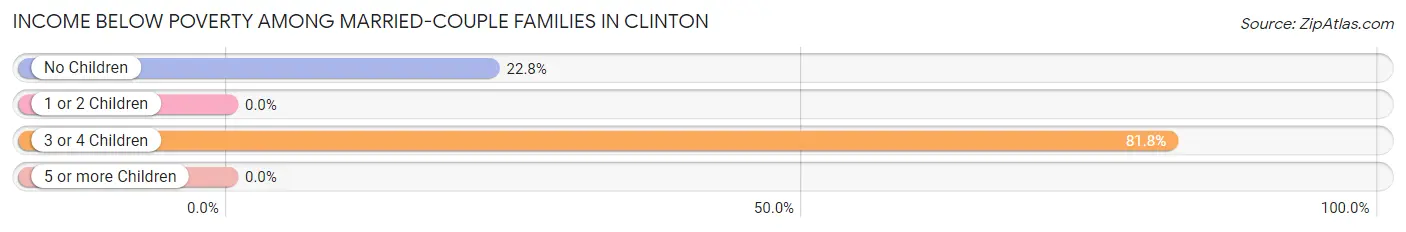
| Children | Above Poverty | Below Poverty |
| No Children | 78 (77.2%) | 23 (22.8%) |
| 1 or 2 Children | 19 (100.0%) | 0 (0.0%) |
| 3 or 4 Children | 2 (18.2%) | 9 (81.8%) |
| 5 or more Children | 0 (0.0%) | 0 (0.0%) |
| Total | 99 (75.6%) | 32 (24.4%) |
Income Below Poverty Among Single-Parent Households in Clinton
According to the poverty data in Clinton, 30.8% or 4 single-father households and 36.4% or 28 single-mother households are living below the poverty line. Among single-father households, those with 1 or 2 children have the highest poverty rate, with 4 households (100.0%) experiencing poverty. Likewise, among single-mother households, those with 3 or 4 children have the highest poverty rate, with 20 households (100.0%) falling below the poverty line.
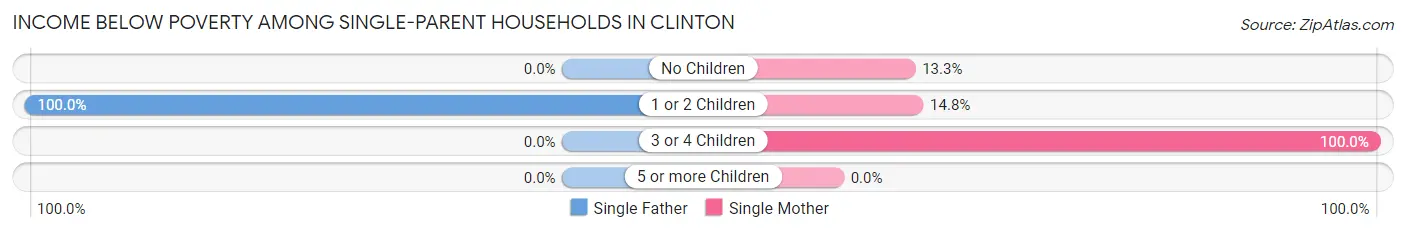
| Children | Single Father | Single Mother |
| No Children | 0 (0.0%) | 4 (13.3%) |
| 1 or 2 Children | 4 (100.0%) | 4 (14.8%) |
| 3 or 4 Children | 0 (0.0%) | 20 (100.0%) |
| 5 or more Children | 0 (0.0%) | 0 (0.0%) |
| Total | 4 (30.8%) | 28 (36.4%) |
Income Below Poverty Among Married-Couple vs Single-Parent Households in Clinton
The poverty data for Clinton shows that 32 of the married-couple family households (24.4%) and 32 of the single-parent households (35.6%) are living below the poverty level. Within the married-couple family households, those with 3 or 4 children have the highest poverty rate, with 9 households (81.8%) falling below the poverty line. Among the single-parent households, those with 3 or 4 children have the highest poverty rate, with 20 household (87.0%) living below poverty.
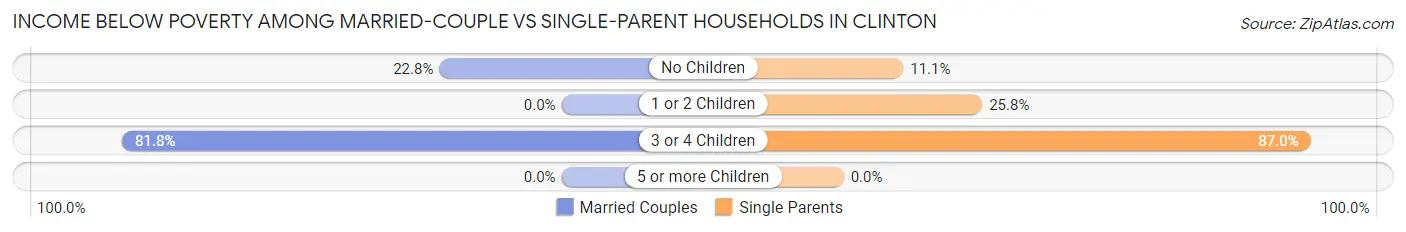
| Children | Married-Couple Families | Single-Parent Households |
| No Children | 23 (22.8%) | 4 (11.1%) |
| 1 or 2 Children | 0 (0.0%) | 8 (25.8%) |
| 3 or 4 Children | 9 (81.8%) | 20 (87.0%) |
| 5 or more Children | 0 (0.0%) | 0 (0.0%) |
| Total | 32 (24.4%) | 32 (35.6%) |
Race in Clinton
The most populous races in Clinton are White / Caucasian (761 | 64.9%), Black / African American (362 | 30.9%), and Two or more Races (44 | 3.7%).
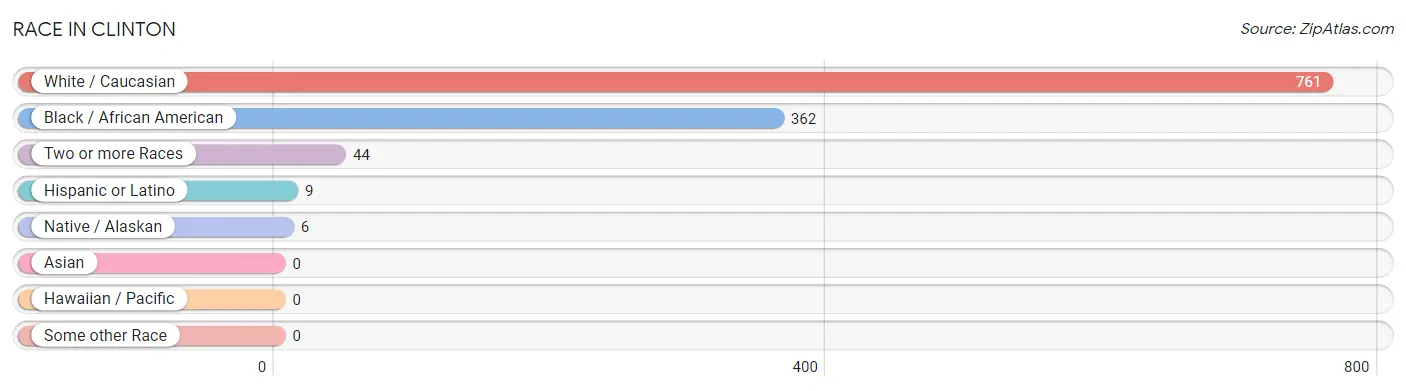
| Race | # Population | % Population |
| Asian | 0 | 0.0% |
| Black / African American | 362 | 30.9% |
| Hawaiian / Pacific | 0 | 0.0% |
| Hispanic or Latino | 9 | 0.8% |
| Native / Alaskan | 6 | 0.5% |
| White / Caucasian | 761 | 64.9% |
| Two or more Races | 44 | 3.7% |
| Some other Race | 0 | 0.0% |
| Total | 1,173 | 100.0% |
Ancestry in Clinton
The most populous ancestries reported in Clinton are English (267 | 22.8%), American (113 | 9.6%), Irish (88 | 7.5%), African (87 | 7.4%), and Subsaharan African (87 | 7.4%), together accounting for 54.7% of all Clinton residents.
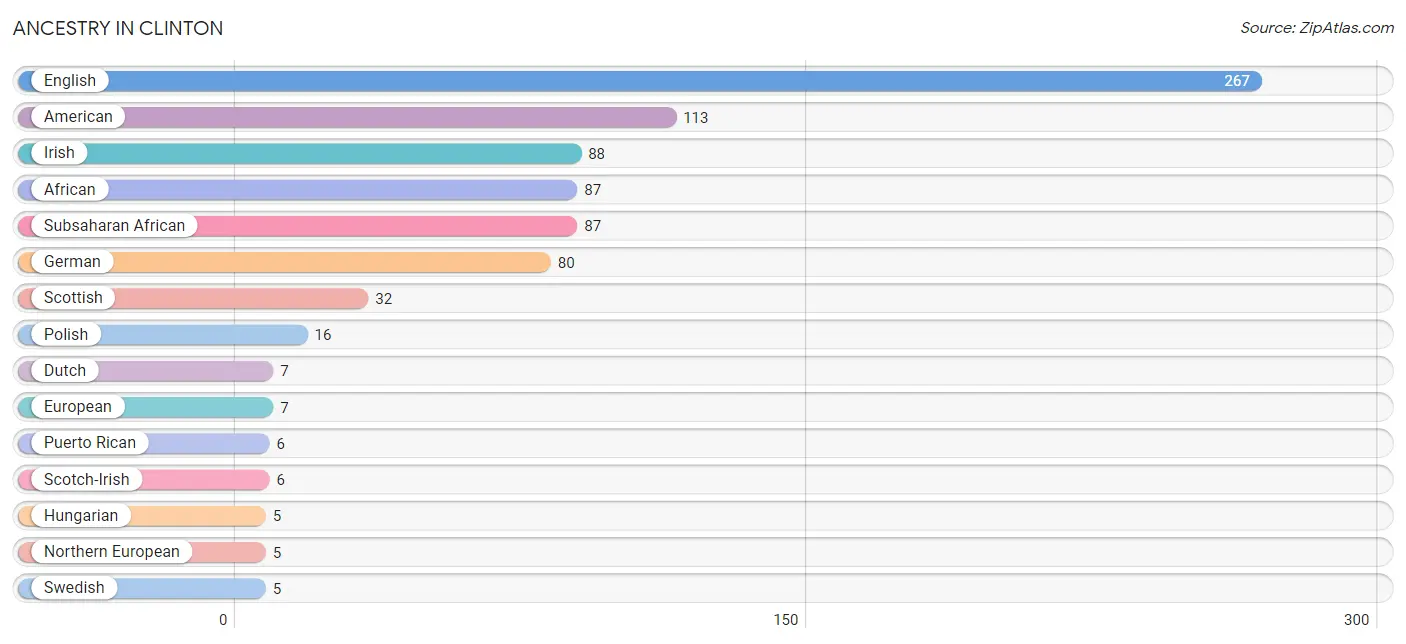
| Ancestry | # Population | % Population |
| African | 87 | 7.4% |
| American | 113 | 9.6% |
| Cherokee | 2 | 0.2% |
| Danish | 3 | 0.3% |
| Dutch | 7 | 0.6% |
| English | 267 | 22.8% |
| European | 7 | 0.6% |
| German | 80 | 6.8% |
| Hungarian | 5 | 0.4% |
| Irish | 88 | 7.5% |
| Italian | 3 | 0.3% |
| Mexican | 3 | 0.3% |
| Mexican American Indian | 3 | 0.3% |
| Northern European | 5 | 0.4% |
| Polish | 16 | 1.4% |
| Puerto Rican | 6 | 0.5% |
| Scotch-Irish | 6 | 0.5% |
| Scottish | 32 | 2.7% |
| Subsaharan African | 87 | 7.4% |
| Swedish | 5 | 0.4% | View All 20 Rows |
Immigrants in Clinton
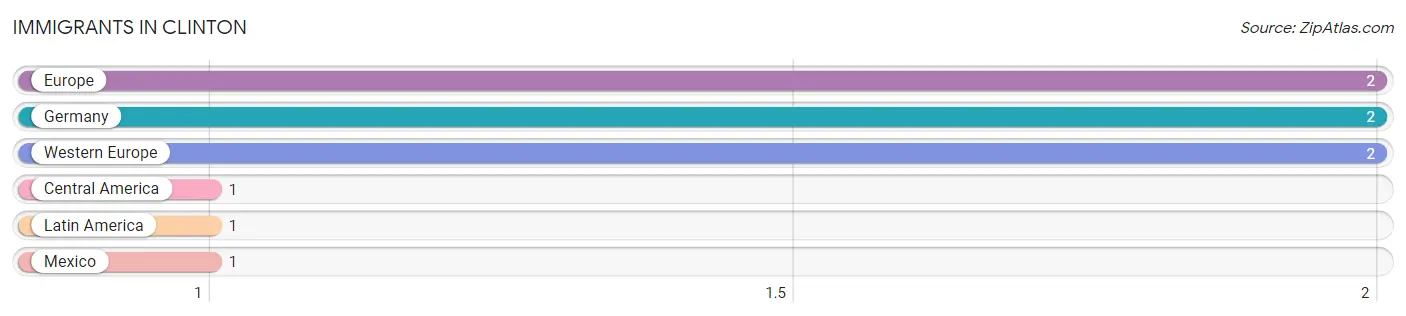
The most numerous immigrant groups reported in Clinton came from Europe (2 | 0.2%), Germany (2 | 0.2%), Western Europe (2 | 0.2%), Central America (1 | 0.1%), and Latin America (1 | 0.1%), together accounting for 0.7% of all Clinton residents.
| Immigration Origin | # Population | % Population |
| Central America | 1 | 0.1% |
| Europe | 2 | 0.2% |
| Germany | 2 | 0.2% |
| Latin America | 1 | 0.1% |
| Mexico | 1 | 0.1% |
| Western Europe | 2 | 0.2% | View All 6 Rows |
Sex and Age in Clinton
Sex and Age in Clinton
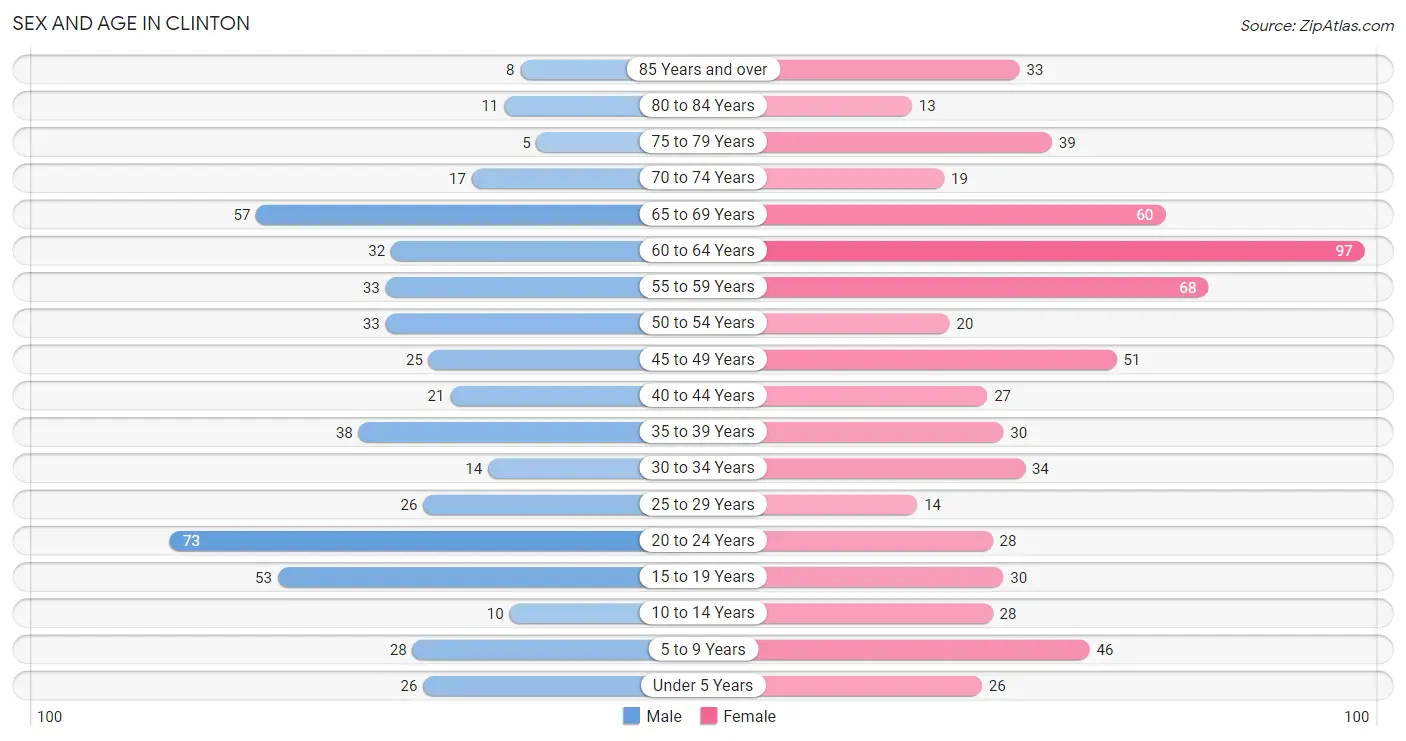
The most populous age groups in Clinton are 20 to 24 Years (73 | 14.3%) for men and 60 to 64 Years (97 | 14.6%) for women.
| Age Bracket | Male | Female |
| Under 5 Years | 26 (5.1%) | 26 (3.9%) |
| 5 to 9 Years | 28 (5.5%) | 46 (6.9%) |
| 10 to 14 Years | 10 (2.0%) | 28 (4.2%) |
| 15 to 19 Years | 53 (10.4%) | 30 (4.5%) |
| 20 to 24 Years | 73 (14.3%) | 28 (4.2%) |
| 25 to 29 Years | 26 (5.1%) | 14 (2.1%) |
| 30 to 34 Years | 14 (2.8%) | 34 (5.1%) |
| 35 to 39 Years | 38 (7.4%) | 30 (4.5%) |
| 40 to 44 Years | 21 (4.1%) | 27 (4.1%) |
| 45 to 49 Years | 25 (4.9%) | 51 (7.7%) |
| 50 to 54 Years | 33 (6.5%) | 20 (3.0%) |
| 55 to 59 Years | 33 (6.5%) | 68 (10.3%) |
| 60 to 64 Years | 32 (6.3%) | 97 (14.6%) |
| 65 to 69 Years | 57 (11.2%) | 60 (9.0%) |
| 70 to 74 Years | 17 (3.3%) | 19 (2.9%) |
| 75 to 79 Years | 5 (1.0%) | 39 (5.9%) |
| 80 to 84 Years | 11 (2.2%) | 13 (2.0%) |
| 85 Years and over | 8 (1.6%) | 33 (5.0%) |
| Total | 510 (100.0%) | 663 (100.0%) |
Families and Households in Clinton
Median Family Size in Clinton
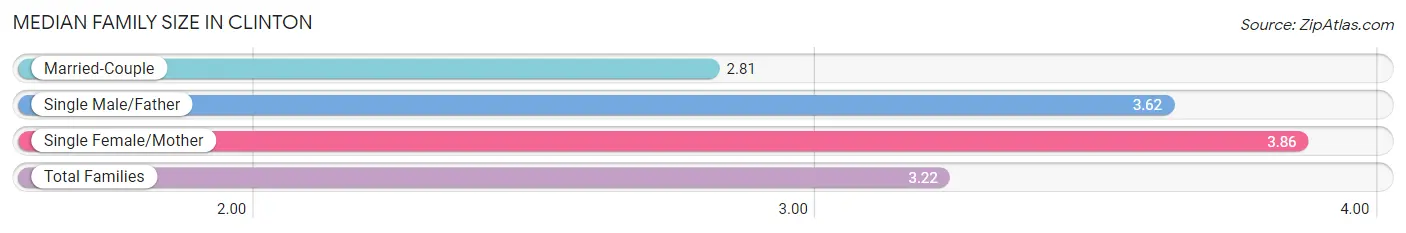
The median family size in Clinton is 3.22 persons per family, with single female/mother families (77 | 34.8%) accounting for the largest median family size of 3.86 persons per family. On the other hand, married-couple families (131 | 59.3%) represent the smallest median family size with 2.81 persons per family.
| Family Type | # Families | Family Size |
| Married-Couple | 131 (59.3%) | 2.81 |
| Single Male/Father | 13 (5.9%) | 3.62 |
| Single Female/Mother | 77 (34.8%) | 3.86 |
| Total Families | 221 (100.0%) | 3.22 |
Median Household Size in Clinton
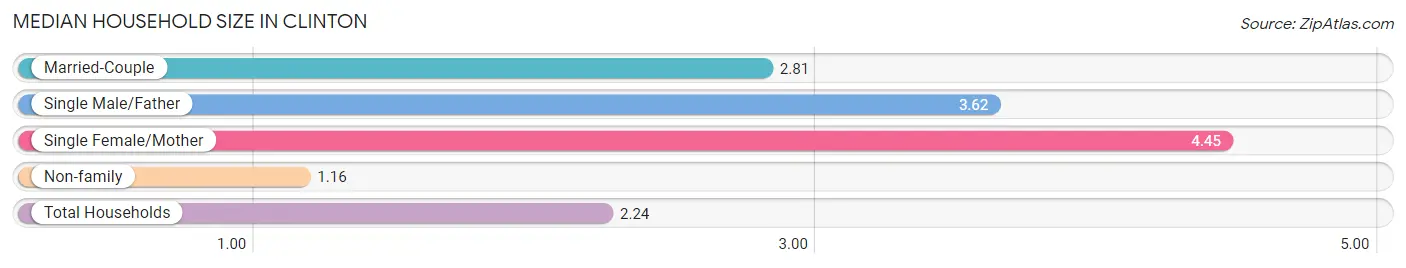
The median household size in Clinton is 2.24 persons per household, with single female/mother households (77 | 16.5%) accounting for the largest median household size of 4.45 persons per household. non-family households (245 | 52.6%) represent the smallest median household size with 1.16 persons per household.
| Household Type | # Households | Household Size |
| Married-Couple | 131 (28.1%) | 2.81 |
| Single Male/Father | 13 (2.8%) | 3.62 |
| Single Female/Mother | 77 (16.5%) | 4.45 |
| Non-family | 245 (52.6%) | 1.16 |
| Total Households | 466 (100.0%) | 2.24 |
Household Size by Marriage Status in Clinton
Out of a total of 466 households in Clinton, 221 (47.4%) are family households, while 245 (52.6%) are nonfamily households. The most numerous type of family households are 2-person households, comprising 102, and the most common type of nonfamily households are 1-person households, comprising 218.
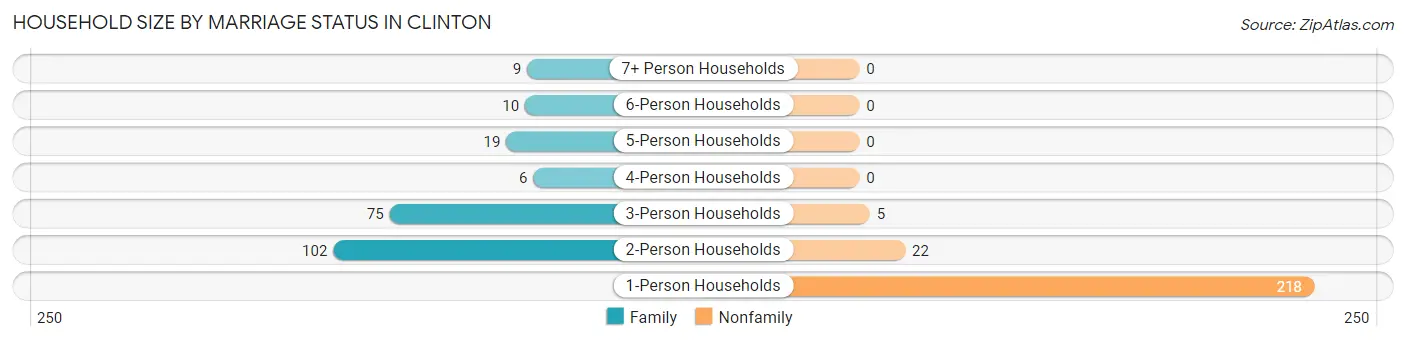
| Household Size | Family Households | Nonfamily Households |
| 1-Person Households | - | 218 (46.8%) |
| 2-Person Households | 102 (21.9%) | 22 (4.7%) |
| 3-Person Households | 75 (16.1%) | 5 (1.1%) |
| 4-Person Households | 6 (1.3%) | 0 (0.0%) |
| 5-Person Households | 19 (4.1%) | 0 (0.0%) |
| 6-Person Households | 10 (2.1%) | 0 (0.0%) |
| 7+ Person Households | 9 (1.9%) | 0 (0.0%) |
| Total | 221 (47.4%) | 245 (52.6%) |
Female Fertility in Clinton
Fertility by Age in Clinton
Average fertility rate in Clinton is 122.0 births per 1,000 women. Women in the age bracket of 20 to 34 years have the highest fertility rate with 211.0 births per 1,000 women. Women in the age bracket of 20 to 34 years acount for 59.3% of all women with births.
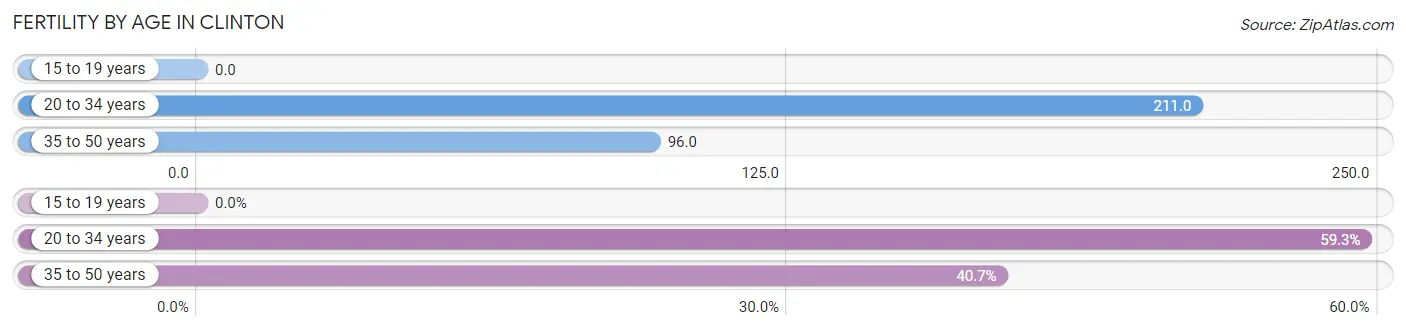
| Age Bracket | Women with Births | Births / 1,000 Women |
| 15 to 19 years | 0 (0.0%) | 0.0 |
| 20 to 34 years | 16 (59.3%) | 211.0 |
| 35 to 50 years | 11 (40.7%) | 96.0 |
| Total | 27 (100.0%) | 122.0 |
Fertility by Age by Marriage Status in Clinton
40.7% of women with births (27) in Clinton are married. The highest percentage of unmarried women with births falls into 20 to 34 years age bracket with 100.0% of them unmarried at the time of birth, while the lowest percentage of unmarried women with births belong to 35 to 50 years age bracket with 0.0% of them unmarried.
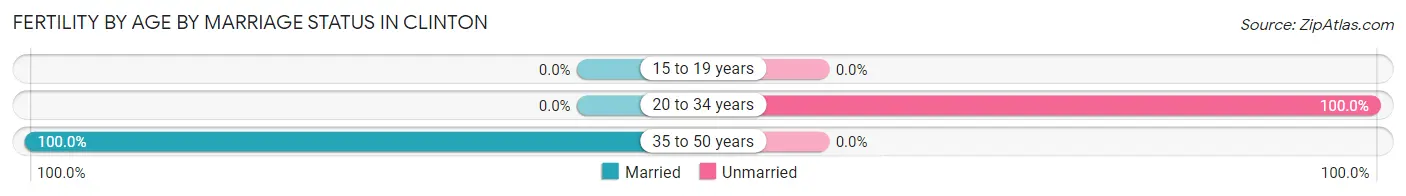
| Age Bracket | Married | Unmarried |
| 15 to 19 years | 0 (0.0%) | 0 (0.0%) |
| 20 to 34 years | 0 (0.0%) | 16 (100.0%) |
| 35 to 50 years | 11 (100.0%) | 0 (0.0%) |
| Total | 11 (40.7%) | 16 (59.3%) |
Fertility by Education in Clinton
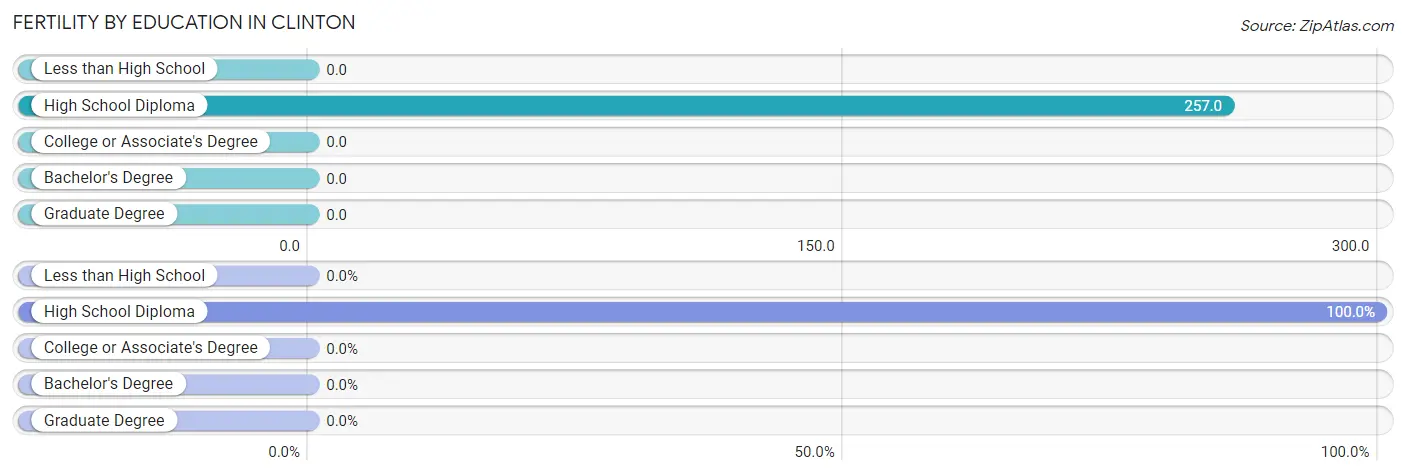
| Educational Attainment | Women with Births | Births / 1,000 Women |
| Less than High School | 0 (0.0%) | 0.0 |
| High School Diploma | 27 (100.0%) | 257.0 |
| College or Associate's Degree | 0 (0.0%) | 0.0 |
| Bachelor's Degree | 0 (0.0%) | 0.0 |
| Graduate Degree | 0 (0.0%) | 0.0 |
| Total | 27 (100.0%) | 122.0 |
Fertility by Education by Marriage Status in Clinton
59.3% of women with births in Clinton are unmarried. Women with the educational attainment of high school diploma are most likely to be married with 40.7% of them married at childbirth, while women with the educational attainment of high school diploma are least likely to be married with 59.3% of them unmarried at childbirth.
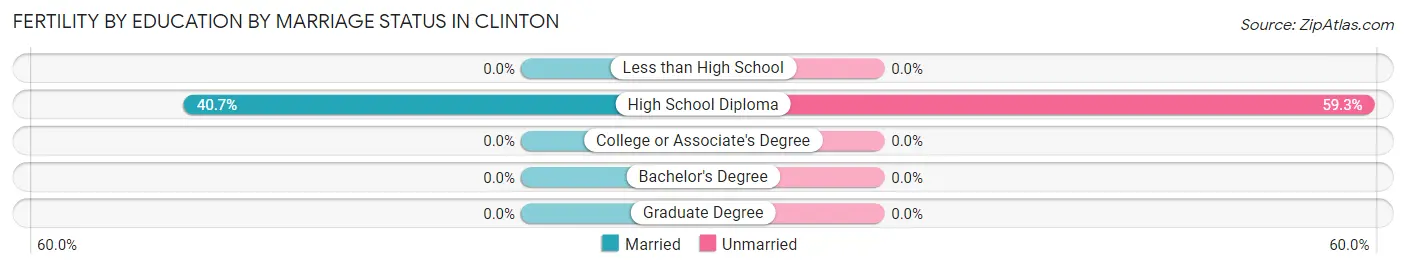
| Educational Attainment | Married | Unmarried |
| Less than High School | 0 (0.0%) | 0 (0.0%) |
| High School Diploma | 11 (40.7%) | 16 (59.3%) |
| College or Associate's Degree | 0 (0.0%) | 0 (0.0%) |
| Bachelor's Degree | 0 (0.0%) | 0 (0.0%) |
| Graduate Degree | 0 (0.0%) | 0 (0.0%) |
| Total | 11 (40.7%) | 16 (59.3%) |
Employment Characteristics in Clinton
Employment by Class of Employer in Clinton
Among the 335 employed individuals in Clinton, private company employees (251 | 74.9%), not-for-profit organizations (31 | 9.2%), and local government employees (19 | 5.7%) make up the most common classes of employment.
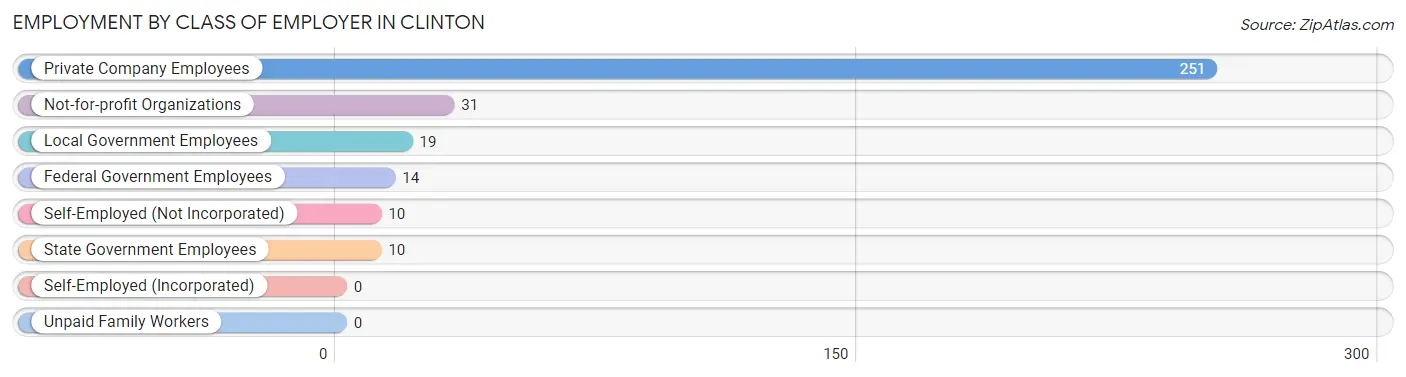
| Employer Class | # Employees | % Employees |
| Private Company Employees | 251 | 74.9% |
| Self-Employed (Incorporated) | 0 | 0.0% |
| Self-Employed (Not Incorporated) | 10 | 3.0% |
| Not-for-profit Organizations | 31 | 9.2% |
| Local Government Employees | 19 | 5.7% |
| State Government Employees | 10 | 3.0% |
| Federal Government Employees | 14 | 4.2% |
| Unpaid Family Workers | 0 | 0.0% |
| Total | 335 | 100.0% |
Employment Status by Age in Clinton
According to the labor force statistics for Clinton, out of the total population over 16 years of age (989), 39.5% or 391 individuals are in the labor force, with 13.3% or 52 of them unemployed. The age group with the highest labor force participation rate is 30 to 34 years, with 85.4% or 41 individuals in the labor force. Within the labor force, the 55 to 59 years age range has the highest percentage of unemployed individuals, with 41.2% or 7 of them being unemployed.
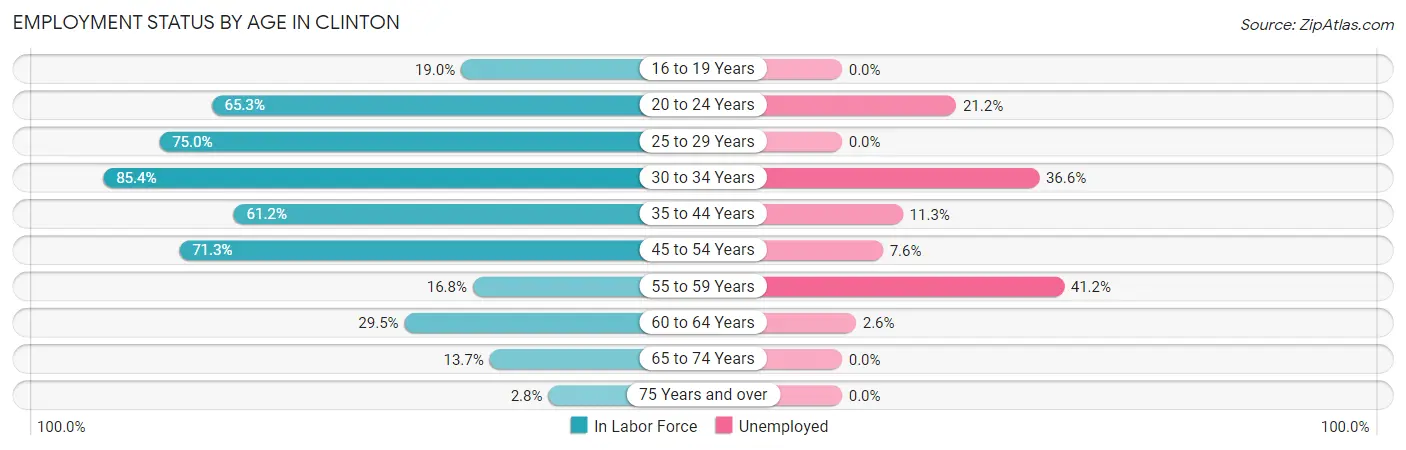
| Age Bracket | In Labor Force | Unemployed |
| 16 to 19 Years | 12 (19.0%) | 0 (0.0%) |
| 20 to 24 Years | 66 (65.3%) | 14 (21.2%) |
| 25 to 29 Years | 30 (75.0%) | 0 (0.0%) |
| 30 to 34 Years | 41 (85.4%) | 15 (36.6%) |
| 35 to 44 Years | 71 (61.2%) | 8 (11.3%) |
| 45 to 54 Years | 92 (71.3%) | 7 (7.6%) |
| 55 to 59 Years | 17 (16.8%) | 7 (41.2%) |
| 60 to 64 Years | 38 (29.5%) | 1 (2.6%) |
| 65 to 74 Years | 21 (13.7%) | 0 (0.0%) |
| 75 Years and over | 3 (2.8%) | 0 (0.0%) |
| Total | 391 (39.5%) | 52 (13.3%) |
Employment Status by Educational Attainment in Clinton
According to labor force statistics for Clinton, 51.3% of individuals (289) out of the total population between 25 and 64 years of age (563) are in the labor force, with 13.1% or 38 of them being unemployed. The group with the highest labor force participation rate are those with the educational attainment of college / associate degree, with 74.9% or 137 individuals in the labor force. Within the labor force, individuals with less than high school education have the highest percentage of unemployment, with 38.5% or 15 of them being unemployed.
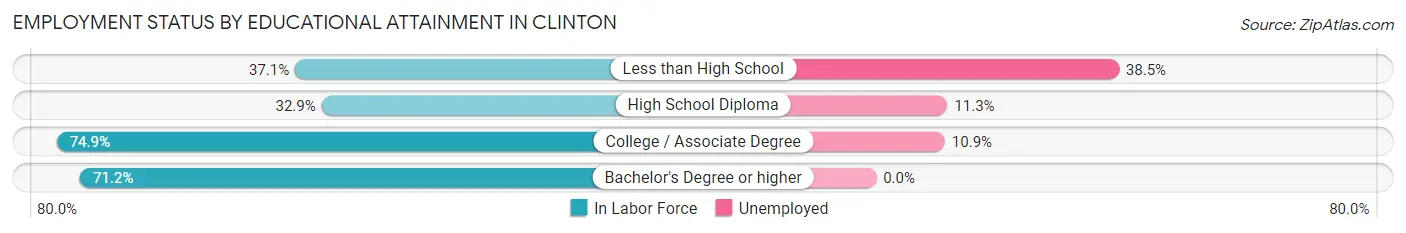
| Educational Attainment | In Labor Force | Unemployed |
| Less than High School | 39 (37.1%) | 40 (38.5%) |
| High School Diploma | 71 (32.9%) | 24 (11.3%) |
| College / Associate Degree | 137 (74.9%) | 20 (10.9%) |
| Bachelor's Degree or higher | 42 (71.2%) | 0 (0.0%) |
| Total | 289 (51.3%) | 74 (13.1%) |
Employment Occupations by Sex in Clinton
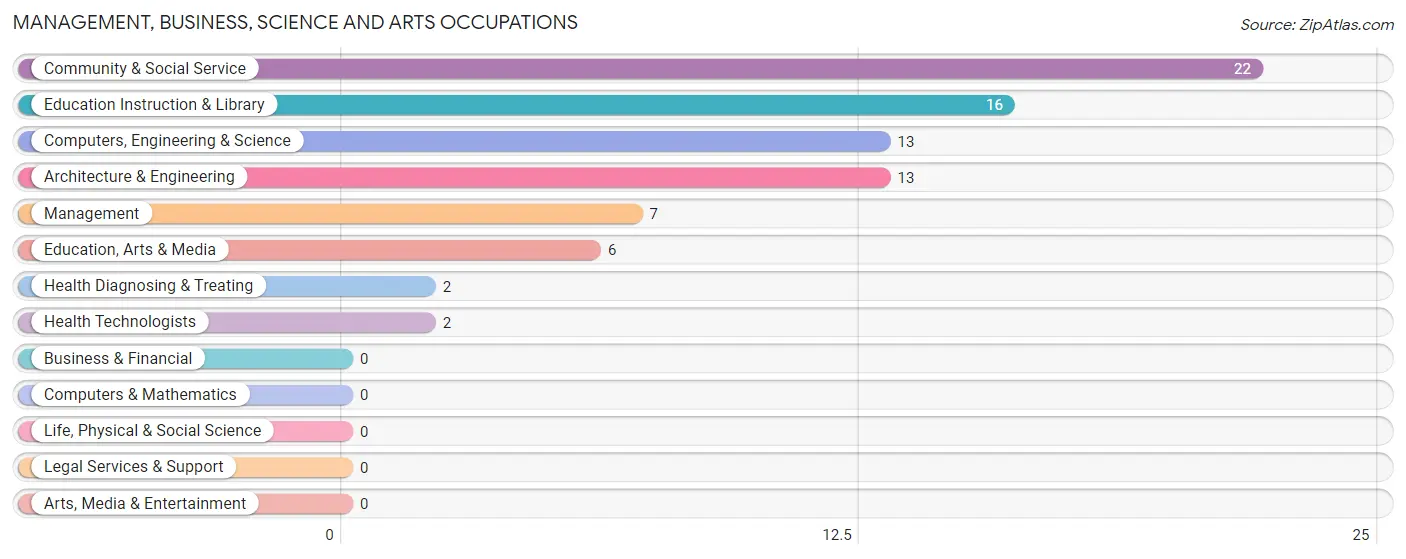
Management, Business, Science and Arts Occupations
The most common Management, Business, Science and Arts occupations in Clinton are Community & Social Service (22 | 6.5%), Education Instruction & Library (16 | 4.7%), Computers, Engineering & Science (13 | 3.8%), Architecture & Engineering (13 | 3.8%), and Management (7 | 2.1%).
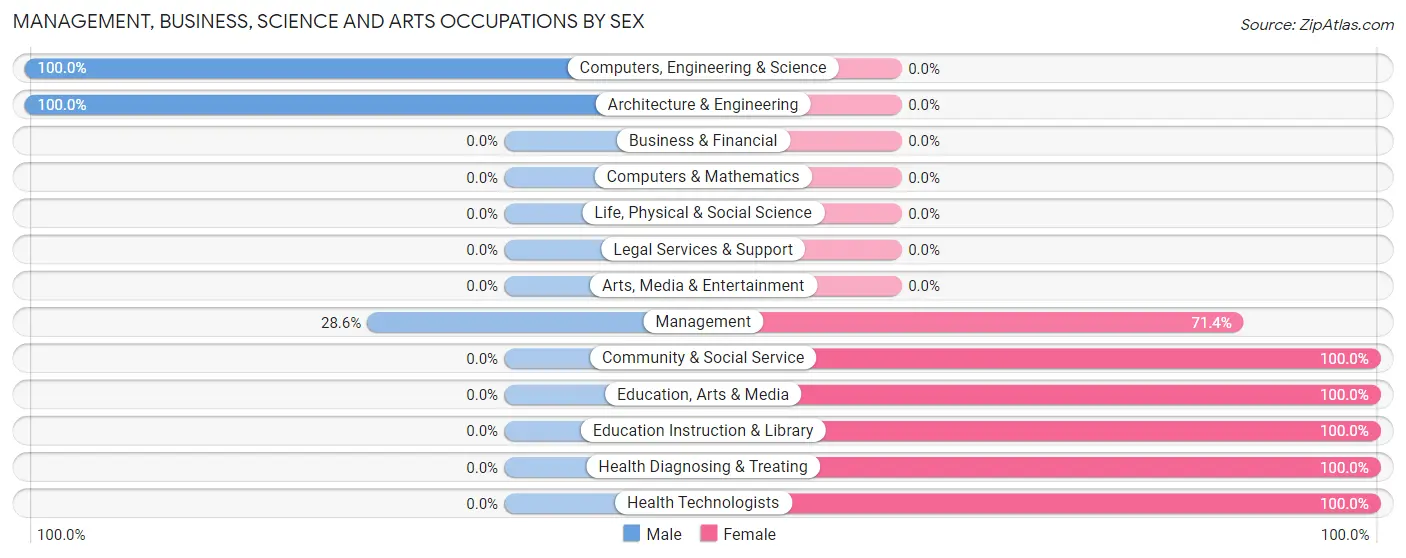
Management, Business, Science and Arts Occupations by Sex
Within the Management, Business, Science and Arts occupations in Clinton, the most male-oriented occupations are Computers, Engineering & Science (100.0%), Architecture & Engineering (100.0%), and Management (28.6%), while the most female-oriented occupations are Community & Social Service (100.0%), Education, Arts & Media (100.0%), and Education Instruction & Library (100.0%).
| Occupation | Male | Female |
| Management | 2 (28.6%) | 5 (71.4%) |
| Business & Financial | 0 (0.0%) | 0 (0.0%) |
| Computers, Engineering & Science | 13 (100.0%) | 0 (0.0%) |
| Computers & Mathematics | 0 (0.0%) | 0 (0.0%) |
| Architecture & Engineering | 13 (100.0%) | 0 (0.0%) |
| Life, Physical & Social Science | 0 (0.0%) | 0 (0.0%) |
| Community & Social Service | 0 (0.0%) | 22 (100.0%) |
| Education, Arts & Media | 0 (0.0%) | 6 (100.0%) |
| Legal Services & Support | 0 (0.0%) | 0 (0.0%) |
| Education Instruction & Library | 0 (0.0%) | 16 (100.0%) |
| Arts, Media & Entertainment | 0 (0.0%) | 0 (0.0%) |
| Health Diagnosing & Treating | 0 (0.0%) | 2 (100.0%) |
| Health Technologists | 0 (0.0%) | 2 (100.0%) |
| Total (Category) | 15 (34.1%) | 29 (65.9%) |
| Total (Overall) | 163 (48.1%) | 176 (51.9%) |
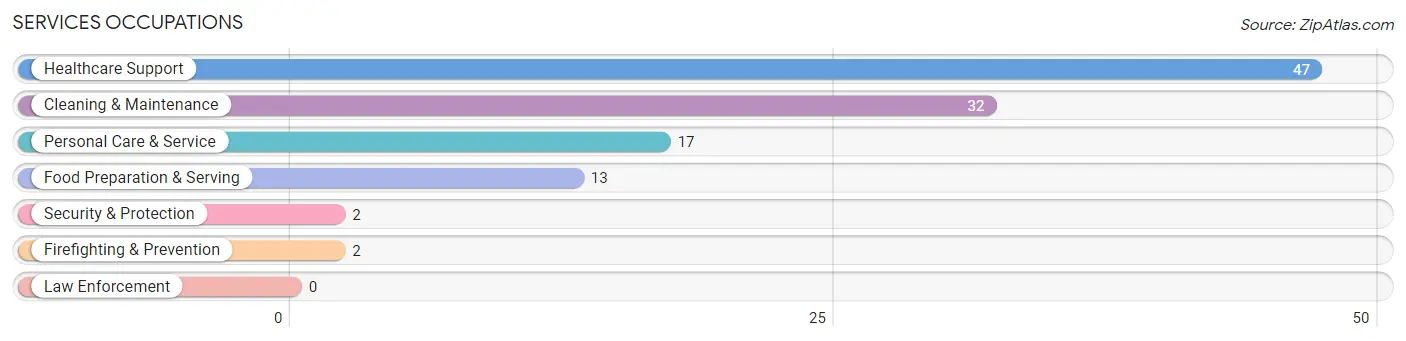
Services Occupations
The most common Services occupations in Clinton are Healthcare Support (47 | 13.9%), Cleaning & Maintenance (32 | 9.4%), Personal Care & Service (17 | 5.0%), Food Preparation & Serving (13 | 3.8%), and Security & Protection (2 | 0.6%).
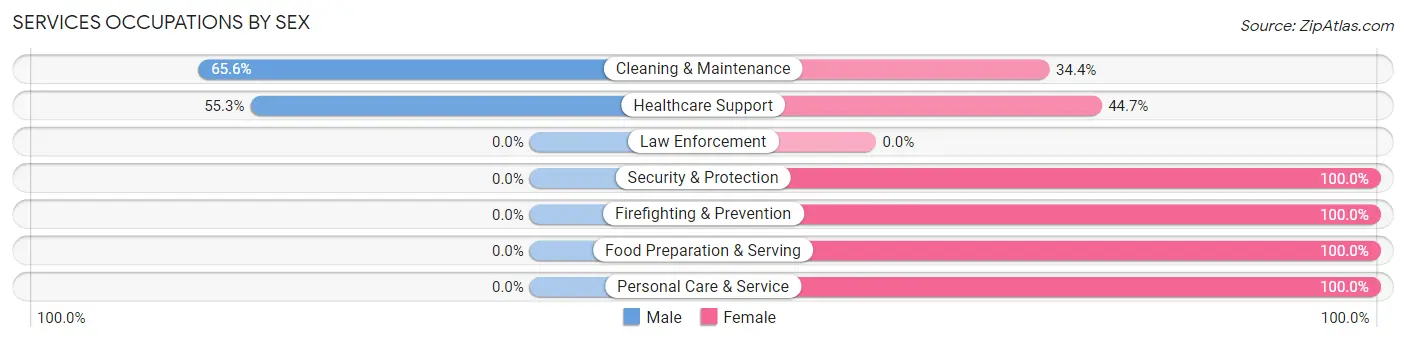
Services Occupations by Sex
Within the Services occupations in Clinton, the most male-oriented occupations are Cleaning & Maintenance (65.6%), and Healthcare Support (55.3%), while the most female-oriented occupations are Security & Protection (100.0%), Firefighting & Prevention (100.0%), and Food Preparation & Serving (100.0%).
| Occupation | Male | Female |
| Healthcare Support | 26 (55.3%) | 21 (44.7%) |
| Security & Protection | 0 (0.0%) | 2 (100.0%) |
| Firefighting & Prevention | 0 (0.0%) | 2 (100.0%) |
| Law Enforcement | 0 (0.0%) | 0 (0.0%) |
| Food Preparation & Serving | 0 (0.0%) | 13 (100.0%) |
| Cleaning & Maintenance | 21 (65.6%) | 11 (34.4%) |
| Personal Care & Service | 0 (0.0%) | 17 (100.0%) |
| Total (Category) | 47 (42.3%) | 64 (57.7%) |
| Total (Overall) | 163 (48.1%) | 176 (51.9%) |
Sales and Office Occupations
The most common Sales and Office occupations in Clinton are Office & Administration (75 | 22.1%), and Sales & Related (9 | 2.6%).
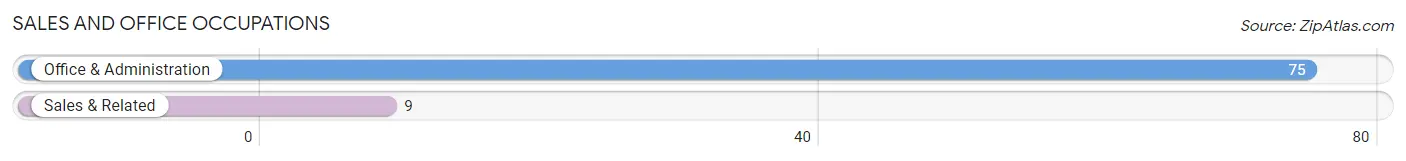
Sales and Office Occupations by Sex
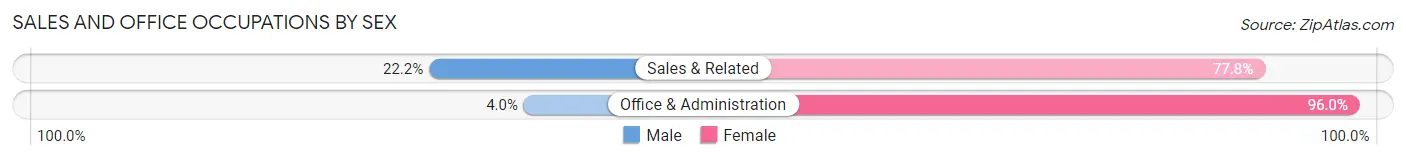
| Occupation | Male | Female |
| Sales & Related | 2 (22.2%) | 7 (77.8%) |
| Office & Administration | 3 (4.0%) | 72 (96.0%) |
| Total (Category) | 5 (5.9%) | 79 (94.1%) |
| Total (Overall) | 163 (48.1%) | 176 (51.9%) |
Natural Resources, Construction and Maintenance Occupations
The most common Natural Resources, Construction and Maintenance occupations in Clinton are Installation, Maintenance & Repair (21 | 6.2%), Farming, Fishing & Forestry (4 | 1.2%), and Construction & Extraction (3 | 0.9%).
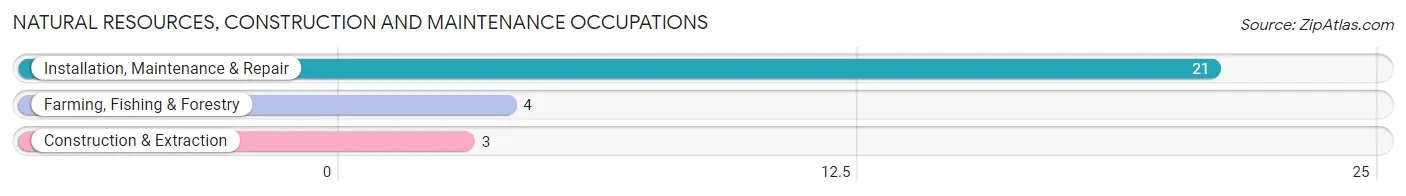
Natural Resources, Construction and Maintenance Occupations by Sex
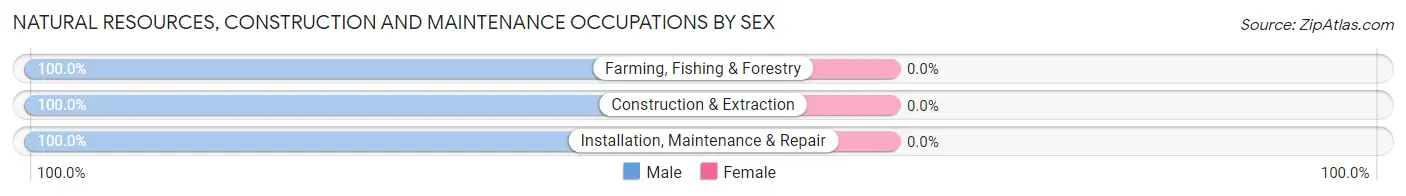
| Occupation | Male | Female |
| Farming, Fishing & Forestry | 4 (100.0%) | 0 (0.0%) |
| Construction & Extraction | 3 (100.0%) | 0 (0.0%) |
| Installation, Maintenance & Repair | 21 (100.0%) | 0 (0.0%) |
| Total (Category) | 28 (100.0%) | 0 (0.0%) |
| Total (Overall) | 163 (48.1%) | 176 (51.9%) |
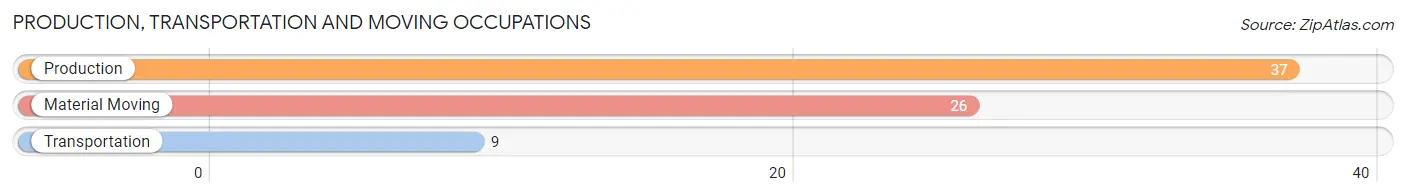
Production, Transportation and Moving Occupations
The most common Production, Transportation and Moving occupations in Clinton are Production (37 | 10.9%), Material Moving (26 | 7.7%), and Transportation (9 | 2.6%).
Production, Transportation and Moving Occupations by Sex
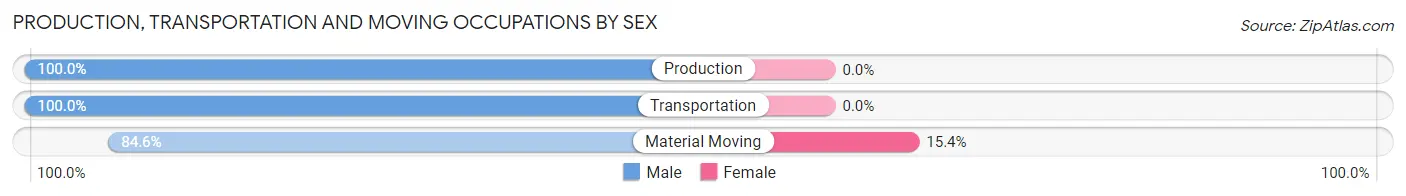
| Occupation | Male | Female |
| Production | 37 (100.0%) | 0 (0.0%) |
| Transportation | 9 (100.0%) | 0 (0.0%) |
| Material Moving | 22 (84.6%) | 4 (15.4%) |
| Total (Category) | 68 (94.4%) | 4 (5.6%) |
| Total (Overall) | 163 (48.1%) | 176 (51.9%) |
Employment Industries by Sex in Clinton
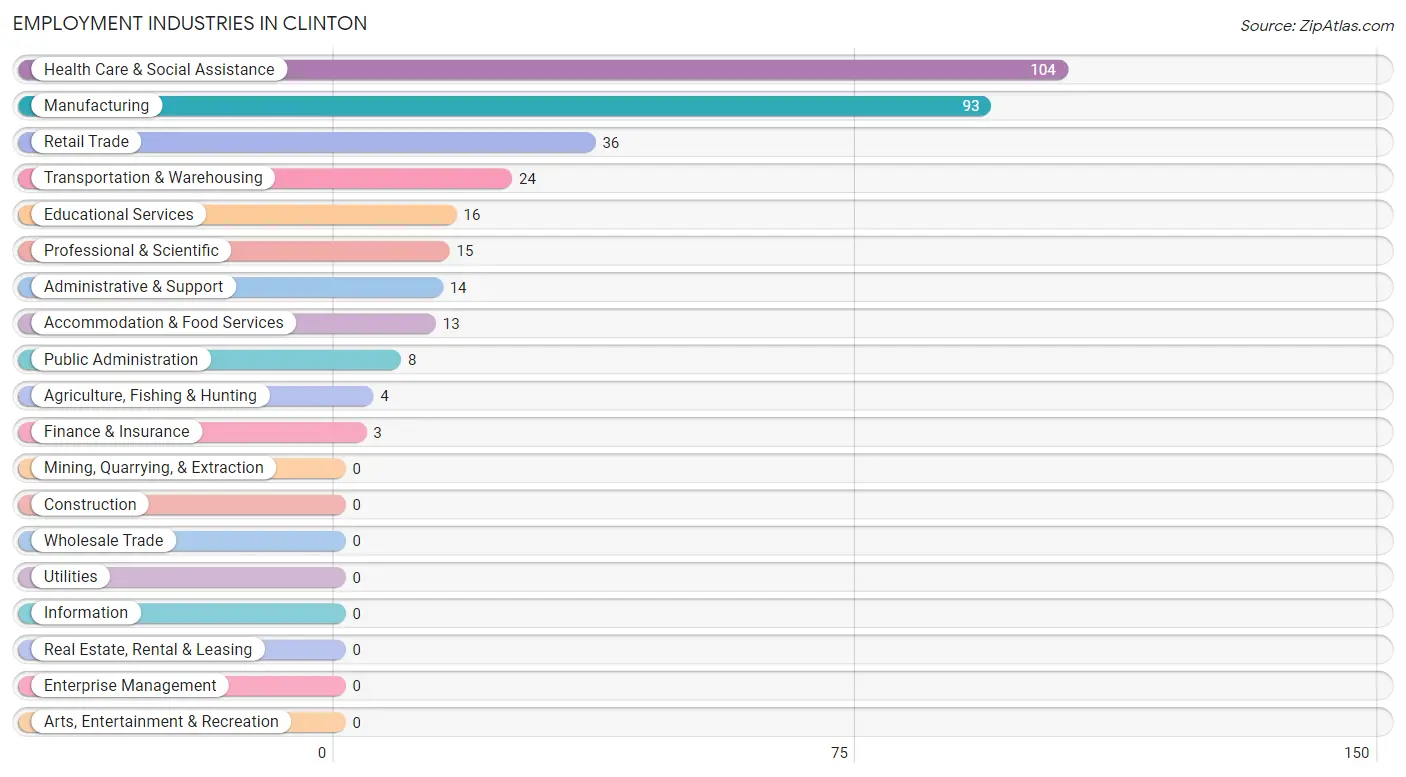
Employment Industries in Clinton
The major employment industries in Clinton include Health Care & Social Assistance (104 | 30.7%), Manufacturing (93 | 27.4%), Retail Trade (36 | 10.6%), Transportation & Warehousing (24 | 7.1%), and Educational Services (16 | 4.7%).
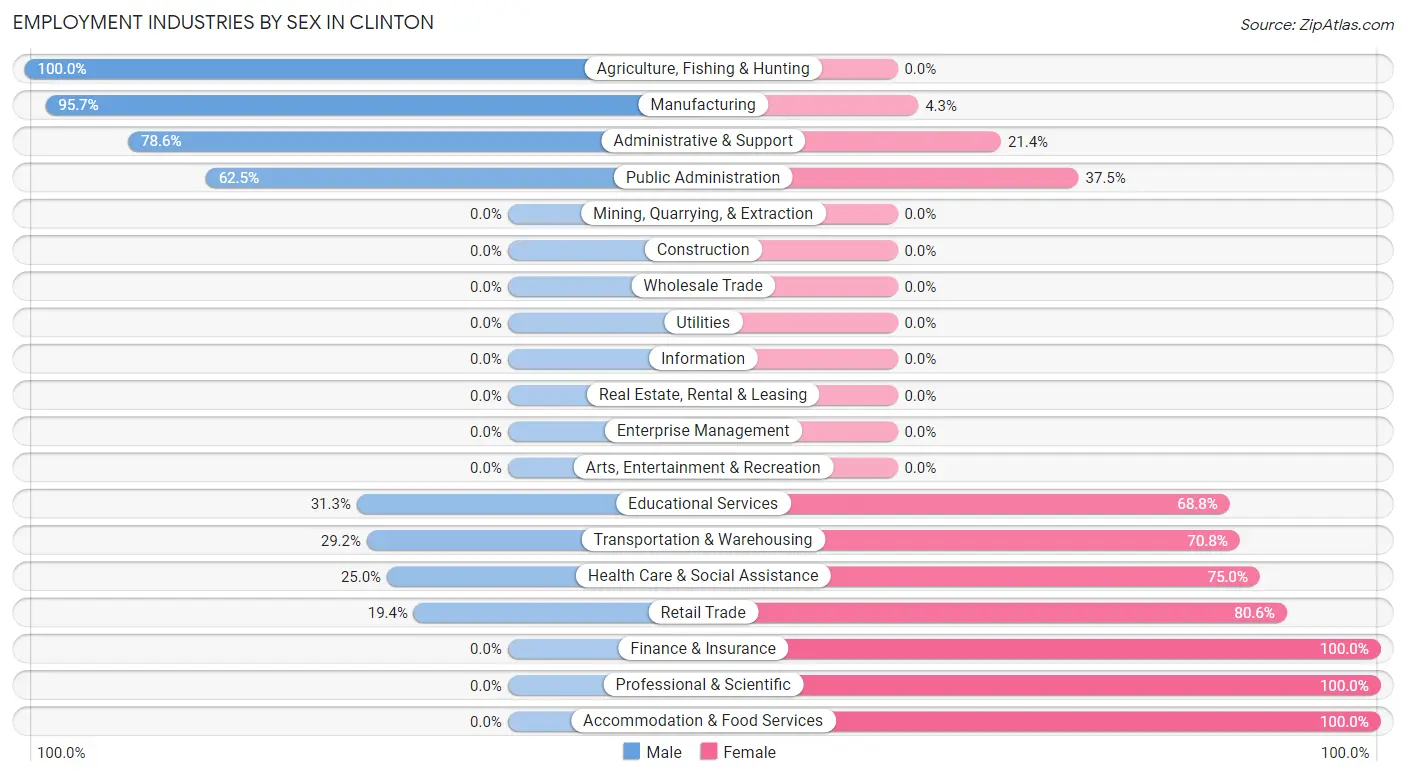
Employment Industries by Sex in Clinton
The Clinton industries that see more men than women are Agriculture, Fishing & Hunting (100.0%), Manufacturing (95.7%), and Administrative & Support (78.6%), whereas the industries that tend to have a higher number of women are Finance & Insurance (100.0%), Professional & Scientific (100.0%), and Accommodation & Food Services (100.0%).
| Industry | Male | Female |
| Agriculture, Fishing & Hunting | 4 (100.0%) | 0 (0.0%) |
| Mining, Quarrying, & Extraction | 0 (0.0%) | 0 (0.0%) |
| Construction | 0 (0.0%) | 0 (0.0%) |
| Manufacturing | 89 (95.7%) | 4 (4.3%) |
| Wholesale Trade | 0 (0.0%) | 0 (0.0%) |
| Retail Trade | 7 (19.4%) | 29 (80.6%) |
| Transportation & Warehousing | 7 (29.2%) | 17 (70.8%) |
| Utilities | 0 (0.0%) | 0 (0.0%) |
| Information | 0 (0.0%) | 0 (0.0%) |
| Finance & Insurance | 0 (0.0%) | 3 (100.0%) |
| Real Estate, Rental & Leasing | 0 (0.0%) | 0 (0.0%) |
| Professional & Scientific | 0 (0.0%) | 15 (100.0%) |
| Enterprise Management | 0 (0.0%) | 0 (0.0%) |
| Administrative & Support | 11 (78.6%) | 3 (21.4%) |
| Educational Services | 5 (31.2%) | 11 (68.8%) |
| Health Care & Social Assistance | 26 (25.0%) | 78 (75.0%) |
| Arts, Entertainment & Recreation | 0 (0.0%) | 0 (0.0%) |
| Accommodation & Food Services | 0 (0.0%) | 13 (100.0%) |
| Public Administration | 5 (62.5%) | 3 (37.5%) |
| Total | 163 (48.1%) | 176 (51.9%) |
Education in Clinton
School Enrollment in Clinton
The most common levels of schooling among the 222 students in Clinton are high school (75 | 33.8%), elementary school (68 | 30.6%), and college / undergraduate (31 | 14.0%).
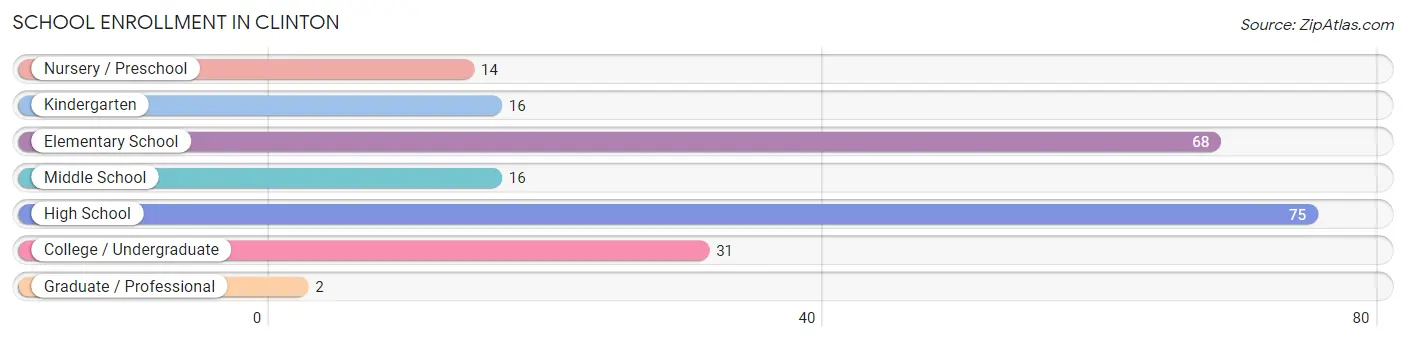
| School Level | # Students | % Students |
| Nursery / Preschool | 14 | 6.3% |
| Kindergarten | 16 | 7.2% |
| Elementary School | 68 | 30.6% |
| Middle School | 16 | 7.2% |
| High School | 75 | 33.8% |
| College / Undergraduate | 31 | 14.0% |
| Graduate / Professional | 2 | 0.9% |
| Total | 222 | 100.0% |
School Enrollment by Age by Funding Source in Clinton
Out of a total of 222 students who are enrolled in schools in Clinton, 9 (4.1%) attend a private institution, while the remaining 213 (95.9%) are enrolled in public schools. The age group of 10 to 14 year olds has the highest likelihood of being enrolled in private schools, with 4 (11.8% in the age bracket) enrolled. Conversely, the age group of 3 to 4 year olds has the lowest likelihood of being enrolled in a private school, with 10 (100.0% in the age bracket) attending a public institution.
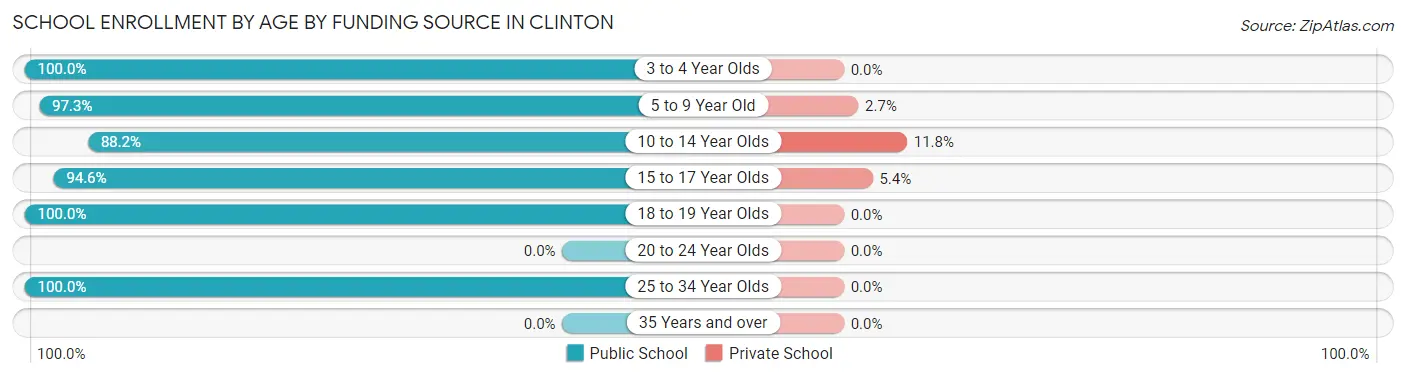
| Age Bracket | Public School | Private School |
| 3 to 4 Year Olds | 10 (100.0%) | 0 (0.0%) |
| 5 to 9 Year Old | 72 (97.3%) | 2 (2.7%) |
| 10 to 14 Year Olds | 30 (88.2%) | 4 (11.8%) |
| 15 to 17 Year Olds | 53 (94.6%) | 3 (5.4%) |
| 18 to 19 Year Olds | 20 (100.0%) | 0 (0.0%) |
| 20 to 24 Year Olds | 0 (0.0%) | 0 (0.0%) |
| 25 to 34 Year Olds | 28 (100.0%) | 0 (0.0%) |
| 35 Years and over | 0 (0.0%) | 0 (0.0%) |
| Total | 213 (95.9%) | 9 (4.1%) |
Educational Attainment by Field of Study in Clinton
Psychology (25 | 30.5%), engineering (13 | 15.9%), business (13 | 15.9%), education (13 | 15.9%), and arts & humanities (8 | 9.8%) are the most common fields of study among 82 individuals in Clinton who have obtained a bachelor's degree or higher.
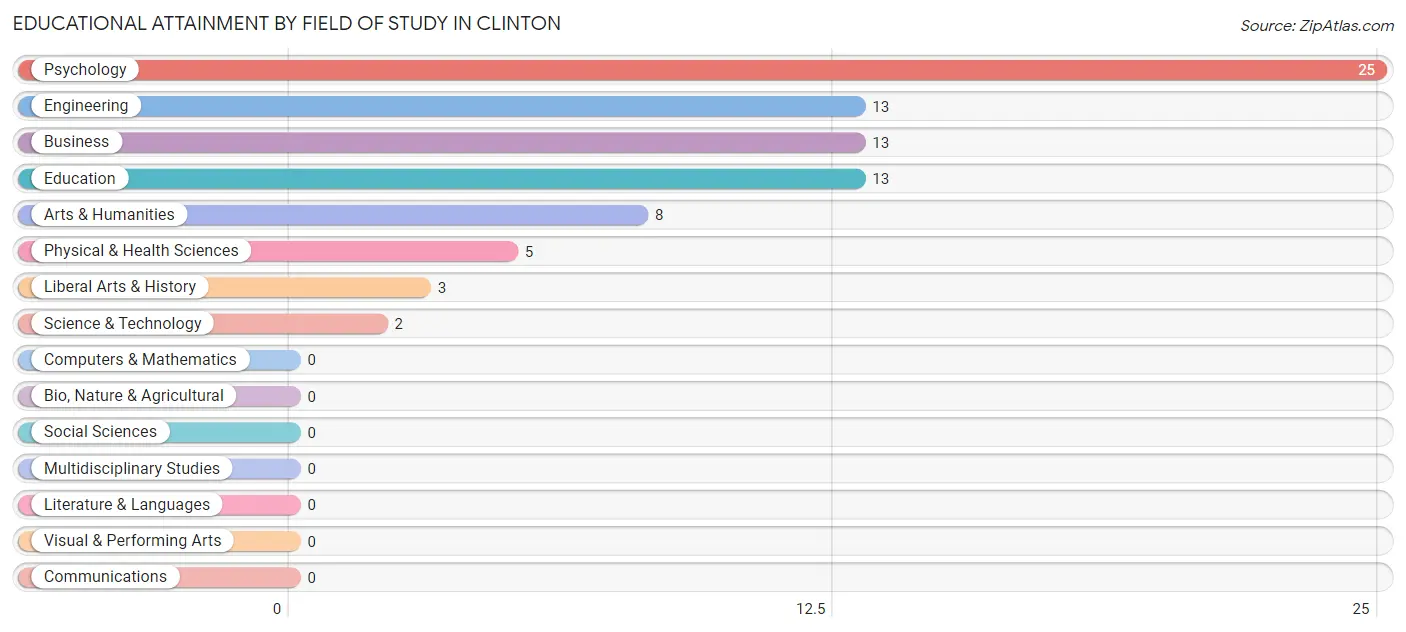
| Field of Study | # Graduates | % Graduates |
| Computers & Mathematics | 0 | 0.0% |
| Bio, Nature & Agricultural | 0 | 0.0% |
| Physical & Health Sciences | 5 | 6.1% |
| Psychology | 25 | 30.5% |
| Social Sciences | 0 | 0.0% |
| Engineering | 13 | 15.9% |
| Multidisciplinary Studies | 0 | 0.0% |
| Science & Technology | 2 | 2.4% |
| Business | 13 | 15.9% |
| Education | 13 | 15.9% |
| Literature & Languages | 0 | 0.0% |
| Liberal Arts & History | 3 | 3.7% |
| Visual & Performing Arts | 0 | 0.0% |
| Communications | 0 | 0.0% |
| Arts & Humanities | 8 | 9.8% |
| Total | 82 | 100.0% |
Transportation & Commute in Clinton
Vehicle Availability by Sex in Clinton
The most prevalent vehicle ownership categories in Clinton are males with 2 vehicles (97, accounting for 61.0%) and females with 2 vehicles (88, making up 55.1%).
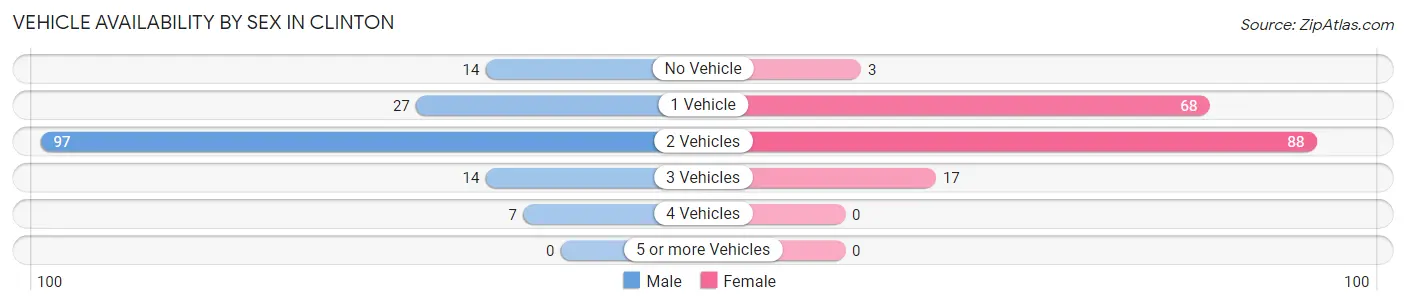
| Vehicles Available | Male | Female |
| No Vehicle | 14 (8.8%) | 3 (1.7%) |
| 1 Vehicle | 27 (17.0%) | 68 (38.6%) |
| 2 Vehicles | 97 (61.0%) | 88 (50.0%) |
| 3 Vehicles | 14 (8.8%) | 17 (9.7%) |
| 4 Vehicles | 7 (4.4%) | 0 (0.0%) |
| 5 or more Vehicles | 0 (0.0%) | 0 (0.0%) |
| Total | 159 (100.0%) | 176 (100.0%) |
Commute Time in Clinton
The most frequently occuring commute durations in Clinton are 30 to 34 minutes (61 commuters, 18.5%), 5 to 9 minutes (57 commuters, 17.3%), and 20 to 24 minutes (35 commuters, 10.6%).
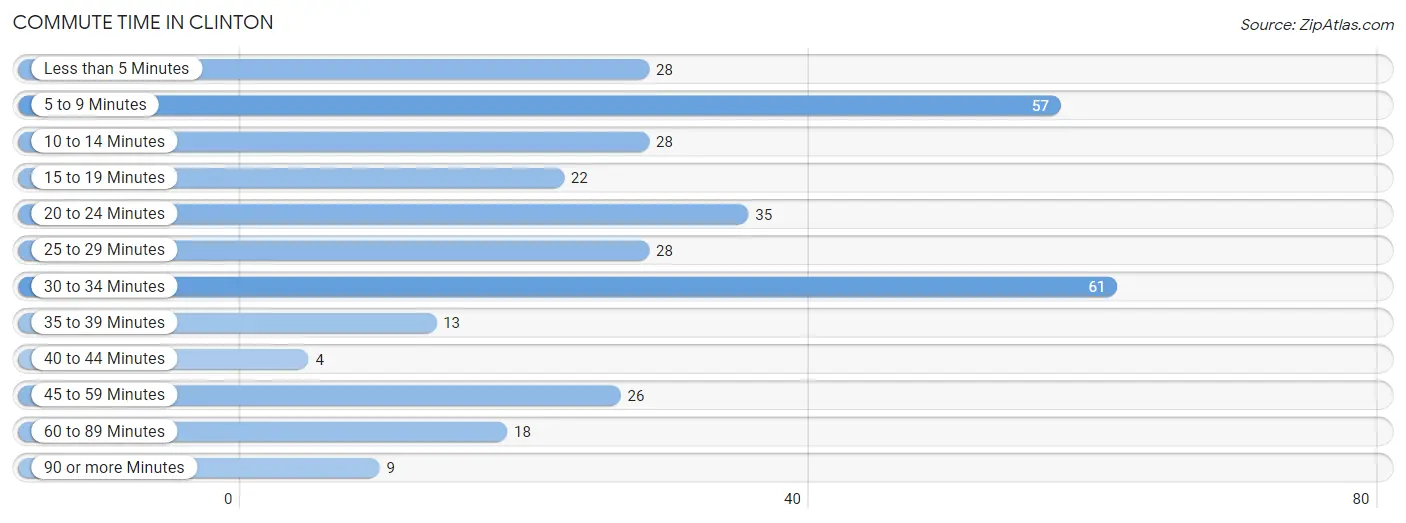
| Commute Time | # Commuters | % Commuters |
| Less than 5 Minutes | 28 | 8.5% |
| 5 to 9 Minutes | 57 | 17.3% |
| 10 to 14 Minutes | 28 | 8.5% |
| 15 to 19 Minutes | 22 | 6.7% |
| 20 to 24 Minutes | 35 | 10.6% |
| 25 to 29 Minutes | 28 | 8.5% |
| 30 to 34 Minutes | 61 | 18.5% |
| 35 to 39 Minutes | 13 | 4.0% |
| 40 to 44 Minutes | 4 | 1.2% |
| 45 to 59 Minutes | 26 | 7.9% |
| 60 to 89 Minutes | 18 | 5.5% |
| 90 or more Minutes | 9 | 2.7% |
Commute Time by Sex in Clinton
The most common commute times in Clinton are 30 to 34 minutes (31 commuters, 19.5%) for males and 5 to 9 minutes (43 commuters, 25.3%) for females.
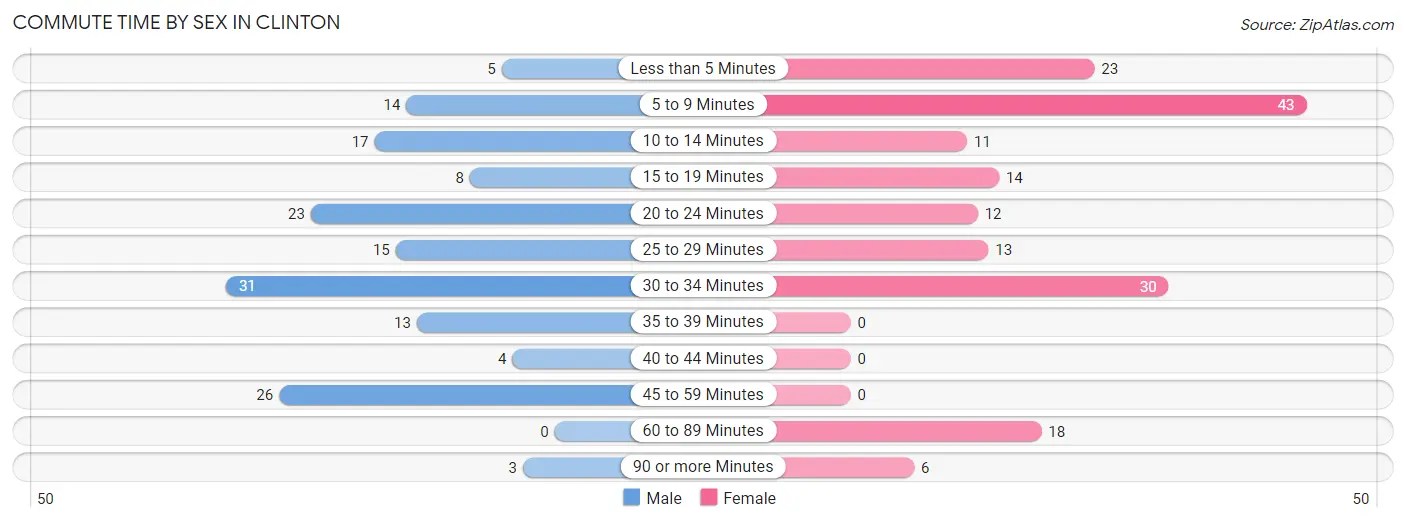
| Commute Time | Male | Female |
| Less than 5 Minutes | 5 (3.1%) | 23 (13.5%) |
| 5 to 9 Minutes | 14 (8.8%) | 43 (25.3%) |
| 10 to 14 Minutes | 17 (10.7%) | 11 (6.5%) |
| 15 to 19 Minutes | 8 (5.0%) | 14 (8.2%) |
| 20 to 24 Minutes | 23 (14.5%) | 12 (7.1%) |
| 25 to 29 Minutes | 15 (9.4%) | 13 (7.6%) |
| 30 to 34 Minutes | 31 (19.5%) | 30 (17.6%) |
| 35 to 39 Minutes | 13 (8.2%) | 0 (0.0%) |
| 40 to 44 Minutes | 4 (2.5%) | 0 (0.0%) |
| 45 to 59 Minutes | 26 (16.4%) | 0 (0.0%) |
| 60 to 89 Minutes | 0 (0.0%) | 18 (10.6%) |
| 90 or more Minutes | 3 (1.9%) | 6 (3.5%) |
Time of Departure to Work by Sex in Clinton
The most frequent times of departure to work in Clinton are 4:00 PM to 11:59 PM (37, 23.3%) for males and 7:00 AM to 7:29 AM (37, 21.8%) for females.
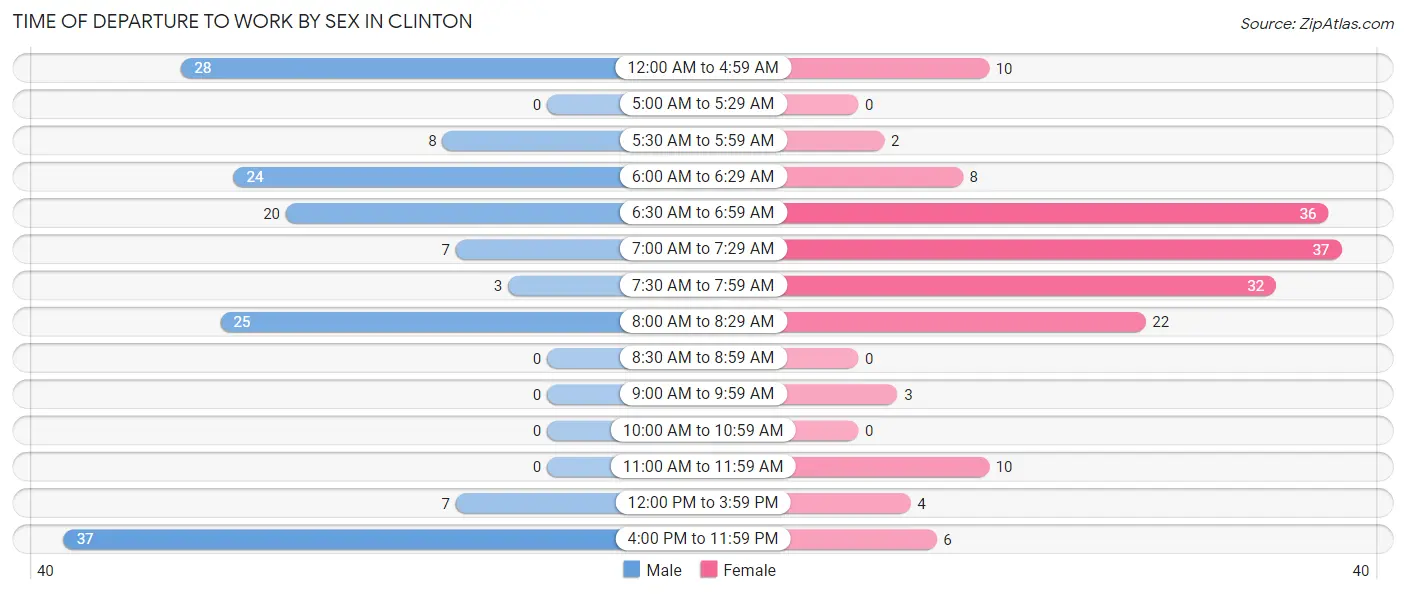
| Time of Departure | Male | Female |
| 12:00 AM to 4:59 AM | 28 (17.6%) | 10 (5.9%) |
| 5:00 AM to 5:29 AM | 0 (0.0%) | 0 (0.0%) |
| 5:30 AM to 5:59 AM | 8 (5.0%) | 2 (1.2%) |
| 6:00 AM to 6:29 AM | 24 (15.1%) | 8 (4.7%) |
| 6:30 AM to 6:59 AM | 20 (12.6%) | 36 (21.2%) |
| 7:00 AM to 7:29 AM | 7 (4.4%) | 37 (21.8%) |
| 7:30 AM to 7:59 AM | 3 (1.9%) | 32 (18.8%) |
| 8:00 AM to 8:29 AM | 25 (15.7%) | 22 (12.9%) |
| 8:30 AM to 8:59 AM | 0 (0.0%) | 0 (0.0%) |
| 9:00 AM to 9:59 AM | 0 (0.0%) | 3 (1.8%) |
| 10:00 AM to 10:59 AM | 0 (0.0%) | 0 (0.0%) |
| 11:00 AM to 11:59 AM | 0 (0.0%) | 10 (5.9%) |
| 12:00 PM to 3:59 PM | 7 (4.4%) | 4 (2.4%) |
| 4:00 PM to 11:59 PM | 37 (23.3%) | 6 (3.5%) |
| Total | 159 (100.0%) | 170 (100.0%) |
Housing Occupancy in Clinton
Occupancy by Ownership in Clinton
Of the total 466 dwellings in Clinton, owner-occupied units account for 272 (58.4%), while renter-occupied units make up 194 (41.6%).
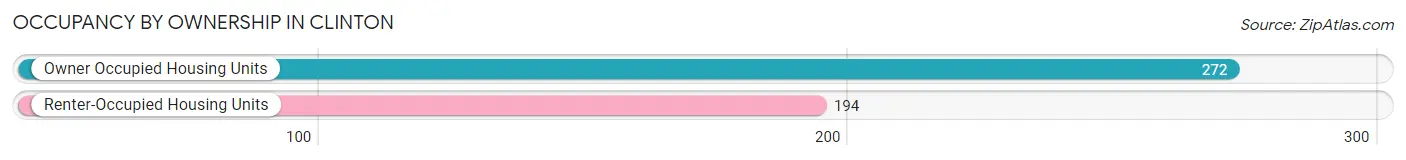
| Occupancy | # Housing Units | % Housing Units |
| Owner Occupied Housing Units | 272 | 58.4% |
| Renter-Occupied Housing Units | 194 | 41.6% |
| Total Occupied Housing Units | 466 | 100.0% |
Occupancy by Household Size in Clinton
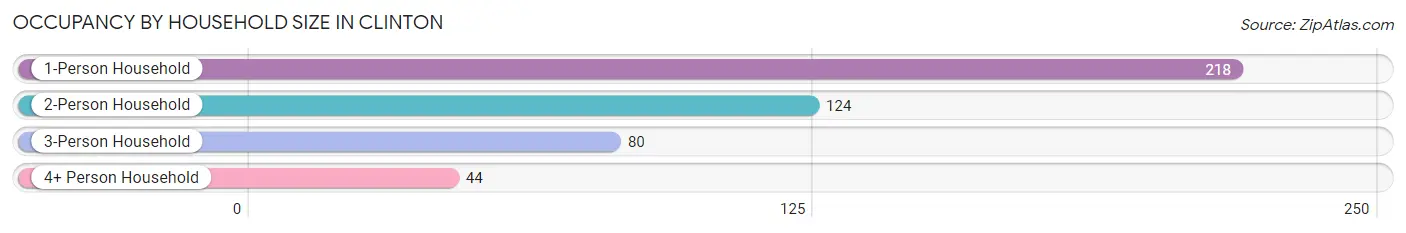
| Household Size | # Housing Units | % Housing Units |
| 1-Person Household | 218 | 46.8% |
| 2-Person Household | 124 | 26.6% |
| 3-Person Household | 80 | 17.2% |
| 4+ Person Household | 44 | 9.4% |
| Total Housing Units | 466 | 100.0% |
Occupancy by Ownership by Household Size in Clinton
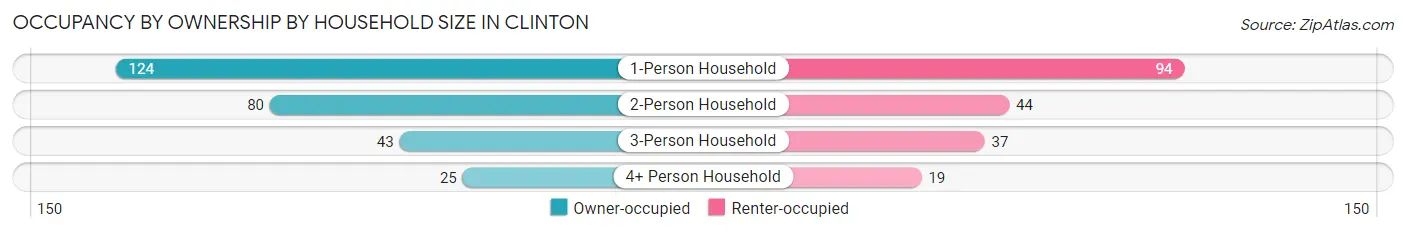
| Household Size | Owner-occupied | Renter-occupied |
| 1-Person Household | 124 (56.9%) | 94 (43.1%) |
| 2-Person Household | 80 (64.5%) | 44 (35.5%) |
| 3-Person Household | 43 (53.7%) | 37 (46.3%) |
| 4+ Person Household | 25 (56.8%) | 19 (43.2%) |
| Total Housing Units | 272 (58.4%) | 194 (41.6%) |
Occupancy by Educational Attainment in Clinton
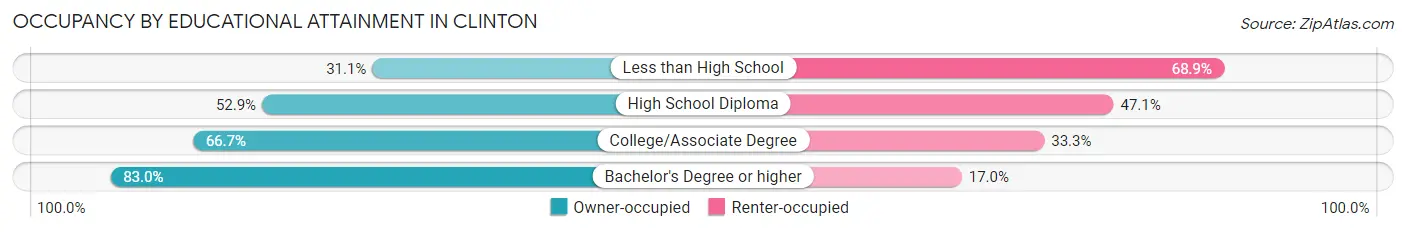
| Household Size | Owner-occupied | Renter-occupied |
| Less than High School | 23 (31.1%) | 51 (68.9%) |
| High School Diploma | 81 (52.9%) | 72 (47.1%) |
| College/Associate Degree | 124 (66.7%) | 62 (33.3%) |
| Bachelor's Degree or higher | 44 (83.0%) | 9 (17.0%) |
Occupancy by Age of Householder in Clinton
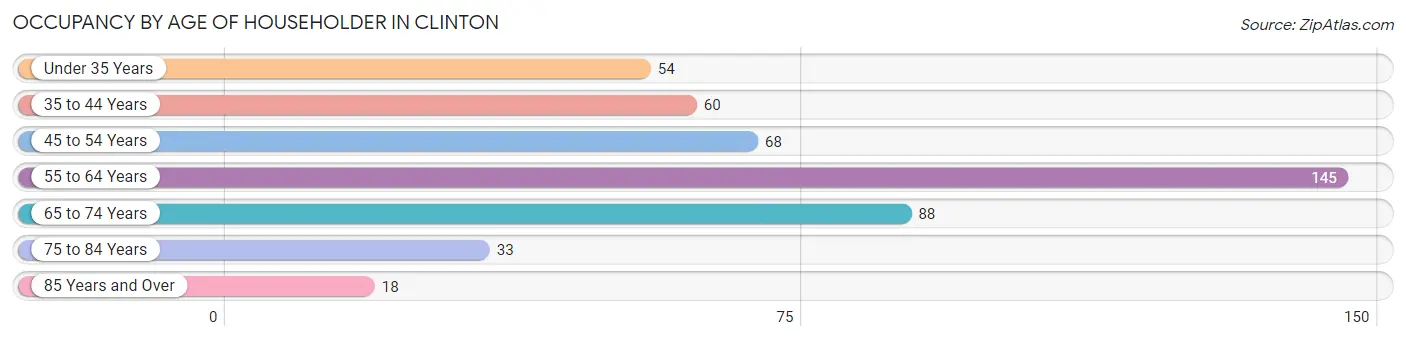
| Age Bracket | # Households | % Households |
| Under 35 Years | 54 | 11.6% |
| 35 to 44 Years | 60 | 12.9% |
| 45 to 54 Years | 68 | 14.6% |
| 55 to 64 Years | 145 | 31.1% |
| 65 to 74 Years | 88 | 18.9% |
| 75 to 84 Years | 33 | 7.1% |
| 85 Years and Over | 18 | 3.9% |
| Total | 466 | 100.0% |
Housing Finances in Clinton
Median Income by Occupancy in Clinton
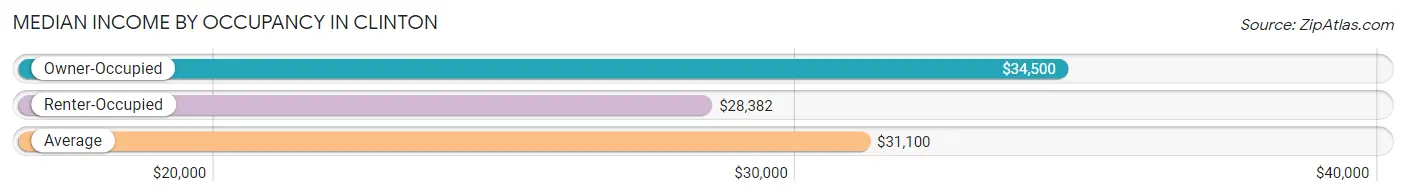
| Occupancy Type | # Households | Median Income |
| Owner-Occupied | 272 (58.4%) | $34,500 |
| Renter-Occupied | 194 (41.6%) | $28,382 |
| Average | 466 (100.0%) | $31,100 |
Occupancy by Householder Income Bracket in Clinton
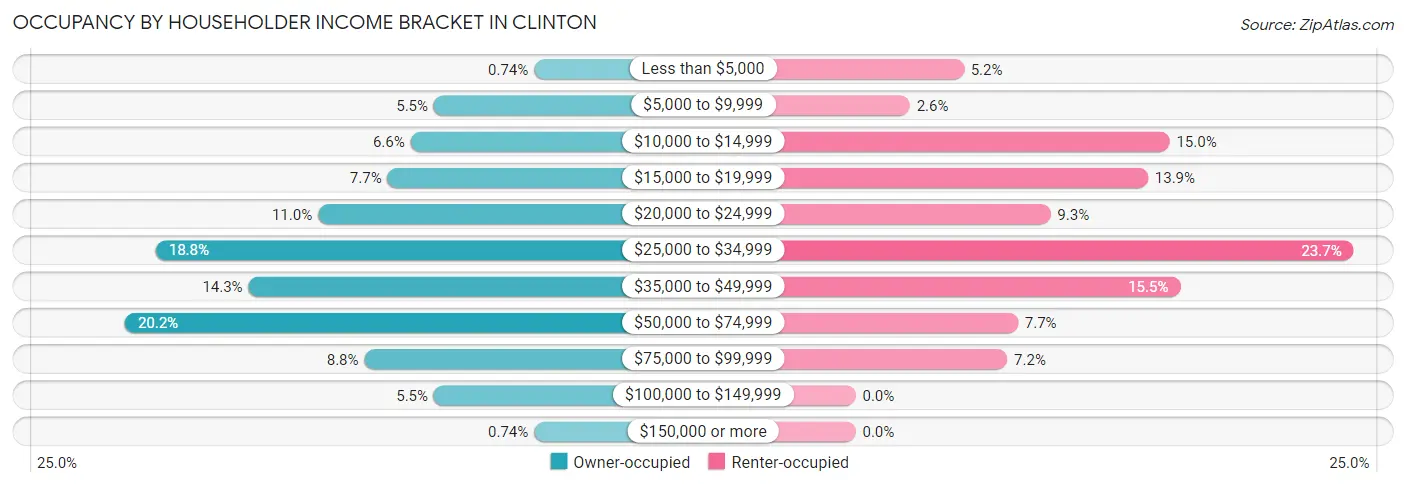
| Income Bracket | Owner-occupied | Renter-occupied |
| Less than $5,000 | 2 (0.7%) | 10 (5.1%) |
| $5,000 to $9,999 | 15 (5.5%) | 5 (2.6%) |
| $10,000 to $14,999 | 18 (6.6%) | 29 (14.9%) |
| $15,000 to $19,999 | 21 (7.7%) | 27 (13.9%) |
| $20,000 to $24,999 | 30 (11.0%) | 18 (9.3%) |
| $25,000 to $34,999 | 51 (18.8%) | 46 (23.7%) |
| $35,000 to $49,999 | 39 (14.3%) | 30 (15.5%) |
| $50,000 to $74,999 | 55 (20.2%) | 15 (7.7%) |
| $75,000 to $99,999 | 24 (8.8%) | 14 (7.2%) |
| $100,000 to $149,999 | 15 (5.5%) | 0 (0.0%) |
| $150,000 or more | 2 (0.7%) | 0 (0.0%) |
| Total | 272 (100.0%) | 194 (100.0%) |
Monthly Housing Cost Tiers in Clinton
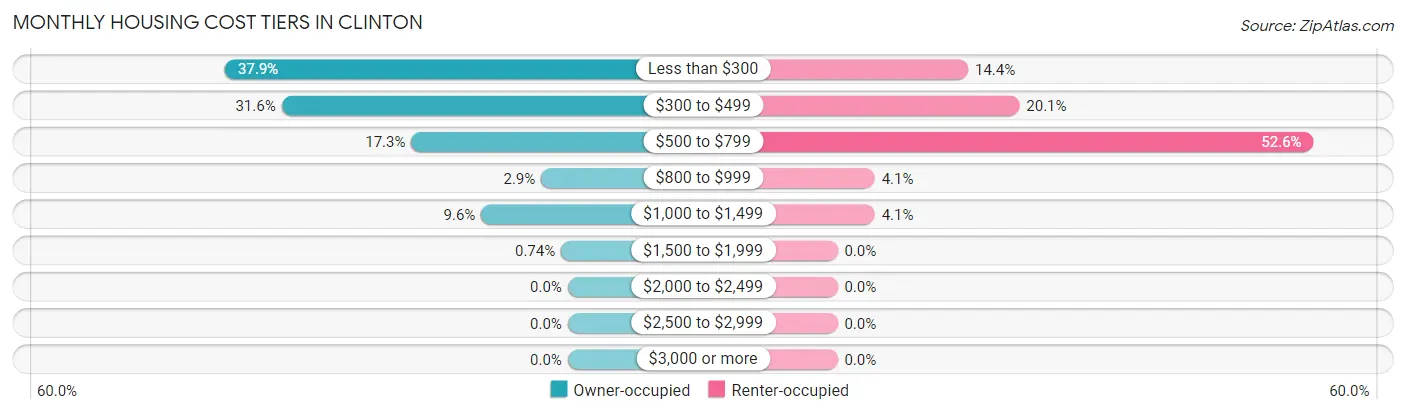
| Monthly Cost | Owner-occupied | Renter-occupied |
| Less than $300 | 103 (37.9%) | 28 (14.4%) |
| $300 to $499 | 86 (31.6%) | 39 (20.1%) |
| $500 to $799 | 47 (17.3%) | 102 (52.6%) |
| $800 to $999 | 8 (2.9%) | 8 (4.1%) |
| $1,000 to $1,499 | 26 (9.6%) | 8 (4.1%) |
| $1,500 to $1,999 | 2 (0.7%) | 0 (0.0%) |
| $2,000 to $2,499 | 0 (0.0%) | 0 (0.0%) |
| $2,500 to $2,999 | 0 (0.0%) | 0 (0.0%) |
| $3,000 or more | 0 (0.0%) | 0 (0.0%) |
| Total | 272 (100.0%) | 194 (100.0%) |
Physical Housing Characteristics in Clinton
Housing Structures in Clinton
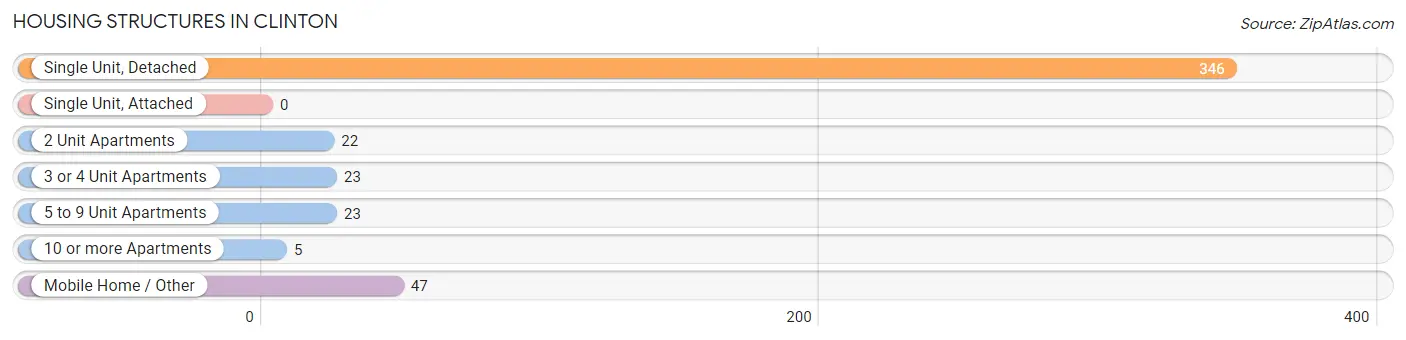
| Structure Type | # Housing Units | % Housing Units |
| Single Unit, Detached | 346 | 74.3% |
| Single Unit, Attached | 0 | 0.0% |
| 2 Unit Apartments | 22 | 4.7% |
| 3 or 4 Unit Apartments | 23 | 4.9% |
| 5 to 9 Unit Apartments | 23 | 4.9% |
| 10 or more Apartments | 5 | 1.1% |
| Mobile Home / Other | 47 | 10.1% |
| Total | 466 | 100.0% |
Housing Structures by Occupancy in Clinton
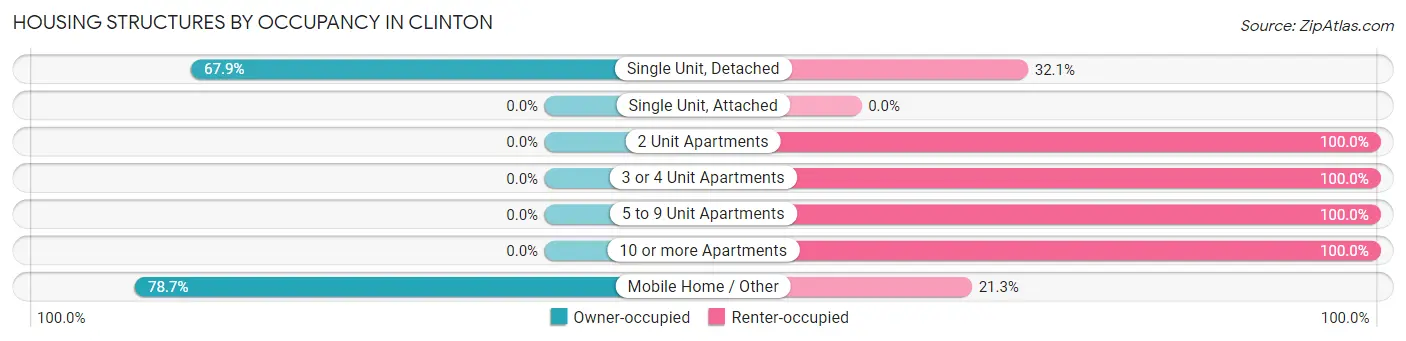
| Structure Type | Owner-occupied | Renter-occupied |
| Single Unit, Detached | 235 (67.9%) | 111 (32.1%) |
| Single Unit, Attached | 0 (0.0%) | 0 (0.0%) |
| 2 Unit Apartments | 0 (0.0%) | 22 (100.0%) |
| 3 or 4 Unit Apartments | 0 (0.0%) | 23 (100.0%) |
| 5 to 9 Unit Apartments | 0 (0.0%) | 23 (100.0%) |
| 10 or more Apartments | 0 (0.0%) | 5 (100.0%) |
| Mobile Home / Other | 37 (78.7%) | 10 (21.3%) |
| Total | 272 (58.4%) | 194 (41.6%) |
Housing Structures by Number of Rooms in Clinton
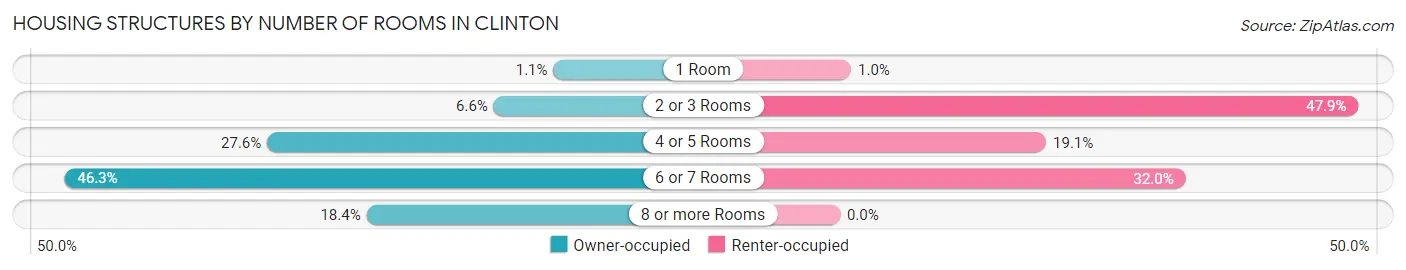
| Number of Rooms | Owner-occupied | Renter-occupied |
| 1 Room | 3 (1.1%) | 2 (1.0%) |
| 2 or 3 Rooms | 18 (6.6%) | 93 (47.9%) |
| 4 or 5 Rooms | 75 (27.6%) | 37 (19.1%) |
| 6 or 7 Rooms | 126 (46.3%) | 62 (32.0%) |
| 8 or more Rooms | 50 (18.4%) | 0 (0.0%) |
| Total | 272 (100.0%) | 194 (100.0%) |
Housing Structure by Heating Type in Clinton
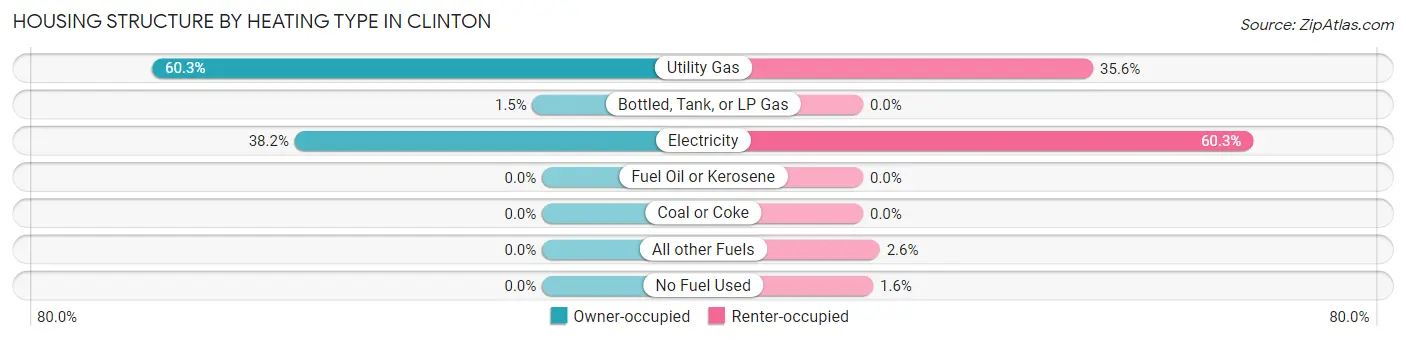
| Heating Type | Owner-occupied | Renter-occupied |
| Utility Gas | 164 (60.3%) | 69 (35.6%) |
| Bottled, Tank, or LP Gas | 4 (1.5%) | 0 (0.0%) |
| Electricity | 104 (38.2%) | 117 (60.3%) |
| Fuel Oil or Kerosene | 0 (0.0%) | 0 (0.0%) |
| Coal or Coke | 0 (0.0%) | 0 (0.0%) |
| All other Fuels | 0 (0.0%) | 5 (2.6%) |
| No Fuel Used | 0 (0.0%) | 3 (1.5%) |
| Total | 272 (100.0%) | 194 (100.0%) |
Household Vehicle Usage in Clinton
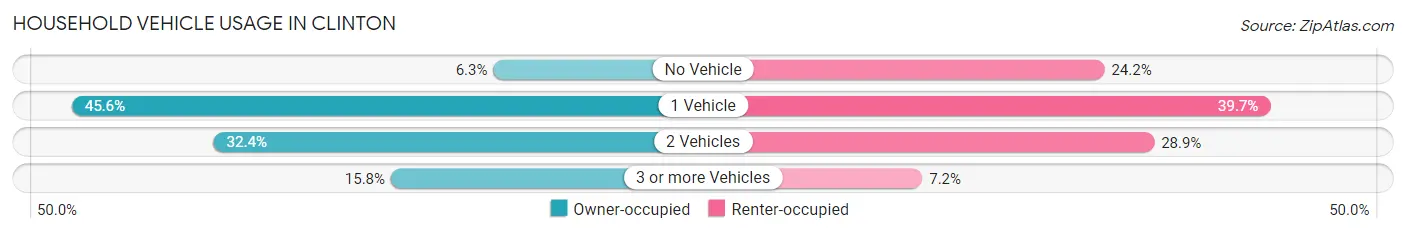
| Vehicles per Household | Owner-occupied | Renter-occupied |
| No Vehicle | 17 (6.2%) | 47 (24.2%) |
| 1 Vehicle | 124 (45.6%) | 77 (39.7%) |
| 2 Vehicles | 88 (32.4%) | 56 (28.9%) |
| 3 or more Vehicles | 43 (15.8%) | 14 (7.2%) |
| Total | 272 (100.0%) | 194 (100.0%) |
Real Estate & Mortgages in Clinton
Real Estate and Mortgage Overview in Clinton
| Characteristic | Without Mortgage | With Mortgage |
| Housing Units | 209 | 63 |
| Median Property Value | $46,300 | $69,200 |
| Median Household Income | $31,528 | $0 |
| Monthly Housing Costs | $303 | $0 |
| Real Estate Taxes | $283 | $8 |
Property Value by Mortgage Status in Clinton
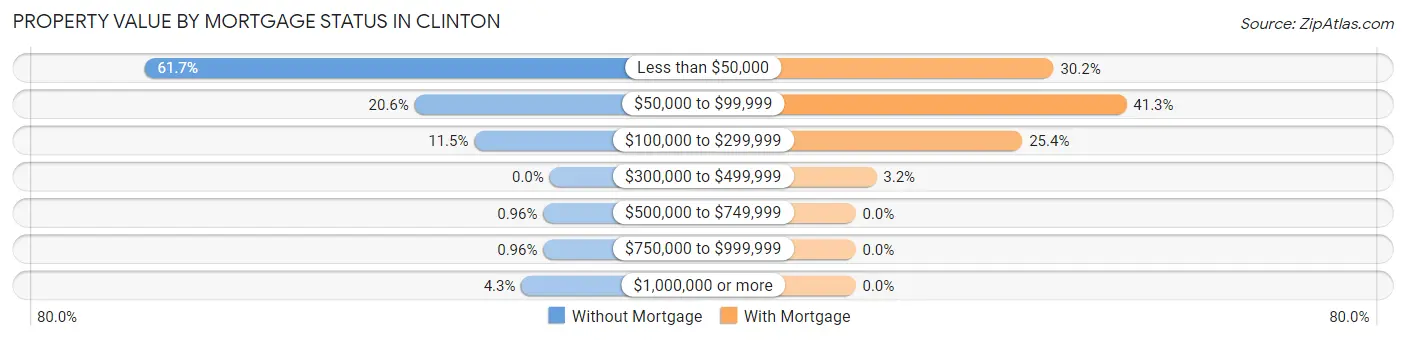
| Property Value | Without Mortgage | With Mortgage |
| Less than $50,000 | 129 (61.7%) | 19 (30.2%) |
| $50,000 to $99,999 | 43 (20.6%) | 26 (41.3%) |
| $100,000 to $299,999 | 24 (11.5%) | 16 (25.4%) |
| $300,000 to $499,999 | 0 (0.0%) | 2 (3.2%) |
| $500,000 to $749,999 | 2 (1.0%) | 0 (0.0%) |
| $750,000 to $999,999 | 2 (1.0%) | 0 (0.0%) |
| $1,000,000 or more | 9 (4.3%) | 0 (0.0%) |
| Total | 209 (100.0%) | 63 (100.0%) |
Household Income by Mortgage Status in Clinton
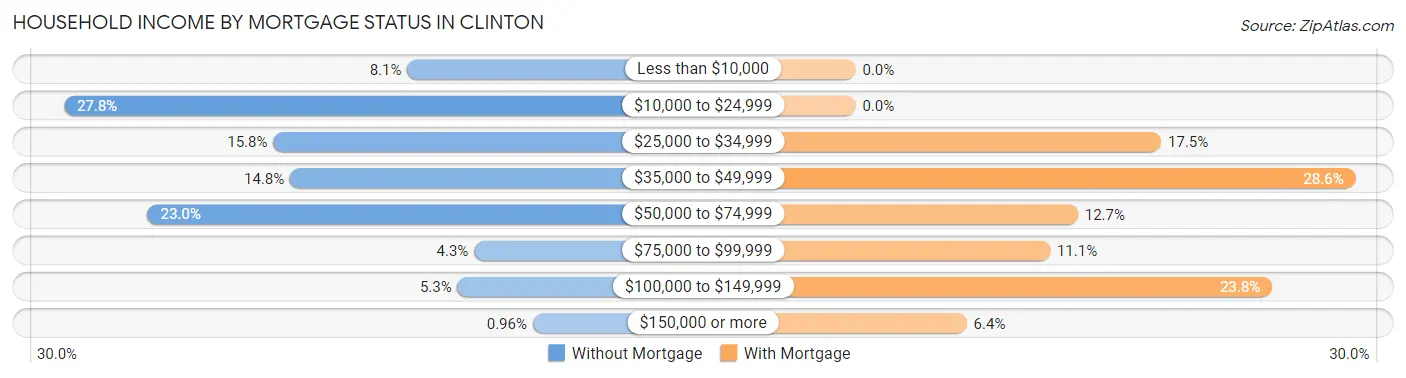
| Household Income | Without Mortgage | With Mortgage |
| Less than $10,000 | 17 (8.1%) | 0 (0.0%) |
| $10,000 to $24,999 | 58 (27.8%) | 0 (0.0%) |
| $25,000 to $34,999 | 33 (15.8%) | 11 (17.5%) |
| $35,000 to $49,999 | 31 (14.8%) | 18 (28.6%) |
| $50,000 to $74,999 | 48 (23.0%) | 8 (12.7%) |
| $75,000 to $99,999 | 9 (4.3%) | 7 (11.1%) |
| $100,000 to $149,999 | 11 (5.3%) | 15 (23.8%) |
| $150,000 or more | 2 (1.0%) | 4 (6.4%) |
| Total | 209 (100.0%) | 63 (100.0%) |
Property Value to Household Income Ratio in Clinton
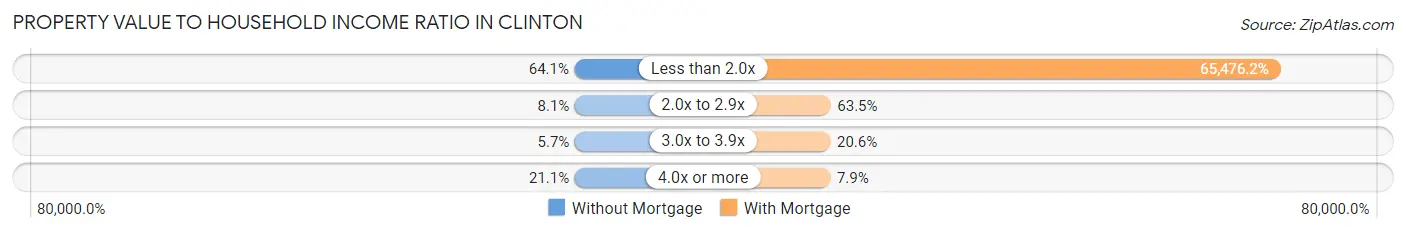
| Value-to-Income Ratio | Without Mortgage | With Mortgage |
| Less than 2.0x | 134 (64.1%) | 41,250 (65,476.2%) |
| 2.0x to 2.9x | 17 (8.1%) | 40 (63.5%) |
| 3.0x to 3.9x | 12 (5.7%) | 13 (20.6%) |
| 4.0x or more | 44 (21.0%) | 5 (7.9%) |
| Total | 209 (100.0%) | 63 (100.0%) |
Real Estate Taxes by Mortgage Status in Clinton
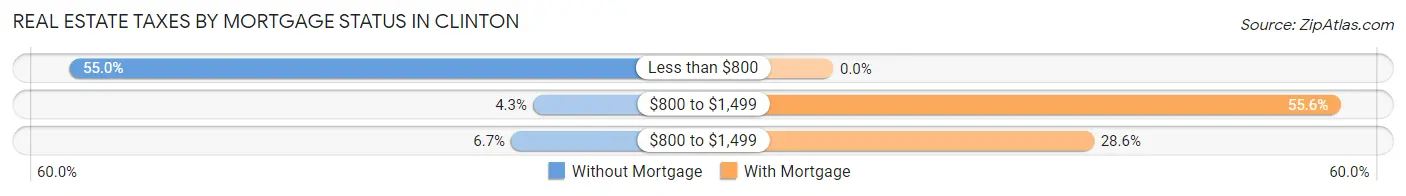
| Property Taxes | Without Mortgage | With Mortgage |
| Less than $800 | 115 (55.0%) | 0 (0.0%) |
| $800 to $1,499 | 9 (4.3%) | 35 (55.6%) |
| $800 to $1,499 | 14 (6.7%) | 18 (28.6%) |
| Total | 209 (100.0%) | 63 (100.0%) |
Health & Disability in Clinton
Health Insurance Coverage by Age in Clinton
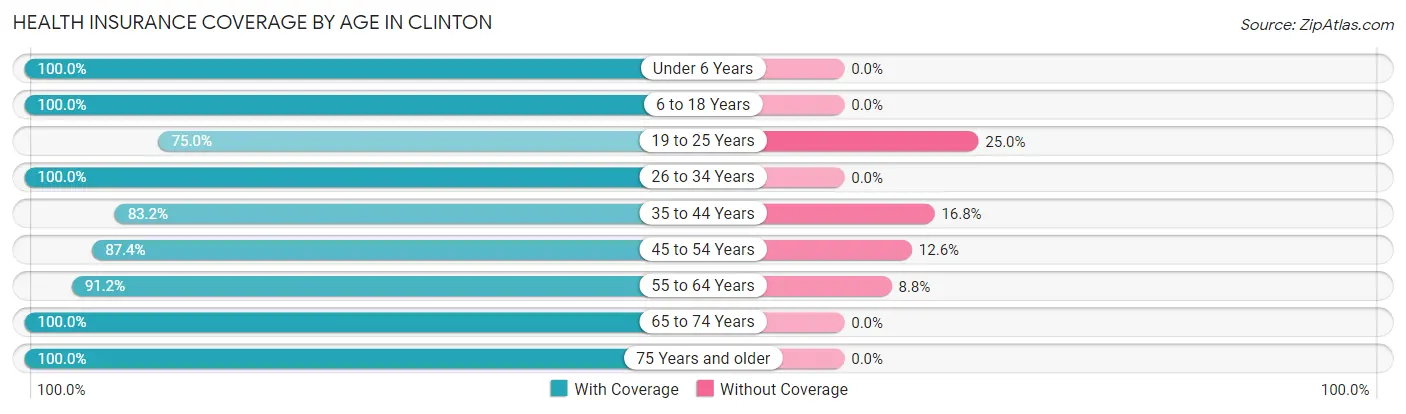
| Age Bracket | With Coverage | Without Coverage |
| Under 6 Years | 62 (100.0%) | 0 (0.0%) |
| 6 to 18 Years | 180 (100.0%) | 0 (0.0%) |
| 19 to 25 Years | 81 (75.0%) | 27 (25.0%) |
| 26 to 34 Years | 83 (100.0%) | 0 (0.0%) |
| 35 to 44 Years | 94 (83.2%) | 19 (16.8%) |
| 45 to 54 Years | 104 (87.4%) | 15 (12.6%) |
| 55 to 64 Years | 176 (91.2%) | 17 (8.8%) |
| 65 to 74 Years | 126 (100.0%) | 0 (0.0%) |
| 75 Years and older | 59 (100.0%) | 0 (0.0%) |
| Total | 965 (92.5%) | 78 (7.5%) |
Health Insurance Coverage by Citizenship Status in Clinton
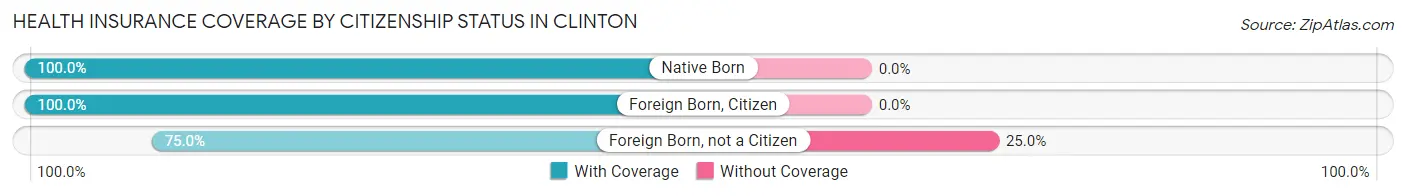
| Citizenship Status | With Coverage | Without Coverage |
| Native Born | 62 (100.0%) | 0 (0.0%) |
| Foreign Born, Citizen | 180 (100.0%) | 0 (0.0%) |
| Foreign Born, not a Citizen | 81 (75.0%) | 27 (25.0%) |
Health Insurance Coverage by Household Income in Clinton
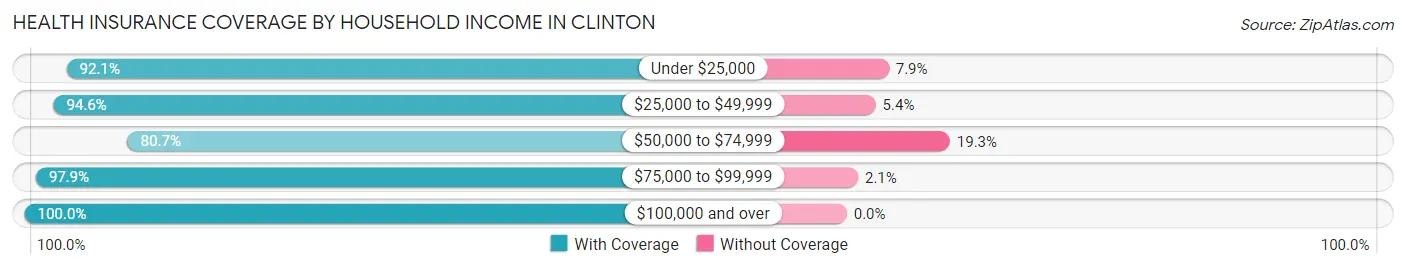
| Household Income | With Coverage | Without Coverage |
| Under $25,000 | 316 (92.1%) | 27 (7.9%) |
| $25,000 to $49,999 | 350 (94.6%) | 20 (5.4%) |
| $50,000 to $74,999 | 117 (80.7%) | 28 (19.3%) |
| $75,000 to $99,999 | 139 (97.9%) | 3 (2.1%) |
| $100,000 and over | 43 (100.0%) | 0 (0.0%) |
Public vs Private Health Insurance Coverage by Age in Clinton
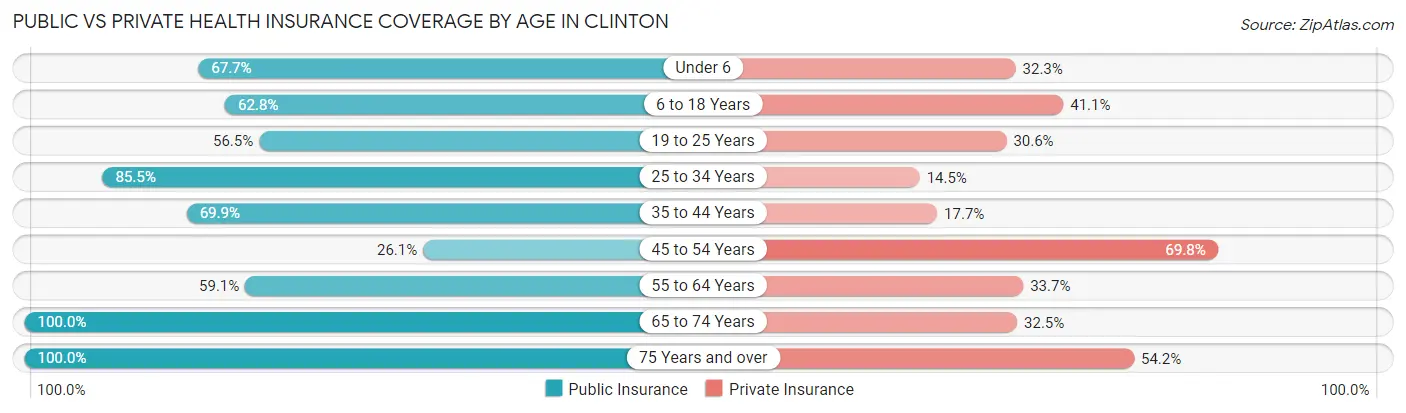
| Age Bracket | Public Insurance | Private Insurance |
| Under 6 | 42 (67.7%) | 20 (32.3%) |
| 6 to 18 Years | 113 (62.8%) | 74 (41.1%) |
| 19 to 25 Years | 61 (56.5%) | 33 (30.6%) |
| 25 to 34 Years | 71 (85.5%) | 12 (14.5%) |
| 35 to 44 Years | 79 (69.9%) | 20 (17.7%) |
| 45 to 54 Years | 31 (26.1%) | 83 (69.8%) |
| 55 to 64 Years | 114 (59.1%) | 65 (33.7%) |
| 65 to 74 Years | 126 (100.0%) | 41 (32.5%) |
| 75 Years and over | 59 (100.0%) | 32 (54.2%) |
| Total | 696 (66.7%) | 380 (36.4%) |
Disability Status by Sex by Age in Clinton
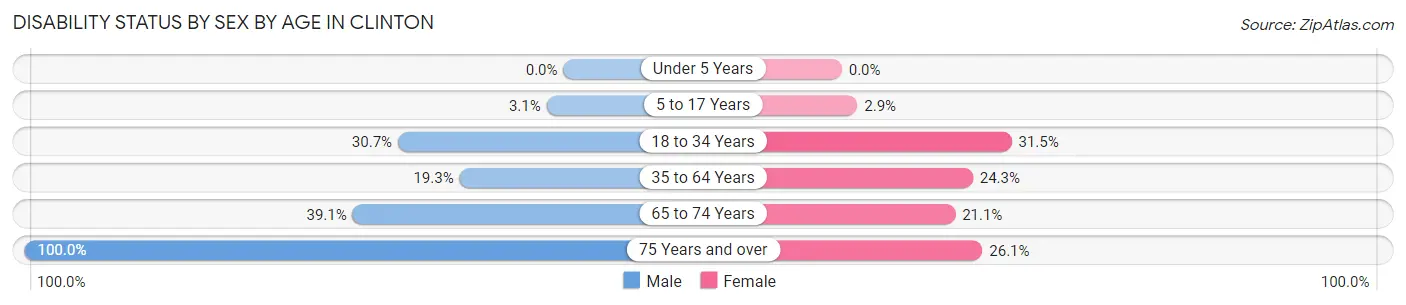
| Age Bracket | Male | Female |
| Under 5 Years | 0 (0.0%) | 0 (0.0%) |
| 5 to 17 Years | 2 (3.1%) | 3 (2.9%) |
| 18 to 34 Years | 43 (30.7%) | 23 (31.5%) |
| 35 to 64 Years | 32 (19.3%) | 63 (24.3%) |
| 65 to 74 Years | 27 (39.1%) | 12 (21.0%) |
| 75 Years and over | 13 (100.0%) | 12 (26.1%) |
Disability Class by Sex by Age in Clinton
Disability Class: Hearing Difficulty
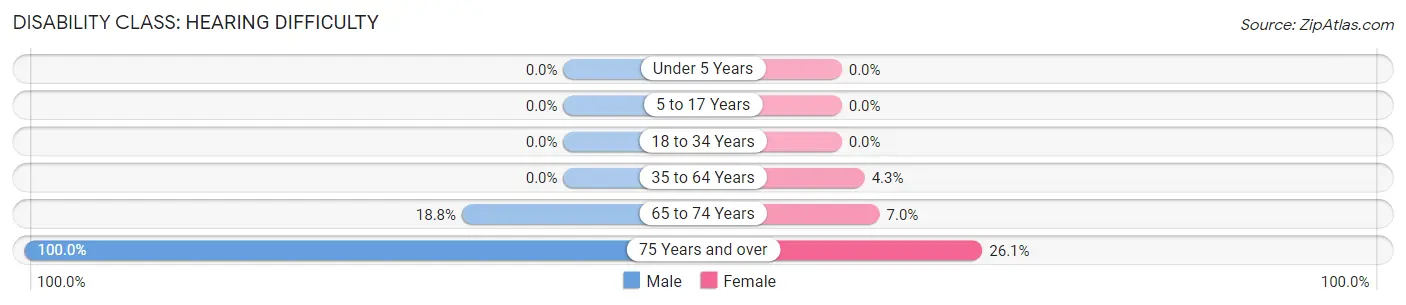
| Age Bracket | Male | Female |
| Under 5 Years | 0 (0.0%) | 0 (0.0%) |
| 5 to 17 Years | 0 (0.0%) | 0 (0.0%) |
| 18 to 34 Years | 0 (0.0%) | 0 (0.0%) |
| 35 to 64 Years | 0 (0.0%) | 11 (4.3%) |
| 65 to 74 Years | 13 (18.8%) | 4 (7.0%) |
| 75 Years and over | 13 (100.0%) | 12 (26.1%) |
Disability Class: Vision Difficulty
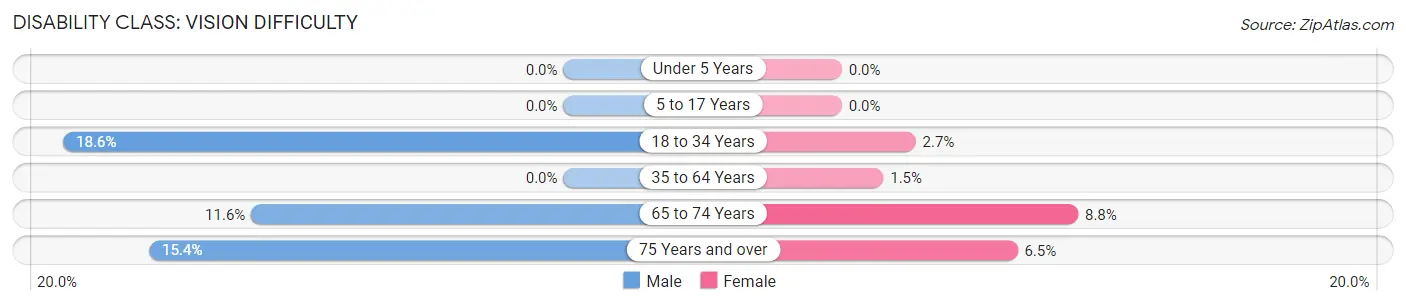
| Age Bracket | Male | Female |
| Under 5 Years | 0 (0.0%) | 0 (0.0%) |
| 5 to 17 Years | 0 (0.0%) | 0 (0.0%) |
| 18 to 34 Years | 26 (18.6%) | 2 (2.7%) |
| 35 to 64 Years | 0 (0.0%) | 4 (1.5%) |
| 65 to 74 Years | 8 (11.6%) | 5 (8.8%) |
| 75 Years and over | 2 (15.4%) | 3 (6.5%) |
Disability Class: Cognitive Difficulty
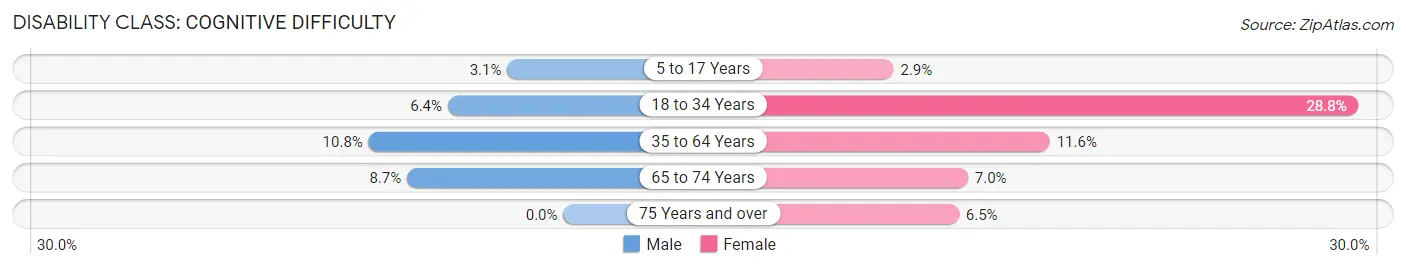
| Age Bracket | Male | Female |
| 5 to 17 Years | 2 (3.1%) | 3 (2.9%) |
| 18 to 34 Years | 9 (6.4%) | 21 (28.8%) |
| 35 to 64 Years | 18 (10.8%) | 30 (11.6%) |
| 65 to 74 Years | 6 (8.7%) | 4 (7.0%) |
| 75 Years and over | 0 (0.0%) | 3 (6.5%) |
Disability Class: Ambulatory Difficulty
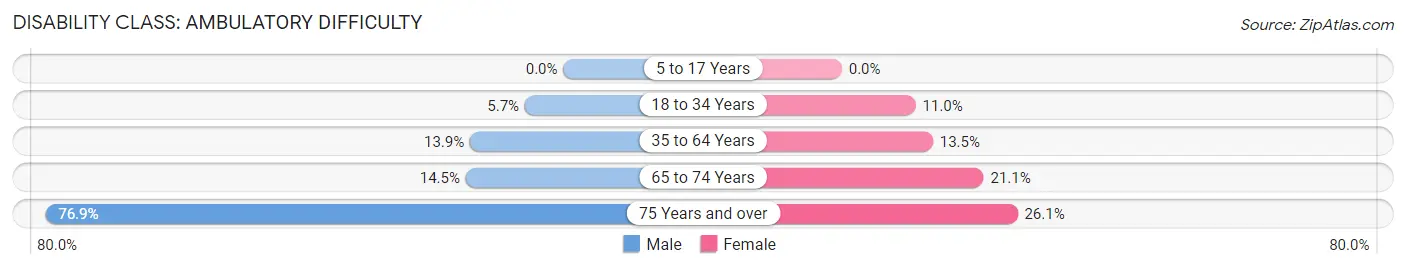
| Age Bracket | Male | Female |
| 5 to 17 Years | 0 (0.0%) | 0 (0.0%) |
| 18 to 34 Years | 8 (5.7%) | 8 (11.0%) |
| 35 to 64 Years | 23 (13.9%) | 35 (13.5%) |
| 65 to 74 Years | 10 (14.5%) | 12 (21.0%) |
| 75 Years and over | 10 (76.9%) | 12 (26.1%) |
Disability Class: Self-Care Difficulty
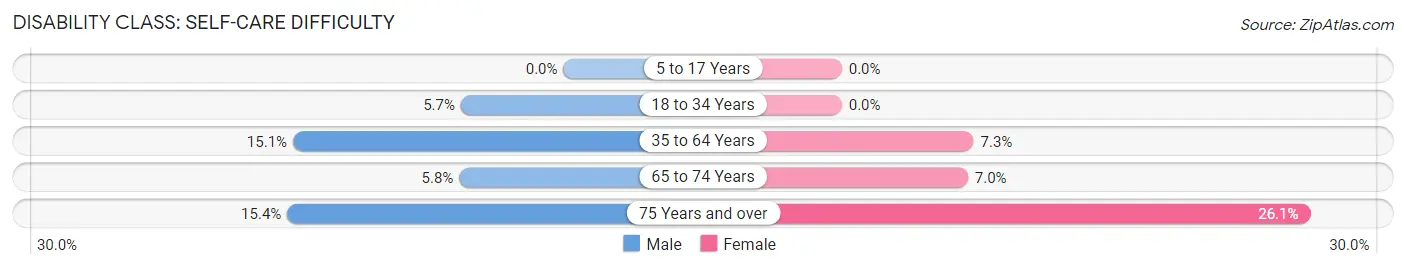
| Age Bracket | Male | Female |
| 5 to 17 Years | 0 (0.0%) | 0 (0.0%) |
| 18 to 34 Years | 8 (5.7%) | 0 (0.0%) |
| 35 to 64 Years | 25 (15.1%) | 19 (7.3%) |
| 65 to 74 Years | 4 (5.8%) | 4 (7.0%) |
| 75 Years and over | 2 (15.4%) | 12 (26.1%) |
Technology Access in Clinton
Computing Device Access in Clinton
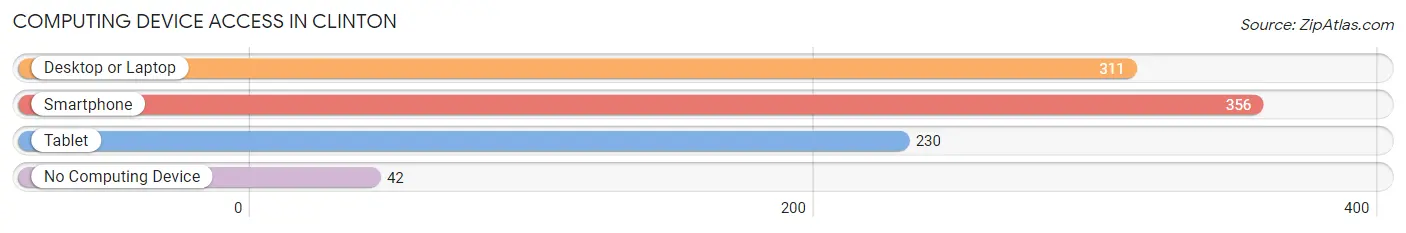
| Device Type | # Households | % Households |
| Desktop or Laptop | 311 | 66.7% |
| Smartphone | 356 | 76.4% |
| Tablet | 230 | 49.4% |
| No Computing Device | 42 | 9.0% |
| Total | 466 | 100.0% |
Internet Access in Clinton
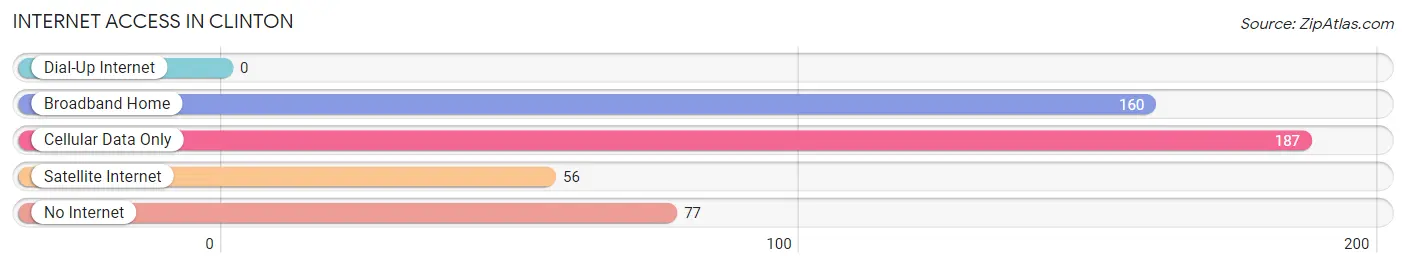
| Internet Type | # Households | % Households |
| Dial-Up Internet | 0 | 0.0% |
| Broadband Home | 160 | 34.3% |
| Cellular Data Only | 187 | 40.1% |
| Satellite Internet | 56 | 12.0% |
| No Internet | 77 | 16.5% |
| Total | 466 | 100.0% |
Clinton Summary
Clinton, Kentucky is a small city located in Hickman County, Kentucky. It is situated on the banks of the Kentucky River, and is part of the Paducah, Kentucky metropolitan area. The city has a population of approximately 1,500 people, and is the county seat of Hickman County.
History
The area that is now Clinton was first settled in the early 1800s by a group of settlers from Virginia. The town was originally known as “Hickman’s Landing”, and was named after the county’s first settler, William Hickman. The town was officially incorporated in 1837, and was renamed “Clinton” in honor of DeWitt Clinton, the former governor of New York.
In the late 1800s, Clinton became a major shipping port for the Kentucky River. The town was home to several steamboat companies, and was a major hub for the transportation of goods and passengers. The town also had a thriving lumber industry, and was home to several sawmills.
In the early 1900s, the town began to decline as the steamboat industry began to decline. The town’s economy shifted to agriculture, and the town became a center for tobacco production. The town also became a center for the production of moonshine, and was home to several stills.
Geography
Clinton is located in Hickman County, Kentucky, and is situated on the banks of the Kentucky River. The city is located approximately 25 miles south of Paducah, Kentucky, and is part of the Paducah metropolitan area. The city has a total area of 1.2 square miles, and is located at an elevation of 441 feet.
Economy
The economy of Clinton is largely based on agriculture. The town is home to several tobacco farms, and is a major producer of tobacco products. The town is also home to several sawmills, and is a major producer of lumber products. The town is also home to several small businesses, including restaurants, retail stores, and service providers.
Demographics
As of the 2010 census, the population of Clinton was 1,500 people. The racial makeup of the city was 95.3% White, 0.7% African American, 0.3% Native American, 0.3% Asian, 0.1% Pacific Islander, and 3.3% from other races. The median household income in the city was $30,000, and the median family income was $35,000. The per capita income in the city was $14,000.
Conclusion
Clinton, Kentucky is a small city located in Hickman County, Kentucky. It is situated on the banks of the Kentucky River, and is part of the Paducah, Kentucky metropolitan area. The city has a population of approximately 1,500 people, and is the county seat of Hickman County. The economy of Clinton is largely based on agriculture, and the town is home to several tobacco farms, sawmills, and small businesses. The racial makeup of the city is 95.3% White, 0.7% African American, 0.3% Native American, 0.3% Asian, 0.1% Pacific Islander, and 3.3% from other races. The median household income in the city was $30,000, and the median family income was $35,000.
Common Questions
What is Per Capita Income in Clinton?
Per Capita income in Clinton is $16,962.
What is the Median Family Income in Clinton?
Median Family Income in Clinton is $37,292.
What is the Median Household income in Clinton?
Median Household Income in Clinton is $31,100.
What is Income or Wage Gap in Clinton?
Income or Wage Gap in Clinton is 5.7%.
Women in Clinton earn 94.3 cents for every dollar earned by a man.
What is Inequality or Gini Index in Clinton?
Inequality or Gini Index in Clinton is 0.37.
What is the Total Population of Clinton?
Total Population of Clinton is 1,173.
What is the Total Male Population of Clinton?
Total Male Population of Clinton is 510.
What is the Total Female Population of Clinton?
Total Female Population of Clinton is 663.
What is the Ratio of Males per 100 Females in Clinton?
There are 76.92 Males per 100 Females in Clinton.
What is the Ratio of Females per 100 Males in Clinton?
There are 130.00 Females per 100 Males in Clinton.
What is the Median Population Age in Clinton?
Median Population Age in Clinton is 47.2 Years.
What is the Average Family Size in Clinton
Average Family Size in Clinton is 3.2 People.
What is the Average Household Size in Clinton
Average Household Size in Clinton is 2.2 People.
How Large is the Labor Force in Clinton?
There are 391 People in the Labor Forcein in Clinton.
What is the Percentage of People in the Labor Force in Clinton?
39.5% of People are in the Labor Force in Clinton.
What is the Unemployment Rate in Clinton?
Unemployment Rate in Clinton is 13.3%.