Norbourne Estates, KY Map & Demographics
Norbourne Estates Map
Norbourne Estates Overview
$82,347
PER CAPITA INCOME
$189,583
AVG FAMILY INCOME
$166,944
AVG HOUSEHOLD INCOME
40.1%
WAGE / INCOME GAP [ % ]
59.9¢/ $1
WAGE / INCOME GAP [ $ ]
0.42
INEQUALITY / GINI INDEX
464
TOTAL POPULATION
216
MALE POPULATION
248
FEMALE POPULATION
87.10
MALES / 100 FEMALES
114.81
FEMALES / 100 MALES
41.7
MEDIAN AGE
2.9
AVG FAMILY SIZE
2.6
AVG HOUSEHOLD SIZE
215
LABOR FORCE [ PEOPLE ]
58.0%
PERCENT IN LABOR FORCE
1.9%
UNEMPLOYMENT RATE
Norbourne Estates Area Codes
Income in Norbourne Estates
Income Overview in Norbourne Estates
Per Capita Income in Norbourne Estates is $82,347, while median incomes of families and households are $189,583 and $166,944 respectively.
| Characteristic | Number | Measure |
| Per Capita Income | 464 | $82,347 |
| Median Family Income | 143 | $189,583 |
| Mean Family Income | 143 | $240,761 |
| Median Household Income | 180 | $166,944 |
| Mean Household Income | 180 | $214,440 |
| Income Deficit | 143 | $0 |
| Wage / Income Gap (%) | 464 | 40.12% |
| Wage / Income Gap ($) | 464 | 59.88¢ per $1 |
| Gini / Inequality Index | 464 | 0.42 |
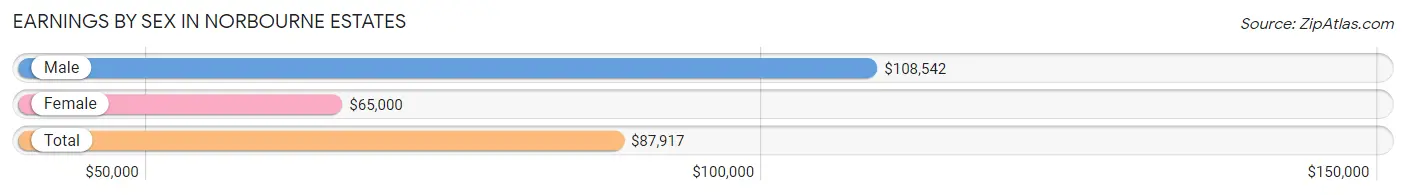
Earnings by Sex in Norbourne Estates
Average Earnings in Norbourne Estates are $87,917, $108,542 for men and $65,000 for women, a difference of 40.1%.
| Sex | Number | Average Earnings |
| Male | 121 (52.4%) | $108,542 |
| Female | 110 (47.6%) | $65,000 |
| Total | 231 (100.0%) | $87,917 |
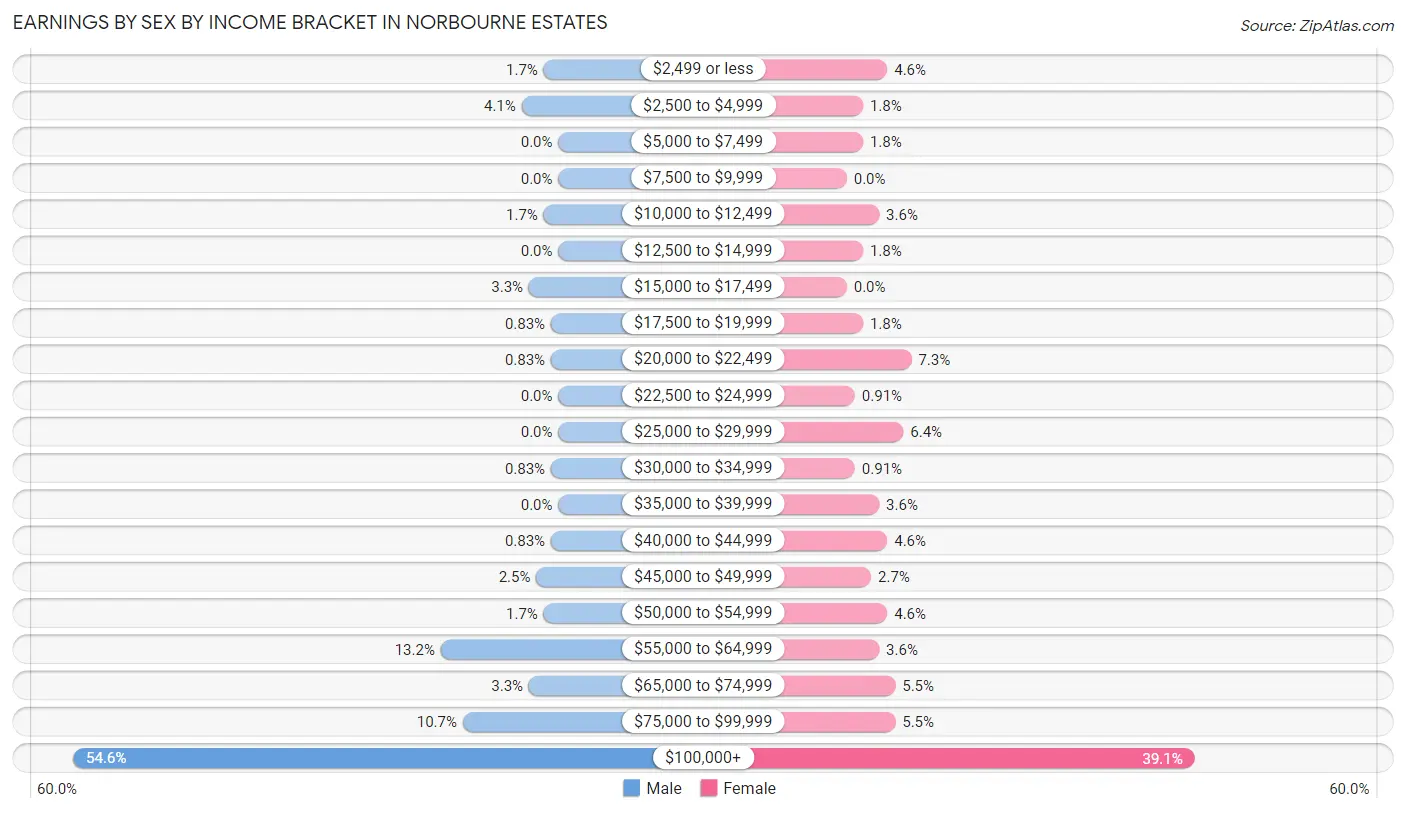
Earnings by Sex by Income Bracket in Norbourne Estates
The most common earnings brackets in Norbourne Estates are $100,000+ for men (66 | 54.5%) and $100,000+ for women (43 | 39.1%).
| Income | Male | Female |
| $2,499 or less | 2 (1.7%) | 5 (4.5%) |
| $2,500 to $4,999 | 5 (4.1%) | 2 (1.8%) |
| $5,000 to $7,499 | 0 (0.0%) | 2 (1.8%) |
| $7,500 to $9,999 | 0 (0.0%) | 0 (0.0%) |
| $10,000 to $12,499 | 2 (1.7%) | 4 (3.6%) |
| $12,500 to $14,999 | 0 (0.0%) | 2 (1.8%) |
| $15,000 to $17,499 | 4 (3.3%) | 0 (0.0%) |
| $17,500 to $19,999 | 1 (0.8%) | 2 (1.8%) |
| $20,000 to $22,499 | 1 (0.8%) | 8 (7.3%) |
| $22,500 to $24,999 | 0 (0.0%) | 1 (0.9%) |
| $25,000 to $29,999 | 0 (0.0%) | 7 (6.4%) |
| $30,000 to $34,999 | 1 (0.8%) | 1 (0.9%) |
| $35,000 to $39,999 | 0 (0.0%) | 4 (3.6%) |
| $40,000 to $44,999 | 1 (0.8%) | 5 (4.5%) |
| $45,000 to $49,999 | 3 (2.5%) | 3 (2.7%) |
| $50,000 to $54,999 | 2 (1.7%) | 5 (4.5%) |
| $55,000 to $64,999 | 16 (13.2%) | 4 (3.6%) |
| $65,000 to $74,999 | 4 (3.3%) | 6 (5.4%) |
| $75,000 to $99,999 | 13 (10.7%) | 6 (5.4%) |
| $100,000+ | 66 (54.5%) | 43 (39.1%) |
| Total | 121 (100.0%) | 110 (100.0%) |
Earnings by Sex by Educational Attainment in Norbourne Estates
Average earnings in Norbourne Estates are $109,167 for men and $72,000 for women, a difference of 34.1%. Men with an educational attainment of graduate degree enjoy the highest average annual earnings of $156,875, while those with bachelor's degree education earn the least with $88,750. Women with an educational attainment of graduate degree earn the most with the average annual earnings of $123,750, while those with college or associate's degree education have the smallest earnings of $37,500.

| Educational Attainment | Male Income | Female Income |
| Less than High School | - | - |
| High School Diploma | $148,438 | $0 |
| College or Associate's Degree | - | - |
| Bachelor's Degree | $88,750 | $62,917 |
| Graduate Degree | $156,875 | $123,750 |
| Total | $109,167 | $72,000 |
Family Income in Norbourne Estates
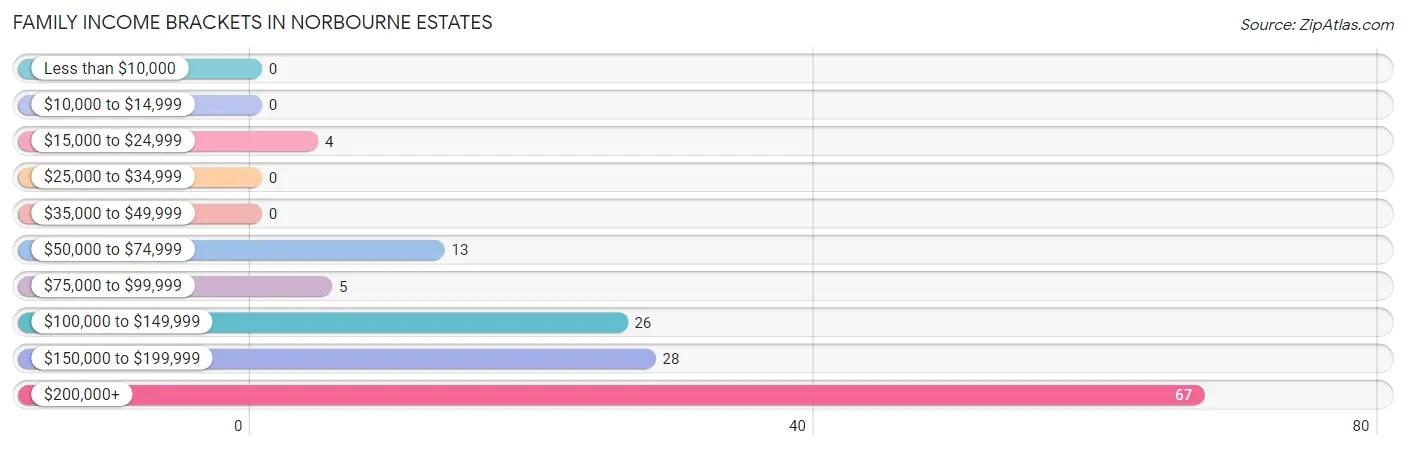
Family Income Brackets in Norbourne Estates
According to the Norbourne Estates family income data, there are 67 families falling into the $200,000+ income range, which is the most common income bracket and makes up 46.9% of all families.
| Income Bracket | # Families | % Families |
| Less than $10,000 | 0 | 0.0% |
| $10,000 to $14,999 | 0 | 0.0% |
| $15,000 to $24,999 | 4 | 2.8% |
| $25,000 to $34,999 | 0 | 0.0% |
| $35,000 to $49,999 | 0 | 0.0% |
| $50,000 to $74,999 | 13 | 9.1% |
| $75,000 to $99,999 | 5 | 3.5% |
| $100,000 to $149,999 | 26 | 18.2% |
| $150,000 to $199,999 | 28 | 19.6% |
| $200,000+ | 67 | 46.9% |
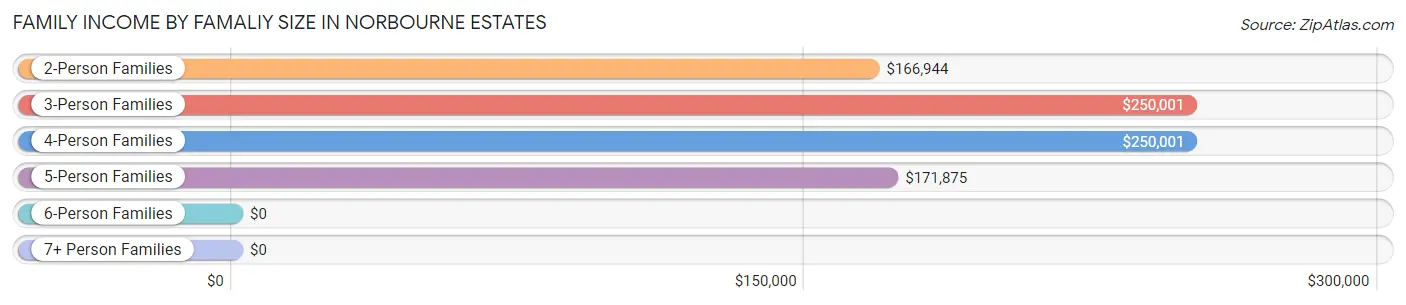
Family Income by Famaliy Size in Norbourne Estates
3-person families (19 | 13.3%) account for the highest median family income in Norbourne Estates with $250,001 per family, while 2-person families (82 | 57.3%) have the highest median income of $83,472 per family member.
| Income Bracket | # Families | Median Income |
| 2-Person Families | 82 (57.3%) | $166,944 |
| 3-Person Families | 19 (13.3%) | $250,001 |
| 4-Person Families | 23 (16.1%) | $250,001 |
| 5-Person Families | 18 (12.6%) | $171,875 |
| 6-Person Families | 1 (0.7%) | $0 |
| 7+ Person Families | 0 (0.0%) | $0 |
| Total | 143 (100.0%) | $189,583 |
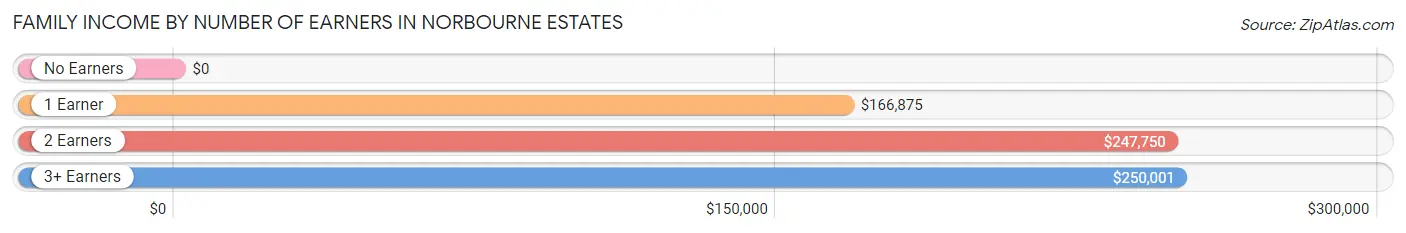
Family Income by Number of Earners in Norbourne Estates
| Number of Earners | # Families | Median Income |
| No Earners | 27 (18.9%) | $0 |
| 1 Earner | 32 (22.4%) | $166,875 |
| 2 Earners | 79 (55.2%) | $247,750 |
| 3+ Earners | 5 (3.5%) | $250,001 |
| Total | 143 (100.0%) | $189,583 |
Household Income in Norbourne Estates
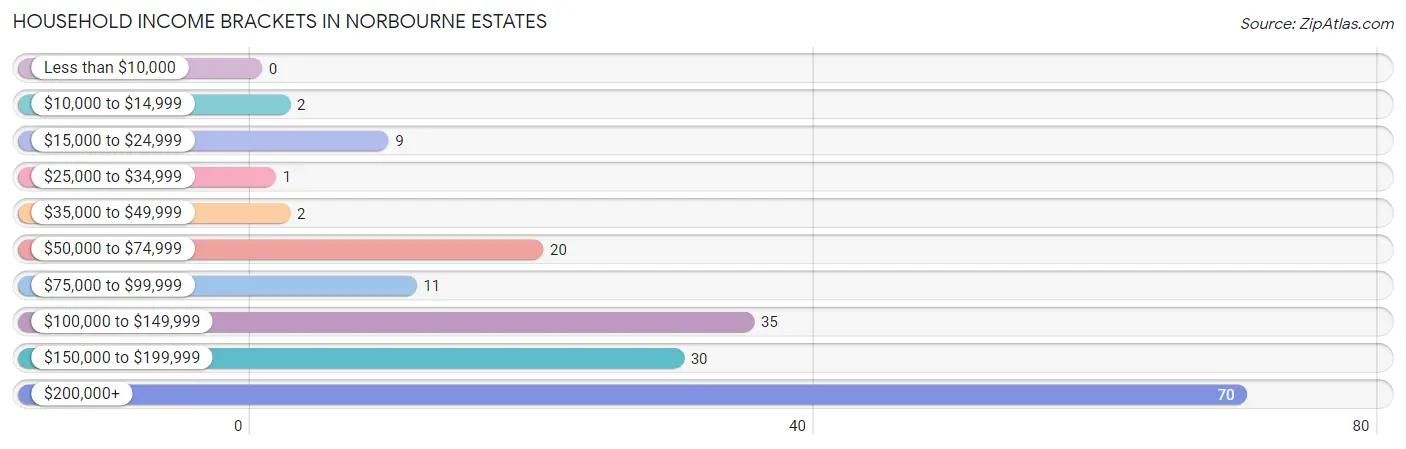
Household Income Brackets in Norbourne Estates
With 70 households falling in the category, the $200,000+ income range is the most frequent in Norbourne Estates, accounting for 38.9% of all households.
| Income Bracket | # Households | % Households |
| Less than $10,000 | 0 | 0.0% |
| $10,000 to $14,999 | 2 | 1.1% |
| $15,000 to $24,999 | 9 | 5.0% |
| $25,000 to $34,999 | 1 | 0.6% |
| $35,000 to $49,999 | 2 | 1.1% |
| $50,000 to $74,999 | 20 | 11.1% |
| $75,000 to $99,999 | 11 | 6.1% |
| $100,000 to $149,999 | 35 | 19.4% |
| $150,000 to $199,999 | 30 | 16.7% |
| $200,000+ | 70 | 38.9% |
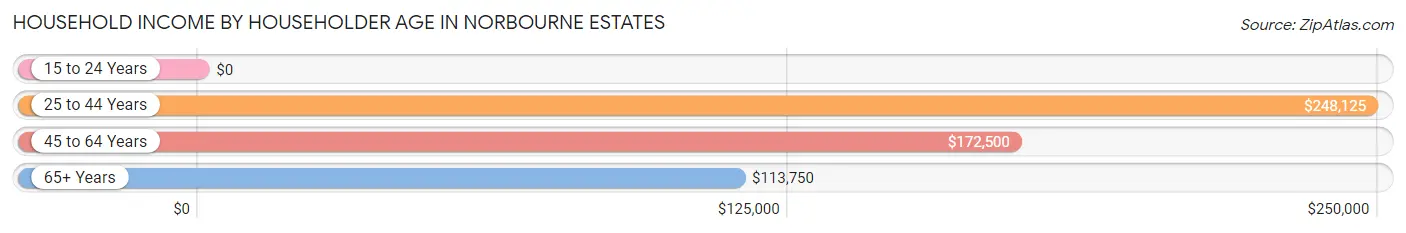
Household Income by Householder Age in Norbourne Estates
The median household income in Norbourne Estates is $166,944, with the highest median household income of $248,125 found in the 25 to 44 years age bracket for the primary householder. A total of 46 households (25.6%) fall into this category.
| Income Bracket | # Households | Median Income |
| 15 to 24 Years | 0 (0.0%) | $0 |
| 25 to 44 Years | 46 (25.6%) | $248,125 |
| 45 to 64 Years | 70 (38.9%) | $172,500 |
| 65+ Years | 64 (35.6%) | $113,750 |
| Total | 180 (100.0%) | $166,944 |
Poverty in Norbourne Estates
Income Below Poverty by Sex and Age in Norbourne Estates
With 0.5% poverty level for males and 1.6% for females among the residents of Norbourne Estates, 35 to 44 year old males and 5 year old females are the most vulnerable to poverty, with 1 males (2.5%) and 1 females (25.0%) in their respective age groups living below the poverty level.
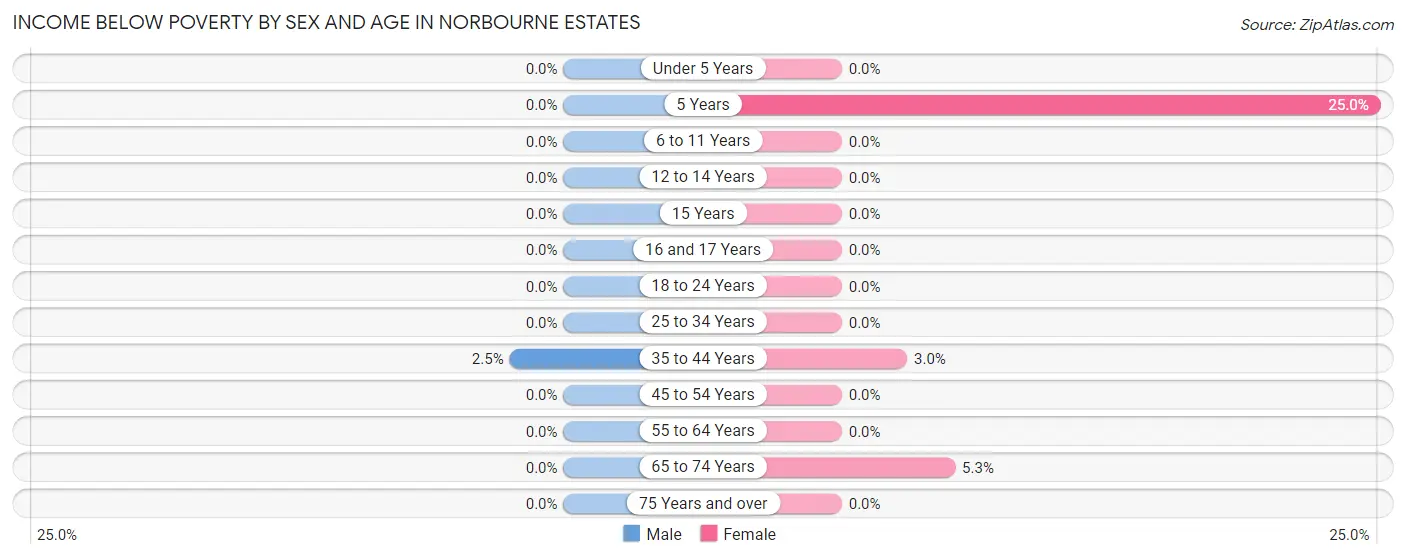
| Age Bracket | Male | Female |
| Under 5 Years | 0 (0.0%) | 0 (0.0%) |
| 5 Years | 0 (0.0%) | 1 (25.0%) |
| 6 to 11 Years | 0 (0.0%) | 0 (0.0%) |
| 12 to 14 Years | 0 (0.0%) | 0 (0.0%) |
| 15 Years | 0 (0.0%) | 0 (0.0%) |
| 16 and 17 Years | 0 (0.0%) | 0 (0.0%) |
| 18 to 24 Years | 0 (0.0%) | 0 (0.0%) |
| 25 to 34 Years | 0 (0.0%) | 0 (0.0%) |
| 35 to 44 Years | 1 (2.5%) | 1 (3.0%) |
| 45 to 54 Years | 0 (0.0%) | 0 (0.0%) |
| 55 to 64 Years | 0 (0.0%) | 0 (0.0%) |
| 65 to 74 Years | 0 (0.0%) | 2 (5.3%) |
| 75 Years and over | 0 (0.0%) | 0 (0.0%) |
| Total | 1 (0.5%) | 4 (1.6%) |
Income Above Poverty by Sex and Age in Norbourne Estates
According to the poverty statistics in Norbourne Estates, males aged under 5 years and females aged under 5 years are the age groups that are most secure financially, with 100.0% of males and 100.0% of females in these age groups living above the poverty line.
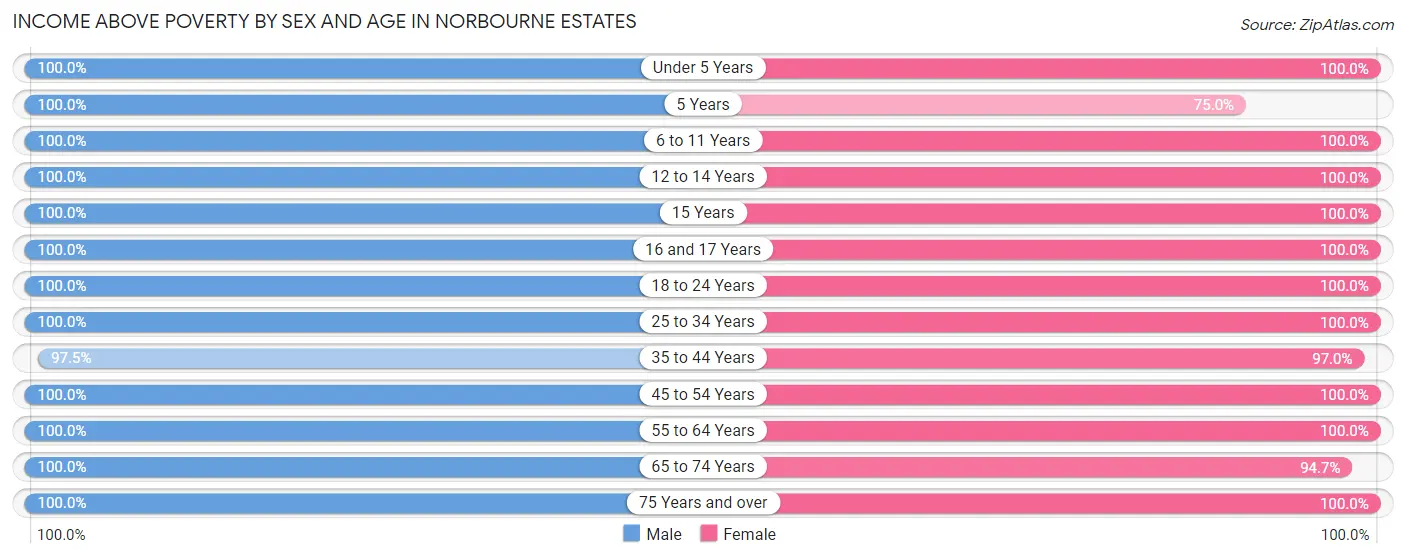
| Age Bracket | Male | Female |
| Under 5 Years | 23 (100.0%) | 19 (100.0%) |
| 5 Years | 2 (100.0%) | 3 (75.0%) |
| 6 to 11 Years | 14 (100.0%) | 18 (100.0%) |
| 12 to 14 Years | 4 (100.0%) | 4 (100.0%) |
| 15 Years | 2 (100.0%) | 3 (100.0%) |
| 16 and 17 Years | 13 (100.0%) | 6 (100.0%) |
| 18 to 24 Years | 7 (100.0%) | 23 (100.0%) |
| 25 to 34 Years | 12 (100.0%) | 21 (100.0%) |
| 35 to 44 Years | 39 (97.5%) | 32 (97.0%) |
| 45 to 54 Years | 18 (100.0%) | 20 (100.0%) |
| 55 to 64 Years | 39 (100.0%) | 42 (100.0%) |
| 65 to 74 Years | 23 (100.0%) | 36 (94.7%) |
| 75 Years and over | 19 (100.0%) | 17 (100.0%) |
| Total | 215 (99.5%) | 244 (98.4%) |
Income Below Poverty Among Married-Couple Families in Norbourne Estates
The poverty statistics for married-couple families in Norbourne Estates show that 0.8% or 1 of the total 131 families live below the poverty line. Families with 1 or 2 children have the highest poverty rate of 3.3%, comprising of 1 families. On the other hand, families with no children have the lowest poverty rate of 0.0%, which includes 0 families.
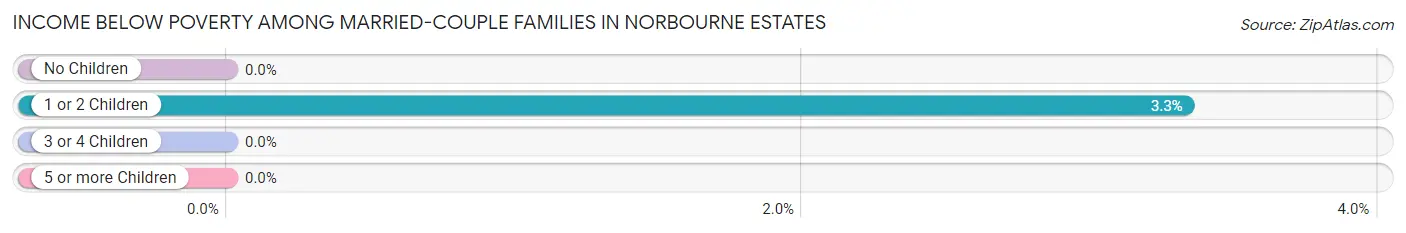
| Children | Above Poverty | Below Poverty |
| No Children | 87 (100.0%) | 0 (0.0%) |
| 1 or 2 Children | 29 (96.7%) | 1 (3.3%) |
| 3 or 4 Children | 14 (100.0%) | 0 (0.0%) |
| 5 or more Children | 0 (0.0%) | 0 (0.0%) |
| Total | 130 (99.2%) | 1 (0.8%) |
Income Below Poverty Among Single-Parent Households in Norbourne Estates
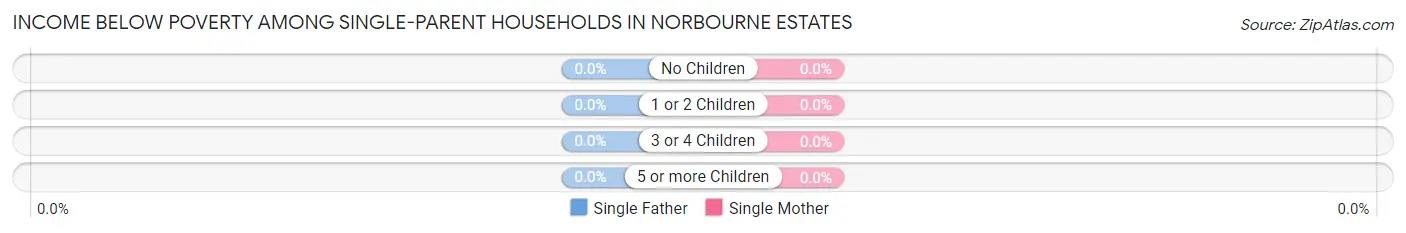
| Children | Single Father | Single Mother |
| No Children | 0 (0.0%) | 0 (0.0%) |
| 1 or 2 Children | 0 (0.0%) | 0 (0.0%) |
| 3 or 4 Children | 0 (0.0%) | 0 (0.0%) |
| 5 or more Children | 0 (0.0%) | 0 (0.0%) |
| Total | 0 (0.0%) | 0 (0.0%) |
Income Below Poverty Among Married-Couple vs Single-Parent Households in Norbourne Estates
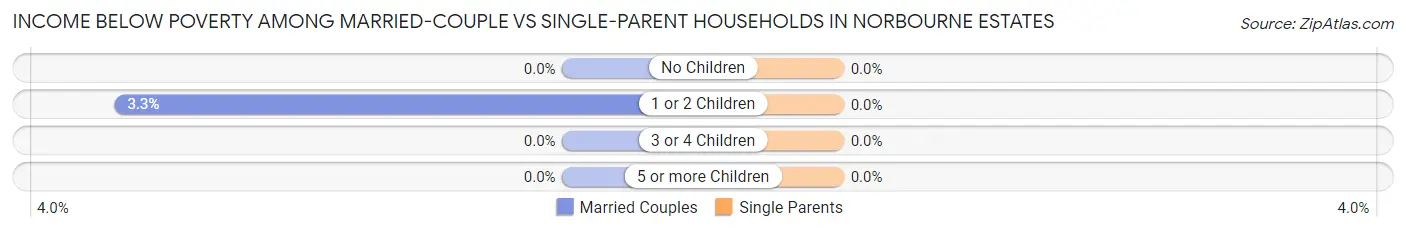
| Children | Married-Couple Families | Single-Parent Households |
| No Children | 0 (0.0%) | 0 (0.0%) |
| 1 or 2 Children | 1 (3.3%) | 0 (0.0%) |
| 3 or 4 Children | 0 (0.0%) | 0 (0.0%) |
| 5 or more Children | 0 (0.0%) | 0 (0.0%) |
| Total | 1 (0.8%) | 0 (0.0%) |
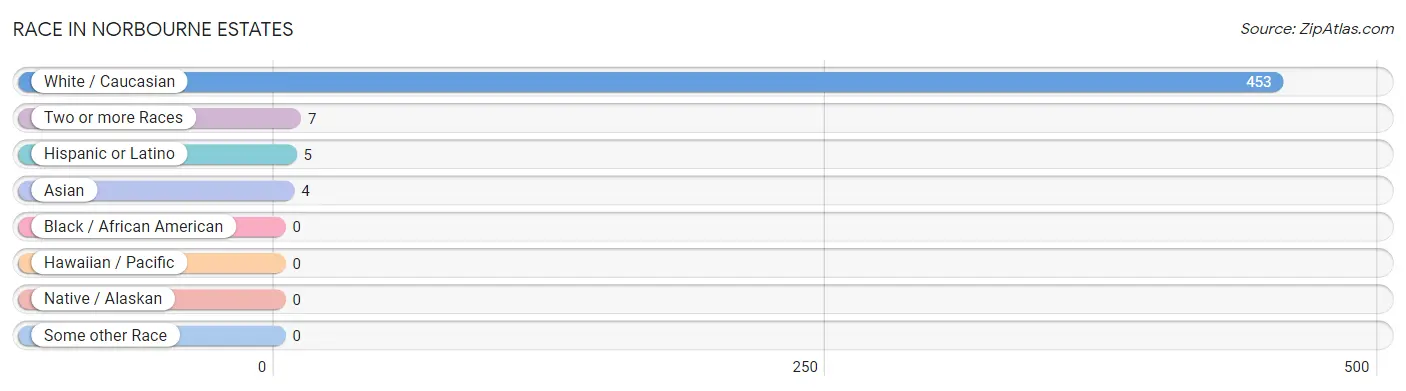
Race in Norbourne Estates
The most populous races in Norbourne Estates are White / Caucasian (453 | 97.6%), Two or more Races (7 | 1.5%), and Hispanic or Latino (5 | 1.1%).
| Race | # Population | % Population |
| Asian | 4 | 0.9% |
| Black / African American | 0 | 0.0% |
| Hawaiian / Pacific | 0 | 0.0% |
| Hispanic or Latino | 5 | 1.1% |
| Native / Alaskan | 0 | 0.0% |
| White / Caucasian | 453 | 97.6% |
| Two or more Races | 7 | 1.5% |
| Some other Race | 0 | 0.0% |
| Total | 464 | 100.0% |
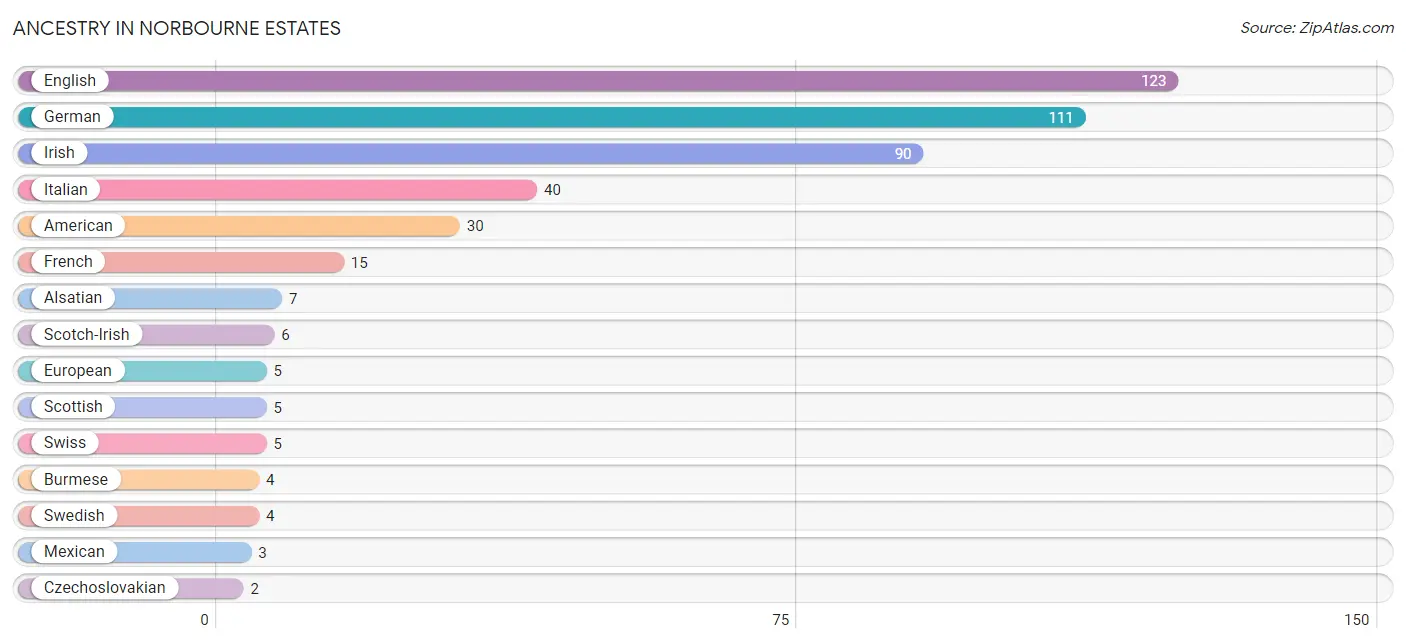
Ancestry in Norbourne Estates
The most populous ancestries reported in Norbourne Estates are English (123 | 26.5%), German (111 | 23.9%), Irish (90 | 19.4%), Italian (40 | 8.6%), and American (30 | 6.5%), together accounting for 84.9% of all Norbourne Estates residents.
| Ancestry | # Population | % Population |
| Alsatian | 7 | 1.5% |
| American | 30 | 6.5% |
| Arab | 1 | 0.2% |
| British | 1 | 0.2% |
| Burmese | 4 | 0.9% |
| Czechoslovakian | 2 | 0.4% |
| Danish | 2 | 0.4% |
| Dominican | 1 | 0.2% |
| Dutch | 1 | 0.2% |
| English | 123 | 26.5% |
| European | 5 | 1.1% |
| French | 15 | 3.2% |
| German | 111 | 23.9% |
| Greek | 2 | 0.4% |
| Hungarian | 1 | 0.2% |
| Irish | 90 | 19.4% |
| Italian | 40 | 8.6% |
| Mexican | 3 | 0.6% |
| Pennsylvania German | 1 | 0.2% |
| Portuguese | 1 | 0.2% |
| Russian | 2 | 0.4% |
| Scotch-Irish | 6 | 1.3% |
| Scottish | 5 | 1.1% |
| Spanish | 1 | 0.2% |
| Swedish | 4 | 0.9% |
| Swiss | 5 | 1.1% |
| Welsh | 1 | 0.2% | View All 27 Rows |
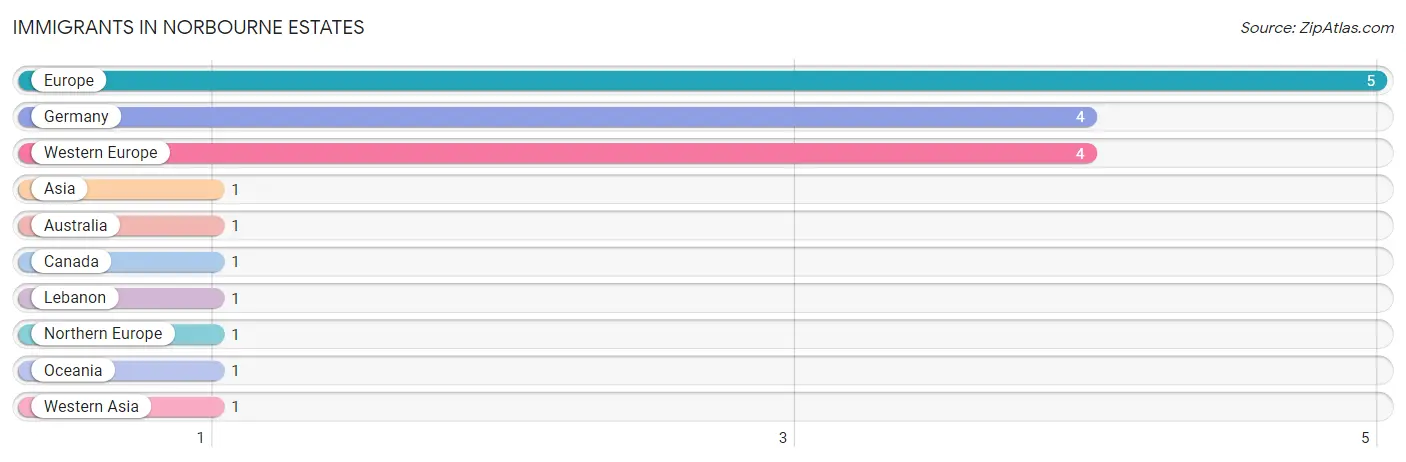
Immigrants in Norbourne Estates
The most numerous immigrant groups reported in Norbourne Estates came from Europe (5 | 1.1%), Germany (4 | 0.9%), Western Europe (4 | 0.9%), Asia (1 | 0.2%), and Australia (1 | 0.2%), together accounting for 3.2% of all Norbourne Estates residents.
| Immigration Origin | # Population | % Population |
| Asia | 1 | 0.2% |
| Australia | 1 | 0.2% |
| Canada | 1 | 0.2% |
| Europe | 5 | 1.1% |
| Germany | 4 | 0.9% |
| Lebanon | 1 | 0.2% |
| Northern Europe | 1 | 0.2% |
| Oceania | 1 | 0.2% |
| Western Asia | 1 | 0.2% |
| Western Europe | 4 | 0.9% | View All 10 Rows |
Sex and Age in Norbourne Estates
Sex and Age in Norbourne Estates
The most populous age groups in Norbourne Estates are 60 to 64 Years (28 | 13.0%) for men and 60 to 64 Years (27 | 10.9%) for women.
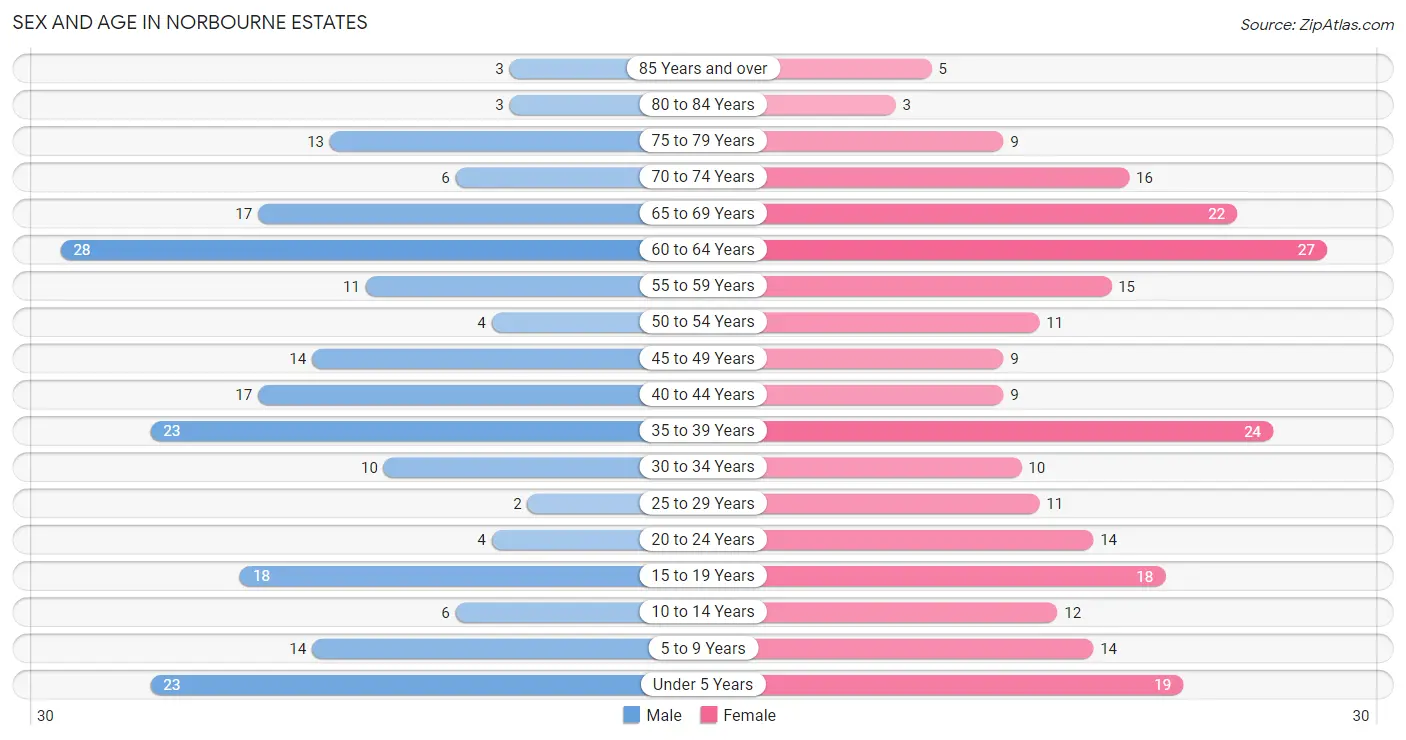
| Age Bracket | Male | Female |
| Under 5 Years | 23 (10.6%) | 19 (7.7%) |
| 5 to 9 Years | 14 (6.5%) | 14 (5.7%) |
| 10 to 14 Years | 6 (2.8%) | 12 (4.8%) |
| 15 to 19 Years | 18 (8.3%) | 18 (7.3%) |
| 20 to 24 Years | 4 (1.8%) | 14 (5.7%) |
| 25 to 29 Years | 2 (0.9%) | 11 (4.4%) |
| 30 to 34 Years | 10 (4.6%) | 10 (4.0%) |
| 35 to 39 Years | 23 (10.6%) | 24 (9.7%) |
| 40 to 44 Years | 17 (7.9%) | 9 (3.6%) |
| 45 to 49 Years | 14 (6.5%) | 9 (3.6%) |
| 50 to 54 Years | 4 (1.8%) | 11 (4.4%) |
| 55 to 59 Years | 11 (5.1%) | 15 (6.0%) |
| 60 to 64 Years | 28 (13.0%) | 27 (10.9%) |
| 65 to 69 Years | 17 (7.9%) | 22 (8.9%) |
| 70 to 74 Years | 6 (2.8%) | 16 (6.5%) |
| 75 to 79 Years | 13 (6.0%) | 9 (3.6%) |
| 80 to 84 Years | 3 (1.4%) | 3 (1.2%) |
| 85 Years and over | 3 (1.4%) | 5 (2.0%) |
| Total | 216 (100.0%) | 248 (100.0%) |
Families and Households in Norbourne Estates
Median Family Size in Norbourne Estates
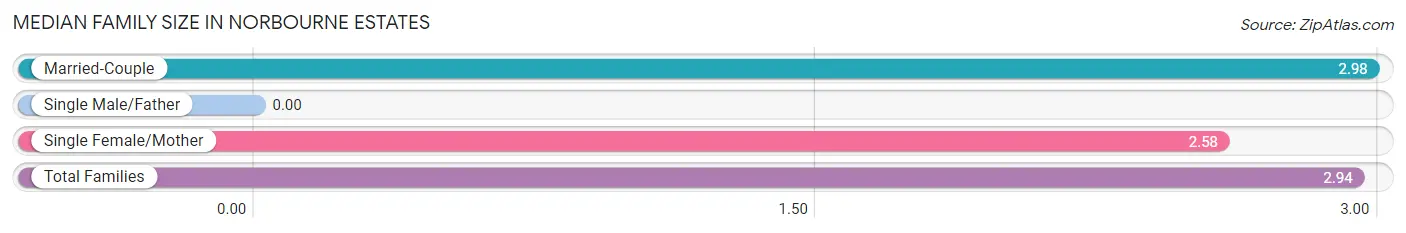
| Family Type | # Families | Family Size |
| Married-Couple | 131 (91.6%) | 2.98 |
| Single Male/Father | 0 (0.0%) | - |
| Single Female/Mother | 12 (8.4%) | 2.58 |
| Total Families | 143 (100.0%) | 2.94 |
Median Household Size in Norbourne Estates
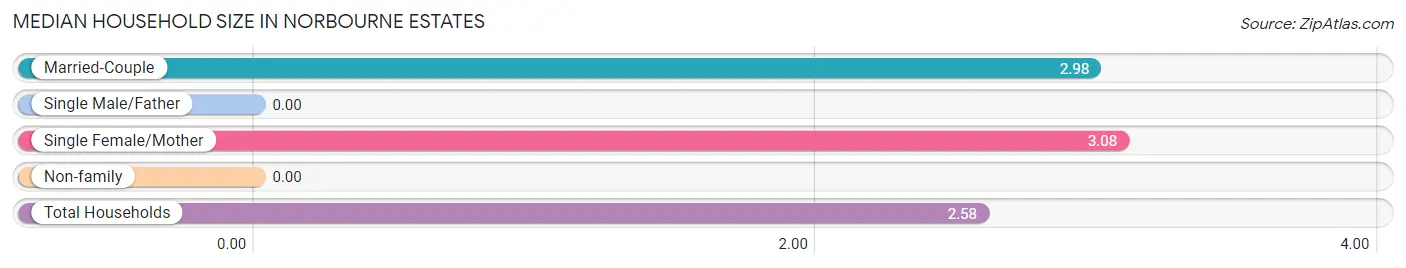
| Household Type | # Households | Household Size |
| Married-Couple | 131 (72.8%) | 2.98 |
| Single Male/Father | 0 (0.0%) | - |
| Single Female/Mother | 12 (6.7%) | 3.08 |
| Non-family | 37 (20.6%) | - |
| Total Households | 180 (100.0%) | 2.58 |
Household Size by Marriage Status in Norbourne Estates
Out of a total of 180 households in Norbourne Estates, 143 (79.4%) are family households, while 37 (20.6%) are nonfamily households. The most numerous type of family households are 2-person households, comprising 81, and the most common type of nonfamily households are 1-person households, comprising 37.
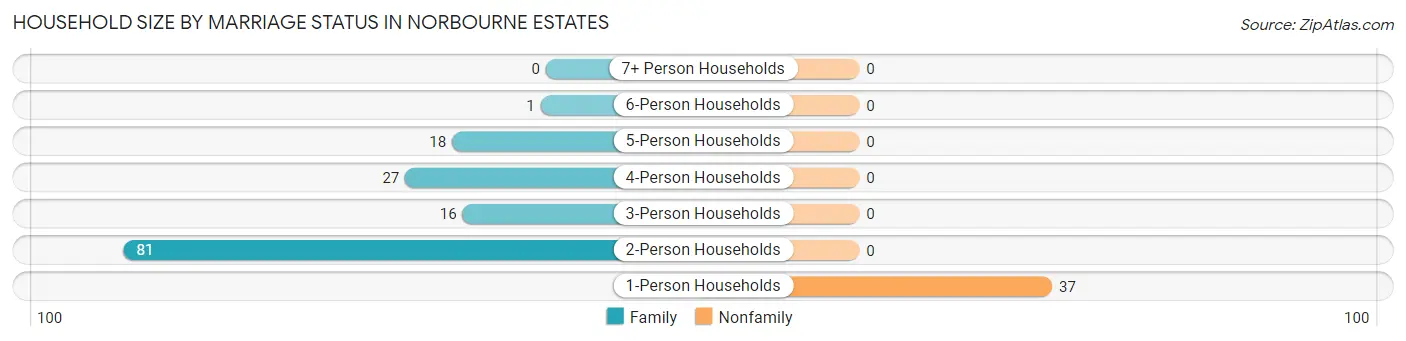
| Household Size | Family Households | Nonfamily Households |
| 1-Person Households | - | 37 (20.6%) |
| 2-Person Households | 81 (45.0%) | 0 (0.0%) |
| 3-Person Households | 16 (8.9%) | 0 (0.0%) |
| 4-Person Households | 27 (15.0%) | 0 (0.0%) |
| 5-Person Households | 18 (10.0%) | 0 (0.0%) |
| 6-Person Households | 1 (0.6%) | 0 (0.0%) |
| 7+ Person Households | 0 (0.0%) | 0 (0.0%) |
| Total | 143 (79.4%) | 37 (20.6%) |
Female Fertility in Norbourne Estates
Fertility by Age in Norbourne Estates
Average fertility rate in Norbourne Estates is 50.0 births per 1,000 women. Women in the age bracket of 35 to 50 years have the highest fertility rate with 85.0 births per 1,000 women. Women in the age bracket of 35 to 50 years acount for 80.0% of all women with births.
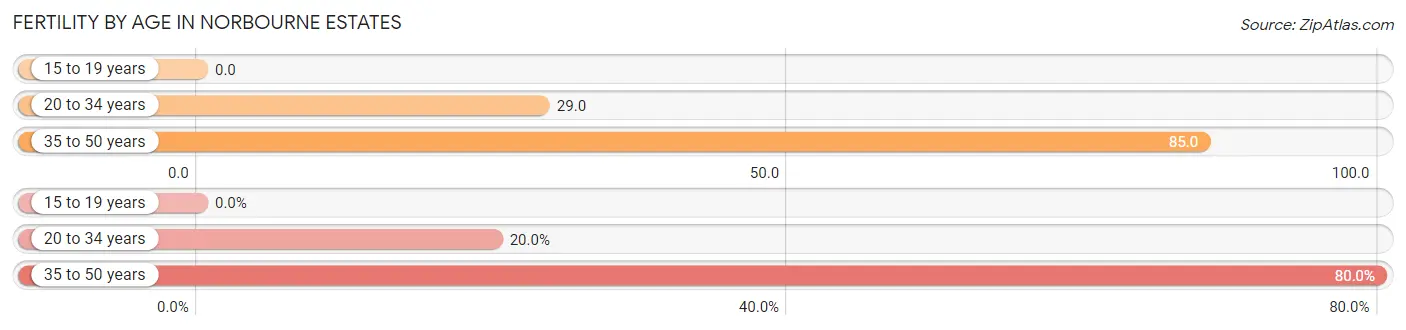
| Age Bracket | Women with Births | Births / 1,000 Women |
| 15 to 19 years | 0 (0.0%) | 0.0 |
| 20 to 34 years | 1 (20.0%) | 29.0 |
| 35 to 50 years | 4 (80.0%) | 85.0 |
| Total | 5 (100.0%) | 50.0 |
Fertility by Age by Marriage Status in Norbourne Estates
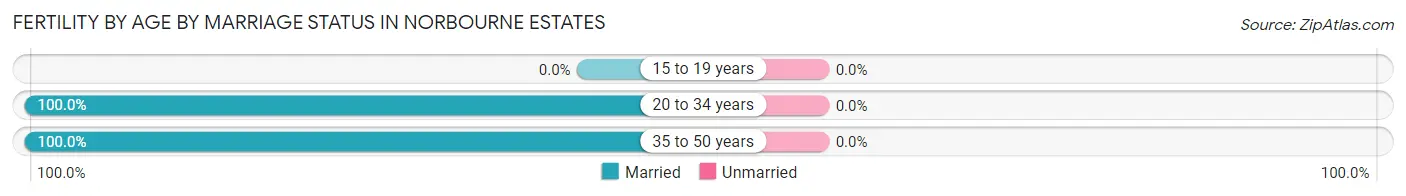
| Age Bracket | Married | Unmarried |
| 15 to 19 years | 0 (0.0%) | 0 (0.0%) |
| 20 to 34 years | 1 (100.0%) | 0 (0.0%) |
| 35 to 50 years | 4 (100.0%) | 0 (0.0%) |
| Total | 5 (100.0%) | 0 (0.0%) |
Fertility by Education in Norbourne Estates
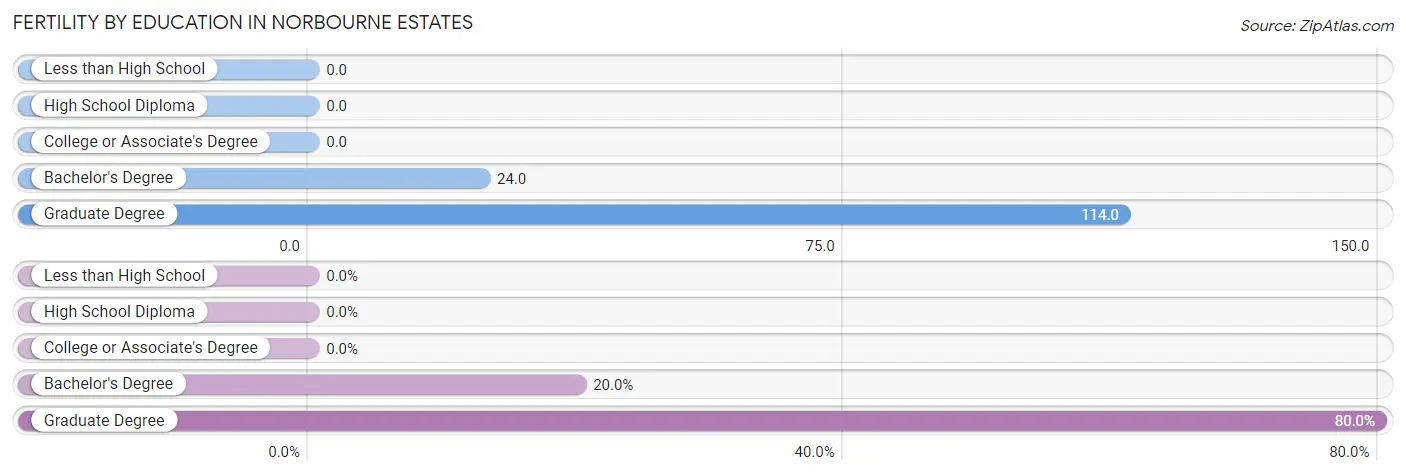
| Educational Attainment | Women with Births | Births / 1,000 Women |
| Less than High School | 0 (0.0%) | 0.0 |
| High School Diploma | 0 (0.0%) | 0.0 |
| College or Associate's Degree | 0 (0.0%) | 0.0 |
| Bachelor's Degree | 1 (20.0%) | 24.0 |
| Graduate Degree | 4 (80.0%) | 114.0 |
| Total | 5 (100.0%) | 50.0 |
Fertility by Education by Marriage Status in Norbourne Estates
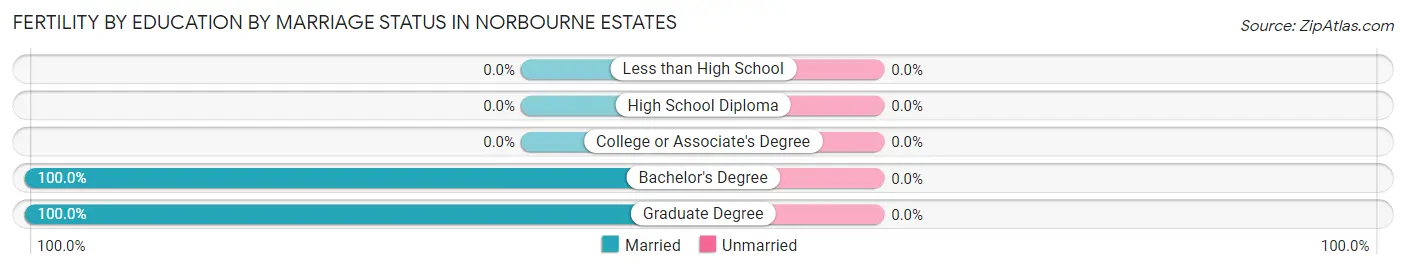
| Educational Attainment | Married | Unmarried |
| Less than High School | 0 (0.0%) | 0 (0.0%) |
| High School Diploma | 0 (0.0%) | 0 (0.0%) |
| College or Associate's Degree | 0 (0.0%) | 0 (0.0%) |
| Bachelor's Degree | 1 (100.0%) | 0 (0.0%) |
| Graduate Degree | 4 (100.0%) | 0 (0.0%) |
| Total | 5 (100.0%) | 0 (0.0%) |
Employment Characteristics in Norbourne Estates
Employment by Class of Employer in Norbourne Estates
Among the 211 employed individuals in Norbourne Estates, private company employees (154 | 73.0%), self-employed (incorporated) (22 | 10.4%), and not-for-profit organizations (15 | 7.1%) make up the most common classes of employment.
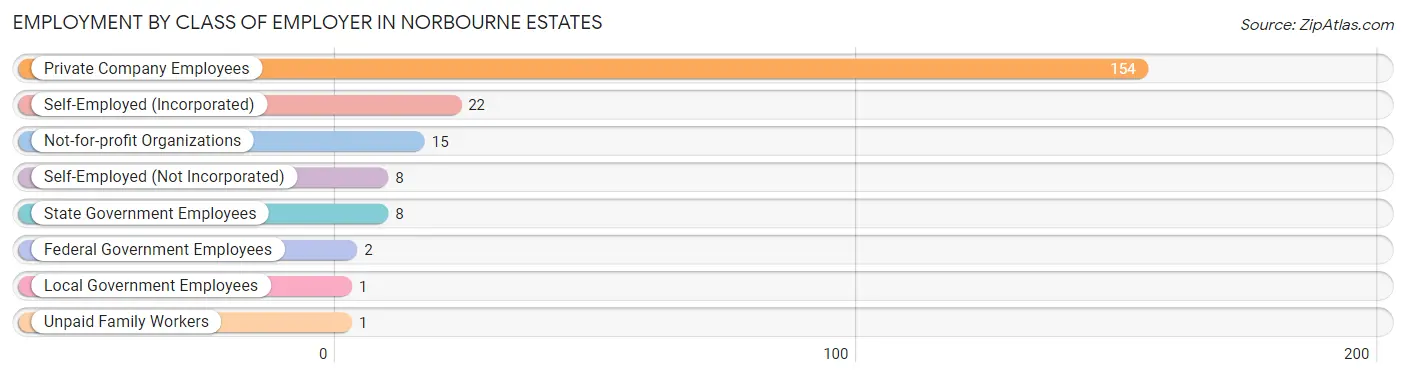
| Employer Class | # Employees | % Employees |
| Private Company Employees | 154 | 73.0% |
| Self-Employed (Incorporated) | 22 | 10.4% |
| Self-Employed (Not Incorporated) | 8 | 3.8% |
| Not-for-profit Organizations | 15 | 7.1% |
| Local Government Employees | 1 | 0.5% |
| State Government Employees | 8 | 3.8% |
| Federal Government Employees | 2 | 0.9% |
| Unpaid Family Workers | 1 | 0.5% |
| Total | 211 | 100.0% |
Employment Status by Age in Norbourne Estates
According to the labor force statistics for Norbourne Estates, out of the total population over 16 years of age (371), 58.0% or 215 individuals are in the labor force, with 1.9% or 4 of them unemployed. The age group with the highest labor force participation rate is 30 to 34 years, with 100.0% or 20 individuals in the labor force. Within the labor force, the 20 to 24 years age range has the highest percentage of unemployed individuals, with 44.4% or 4 of them being unemployed.
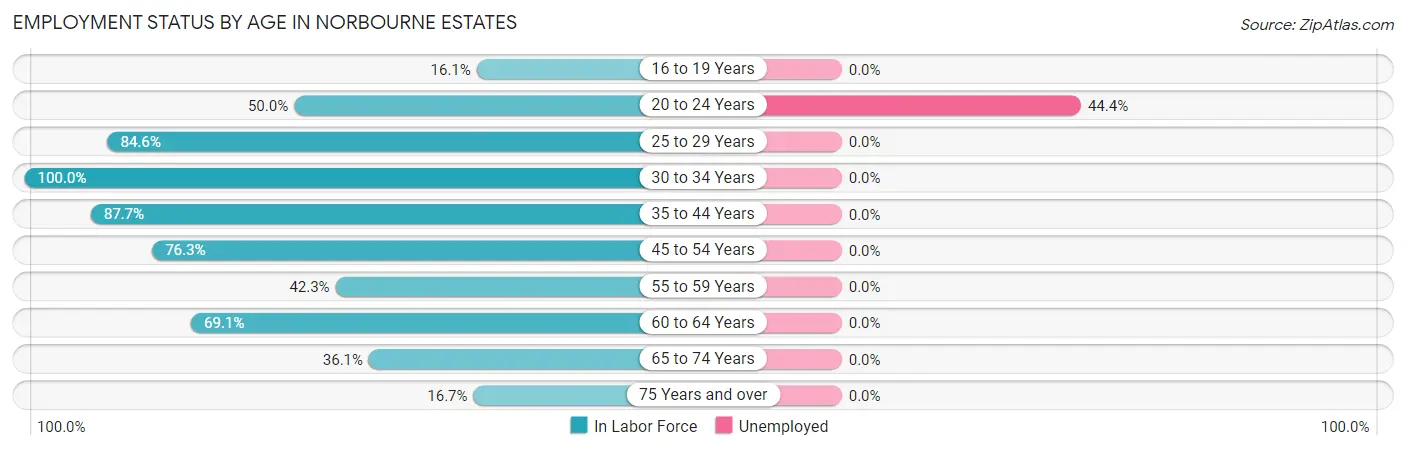
| Age Bracket | In Labor Force | Unemployed |
| 16 to 19 Years | 5 (16.1%) | 0 (0.0%) |
| 20 to 24 Years | 9 (50.0%) | 4 (44.4%) |
| 25 to 29 Years | 11 (84.6%) | 0 (0.0%) |
| 30 to 34 Years | 20 (100.0%) | 0 (0.0%) |
| 35 to 44 Years | 64 (87.7%) | 0 (0.0%) |
| 45 to 54 Years | 29 (76.3%) | 0 (0.0%) |
| 55 to 59 Years | 11 (42.3%) | 0 (0.0%) |
| 60 to 64 Years | 38 (69.1%) | 0 (0.0%) |
| 65 to 74 Years | 22 (36.1%) | 0 (0.0%) |
| 75 Years and over | 6 (16.7%) | 0 (0.0%) |
| Total | 215 (58.0%) | 4 (1.9%) |
Employment Status by Educational Attainment in Norbourne Estates
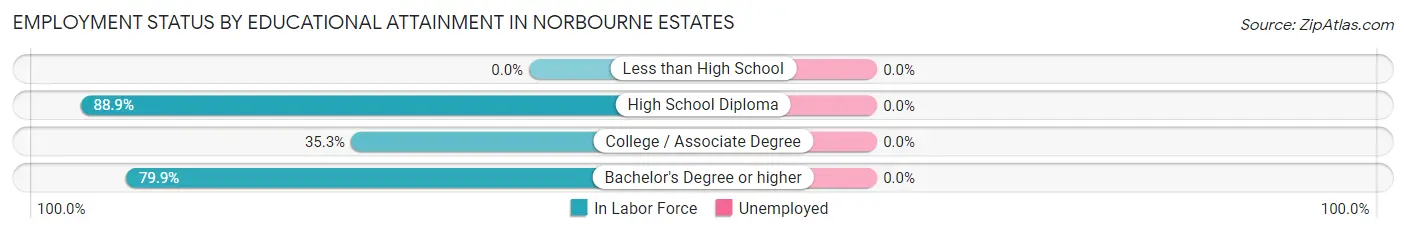
| Educational Attainment | In Labor Force | Unemployed |
| Less than High School | 0 (0.0%) | 0 (0.0%) |
| High School Diploma | 8 (88.9%) | 0 (0.0%) |
| College / Associate Degree | 6 (35.3%) | 0 (0.0%) |
| Bachelor's Degree or higher | 159 (79.9%) | 0 (0.0%) |
| Total | 173 (76.9%) | 0 (0.0%) |
Employment Occupations by Sex in Norbourne Estates
Management, Business, Science and Arts Occupations
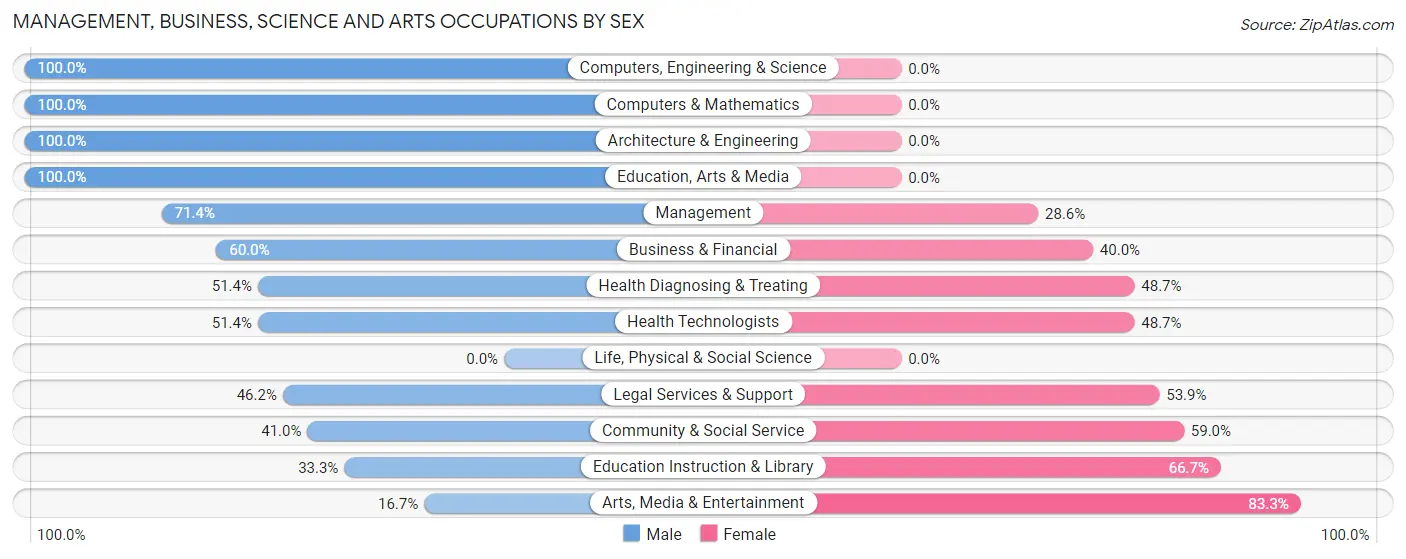
The most common Management, Business, Science and Arts occupations in Norbourne Estates are Management (42 | 19.9%), Community & Social Service (39 | 18.5%), Health Diagnosing & Treating (37 | 17.5%), Health Technologists (37 | 17.5%), and Legal Services & Support (26 | 12.3%).
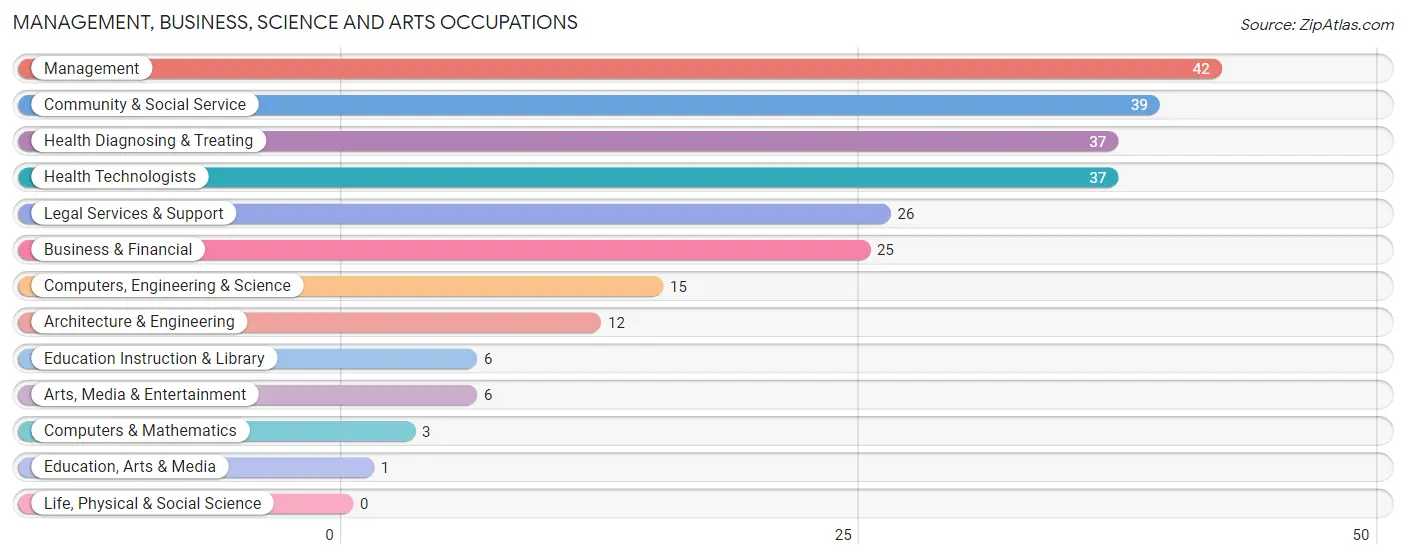
Management, Business, Science and Arts Occupations by Sex
Within the Management, Business, Science and Arts occupations in Norbourne Estates, the most male-oriented occupations are Computers, Engineering & Science (100.0%), Computers & Mathematics (100.0%), and Architecture & Engineering (100.0%), while the most female-oriented occupations are Arts, Media & Entertainment (83.3%), Education Instruction & Library (66.7%), and Community & Social Service (59.0%).
| Occupation | Male | Female |
| Management | 30 (71.4%) | 12 (28.6%) |
| Business & Financial | 15 (60.0%) | 10 (40.0%) |
| Computers, Engineering & Science | 15 (100.0%) | 0 (0.0%) |
| Computers & Mathematics | 3 (100.0%) | 0 (0.0%) |
| Architecture & Engineering | 12 (100.0%) | 0 (0.0%) |
| Life, Physical & Social Science | 0 (0.0%) | 0 (0.0%) |
| Community & Social Service | 16 (41.0%) | 23 (59.0%) |
| Education, Arts & Media | 1 (100.0%) | 0 (0.0%) |
| Legal Services & Support | 12 (46.2%) | 14 (53.8%) |
| Education Instruction & Library | 2 (33.3%) | 4 (66.7%) |
| Arts, Media & Entertainment | 1 (16.7%) | 5 (83.3%) |
| Health Diagnosing & Treating | 19 (51.3%) | 18 (48.6%) |
| Health Technologists | 19 (51.3%) | 18 (48.6%) |
| Total (Category) | 95 (60.1%) | 63 (39.9%) |
| Total (Overall) | 117 (55.4%) | 94 (44.6%) |
Services Occupations
The most common Services occupations in Norbourne Estates are Healthcare Support (3 | 1.4%), Personal Care & Service (2 | 0.9%), Security & Protection (1 | 0.5%), Firefighting & Prevention (1 | 0.5%), and Food Preparation & Serving (1 | 0.5%).
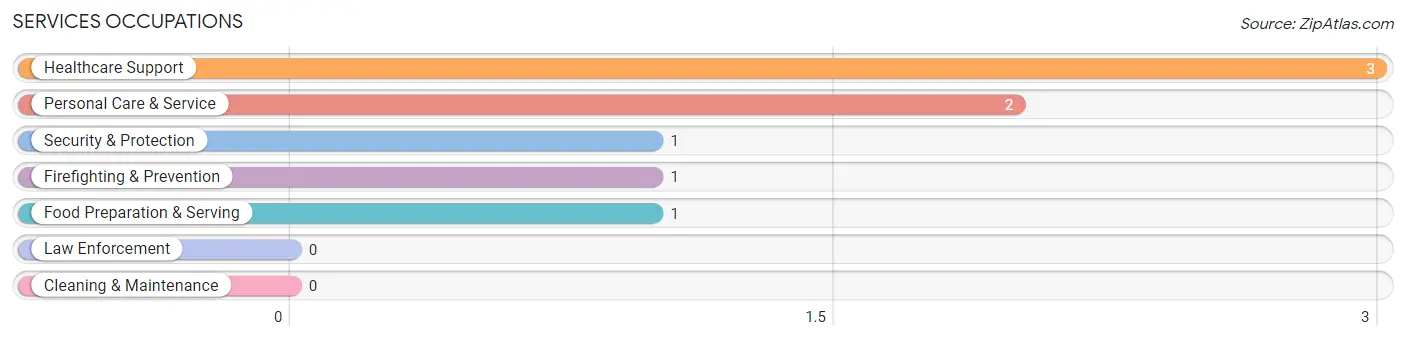
Services Occupations by Sex
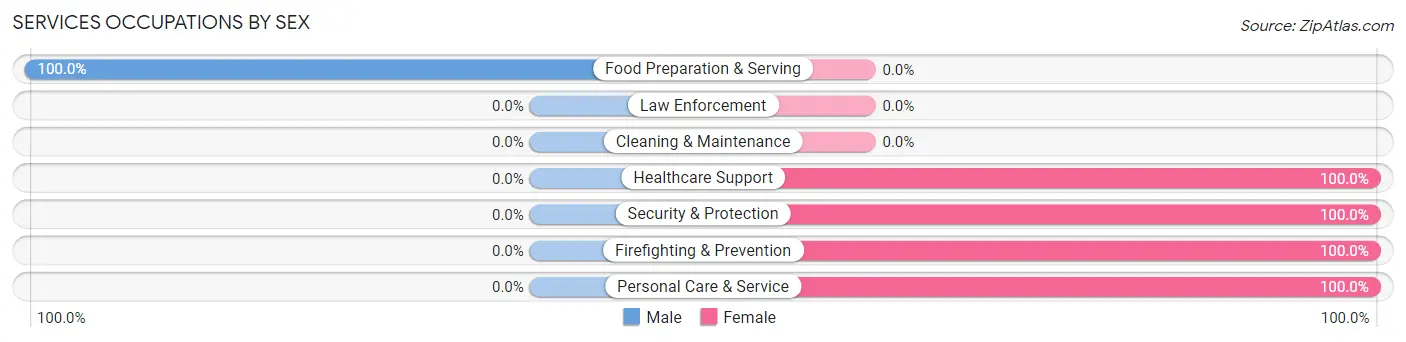
| Occupation | Male | Female |
| Healthcare Support | 0 (0.0%) | 3 (100.0%) |
| Security & Protection | 0 (0.0%) | 1 (100.0%) |
| Firefighting & Prevention | 0 (0.0%) | 1 (100.0%) |
| Law Enforcement | 0 (0.0%) | 0 (0.0%) |
| Food Preparation & Serving | 1 (100.0%) | 0 (0.0%) |
| Cleaning & Maintenance | 0 (0.0%) | 0 (0.0%) |
| Personal Care & Service | 0 (0.0%) | 2 (100.0%) |
| Total (Category) | 1 (14.3%) | 6 (85.7%) |
| Total (Overall) | 117 (55.4%) | 94 (44.6%) |
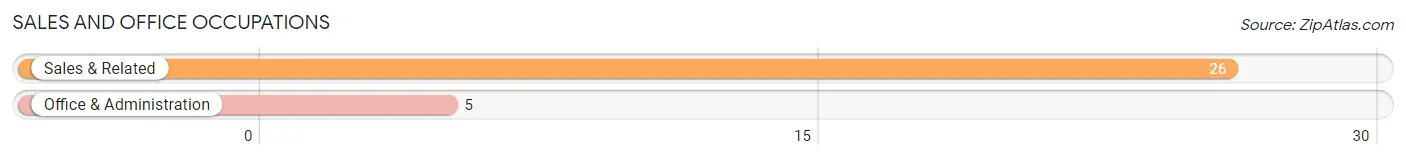
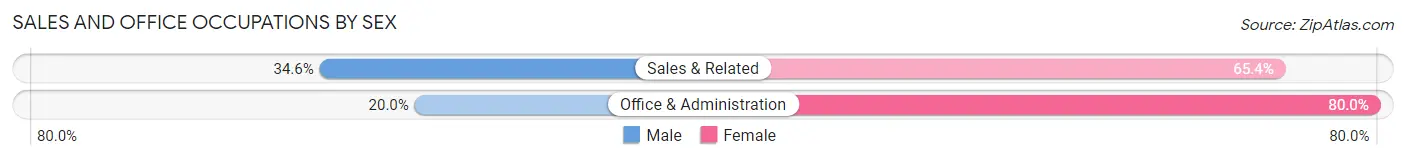
Sales and Office Occupations
The most common Sales and Office occupations in Norbourne Estates are Sales & Related (26 | 12.3%), and Office & Administration (5 | 2.4%).
Sales and Office Occupations by Sex
| Occupation | Male | Female |
| Sales & Related | 9 (34.6%) | 17 (65.4%) |
| Office & Administration | 1 (20.0%) | 4 (80.0%) |
| Total (Category) | 10 (32.3%) | 21 (67.7%) |
| Total (Overall) | 117 (55.4%) | 94 (44.6%) |
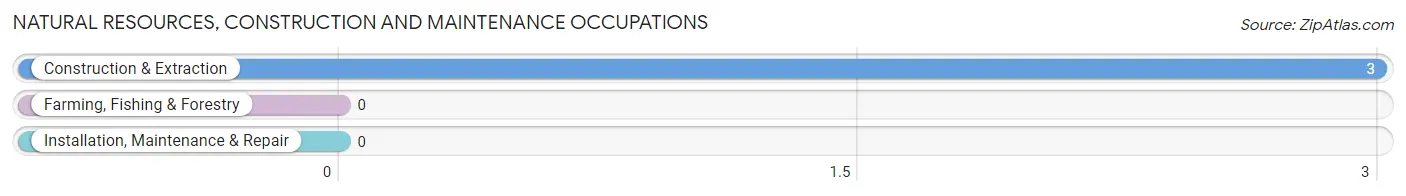
Natural Resources, Construction and Maintenance Occupations
The most common Natural Resources, Construction and Maintenance occupations in Norbourne Estates are , and Construction & Extraction (3 | 1.4%).
Natural Resources, Construction and Maintenance Occupations by Sex
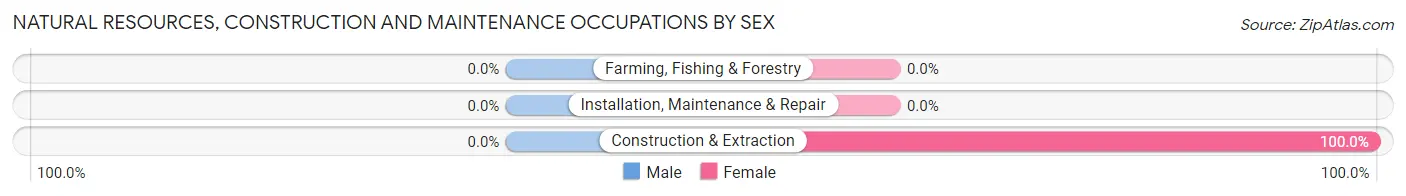
| Occupation | Male | Female |
| Farming, Fishing & Forestry | 0 (0.0%) | 0 (0.0%) |
| Construction & Extraction | 0 (0.0%) | 3 (100.0%) |
| Installation, Maintenance & Repair | 0 (0.0%) | 0 (0.0%) |
| Total (Category) | 0 (0.0%) | 3 (100.0%) |
| Total (Overall) | 117 (55.4%) | 94 (44.6%) |
Production, Transportation and Moving Occupations
The most common Production, Transportation and Moving occupations in Norbourne Estates are Transportation (7 | 3.3%), Material Moving (4 | 1.9%), and Production (1 | 0.5%).
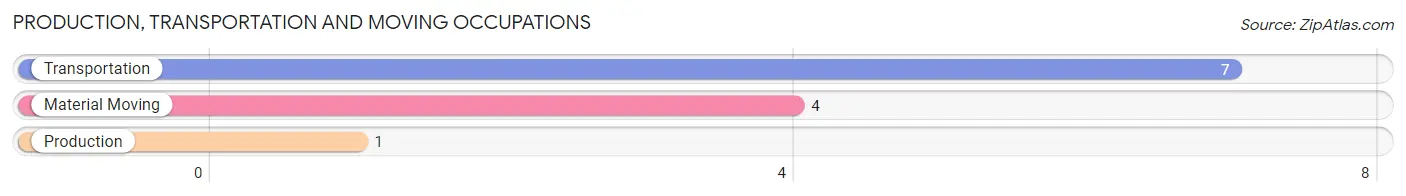
Production, Transportation and Moving Occupations by Sex
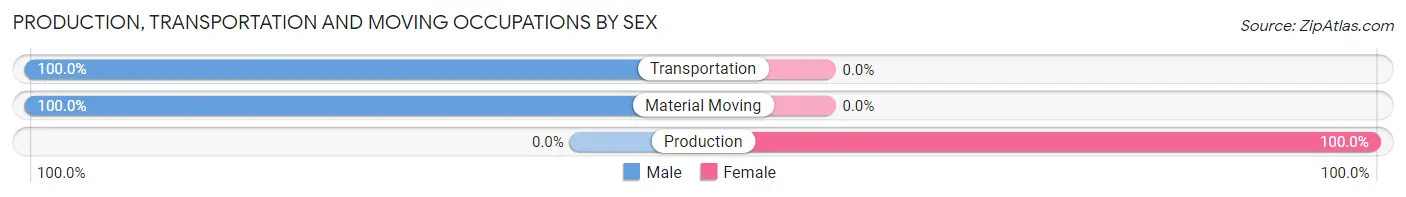
| Occupation | Male | Female |
| Production | 0 (0.0%) | 1 (100.0%) |
| Transportation | 7 (100.0%) | 0 (0.0%) |
| Material Moving | 4 (100.0%) | 0 (0.0%) |
| Total (Category) | 11 (91.7%) | 1 (8.3%) |
| Total (Overall) | 117 (55.4%) | 94 (44.6%) |
Employment Industries by Sex in Norbourne Estates
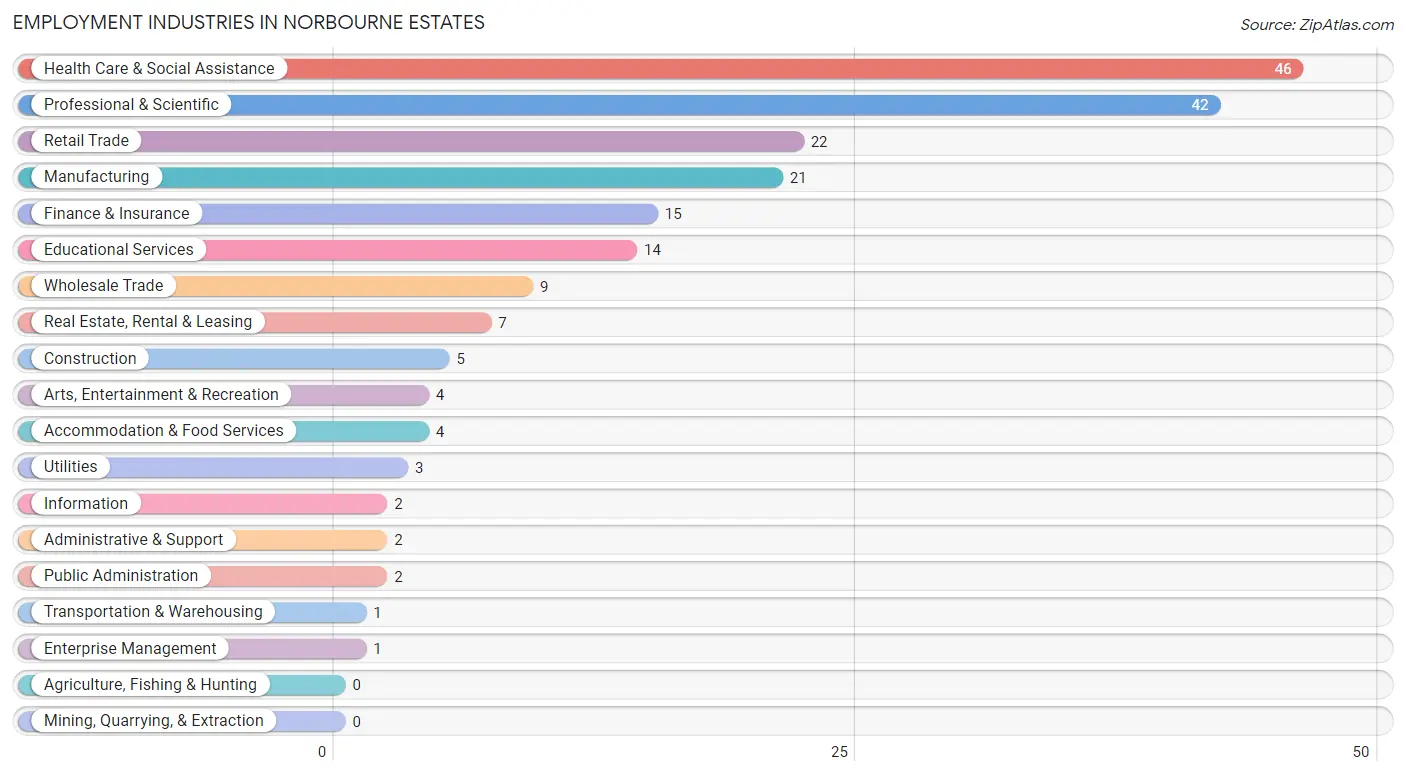
Employment Industries in Norbourne Estates
The major employment industries in Norbourne Estates include Health Care & Social Assistance (46 | 21.8%), Professional & Scientific (42 | 19.9%), Retail Trade (22 | 10.4%), Manufacturing (21 | 10.0%), and Finance & Insurance (15 | 7.1%).
Employment Industries by Sex in Norbourne Estates
The Norbourne Estates industries that see more men than women are Transportation & Warehousing (100.0%), Utilities (100.0%), and Enterprise Management (100.0%), whereas the industries that tend to have a higher number of women are Information (100.0%), Public Administration (100.0%), and Educational Services (71.4%).
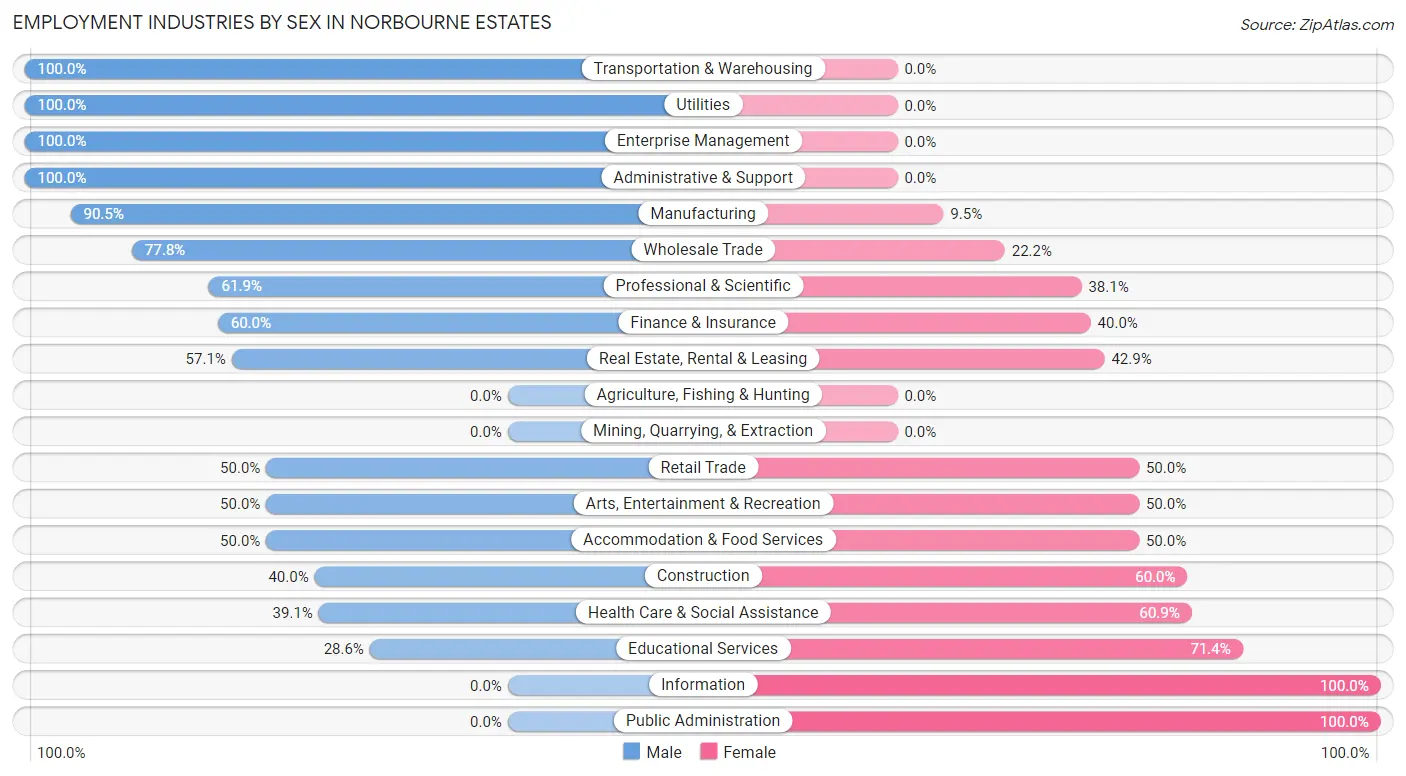
| Industry | Male | Female |
| Agriculture, Fishing & Hunting | 0 (0.0%) | 0 (0.0%) |
| Mining, Quarrying, & Extraction | 0 (0.0%) | 0 (0.0%) |
| Construction | 2 (40.0%) | 3 (60.0%) |
| Manufacturing | 19 (90.5%) | 2 (9.5%) |
| Wholesale Trade | 7 (77.8%) | 2 (22.2%) |
| Retail Trade | 11 (50.0%) | 11 (50.0%) |
| Transportation & Warehousing | 1 (100.0%) | 0 (0.0%) |
| Utilities | 3 (100.0%) | 0 (0.0%) |
| Information | 0 (0.0%) | 2 (100.0%) |
| Finance & Insurance | 9 (60.0%) | 6 (40.0%) |
| Real Estate, Rental & Leasing | 4 (57.1%) | 3 (42.9%) |
| Professional & Scientific | 26 (61.9%) | 16 (38.1%) |
| Enterprise Management | 1 (100.0%) | 0 (0.0%) |
| Administrative & Support | 2 (100.0%) | 0 (0.0%) |
| Educational Services | 4 (28.6%) | 10 (71.4%) |
| Health Care & Social Assistance | 18 (39.1%) | 28 (60.9%) |
| Arts, Entertainment & Recreation | 2 (50.0%) | 2 (50.0%) |
| Accommodation & Food Services | 2 (50.0%) | 2 (50.0%) |
| Public Administration | 0 (0.0%) | 2 (100.0%) |
| Total | 117 (55.4%) | 94 (44.6%) |
Education in Norbourne Estates
School Enrollment in Norbourne Estates
The most common levels of schooling among the 104 students in Norbourne Estates are high school (31 | 29.8%), elementary school (21 | 20.2%), and middle school (16 | 15.4%).
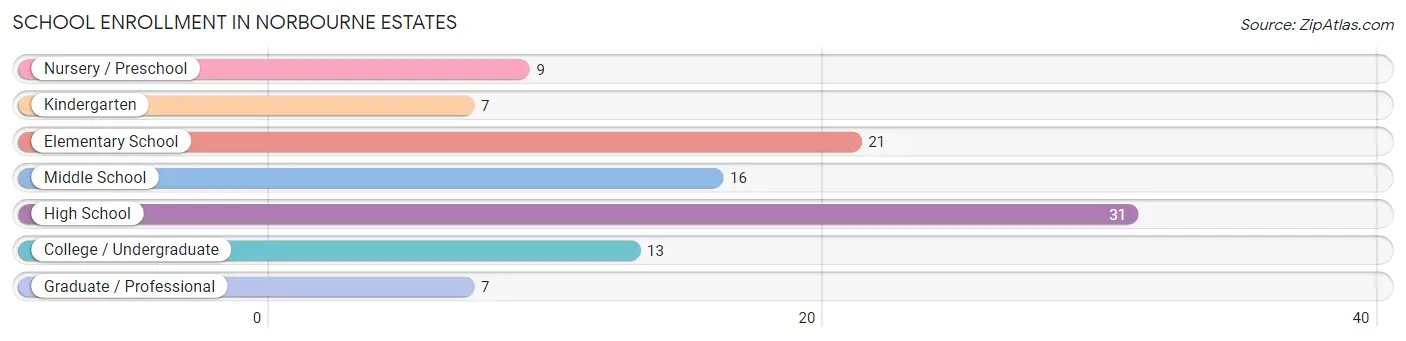
| School Level | # Students | % Students |
| Nursery / Preschool | 9 | 8.6% |
| Kindergarten | 7 | 6.7% |
| Elementary School | 21 | 20.2% |
| Middle School | 16 | 15.4% |
| High School | 31 | 29.8% |
| College / Undergraduate | 13 | 12.5% |
| Graduate / Professional | 7 | 6.7% |
| Total | 104 | 100.0% |
School Enrollment by Age by Funding Source in Norbourne Estates
Out of a total of 104 students who are enrolled in schools in Norbourne Estates, 90 (86.5%) attend a private institution, while the remaining 14 (13.5%) are enrolled in public schools. The age group of 3 to 4 year olds has the highest likelihood of being enrolled in private schools, with 9 (100.0% in the age bracket) enrolled. Conversely, the age group of 35 years and over has the lowest likelihood of being enrolled in a private school, with 1 (100.0% in the age bracket) attending a public institution.
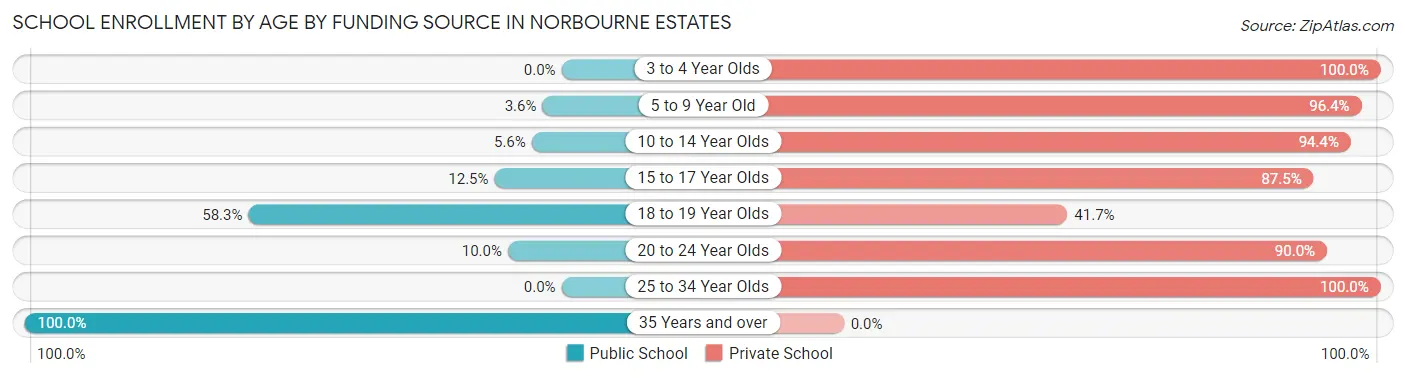
| Age Bracket | Public School | Private School |
| 3 to 4 Year Olds | 0 (0.0%) | 9 (100.0%) |
| 5 to 9 Year Old | 1 (3.6%) | 27 (96.4%) |
| 10 to 14 Year Olds | 1 (5.6%) | 17 (94.4%) |
| 15 to 17 Year Olds | 3 (12.5%) | 21 (87.5%) |
| 18 to 19 Year Olds | 7 (58.3%) | 5 (41.7%) |
| 20 to 24 Year Olds | 1 (10.0%) | 9 (90.0%) |
| 25 to 34 Year Olds | 0 (0.0%) | 2 (100.0%) |
| 35 Years and over | 1 (100.0%) | 0 (0.0%) |
| Total | 14 (13.5%) | 90 (86.5%) |
Educational Attainment by Field of Study in Norbourne Estates
Business (76 | 25.7%), social sciences (31 | 10.5%), communications (27 | 9.1%), literature & languages (26 | 8.8%), and bio, nature & agricultural (25 | 8.5%) are the most common fields of study among 296 individuals in Norbourne Estates who have obtained a bachelor's degree or higher.
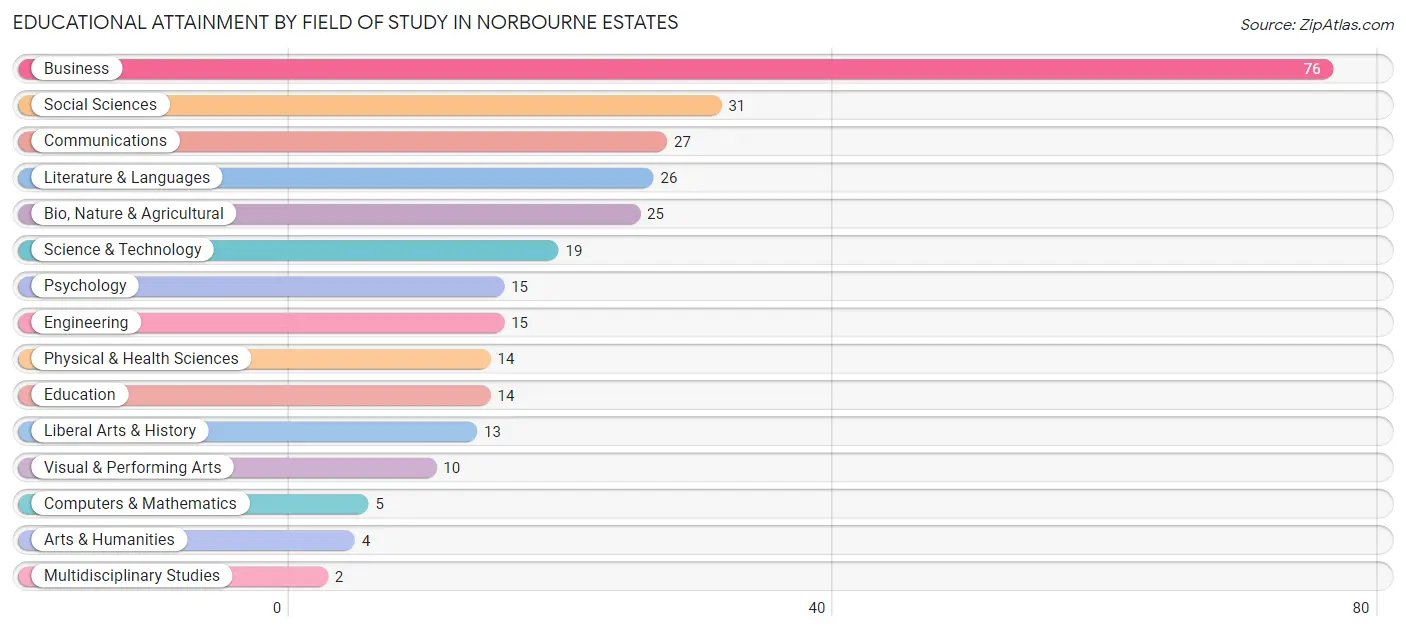
| Field of Study | # Graduates | % Graduates |
| Computers & Mathematics | 5 | 1.7% |
| Bio, Nature & Agricultural | 25 | 8.5% |
| Physical & Health Sciences | 14 | 4.7% |
| Psychology | 15 | 5.1% |
| Social Sciences | 31 | 10.5% |
| Engineering | 15 | 5.1% |
| Multidisciplinary Studies | 2 | 0.7% |
| Science & Technology | 19 | 6.4% |
| Business | 76 | 25.7% |
| Education | 14 | 4.7% |
| Literature & Languages | 26 | 8.8% |
| Liberal Arts & History | 13 | 4.4% |
| Visual & Performing Arts | 10 | 3.4% |
| Communications | 27 | 9.1% |
| Arts & Humanities | 4 | 1.3% |
| Total | 296 | 100.0% |
Transportation & Commute in Norbourne Estates
Vehicle Availability by Sex in Norbourne Estates
The most prevalent vehicle ownership categories in Norbourne Estates are males with 2 vehicles (69, accounting for 59.0%) and females with 2 vehicles (58, making up 73.4%).
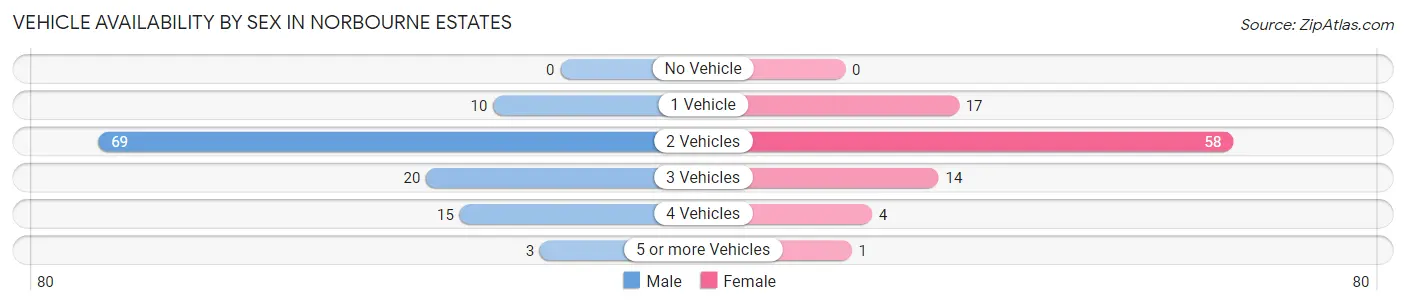
| Vehicles Available | Male | Female |
| No Vehicle | 0 (0.0%) | 0 (0.0%) |
| 1 Vehicle | 10 (8.6%) | 17 (18.1%) |
| 2 Vehicles | 69 (59.0%) | 58 (61.7%) |
| 3 Vehicles | 20 (17.1%) | 14 (14.9%) |
| 4 Vehicles | 15 (12.8%) | 4 (4.3%) |
| 5 or more Vehicles | 3 (2.6%) | 1 (1.1%) |
| Total | 117 (100.0%) | 94 (100.0%) |
Commute Time in Norbourne Estates
The most frequently occuring commute durations in Norbourne Estates are 15 to 19 minutes (50 commuters, 27.3%), 5 to 9 minutes (44 commuters, 24.0%), and 20 to 24 minutes (27 commuters, 14.7%).
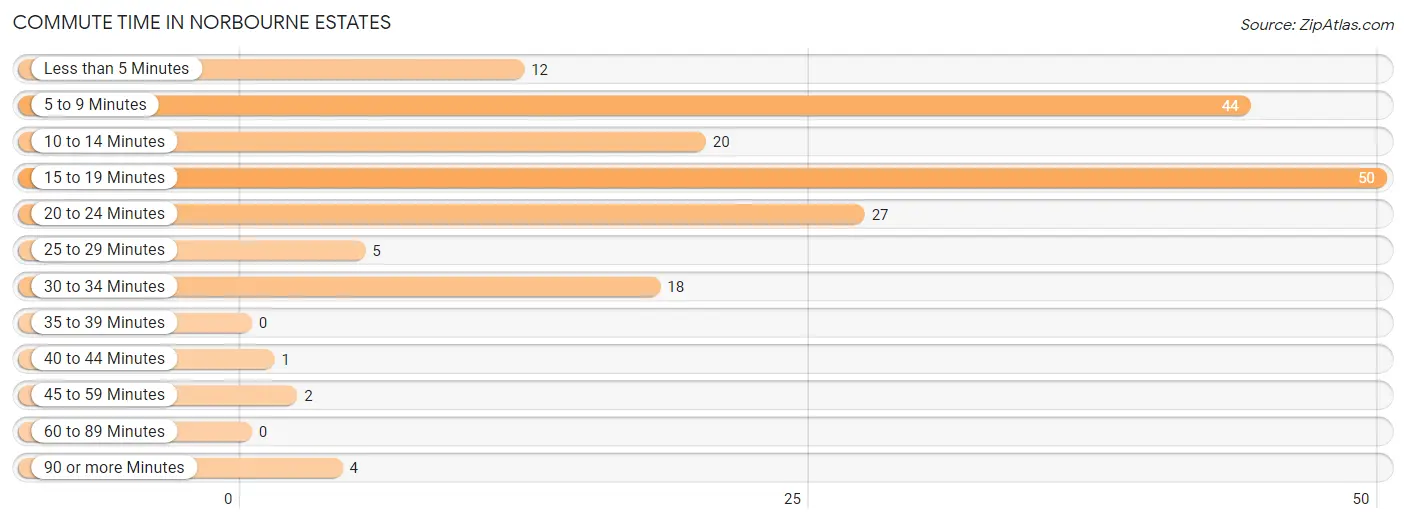
| Commute Time | # Commuters | % Commuters |
| Less than 5 Minutes | 12 | 6.6% |
| 5 to 9 Minutes | 44 | 24.0% |
| 10 to 14 Minutes | 20 | 10.9% |
| 15 to 19 Minutes | 50 | 27.3% |
| 20 to 24 Minutes | 27 | 14.7% |
| 25 to 29 Minutes | 5 | 2.7% |
| 30 to 34 Minutes | 18 | 9.8% |
| 35 to 39 Minutes | 0 | 0.0% |
| 40 to 44 Minutes | 1 | 0.5% |
| 45 to 59 Minutes | 2 | 1.1% |
| 60 to 89 Minutes | 0 | 0.0% |
| 90 or more Minutes | 4 | 2.2% |
Commute Time by Sex in Norbourne Estates
The most common commute times in Norbourne Estates are 15 to 19 minutes (26 commuters, 24.8%) for males and 5 to 9 minutes (24 commuters, 30.8%) for females.
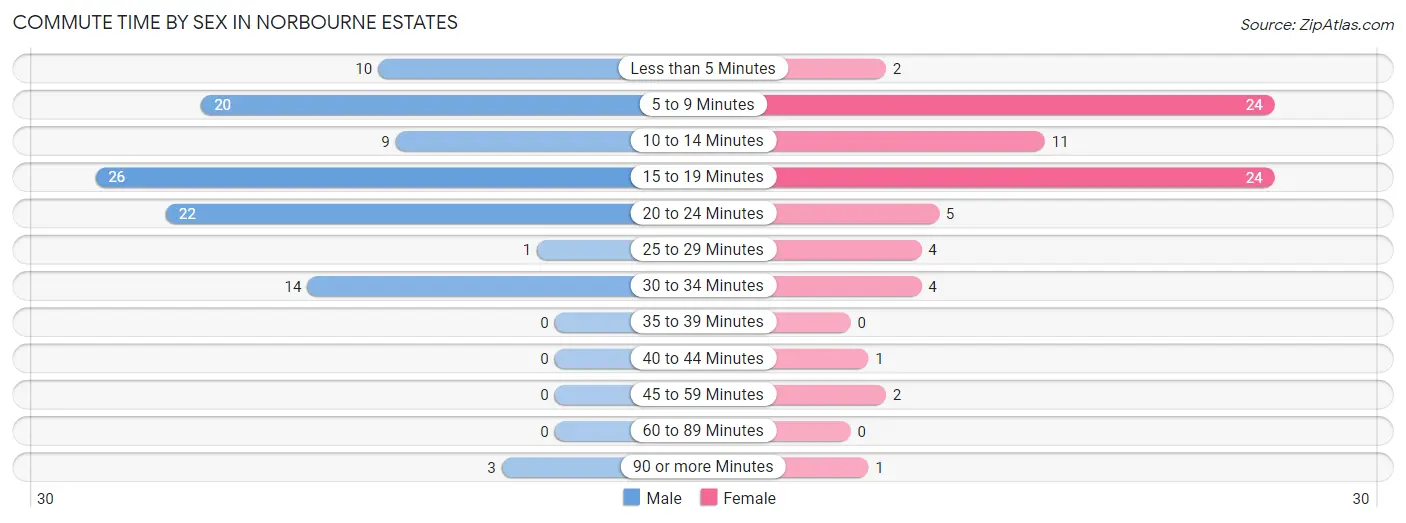
| Commute Time | Male | Female |
| Less than 5 Minutes | 10 (9.5%) | 2 (2.6%) |
| 5 to 9 Minutes | 20 (19.1%) | 24 (30.8%) |
| 10 to 14 Minutes | 9 (8.6%) | 11 (14.1%) |
| 15 to 19 Minutes | 26 (24.8%) | 24 (30.8%) |
| 20 to 24 Minutes | 22 (20.9%) | 5 (6.4%) |
| 25 to 29 Minutes | 1 (0.9%) | 4 (5.1%) |
| 30 to 34 Minutes | 14 (13.3%) | 4 (5.1%) |
| 35 to 39 Minutes | 0 (0.0%) | 0 (0.0%) |
| 40 to 44 Minutes | 0 (0.0%) | 1 (1.3%) |
| 45 to 59 Minutes | 0 (0.0%) | 2 (2.6%) |
| 60 to 89 Minutes | 0 (0.0%) | 0 (0.0%) |
| 90 or more Minutes | 3 (2.9%) | 1 (1.3%) |
Time of Departure to Work by Sex in Norbourne Estates
The most frequent times of departure to work in Norbourne Estates are 8:30 AM to 8:59 AM (27, 25.7%) for males and 8:00 AM to 8:29 AM (20, 25.6%) for females.
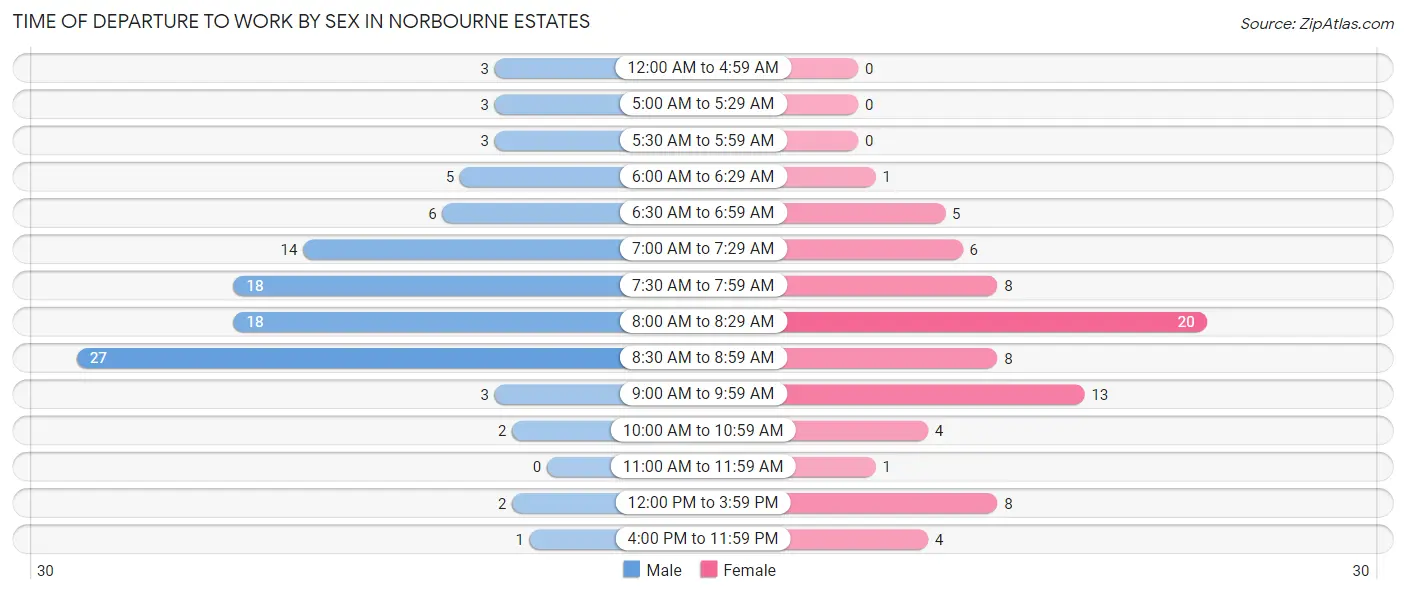
| Time of Departure | Male | Female |
| 12:00 AM to 4:59 AM | 3 (2.9%) | 0 (0.0%) |
| 5:00 AM to 5:29 AM | 3 (2.9%) | 0 (0.0%) |
| 5:30 AM to 5:59 AM | 3 (2.9%) | 0 (0.0%) |
| 6:00 AM to 6:29 AM | 5 (4.8%) | 1 (1.3%) |
| 6:30 AM to 6:59 AM | 6 (5.7%) | 5 (6.4%) |
| 7:00 AM to 7:29 AM | 14 (13.3%) | 6 (7.7%) |
| 7:30 AM to 7:59 AM | 18 (17.1%) | 8 (10.3%) |
| 8:00 AM to 8:29 AM | 18 (17.1%) | 20 (25.6%) |
| 8:30 AM to 8:59 AM | 27 (25.7%) | 8 (10.3%) |
| 9:00 AM to 9:59 AM | 3 (2.9%) | 13 (16.7%) |
| 10:00 AM to 10:59 AM | 2 (1.9%) | 4 (5.1%) |
| 11:00 AM to 11:59 AM | 0 (0.0%) | 1 (1.3%) |
| 12:00 PM to 3:59 PM | 2 (1.9%) | 8 (10.3%) |
| 4:00 PM to 11:59 PM | 1 (0.9%) | 4 (5.1%) |
| Total | 105 (100.0%) | 78 (100.0%) |
Housing Occupancy in Norbourne Estates
Occupancy by Ownership in Norbourne Estates
Of the total 180 dwellings in Norbourne Estates, owner-occupied units account for 174 (96.7%), while renter-occupied units make up 6 (3.3%).
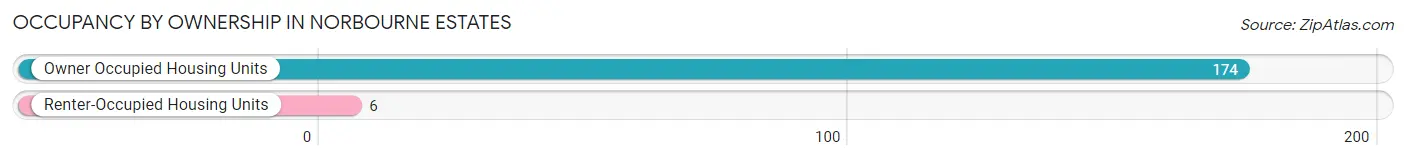
| Occupancy | # Housing Units | % Housing Units |
| Owner Occupied Housing Units | 174 | 96.7% |
| Renter-Occupied Housing Units | 6 | 3.3% |
| Total Occupied Housing Units | 180 | 100.0% |
Occupancy by Household Size in Norbourne Estates
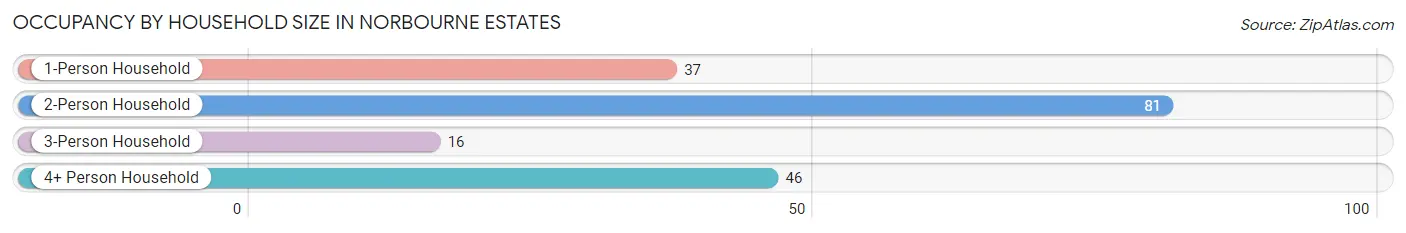
| Household Size | # Housing Units | % Housing Units |
| 1-Person Household | 37 | 20.6% |
| 2-Person Household | 81 | 45.0% |
| 3-Person Household | 16 | 8.9% |
| 4+ Person Household | 46 | 25.6% |
| Total Housing Units | 180 | 100.0% |
Occupancy by Ownership by Household Size in Norbourne Estates
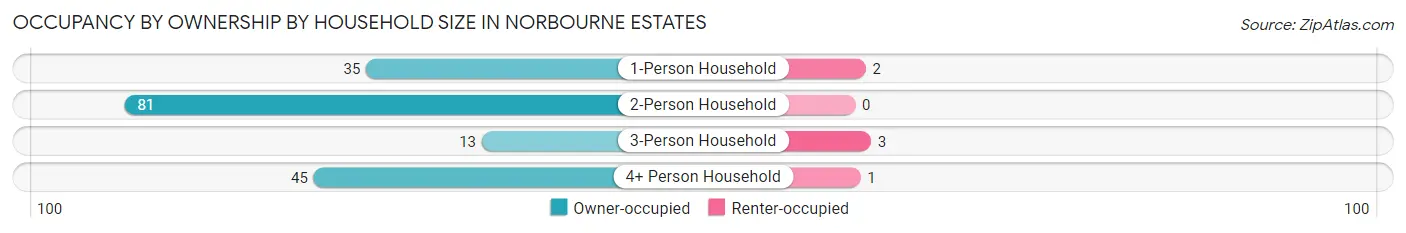
| Household Size | Owner-occupied | Renter-occupied |
| 1-Person Household | 35 (94.6%) | 2 (5.4%) |
| 2-Person Household | 81 (100.0%) | 0 (0.0%) |
| 3-Person Household | 13 (81.2%) | 3 (18.8%) |
| 4+ Person Household | 45 (97.8%) | 1 (2.2%) |
| Total Housing Units | 174 (96.7%) | 6 (3.3%) |
Occupancy by Educational Attainment in Norbourne Estates
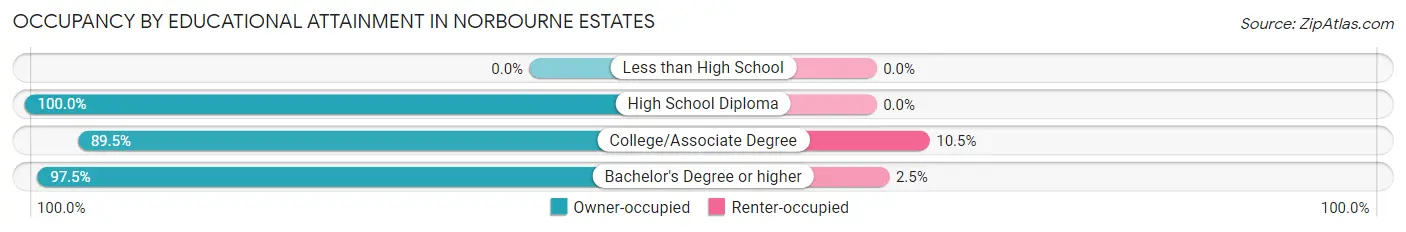
| Household Size | Owner-occupied | Renter-occupied |
| Less than High School | 0 (0.0%) | 0 (0.0%) |
| High School Diploma | 3 (100.0%) | 0 (0.0%) |
| College/Associate Degree | 17 (89.5%) | 2 (10.5%) |
| Bachelor's Degree or higher | 154 (97.5%) | 4 (2.5%) |
Occupancy by Age of Householder in Norbourne Estates
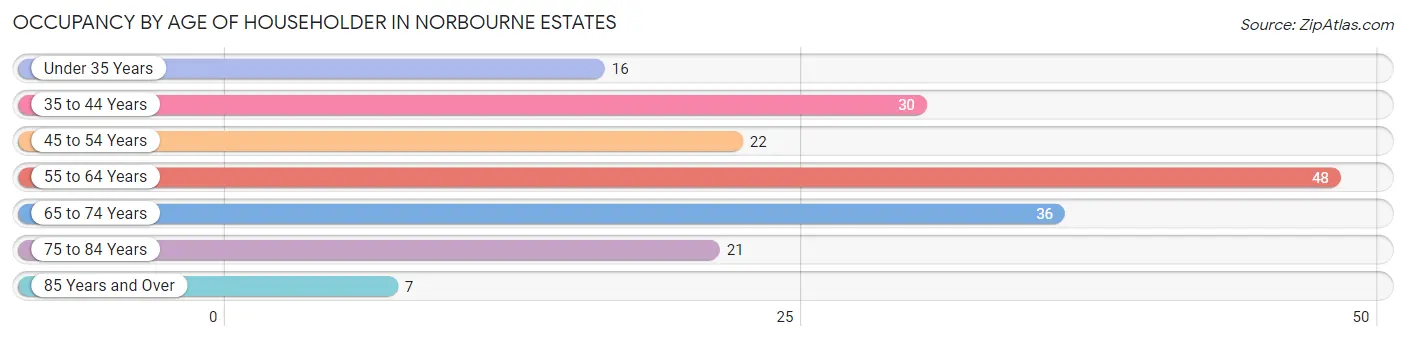
| Age Bracket | # Households | % Households |
| Under 35 Years | 16 | 8.9% |
| 35 to 44 Years | 30 | 16.7% |
| 45 to 54 Years | 22 | 12.2% |
| 55 to 64 Years | 48 | 26.7% |
| 65 to 74 Years | 36 | 20.0% |
| 75 to 84 Years | 21 | 11.7% |
| 85 Years and Over | 7 | 3.9% |
| Total | 180 | 100.0% |
Housing Finances in Norbourne Estates
Median Income by Occupancy in Norbourne Estates
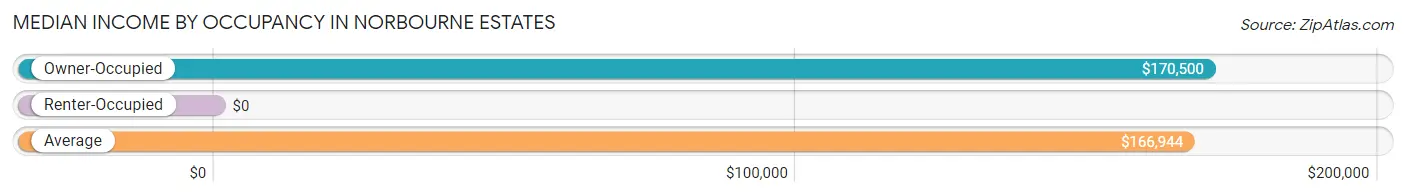
| Occupancy Type | # Households | Median Income |
| Owner-Occupied | 174 (96.7%) | $170,500 |
| Renter-Occupied | 6 (3.3%) | $0 |
| Average | 180 (100.0%) | $166,944 |
Occupancy by Householder Income Bracket in Norbourne Estates
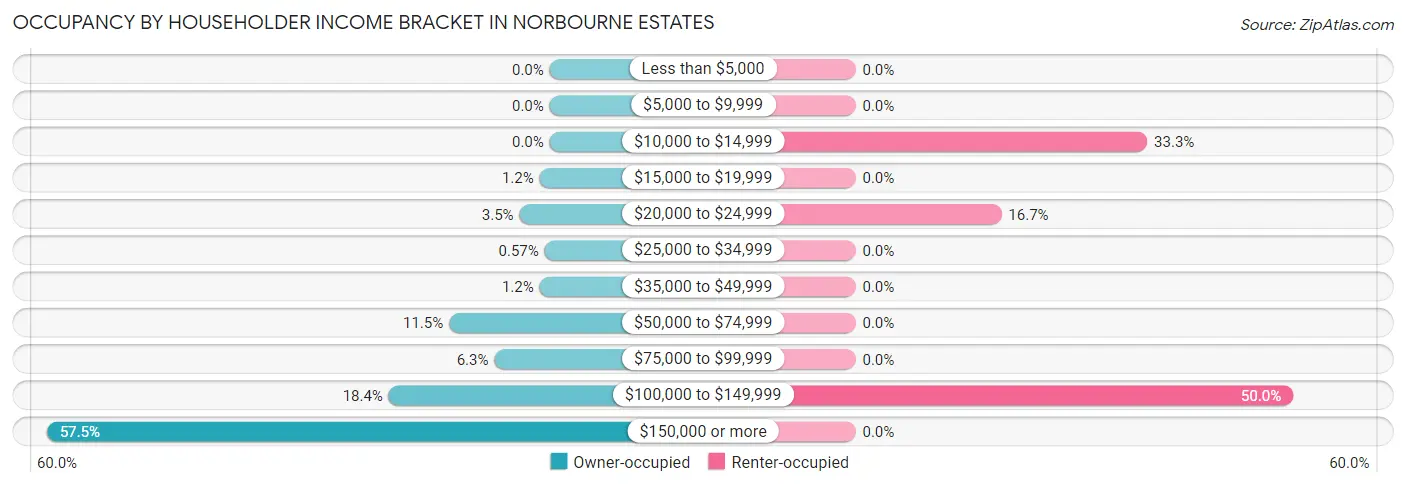
| Income Bracket | Owner-occupied | Renter-occupied |
| Less than $5,000 | 0 (0.0%) | 0 (0.0%) |
| $5,000 to $9,999 | 0 (0.0%) | 0 (0.0%) |
| $10,000 to $14,999 | 0 (0.0%) | 2 (33.3%) |
| $15,000 to $19,999 | 2 (1.1%) | 0 (0.0%) |
| $20,000 to $24,999 | 6 (3.5%) | 1 (16.7%) |
| $25,000 to $34,999 | 1 (0.6%) | 0 (0.0%) |
| $35,000 to $49,999 | 2 (1.1%) | 0 (0.0%) |
| $50,000 to $74,999 | 20 (11.5%) | 0 (0.0%) |
| $75,000 to $99,999 | 11 (6.3%) | 0 (0.0%) |
| $100,000 to $149,999 | 32 (18.4%) | 3 (50.0%) |
| $150,000 or more | 100 (57.5%) | 0 (0.0%) |
| Total | 174 (100.0%) | 6 (100.0%) |
Monthly Housing Cost Tiers in Norbourne Estates
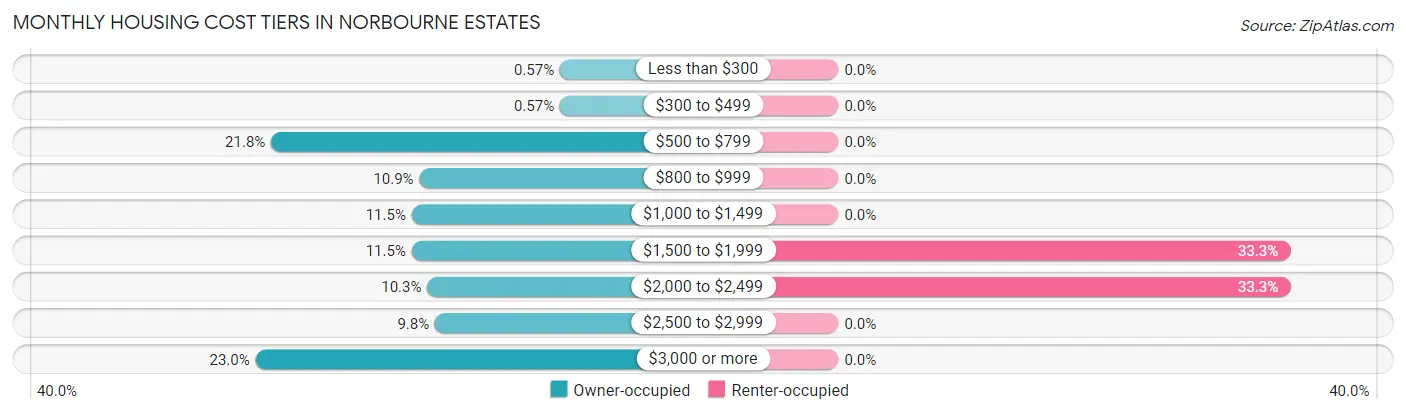
| Monthly Cost | Owner-occupied | Renter-occupied |
| Less than $300 | 1 (0.6%) | 0 (0.0%) |
| $300 to $499 | 1 (0.6%) | 0 (0.0%) |
| $500 to $799 | 38 (21.8%) | 0 (0.0%) |
| $800 to $999 | 19 (10.9%) | 0 (0.0%) |
| $1,000 to $1,499 | 20 (11.5%) | 0 (0.0%) |
| $1,500 to $1,999 | 20 (11.5%) | 2 (33.3%) |
| $2,000 to $2,499 | 18 (10.3%) | 2 (33.3%) |
| $2,500 to $2,999 | 17 (9.8%) | 0 (0.0%) |
| $3,000 or more | 40 (23.0%) | 0 (0.0%) |
| Total | 174 (100.0%) | 6 (100.0%) |
Physical Housing Characteristics in Norbourne Estates
Housing Structures in Norbourne Estates
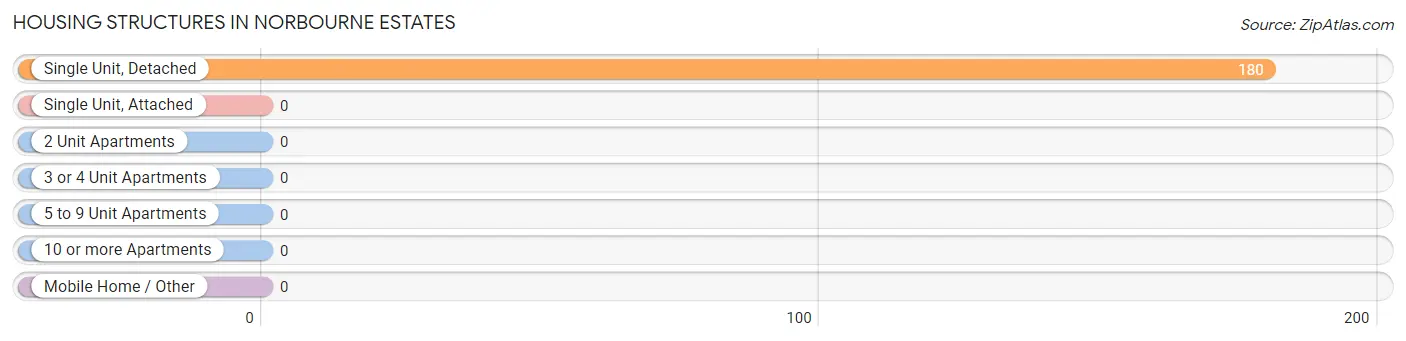
| Structure Type | # Housing Units | % Housing Units |
| Single Unit, Detached | 180 | 100.0% |
| Single Unit, Attached | 0 | 0.0% |
| 2 Unit Apartments | 0 | 0.0% |
| 3 or 4 Unit Apartments | 0 | 0.0% |
| 5 to 9 Unit Apartments | 0 | 0.0% |
| 10 or more Apartments | 0 | 0.0% |
| Mobile Home / Other | 0 | 0.0% |
| Total | 180 | 100.0% |
Housing Structures by Occupancy in Norbourne Estates
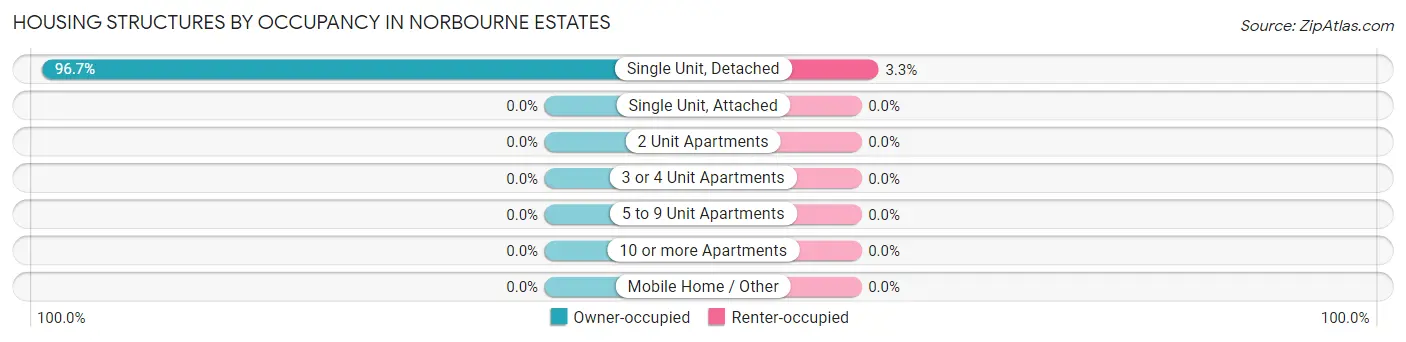
| Structure Type | Owner-occupied | Renter-occupied |
| Single Unit, Detached | 174 (96.7%) | 6 (3.3%) |
| Single Unit, Attached | 0 (0.0%) | 0 (0.0%) |
| 2 Unit Apartments | 0 (0.0%) | 0 (0.0%) |
| 3 or 4 Unit Apartments | 0 (0.0%) | 0 (0.0%) |
| 5 to 9 Unit Apartments | 0 (0.0%) | 0 (0.0%) |
| 10 or more Apartments | 0 (0.0%) | 0 (0.0%) |
| Mobile Home / Other | 0 (0.0%) | 0 (0.0%) |
| Total | 174 (96.7%) | 6 (3.3%) |
Housing Structures by Number of Rooms in Norbourne Estates
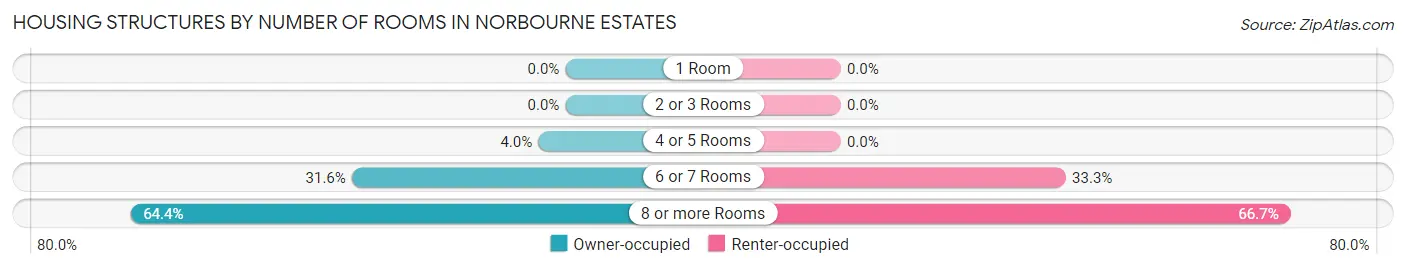
| Number of Rooms | Owner-occupied | Renter-occupied |
| 1 Room | 0 (0.0%) | 0 (0.0%) |
| 2 or 3 Rooms | 0 (0.0%) | 0 (0.0%) |
| 4 or 5 Rooms | 7 (4.0%) | 0 (0.0%) |
| 6 or 7 Rooms | 55 (31.6%) | 2 (33.3%) |
| 8 or more Rooms | 112 (64.4%) | 4 (66.7%) |
| Total | 174 (100.0%) | 6 (100.0%) |
Housing Structure by Heating Type in Norbourne Estates
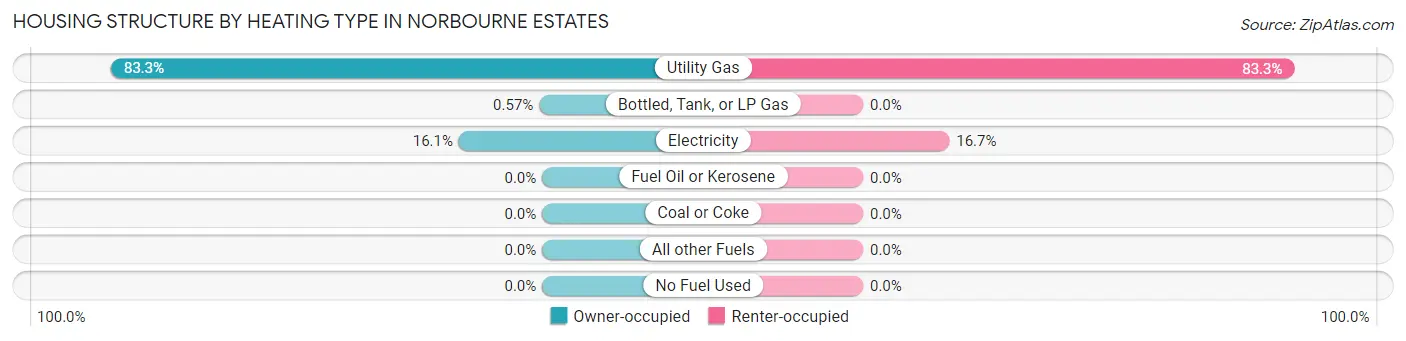
| Heating Type | Owner-occupied | Renter-occupied |
| Utility Gas | 145 (83.3%) | 5 (83.3%) |
| Bottled, Tank, or LP Gas | 1 (0.6%) | 0 (0.0%) |
| Electricity | 28 (16.1%) | 1 (16.7%) |
| Fuel Oil or Kerosene | 0 (0.0%) | 0 (0.0%) |
| Coal or Coke | 0 (0.0%) | 0 (0.0%) |
| All other Fuels | 0 (0.0%) | 0 (0.0%) |
| No Fuel Used | 0 (0.0%) | 0 (0.0%) |
| Total | 174 (100.0%) | 6 (100.0%) |
Household Vehicle Usage in Norbourne Estates
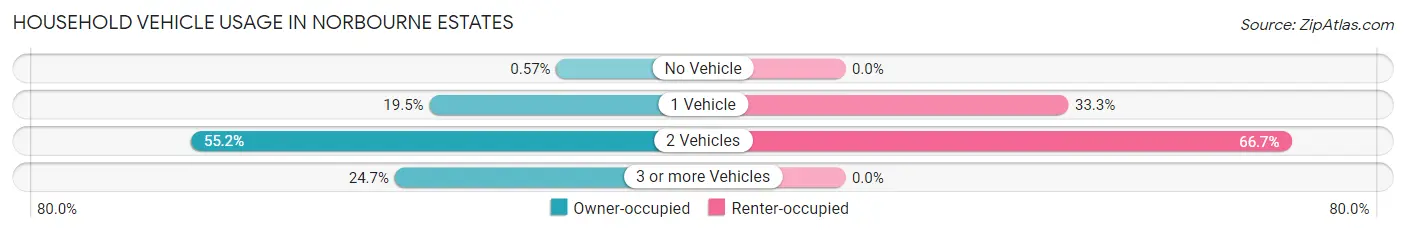
| Vehicles per Household | Owner-occupied | Renter-occupied |
| No Vehicle | 1 (0.6%) | 0 (0.0%) |
| 1 Vehicle | 34 (19.5%) | 2 (33.3%) |
| 2 Vehicles | 96 (55.2%) | 4 (66.7%) |
| 3 or more Vehicles | 43 (24.7%) | 0 (0.0%) |
| Total | 174 (100.0%) | 6 (100.0%) |
Real Estate & Mortgages in Norbourne Estates
Real Estate and Mortgage Overview in Norbourne Estates
| Characteristic | Without Mortgage | With Mortgage |
| Housing Units | 71 | 103 |
| Median Property Value | $578,100 | $592,900 |
| Median Household Income | $141,875 | $70 |
| Monthly Housing Costs | $784 | $40 |
| Real Estate Taxes | $3,881 | $1 |
Property Value by Mortgage Status in Norbourne Estates
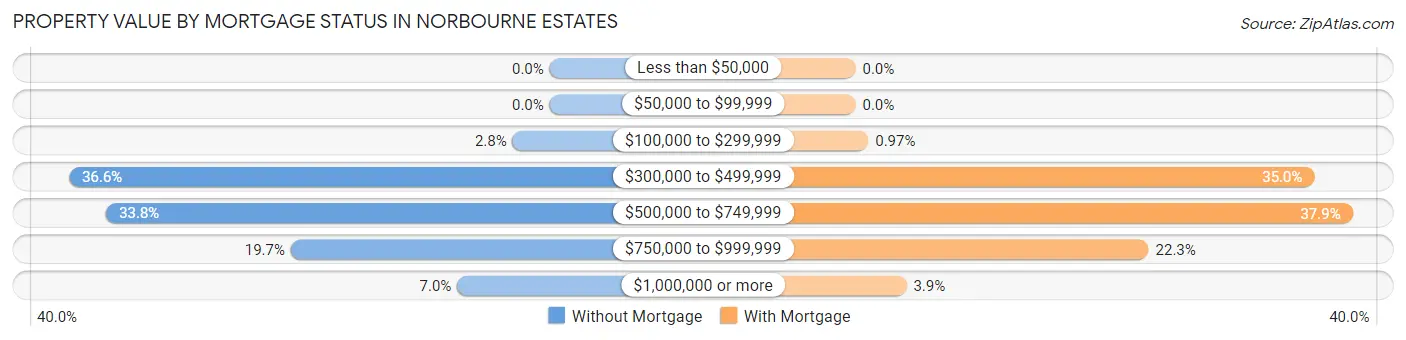
| Property Value | Without Mortgage | With Mortgage |
| Less than $50,000 | 0 (0.0%) | 0 (0.0%) |
| $50,000 to $99,999 | 0 (0.0%) | 0 (0.0%) |
| $100,000 to $299,999 | 2 (2.8%) | 1 (1.0%) |
| $300,000 to $499,999 | 26 (36.6%) | 36 (34.9%) |
| $500,000 to $749,999 | 24 (33.8%) | 39 (37.9%) |
| $750,000 to $999,999 | 14 (19.7%) | 23 (22.3%) |
| $1,000,000 or more | 5 (7.0%) | 4 (3.9%) |
| Total | 71 (100.0%) | 103 (100.0%) |
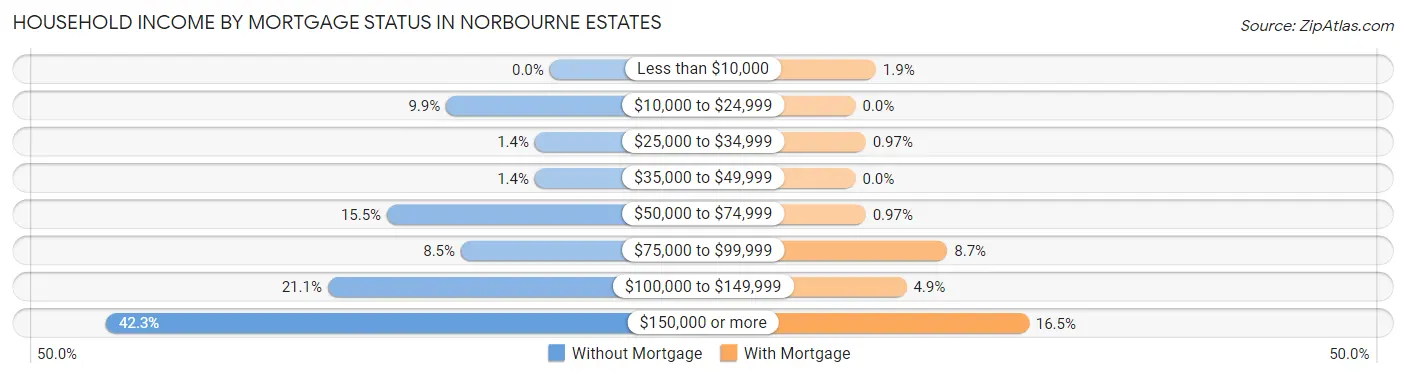
Household Income by Mortgage Status in Norbourne Estates
| Household Income | Without Mortgage | With Mortgage |
| Less than $10,000 | 0 (0.0%) | 2 (1.9%) |
| $10,000 to $24,999 | 7 (9.9%) | 0 (0.0%) |
| $25,000 to $34,999 | 1 (1.4%) | 1 (1.0%) |
| $35,000 to $49,999 | 1 (1.4%) | 0 (0.0%) |
| $50,000 to $74,999 | 11 (15.5%) | 1 (1.0%) |
| $75,000 to $99,999 | 6 (8.5%) | 9 (8.7%) |
| $100,000 to $149,999 | 15 (21.1%) | 5 (4.9%) |
| $150,000 or more | 30 (42.2%) | 17 (16.5%) |
| Total | 71 (100.0%) | 103 (100.0%) |
Property Value to Household Income Ratio in Norbourne Estates
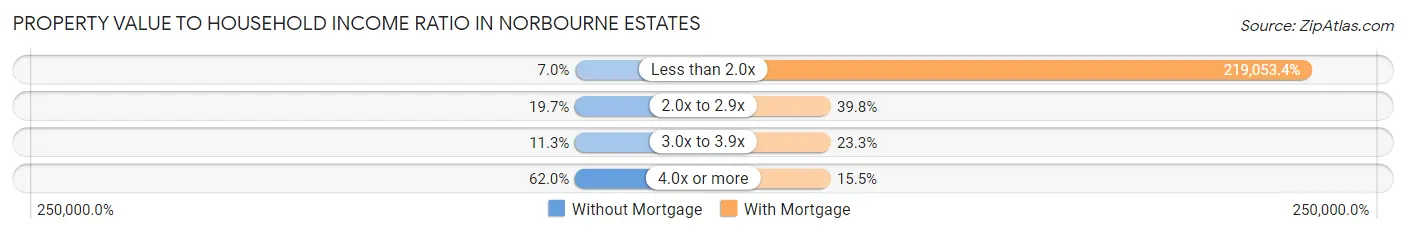
| Value-to-Income Ratio | Without Mortgage | With Mortgage |
| Less than 2.0x | 5 (7.0%) | 225,625 (219,053.4%) |
| 2.0x to 2.9x | 14 (19.7%) | 41 (39.8%) |
| 3.0x to 3.9x | 8 (11.3%) | 24 (23.3%) |
| 4.0x or more | 44 (62.0%) | 16 (15.5%) |
| Total | 71 (100.0%) | 103 (100.0%) |
Real Estate Taxes by Mortgage Status in Norbourne Estates
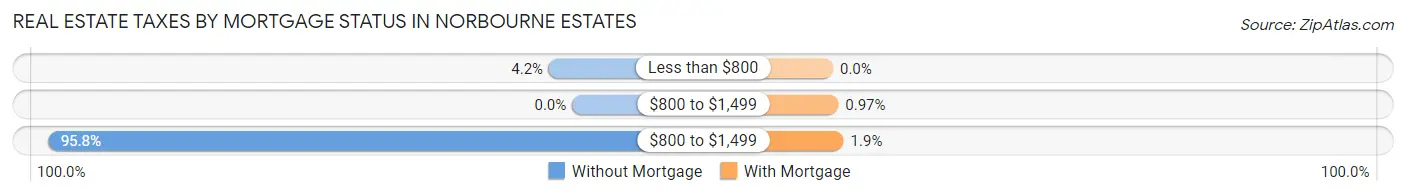
| Property Taxes | Without Mortgage | With Mortgage |
| Less than $800 | 3 (4.2%) | 0 (0.0%) |
| $800 to $1,499 | 0 (0.0%) | 1 (1.0%) |
| $800 to $1,499 | 68 (95.8%) | 2 (1.9%) |
| Total | 71 (100.0%) | 103 (100.0%) |
Health & Disability in Norbourne Estates
Health Insurance Coverage by Age in Norbourne Estates
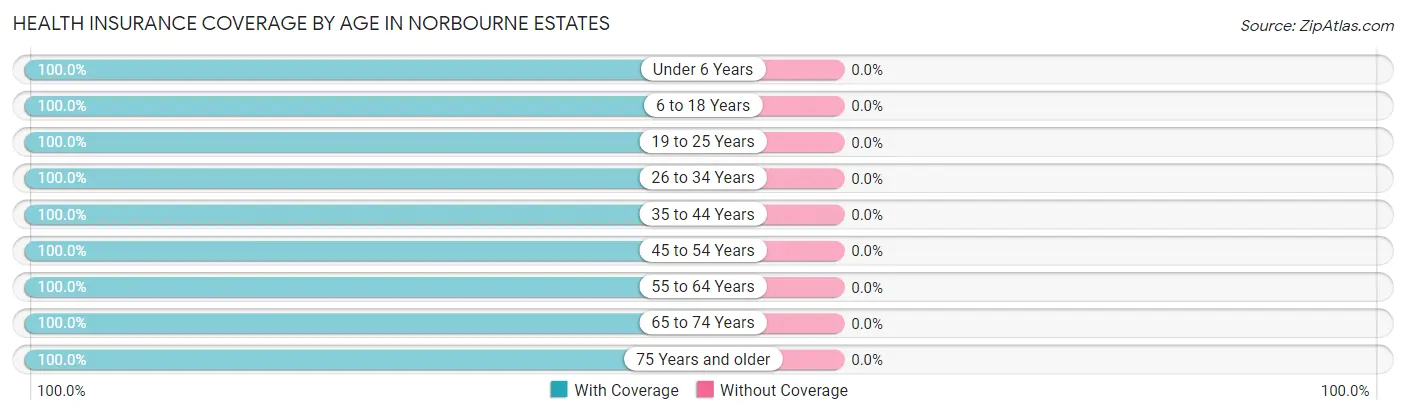
| Age Bracket | With Coverage | Without Coverage |
| Under 6 Years | 48 (100.0%) | 0 (0.0%) |
| 6 to 18 Years | 74 (100.0%) | 0 (0.0%) |
| 19 to 25 Years | 20 (100.0%) | 0 (0.0%) |
| 26 to 34 Years | 33 (100.0%) | 0 (0.0%) |
| 35 to 44 Years | 73 (100.0%) | 0 (0.0%) |
| 45 to 54 Years | 38 (100.0%) | 0 (0.0%) |
| 55 to 64 Years | 81 (100.0%) | 0 (0.0%) |
| 65 to 74 Years | 61 (100.0%) | 0 (0.0%) |
| 75 Years and older | 36 (100.0%) | 0 (0.0%) |
| Total | 464 (100.0%) | 0 (0.0%) |
Health Insurance Coverage by Citizenship Status in Norbourne Estates
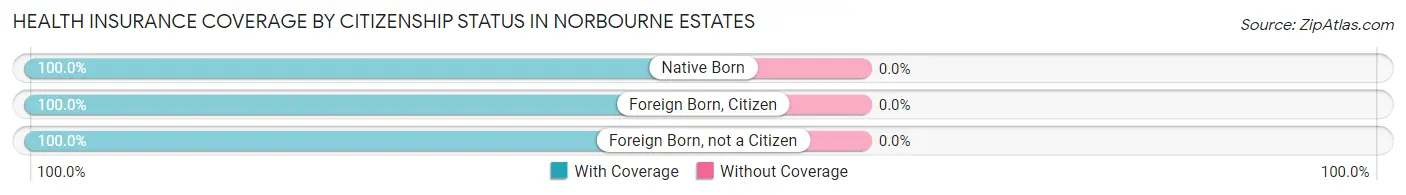
| Citizenship Status | With Coverage | Without Coverage |
| Native Born | 48 (100.0%) | 0 (0.0%) |
| Foreign Born, Citizen | 74 (100.0%) | 0 (0.0%) |
| Foreign Born, not a Citizen | 20 (100.0%) | 0 (0.0%) |
Health Insurance Coverage by Household Income in Norbourne Estates
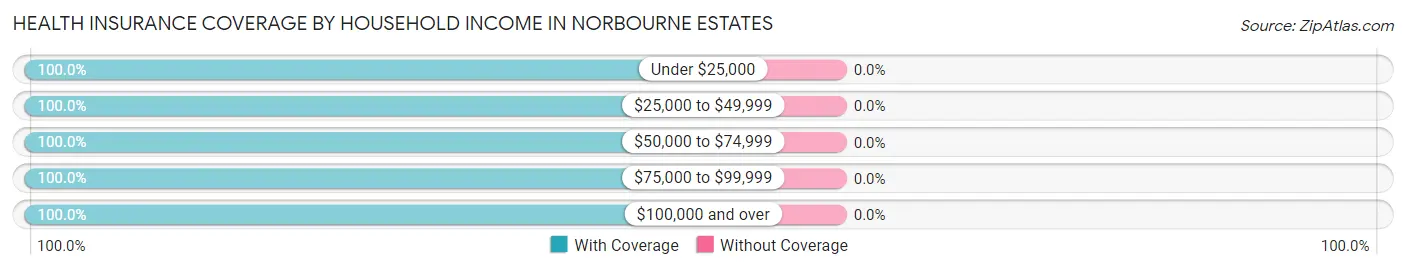
| Household Income | With Coverage | Without Coverage |
| Under $25,000 | 15 (100.0%) | 0 (0.0%) |
| $25,000 to $49,999 | 3 (100.0%) | 0 (0.0%) |
| $50,000 to $74,999 | 34 (100.0%) | 0 (0.0%) |
| $75,000 to $99,999 | 24 (100.0%) | 0 (0.0%) |
| $100,000 and over | 388 (100.0%) | 0 (0.0%) |
Public vs Private Health Insurance Coverage by Age in Norbourne Estates
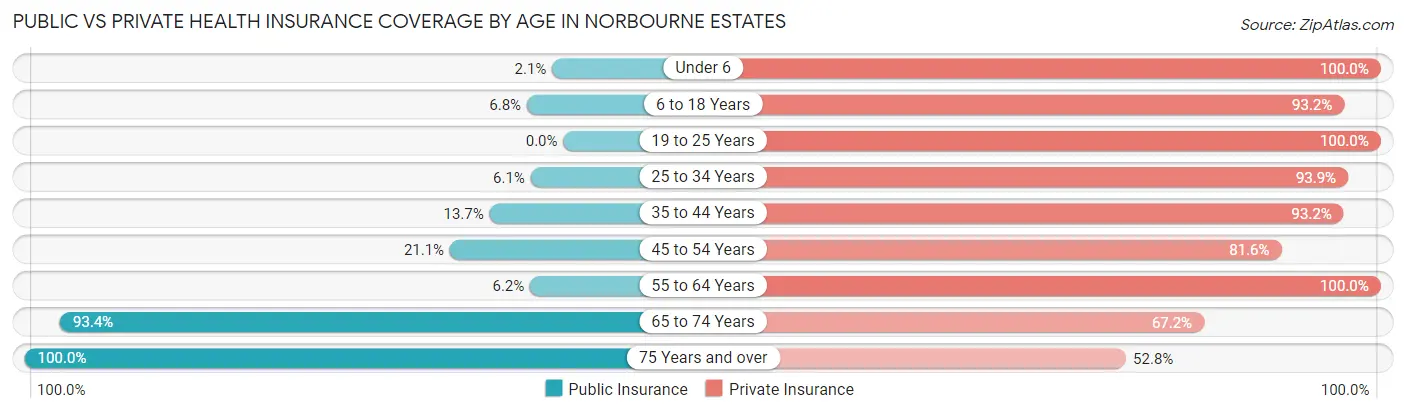
| Age Bracket | Public Insurance | Private Insurance |
| Under 6 | 1 (2.1%) | 48 (100.0%) |
| 6 to 18 Years | 5 (6.8%) | 69 (93.2%) |
| 19 to 25 Years | 0 (0.0%) | 20 (100.0%) |
| 25 to 34 Years | 2 (6.1%) | 31 (93.9%) |
| 35 to 44 Years | 10 (13.7%) | 68 (93.1%) |
| 45 to 54 Years | 8 (21.0%) | 31 (81.6%) |
| 55 to 64 Years | 5 (6.2%) | 81 (100.0%) |
| 65 to 74 Years | 57 (93.4%) | 41 (67.2%) |
| 75 Years and over | 36 (100.0%) | 19 (52.8%) |
| Total | 124 (26.7%) | 408 (87.9%) |
Disability Status by Sex by Age in Norbourne Estates
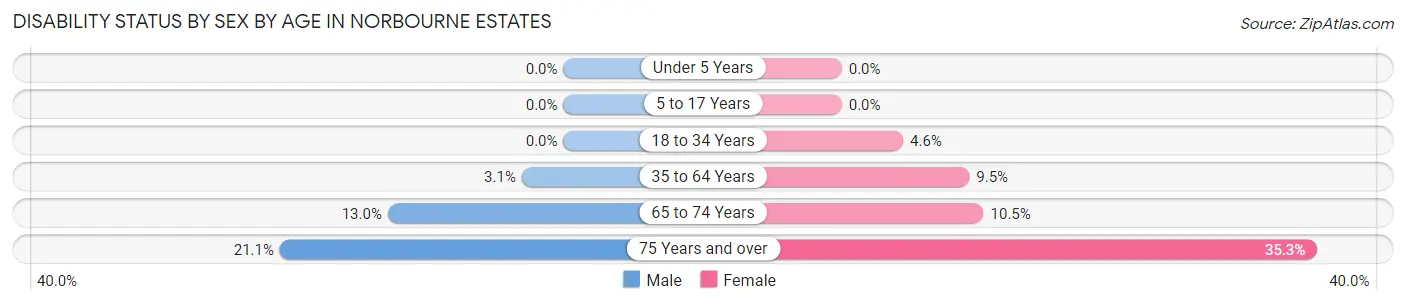
| Age Bracket | Male | Female |
| Under 5 Years | 0 (0.0%) | 0 (0.0%) |
| 5 to 17 Years | 0 (0.0%) | 0 (0.0%) |
| 18 to 34 Years | 0 (0.0%) | 2 (4.5%) |
| 35 to 64 Years | 3 (3.1%) | 9 (9.5%) |
| 65 to 74 Years | 3 (13.0%) | 4 (10.5%) |
| 75 Years and over | 4 (21.0%) | 6 (35.3%) |
Disability Class by Sex by Age in Norbourne Estates
Disability Class: Hearing Difficulty
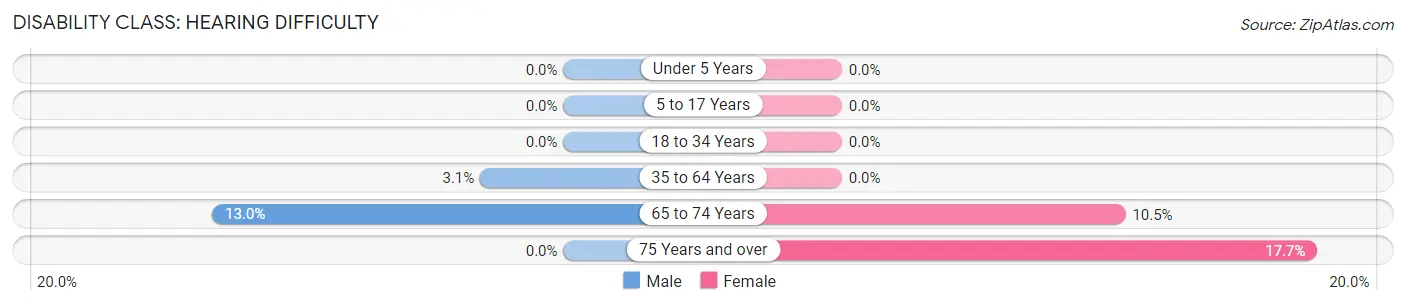
| Age Bracket | Male | Female |
| Under 5 Years | 0 (0.0%) | 0 (0.0%) |
| 5 to 17 Years | 0 (0.0%) | 0 (0.0%) |
| 18 to 34 Years | 0 (0.0%) | 0 (0.0%) |
| 35 to 64 Years | 3 (3.1%) | 0 (0.0%) |
| 65 to 74 Years | 3 (13.0%) | 4 (10.5%) |
| 75 Years and over | 0 (0.0%) | 3 (17.6%) |
Disability Class: Vision Difficulty
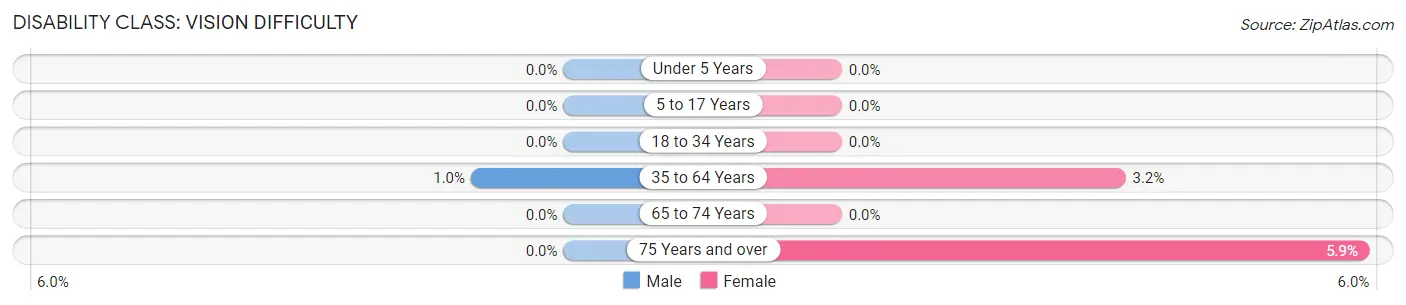
| Age Bracket | Male | Female |
| Under 5 Years | 0 (0.0%) | 0 (0.0%) |
| 5 to 17 Years | 0 (0.0%) | 0 (0.0%) |
| 18 to 34 Years | 0 (0.0%) | 0 (0.0%) |
| 35 to 64 Years | 1 (1.0%) | 3 (3.2%) |
| 65 to 74 Years | 0 (0.0%) | 0 (0.0%) |
| 75 Years and over | 0 (0.0%) | 1 (5.9%) |
Disability Class: Cognitive Difficulty
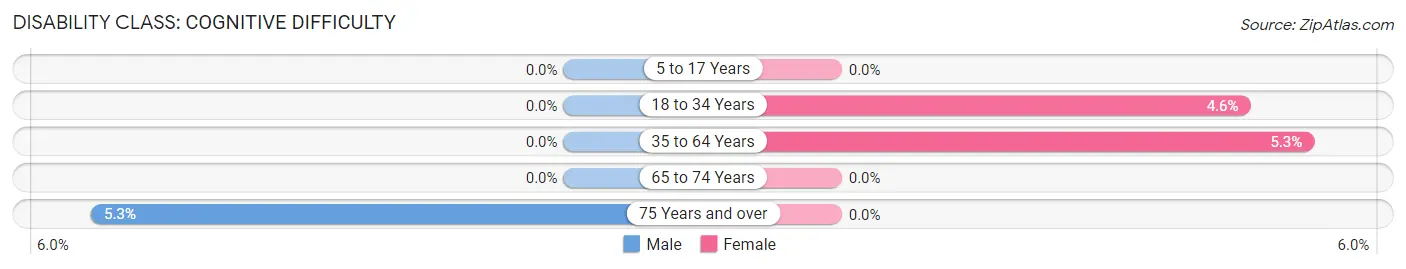
| Age Bracket | Male | Female |
| 5 to 17 Years | 0 (0.0%) | 0 (0.0%) |
| 18 to 34 Years | 0 (0.0%) | 2 (4.5%) |
| 35 to 64 Years | 0 (0.0%) | 5 (5.3%) |
| 65 to 74 Years | 0 (0.0%) | 0 (0.0%) |
| 75 Years and over | 1 (5.3%) | 0 (0.0%) |
Disability Class: Ambulatory Difficulty
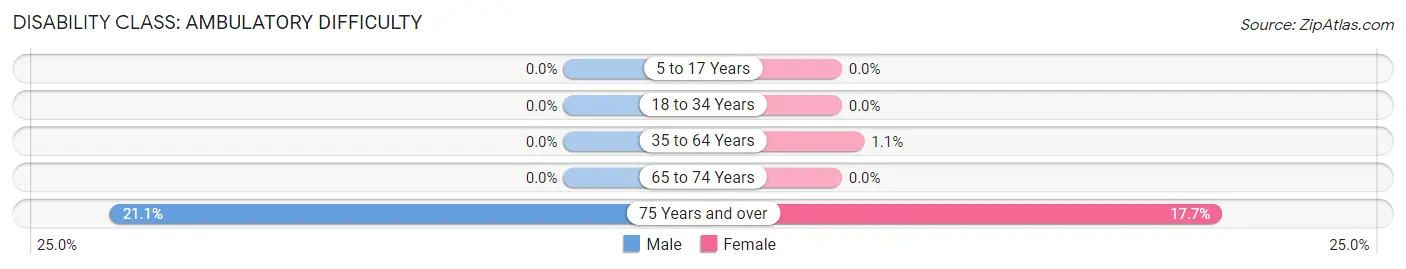
| Age Bracket | Male | Female |
| 5 to 17 Years | 0 (0.0%) | 0 (0.0%) |
| 18 to 34 Years | 0 (0.0%) | 0 (0.0%) |
| 35 to 64 Years | 0 (0.0%) | 1 (1.1%) |
| 65 to 74 Years | 0 (0.0%) | 0 (0.0%) |
| 75 Years and over | 4 (21.0%) | 3 (17.6%) |
Disability Class: Self-Care Difficulty
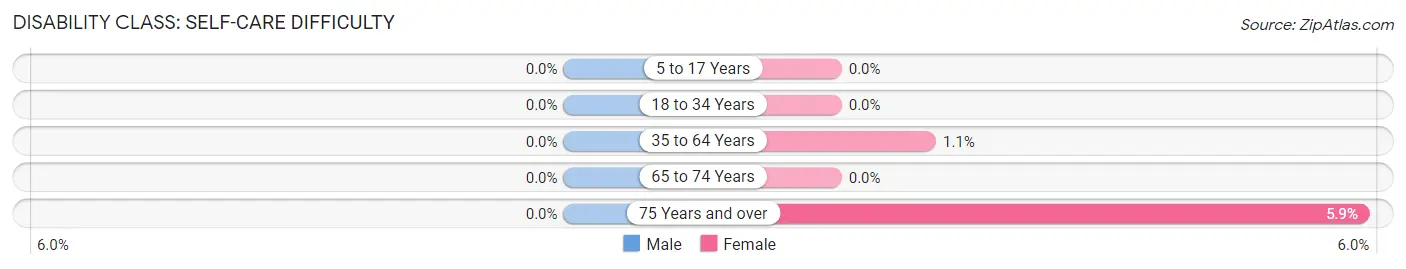
| Age Bracket | Male | Female |
| 5 to 17 Years | 0 (0.0%) | 0 (0.0%) |
| 18 to 34 Years | 0 (0.0%) | 0 (0.0%) |
| 35 to 64 Years | 0 (0.0%) | 1 (1.1%) |
| 65 to 74 Years | 0 (0.0%) | 0 (0.0%) |
| 75 Years and over | 0 (0.0%) | 1 (5.9%) |
Technology Access in Norbourne Estates
Computing Device Access in Norbourne Estates
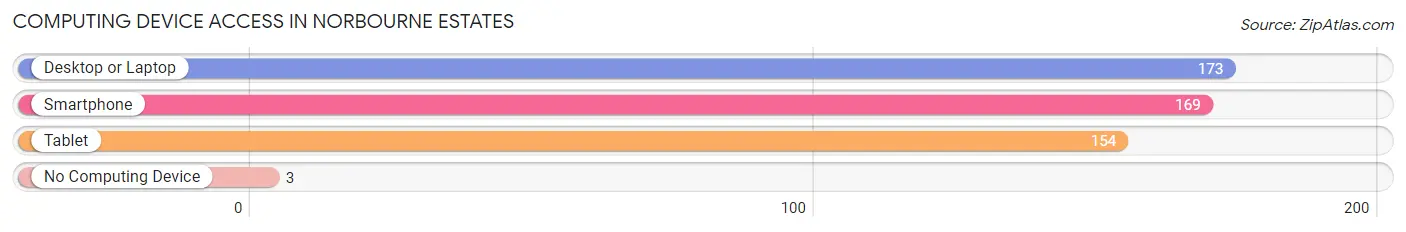
| Device Type | # Households | % Households |
| Desktop or Laptop | 173 | 96.1% |
| Smartphone | 169 | 93.9% |
| Tablet | 154 | 85.6% |
| No Computing Device | 3 | 1.7% |
| Total | 180 | 100.0% |
Internet Access in Norbourne Estates
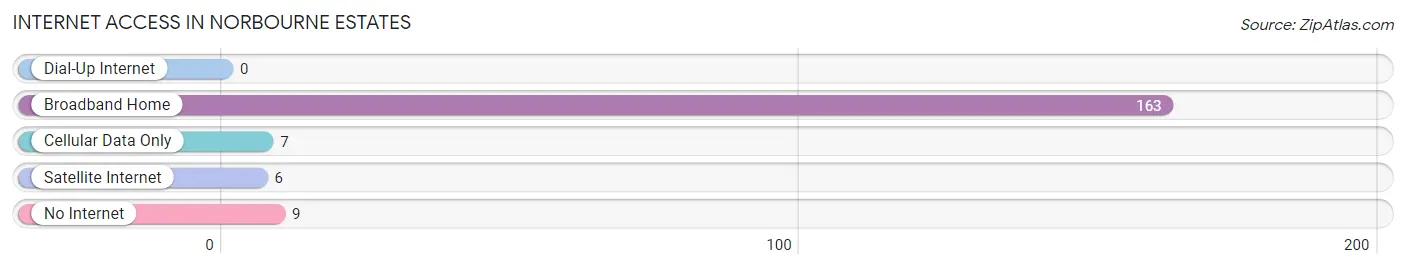
| Internet Type | # Households | % Households |
| Dial-Up Internet | 0 | 0.0% |
| Broadband Home | 163 | 90.6% |
| Cellular Data Only | 7 | 3.9% |
| Satellite Internet | 6 | 3.3% |
| No Internet | 9 | 5.0% |
| Total | 180 | 100.0% |
Norbourne Estates Summary
Norbourne Estates is a small, unincorporated community located in Jefferson County, Kentucky. It is situated just east of Louisville, the largest city in the state. The community is bordered by the cities of St. Matthews and Lyndon, and is part of the Louisville Metro area.
History
Norbourne Estates was founded in the early 1950s by developer William H. Hite. The community was originally intended to be a residential development, and was named after Hite’s wife, Norbourne. The development was planned to include a variety of housing styles, including single-family homes, townhouses, and apartments.
The community was initially successful, and by the mid-1960s, Norbourne Estates had become a popular destination for families looking for a suburban lifestyle. However, the community began to decline in the late 1960s and early 1970s due to a variety of factors, including the rise of crime in the area and the decline of the local economy.
By the 1980s, Norbourne Estates had become a predominantly low-income area, and the community was plagued by crime and poverty. In the 1990s, the community began to experience a resurgence, as new businesses and housing developments began to move into the area.
Geography
Norbourne Estates is located in Jefferson County, Kentucky, just east of Louisville. The community is bordered by the cities of St. Matthews and Lyndon, and is part of the Louisville Metro area. The community is situated on the banks of the Ohio River, and is located in a hilly area.
The climate in Norbourne Estates is humid subtropical, with hot, humid summers and mild winters. The average annual temperature is around 60 degrees Fahrenheit, and the average annual precipitation is around 45 inches.
Economy
The economy of Norbourne Estates is largely based on the service industry. The community is home to a variety of businesses, including restaurants, retail stores, and professional services. The community is also home to a number of manufacturing companies, including a furniture factory and a printing company.
The unemployment rate in Norbourne Estates is slightly higher than the national average, but the median household income is slightly lower than the national average. The median home value in the community is around $150,000, which is slightly higher than the national average.
Demographics
As of the 2010 census, the population of Norbourne Estates was 4,845. The racial makeup of the community was 79.3% White, 15.2% African American, 0.7% Asian, 0.2% Native American, and 4.6% from other races. The median age in the community was 37.7 years, and the median household income was $45,845.
The majority of the population in Norbourne Estates is employed in the service industry, and the community is home to a variety of businesses, including restaurants, retail stores, and professional services. The community is also home to a number of manufacturing companies, including a furniture factory and a printing company.
Conclusion
Norbourne Estates is a small, unincorporated community located in Jefferson County, Kentucky. It is situated just east of Louisville, the largest city in the state. The community was founded in the early 1950s by developer William H. Hite, and was originally intended to be a residential development. The community has experienced a resurgence in recent years, and is now home to a variety of businesses, including restaurants, retail stores, and professional services. The population of Norbourne Estates is 4,845, and the median household income is $45,845. The community is largely employed in the service industry, and is home to a number of manufacturing companies.
Common Questions
What is Per Capita Income in Norbourne Estates?
Per Capita income in Norbourne Estates is $82,347.
What is the Median Family Income in Norbourne Estates?
Median Family Income in Norbourne Estates is $189,583.
What is the Median Household income in Norbourne Estates?
Median Household Income in Norbourne Estates is $166,944.
What is Income or Wage Gap in Norbourne Estates?
Income or Wage Gap in Norbourne Estates is 40.1%.
Women in Norbourne Estates earn 59.9 cents for every dollar earned by a man.
What is Inequality or Gini Index in Norbourne Estates?
Inequality or Gini Index in Norbourne Estates is 0.42.
What is the Total Population of Norbourne Estates?
Total Population of Norbourne Estates is 464.
What is the Total Male Population of Norbourne Estates?
Total Male Population of Norbourne Estates is 216.
What is the Total Female Population of Norbourne Estates?
Total Female Population of Norbourne Estates is 248.
What is the Ratio of Males per 100 Females in Norbourne Estates?
There are 87.10 Males per 100 Females in Norbourne Estates.
What is the Ratio of Females per 100 Males in Norbourne Estates?
There are 114.81 Females per 100 Males in Norbourne Estates.
What is the Median Population Age in Norbourne Estates?
Median Population Age in Norbourne Estates is 41.7 Years.
What is the Average Family Size in Norbourne Estates
Average Family Size in Norbourne Estates is 2.9 People.
What is the Average Household Size in Norbourne Estates
Average Household Size in Norbourne Estates is 2.6 People.
How Large is the Labor Force in Norbourne Estates?
There are 215 People in the Labor Forcein in Norbourne Estates.
What is the Percentage of People in the Labor Force in Norbourne Estates?
58.0% of People are in the Labor Force in Norbourne Estates.
What is the Unemployment Rate in Norbourne Estates?
Unemployment Rate in Norbourne Estates is 1.9%.