New Castle, KY Map & Demographics
New Castle Map
New Castle Overview
$26,450
PER CAPITA INCOME
$63,750
AVG FAMILY INCOME
$38,594
AVG HOUSEHOLD INCOME
29.7%
WAGE / INCOME GAP [ % ]
70.3¢/ $1
WAGE / INCOME GAP [ $ ]
0.43
INEQUALITY / GINI INDEX
880
TOTAL POPULATION
372
MALE POPULATION
508
FEMALE POPULATION
73.23
MALES / 100 FEMALES
136.56
FEMALES / 100 MALES
52.1
MEDIAN AGE
2.7
AVG FAMILY SIZE
2.0
AVG HOUSEHOLD SIZE
348
LABOR FORCE [ PEOPLE ]
45.1%
PERCENT IN LABOR FORCE
4.9%
UNEMPLOYMENT RATE
New Castle Zip Codes
New Castle Area Codes
Income in New Castle
Income Overview in New Castle
Per Capita Income in New Castle is $26,450, while median incomes of families and households are $63,750 and $38,594 respectively.
| Characteristic | Number | Measure |
| Per Capita Income | 880 | $26,450 |
| Median Family Income | 203 | $63,750 |
| Mean Family Income | 203 | $72,067 |
| Median Household Income | 405 | $38,594 |
| Mean Household Income | 405 | $51,746 |
| Income Deficit | 203 | $0 |
| Wage / Income Gap (%) | 880 | 29.75% |
| Wage / Income Gap ($) | 880 | 70.25¢ per $1 |
| Gini / Inequality Index | 880 | 0.43 |
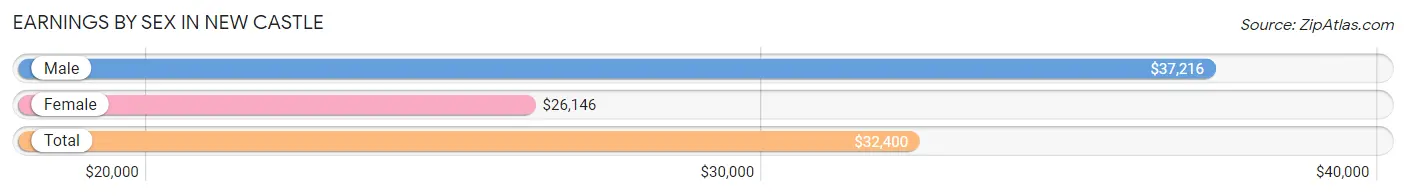
Earnings by Sex in New Castle
Average Earnings in New Castle are $32,400, $37,216 for men and $26,146 for women, a difference of 29.7%.
| Sex | Number | Average Earnings |
| Male | 185 (52.3%) | $37,216 |
| Female | 169 (47.7%) | $26,146 |
| Total | 354 (100.0%) | $32,400 |
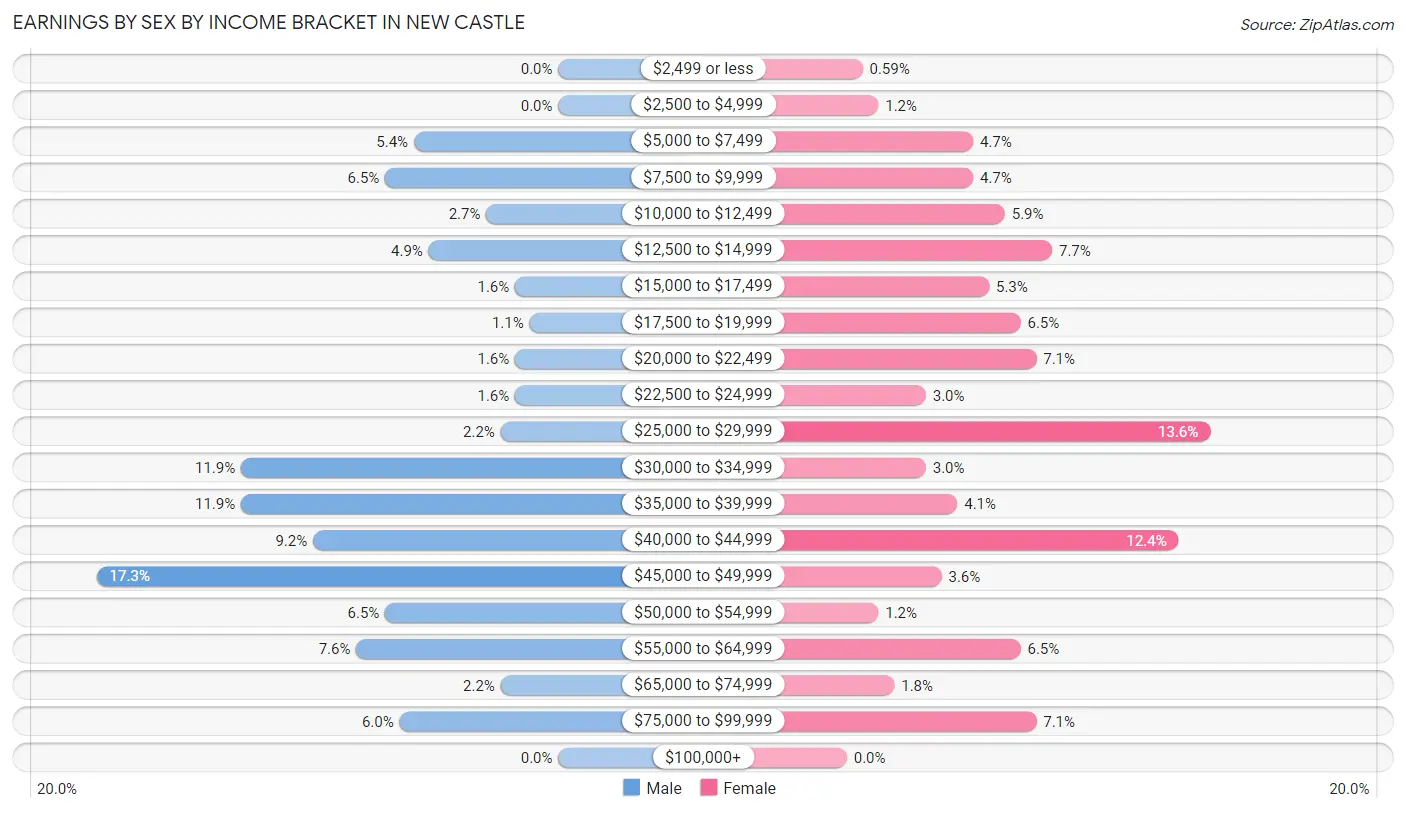
Earnings by Sex by Income Bracket in New Castle
The most common earnings brackets in New Castle are $45,000 to $49,999 for men (32 | 17.3%) and $25,000 to $29,999 for women (23 | 13.6%).
| Income | Male | Female |
| $2,499 or less | 0 (0.0%) | 1 (0.6%) |
| $2,500 to $4,999 | 0 (0.0%) | 2 (1.2%) |
| $5,000 to $7,499 | 10 (5.4%) | 8 (4.7%) |
| $7,500 to $9,999 | 12 (6.5%) | 8 (4.7%) |
| $10,000 to $12,499 | 5 (2.7%) | 10 (5.9%) |
| $12,500 to $14,999 | 9 (4.9%) | 13 (7.7%) |
| $15,000 to $17,499 | 3 (1.6%) | 9 (5.3%) |
| $17,500 to $19,999 | 2 (1.1%) | 11 (6.5%) |
| $20,000 to $22,499 | 3 (1.6%) | 12 (7.1%) |
| $22,500 to $24,999 | 3 (1.6%) | 5 (3.0%) |
| $25,000 to $29,999 | 4 (2.2%) | 23 (13.6%) |
| $30,000 to $34,999 | 22 (11.9%) | 5 (3.0%) |
| $35,000 to $39,999 | 22 (11.9%) | 7 (4.1%) |
| $40,000 to $44,999 | 17 (9.2%) | 21 (12.4%) |
| $45,000 to $49,999 | 32 (17.3%) | 6 (3.5%) |
| $50,000 to $54,999 | 12 (6.5%) | 2 (1.2%) |
| $55,000 to $64,999 | 14 (7.6%) | 11 (6.5%) |
| $65,000 to $74,999 | 4 (2.2%) | 3 (1.8%) |
| $75,000 to $99,999 | 11 (5.9%) | 12 (7.1%) |
| $100,000+ | 0 (0.0%) | 0 (0.0%) |
| Total | 185 (100.0%) | 169 (100.0%) |
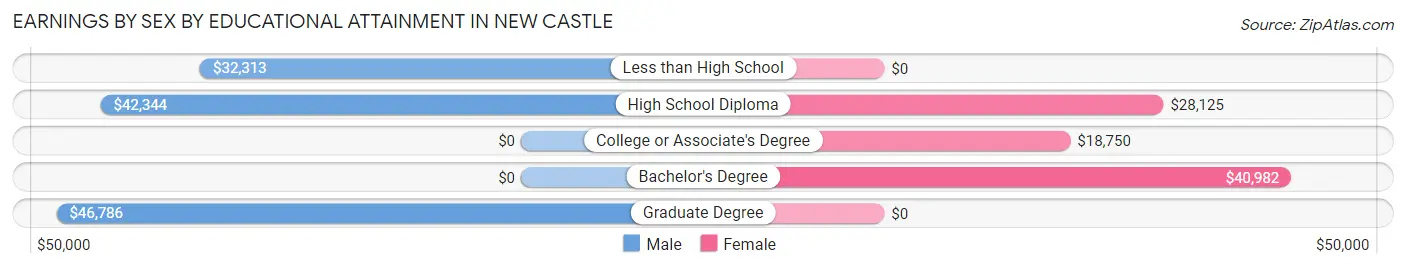
Earnings by Sex by Educational Attainment in New Castle
Average earnings in New Castle are $42,188 for men and $27,955 for women, a difference of 33.7%. Men with an educational attainment of graduate degree enjoy the highest average annual earnings of $46,786, while those with less than high school education earn the least with $32,313. Women with an educational attainment of bachelor's degree earn the most with the average annual earnings of $40,982, while those with college or associate's degree education have the smallest earnings of $18,750.
| Educational Attainment | Male Income | Female Income |
| Less than High School | $32,313 | $0 |
| High School Diploma | $42,344 | $28,125 |
| College or Associate's Degree | - | - |
| Bachelor's Degree | - | - |
| Graduate Degree | $46,786 | $0 |
| Total | $42,188 | $27,955 |
Family Income in New Castle
Family Income Brackets in New Castle
According to the New Castle family income data, there are 54 families falling into the $75,000 to $99,999 income range, which is the most common income bracket and makes up 26.6% of all families.
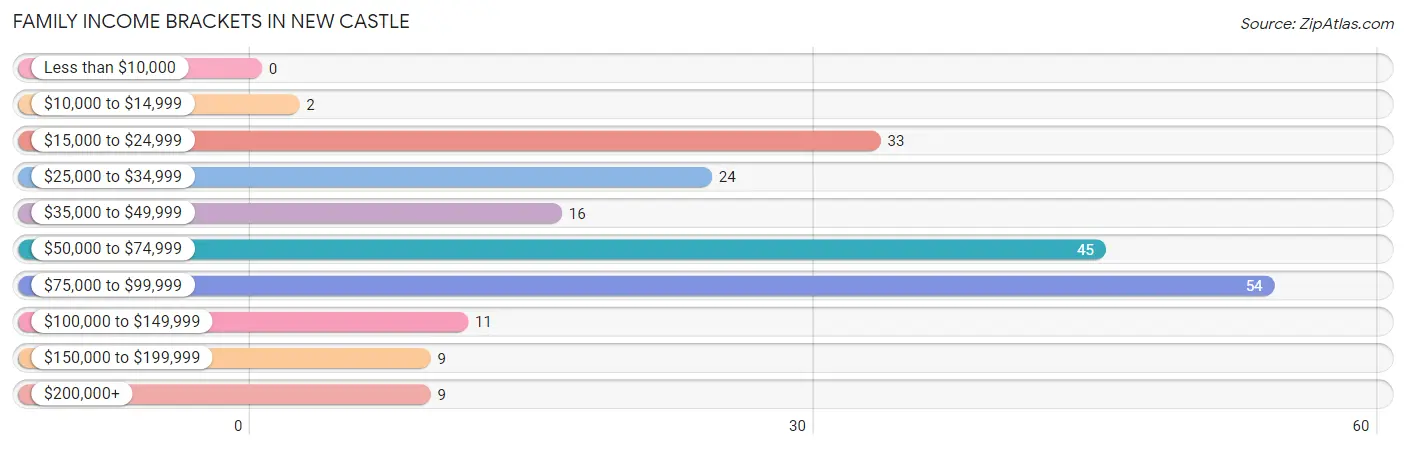
| Income Bracket | # Families | % Families |
| Less than $10,000 | 0 | 0.0% |
| $10,000 to $14,999 | 2 | 1.0% |
| $15,000 to $24,999 | 33 | 16.3% |
| $25,000 to $34,999 | 24 | 11.8% |
| $35,000 to $49,999 | 16 | 7.9% |
| $50,000 to $74,999 | 45 | 22.2% |
| $75,000 to $99,999 | 54 | 26.6% |
| $100,000 to $149,999 | 11 | 5.4% |
| $150,000 to $199,999 | 9 | 4.4% |
| $200,000+ | 9 | 4.4% |
Family Income by Famaliy Size in New Castle
5-person families (18 | 8.9%) account for the highest median family income in New Castle with $125,000 per family, while 3-person families (27 | 13.3%) have the highest median income of $29,479 per family member.
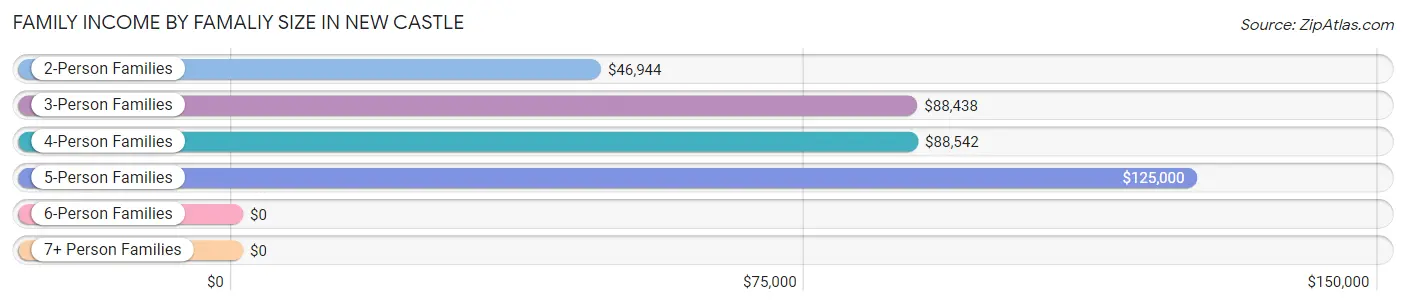
| Income Bracket | # Families | Median Income |
| 2-Person Families | 132 (65.0%) | $46,944 |
| 3-Person Families | 27 (13.3%) | $88,438 |
| 4-Person Families | 26 (12.8%) | $88,542 |
| 5-Person Families | 18 (8.9%) | $125,000 |
| 6-Person Families | 0 (0.0%) | $0 |
| 7+ Person Families | 0 (0.0%) | $0 |
| Total | 203 (100.0%) | $63,750 |
Family Income by Number of Earners in New Castle
The median family income in New Castle is $63,750, with families comprising 3+ earners (17) having the highest median family income of $151,875, while families with 1 earner (88) have the lowest median family income of $32,250, accounting for 8.4% and 43.3% of families, respectively.
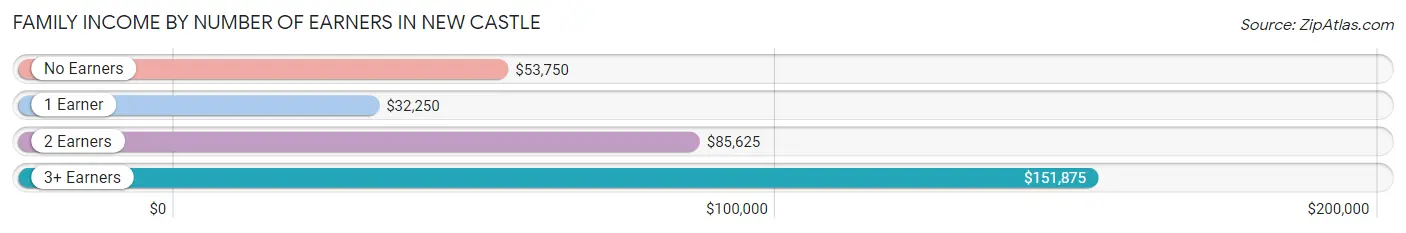
| Number of Earners | # Families | Median Income |
| No Earners | 34 (16.8%) | $53,750 |
| 1 Earner | 88 (43.3%) | $32,250 |
| 2 Earners | 64 (31.5%) | $85,625 |
| 3+ Earners | 17 (8.4%) | $151,875 |
| Total | 203 (100.0%) | $63,750 |
Household Income in New Castle
Household Income Brackets in New Castle
With 74 households falling in the category, the $25,000 to $34,999 income range is the most frequent in New Castle, accounting for 18.3% of all households. In contrast, only 9 households (2.2%) fall into the $150,000 to $199,999 income bracket, making it the least populous group.
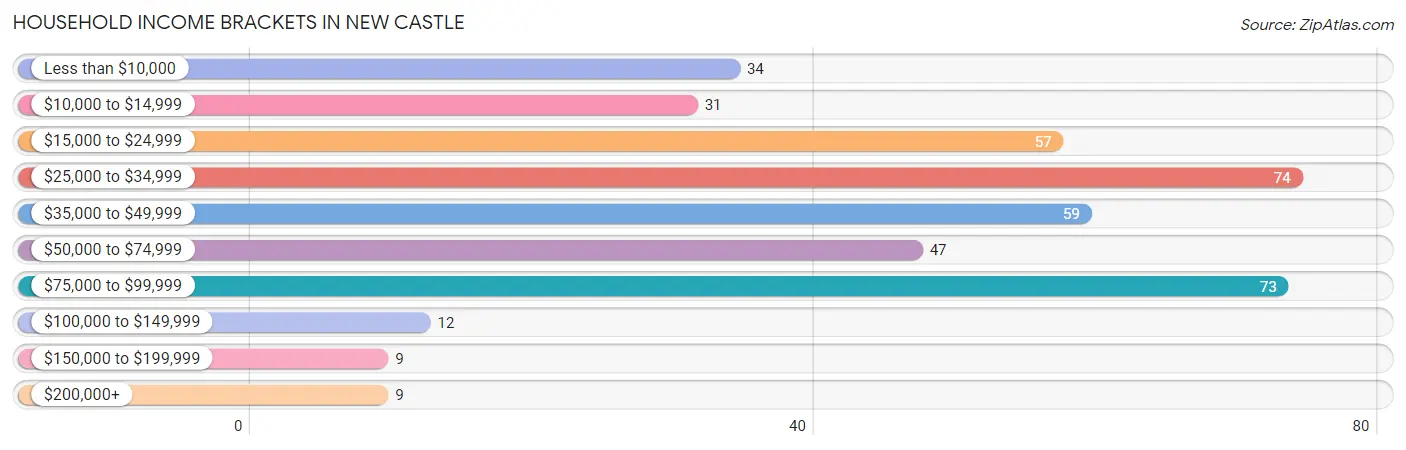
| Income Bracket | # Households | % Households |
| Less than $10,000 | 34 | 8.4% |
| $10,000 to $14,999 | 31 | 7.7% |
| $15,000 to $24,999 | 57 | 14.1% |
| $25,000 to $34,999 | 74 | 18.3% |
| $35,000 to $49,999 | 59 | 14.6% |
| $50,000 to $74,999 | 47 | 11.6% |
| $75,000 to $99,999 | 73 | 18.0% |
| $100,000 to $149,999 | 12 | 3.0% |
| $150,000 to $199,999 | 9 | 2.2% |
| $200,000+ | 9 | 2.2% |
Household Income by Householder Age in New Castle
The median household income in New Castle is $38,594, with the highest median household income of $62,500 found in the 25 to 44 years age bracket for the primary householder. A total of 82 households (20.3%) fall into this category. Meanwhile, the 15 to 24 years age bracket for the primary householder has the lowest median household income of $0, with 5 households (1.2%) in this group.
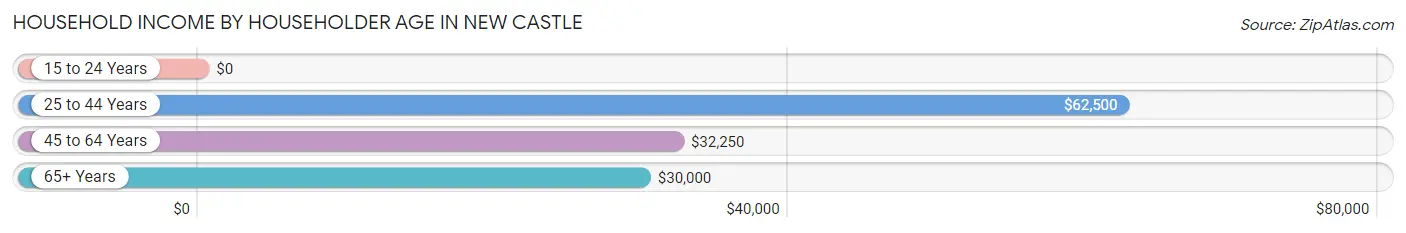
| Income Bracket | # Households | Median Income |
| 15 to 24 Years | 5 (1.2%) | $0 |
| 25 to 44 Years | 82 (20.3%) | $62,500 |
| 45 to 64 Years | 150 (37.0%) | $32,250 |
| 65+ Years | 168 (41.5%) | $30,000 |
| Total | 405 (100.0%) | $38,594 |
Poverty in New Castle
Income Below Poverty by Sex and Age in New Castle
With 17.9% poverty level for males and 18.2% for females among the residents of New Castle, 18 to 24 year old males and 45 to 54 year old females are the most vulnerable to poverty, with 12 males (37.5%) and 25 females (37.3%) in their respective age groups living below the poverty level.
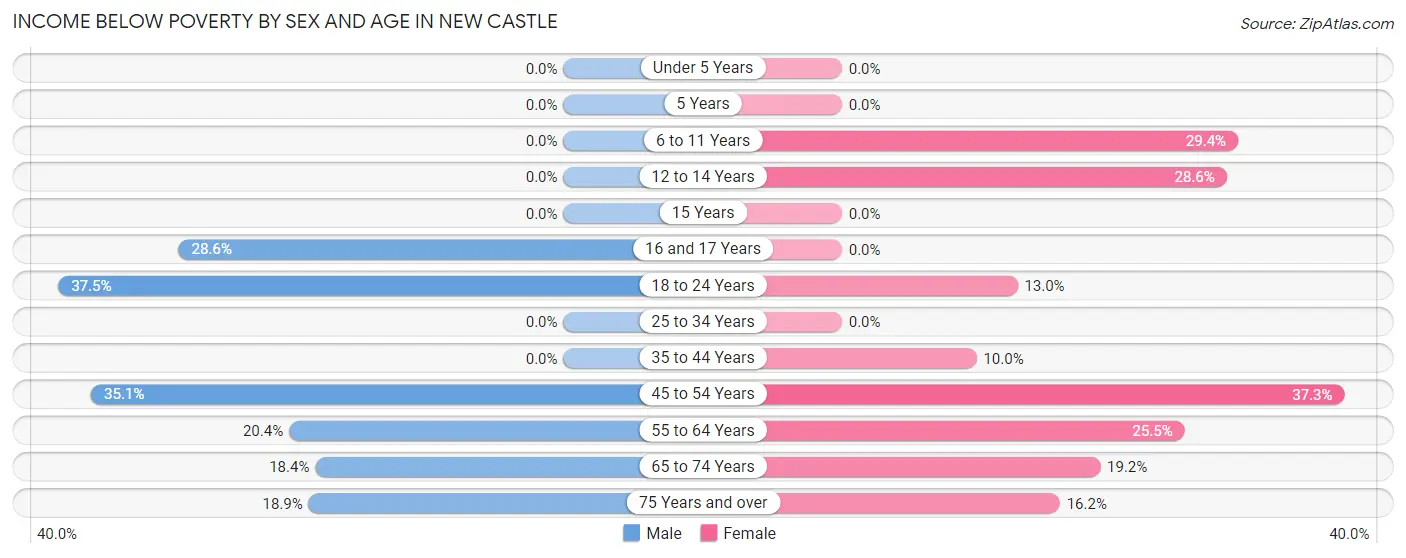
| Age Bracket | Male | Female |
| Under 5 Years | 0 (0.0%) | 0 (0.0%) |
| 5 Years | 0 (0.0%) | 0 (0.0%) |
| 6 to 11 Years | 0 (0.0%) | 5 (29.4%) |
| 12 to 14 Years | 0 (0.0%) | 2 (28.6%) |
| 15 Years | 0 (0.0%) | 0 (0.0%) |
| 16 and 17 Years | 2 (28.6%) | 0 (0.0%) |
| 18 to 24 Years | 12 (37.5%) | 3 (13.0%) |
| 25 to 34 Years | 0 (0.0%) | 0 (0.0%) |
| 35 to 44 Years | 0 (0.0%) | 3 (10.0%) |
| 45 to 54 Years | 27 (35.1%) | 25 (37.3%) |
| 55 to 64 Years | 11 (20.4%) | 14 (25.5%) |
| 65 to 74 Years | 7 (18.4%) | 14 (19.2%) |
| 75 Years and over | 7 (18.9%) | 11 (16.2%) |
| Total | 66 (17.9%) | 77 (18.2%) |
Income Above Poverty by Sex and Age in New Castle
According to the poverty statistics in New Castle, males aged under 5 years and females aged under 5 years are the age groups that are most secure financially, with 100.0% of males and 100.0% of females in these age groups living above the poverty line.
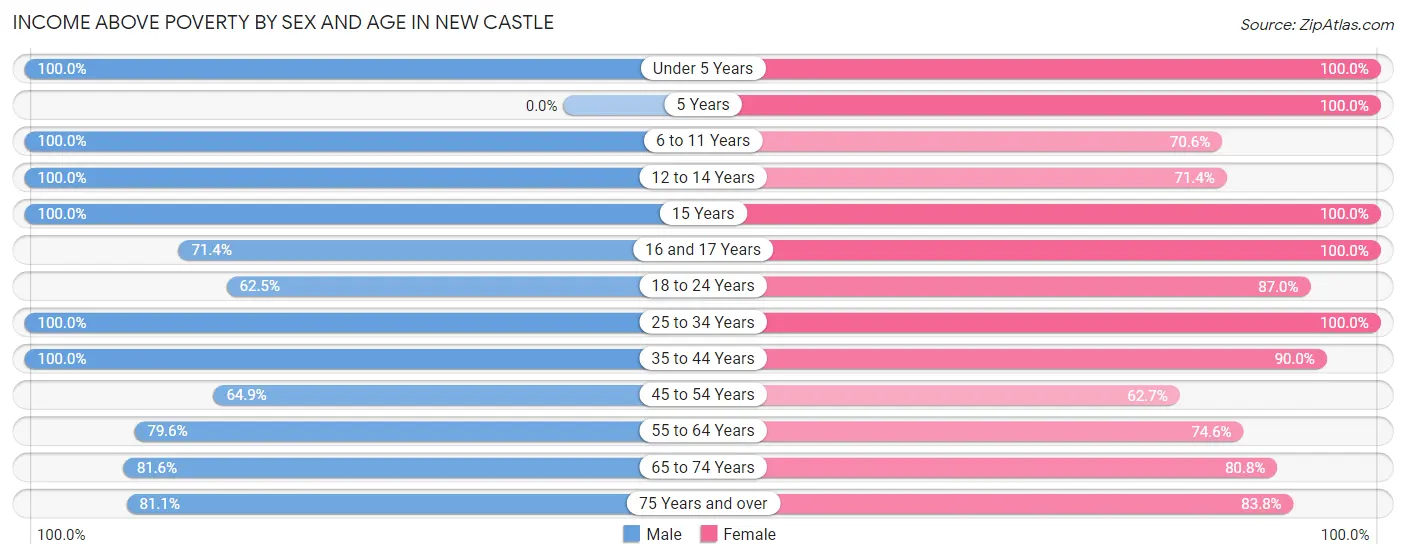
| Age Bracket | Male | Female |
| Under 5 Years | 24 (100.0%) | 10 (100.0%) |
| 5 Years | 0 (0.0%) | 2 (100.0%) |
| 6 to 11 Years | 24 (100.0%) | 12 (70.6%) |
| 12 to 14 Years | 8 (100.0%) | 5 (71.4%) |
| 15 Years | 1 (100.0%) | 9 (100.0%) |
| 16 and 17 Years | 5 (71.4%) | 8 (100.0%) |
| 18 to 24 Years | 20 (62.5%) | 20 (87.0%) |
| 25 to 34 Years | 53 (100.0%) | 53 (100.0%) |
| 35 to 44 Years | 14 (100.0%) | 27 (90.0%) |
| 45 to 54 Years | 50 (64.9%) | 42 (62.7%) |
| 55 to 64 Years | 43 (79.6%) | 41 (74.6%) |
| 65 to 74 Years | 31 (81.6%) | 59 (80.8%) |
| 75 Years and over | 30 (81.1%) | 57 (83.8%) |
| Total | 303 (82.1%) | 345 (81.8%) |
Income Below Poverty Among Married-Couple Families in New Castle
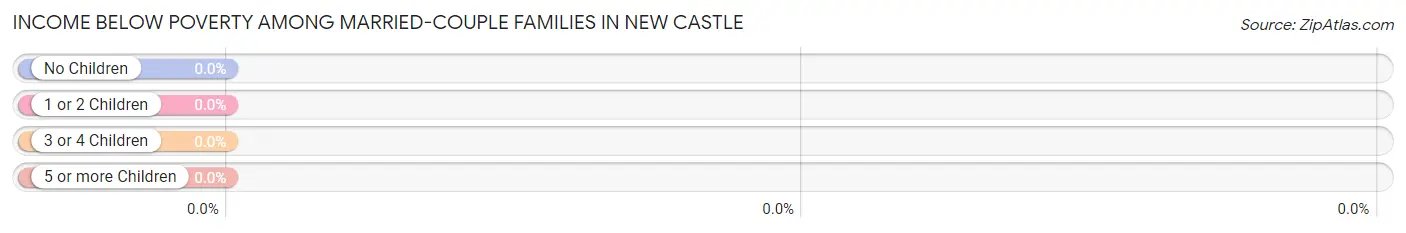
| Children | Above Poverty | Below Poverty |
| No Children | 110 (100.0%) | 0 (0.0%) |
| 1 or 2 Children | 43 (100.0%) | 0 (0.0%) |
| 3 or 4 Children | 2 (100.0%) | 0 (0.0%) |
| 5 or more Children | 0 (0.0%) | 0 (0.0%) |
| Total | 155 (100.0%) | 0 (0.0%) |
Income Below Poverty Among Single-Parent Households in New Castle
According to the poverty data in New Castle, 70.0% or 7 single-father households and 31.6% or 12 single-mother households are living below the poverty line. Among single-father households, those with no children have the highest poverty rate, with 7 households (100.0%) experiencing poverty. Likewise, among single-mother households, those with 1 or 2 children have the highest poverty rate, with 12 households (42.9%) falling below the poverty line.
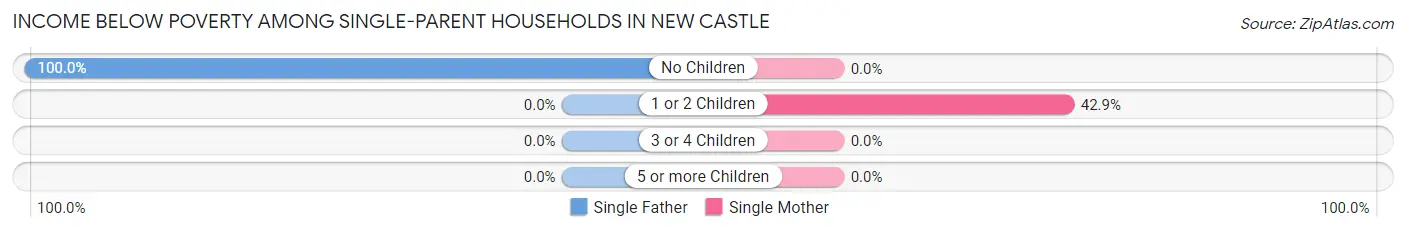
| Children | Single Father | Single Mother |
| No Children | 7 (100.0%) | 0 (0.0%) |
| 1 or 2 Children | 0 (0.0%) | 12 (42.9%) |
| 3 or 4 Children | 0 (0.0%) | 0 (0.0%) |
| 5 or more Children | 0 (0.0%) | 0 (0.0%) |
| Total | 7 (70.0%) | 12 (31.6%) |
Income Below Poverty Among Married-Couple vs Single-Parent Households in New Castle
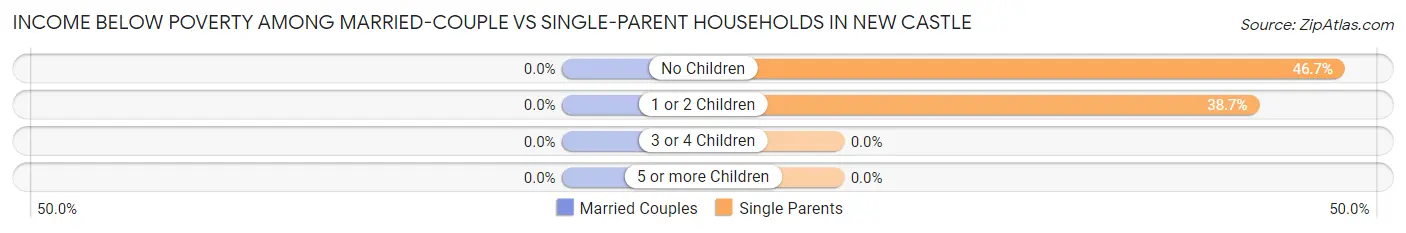
| Children | Married-Couple Families | Single-Parent Households |
| No Children | 0 (0.0%) | 7 (46.7%) |
| 1 or 2 Children | 0 (0.0%) | 12 (38.7%) |
| 3 or 4 Children | 0 (0.0%) | 0 (0.0%) |
| 5 or more Children | 0 (0.0%) | 0 (0.0%) |
| Total | 0 (0.0%) | 19 (39.6%) |
Race in New Castle
The most populous races in New Castle are White / Caucasian (794 | 90.2%), Black / African American (55 | 6.2%), and Two or more Races (28 | 3.2%).
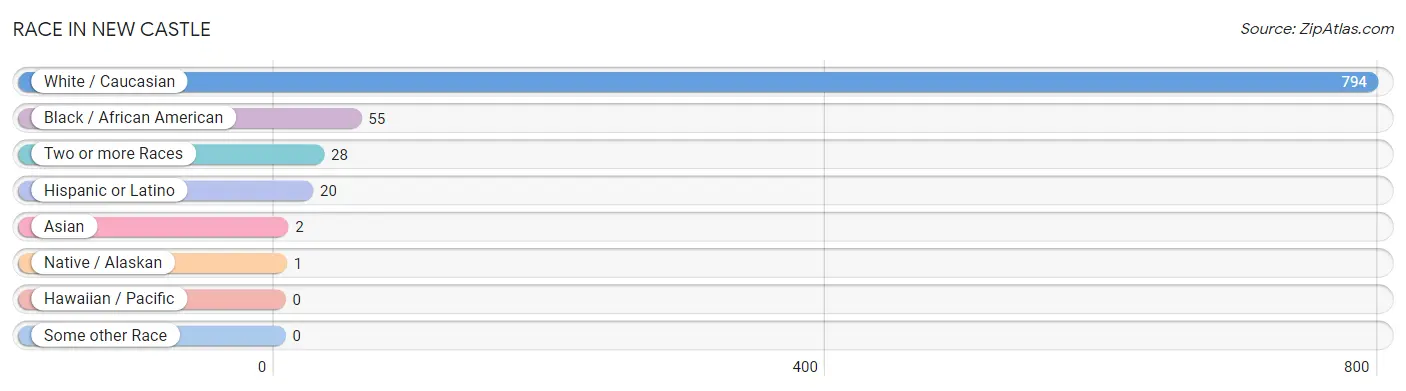
| Race | # Population | % Population |
| Asian | 2 | 0.2% |
| Black / African American | 55 | 6.2% |
| Hawaiian / Pacific | 0 | 0.0% |
| Hispanic or Latino | 20 | 2.3% |
| Native / Alaskan | 1 | 0.1% |
| White / Caucasian | 794 | 90.2% |
| Two or more Races | 28 | 3.2% |
| Some other Race | 0 | 0.0% |
| Total | 880 | 100.0% |
Ancestry in New Castle
The most populous ancestries reported in New Castle are English (140 | 15.9%), American (128 | 14.5%), Irish (96 | 10.9%), German (70 | 8.0%), and Scottish (33 | 3.7%), together accounting for 53.1% of all New Castle residents.
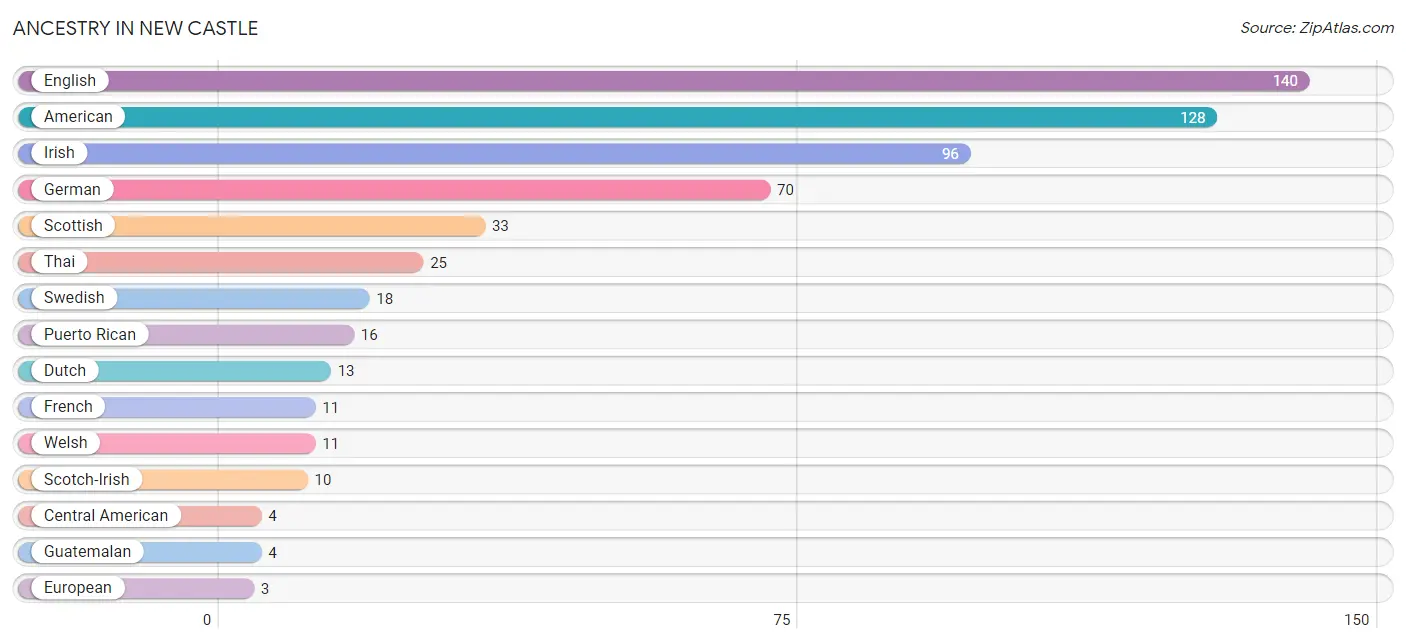
| Ancestry | # Population | % Population |
| American | 128 | 14.5% |
| Canadian | 1 | 0.1% |
| Central American | 4 | 0.4% |
| Czech | 2 | 0.2% |
| Danish | 1 | 0.1% |
| Dutch | 13 | 1.5% |
| English | 140 | 15.9% |
| European | 3 | 0.3% |
| French | 11 | 1.3% |
| French American Indian | 2 | 0.2% |
| German | 70 | 8.0% |
| Greek | 3 | 0.3% |
| Guatemalan | 4 | 0.4% |
| Irish | 96 | 10.9% |
| Italian | 3 | 0.3% |
| Portuguese | 2 | 0.2% |
| Puerto Rican | 16 | 1.8% |
| Scotch-Irish | 10 | 1.1% |
| Scottish | 33 | 3.7% |
| Swedish | 18 | 2.1% |
| Thai | 25 | 2.8% |
| Welsh | 11 | 1.3% | View All 22 Rows |
Immigrants in New Castle
The most numerous immigrant groups reported in New Castle came from Latin America (6 | 0.7%), Caribbean (3 | 0.3%), Central America (3 | 0.3%), Guatemala (3 | 0.3%), and Jamaica (3 | 0.3%), together accounting for 2.0% of all New Castle residents.
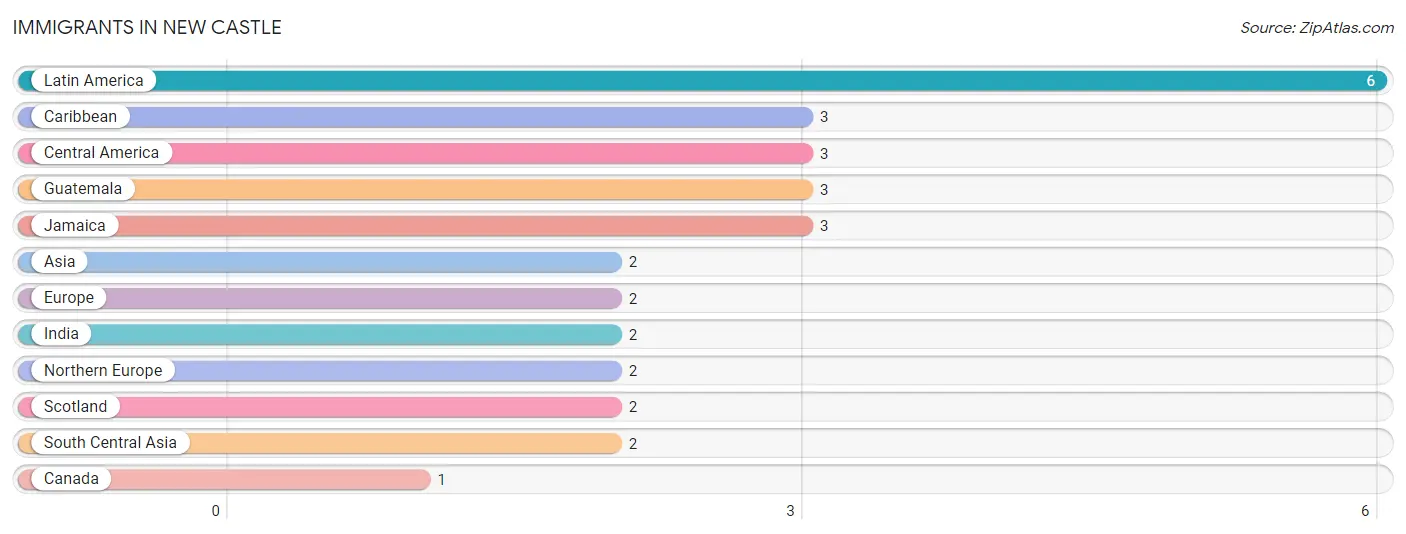
| Immigration Origin | # Population | % Population |
| Asia | 2 | 0.2% |
| Canada | 1 | 0.1% |
| Caribbean | 3 | 0.3% |
| Central America | 3 | 0.3% |
| Europe | 2 | 0.2% |
| Guatemala | 3 | 0.3% |
| India | 2 | 0.2% |
| Jamaica | 3 | 0.3% |
| Latin America | 6 | 0.7% |
| Northern Europe | 2 | 0.2% |
| Scotland | 2 | 0.2% |
| South Central Asia | 2 | 0.2% | View All 12 Rows |
Sex and Age in New Castle
Sex and Age in New Castle
The most populous age groups in New Castle are 50 to 54 Years (47 | 12.6%) for men and 85 Years and over (79 | 15.5%) for women.
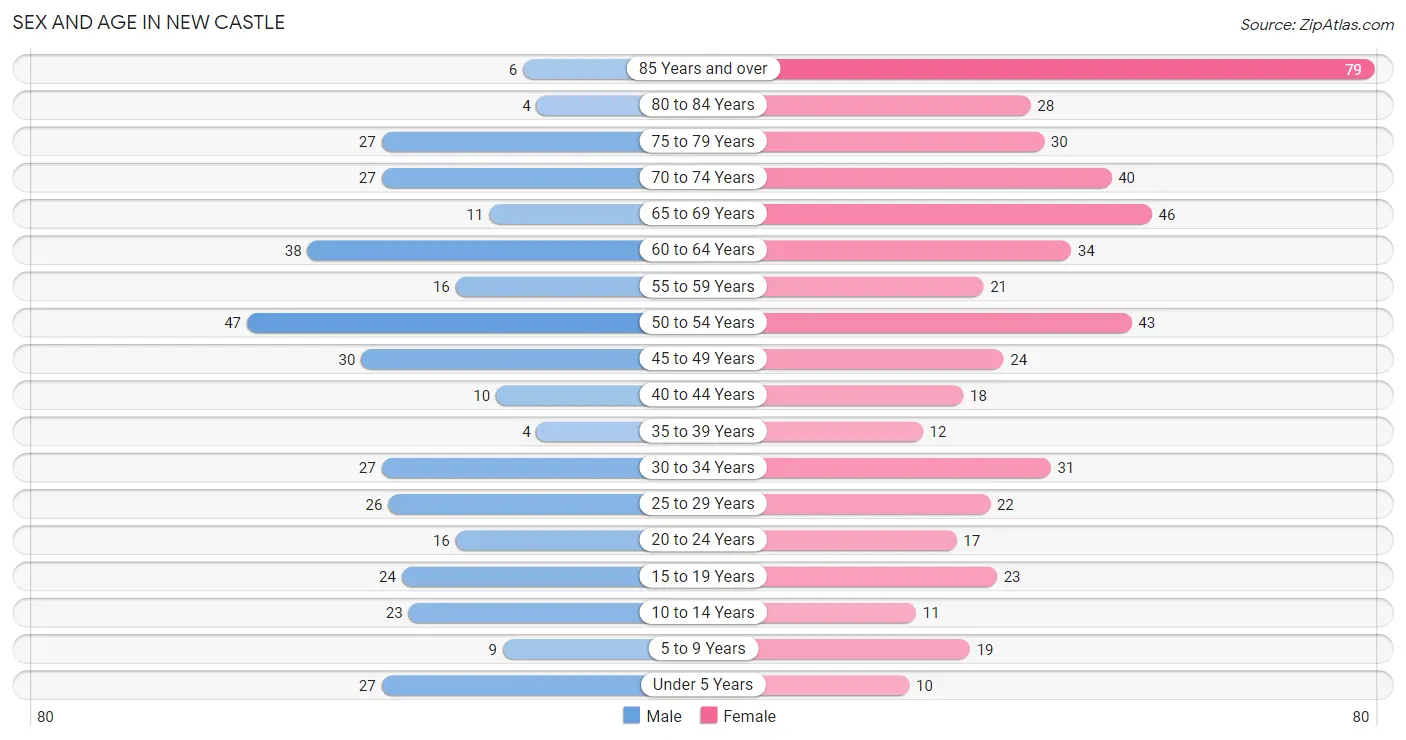
| Age Bracket | Male | Female |
| Under 5 Years | 27 (7.3%) | 10 (2.0%) |
| 5 to 9 Years | 9 (2.4%) | 19 (3.7%) |
| 10 to 14 Years | 23 (6.2%) | 11 (2.2%) |
| 15 to 19 Years | 24 (6.5%) | 23 (4.5%) |
| 20 to 24 Years | 16 (4.3%) | 17 (3.4%) |
| 25 to 29 Years | 26 (7.0%) | 22 (4.3%) |
| 30 to 34 Years | 27 (7.3%) | 31 (6.1%) |
| 35 to 39 Years | 4 (1.1%) | 12 (2.4%) |
| 40 to 44 Years | 10 (2.7%) | 18 (3.5%) |
| 45 to 49 Years | 30 (8.1%) | 24 (4.7%) |
| 50 to 54 Years | 47 (12.6%) | 43 (8.5%) |
| 55 to 59 Years | 16 (4.3%) | 21 (4.1%) |
| 60 to 64 Years | 38 (10.2%) | 34 (6.7%) |
| 65 to 69 Years | 11 (3.0%) | 46 (9.1%) |
| 70 to 74 Years | 27 (7.3%) | 40 (7.9%) |
| 75 to 79 Years | 27 (7.3%) | 30 (5.9%) |
| 80 to 84 Years | 4 (1.1%) | 28 (5.5%) |
| 85 Years and over | 6 (1.6%) | 79 (15.5%) |
| Total | 372 (100.0%) | 508 (100.0%) |
Families and Households in New Castle
Median Family Size in New Castle
The median family size in New Castle is 2.71 persons per family, with single male/father families (10 | 4.9%) accounting for the largest median family size of 3.2 persons per family. On the other hand, married-couple families (155 | 76.3%) represent the smallest median family size with 2.66 persons per family.
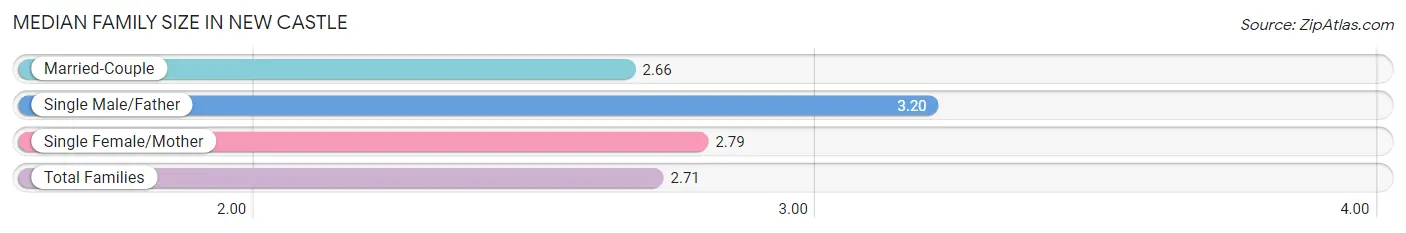
| Family Type | # Families | Family Size |
| Married-Couple | 155 (76.3%) | 2.66 |
| Single Male/Father | 10 (4.9%) | 3.20 |
| Single Female/Mother | 38 (18.7%) | 2.79 |
| Total Families | 203 (100.0%) | 2.71 |
Median Household Size in New Castle
The median household size in New Castle is 1.96 persons per household, with single male/father households (10 | 2.5%) accounting for the largest median household size of 3.3 persons per household. non-family households (202 | 49.9%) represent the smallest median household size with 1.11 persons per household.
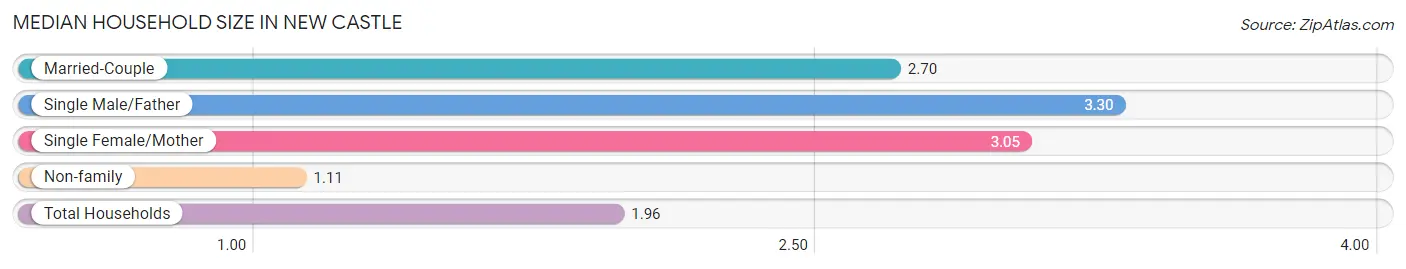
| Household Type | # Households | Household Size |
| Married-Couple | 155 (38.3%) | 2.70 |
| Single Male/Father | 10 (2.5%) | 3.30 |
| Single Female/Mother | 38 (9.4%) | 3.05 |
| Non-family | 202 (49.9%) | 1.11 |
| Total Households | 405 (100.0%) | 1.96 |
Household Size by Marriage Status in New Castle
Out of a total of 405 households in New Castle, 203 (50.1%) are family households, while 202 (49.9%) are nonfamily households. The most numerous type of family households are 2-person households, comprising 123, and the most common type of nonfamily households are 1-person households, comprising 184.
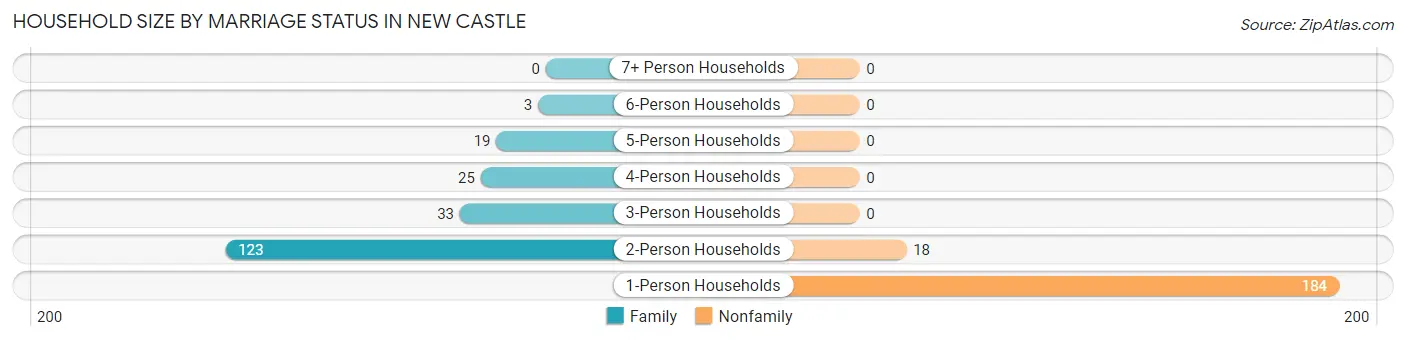
| Household Size | Family Households | Nonfamily Households |
| 1-Person Households | - | 184 (45.4%) |
| 2-Person Households | 123 (30.4%) | 18 (4.4%) |
| 3-Person Households | 33 (8.2%) | 0 (0.0%) |
| 4-Person Households | 25 (6.2%) | 0 (0.0%) |
| 5-Person Households | 19 (4.7%) | 0 (0.0%) |
| 6-Person Households | 3 (0.7%) | 0 (0.0%) |
| 7+ Person Households | 0 (0.0%) | 0 (0.0%) |
| Total | 203 (50.1%) | 202 (49.9%) |
Female Fertility in New Castle
Fertility by Age in New Castle
Average fertility rate in New Castle is 18.0 births per 1,000 women. Women in the age bracket of 20 to 34 years have the highest fertility rate with 43.0 births per 1,000 women. Women in the age bracket of 20 to 34 years acount for 100.0% of all women with births.
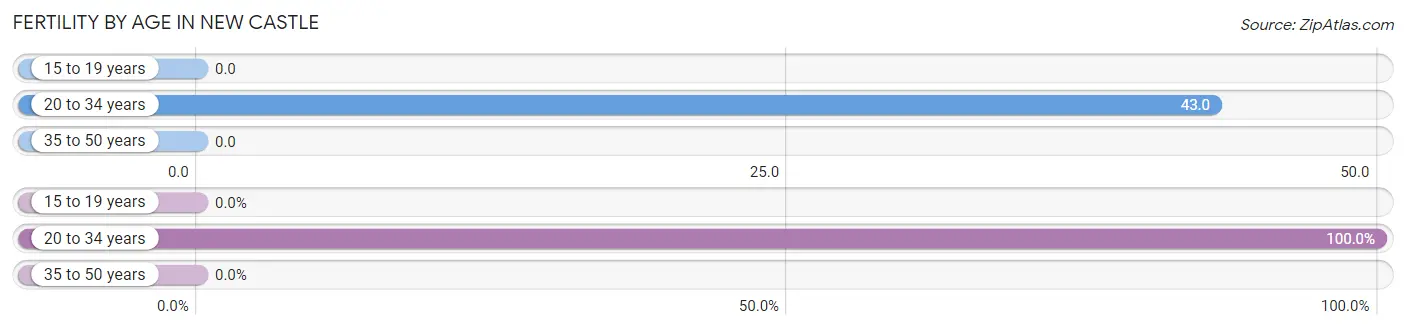
| Age Bracket | Women with Births | Births / 1,000 Women |
| 15 to 19 years | 0 (0.0%) | 0.0 |
| 20 to 34 years | 3 (100.0%) | 43.0 |
| 35 to 50 years | 0 (0.0%) | 0.0 |
| Total | 3 (100.0%) | 18.0 |
Fertility by Age by Marriage Status in New Castle
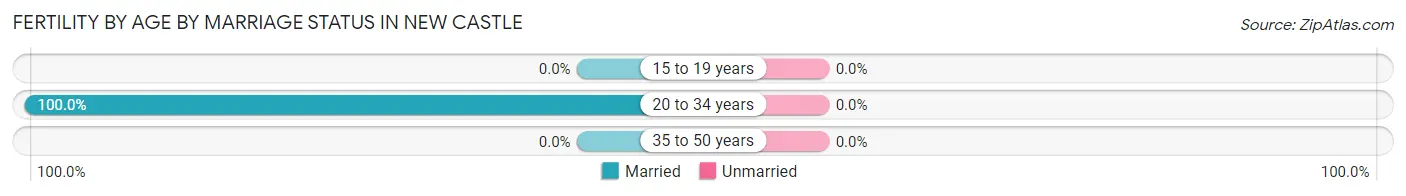
| Age Bracket | Married | Unmarried |
| 15 to 19 years | 0 (0.0%) | 0 (0.0%) |
| 20 to 34 years | 3 (100.0%) | 0 (0.0%) |
| 35 to 50 years | 0 (0.0%) | 0 (0.0%) |
| Total | 3 (100.0%) | 0 (0.0%) |
Fertility by Education in New Castle
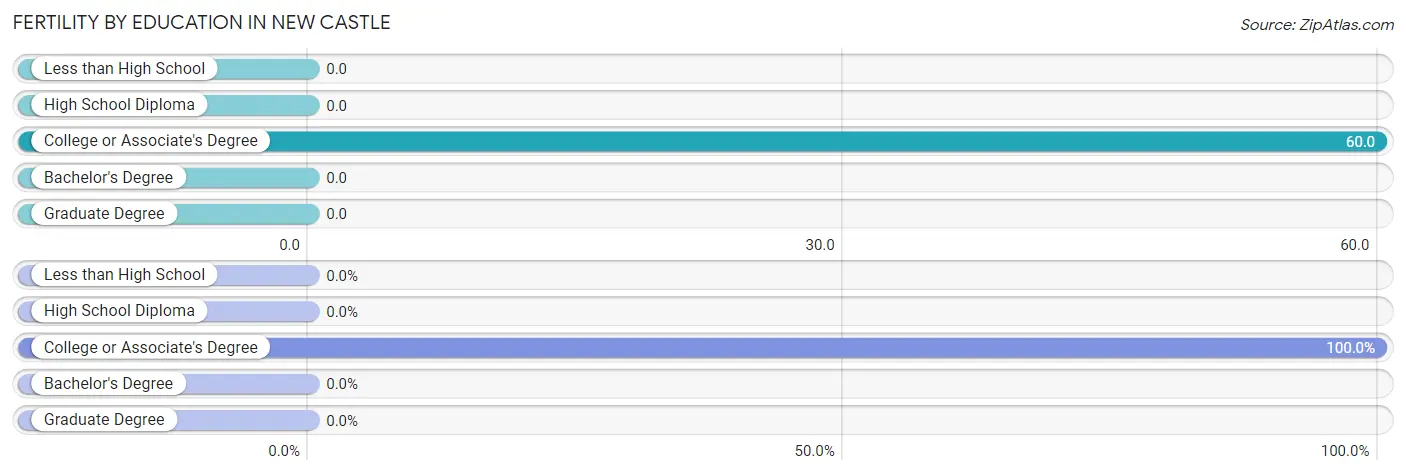
| Educational Attainment | Women with Births | Births / 1,000 Women |
| Less than High School | 0 (0.0%) | 0.0 |
| High School Diploma | 0 (0.0%) | 0.0 |
| College or Associate's Degree | 3 (100.0%) | 60.0 |
| Bachelor's Degree | 0 (0.0%) | 0.0 |
| Graduate Degree | 0 (0.0%) | 0.0 |
| Total | 3 (100.0%) | 18.0 |
Fertility by Education by Marriage Status in New Castle
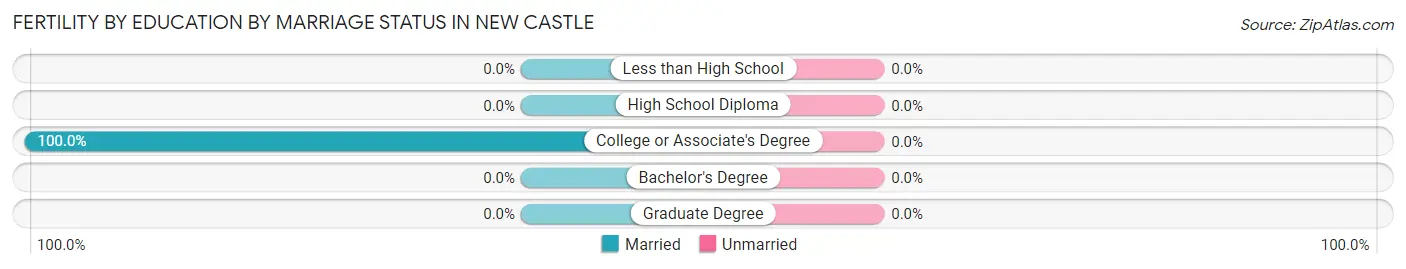
| Educational Attainment | Married | Unmarried |
| Less than High School | 0 (0.0%) | 0 (0.0%) |
| High School Diploma | 0 (0.0%) | 0 (0.0%) |
| College or Associate's Degree | 3 (100.0%) | 0 (0.0%) |
| Bachelor's Degree | 0 (0.0%) | 0 (0.0%) |
| Graduate Degree | 0 (0.0%) | 0 (0.0%) |
| Total | 3 (100.0%) | 0 (0.0%) |
Employment Characteristics in New Castle
Employment by Class of Employer in New Castle
Among the 331 employed individuals in New Castle, private company employees (217 | 65.6%), local government employees (55 | 16.6%), and self-employed (not incorporated) (20 | 6.0%) make up the most common classes of employment.
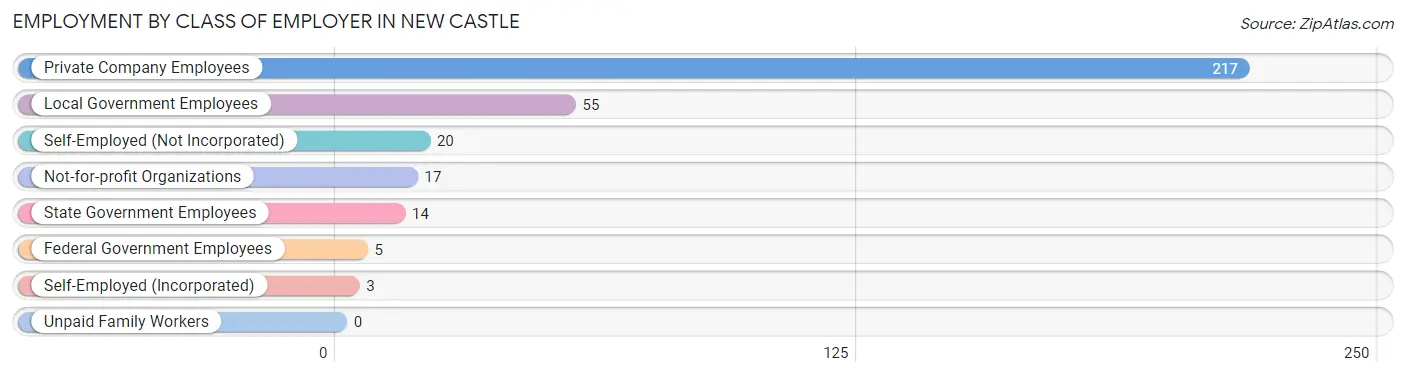
| Employer Class | # Employees | % Employees |
| Private Company Employees | 217 | 65.6% |
| Self-Employed (Incorporated) | 3 | 0.9% |
| Self-Employed (Not Incorporated) | 20 | 6.0% |
| Not-for-profit Organizations | 17 | 5.1% |
| Local Government Employees | 55 | 16.6% |
| State Government Employees | 14 | 4.2% |
| Federal Government Employees | 5 | 1.5% |
| Unpaid Family Workers | 0 | 0.0% |
| Total | 331 | 100.0% |
Employment Status by Age in New Castle
According to the labor force statistics for New Castle, out of the total population over 16 years of age (771), 45.1% or 348 individuals are in the labor force, with 4.9% or 17 of them unemployed. The age group with the highest labor force participation rate is 25 to 29 years, with 100.0% or 48 individuals in the labor force. Within the labor force, the 16 to 19 years age range has the highest percentage of unemployed individuals, with 63.2% or 12 of them being unemployed.
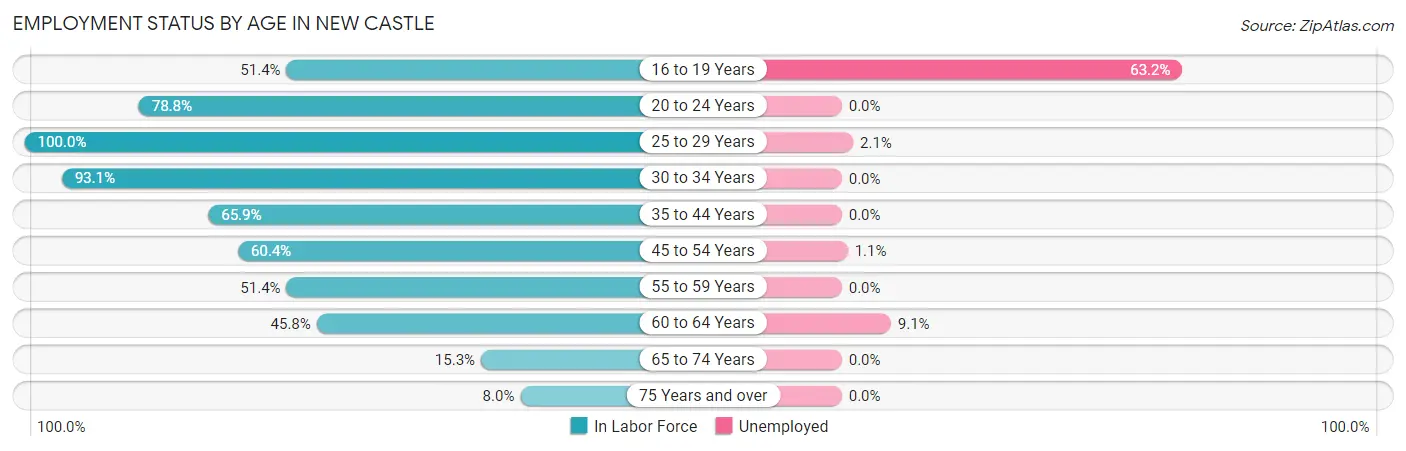
| Age Bracket | In Labor Force | Unemployed |
| 16 to 19 Years | 19 (51.4%) | 12 (63.2%) |
| 20 to 24 Years | 26 (78.8%) | 0 (0.0%) |
| 25 to 29 Years | 48 (100.0%) | 1 (2.1%) |
| 30 to 34 Years | 54 (93.1%) | 0 (0.0%) |
| 35 to 44 Years | 29 (65.9%) | 0 (0.0%) |
| 45 to 54 Years | 87 (60.4%) | 1 (1.1%) |
| 55 to 59 Years | 19 (51.4%) | 0 (0.0%) |
| 60 to 64 Years | 33 (45.8%) | 3 (9.1%) |
| 65 to 74 Years | 19 (15.3%) | 0 (0.0%) |
| 75 Years and over | 14 (8.0%) | 0 (0.0%) |
| Total | 348 (45.1%) | 17 (4.9%) |
Employment Status by Educational Attainment in New Castle
According to labor force statistics for New Castle, 67.0% of individuals (270) out of the total population between 25 and 64 years of age (403) are in the labor force, with 1.9% or 5 of them being unemployed. The group with the highest labor force participation rate are those with the educational attainment of bachelor's degree or higher, with 81.5% or 66 individuals in the labor force. Within the labor force, individuals with bachelor's degree or higher education have the highest percentage of unemployment, with 4.5% or 3 of them being unemployed.
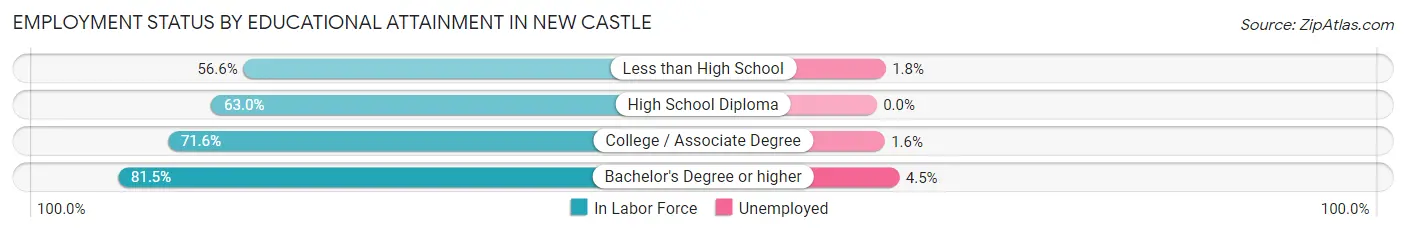
| Educational Attainment | In Labor Force | Unemployed |
| Less than High School | 56 (56.6%) | 2 (1.8%) |
| High School Diploma | 85 (63.0%) | 0 (0.0%) |
| College / Associate Degree | 63 (71.6%) | 1 (1.6%) |
| Bachelor's Degree or higher | 66 (81.5%) | 4 (4.5%) |
| Total | 270 (67.0%) | 8 (1.9%) |
Employment Occupations by Sex in New Castle
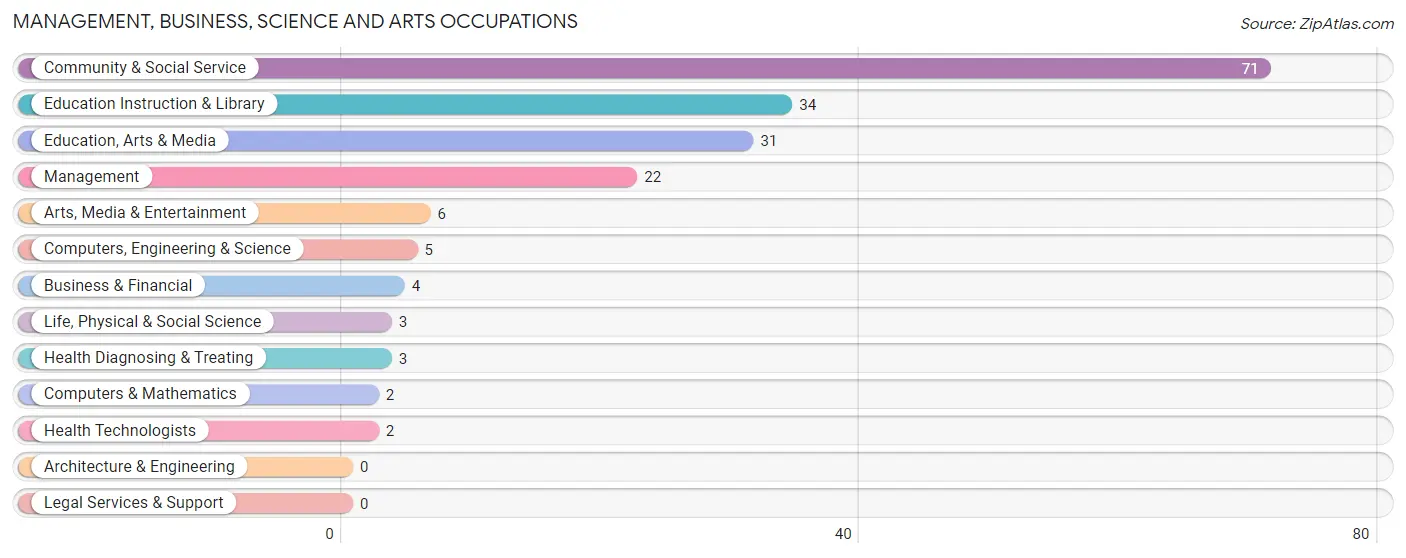
Management, Business, Science and Arts Occupations
The most common Management, Business, Science and Arts occupations in New Castle are Community & Social Service (71 | 21.4%), Education Instruction & Library (34 | 10.3%), Education, Arts & Media (31 | 9.4%), Management (22 | 6.7%), and Arts, Media & Entertainment (6 | 1.8%).
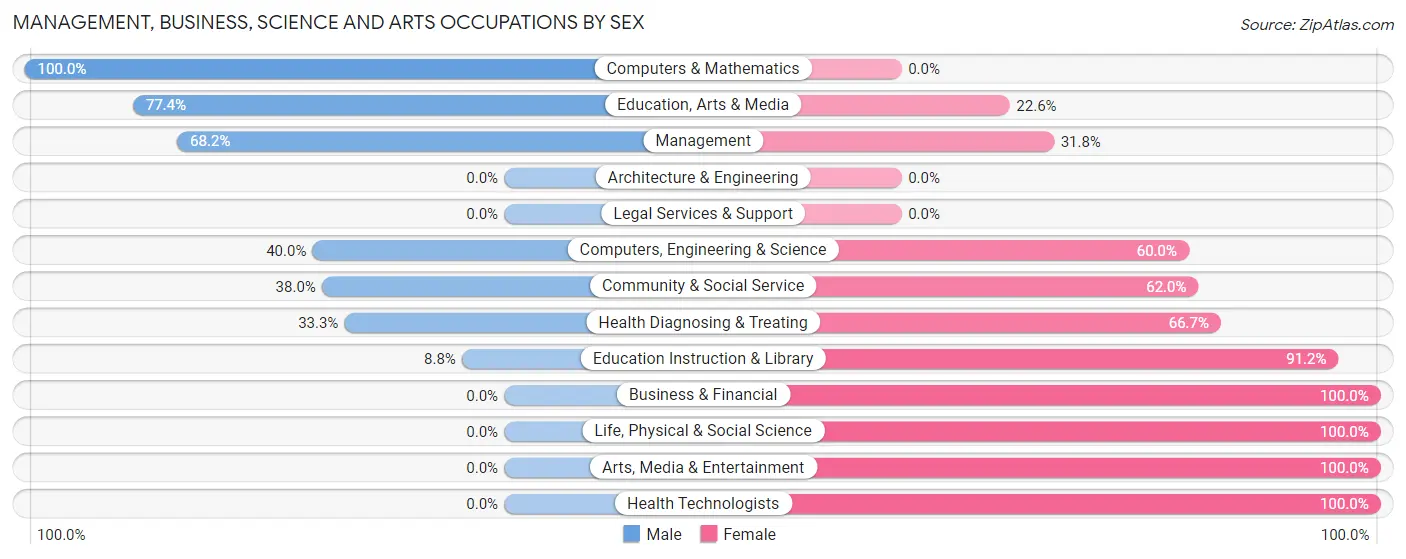
Management, Business, Science and Arts Occupations by Sex
Within the Management, Business, Science and Arts occupations in New Castle, the most male-oriented occupations are Computers & Mathematics (100.0%), Education, Arts & Media (77.4%), and Management (68.2%), while the most female-oriented occupations are Business & Financial (100.0%), Life, Physical & Social Science (100.0%), and Arts, Media & Entertainment (100.0%).
| Occupation | Male | Female |
| Management | 15 (68.2%) | 7 (31.8%) |
| Business & Financial | 0 (0.0%) | 4 (100.0%) |
| Computers, Engineering & Science | 2 (40.0%) | 3 (60.0%) |
| Computers & Mathematics | 2 (100.0%) | 0 (0.0%) |
| Architecture & Engineering | 0 (0.0%) | 0 (0.0%) |
| Life, Physical & Social Science | 0 (0.0%) | 3 (100.0%) |
| Community & Social Service | 27 (38.0%) | 44 (62.0%) |
| Education, Arts & Media | 24 (77.4%) | 7 (22.6%) |
| Legal Services & Support | 0 (0.0%) | 0 (0.0%) |
| Education Instruction & Library | 3 (8.8%) | 31 (91.2%) |
| Arts, Media & Entertainment | 0 (0.0%) | 6 (100.0%) |
| Health Diagnosing & Treating | 1 (33.3%) | 2 (66.7%) |
| Health Technologists | 0 (0.0%) | 2 (100.0%) |
| Total (Category) | 45 (42.9%) | 60 (57.1%) |
| Total (Overall) | 172 (52.0%) | 159 (48.0%) |
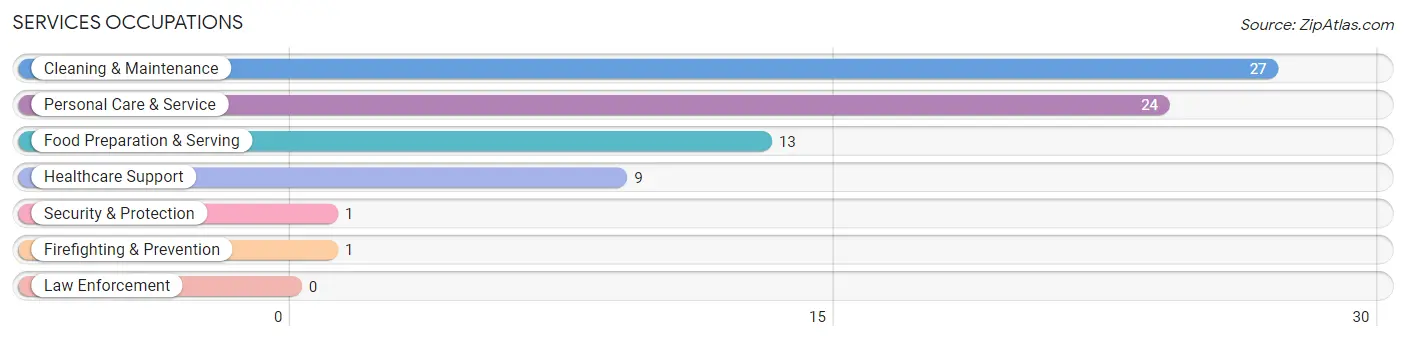
Services Occupations
The most common Services occupations in New Castle are Cleaning & Maintenance (27 | 8.2%), Personal Care & Service (24 | 7.2%), Food Preparation & Serving (13 | 3.9%), Healthcare Support (9 | 2.7%), and Security & Protection (1 | 0.3%).
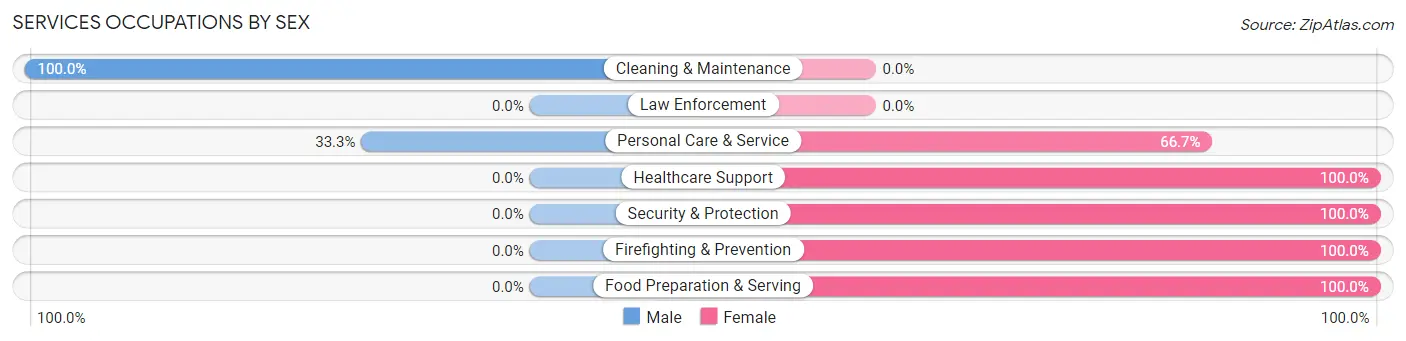
Services Occupations by Sex
Within the Services occupations in New Castle, the most male-oriented occupations are Cleaning & Maintenance (100.0%), and Personal Care & Service (33.3%), while the most female-oriented occupations are Healthcare Support (100.0%), Security & Protection (100.0%), and Firefighting & Prevention (100.0%).
| Occupation | Male | Female |
| Healthcare Support | 0 (0.0%) | 9 (100.0%) |
| Security & Protection | 0 (0.0%) | 1 (100.0%) |
| Firefighting & Prevention | 0 (0.0%) | 1 (100.0%) |
| Law Enforcement | 0 (0.0%) | 0 (0.0%) |
| Food Preparation & Serving | 0 (0.0%) | 13 (100.0%) |
| Cleaning & Maintenance | 27 (100.0%) | 0 (0.0%) |
| Personal Care & Service | 8 (33.3%) | 16 (66.7%) |
| Total (Category) | 35 (47.3%) | 39 (52.7%) |
| Total (Overall) | 172 (52.0%) | 159 (48.0%) |
Sales and Office Occupations
The most common Sales and Office occupations in New Castle are Sales & Related (27 | 8.2%), and Office & Administration (27 | 8.2%).
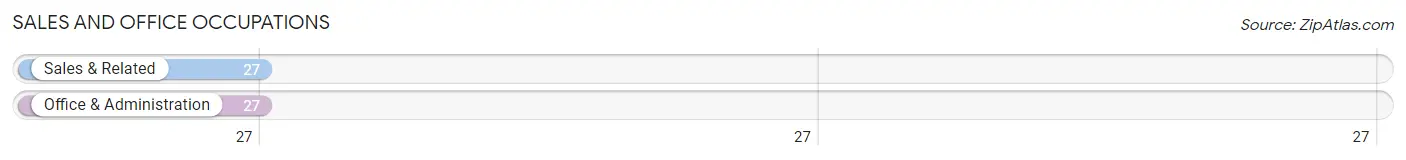
Sales and Office Occupations by Sex

| Occupation | Male | Female |
| Sales & Related | 5 (18.5%) | 22 (81.5%) |
| Office & Administration | 0 (0.0%) | 27 (100.0%) |
| Total (Category) | 5 (9.3%) | 49 (90.7%) |
| Total (Overall) | 172 (52.0%) | 159 (48.0%) |
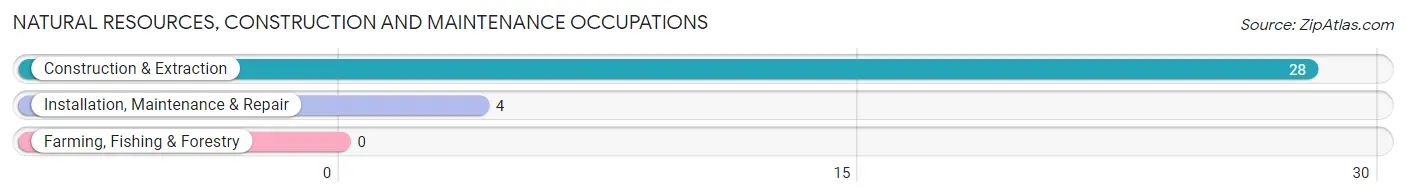
Natural Resources, Construction and Maintenance Occupations
The most common Natural Resources, Construction and Maintenance occupations in New Castle are Construction & Extraction (28 | 8.5%), and Installation, Maintenance & Repair (4 | 1.2%).
Natural Resources, Construction and Maintenance Occupations by Sex
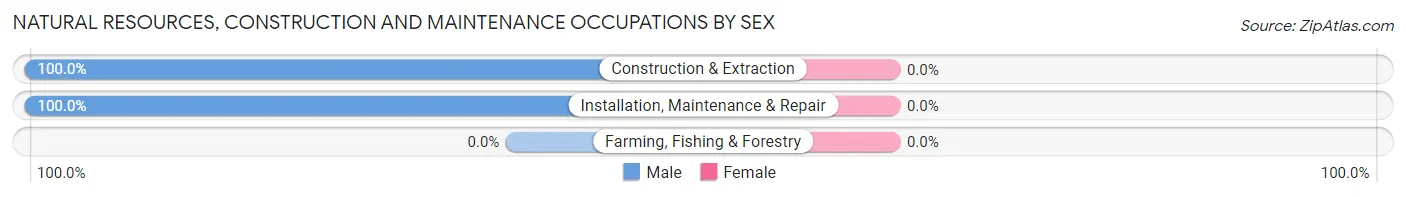
| Occupation | Male | Female |
| Farming, Fishing & Forestry | 0 (0.0%) | 0 (0.0%) |
| Construction & Extraction | 28 (100.0%) | 0 (0.0%) |
| Installation, Maintenance & Repair | 4 (100.0%) | 0 (0.0%) |
| Total (Category) | 32 (100.0%) | 0 (0.0%) |
| Total (Overall) | 172 (52.0%) | 159 (48.0%) |
Production, Transportation and Moving Occupations
The most common Production, Transportation and Moving occupations in New Castle are Production (31 | 9.4%), Material Moving (27 | 8.2%), and Transportation (8 | 2.4%).
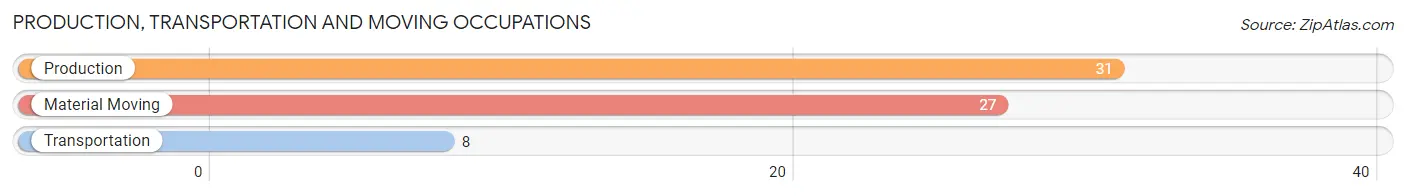
Production, Transportation and Moving Occupations by Sex
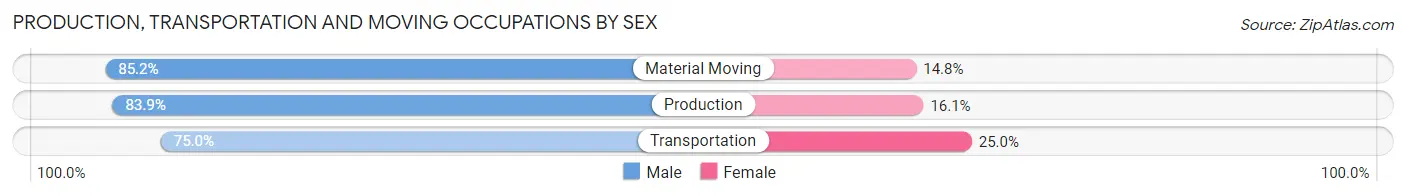
| Occupation | Male | Female |
| Production | 26 (83.9%) | 5 (16.1%) |
| Transportation | 6 (75.0%) | 2 (25.0%) |
| Material Moving | 23 (85.2%) | 4 (14.8%) |
| Total (Category) | 55 (83.3%) | 11 (16.7%) |
| Total (Overall) | 172 (52.0%) | 159 (48.0%) |
Employment Industries by Sex in New Castle
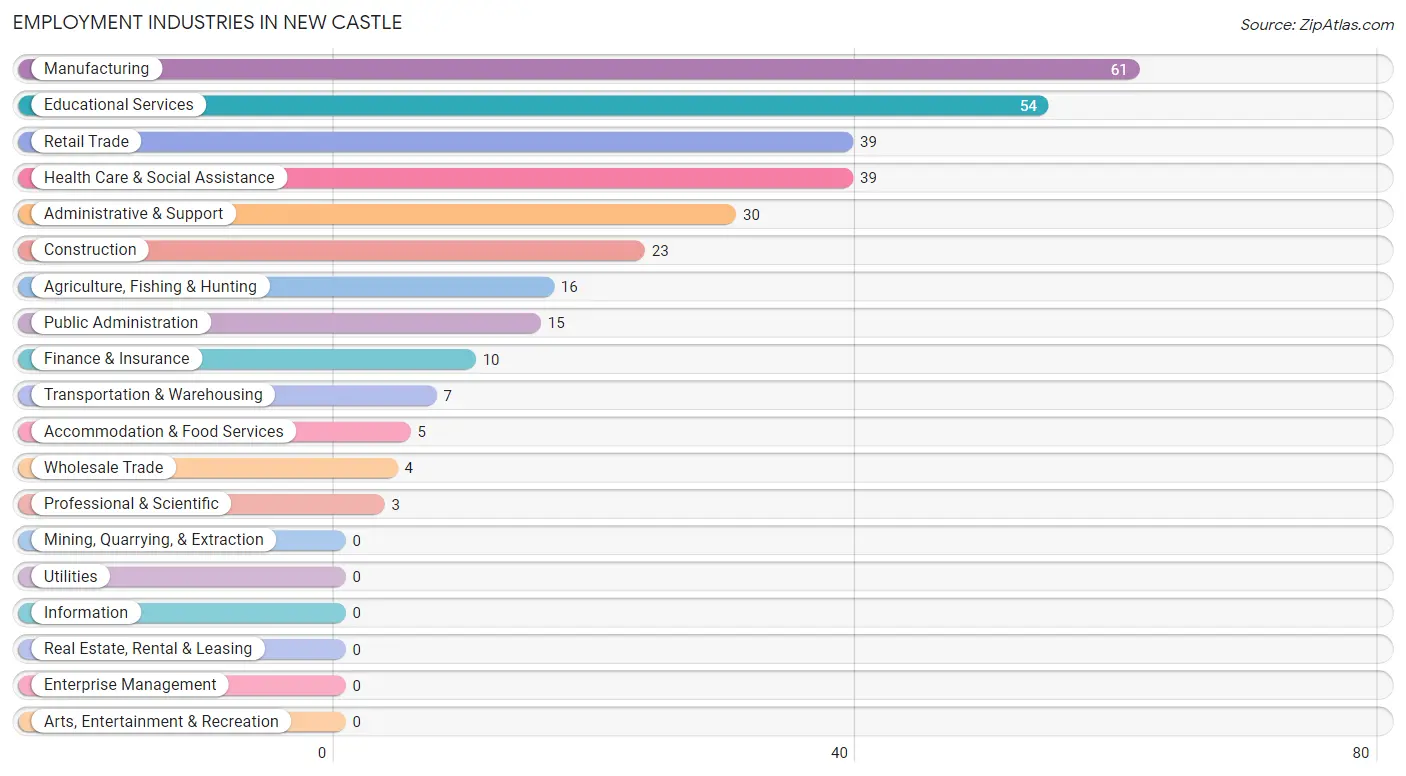
Employment Industries in New Castle
The major employment industries in New Castle include Manufacturing (61 | 18.4%), Educational Services (54 | 16.3%), Retail Trade (39 | 11.8%), Health Care & Social Assistance (39 | 11.8%), and Administrative & Support (30 | 9.1%).
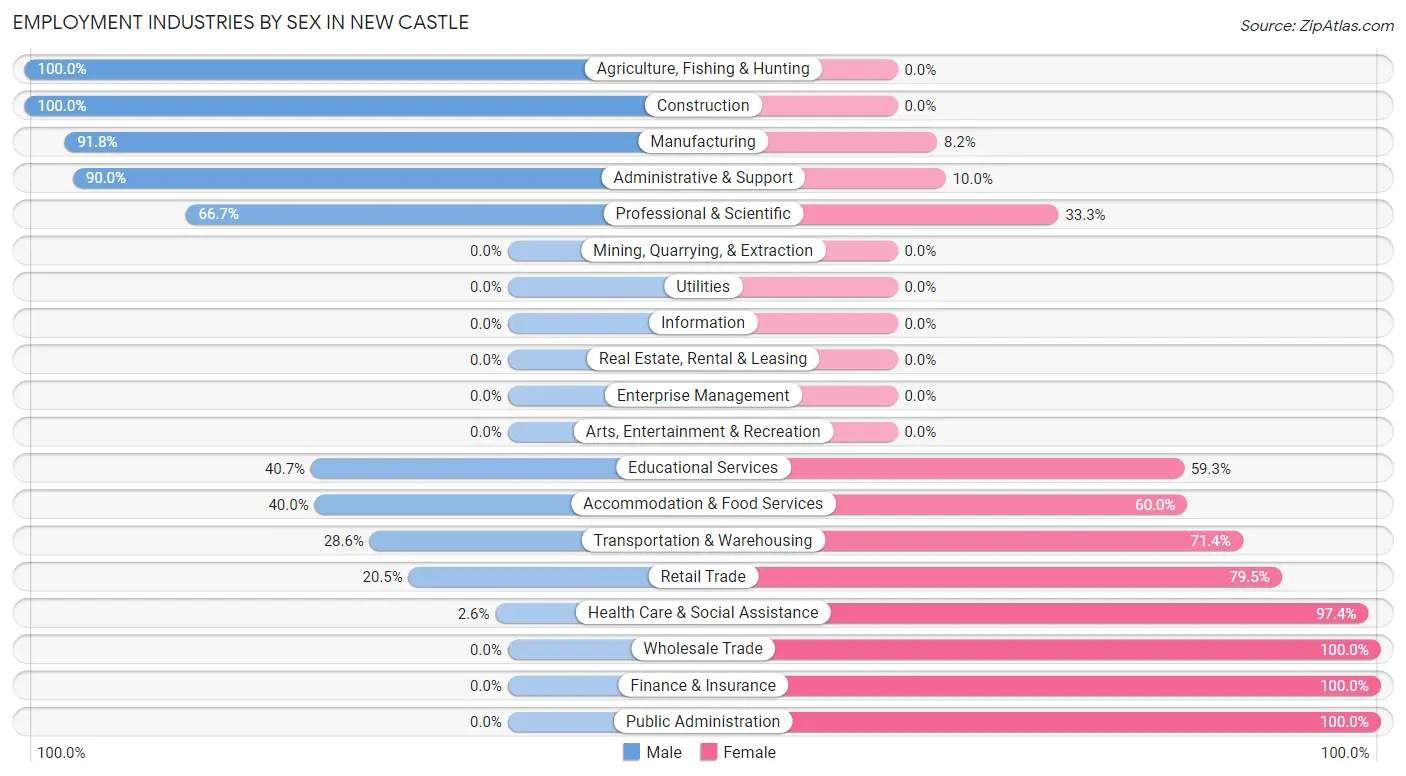
Employment Industries by Sex in New Castle
The New Castle industries that see more men than women are Agriculture, Fishing & Hunting (100.0%), Construction (100.0%), and Manufacturing (91.8%), whereas the industries that tend to have a higher number of women are Wholesale Trade (100.0%), Finance & Insurance (100.0%), and Public Administration (100.0%).
| Industry | Male | Female |
| Agriculture, Fishing & Hunting | 16 (100.0%) | 0 (0.0%) |
| Mining, Quarrying, & Extraction | 0 (0.0%) | 0 (0.0%) |
| Construction | 23 (100.0%) | 0 (0.0%) |
| Manufacturing | 56 (91.8%) | 5 (8.2%) |
| Wholesale Trade | 0 (0.0%) | 4 (100.0%) |
| Retail Trade | 8 (20.5%) | 31 (79.5%) |
| Transportation & Warehousing | 2 (28.6%) | 5 (71.4%) |
| Utilities | 0 (0.0%) | 0 (0.0%) |
| Information | 0 (0.0%) | 0 (0.0%) |
| Finance & Insurance | 0 (0.0%) | 10 (100.0%) |
| Real Estate, Rental & Leasing | 0 (0.0%) | 0 (0.0%) |
| Professional & Scientific | 2 (66.7%) | 1 (33.3%) |
| Enterprise Management | 0 (0.0%) | 0 (0.0%) |
| Administrative & Support | 27 (90.0%) | 3 (10.0%) |
| Educational Services | 22 (40.7%) | 32 (59.3%) |
| Health Care & Social Assistance | 1 (2.6%) | 38 (97.4%) |
| Arts, Entertainment & Recreation | 0 (0.0%) | 0 (0.0%) |
| Accommodation & Food Services | 2 (40.0%) | 3 (60.0%) |
| Public Administration | 0 (0.0%) | 15 (100.0%) |
| Total | 172 (52.0%) | 159 (48.0%) |
Education in New Castle
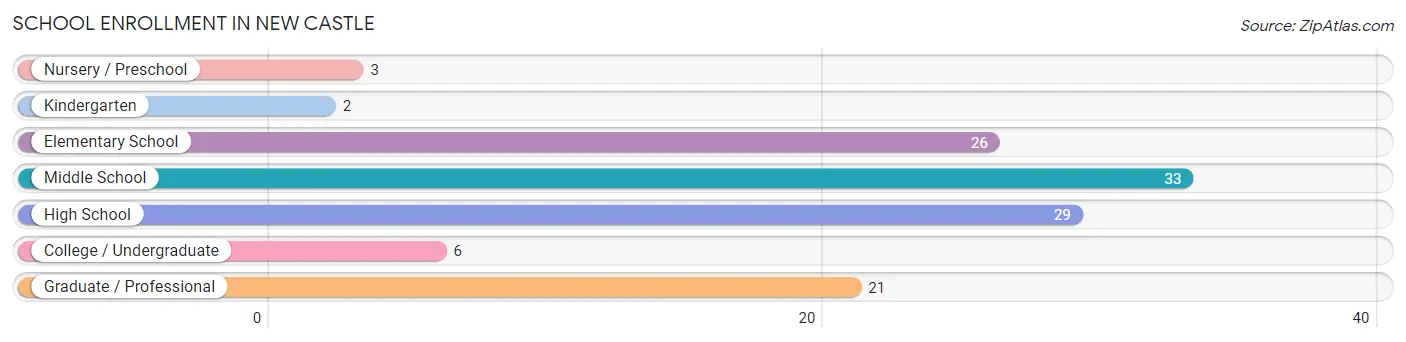
School Enrollment in New Castle
The most common levels of schooling among the 120 students in New Castle are middle school (33 | 27.5%), high school (29 | 24.2%), and elementary school (26 | 21.7%).
| School Level | # Students | % Students |
| Nursery / Preschool | 3 | 2.5% |
| Kindergarten | 2 | 1.7% |
| Elementary School | 26 | 21.7% |
| Middle School | 33 | 27.5% |
| High School | 29 | 24.2% |
| College / Undergraduate | 6 | 5.0% |
| Graduate / Professional | 21 | 17.5% |
| Total | 120 | 100.0% |
School Enrollment by Age by Funding Source in New Castle
Out of a total of 120 students who are enrolled in schools in New Castle, 14 (11.7%) attend a private institution, while the remaining 106 (88.3%) are enrolled in public schools. The age group of 25 to 34 year olds has the highest likelihood of being enrolled in private schools, with 6 (28.6% in the age bracket) enrolled. Conversely, the age group of 3 to 4 year olds has the lowest likelihood of being enrolled in a private school, with 3 (100.0% in the age bracket) attending a public institution.
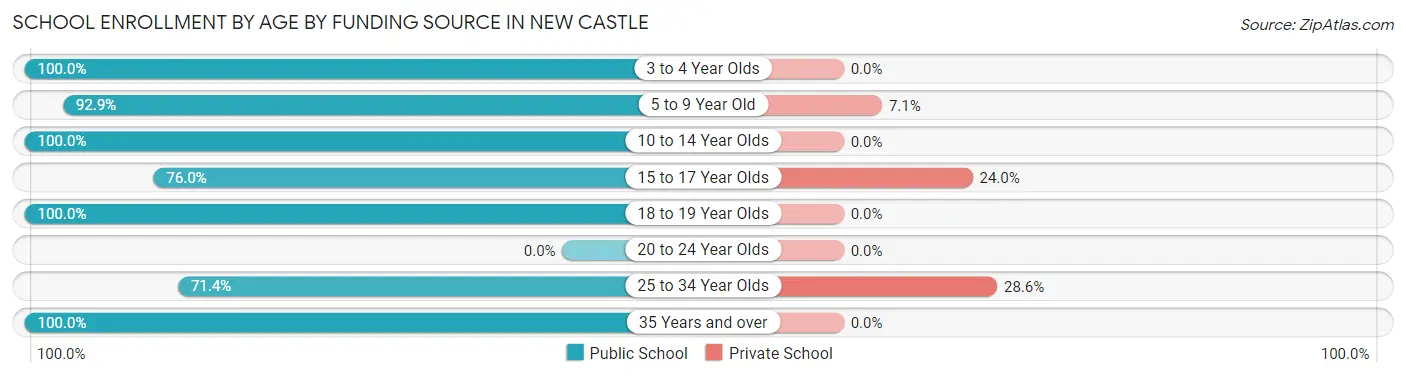
| Age Bracket | Public School | Private School |
| 3 to 4 Year Olds | 3 (100.0%) | 0 (0.0%) |
| 5 to 9 Year Old | 26 (92.9%) | 2 (7.1%) |
| 10 to 14 Year Olds | 34 (100.0%) | 0 (0.0%) |
| 15 to 17 Year Olds | 19 (76.0%) | 6 (24.0%) |
| 18 to 19 Year Olds | 6 (100.0%) | 0 (0.0%) |
| 20 to 24 Year Olds | 0 (0.0%) | 0 (0.0%) |
| 25 to 34 Year Olds | 15 (71.4%) | 6 (28.6%) |
| 35 Years and over | 3 (100.0%) | 0 (0.0%) |
| Total | 106 (88.3%) | 14 (11.7%) |
Educational Attainment by Field of Study in New Castle
Education (55 | 38.2%), arts & humanities (25 | 17.4%), engineering (15 | 10.4%), psychology (11 | 7.6%), and literature & languages (10 | 6.9%) are the most common fields of study among 144 individuals in New Castle who have obtained a bachelor's degree or higher.
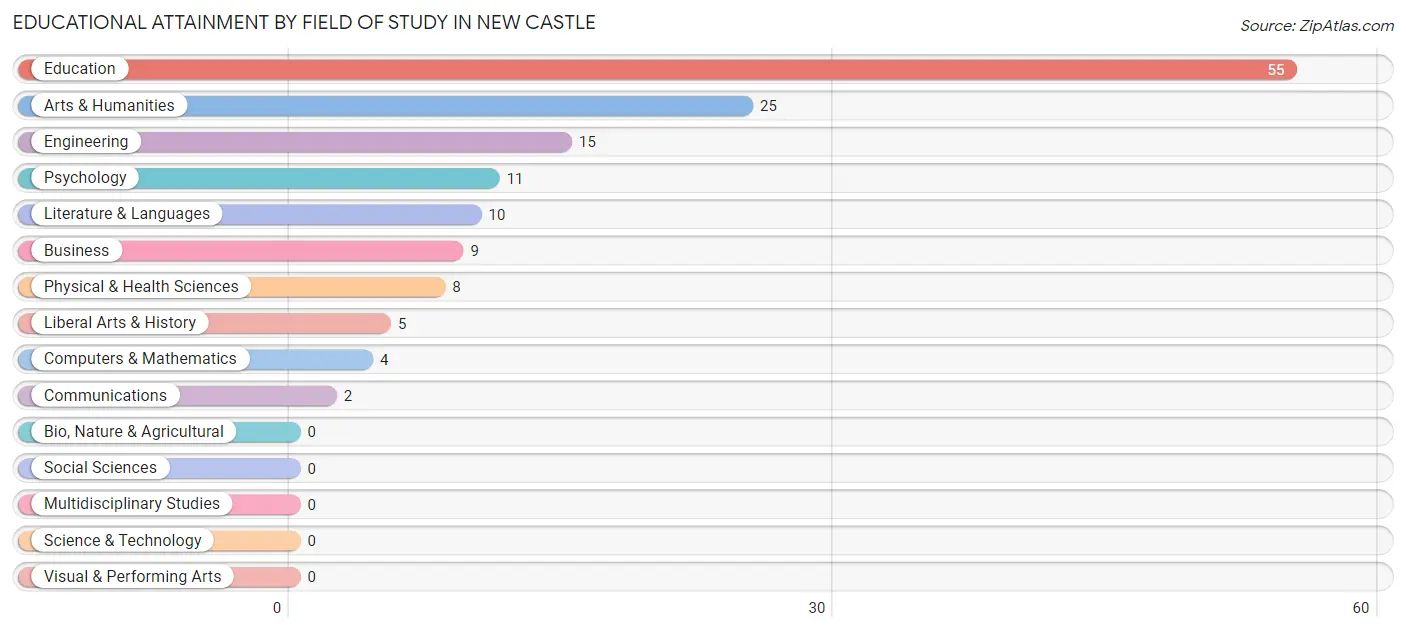
| Field of Study | # Graduates | % Graduates |
| Computers & Mathematics | 4 | 2.8% |
| Bio, Nature & Agricultural | 0 | 0.0% |
| Physical & Health Sciences | 8 | 5.6% |
| Psychology | 11 | 7.6% |
| Social Sciences | 0 | 0.0% |
| Engineering | 15 | 10.4% |
| Multidisciplinary Studies | 0 | 0.0% |
| Science & Technology | 0 | 0.0% |
| Business | 9 | 6.2% |
| Education | 55 | 38.2% |
| Literature & Languages | 10 | 6.9% |
| Liberal Arts & History | 5 | 3.5% |
| Visual & Performing Arts | 0 | 0.0% |
| Communications | 2 | 1.4% |
| Arts & Humanities | 25 | 17.4% |
| Total | 144 | 100.0% |
Transportation & Commute in New Castle
Vehicle Availability by Sex in New Castle
The most prevalent vehicle ownership categories in New Castle are males with 2 vehicles (58, accounting for 33.7%) and females with 2 vehicles (80, making up 36.5%).
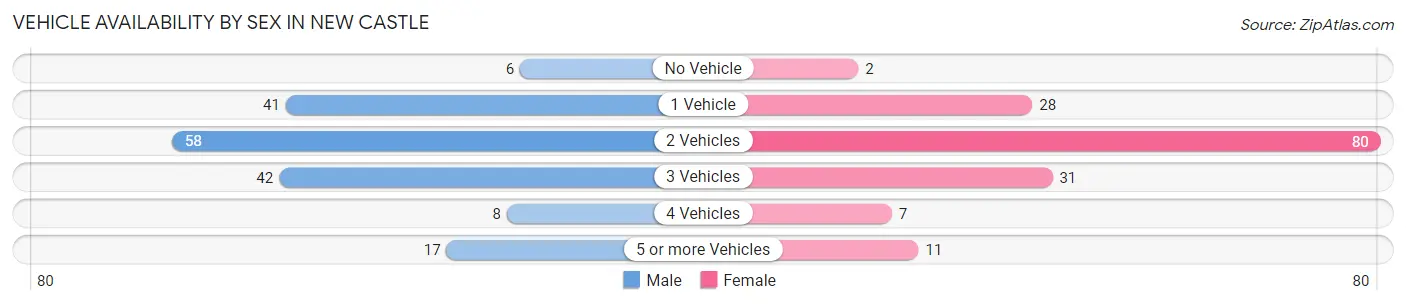
| Vehicles Available | Male | Female |
| No Vehicle | 6 (3.5%) | 2 (1.3%) |
| 1 Vehicle | 41 (23.8%) | 28 (17.6%) |
| 2 Vehicles | 58 (33.7%) | 80 (50.3%) |
| 3 Vehicles | 42 (24.4%) | 31 (19.5%) |
| 4 Vehicles | 8 (4.6%) | 7 (4.4%) |
| 5 or more Vehicles | 17 (9.9%) | 11 (6.9%) |
| Total | 172 (100.0%) | 159 (100.0%) |
Commute Time in New Castle
The most frequently occuring commute durations in New Castle are 30 to 34 minutes (71 commuters, 22.5%), 5 to 9 minutes (50 commuters, 15.8%), and 15 to 19 minutes (42 commuters, 13.3%).
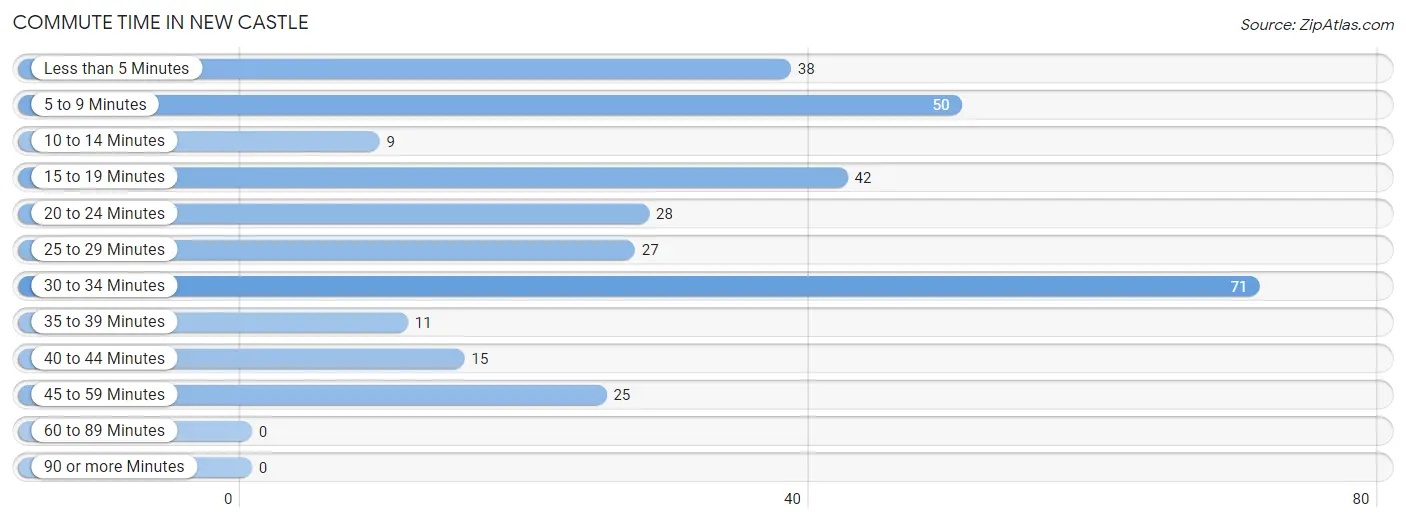
| Commute Time | # Commuters | % Commuters |
| Less than 5 Minutes | 38 | 12.0% |
| 5 to 9 Minutes | 50 | 15.8% |
| 10 to 14 Minutes | 9 | 2.9% |
| 15 to 19 Minutes | 42 | 13.3% |
| 20 to 24 Minutes | 28 | 8.9% |
| 25 to 29 Minutes | 27 | 8.5% |
| 30 to 34 Minutes | 71 | 22.5% |
| 35 to 39 Minutes | 11 | 3.5% |
| 40 to 44 Minutes | 15 | 4.8% |
| 45 to 59 Minutes | 25 | 7.9% |
| 60 to 89 Minutes | 0 | 0.0% |
| 90 or more Minutes | 0 | 0.0% |
Commute Time by Sex in New Castle
The most common commute times in New Castle are 30 to 34 minutes (50 commuters, 30.5%) for males and less than 5 minutes (26 commuters, 17.1%) for females.
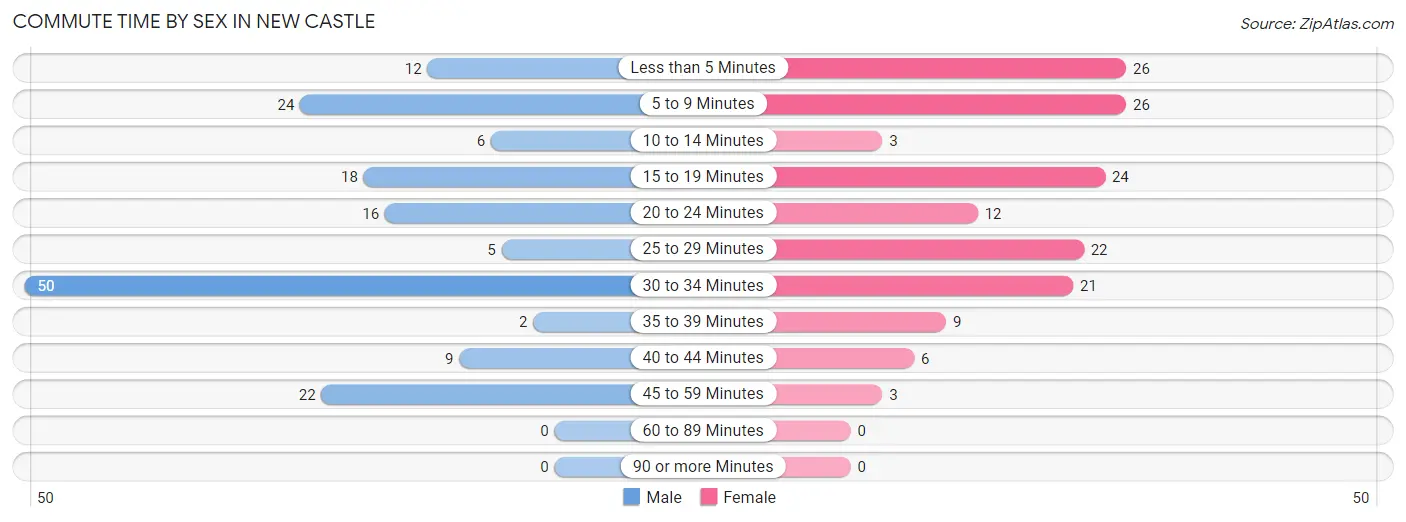
| Commute Time | Male | Female |
| Less than 5 Minutes | 12 (7.3%) | 26 (17.1%) |
| 5 to 9 Minutes | 24 (14.6%) | 26 (17.1%) |
| 10 to 14 Minutes | 6 (3.7%) | 3 (2.0%) |
| 15 to 19 Minutes | 18 (11.0%) | 24 (15.8%) |
| 20 to 24 Minutes | 16 (9.8%) | 12 (7.9%) |
| 25 to 29 Minutes | 5 (3.0%) | 22 (14.5%) |
| 30 to 34 Minutes | 50 (30.5%) | 21 (13.8%) |
| 35 to 39 Minutes | 2 (1.2%) | 9 (5.9%) |
| 40 to 44 Minutes | 9 (5.5%) | 6 (4.0%) |
| 45 to 59 Minutes | 22 (13.4%) | 3 (2.0%) |
| 60 to 89 Minutes | 0 (0.0%) | 0 (0.0%) |
| 90 or more Minutes | 0 (0.0%) | 0 (0.0%) |
Time of Departure to Work by Sex in New Castle
The most frequent times of departure to work in New Castle are 7:30 AM to 7:59 AM (40, 24.4%) for males and 7:00 AM to 7:29 AM (46, 30.3%) for females.
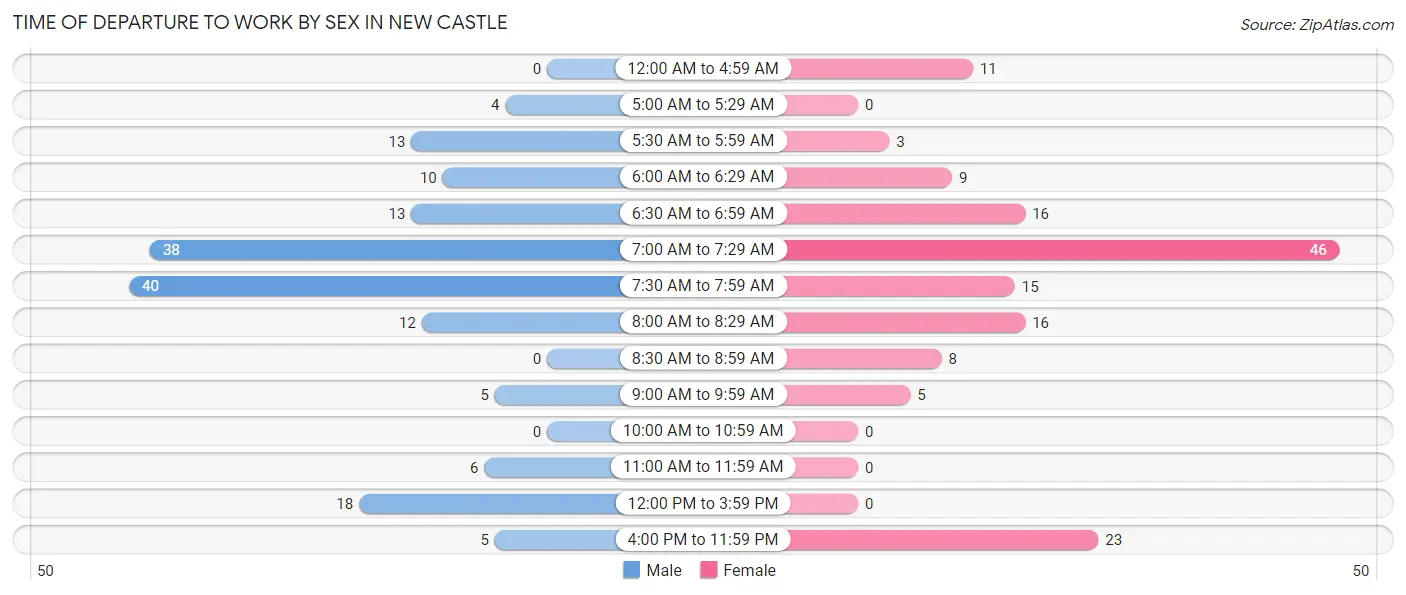
| Time of Departure | Male | Female |
| 12:00 AM to 4:59 AM | 0 (0.0%) | 11 (7.2%) |
| 5:00 AM to 5:29 AM | 4 (2.4%) | 0 (0.0%) |
| 5:30 AM to 5:59 AM | 13 (7.9%) | 3 (2.0%) |
| 6:00 AM to 6:29 AM | 10 (6.1%) | 9 (5.9%) |
| 6:30 AM to 6:59 AM | 13 (7.9%) | 16 (10.5%) |
| 7:00 AM to 7:29 AM | 38 (23.2%) | 46 (30.3%) |
| 7:30 AM to 7:59 AM | 40 (24.4%) | 15 (9.9%) |
| 8:00 AM to 8:29 AM | 12 (7.3%) | 16 (10.5%) |
| 8:30 AM to 8:59 AM | 0 (0.0%) | 8 (5.3%) |
| 9:00 AM to 9:59 AM | 5 (3.0%) | 5 (3.3%) |
| 10:00 AM to 10:59 AM | 0 (0.0%) | 0 (0.0%) |
| 11:00 AM to 11:59 AM | 6 (3.7%) | 0 (0.0%) |
| 12:00 PM to 3:59 PM | 18 (11.0%) | 0 (0.0%) |
| 4:00 PM to 11:59 PM | 5 (3.0%) | 23 (15.1%) |
| Total | 164 (100.0%) | 152 (100.0%) |
Housing Occupancy in New Castle
Occupancy by Ownership in New Castle
Of the total 405 dwellings in New Castle, owner-occupied units account for 232 (57.3%), while renter-occupied units make up 173 (42.7%).
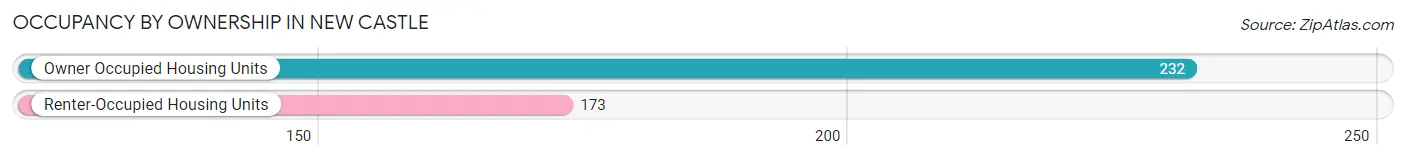
| Occupancy | # Housing Units | % Housing Units |
| Owner Occupied Housing Units | 232 | 57.3% |
| Renter-Occupied Housing Units | 173 | 42.7% |
| Total Occupied Housing Units | 405 | 100.0% |
Occupancy by Household Size in New Castle
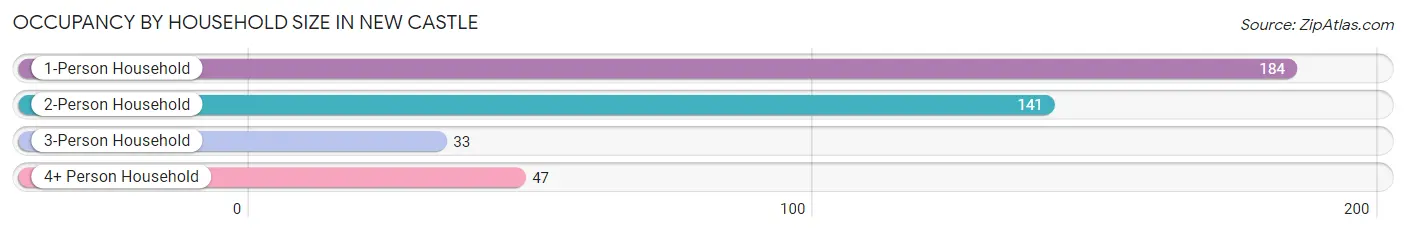
| Household Size | # Housing Units | % Housing Units |
| 1-Person Household | 184 | 45.4% |
| 2-Person Household | 141 | 34.8% |
| 3-Person Household | 33 | 8.2% |
| 4+ Person Household | 47 | 11.6% |
| Total Housing Units | 405 | 100.0% |
Occupancy by Ownership by Household Size in New Castle
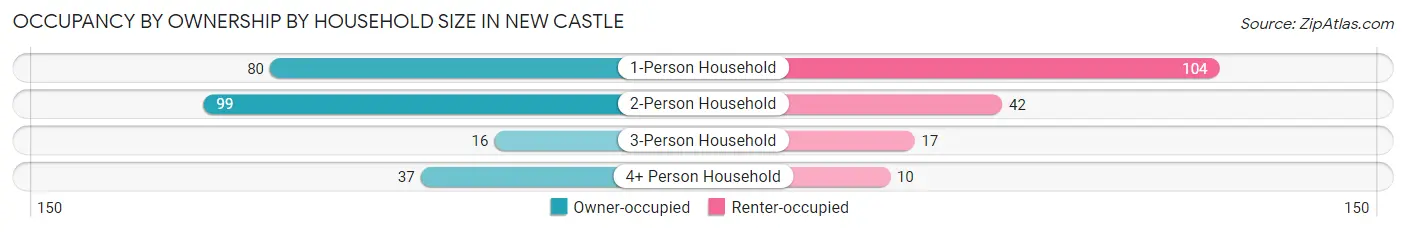
| Household Size | Owner-occupied | Renter-occupied |
| 1-Person Household | 80 (43.5%) | 104 (56.5%) |
| 2-Person Household | 99 (70.2%) | 42 (29.8%) |
| 3-Person Household | 16 (48.5%) | 17 (51.5%) |
| 4+ Person Household | 37 (78.7%) | 10 (21.3%) |
| Total Housing Units | 232 (57.3%) | 173 (42.7%) |
Occupancy by Educational Attainment in New Castle
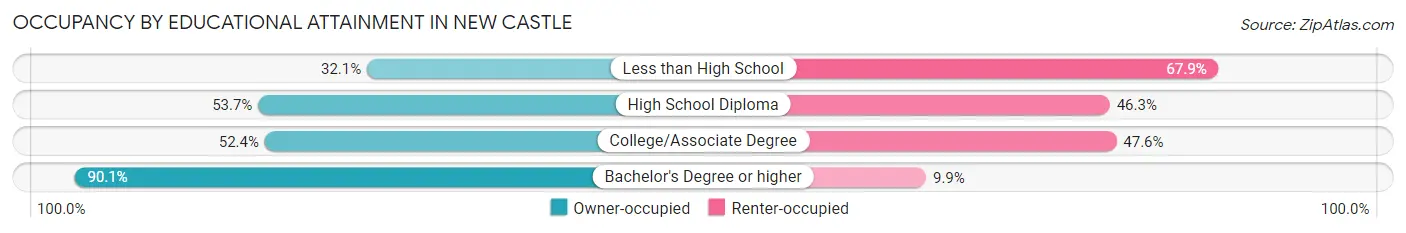
| Household Size | Owner-occupied | Renter-occupied |
| Less than High School | 26 (32.1%) | 55 (67.9%) |
| High School Diploma | 80 (53.7%) | 69 (46.3%) |
| College/Associate Degree | 44 (52.4%) | 40 (47.6%) |
| Bachelor's Degree or higher | 82 (90.1%) | 9 (9.9%) |
Occupancy by Age of Householder in New Castle
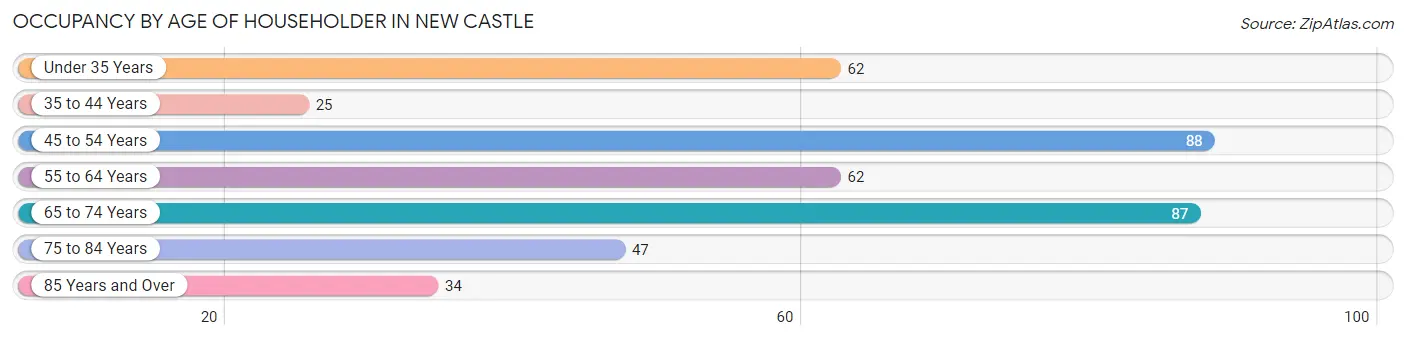
| Age Bracket | # Households | % Households |
| Under 35 Years | 62 | 15.3% |
| 35 to 44 Years | 25 | 6.2% |
| 45 to 54 Years | 88 | 21.7% |
| 55 to 64 Years | 62 | 15.3% |
| 65 to 74 Years | 87 | 21.5% |
| 75 to 84 Years | 47 | 11.6% |
| 85 Years and Over | 34 | 8.4% |
| Total | 405 | 100.0% |
Housing Finances in New Castle
Median Income by Occupancy in New Castle
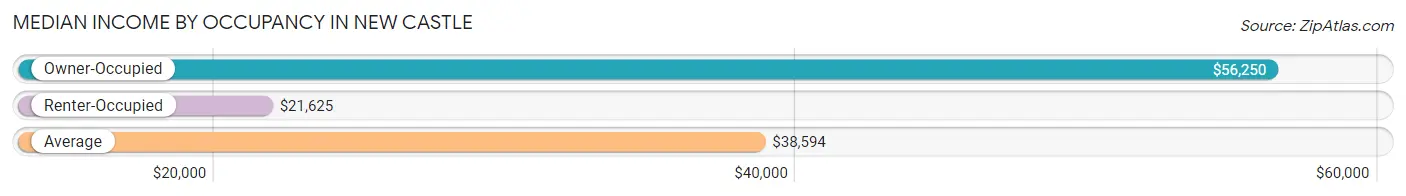
| Occupancy Type | # Households | Median Income |
| Owner-Occupied | 232 (57.3%) | $56,250 |
| Renter-Occupied | 173 (42.7%) | $21,625 |
| Average | 405 (100.0%) | $38,594 |
Occupancy by Householder Income Bracket in New Castle
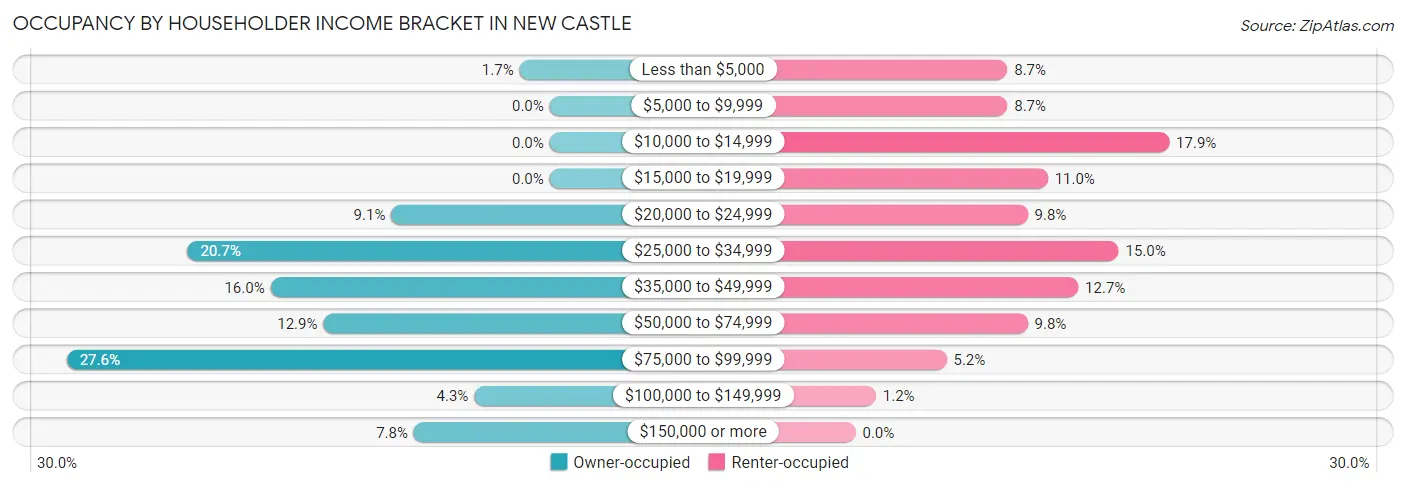
| Income Bracket | Owner-occupied | Renter-occupied |
| Less than $5,000 | 4 (1.7%) | 15 (8.7%) |
| $5,000 to $9,999 | 0 (0.0%) | 15 (8.7%) |
| $10,000 to $14,999 | 0 (0.0%) | 31 (17.9%) |
| $15,000 to $19,999 | 0 (0.0%) | 19 (11.0%) |
| $20,000 to $24,999 | 21 (9.0%) | 17 (9.8%) |
| $25,000 to $34,999 | 48 (20.7%) | 26 (15.0%) |
| $35,000 to $49,999 | 37 (16.0%) | 22 (12.7%) |
| $50,000 to $74,999 | 30 (12.9%) | 17 (9.8%) |
| $75,000 to $99,999 | 64 (27.6%) | 9 (5.2%) |
| $100,000 to $149,999 | 10 (4.3%) | 2 (1.2%) |
| $150,000 or more | 18 (7.8%) | 0 (0.0%) |
| Total | 232 (100.0%) | 173 (100.0%) |
Monthly Housing Cost Tiers in New Castle
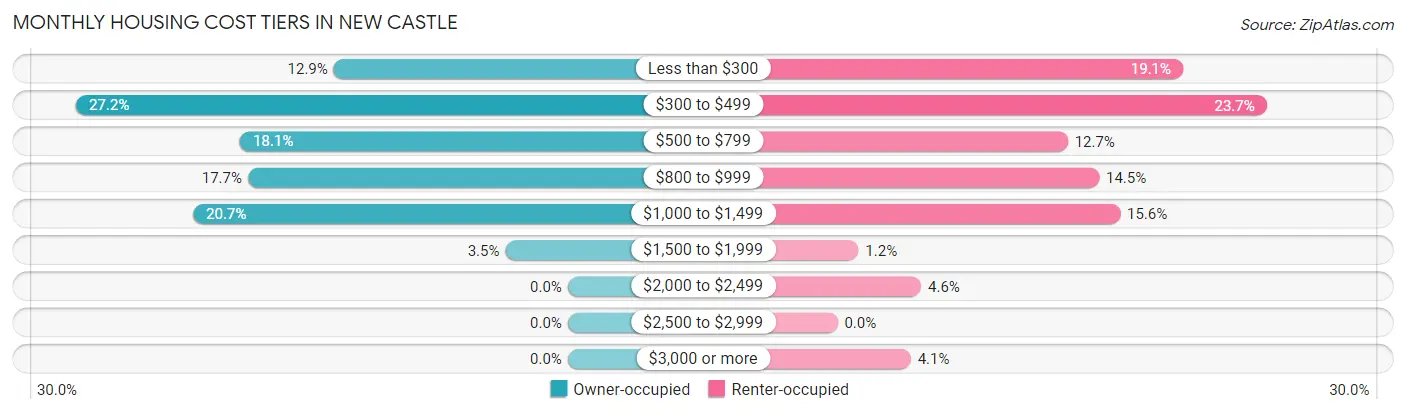
| Monthly Cost | Owner-occupied | Renter-occupied |
| Less than $300 | 30 (12.9%) | 33 (19.1%) |
| $300 to $499 | 63 (27.2%) | 41 (23.7%) |
| $500 to $799 | 42 (18.1%) | 22 (12.7%) |
| $800 to $999 | 41 (17.7%) | 25 (14.4%) |
| $1,000 to $1,499 | 48 (20.7%) | 27 (15.6%) |
| $1,500 to $1,999 | 8 (3.5%) | 2 (1.2%) |
| $2,000 to $2,499 | 0 (0.0%) | 8 (4.6%) |
| $2,500 to $2,999 | 0 (0.0%) | 0 (0.0%) |
| $3,000 or more | 0 (0.0%) | 7 (4.1%) |
| Total | 232 (100.0%) | 173 (100.0%) |
Physical Housing Characteristics in New Castle
Housing Structures in New Castle
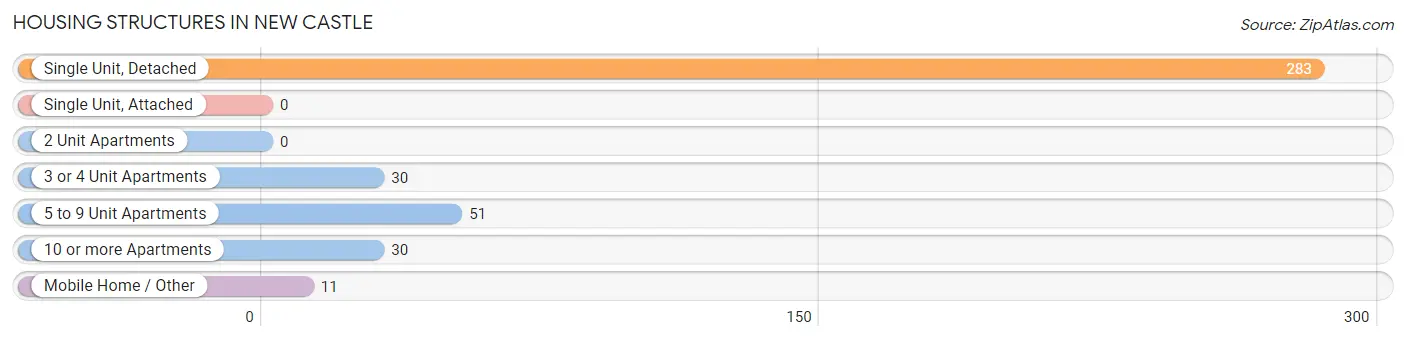
| Structure Type | # Housing Units | % Housing Units |
| Single Unit, Detached | 283 | 69.9% |
| Single Unit, Attached | 0 | 0.0% |
| 2 Unit Apartments | 0 | 0.0% |
| 3 or 4 Unit Apartments | 30 | 7.4% |
| 5 to 9 Unit Apartments | 51 | 12.6% |
| 10 or more Apartments | 30 | 7.4% |
| Mobile Home / Other | 11 | 2.7% |
| Total | 405 | 100.0% |
Housing Structures by Occupancy in New Castle
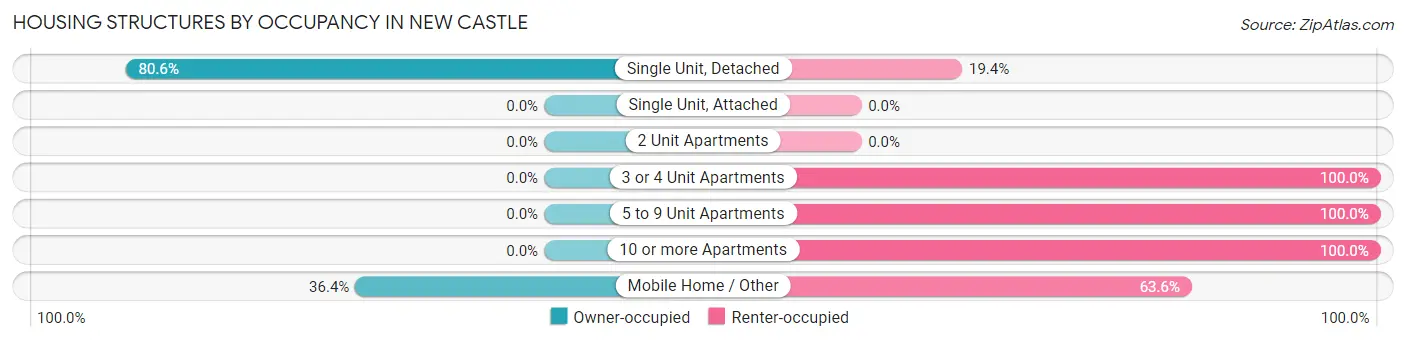
| Structure Type | Owner-occupied | Renter-occupied |
| Single Unit, Detached | 228 (80.6%) | 55 (19.4%) |
| Single Unit, Attached | 0 (0.0%) | 0 (0.0%) |
| 2 Unit Apartments | 0 (0.0%) | 0 (0.0%) |
| 3 or 4 Unit Apartments | 0 (0.0%) | 30 (100.0%) |
| 5 to 9 Unit Apartments | 0 (0.0%) | 51 (100.0%) |
| 10 or more Apartments | 0 (0.0%) | 30 (100.0%) |
| Mobile Home / Other | 4 (36.4%) | 7 (63.6%) |
| Total | 232 (57.3%) | 173 (42.7%) |
Housing Structures by Number of Rooms in New Castle
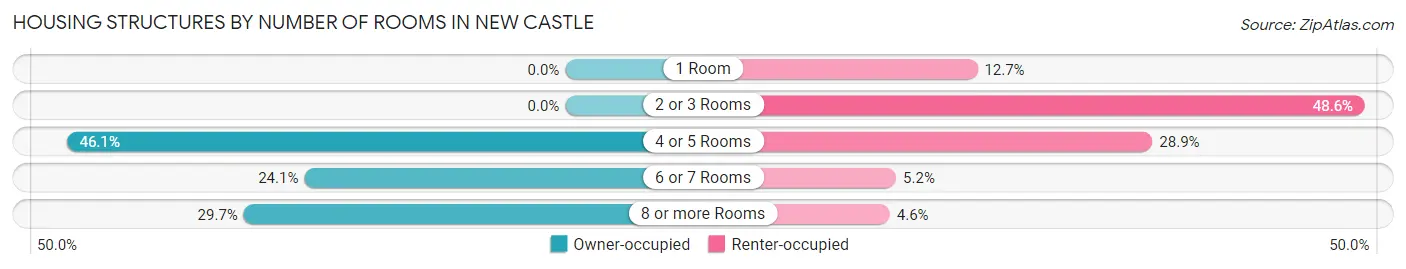
| Number of Rooms | Owner-occupied | Renter-occupied |
| 1 Room | 0 (0.0%) | 22 (12.7%) |
| 2 or 3 Rooms | 0 (0.0%) | 84 (48.5%) |
| 4 or 5 Rooms | 107 (46.1%) | 50 (28.9%) |
| 6 or 7 Rooms | 56 (24.1%) | 9 (5.2%) |
| 8 or more Rooms | 69 (29.7%) | 8 (4.6%) |
| Total | 232 (100.0%) | 173 (100.0%) |
Housing Structure by Heating Type in New Castle
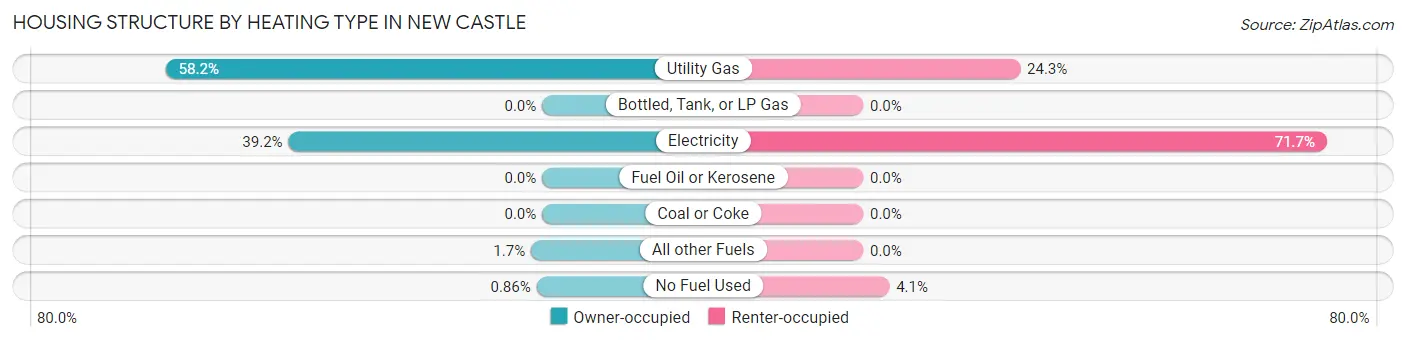
| Heating Type | Owner-occupied | Renter-occupied |
| Utility Gas | 135 (58.2%) | 42 (24.3%) |
| Bottled, Tank, or LP Gas | 0 (0.0%) | 0 (0.0%) |
| Electricity | 91 (39.2%) | 124 (71.7%) |
| Fuel Oil or Kerosene | 0 (0.0%) | 0 (0.0%) |
| Coal or Coke | 0 (0.0%) | 0 (0.0%) |
| All other Fuels | 4 (1.7%) | 0 (0.0%) |
| No Fuel Used | 2 (0.9%) | 7 (4.1%) |
| Total | 232 (100.0%) | 173 (100.0%) |
Household Vehicle Usage in New Castle
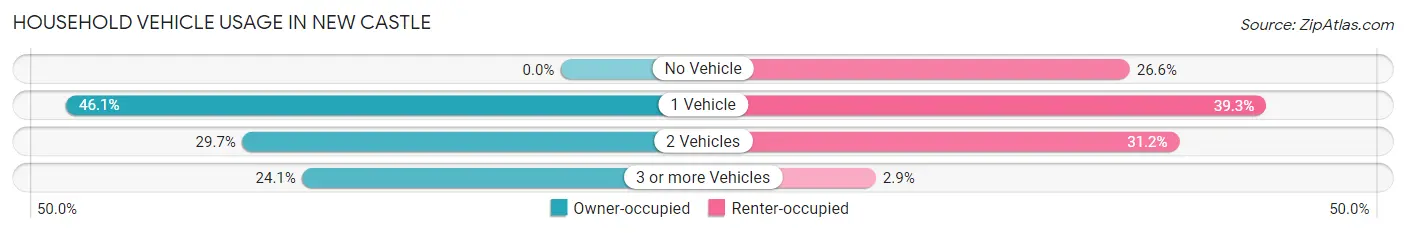
| Vehicles per Household | Owner-occupied | Renter-occupied |
| No Vehicle | 0 (0.0%) | 46 (26.6%) |
| 1 Vehicle | 107 (46.1%) | 68 (39.3%) |
| 2 Vehicles | 69 (29.7%) | 54 (31.2%) |
| 3 or more Vehicles | 56 (24.1%) | 5 (2.9%) |
| Total | 232 (100.0%) | 173 (100.0%) |
Real Estate & Mortgages in New Castle
Real Estate and Mortgage Overview in New Castle
| Characteristic | Without Mortgage | With Mortgage |
| Housing Units | 129 | 103 |
| Median Property Value | $132,100 | $115,300 |
| Median Household Income | $57,031 | $7 |
| Monthly Housing Costs | $437 | $0 |
| Real Estate Taxes | $1,076 | $3 |
Property Value by Mortgage Status in New Castle
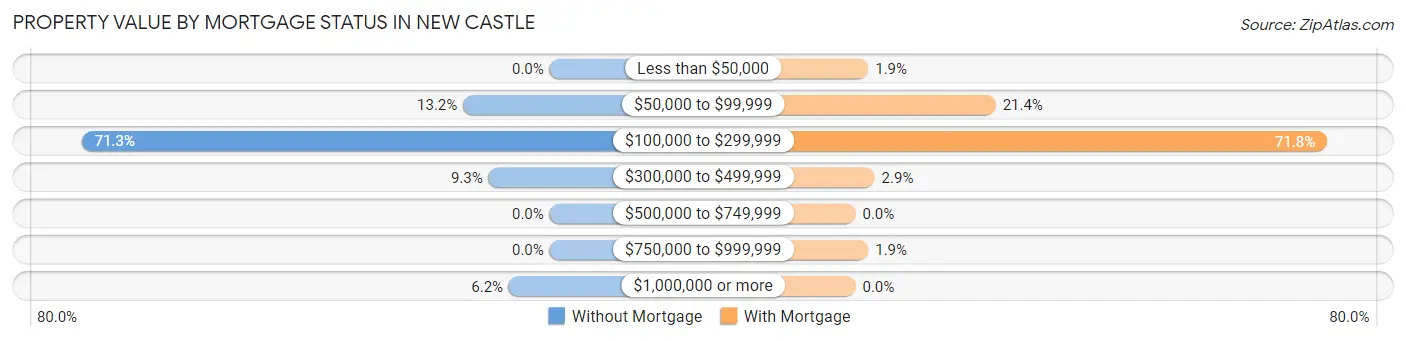
| Property Value | Without Mortgage | With Mortgage |
| Less than $50,000 | 0 (0.0%) | 2 (1.9%) |
| $50,000 to $99,999 | 17 (13.2%) | 22 (21.4%) |
| $100,000 to $299,999 | 92 (71.3%) | 74 (71.8%) |
| $300,000 to $499,999 | 12 (9.3%) | 3 (2.9%) |
| $500,000 to $749,999 | 0 (0.0%) | 0 (0.0%) |
| $750,000 to $999,999 | 0 (0.0%) | 2 (1.9%) |
| $1,000,000 or more | 8 (6.2%) | 0 (0.0%) |
| Total | 129 (100.0%) | 103 (100.0%) |
Household Income by Mortgage Status in New Castle
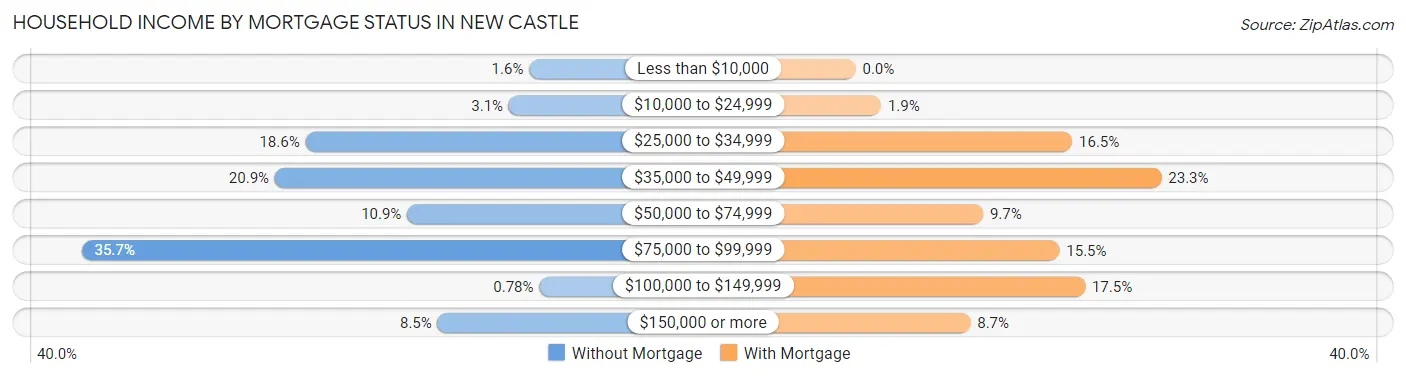
| Household Income | Without Mortgage | With Mortgage |
| Less than $10,000 | 2 (1.5%) | 0 (0.0%) |
| $10,000 to $24,999 | 4 (3.1%) | 2 (1.9%) |
| $25,000 to $34,999 | 24 (18.6%) | 17 (16.5%) |
| $35,000 to $49,999 | 27 (20.9%) | 24 (23.3%) |
| $50,000 to $74,999 | 14 (10.8%) | 10 (9.7%) |
| $75,000 to $99,999 | 46 (35.7%) | 16 (15.5%) |
| $100,000 to $149,999 | 1 (0.8%) | 18 (17.5%) |
| $150,000 or more | 11 (8.5%) | 9 (8.7%) |
| Total | 129 (100.0%) | 103 (100.0%) |
Property Value to Household Income Ratio in New Castle
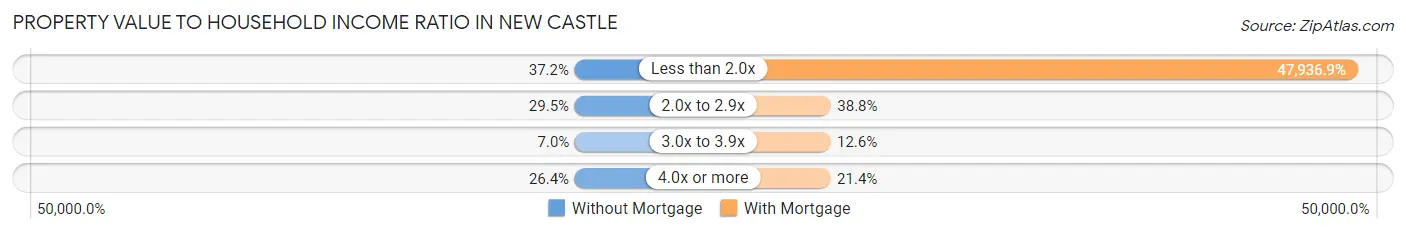
| Value-to-Income Ratio | Without Mortgage | With Mortgage |
| Less than 2.0x | 48 (37.2%) | 49,375 (47,936.9%) |
| 2.0x to 2.9x | 38 (29.5%) | 40 (38.8%) |
| 3.0x to 3.9x | 9 (7.0%) | 13 (12.6%) |
| 4.0x or more | 34 (26.4%) | 22 (21.4%) |
| Total | 129 (100.0%) | 103 (100.0%) |
Real Estate Taxes by Mortgage Status in New Castle
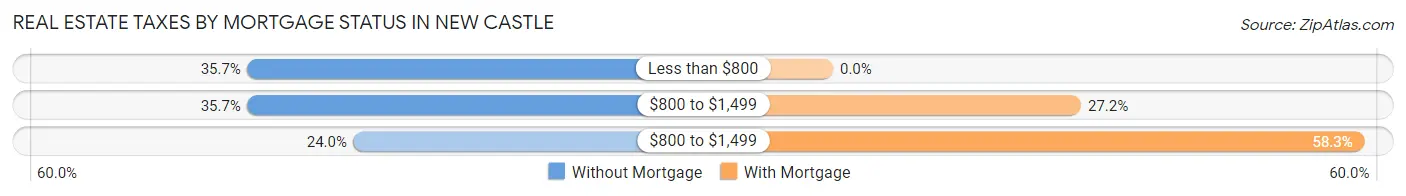
| Property Taxes | Without Mortgage | With Mortgage |
| Less than $800 | 46 (35.7%) | 0 (0.0%) |
| $800 to $1,499 | 46 (35.7%) | 28 (27.2%) |
| $800 to $1,499 | 31 (24.0%) | 60 (58.3%) |
| Total | 129 (100.0%) | 103 (100.0%) |
Health & Disability in New Castle
Health Insurance Coverage by Age in New Castle
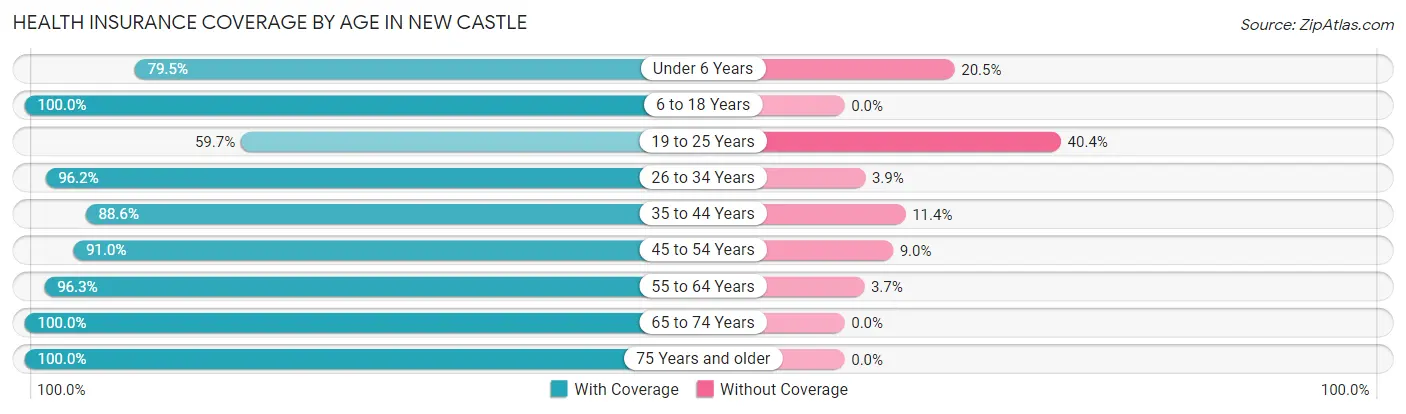
| Age Bracket | With Coverage | Without Coverage |
| Under 6 Years | 31 (79.5%) | 8 (20.5%) |
| 6 to 18 Years | 85 (100.0%) | 0 (0.0%) |
| 19 to 25 Years | 34 (59.7%) | 23 (40.4%) |
| 26 to 34 Years | 100 (96.2%) | 4 (3.8%) |
| 35 to 44 Years | 39 (88.6%) | 5 (11.4%) |
| 45 to 54 Years | 131 (91.0%) | 13 (9.0%) |
| 55 to 64 Years | 105 (96.3%) | 4 (3.7%) |
| 65 to 74 Years | 111 (100.0%) | 0 (0.0%) |
| 75 Years and older | 105 (100.0%) | 0 (0.0%) |
| Total | 741 (92.9%) | 57 (7.1%) |
Health Insurance Coverage by Citizenship Status in New Castle
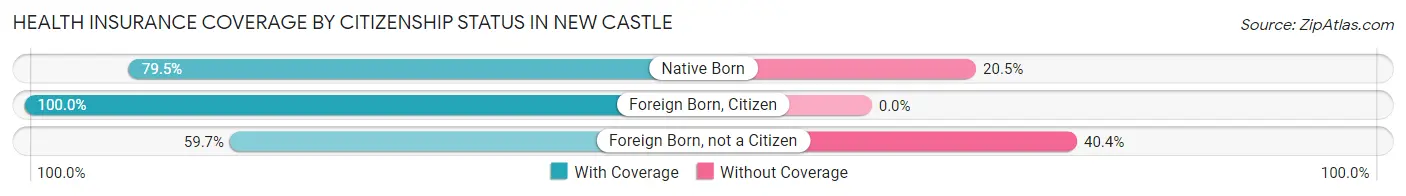
| Citizenship Status | With Coverage | Without Coverage |
| Native Born | 31 (79.5%) | 8 (20.5%) |
| Foreign Born, Citizen | 85 (100.0%) | 0 (0.0%) |
| Foreign Born, not a Citizen | 34 (59.7%) | 23 (40.4%) |
Health Insurance Coverage by Household Income in New Castle
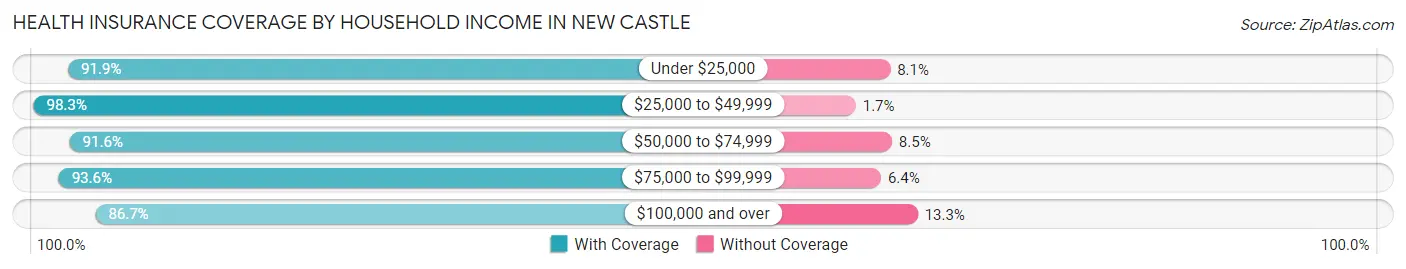
| Household Income | With Coverage | Without Coverage |
| Under $25,000 | 158 (91.9%) | 14 (8.1%) |
| $25,000 to $49,999 | 176 (98.3%) | 3 (1.7%) |
| $50,000 to $74,999 | 130 (91.5%) | 12 (8.5%) |
| $75,000 to $99,999 | 161 (93.6%) | 11 (6.4%) |
| $100,000 and over | 111 (86.7%) | 17 (13.3%) |
Public vs Private Health Insurance Coverage by Age in New Castle
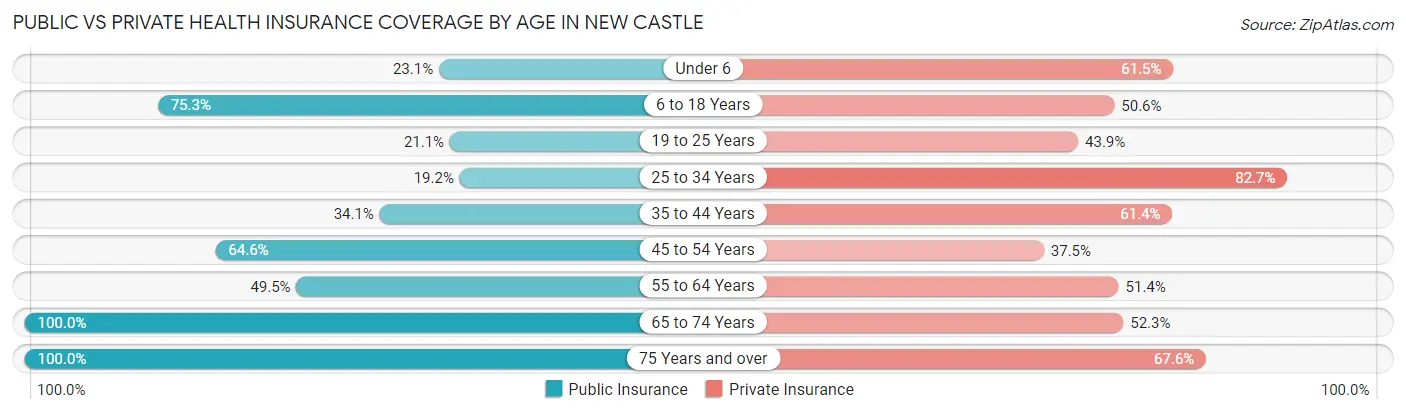
| Age Bracket | Public Insurance | Private Insurance |
| Under 6 | 9 (23.1%) | 24 (61.5%) |
| 6 to 18 Years | 64 (75.3%) | 43 (50.6%) |
| 19 to 25 Years | 12 (21.0%) | 25 (43.9%) |
| 25 to 34 Years | 20 (19.2%) | 86 (82.7%) |
| 35 to 44 Years | 15 (34.1%) | 27 (61.4%) |
| 45 to 54 Years | 93 (64.6%) | 54 (37.5%) |
| 55 to 64 Years | 54 (49.5%) | 56 (51.4%) |
| 65 to 74 Years | 111 (100.0%) | 58 (52.2%) |
| 75 Years and over | 105 (100.0%) | 71 (67.6%) |
| Total | 483 (60.5%) | 444 (55.6%) |
Disability Status by Sex by Age in New Castle
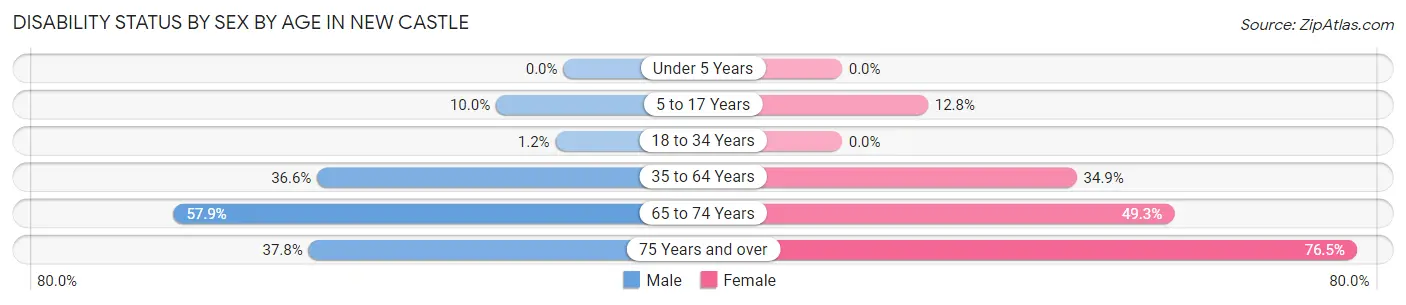
| Age Bracket | Male | Female |
| Under 5 Years | 0 (0.0%) | 0 (0.0%) |
| 5 to 17 Years | 4 (10.0%) | 6 (12.8%) |
| 18 to 34 Years | 1 (1.2%) | 0 (0.0%) |
| 35 to 64 Years | 53 (36.5%) | 53 (34.9%) |
| 65 to 74 Years | 22 (57.9%) | 36 (49.3%) |
| 75 Years and over | 14 (37.8%) | 52 (76.5%) |
Disability Class by Sex by Age in New Castle
Disability Class: Hearing Difficulty
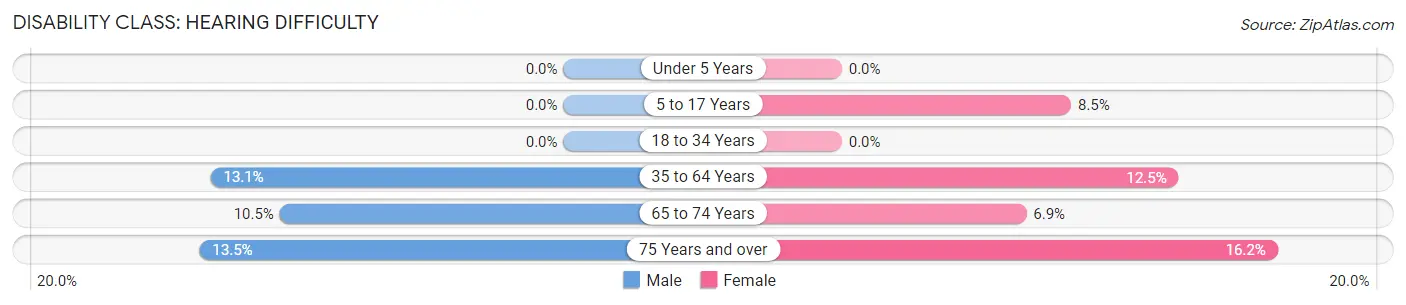
| Age Bracket | Male | Female |
| Under 5 Years | 0 (0.0%) | 0 (0.0%) |
| 5 to 17 Years | 0 (0.0%) | 4 (8.5%) |
| 18 to 34 Years | 0 (0.0%) | 0 (0.0%) |
| 35 to 64 Years | 19 (13.1%) | 19 (12.5%) |
| 65 to 74 Years | 4 (10.5%) | 5 (6.9%) |
| 75 Years and over | 5 (13.5%) | 11 (16.2%) |
Disability Class: Vision Difficulty
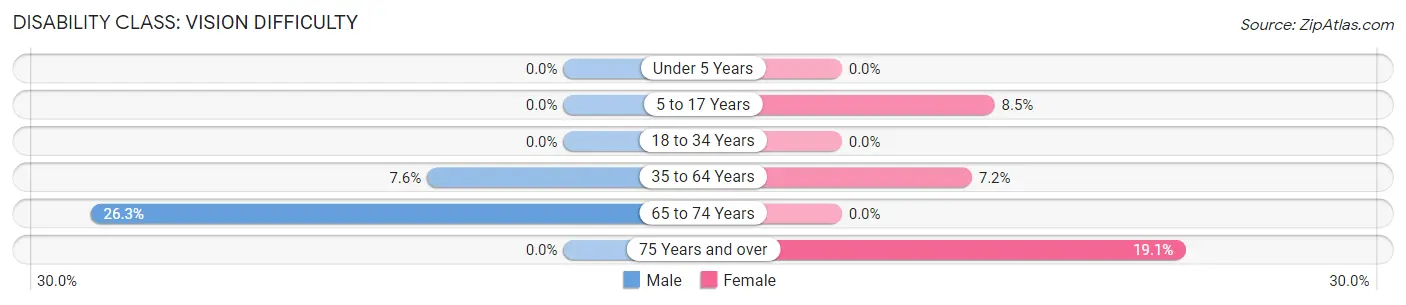
| Age Bracket | Male | Female |
| Under 5 Years | 0 (0.0%) | 0 (0.0%) |
| 5 to 17 Years | 0 (0.0%) | 4 (8.5%) |
| 18 to 34 Years | 0 (0.0%) | 0 (0.0%) |
| 35 to 64 Years | 11 (7.6%) | 11 (7.2%) |
| 65 to 74 Years | 10 (26.3%) | 0 (0.0%) |
| 75 Years and over | 0 (0.0%) | 13 (19.1%) |
Disability Class: Cognitive Difficulty
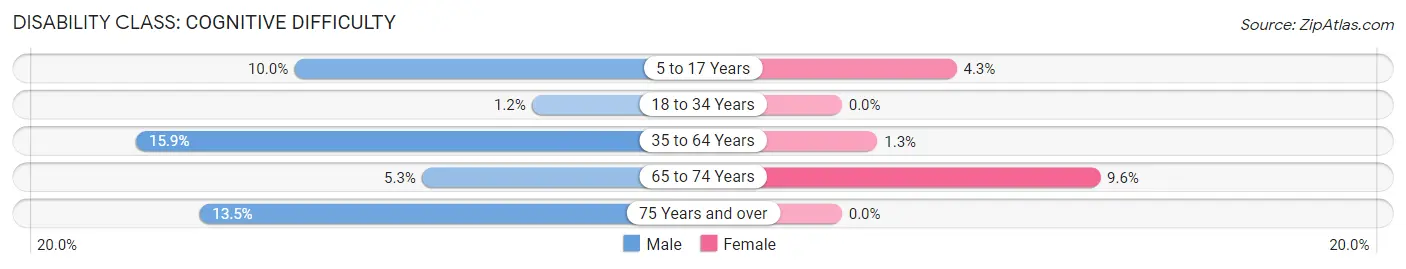
| Age Bracket | Male | Female |
| 5 to 17 Years | 4 (10.0%) | 2 (4.3%) |
| 18 to 34 Years | 1 (1.2%) | 0 (0.0%) |
| 35 to 64 Years | 23 (15.9%) | 2 (1.3%) |
| 65 to 74 Years | 2 (5.3%) | 7 (9.6%) |
| 75 Years and over | 5 (13.5%) | 0 (0.0%) |
Disability Class: Ambulatory Difficulty
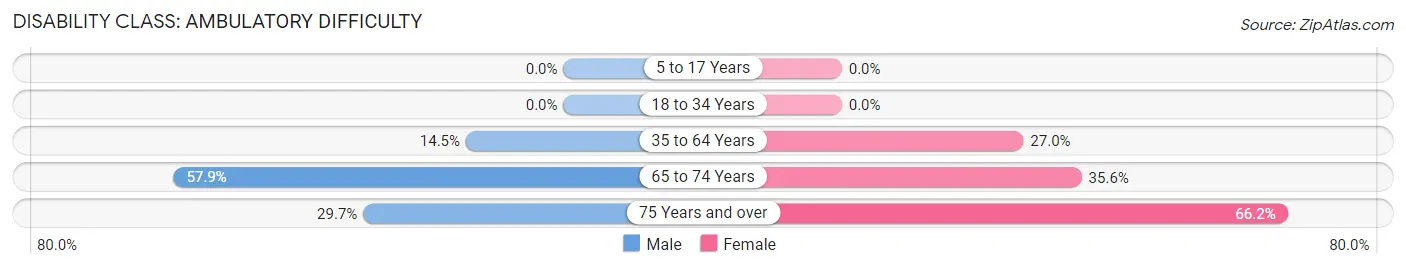
| Age Bracket | Male | Female |
| 5 to 17 Years | 0 (0.0%) | 0 (0.0%) |
| 18 to 34 Years | 0 (0.0%) | 0 (0.0%) |
| 35 to 64 Years | 21 (14.5%) | 41 (27.0%) |
| 65 to 74 Years | 22 (57.9%) | 26 (35.6%) |
| 75 Years and over | 11 (29.7%) | 45 (66.2%) |
Disability Class: Self-Care Difficulty
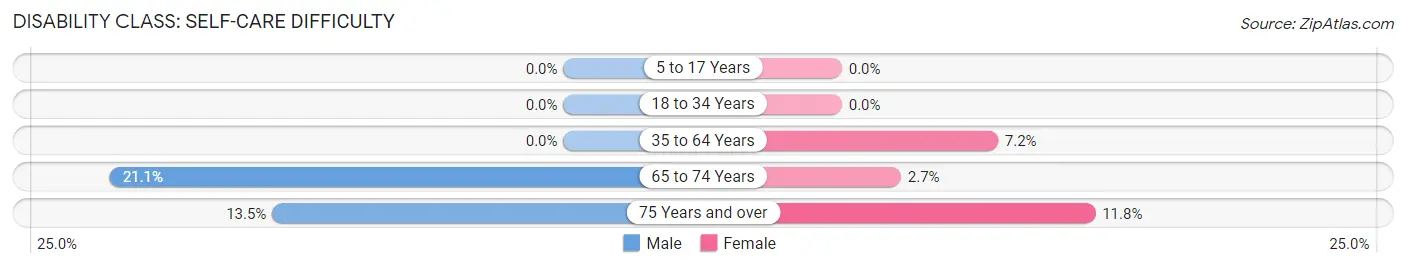
| Age Bracket | Male | Female |
| 5 to 17 Years | 0 (0.0%) | 0 (0.0%) |
| 18 to 34 Years | 0 (0.0%) | 0 (0.0%) |
| 35 to 64 Years | 0 (0.0%) | 11 (7.2%) |
| 65 to 74 Years | 8 (21.0%) | 2 (2.7%) |
| 75 Years and over | 5 (13.5%) | 8 (11.8%) |
Technology Access in New Castle
Computing Device Access in New Castle
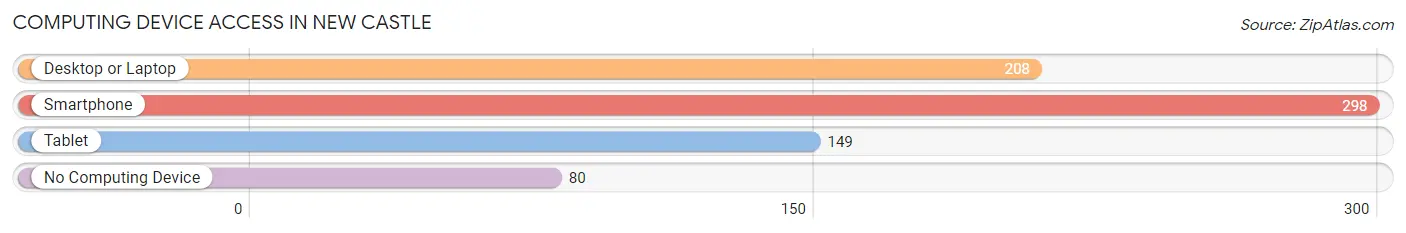
| Device Type | # Households | % Households |
| Desktop or Laptop | 208 | 51.4% |
| Smartphone | 298 | 73.6% |
| Tablet | 149 | 36.8% |
| No Computing Device | 80 | 19.8% |
| Total | 405 | 100.0% |
Internet Access in New Castle
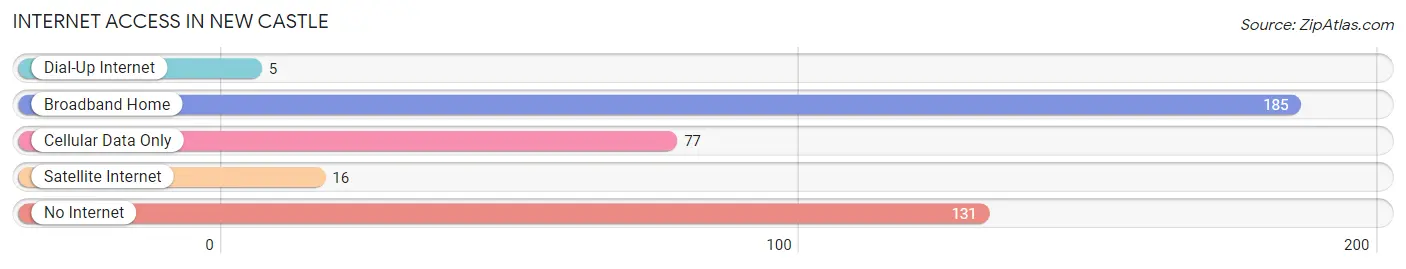
| Internet Type | # Households | % Households |
| Dial-Up Internet | 5 | 1.2% |
| Broadband Home | 185 | 45.7% |
| Cellular Data Only | 77 | 19.0% |
| Satellite Internet | 16 | 4.0% |
| No Internet | 131 | 32.4% |
| Total | 405 | 100.0% |
New Castle Summary
New Castle is a small city located in Henry County, Kentucky. It is situated in the heart of the Bluegrass Region, and is part of the Louisville/Jefferson County Metropolitan Statistical Area. The city has a population of approximately 1,500 people, and is the county seat of Henry County.
History
New Castle was founded in 1836 by a group of settlers from Virginia. The city was named after the nearby New Castle Creek, which was named after the city of Newcastle-upon-Tyne in England. The city was incorporated in 1837, and the first post office was established in 1838.
The city was an important stop on the Louisville and Nashville Railroad, which was completed in 1859. This allowed the city to become a major shipping center for the region. The city was also home to several manufacturing plants, including a flour mill, a sawmill, and a furniture factory.
The city was also home to several Civil War battles, including the Battle of New Castle in 1862. The city was occupied by Confederate forces during the war, and was the site of a major skirmish in 1864.
Geography
New Castle is located in the Bluegrass Region of Kentucky, in the central part of the state. The city is situated in the western part of Henry County, and is bordered by Shelby County to the north, Oldham County to the east, and Trimble County to the south. The city is located approximately 25 miles northeast of Louisville, and is part of the Louisville/Jefferson County Metropolitan Statistical Area.
The city is situated on the banks of the New Castle Creek, which flows through the city and empties into the Kentucky River. The city is located in a hilly region, and is surrounded by rolling hills and farmland.
Economy
The economy of New Castle is largely based on agriculture and manufacturing. The city is home to several manufacturing plants, including a furniture factory, a sawmill, and a flour mill. The city is also home to several agricultural businesses, including a dairy farm, a feed mill, and a grain elevator.
The city is also home to several retail businesses, including a grocery store, a hardware store, and a pharmacy. The city is also home to several restaurants, including a pizza parlor, a Mexican restaurant, and a steakhouse.
Demographics
As of the 2010 census, the population of New Castle was 1,500 people. The racial makeup of the city was 95.3% White, 1.7% African American, 0.3% Native American, 0.3% Asian, 0.7% from other races, and 1.7% from two or more races. Hispanic or Latino of any race were 1.7% of the population.
The median household income in New Castle was $37,500, and the median family income was $45,000. The per capita income in the city was $18,000. About 11.7% of the population was below the poverty line.
Common Questions
What is Per Capita Income in New Castle?
Per Capita income in New Castle is $26,450.
What is the Median Family Income in New Castle?
Median Family Income in New Castle is $63,750.
What is the Median Household income in New Castle?
Median Household Income in New Castle is $38,594.
What is Income or Wage Gap in New Castle?
Income or Wage Gap in New Castle is 29.7%.
Women in New Castle earn 70.3 cents for every dollar earned by a man.
What is Inequality or Gini Index in New Castle?
Inequality or Gini Index in New Castle is 0.43.
What is the Total Population of New Castle?
Total Population of New Castle is 880.
What is the Total Male Population of New Castle?
Total Male Population of New Castle is 372.
What is the Total Female Population of New Castle?
Total Female Population of New Castle is 508.
What is the Ratio of Males per 100 Females in New Castle?
There are 73.23 Males per 100 Females in New Castle.
What is the Ratio of Females per 100 Males in New Castle?
There are 136.56 Females per 100 Males in New Castle.
What is the Median Population Age in New Castle?
Median Population Age in New Castle is 52.1 Years.
What is the Average Family Size in New Castle
Average Family Size in New Castle is 2.7 People.
What is the Average Household Size in New Castle
Average Household Size in New Castle is 2.0 People.
How Large is the Labor Force in New Castle?
There are 348 People in the Labor Forcein in New Castle.
What is the Percentage of People in the Labor Force in New Castle?
45.1% of People are in the Labor Force in New Castle.
What is the Unemployment Rate in New Castle?
Unemployment Rate in New Castle is 4.9%.