Whitesburg, KY Map & Demographics
Whitesburg Map
Whitesburg Overview
$25,628
PER CAPITA INCOME
$46,250
AVG FAMILY INCOME
$32,663
AVG HOUSEHOLD INCOME
41.0%
WAGE / INCOME GAP [ % ]
59.0¢/ $1
WAGE / INCOME GAP [ $ ]
$12,184
FAMILY INCOME DEFICIT
0.57
INEQUALITY / GINI INDEX
2,153
TOTAL POPULATION
938
MALE POPULATION
1,215
FEMALE POPULATION
77.20
MALES / 100 FEMALES
129.53
FEMALES / 100 MALES
41.0
MEDIAN AGE
3.0
AVG FAMILY SIZE
2.4
AVG HOUSEHOLD SIZE
789
LABOR FORCE [ PEOPLE ]
45.1%
PERCENT IN LABOR FORCE
17.6%
UNEMPLOYMENT RATE
Whitesburg Zip Codes
Whitesburg Area Codes
Income in Whitesburg
Income Overview in Whitesburg
Per Capita Income in Whitesburg is $25,628, while median incomes of families and households are $46,250 and $32,663 respectively.
| Characteristic | Number | Measure |
| Per Capita Income | 2,153 | $25,628 |
| Median Family Income | 534 | $46,250 |
| Mean Family Income | 534 | $63,713 |
| Median Household Income | 803 | $32,663 |
| Mean Household Income | 803 | $62,254 |
| Income Deficit | 534 | $12,184 |
| Wage / Income Gap (%) | 2,153 | 41.01% |
| Wage / Income Gap ($) | 2,153 | 58.99¢ per $1 |
| Gini / Inequality Index | 2,153 | 0.57 |
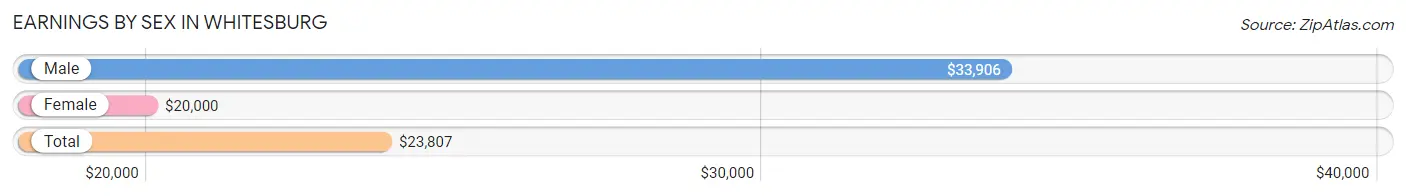
Earnings by Sex in Whitesburg
Average Earnings in Whitesburg are $23,807, $33,906 for men and $20,000 for women, a difference of 41.0%.
| Sex | Number | Average Earnings |
| Male | 366 (45.6%) | $33,906 |
| Female | 436 (54.4%) | $20,000 |
| Total | 802 (100.0%) | $23,807 |
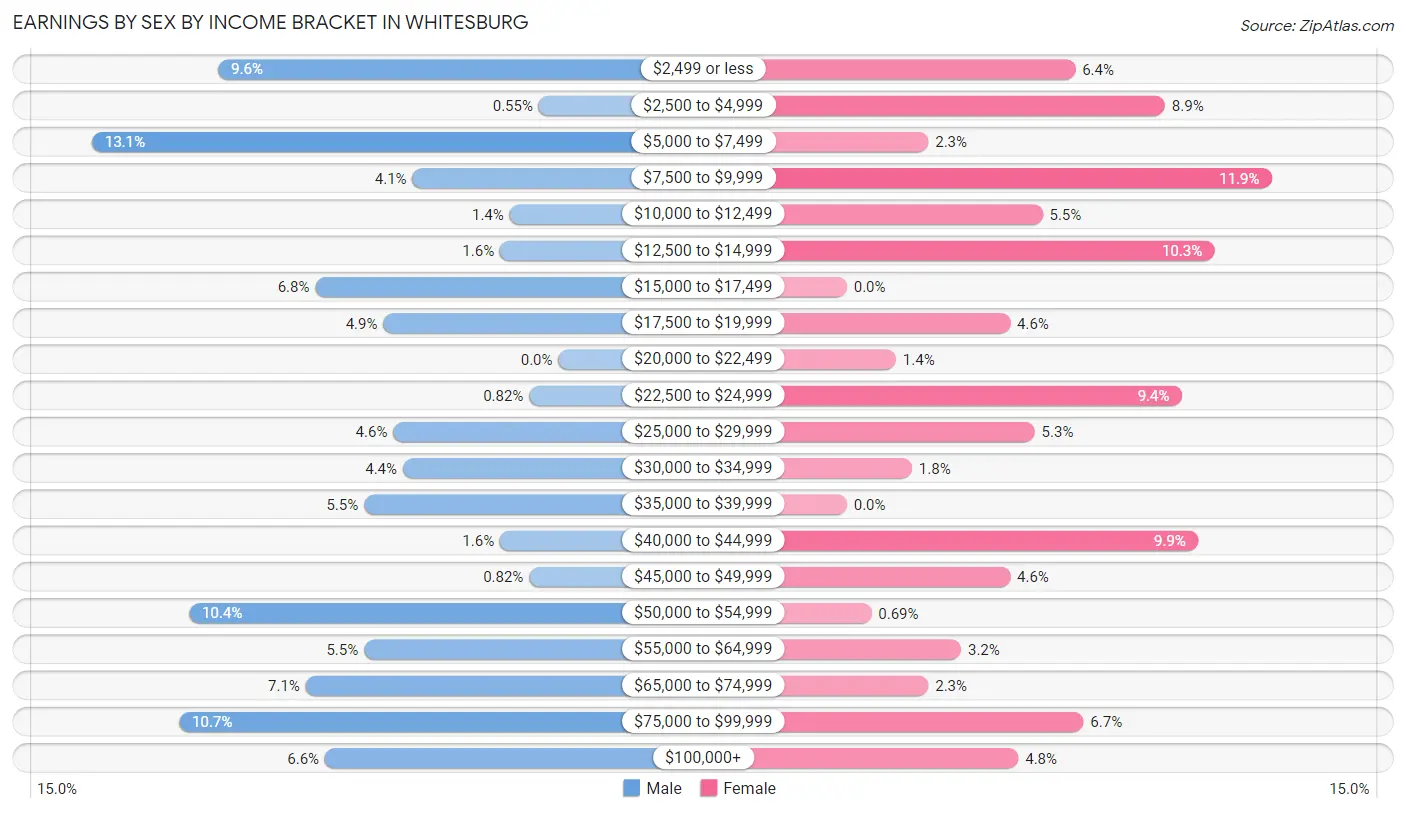
Earnings by Sex by Income Bracket in Whitesburg
The most common earnings brackets in Whitesburg are $5,000 to $7,499 for men (48 | 13.1%) and $7,500 to $9,999 for women (52 | 11.9%).
| Income | Male | Female |
| $2,499 or less | 35 (9.6%) | 28 (6.4%) |
| $2,500 to $4,999 | 2 (0.5%) | 39 (8.9%) |
| $5,000 to $7,499 | 48 (13.1%) | 10 (2.3%) |
| $7,500 to $9,999 | 15 (4.1%) | 52 (11.9%) |
| $10,000 to $12,499 | 5 (1.4%) | 24 (5.5%) |
| $12,500 to $14,999 | 6 (1.6%) | 45 (10.3%) |
| $15,000 to $17,499 | 25 (6.8%) | 0 (0.0%) |
| $17,500 to $19,999 | 18 (4.9%) | 20 (4.6%) |
| $20,000 to $22,499 | 0 (0.0%) | 6 (1.4%) |
| $22,500 to $24,999 | 3 (0.8%) | 41 (9.4%) |
| $25,000 to $29,999 | 17 (4.6%) | 23 (5.3%) |
| $30,000 to $34,999 | 16 (4.4%) | 8 (1.8%) |
| $35,000 to $39,999 | 20 (5.5%) | 0 (0.0%) |
| $40,000 to $44,999 | 6 (1.6%) | 43 (9.9%) |
| $45,000 to $49,999 | 3 (0.8%) | 20 (4.6%) |
| $50,000 to $54,999 | 38 (10.4%) | 3 (0.7%) |
| $55,000 to $64,999 | 20 (5.5%) | 14 (3.2%) |
| $65,000 to $74,999 | 26 (7.1%) | 10 (2.3%) |
| $75,000 to $99,999 | 39 (10.7%) | 29 (6.7%) |
| $100,000+ | 24 (6.6%) | 21 (4.8%) |
| Total | 366 (100.0%) | 436 (100.0%) |
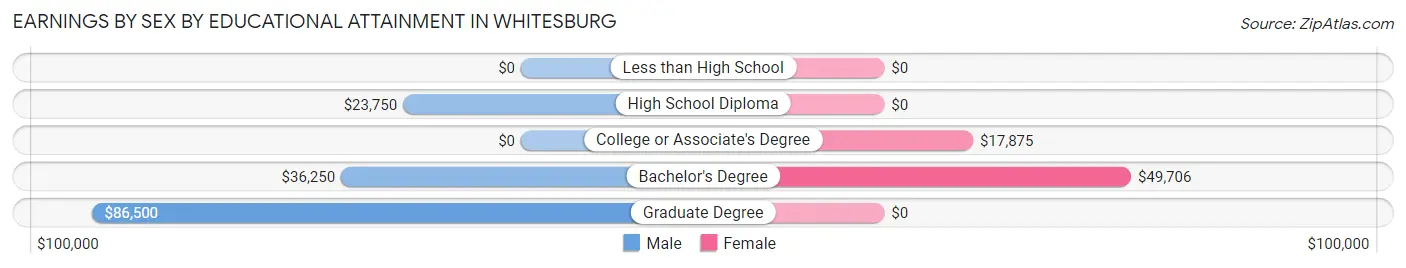
Earnings by Sex by Educational Attainment in Whitesburg
Average earnings in Whitesburg are $34,766 for men and $22,561 for women, a difference of 35.1%. Men with an educational attainment of graduate degree enjoy the highest average annual earnings of $86,500, while those with high school diploma education earn the least with $23,750. Women with an educational attainment of bachelor's degree earn the most with the average annual earnings of $49,706, while those with college or associate's degree education have the smallest earnings of $17,875.
| Educational Attainment | Male Income | Female Income |
| Less than High School | - | - |
| High School Diploma | $23,750 | $0 |
| College or Associate's Degree | - | - |
| Bachelor's Degree | $36,250 | $49,706 |
| Graduate Degree | $86,500 | $0 |
| Total | $34,766 | $22,561 |
Family Income in Whitesburg
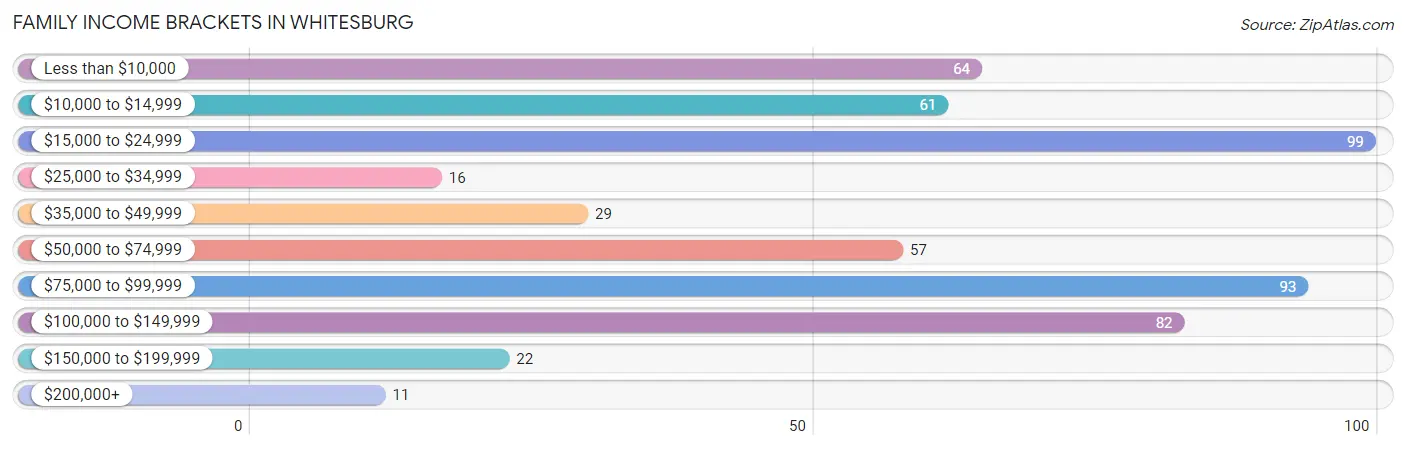
Family Income Brackets in Whitesburg
According to the Whitesburg family income data, there are 99 families falling into the $15,000 to $24,999 income range, which is the most common income bracket and makes up 18.5% of all families. Conversely, the $200,000+ income bracket is the least frequent group with only 11 families (2.1%) belonging to this category.
| Income Bracket | # Families | % Families |
| Less than $10,000 | 64 | 12.0% |
| $10,000 to $14,999 | 61 | 11.4% |
| $15,000 to $24,999 | 99 | 18.5% |
| $25,000 to $34,999 | 16 | 3.0% |
| $35,000 to $49,999 | 29 | 5.4% |
| $50,000 to $74,999 | 57 | 10.7% |
| $75,000 to $99,999 | 93 | 17.4% |
| $100,000 to $149,999 | 82 | 15.4% |
| $150,000 to $199,999 | 22 | 4.1% |
| $200,000+ | 11 | 2.1% |
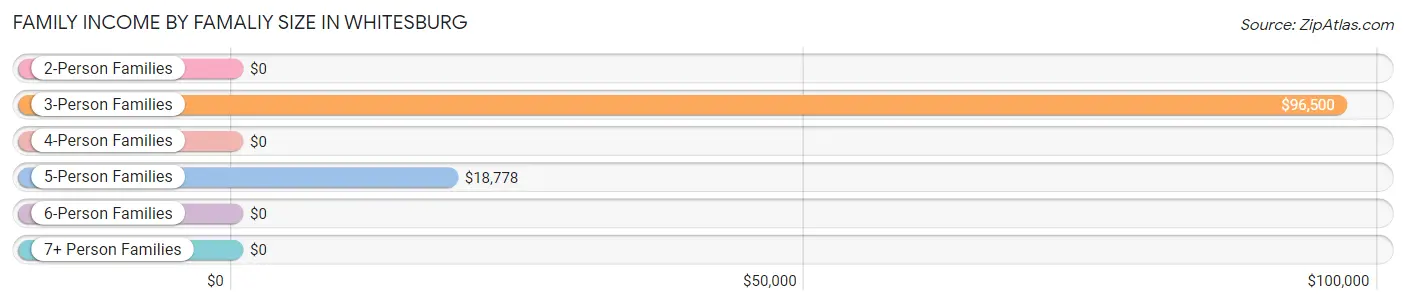
Family Income by Famaliy Size in Whitesburg
3-person families (108 | 20.2%) account for the highest median family income in Whitesburg with $96,500 per family, while 3-person families (108 | 20.2%) have the highest median income of $32,167 per family member.
| Income Bracket | # Families | Median Income |
| 2-Person Families | 273 (51.1%) | $0 |
| 3-Person Families | 108 (20.2%) | $96,500 |
| 4-Person Families | 89 (16.7%) | $0 |
| 5-Person Families | 46 (8.6%) | $18,778 |
| 6-Person Families | 16 (3.0%) | $0 |
| 7+ Person Families | 2 (0.4%) | $0 |
| Total | 534 (100.0%) | $46,250 |
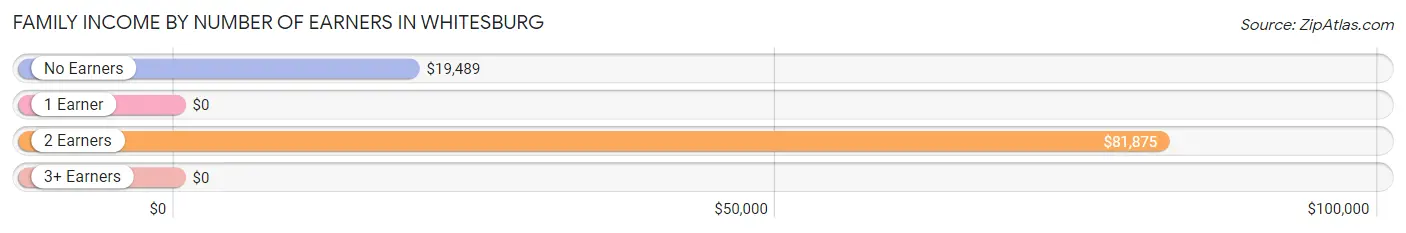
Family Income by Number of Earners in Whitesburg
| Number of Earners | # Families | Median Income |
| No Earners | 174 (32.6%) | $19,489 |
| 1 Earner | 162 (30.3%) | $0 |
| 2 Earners | 188 (35.2%) | $81,875 |
| 3+ Earners | 10 (1.9%) | $0 |
| Total | 534 (100.0%) | $46,250 |
Household Income in Whitesburg
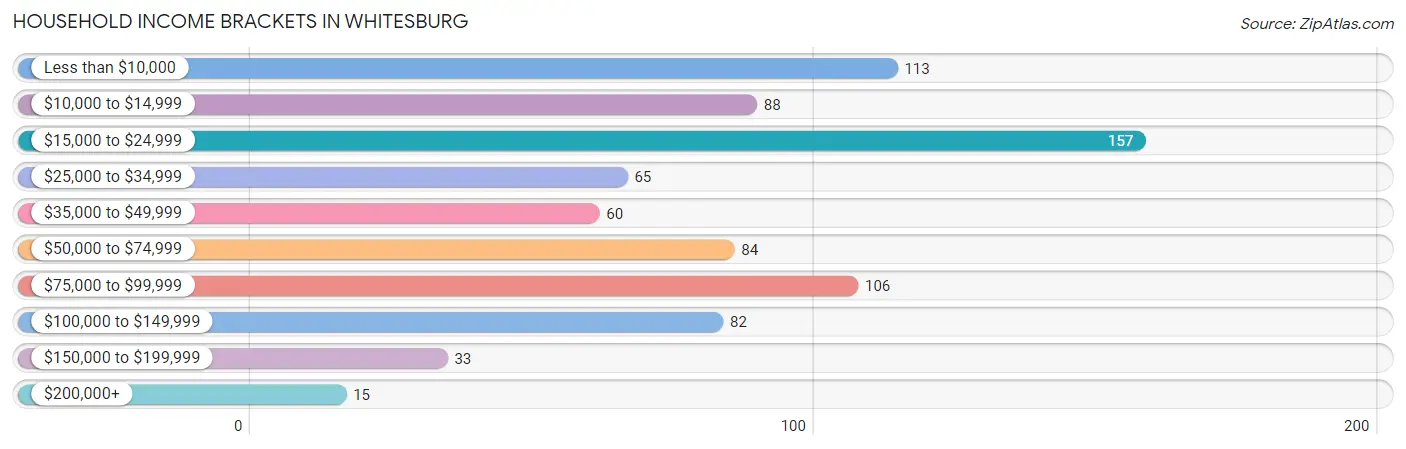
Household Income Brackets in Whitesburg
With 157 households falling in the category, the $15,000 to $24,999 income range is the most frequent in Whitesburg, accounting for 19.6% of all households. In contrast, only 15 households (1.9%) fall into the $200,000+ income bracket, making it the least populous group.
| Income Bracket | # Households | % Households |
| Less than $10,000 | 113 | 14.1% |
| $10,000 to $14,999 | 88 | 11.0% |
| $15,000 to $24,999 | 157 | 19.6% |
| $25,000 to $34,999 | 65 | 8.1% |
| $35,000 to $49,999 | 60 | 7.5% |
| $50,000 to $74,999 | 84 | 10.5% |
| $75,000 to $99,999 | 106 | 13.2% |
| $100,000 to $149,999 | 82 | 10.2% |
| $150,000 to $199,999 | 33 | 4.1% |
| $200,000+ | 15 | 1.9% |
Household Income by Householder Age in Whitesburg
The median household income in Whitesburg is $32,663, with the highest median household income of $20,859 found in the 25 to 44 years age bracket for the primary householder. A total of 319 households (39.7%) fall into this category. Meanwhile, the 15 to 24 years age bracket for the primary householder has the lowest median household income of $0, with 12 households (1.5%) in this group.
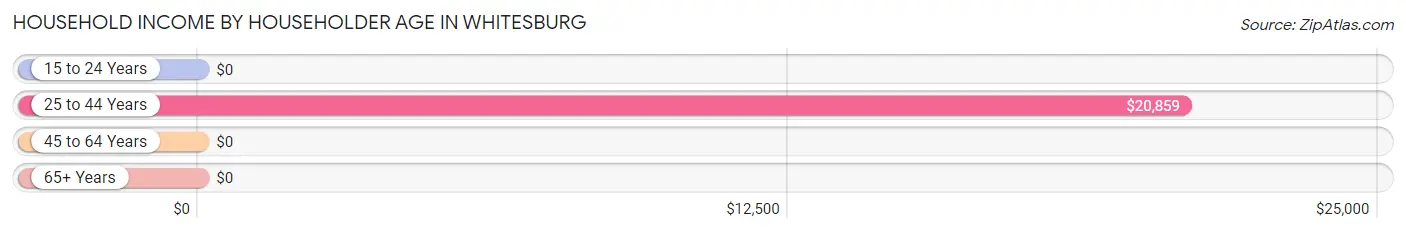
| Income Bracket | # Households | Median Income |
| 15 to 24 Years | 12 (1.5%) | $0 |
| 25 to 44 Years | 319 (39.7%) | $20,859 |
| 45 to 64 Years | 237 (29.5%) | $0 |
| 65+ Years | 235 (29.3%) | $0 |
| Total | 803 (100.0%) | $32,663 |
Poverty in Whitesburg
Income Below Poverty by Sex and Age in Whitesburg
With 41.3% poverty level for males and 40.1% for females among the residents of Whitesburg, 12 to 14 year old males and 18 to 24 year old females are the most vulnerable to poverty, with 65 males (98.5%) and 92 females (75.4%) in their respective age groups living below the poverty level.
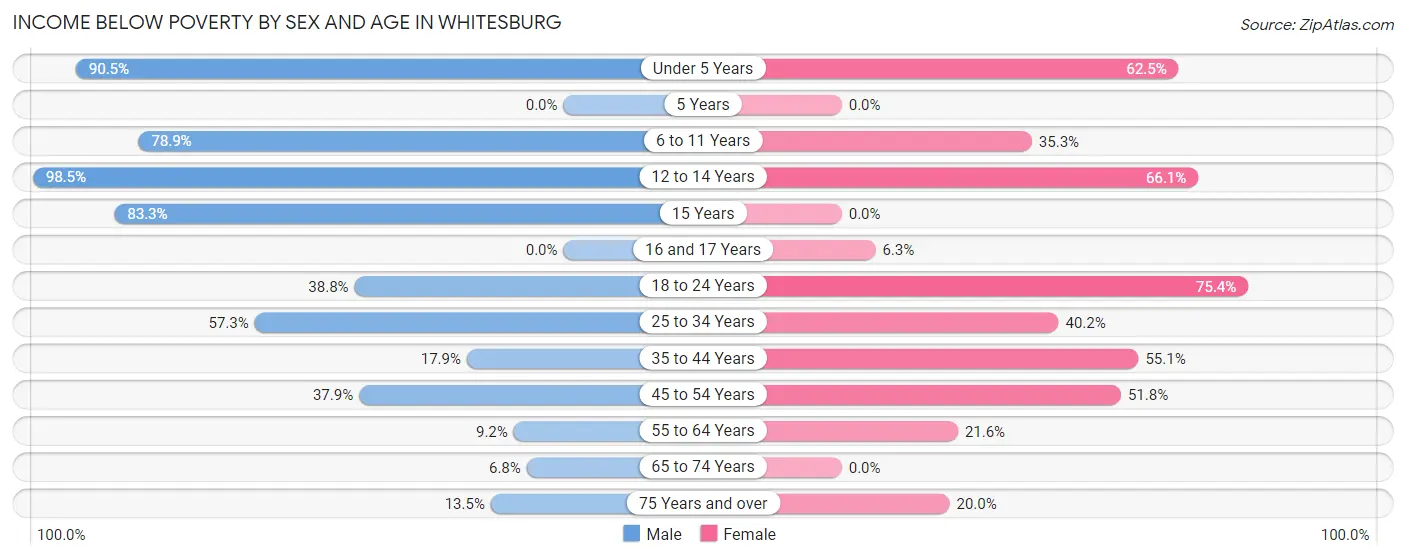
| Age Bracket | Male | Female |
| Under 5 Years | 19 (90.5%) | 70 (62.5%) |
| 5 Years | 0 (0.0%) | 0 (0.0%) |
| 6 to 11 Years | 56 (78.9%) | 18 (35.3%) |
| 12 to 14 Years | 65 (98.5%) | 41 (66.1%) |
| 15 Years | 10 (83.3%) | 0 (0.0%) |
| 16 and 17 Years | 0 (0.0%) | 2 (6.2%) |
| 18 to 24 Years | 19 (38.8%) | 92 (75.4%) |
| 25 to 34 Years | 94 (57.3%) | 35 (40.2%) |
| 35 to 44 Years | 19 (17.9%) | 76 (55.1%) |
| 45 to 54 Years | 33 (37.9%) | 57 (51.8%) |
| 55 to 64 Years | 6 (9.2%) | 36 (21.6%) |
| 65 to 74 Years | 6 (6.8%) | 0 (0.0%) |
| 75 Years and over | 12 (13.5%) | 17 (20.0%) |
| Total | 339 (41.3%) | 444 (40.1%) |
Income Above Poverty by Sex and Age in Whitesburg
According to the poverty statistics in Whitesburg, males aged 5 years and females aged 5 years are the age groups that are most secure financially, with 100.0% of males and 100.0% of females in these age groups living above the poverty line.
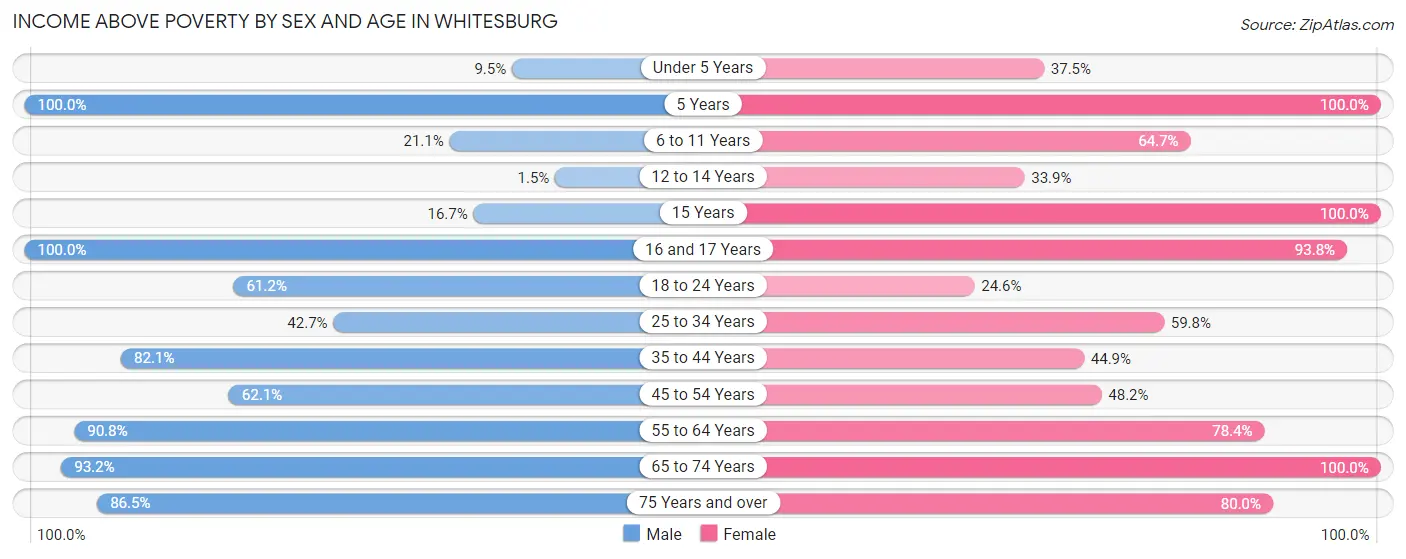
| Age Bracket | Male | Female |
| Under 5 Years | 2 (9.5%) | 42 (37.5%) |
| 5 Years | 1 (100.0%) | 5 (100.0%) |
| 6 to 11 Years | 15 (21.1%) | 33 (64.7%) |
| 12 to 14 Years | 1 (1.5%) | 21 (33.9%) |
| 15 Years | 2 (16.7%) | 2 (100.0%) |
| 16 and 17 Years | 2 (100.0%) | 30 (93.8%) |
| 18 to 24 Years | 30 (61.2%) | 30 (24.6%) |
| 25 to 34 Years | 70 (42.7%) | 52 (59.8%) |
| 35 to 44 Years | 87 (82.1%) | 62 (44.9%) |
| 45 to 54 Years | 54 (62.1%) | 53 (48.2%) |
| 55 to 64 Years | 59 (90.8%) | 131 (78.4%) |
| 65 to 74 Years | 82 (93.2%) | 135 (100.0%) |
| 75 Years and over | 77 (86.5%) | 68 (80.0%) |
| Total | 482 (58.7%) | 664 (59.9%) |
Income Below Poverty Among Married-Couple Families in Whitesburg
The poverty statistics for married-couple families in Whitesburg show that 23.6% or 78 of the total 331 families live below the poverty line. Families with 3 or 4 children have the highest poverty rate of 94.7%, comprising of 18 families. On the other hand, families with 5 or more children have the lowest poverty rate of 0.0%, which includes 0 families.
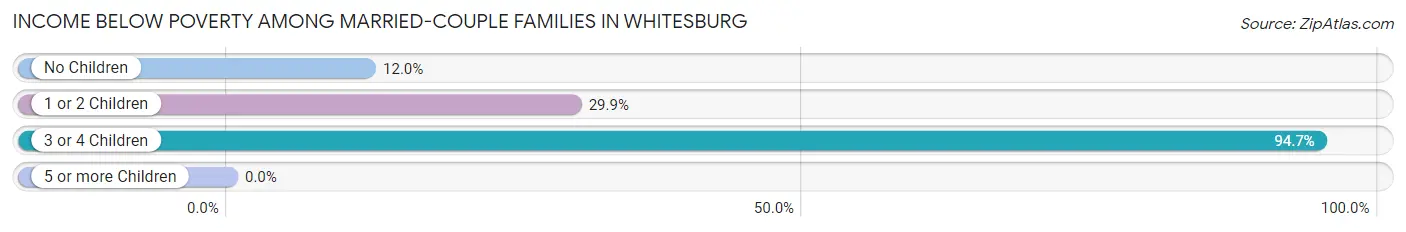
| Children | Above Poverty | Below Poverty |
| No Children | 161 (88.0%) | 22 (12.0%) |
| 1 or 2 Children | 89 (70.1%) | 38 (29.9%) |
| 3 or 4 Children | 1 (5.3%) | 18 (94.7%) |
| 5 or more Children | 2 (100.0%) | 0 (0.0%) |
| Total | 253 (76.4%) | 78 (23.6%) |
Income Below Poverty Among Single-Parent Households in Whitesburg
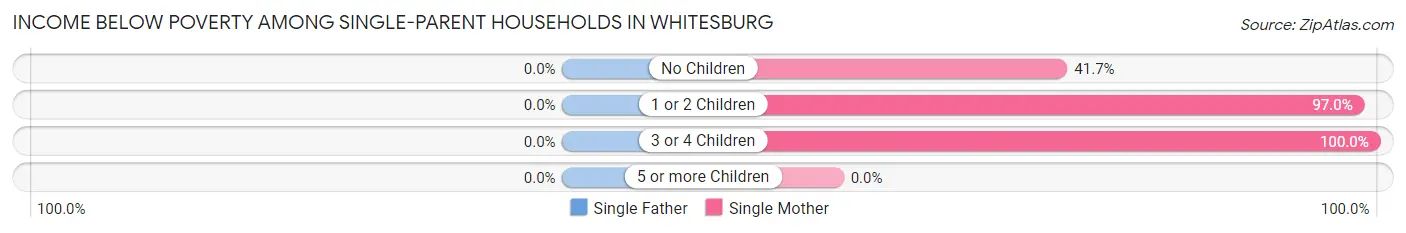
| Children | Single Father | Single Mother |
| No Children | 0 (0.0%) | 25 (41.7%) |
| 1 or 2 Children | 0 (0.0%) | 65 (97.0%) |
| 3 or 4 Children | 0 (0.0%) | 45 (100.0%) |
| 5 or more Children | 0 (0.0%) | 0 (0.0%) |
| Total | 0 (0.0%) | 135 (78.5%) |
Income Below Poverty Among Married-Couple vs Single-Parent Households in Whitesburg
The poverty data for Whitesburg shows that 78 of the married-couple family households (23.6%) and 135 of the single-parent households (66.5%) are living below the poverty level. Within the married-couple family households, those with 3 or 4 children have the highest poverty rate, with 18 households (94.7%) falling below the poverty line. Among the single-parent households, those with 3 or 4 children have the highest poverty rate, with 45 household (100.0%) living below poverty.
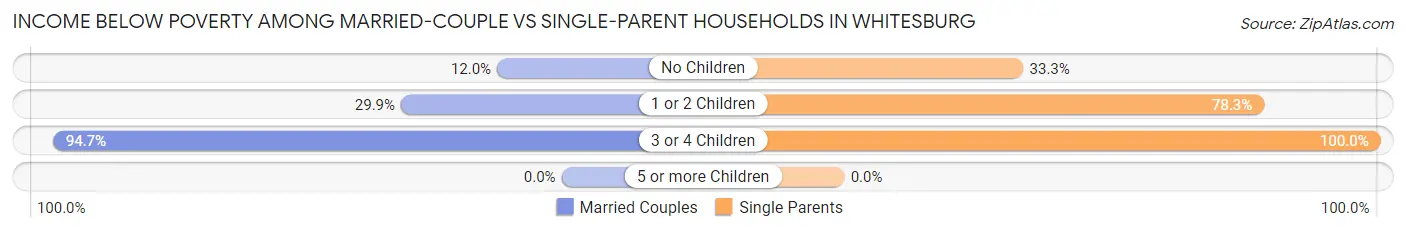
| Children | Married-Couple Families | Single-Parent Households |
| No Children | 22 (12.0%) | 25 (33.3%) |
| 1 or 2 Children | 38 (29.9%) | 65 (78.3%) |
| 3 or 4 Children | 18 (94.7%) | 45 (100.0%) |
| 5 or more Children | 0 (0.0%) | 0 (0.0%) |
| Total | 78 (23.6%) | 135 (66.5%) |
Race in Whitesburg
The most populous races in Whitesburg are White / Caucasian (2,095 | 97.3%), Hispanic or Latino (50 | 2.3%), and Asian (37 | 1.7%).
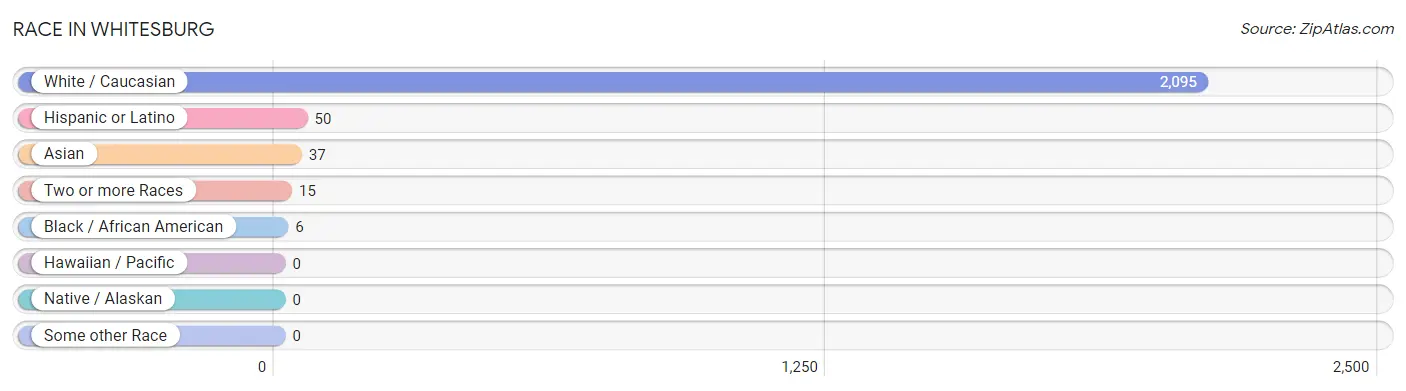
| Race | # Population | % Population |
| Asian | 37 | 1.7% |
| Black / African American | 6 | 0.3% |
| Hawaiian / Pacific | 0 | 0.0% |
| Hispanic or Latino | 50 | 2.3% |
| Native / Alaskan | 0 | 0.0% |
| White / Caucasian | 2,095 | 97.3% |
| Two or more Races | 15 | 0.7% |
| Some other Race | 0 | 0.0% |
| Total | 2,153 | 100.0% |
Ancestry in Whitesburg
The most populous ancestries reported in Whitesburg are English (295 | 13.7%), German (166 | 7.7%), American (145 | 6.7%), Irish (127 | 5.9%), and Italian (93 | 4.3%), together accounting for 38.4% of all Whitesburg residents.
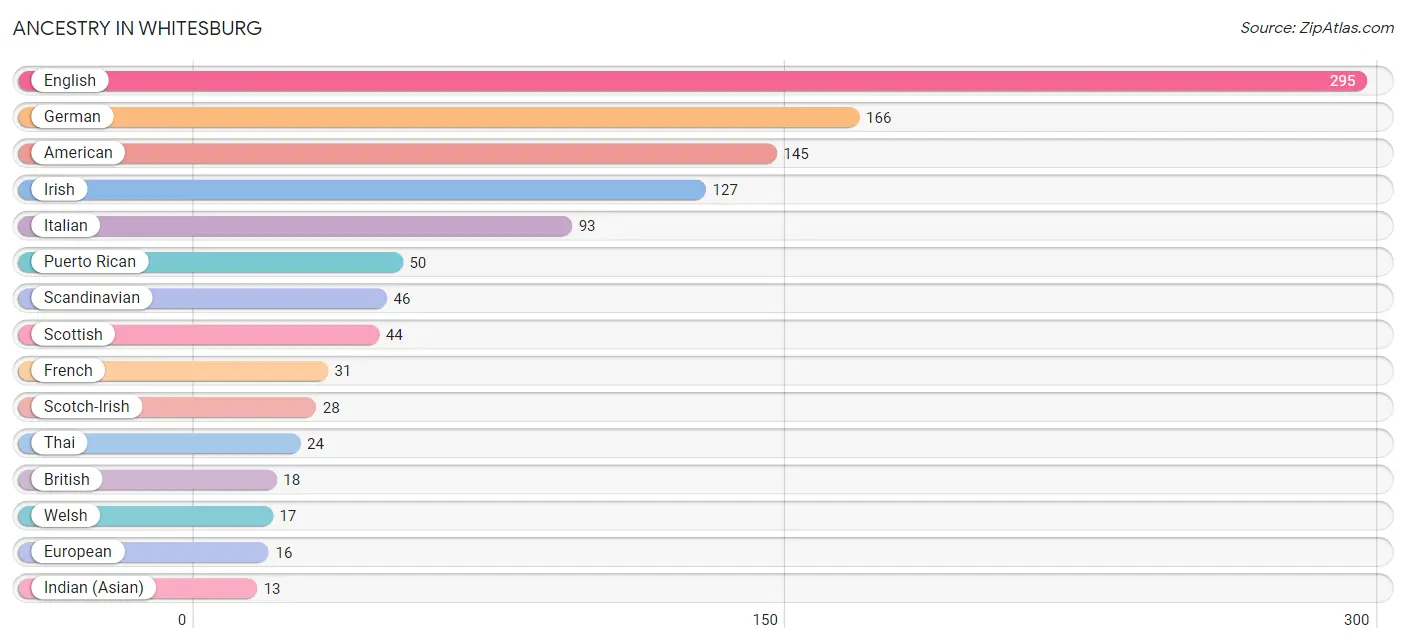
| Ancestry | # Population | % Population |
| American | 145 | 6.7% |
| Arab | 5 | 0.2% |
| British | 18 | 0.8% |
| Cherokee | 6 | 0.3% |
| English | 295 | 13.7% |
| European | 16 | 0.7% |
| French | 31 | 1.4% |
| German | 166 | 7.7% |
| Indian (Asian) | 13 | 0.6% |
| Irish | 127 | 5.9% |
| Italian | 93 | 4.3% |
| Puerto Rican | 50 | 2.3% |
| Scandinavian | 46 | 2.1% |
| Scotch-Irish | 28 | 1.3% |
| Scottish | 44 | 2.0% |
| Thai | 24 | 1.1% |
| Welsh | 17 | 0.8% | View All 17 Rows |
Immigrants in Whitesburg
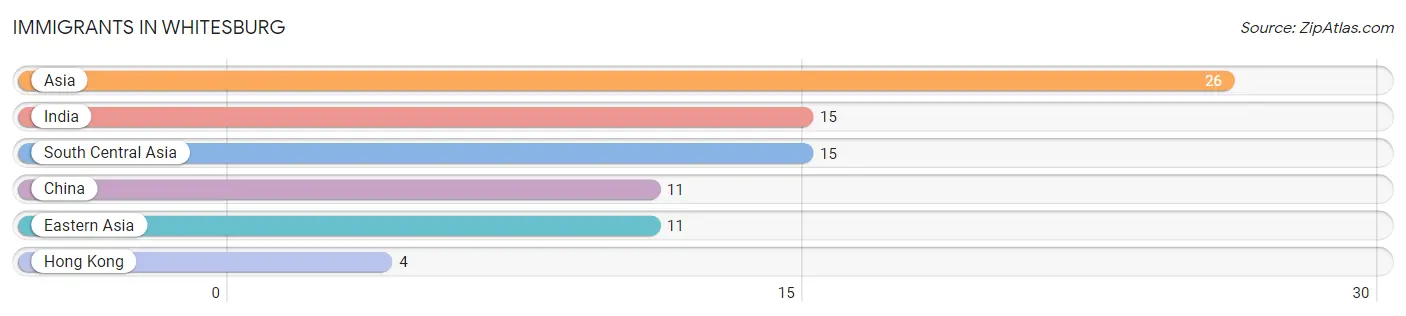
The most numerous immigrant groups reported in Whitesburg came from Asia (26 | 1.2%), India (15 | 0.7%), South Central Asia (15 | 0.7%), China (11 | 0.5%), and Eastern Asia (11 | 0.5%), together accounting for 3.6% of all Whitesburg residents.
| Immigration Origin | # Population | % Population |
| Asia | 26 | 1.2% |
| China | 11 | 0.5% |
| Eastern Asia | 11 | 0.5% |
| Hong Kong | 4 | 0.2% |
| India | 15 | 0.7% |
| South Central Asia | 15 | 0.7% | View All 6 Rows |
Sex and Age in Whitesburg
Sex and Age in Whitesburg
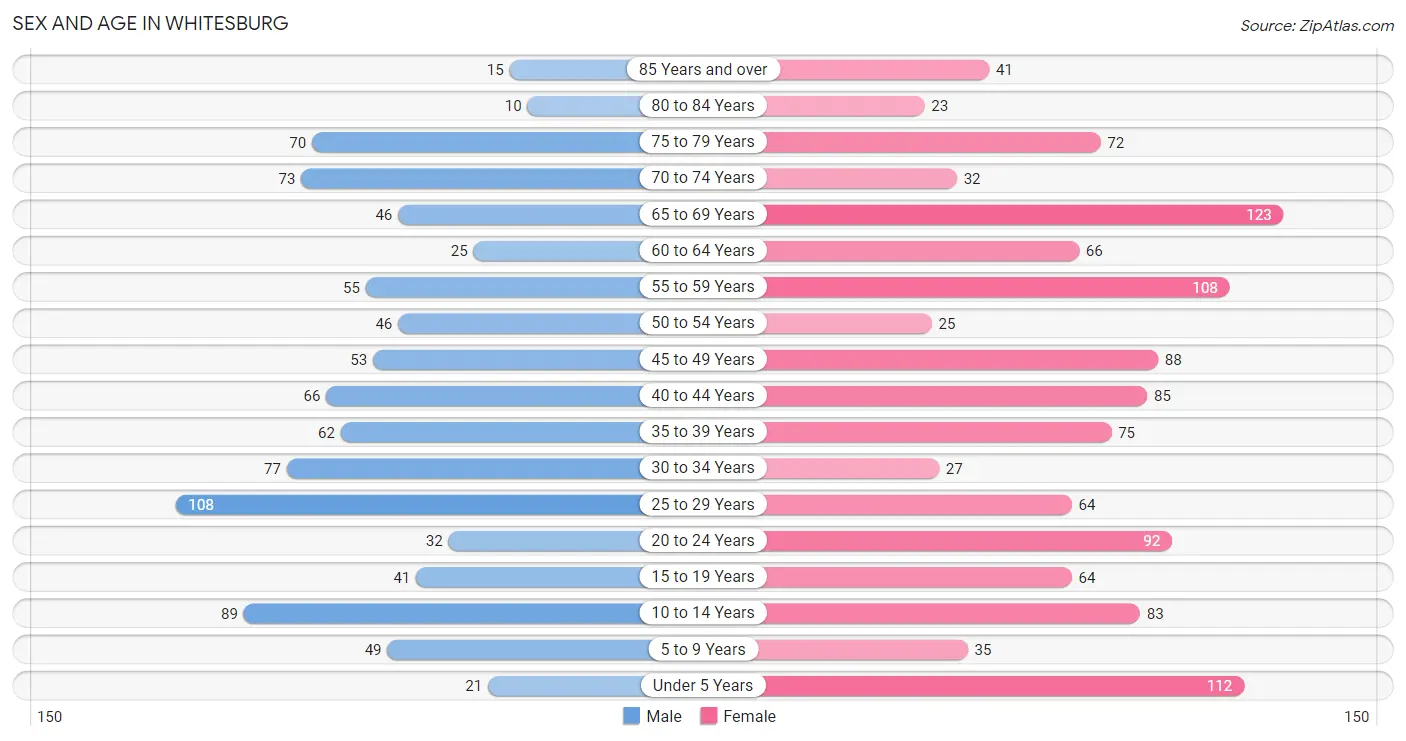
The most populous age groups in Whitesburg are 25 to 29 Years (108 | 11.5%) for men and 65 to 69 Years (123 | 10.1%) for women.
| Age Bracket | Male | Female |
| Under 5 Years | 21 (2.2%) | 112 (9.2%) |
| 5 to 9 Years | 49 (5.2%) | 35 (2.9%) |
| 10 to 14 Years | 89 (9.5%) | 83 (6.8%) |
| 15 to 19 Years | 41 (4.4%) | 64 (5.3%) |
| 20 to 24 Years | 32 (3.4%) | 92 (7.6%) |
| 25 to 29 Years | 108 (11.5%) | 64 (5.3%) |
| 30 to 34 Years | 77 (8.2%) | 27 (2.2%) |
| 35 to 39 Years | 62 (6.6%) | 75 (6.2%) |
| 40 to 44 Years | 66 (7.0%) | 85 (7.0%) |
| 45 to 49 Years | 53 (5.7%) | 88 (7.2%) |
| 50 to 54 Years | 46 (4.9%) | 25 (2.1%) |
| 55 to 59 Years | 55 (5.9%) | 108 (8.9%) |
| 60 to 64 Years | 25 (2.7%) | 66 (5.4%) |
| 65 to 69 Years | 46 (4.9%) | 123 (10.1%) |
| 70 to 74 Years | 73 (7.8%) | 32 (2.6%) |
| 75 to 79 Years | 70 (7.5%) | 72 (5.9%) |
| 80 to 84 Years | 10 (1.1%) | 23 (1.9%) |
| 85 Years and over | 15 (1.6%) | 41 (3.4%) |
| Total | 938 (100.0%) | 1,215 (100.0%) |
Families and Households in Whitesburg
Median Family Size in Whitesburg
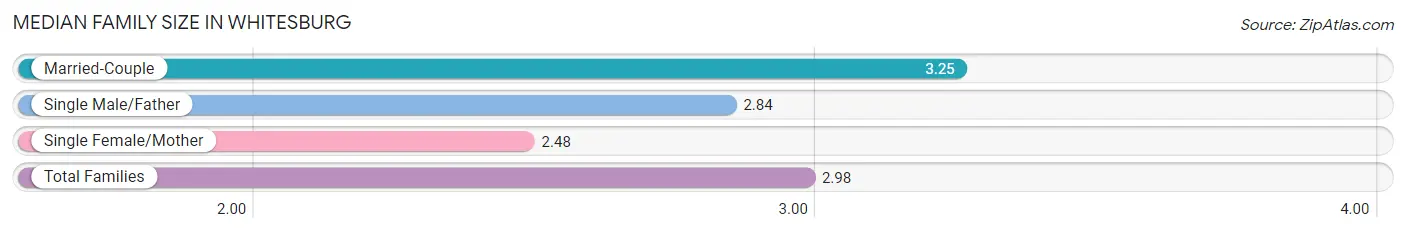
The median family size in Whitesburg is 2.98 persons per family, with married-couple families (331 | 62.0%) accounting for the largest median family size of 3.25 persons per family. On the other hand, single female/mother families (172 | 32.2%) represent the smallest median family size with 2.48 persons per family.
| Family Type | # Families | Family Size |
| Married-Couple | 331 (62.0%) | 3.25 |
| Single Male/Father | 31 (5.8%) | 2.84 |
| Single Female/Mother | 172 (32.2%) | 2.48 |
| Total Families | 534 (100.0%) | 2.98 |
Median Household Size in Whitesburg
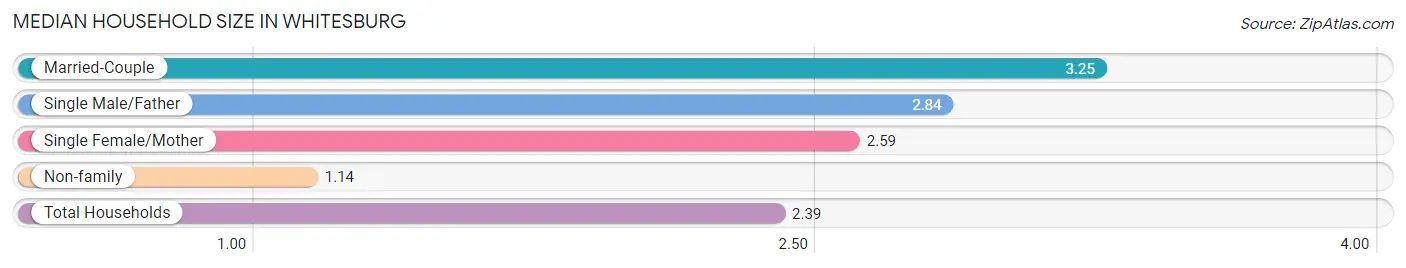
The median household size in Whitesburg is 2.39 persons per household, with married-couple households (331 | 41.2%) accounting for the largest median household size of 3.25 persons per household. non-family households (269 | 33.5%) represent the smallest median household size with 1.14 persons per household.
| Household Type | # Households | Household Size |
| Married-Couple | 331 (41.2%) | 3.25 |
| Single Male/Father | 31 (3.9%) | 2.84 |
| Single Female/Mother | 172 (21.4%) | 2.59 |
| Non-family | 269 (33.5%) | 1.14 |
| Total Households | 803 (100.0%) | 2.39 |
Household Size by Marriage Status in Whitesburg
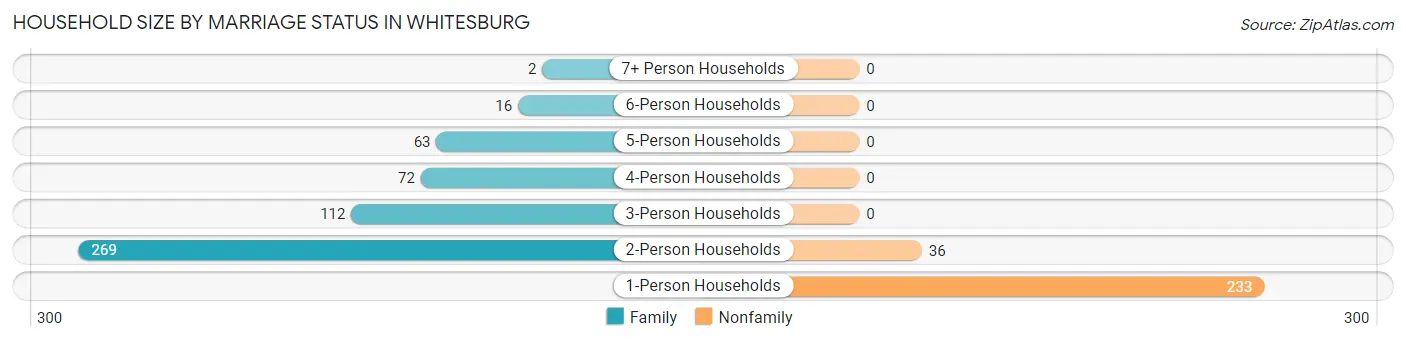
Out of a total of 803 households in Whitesburg, 534 (66.5%) are family households, while 269 (33.5%) are nonfamily households. The most numerous type of family households are 2-person households, comprising 269, and the most common type of nonfamily households are 1-person households, comprising 233.
| Household Size | Family Households | Nonfamily Households |
| 1-Person Households | - | 233 (29.0%) |
| 2-Person Households | 269 (33.5%) | 36 (4.5%) |
| 3-Person Households | 112 (14.0%) | 0 (0.0%) |
| 4-Person Households | 72 (9.0%) | 0 (0.0%) |
| 5-Person Households | 63 (7.9%) | 0 (0.0%) |
| 6-Person Households | 16 (2.0%) | 0 (0.0%) |
| 7+ Person Households | 2 (0.3%) | 0 (0.0%) |
| Total | 534 (66.5%) | 269 (33.5%) |
Female Fertility in Whitesburg
Fertility by Age in Whitesburg
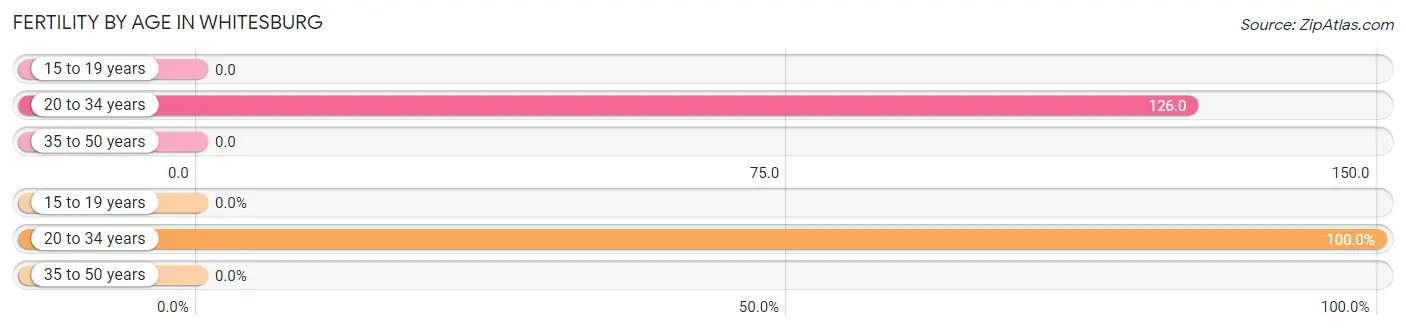
Average fertility rate in Whitesburg is 44.0 births per 1,000 women. Women in the age bracket of 20 to 34 years have the highest fertility rate with 126.0 births per 1,000 women. Women in the age bracket of 20 to 34 years acount for 100.0% of all women with births.
| Age Bracket | Women with Births | Births / 1,000 Women |
| 15 to 19 years | 0 (0.0%) | 0.0 |
| 20 to 34 years | 23 (100.0%) | 126.0 |
| 35 to 50 years | 0 (0.0%) | 0.0 |
| Total | 23 (100.0%) | 44.0 |
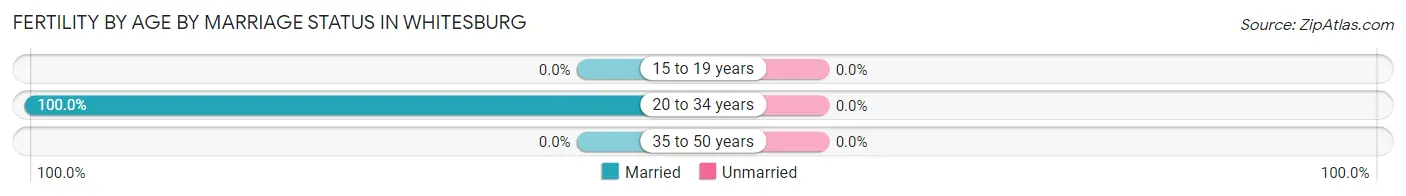
Fertility by Age by Marriage Status in Whitesburg
| Age Bracket | Married | Unmarried |
| 15 to 19 years | 0 (0.0%) | 0 (0.0%) |
| 20 to 34 years | 23 (100.0%) | 0 (0.0%) |
| 35 to 50 years | 0 (0.0%) | 0 (0.0%) |
| Total | 23 (100.0%) | 0 (0.0%) |
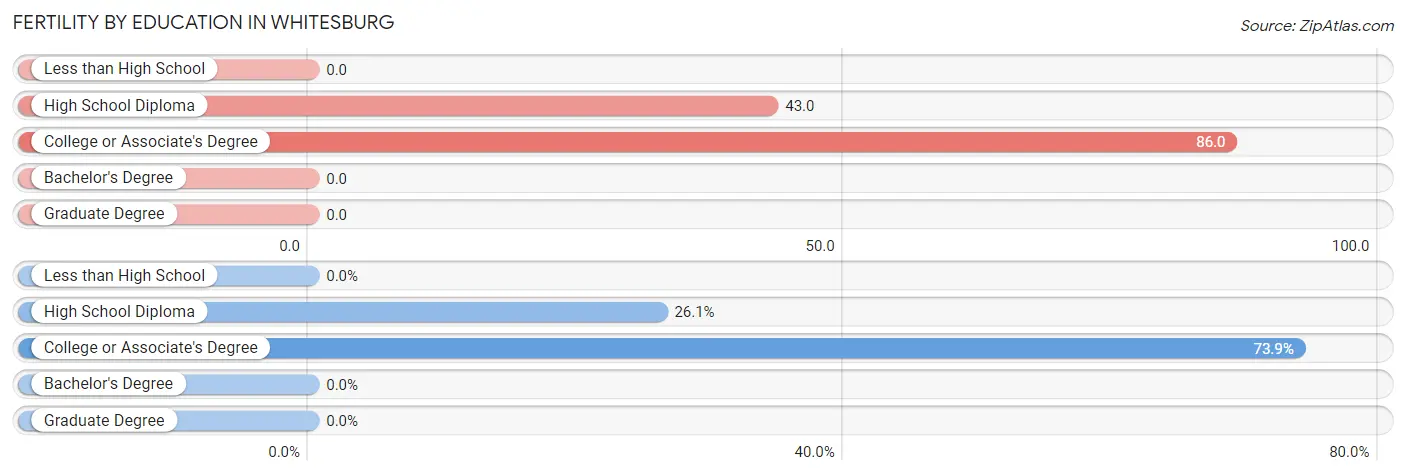
Fertility by Education in Whitesburg
| Educational Attainment | Women with Births | Births / 1,000 Women |
| Less than High School | 0 (0.0%) | 0.0 |
| High School Diploma | 6 (26.1%) | 43.0 |
| College or Associate's Degree | 17 (73.9%) | 86.0 |
| Bachelor's Degree | 0 (0.0%) | 0.0 |
| Graduate Degree | 0 (0.0%) | 0.0 |
| Total | 23 (100.0%) | 44.0 |
Fertility by Education by Marriage Status in Whitesburg
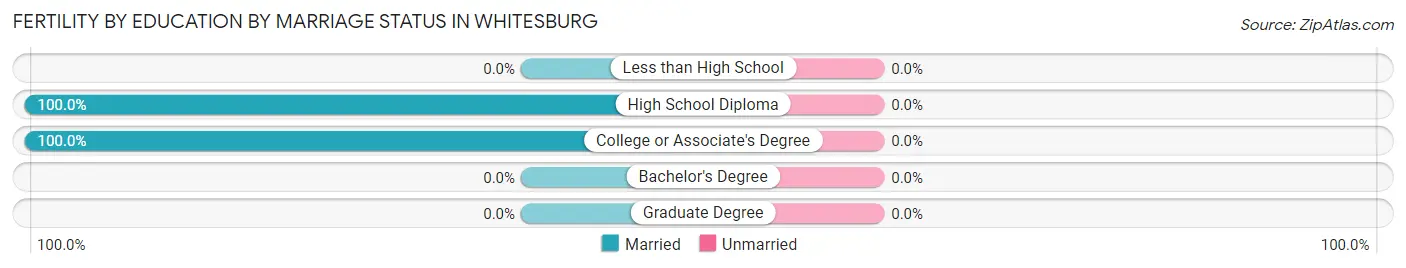
| Educational Attainment | Married | Unmarried |
| Less than High School | 0 (0.0%) | 0 (0.0%) |
| High School Diploma | 6 (100.0%) | 0 (0.0%) |
| College or Associate's Degree | 17 (100.0%) | 0 (0.0%) |
| Bachelor's Degree | 0 (0.0%) | 0 (0.0%) |
| Graduate Degree | 0 (0.0%) | 0 (0.0%) |
| Total | 23 (100.0%) | 0 (0.0%) |
Employment Characteristics in Whitesburg
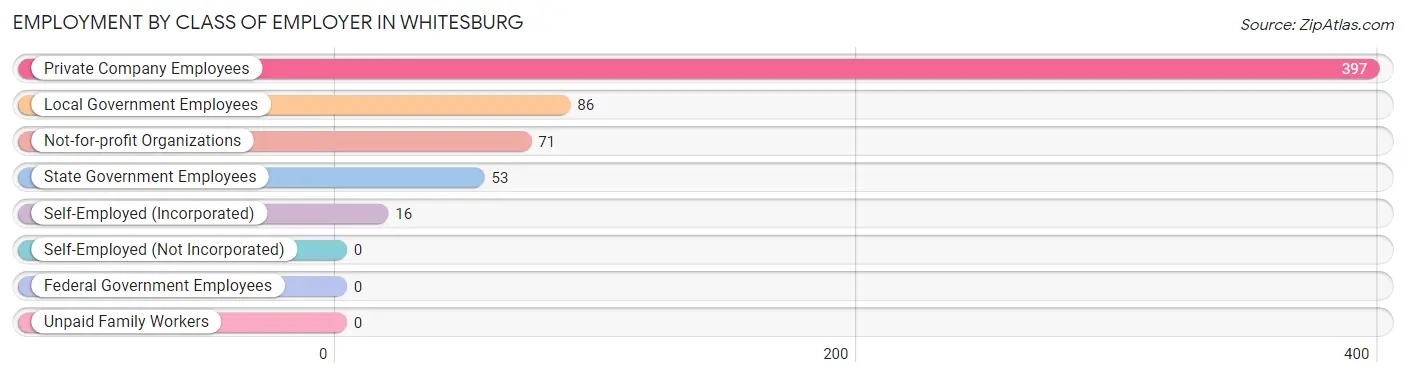
Employment by Class of Employer in Whitesburg
Among the 623 employed individuals in Whitesburg, private company employees (397 | 63.7%), local government employees (86 | 13.8%), and not-for-profit organizations (71 | 11.4%) make up the most common classes of employment.
| Employer Class | # Employees | % Employees |
| Private Company Employees | 397 | 63.7% |
| Self-Employed (Incorporated) | 16 | 2.6% |
| Self-Employed (Not Incorporated) | 0 | 0.0% |
| Not-for-profit Organizations | 71 | 11.4% |
| Local Government Employees | 86 | 13.8% |
| State Government Employees | 53 | 8.5% |
| Federal Government Employees | 0 | 0.0% |
| Unpaid Family Workers | 0 | 0.0% |
| Total | 623 | 100.0% |
Employment Status by Age in Whitesburg
According to the labor force statistics for Whitesburg, out of the total population over 16 years of age (1,750), 45.1% or 789 individuals are in the labor force, with 17.6% or 139 of them unemployed. The age group with the highest labor force participation rate is 25 to 29 years, with 76.7% or 132 individuals in the labor force. Within the labor force, the 20 to 24 years age range has the highest percentage of unemployed individuals, with 43.7% or 38 of them being unemployed.
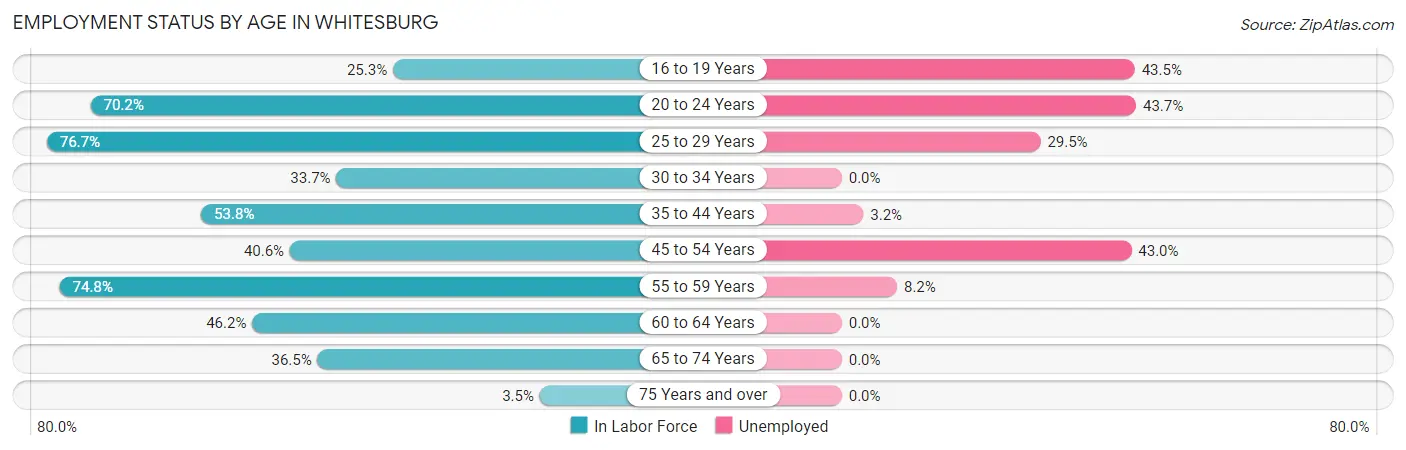
| Age Bracket | In Labor Force | Unemployed |
| 16 to 19 Years | 23 (25.3%) | 10 (43.5%) |
| 20 to 24 Years | 87 (70.2%) | 38 (43.7%) |
| 25 to 29 Years | 132 (76.7%) | 39 (29.5%) |
| 30 to 34 Years | 35 (33.7%) | 0 (0.0%) |
| 35 to 44 Years | 155 (53.8%) | 5 (3.2%) |
| 45 to 54 Years | 86 (40.6%) | 37 (43.0%) |
| 55 to 59 Years | 122 (74.8%) | 10 (8.2%) |
| 60 to 64 Years | 42 (46.2%) | 0 (0.0%) |
| 65 to 74 Years | 100 (36.5%) | 0 (0.0%) |
| 75 Years and over | 8 (3.5%) | 0 (0.0%) |
| Total | 789 (45.1%) | 139 (17.6%) |
Employment Status by Educational Attainment in Whitesburg
According to labor force statistics for Whitesburg, 55.5% of individuals (572) out of the total population between 25 and 64 years of age (1,030) are in the labor force, with 15.9% or 91 of them being unemployed. The group with the highest labor force participation rate are those with the educational attainment of bachelor's degree or higher, with 81.1% or 197 individuals in the labor force. Within the labor force, individuals with less than high school education have the highest percentage of unemployment, with 35.7% or 5 of them being unemployed.
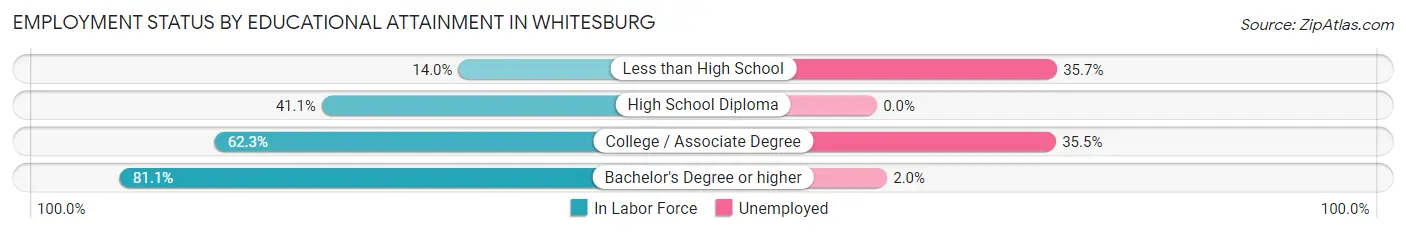
| Educational Attainment | In Labor Force | Unemployed |
| Less than High School | 14 (14.0%) | 36 (35.7%) |
| High School Diploma | 130 (41.1%) | 0 (0.0%) |
| College / Associate Degree | 231 (62.3%) | 132 (35.5%) |
| Bachelor's Degree or higher | 197 (81.1%) | 5 (2.0%) |
| Total | 572 (55.5%) | 164 (15.9%) |
Employment Occupations by Sex in Whitesburg
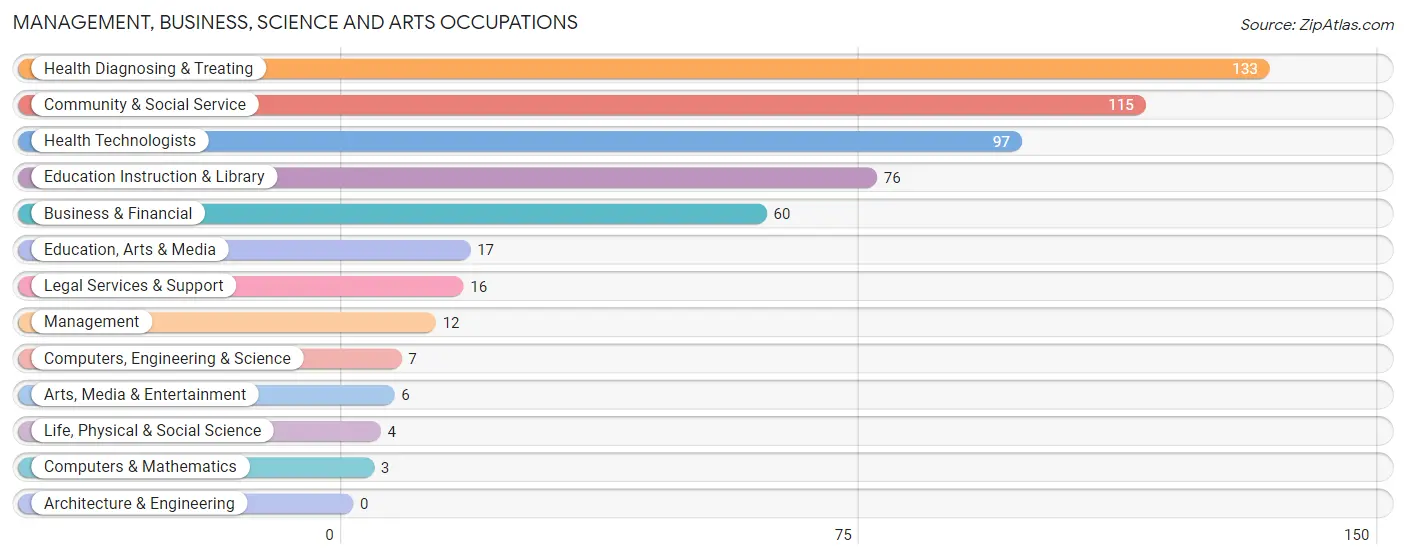
Management, Business, Science and Arts Occupations
The most common Management, Business, Science and Arts occupations in Whitesburg are Health Diagnosing & Treating (133 | 20.4%), Community & Social Service (115 | 17.7%), Health Technologists (97 | 14.9%), Education Instruction & Library (76 | 11.7%), and Business & Financial (60 | 9.2%).
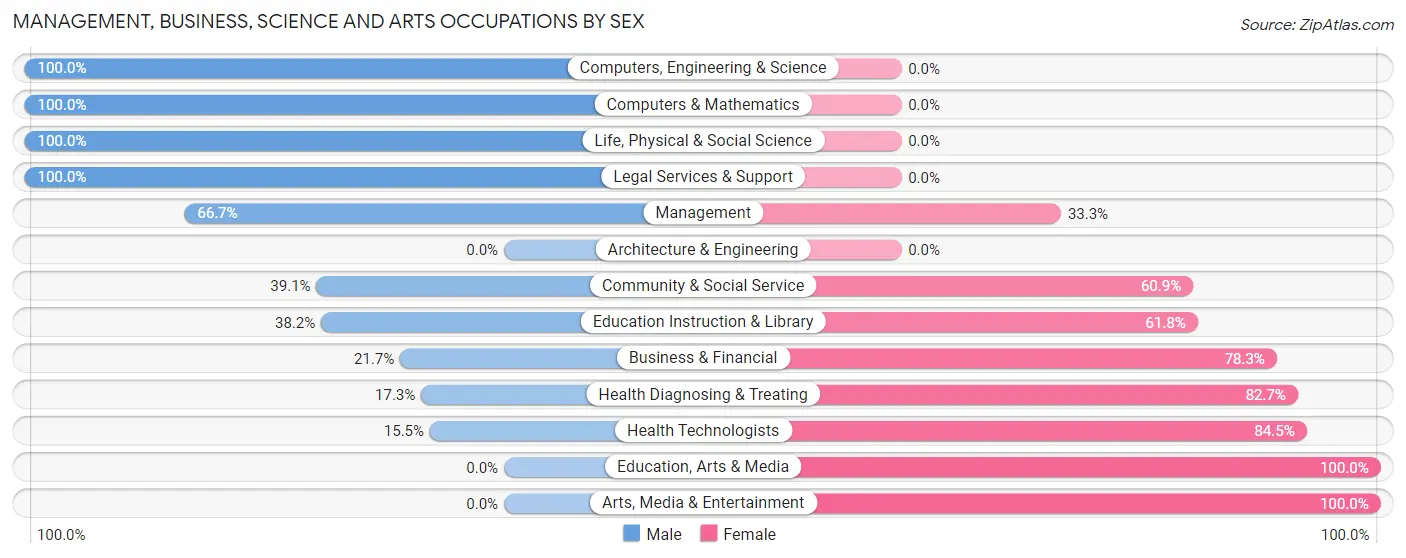
Management, Business, Science and Arts Occupations by Sex
Within the Management, Business, Science and Arts occupations in Whitesburg, the most male-oriented occupations are Computers, Engineering & Science (100.0%), Computers & Mathematics (100.0%), and Life, Physical & Social Science (100.0%), while the most female-oriented occupations are Education, Arts & Media (100.0%), Arts, Media & Entertainment (100.0%), and Health Technologists (84.5%).
| Occupation | Male | Female |
| Management | 8 (66.7%) | 4 (33.3%) |
| Business & Financial | 13 (21.7%) | 47 (78.3%) |
| Computers, Engineering & Science | 7 (100.0%) | 0 (0.0%) |
| Computers & Mathematics | 3 (100.0%) | 0 (0.0%) |
| Architecture & Engineering | 0 (0.0%) | 0 (0.0%) |
| Life, Physical & Social Science | 4 (100.0%) | 0 (0.0%) |
| Community & Social Service | 45 (39.1%) | 70 (60.9%) |
| Education, Arts & Media | 0 (0.0%) | 17 (100.0%) |
| Legal Services & Support | 16 (100.0%) | 0 (0.0%) |
| Education Instruction & Library | 29 (38.2%) | 47 (61.8%) |
| Arts, Media & Entertainment | 0 (0.0%) | 6 (100.0%) |
| Health Diagnosing & Treating | 23 (17.3%) | 110 (82.7%) |
| Health Technologists | 15 (15.5%) | 82 (84.5%) |
| Total (Category) | 96 (29.4%) | 231 (70.6%) |
| Total (Overall) | 258 (39.6%) | 393 (60.4%) |
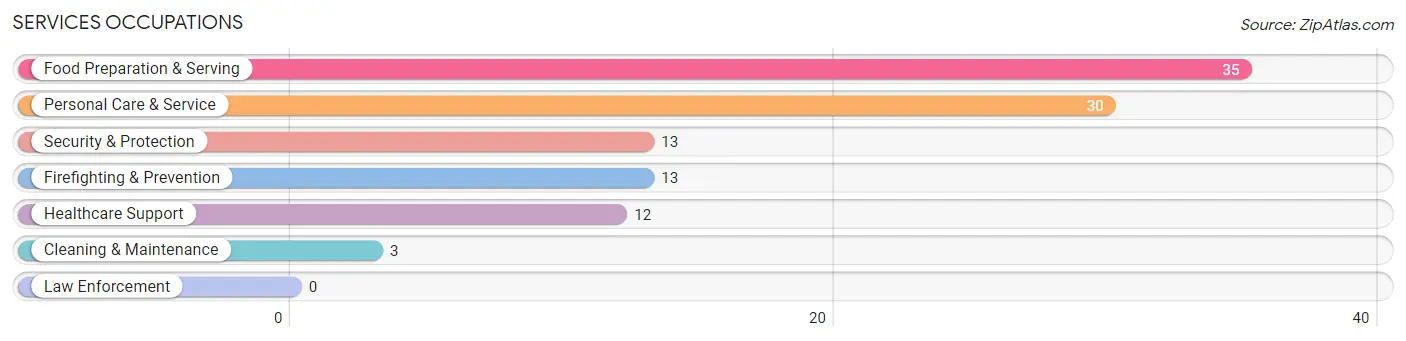
Services Occupations
The most common Services occupations in Whitesburg are Food Preparation & Serving (35 | 5.4%), Personal Care & Service (30 | 4.6%), Security & Protection (13 | 2.0%), Firefighting & Prevention (13 | 2.0%), and Healthcare Support (12 | 1.8%).
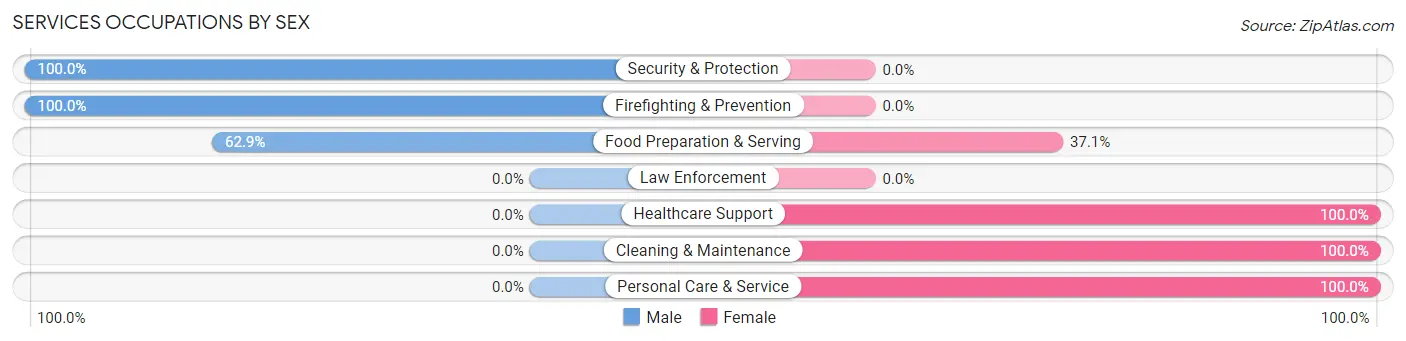
Services Occupations by Sex
Within the Services occupations in Whitesburg, the most male-oriented occupations are Security & Protection (100.0%), Firefighting & Prevention (100.0%), and Food Preparation & Serving (62.9%), while the most female-oriented occupations are Healthcare Support (100.0%), Cleaning & Maintenance (100.0%), and Personal Care & Service (100.0%).
| Occupation | Male | Female |
| Healthcare Support | 0 (0.0%) | 12 (100.0%) |
| Security & Protection | 13 (100.0%) | 0 (0.0%) |
| Firefighting & Prevention | 13 (100.0%) | 0 (0.0%) |
| Law Enforcement | 0 (0.0%) | 0 (0.0%) |
| Food Preparation & Serving | 22 (62.9%) | 13 (37.1%) |
| Cleaning & Maintenance | 0 (0.0%) | 3 (100.0%) |
| Personal Care & Service | 0 (0.0%) | 30 (100.0%) |
| Total (Category) | 35 (37.6%) | 58 (62.4%) |
| Total (Overall) | 258 (39.6%) | 393 (60.4%) |
Sales and Office Occupations
The most common Sales and Office occupations in Whitesburg are Sales & Related (103 | 15.8%), and Office & Administration (39 | 6.0%).
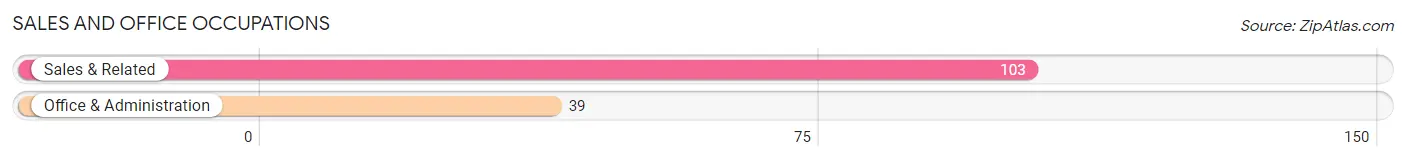
Sales and Office Occupations by Sex
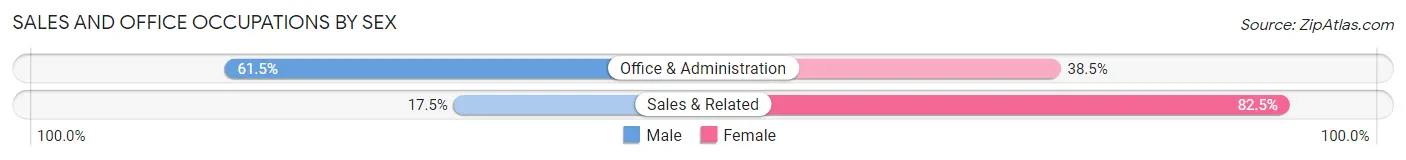
| Occupation | Male | Female |
| Sales & Related | 18 (17.5%) | 85 (82.5%) |
| Office & Administration | 24 (61.5%) | 15 (38.5%) |
| Total (Category) | 42 (29.6%) | 100 (70.4%) |
| Total (Overall) | 258 (39.6%) | 393 (60.4%) |
Natural Resources, Construction and Maintenance Occupations
The most common Natural Resources, Construction and Maintenance occupations in Whitesburg are , and Construction & Extraction (16 | 2.5%).
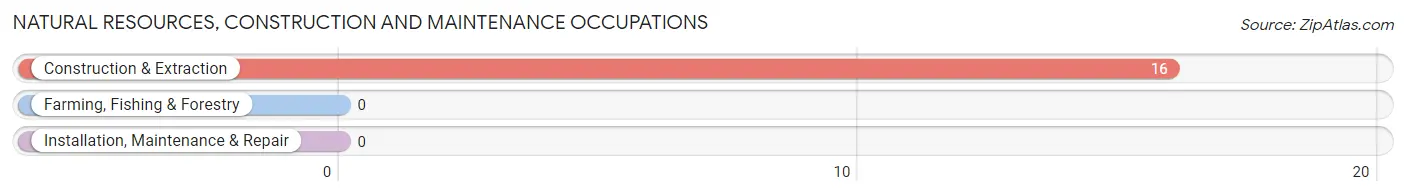
Natural Resources, Construction and Maintenance Occupations by Sex
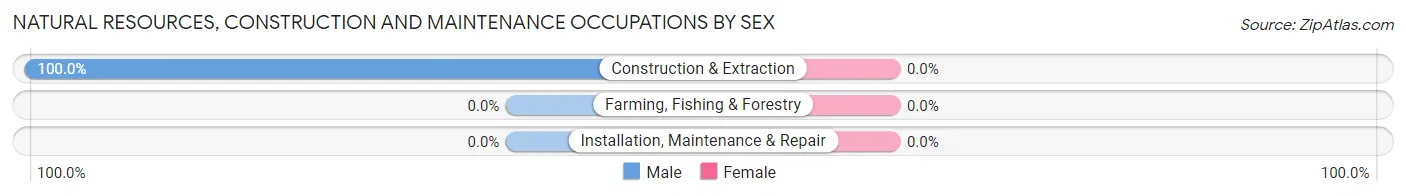
| Occupation | Male | Female |
| Farming, Fishing & Forestry | 0 (0.0%) | 0 (0.0%) |
| Construction & Extraction | 16 (100.0%) | 0 (0.0%) |
| Installation, Maintenance & Repair | 0 (0.0%) | 0 (0.0%) |
| Total (Category) | 16 (100.0%) | 0 (0.0%) |
| Total (Overall) | 258 (39.6%) | 393 (60.4%) |
Production, Transportation and Moving Occupations
The most common Production, Transportation and Moving occupations in Whitesburg are Transportation (37 | 5.7%), and Production (36 | 5.5%).
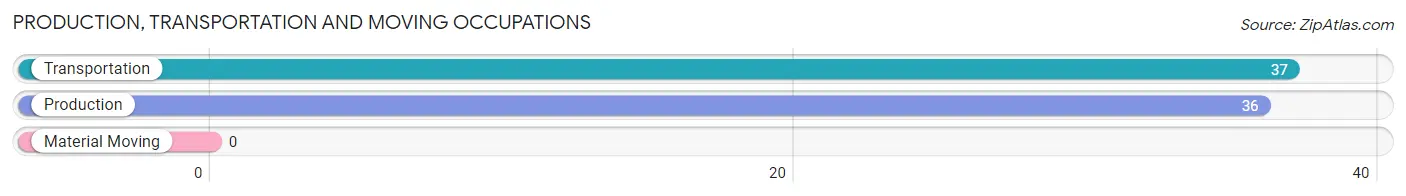
Production, Transportation and Moving Occupations by Sex
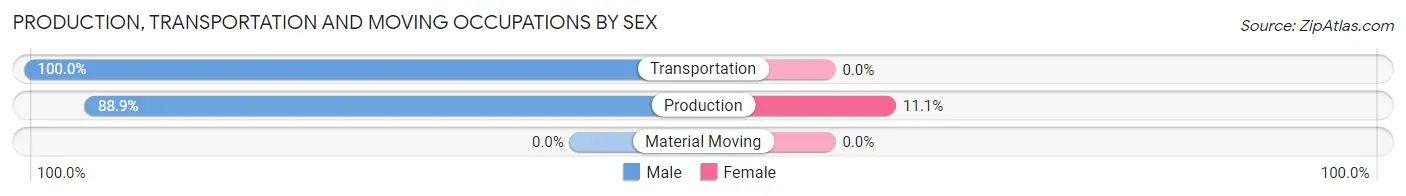
| Occupation | Male | Female |
| Production | 32 (88.9%) | 4 (11.1%) |
| Transportation | 37 (100.0%) | 0 (0.0%) |
| Material Moving | 0 (0.0%) | 0 (0.0%) |
| Total (Category) | 69 (94.5%) | 4 (5.5%) |
| Total (Overall) | 258 (39.6%) | 393 (60.4%) |
Employment Industries by Sex in Whitesburg
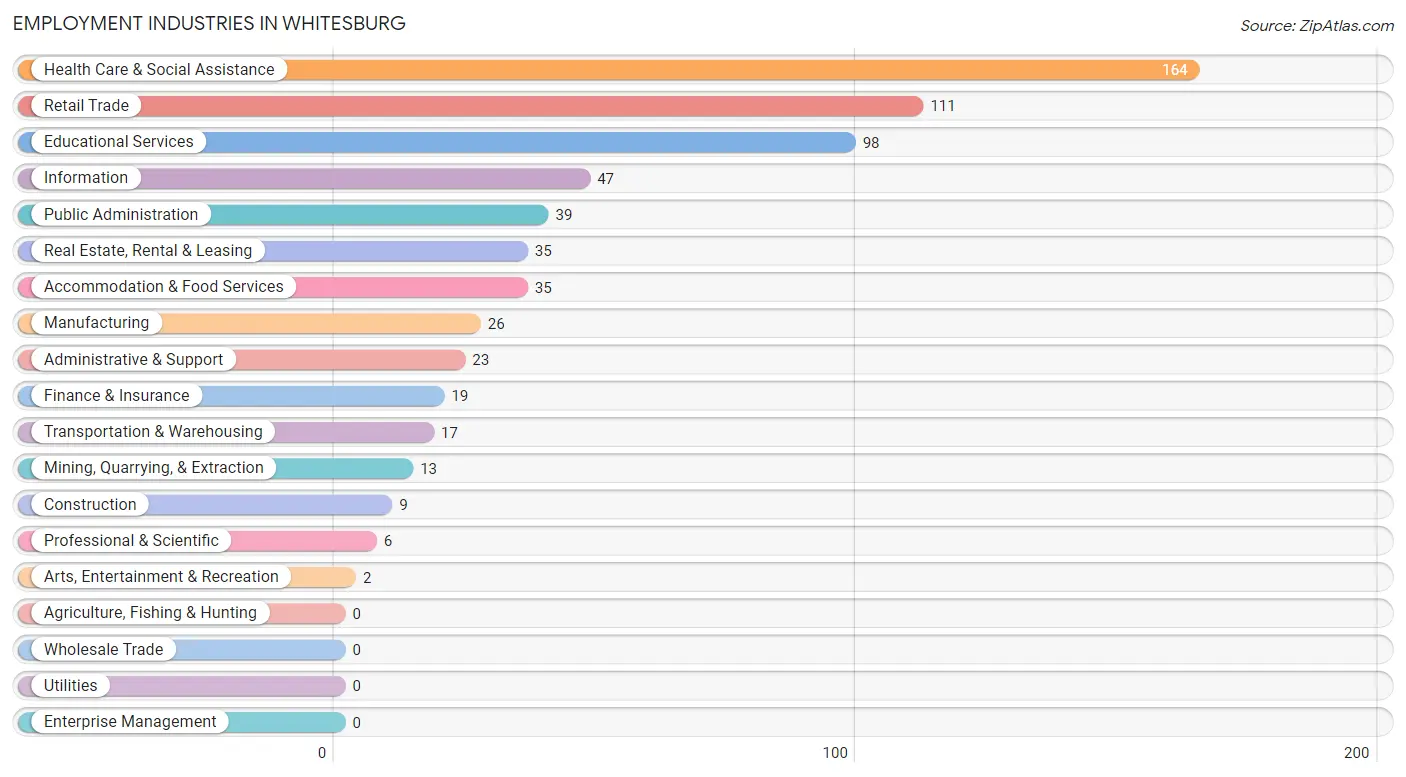
Employment Industries in Whitesburg
The major employment industries in Whitesburg include Health Care & Social Assistance (164 | 25.2%), Retail Trade (111 | 17.1%), Educational Services (98 | 15.0%), Information (47 | 7.2%), and Public Administration (39 | 6.0%).
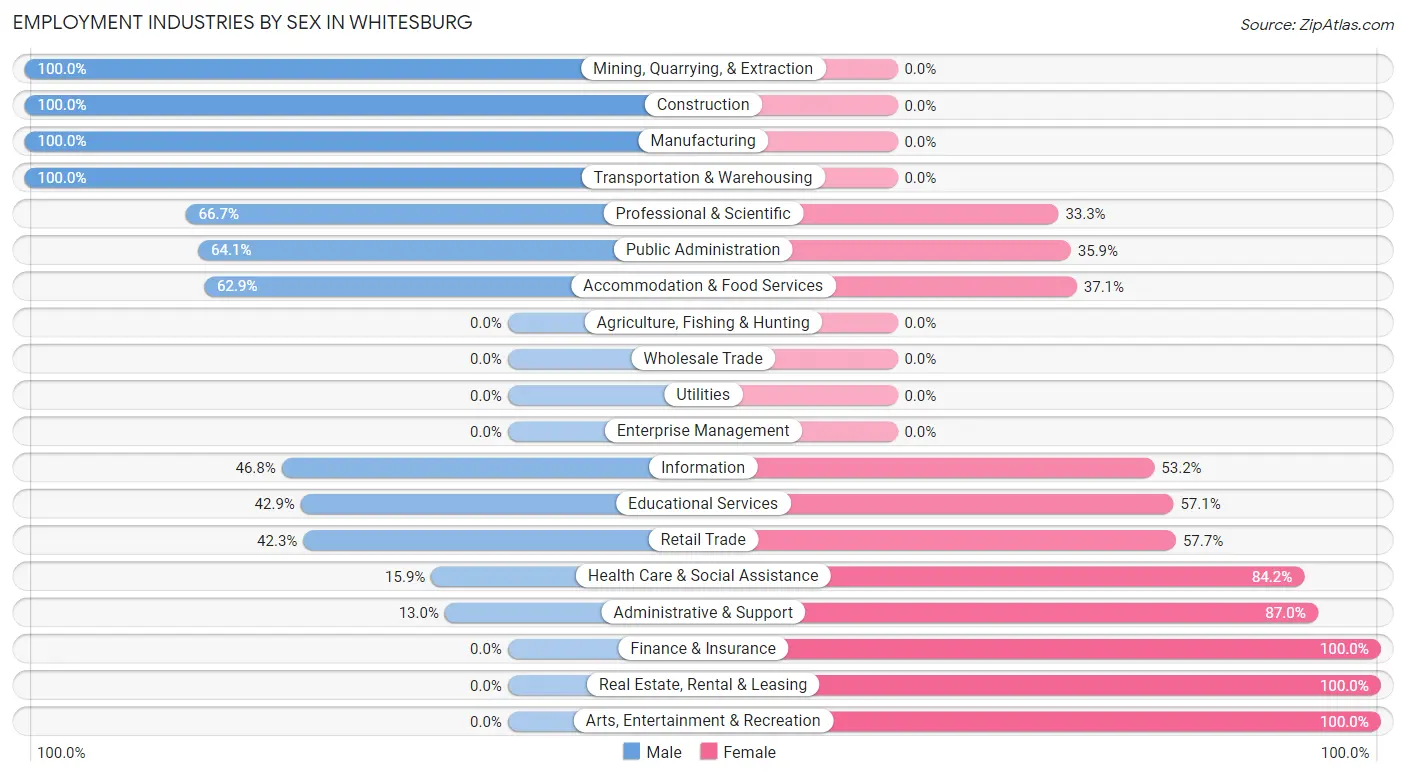
Employment Industries by Sex in Whitesburg
The Whitesburg industries that see more men than women are Mining, Quarrying, & Extraction (100.0%), Construction (100.0%), and Manufacturing (100.0%), whereas the industries that tend to have a higher number of women are Finance & Insurance (100.0%), Real Estate, Rental & Leasing (100.0%), and Arts, Entertainment & Recreation (100.0%).
| Industry | Male | Female |
| Agriculture, Fishing & Hunting | 0 (0.0%) | 0 (0.0%) |
| Mining, Quarrying, & Extraction | 13 (100.0%) | 0 (0.0%) |
| Construction | 9 (100.0%) | 0 (0.0%) |
| Manufacturing | 26 (100.0%) | 0 (0.0%) |
| Wholesale Trade | 0 (0.0%) | 0 (0.0%) |
| Retail Trade | 47 (42.3%) | 64 (57.7%) |
| Transportation & Warehousing | 17 (100.0%) | 0 (0.0%) |
| Utilities | 0 (0.0%) | 0 (0.0%) |
| Information | 22 (46.8%) | 25 (53.2%) |
| Finance & Insurance | 0 (0.0%) | 19 (100.0%) |
| Real Estate, Rental & Leasing | 0 (0.0%) | 35 (100.0%) |
| Professional & Scientific | 4 (66.7%) | 2 (33.3%) |
| Enterprise Management | 0 (0.0%) | 0 (0.0%) |
| Administrative & Support | 3 (13.0%) | 20 (87.0%) |
| Educational Services | 42 (42.9%) | 56 (57.1%) |
| Health Care & Social Assistance | 26 (15.9%) | 138 (84.2%) |
| Arts, Entertainment & Recreation | 0 (0.0%) | 2 (100.0%) |
| Accommodation & Food Services | 22 (62.9%) | 13 (37.1%) |
| Public Administration | 25 (64.1%) | 14 (35.9%) |
| Total | 258 (39.6%) | 393 (60.4%) |
Education in Whitesburg
School Enrollment in Whitesburg
The most common levels of schooling among the 366 students in Whitesburg are middle school (152 | 41.5%), elementary school (60 | 16.4%), and high school (60 | 16.4%).
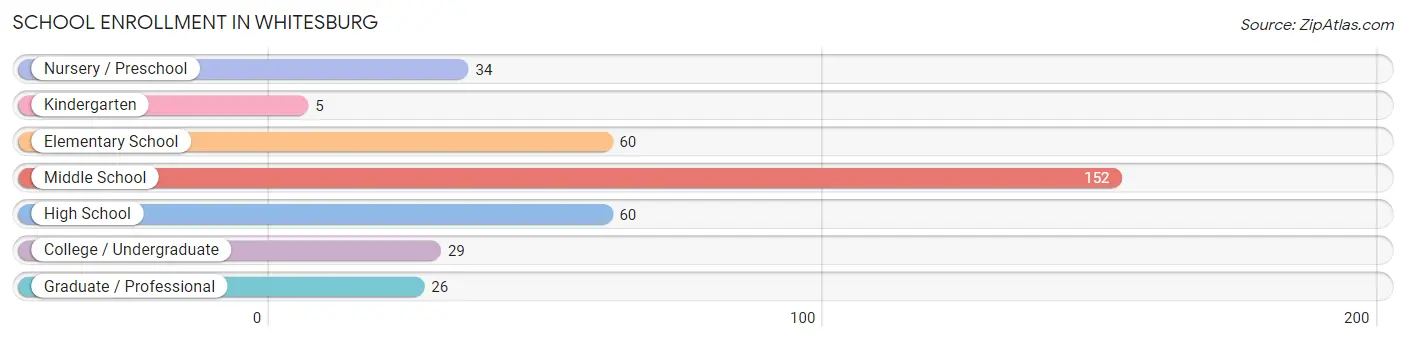
| School Level | # Students | % Students |
| Nursery / Preschool | 34 | 9.3% |
| Kindergarten | 5 | 1.4% |
| Elementary School | 60 | 16.4% |
| Middle School | 152 | 41.5% |
| High School | 60 | 16.4% |
| College / Undergraduate | 29 | 7.9% |
| Graduate / Professional | 26 | 7.1% |
| Total | 366 | 100.0% |
School Enrollment by Age by Funding Source in Whitesburg
Out of a total of 366 students who are enrolled in schools in Whitesburg, 70 (19.1%) attend a private institution, while the remaining 296 (80.9%) are enrolled in public schools. The age group of 35 years and over has the highest likelihood of being enrolled in private schools, with 7 (58.3% in the age bracket) enrolled. Conversely, the age group of 3 to 4 year olds has the lowest likelihood of being enrolled in a private school, with 33 (100.0% in the age bracket) attending a public institution.
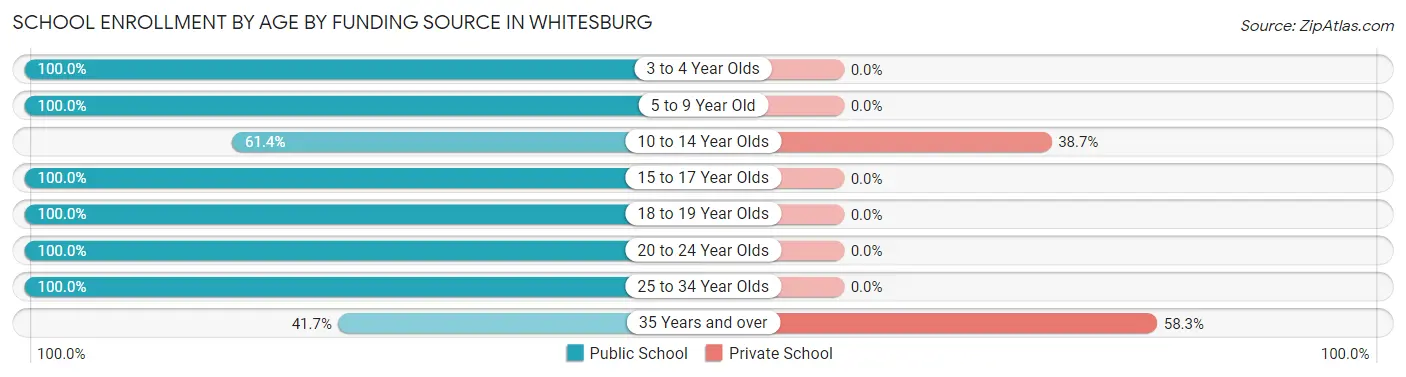
| Age Bracket | Public School | Private School |
| 3 to 4 Year Olds | 33 (100.0%) | 0 (0.0%) |
| 5 to 9 Year Old | 55 (100.0%) | 0 (0.0%) |
| 10 to 14 Year Olds | 100 (61.4%) | 63 (38.7%) |
| 15 to 17 Year Olds | 48 (100.0%) | 0 (0.0%) |
| 18 to 19 Year Olds | 17 (100.0%) | 0 (0.0%) |
| 20 to 24 Year Olds | 9 (100.0%) | 0 (0.0%) |
| 25 to 34 Year Olds | 29 (100.0%) | 0 (0.0%) |
| 35 Years and over | 5 (41.7%) | 7 (58.3%) |
| Total | 296 (80.9%) | 70 (19.1%) |
Educational Attainment by Field of Study in Whitesburg
Education (75 | 19.0%), computers & mathematics (53 | 13.5%), science & technology (47 | 11.9%), bio, nature & agricultural (40 | 10.2%), and social sciences (38 | 9.6%) are the most common fields of study among 394 individuals in Whitesburg who have obtained a bachelor's degree or higher.
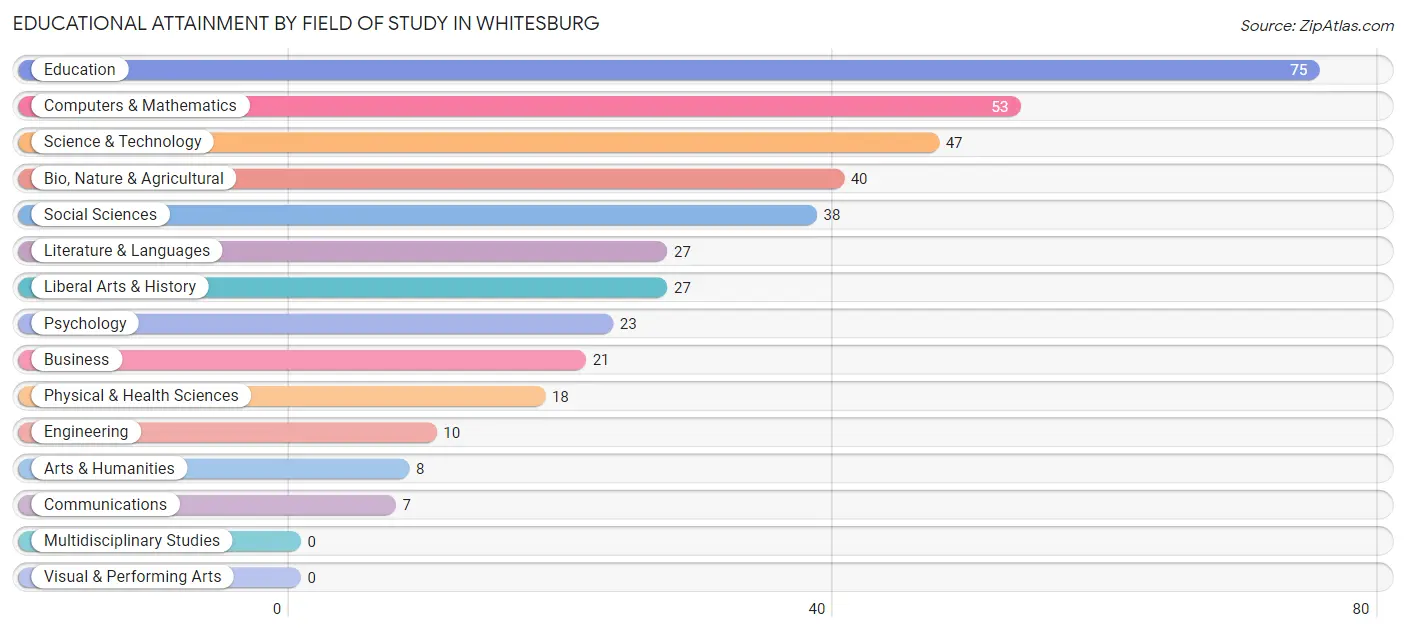
| Field of Study | # Graduates | % Graduates |
| Computers & Mathematics | 53 | 13.5% |
| Bio, Nature & Agricultural | 40 | 10.2% |
| Physical & Health Sciences | 18 | 4.6% |
| Psychology | 23 | 5.8% |
| Social Sciences | 38 | 9.6% |
| Engineering | 10 | 2.5% |
| Multidisciplinary Studies | 0 | 0.0% |
| Science & Technology | 47 | 11.9% |
| Business | 21 | 5.3% |
| Education | 75 | 19.0% |
| Literature & Languages | 27 | 6.9% |
| Liberal Arts & History | 27 | 6.9% |
| Visual & Performing Arts | 0 | 0.0% |
| Communications | 7 | 1.8% |
| Arts & Humanities | 8 | 2.0% |
| Total | 394 | 100.0% |
Transportation & Commute in Whitesburg
Vehicle Availability by Sex in Whitesburg
The most prevalent vehicle ownership categories in Whitesburg are males with 2 vehicles (120, accounting for 47.4%) and females with 2 vehicles (179, making up 32.8%).
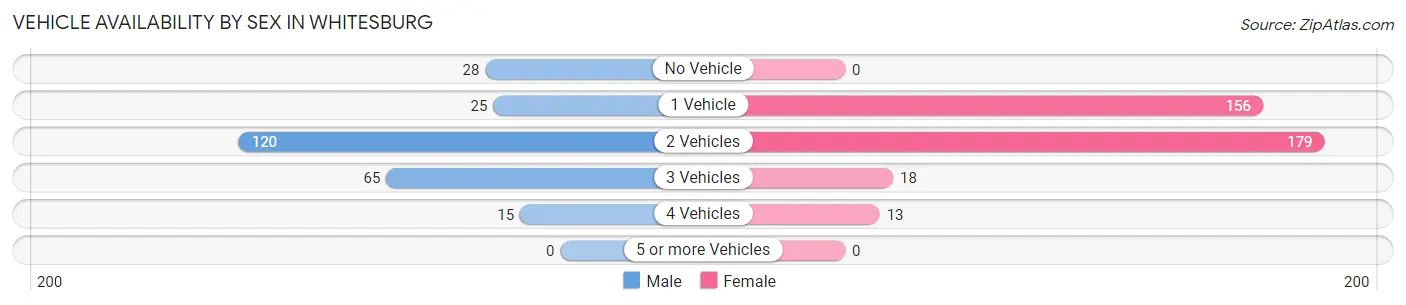
| Vehicles Available | Male | Female |
| No Vehicle | 28 (11.1%) | 0 (0.0%) |
| 1 Vehicle | 25 (9.9%) | 156 (42.6%) |
| 2 Vehicles | 120 (47.4%) | 179 (48.9%) |
| 3 Vehicles | 65 (25.7%) | 18 (4.9%) |
| 4 Vehicles | 15 (5.9%) | 13 (3.5%) |
| 5 or more Vehicles | 0 (0.0%) | 0 (0.0%) |
| Total | 253 (100.0%) | 366 (100.0%) |
Commute Time in Whitesburg
The most frequently occuring commute durations in Whitesburg are less than 5 minutes (196 commuters, 36.1%), 5 to 9 minutes (111 commuters, 20.4%), and 45 to 59 minutes (60 commuters, 11.1%).
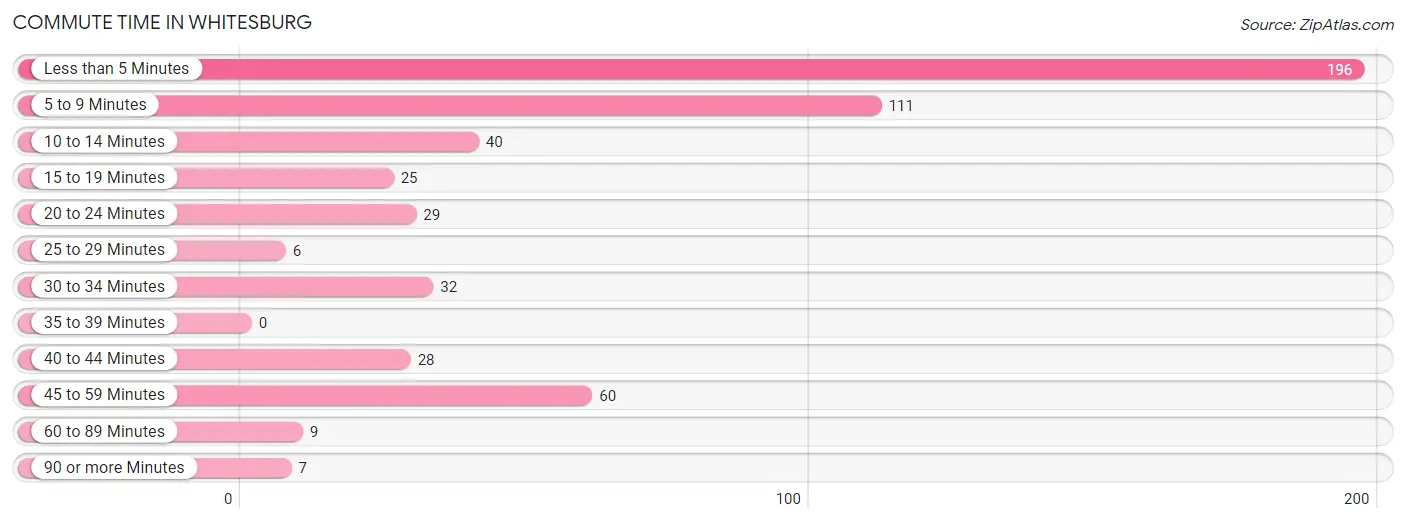
| Commute Time | # Commuters | % Commuters |
| Less than 5 Minutes | 196 | 36.1% |
| 5 to 9 Minutes | 111 | 20.4% |
| 10 to 14 Minutes | 40 | 7.4% |
| 15 to 19 Minutes | 25 | 4.6% |
| 20 to 24 Minutes | 29 | 5.3% |
| 25 to 29 Minutes | 6 | 1.1% |
| 30 to 34 Minutes | 32 | 5.9% |
| 35 to 39 Minutes | 0 | 0.0% |
| 40 to 44 Minutes | 28 | 5.2% |
| 45 to 59 Minutes | 60 | 11.1% |
| 60 to 89 Minutes | 9 | 1.7% |
| 90 or more Minutes | 7 | 1.3% |
Commute Time by Sex in Whitesburg
The most common commute times in Whitesburg are 5 to 9 minutes (54 commuters, 23.9%) for males and less than 5 minutes (158 commuters, 49.8%) for females.
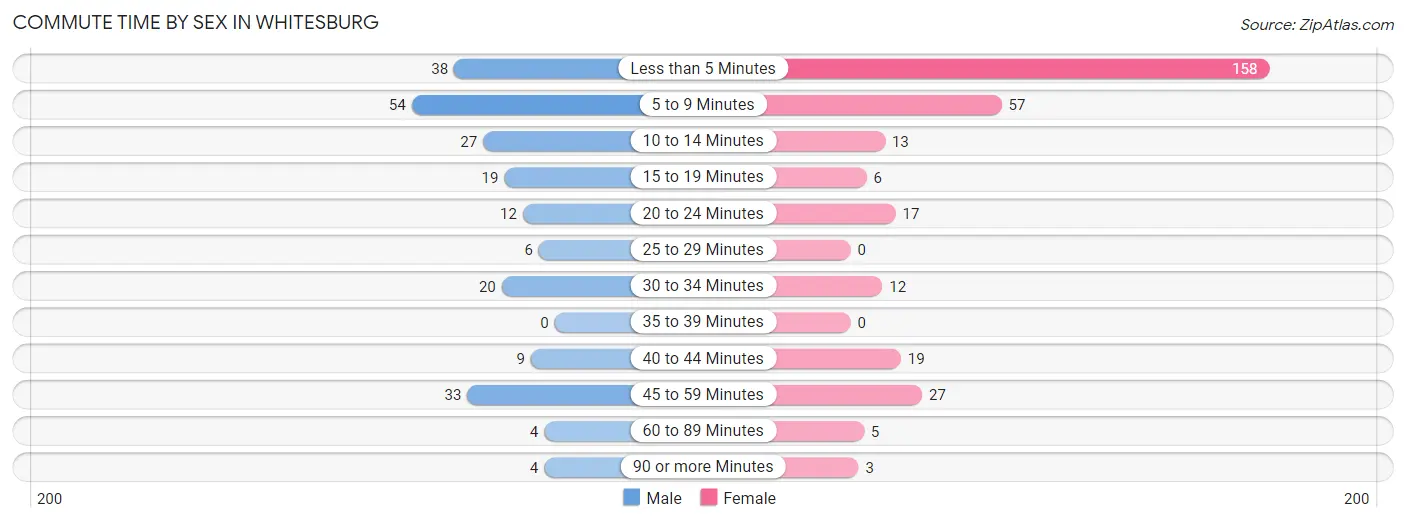
| Commute Time | Male | Female |
| Less than 5 Minutes | 38 (16.8%) | 158 (49.8%) |
| 5 to 9 Minutes | 54 (23.9%) | 57 (18.0%) |
| 10 to 14 Minutes | 27 (11.9%) | 13 (4.1%) |
| 15 to 19 Minutes | 19 (8.4%) | 6 (1.9%) |
| 20 to 24 Minutes | 12 (5.3%) | 17 (5.4%) |
| 25 to 29 Minutes | 6 (2.6%) | 0 (0.0%) |
| 30 to 34 Minutes | 20 (8.8%) | 12 (3.8%) |
| 35 to 39 Minutes | 0 (0.0%) | 0 (0.0%) |
| 40 to 44 Minutes | 9 (4.0%) | 19 (6.0%) |
| 45 to 59 Minutes | 33 (14.6%) | 27 (8.5%) |
| 60 to 89 Minutes | 4 (1.8%) | 5 (1.6%) |
| 90 or more Minutes | 4 (1.8%) | 3 (0.9%) |
Time of Departure to Work by Sex in Whitesburg
The most frequent times of departure to work in Whitesburg are 7:30 AM to 7:59 AM (65, 28.8%) for males and 4:00 PM to 11:59 PM (75, 23.7%) for females.
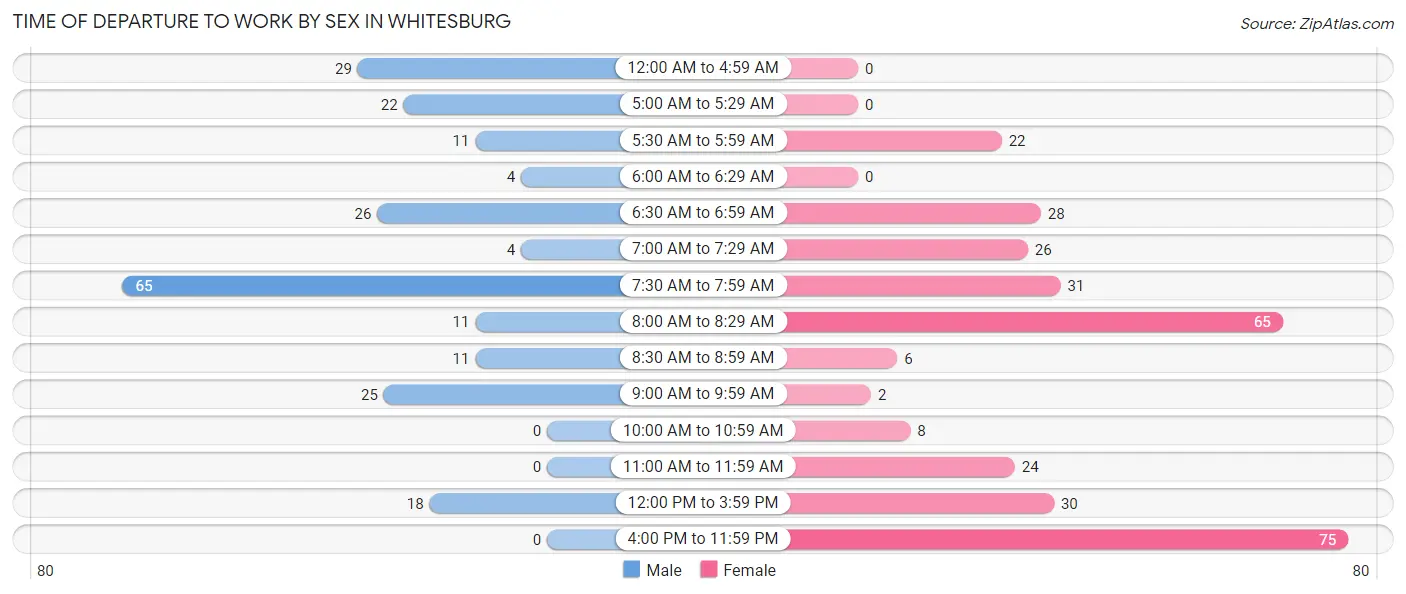
| Time of Departure | Male | Female |
| 12:00 AM to 4:59 AM | 29 (12.8%) | 0 (0.0%) |
| 5:00 AM to 5:29 AM | 22 (9.7%) | 0 (0.0%) |
| 5:30 AM to 5:59 AM | 11 (4.9%) | 22 (6.9%) |
| 6:00 AM to 6:29 AM | 4 (1.8%) | 0 (0.0%) |
| 6:30 AM to 6:59 AM | 26 (11.5%) | 28 (8.8%) |
| 7:00 AM to 7:29 AM | 4 (1.8%) | 26 (8.2%) |
| 7:30 AM to 7:59 AM | 65 (28.8%) | 31 (9.8%) |
| 8:00 AM to 8:29 AM | 11 (4.9%) | 65 (20.5%) |
| 8:30 AM to 8:59 AM | 11 (4.9%) | 6 (1.9%) |
| 9:00 AM to 9:59 AM | 25 (11.1%) | 2 (0.6%) |
| 10:00 AM to 10:59 AM | 0 (0.0%) | 8 (2.5%) |
| 11:00 AM to 11:59 AM | 0 (0.0%) | 24 (7.6%) |
| 12:00 PM to 3:59 PM | 18 (8.0%) | 30 (9.5%) |
| 4:00 PM to 11:59 PM | 0 (0.0%) | 75 (23.7%) |
| Total | 226 (100.0%) | 317 (100.0%) |
Housing Occupancy in Whitesburg
Occupancy by Ownership in Whitesburg
Of the total 803 dwellings in Whitesburg, owner-occupied units account for 383 (47.7%), while renter-occupied units make up 420 (52.3%).
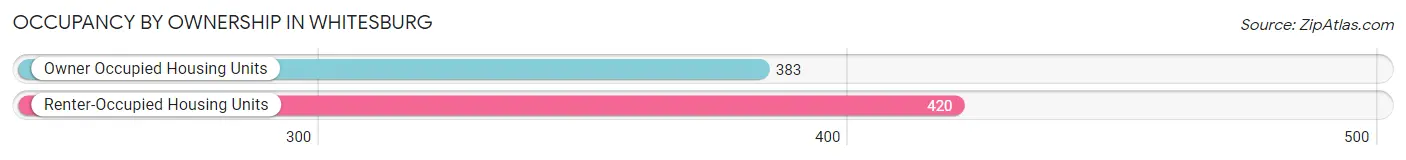
| Occupancy | # Housing Units | % Housing Units |
| Owner Occupied Housing Units | 383 | 47.7% |
| Renter-Occupied Housing Units | 420 | 52.3% |
| Total Occupied Housing Units | 803 | 100.0% |
Occupancy by Household Size in Whitesburg
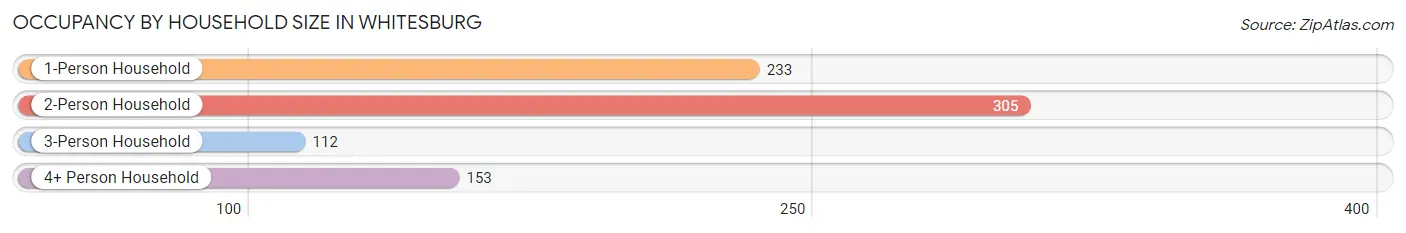
| Household Size | # Housing Units | % Housing Units |
| 1-Person Household | 233 | 29.0% |
| 2-Person Household | 305 | 38.0% |
| 3-Person Household | 112 | 14.0% |
| 4+ Person Household | 153 | 19.1% |
| Total Housing Units | 803 | 100.0% |
Occupancy by Ownership by Household Size in Whitesburg
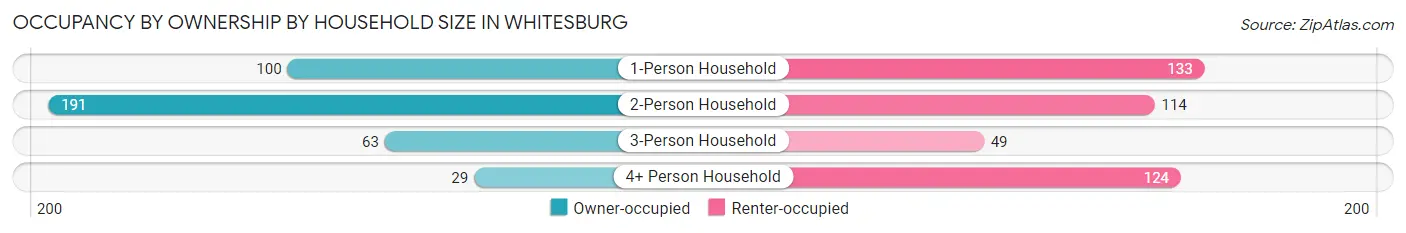
| Household Size | Owner-occupied | Renter-occupied |
| 1-Person Household | 100 (42.9%) | 133 (57.1%) |
| 2-Person Household | 191 (62.6%) | 114 (37.4%) |
| 3-Person Household | 63 (56.2%) | 49 (43.8%) |
| 4+ Person Household | 29 (19.0%) | 124 (81.0%) |
| Total Housing Units | 383 (47.7%) | 420 (52.3%) |
Occupancy by Educational Attainment in Whitesburg
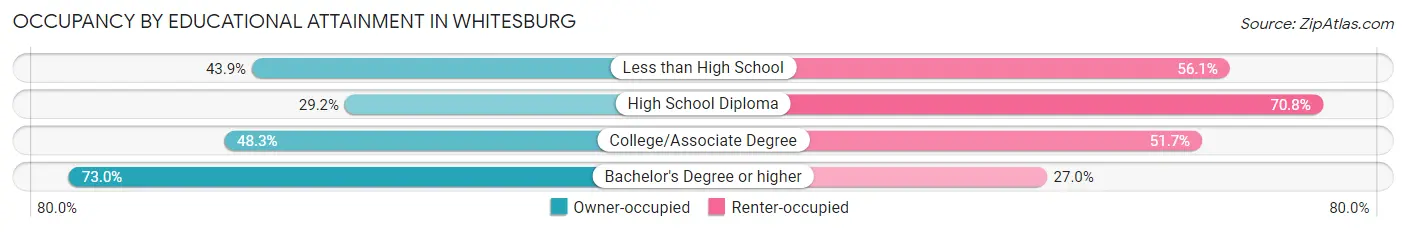
| Household Size | Owner-occupied | Renter-occupied |
| Less than High School | 29 (43.9%) | 37 (56.1%) |
| High School Diploma | 73 (29.2%) | 177 (70.8%) |
| College/Associate Degree | 146 (48.3%) | 156 (51.7%) |
| Bachelor's Degree or higher | 135 (73.0%) | 50 (27.0%) |
Occupancy by Age of Householder in Whitesburg
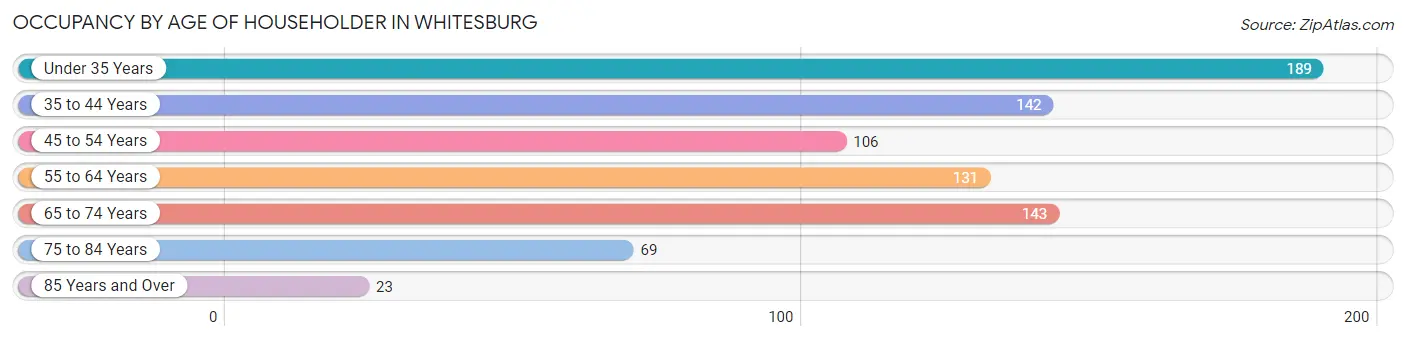
| Age Bracket | # Households | % Households |
| Under 35 Years | 189 | 23.5% |
| 35 to 44 Years | 142 | 17.7% |
| 45 to 54 Years | 106 | 13.2% |
| 55 to 64 Years | 131 | 16.3% |
| 65 to 74 Years | 143 | 17.8% |
| 75 to 84 Years | 69 | 8.6% |
| 85 Years and Over | 23 | 2.9% |
| Total | 803 | 100.0% |
Housing Finances in Whitesburg
Median Income by Occupancy in Whitesburg
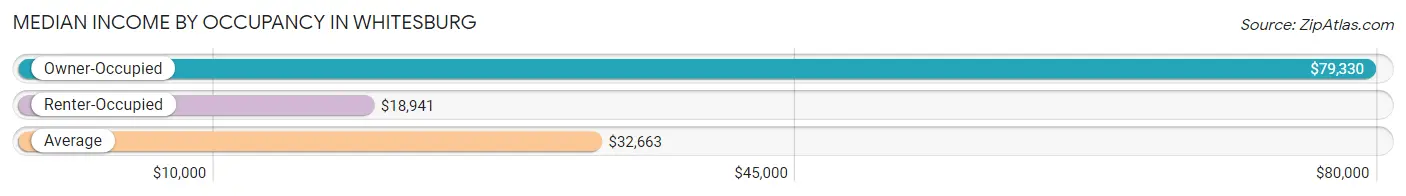
| Occupancy Type | # Households | Median Income |
| Owner-Occupied | 383 (47.7%) | $79,330 |
| Renter-Occupied | 420 (52.3%) | $18,941 |
| Average | 803 (100.0%) | $32,663 |
Occupancy by Householder Income Bracket in Whitesburg
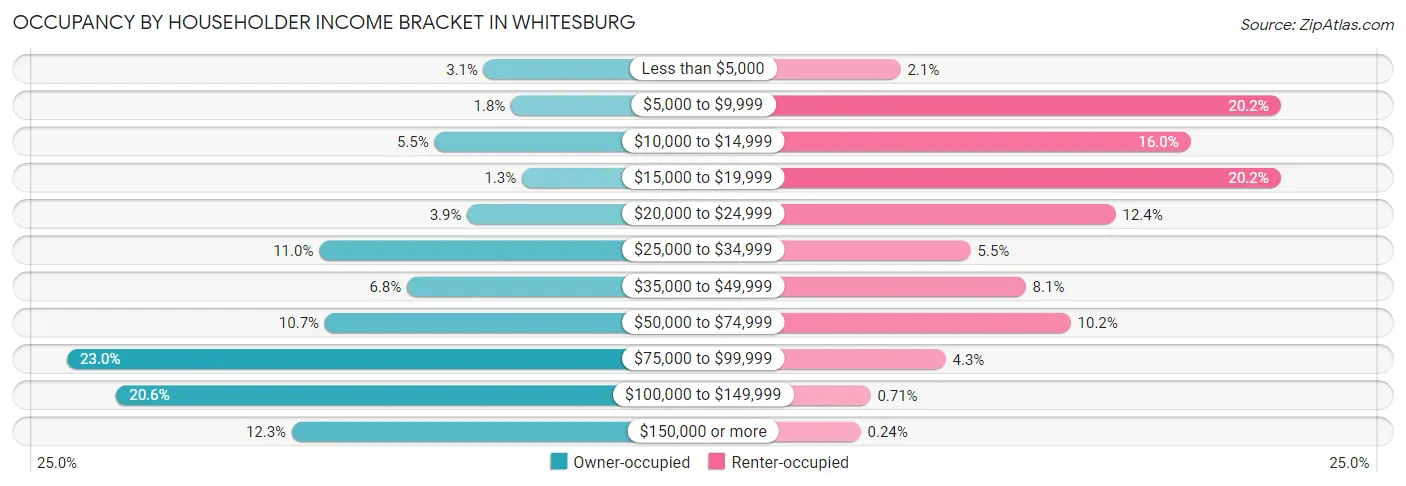
| Income Bracket | Owner-occupied | Renter-occupied |
| Less than $5,000 | 12 (3.1%) | 9 (2.1%) |
| $5,000 to $9,999 | 7 (1.8%) | 85 (20.2%) |
| $10,000 to $14,999 | 21 (5.5%) | 67 (16.0%) |
| $15,000 to $19,999 | 5 (1.3%) | 85 (20.2%) |
| $20,000 to $24,999 | 15 (3.9%) | 52 (12.4%) |
| $25,000 to $34,999 | 42 (11.0%) | 23 (5.5%) |
| $35,000 to $49,999 | 26 (6.8%) | 34 (8.1%) |
| $50,000 to $74,999 | 41 (10.7%) | 43 (10.2%) |
| $75,000 to $99,999 | 88 (23.0%) | 18 (4.3%) |
| $100,000 to $149,999 | 79 (20.6%) | 3 (0.7%) |
| $150,000 or more | 47 (12.3%) | 1 (0.2%) |
| Total | 383 (100.0%) | 420 (100.0%) |
Monthly Housing Cost Tiers in Whitesburg
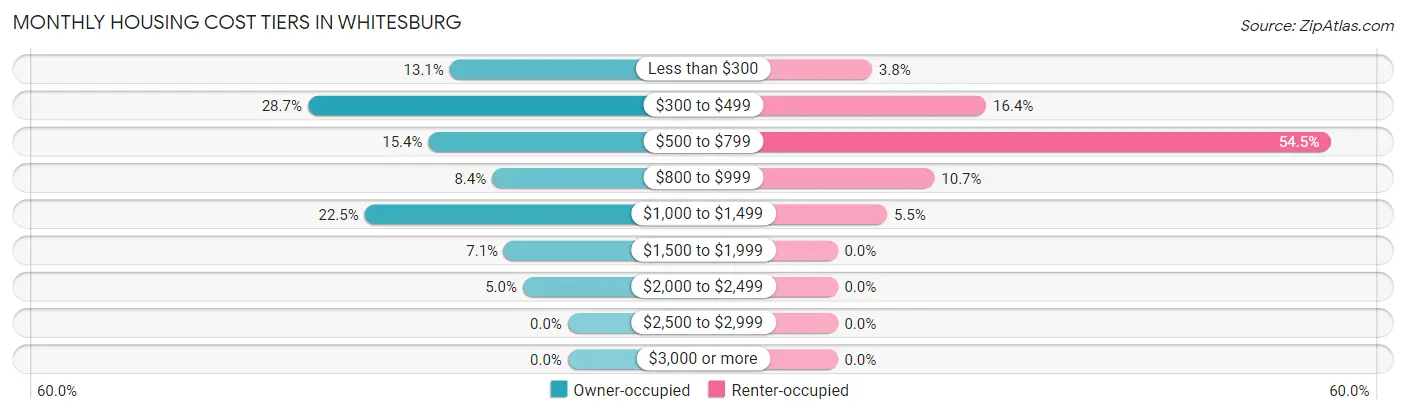
| Monthly Cost | Owner-occupied | Renter-occupied |
| Less than $300 | 50 (13.1%) | 16 (3.8%) |
| $300 to $499 | 110 (28.7%) | 69 (16.4%) |
| $500 to $799 | 59 (15.4%) | 229 (54.5%) |
| $800 to $999 | 32 (8.4%) | 45 (10.7%) |
| $1,000 to $1,499 | 86 (22.5%) | 23 (5.5%) |
| $1,500 to $1,999 | 27 (7.0%) | 0 (0.0%) |
| $2,000 to $2,499 | 19 (5.0%) | 0 (0.0%) |
| $2,500 to $2,999 | 0 (0.0%) | 0 (0.0%) |
| $3,000 or more | 0 (0.0%) | 0 (0.0%) |
| Total | 383 (100.0%) | 420 (100.0%) |
Physical Housing Characteristics in Whitesburg
Housing Structures in Whitesburg
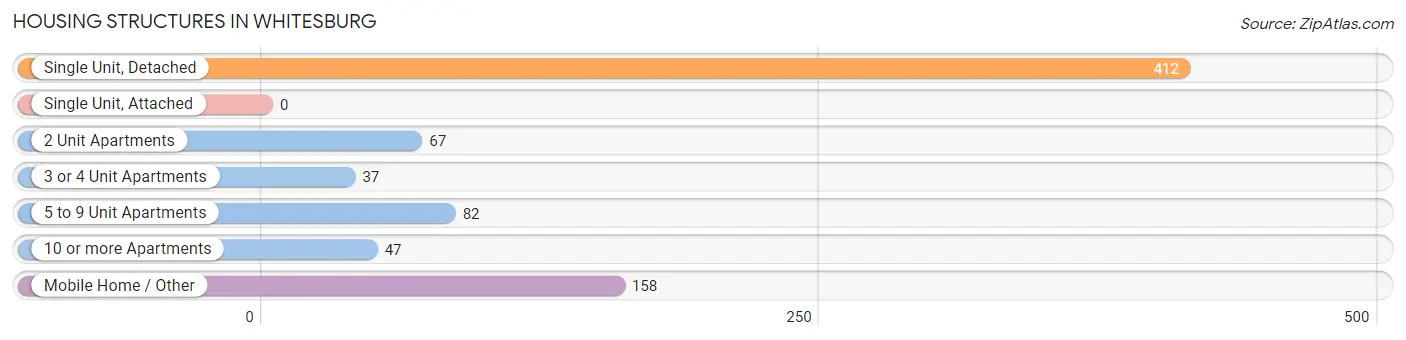
| Structure Type | # Housing Units | % Housing Units |
| Single Unit, Detached | 412 | 51.3% |
| Single Unit, Attached | 0 | 0.0% |
| 2 Unit Apartments | 67 | 8.3% |
| 3 or 4 Unit Apartments | 37 | 4.6% |
| 5 to 9 Unit Apartments | 82 | 10.2% |
| 10 or more Apartments | 47 | 5.9% |
| Mobile Home / Other | 158 | 19.7% |
| Total | 803 | 100.0% |
Housing Structures by Occupancy in Whitesburg
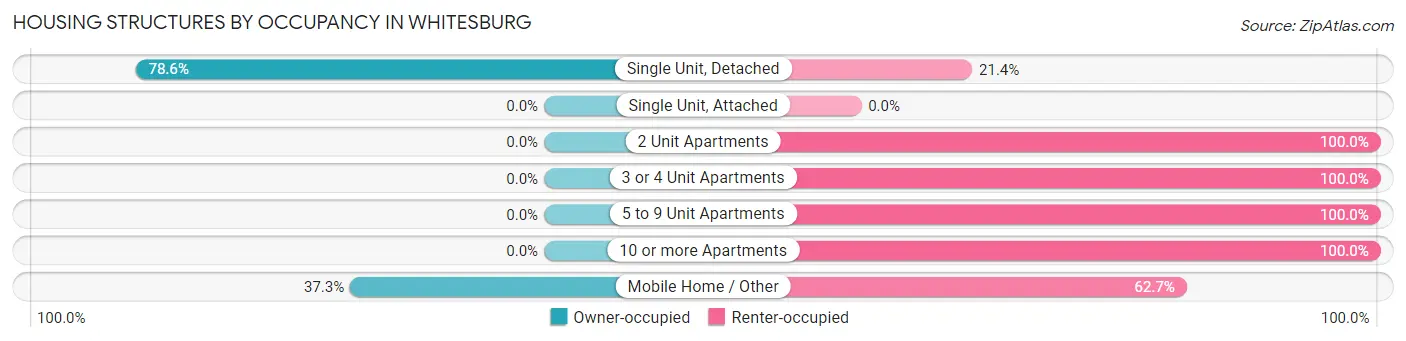
| Structure Type | Owner-occupied | Renter-occupied |
| Single Unit, Detached | 324 (78.6%) | 88 (21.4%) |
| Single Unit, Attached | 0 (0.0%) | 0 (0.0%) |
| 2 Unit Apartments | 0 (0.0%) | 67 (100.0%) |
| 3 or 4 Unit Apartments | 0 (0.0%) | 37 (100.0%) |
| 5 to 9 Unit Apartments | 0 (0.0%) | 82 (100.0%) |
| 10 or more Apartments | 0 (0.0%) | 47 (100.0%) |
| Mobile Home / Other | 59 (37.3%) | 99 (62.7%) |
| Total | 383 (47.7%) | 420 (52.3%) |
Housing Structures by Number of Rooms in Whitesburg
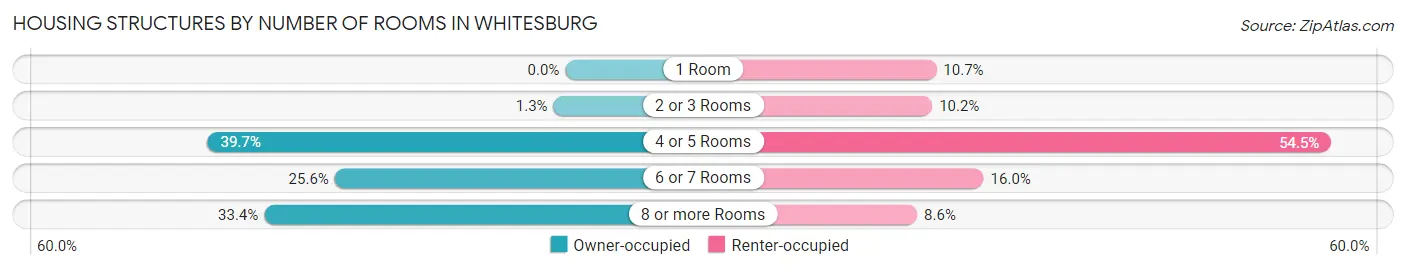
| Number of Rooms | Owner-occupied | Renter-occupied |
| 1 Room | 0 (0.0%) | 45 (10.7%) |
| 2 or 3 Rooms | 5 (1.3%) | 43 (10.2%) |
| 4 or 5 Rooms | 152 (39.7%) | 229 (54.5%) |
| 6 or 7 Rooms | 98 (25.6%) | 67 (16.0%) |
| 8 or more Rooms | 128 (33.4%) | 36 (8.6%) |
| Total | 383 (100.0%) | 420 (100.0%) |
Housing Structure by Heating Type in Whitesburg
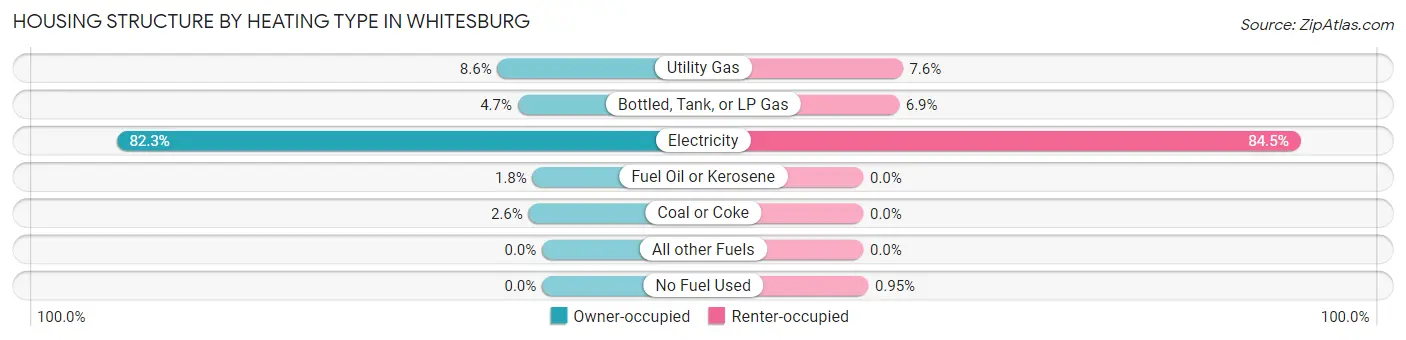
| Heating Type | Owner-occupied | Renter-occupied |
| Utility Gas | 33 (8.6%) | 32 (7.6%) |
| Bottled, Tank, or LP Gas | 18 (4.7%) | 29 (6.9%) |
| Electricity | 315 (82.3%) | 355 (84.5%) |
| Fuel Oil or Kerosene | 7 (1.8%) | 0 (0.0%) |
| Coal or Coke | 10 (2.6%) | 0 (0.0%) |
| All other Fuels | 0 (0.0%) | 0 (0.0%) |
| No Fuel Used | 0 (0.0%) | 4 (0.9%) |
| Total | 383 (100.0%) | 420 (100.0%) |
Household Vehicle Usage in Whitesburg
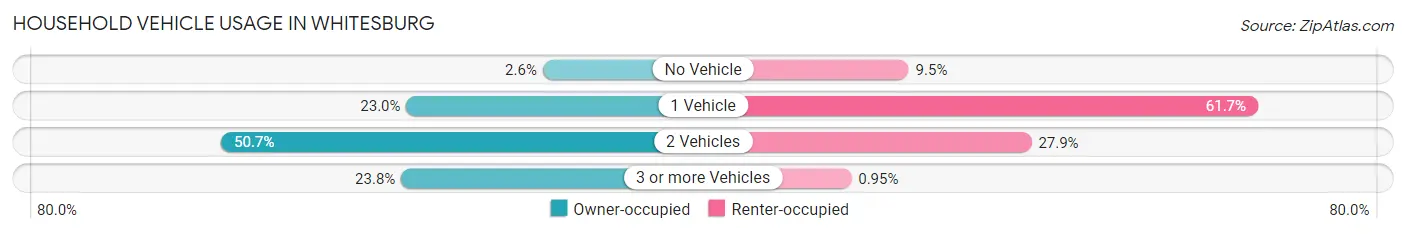
| Vehicles per Household | Owner-occupied | Renter-occupied |
| No Vehicle | 10 (2.6%) | 40 (9.5%) |
| 1 Vehicle | 88 (23.0%) | 259 (61.7%) |
| 2 Vehicles | 194 (50.6%) | 117 (27.9%) |
| 3 or more Vehicles | 91 (23.8%) | 4 (0.9%) |
| Total | 383 (100.0%) | 420 (100.0%) |
Real Estate & Mortgages in Whitesburg
Real Estate and Mortgage Overview in Whitesburg
| Characteristic | Without Mortgage | With Mortgage |
| Housing Units | 220 | 163 |
| Median Property Value | $87,500 | $139,100 |
| Median Household Income | $57,083 | $27 |
| Monthly Housing Costs | $415 | $0 |
| Real Estate Taxes | $792 | $19 |
Property Value by Mortgage Status in Whitesburg
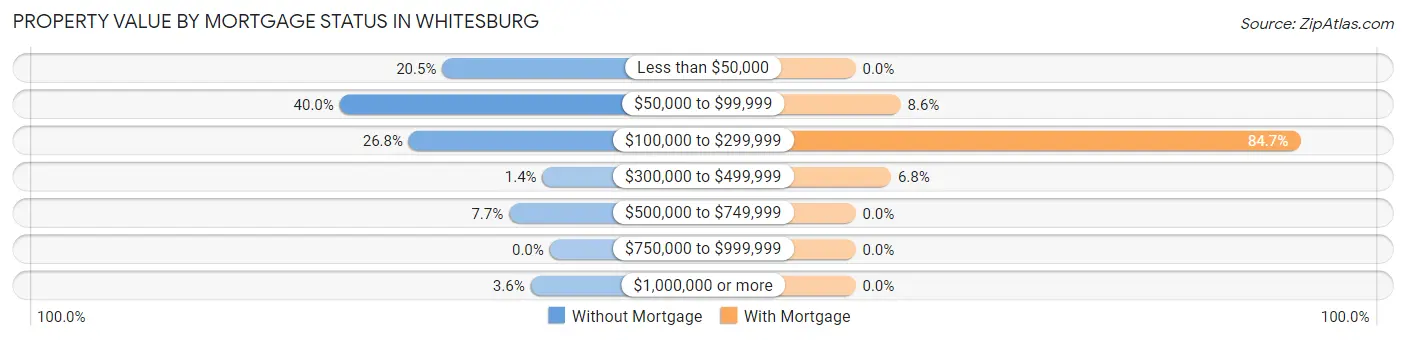
| Property Value | Without Mortgage | With Mortgage |
| Less than $50,000 | 45 (20.4%) | 0 (0.0%) |
| $50,000 to $99,999 | 88 (40.0%) | 14 (8.6%) |
| $100,000 to $299,999 | 59 (26.8%) | 138 (84.7%) |
| $300,000 to $499,999 | 3 (1.4%) | 11 (6.8%) |
| $500,000 to $749,999 | 17 (7.7%) | 0 (0.0%) |
| $750,000 to $999,999 | 0 (0.0%) | 0 (0.0%) |
| $1,000,000 or more | 8 (3.6%) | 0 (0.0%) |
| Total | 220 (100.0%) | 163 (100.0%) |
Household Income by Mortgage Status in Whitesburg
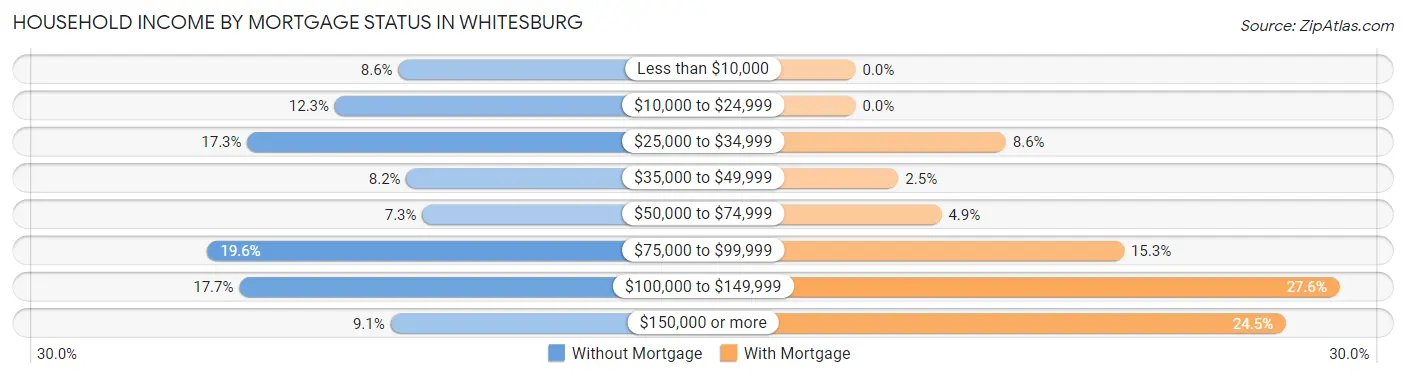
| Household Income | Without Mortgage | With Mortgage |
| Less than $10,000 | 19 (8.6%) | 0 (0.0%) |
| $10,000 to $24,999 | 27 (12.3%) | 0 (0.0%) |
| $25,000 to $34,999 | 38 (17.3%) | 14 (8.6%) |
| $35,000 to $49,999 | 18 (8.2%) | 4 (2.5%) |
| $50,000 to $74,999 | 16 (7.3%) | 8 (4.9%) |
| $75,000 to $99,999 | 43 (19.6%) | 25 (15.3%) |
| $100,000 to $149,999 | 39 (17.7%) | 45 (27.6%) |
| $150,000 or more | 20 (9.1%) | 40 (24.5%) |
| Total | 220 (100.0%) | 163 (100.0%) |
Property Value to Household Income Ratio in Whitesburg
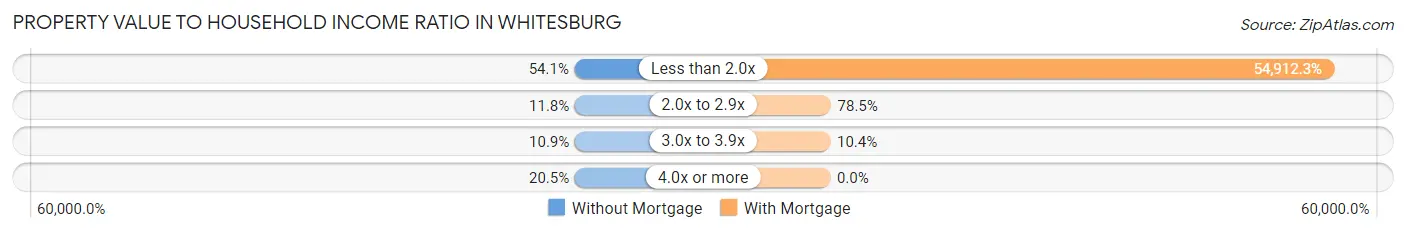
| Value-to-Income Ratio | Without Mortgage | With Mortgage |
| Less than 2.0x | 119 (54.1%) | 89,507 (54,912.3%) |
| 2.0x to 2.9x | 26 (11.8%) | 128 (78.5%) |
| 3.0x to 3.9x | 24 (10.9%) | 17 (10.4%) |
| 4.0x or more | 45 (20.4%) | 0 (0.0%) |
| Total | 220 (100.0%) | 163 (100.0%) |
Real Estate Taxes by Mortgage Status in Whitesburg
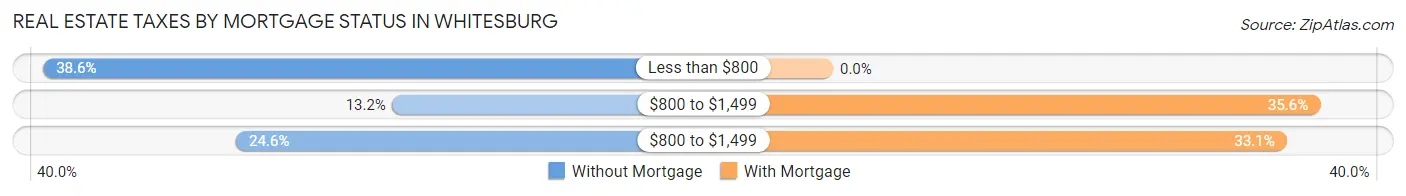
| Property Taxes | Without Mortgage | With Mortgage |
| Less than $800 | 85 (38.6%) | 0 (0.0%) |
| $800 to $1,499 | 29 (13.2%) | 58 (35.6%) |
| $800 to $1,499 | 54 (24.5%) | 54 (33.1%) |
| Total | 220 (100.0%) | 163 (100.0%) |
Health & Disability in Whitesburg
Health Insurance Coverage by Age in Whitesburg
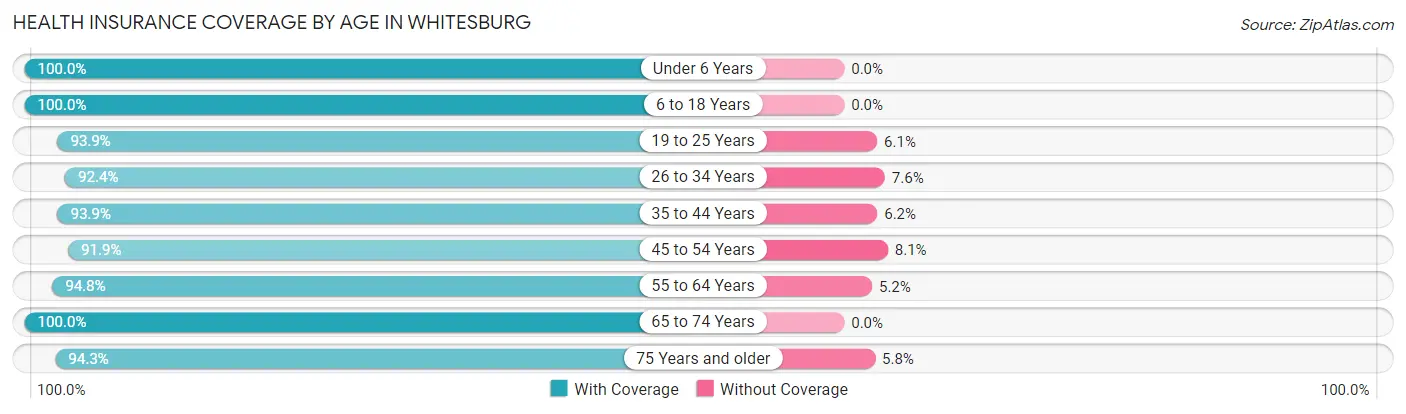
| Age Bracket | With Coverage | Without Coverage |
| Under 6 Years | 139 (100.0%) | 0 (0.0%) |
| 6 to 18 Years | 323 (100.0%) | 0 (0.0%) |
| 19 to 25 Years | 199 (93.9%) | 13 (6.1%) |
| 26 to 34 Years | 171 (92.4%) | 14 (7.6%) |
| 35 to 44 Years | 229 (93.9%) | 15 (6.1%) |
| 45 to 54 Years | 181 (91.9%) | 16 (8.1%) |
| 55 to 64 Years | 220 (94.8%) | 12 (5.2%) |
| 65 to 74 Years | 223 (100.0%) | 0 (0.0%) |
| 75 Years and older | 164 (94.3%) | 10 (5.8%) |
| Total | 1,849 (95.9%) | 80 (4.2%) |
Health Insurance Coverage by Citizenship Status in Whitesburg
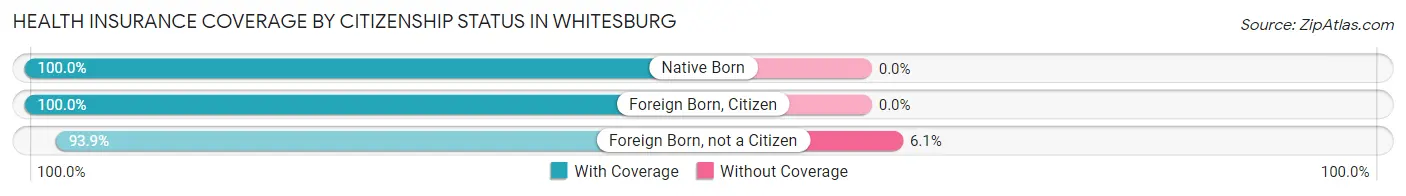
| Citizenship Status | With Coverage | Without Coverage |
| Native Born | 139 (100.0%) | 0 (0.0%) |
| Foreign Born, Citizen | 323 (100.0%) | 0 (0.0%) |
| Foreign Born, not a Citizen | 199 (93.9%) | 13 (6.1%) |
Health Insurance Coverage by Household Income in Whitesburg
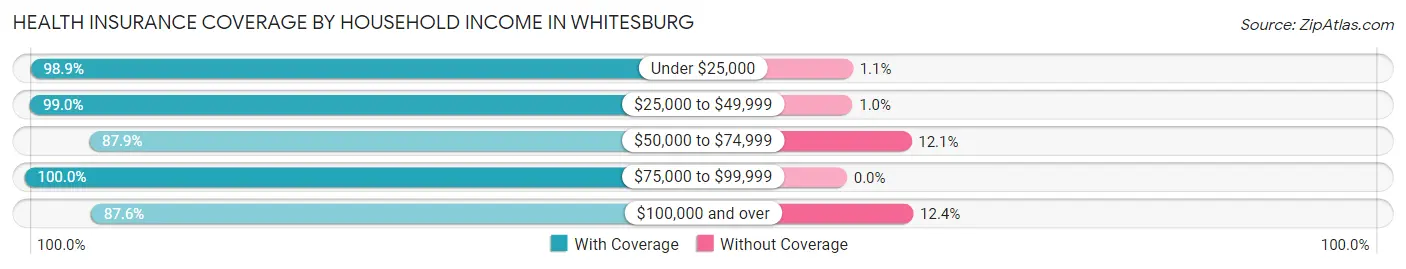
| Household Income | With Coverage | Without Coverage |
| Under $25,000 | 799 (98.9%) | 9 (1.1%) |
| $25,000 to $49,999 | 289 (99.0%) | 3 (1.0%) |
| $50,000 to $74,999 | 160 (87.9%) | 22 (12.1%) |
| $75,000 to $99,999 | 264 (100.0%) | 0 (0.0%) |
| $100,000 and over | 324 (87.6%) | 46 (12.4%) |
Public vs Private Health Insurance Coverage by Age in Whitesburg
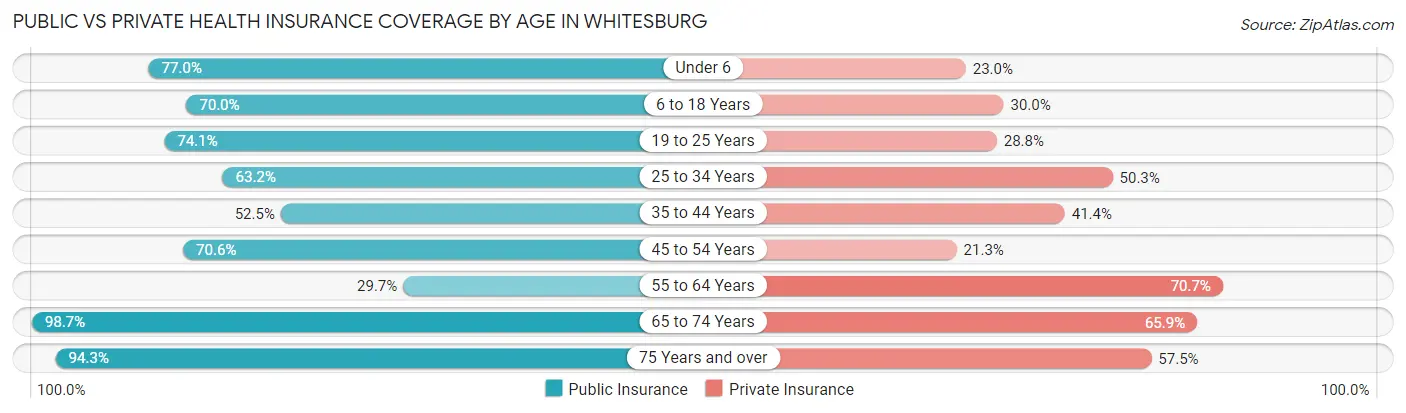
| Age Bracket | Public Insurance | Private Insurance |
| Under 6 | 107 (77.0%) | 32 (23.0%) |
| 6 to 18 Years | 226 (70.0%) | 97 (30.0%) |
| 19 to 25 Years | 157 (74.1%) | 61 (28.8%) |
| 25 to 34 Years | 117 (63.2%) | 93 (50.3%) |
| 35 to 44 Years | 128 (52.5%) | 101 (41.4%) |
| 45 to 54 Years | 139 (70.6%) | 42 (21.3%) |
| 55 to 64 Years | 69 (29.7%) | 164 (70.7%) |
| 65 to 74 Years | 220 (98.7%) | 147 (65.9%) |
| 75 Years and over | 164 (94.3%) | 100 (57.5%) |
| Total | 1,327 (68.8%) | 837 (43.4%) |
Disability Status by Sex by Age in Whitesburg
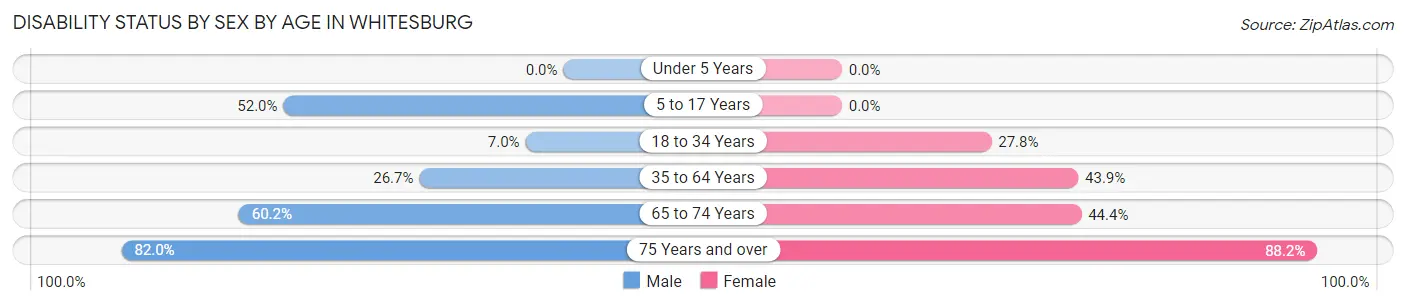
| Age Bracket | Male | Female |
| Under 5 Years | 0 (0.0%) | 0 (0.0%) |
| 5 to 17 Years | 79 (52.0%) | 0 (0.0%) |
| 18 to 34 Years | 15 (7.0%) | 58 (27.8%) |
| 35 to 64 Years | 69 (26.7%) | 182 (43.9%) |
| 65 to 74 Years | 53 (60.2%) | 60 (44.4%) |
| 75 Years and over | 73 (82.0%) | 75 (88.2%) |
Disability Class by Sex by Age in Whitesburg
Disability Class: Hearing Difficulty
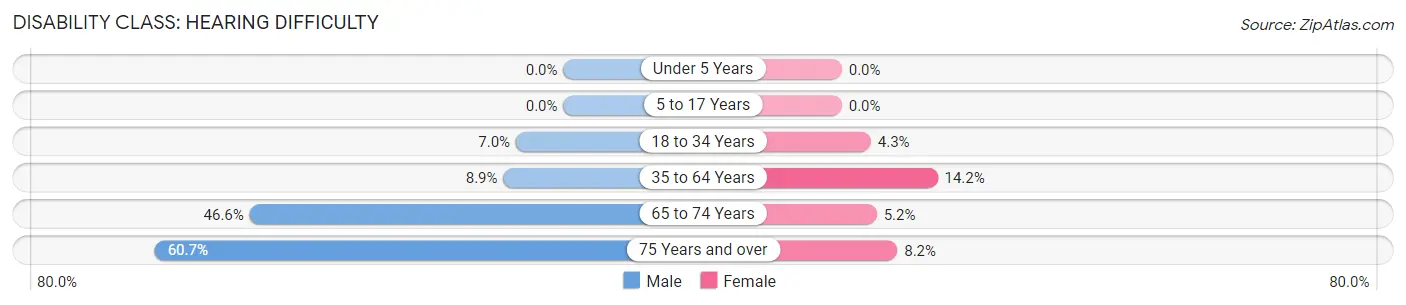
| Age Bracket | Male | Female |
| Under 5 Years | 0 (0.0%) | 0 (0.0%) |
| 5 to 17 Years | 0 (0.0%) | 0 (0.0%) |
| 18 to 34 Years | 15 (7.0%) | 9 (4.3%) |
| 35 to 64 Years | 23 (8.9%) | 59 (14.2%) |
| 65 to 74 Years | 41 (46.6%) | 7 (5.2%) |
| 75 Years and over | 54 (60.7%) | 7 (8.2%) |
Disability Class: Vision Difficulty
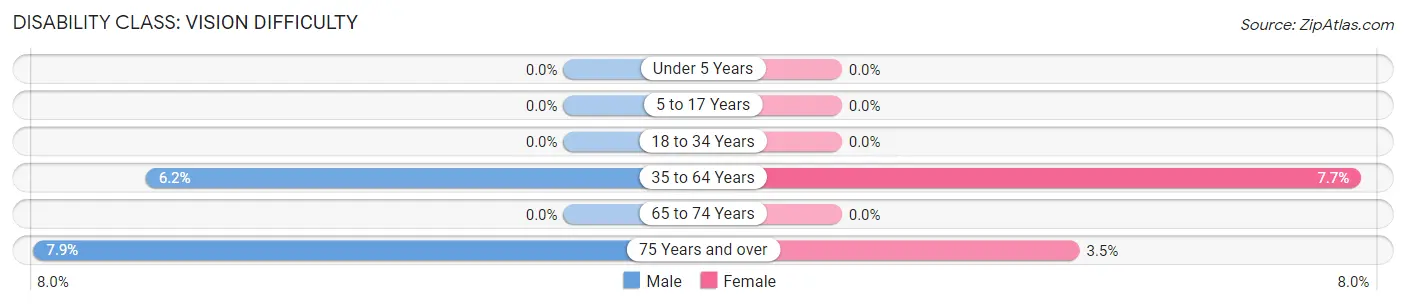
| Age Bracket | Male | Female |
| Under 5 Years | 0 (0.0%) | 0 (0.0%) |
| 5 to 17 Years | 0 (0.0%) | 0 (0.0%) |
| 18 to 34 Years | 0 (0.0%) | 0 (0.0%) |
| 35 to 64 Years | 16 (6.2%) | 32 (7.7%) |
| 65 to 74 Years | 0 (0.0%) | 0 (0.0%) |
| 75 Years and over | 7 (7.9%) | 3 (3.5%) |
Disability Class: Cognitive Difficulty
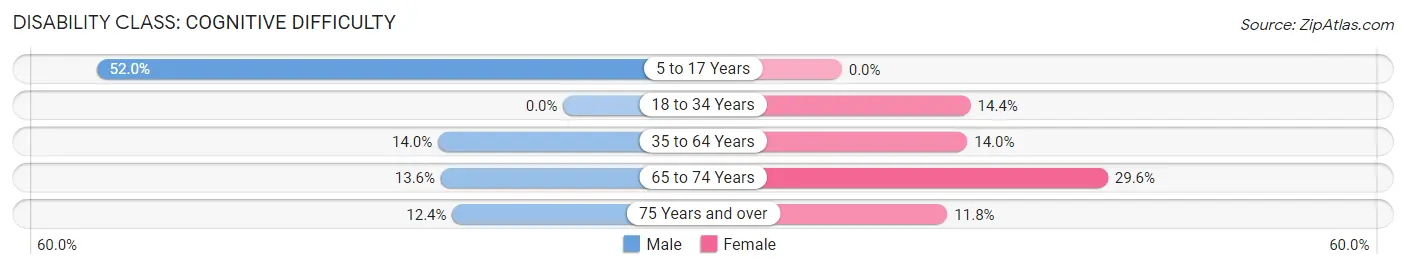
| Age Bracket | Male | Female |
| 5 to 17 Years | 79 (52.0%) | 0 (0.0%) |
| 18 to 34 Years | 0 (0.0%) | 30 (14.3%) |
| 35 to 64 Years | 36 (14.0%) | 58 (14.0%) |
| 65 to 74 Years | 12 (13.6%) | 40 (29.6%) |
| 75 Years and over | 11 (12.4%) | 10 (11.8%) |
Disability Class: Ambulatory Difficulty
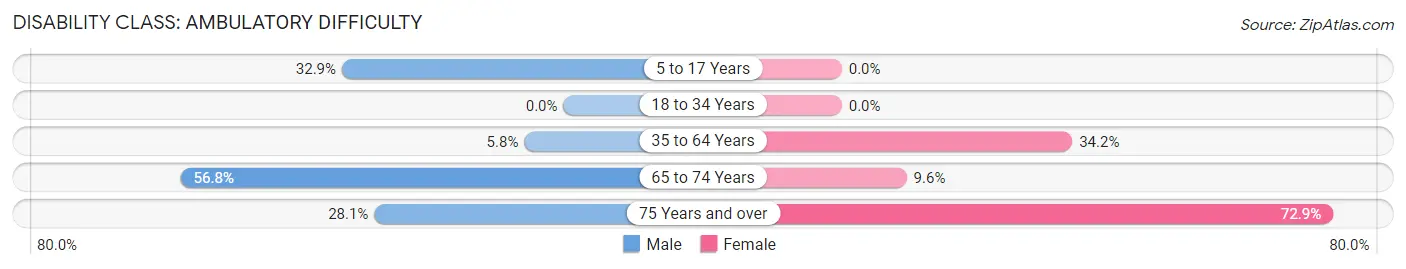
| Age Bracket | Male | Female |
| 5 to 17 Years | 50 (32.9%) | 0 (0.0%) |
| 18 to 34 Years | 0 (0.0%) | 0 (0.0%) |
| 35 to 64 Years | 15 (5.8%) | 142 (34.2%) |
| 65 to 74 Years | 50 (56.8%) | 13 (9.6%) |
| 75 Years and over | 25 (28.1%) | 62 (72.9%) |
Disability Class: Self-Care Difficulty
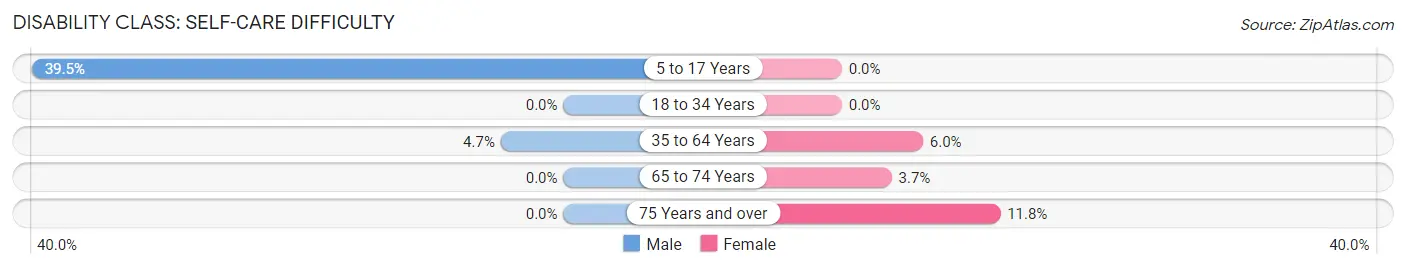
| Age Bracket | Male | Female |
| 5 to 17 Years | 60 (39.5%) | 0 (0.0%) |
| 18 to 34 Years | 0 (0.0%) | 0 (0.0%) |
| 35 to 64 Years | 12 (4.6%) | 25 (6.0%) |
| 65 to 74 Years | 0 (0.0%) | 5 (3.7%) |
| 75 Years and over | 0 (0.0%) | 10 (11.8%) |
Technology Access in Whitesburg
Computing Device Access in Whitesburg
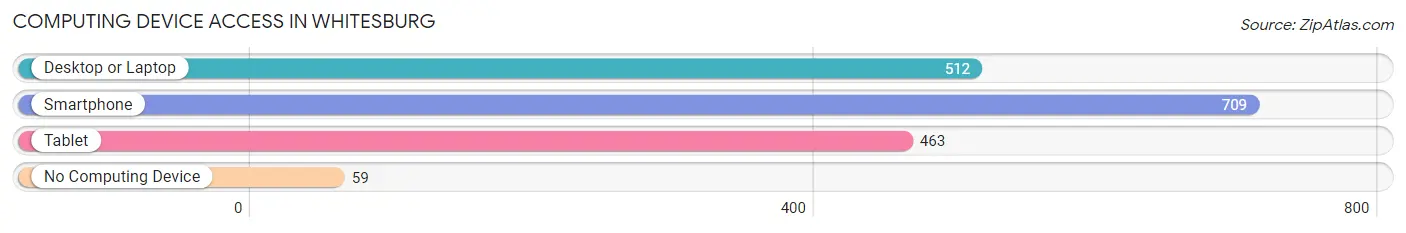
| Device Type | # Households | % Households |
| Desktop or Laptop | 512 | 63.8% |
| Smartphone | 709 | 88.3% |
| Tablet | 463 | 57.7% |
| No Computing Device | 59 | 7.3% |
| Total | 803 | 100.0% |
Internet Access in Whitesburg
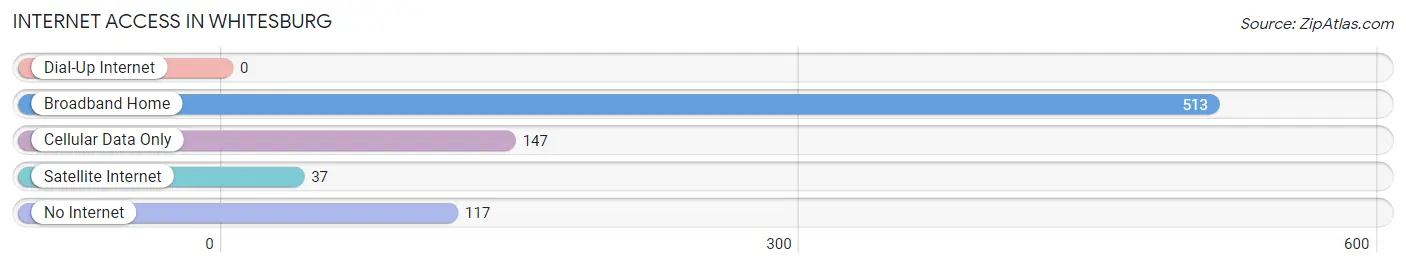
| Internet Type | # Households | % Households |
| Dial-Up Internet | 0 | 0.0% |
| Broadband Home | 513 | 63.9% |
| Cellular Data Only | 147 | 18.3% |
| Satellite Internet | 37 | 4.6% |
| No Internet | 117 | 14.6% |
| Total | 803 | 100.0% |
Whitesburg Summary
Whitesburg is a city located in Letcher County, Kentucky, United States. The population was 2,139 at the 2010 census. It is the county seat of Letcher County. The city is named for its founder, William D. White.
History
Whitesburg was founded in 1883 by William D. White, a former Confederate soldier. White had purchased the land from the heirs of the original owner, John C. Caudill. White named the town after himself and began to develop it as a commercial center for the surrounding area. The town was incorporated in 1891.
Whitesburg was the site of a major coal mining operation in the early 20th century. The coal industry was the primary source of employment for the town's residents. The coal industry declined in the mid-20th century, leading to a period of economic decline for the town.
In the late 20th century, Whitesburg began to experience a resurgence. The city has become a popular tourist destination, with a number of restaurants, shops, and other attractions. The city is also home to the Letcher County Tourism Commission, which promotes the area's attractions.
Geography
Whitesburg is located in southeastern Kentucky, in the Appalachian Mountains. The city is situated in the valley of the North Fork of the Kentucky River. The city is surrounded by mountains, including Pine Mountain to the east and the Cumberland Plateau to the west.
The city has a total area of 2 2 square miles 5 7 km2 all of it land
Economy
The economy of Whitesburg is largely based on tourism and retail. The city is home to a number of restaurants, shops, and other attractions. The city is also home to the Letcher County Tourism Commission, which promotes the area's attractions.
The city is also home to a number of manufacturing and industrial businesses. The largest employer in the city is the Whitesburg Industrial Park, which is home to a number of businesses, including a plastics manufacturer and a furniture manufacturer.
Demographics
As of the 2010 census, there were 2,139 people, 890 households, and 545 families residing in the city. The population density was 971.2 people per square mile (375.3/km2). There were 1,006 housing units at an average density of 454.2 per square mile (175.3/km2). The racial makeup of the city was 97.2% White, 0.7% African American, 0.2% Native American, 0.2% Asian, 0.1% Pacific Islander, 0.7% from other races, and 0.9% from two or more races. Hispanic or Latino of any race were 1.2% of the population.
There were 890 households, out of which 28.2% had children under the age of 18 living with them, 41.2% were married couples living together, 16.2% had a female householder with no husband present, and 37.2% were non-families. 33.2% of all households were made up of individuals, and 15.2% had someone living alone who was 65 years of age or older. The average household size was 2.30 and the average family size was 2.90.
In the city, the population was spread out, with 24.2% under the age of 18, 8.2% from 18 to 24, 27.2% from 25 to 44, 24.2% from 45 to 64, and 16.2% who were 65 years of age or older. The median age was 38 years. For every 100 females, there were 87.2 males. For every 100 females age 18 and over, there were 82.2 males.
The median income for a household in the city was $19,917, and the median income for a family was $25,000. Males had a median income of $30,000 versus $20,000 for females. The per capita income for the city was $12,845. About 22.2% of families and 25.2% of the population were below the poverty line, including 33.2% of those under age 18 and 20.2% of those age 65 or over.
Common Questions
What is Per Capita Income in Whitesburg?
Per Capita income in Whitesburg is $25,628.
What is the Median Family Income in Whitesburg?
Median Family Income in Whitesburg is $46,250.
What is the Median Household income in Whitesburg?
Median Household Income in Whitesburg is $32,663.
What is Income or Wage Gap in Whitesburg?
Income or Wage Gap in Whitesburg is 41.0%.
Women in Whitesburg earn 59.0 cents for every dollar earned by a man.
What is Family Income Deficit in Whitesburg?
Family Income Deficit in Whitesburg is $12,184.
Families that are below poverty line in Whitesburg earn $12,184 less on average than the poverty threshold level.
What is Inequality or Gini Index in Whitesburg?
Inequality or Gini Index in Whitesburg is 0.57.
What is the Total Population of Whitesburg?
Total Population of Whitesburg is 2,153.
What is the Total Male Population of Whitesburg?
Total Male Population of Whitesburg is 938.
What is the Total Female Population of Whitesburg?
Total Female Population of Whitesburg is 1,215.
What is the Ratio of Males per 100 Females in Whitesburg?
There are 77.20 Males per 100 Females in Whitesburg.
What is the Ratio of Females per 100 Males in Whitesburg?
There are 129.53 Females per 100 Males in Whitesburg.
What is the Median Population Age in Whitesburg?
Median Population Age in Whitesburg is 41.0 Years.
What is the Average Family Size in Whitesburg
Average Family Size in Whitesburg is 3.0 People.
What is the Average Household Size in Whitesburg
Average Household Size in Whitesburg is 2.4 People.
How Large is the Labor Force in Whitesburg?
There are 789 People in the Labor Forcein in Whitesburg.
What is the Percentage of People in the Labor Force in Whitesburg?
45.1% of People are in the Labor Force in Whitesburg.
What is the Unemployment Rate in Whitesburg?
Unemployment Rate in Whitesburg is 17.6%.