Loyall, KY Map & Demographics
Loyall Map
Loyall Overview
$16,017
PER CAPITA INCOME
$37,639
AVG FAMILY INCOME
$30,278
AVG HOUSEHOLD INCOME
16.4%
WAGE / INCOME GAP [ % ]
83.6¢/ $1
WAGE / INCOME GAP [ $ ]
$9,702
FAMILY INCOME DEFICIT
0.39
INEQUALITY / GINI INDEX
614
TOTAL POPULATION
276
MALE POPULATION
338
FEMALE POPULATION
81.66
MALES / 100 FEMALES
122.46
FEMALES / 100 MALES
39.8
MEDIAN AGE
3.4
AVG FAMILY SIZE
2.5
AVG HOUSEHOLD SIZE
192
LABOR FORCE [ PEOPLE ]
41.0%
PERCENT IN LABOR FORCE
8.3%
UNEMPLOYMENT RATE
Loyall Zip Codes
Loyall Area Codes
Income in Loyall
Income Overview in Loyall
Per Capita Income in Loyall is $16,017, while median incomes of families and households are $37,639 and $30,278 respectively.
| Characteristic | Number | Measure |
| Per Capita Income | 614 | $16,017 |
| Median Family Income | 133 | $37,639 |
| Mean Family Income | 133 | $44,856 |
| Median Household Income | 244 | $30,278 |
| Mean Household Income | 244 | $39,201 |
| Income Deficit | 133 | $9,702 |
| Wage / Income Gap (%) | 614 | 16.42% |
| Wage / Income Gap ($) | 614 | 83.58¢ per $1 |
| Gini / Inequality Index | 614 | 0.39 |
Earnings by Sex in Loyall
Average Earnings in Loyall are $21,576, $19,375 for men and $23,182 for women, a difference of 16.4%.
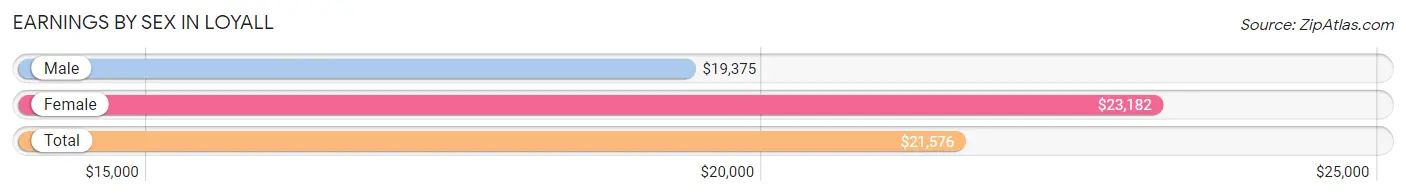
| Sex | Number | Average Earnings |
| Male | 99 (48.3%) | $19,375 |
| Female | 106 (51.7%) | $23,182 |
| Total | 205 (100.0%) | $21,576 |
Earnings by Sex by Income Bracket in Loyall
The most common earnings brackets in Loyall are $5,000 to $7,499 for men (20 | 20.2%) and $30,000 to $34,999 for women (23 | 21.7%).
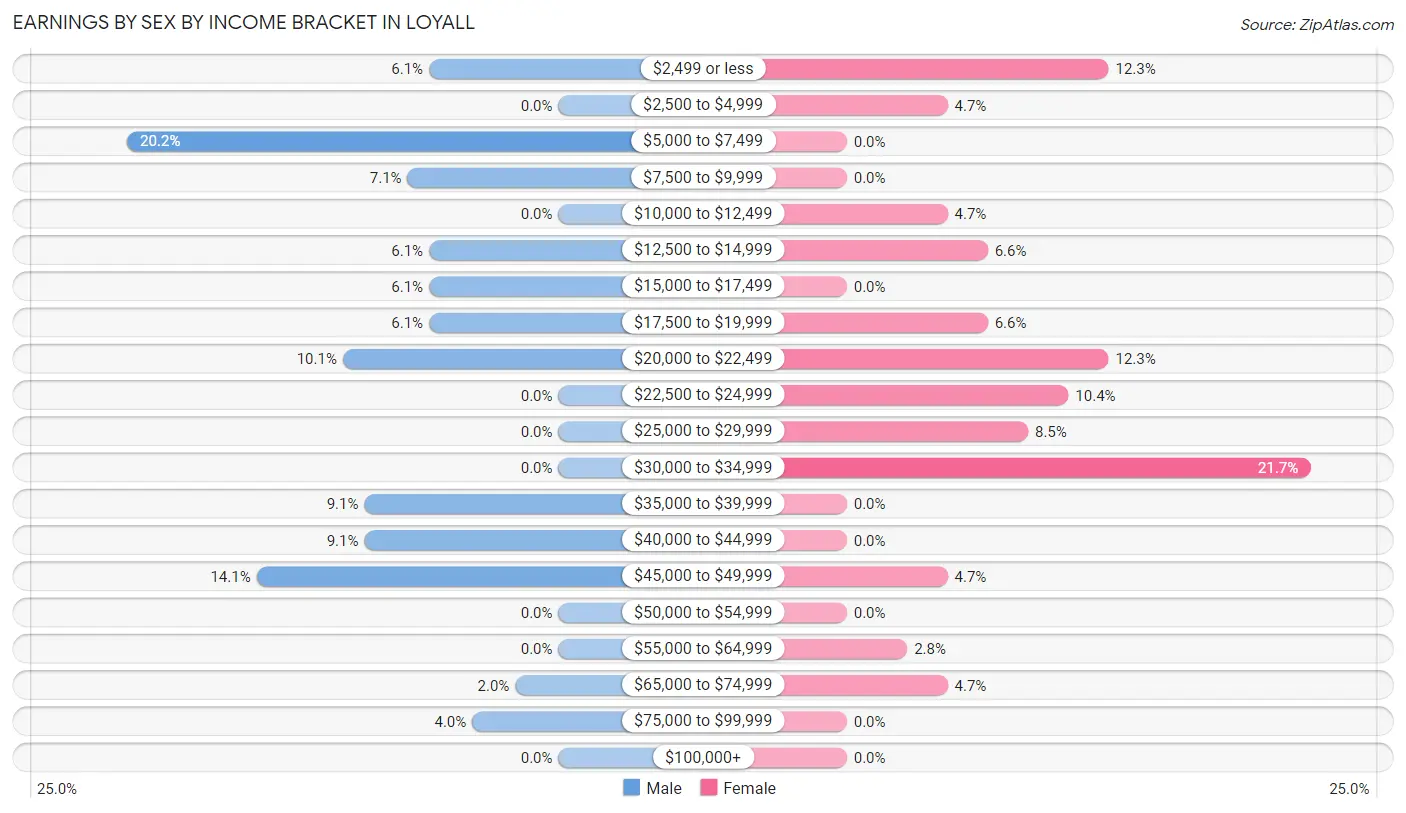
| Income | Male | Female |
| $2,499 or less | 6 (6.1%) | 13 (12.3%) |
| $2,500 to $4,999 | 0 (0.0%) | 5 (4.7%) |
| $5,000 to $7,499 | 20 (20.2%) | 0 (0.0%) |
| $7,500 to $9,999 | 7 (7.1%) | 0 (0.0%) |
| $10,000 to $12,499 | 0 (0.0%) | 5 (4.7%) |
| $12,500 to $14,999 | 6 (6.1%) | 7 (6.6%) |
| $15,000 to $17,499 | 6 (6.1%) | 0 (0.0%) |
| $17,500 to $19,999 | 6 (6.1%) | 7 (6.6%) |
| $20,000 to $22,499 | 10 (10.1%) | 13 (12.3%) |
| $22,500 to $24,999 | 0 (0.0%) | 11 (10.4%) |
| $25,000 to $29,999 | 0 (0.0%) | 9 (8.5%) |
| $30,000 to $34,999 | 0 (0.0%) | 23 (21.7%) |
| $35,000 to $39,999 | 9 (9.1%) | 0 (0.0%) |
| $40,000 to $44,999 | 9 (9.1%) | 0 (0.0%) |
| $45,000 to $49,999 | 14 (14.1%) | 5 (4.7%) |
| $50,000 to $54,999 | 0 (0.0%) | 0 (0.0%) |
| $55,000 to $64,999 | 0 (0.0%) | 3 (2.8%) |
| $65,000 to $74,999 | 2 (2.0%) | 5 (4.7%) |
| $75,000 to $99,999 | 4 (4.0%) | 0 (0.0%) |
| $100,000+ | 0 (0.0%) | 0 (0.0%) |
| Total | 99 (100.0%) | 106 (100.0%) |
Earnings by Sex by Educational Attainment in Loyall
Average earnings in Loyall are $18,958 for men and $23,864 for women, a difference of 20.6%. Men with an educational attainment of high school diploma enjoy the highest average annual earnings of $21,875, while those with high school diploma education earn the least with $21,875. Women with an educational attainment of high school diploma earn the most with the average annual earnings of $30,083, while those with college or associate's degree education have the smallest earnings of $25,417.
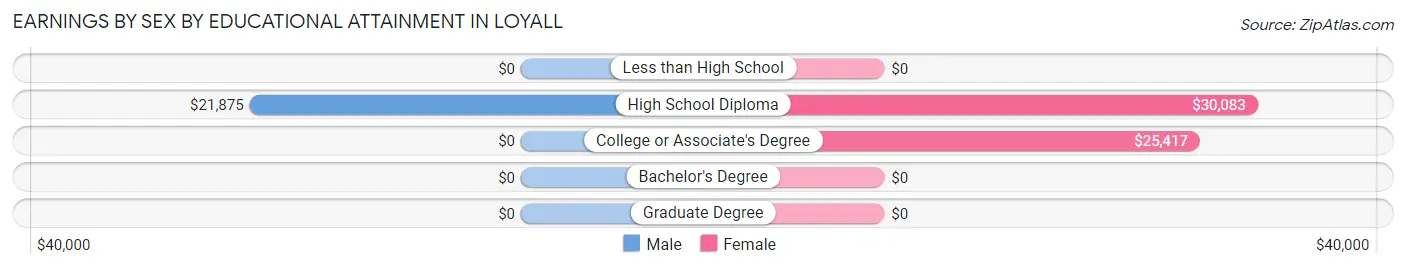
| Educational Attainment | Male Income | Female Income |
| Less than High School | - | - |
| High School Diploma | $21,875 | $30,083 |
| College or Associate's Degree | - | - |
| Bachelor's Degree | - | - |
| Graduate Degree | - | - |
| Total | $18,958 | $23,864 |
Family Income in Loyall
Family Income Brackets in Loyall
According to the Loyall family income data, there are 28 families falling into the $15,000 to $24,999 income range, which is the most common income bracket and makes up 21.0% of all families.
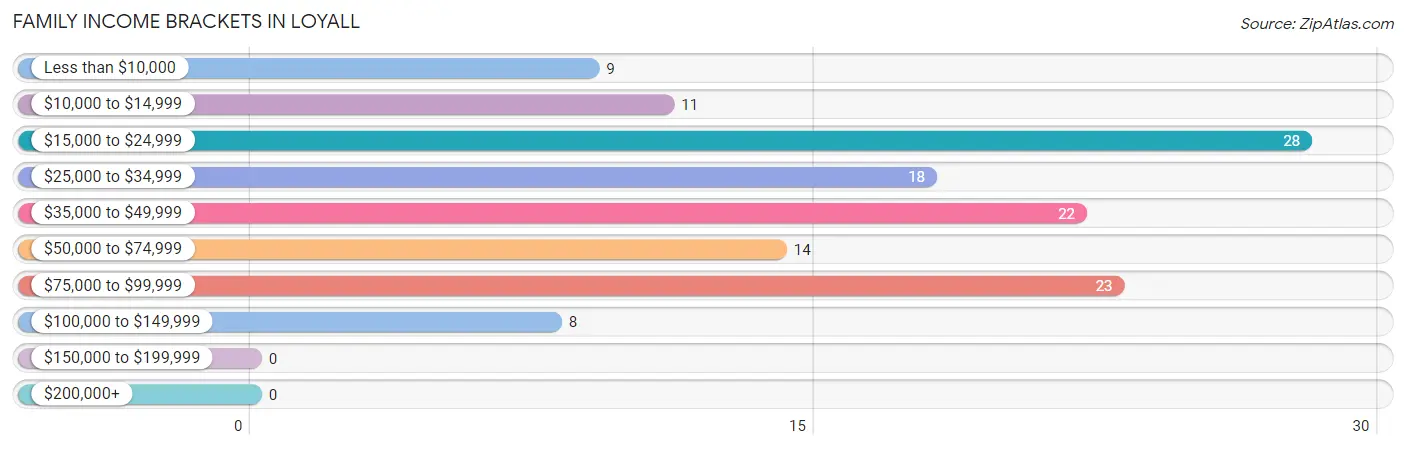
| Income Bracket | # Families | % Families |
| Less than $10,000 | 9 | 6.8% |
| $10,000 to $14,999 | 11 | 8.3% |
| $15,000 to $24,999 | 28 | 21.1% |
| $25,000 to $34,999 | 18 | 13.5% |
| $35,000 to $49,999 | 22 | 16.5% |
| $50,000 to $74,999 | 14 | 10.5% |
| $75,000 to $99,999 | 23 | 17.3% |
| $100,000 to $149,999 | 8 | 6.0% |
| $150,000 to $199,999 | 0 | 0.0% |
| $200,000+ | 0 | 0.0% |
Family Income by Famaliy Size in Loyall
5-person families (23 | 17.3%) account for the highest median family income in Loyall with $69,531 per family, while 2-person families (66 | 49.6%) have the highest median income of $15,357 per family member.
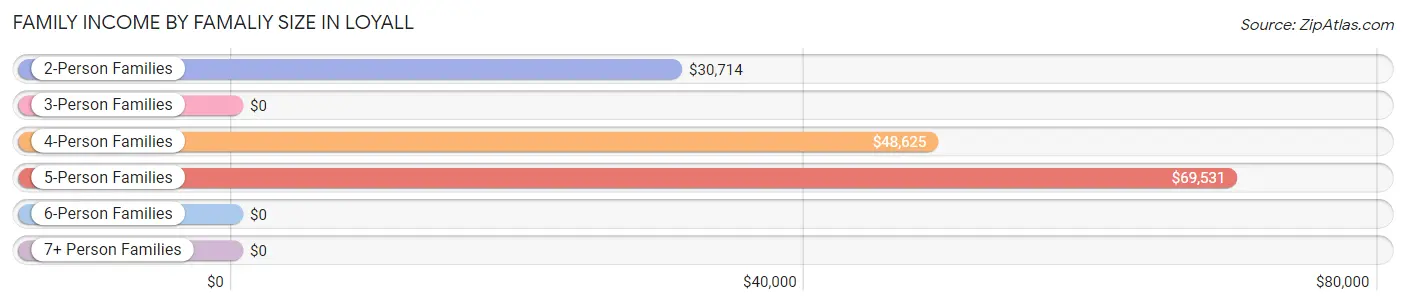
| Income Bracket | # Families | Median Income |
| 2-Person Families | 66 (49.6%) | $30,714 |
| 3-Person Families | 17 (12.8%) | $0 |
| 4-Person Families | 21 (15.8%) | $48,625 |
| 5-Person Families | 23 (17.3%) | $69,531 |
| 6-Person Families | 6 (4.5%) | $0 |
| 7+ Person Families | 0 (0.0%) | $0 |
| Total | 133 (100.0%) | $37,639 |
Family Income by Number of Earners in Loyall
| Number of Earners | # Families | Median Income |
| No Earners | 45 (33.8%) | $0 |
| 1 Earner | 50 (37.6%) | $0 |
| 2 Earners | 30 (22.6%) | $0 |
| 3+ Earners | 8 (6.0%) | $0 |
| Total | 133 (100.0%) | $37,639 |
Household Income in Loyall
Household Income Brackets in Loyall
With 68 households falling in the category, the $15,000 to $24,999 income range is the most frequent in Loyall, accounting for 27.9% of all households.
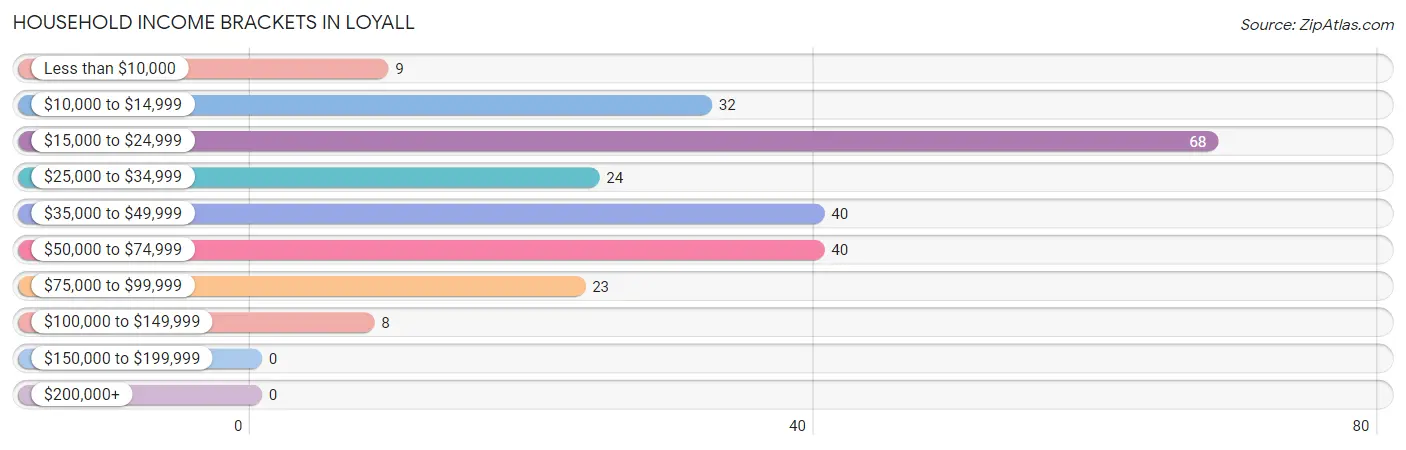
| Income Bracket | # Households | % Households |
| Less than $10,000 | 9 | 3.7% |
| $10,000 to $14,999 | 32 | 13.1% |
| $15,000 to $24,999 | 68 | 27.9% |
| $25,000 to $34,999 | 24 | 9.8% |
| $35,000 to $49,999 | 40 | 16.4% |
| $50,000 to $74,999 | 40 | 16.4% |
| $75,000 to $99,999 | 23 | 9.4% |
| $100,000 to $149,999 | 8 | 3.3% |
| $150,000 to $199,999 | 0 | 0.0% |
| $200,000+ | 0 | 0.0% |
Household Income by Householder Age in Loyall
The median household income in Loyall is $30,278, with the highest median household income of $38,750 found in the 65+ years age bracket for the primary householder. A total of 79 households (32.4%) fall into this category.
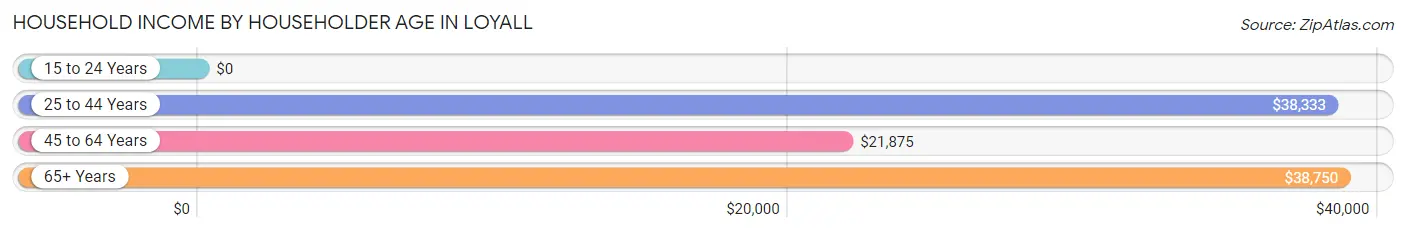
| Income Bracket | # Households | Median Income |
| 15 to 24 Years | 0 (0.0%) | $0 |
| 25 to 44 Years | 54 (22.1%) | $38,333 |
| 45 to 64 Years | 111 (45.5%) | $21,875 |
| 65+ Years | 79 (32.4%) | $38,750 |
| Total | 244 (100.0%) | $30,278 |
Poverty in Loyall
Income Below Poverty by Sex and Age in Loyall
With 35.9% poverty level for males and 40.5% for females among the residents of Loyall, under 5 year old males and 15 year old females are the most vulnerable to poverty, with 17 males (100.0%) and 6 females (100.0%) in their respective age groups living below the poverty level.
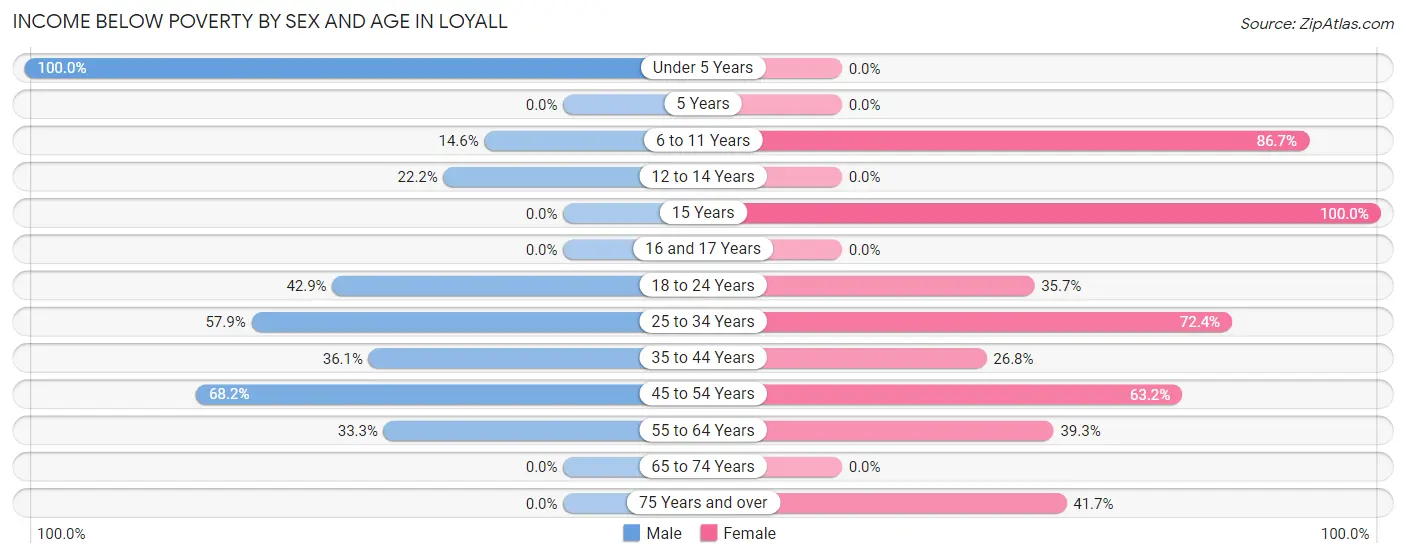
| Age Bracket | Male | Female |
| Under 5 Years | 17 (100.0%) | 0 (0.0%) |
| 5 Years | 0 (0.0%) | 0 (0.0%) |
| 6 to 11 Years | 6 (14.6%) | 26 (86.7%) |
| 12 to 14 Years | 6 (22.2%) | 0 (0.0%) |
| 15 Years | 0 (0.0%) | 6 (100.0%) |
| 16 and 17 Years | 0 (0.0%) | 0 (0.0%) |
| 18 to 24 Years | 6 (42.9%) | 5 (35.7%) |
| 25 to 34 Years | 11 (57.9%) | 21 (72.4%) |
| 35 to 44 Years | 13 (36.1%) | 11 (26.8%) |
| 45 to 54 Years | 30 (68.2%) | 36 (63.2%) |
| 55 to 64 Years | 10 (33.3%) | 22 (39.3%) |
| 65 to 74 Years | 0 (0.0%) | 0 (0.0%) |
| 75 Years and over | 0 (0.0%) | 10 (41.7%) |
| Total | 99 (35.9%) | 137 (40.5%) |
Income Above Poverty by Sex and Age in Loyall
According to the poverty statistics in Loyall, males aged 15 years and females aged under 5 years are the age groups that are most secure financially, with 100.0% of males and 100.0% of females in these age groups living above the poverty line.
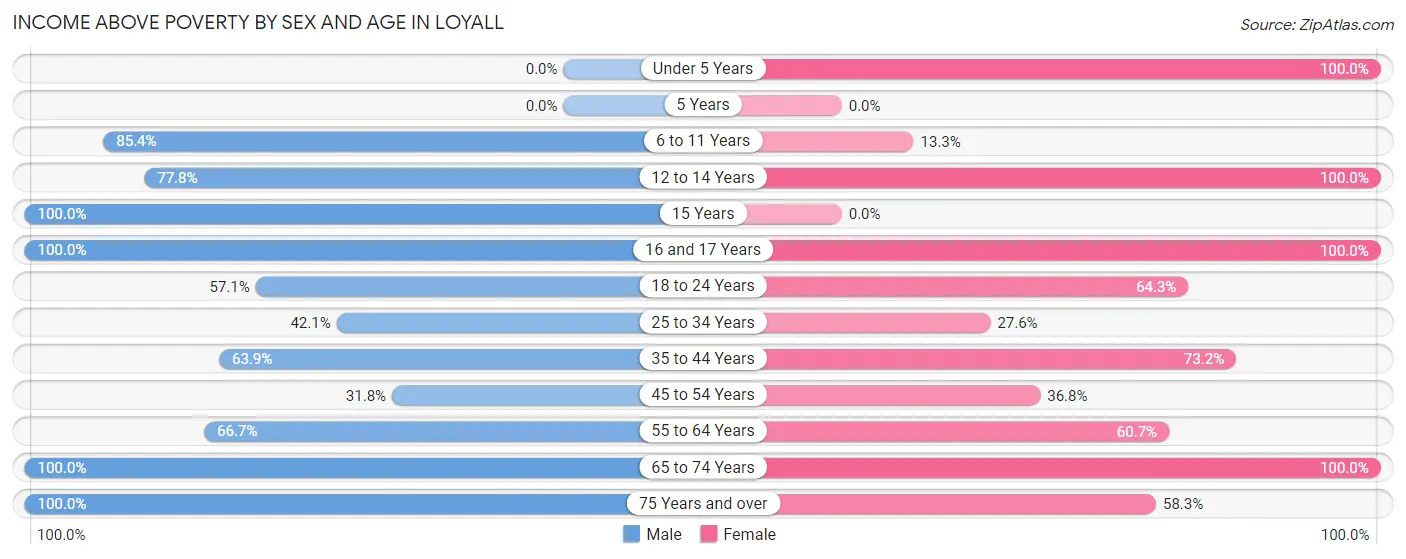
| Age Bracket | Male | Female |
| Under 5 Years | 0 (0.0%) | 8 (100.0%) |
| 5 Years | 0 (0.0%) | 0 (0.0%) |
| 6 to 11 Years | 35 (85.4%) | 4 (13.3%) |
| 12 to 14 Years | 21 (77.8%) | 12 (100.0%) |
| 15 Years | 5 (100.0%) | 0 (0.0%) |
| 16 and 17 Years | 6 (100.0%) | 10 (100.0%) |
| 18 to 24 Years | 8 (57.1%) | 9 (64.3%) |
| 25 to 34 Years | 8 (42.1%) | 8 (27.6%) |
| 35 to 44 Years | 23 (63.9%) | 30 (73.2%) |
| 45 to 54 Years | 14 (31.8%) | 21 (36.8%) |
| 55 to 64 Years | 20 (66.7%) | 34 (60.7%) |
| 65 to 74 Years | 17 (100.0%) | 51 (100.0%) |
| 75 Years and over | 20 (100.0%) | 14 (58.3%) |
| Total | 177 (64.1%) | 201 (59.5%) |
Income Below Poverty Among Married-Couple Families in Loyall
The poverty statistics for married-couple families in Loyall show that 25.6% or 20 of the total 78 families live below the poverty line. Families with 3 or 4 children have the highest poverty rate of 60.0%, comprising of 6 families. On the other hand, families with 1 or 2 children have the lowest poverty rate of 17.9%, which includes 7 families.
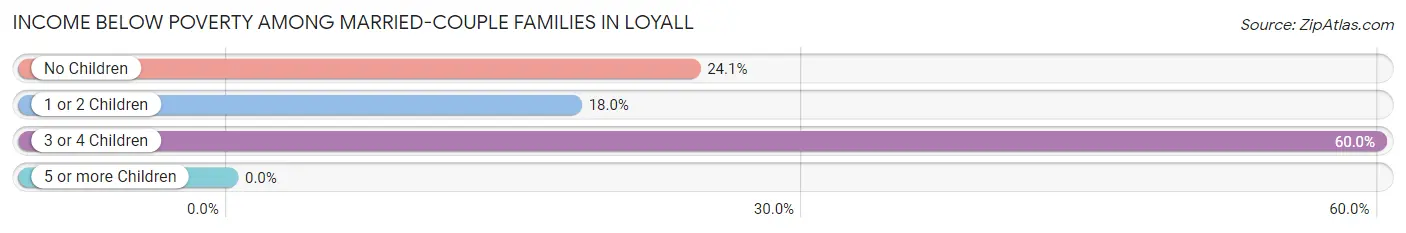
| Children | Above Poverty | Below Poverty |
| No Children | 22 (75.9%) | 7 (24.1%) |
| 1 or 2 Children | 32 (82.1%) | 7 (17.9%) |
| 3 or 4 Children | 4 (40.0%) | 6 (60.0%) |
| 5 or more Children | 0 (0.0%) | 0 (0.0%) |
| Total | 58 (74.4%) | 20 (25.6%) |
Income Below Poverty Among Single-Parent Households in Loyall
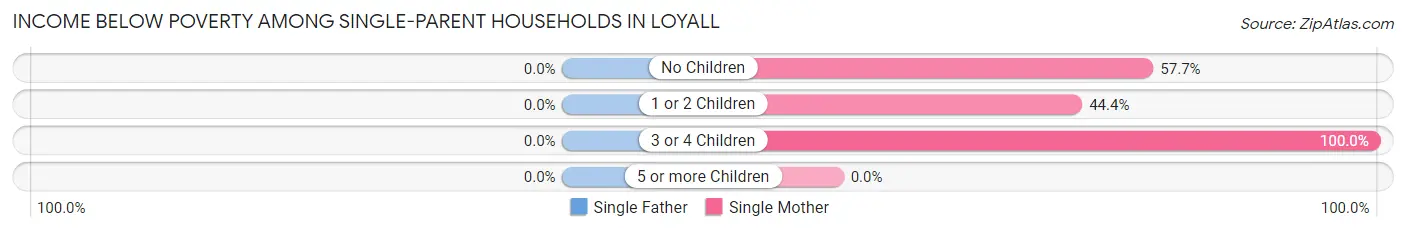
| Children | Single Father | Single Mother |
| No Children | 0 (0.0%) | 15 (57.7%) |
| 1 or 2 Children | 0 (0.0%) | 8 (44.4%) |
| 3 or 4 Children | 0 (0.0%) | 5 (100.0%) |
| 5 or more Children | 0 (0.0%) | 0 (0.0%) |
| Total | 0 (0.0%) | 28 (57.1%) |
Income Below Poverty Among Married-Couple vs Single-Parent Households in Loyall
The poverty data for Loyall shows that 20 of the married-couple family households (25.6%) and 28 of the single-parent households (50.9%) are living below the poverty level. Within the married-couple family households, those with 3 or 4 children have the highest poverty rate, with 6 households (60.0%) falling below the poverty line. Among the single-parent households, those with 3 or 4 children have the highest poverty rate, with 5 household (100.0%) living below poverty.
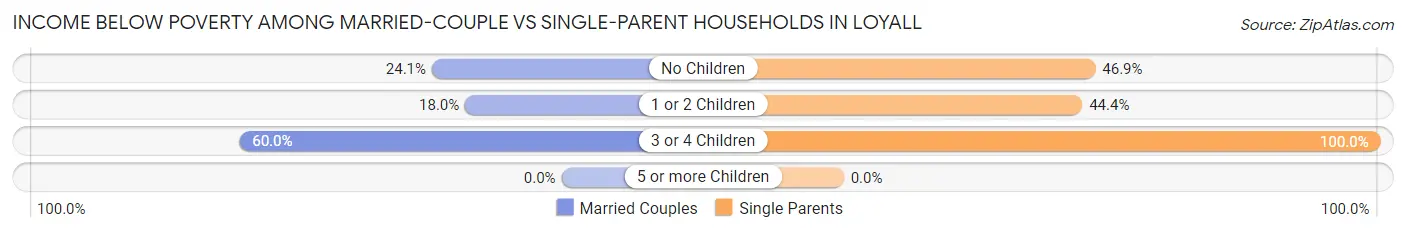
| Children | Married-Couple Families | Single-Parent Households |
| No Children | 7 (24.1%) | 15 (46.9%) |
| 1 or 2 Children | 7 (17.9%) | 8 (44.4%) |
| 3 or 4 Children | 6 (60.0%) | 5 (100.0%) |
| 5 or more Children | 0 (0.0%) | 0 (0.0%) |
| Total | 20 (25.6%) | 28 (50.9%) |
Race in Loyall
The most populous races in Loyall are White / Caucasian (599 | 97.6%), Black / African American (11 | 1.8%), and Hispanic or Latino (9 | 1.5%).
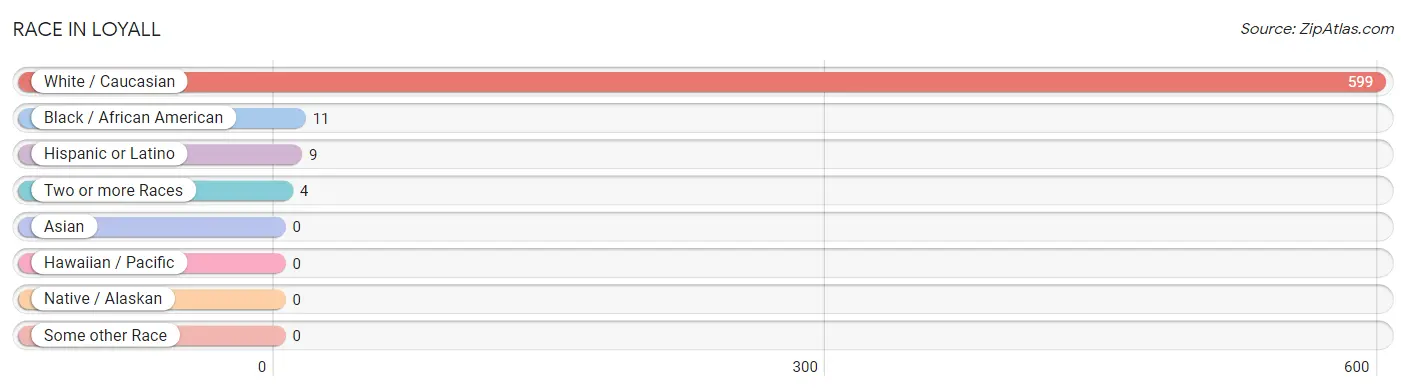
| Race | # Population | % Population |
| Asian | 0 | 0.0% |
| Black / African American | 11 | 1.8% |
| Hawaiian / Pacific | 0 | 0.0% |
| Hispanic or Latino | 9 | 1.5% |
| Native / Alaskan | 0 | 0.0% |
| White / Caucasian | 599 | 97.6% |
| Two or more Races | 4 | 0.6% |
| Some other Race | 0 | 0.0% |
| Total | 614 | 100.0% |
Ancestry in Loyall
The most populous ancestries reported in Loyall are Irish (86 | 14.0%), American (67 | 10.9%), English (47 | 7.6%), German (46 | 7.5%), and Scotch-Irish (16 | 2.6%), together accounting for 42.7% of all Loyall residents.
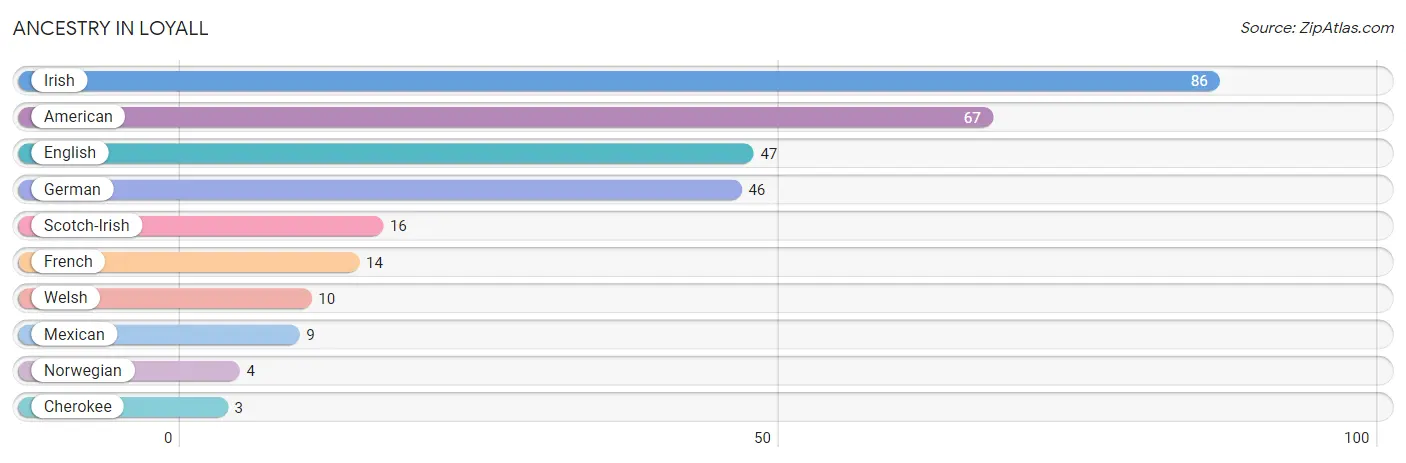
| Ancestry | # Population | % Population |
| American | 67 | 10.9% |
| Cherokee | 3 | 0.5% |
| English | 47 | 7.6% |
| French | 14 | 2.3% |
| German | 46 | 7.5% |
| Irish | 86 | 14.0% |
| Mexican | 9 | 1.5% |
| Norwegian | 4 | 0.6% |
| Scotch-Irish | 16 | 2.6% |
| Welsh | 10 | 1.6% | View All 10 Rows |
Immigrants in Loyall

| Immigration Origin | # Population | % Population | View All 0 Rows |
Sex and Age in Loyall
Sex and Age in Loyall
The most populous age groups in Loyall are 10 to 14 Years (41 | 14.9%) for men and 35 to 39 Years (41 | 12.1%) for women.
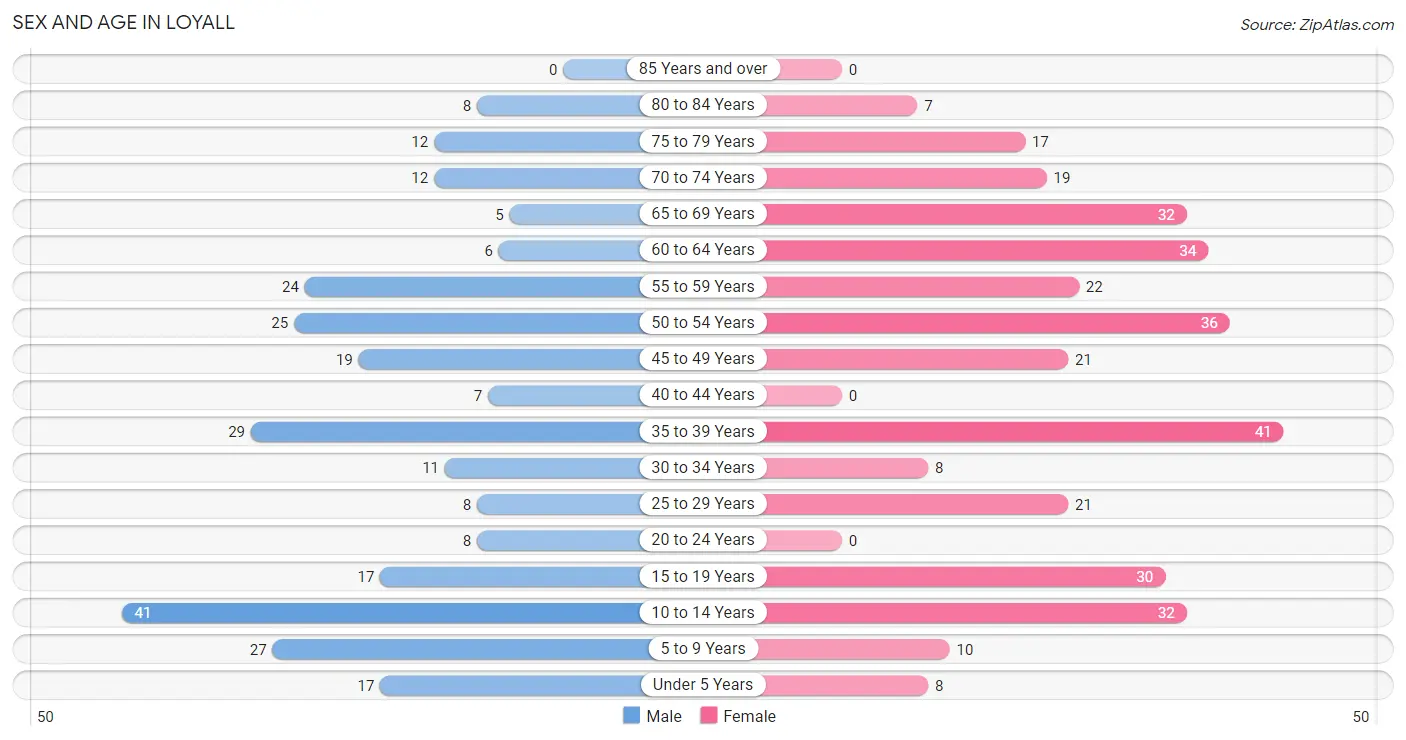
| Age Bracket | Male | Female |
| Under 5 Years | 17 (6.2%) | 8 (2.4%) |
| 5 to 9 Years | 27 (9.8%) | 10 (3.0%) |
| 10 to 14 Years | 41 (14.9%) | 32 (9.5%) |
| 15 to 19 Years | 17 (6.2%) | 30 (8.9%) |
| 20 to 24 Years | 8 (2.9%) | 0 (0.0%) |
| 25 to 29 Years | 8 (2.9%) | 21 (6.2%) |
| 30 to 34 Years | 11 (4.0%) | 8 (2.4%) |
| 35 to 39 Years | 29 (10.5%) | 41 (12.1%) |
| 40 to 44 Years | 7 (2.5%) | 0 (0.0%) |
| 45 to 49 Years | 19 (6.9%) | 21 (6.2%) |
| 50 to 54 Years | 25 (9.1%) | 36 (10.6%) |
| 55 to 59 Years | 24 (8.7%) | 22 (6.5%) |
| 60 to 64 Years | 6 (2.2%) | 34 (10.1%) |
| 65 to 69 Years | 5 (1.8%) | 32 (9.5%) |
| 70 to 74 Years | 12 (4.3%) | 19 (5.6%) |
| 75 to 79 Years | 12 (4.3%) | 17 (5.0%) |
| 80 to 84 Years | 8 (2.9%) | 7 (2.1%) |
| 85 Years and over | 0 (0.0%) | 0 (0.0%) |
| Total | 276 (100.0%) | 338 (100.0%) |
Families and Households in Loyall
Median Family Size in Loyall
The median family size in Loyall is 3.38 persons per family, with married-couple families (78 | 58.7%) accounting for the largest median family size of 3.77 persons per family. On the other hand, single male/father families (6 | 4.5%) represent the smallest median family size with 2.17 persons per family.
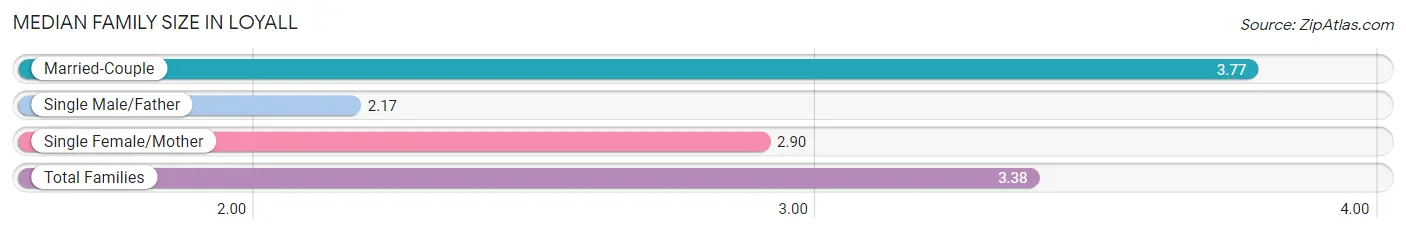
| Family Type | # Families | Family Size |
| Married-Couple | 78 (58.7%) | 3.77 |
| Single Male/Father | 6 (4.5%) | 2.17 |
| Single Female/Mother | 49 (36.8%) | 2.90 |
| Total Families | 133 (100.0%) | 3.38 |
Median Household Size in Loyall
The median household size in Loyall is 2.52 persons per household, with married-couple households (78 | 32.0%) accounting for the largest median household size of 3.77 persons per household. non-family households (111 | 45.5%) represent the smallest median household size with 1.42 persons per household.
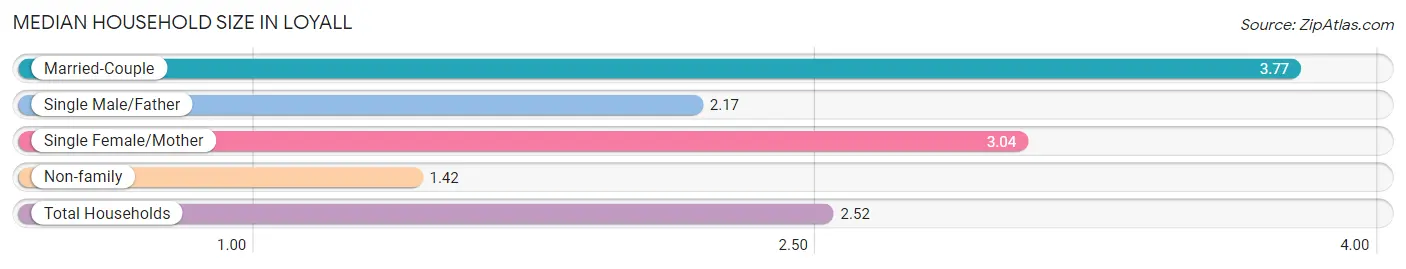
| Household Type | # Households | Household Size |
| Married-Couple | 78 (32.0%) | 3.77 |
| Single Male/Father | 6 (2.5%) | 2.17 |
| Single Female/Mother | 49 (20.1%) | 3.04 |
| Non-family | 111 (45.5%) | 1.42 |
| Total Households | 244 (100.0%) | 2.52 |
Household Size by Marriage Status in Loyall
Out of a total of 244 households in Loyall, 133 (54.5%) are family households, while 111 (45.5%) are nonfamily households. The most numerous type of family households are 2-person households, comprising 59, and the most common type of nonfamily households are 1-person households, comprising 85.
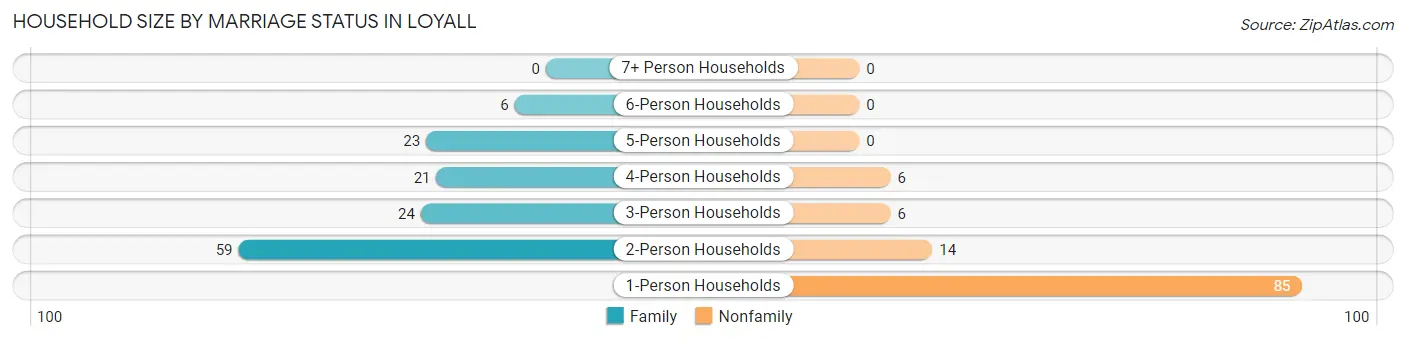
| Household Size | Family Households | Nonfamily Households |
| 1-Person Households | - | 85 (34.8%) |
| 2-Person Households | 59 (24.2%) | 14 (5.7%) |
| 3-Person Households | 24 (9.8%) | 6 (2.5%) |
| 4-Person Households | 21 (8.6%) | 6 (2.5%) |
| 5-Person Households | 23 (9.4%) | 0 (0.0%) |
| 6-Person Households | 6 (2.5%) | 0 (0.0%) |
| 7+ Person Households | 0 (0.0%) | 0 (0.0%) |
| Total | 133 (54.5%) | 111 (45.5%) |
Female Fertility in Loyall
Fertility by Age in Loyall
| Age Bracket | Women with Births | Births / 1,000 Women |
| 15 to 19 years | 0 (0.0%) | 0.0 |
| 20 to 34 years | 0 (0.0%) | 0.0 |
| 35 to 50 years | 0 (0.0%) | 0.0 |
| Total | 0 (0.0%) | 0.0 |
Fertility by Age by Marriage Status in Loyall
| Age Bracket | Married | Unmarried |
| 15 to 19 years | 0 (0.0%) | 0 (0.0%) |
| 20 to 34 years | 0 (0.0%) | 0 (0.0%) |
| 35 to 50 years | 0 (0.0%) | 0 (0.0%) |
| Total | 0 (0.0%) | 0 (0.0%) |
Fertility by Education in Loyall
| Educational Attainment | Women with Births | Births / 1,000 Women |
| Less than High School | 0 (0.0%) | 0.0 |
| High School Diploma | 0 (0.0%) | 0.0 |
| College or Associate's Degree | 0 (0.0%) | 0.0 |
| Bachelor's Degree | 0 (0.0%) | 0.0 |
| Graduate Degree | 0 (0.0%) | 0.0 |
| Total | 0 (0.0%) | 0.0 |
Fertility by Education by Marriage Status in Loyall
| Educational Attainment | Married | Unmarried |
| Less than High School | 0 (0.0%) | 0 (0.0%) |
| High School Diploma | 0 (0.0%) | 0 (0.0%) |
| College or Associate's Degree | 0 (0.0%) | 0 (0.0%) |
| Bachelor's Degree | 0 (0.0%) | 0 (0.0%) |
| Graduate Degree | 0 (0.0%) | 0 (0.0%) |
| Total | 0 (0.0%) | 0 (0.0%) |
Employment Characteristics in Loyall
Employment by Class of Employer in Loyall
Among the 170 employed individuals in Loyall, private company employees (91 | 53.5%), not-for-profit organizations (45 | 26.5%), and local government employees (12 | 7.1%) make up the most common classes of employment.
| Employer Class | # Employees | % Employees |
| Private Company Employees | 91 | 53.5% |
| Self-Employed (Incorporated) | 0 | 0.0% |
| Self-Employed (Not Incorporated) | 11 | 6.5% |
| Not-for-profit Organizations | 45 | 26.5% |
| Local Government Employees | 12 | 7.1% |
| State Government Employees | 6 | 3.5% |
| Federal Government Employees | 5 | 2.9% |
| Unpaid Family Workers | 0 | 0.0% |
| Total | 170 | 100.0% |
Employment Status by Age in Loyall
According to the labor force statistics for Loyall, out of the total population over 16 years of age (468), 41.0% or 192 individuals are in the labor force, with 8.3% or 16 of them unemployed. The age group with the highest labor force participation rate is 20 to 24 years, with 100.0% or 8 individuals in the labor force. Within the labor force, the 45 to 54 years age range has the highest percentage of unemployed individuals, with 51.6% or 16 of them being unemployed.
| Age Bracket | In Labor Force | Unemployed |
| 16 to 19 Years | 6 (16.7%) | 0 (0.0%) |
| 20 to 24 Years | 8 (100.0%) | 0 (0.0%) |
| 25 to 29 Years | 8 (27.6%) | 0 (0.0%) |
| 30 to 34 Years | 19 (100.0%) | 0 (0.0%) |
| 35 to 44 Years | 45 (58.4%) | 0 (0.0%) |
| 45 to 54 Years | 31 (30.7%) | 16 (51.6%) |
| 55 to 59 Years | 27 (58.7%) | 0 (0.0%) |
| 60 to 64 Years | 16 (40.0%) | 0 (0.0%) |
| 65 to 74 Years | 26 (38.2%) | 0 (0.0%) |
| 75 Years and over | 6 (13.6%) | 0 (0.0%) |
| Total | 192 (41.0%) | 16 (8.3%) |
Employment Status by Educational Attainment in Loyall
According to labor force statistics for Loyall, 46.8% of individuals (146) out of the total population between 25 and 64 years of age (312) are in the labor force, with 11.0% or 16 of them being unemployed. The group with the highest labor force participation rate are those with the educational attainment of bachelor's degree or higher, with 88.9% or 24 individuals in the labor force. Within the labor force, individuals with less than high school education have the highest percentage of unemployment, with 31.8% or 7 of them being unemployed.
| Educational Attainment | In Labor Force | Unemployed |
| Less than High School | 22 (21.4%) | 33 (31.8%) |
| High School Diploma | 51 (50.5%) | 0 (0.0%) |
| College / Associate Degree | 49 (60.5%) | 15 (18.4%) |
| Bachelor's Degree or higher | 24 (88.9%) | 0 (0.0%) |
| Total | 146 (46.8%) | 34 (11.0%) |
Employment Occupations by Sex in Loyall
Management, Business, Science and Arts Occupations
The most common Management, Business, Science and Arts occupations in Loyall are Community & Social Service (25 | 14.2%), Management (20 | 11.4%), Education Instruction & Library (18 | 10.2%), Education, Arts & Media (7 | 4.0%), and Business & Financial (2 | 1.1%).
Management, Business, Science and Arts Occupations by Sex
Within the Management, Business, Science and Arts occupations in Loyall, the most male-oriented occupations are Education Instruction & Library (33.3%), Community & Social Service (32.0%), and Management (30.0%), while the most female-oriented occupations are Business & Financial (100.0%), Education, Arts & Media (71.4%), and Management (70.0%).
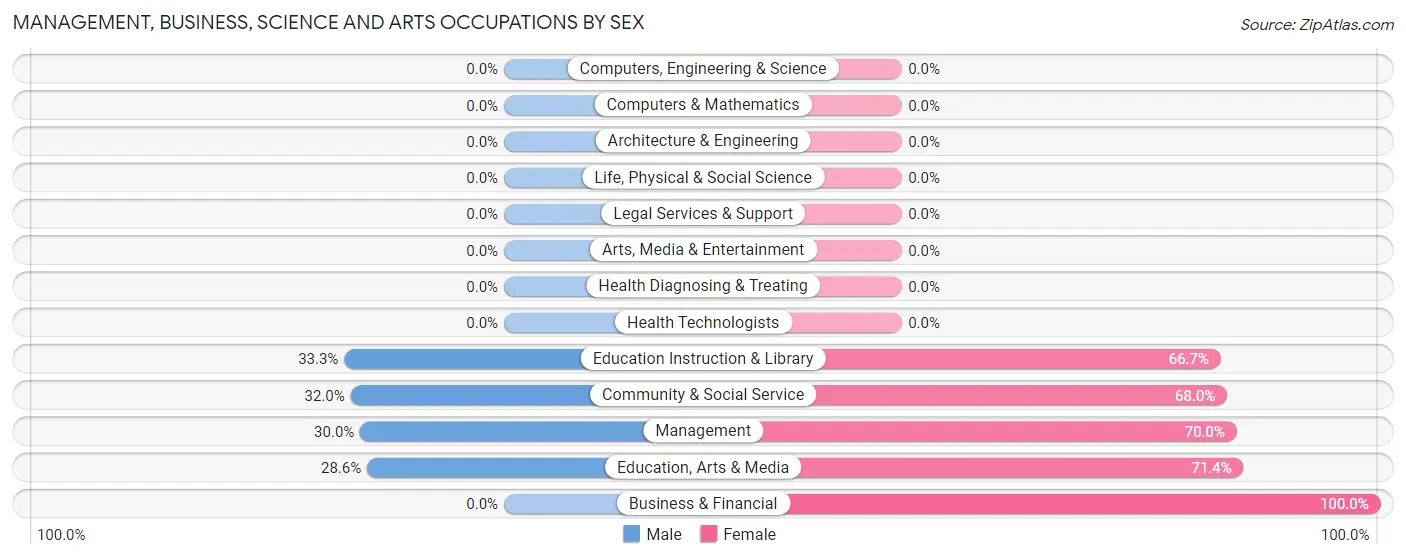
| Occupation | Male | Female |
| Management | 6 (30.0%) | 14 (70.0%) |
| Business & Financial | 0 (0.0%) | 2 (100.0%) |
| Computers, Engineering & Science | 0 (0.0%) | 0 (0.0%) |
| Computers & Mathematics | 0 (0.0%) | 0 (0.0%) |
| Architecture & Engineering | 0 (0.0%) | 0 (0.0%) |
| Life, Physical & Social Science | 0 (0.0%) | 0 (0.0%) |
| Community & Social Service | 8 (32.0%) | 17 (68.0%) |
| Education, Arts & Media | 2 (28.6%) | 5 (71.4%) |
| Legal Services & Support | 0 (0.0%) | 0 (0.0%) |
| Education Instruction & Library | 6 (33.3%) | 12 (66.7%) |
| Arts, Media & Entertainment | 0 (0.0%) | 0 (0.0%) |
| Health Diagnosing & Treating | 0 (0.0%) | 0 (0.0%) |
| Health Technologists | 0 (0.0%) | 0 (0.0%) |
| Total (Category) | 14 (29.8%) | 33 (70.2%) |
| Total (Overall) | 77 (43.8%) | 99 (56.2%) |
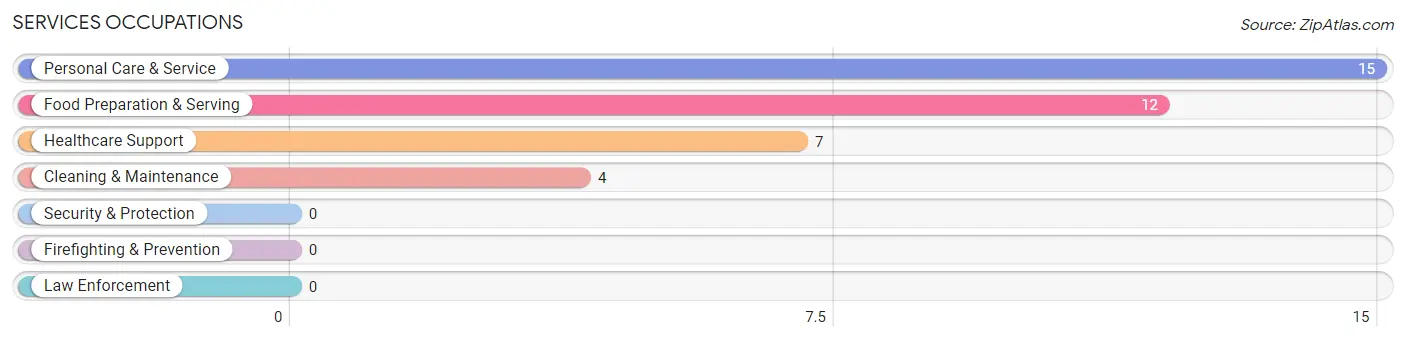
Services Occupations
The most common Services occupations in Loyall are Personal Care & Service (15 | 8.5%), Food Preparation & Serving (12 | 6.8%), Healthcare Support (7 | 4.0%), and Cleaning & Maintenance (4 | 2.3%).
Services Occupations by Sex
Within the Services occupations in Loyall, the most male-oriented occupations are Personal Care & Service (60.0%), Food Preparation & Serving (50.0%), and Cleaning & Maintenance (25.0%), while the most female-oriented occupations are Healthcare Support (100.0%), Cleaning & Maintenance (75.0%), and Food Preparation & Serving (50.0%).
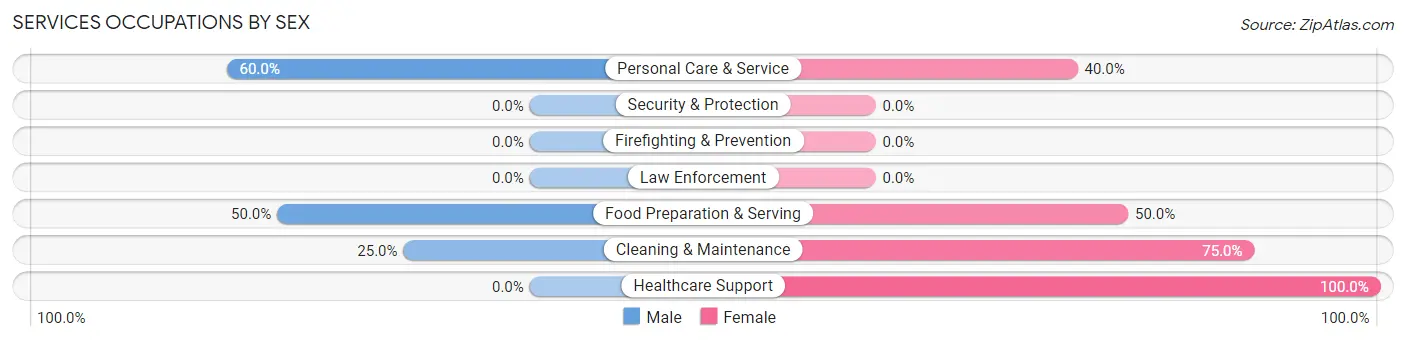
| Occupation | Male | Female |
| Healthcare Support | 0 (0.0%) | 7 (100.0%) |
| Security & Protection | 0 (0.0%) | 0 (0.0%) |
| Firefighting & Prevention | 0 (0.0%) | 0 (0.0%) |
| Law Enforcement | 0 (0.0%) | 0 (0.0%) |
| Food Preparation & Serving | 6 (50.0%) | 6 (50.0%) |
| Cleaning & Maintenance | 1 (25.0%) | 3 (75.0%) |
| Personal Care & Service | 9 (60.0%) | 6 (40.0%) |
| Total (Category) | 16 (42.1%) | 22 (57.9%) |
| Total (Overall) | 77 (43.8%) | 99 (56.2%) |
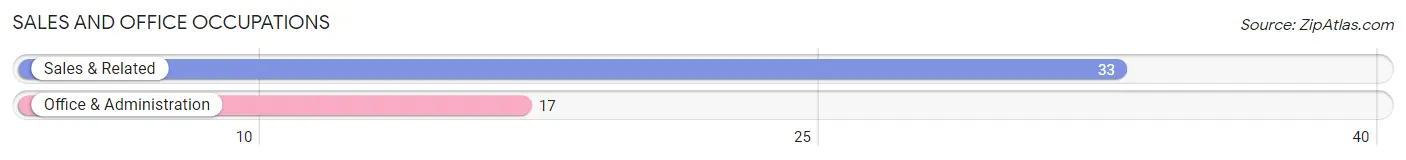
Sales and Office Occupations
The most common Sales and Office occupations in Loyall are Sales & Related (33 | 18.8%), and Office & Administration (17 | 9.7%).
Sales and Office Occupations by Sex
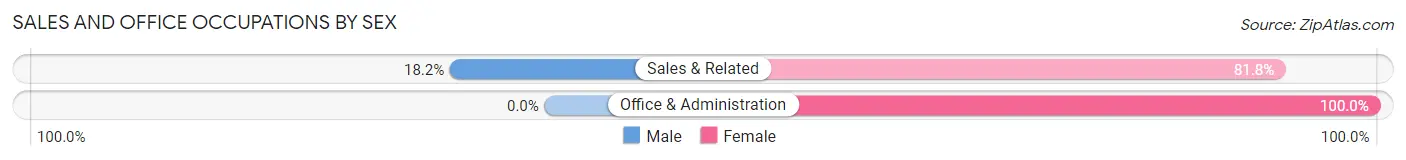
| Occupation | Male | Female |
| Sales & Related | 6 (18.2%) | 27 (81.8%) |
| Office & Administration | 0 (0.0%) | 17 (100.0%) |
| Total (Category) | 6 (12.0%) | 44 (88.0%) |
| Total (Overall) | 77 (43.8%) | 99 (56.2%) |
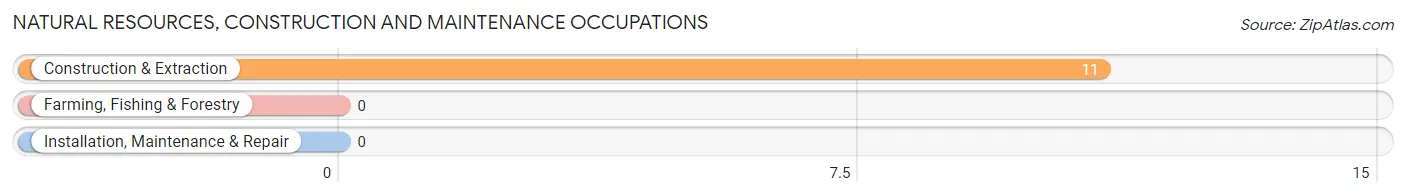
Natural Resources, Construction and Maintenance Occupations
The most common Natural Resources, Construction and Maintenance occupations in Loyall are , and Construction & Extraction (11 | 6.2%).
Natural Resources, Construction and Maintenance Occupations by Sex
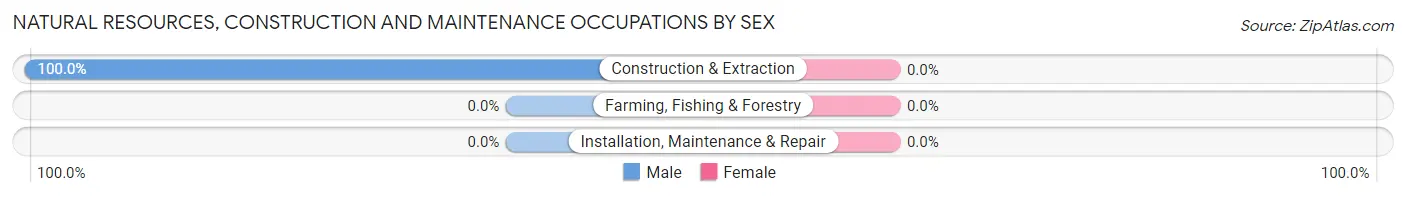
| Occupation | Male | Female |
| Farming, Fishing & Forestry | 0 (0.0%) | 0 (0.0%) |
| Construction & Extraction | 11 (100.0%) | 0 (0.0%) |
| Installation, Maintenance & Repair | 0 (0.0%) | 0 (0.0%) |
| Total (Category) | 11 (100.0%) | 0 (0.0%) |
| Total (Overall) | 77 (43.8%) | 99 (56.2%) |
Production, Transportation and Moving Occupations
The most common Production, Transportation and Moving occupations in Loyall are Transportation (16 | 9.1%), and Production (14 | 8.0%).
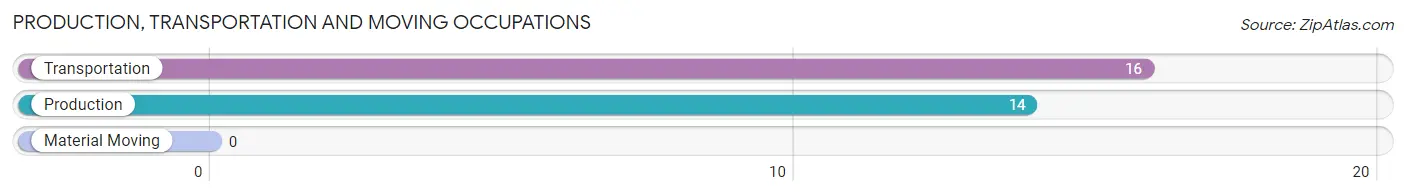
Production, Transportation and Moving Occupations by Sex
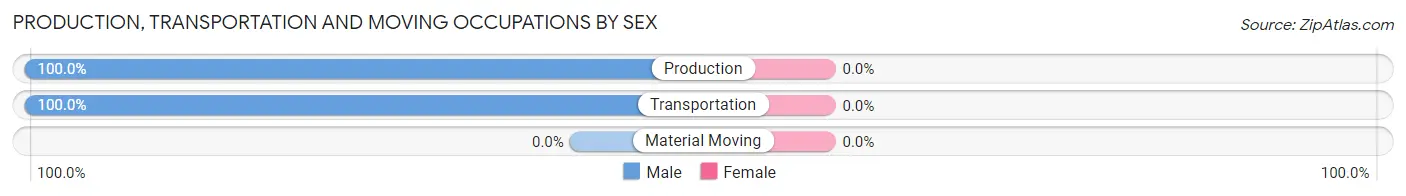
| Occupation | Male | Female |
| Production | 14 (100.0%) | 0 (0.0%) |
| Transportation | 16 (100.0%) | 0 (0.0%) |
| Material Moving | 0 (0.0%) | 0 (0.0%) |
| Total (Category) | 30 (100.0%) | 0 (0.0%) |
| Total (Overall) | 77 (43.8%) | 99 (56.2%) |
Employment Industries by Sex in Loyall
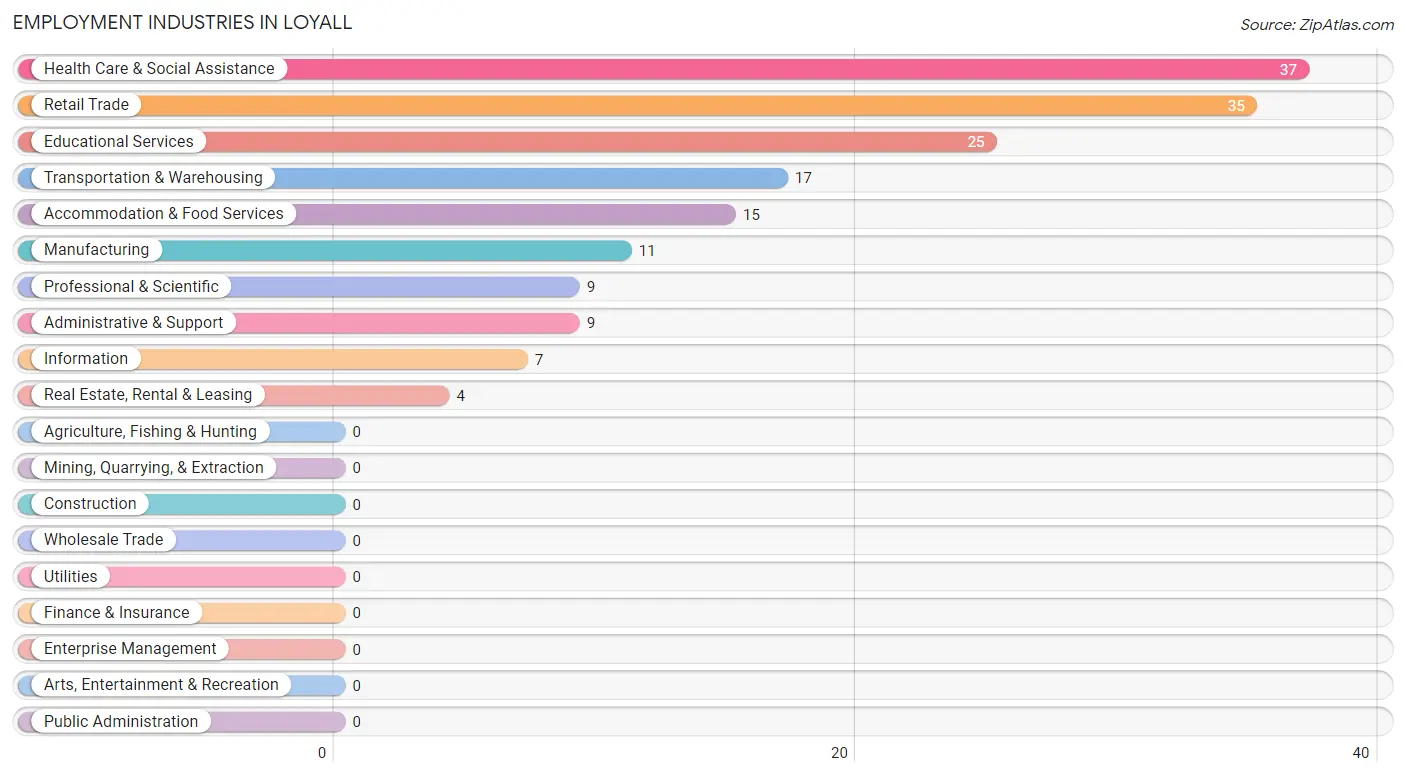
Employment Industries in Loyall
The major employment industries in Loyall include Health Care & Social Assistance (37 | 21.0%), Retail Trade (35 | 19.9%), Educational Services (25 | 14.2%), Transportation & Warehousing (17 | 9.7%), and Accommodation & Food Services (15 | 8.5%).
Employment Industries by Sex in Loyall
The Loyall industries that see more men than women are Manufacturing (100.0%), Real Estate, Rental & Leasing (100.0%), and Professional & Scientific (100.0%), whereas the industries that tend to have a higher number of women are Information (100.0%), Health Care & Social Assistance (100.0%), and Educational Services (68.0%).
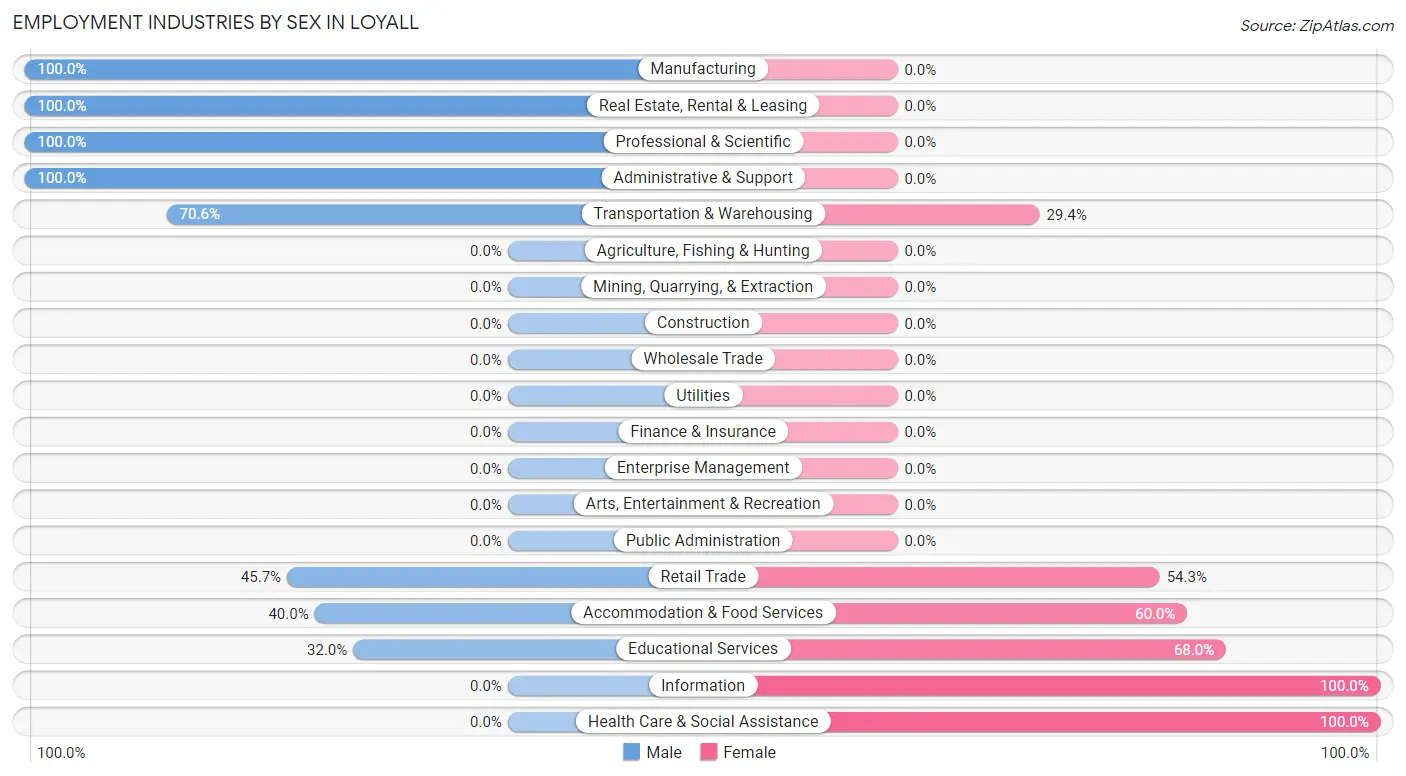
| Industry | Male | Female |
| Agriculture, Fishing & Hunting | 0 (0.0%) | 0 (0.0%) |
| Mining, Quarrying, & Extraction | 0 (0.0%) | 0 (0.0%) |
| Construction | 0 (0.0%) | 0 (0.0%) |
| Manufacturing | 11 (100.0%) | 0 (0.0%) |
| Wholesale Trade | 0 (0.0%) | 0 (0.0%) |
| Retail Trade | 16 (45.7%) | 19 (54.3%) |
| Transportation & Warehousing | 12 (70.6%) | 5 (29.4%) |
| Utilities | 0 (0.0%) | 0 (0.0%) |
| Information | 0 (0.0%) | 7 (100.0%) |
| Finance & Insurance | 0 (0.0%) | 0 (0.0%) |
| Real Estate, Rental & Leasing | 4 (100.0%) | 0 (0.0%) |
| Professional & Scientific | 9 (100.0%) | 0 (0.0%) |
| Enterprise Management | 0 (0.0%) | 0 (0.0%) |
| Administrative & Support | 9 (100.0%) | 0 (0.0%) |
| Educational Services | 8 (32.0%) | 17 (68.0%) |
| Health Care & Social Assistance | 0 (0.0%) | 37 (100.0%) |
| Arts, Entertainment & Recreation | 0 (0.0%) | 0 (0.0%) |
| Accommodation & Food Services | 6 (40.0%) | 9 (60.0%) |
| Public Administration | 0 (0.0%) | 0 (0.0%) |
| Total | 77 (43.8%) | 99 (56.2%) |
Education in Loyall
School Enrollment in Loyall
The most common levels of schooling among the 151 students in Loyall are elementary school (47 | 31.1%), middle school (44 | 29.1%), and high school (42 | 27.8%).
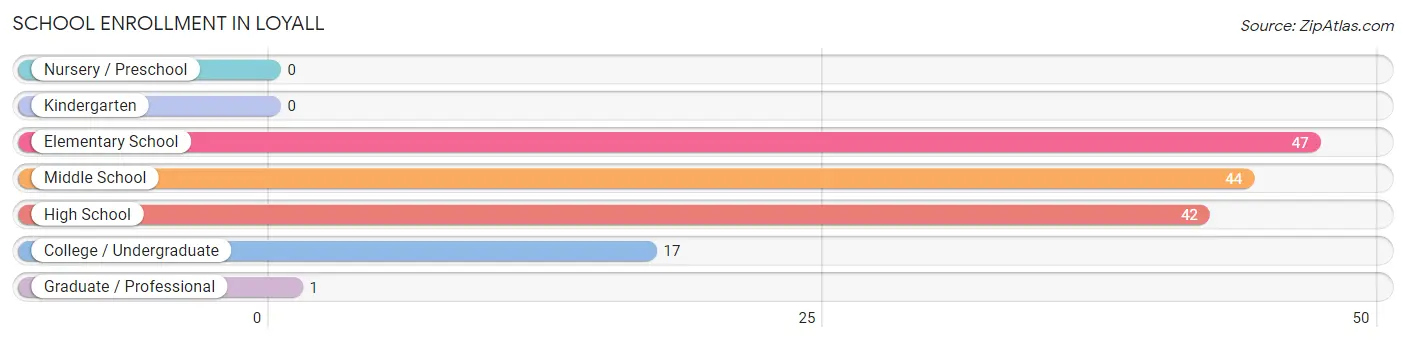
| School Level | # Students | % Students |
| Nursery / Preschool | 0 | 0.0% |
| Kindergarten | 0 | 0.0% |
| Elementary School | 47 | 31.1% |
| Middle School | 44 | 29.1% |
| High School | 42 | 27.8% |
| College / Undergraduate | 17 | 11.3% |
| Graduate / Professional | 1 | 0.7% |
| Total | 151 | 100.0% |
School Enrollment by Age by Funding Source in Loyall
Out of a total of 151 students who are enrolled in schools in Loyall, 20 (13.2%) attend a private institution, while the remaining 131 (86.8%) are enrolled in public schools. The age group of 35 years and over has the highest likelihood of being enrolled in private schools, with 2 (100.0% in the age bracket) enrolled. Conversely, the age group of 5 to 9 year old has the lowest likelihood of being enrolled in a private school, with 31 (100.0% in the age bracket) attending a public institution.
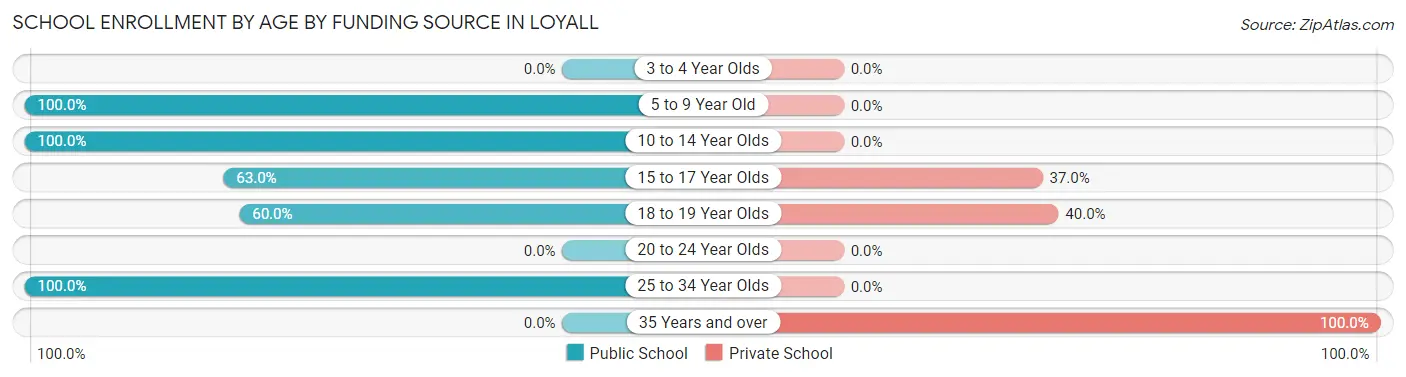
| Age Bracket | Public School | Private School |
| 3 to 4 Year Olds | 0 (0.0%) | 0 (0.0%) |
| 5 to 9 Year Old | 31 (100.0%) | 0 (0.0%) |
| 10 to 14 Year Olds | 63 (100.0%) | 0 (0.0%) |
| 15 to 17 Year Olds | 17 (63.0%) | 10 (37.0%) |
| 18 to 19 Year Olds | 12 (60.0%) | 8 (40.0%) |
| 20 to 24 Year Olds | 0 (0.0%) | 0 (0.0%) |
| 25 to 34 Year Olds | 8 (100.0%) | 0 (0.0%) |
| 35 Years and over | 0 (0.0%) | 2 (100.0%) |
| Total | 131 (86.8%) | 20 (13.2%) |
Educational Attainment by Field of Study in Loyall
Education (24 | 70.6%), psychology (6 | 17.6%), physical & health sciences (3 | 8.8%), and science & technology (1 | 2.9%) are the most common fields of study among 34 individuals in Loyall who have obtained a bachelor's degree or higher.
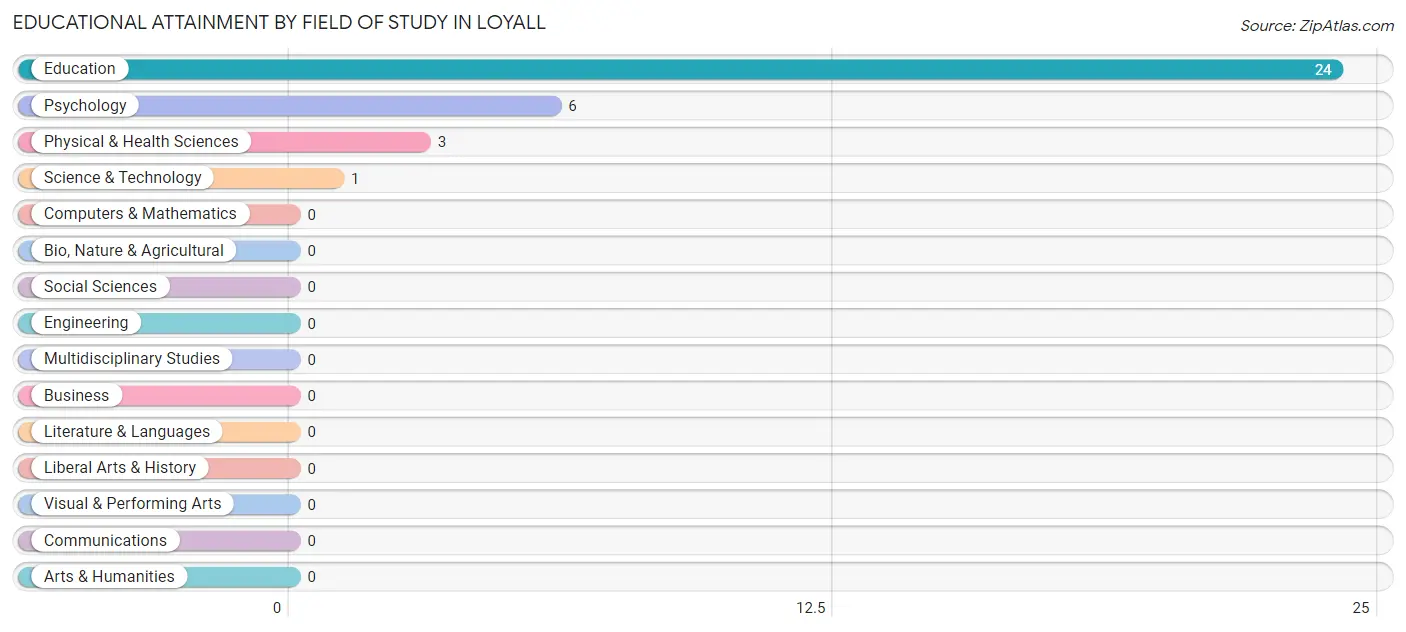
| Field of Study | # Graduates | % Graduates |
| Computers & Mathematics | 0 | 0.0% |
| Bio, Nature & Agricultural | 0 | 0.0% |
| Physical & Health Sciences | 3 | 8.8% |
| Psychology | 6 | 17.6% |
| Social Sciences | 0 | 0.0% |
| Engineering | 0 | 0.0% |
| Multidisciplinary Studies | 0 | 0.0% |
| Science & Technology | 1 | 2.9% |
| Business | 0 | 0.0% |
| Education | 24 | 70.6% |
| Literature & Languages | 0 | 0.0% |
| Liberal Arts & History | 0 | 0.0% |
| Visual & Performing Arts | 0 | 0.0% |
| Communications | 0 | 0.0% |
| Arts & Humanities | 0 | 0.0% |
| Total | 34 | 100.0% |
Transportation & Commute in Loyall
Vehicle Availability by Sex in Loyall
The most prevalent vehicle ownership categories in Loyall are males with 4 vehicles (23, accounting for 29.9%) and females with 4 vehicles (8, making up 24.7%).
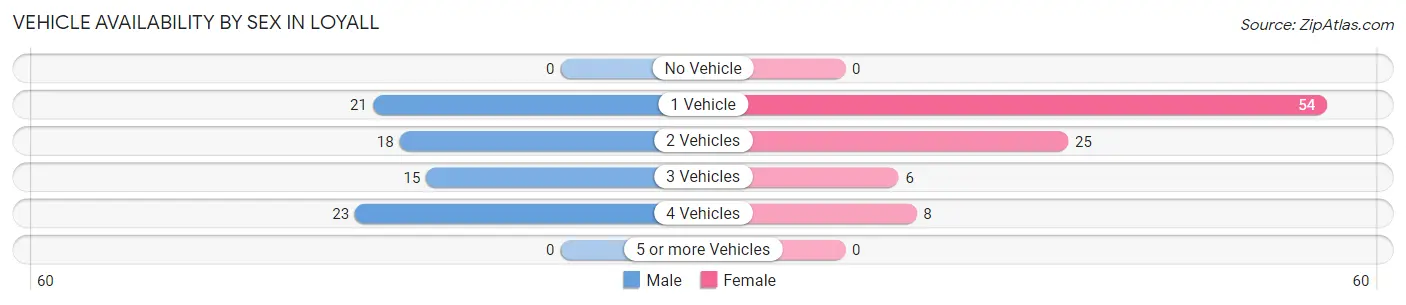
| Vehicles Available | Male | Female |
| No Vehicle | 0 (0.0%) | 0 (0.0%) |
| 1 Vehicle | 21 (27.3%) | 54 (58.1%) |
| 2 Vehicles | 18 (23.4%) | 25 (26.9%) |
| 3 Vehicles | 15 (19.5%) | 6 (6.5%) |
| 4 Vehicles | 23 (29.9%) | 8 (8.6%) |
| 5 or more Vehicles | 0 (0.0%) | 0 (0.0%) |
| Total | 77 (100.0%) | 93 (100.0%) |
Commute Time in Loyall
The most frequently occuring commute durations in Loyall are 10 to 14 minutes (58 commuters, 35.4%), 5 to 9 minutes (45 commuters, 27.4%), and 15 to 19 minutes (44 commuters, 26.8%).
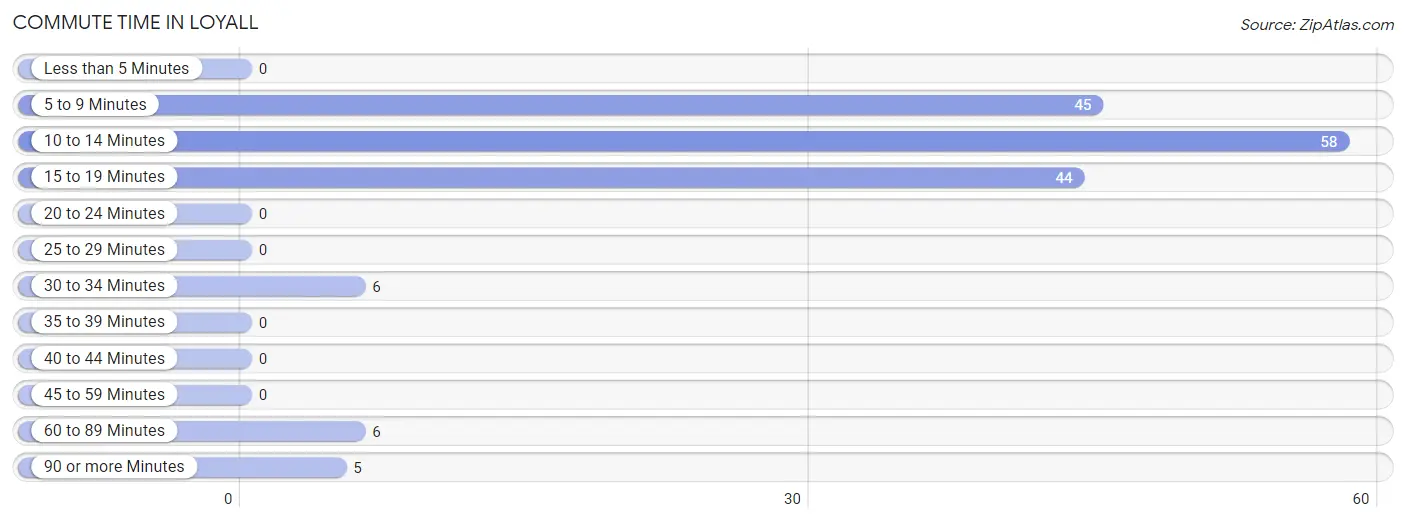
| Commute Time | # Commuters | % Commuters |
| Less than 5 Minutes | 0 | 0.0% |
| 5 to 9 Minutes | 45 | 27.4% |
| 10 to 14 Minutes | 58 | 35.4% |
| 15 to 19 Minutes | 44 | 26.8% |
| 20 to 24 Minutes | 0 | 0.0% |
| 25 to 29 Minutes | 0 | 0.0% |
| 30 to 34 Minutes | 6 | 3.7% |
| 35 to 39 Minutes | 0 | 0.0% |
| 40 to 44 Minutes | 0 | 0.0% |
| 45 to 59 Minutes | 0 | 0.0% |
| 60 to 89 Minutes | 6 | 3.7% |
| 90 or more Minutes | 5 | 3.0% |
Commute Time by Sex in Loyall
The most common commute times in Loyall are 15 to 19 minutes (22 commuters, 30.1%) for males and 10 to 14 minutes (37 commuters, 40.7%) for females.
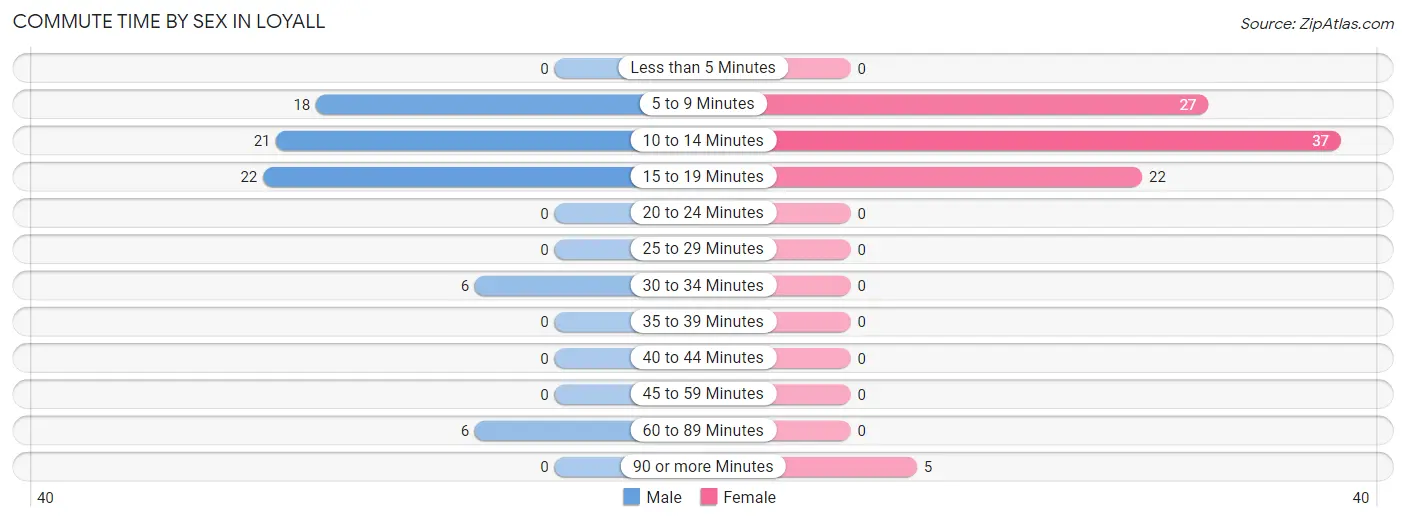
| Commute Time | Male | Female |
| Less than 5 Minutes | 0 (0.0%) | 0 (0.0%) |
| 5 to 9 Minutes | 18 (24.7%) | 27 (29.7%) |
| 10 to 14 Minutes | 21 (28.8%) | 37 (40.7%) |
| 15 to 19 Minutes | 22 (30.1%) | 22 (24.2%) |
| 20 to 24 Minutes | 0 (0.0%) | 0 (0.0%) |
| 25 to 29 Minutes | 0 (0.0%) | 0 (0.0%) |
| 30 to 34 Minutes | 6 (8.2%) | 0 (0.0%) |
| 35 to 39 Minutes | 0 (0.0%) | 0 (0.0%) |
| 40 to 44 Minutes | 0 (0.0%) | 0 (0.0%) |
| 45 to 59 Minutes | 0 (0.0%) | 0 (0.0%) |
| 60 to 89 Minutes | 6 (8.2%) | 0 (0.0%) |
| 90 or more Minutes | 0 (0.0%) | 5 (5.5%) |
Time of Departure to Work by Sex in Loyall
The most frequent times of departure to work in Loyall are 12:00 PM to 3:59 PM (21, 28.8%) for males and 8:30 AM to 8:59 AM (21, 23.1%) for females.
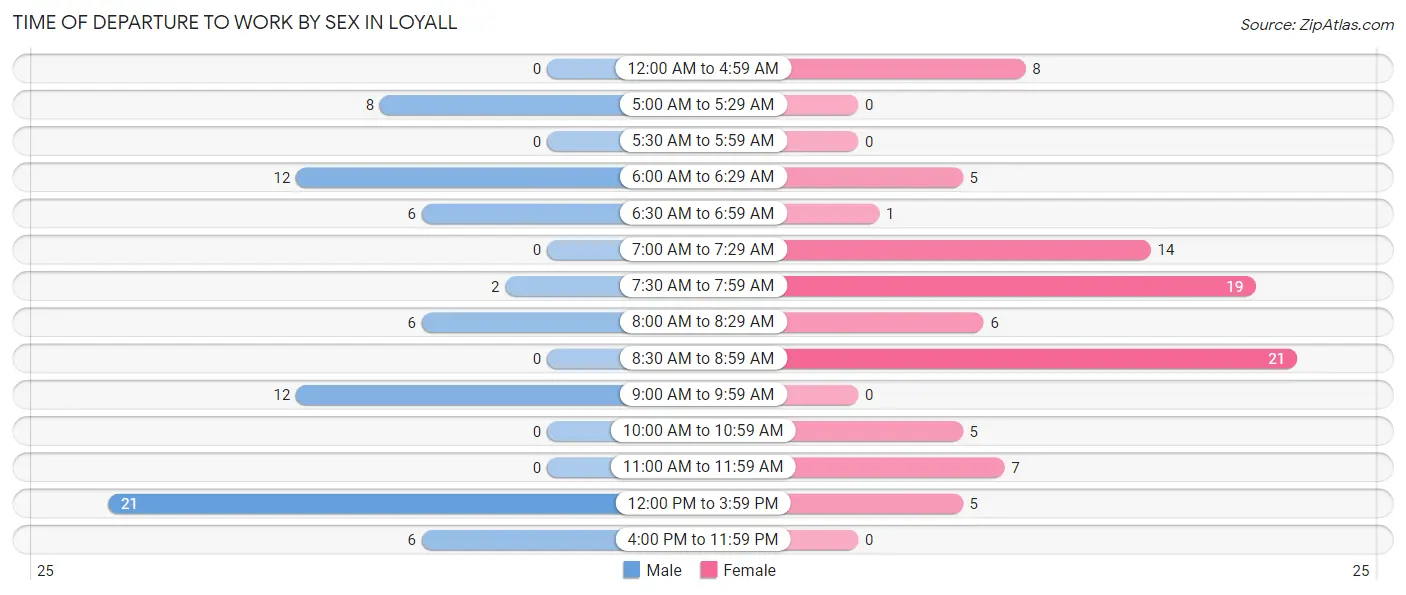
| Time of Departure | Male | Female |
| 12:00 AM to 4:59 AM | 0 (0.0%) | 8 (8.8%) |
| 5:00 AM to 5:29 AM | 8 (11.0%) | 0 (0.0%) |
| 5:30 AM to 5:59 AM | 0 (0.0%) | 0 (0.0%) |
| 6:00 AM to 6:29 AM | 12 (16.4%) | 5 (5.5%) |
| 6:30 AM to 6:59 AM | 6 (8.2%) | 1 (1.1%) |
| 7:00 AM to 7:29 AM | 0 (0.0%) | 14 (15.4%) |
| 7:30 AM to 7:59 AM | 2 (2.7%) | 19 (20.9%) |
| 8:00 AM to 8:29 AM | 6 (8.2%) | 6 (6.6%) |
| 8:30 AM to 8:59 AM | 0 (0.0%) | 21 (23.1%) |
| 9:00 AM to 9:59 AM | 12 (16.4%) | 0 (0.0%) |
| 10:00 AM to 10:59 AM | 0 (0.0%) | 5 (5.5%) |
| 11:00 AM to 11:59 AM | 0 (0.0%) | 7 (7.7%) |
| 12:00 PM to 3:59 PM | 21 (28.8%) | 5 (5.5%) |
| 4:00 PM to 11:59 PM | 6 (8.2%) | 0 (0.0%) |
| Total | 73 (100.0%) | 91 (100.0%) |
Housing Occupancy in Loyall
Occupancy by Ownership in Loyall
Of the total 244 dwellings in Loyall, owner-occupied units account for 119 (48.8%), while renter-occupied units make up 125 (51.2%).
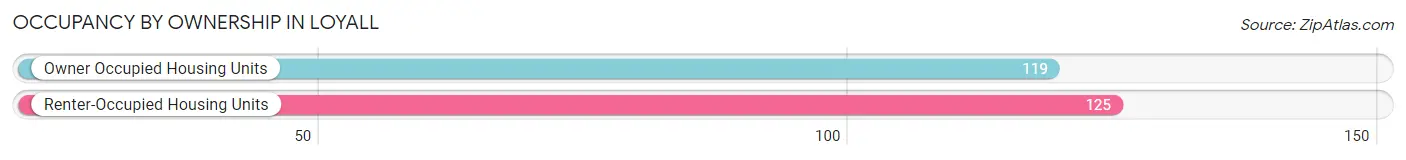
| Occupancy | # Housing Units | % Housing Units |
| Owner Occupied Housing Units | 119 | 48.8% |
| Renter-Occupied Housing Units | 125 | 51.2% |
| Total Occupied Housing Units | 244 | 100.0% |
Occupancy by Household Size in Loyall
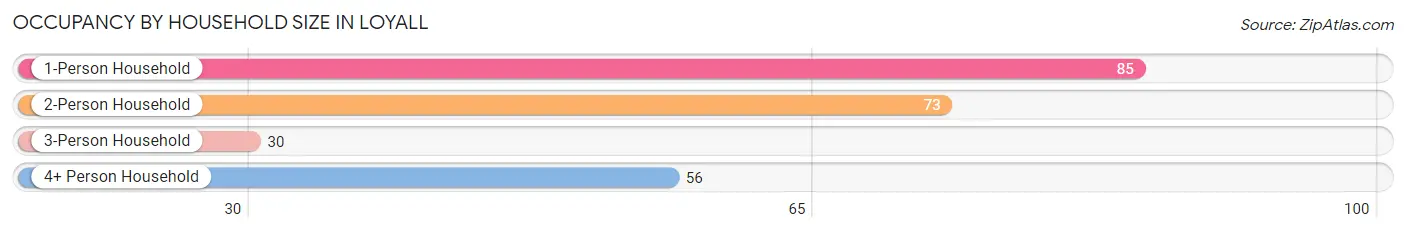
| Household Size | # Housing Units | % Housing Units |
| 1-Person Household | 85 | 34.8% |
| 2-Person Household | 73 | 29.9% |
| 3-Person Household | 30 | 12.3% |
| 4+ Person Household | 56 | 23.0% |
| Total Housing Units | 244 | 100.0% |
Occupancy by Ownership by Household Size in Loyall
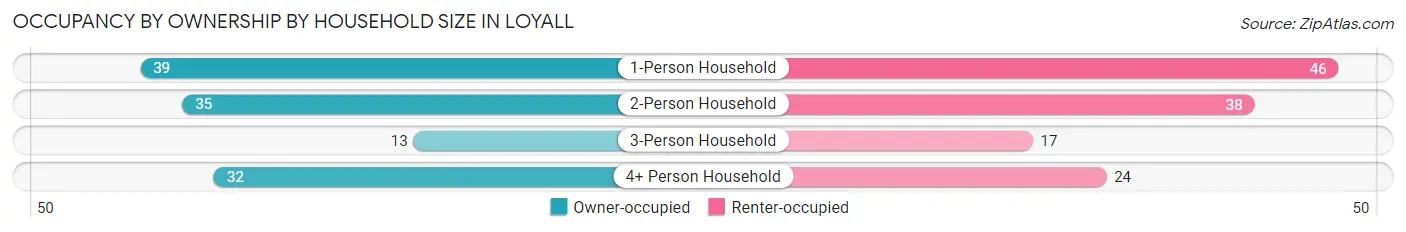
| Household Size | Owner-occupied | Renter-occupied |
| 1-Person Household | 39 (45.9%) | 46 (54.1%) |
| 2-Person Household | 35 (47.9%) | 38 (52.0%) |
| 3-Person Household | 13 (43.3%) | 17 (56.7%) |
| 4+ Person Household | 32 (57.1%) | 24 (42.9%) |
| Total Housing Units | 119 (48.8%) | 125 (51.2%) |
Occupancy by Educational Attainment in Loyall
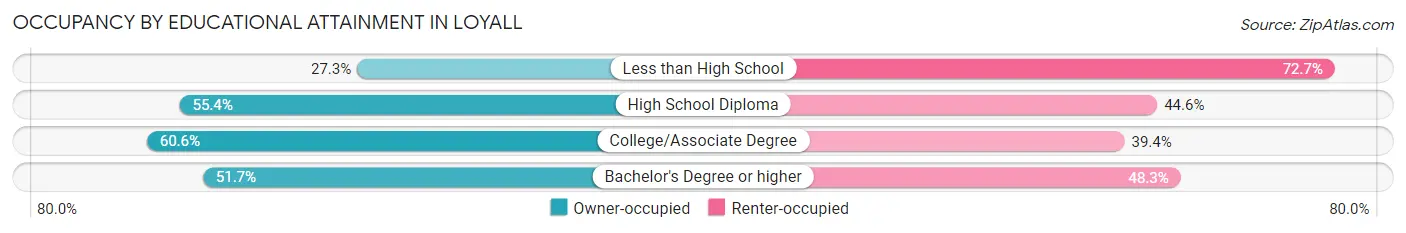
| Household Size | Owner-occupied | Renter-occupied |
| Less than High School | 18 (27.3%) | 48 (72.7%) |
| High School Diploma | 46 (55.4%) | 37 (44.6%) |
| College/Associate Degree | 40 (60.6%) | 26 (39.4%) |
| Bachelor's Degree or higher | 15 (51.7%) | 14 (48.3%) |
Occupancy by Age of Householder in Loyall
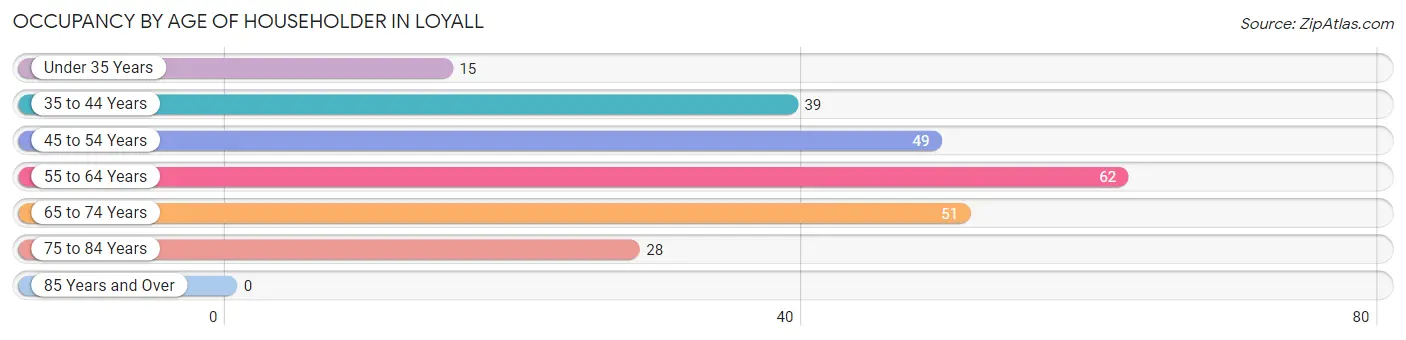
| Age Bracket | # Households | % Households |
| Under 35 Years | 15 | 6.1% |
| 35 to 44 Years | 39 | 16.0% |
| 45 to 54 Years | 49 | 20.1% |
| 55 to 64 Years | 62 | 25.4% |
| 65 to 74 Years | 51 | 20.9% |
| 75 to 84 Years | 28 | 11.5% |
| 85 Years and Over | 0 | 0.0% |
| Total | 244 | 100.0% |
Housing Finances in Loyall
Median Income by Occupancy in Loyall
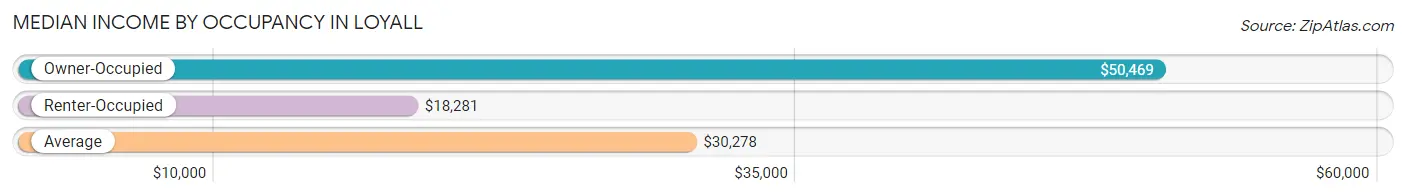
| Occupancy Type | # Households | Median Income |
| Owner-Occupied | 119 (48.8%) | $50,469 |
| Renter-Occupied | 125 (51.2%) | $18,281 |
| Average | 244 (100.0%) | $30,278 |
Occupancy by Householder Income Bracket in Loyall
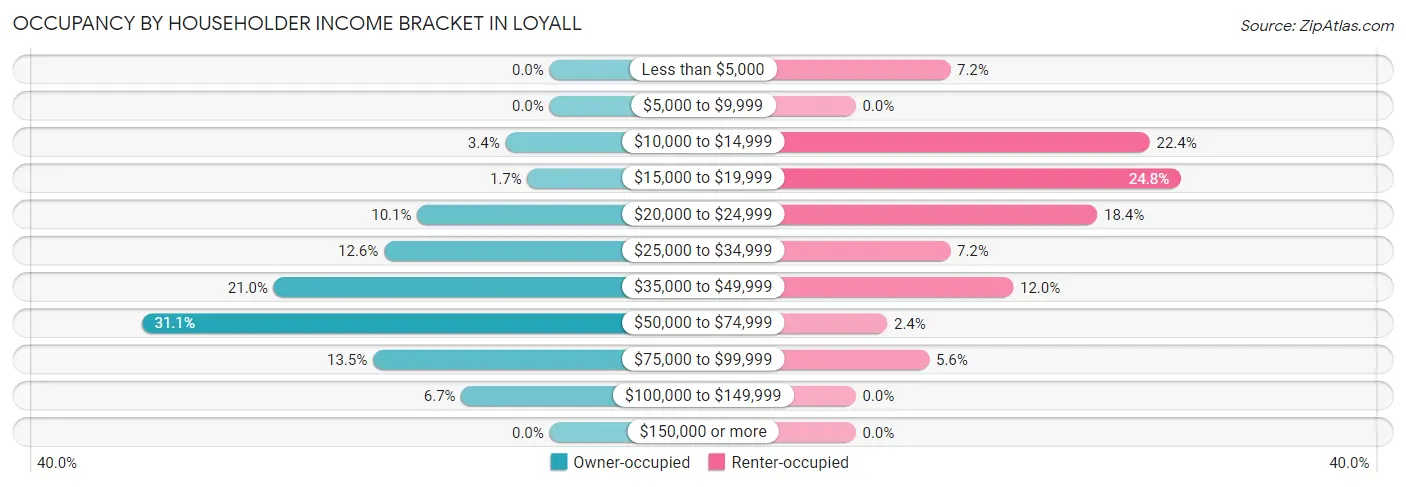
| Income Bracket | Owner-occupied | Renter-occupied |
| Less than $5,000 | 0 (0.0%) | 9 (7.2%) |
| $5,000 to $9,999 | 0 (0.0%) | 0 (0.0%) |
| $10,000 to $14,999 | 4 (3.4%) | 28 (22.4%) |
| $15,000 to $19,999 | 2 (1.7%) | 31 (24.8%) |
| $20,000 to $24,999 | 12 (10.1%) | 23 (18.4%) |
| $25,000 to $34,999 | 15 (12.6%) | 9 (7.2%) |
| $35,000 to $49,999 | 25 (21.0%) | 15 (12.0%) |
| $50,000 to $74,999 | 37 (31.1%) | 3 (2.4%) |
| $75,000 to $99,999 | 16 (13.5%) | 7 (5.6%) |
| $100,000 to $149,999 | 8 (6.7%) | 0 (0.0%) |
| $150,000 or more | 0 (0.0%) | 0 (0.0%) |
| Total | 119 (100.0%) | 125 (100.0%) |
Monthly Housing Cost Tiers in Loyall
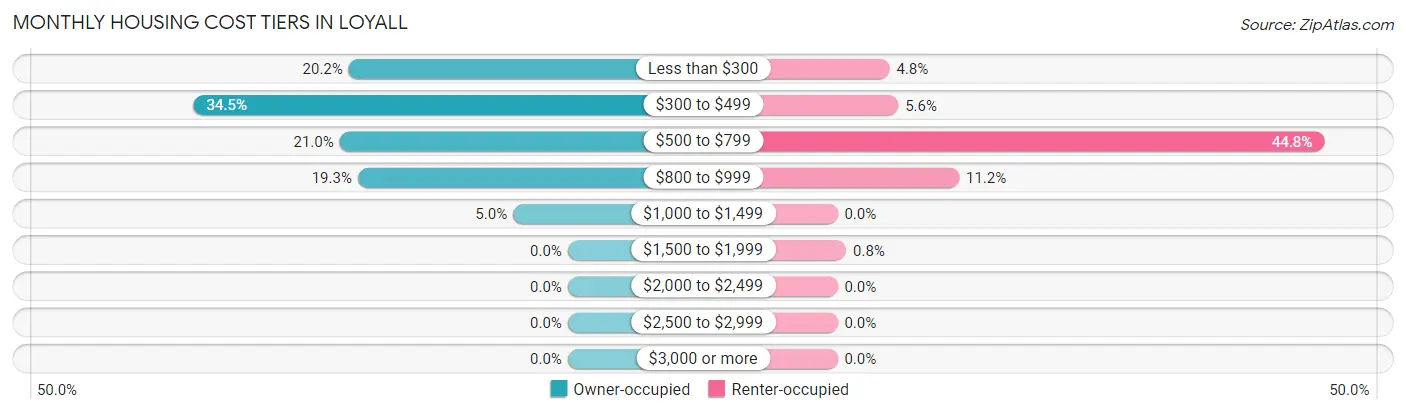
| Monthly Cost | Owner-occupied | Renter-occupied |
| Less than $300 | 24 (20.2%) | 6 (4.8%) |
| $300 to $499 | 41 (34.4%) | 7 (5.6%) |
| $500 to $799 | 25 (21.0%) | 56 (44.8%) |
| $800 to $999 | 23 (19.3%) | 14 (11.2%) |
| $1,000 to $1,499 | 6 (5.0%) | 0 (0.0%) |
| $1,500 to $1,999 | 0 (0.0%) | 1 (0.8%) |
| $2,000 to $2,499 | 0 (0.0%) | 0 (0.0%) |
| $2,500 to $2,999 | 0 (0.0%) | 0 (0.0%) |
| $3,000 or more | 0 (0.0%) | 0 (0.0%) |
| Total | 119 (100.0%) | 125 (100.0%) |
Physical Housing Characteristics in Loyall
Housing Structures in Loyall
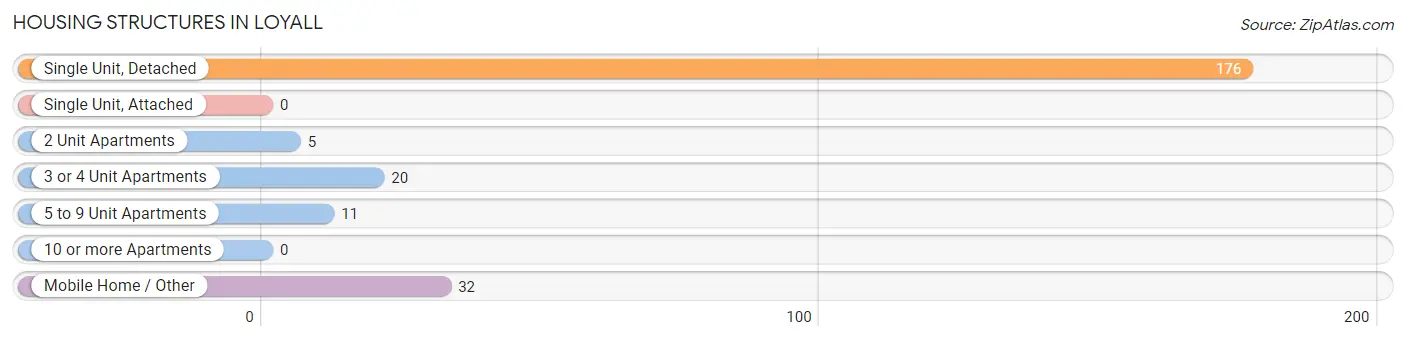
| Structure Type | # Housing Units | % Housing Units |
| Single Unit, Detached | 176 | 72.1% |
| Single Unit, Attached | 0 | 0.0% |
| 2 Unit Apartments | 5 | 2.1% |
| 3 or 4 Unit Apartments | 20 | 8.2% |
| 5 to 9 Unit Apartments | 11 | 4.5% |
| 10 or more Apartments | 0 | 0.0% |
| Mobile Home / Other | 32 | 13.1% |
| Total | 244 | 100.0% |
Housing Structures by Occupancy in Loyall
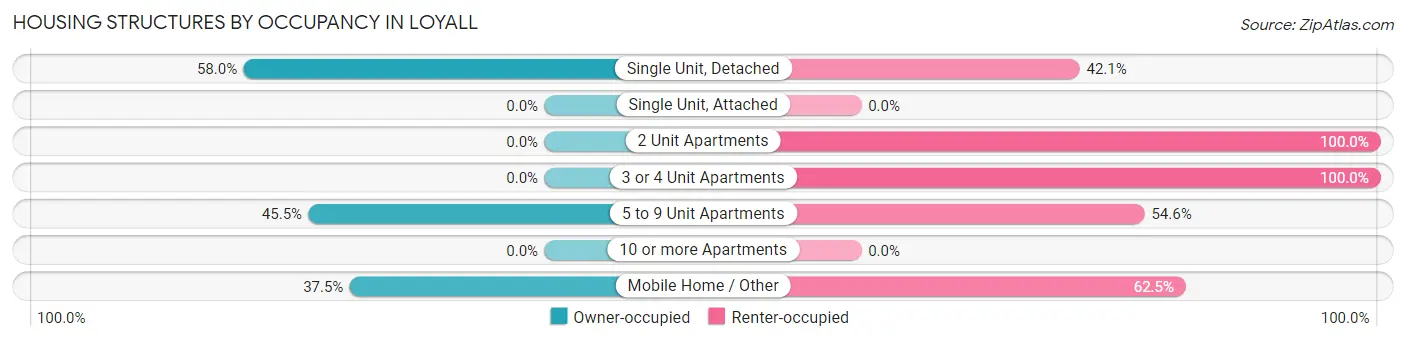
| Structure Type | Owner-occupied | Renter-occupied |
| Single Unit, Detached | 102 (58.0%) | 74 (42.0%) |
| Single Unit, Attached | 0 (0.0%) | 0 (0.0%) |
| 2 Unit Apartments | 0 (0.0%) | 5 (100.0%) |
| 3 or 4 Unit Apartments | 0 (0.0%) | 20 (100.0%) |
| 5 to 9 Unit Apartments | 5 (45.5%) | 6 (54.5%) |
| 10 or more Apartments | 0 (0.0%) | 0 (0.0%) |
| Mobile Home / Other | 12 (37.5%) | 20 (62.5%) |
| Total | 119 (48.8%) | 125 (51.2%) |
Housing Structures by Number of Rooms in Loyall
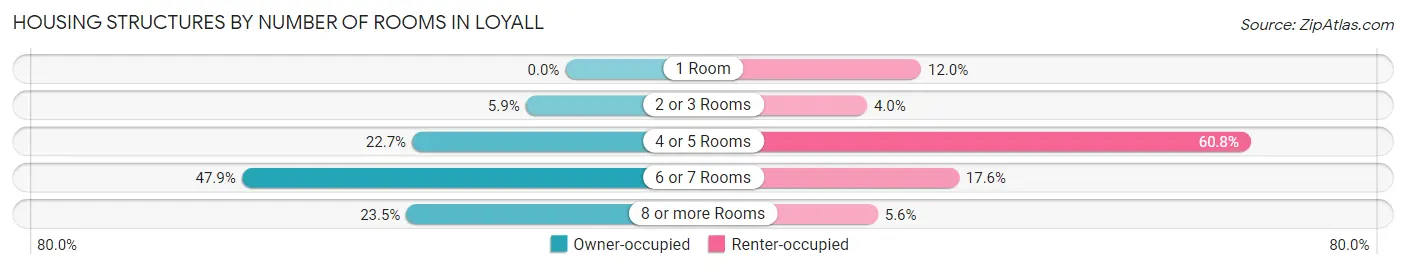
| Number of Rooms | Owner-occupied | Renter-occupied |
| 1 Room | 0 (0.0%) | 15 (12.0%) |
| 2 or 3 Rooms | 7 (5.9%) | 5 (4.0%) |
| 4 or 5 Rooms | 27 (22.7%) | 76 (60.8%) |
| 6 or 7 Rooms | 57 (47.9%) | 22 (17.6%) |
| 8 or more Rooms | 28 (23.5%) | 7 (5.6%) |
| Total | 119 (100.0%) | 125 (100.0%) |
Housing Structure by Heating Type in Loyall
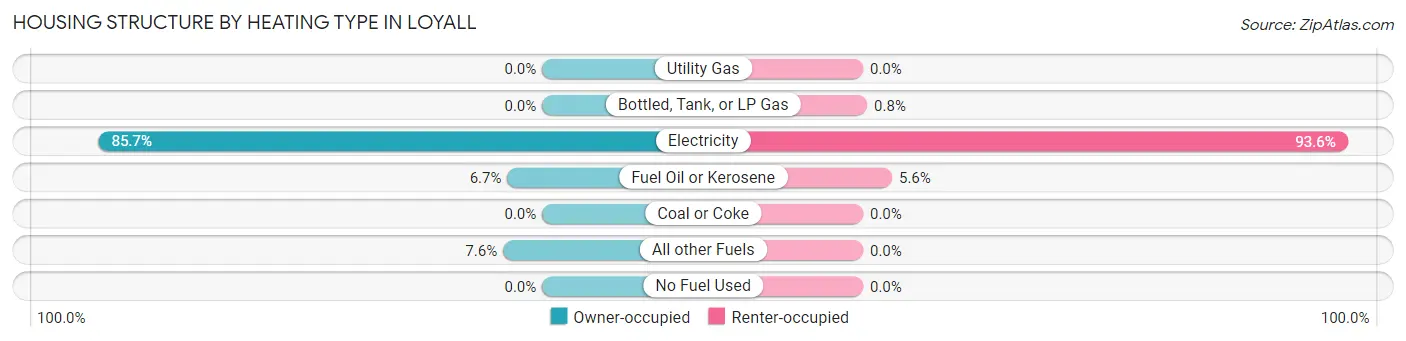
| Heating Type | Owner-occupied | Renter-occupied |
| Utility Gas | 0 (0.0%) | 0 (0.0%) |
| Bottled, Tank, or LP Gas | 0 (0.0%) | 1 (0.8%) |
| Electricity | 102 (85.7%) | 117 (93.6%) |
| Fuel Oil or Kerosene | 8 (6.7%) | 7 (5.6%) |
| Coal or Coke | 0 (0.0%) | 0 (0.0%) |
| All other Fuels | 9 (7.6%) | 0 (0.0%) |
| No Fuel Used | 0 (0.0%) | 0 (0.0%) |
| Total | 119 (100.0%) | 125 (100.0%) |
Household Vehicle Usage in Loyall
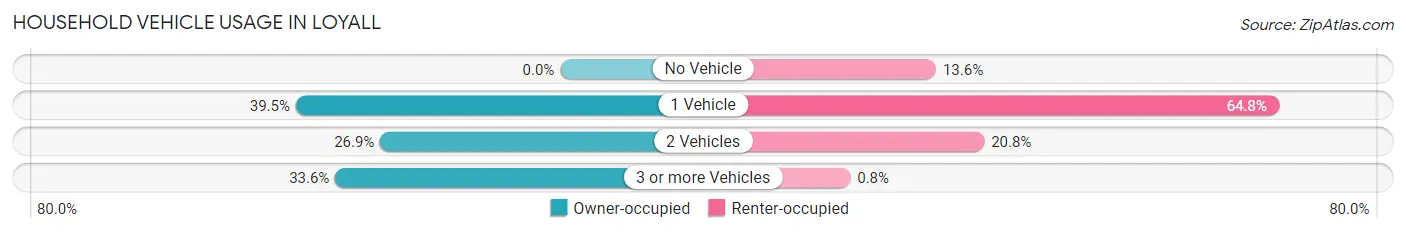
| Vehicles per Household | Owner-occupied | Renter-occupied |
| No Vehicle | 0 (0.0%) | 17 (13.6%) |
| 1 Vehicle | 47 (39.5%) | 81 (64.8%) |
| 2 Vehicles | 32 (26.9%) | 26 (20.8%) |
| 3 or more Vehicles | 40 (33.6%) | 1 (0.8%) |
| Total | 119 (100.0%) | 125 (100.0%) |
Real Estate & Mortgages in Loyall
Real Estate and Mortgage Overview in Loyall
| Characteristic | Without Mortgage | With Mortgage |
| Housing Units | 70 | 49 |
| Median Property Value | $64,500 | $74,600 |
| Median Household Income | $50,625 | $0 |
| Monthly Housing Costs | $373 | $0 |
| Real Estate Taxes | $531 | $0 |
Property Value by Mortgage Status in Loyall
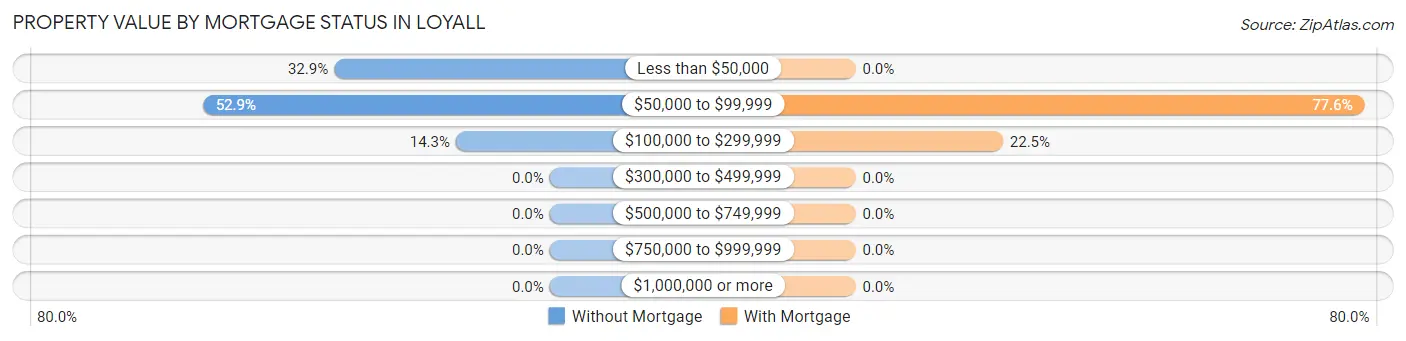
| Property Value | Without Mortgage | With Mortgage |
| Less than $50,000 | 23 (32.9%) | 0 (0.0%) |
| $50,000 to $99,999 | 37 (52.9%) | 38 (77.5%) |
| $100,000 to $299,999 | 10 (14.3%) | 11 (22.5%) |
| $300,000 to $499,999 | 0 (0.0%) | 0 (0.0%) |
| $500,000 to $749,999 | 0 (0.0%) | 0 (0.0%) |
| $750,000 to $999,999 | 0 (0.0%) | 0 (0.0%) |
| $1,000,000 or more | 0 (0.0%) | 0 (0.0%) |
| Total | 70 (100.0%) | 49 (100.0%) |
Household Income by Mortgage Status in Loyall
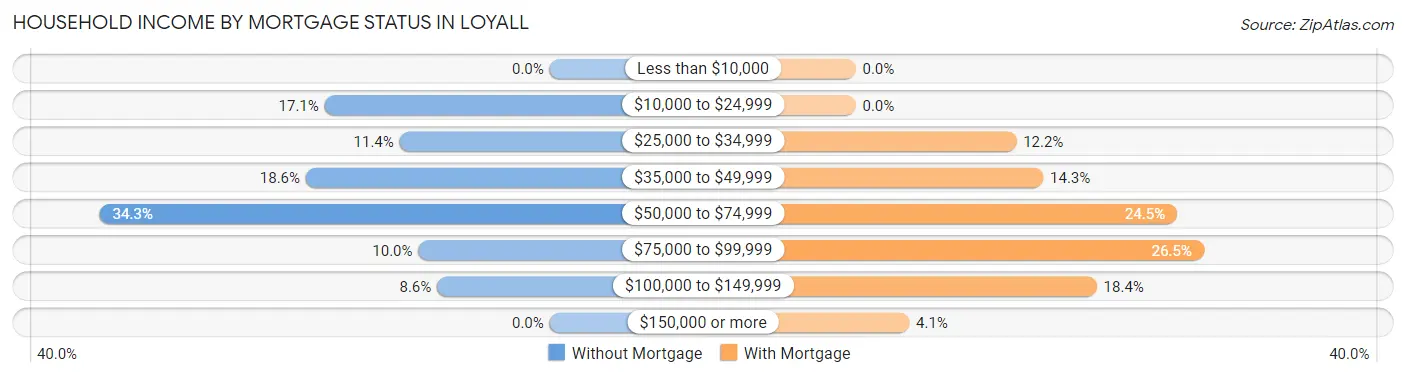
| Household Income | Without Mortgage | With Mortgage |
| Less than $10,000 | 0 (0.0%) | 0 (0.0%) |
| $10,000 to $24,999 | 12 (17.1%) | 0 (0.0%) |
| $25,000 to $34,999 | 8 (11.4%) | 6 (12.2%) |
| $35,000 to $49,999 | 13 (18.6%) | 7 (14.3%) |
| $50,000 to $74,999 | 24 (34.3%) | 12 (24.5%) |
| $75,000 to $99,999 | 7 (10.0%) | 13 (26.5%) |
| $100,000 to $149,999 | 6 (8.6%) | 9 (18.4%) |
| $150,000 or more | 0 (0.0%) | 2 (4.1%) |
| Total | 70 (100.0%) | 49 (100.0%) |
Property Value to Household Income Ratio in Loyall
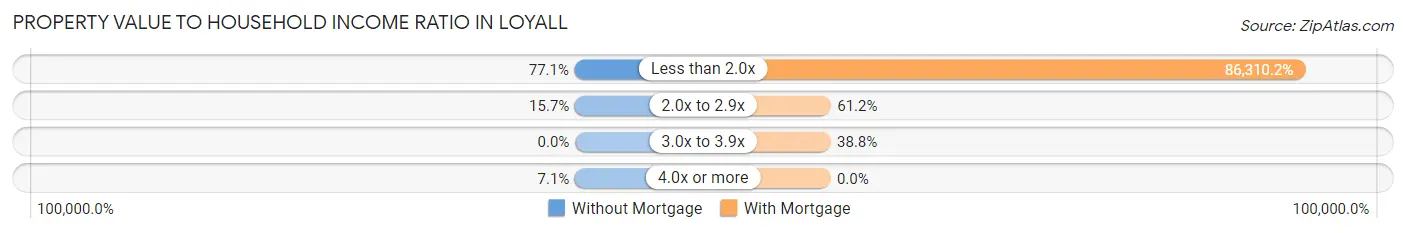
| Value-to-Income Ratio | Without Mortgage | With Mortgage |
| Less than 2.0x | 54 (77.1%) | 42,292 (86,310.2%) |
| 2.0x to 2.9x | 11 (15.7%) | 30 (61.2%) |
| 3.0x to 3.9x | 0 (0.0%) | 19 (38.8%) |
| 4.0x or more | 5 (7.1%) | 0 (0.0%) |
| Total | 70 (100.0%) | 49 (100.0%) |
Real Estate Taxes by Mortgage Status in Loyall
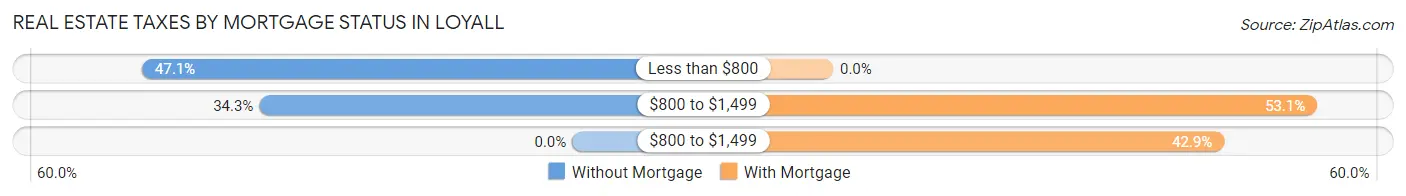
| Property Taxes | Without Mortgage | With Mortgage |
| Less than $800 | 33 (47.1%) | 0 (0.0%) |
| $800 to $1,499 | 24 (34.3%) | 26 (53.1%) |
| $800 to $1,499 | 0 (0.0%) | 21 (42.9%) |
| Total | 70 (100.0%) | 49 (100.0%) |
Health & Disability in Loyall
Health Insurance Coverage by Age in Loyall
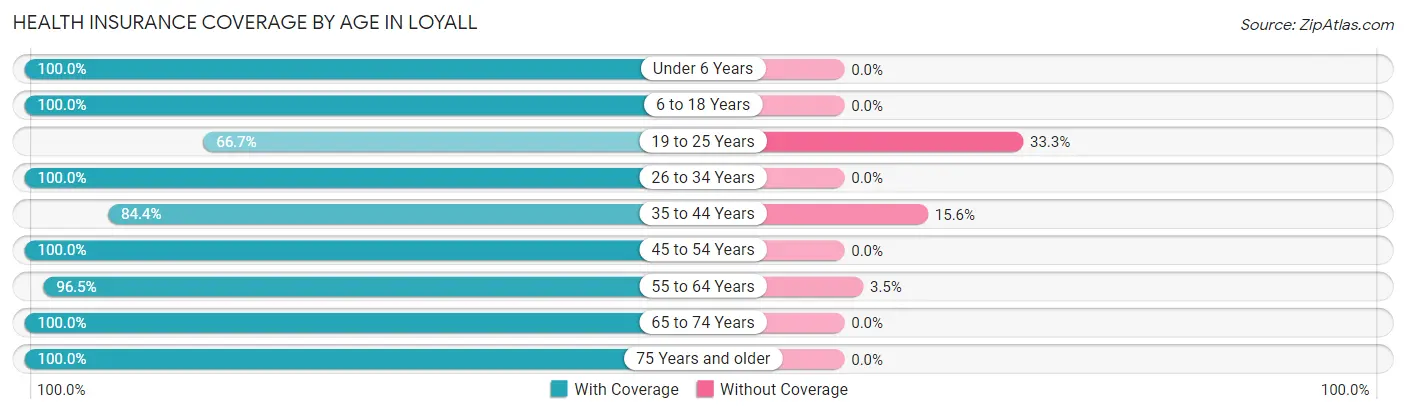
| Age Bracket | With Coverage | Without Coverage |
| Under 6 Years | 25 (100.0%) | 0 (0.0%) |
| 6 to 18 Years | 149 (100.0%) | 0 (0.0%) |
| 19 to 25 Years | 16 (66.7%) | 8 (33.3%) |
| 26 to 34 Years | 40 (100.0%) | 0 (0.0%) |
| 35 to 44 Years | 65 (84.4%) | 12 (15.6%) |
| 45 to 54 Years | 101 (100.0%) | 0 (0.0%) |
| 55 to 64 Years | 83 (96.5%) | 3 (3.5%) |
| 65 to 74 Years | 68 (100.0%) | 0 (0.0%) |
| 75 Years and older | 44 (100.0%) | 0 (0.0%) |
| Total | 591 (96.3%) | 23 (3.7%) |
Health Insurance Coverage by Citizenship Status in Loyall
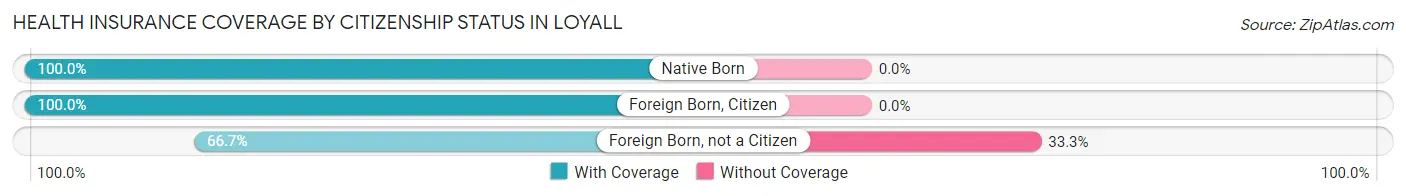
| Citizenship Status | With Coverage | Without Coverage |
| Native Born | 25 (100.0%) | 0 (0.0%) |
| Foreign Born, Citizen | 149 (100.0%) | 0 (0.0%) |
| Foreign Born, not a Citizen | 16 (66.7%) | 8 (33.3%) |
Health Insurance Coverage by Household Income in Loyall
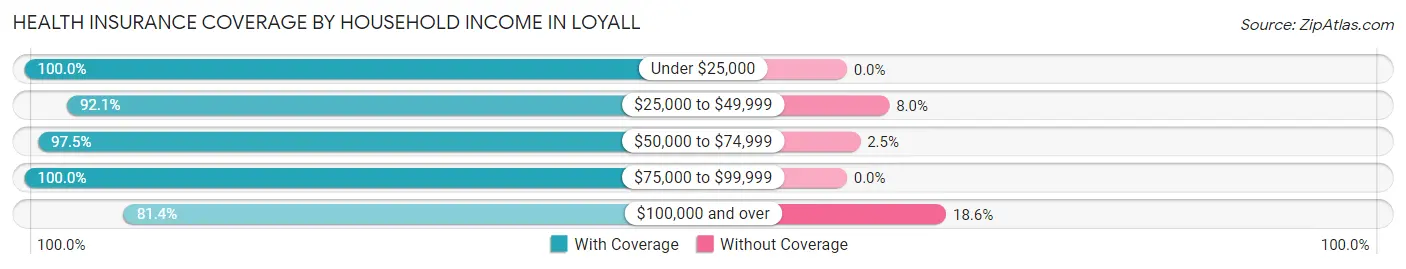
| Household Income | With Coverage | Without Coverage |
| Under $25,000 | 241 (100.0%) | 0 (0.0%) |
| $25,000 to $49,999 | 139 (92.0%) | 12 (8.0%) |
| $50,000 to $74,999 | 116 (97.5%) | 3 (2.5%) |
| $75,000 to $99,999 | 60 (100.0%) | 0 (0.0%) |
| $100,000 and over | 35 (81.4%) | 8 (18.6%) |
Public vs Private Health Insurance Coverage by Age in Loyall
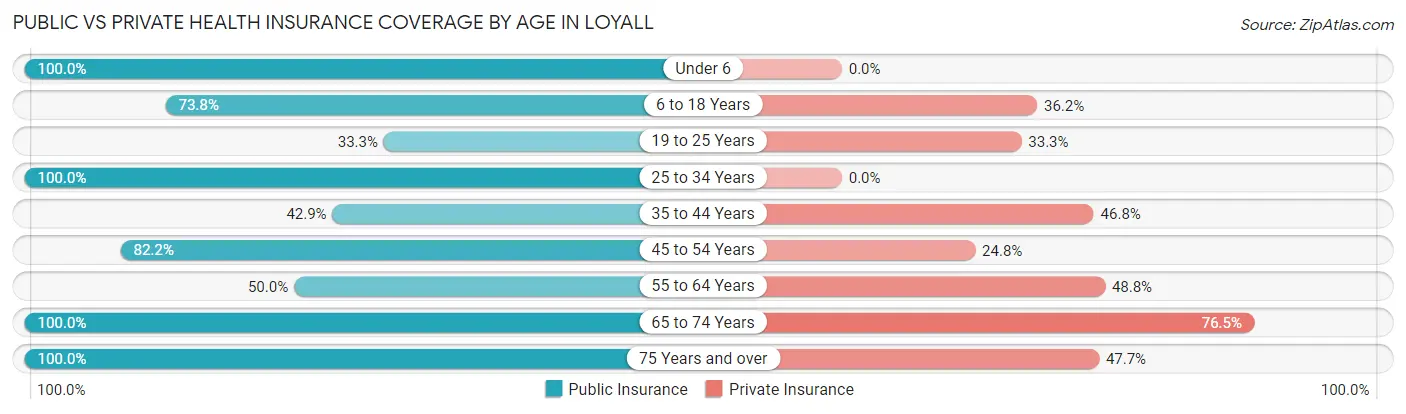
| Age Bracket | Public Insurance | Private Insurance |
| Under 6 | 25 (100.0%) | 0 (0.0%) |
| 6 to 18 Years | 110 (73.8%) | 54 (36.2%) |
| 19 to 25 Years | 8 (33.3%) | 8 (33.3%) |
| 25 to 34 Years | 40 (100.0%) | 0 (0.0%) |
| 35 to 44 Years | 33 (42.9%) | 36 (46.8%) |
| 45 to 54 Years | 83 (82.2%) | 25 (24.7%) |
| 55 to 64 Years | 43 (50.0%) | 42 (48.8%) |
| 65 to 74 Years | 68 (100.0%) | 52 (76.5%) |
| 75 Years and over | 44 (100.0%) | 21 (47.7%) |
| Total | 454 (73.9%) | 238 (38.8%) |
Disability Status by Sex by Age in Loyall
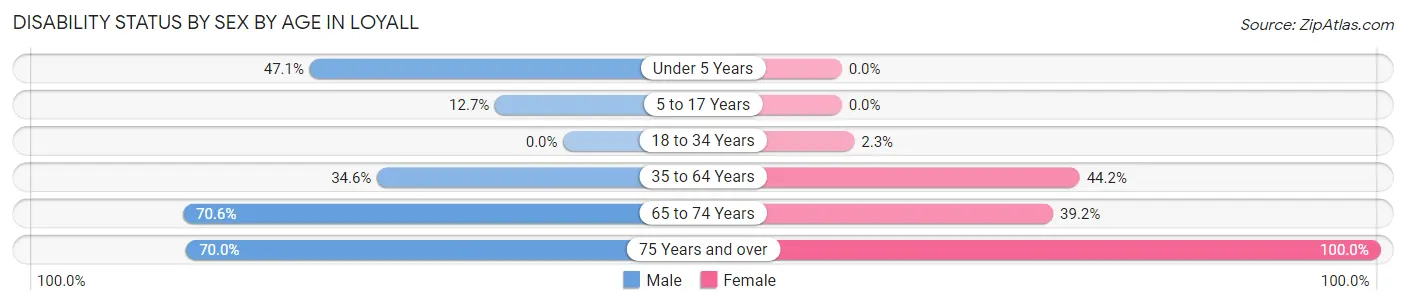
| Age Bracket | Male | Female |
| Under 5 Years | 8 (47.1%) | 0 (0.0%) |
| 5 to 17 Years | 10 (12.7%) | 0 (0.0%) |
| 18 to 34 Years | 0 (0.0%) | 1 (2.3%) |
| 35 to 64 Years | 38 (34.5%) | 68 (44.2%) |
| 65 to 74 Years | 12 (70.6%) | 20 (39.2%) |
| 75 Years and over | 14 (70.0%) | 24 (100.0%) |
Disability Class by Sex by Age in Loyall
Disability Class: Hearing Difficulty
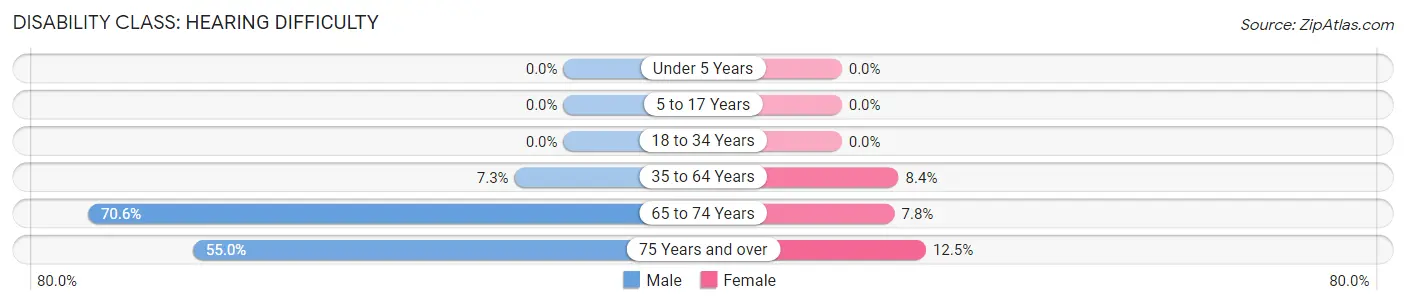
| Age Bracket | Male | Female |
| Under 5 Years | 0 (0.0%) | 0 (0.0%) |
| 5 to 17 Years | 0 (0.0%) | 0 (0.0%) |
| 18 to 34 Years | 0 (0.0%) | 0 (0.0%) |
| 35 to 64 Years | 8 (7.3%) | 13 (8.4%) |
| 65 to 74 Years | 12 (70.6%) | 4 (7.8%) |
| 75 Years and over | 11 (55.0%) | 3 (12.5%) |
Disability Class: Vision Difficulty
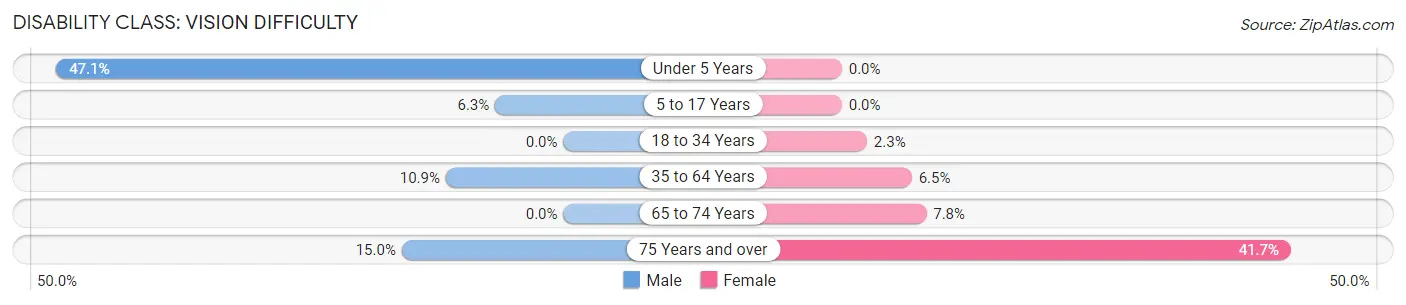
| Age Bracket | Male | Female |
| Under 5 Years | 8 (47.1%) | 0 (0.0%) |
| 5 to 17 Years | 5 (6.3%) | 0 (0.0%) |
| 18 to 34 Years | 0 (0.0%) | 1 (2.3%) |
| 35 to 64 Years | 12 (10.9%) | 10 (6.5%) |
| 65 to 74 Years | 0 (0.0%) | 4 (7.8%) |
| 75 Years and over | 3 (15.0%) | 10 (41.7%) |
Disability Class: Cognitive Difficulty
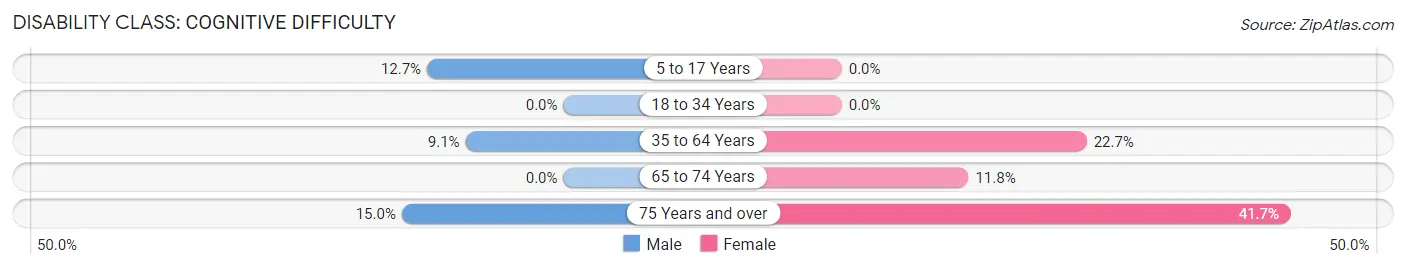
| Age Bracket | Male | Female |
| 5 to 17 Years | 10 (12.7%) | 0 (0.0%) |
| 18 to 34 Years | 0 (0.0%) | 0 (0.0%) |
| 35 to 64 Years | 10 (9.1%) | 35 (22.7%) |
| 65 to 74 Years | 0 (0.0%) | 6 (11.8%) |
| 75 Years and over | 3 (15.0%) | 10 (41.7%) |
Disability Class: Ambulatory Difficulty
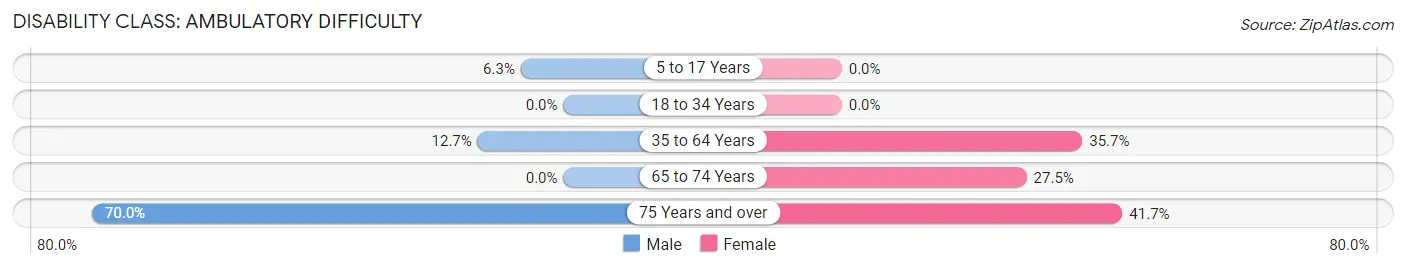
| Age Bracket | Male | Female |
| 5 to 17 Years | 5 (6.3%) | 0 (0.0%) |
| 18 to 34 Years | 0 (0.0%) | 0 (0.0%) |
| 35 to 64 Years | 14 (12.7%) | 55 (35.7%) |
| 65 to 74 Years | 0 (0.0%) | 14 (27.5%) |
| 75 Years and over | 14 (70.0%) | 10 (41.7%) |
Disability Class: Self-Care Difficulty
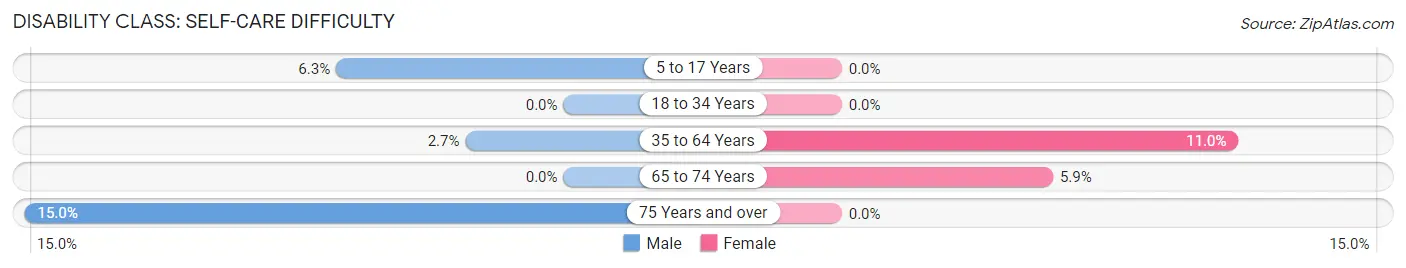
| Age Bracket | Male | Female |
| 5 to 17 Years | 5 (6.3%) | 0 (0.0%) |
| 18 to 34 Years | 0 (0.0%) | 0 (0.0%) |
| 35 to 64 Years | 3 (2.7%) | 17 (11.0%) |
| 65 to 74 Years | 0 (0.0%) | 3 (5.9%) |
| 75 Years and over | 3 (15.0%) | 0 (0.0%) |
Technology Access in Loyall
Computing Device Access in Loyall
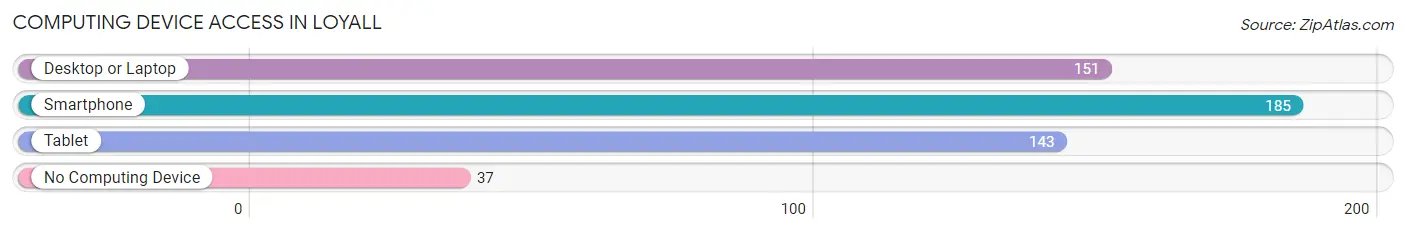
| Device Type | # Households | % Households |
| Desktop or Laptop | 151 | 61.9% |
| Smartphone | 185 | 75.8% |
| Tablet | 143 | 58.6% |
| No Computing Device | 37 | 15.2% |
| Total | 244 | 100.0% |
Internet Access in Loyall
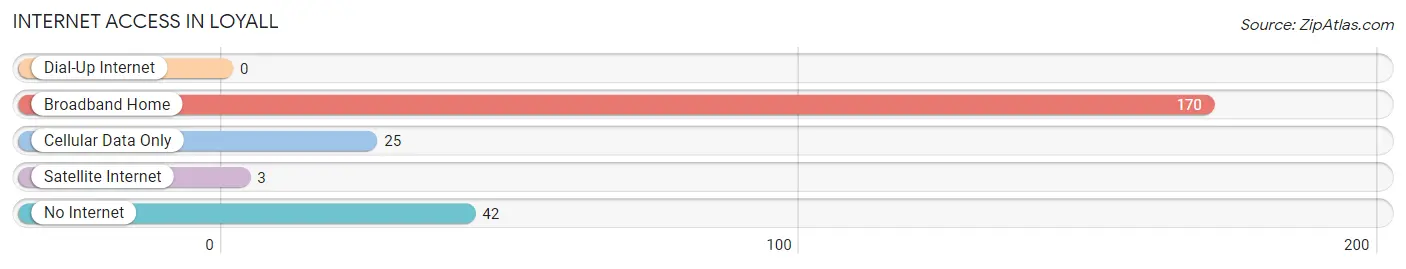
| Internet Type | # Households | % Households |
| Dial-Up Internet | 0 | 0.0% |
| Broadband Home | 170 | 69.7% |
| Cellular Data Only | 25 | 10.2% |
| Satellite Internet | 3 | 1.2% |
| No Internet | 42 | 17.2% |
| Total | 244 | 100.0% |
Loyall Summary
Loyall is a small city located in Harlan County, Kentucky. It is situated in the Appalachian Mountains and is part of the Cumberland Plateau. The city has a population of 1,845 people as of the 2010 census.
History
Loyall was founded in 1883 by the Louisville and Nashville Railroad. The city was named after the Loyall family, who were prominent landowners in the area. The city was incorporated in 1891 and was the first city in Harlan County to be incorporated.
The city was a major coal mining center in the early 20th century. The coal industry was the main source of employment for the city's residents. The coal industry declined in the mid-20th century, and the city's population began to decline as well.
Geography
Loyall is located in the Appalachian Mountains in southeastern Kentucky. The city is situated in the Cumberland Plateau, which is a region of rolling hills and valleys. The city is located at the intersection of US Highway 119 and Kentucky Route 38.
The city has a total area of 1.2 square miles, all of which is land. The city is located at an elevation of 1,845 feet above sea level.
Economy
The economy of Loyall is largely based on agriculture and tourism. The city is home to several farms, which produce a variety of crops, including corn, soybeans, and tobacco. The city is also home to several tourist attractions, including the Loyall Coal Mine Museum and the Loyall Historical Society.
The city is also home to several small businesses, including restaurants, retail stores, and service providers. The city is also home to a few manufacturing companies, which produce a variety of products, including furniture, clothing, and automotive parts.
Demographics
As of the 2010 census, the population of Loyall was 1,845 people. The racial makeup of the city was 97.3% White, 0.7% African American, 0.2% Native American, 0.2% Asian, 0.1% Pacific Islander, 0.2% from other races, and 1.3% from two or more races. Hispanic or Latino of any race were 0.7% of the population.
The median household income in Loyall was $25,938, and the median family income was $31,250. The per capita income for the city was $14,845. About 17.3% of the population was below the poverty line.
Conclusion
Loyall is a small city located in Harlan County, Kentucky. It is situated in the Appalachian Mountains and is part of the Cumberland Plateau. The city was founded in 1883 and was a major coal mining center in the early 20th century. The economy of Loyall is largely based on agriculture and tourism. The population of Loyall was 1,845 people as of the 2010 census. The city is home to several farms, tourist attractions, and small businesses.
Common Questions
What is Per Capita Income in Loyall?
Per Capita income in Loyall is $16,017.
What is the Median Family Income in Loyall?
Median Family Income in Loyall is $37,639.
What is the Median Household income in Loyall?
Median Household Income in Loyall is $30,278.
What is Income or Wage Gap in Loyall?
Income or Wage Gap in Loyall is 16.4%.
Women in Loyall earn 83.6 cents for every dollar earned by a man.
What is Family Income Deficit in Loyall?
Family Income Deficit in Loyall is $9,702.
Families that are below poverty line in Loyall earn $9,702 less on average than the poverty threshold level.
What is Inequality or Gini Index in Loyall?
Inequality or Gini Index in Loyall is 0.39.
What is the Total Population of Loyall?
Total Population of Loyall is 614.
What is the Total Male Population of Loyall?
Total Male Population of Loyall is 276.
What is the Total Female Population of Loyall?
Total Female Population of Loyall is 338.
What is the Ratio of Males per 100 Females in Loyall?
There are 81.66 Males per 100 Females in Loyall.
What is the Ratio of Females per 100 Males in Loyall?
There are 122.46 Females per 100 Males in Loyall.
What is the Median Population Age in Loyall?
Median Population Age in Loyall is 39.8 Years.
What is the Average Family Size in Loyall
Average Family Size in Loyall is 3.4 People.
What is the Average Household Size in Loyall
Average Household Size in Loyall is 2.5 People.
How Large is the Labor Force in Loyall?
There are 192 People in the Labor Forcein in Loyall.
What is the Percentage of People in the Labor Force in Loyall?
41.0% of People are in the Labor Force in Loyall.
What is the Unemployment Rate in Loyall?
Unemployment Rate in Loyall is 8.3%.