Elk Creek, KY Map & Demographics
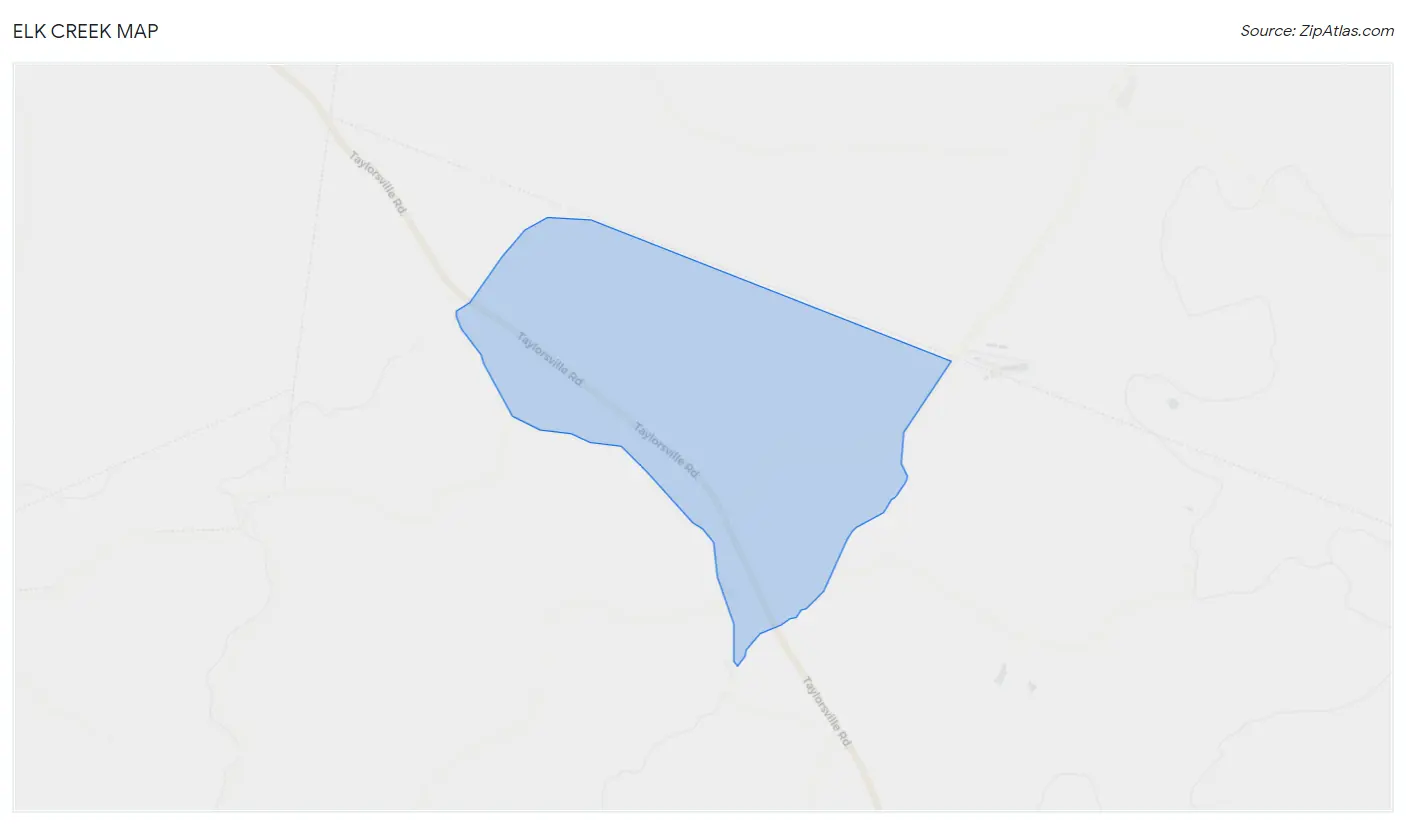
Elk Creek Map
Elk Creek Overview
$48,870
PER CAPITA INCOME
$136,607
AVG FAMILY INCOME
$131,172
AVG HOUSEHOLD INCOME
29.0%
WAGE / INCOME GAP [ % ]
71.0¢/ $1
WAGE / INCOME GAP [ $ ]
0.43
INEQUALITY / GINI INDEX
2,295
TOTAL POPULATION
1,125
MALE POPULATION
1,170
FEMALE POPULATION
96.15
MALES / 100 FEMALES
104.00
FEMALES / 100 MALES
35.0
MEDIAN AGE
3.5
AVG FAMILY SIZE
3.4
AVG HOUSEHOLD SIZE
1,180
LABOR FORCE [ PEOPLE ]
71.4%
PERCENT IN LABOR FORCE
4.9%
UNEMPLOYMENT RATE
Income in Elk Creek
Income Overview in Elk Creek
Per Capita Income in Elk Creek is $48,870, while median incomes of families and households are $136,607 and $131,172 respectively.
| Characteristic | Number | Measure |
| Per Capita Income | 2,295 | $48,870 |
| Median Family Income | 581 | $136,607 |
| Mean Family Income | 581 | $169,062 |
| Median Household Income | 679 | $131,172 |
| Mean Household Income | 679 | $153,276 |
| Income Deficit | 581 | $0 |
| Wage / Income Gap (%) | 2,295 | 29.01% |
| Wage / Income Gap ($) | 2,295 | 70.99¢ per $1 |
| Gini / Inequality Index | 2,295 | 0.43 |
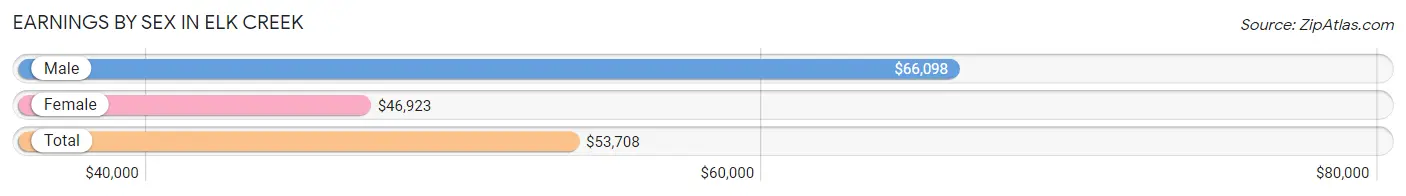
Earnings by Sex in Elk Creek
Average Earnings in Elk Creek are $53,708, $66,098 for men and $46,923 for women, a difference of 29.0%.
| Sex | Number | Average Earnings |
| Male | 621 (49.6%) | $66,098 |
| Female | 632 (50.4%) | $46,923 |
| Total | 1,253 (100.0%) | $53,708 |
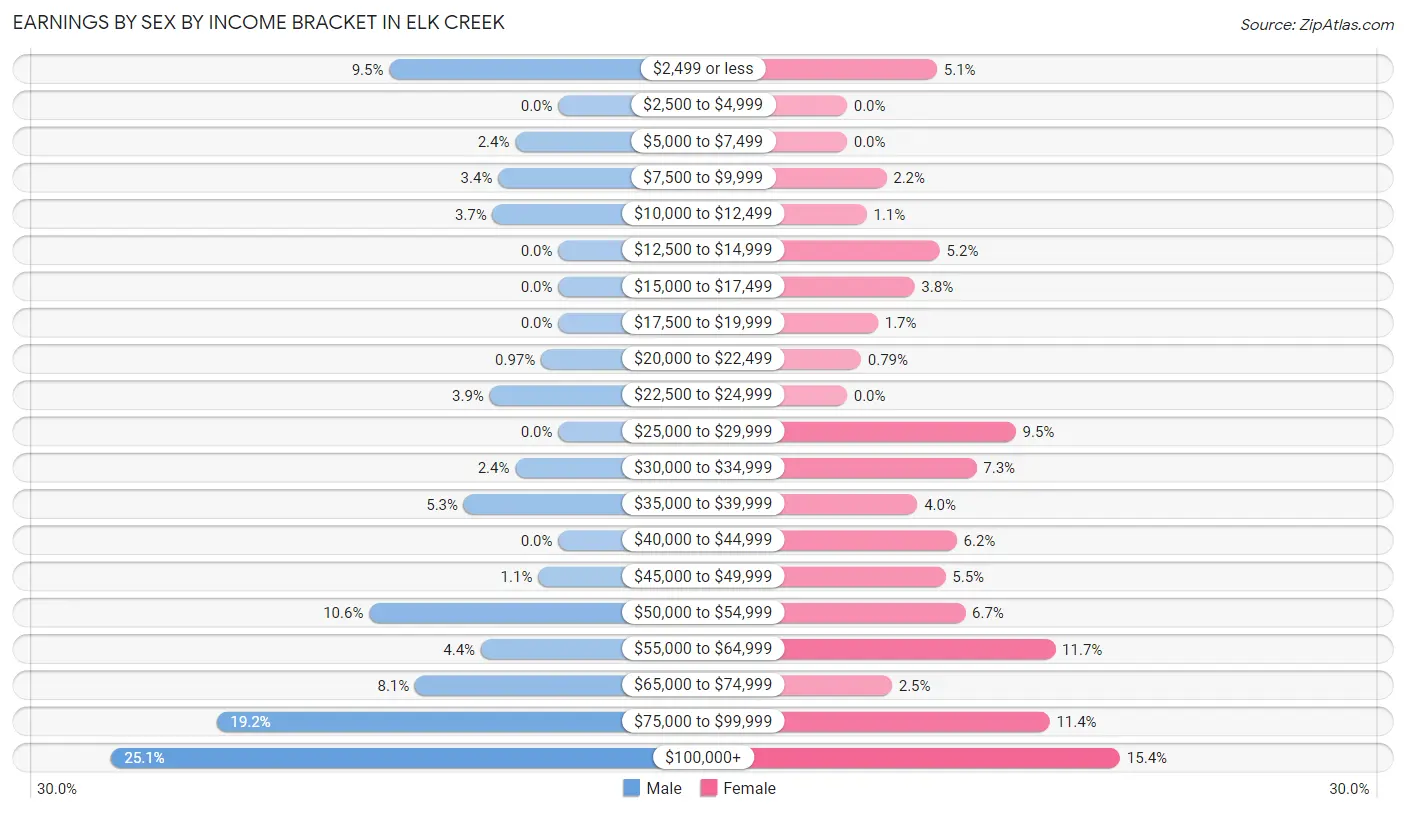
Earnings by Sex by Income Bracket in Elk Creek
The most common earnings brackets in Elk Creek are $100,000+ for men (156 | 25.1%) and $100,000+ for women (97 | 15.3%).
| Income | Male | Female |
| $2,499 or less | 59 (9.5%) | 32 (5.1%) |
| $2,500 to $4,999 | 0 (0.0%) | 0 (0.0%) |
| $5,000 to $7,499 | 15 (2.4%) | 0 (0.0%) |
| $7,500 to $9,999 | 21 (3.4%) | 14 (2.2%) |
| $10,000 to $12,499 | 23 (3.7%) | 7 (1.1%) |
| $12,500 to $14,999 | 0 (0.0%) | 33 (5.2%) |
| $15,000 to $17,499 | 0 (0.0%) | 24 (3.8%) |
| $17,500 to $19,999 | 0 (0.0%) | 11 (1.7%) |
| $20,000 to $22,499 | 6 (1.0%) | 5 (0.8%) |
| $22,500 to $24,999 | 24 (3.9%) | 0 (0.0%) |
| $25,000 to $29,999 | 0 (0.0%) | 60 (9.5%) |
| $30,000 to $34,999 | 15 (2.4%) | 46 (7.3%) |
| $35,000 to $39,999 | 33 (5.3%) | 25 (4.0%) |
| $40,000 to $44,999 | 0 (0.0%) | 39 (6.2%) |
| $45,000 to $49,999 | 7 (1.1%) | 35 (5.5%) |
| $50,000 to $54,999 | 66 (10.6%) | 42 (6.7%) |
| $55,000 to $64,999 | 27 (4.3%) | 74 (11.7%) |
| $65,000 to $74,999 | 50 (8.1%) | 16 (2.5%) |
| $75,000 to $99,999 | 119 (19.2%) | 72 (11.4%) |
| $100,000+ | 156 (25.1%) | 97 (15.3%) |
| Total | 621 (100.0%) | 632 (100.0%) |
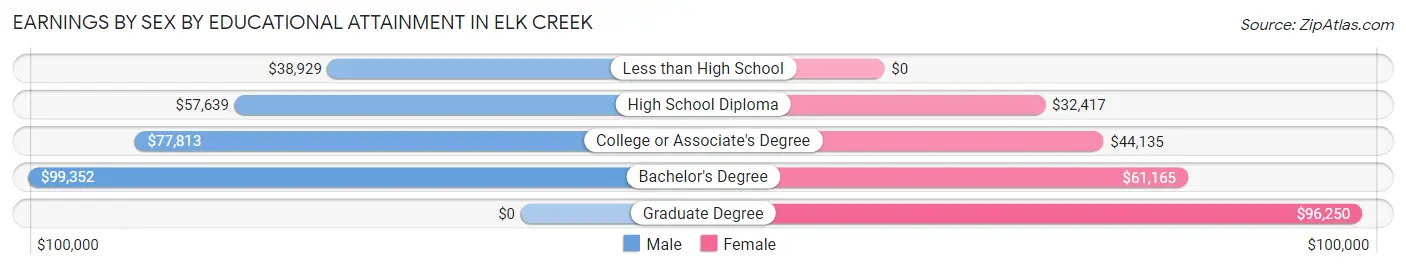
Earnings by Sex by Educational Attainment in Elk Creek
Average earnings in Elk Creek are $77,847 for men and $52,071 for women, a difference of 33.1%. Men with an educational attainment of bachelor's degree enjoy the highest average annual earnings of $99,352, while those with less than high school education earn the least with $38,929. Women with an educational attainment of graduate degree earn the most with the average annual earnings of $96,250, while those with high school diploma education have the smallest earnings of $32,417.
| Educational Attainment | Male Income | Female Income |
| Less than High School | $38,929 | $0 |
| High School Diploma | $57,639 | $32,417 |
| College or Associate's Degree | $77,813 | $44,135 |
| Bachelor's Degree | $99,352 | $61,165 |
| Graduate Degree | - | - |
| Total | $77,847 | $52,071 |
Family Income in Elk Creek
Family Income Brackets in Elk Creek
According to the Elk Creek family income data, there are 214 families falling into the $100,000 to $149,999 income range, which is the most common income bracket and makes up 36.8% of all families.
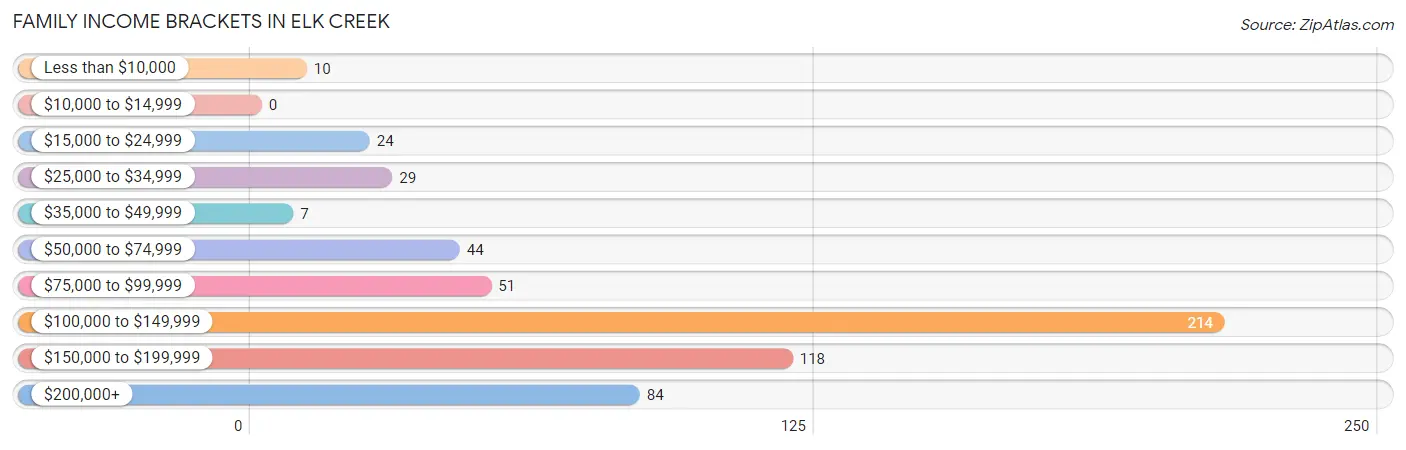
| Income Bracket | # Families | % Families |
| Less than $10,000 | 10 | 1.7% |
| $10,000 to $14,999 | 0 | 0.0% |
| $15,000 to $24,999 | 24 | 4.1% |
| $25,000 to $34,999 | 29 | 5.0% |
| $35,000 to $49,999 | 7 | 1.2% |
| $50,000 to $74,999 | 44 | 7.6% |
| $75,000 to $99,999 | 51 | 8.8% |
| $100,000 to $149,999 | 214 | 36.8% |
| $150,000 to $199,999 | 118 | 20.3% |
| $200,000+ | 84 | 14.5% |
Family Income by Famaliy Size in Elk Creek
4-person families (202 | 34.8%) account for the highest median family income in Elk Creek with $143,295 per family, while 2-person families (215 | 37.0%) have the highest median income of $59,744 per family member.
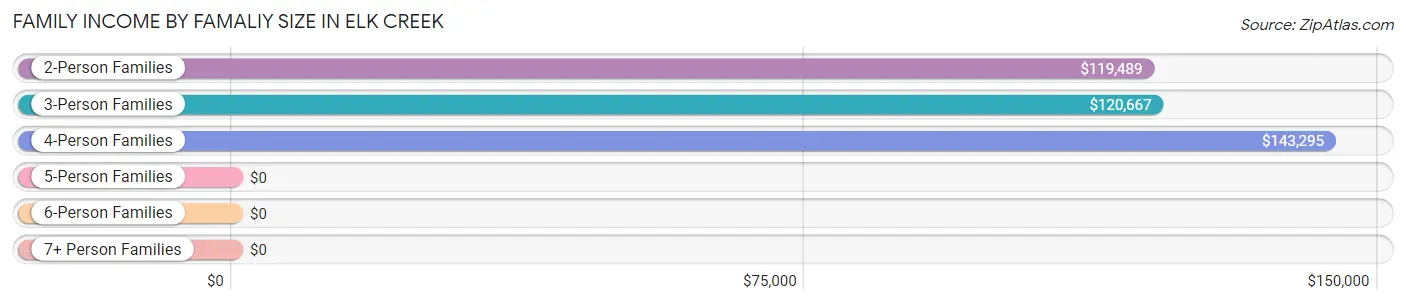
| Income Bracket | # Families | Median Income |
| 2-Person Families | 215 (37.0%) | $119,489 |
| 3-Person Families | 100 (17.2%) | $120,667 |
| 4-Person Families | 202 (34.8%) | $143,295 |
| 5-Person Families | 42 (7.2%) | $0 |
| 6-Person Families | 10 (1.7%) | $0 |
| 7+ Person Families | 12 (2.1%) | $0 |
| Total | 581 (100.0%) | $136,607 |
Family Income by Number of Earners in Elk Creek
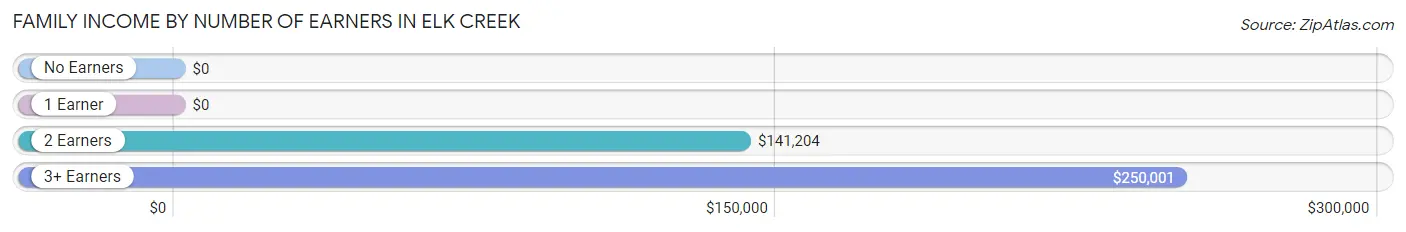
| Number of Earners | # Families | Median Income |
| No Earners | 65 (11.2%) | $0 |
| 1 Earner | 133 (22.9%) | $0 |
| 2 Earners | 304 (52.3%) | $141,204 |
| 3+ Earners | 79 (13.6%) | $250,001 |
| Total | 581 (100.0%) | $136,607 |
Household Income in Elk Creek
Household Income Brackets in Elk Creek
With 246 households falling in the category, the $100,000 to $149,999 income range is the most frequent in Elk Creek, accounting for 36.2% of all households.
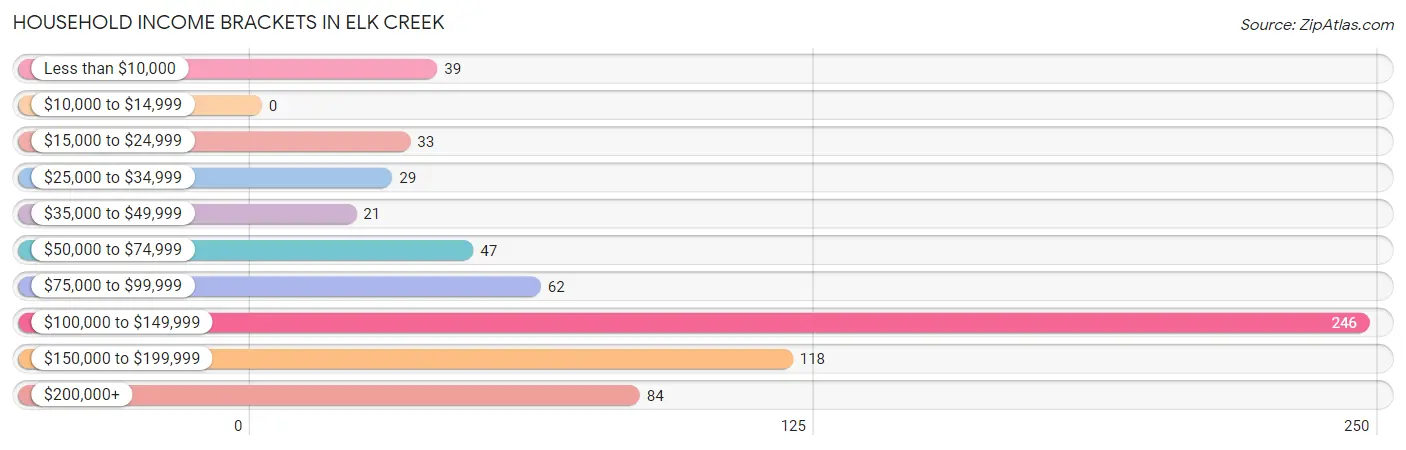
| Income Bracket | # Households | % Households |
| Less than $10,000 | 39 | 5.7% |
| $10,000 to $14,999 | 0 | 0.0% |
| $15,000 to $24,999 | 33 | 4.9% |
| $25,000 to $34,999 | 29 | 4.3% |
| $35,000 to $49,999 | 21 | 3.1% |
| $50,000 to $74,999 | 47 | 6.9% |
| $75,000 to $99,999 | 62 | 9.1% |
| $100,000 to $149,999 | 246 | 36.2% |
| $150,000 to $199,999 | 118 | 17.4% |
| $200,000+ | 84 | 12.4% |
Household Income by Householder Age in Elk Creek
The median household income in Elk Creek is $131,172, with the highest median household income of $137,071 found in the 25 to 44 years age bracket for the primary householder. A total of 262 households (38.6%) fall into this category.
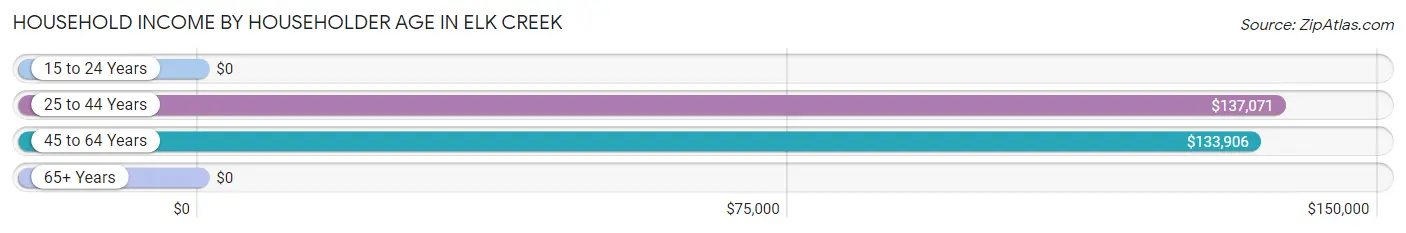
| Income Bracket | # Households | Median Income |
| 15 to 24 Years | 0 (0.0%) | $0 |
| 25 to 44 Years | 262 (38.6%) | $137,071 |
| 45 to 64 Years | 271 (39.9%) | $133,906 |
| 65+ Years | 146 (21.5%) | $0 |
| Total | 679 (100.0%) | $131,172 |
Poverty in Elk Creek
Income Below Poverty by Sex and Age in Elk Creek
With 2.9% poverty level for males and 16.2% for females among the residents of Elk Creek, 35 to 44 year old males and 15 year old females are the most vulnerable to poverty, with 21 males (10.3%) and 13 females (100.0%) in their respective age groups living below the poverty level.
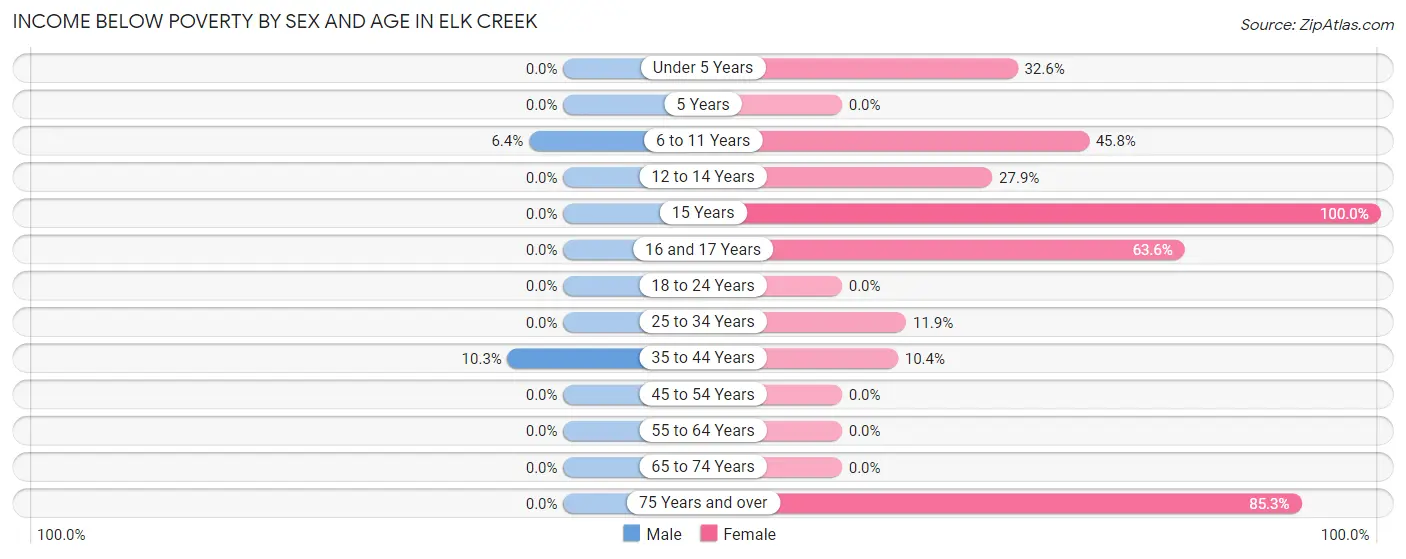
| Age Bracket | Male | Female |
| Under 5 Years | 0 (0.0%) | 30 (32.6%) |
| 5 Years | 0 (0.0%) | 0 (0.0%) |
| 6 to 11 Years | 11 (6.4%) | 22 (45.8%) |
| 12 to 14 Years | 0 (0.0%) | 12 (27.9%) |
| 15 Years | 0 (0.0%) | 13 (100.0%) |
| 16 and 17 Years | 0 (0.0%) | 28 (63.6%) |
| 18 to 24 Years | 0 (0.0%) | 0 (0.0%) |
| 25 to 34 Years | 0 (0.0%) | 26 (11.9%) |
| 35 to 44 Years | 21 (10.3%) | 21 (10.4%) |
| 45 to 54 Years | 0 (0.0%) | 0 (0.0%) |
| 55 to 64 Years | 0 (0.0%) | 0 (0.0%) |
| 65 to 74 Years | 0 (0.0%) | 0 (0.0%) |
| 75 Years and over | 0 (0.0%) | 29 (85.3%) |
| Total | 32 (2.9%) | 181 (16.2%) |
Income Above Poverty by Sex and Age in Elk Creek
According to the poverty statistics in Elk Creek, males aged under 5 years and females aged 5 years are the age groups that are most secure financially, with 100.0% of males and 100.0% of females in these age groups living above the poverty line.
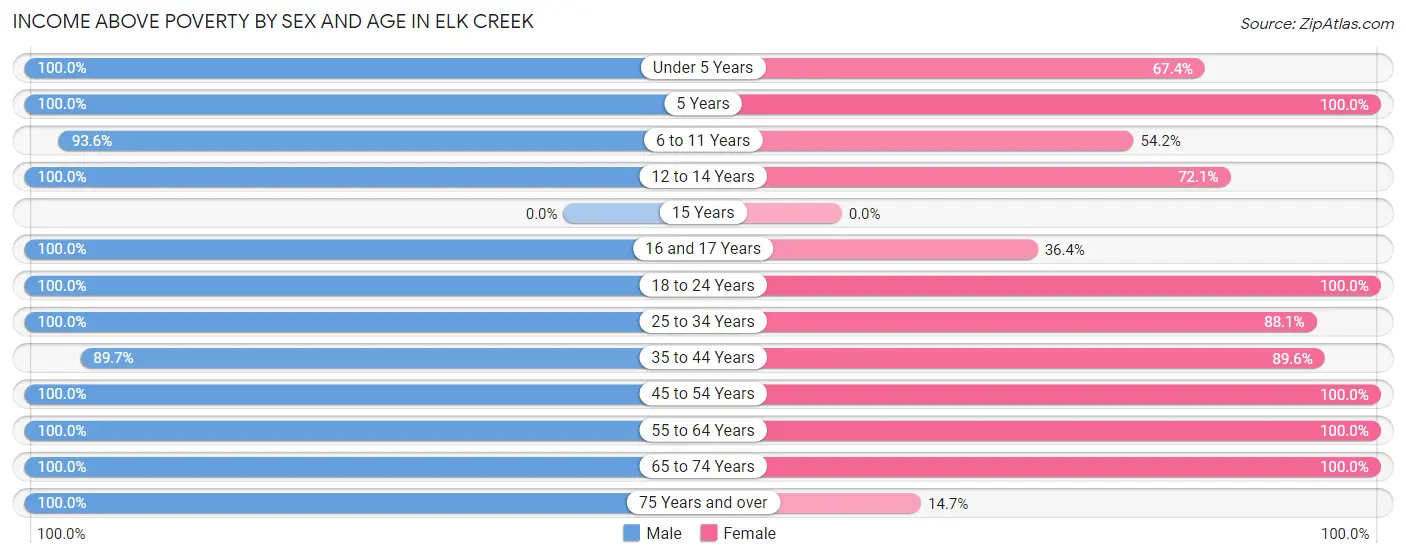
| Age Bracket | Male | Female |
| Under 5 Years | 75 (100.0%) | 62 (67.4%) |
| 5 Years | 64 (100.0%) | 13 (100.0%) |
| 6 to 11 Years | 162 (93.6%) | 26 (54.2%) |
| 12 to 14 Years | 27 (100.0%) | 31 (72.1%) |
| 15 Years | 0 (0.0%) | 0 (0.0%) |
| 16 and 17 Years | 6 (100.0%) | 16 (36.4%) |
| 18 to 24 Years | 85 (100.0%) | 81 (100.0%) |
| 25 to 34 Years | 68 (100.0%) | 192 (88.1%) |
| 35 to 44 Years | 182 (89.7%) | 181 (89.6%) |
| 45 to 54 Years | 151 (100.0%) | 105 (100.0%) |
| 55 to 64 Years | 114 (100.0%) | 93 (100.0%) |
| 65 to 74 Years | 82 (100.0%) | 130 (100.0%) |
| 75 Years and over | 37 (100.0%) | 5 (14.7%) |
| Total | 1,053 (97.1%) | 935 (83.8%) |
Income Below Poverty Among Married-Couple Families in Elk Creek
The poverty statistics for married-couple families in Elk Creek show that 4.1% or 22 of the total 543 families live below the poverty line. Families with 5 or more children have the highest poverty rate of 100.0%, comprising of 12 families. On the other hand, families with no children have the lowest poverty rate of 0.0%, which includes 0 families.
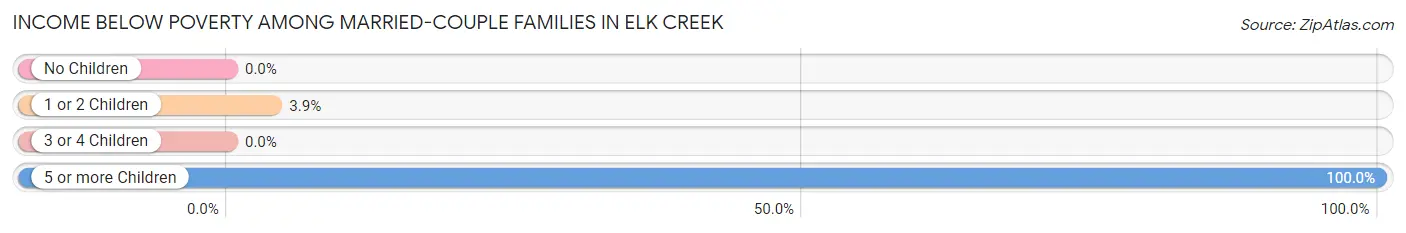
| Children | Above Poverty | Below Poverty |
| No Children | 227 (100.0%) | 0 (0.0%) |
| 1 or 2 Children | 249 (96.1%) | 10 (3.9%) |
| 3 or 4 Children | 45 (100.0%) | 0 (0.0%) |
| 5 or more Children | 0 (0.0%) | 12 (100.0%) |
| Total | 521 (96.0%) | 22 (4.1%) |
Income Below Poverty Among Single-Parent Households in Elk Creek
| Children | Single Father | Single Mother |
| No Children | 0 (0.0%) | 0 (0.0%) |
| 1 or 2 Children | 0 (0.0%) | 0 (0.0%) |
| 3 or 4 Children | 0 (0.0%) | 0 (0.0%) |
| 5 or more Children | 0 (0.0%) | 0 (0.0%) |
| Total | 0 (0.0%) | 0 (0.0%) |
Income Below Poverty Among Married-Couple vs Single-Parent Households in Elk Creek
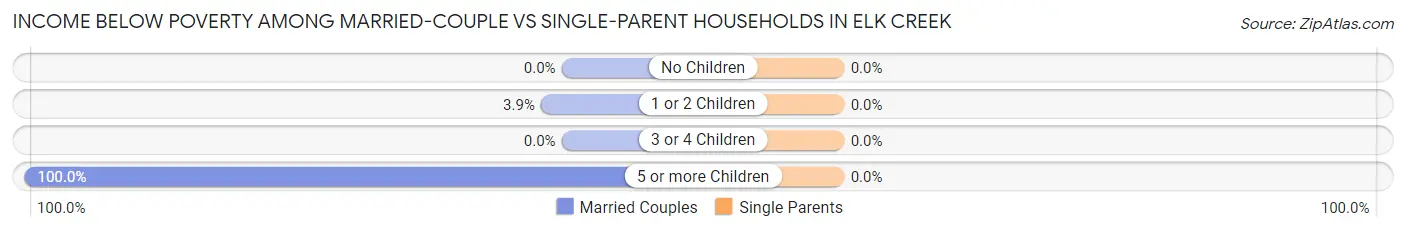
| Children | Married-Couple Families | Single-Parent Households |
| No Children | 0 (0.0%) | 0 (0.0%) |
| 1 or 2 Children | 10 (3.9%) | 0 (0.0%) |
| 3 or 4 Children | 0 (0.0%) | 0 (0.0%) |
| 5 or more Children | 12 (100.0%) | 0 (0.0%) |
| Total | 22 (4.1%) | 0 (0.0%) |
Race in Elk Creek
The most populous races in Elk Creek are White / Caucasian (2,158 | 94.0%), Some other Race (52 | 2.3%), and Two or more Races (49 | 2.1%).
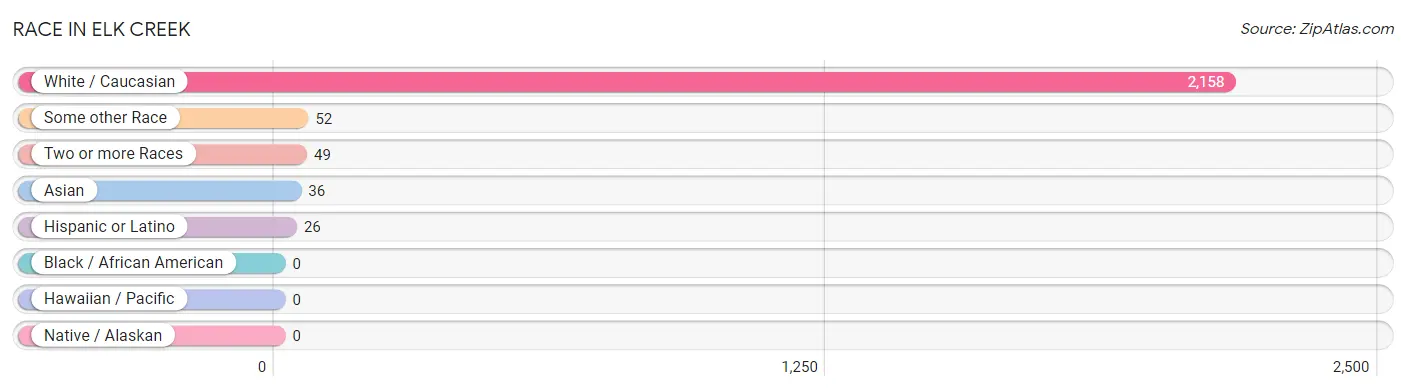
| Race | # Population | % Population |
| Asian | 36 | 1.6% |
| Black / African American | 0 | 0.0% |
| Hawaiian / Pacific | 0 | 0.0% |
| Hispanic or Latino | 26 | 1.1% |
| Native / Alaskan | 0 | 0.0% |
| White / Caucasian | 2,158 | 94.0% |
| Two or more Races | 49 | 2.1% |
| Some other Race | 52 | 2.3% |
| Total | 2,295 | 100.0% |
Ancestry in Elk Creek
The most populous ancestries reported in Elk Creek are German (367 | 16.0%), English (363 | 15.8%), Irish (223 | 9.7%), American (200 | 8.7%), and Italian (117 | 5.1%), together accounting for 55.3% of all Elk Creek residents.
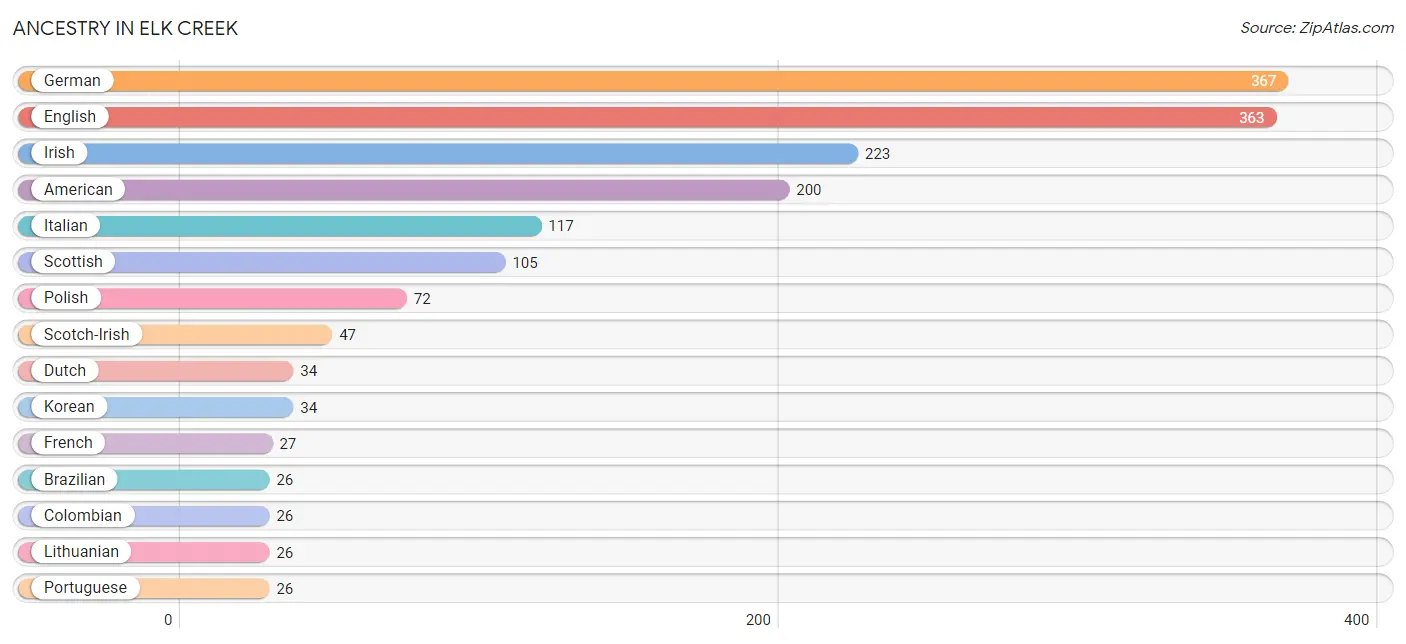
| Ancestry | # Population | % Population |
| American | 200 | 8.7% |
| Brazilian | 26 | 1.1% |
| Cherokee | 5 | 0.2% |
| Colombian | 26 | 1.1% |
| Dutch | 34 | 1.5% |
| English | 363 | 15.8% |
| European | 20 | 0.9% |
| French | 27 | 1.2% |
| German | 367 | 16.0% |
| Greek | 11 | 0.5% |
| Irish | 223 | 9.7% |
| Italian | 117 | 5.1% |
| Korean | 34 | 1.5% |
| Lithuanian | 26 | 1.1% |
| Polish | 72 | 3.1% |
| Portuguese | 26 | 1.1% |
| Scotch-Irish | 47 | 2.1% |
| Scottish | 105 | 4.6% |
| South American | 26 | 1.1% |
| Swiss | 12 | 0.5% |
| Thai | 10 | 0.4% | View All 21 Rows |
Immigrants in Elk Creek
The most numerous immigrant groups reported in Elk Creek came from Latin America (52 | 2.3%), South America (52 | 2.3%), Asia (36 | 1.6%), Brazil (26 | 1.1%), and Colombia (26 | 1.1%), together accounting for 8.4% of all Elk Creek residents.
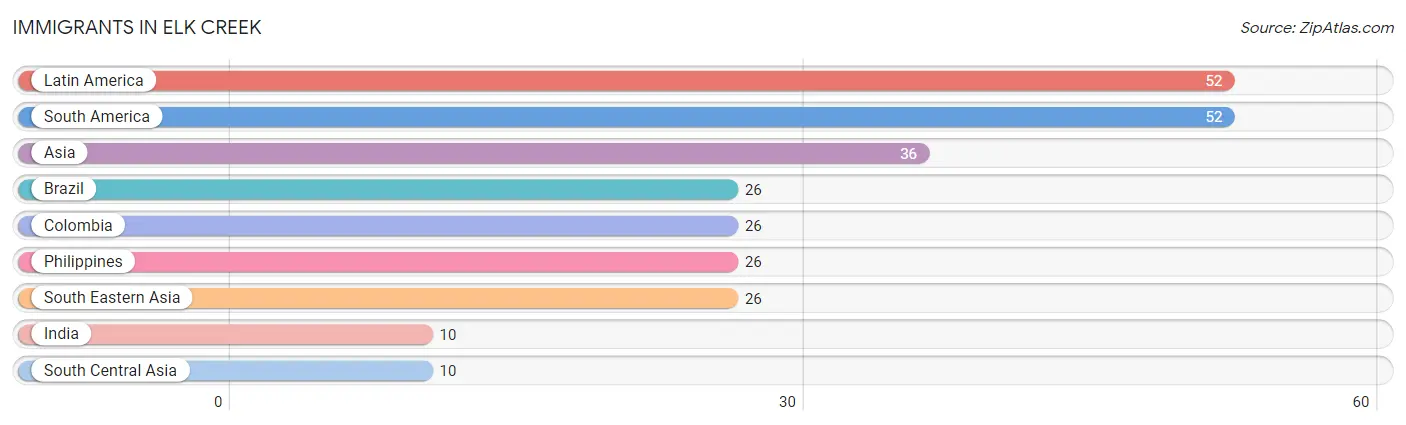
| Immigration Origin | # Population | % Population |
| Asia | 36 | 1.6% |
| Brazil | 26 | 1.1% |
| Colombia | 26 | 1.1% |
| India | 10 | 0.4% |
| Latin America | 52 | 2.3% |
| Philippines | 26 | 1.1% |
| South America | 52 | 2.3% |
| South Central Asia | 10 | 0.4% |
| South Eastern Asia | 26 | 1.1% | View All 9 Rows |
Sex and Age in Elk Creek
Sex and Age in Elk Creek
The most populous age groups in Elk Creek are 5 to 9 Years (184 | 16.4%) for men and 35 to 39 Years (163 | 13.9%) for women.
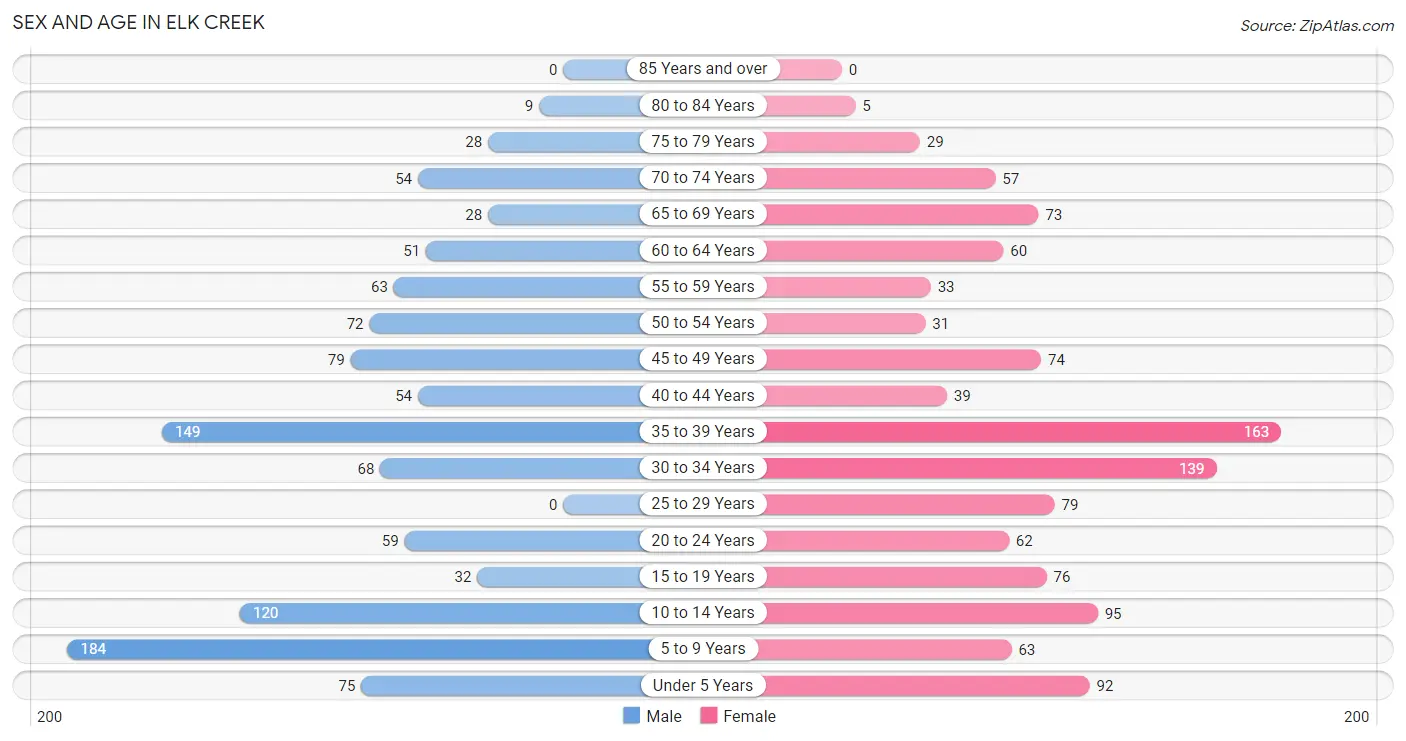
| Age Bracket | Male | Female |
| Under 5 Years | 75 (6.7%) | 92 (7.9%) |
| 5 to 9 Years | 184 (16.4%) | 63 (5.4%) |
| 10 to 14 Years | 120 (10.7%) | 95 (8.1%) |
| 15 to 19 Years | 32 (2.8%) | 76 (6.5%) |
| 20 to 24 Years | 59 (5.2%) | 62 (5.3%) |
| 25 to 29 Years | 0 (0.0%) | 79 (6.8%) |
| 30 to 34 Years | 68 (6.0%) | 139 (11.9%) |
| 35 to 39 Years | 149 (13.2%) | 163 (13.9%) |
| 40 to 44 Years | 54 (4.8%) | 39 (3.3%) |
| 45 to 49 Years | 79 (7.0%) | 74 (6.3%) |
| 50 to 54 Years | 72 (6.4%) | 31 (2.6%) |
| 55 to 59 Years | 63 (5.6%) | 33 (2.8%) |
| 60 to 64 Years | 51 (4.5%) | 60 (5.1%) |
| 65 to 69 Years | 28 (2.5%) | 73 (6.2%) |
| 70 to 74 Years | 54 (4.8%) | 57 (4.9%) |
| 75 to 79 Years | 28 (2.5%) | 29 (2.5%) |
| 80 to 84 Years | 9 (0.8%) | 5 (0.4%) |
| 85 Years and over | 0 (0.0%) | 0 (0.0%) |
| Total | 1,125 (100.0%) | 1,170 (100.0%) |
Families and Households in Elk Creek
Median Family Size in Elk Creek
The median family size in Elk Creek is 3.47 persons per family, with single female/mother families (8 | 1.4%) accounting for the largest median family size of 3.63 persons per family. On the other hand, single male/father families (30 | 5.2%) represent the smallest median family size with 2.00 persons per family.
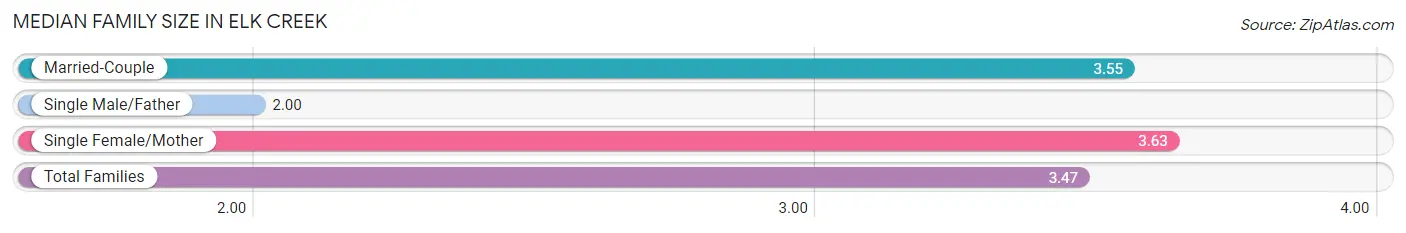
| Family Type | # Families | Family Size |
| Married-Couple | 543 (93.5%) | 3.55 |
| Single Male/Father | 30 (5.2%) | 2.00 |
| Single Female/Mother | 8 (1.4%) | 3.63 |
| Total Families | 581 (100.0%) | 3.47 |
Median Household Size in Elk Creek
The median household size in Elk Creek is 3.38 persons per household, with single female/mother households (8 | 1.2%) accounting for the largest median household size of 4.5 persons per household. single male/father households (30 | 4.4%) represent the smallest median household size with 2.00 persons per household.
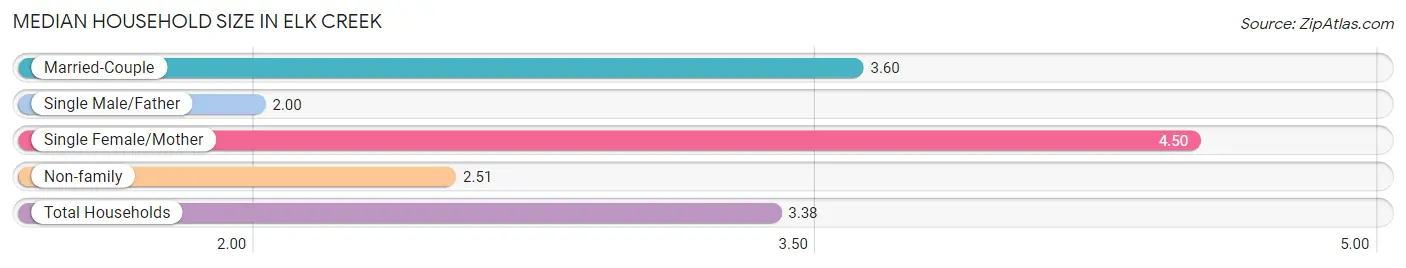
| Household Type | # Households | Household Size |
| Married-Couple | 543 (80.0%) | 3.60 |
| Single Male/Father | 30 (4.4%) | 2.00 |
| Single Female/Mother | 8 (1.2%) | 4.50 |
| Non-family | 98 (14.4%) | 2.51 |
| Total Households | 679 (100.0%) | 3.38 |
Household Size by Marriage Status in Elk Creek
Out of a total of 679 households in Elk Creek, 581 (85.6%) are family households, while 98 (14.4%) are nonfamily households. The most numerous type of family households are 2-person households, comprising 215, and the most common type of nonfamily households are 1-person households, comprising 63.
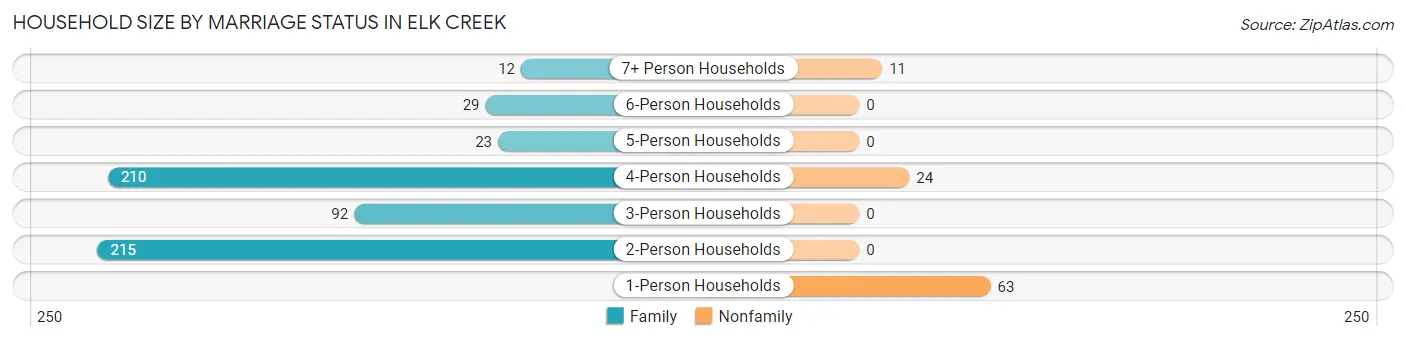
| Household Size | Family Households | Nonfamily Households |
| 1-Person Households | - | 63 (9.3%) |
| 2-Person Households | 215 (31.7%) | 0 (0.0%) |
| 3-Person Households | 92 (13.6%) | 0 (0.0%) |
| 4-Person Households | 210 (30.9%) | 24 (3.5%) |
| 5-Person Households | 23 (3.4%) | 0 (0.0%) |
| 6-Person Households | 29 (4.3%) | 0 (0.0%) |
| 7+ Person Households | 12 (1.8%) | 11 (1.6%) |
| Total | 581 (85.6%) | 98 (14.4%) |
Female Fertility in Elk Creek
Fertility by Age in Elk Creek
| Age Bracket | Women with Births | Births / 1,000 Women |
| 15 to 19 years | 0 (0.0%) | 0.0 |
| 20 to 34 years | 0 (0.0%) | 0.0 |
| 35 to 50 years | 0 (0.0%) | 0.0 |
| Total | 0 (0.0%) | 0.0 |
Fertility by Age by Marriage Status in Elk Creek
| Age Bracket | Married | Unmarried |
| 15 to 19 years | 0 (0.0%) | 0 (0.0%) |
| 20 to 34 years | 0 (0.0%) | 0 (0.0%) |
| 35 to 50 years | 0 (0.0%) | 0 (0.0%) |
| Total | 0 (0.0%) | 0 (0.0%) |
Fertility by Education in Elk Creek
| Educational Attainment | Women with Births | Births / 1,000 Women |
| Less than High School | 0 (0.0%) | 0.0 |
| High School Diploma | 0 (0.0%) | 0.0 |
| College or Associate's Degree | 0 (0.0%) | 0.0 |
| Bachelor's Degree | 0 (0.0%) | 0.0 |
| Graduate Degree | 0 (0.0%) | 0.0 |
| Total | 0 (0.0%) | 0.0 |
Fertility by Education by Marriage Status in Elk Creek
| Educational Attainment | Married | Unmarried |
| Less than High School | 0 (0.0%) | 0 (0.0%) |
| High School Diploma | 0 (0.0%) | 0 (0.0%) |
| College or Associate's Degree | 0 (0.0%) | 0 (0.0%) |
| Bachelor's Degree | 0 (0.0%) | 0 (0.0%) |
| Graduate Degree | 0 (0.0%) | 0 (0.0%) |
| Total | 0 (0.0%) | 0 (0.0%) |
Employment Characteristics in Elk Creek
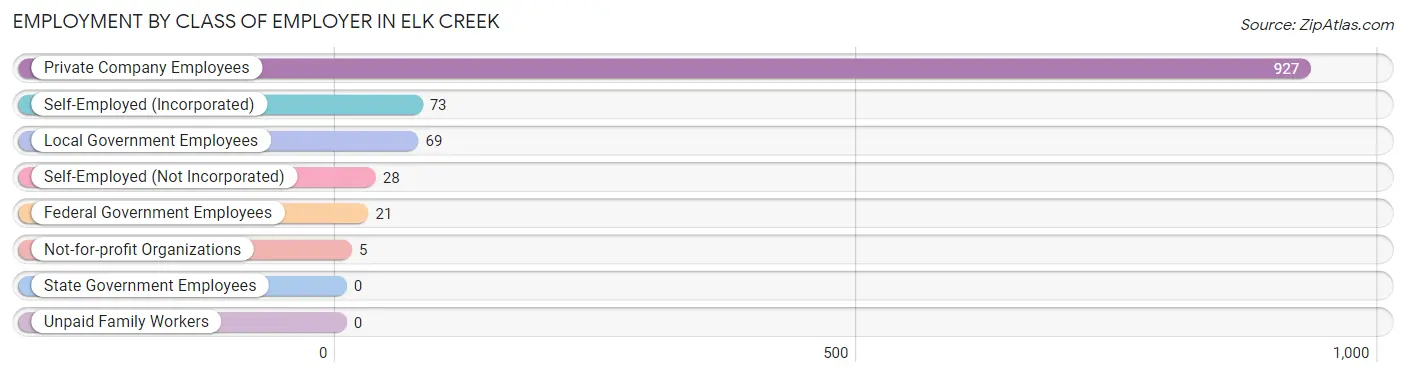
Employment by Class of Employer in Elk Creek
Among the 1,123 employed individuals in Elk Creek, private company employees (927 | 82.6%), self-employed (incorporated) (73 | 6.5%), and local government employees (69 | 6.1%) make up the most common classes of employment.
| Employer Class | # Employees | % Employees |
| Private Company Employees | 927 | 82.6% |
| Self-Employed (Incorporated) | 73 | 6.5% |
| Self-Employed (Not Incorporated) | 28 | 2.5% |
| Not-for-profit Organizations | 5 | 0.4% |
| Local Government Employees | 69 | 6.1% |
| State Government Employees | 0 | 0.0% |
| Federal Government Employees | 21 | 1.9% |
| Unpaid Family Workers | 0 | 0.0% |
| Total | 1,123 | 100.0% |
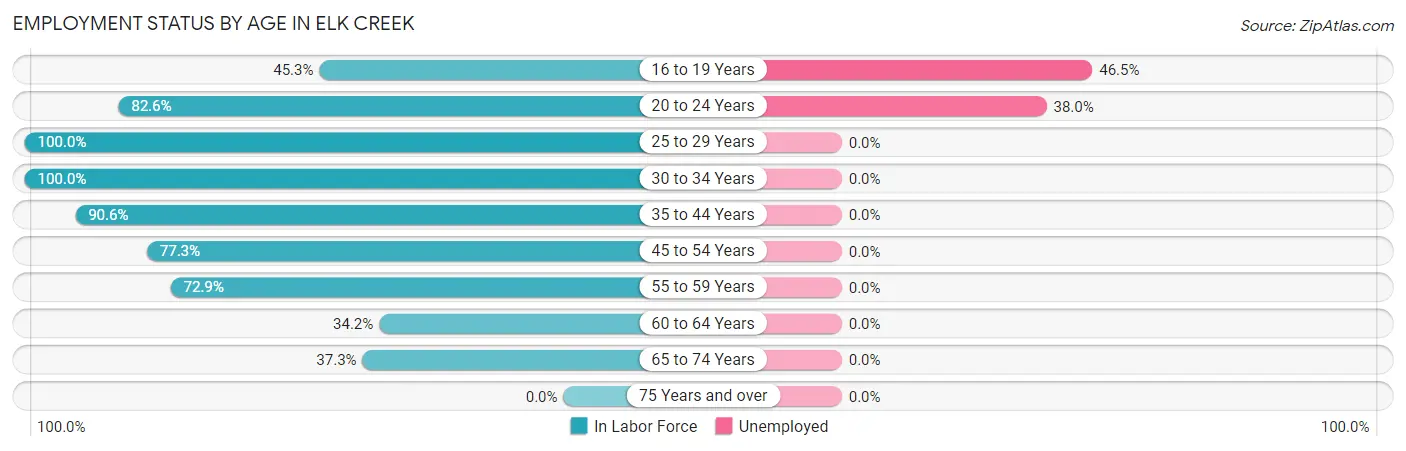
Employment Status by Age in Elk Creek
According to the labor force statistics for Elk Creek, out of the total population over 16 years of age (1,653), 71.4% or 1,180 individuals are in the labor force, with 4.9% or 58 of them unemployed. The age group with the highest labor force participation rate is 25 to 29 years, with 100.0% or 79 individuals in the labor force. Within the labor force, the 16 to 19 years age range has the highest percentage of unemployed individuals, with 46.5% or 20 of them being unemployed.
| Age Bracket | In Labor Force | Unemployed |
| 16 to 19 Years | 43 (45.3%) | 20 (46.5%) |
| 20 to 24 Years | 100 (82.6%) | 38 (38.0%) |
| 25 to 29 Years | 79 (100.0%) | 0 (0.0%) |
| 30 to 34 Years | 207 (100.0%) | 0 (0.0%) |
| 35 to 44 Years | 367 (90.6%) | 0 (0.0%) |
| 45 to 54 Years | 198 (77.3%) | 0 (0.0%) |
| 55 to 59 Years | 70 (72.9%) | 0 (0.0%) |
| 60 to 64 Years | 38 (34.2%) | 0 (0.0%) |
| 65 to 74 Years | 79 (37.3%) | 0 (0.0%) |
| 75 Years and over | 0 (0.0%) | 0 (0.0%) |
| Total | 1,180 (71.4%) | 58 (4.9%) |
Employment Status by Educational Attainment in Elk Creek
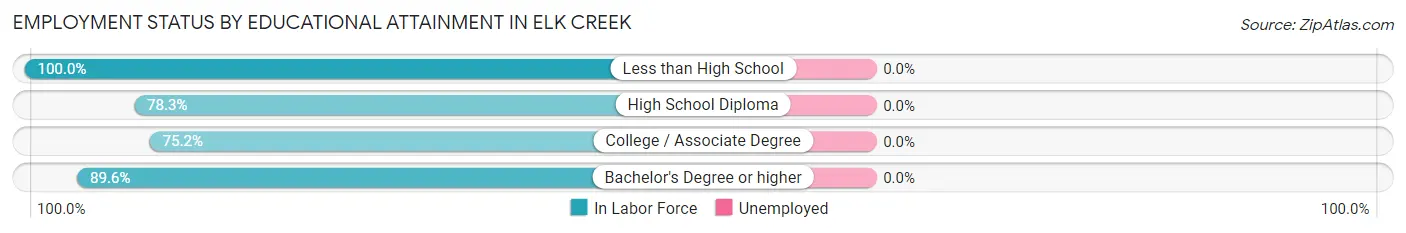
| Educational Attainment | In Labor Force | Unemployed |
| Less than High School | 56 (100.0%) | 0 (0.0%) |
| High School Diploma | 144 (78.3%) | 0 (0.0%) |
| College / Associate Degree | 312 (75.2%) | 0 (0.0%) |
| Bachelor's Degree or higher | 447 (89.6%) | 0 (0.0%) |
| Total | 959 (83.1%) | 0 (0.0%) |
Employment Occupations by Sex in Elk Creek
Management, Business, Science and Arts Occupations
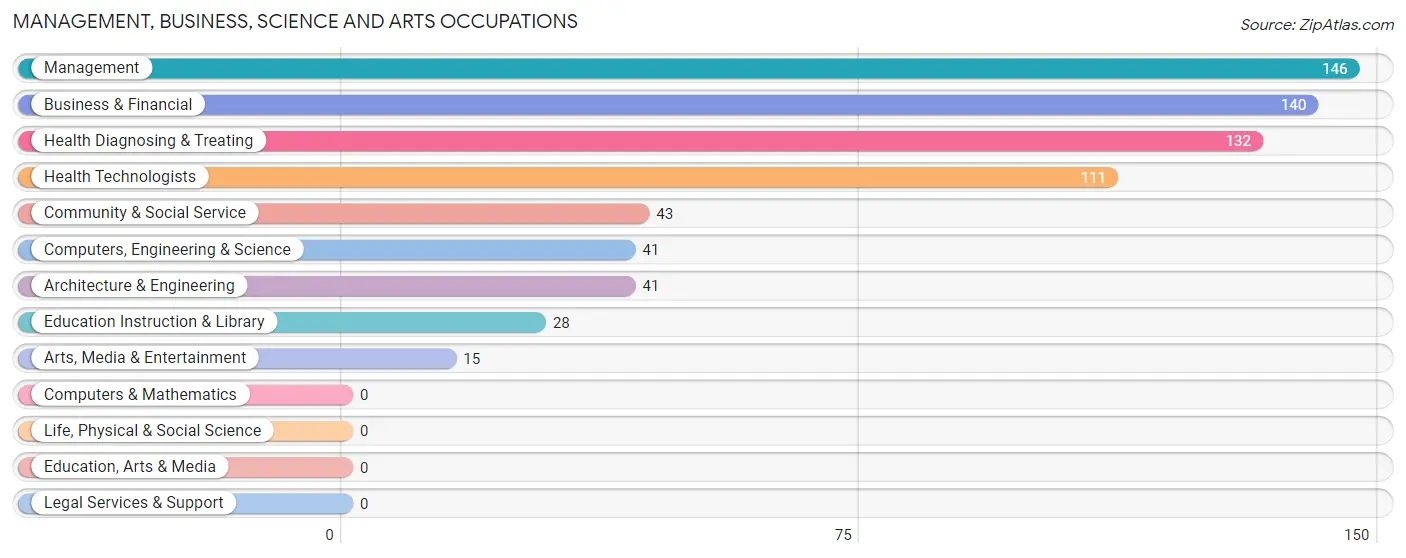
The most common Management, Business, Science and Arts occupations in Elk Creek are Management (146 | 13.0%), Business & Financial (140 | 12.5%), Health Diagnosing & Treating (132 | 11.7%), Health Technologists (111 | 9.9%), and Community & Social Service (43 | 3.8%).
Management, Business, Science and Arts Occupations by Sex
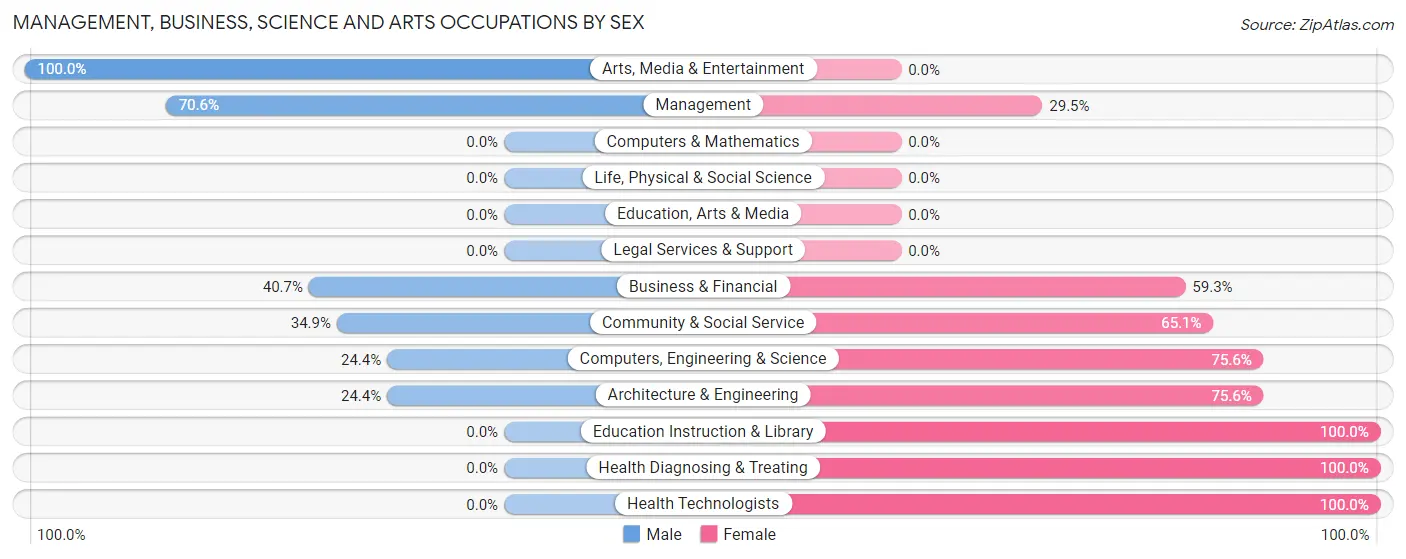
Within the Management, Business, Science and Arts occupations in Elk Creek, the most male-oriented occupations are Arts, Media & Entertainment (100.0%), Management (70.6%), and Business & Financial (40.7%), while the most female-oriented occupations are Education Instruction & Library (100.0%), Health Diagnosing & Treating (100.0%), and Health Technologists (100.0%).
| Occupation | Male | Female |
| Management | 103 (70.6%) | 43 (29.4%) |
| Business & Financial | 57 (40.7%) | 83 (59.3%) |
| Computers, Engineering & Science | 10 (24.4%) | 31 (75.6%) |
| Computers & Mathematics | 0 (0.0%) | 0 (0.0%) |
| Architecture & Engineering | 10 (24.4%) | 31 (75.6%) |
| Life, Physical & Social Science | 0 (0.0%) | 0 (0.0%) |
| Community & Social Service | 15 (34.9%) | 28 (65.1%) |
| Education, Arts & Media | 0 (0.0%) | 0 (0.0%) |
| Legal Services & Support | 0 (0.0%) | 0 (0.0%) |
| Education Instruction & Library | 0 (0.0%) | 28 (100.0%) |
| Arts, Media & Entertainment | 15 (100.0%) | 0 (0.0%) |
| Health Diagnosing & Treating | 0 (0.0%) | 132 (100.0%) |
| Health Technologists | 0 (0.0%) | 111 (100.0%) |
| Total (Category) | 185 (36.8%) | 317 (63.1%) |
| Total (Overall) | 547 (48.7%) | 576 (51.3%) |
Services Occupations
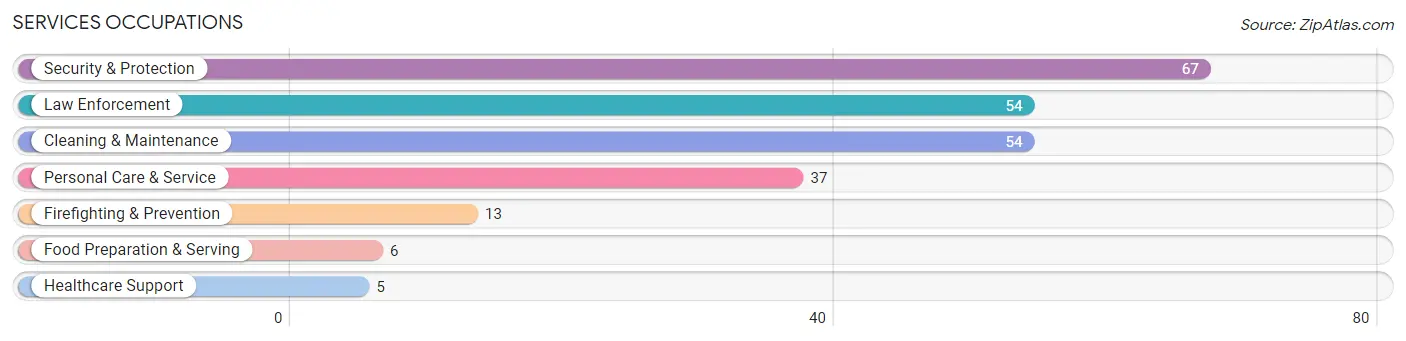
The most common Services occupations in Elk Creek are Security & Protection (67 | 6.0%), Law Enforcement (54 | 4.8%), Cleaning & Maintenance (54 | 4.8%), Personal Care & Service (37 | 3.3%), and Firefighting & Prevention (13 | 1.2%).
Services Occupations by Sex
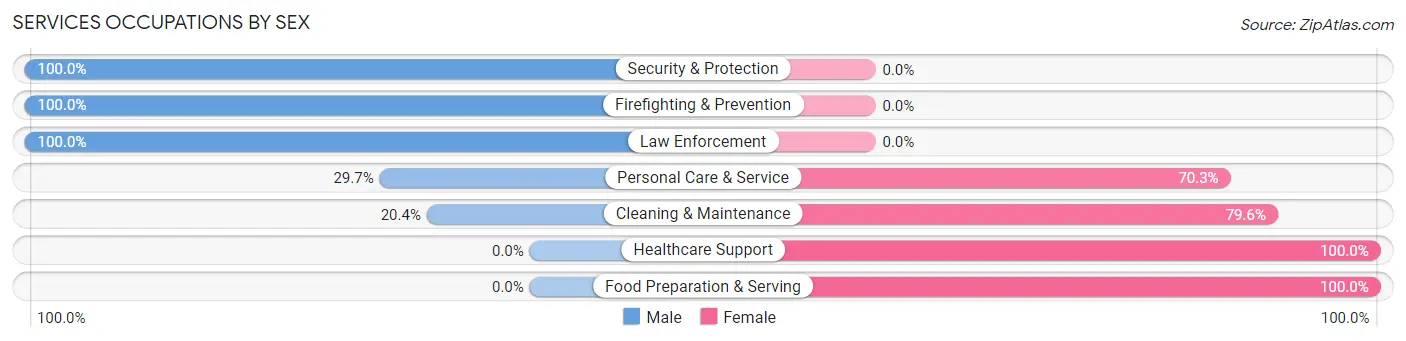
Within the Services occupations in Elk Creek, the most male-oriented occupations are Security & Protection (100.0%), Firefighting & Prevention (100.0%), and Law Enforcement (100.0%), while the most female-oriented occupations are Healthcare Support (100.0%), Food Preparation & Serving (100.0%), and Cleaning & Maintenance (79.6%).
| Occupation | Male | Female |
| Healthcare Support | 0 (0.0%) | 5 (100.0%) |
| Security & Protection | 67 (100.0%) | 0 (0.0%) |
| Firefighting & Prevention | 13 (100.0%) | 0 (0.0%) |
| Law Enforcement | 54 (100.0%) | 0 (0.0%) |
| Food Preparation & Serving | 0 (0.0%) | 6 (100.0%) |
| Cleaning & Maintenance | 11 (20.4%) | 43 (79.6%) |
| Personal Care & Service | 11 (29.7%) | 26 (70.3%) |
| Total (Category) | 89 (52.7%) | 80 (47.3%) |
| Total (Overall) | 547 (48.7%) | 576 (51.3%) |
Sales and Office Occupations
The most common Sales and Office occupations in Elk Creek are Office & Administration (128 | 11.4%), and Sales & Related (111 | 9.9%).

Sales and Office Occupations by Sex

| Occupation | Male | Female |
| Sales & Related | 40 (36.0%) | 71 (64.0%) |
| Office & Administration | 33 (25.8%) | 95 (74.2%) |
| Total (Category) | 73 (30.5%) | 166 (69.5%) |
| Total (Overall) | 547 (48.7%) | 576 (51.3%) |
Natural Resources, Construction and Maintenance Occupations
The most common Natural Resources, Construction and Maintenance occupations in Elk Creek are Installation, Maintenance & Repair (81 | 7.2%), and Construction & Extraction (22 | 2.0%).

Natural Resources, Construction and Maintenance Occupations by Sex
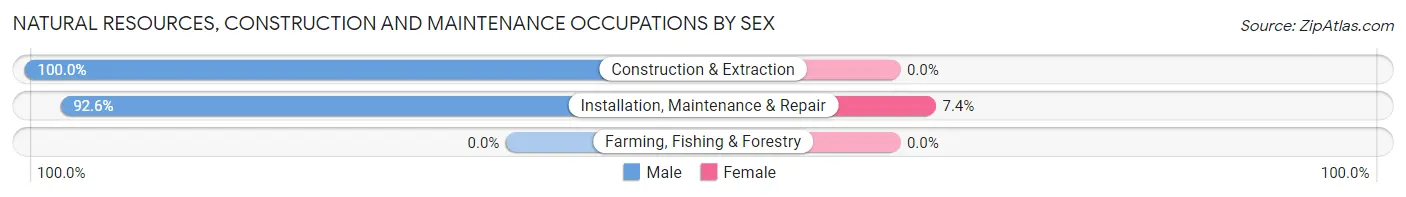
| Occupation | Male | Female |
| Farming, Fishing & Forestry | 0 (0.0%) | 0 (0.0%) |
| Construction & Extraction | 22 (100.0%) | 0 (0.0%) |
| Installation, Maintenance & Repair | 75 (92.6%) | 6 (7.4%) |
| Total (Category) | 97 (94.2%) | 6 (5.8%) |
| Total (Overall) | 547 (48.7%) | 576 (51.3%) |
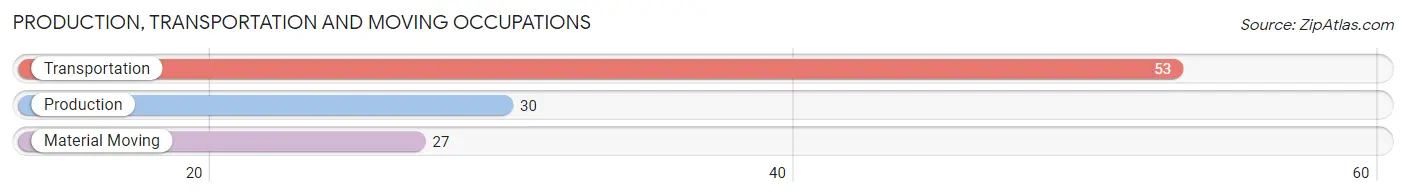
Production, Transportation and Moving Occupations
The most common Production, Transportation and Moving occupations in Elk Creek are Transportation (53 | 4.7%), Production (30 | 2.7%), and Material Moving (27 | 2.4%).
Production, Transportation and Moving Occupations by Sex
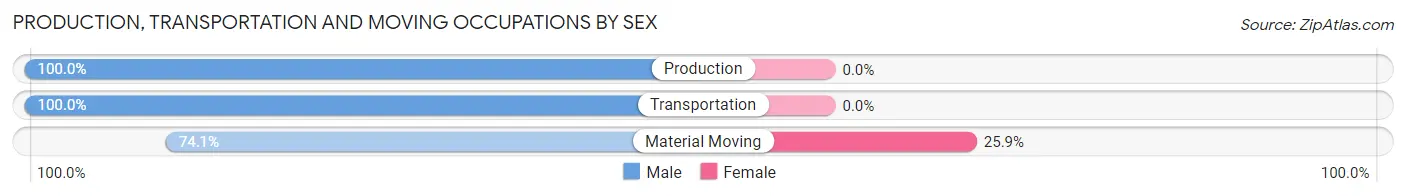
| Occupation | Male | Female |
| Production | 30 (100.0%) | 0 (0.0%) |
| Transportation | 53 (100.0%) | 0 (0.0%) |
| Material Moving | 20 (74.1%) | 7 (25.9%) |
| Total (Category) | 103 (93.6%) | 7 (6.4%) |
| Total (Overall) | 547 (48.7%) | 576 (51.3%) |
Employment Industries by Sex in Elk Creek
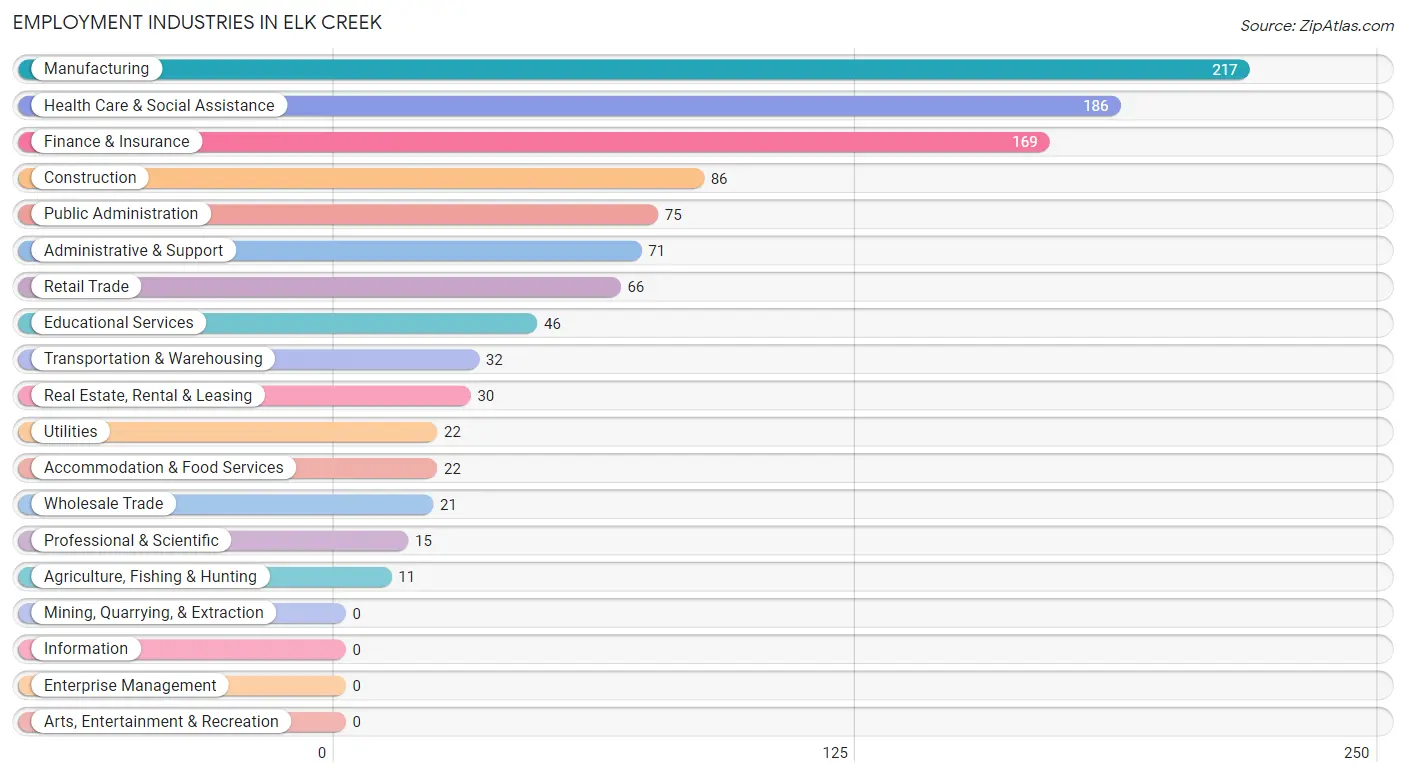
Employment Industries in Elk Creek
The major employment industries in Elk Creek include Manufacturing (217 | 19.3%), Health Care & Social Assistance (186 | 16.6%), Finance & Insurance (169 | 15.0%), Construction (86 | 7.7%), and Public Administration (75 | 6.7%).
Employment Industries by Sex in Elk Creek
The Elk Creek industries that see more men than women are Agriculture, Fishing & Hunting (100.0%), Transportation & Warehousing (100.0%), and Utilities (100.0%), whereas the industries that tend to have a higher number of women are Educational Services (100.0%), Health Care & Social Assistance (100.0%), and Accommodation & Food Services (100.0%).
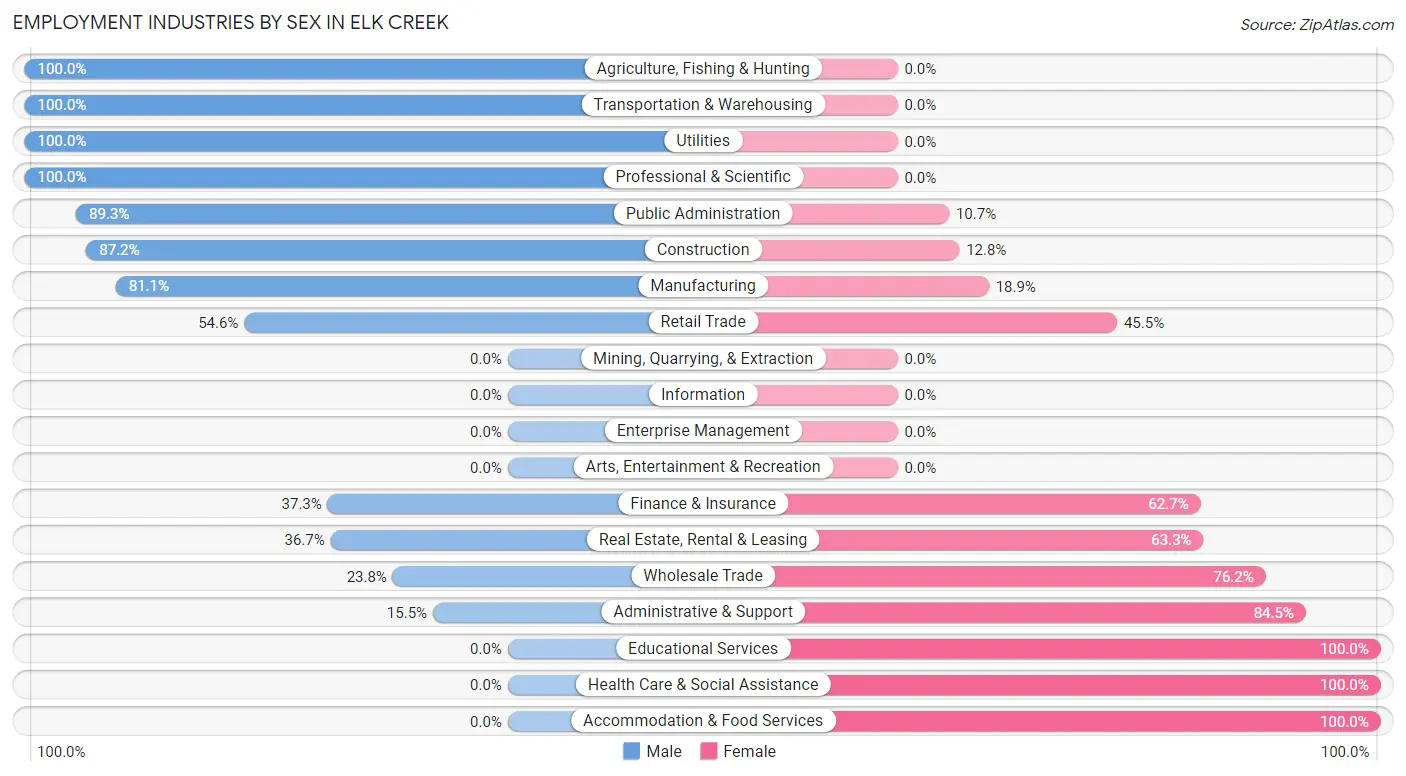
| Industry | Male | Female |
| Agriculture, Fishing & Hunting | 11 (100.0%) | 0 (0.0%) |
| Mining, Quarrying, & Extraction | 0 (0.0%) | 0 (0.0%) |
| Construction | 75 (87.2%) | 11 (12.8%) |
| Manufacturing | 176 (81.1%) | 41 (18.9%) |
| Wholesale Trade | 5 (23.8%) | 16 (76.2%) |
| Retail Trade | 36 (54.5%) | 30 (45.5%) |
| Transportation & Warehousing | 32 (100.0%) | 0 (0.0%) |
| Utilities | 22 (100.0%) | 0 (0.0%) |
| Information | 0 (0.0%) | 0 (0.0%) |
| Finance & Insurance | 63 (37.3%) | 106 (62.7%) |
| Real Estate, Rental & Leasing | 11 (36.7%) | 19 (63.3%) |
| Professional & Scientific | 15 (100.0%) | 0 (0.0%) |
| Enterprise Management | 0 (0.0%) | 0 (0.0%) |
| Administrative & Support | 11 (15.5%) | 60 (84.5%) |
| Educational Services | 0 (0.0%) | 46 (100.0%) |
| Health Care & Social Assistance | 0 (0.0%) | 186 (100.0%) |
| Arts, Entertainment & Recreation | 0 (0.0%) | 0 (0.0%) |
| Accommodation & Food Services | 0 (0.0%) | 22 (100.0%) |
| Public Administration | 67 (89.3%) | 8 (10.7%) |
| Total | 547 (48.7%) | 576 (51.3%) |
Education in Elk Creek
School Enrollment in Elk Creek
The most common levels of schooling among the 652 students in Elk Creek are elementary school (160 | 24.5%), middle school (143 | 21.9%), and kindergarten (103 | 15.8%).
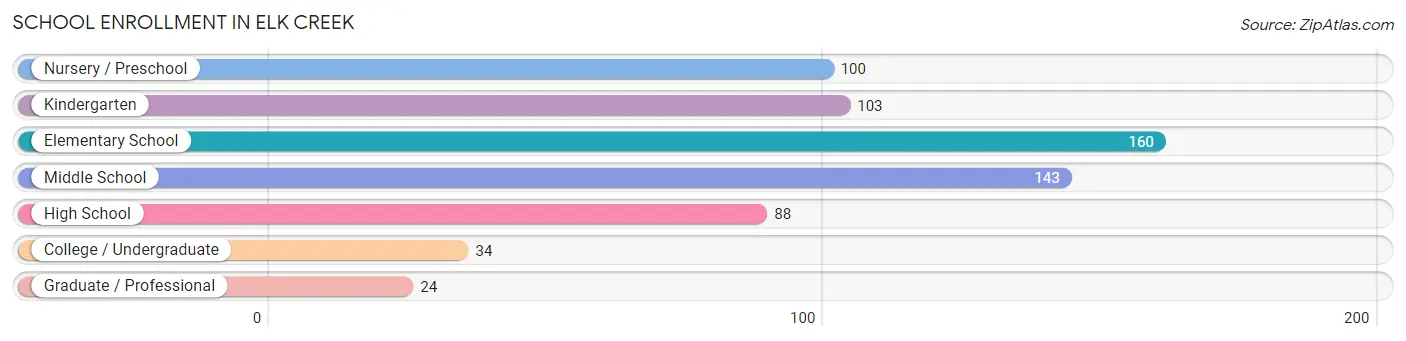
| School Level | # Students | % Students |
| Nursery / Preschool | 100 | 15.3% |
| Kindergarten | 103 | 15.8% |
| Elementary School | 160 | 24.5% |
| Middle School | 143 | 21.9% |
| High School | 88 | 13.5% |
| College / Undergraduate | 34 | 5.2% |
| Graduate / Professional | 24 | 3.7% |
| Total | 652 | 100.0% |
School Enrollment by Age by Funding Source in Elk Creek
Out of a total of 652 students who are enrolled in schools in Elk Creek, 115 (17.6%) attend a private institution, while the remaining 537 (82.4%) are enrolled in public schools. The age group of 20 to 24 year olds has the highest likelihood of being enrolled in private schools, with 19 (100.0% in the age bracket) enrolled. Conversely, the age group of 5 to 9 year old has the lowest likelihood of being enrolled in a private school, with 234 (100.0% in the age bracket) attending a public institution.
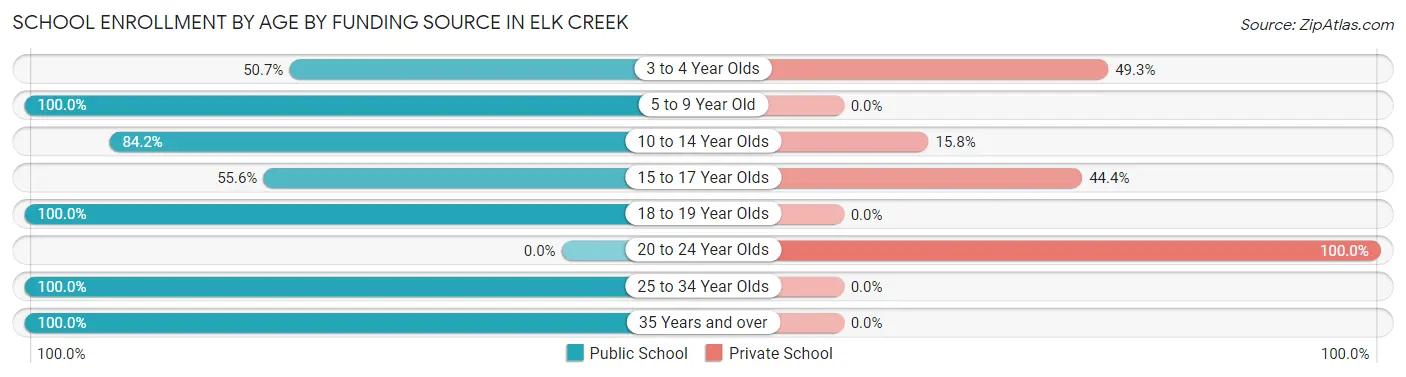
| Age Bracket | Public School | Private School |
| 3 to 4 Year Olds | 35 (50.7%) | 34 (49.3%) |
| 5 to 9 Year Old | 234 (100.0%) | 0 (0.0%) |
| 10 to 14 Year Olds | 181 (84.2%) | 34 (15.8%) |
| 15 to 17 Year Olds | 35 (55.6%) | 28 (44.4%) |
| 18 to 19 Year Olds | 19 (100.0%) | 0 (0.0%) |
| 20 to 24 Year Olds | 0 (0.0%) | 19 (100.0%) |
| 25 to 34 Year Olds | 24 (100.0%) | 0 (0.0%) |
| 35 Years and over | 9 (100.0%) | 0 (0.0%) |
| Total | 537 (82.4%) | 115 (17.6%) |
Educational Attainment by Field of Study in Elk Creek
Business (146 | 26.7%), science & technology (129 | 23.6%), arts & humanities (91 | 16.6%), engineering (56 | 10.2%), and social sciences (45 | 8.2%) are the most common fields of study among 547 individuals in Elk Creek who have obtained a bachelor's degree or higher.
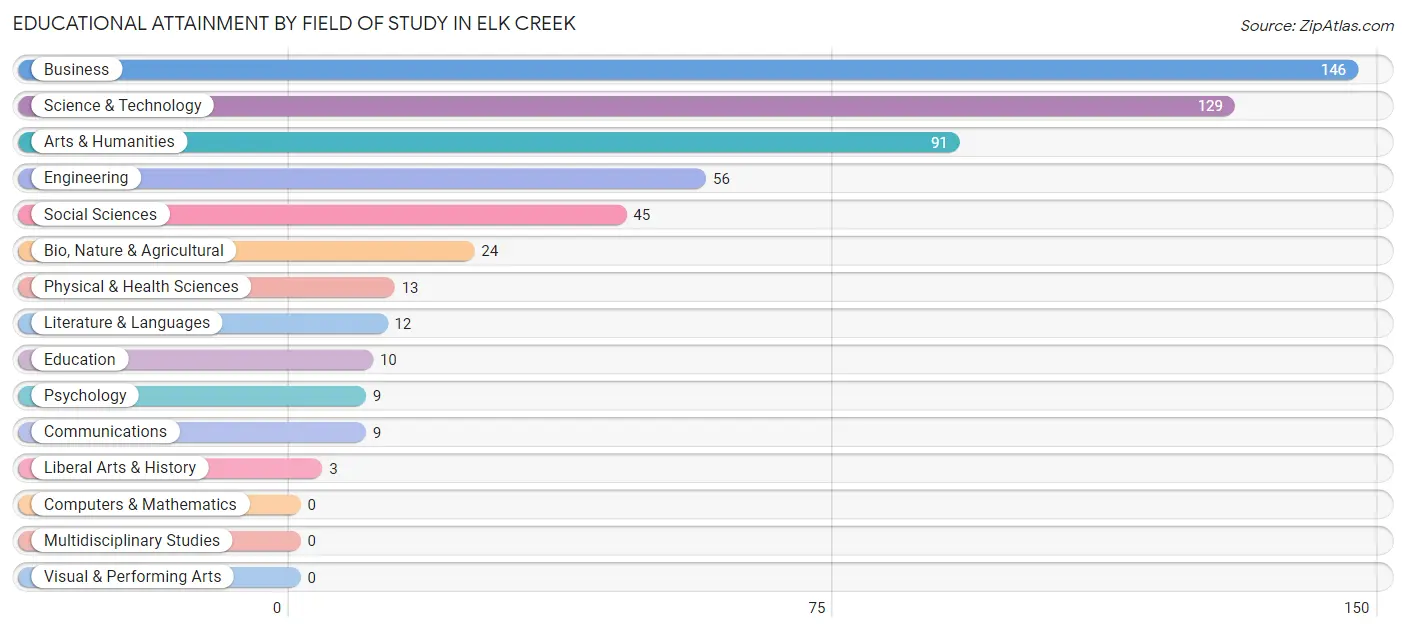
| Field of Study | # Graduates | % Graduates |
| Computers & Mathematics | 0 | 0.0% |
| Bio, Nature & Agricultural | 24 | 4.4% |
| Physical & Health Sciences | 13 | 2.4% |
| Psychology | 9 | 1.7% |
| Social Sciences | 45 | 8.2% |
| Engineering | 56 | 10.2% |
| Multidisciplinary Studies | 0 | 0.0% |
| Science & Technology | 129 | 23.6% |
| Business | 146 | 26.7% |
| Education | 10 | 1.8% |
| Literature & Languages | 12 | 2.2% |
| Liberal Arts & History | 3 | 0.5% |
| Visual & Performing Arts | 0 | 0.0% |
| Communications | 9 | 1.7% |
| Arts & Humanities | 91 | 16.6% |
| Total | 547 | 100.0% |
Transportation & Commute in Elk Creek
Vehicle Availability by Sex in Elk Creek
The most prevalent vehicle ownership categories in Elk Creek are males with 2 vehicles (253, accounting for 46.3%) and females with 2 vehicles (259, making up 43.9%).
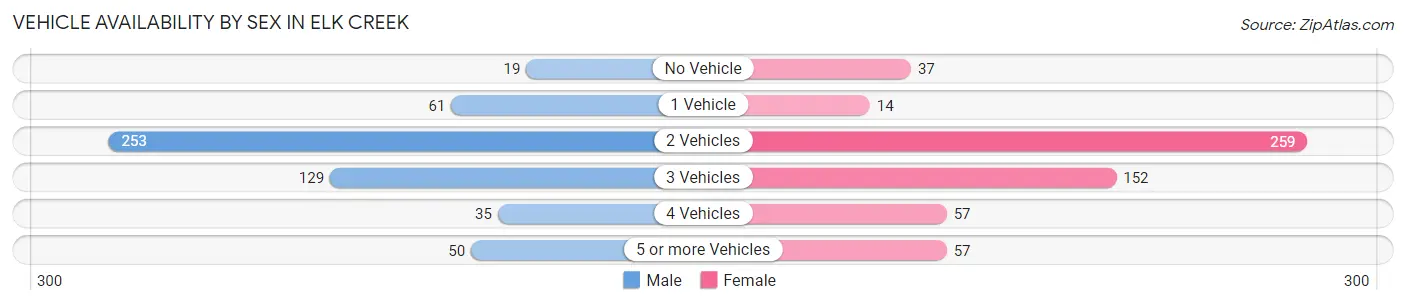
| Vehicles Available | Male | Female |
| No Vehicle | 19 (3.5%) | 37 (6.4%) |
| 1 Vehicle | 61 (11.2%) | 14 (2.4%) |
| 2 Vehicles | 253 (46.3%) | 259 (45.0%) |
| 3 Vehicles | 129 (23.6%) | 152 (26.4%) |
| 4 Vehicles | 35 (6.4%) | 57 (9.9%) |
| 5 or more Vehicles | 50 (9.1%) | 57 (9.9%) |
| Total | 547 (100.0%) | 576 (100.0%) |
Commute Time in Elk Creek
The most frequently occuring commute durations in Elk Creek are 40 to 44 minutes (185 commuters, 19.3%), 30 to 34 minutes (178 commuters, 18.6%), and 45 to 59 minutes (169 commuters, 17.6%).
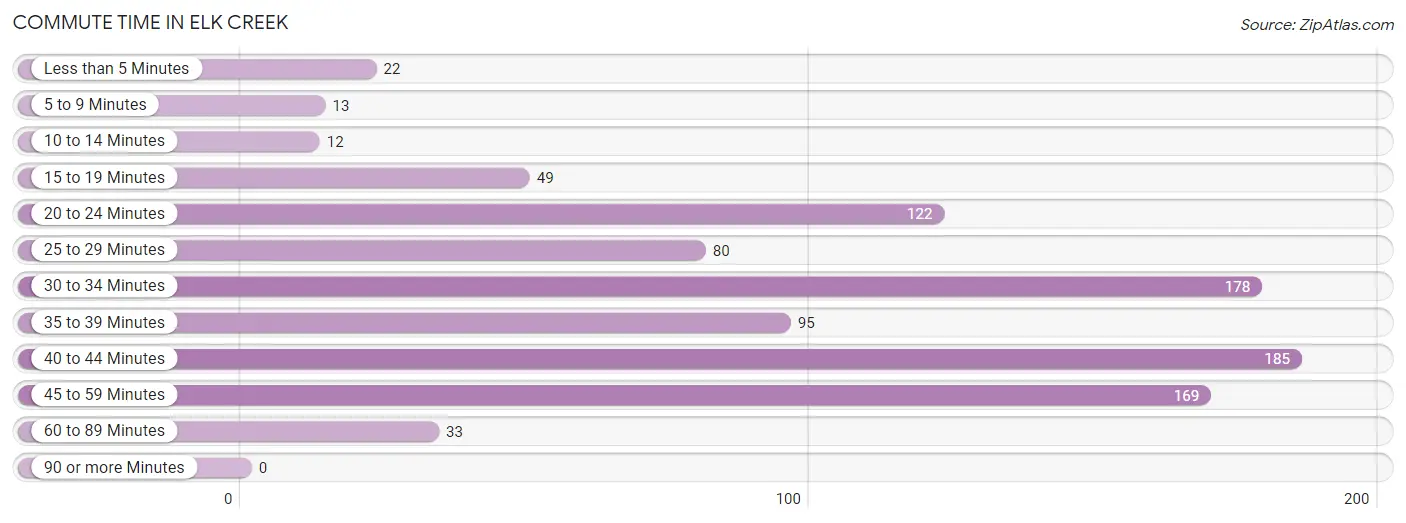
| Commute Time | # Commuters | % Commuters |
| Less than 5 Minutes | 22 | 2.3% |
| 5 to 9 Minutes | 13 | 1.4% |
| 10 to 14 Minutes | 12 | 1.3% |
| 15 to 19 Minutes | 49 | 5.1% |
| 20 to 24 Minutes | 122 | 12.7% |
| 25 to 29 Minutes | 80 | 8.4% |
| 30 to 34 Minutes | 178 | 18.6% |
| 35 to 39 Minutes | 95 | 9.9% |
| 40 to 44 Minutes | 185 | 19.3% |
| 45 to 59 Minutes | 169 | 17.6% |
| 60 to 89 Minutes | 33 | 3.4% |
| 90 or more Minutes | 0 | 0.0% |
Commute Time by Sex in Elk Creek
The most common commute times in Elk Creek are 45 to 59 minutes (84 commuters, 17.8%) for males and 40 to 44 minutes (141 commuters, 29.0%) for females.
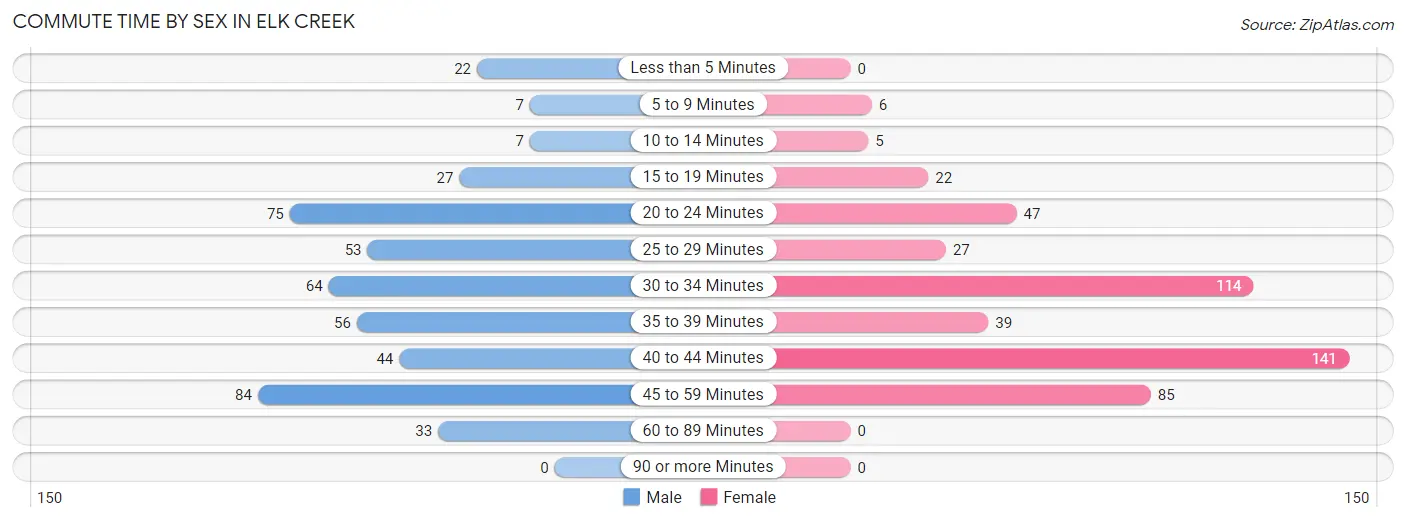
| Commute Time | Male | Female |
| Less than 5 Minutes | 22 (4.7%) | 0 (0.0%) |
| 5 to 9 Minutes | 7 (1.5%) | 6 (1.2%) |
| 10 to 14 Minutes | 7 (1.5%) | 5 (1.0%) |
| 15 to 19 Minutes | 27 (5.7%) | 22 (4.5%) |
| 20 to 24 Minutes | 75 (15.9%) | 47 (9.7%) |
| 25 to 29 Minutes | 53 (11.2%) | 27 (5.6%) |
| 30 to 34 Minutes | 64 (13.6%) | 114 (23.5%) |
| 35 to 39 Minutes | 56 (11.9%) | 39 (8.0%) |
| 40 to 44 Minutes | 44 (9.3%) | 141 (29.0%) |
| 45 to 59 Minutes | 84 (17.8%) | 85 (17.5%) |
| 60 to 89 Minutes | 33 (7.0%) | 0 (0.0%) |
| 90 or more Minutes | 0 (0.0%) | 0 (0.0%) |
Time of Departure to Work by Sex in Elk Creek
The most frequent times of departure to work in Elk Creek are 6:30 AM to 6:59 AM (78, 16.5%) for males and 7:00 AM to 7:29 AM (111, 22.8%) for females.
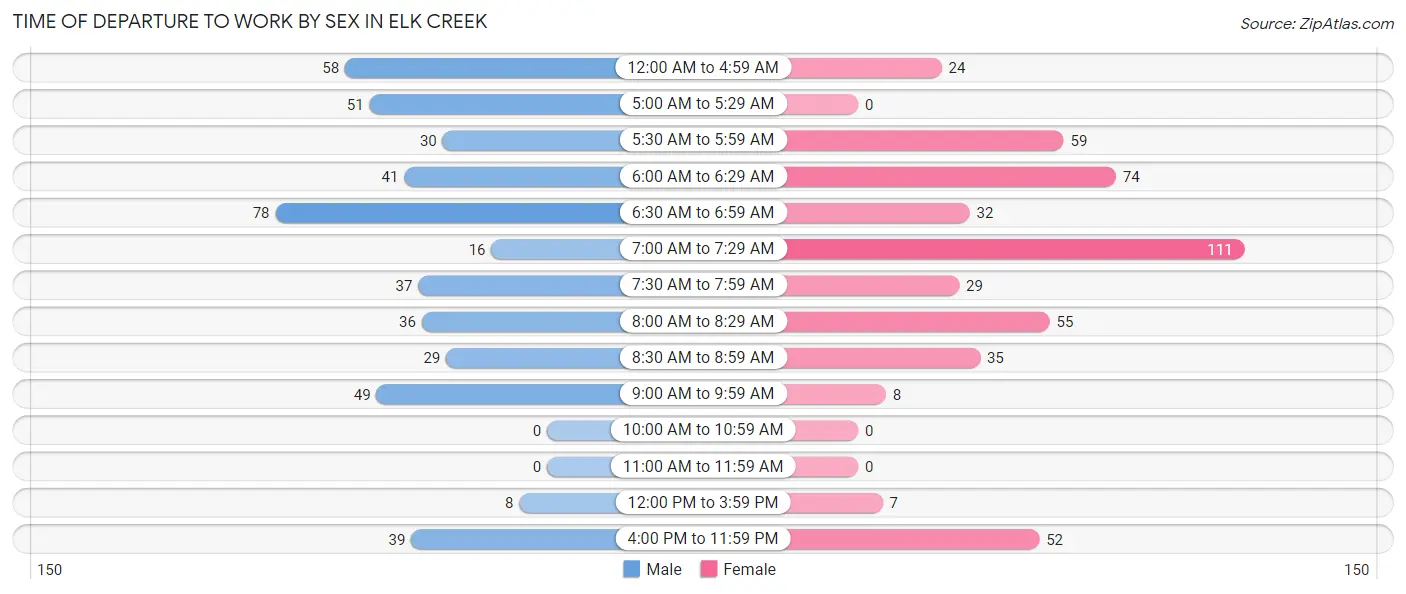
| Time of Departure | Male | Female |
| 12:00 AM to 4:59 AM | 58 (12.3%) | 24 (4.9%) |
| 5:00 AM to 5:29 AM | 51 (10.8%) | 0 (0.0%) |
| 5:30 AM to 5:59 AM | 30 (6.4%) | 59 (12.1%) |
| 6:00 AM to 6:29 AM | 41 (8.7%) | 74 (15.2%) |
| 6:30 AM to 6:59 AM | 78 (16.5%) | 32 (6.6%) |
| 7:00 AM to 7:29 AM | 16 (3.4%) | 111 (22.8%) |
| 7:30 AM to 7:59 AM | 37 (7.8%) | 29 (6.0%) |
| 8:00 AM to 8:29 AM | 36 (7.6%) | 55 (11.3%) |
| 8:30 AM to 8:59 AM | 29 (6.1%) | 35 (7.2%) |
| 9:00 AM to 9:59 AM | 49 (10.4%) | 8 (1.7%) |
| 10:00 AM to 10:59 AM | 0 (0.0%) | 0 (0.0%) |
| 11:00 AM to 11:59 AM | 0 (0.0%) | 0 (0.0%) |
| 12:00 PM to 3:59 PM | 8 (1.7%) | 7 (1.4%) |
| 4:00 PM to 11:59 PM | 39 (8.3%) | 52 (10.7%) |
| Total | 472 (100.0%) | 486 (100.0%) |
Housing Occupancy in Elk Creek
Occupancy by Ownership in Elk Creek
Of the total 679 dwellings in Elk Creek, owner-occupied units account for 661 (97.4%), while renter-occupied units make up 18 (2.6%).
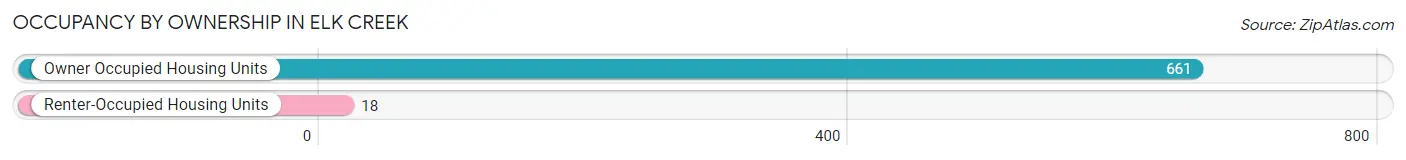
| Occupancy | # Housing Units | % Housing Units |
| Owner Occupied Housing Units | 661 | 97.4% |
| Renter-Occupied Housing Units | 18 | 2.6% |
| Total Occupied Housing Units | 679 | 100.0% |
Occupancy by Household Size in Elk Creek
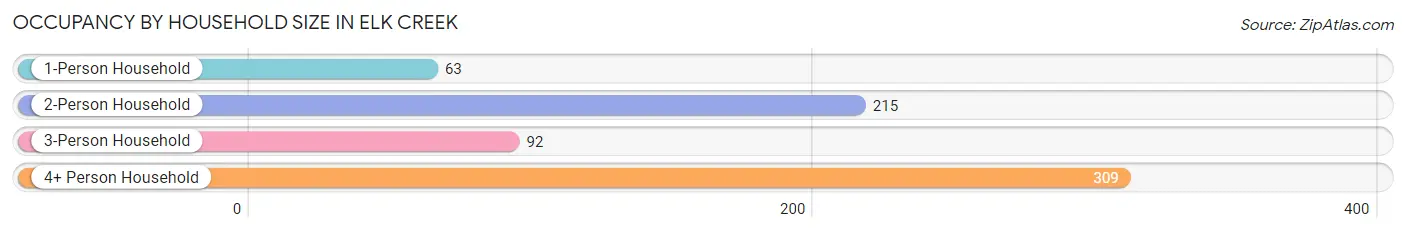
| Household Size | # Housing Units | % Housing Units |
| 1-Person Household | 63 | 9.3% |
| 2-Person Household | 215 | 31.7% |
| 3-Person Household | 92 | 13.6% |
| 4+ Person Household | 309 | 45.5% |
| Total Housing Units | 679 | 100.0% |
Occupancy by Ownership by Household Size in Elk Creek
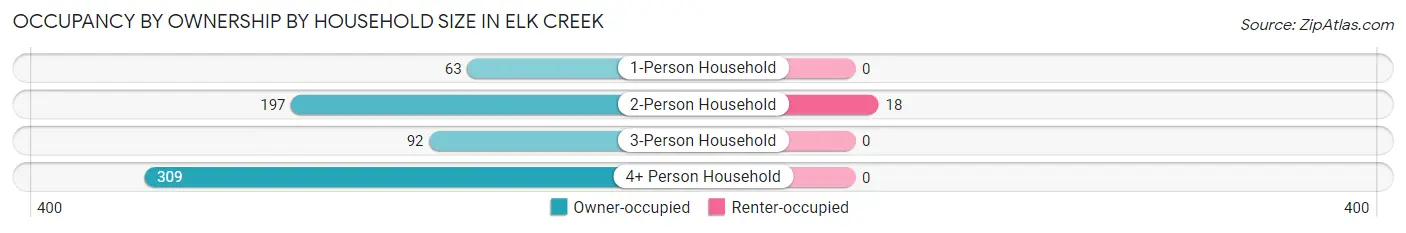
| Household Size | Owner-occupied | Renter-occupied |
| 1-Person Household | 63 (100.0%) | 0 (0.0%) |
| 2-Person Household | 197 (91.6%) | 18 (8.4%) |
| 3-Person Household | 92 (100.0%) | 0 (0.0%) |
| 4+ Person Household | 309 (100.0%) | 0 (0.0%) |
| Total Housing Units | 661 (97.4%) | 18 (2.6%) |
Occupancy by Educational Attainment in Elk Creek
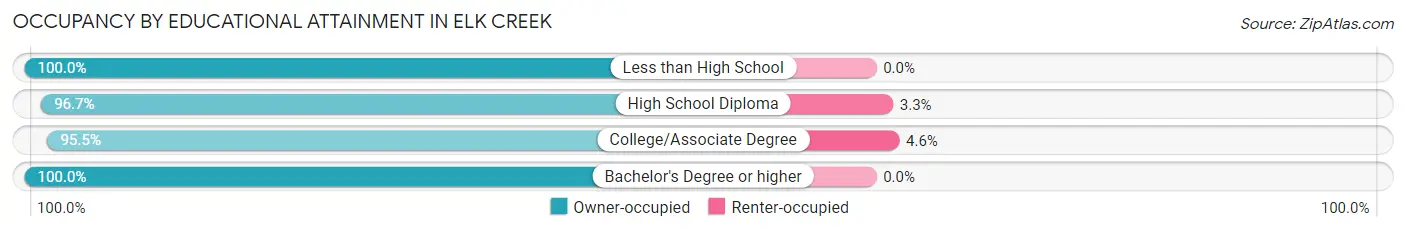
| Household Size | Owner-occupied | Renter-occupied |
| Less than High School | 11 (100.0%) | 0 (0.0%) |
| High School Diploma | 176 (96.7%) | 6 (3.3%) |
| College/Associate Degree | 252 (95.5%) | 12 (4.5%) |
| Bachelor's Degree or higher | 222 (100.0%) | 0 (0.0%) |
Occupancy by Age of Householder in Elk Creek
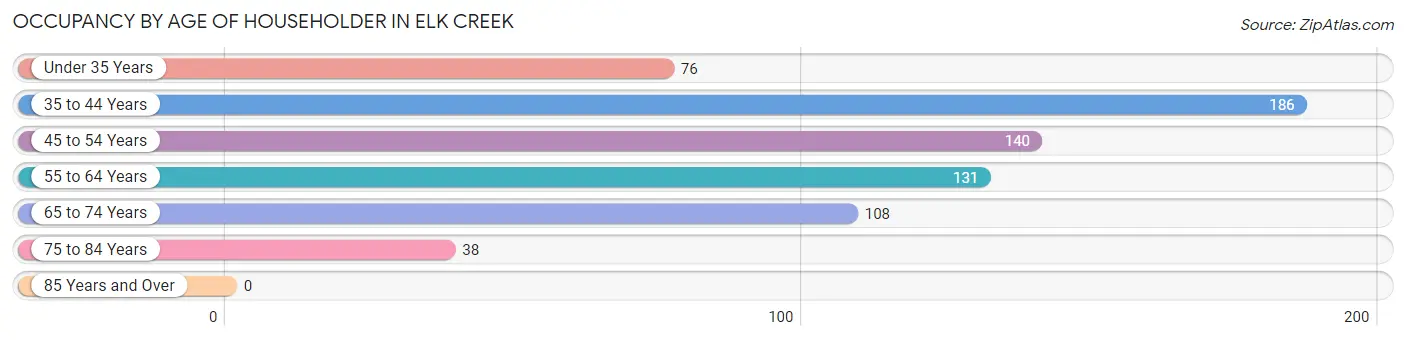
| Age Bracket | # Households | % Households |
| Under 35 Years | 76 | 11.2% |
| 35 to 44 Years | 186 | 27.4% |
| 45 to 54 Years | 140 | 20.6% |
| 55 to 64 Years | 131 | 19.3% |
| 65 to 74 Years | 108 | 15.9% |
| 75 to 84 Years | 38 | 5.6% |
| 85 Years and Over | 0 | 0.0% |
| Total | 679 | 100.0% |
Housing Finances in Elk Creek
Median Income by Occupancy in Elk Creek
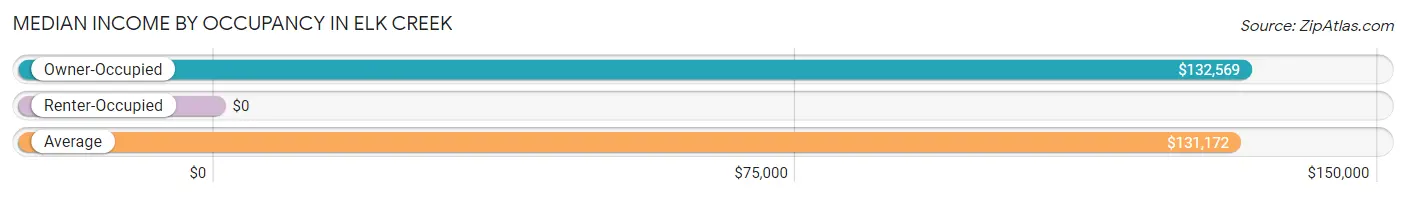
| Occupancy Type | # Households | Median Income |
| Owner-Occupied | 661 (97.4%) | $132,569 |
| Renter-Occupied | 18 (2.6%) | $0 |
| Average | 679 (100.0%) | $131,172 |
Occupancy by Householder Income Bracket in Elk Creek
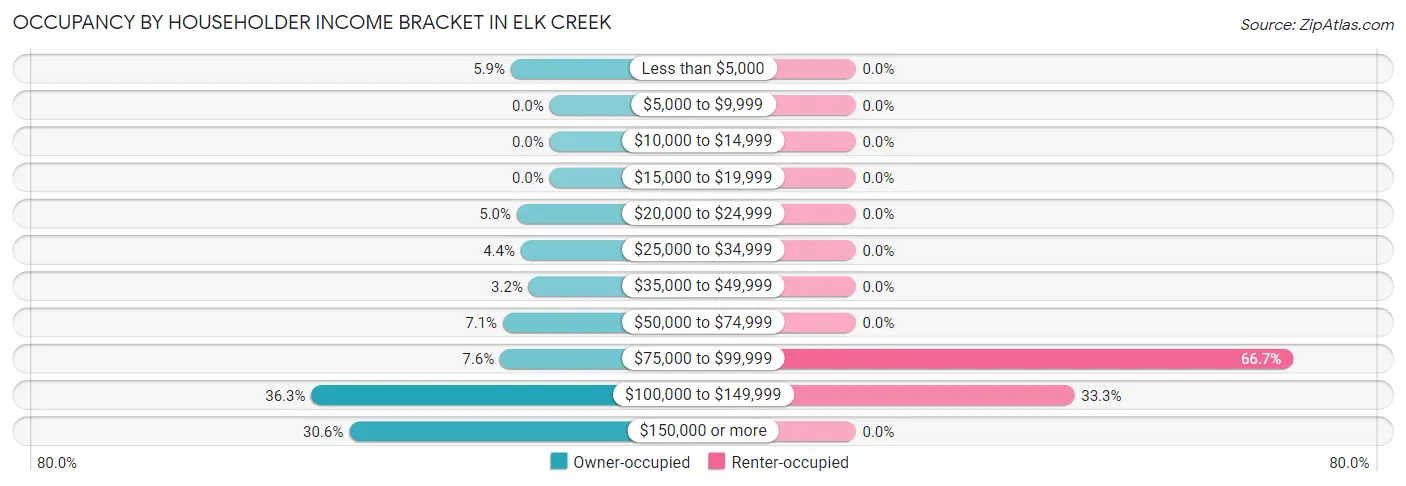
| Income Bracket | Owner-occupied | Renter-occupied |
| Less than $5,000 | 39 (5.9%) | 0 (0.0%) |
| $5,000 to $9,999 | 0 (0.0%) | 0 (0.0%) |
| $10,000 to $14,999 | 0 (0.0%) | 0 (0.0%) |
| $15,000 to $19,999 | 0 (0.0%) | 0 (0.0%) |
| $20,000 to $24,999 | 33 (5.0%) | 0 (0.0%) |
| $25,000 to $34,999 | 29 (4.4%) | 0 (0.0%) |
| $35,000 to $49,999 | 21 (3.2%) | 0 (0.0%) |
| $50,000 to $74,999 | 47 (7.1%) | 0 (0.0%) |
| $75,000 to $99,999 | 50 (7.6%) | 12 (66.7%) |
| $100,000 to $149,999 | 240 (36.3%) | 6 (33.3%) |
| $150,000 or more | 202 (30.6%) | 0 (0.0%) |
| Total | 661 (100.0%) | 18 (100.0%) |
Monthly Housing Cost Tiers in Elk Creek
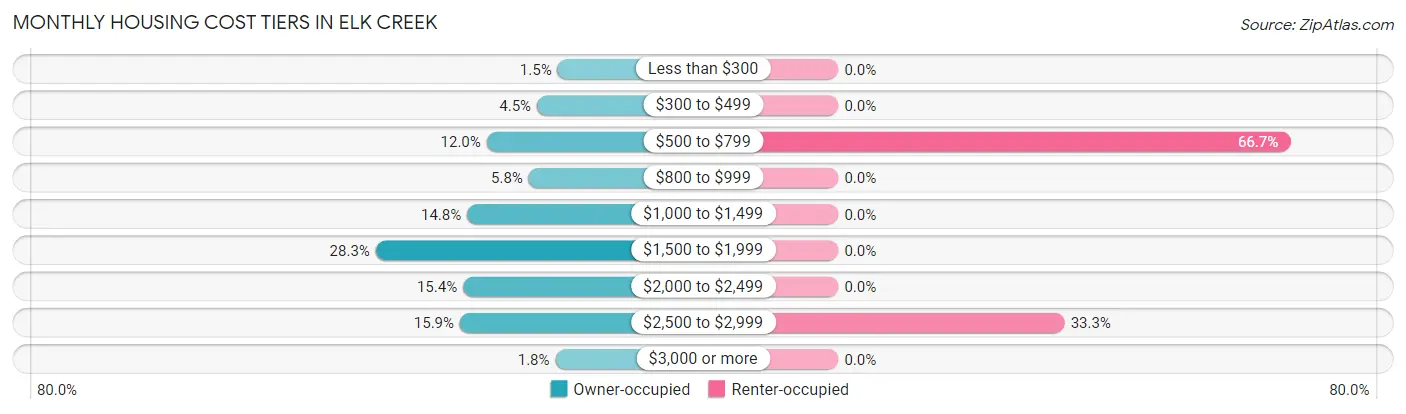
| Monthly Cost | Owner-occupied | Renter-occupied |
| Less than $300 | 10 (1.5%) | 0 (0.0%) |
| $300 to $499 | 30 (4.5%) | 0 (0.0%) |
| $500 to $799 | 79 (11.9%) | 12 (66.7%) |
| $800 to $999 | 38 (5.8%) | 0 (0.0%) |
| $1,000 to $1,499 | 98 (14.8%) | 0 (0.0%) |
| $1,500 to $1,999 | 187 (28.3%) | 0 (0.0%) |
| $2,000 to $2,499 | 102 (15.4%) | 0 (0.0%) |
| $2,500 to $2,999 | 105 (15.9%) | 6 (33.3%) |
| $3,000 or more | 12 (1.8%) | 0 (0.0%) |
| Total | 661 (100.0%) | 18 (100.0%) |
Physical Housing Characteristics in Elk Creek
Housing Structures in Elk Creek
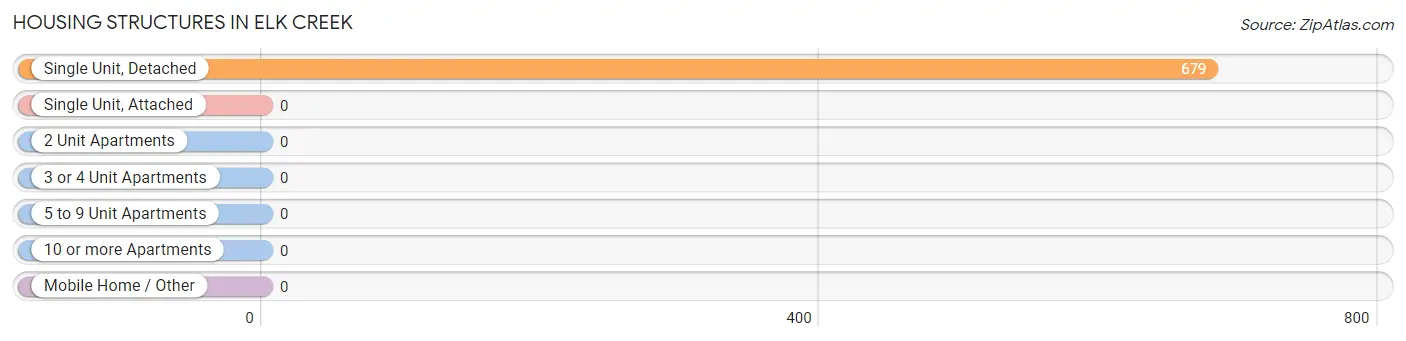
| Structure Type | # Housing Units | % Housing Units |
| Single Unit, Detached | 679 | 100.0% |
| Single Unit, Attached | 0 | 0.0% |
| 2 Unit Apartments | 0 | 0.0% |
| 3 or 4 Unit Apartments | 0 | 0.0% |
| 5 to 9 Unit Apartments | 0 | 0.0% |
| 10 or more Apartments | 0 | 0.0% |
| Mobile Home / Other | 0 | 0.0% |
| Total | 679 | 100.0% |
Housing Structures by Occupancy in Elk Creek
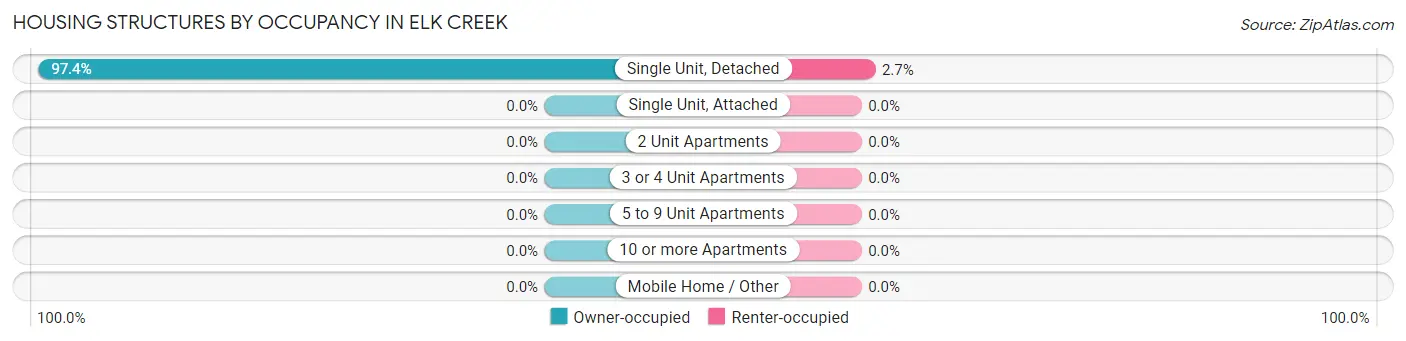
| Structure Type | Owner-occupied | Renter-occupied |
| Single Unit, Detached | 661 (97.4%) | 18 (2.6%) |
| Single Unit, Attached | 0 (0.0%) | 0 (0.0%) |
| 2 Unit Apartments | 0 (0.0%) | 0 (0.0%) |
| 3 or 4 Unit Apartments | 0 (0.0%) | 0 (0.0%) |
| 5 to 9 Unit Apartments | 0 (0.0%) | 0 (0.0%) |
| 10 or more Apartments | 0 (0.0%) | 0 (0.0%) |
| Mobile Home / Other | 0 (0.0%) | 0 (0.0%) |
| Total | 661 (97.4%) | 18 (2.6%) |
Housing Structures by Number of Rooms in Elk Creek
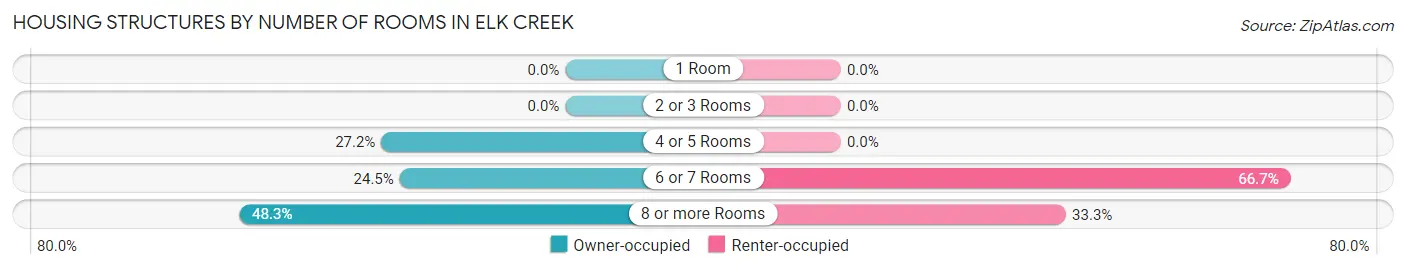
| Number of Rooms | Owner-occupied | Renter-occupied |
| 1 Room | 0 (0.0%) | 0 (0.0%) |
| 2 or 3 Rooms | 0 (0.0%) | 0 (0.0%) |
| 4 or 5 Rooms | 180 (27.2%) | 0 (0.0%) |
| 6 or 7 Rooms | 162 (24.5%) | 12 (66.7%) |
| 8 or more Rooms | 319 (48.3%) | 6 (33.3%) |
| Total | 661 (100.0%) | 18 (100.0%) |
Housing Structure by Heating Type in Elk Creek
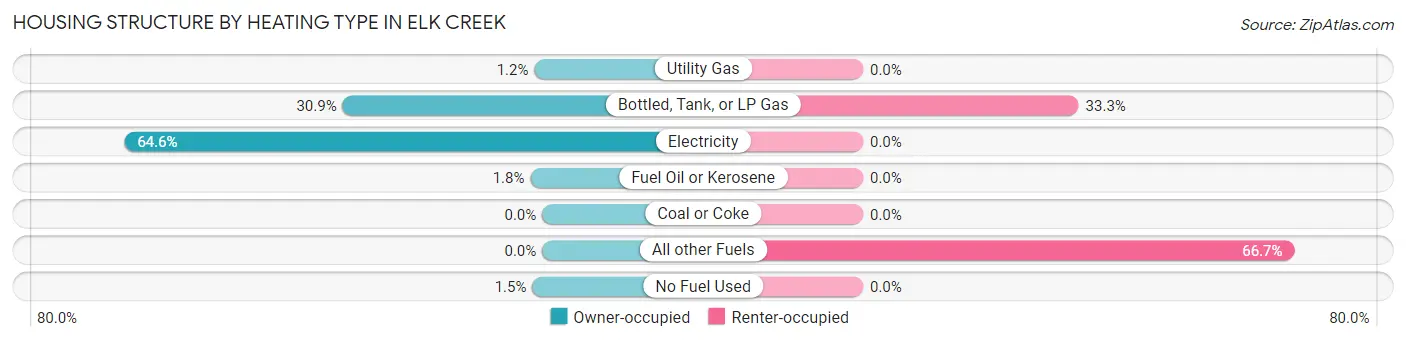
| Heating Type | Owner-occupied | Renter-occupied |
| Utility Gas | 8 (1.2%) | 0 (0.0%) |
| Bottled, Tank, or LP Gas | 204 (30.9%) | 6 (33.3%) |
| Electricity | 427 (64.6%) | 0 (0.0%) |
| Fuel Oil or Kerosene | 12 (1.8%) | 0 (0.0%) |
| Coal or Coke | 0 (0.0%) | 0 (0.0%) |
| All other Fuels | 0 (0.0%) | 12 (66.7%) |
| No Fuel Used | 10 (1.5%) | 0 (0.0%) |
| Total | 661 (100.0%) | 18 (100.0%) |
Household Vehicle Usage in Elk Creek
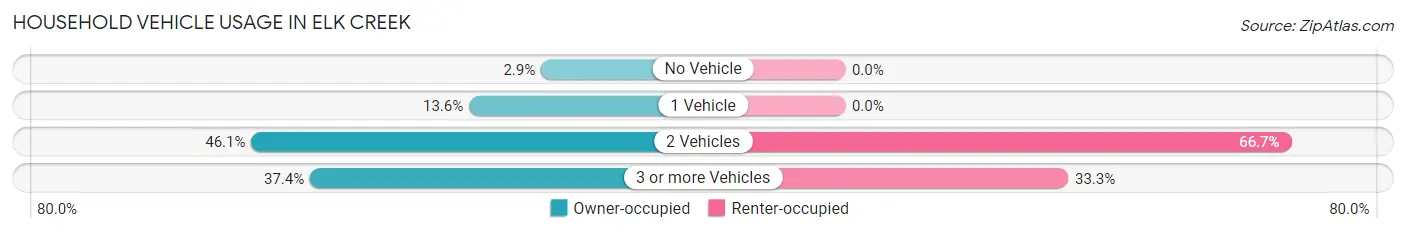
| Vehicles per Household | Owner-occupied | Renter-occupied |
| No Vehicle | 19 (2.9%) | 0 (0.0%) |
| 1 Vehicle | 90 (13.6%) | 0 (0.0%) |
| 2 Vehicles | 305 (46.1%) | 12 (66.7%) |
| 3 or more Vehicles | 247 (37.4%) | 6 (33.3%) |
| Total | 661 (100.0%) | 18 (100.0%) |
Real Estate & Mortgages in Elk Creek
Real Estate and Mortgage Overview in Elk Creek
| Characteristic | Without Mortgage | With Mortgage |
| Housing Units | 128 | 533 |
| Median Property Value | $297,100 | $344,200 |
| Median Household Income | $58,295 | $193 |
| Monthly Housing Costs | $546 | $12 |
| Real Estate Taxes | $2,104 | $0 |
Property Value by Mortgage Status in Elk Creek
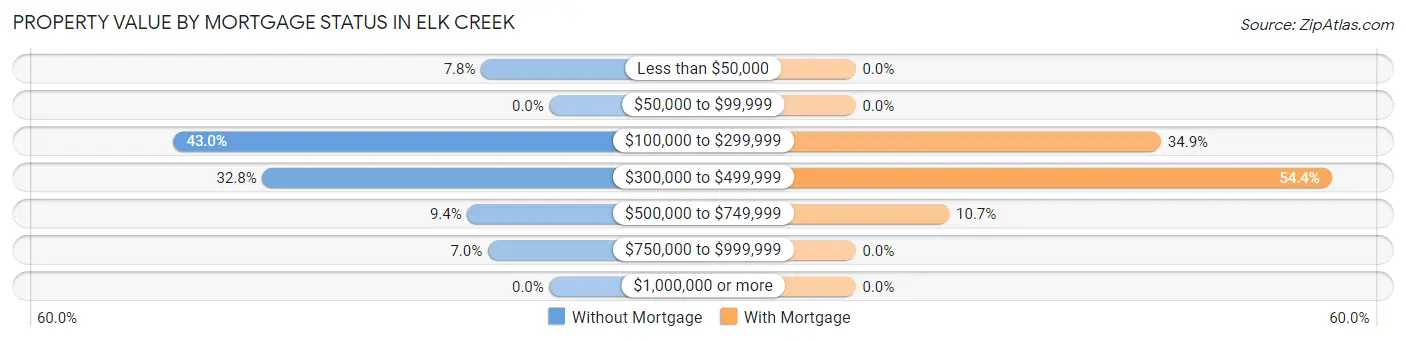
| Property Value | Without Mortgage | With Mortgage |
| Less than $50,000 | 10 (7.8%) | 0 (0.0%) |
| $50,000 to $99,999 | 0 (0.0%) | 0 (0.0%) |
| $100,000 to $299,999 | 55 (43.0%) | 186 (34.9%) |
| $300,000 to $499,999 | 42 (32.8%) | 290 (54.4%) |
| $500,000 to $749,999 | 12 (9.4%) | 57 (10.7%) |
| $750,000 to $999,999 | 9 (7.0%) | 0 (0.0%) |
| $1,000,000 or more | 0 (0.0%) | 0 (0.0%) |
| Total | 128 (100.0%) | 533 (100.0%) |
Household Income by Mortgage Status in Elk Creek
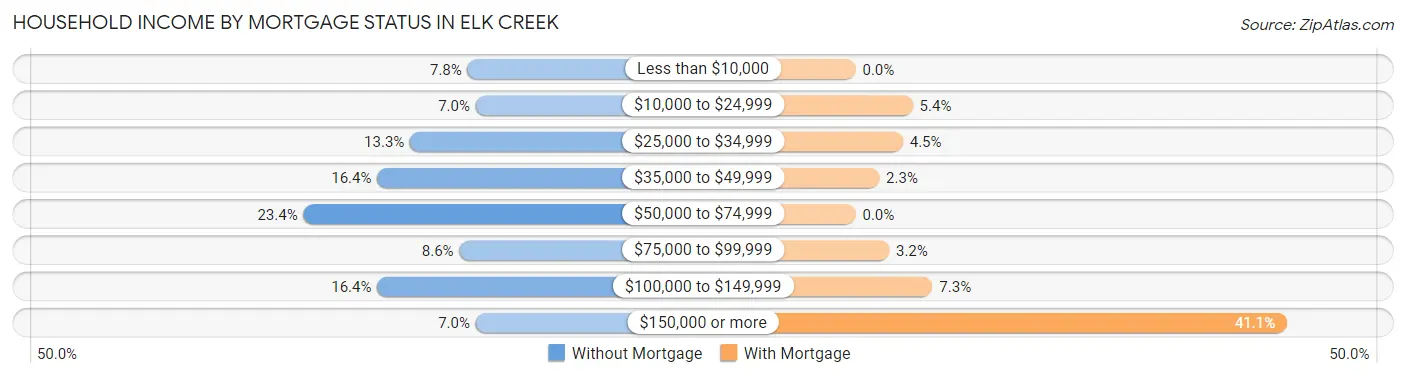
| Household Income | Without Mortgage | With Mortgage |
| Less than $10,000 | 10 (7.8%) | 0 (0.0%) |
| $10,000 to $24,999 | 9 (7.0%) | 29 (5.4%) |
| $25,000 to $34,999 | 17 (13.3%) | 24 (4.5%) |
| $35,000 to $49,999 | 21 (16.4%) | 12 (2.2%) |
| $50,000 to $74,999 | 30 (23.4%) | 0 (0.0%) |
| $75,000 to $99,999 | 11 (8.6%) | 17 (3.2%) |
| $100,000 to $149,999 | 21 (16.4%) | 39 (7.3%) |
| $150,000 or more | 9 (7.0%) | 219 (41.1%) |
| Total | 128 (100.0%) | 533 (100.0%) |
Property Value to Household Income Ratio in Elk Creek
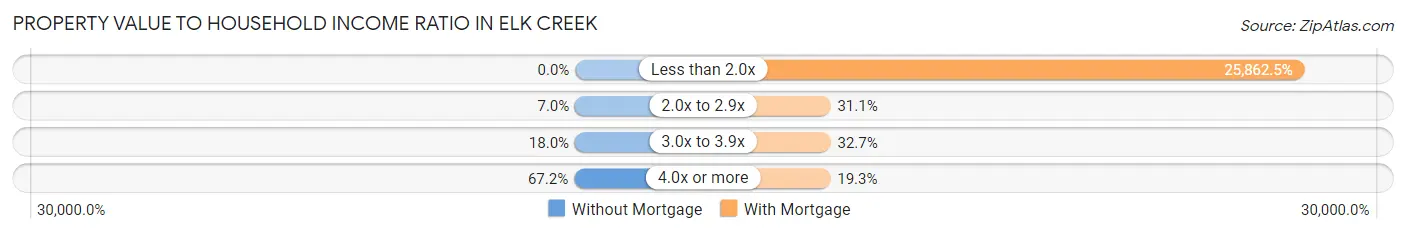
| Value-to-Income Ratio | Without Mortgage | With Mortgage |
| Less than 2.0x | 0 (0.0%) | 137,847 (25,862.5%) |
| 2.0x to 2.9x | 9 (7.0%) | 166 (31.1%) |
| 3.0x to 3.9x | 23 (18.0%) | 174 (32.7%) |
| 4.0x or more | 86 (67.2%) | 103 (19.3%) |
| Total | 128 (100.0%) | 533 (100.0%) |
Real Estate Taxes by Mortgage Status in Elk Creek
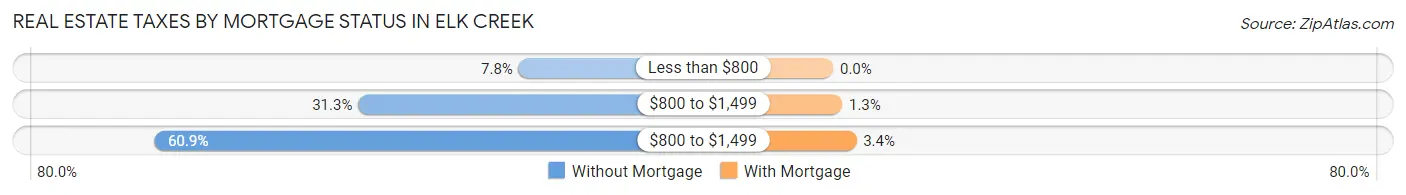
| Property Taxes | Without Mortgage | With Mortgage |
| Less than $800 | 10 (7.8%) | 0 (0.0%) |
| $800 to $1,499 | 40 (31.2%) | 7 (1.3%) |
| $800 to $1,499 | 78 (60.9%) | 18 (3.4%) |
| Total | 128 (100.0%) | 533 (100.0%) |
Health & Disability in Elk Creek
Health Insurance Coverage by Age in Elk Creek
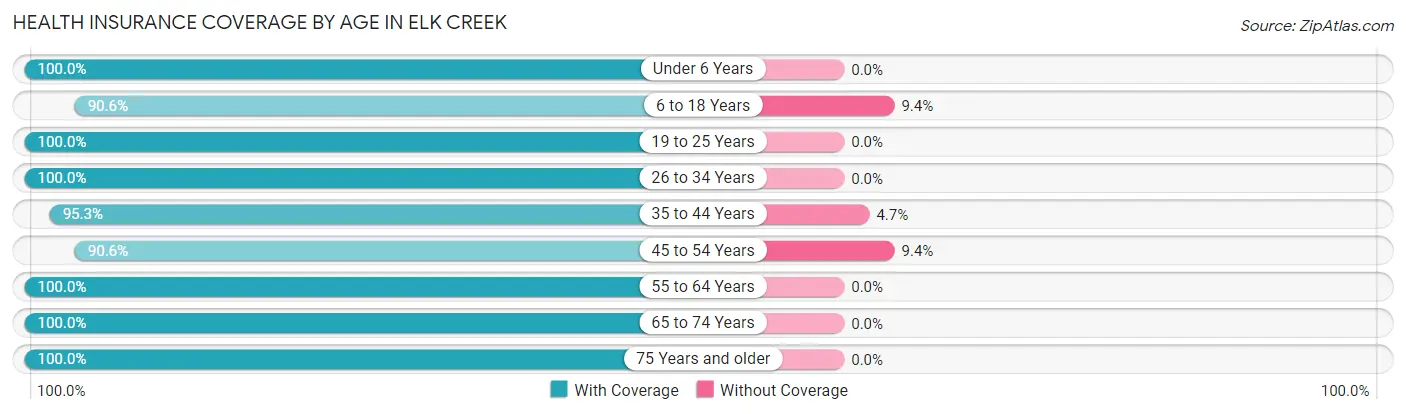
| Age Bracket | With Coverage | Without Coverage |
| Under 6 Years | 267 (100.0%) | 0 (0.0%) |
| 6 to 18 Years | 426 (90.6%) | 44 (9.4%) |
| 19 to 25 Years | 121 (100.0%) | 0 (0.0%) |
| 26 to 34 Years | 286 (100.0%) | 0 (0.0%) |
| 35 to 44 Years | 386 (95.3%) | 19 (4.7%) |
| 45 to 54 Years | 232 (90.6%) | 24 (9.4%) |
| 55 to 64 Years | 207 (100.0%) | 0 (0.0%) |
| 65 to 74 Years | 212 (100.0%) | 0 (0.0%) |
| 75 Years and older | 71 (100.0%) | 0 (0.0%) |
| Total | 2,208 (96.2%) | 87 (3.8%) |
Health Insurance Coverage by Citizenship Status in Elk Creek

| Citizenship Status | With Coverage | Without Coverage |
| Native Born | 267 (100.0%) | 0 (0.0%) |
| Foreign Born, Citizen | 426 (90.6%) | 44 (9.4%) |
| Foreign Born, not a Citizen | 121 (100.0%) | 0 (0.0%) |
Health Insurance Coverage by Household Income in Elk Creek
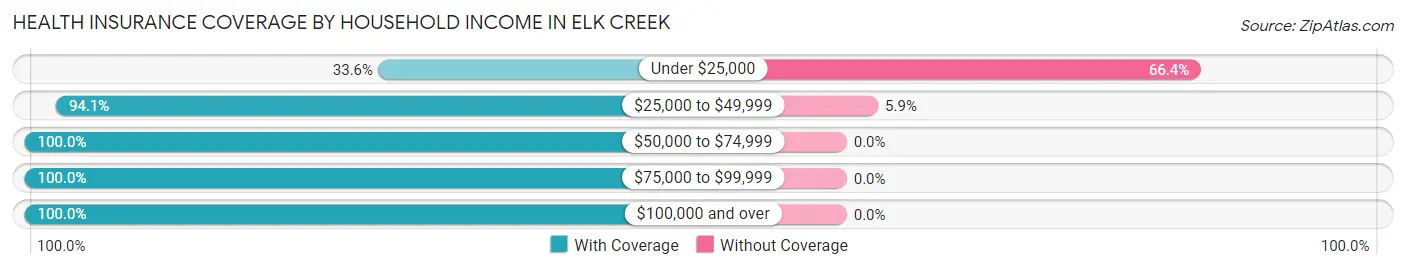
| Household Income | With Coverage | Without Coverage |
| Under $25,000 | 38 (33.6%) | 75 (66.4%) |
| $25,000 to $49,999 | 192 (94.1%) | 12 (5.9%) |
| $50,000 to $74,999 | 101 (100.0%) | 0 (0.0%) |
| $75,000 to $99,999 | 272 (100.0%) | 0 (0.0%) |
| $100,000 and over | 1,605 (100.0%) | 0 (0.0%) |
Public vs Private Health Insurance Coverage by Age in Elk Creek
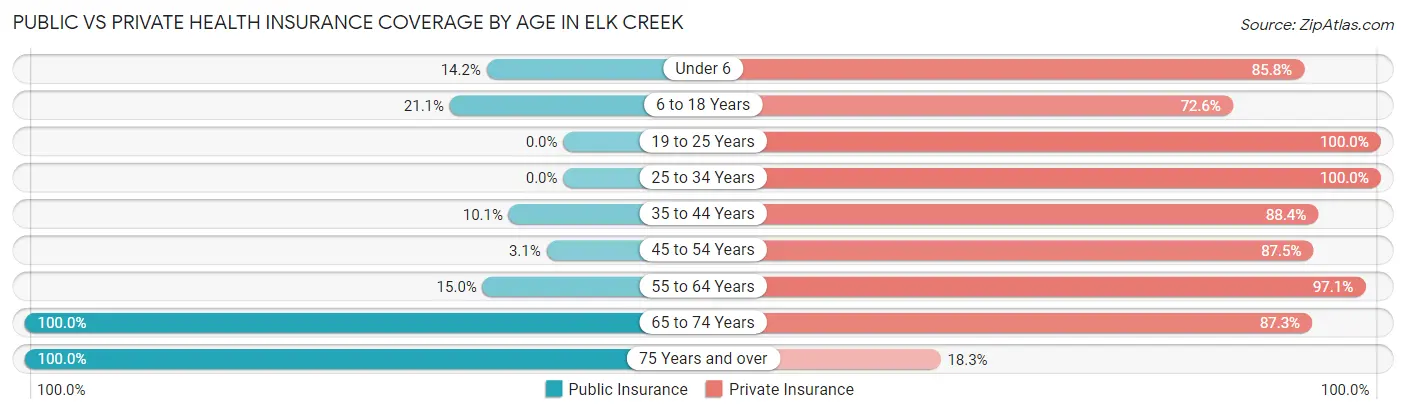
| Age Bracket | Public Insurance | Private Insurance |
| Under 6 | 38 (14.2%) | 229 (85.8%) |
| 6 to 18 Years | 99 (21.1%) | 341 (72.6%) |
| 19 to 25 Years | 0 (0.0%) | 121 (100.0%) |
| 25 to 34 Years | 0 (0.0%) | 286 (100.0%) |
| 35 to 44 Years | 41 (10.1%) | 358 (88.4%) |
| 45 to 54 Years | 8 (3.1%) | 224 (87.5%) |
| 55 to 64 Years | 31 (15.0%) | 201 (97.1%) |
| 65 to 74 Years | 212 (100.0%) | 185 (87.3%) |
| 75 Years and over | 71 (100.0%) | 13 (18.3%) |
| Total | 500 (21.8%) | 1,958 (85.3%) |
Disability Status by Sex by Age in Elk Creek
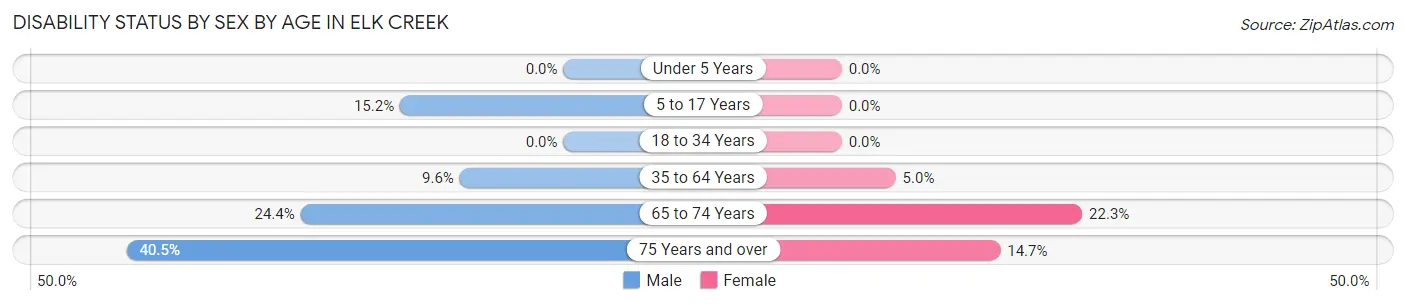
| Age Bracket | Male | Female |
| Under 5 Years | 0 (0.0%) | 0 (0.0%) |
| 5 to 17 Years | 47 (15.2%) | 0 (0.0%) |
| 18 to 34 Years | 0 (0.0%) | 0 (0.0%) |
| 35 to 64 Years | 45 (9.6%) | 20 (5.0%) |
| 65 to 74 Years | 20 (24.4%) | 29 (22.3%) |
| 75 Years and over | 15 (40.5%) | 5 (14.7%) |
Disability Class by Sex by Age in Elk Creek
Disability Class: Hearing Difficulty
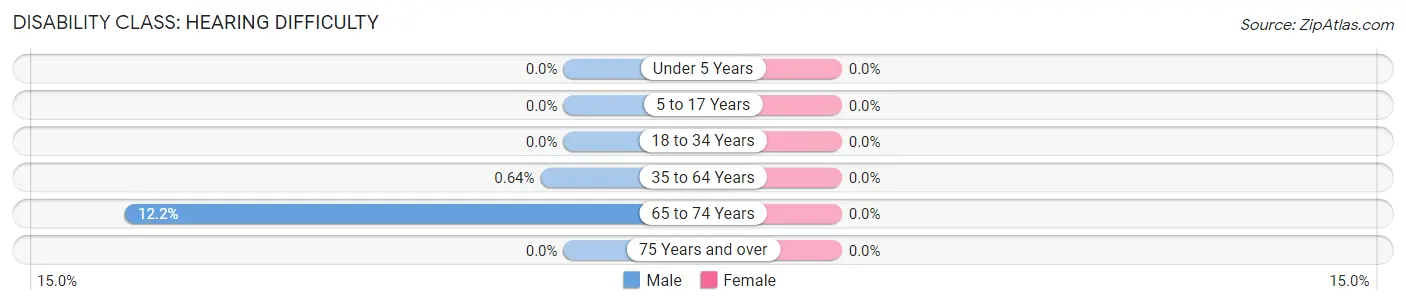
| Age Bracket | Male | Female |
| Under 5 Years | 0 (0.0%) | 0 (0.0%) |
| 5 to 17 Years | 0 (0.0%) | 0 (0.0%) |
| 18 to 34 Years | 0 (0.0%) | 0 (0.0%) |
| 35 to 64 Years | 3 (0.6%) | 0 (0.0%) |
| 65 to 74 Years | 10 (12.2%) | 0 (0.0%) |
| 75 Years and over | 0 (0.0%) | 0 (0.0%) |
Disability Class: Vision Difficulty
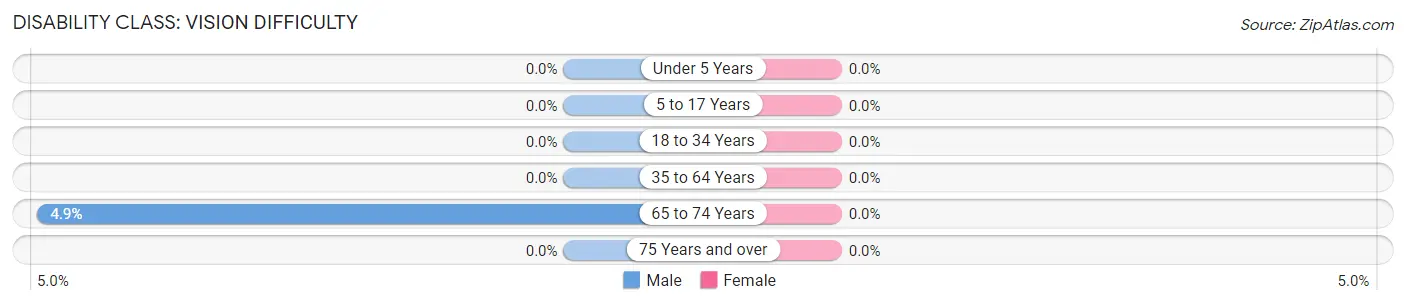
| Age Bracket | Male | Female |
| Under 5 Years | 0 (0.0%) | 0 (0.0%) |
| 5 to 17 Years | 0 (0.0%) | 0 (0.0%) |
| 18 to 34 Years | 0 (0.0%) | 0 (0.0%) |
| 35 to 64 Years | 0 (0.0%) | 0 (0.0%) |
| 65 to 74 Years | 4 (4.9%) | 0 (0.0%) |
| 75 Years and over | 0 (0.0%) | 0 (0.0%) |
Disability Class: Cognitive Difficulty
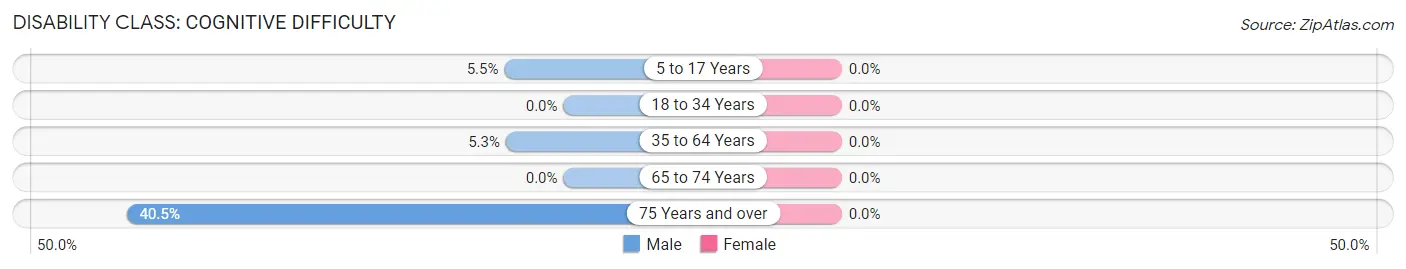
| Age Bracket | Male | Female |
| 5 to 17 Years | 17 (5.5%) | 0 (0.0%) |
| 18 to 34 Years | 0 (0.0%) | 0 (0.0%) |
| 35 to 64 Years | 25 (5.3%) | 0 (0.0%) |
| 65 to 74 Years | 0 (0.0%) | 0 (0.0%) |
| 75 Years and over | 15 (40.5%) | 0 (0.0%) |
Disability Class: Ambulatory Difficulty
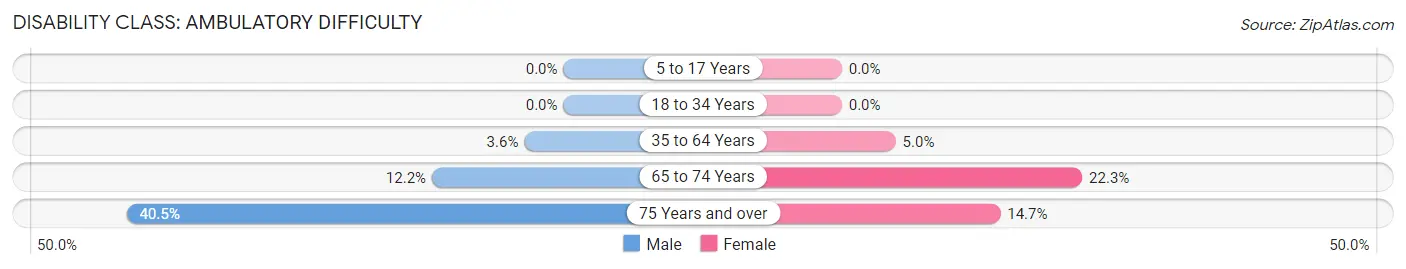
| Age Bracket | Male | Female |
| 5 to 17 Years | 0 (0.0%) | 0 (0.0%) |
| 18 to 34 Years | 0 (0.0%) | 0 (0.0%) |
| 35 to 64 Years | 17 (3.6%) | 20 (5.0%) |
| 65 to 74 Years | 10 (12.2%) | 29 (22.3%) |
| 75 Years and over | 15 (40.5%) | 5 (14.7%) |
Disability Class: Self-Care Difficulty
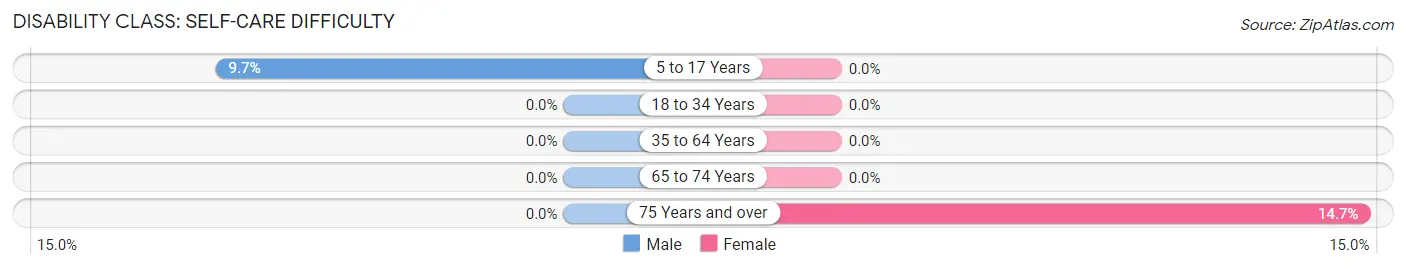
| Age Bracket | Male | Female |
| 5 to 17 Years | 30 (9.7%) | 0 (0.0%) |
| 18 to 34 Years | 0 (0.0%) | 0 (0.0%) |
| 35 to 64 Years | 0 (0.0%) | 0 (0.0%) |
| 65 to 74 Years | 0 (0.0%) | 0 (0.0%) |
| 75 Years and over | 0 (0.0%) | 5 (14.7%) |
Technology Access in Elk Creek
Computing Device Access in Elk Creek
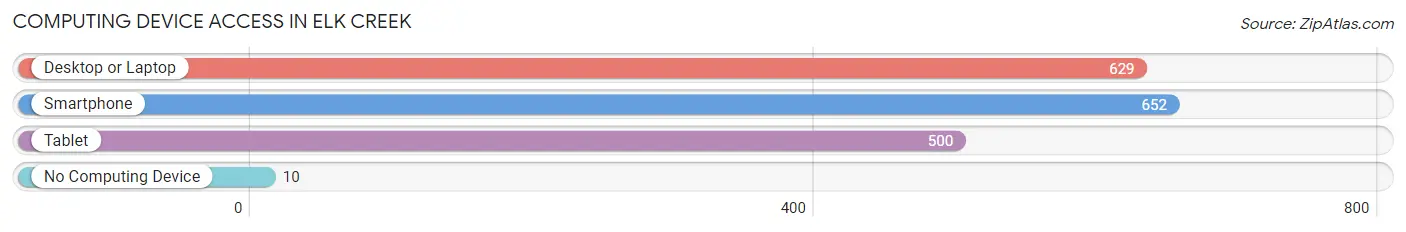
| Device Type | # Households | % Households |
| Desktop or Laptop | 629 | 92.6% |
| Smartphone | 652 | 96.0% |
| Tablet | 500 | 73.6% |
| No Computing Device | 10 | 1.5% |
| Total | 679 | 100.0% |
Internet Access in Elk Creek
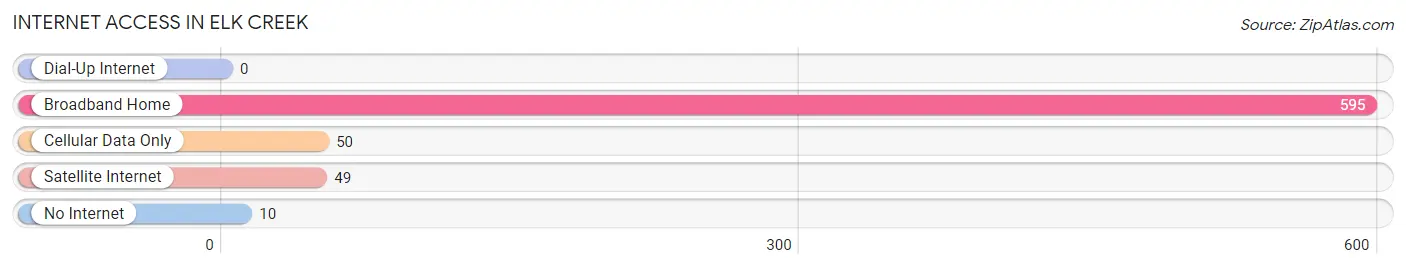
| Internet Type | # Households | % Households |
| Dial-Up Internet | 0 | 0.0% |
| Broadband Home | 595 | 87.6% |
| Cellular Data Only | 50 | 7.4% |
| Satellite Internet | 49 | 7.2% |
| No Internet | 10 | 1.5% |
| Total | 679 | 100.0% |
Elk Creek Summary
Elk Creek is a small unincorporated community located in the southeastern corner of Grayson County, Kentucky. It is situated along the banks of the Elk Creek, a tributary of the Green River. The community is located approximately 10 miles south of Leitchfield, the county seat, and is part of the Leitchfield Micropolitan Statistical Area.
History
The area that is now Elk Creek was first settled in the early 1800s by a group of settlers from Virginia. The community was originally known as “Elk Creek Station” and was a stop on the Louisville and Nashville Railroad. The railroad was built in the late 1800s and was a major factor in the growth of the community.
In the early 1900s, the community was home to a number of businesses, including a general store, a blacksmith shop, a grist mill, and a sawmill. The community also had a post office, which was established in 1891 and closed in 1954.
Geography
Elk Creek is located in the southeastern corner of Grayson County, Kentucky. It is situated along the banks of the Elk Creek, a tributary of the Green River. The community is located approximately 10 miles south of Leitchfield, the county seat.
The terrain in the area is mostly rolling hills and is covered with a mix of hardwood and pine forests. The climate is humid subtropical, with hot summers and mild winters.
Economy
The economy of Elk Creek is largely based on agriculture. The area is home to a number of farms, which produce a variety of crops, including corn, soybeans, wheat, and hay. The community also has a number of small businesses, including a general store, a gas station, and a restaurant.
Demographics
As of the 2010 census, the population of Elk Creek was 545. The racial makeup of the community was 97.3% White, 0.7% African American, 0.2% Native American, 0.2% Asian, and 1.6% from other races. The median household income was $31,250, and the median family income was $37,500.
Conclusion
Elk Creek is a small unincorporated community located in the southeastern corner of Grayson County, Kentucky. It is situated along the banks of the Elk Creek, a tributary of the Green River. The community is home to a number of farms and small businesses, and the economy is largely based on agriculture. The population of Elk Creek was 545 as of the 2010 census, and the median household income was $31,250.
Common Questions
What is Per Capita Income in Elk Creek?
Per Capita income in Elk Creek is $48,870.
What is the Median Family Income in Elk Creek?
Median Family Income in Elk Creek is $136,607.
What is the Median Household income in Elk Creek?
Median Household Income in Elk Creek is $131,172.
What is Income or Wage Gap in Elk Creek?
Income or Wage Gap in Elk Creek is 29.0%.
Women in Elk Creek earn 71.0 cents for every dollar earned by a man.
What is Inequality or Gini Index in Elk Creek?
Inequality or Gini Index in Elk Creek is 0.43.
What is the Total Population of Elk Creek?
Total Population of Elk Creek is 2,295.
What is the Total Male Population of Elk Creek?
Total Male Population of Elk Creek is 1,125.
What is the Total Female Population of Elk Creek?
Total Female Population of Elk Creek is 1,170.
What is the Ratio of Males per 100 Females in Elk Creek?
There are 96.15 Males per 100 Females in Elk Creek.
What is the Ratio of Females per 100 Males in Elk Creek?
There are 104.00 Females per 100 Males in Elk Creek.
What is the Median Population Age in Elk Creek?
Median Population Age in Elk Creek is 35.0 Years.
What is the Average Family Size in Elk Creek
Average Family Size in Elk Creek is 3.5 People.
What is the Average Household Size in Elk Creek
Average Household Size in Elk Creek is 3.4 People.
How Large is the Labor Force in Elk Creek?
There are 1,180 People in the Labor Forcein in Elk Creek.
What is the Percentage of People in the Labor Force in Elk Creek?
71.4% of People are in the Labor Force in Elk Creek.
What is the Unemployment Rate in Elk Creek?
Unemployment Rate in Elk Creek is 4.9%.