Wallins Creek, KY Map & Demographics
Wallins Creek Map
Wallins Creek Overview
$28,267
PER CAPITA INCOME
0.27
INEQUALITY / GINI INDEX
429
TOTAL POPULATION
185
MALE POPULATION
244
FEMALE POPULATION
75.82
MALES / 100 FEMALES
131.89
FEMALES / 100 MALES
53.0
MEDIAN AGE
2.5
AVG FAMILY SIZE
2.4
AVG HOUSEHOLD SIZE
152
LABOR FORCE [ PEOPLE ]
38.1%
PERCENT IN LABOR FORCE
9.9%
UNEMPLOYMENT RATE
Wallins Creek Zip Codes
Wallins Creek Area Codes
Income in Wallins Creek
Income Overview in Wallins Creek
| Characteristic | Number | Measure |
| Per Capita Income | 429 | $28,267 |
| Median Family Income | 149 | $0 |
| Mean Family Income | 149 | $63,946 |
| Median Household Income | 179 | $0 |
| Mean Household Income | 179 | $62,582 |
| Income Deficit | 149 | $0 |
| Wage / Income Gap (%) | 429 | 0.00% |
| Wage / Income Gap ($) | 429 | 100.00¢ per $1 |
| Gini / Inequality Index | 429 | 0.27 |
Earnings by Sex in Wallins Creek
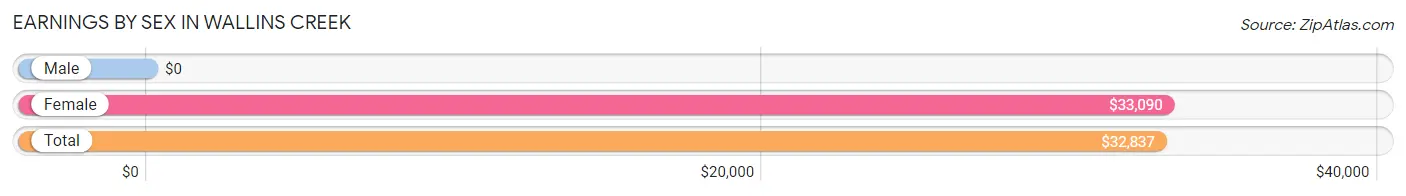
| Sex | Number | Average Earnings |
| Male | 48 (26.1%) | $0 |
| Female | 136 (73.9%) | $33,090 |
| Total | 184 (100.0%) | $32,837 |
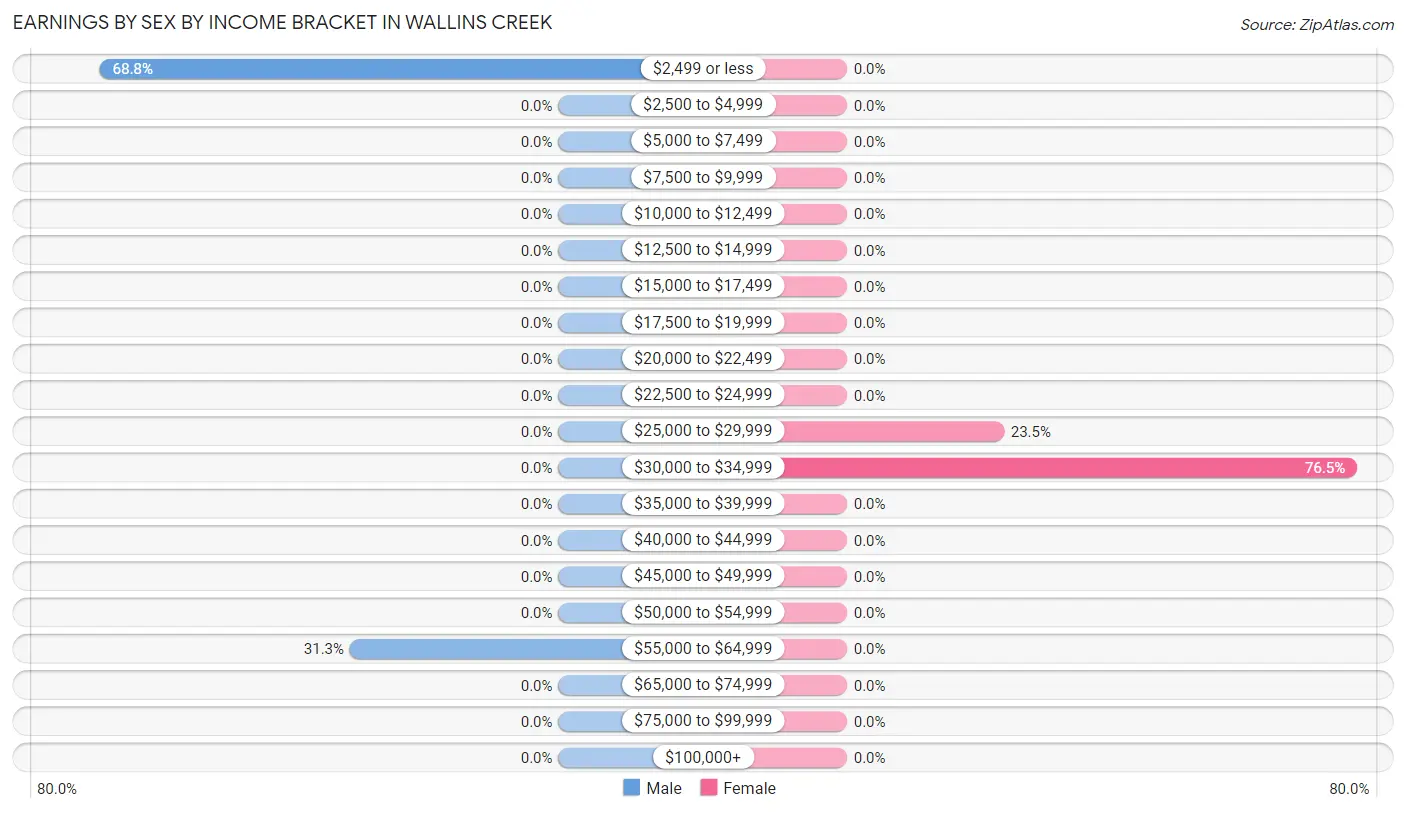
Earnings by Sex by Income Bracket in Wallins Creek
The most common earnings brackets in Wallins Creek are $2,499 or less for men (33 | 68.8%) and $30,000 to $34,999 for women (104 | 76.5%).
| Income | Male | Female |
| $2,499 or less | 33 (68.8%) | 0 (0.0%) |
| $2,500 to $4,999 | 0 (0.0%) | 0 (0.0%) |
| $5,000 to $7,499 | 0 (0.0%) | 0 (0.0%) |
| $7,500 to $9,999 | 0 (0.0%) | 0 (0.0%) |
| $10,000 to $12,499 | 0 (0.0%) | 0 (0.0%) |
| $12,500 to $14,999 | 0 (0.0%) | 0 (0.0%) |
| $15,000 to $17,499 | 0 (0.0%) | 0 (0.0%) |
| $17,500 to $19,999 | 0 (0.0%) | 0 (0.0%) |
| $20,000 to $22,499 | 0 (0.0%) | 0 (0.0%) |
| $22,500 to $24,999 | 0 (0.0%) | 0 (0.0%) |
| $25,000 to $29,999 | 0 (0.0%) | 32 (23.5%) |
| $30,000 to $34,999 | 0 (0.0%) | 104 (76.5%) |
| $35,000 to $39,999 | 0 (0.0%) | 0 (0.0%) |
| $40,000 to $44,999 | 0 (0.0%) | 0 (0.0%) |
| $45,000 to $49,999 | 0 (0.0%) | 0 (0.0%) |
| $50,000 to $54,999 | 0 (0.0%) | 0 (0.0%) |
| $55,000 to $64,999 | 15 (31.2%) | 0 (0.0%) |
| $65,000 to $74,999 | 0 (0.0%) | 0 (0.0%) |
| $75,000 to $99,999 | 0 (0.0%) | 0 (0.0%) |
| $100,000+ | 0 (0.0%) | 0 (0.0%) |
| Total | 48 (100.0%) | 136 (100.0%) |
Earnings by Sex by Educational Attainment in Wallins Creek
| Educational Attainment | Male Income | Female Income |
| Less than High School | - | - |
| High School Diploma | - | - |
| College or Associate's Degree | - | - |
| Bachelor's Degree | - | - |
| Graduate Degree | - | - |
| Total | - | - |
Family Income in Wallins Creek
Family Income Brackets in Wallins Creek
According to the Wallins Creek family income data, there are 69 families falling into the $75,000 to $99,999 income range, which is the most common income bracket and makes up 46.3% of all families.
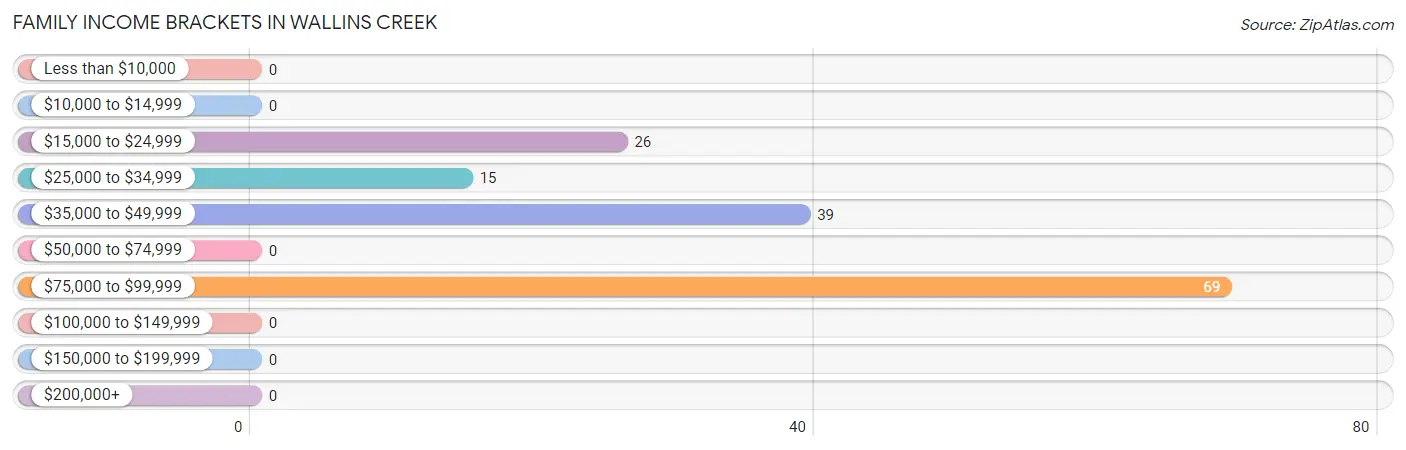
| Income Bracket | # Families | % Families |
| Less than $10,000 | 0 | 0.0% |
| $10,000 to $14,999 | 0 | 0.0% |
| $15,000 to $24,999 | 26 | 17.4% |
| $25,000 to $34,999 | 15 | 10.1% |
| $35,000 to $49,999 | 39 | 26.2% |
| $50,000 to $74,999 | 0 | 0.0% |
| $75,000 to $99,999 | 69 | 46.3% |
| $100,000 to $149,999 | 0 | 0.0% |
| $150,000 to $199,999 | 0 | 0.0% |
| $200,000+ | 0 | 0.0% |
Family Income by Famaliy Size in Wallins Creek
2-person families (108 | 72.5%) account for the highest median family income in Wallins Creek with $98,043 per family, while 2-person families (108 | 72.5%) have the highest median income of $49,022 per family member.
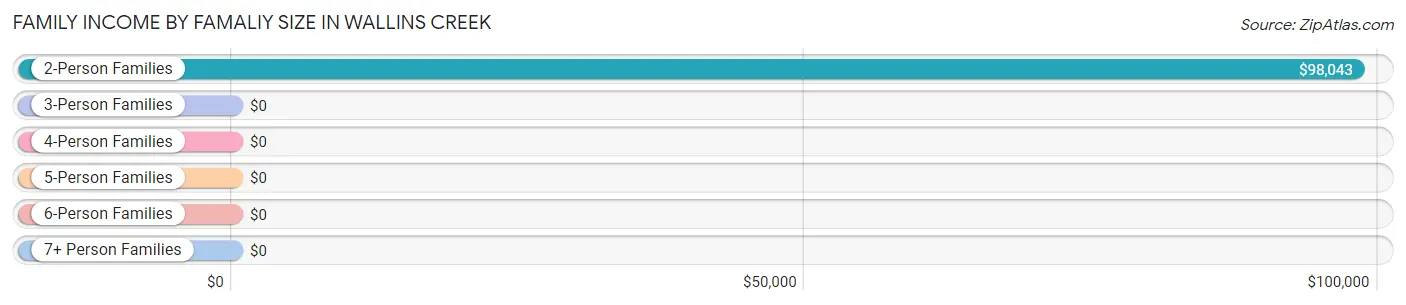
| Income Bracket | # Families | Median Income |
| 2-Person Families | 108 (72.5%) | $98,043 |
| 3-Person Families | 41 (27.5%) | $0 |
| 4-Person Families | 0 (0.0%) | $0 |
| 5-Person Families | 0 (0.0%) | $0 |
| 6-Person Families | 0 (0.0%) | $0 |
| 7+ Person Families | 0 (0.0%) | $0 |
| Total | 149 (100.0%) | $0 |
Family Income by Number of Earners in Wallins Creek
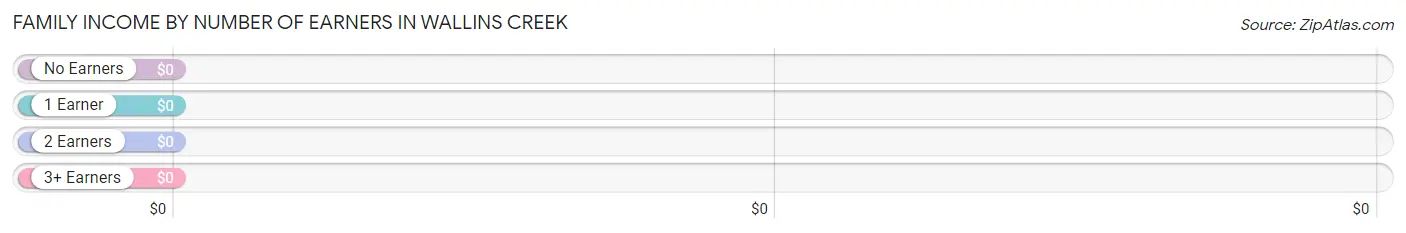
| Number of Earners | # Families | Median Income |
| No Earners | 39 (26.2%) | $0 |
| 1 Earner | 110 (73.8%) | $0 |
| 2 Earners | 0 (0.0%) | $0 |
| 3+ Earners | 0 (0.0%) | $0 |
| Total | 149 (100.0%) | $0 |
Household Income in Wallins Creek
Household Income Brackets in Wallins Creek
With 69 households falling in the category, the $75,000 to $99,999 income range is the most frequent in Wallins Creek, accounting for 38.6% of all households.
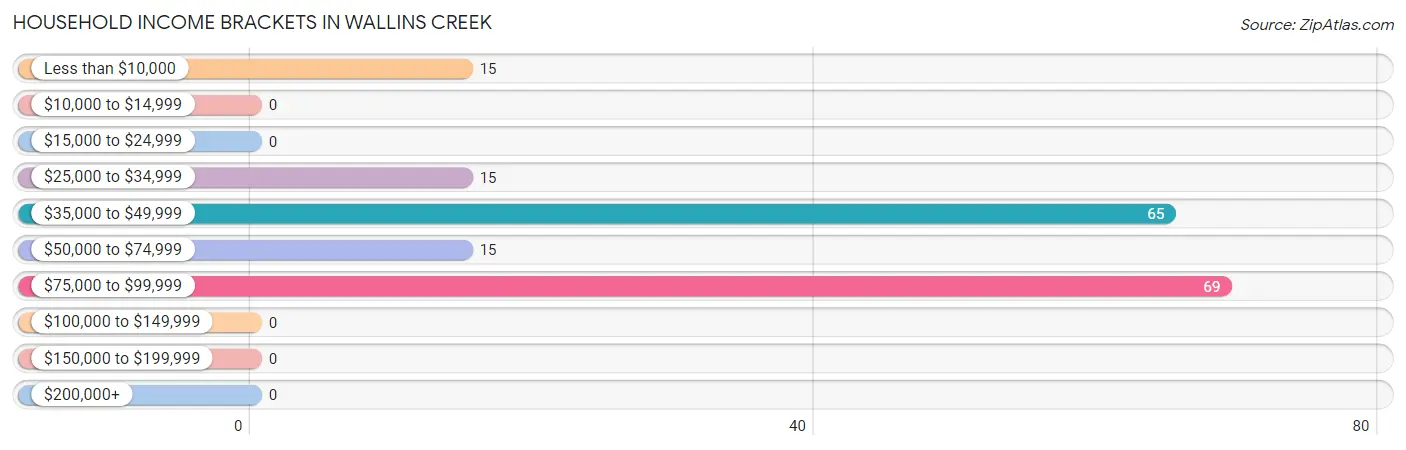
| Income Bracket | # Households | % Households |
| Less than $10,000 | 15 | 8.4% |
| $10,000 to $14,999 | 0 | 0.0% |
| $15,000 to $24,999 | 0 | 0.0% |
| $25,000 to $34,999 | 15 | 8.4% |
| $35,000 to $49,999 | 65 | 36.3% |
| $50,000 to $74,999 | 15 | 8.4% |
| $75,000 to $99,999 | 69 | 38.5% |
| $100,000 to $149,999 | 0 | 0.0% |
| $150,000 to $199,999 | 0 | 0.0% |
| $200,000+ | 0 | 0.0% |
Household Income by Householder Age in Wallins Creek
The median household income in Wallins Creek is $0, with the highest median household income of $98,007 found in the 45 to 64 years age bracket for the primary householder. A total of 110 households (61.5%) fall into this category.
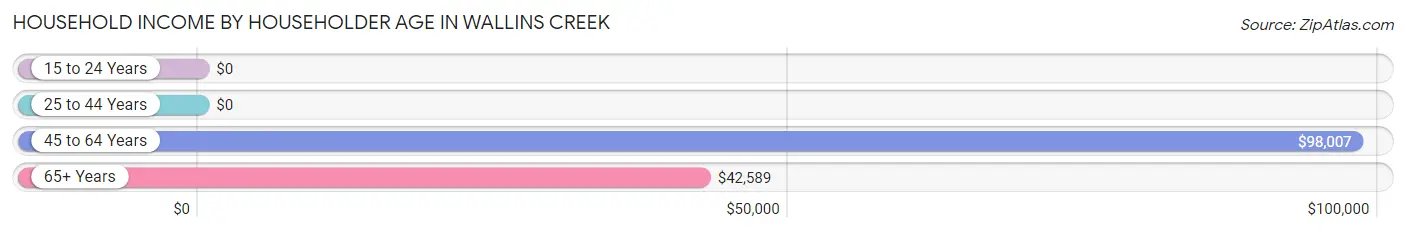
| Income Bracket | # Households | Median Income |
| 15 to 24 Years | 0 (0.0%) | $0 |
| 25 to 44 Years | 15 (8.4%) | $0 |
| 45 to 64 Years | 110 (61.5%) | $98,007 |
| 65+ Years | 54 (30.2%) | $42,589 |
| Total | 179 (100.0%) | $0 |
Poverty in Wallins Creek
Income Below Poverty by Sex and Age in Wallins Creek
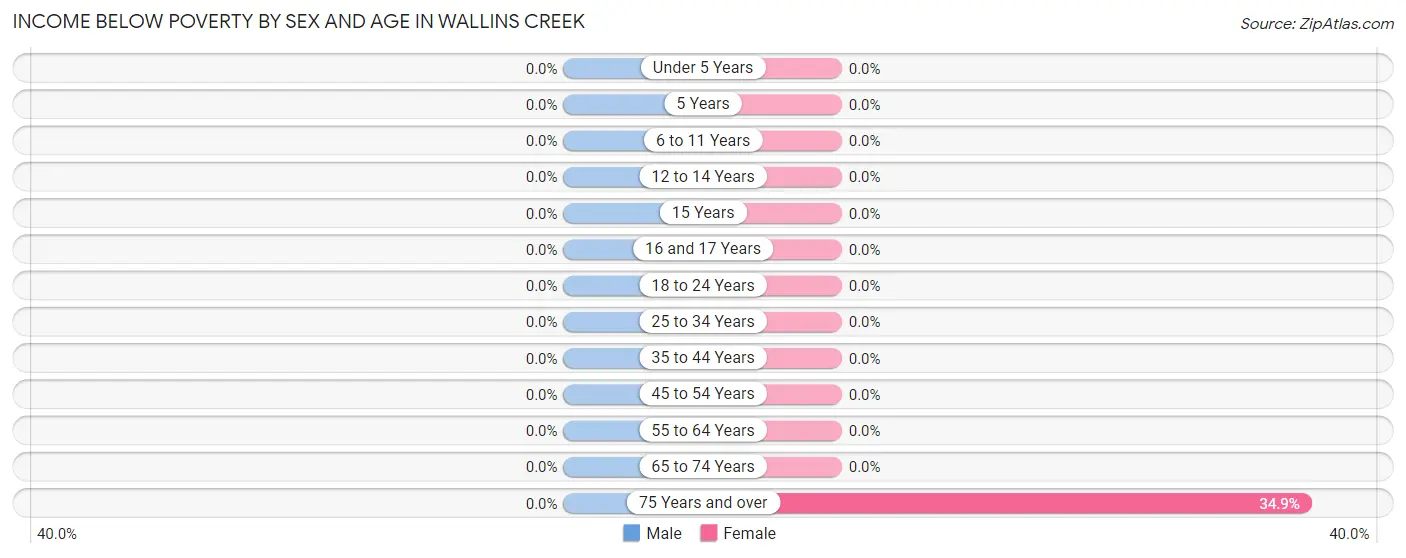
| Age Bracket | Male | Female |
| Under 5 Years | 0 (0.0%) | 0 (0.0%) |
| 5 Years | 0 (0.0%) | 0 (0.0%) |
| 6 to 11 Years | 0 (0.0%) | 0 (0.0%) |
| 12 to 14 Years | 0 (0.0%) | 0 (0.0%) |
| 15 Years | 0 (0.0%) | 0 (0.0%) |
| 16 and 17 Years | 0 (0.0%) | 0 (0.0%) |
| 18 to 24 Years | 0 (0.0%) | 0 (0.0%) |
| 25 to 34 Years | 0 (0.0%) | 0 (0.0%) |
| 35 to 44 Years | 0 (0.0%) | 0 (0.0%) |
| 45 to 54 Years | 0 (0.0%) | 0 (0.0%) |
| 55 to 64 Years | 0 (0.0%) | 0 (0.0%) |
| 65 to 74 Years | 0 (0.0%) | 0 (0.0%) |
| 75 Years and over | 0 (0.0%) | 15 (34.9%) |
| Total | 0 (0.0%) | 15 (6.1%) |
Income Above Poverty by Sex and Age in Wallins Creek
According to the poverty statistics in Wallins Creek, males aged 18 to 24 years and females aged 5 years are the age groups that are most secure financially, with 100.0% of males and 100.0% of females in these age groups living above the poverty line.
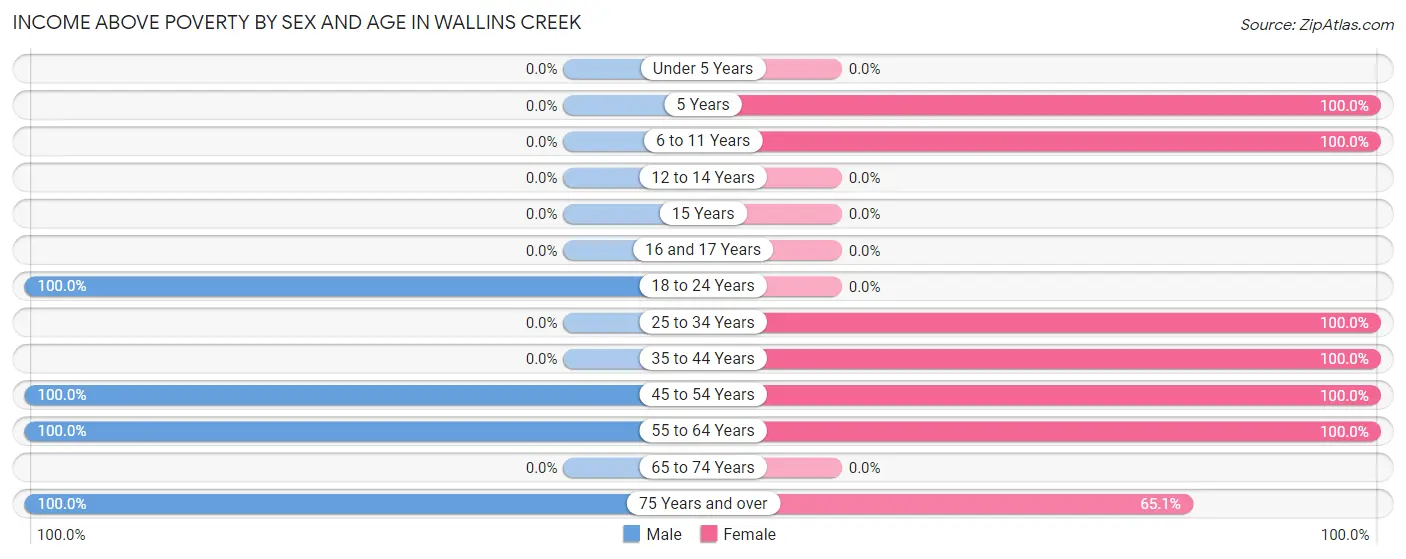
| Age Bracket | Male | Female |
| Under 5 Years | 0 (0.0%) | 0 (0.0%) |
| 5 Years | 0 (0.0%) | 15 (100.0%) |
| 6 to 11 Years | 0 (0.0%) | 15 (100.0%) |
| 12 to 14 Years | 0 (0.0%) | 0 (0.0%) |
| 15 Years | 0 (0.0%) | 0 (0.0%) |
| 16 and 17 Years | 0 (0.0%) | 0 (0.0%) |
| 18 to 24 Years | 33 (100.0%) | 0 (0.0%) |
| 25 to 34 Years | 0 (0.0%) | 47 (100.0%) |
| 35 to 44 Years | 0 (0.0%) | 89 (100.0%) |
| 45 to 54 Years | 42 (100.0%) | 26 (100.0%) |
| 55 to 64 Years | 99 (100.0%) | 9 (100.0%) |
| 65 to 74 Years | 0 (0.0%) | 0 (0.0%) |
| 75 Years and over | 11 (100.0%) | 28 (65.1%) |
| Total | 185 (100.0%) | 229 (93.9%) |
Income Below Poverty Among Married-Couple Families in Wallins Creek
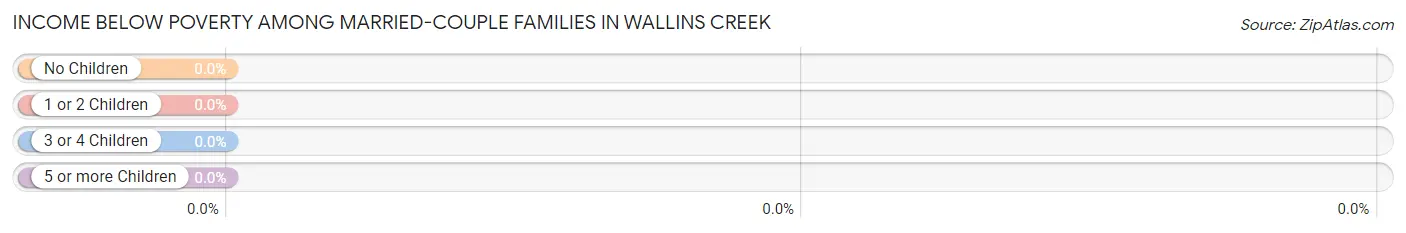
| Children | Above Poverty | Below Poverty |
| No Children | 106 (100.0%) | 0 (0.0%) |
| 1 or 2 Children | 0 (0.0%) | 0 (0.0%) |
| 3 or 4 Children | 0 (0.0%) | 0 (0.0%) |
| 5 or more Children | 0 (0.0%) | 0 (0.0%) |
| Total | 106 (100.0%) | 0 (0.0%) |
Income Below Poverty Among Single-Parent Households in Wallins Creek
| Children | Single Father | Single Mother |
| No Children | 0 (0.0%) | 0 (0.0%) |
| 1 or 2 Children | 0 (0.0%) | 0 (0.0%) |
| 3 or 4 Children | 0 (0.0%) | 0 (0.0%) |
| 5 or more Children | 0 (0.0%) | 0 (0.0%) |
| Total | 0 (0.0%) | 0 (0.0%) |
Income Below Poverty Among Married-Couple vs Single-Parent Households in Wallins Creek
| Children | Married-Couple Families | Single-Parent Households |
| No Children | 0 (0.0%) | 0 (0.0%) |
| 1 or 2 Children | 0 (0.0%) | 0 (0.0%) |
| 3 or 4 Children | 0 (0.0%) | 0 (0.0%) |
| 5 or more Children | 0 (0.0%) | 0 (0.0%) |
| Total | 0 (0.0%) | 0 (0.0%) |
Race in Wallins Creek
The most populous races in Wallins Creek are White / Caucasian (371 | 86.5%), and Asian (58 | 13.5%).
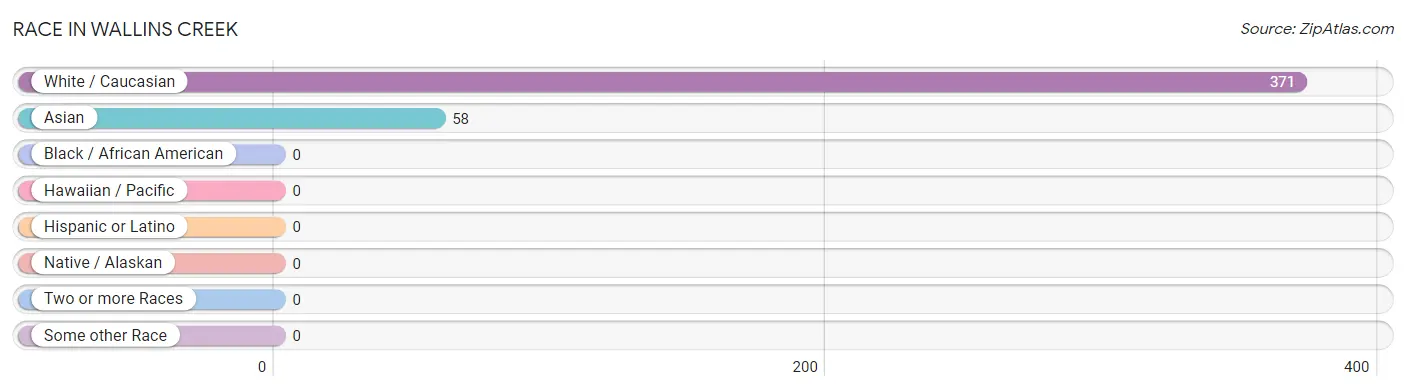
| Race | # Population | % Population |
| Asian | 58 | 13.5% |
| Black / African American | 0 | 0.0% |
| Hawaiian / Pacific | 0 | 0.0% |
| Hispanic or Latino | 0 | 0.0% |
| Native / Alaskan | 0 | 0.0% |
| White / Caucasian | 371 | 86.5% |
| Two or more Races | 0 | 0.0% |
| Some other Race | 0 | 0.0% |
| Total | 429 | 100.0% |
Ancestry in Wallins Creek
The most populous ancestries reported in Wallins Creek are Indian (Asian) (58 | 13.5%), and German (15 | 3.5%), together accounting for 17.0% of all Wallins Creek residents.
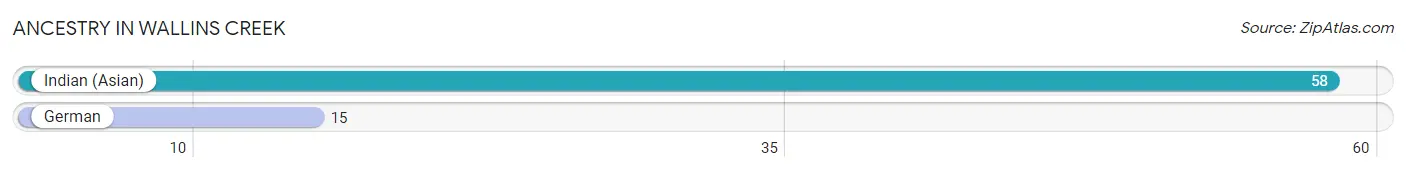
| Ancestry | # Population | % Population |
| German | 15 | 3.5% |
| Indian (Asian) | 58 | 13.5% | View All 2 Rows |
Immigrants in Wallins Creek
The most numerous immigrant groups reported in Wallins Creek came from Asia (58 | 13.5%), South Eastern Asia (30 | 7.0%), Vietnam (30 | 7.0%), China (28 | 6.5%), and Eastern Asia (28 | 6.5%), together accounting for 40.6% of all Wallins Creek residents.
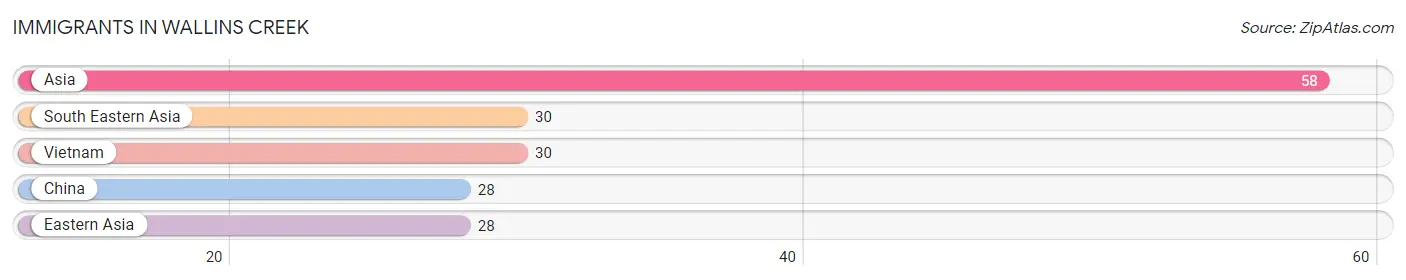
| Immigration Origin | # Population | % Population |
| Asia | 58 | 13.5% |
| China | 28 | 6.5% |
| Eastern Asia | 28 | 6.5% |
| South Eastern Asia | 30 | 7.0% |
| Vietnam | 30 | 7.0% | View All 5 Rows |
Sex and Age in Wallins Creek
Sex and Age in Wallins Creek
The most populous age groups in Wallins Creek are 55 to 59 Years (99 | 53.5%) for men and 40 to 44 Years (89 | 36.5%) for women.
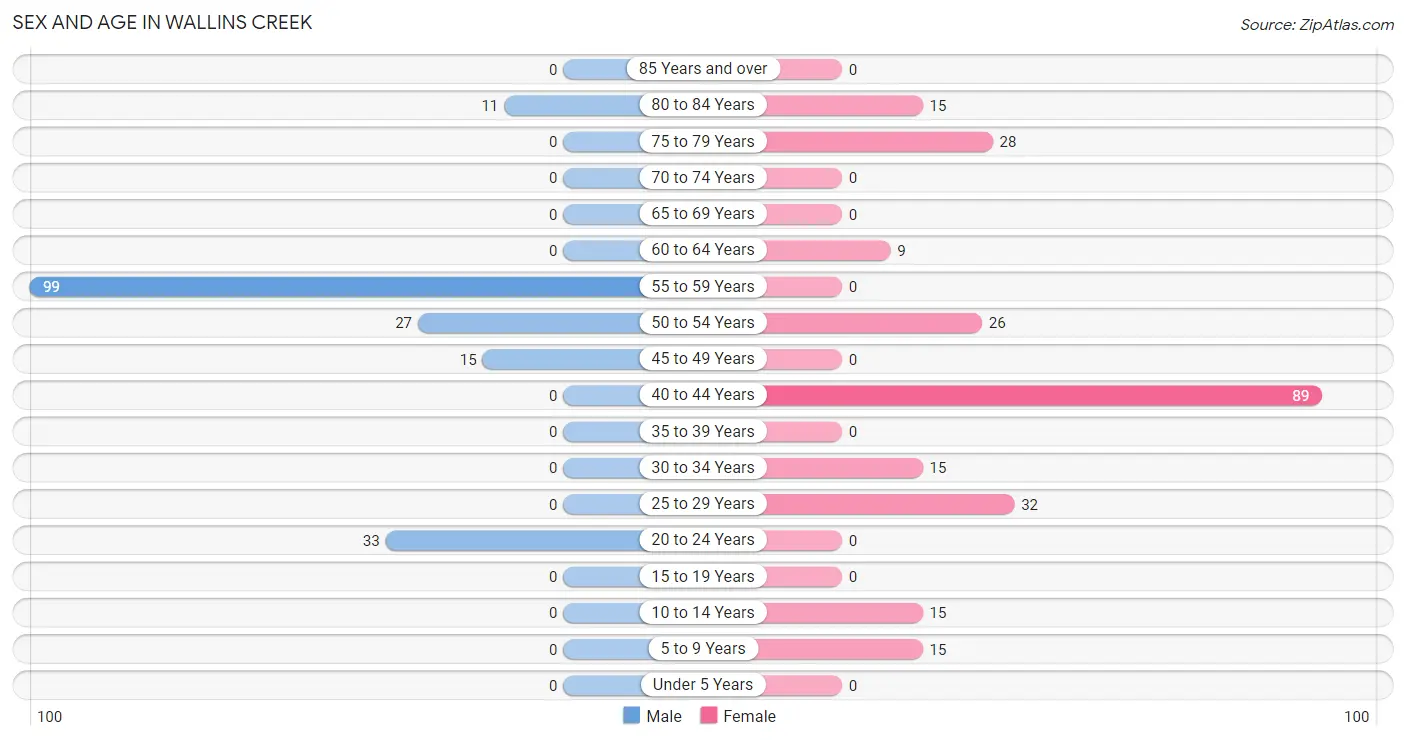
| Age Bracket | Male | Female |
| Under 5 Years | 0 (0.0%) | 0 (0.0%) |
| 5 to 9 Years | 0 (0.0%) | 15 (6.1%) |
| 10 to 14 Years | 0 (0.0%) | 15 (6.1%) |
| 15 to 19 Years | 0 (0.0%) | 0 (0.0%) |
| 20 to 24 Years | 33 (17.8%) | 0 (0.0%) |
| 25 to 29 Years | 0 (0.0%) | 32 (13.1%) |
| 30 to 34 Years | 0 (0.0%) | 15 (6.1%) |
| 35 to 39 Years | 0 (0.0%) | 0 (0.0%) |
| 40 to 44 Years | 0 (0.0%) | 89 (36.5%) |
| 45 to 49 Years | 15 (8.1%) | 0 (0.0%) |
| 50 to 54 Years | 27 (14.6%) | 26 (10.7%) |
| 55 to 59 Years | 99 (53.5%) | 0 (0.0%) |
| 60 to 64 Years | 0 (0.0%) | 9 (3.7%) |
| 65 to 69 Years | 0 (0.0%) | 0 (0.0%) |
| 70 to 74 Years | 0 (0.0%) | 0 (0.0%) |
| 75 to 79 Years | 0 (0.0%) | 28 (11.5%) |
| 80 to 84 Years | 11 (5.9%) | 15 (6.1%) |
| 85 Years and over | 0 (0.0%) | 0 (0.0%) |
| Total | 185 (100.0%) | 244 (100.0%) |
Families and Households in Wallins Creek
Median Family Size in Wallins Creek
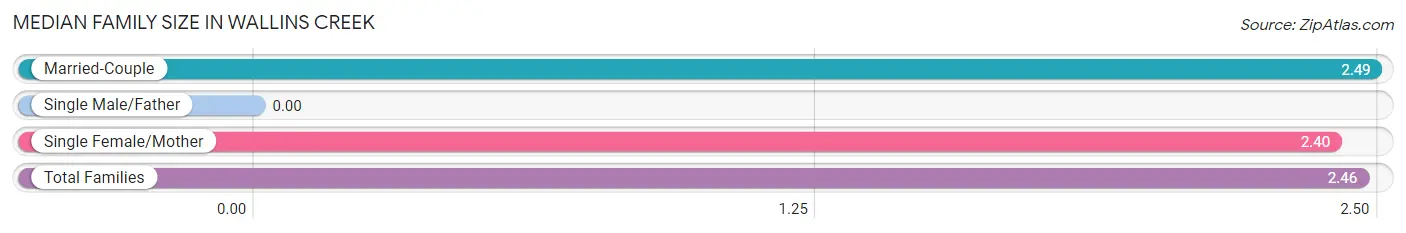
| Family Type | # Families | Family Size |
| Married-Couple | 106 (71.1%) | 2.49 |
| Single Male/Father | 0 (0.0%) | - |
| Single Female/Mother | 43 (28.9%) | 2.40 |
| Total Families | 149 (100.0%) | 2.46 |
Median Household Size in Wallins Creek
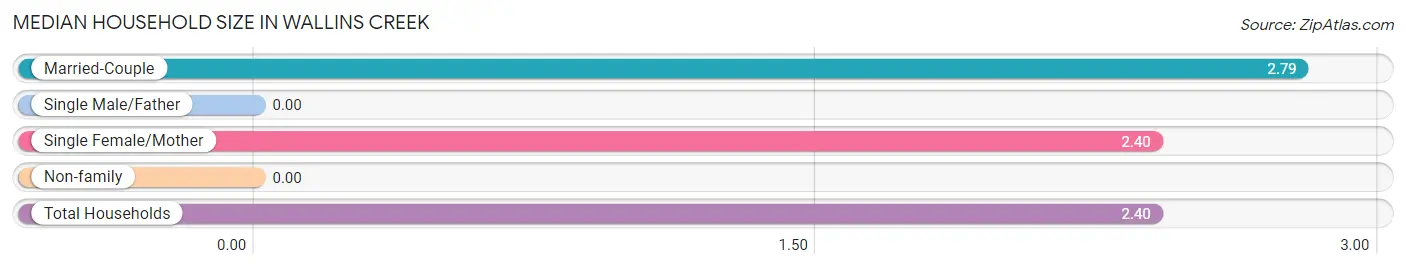
| Household Type | # Households | Household Size |
| Married-Couple | 106 (59.2%) | 2.79 |
| Single Male/Father | 0 (0.0%) | - |
| Single Female/Mother | 43 (24.0%) | 2.40 |
| Non-family | 30 (16.8%) | - |
| Total Households | 179 (100.0%) | 2.40 |
Household Size by Marriage Status in Wallins Creek
Out of a total of 179 households in Wallins Creek, 149 (83.2%) are family households, while 30 (16.8%) are nonfamily households. The most numerous type of family households are 2-person households, comprising 108, and the most common type of nonfamily households are 1-person households, comprising 30.
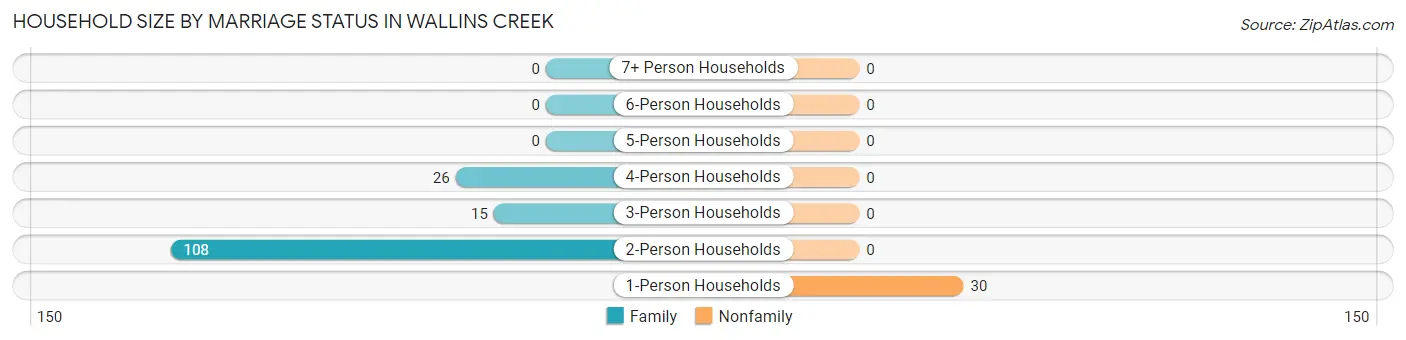
| Household Size | Family Households | Nonfamily Households |
| 1-Person Households | - | 30 (16.8%) |
| 2-Person Households | 108 (60.3%) | 0 (0.0%) |
| 3-Person Households | 15 (8.4%) | 0 (0.0%) |
| 4-Person Households | 26 (14.5%) | 0 (0.0%) |
| 5-Person Households | 0 (0.0%) | 0 (0.0%) |
| 6-Person Households | 0 (0.0%) | 0 (0.0%) |
| 7+ Person Households | 0 (0.0%) | 0 (0.0%) |
| Total | 149 (83.2%) | 30 (16.8%) |
Female Fertility in Wallins Creek
Fertility by Age in Wallins Creek
Average fertility rate in Wallins Creek is 235.0 births per 1,000 women. Women in the age bracket of 20 to 34 years have the highest fertility rate with 681.0 births per 1,000 women. Women in the age bracket of 20 to 34 years acount for 100.0% of all women with births.
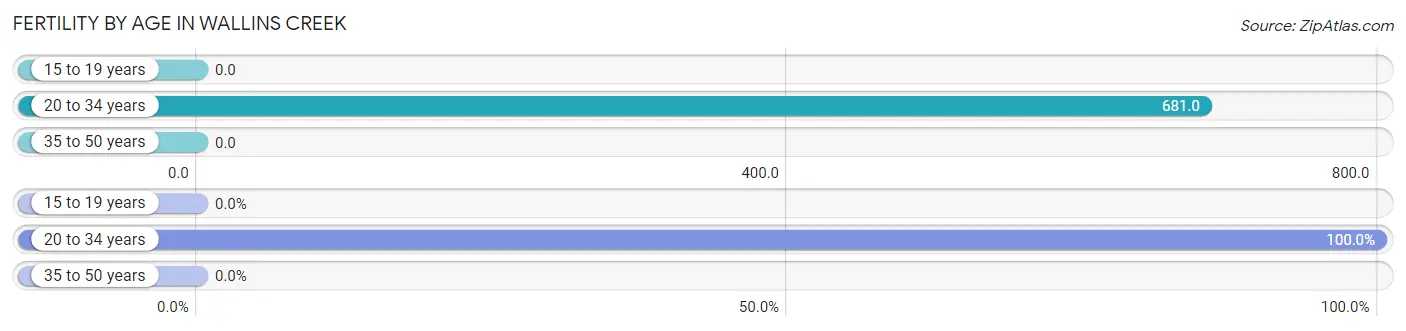
| Age Bracket | Women with Births | Births / 1,000 Women |
| 15 to 19 years | 0 (0.0%) | 0.0 |
| 20 to 34 years | 32 (100.0%) | 681.0 |
| 35 to 50 years | 0 (0.0%) | 0.0 |
| Total | 32 (100.0%) | 235.0 |
Fertility by Age by Marriage Status in Wallins Creek
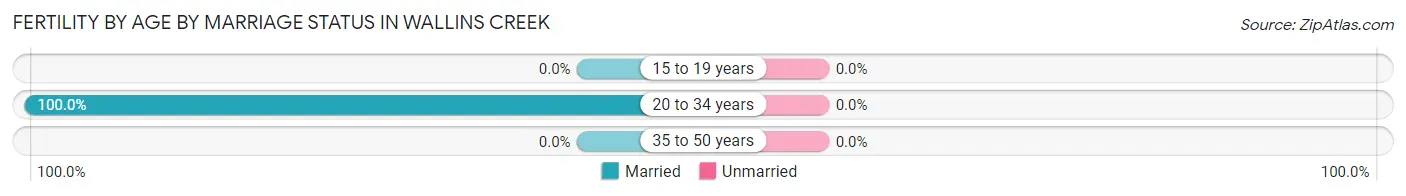
| Age Bracket | Married | Unmarried |
| 15 to 19 years | 0 (0.0%) | 0 (0.0%) |
| 20 to 34 years | 32 (100.0%) | 0 (0.0%) |
| 35 to 50 years | 0 (0.0%) | 0 (0.0%) |
| Total | 32 (100.0%) | 0 (0.0%) |
Fertility by Education in Wallins Creek
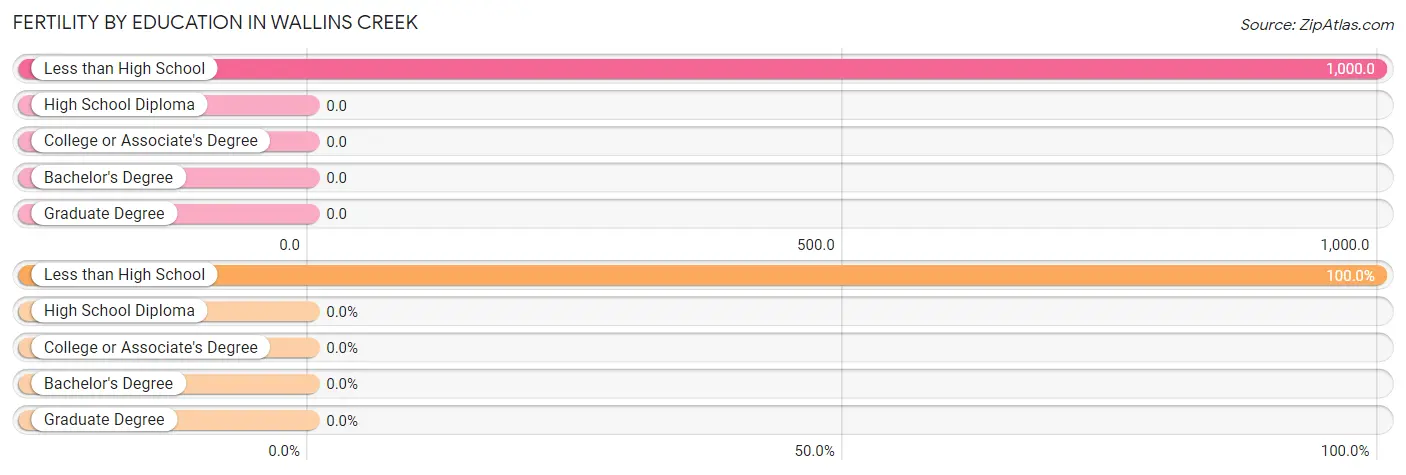
| Educational Attainment | Women with Births | Births / 1,000 Women |
| Less than High School | 32 (100.0%) | 1,000.0 |
| High School Diploma | 0 (0.0%) | 0.0 |
| College or Associate's Degree | 0 (0.0%) | 0.0 |
| Bachelor's Degree | 0 (0.0%) | 0.0 |
| Graduate Degree | 0 (0.0%) | 0.0 |
| Total | 32 (100.0%) | 235.0 |
Fertility by Education by Marriage Status in Wallins Creek
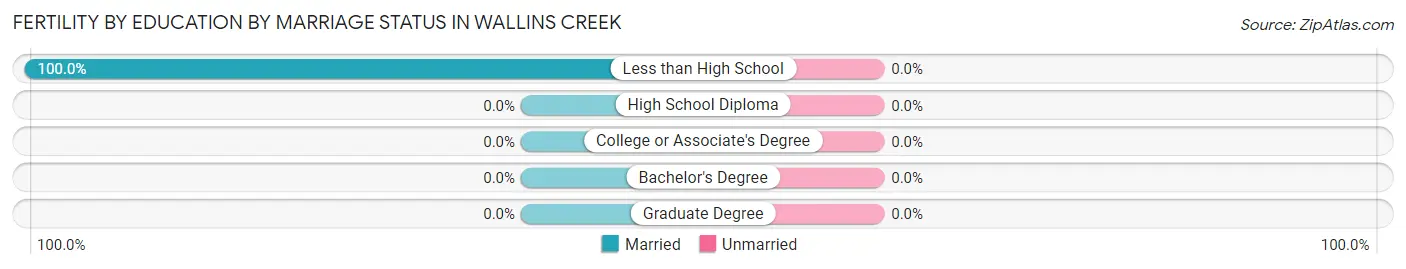
| Educational Attainment | Married | Unmarried |
| Less than High School | 32 (100.0%) | 0 (0.0%) |
| High School Diploma | 0 (0.0%) | 0 (0.0%) |
| College or Associate's Degree | 0 (0.0%) | 0 (0.0%) |
| Bachelor's Degree | 0 (0.0%) | 0 (0.0%) |
| Graduate Degree | 0 (0.0%) | 0 (0.0%) |
| Total | 32 (100.0%) | 0 (0.0%) |
Employment Characteristics in Wallins Creek
Employment by Class of Employer in Wallins Creek
Among the 137 employed individuals in Wallins Creek, private company employees (122 | 89.0%), and local government employees (15 | 11.0%) make up the most common classes of employment.
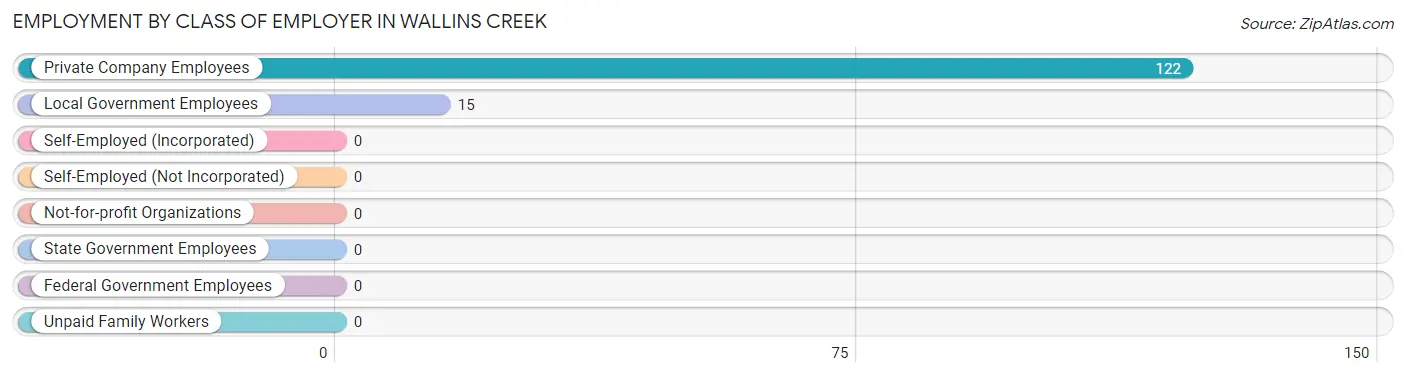
| Employer Class | # Employees | % Employees |
| Private Company Employees | 122 | 89.0% |
| Self-Employed (Incorporated) | 0 | 0.0% |
| Self-Employed (Not Incorporated) | 0 | 0.0% |
| Not-for-profit Organizations | 0 | 0.0% |
| Local Government Employees | 15 | 11.0% |
| State Government Employees | 0 | 0.0% |
| Federal Government Employees | 0 | 0.0% |
| Unpaid Family Workers | 0 | 0.0% |
| Total | 137 | 100.0% |
Employment Status by Age in Wallins Creek
According to the labor force statistics for Wallins Creek, out of the total population over 16 years of age (399), 38.1% or 152 individuals are in the labor force, with 9.9% or 15 of them unemployed. The age group with the highest labor force participation rate is 20 to 24 years, with 100.0% or 33 individuals in the labor force. Within the labor force, the 45 to 54 years age range has the highest percentage of unemployed individuals, with 100.0% or 15 of them being unemployed.
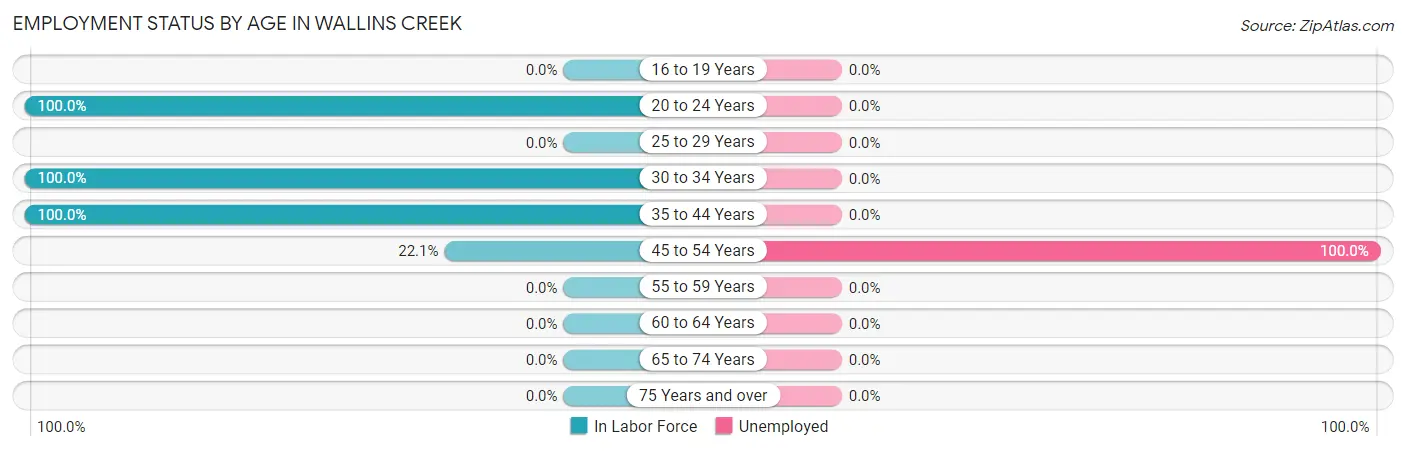
| Age Bracket | In Labor Force | Unemployed |
| 16 to 19 Years | 0 (0.0%) | 0 (0.0%) |
| 20 to 24 Years | 33 (100.0%) | 0 (0.0%) |
| 25 to 29 Years | 0 (0.0%) | 0 (0.0%) |
| 30 to 34 Years | 15 (100.0%) | 0 (0.0%) |
| 35 to 44 Years | 89 (100.0%) | 0 (0.0%) |
| 45 to 54 Years | 15 (22.1%) | 15 (100.0%) |
| 55 to 59 Years | 0 (0.0%) | 0 (0.0%) |
| 60 to 64 Years | 0 (0.0%) | 0 (0.0%) |
| 65 to 74 Years | 0 (0.0%) | 0 (0.0%) |
| 75 Years and over | 0 (0.0%) | 0 (0.0%) |
| Total | 152 (38.1%) | 15 (9.9%) |
Employment Status by Educational Attainment in Wallins Creek
According to labor force statistics for Wallins Creek, 38.1% of individuals (119) out of the total population between 25 and 64 years of age (312) are in the labor force, with 12.6% or 15 of them being unemployed. The group with the highest labor force participation rate are those with the educational attainment of college / associate degree, with 51.2% or 104 individuals in the labor force. Within the labor force, individuals with high school diploma education have the highest percentage of unemployment, with 100.0% or 15 of them being unemployed.
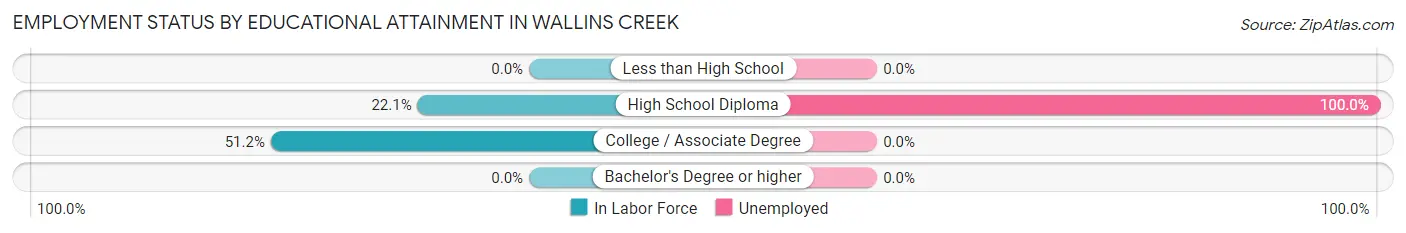
| Educational Attainment | In Labor Force | Unemployed |
| Less than High School | 0 (0.0%) | 0 (0.0%) |
| High School Diploma | 15 (22.1%) | 68 (100.0%) |
| College / Associate Degree | 104 (51.2%) | 0 (0.0%) |
| Bachelor's Degree or higher | 0 (0.0%) | 0 (0.0%) |
| Total | 119 (38.1%) | 39 (12.6%) |
Employment Occupations by Sex in Wallins Creek
Management, Business, Science and Arts Occupations
Management, Business, Science and Arts Occupations by Sex
| Occupation | Male | Female |
| Management | 0 (0.0%) | 0 (0.0%) |
| Business & Financial | 0 (0.0%) | 0 (0.0%) |
| Computers, Engineering & Science | 0 (0.0%) | 0 (0.0%) |
| Computers & Mathematics | 0 (0.0%) | 0 (0.0%) |
| Architecture & Engineering | 0 (0.0%) | 0 (0.0%) |
| Life, Physical & Social Science | 0 (0.0%) | 0 (0.0%) |
| Community & Social Service | 0 (0.0%) | 0 (0.0%) |
| Education, Arts & Media | 0 (0.0%) | 0 (0.0%) |
| Legal Services & Support | 0 (0.0%) | 0 (0.0%) |
| Education Instruction & Library | 0 (0.0%) | 0 (0.0%) |
| Arts, Media & Entertainment | 0 (0.0%) | 0 (0.0%) |
| Health Diagnosing & Treating | 0 (0.0%) | 0 (0.0%) |
| Health Technologists | 0 (0.0%) | 0 (0.0%) |
| Total (Category) | 0 (0.0%) | 0 (0.0%) |
| Total (Overall) | 33 (24.1%) | 104 (75.9%) |
Services Occupations
The most common Services occupations in Wallins Creek are Security & Protection (15 | 11.0%), and Law Enforcement (15 | 11.0%).
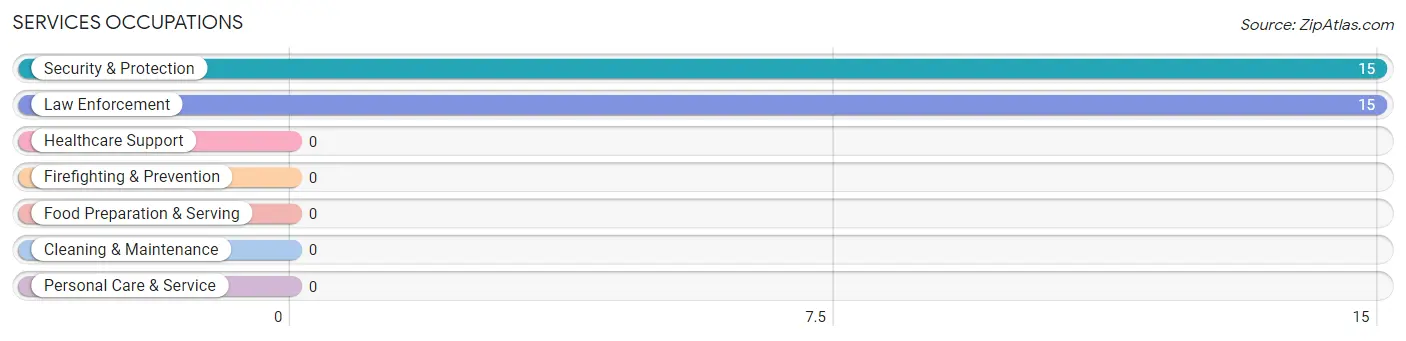
Services Occupations by Sex
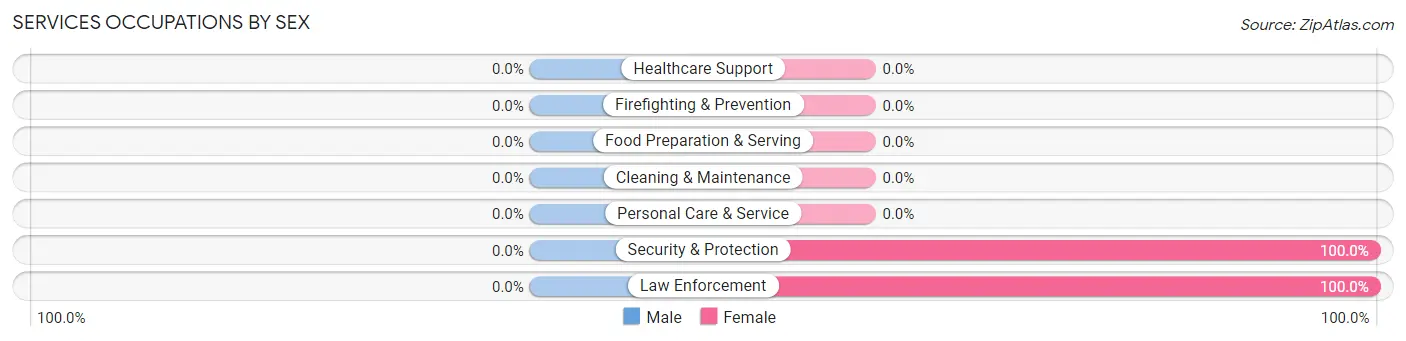
| Occupation | Male | Female |
| Healthcare Support | 0 (0.0%) | 0 (0.0%) |
| Security & Protection | 0 (0.0%) | 15 (100.0%) |
| Firefighting & Prevention | 0 (0.0%) | 0 (0.0%) |
| Law Enforcement | 0 (0.0%) | 15 (100.0%) |
| Food Preparation & Serving | 0 (0.0%) | 0 (0.0%) |
| Cleaning & Maintenance | 0 (0.0%) | 0 (0.0%) |
| Personal Care & Service | 0 (0.0%) | 0 (0.0%) |
| Total (Category) | 0 (0.0%) | 15 (100.0%) |
| Total (Overall) | 33 (24.1%) | 104 (75.9%) |
Sales and Office Occupations
The most common Sales and Office occupations in Wallins Creek are , and Office & Administration (89 | 65.0%).
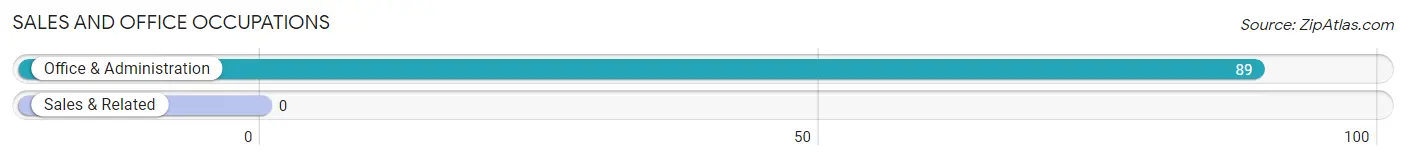
Sales and Office Occupations by Sex
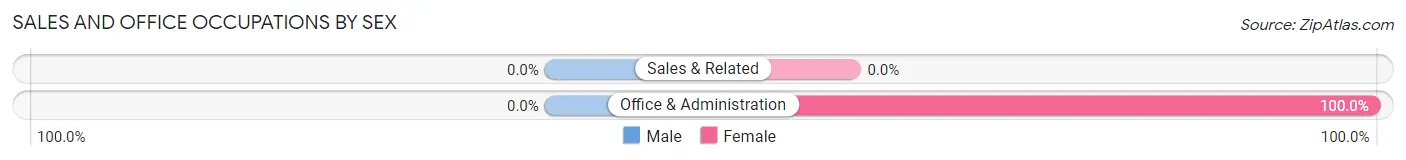
| Occupation | Male | Female |
| Sales & Related | 0 (0.0%) | 0 (0.0%) |
| Office & Administration | 0 (0.0%) | 89 (100.0%) |
| Total (Category) | 0 (0.0%) | 89 (100.0%) |
| Total (Overall) | 33 (24.1%) | 104 (75.9%) |
Natural Resources, Construction and Maintenance Occupations
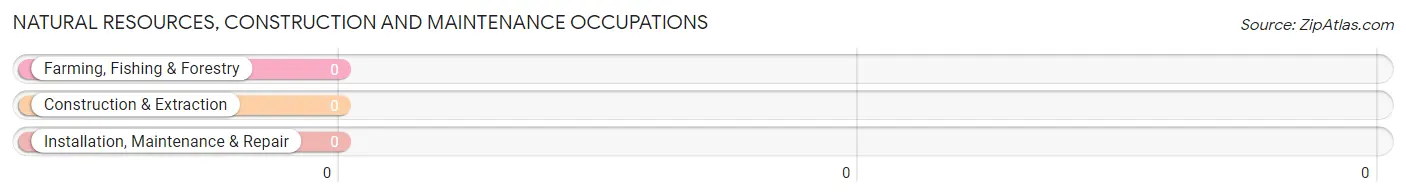
Natural Resources, Construction and Maintenance Occupations by Sex
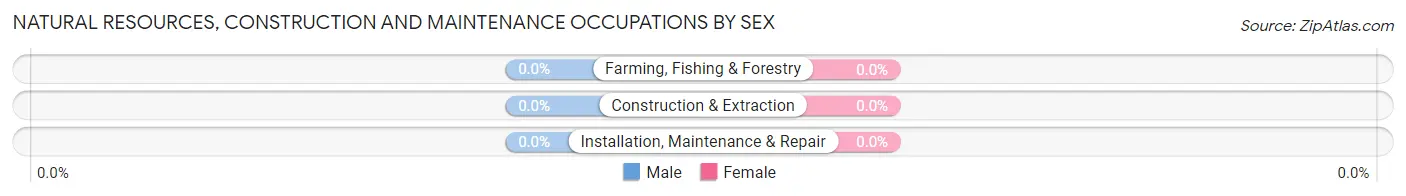
| Occupation | Male | Female |
| Farming, Fishing & Forestry | 0 (0.0%) | 0 (0.0%) |
| Construction & Extraction | 0 (0.0%) | 0 (0.0%) |
| Installation, Maintenance & Repair | 0 (0.0%) | 0 (0.0%) |
| Total (Category) | 0 (0.0%) | 0 (0.0%) |
| Total (Overall) | 33 (24.1%) | 104 (75.9%) |
Production, Transportation and Moving Occupations
The most common Production, Transportation and Moving occupations in Wallins Creek are , and Material Moving (33 | 24.1%).
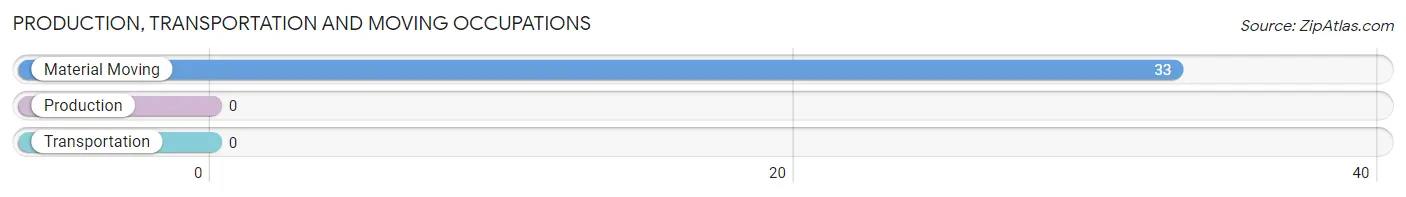
Production, Transportation and Moving Occupations by Sex
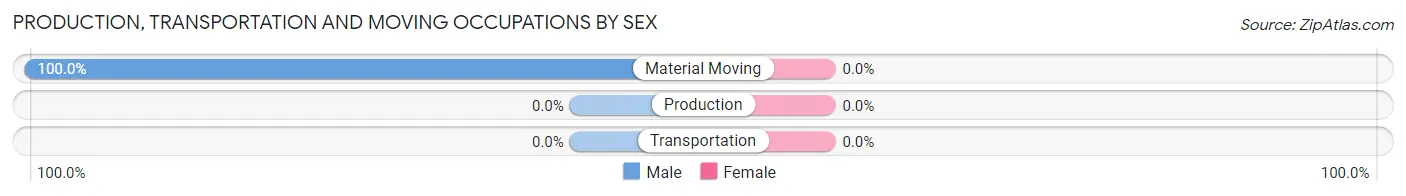
| Occupation | Male | Female |
| Production | 0 (0.0%) | 0 (0.0%) |
| Transportation | 0 (0.0%) | 0 (0.0%) |
| Material Moving | 33 (100.0%) | 0 (0.0%) |
| Total (Category) | 33 (100.0%) | 0 (0.0%) |
| Total (Overall) | 33 (24.1%) | 104 (75.9%) |
Employment Industries by Sex in Wallins Creek
Employment Industries in Wallins Creek
The major employment industries in Wallins Creek include Construction (89 | 65.0%), Manufacturing (33 | 24.1%), and Public Administration (15 | 11.0%).
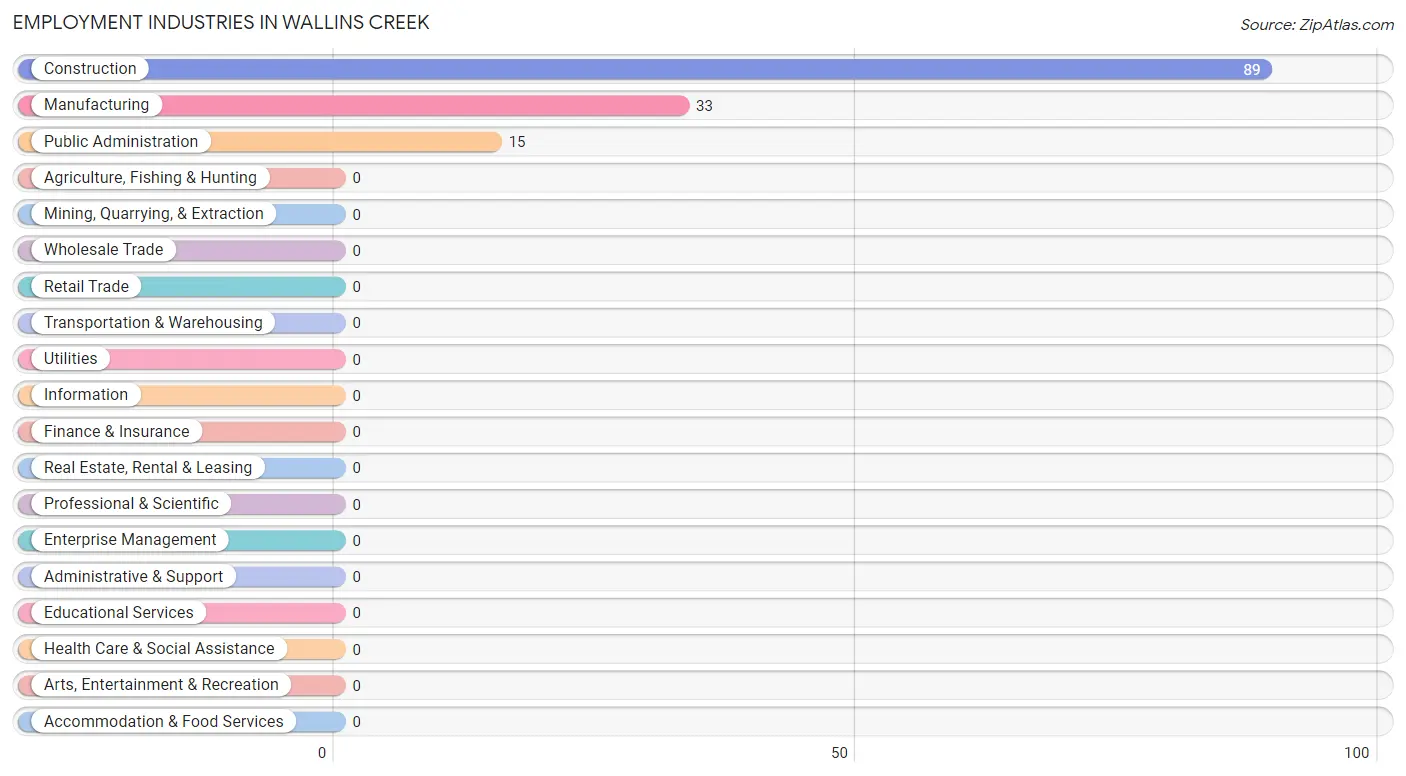
Employment Industries by Sex in Wallins Creek
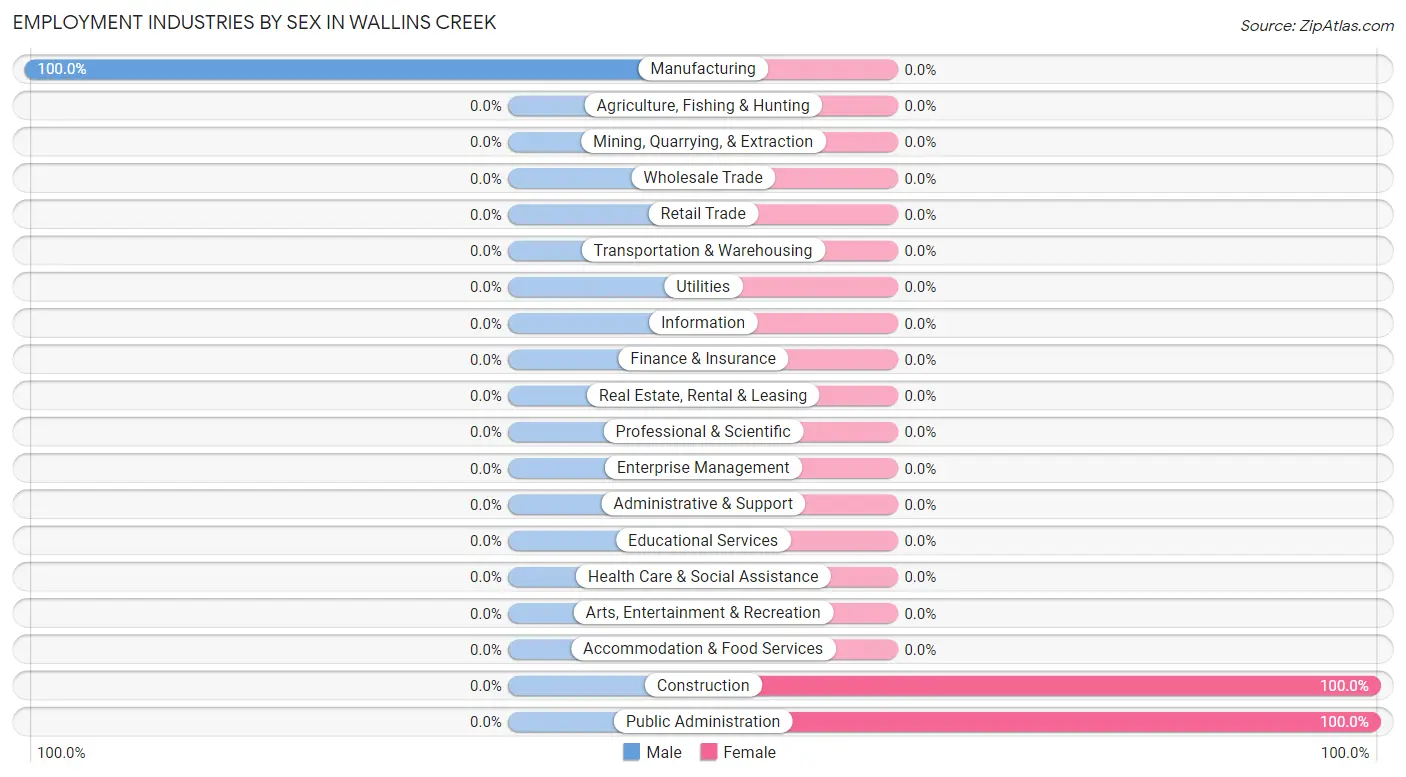
| Industry | Male | Female |
| Agriculture, Fishing & Hunting | 0 (0.0%) | 0 (0.0%) |
| Mining, Quarrying, & Extraction | 0 (0.0%) | 0 (0.0%) |
| Construction | 0 (0.0%) | 89 (100.0%) |
| Manufacturing | 33 (100.0%) | 0 (0.0%) |
| Wholesale Trade | 0 (0.0%) | 0 (0.0%) |
| Retail Trade | 0 (0.0%) | 0 (0.0%) |
| Transportation & Warehousing | 0 (0.0%) | 0 (0.0%) |
| Utilities | 0 (0.0%) | 0 (0.0%) |
| Information | 0 (0.0%) | 0 (0.0%) |
| Finance & Insurance | 0 (0.0%) | 0 (0.0%) |
| Real Estate, Rental & Leasing | 0 (0.0%) | 0 (0.0%) |
| Professional & Scientific | 0 (0.0%) | 0 (0.0%) |
| Enterprise Management | 0 (0.0%) | 0 (0.0%) |
| Administrative & Support | 0 (0.0%) | 0 (0.0%) |
| Educational Services | 0 (0.0%) | 0 (0.0%) |
| Health Care & Social Assistance | 0 (0.0%) | 0 (0.0%) |
| Arts, Entertainment & Recreation | 0 (0.0%) | 0 (0.0%) |
| Accommodation & Food Services | 0 (0.0%) | 0 (0.0%) |
| Public Administration | 0 (0.0%) | 15 (100.0%) |
| Total | 33 (24.1%) | 104 (75.9%) |
Education in Wallins Creek
School Enrollment in Wallins Creek
The most common levels of schooling among the 30 students in Wallins Creek are kindergarten (15 | 50.0%), and middle school (15 | 50.0%).
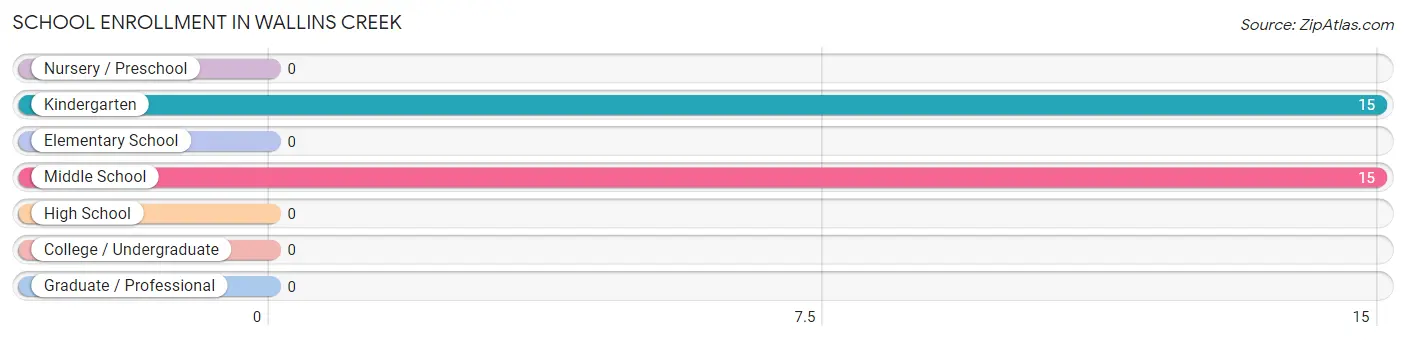
| School Level | # Students | % Students |
| Nursery / Preschool | 0 | 0.0% |
| Kindergarten | 15 | 50.0% |
| Elementary School | 0 | 0.0% |
| Middle School | 15 | 50.0% |
| High School | 0 | 0.0% |
| College / Undergraduate | 0 | 0.0% |
| Graduate / Professional | 0 | 0.0% |
| Total | 30 | 100.0% |
School Enrollment by Age by Funding Source in Wallins Creek
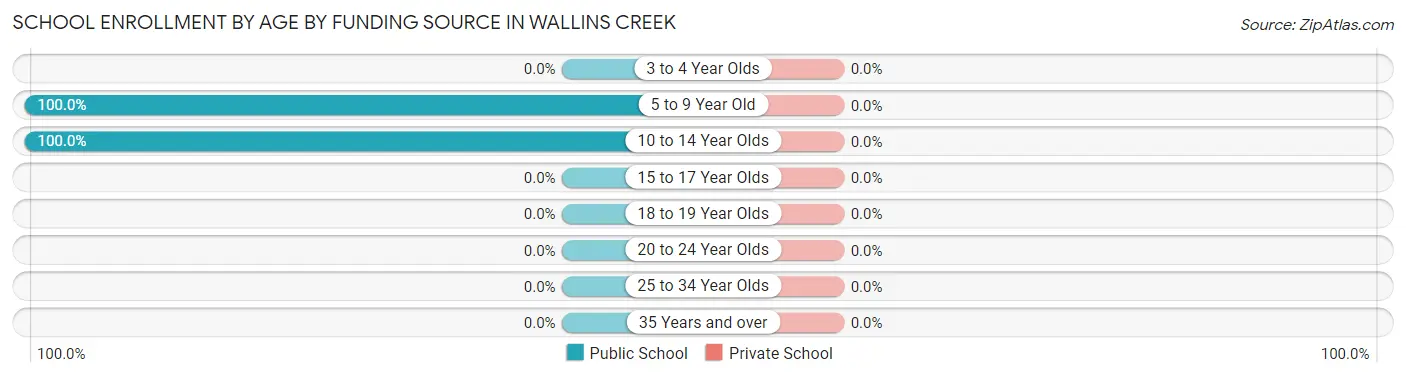
| Age Bracket | Public School | Private School |
| 3 to 4 Year Olds | 0 (0.0%) | 0 (0.0%) |
| 5 to 9 Year Old | 15 (100.0%) | 0 (0.0%) |
| 10 to 14 Year Olds | 15 (100.0%) | 0 (0.0%) |
| 15 to 17 Year Olds | 0 (0.0%) | 0 (0.0%) |
| 18 to 19 Year Olds | 0 (0.0%) | 0 (0.0%) |
| 20 to 24 Year Olds | 0 (0.0%) | 0 (0.0%) |
| 25 to 34 Year Olds | 0 (0.0%) | 0 (0.0%) |
| 35 Years and over | 0 (0.0%) | 0 (0.0%) |
| Total | 30 (100.0%) | 0 (0.0%) |
Educational Attainment by Field of Study in Wallins Creek
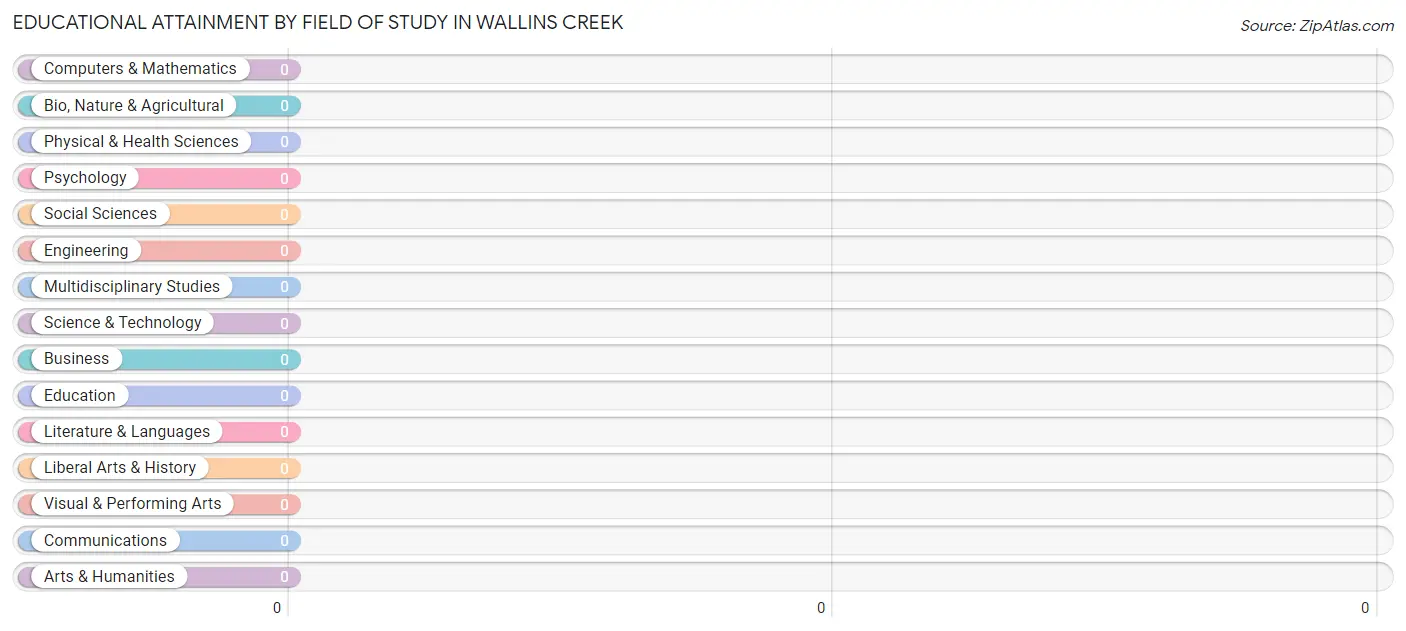
| Field of Study | # Graduates | % Graduates |
| Computers & Mathematics | 0 | 0.0% |
| Bio, Nature & Agricultural | 0 | 0.0% |
| Physical & Health Sciences | 0 | 0.0% |
| Psychology | 0 | 0.0% |
| Social Sciences | 0 | 0.0% |
| Engineering | 0 | 0.0% |
| Multidisciplinary Studies | 0 | 0.0% |
| Science & Technology | 0 | 0.0% |
| Business | 0 | 0.0% |
| Education | 0 | 0.0% |
| Literature & Languages | 0 | 0.0% |
| Liberal Arts & History | 0 | 0.0% |
| Visual & Performing Arts | 0 | 0.0% |
| Communications | 0 | 0.0% |
| Arts & Humanities | 0 | 0.0% |
| Total | 0 | 0.0% |
Transportation & Commute in Wallins Creek
Vehicle Availability by Sex in Wallins Creek
The most prevalent vehicle ownership categories in Wallins Creek are males with 2 vehicles (33, accounting for 100.0%) and females with 2 vehicles (15, making up 31.7%).
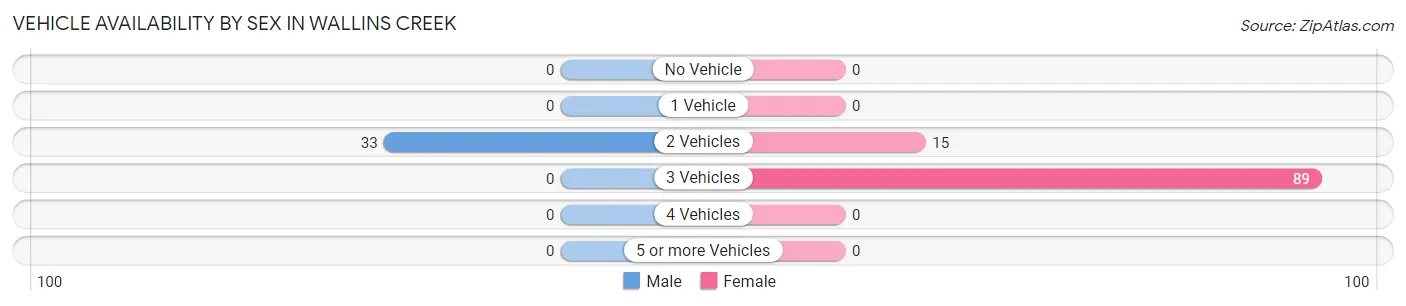
| Vehicles Available | Male | Female |
| No Vehicle | 0 (0.0%) | 0 (0.0%) |
| 1 Vehicle | 0 (0.0%) | 0 (0.0%) |
| 2 Vehicles | 33 (100.0%) | 15 (14.4%) |
| 3 Vehicles | 0 (0.0%) | 89 (85.6%) |
| 4 Vehicles | 0 (0.0%) | 0 (0.0%) |
| 5 or more Vehicles | 0 (0.0%) | 0 (0.0%) |
| Total | 33 (100.0%) | 104 (100.0%) |
Commute Time in Wallins Creek
The most frequently occuring commute durations in Wallins Creek are 10 to 14 minutes (89 commuters, 65.0%), 45 to 59 minutes (33 commuters, 24.1%), and 40 to 44 minutes (15 commuters, 11.0%).
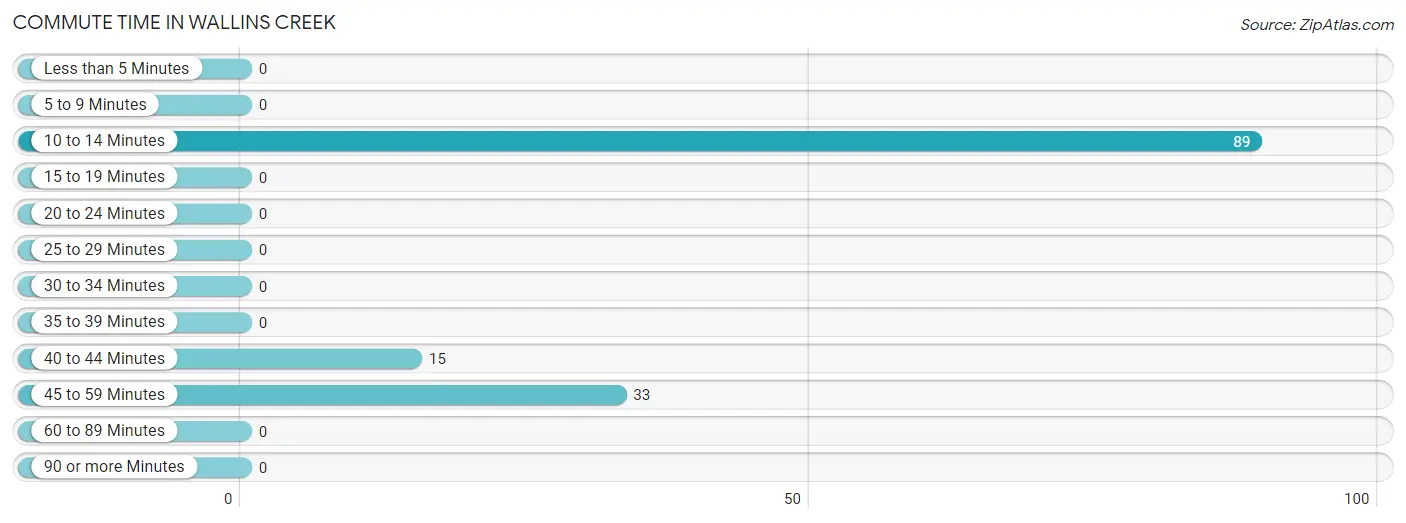
| Commute Time | # Commuters | % Commuters |
| Less than 5 Minutes | 0 | 0.0% |
| 5 to 9 Minutes | 0 | 0.0% |
| 10 to 14 Minutes | 89 | 65.0% |
| 15 to 19 Minutes | 0 | 0.0% |
| 20 to 24 Minutes | 0 | 0.0% |
| 25 to 29 Minutes | 0 | 0.0% |
| 30 to 34 Minutes | 0 | 0.0% |
| 35 to 39 Minutes | 0 | 0.0% |
| 40 to 44 Minutes | 15 | 11.0% |
| 45 to 59 Minutes | 33 | 24.1% |
| 60 to 89 Minutes | 0 | 0.0% |
| 90 or more Minutes | 0 | 0.0% |
Commute Time by Sex in Wallins Creek
The most common commute times in Wallins Creek are 45 to 59 minutes (33 commuters, 100.0%) for males and 10 to 14 minutes (89 commuters, 85.6%) for females.
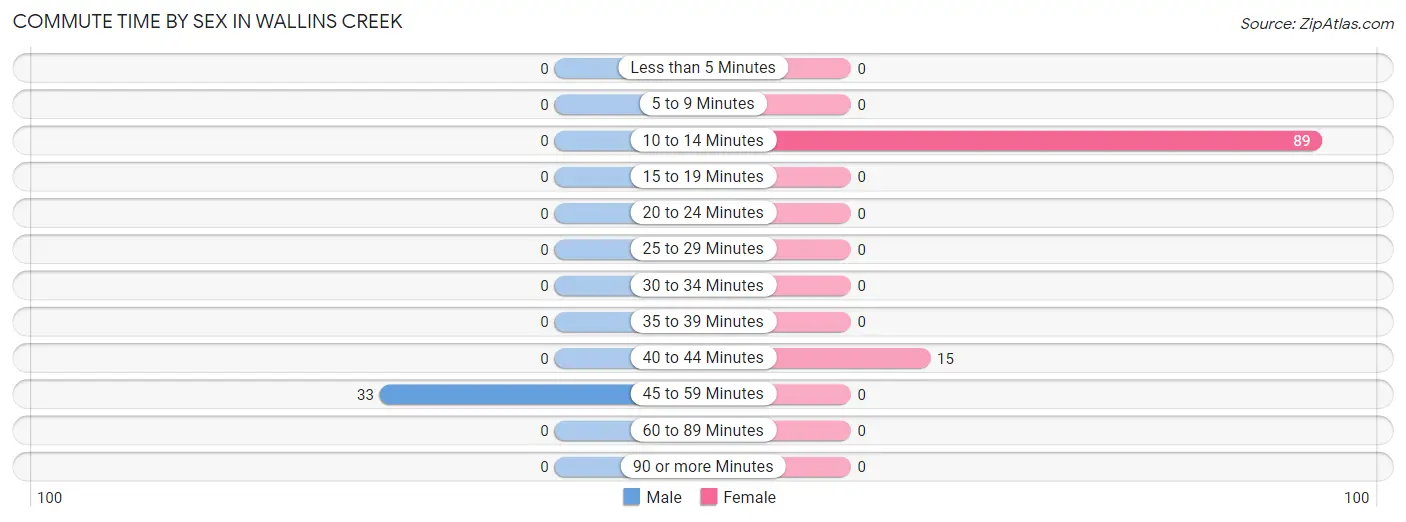
| Commute Time | Male | Female |
| Less than 5 Minutes | 0 (0.0%) | 0 (0.0%) |
| 5 to 9 Minutes | 0 (0.0%) | 0 (0.0%) |
| 10 to 14 Minutes | 0 (0.0%) | 89 (85.6%) |
| 15 to 19 Minutes | 0 (0.0%) | 0 (0.0%) |
| 20 to 24 Minutes | 0 (0.0%) | 0 (0.0%) |
| 25 to 29 Minutes | 0 (0.0%) | 0 (0.0%) |
| 30 to 34 Minutes | 0 (0.0%) | 0 (0.0%) |
| 35 to 39 Minutes | 0 (0.0%) | 0 (0.0%) |
| 40 to 44 Minutes | 0 (0.0%) | 15 (14.4%) |
| 45 to 59 Minutes | 33 (100.0%) | 0 (0.0%) |
| 60 to 89 Minutes | 0 (0.0%) | 0 (0.0%) |
| 90 or more Minutes | 0 (0.0%) | 0 (0.0%) |
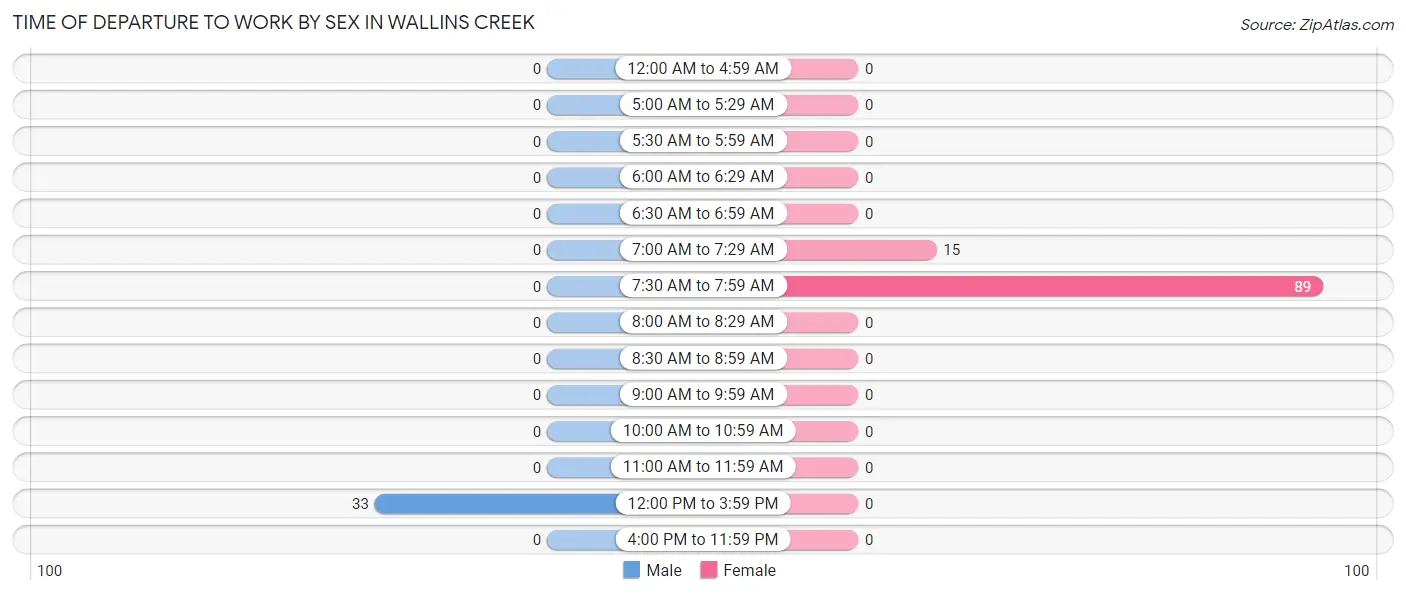
Time of Departure to Work by Sex in Wallins Creek
The most frequent times of departure to work in Wallins Creek are 12:00 PM to 3:59 PM (33, 100.0%) for males and 7:30 AM to 7:59 AM (89, 85.6%) for females.
| Time of Departure | Male | Female |
| 12:00 AM to 4:59 AM | 0 (0.0%) | 0 (0.0%) |
| 5:00 AM to 5:29 AM | 0 (0.0%) | 0 (0.0%) |
| 5:30 AM to 5:59 AM | 0 (0.0%) | 0 (0.0%) |
| 6:00 AM to 6:29 AM | 0 (0.0%) | 0 (0.0%) |
| 6:30 AM to 6:59 AM | 0 (0.0%) | 0 (0.0%) |
| 7:00 AM to 7:29 AM | 0 (0.0%) | 15 (14.4%) |
| 7:30 AM to 7:59 AM | 0 (0.0%) | 89 (85.6%) |
| 8:00 AM to 8:29 AM | 0 (0.0%) | 0 (0.0%) |
| 8:30 AM to 8:59 AM | 0 (0.0%) | 0 (0.0%) |
| 9:00 AM to 9:59 AM | 0 (0.0%) | 0 (0.0%) |
| 10:00 AM to 10:59 AM | 0 (0.0%) | 0 (0.0%) |
| 11:00 AM to 11:59 AM | 0 (0.0%) | 0 (0.0%) |
| 12:00 PM to 3:59 PM | 33 (100.0%) | 0 (0.0%) |
| 4:00 PM to 11:59 PM | 0 (0.0%) | 0 (0.0%) |
| Total | 33 (100.0%) | 104 (100.0%) |
Housing Occupancy in Wallins Creek
Occupancy by Ownership in Wallins Creek
Of the total 179 dwellings in Wallins Creek, owner-occupied units account for 164 (91.6%), while renter-occupied units make up 15 (8.4%).
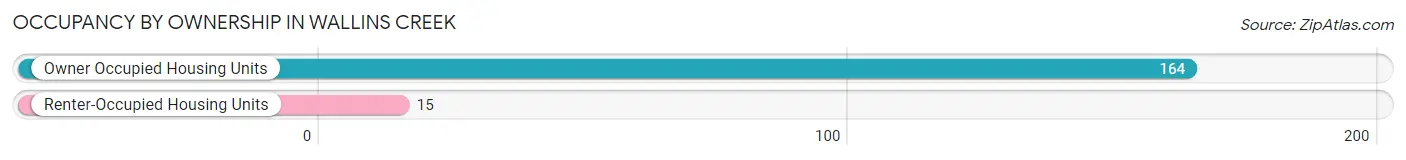
| Occupancy | # Housing Units | % Housing Units |
| Owner Occupied Housing Units | 164 | 91.6% |
| Renter-Occupied Housing Units | 15 | 8.4% |
| Total Occupied Housing Units | 179 | 100.0% |
Occupancy by Household Size in Wallins Creek
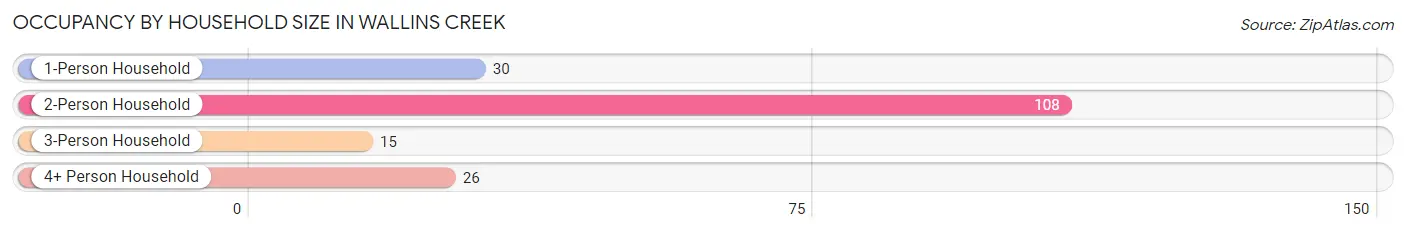
| Household Size | # Housing Units | % Housing Units |
| 1-Person Household | 30 | 16.8% |
| 2-Person Household | 108 | 60.3% |
| 3-Person Household | 15 | 8.4% |
| 4+ Person Household | 26 | 14.5% |
| Total Housing Units | 179 | 100.0% |
Occupancy by Ownership by Household Size in Wallins Creek
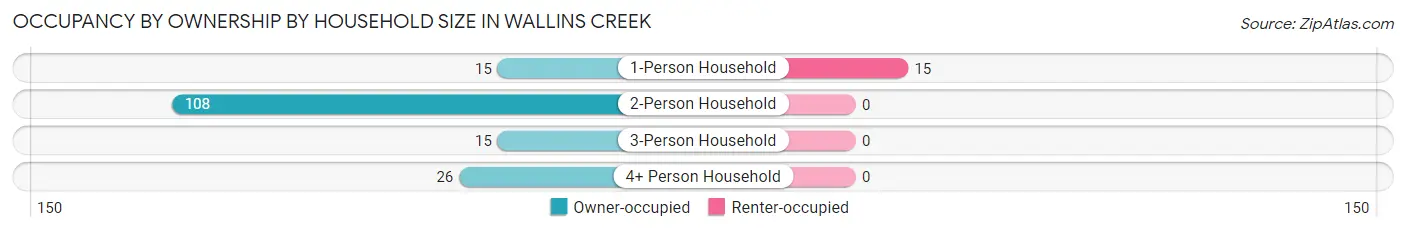
| Household Size | Owner-occupied | Renter-occupied |
| 1-Person Household | 15 (50.0%) | 15 (50.0%) |
| 2-Person Household | 108 (100.0%) | 0 (0.0%) |
| 3-Person Household | 15 (100.0%) | 0 (0.0%) |
| 4+ Person Household | 26 (100.0%) | 0 (0.0%) |
| Total Housing Units | 164 (91.6%) | 15 (8.4%) |
Occupancy by Educational Attainment in Wallins Creek
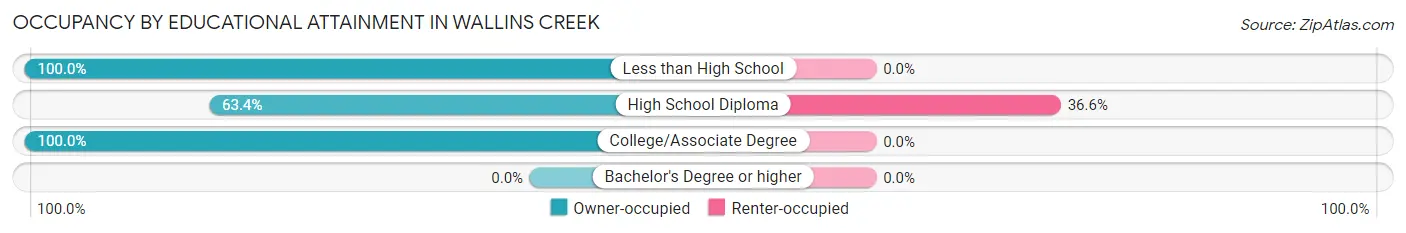
| Household Size | Owner-occupied | Renter-occupied |
| Less than High School | 26 (100.0%) | 0 (0.0%) |
| High School Diploma | 26 (63.4%) | 15 (36.6%) |
| College/Associate Degree | 112 (100.0%) | 0 (0.0%) |
| Bachelor's Degree or higher | 0 (0.0%) | 0 (0.0%) |
Occupancy by Age of Householder in Wallins Creek
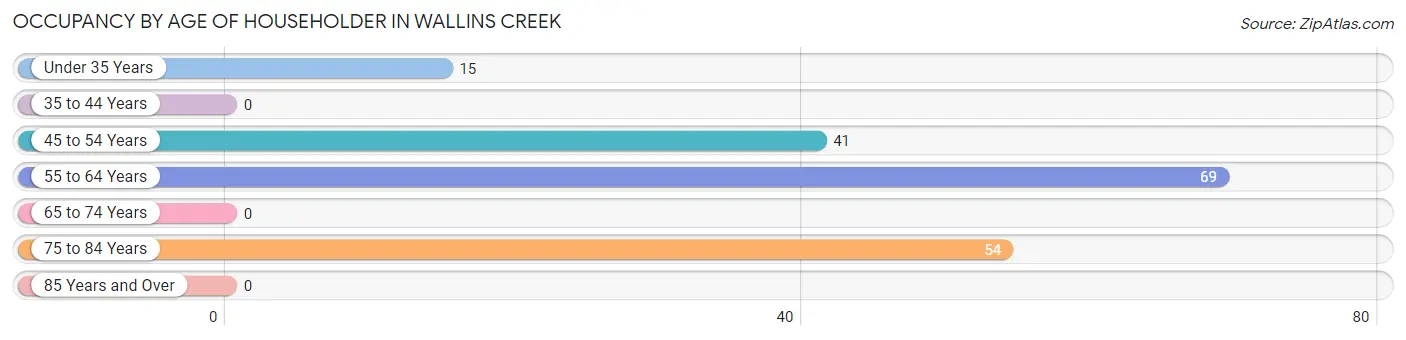
| Age Bracket | # Households | % Households |
| Under 35 Years | 15 | 8.4% |
| 35 to 44 Years | 0 | 0.0% |
| 45 to 54 Years | 41 | 22.9% |
| 55 to 64 Years | 69 | 38.6% |
| 65 to 74 Years | 0 | 0.0% |
| 75 to 84 Years | 54 | 30.2% |
| 85 Years and Over | 0 | 0.0% |
| Total | 179 | 100.0% |
Housing Finances in Wallins Creek
Median Income by Occupancy in Wallins Creek
| Occupancy Type | # Households | Median Income |
| Owner-Occupied | 164 (91.6%) | $0 |
| Renter-Occupied | 15 (8.4%) | $0 |
| Average | 179 (100.0%) | $0 |
Occupancy by Householder Income Bracket in Wallins Creek
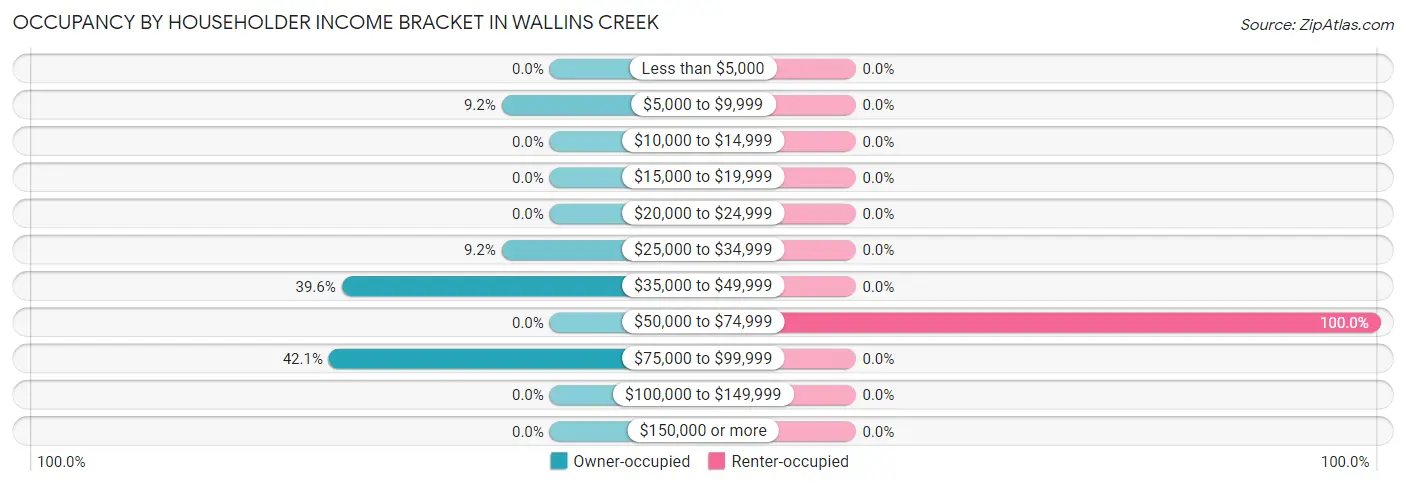
| Income Bracket | Owner-occupied | Renter-occupied |
| Less than $5,000 | 0 (0.0%) | 0 (0.0%) |
| $5,000 to $9,999 | 15 (9.1%) | 0 (0.0%) |
| $10,000 to $14,999 | 0 (0.0%) | 0 (0.0%) |
| $15,000 to $19,999 | 0 (0.0%) | 0 (0.0%) |
| $20,000 to $24,999 | 0 (0.0%) | 0 (0.0%) |
| $25,000 to $34,999 | 15 (9.1%) | 0 (0.0%) |
| $35,000 to $49,999 | 65 (39.6%) | 0 (0.0%) |
| $50,000 to $74,999 | 0 (0.0%) | 15 (100.0%) |
| $75,000 to $99,999 | 69 (42.1%) | 0 (0.0%) |
| $100,000 to $149,999 | 0 (0.0%) | 0 (0.0%) |
| $150,000 or more | 0 (0.0%) | 0 (0.0%) |
| Total | 164 (100.0%) | 15 (100.0%) |
Monthly Housing Cost Tiers in Wallins Creek
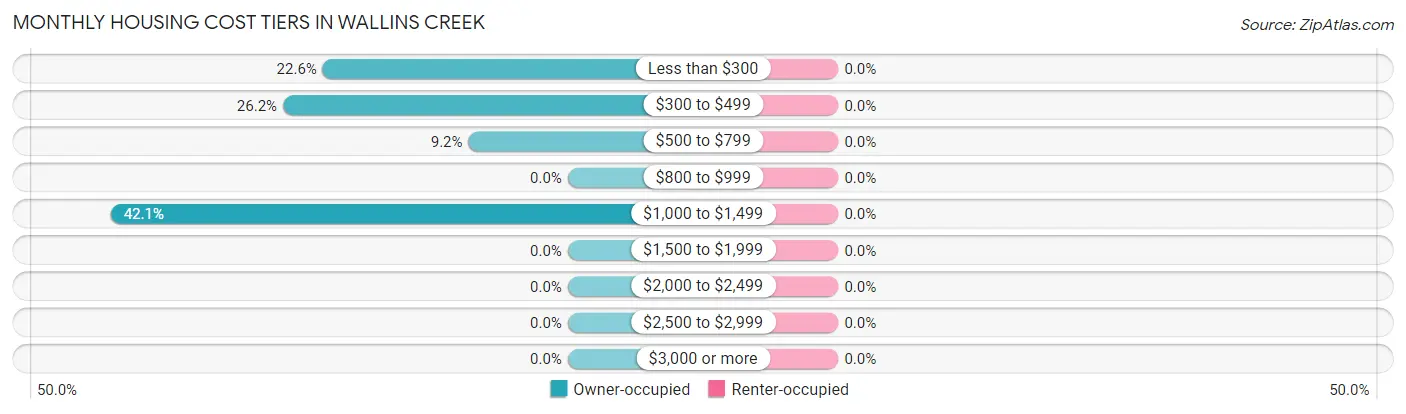
| Monthly Cost | Owner-occupied | Renter-occupied |
| Less than $300 | 37 (22.6%) | 0 (0.0%) |
| $300 to $499 | 43 (26.2%) | 0 (0.0%) |
| $500 to $799 | 15 (9.1%) | 0 (0.0%) |
| $800 to $999 | 0 (0.0%) | 0 (0.0%) |
| $1,000 to $1,499 | 69 (42.1%) | 0 (0.0%) |
| $1,500 to $1,999 | 0 (0.0%) | 0 (0.0%) |
| $2,000 to $2,499 | 0 (0.0%) | 0 (0.0%) |
| $2,500 to $2,999 | 0 (0.0%) | 0 (0.0%) |
| $3,000 or more | 0 (0.0%) | 0 (0.0%) |
| Total | 164 (100.0%) | 15 (100.0%) |
Physical Housing Characteristics in Wallins Creek
Housing Structures in Wallins Creek
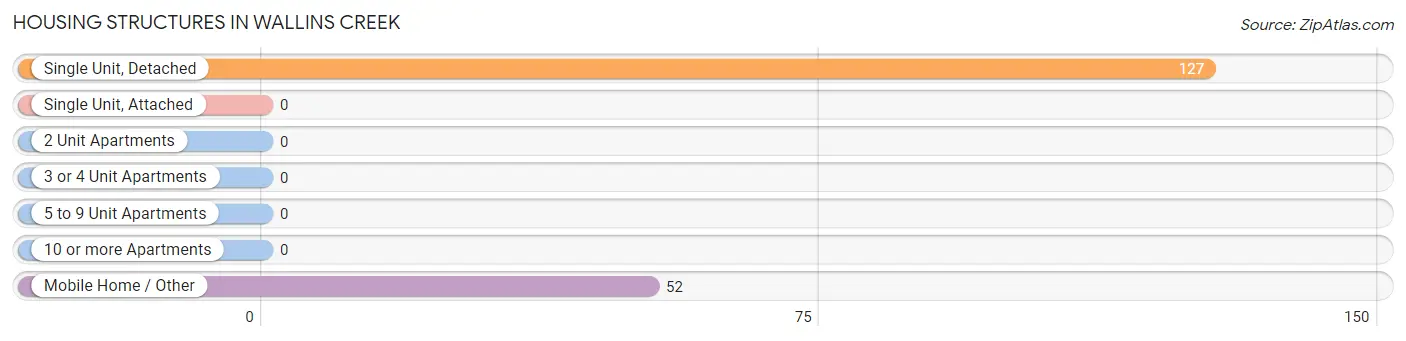
| Structure Type | # Housing Units | % Housing Units |
| Single Unit, Detached | 127 | 71.0% |
| Single Unit, Attached | 0 | 0.0% |
| 2 Unit Apartments | 0 | 0.0% |
| 3 or 4 Unit Apartments | 0 | 0.0% |
| 5 to 9 Unit Apartments | 0 | 0.0% |
| 10 or more Apartments | 0 | 0.0% |
| Mobile Home / Other | 52 | 29.0% |
| Total | 179 | 100.0% |
Housing Structures by Occupancy in Wallins Creek
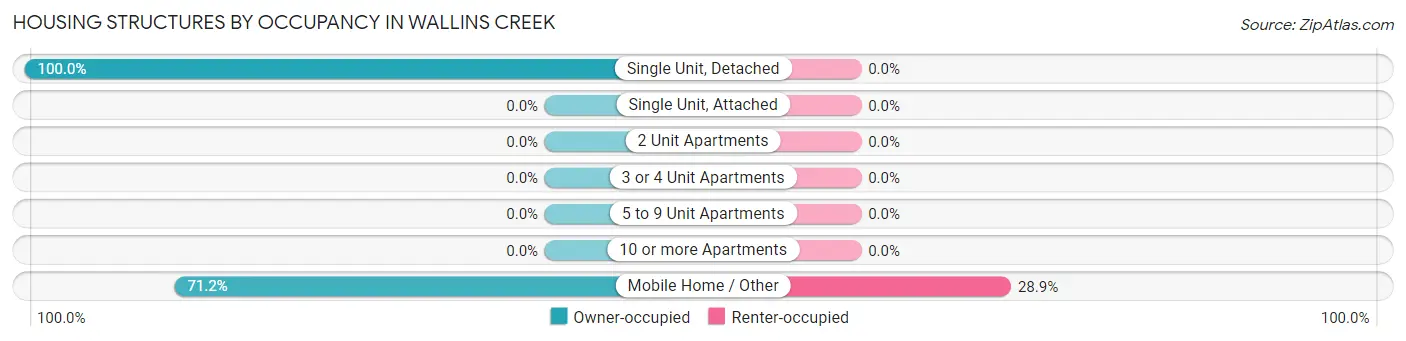
| Structure Type | Owner-occupied | Renter-occupied |
| Single Unit, Detached | 127 (100.0%) | 0 (0.0%) |
| Single Unit, Attached | 0 (0.0%) | 0 (0.0%) |
| 2 Unit Apartments | 0 (0.0%) | 0 (0.0%) |
| 3 or 4 Unit Apartments | 0 (0.0%) | 0 (0.0%) |
| 5 to 9 Unit Apartments | 0 (0.0%) | 0 (0.0%) |
| 10 or more Apartments | 0 (0.0%) | 0 (0.0%) |
| Mobile Home / Other | 37 (71.2%) | 15 (28.8%) |
| Total | 164 (91.6%) | 15 (8.4%) |
Housing Structures by Number of Rooms in Wallins Creek
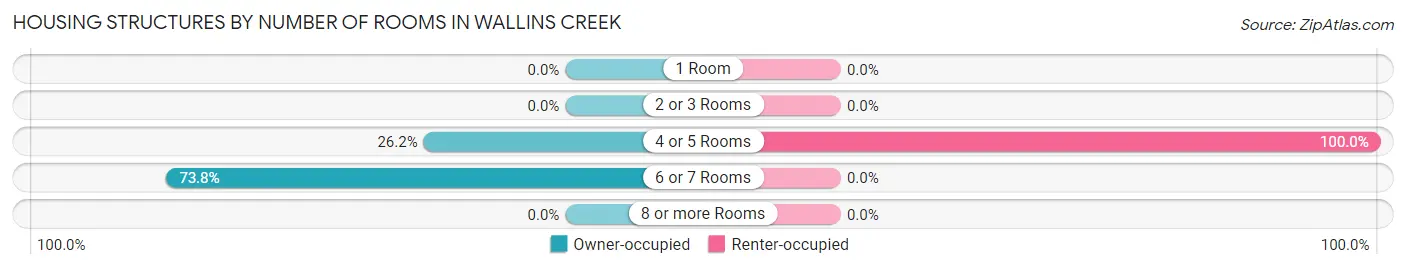
| Number of Rooms | Owner-occupied | Renter-occupied |
| 1 Room | 0 (0.0%) | 0 (0.0%) |
| 2 or 3 Rooms | 0 (0.0%) | 0 (0.0%) |
| 4 or 5 Rooms | 43 (26.2%) | 15 (100.0%) |
| 6 or 7 Rooms | 121 (73.8%) | 0 (0.0%) |
| 8 or more Rooms | 0 (0.0%) | 0 (0.0%) |
| Total | 164 (100.0%) | 15 (100.0%) |
Housing Structure by Heating Type in Wallins Creek
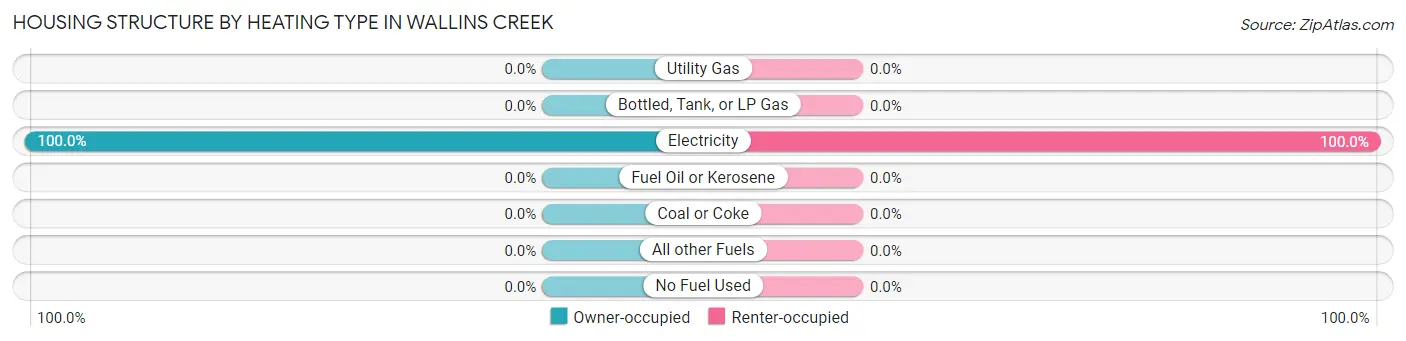
| Heating Type | Owner-occupied | Renter-occupied |
| Utility Gas | 0 (0.0%) | 0 (0.0%) |
| Bottled, Tank, or LP Gas | 0 (0.0%) | 0 (0.0%) |
| Electricity | 164 (100.0%) | 15 (100.0%) |
| Fuel Oil or Kerosene | 0 (0.0%) | 0 (0.0%) |
| Coal or Coke | 0 (0.0%) | 0 (0.0%) |
| All other Fuels | 0 (0.0%) | 0 (0.0%) |
| No Fuel Used | 0 (0.0%) | 0 (0.0%) |
| Total | 164 (100.0%) | 15 (100.0%) |
Household Vehicle Usage in Wallins Creek
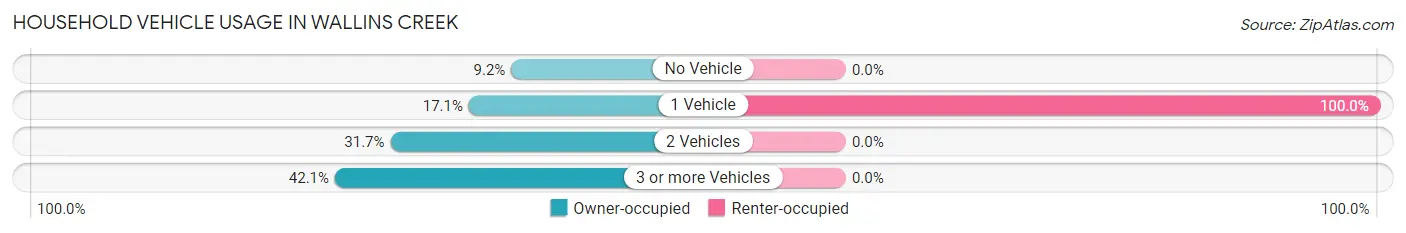
| Vehicles per Household | Owner-occupied | Renter-occupied |
| No Vehicle | 15 (9.1%) | 0 (0.0%) |
| 1 Vehicle | 28 (17.1%) | 15 (100.0%) |
| 2 Vehicles | 52 (31.7%) | 0 (0.0%) |
| 3 or more Vehicles | 69 (42.1%) | 0 (0.0%) |
| Total | 164 (100.0%) | 15 (100.0%) |
Real Estate & Mortgages in Wallins Creek
Real Estate and Mortgage Overview in Wallins Creek
| Characteristic | Without Mortgage | With Mortgage |
| Housing Units | 65 | 99 |
| Median Property Value | - | - |
| Median Household Income | $44,420 | $0 |
| Monthly Housing Costs | $291 | $0 |
| Real Estate Taxes | - | - |
Property Value by Mortgage Status in Wallins Creek
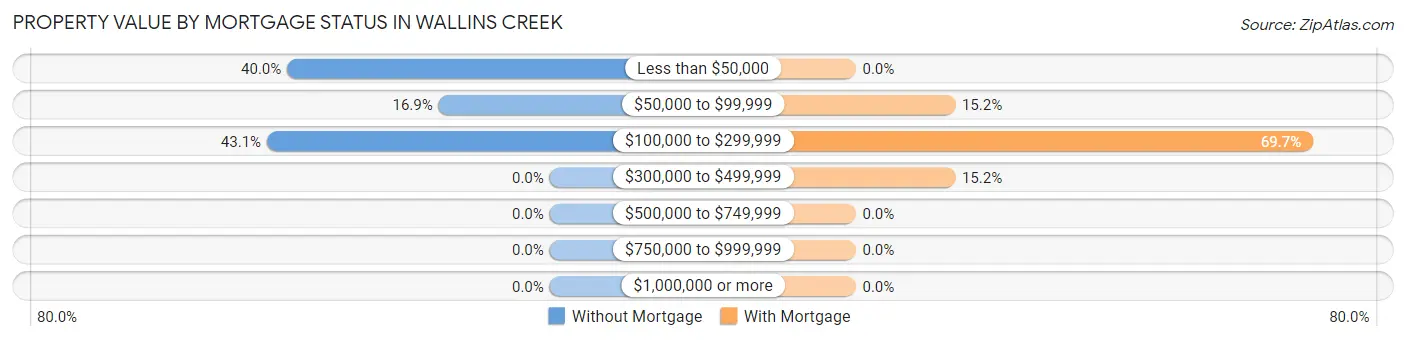
| Property Value | Without Mortgage | With Mortgage |
| Less than $50,000 | 26 (40.0%) | 0 (0.0%) |
| $50,000 to $99,999 | 11 (16.9%) | 15 (15.1%) |
| $100,000 to $299,999 | 28 (43.1%) | 69 (69.7%) |
| $300,000 to $499,999 | 0 (0.0%) | 15 (15.1%) |
| $500,000 to $749,999 | 0 (0.0%) | 0 (0.0%) |
| $750,000 to $999,999 | 0 (0.0%) | 0 (0.0%) |
| $1,000,000 or more | 0 (0.0%) | 0 (0.0%) |
| Total | 65 (100.0%) | 99 (100.0%) |
Household Income by Mortgage Status in Wallins Creek
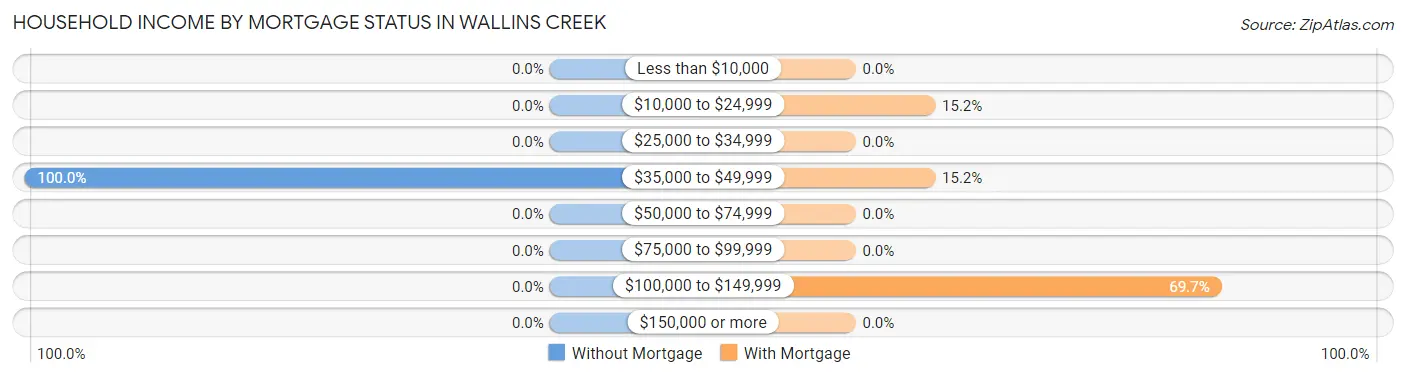
| Household Income | Without Mortgage | With Mortgage |
| Less than $10,000 | 0 (0.0%) | 0 (0.0%) |
| $10,000 to $24,999 | 0 (0.0%) | 15 (15.1%) |
| $25,000 to $34,999 | 0 (0.0%) | 0 (0.0%) |
| $35,000 to $49,999 | 65 (100.0%) | 15 (15.1%) |
| $50,000 to $74,999 | 0 (0.0%) | 0 (0.0%) |
| $75,000 to $99,999 | 0 (0.0%) | 0 (0.0%) |
| $100,000 to $149,999 | 0 (0.0%) | 69 (69.7%) |
| $150,000 or more | 0 (0.0%) | 0 (0.0%) |
| Total | 65 (100.0%) | 99 (100.0%) |
Property Value to Household Income Ratio in Wallins Creek
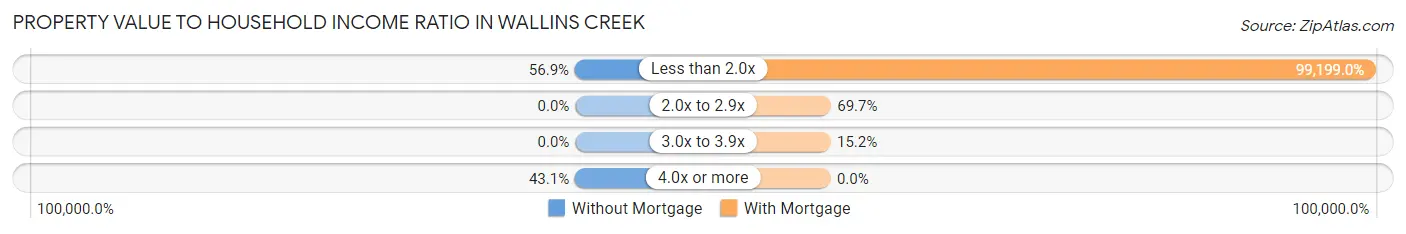
| Value-to-Income Ratio | Without Mortgage | With Mortgage |
| Less than 2.0x | 37 (56.9%) | 98,207 (99,199.0%) |
| 2.0x to 2.9x | 0 (0.0%) | 69 (69.7%) |
| 3.0x to 3.9x | 0 (0.0%) | 15 (15.1%) |
| 4.0x or more | 28 (43.1%) | 0 (0.0%) |
| Total | 65 (100.0%) | 99 (100.0%) |
Real Estate Taxes by Mortgage Status in Wallins Creek
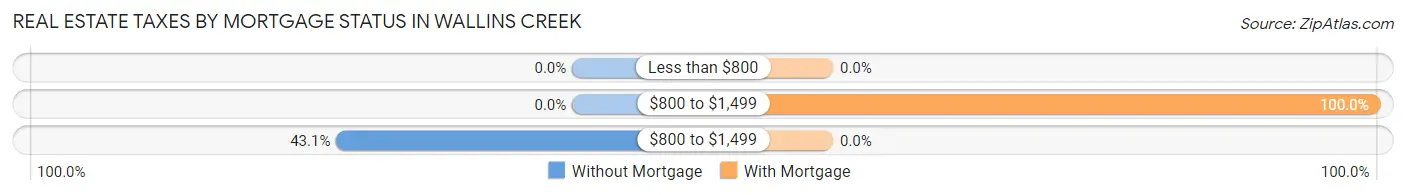
| Property Taxes | Without Mortgage | With Mortgage |
| Less than $800 | 0 (0.0%) | 0 (0.0%) |
| $800 to $1,499 | 0 (0.0%) | 99 (100.0%) |
| $800 to $1,499 | 28 (43.1%) | 0 (0.0%) |
| Total | 65 (100.0%) | 99 (100.0%) |
Health & Disability in Wallins Creek
Health Insurance Coverage by Age in Wallins Creek
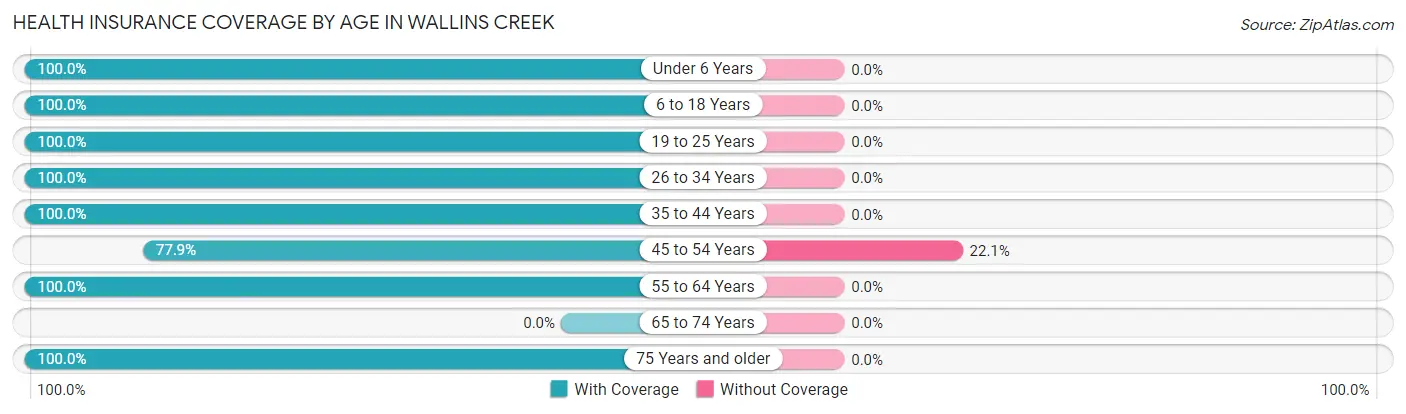
| Age Bracket | With Coverage | Without Coverage |
| Under 6 Years | 15 (100.0%) | 0 (0.0%) |
| 6 to 18 Years | 15 (100.0%) | 0 (0.0%) |
| 19 to 25 Years | 65 (100.0%) | 0 (0.0%) |
| 26 to 34 Years | 15 (100.0%) | 0 (0.0%) |
| 35 to 44 Years | 89 (100.0%) | 0 (0.0%) |
| 45 to 54 Years | 53 (77.9%) | 15 (22.1%) |
| 55 to 64 Years | 108 (100.0%) | 0 (0.0%) |
| 65 to 74 Years | 0 (0.0%) | 0 (0.0%) |
| 75 Years and older | 54 (100.0%) | 0 (0.0%) |
| Total | 414 (96.5%) | 15 (3.5%) |
Health Insurance Coverage by Citizenship Status in Wallins Creek
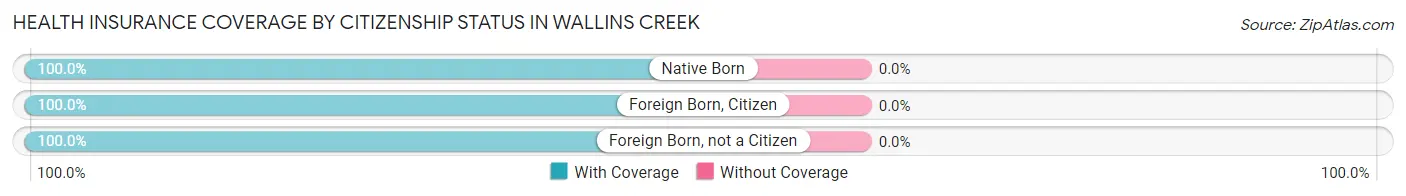
| Citizenship Status | With Coverage | Without Coverage |
| Native Born | 15 (100.0%) | 0 (0.0%) |
| Foreign Born, Citizen | 15 (100.0%) | 0 (0.0%) |
| Foreign Born, not a Citizen | 65 (100.0%) | 0 (0.0%) |
Health Insurance Coverage by Household Income in Wallins Creek
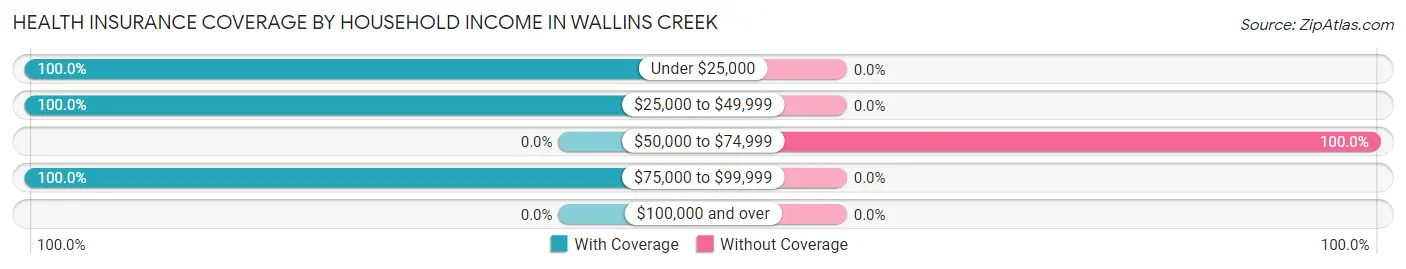
| Household Income | With Coverage | Without Coverage |
| Under $25,000 | 15 (100.0%) | 0 (0.0%) |
| $25,000 to $49,999 | 241 (100.0%) | 0 (0.0%) |
| $50,000 to $74,999 | 0 (0.0%) | 15 (100.0%) |
| $75,000 to $99,999 | 158 (100.0%) | 0 (0.0%) |
| $100,000 and over | 0 (0.0%) | 0 (0.0%) |
Public vs Private Health Insurance Coverage by Age in Wallins Creek
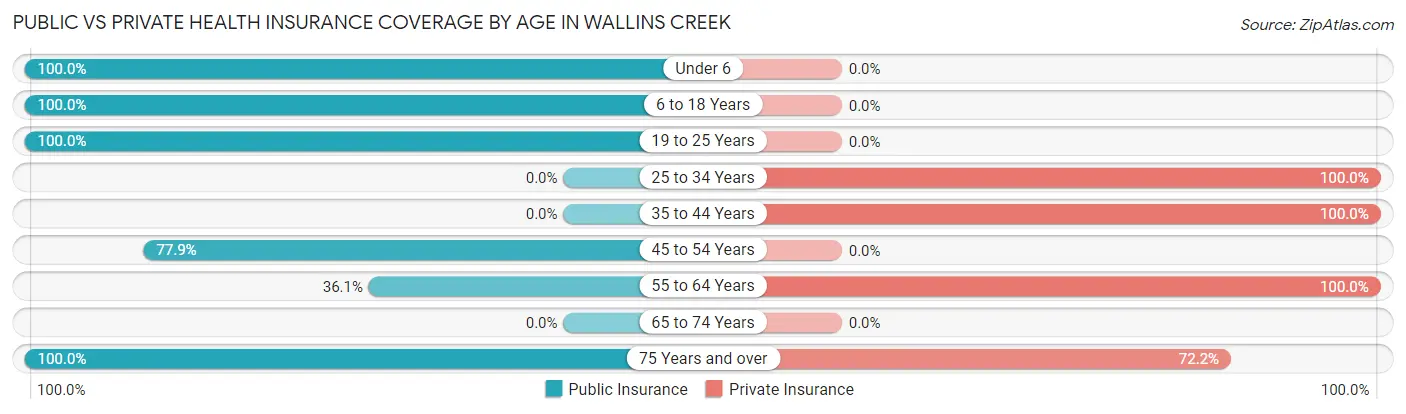
| Age Bracket | Public Insurance | Private Insurance |
| Under 6 | 15 (100.0%) | 0 (0.0%) |
| 6 to 18 Years | 15 (100.0%) | 0 (0.0%) |
| 19 to 25 Years | 65 (100.0%) | 0 (0.0%) |
| 25 to 34 Years | 0 (0.0%) | 15 (100.0%) |
| 35 to 44 Years | 0 (0.0%) | 89 (100.0%) |
| 45 to 54 Years | 53 (77.9%) | 0 (0.0%) |
| 55 to 64 Years | 39 (36.1%) | 108 (100.0%) |
| 65 to 74 Years | 0 (0.0%) | 0 (0.0%) |
| 75 Years and over | 54 (100.0%) | 39 (72.2%) |
| Total | 241 (56.2%) | 251 (58.5%) |
Disability Status by Sex by Age in Wallins Creek
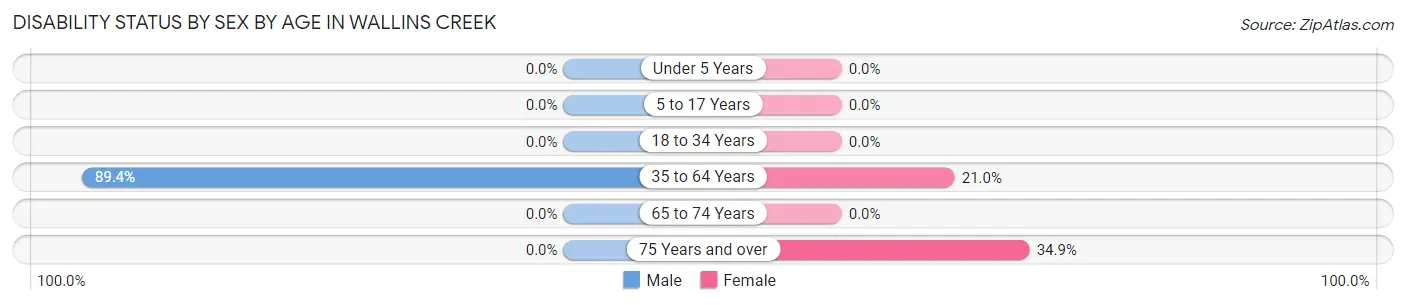
| Age Bracket | Male | Female |
| Under 5 Years | 0 (0.0%) | 0 (0.0%) |
| 5 to 17 Years | 0 (0.0%) | 0 (0.0%) |
| 18 to 34 Years | 0 (0.0%) | 0 (0.0%) |
| 35 to 64 Years | 126 (89.4%) | 26 (21.0%) |
| 65 to 74 Years | 0 (0.0%) | 0 (0.0%) |
| 75 Years and over | 0 (0.0%) | 15 (34.9%) |
Disability Class by Sex by Age in Wallins Creek
Disability Class: Hearing Difficulty
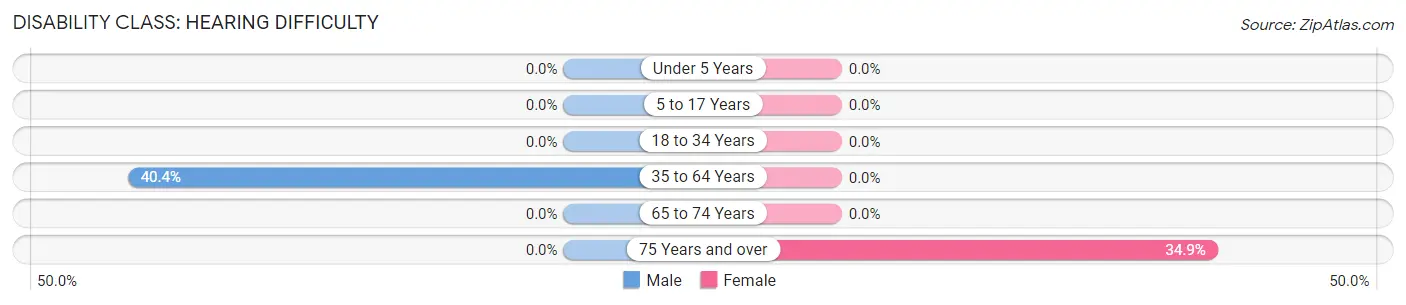
| Age Bracket | Male | Female |
| Under 5 Years | 0 (0.0%) | 0 (0.0%) |
| 5 to 17 Years | 0 (0.0%) | 0 (0.0%) |
| 18 to 34 Years | 0 (0.0%) | 0 (0.0%) |
| 35 to 64 Years | 57 (40.4%) | 0 (0.0%) |
| 65 to 74 Years | 0 (0.0%) | 0 (0.0%) |
| 75 Years and over | 0 (0.0%) | 15 (34.9%) |
Disability Class: Vision Difficulty
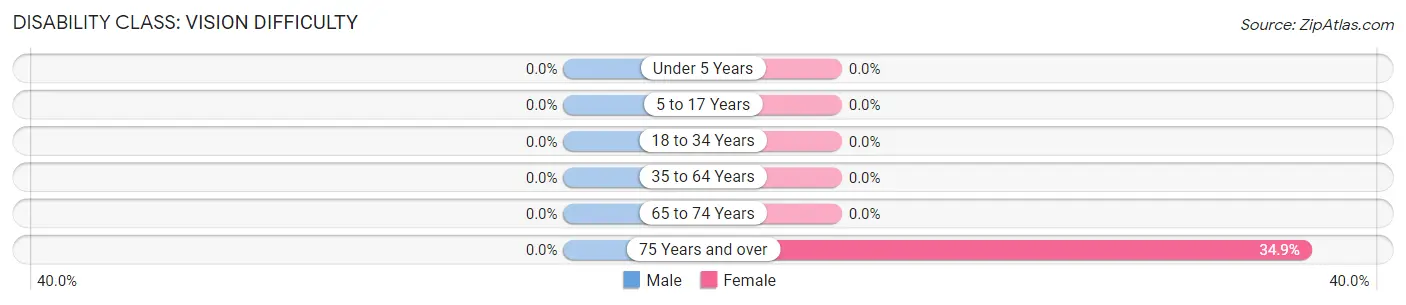
| Age Bracket | Male | Female |
| Under 5 Years | 0 (0.0%) | 0 (0.0%) |
| 5 to 17 Years | 0 (0.0%) | 0 (0.0%) |
| 18 to 34 Years | 0 (0.0%) | 0 (0.0%) |
| 35 to 64 Years | 0 (0.0%) | 0 (0.0%) |
| 65 to 74 Years | 0 (0.0%) | 0 (0.0%) |
| 75 Years and over | 0 (0.0%) | 15 (34.9%) |
Disability Class: Cognitive Difficulty
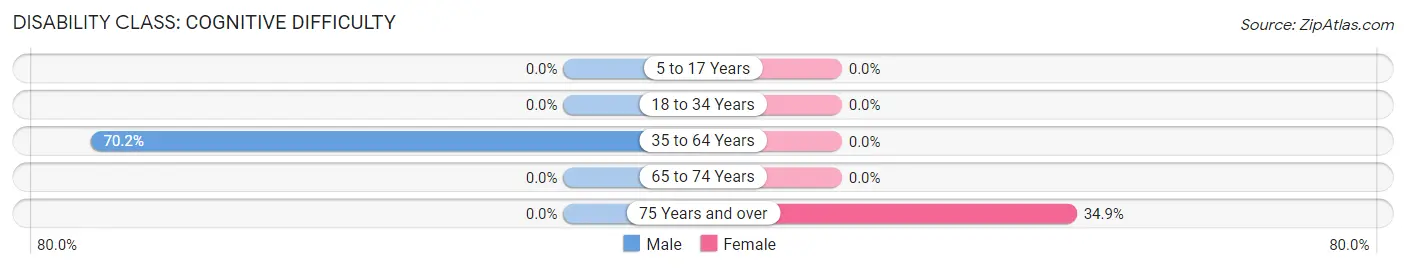
| Age Bracket | Male | Female |
| 5 to 17 Years | 0 (0.0%) | 0 (0.0%) |
| 18 to 34 Years | 0 (0.0%) | 0 (0.0%) |
| 35 to 64 Years | 99 (70.2%) | 0 (0.0%) |
| 65 to 74 Years | 0 (0.0%) | 0 (0.0%) |
| 75 Years and over | 0 (0.0%) | 15 (34.9%) |
Disability Class: Ambulatory Difficulty
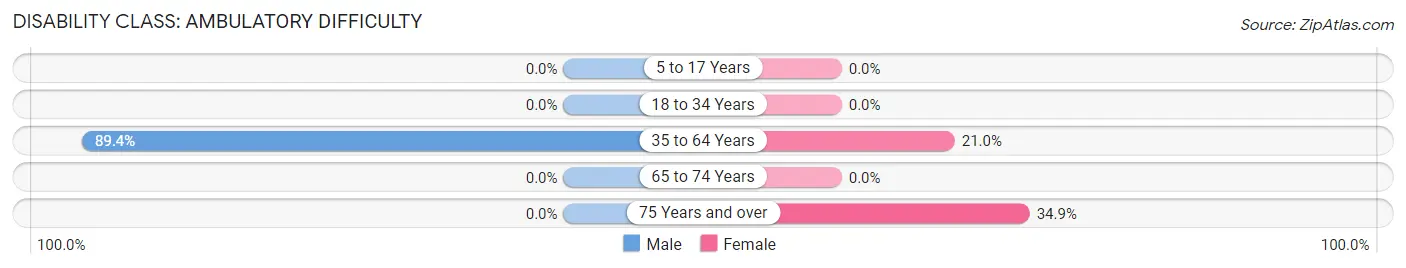
| Age Bracket | Male | Female |
| 5 to 17 Years | 0 (0.0%) | 0 (0.0%) |
| 18 to 34 Years | 0 (0.0%) | 0 (0.0%) |
| 35 to 64 Years | 126 (89.4%) | 26 (21.0%) |
| 65 to 74 Years | 0 (0.0%) | 0 (0.0%) |
| 75 Years and over | 0 (0.0%) | 15 (34.9%) |
Disability Class: Self-Care Difficulty
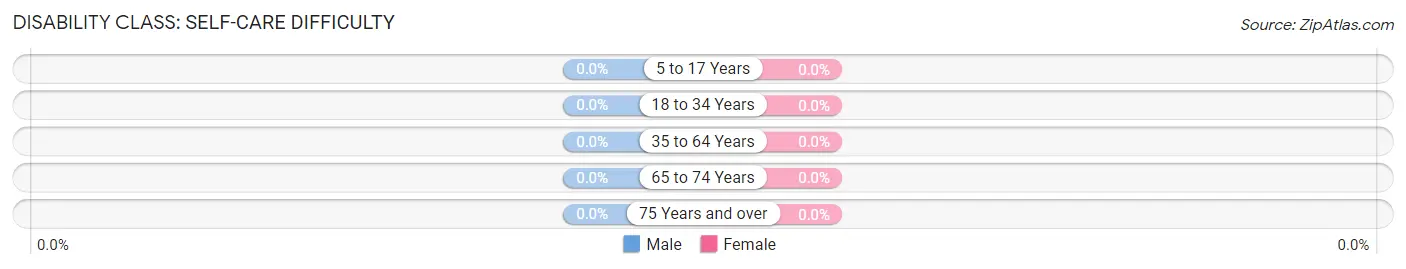
| Age Bracket | Male | Female |
| 5 to 17 Years | 0 (0.0%) | 0 (0.0%) |
| 18 to 34 Years | 0 (0.0%) | 0 (0.0%) |
| 35 to 64 Years | 0 (0.0%) | 0 (0.0%) |
| 65 to 74 Years | 0 (0.0%) | 0 (0.0%) |
| 75 Years and over | 0 (0.0%) | 0 (0.0%) |
Technology Access in Wallins Creek
Computing Device Access in Wallins Creek
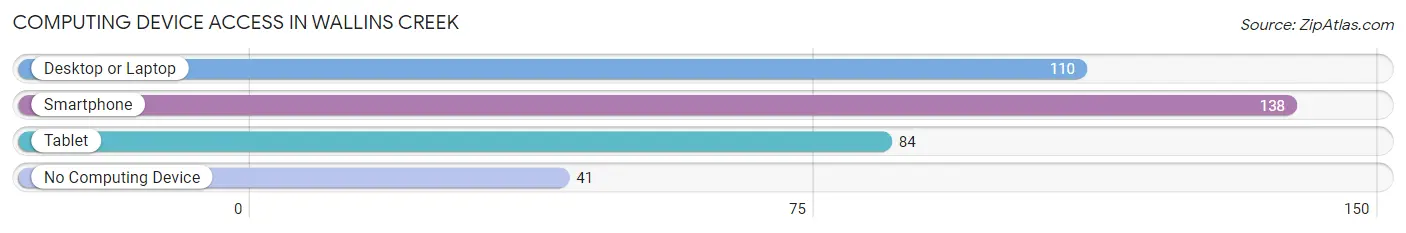
| Device Type | # Households | % Households |
| Desktop or Laptop | 110 | 61.5% |
| Smartphone | 138 | 77.1% |
| Tablet | 84 | 46.9% |
| No Computing Device | 41 | 22.9% |
| Total | 179 | 100.0% |
Internet Access in Wallins Creek
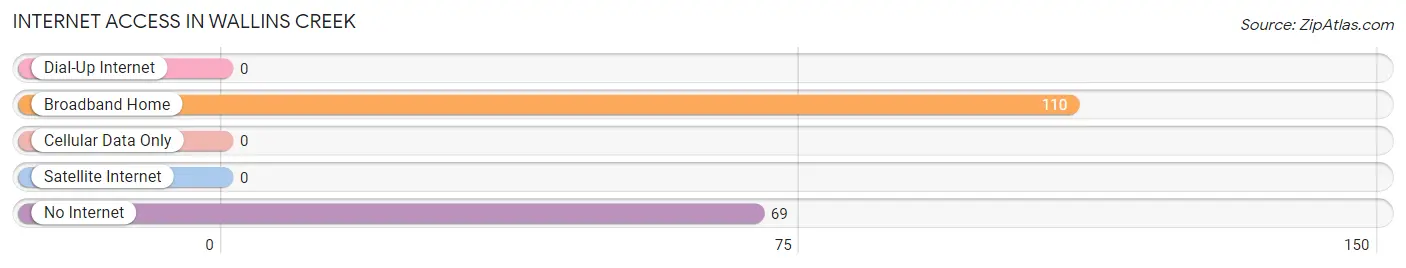
| Internet Type | # Households | % Households |
| Dial-Up Internet | 0 | 0.0% |
| Broadband Home | 110 | 61.5% |
| Cellular Data Only | 0 | 0.0% |
| Satellite Internet | 0 | 0.0% |
| No Internet | 69 | 38.6% |
| Total | 179 | 100.0% |
Wallins Creek Summary
Wallins Creek is a small unincorporated community located in Harlan County, Kentucky. It is situated in the Appalachian Mountains, and is part of the Cumberland Plateau. The population of Wallins Creek was estimated to be around 500 in 2000.
History
Wallins Creek was first settled in the late 1700s by a group of settlers from North Carolina. The town was named after a local creek, which was named after a settler named Wallin. The town was originally a small farming community, and the main crops grown were corn, tobacco, and hay.
In the early 1900s, coal mining began to take off in the area, and Wallins Creek became a major coal mining town. The coal industry provided jobs and economic stability to the town, and it quickly grew in size. The town also had a number of stores, churches, and other businesses.
In the 1950s, the coal industry began to decline, and many of the mines in the area closed. This caused a major economic downturn in the town, and many of the businesses and stores closed. The population of the town also began to decline, as many of the residents moved away in search of better economic opportunities.
Geography
Wallins Creek is located in the Appalachian Mountains, and is part of the Cumberland Plateau. The town is situated in a valley, and is surrounded by hills and mountains. The town is located near the Kentucky-Virginia border, and is about 30 miles from the city of Harlan.
The climate in Wallins Creek is humid subtropical, with hot summers and mild winters. The average annual temperature is around 60 degrees Fahrenheit, and the average annual precipitation is around 45 inches.
Economy
The economy of Wallins Creek is largely based on agriculture and tourism. The town is home to a number of farms, and the main crops grown are corn, tobacco, and hay. The town also has a number of tourist attractions, such as the Wallins Creek State Park and the Wallins Creek National Wildlife Refuge.
The town also has a number of small businesses, such as restaurants, stores, and gas stations. The town also has a number of churches, and there is a small medical clinic in the town.
Demographics
The population of Wallins Creek was estimated to be around 500 in 2000. The town is predominantly white, with a small African American population. The median household income in the town is around $25,000, and the median home value is around $50,000. The town has a high poverty rate, with around 30% of the population living below the poverty line.
Common Questions
What is Per Capita Income in Wallins Creek?
Per Capita income in Wallins Creek is $28,267.
What is Inequality or Gini Index in Wallins Creek?
Inequality or Gini Index in Wallins Creek is 0.27.
What is the Total Population of Wallins Creek?
Total Population of Wallins Creek is 429.
What is the Total Male Population of Wallins Creek?
Total Male Population of Wallins Creek is 185.
What is the Total Female Population of Wallins Creek?
Total Female Population of Wallins Creek is 244.
What is the Ratio of Males per 100 Females in Wallins Creek?
There are 75.82 Males per 100 Females in Wallins Creek.
What is the Ratio of Females per 100 Males in Wallins Creek?
There are 131.89 Females per 100 Males in Wallins Creek.
What is the Median Population Age in Wallins Creek?
Median Population Age in Wallins Creek is 53.0 Years.
What is the Average Family Size in Wallins Creek
Average Family Size in Wallins Creek is 2.5 People.
What is the Average Household Size in Wallins Creek
Average Household Size in Wallins Creek is 2.4 People.
How Large is the Labor Force in Wallins Creek?
There are 152 People in the Labor Forcein in Wallins Creek.
What is the Percentage of People in the Labor Force in Wallins Creek?
38.1% of People are in the Labor Force in Wallins Creek.
What is the Unemployment Rate in Wallins Creek?
Unemployment Rate in Wallins Creek is 9.9%.