Manitou, KY Map & Demographics
Manitou Map
Manitou Overview
$36,559
PER CAPITA INCOME
$103,854
AVG HOUSEHOLD INCOME
34.7%
WAGE / INCOME GAP [ % ]
65.3¢/ $1
WAGE / INCOME GAP [ $ ]
0.16
INEQUALITY / GINI INDEX
183
TOTAL POPULATION
80
MALE POPULATION
103
FEMALE POPULATION
77.67
MALES / 100 FEMALES
128.75
FEMALES / 100 MALES
28.9
MEDIAN AGE
3.1
AVG FAMILY SIZE
3.2
AVG HOUSEHOLD SIZE
111
LABOR FORCE [ PEOPLE ]
99.1%
PERCENT IN LABOR FORCE
Manitou Zip Codes
Manitou Area Codes
Income in Manitou
Income Overview in Manitou
| Characteristic | Number | Measure |
| Per Capita Income | 183 | $36,559 |
| Median Family Income | 44 | $0 |
| Mean Family Income | 44 | $98,689 |
| Median Household Income | 58 | $103,854 |
| Mean Household Income | 58 | $107,807 |
| Income Deficit | 44 | $0 |
| Wage / Income Gap (%) | 183 | 34.75% |
| Wage / Income Gap ($) | 183 | 65.25¢ per $1 |
| Gini / Inequality Index | 183 | 0.16 |
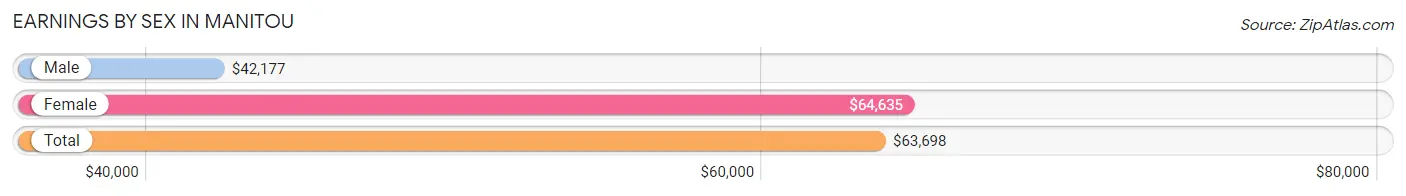
Earnings by Sex in Manitou
Average Earnings in Manitou are $63,698, $42,177 for men and $64,635 for women, a difference of 34.7%.
| Sex | Number | Average Earnings |
| Male | 54 (48.6%) | $42,177 |
| Female | 57 (51.3%) | $64,635 |
| Total | 111 (100.0%) | $63,698 |
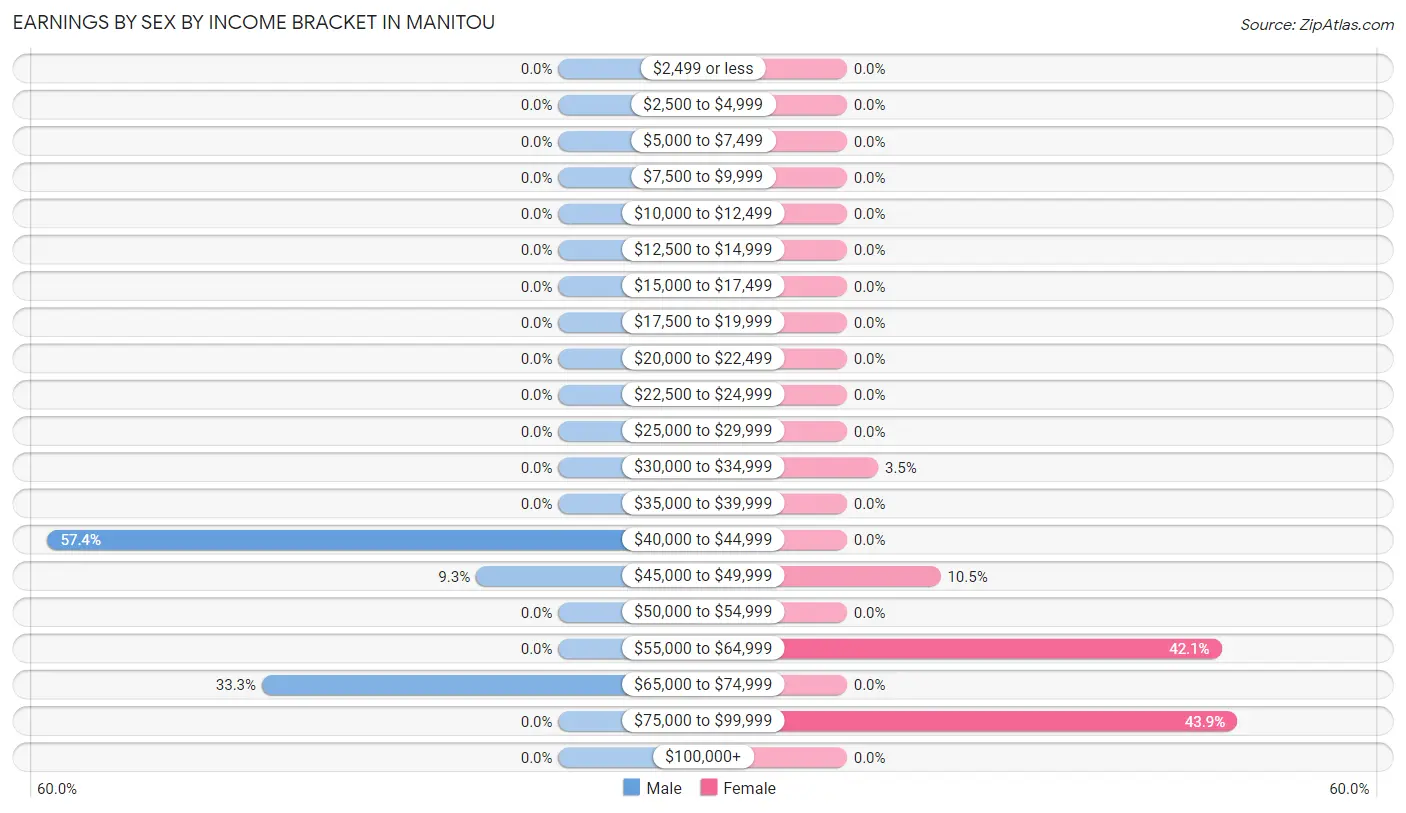
Earnings by Sex by Income Bracket in Manitou
The most common earnings brackets in Manitou are $40,000 to $44,999 for men (31 | 57.4%) and $75,000 to $99,999 for women (25 | 43.9%).
| Income | Male | Female |
| $2,499 or less | 0 (0.0%) | 0 (0.0%) |
| $2,500 to $4,999 | 0 (0.0%) | 0 (0.0%) |
| $5,000 to $7,499 | 0 (0.0%) | 0 (0.0%) |
| $7,500 to $9,999 | 0 (0.0%) | 0 (0.0%) |
| $10,000 to $12,499 | 0 (0.0%) | 0 (0.0%) |
| $12,500 to $14,999 | 0 (0.0%) | 0 (0.0%) |
| $15,000 to $17,499 | 0 (0.0%) | 0 (0.0%) |
| $17,500 to $19,999 | 0 (0.0%) | 0 (0.0%) |
| $20,000 to $22,499 | 0 (0.0%) | 0 (0.0%) |
| $22,500 to $24,999 | 0 (0.0%) | 0 (0.0%) |
| $25,000 to $29,999 | 0 (0.0%) | 0 (0.0%) |
| $30,000 to $34,999 | 0 (0.0%) | 2 (3.5%) |
| $35,000 to $39,999 | 0 (0.0%) | 0 (0.0%) |
| $40,000 to $44,999 | 31 (57.4%) | 0 (0.0%) |
| $45,000 to $49,999 | 5 (9.3%) | 6 (10.5%) |
| $50,000 to $54,999 | 0 (0.0%) | 0 (0.0%) |
| $55,000 to $64,999 | 0 (0.0%) | 24 (42.1%) |
| $65,000 to $74,999 | 18 (33.3%) | 0 (0.0%) |
| $75,000 to $99,999 | 0 (0.0%) | 25 (43.9%) |
| $100,000+ | 0 (0.0%) | 0 (0.0%) |
| Total | 54 (100.0%) | 57 (100.0%) |
Earnings by Sex by Educational Attainment in Manitou
| Educational Attainment | Male Income | Female Income |
| Less than High School | - | - |
| High School Diploma | - | - |
| College or Associate's Degree | - | - |
| Bachelor's Degree | - | - |
| Graduate Degree | - | - |
| Total | $42,177 | $64,635 |
Family Income in Manitou
Family Income Brackets in Manitou
According to the Manitou family income data, there are 24 families falling into the $50,000 to $74,999 income range, which is the most common income bracket and makes up 54.5% of all families.
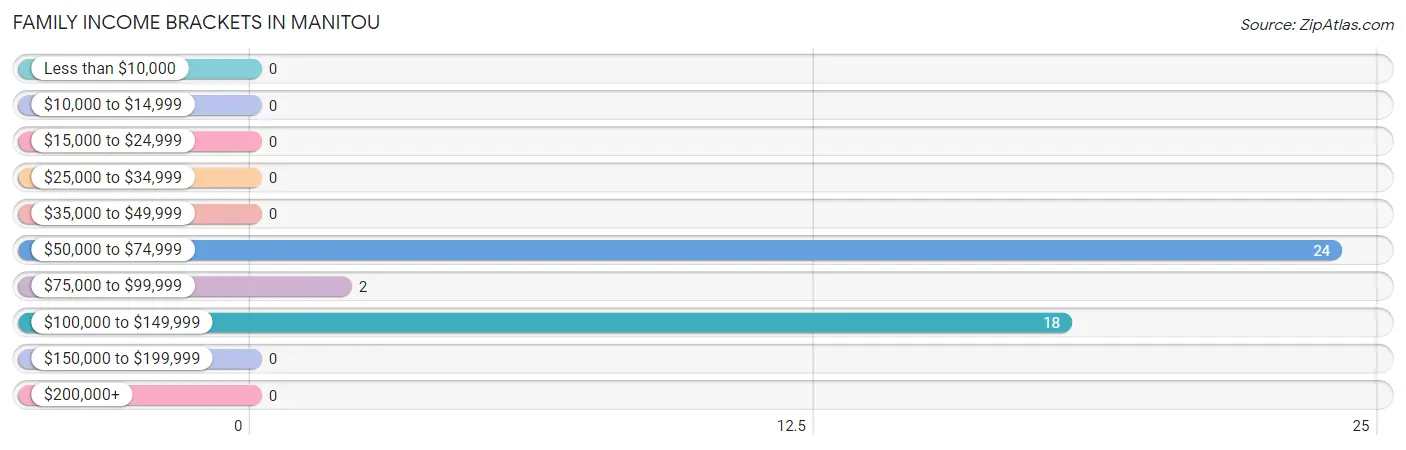
| Income Bracket | # Families | % Families |
| Less than $10,000 | 0 | 0.0% |
| $10,000 to $14,999 | 0 | 0.0% |
| $15,000 to $24,999 | 0 | 0.0% |
| $25,000 to $34,999 | 0 | 0.0% |
| $35,000 to $49,999 | 0 | 0.0% |
| $50,000 to $74,999 | 24 | 54.5% |
| $75,000 to $99,999 | 2 | 4.5% |
| $100,000 to $149,999 | 18 | 40.9% |
| $150,000 to $199,999 | 0 | 0.0% |
| $200,000+ | 0 | 0.0% |
Family Income by Famaliy Size in Manitou
| Income Bracket | # Families | Median Income |
| 2-Person Families | 24 (54.5%) | $0 |
| 3-Person Families | 0 (0.0%) | $0 |
| 4-Person Families | 2 (4.5%) | $0 |
| 5-Person Families | 18 (40.9%) | $0 |
| 6-Person Families | 0 (0.0%) | $0 |
| 7+ Person Families | 0 (0.0%) | $0 |
| Total | 44 (100.0%) | $0 |
Family Income by Number of Earners in Manitou
| Number of Earners | # Families | Median Income |
| No Earners | 0 (0.0%) | $0 |
| 1 Earner | 24 (54.5%) | $0 |
| 2 Earners | 20 (45.5%) | $0 |
| 3+ Earners | 0 (0.0%) | $0 |
| Total | 44 (100.0%) | $0 |
Household Income in Manitou
Household Income Brackets in Manitou
With 42 households falling in the category, the $100,000 to $149,999 income range is the most frequent in Manitou, accounting for 72.4% of all households.
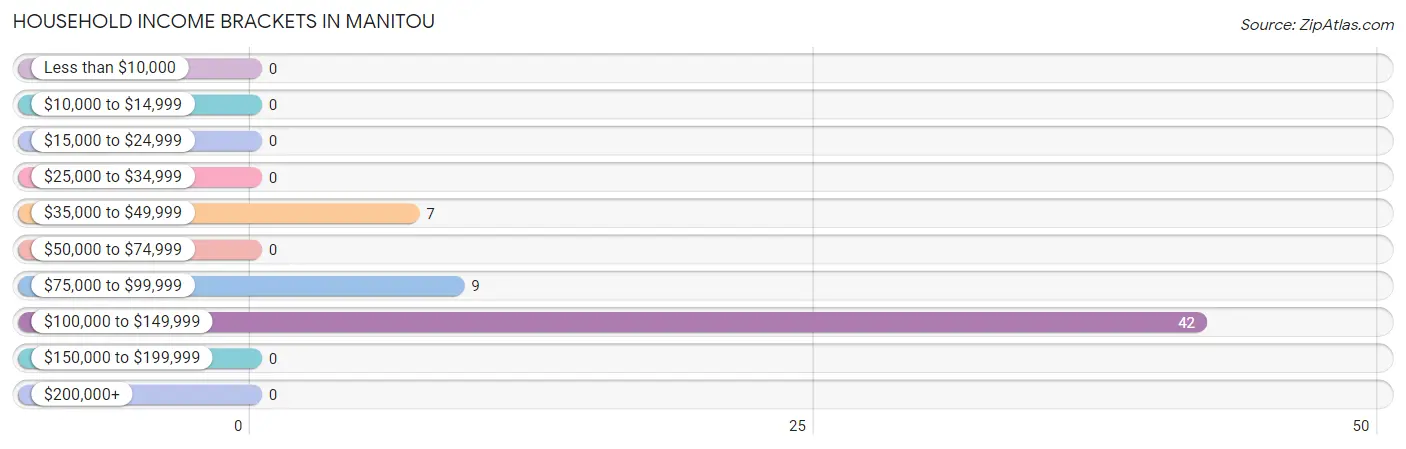
| Income Bracket | # Households | % Households |
| Less than $10,000 | 0 | 0.0% |
| $10,000 to $14,999 | 0 | 0.0% |
| $15,000 to $24,999 | 0 | 0.0% |
| $25,000 to $34,999 | 0 | 0.0% |
| $35,000 to $49,999 | 7 | 12.1% |
| $50,000 to $74,999 | 0 | 0.0% |
| $75,000 to $99,999 | 9 | 15.5% |
| $100,000 to $149,999 | 42 | 72.4% |
| $150,000 to $199,999 | 0 | 0.0% |
| $200,000+ | 0 | 0.0% |
Household Income by Householder Age in Manitou
The median household income in Manitou is $103,854, with the highest median household income of $104,583 found in the 25 to 44 years age bracket for the primary householder. A total of 44 households (75.9%) fall into this category.
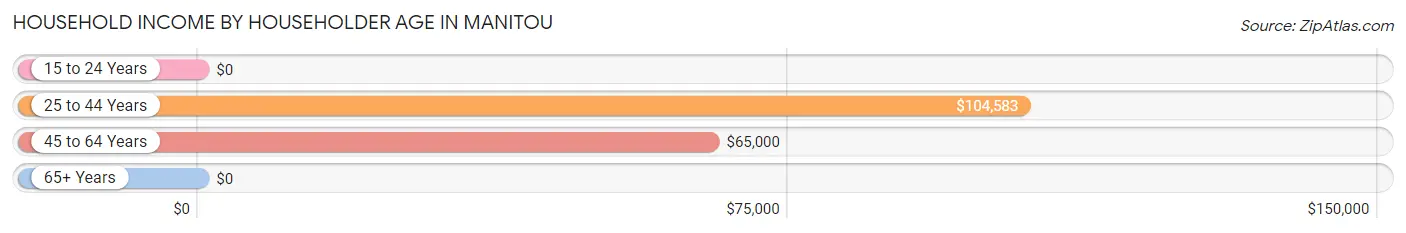
| Income Bracket | # Households | Median Income |
| 15 to 24 Years | 0 (0.0%) | $0 |
| 25 to 44 Years | 44 (75.9%) | $104,583 |
| 45 to 64 Years | 14 (24.1%) | $65,000 |
| 65+ Years | 0 (0.0%) | $0 |
| Total | 58 (100.0%) | $103,854 |
Poverty in Manitou
Income Below Poverty by Sex and Age in Manitou
| Age Bracket | Male | Female |
| Under 5 Years | 0 (0.0%) | 0 (0.0%) |
| 5 Years | 0 (0.0%) | 0 (0.0%) |
| 6 to 11 Years | 0 (0.0%) | 0 (0.0%) |
| 12 to 14 Years | 0 (0.0%) | 0 (0.0%) |
| 15 Years | 0 (0.0%) | 0 (0.0%) |
| 16 and 17 Years | 0 (0.0%) | 0 (0.0%) |
| 18 to 24 Years | 0 (0.0%) | 0 (0.0%) |
| 25 to 34 Years | 0 (0.0%) | 0 (0.0%) |
| 35 to 44 Years | 0 (0.0%) | 0 (0.0%) |
| 45 to 54 Years | 0 (0.0%) | 0 (0.0%) |
| 55 to 64 Years | 0 (0.0%) | 0 (0.0%) |
| 65 to 74 Years | 0 (0.0%) | 0 (0.0%) |
| 75 Years and over | 0 (0.0%) | 0 (0.0%) |
| Total | 0 (0.0%) | 0 (0.0%) |
Income Above Poverty by Sex and Age in Manitou
According to the poverty statistics in Manitou, males aged under 5 years and females aged under 5 years are the age groups that are most secure financially, with 100.0% of males and 100.0% of females in these age groups living above the poverty line.
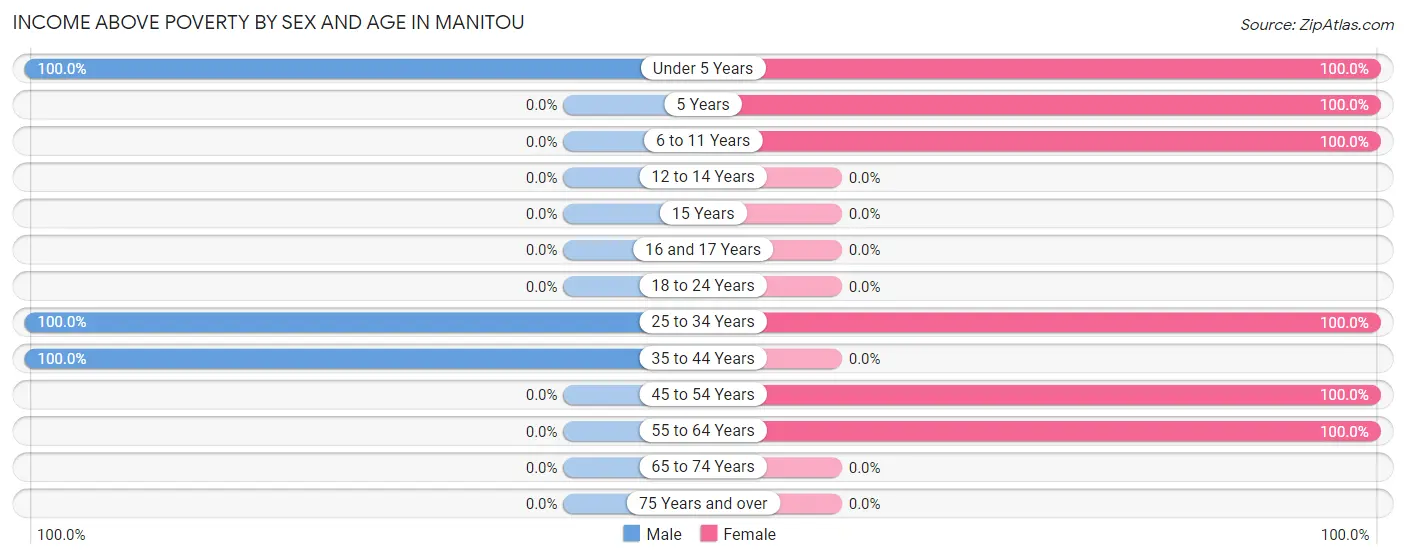
| Age Bracket | Male | Female |
| Under 5 Years | 26 (100.0%) | 23 (100.0%) |
| 5 Years | 0 (0.0%) | 2 (100.0%) |
| 6 to 11 Years | 0 (0.0%) | 20 (100.0%) |
| 12 to 14 Years | 0 (0.0%) | 0 (0.0%) |
| 15 Years | 0 (0.0%) | 0 (0.0%) |
| 16 and 17 Years | 0 (0.0%) | 0 (0.0%) |
| 18 to 24 Years | 0 (0.0%) | 0 (0.0%) |
| 25 to 34 Years | 5 (100.0%) | 44 (100.0%) |
| 35 to 44 Years | 49 (100.0%) | 0 (0.0%) |
| 45 to 54 Years | 0 (0.0%) | 7 (100.0%) |
| 55 to 64 Years | 0 (0.0%) | 7 (100.0%) |
| 65 to 74 Years | 0 (0.0%) | 0 (0.0%) |
| 75 Years and over | 0 (0.0%) | 0 (0.0%) |
| Total | 80 (100.0%) | 103 (100.0%) |
Income Below Poverty Among Married-Couple Families in Manitou
| Children | Above Poverty | Below Poverty |
| No Children | 0 (0.0%) | 0 (0.0%) |
| 1 or 2 Children | 2 (100.0%) | 0 (0.0%) |
| 3 or 4 Children | 18 (100.0%) | 0 (0.0%) |
| 5 or more Children | 0 (0.0%) | 0 (0.0%) |
| Total | 20 (100.0%) | 0 (0.0%) |
Income Below Poverty Among Single-Parent Households in Manitou
| Children | Single Father | Single Mother |
| No Children | 0 (0.0%) | 0 (0.0%) |
| 1 or 2 Children | 0 (0.0%) | 0 (0.0%) |
| 3 or 4 Children | 0 (0.0%) | 0 (0.0%) |
| 5 or more Children | 0 (0.0%) | 0 (0.0%) |
| Total | 0 (0.0%) | 0 (0.0%) |
Income Below Poverty Among Married-Couple vs Single-Parent Households in Manitou
| Children | Married-Couple Families | Single-Parent Households |
| No Children | 0 (0.0%) | 0 (0.0%) |
| 1 or 2 Children | 0 (0.0%) | 0 (0.0%) |
| 3 or 4 Children | 0 (0.0%) | 0 (0.0%) |
| 5 or more Children | 0 (0.0%) | 0 (0.0%) |
| Total | 0 (0.0%) | 0 (0.0%) |
Race in Manitou
The most populous races in Manitou are White / Caucasian (170 | 92.9%), and Two or more Races (13 | 7.1%).
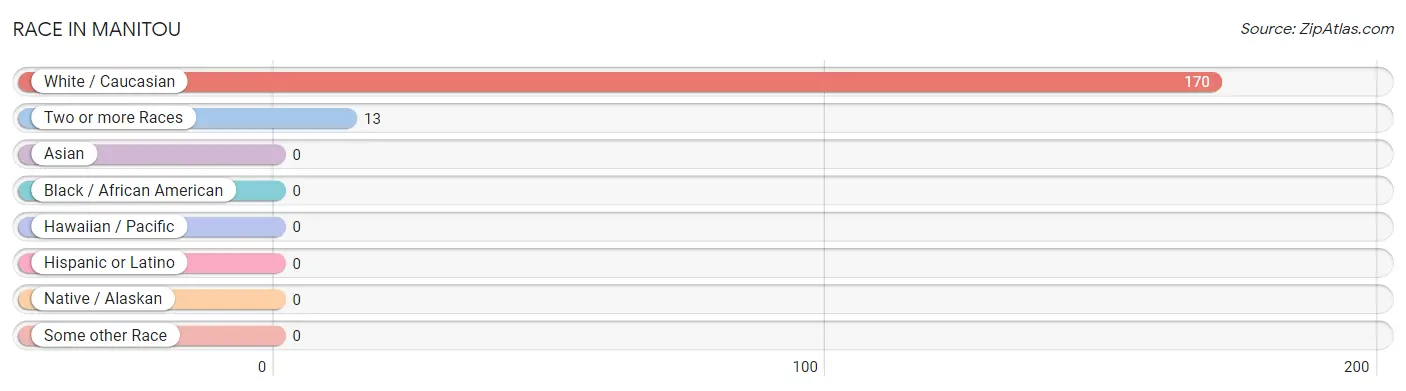
| Race | # Population | % Population |
| Asian | 0 | 0.0% |
| Black / African American | 0 | 0.0% |
| Hawaiian / Pacific | 0 | 0.0% |
| Hispanic or Latino | 0 | 0.0% |
| Native / Alaskan | 0 | 0.0% |
| White / Caucasian | 170 | 92.9% |
| Two or more Races | 13 | 7.1% |
| Some other Race | 0 | 0.0% |
| Total | 183 | 100.0% |
Ancestry in Manitou
The most populous ancestries reported in Manitou are Cherokee (12 | 6.6%), Irish (7 | 3.8%), Italian (7 | 3.8%), English (1 | 0.5%), and Scottish (1 | 0.5%), together accounting for 15.3% of all Manitou residents.
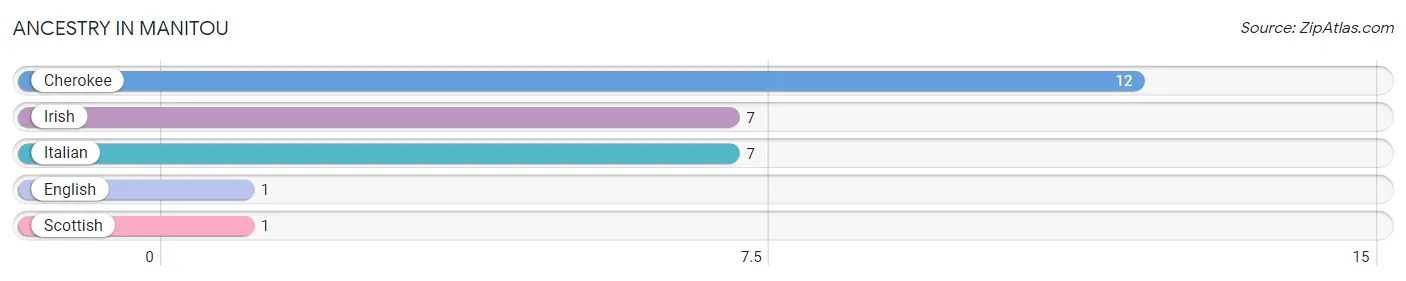
| Ancestry | # Population | % Population |
| Cherokee | 12 | 6.6% |
| English | 1 | 0.5% |
| Irish | 7 | 3.8% |
| Italian | 7 | 3.8% |
| Scottish | 1 | 0.5% | View All 5 Rows |
Immigrants in Manitou

| Immigration Origin | # Population | % Population | View All 0 Rows |
Sex and Age in Manitou
Sex and Age in Manitou
The most populous age groups in Manitou are 35 to 39 Years (31 | 38.8%) for men and 25 to 29 Years (24 | 23.3%) for women.
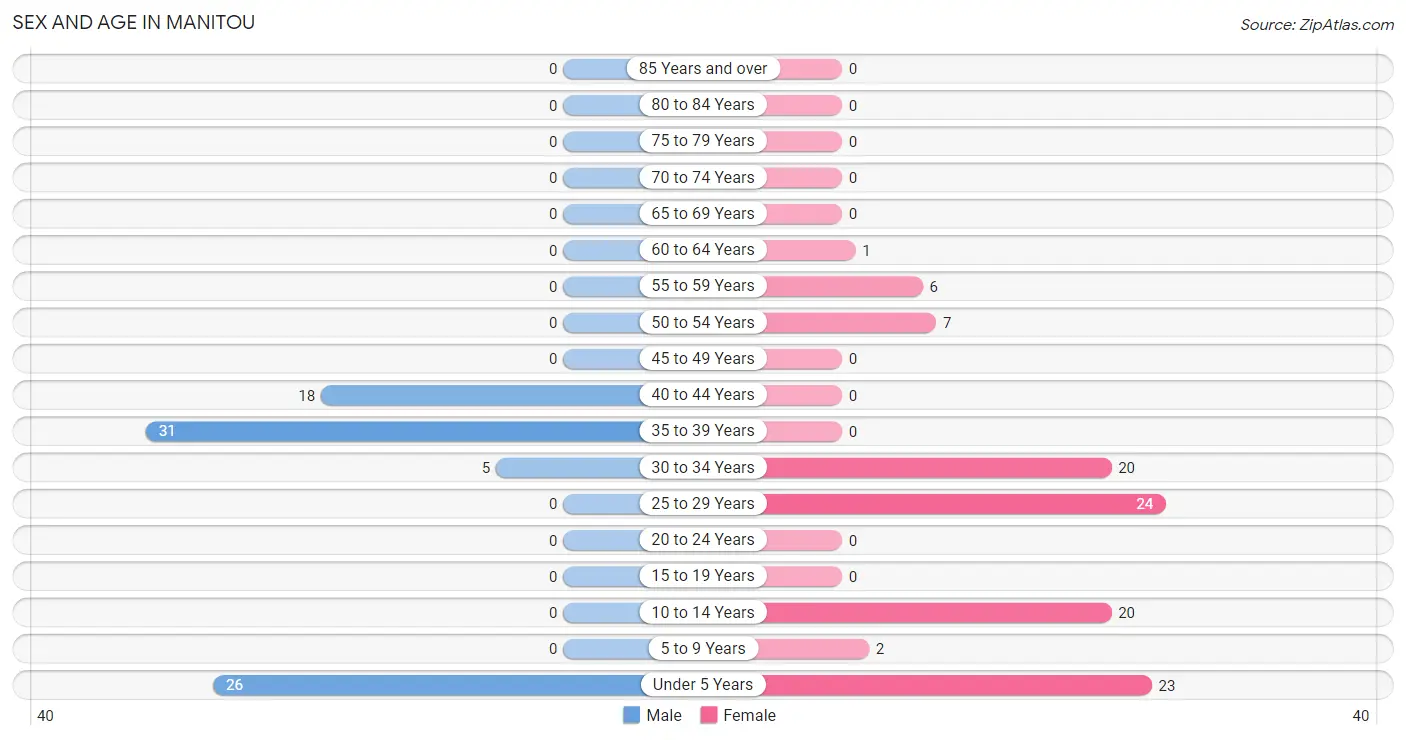
| Age Bracket | Male | Female |
| Under 5 Years | 26 (32.5%) | 23 (22.3%) |
| 5 to 9 Years | 0 (0.0%) | 2 (1.9%) |
| 10 to 14 Years | 0 (0.0%) | 20 (19.4%) |
| 15 to 19 Years | 0 (0.0%) | 0 (0.0%) |
| 20 to 24 Years | 0 (0.0%) | 0 (0.0%) |
| 25 to 29 Years | 0 (0.0%) | 24 (23.3%) |
| 30 to 34 Years | 5 (6.2%) | 20 (19.4%) |
| 35 to 39 Years | 31 (38.8%) | 0 (0.0%) |
| 40 to 44 Years | 18 (22.5%) | 0 (0.0%) |
| 45 to 49 Years | 0 (0.0%) | 0 (0.0%) |
| 50 to 54 Years | 0 (0.0%) | 7 (6.8%) |
| 55 to 59 Years | 0 (0.0%) | 6 (5.8%) |
| 60 to 64 Years | 0 (0.0%) | 1 (1.0%) |
| 65 to 69 Years | 0 (0.0%) | 0 (0.0%) |
| 70 to 74 Years | 0 (0.0%) | 0 (0.0%) |
| 75 to 79 Years | 0 (0.0%) | 0 (0.0%) |
| 80 to 84 Years | 0 (0.0%) | 0 (0.0%) |
| 85 Years and over | 0 (0.0%) | 0 (0.0%) |
| Total | 80 (100.0%) | 103 (100.0%) |
Families and Households in Manitou
Median Family Size in Manitou
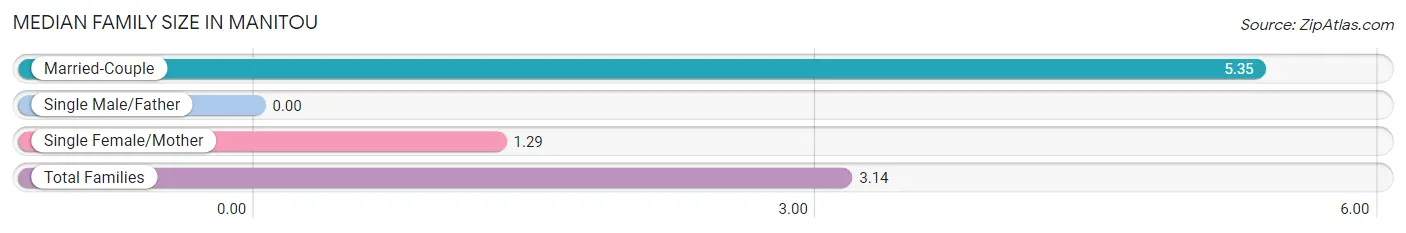
| Family Type | # Families | Family Size |
| Married-Couple | 20 (45.5%) | 5.35 |
| Single Male/Father | 0 (0.0%) | - |
| Single Female/Mother | 24 (54.5%) | 1.29 |
| Total Families | 44 (100.0%) | 3.14 |
Median Household Size in Manitou
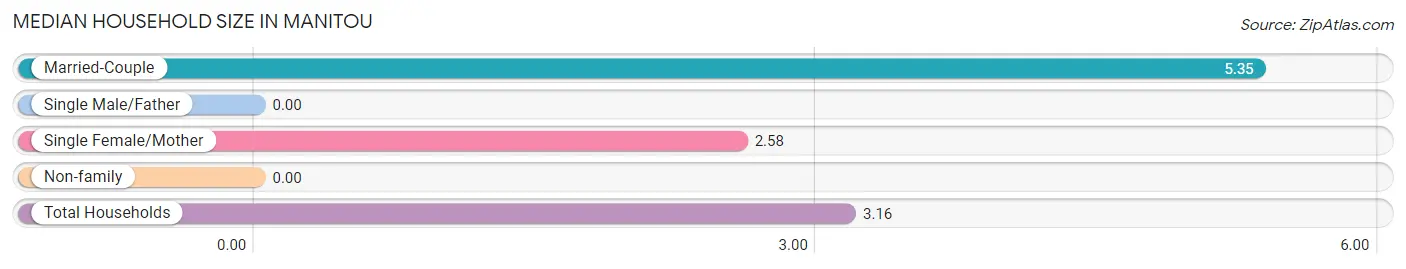
| Household Type | # Households | Household Size |
| Married-Couple | 20 (34.5%) | 5.35 |
| Single Male/Father | 0 (0.0%) | - |
| Single Female/Mother | 24 (41.4%) | 2.58 |
| Non-family | 14 (24.1%) | - |
| Total Households | 58 (100.0%) | 3.16 |
Household Size by Marriage Status in Manitou
Out of a total of 58 households in Manitou, 44 (75.9%) are family households, while 14 (24.1%) are nonfamily households. The most numerous type of family households are 3-person households, comprising 24, and the most common type of nonfamily households are 1-person households, comprising 14.
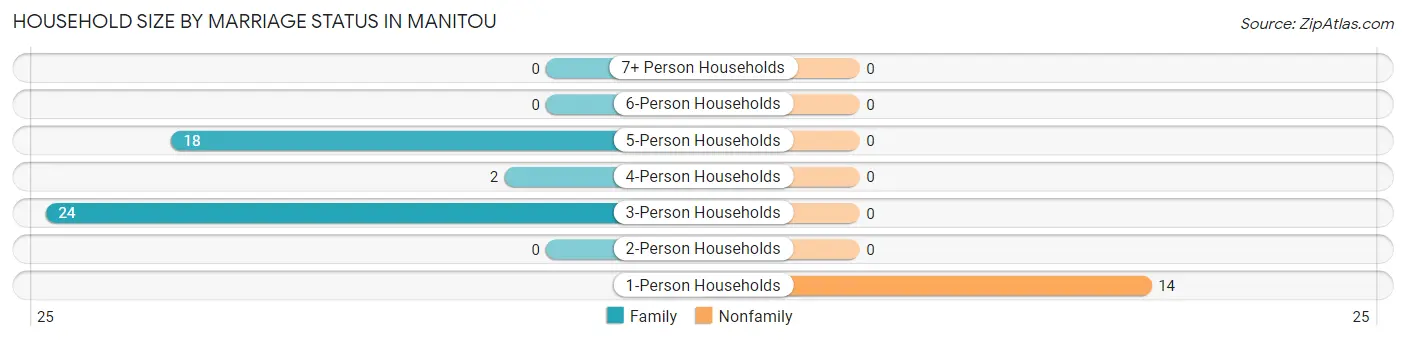
| Household Size | Family Households | Nonfamily Households |
| 1-Person Households | - | 14 (24.1%) |
| 2-Person Households | 0 (0.0%) | 0 (0.0%) |
| 3-Person Households | 24 (41.4%) | 0 (0.0%) |
| 4-Person Households | 2 (3.5%) | 0 (0.0%) |
| 5-Person Households | 18 (31.0%) | 0 (0.0%) |
| 6-Person Households | 0 (0.0%) | 0 (0.0%) |
| 7+ Person Households | 0 (0.0%) | 0 (0.0%) |
| Total | 44 (75.9%) | 14 (24.1%) |
Female Fertility in Manitou
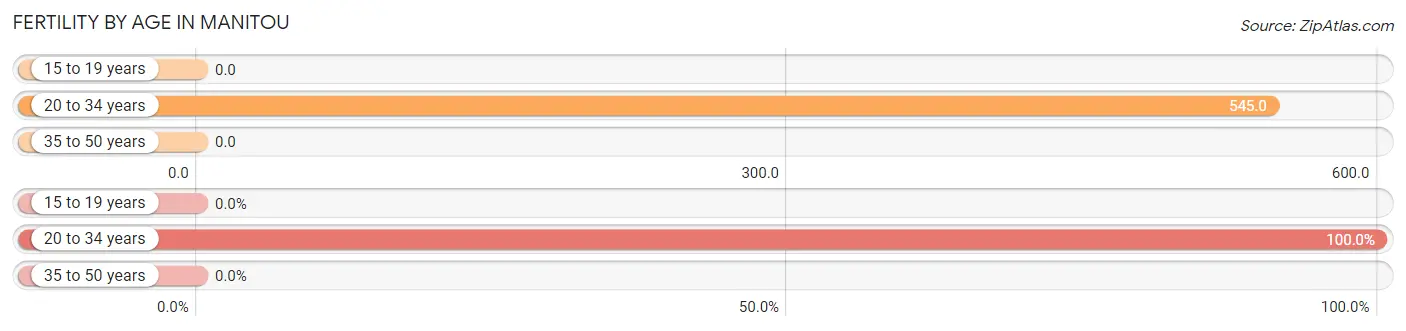
Fertility by Age in Manitou
Average fertility rate in Manitou is 545.0 births per 1,000 women. Women in the age bracket of 20 to 34 years have the highest fertility rate with 545.0 births per 1,000 women. Women in the age bracket of 20 to 34 years acount for 100.0% of all women with births.
| Age Bracket | Women with Births | Births / 1,000 Women |
| 15 to 19 years | 0 (0.0%) | 0.0 |
| 20 to 34 years | 24 (100.0%) | 545.0 |
| 35 to 50 years | 0 (0.0%) | 0.0 |
| Total | 24 (100.0%) | 545.0 |
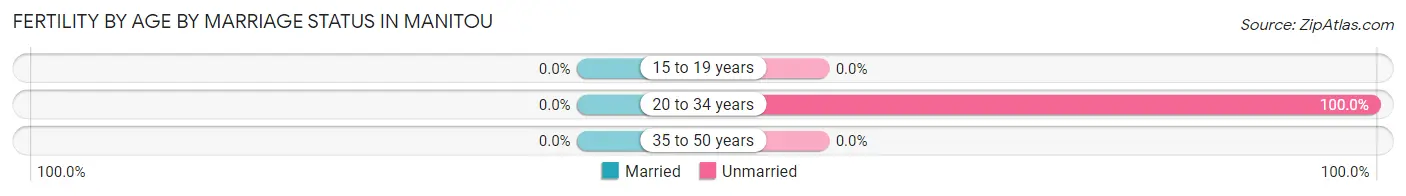
Fertility by Age by Marriage Status in Manitou
| Age Bracket | Married | Unmarried |
| 15 to 19 years | 0 (0.0%) | 0 (0.0%) |
| 20 to 34 years | 0 (0.0%) | 24 (100.0%) |
| 35 to 50 years | 0 (0.0%) | 0 (0.0%) |
| Total | 0 (0.0%) | 24 (100.0%) |
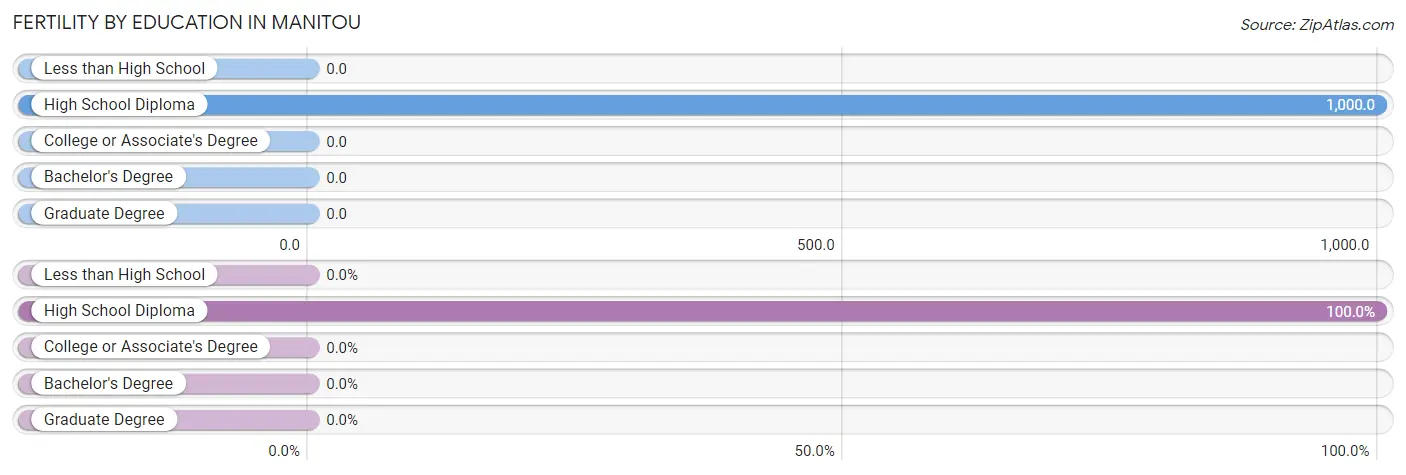
Fertility by Education in Manitou
| Educational Attainment | Women with Births | Births / 1,000 Women |
| Less than High School | 0 (0.0%) | 0.0 |
| High School Diploma | 24 (100.0%) | 1,000.0 |
| College or Associate's Degree | 0 (0.0%) | 0.0 |
| Bachelor's Degree | 0 (0.0%) | 0.0 |
| Graduate Degree | 0 (0.0%) | 0.0 |
| Total | 24 (100.0%) | 545.0 |
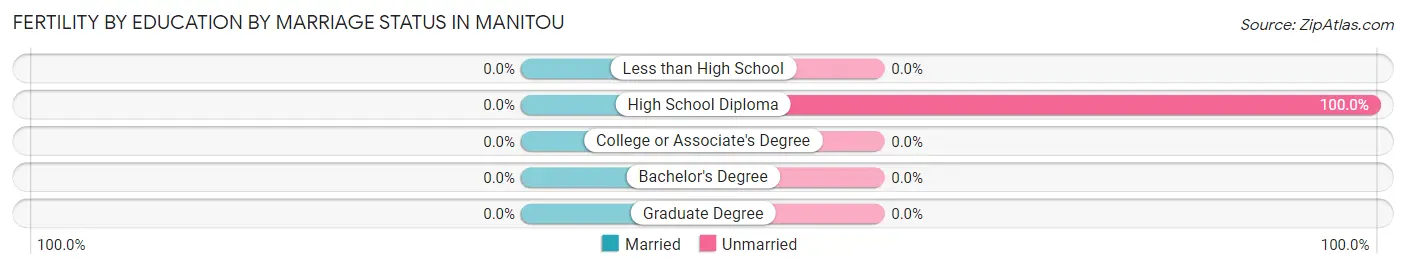
Fertility by Education by Marriage Status in Manitou
| Educational Attainment | Married | Unmarried |
| Less than High School | 0 (0.0%) | 0 (0.0%) |
| High School Diploma | 0 (0.0%) | 24 (100.0%) |
| College or Associate's Degree | 0 (0.0%) | 0 (0.0%) |
| Bachelor's Degree | 0 (0.0%) | 0 (0.0%) |
| Graduate Degree | 0 (0.0%) | 0 (0.0%) |
| Total | 0 (0.0%) | 24 (100.0%) |
Employment Characteristics in Manitou
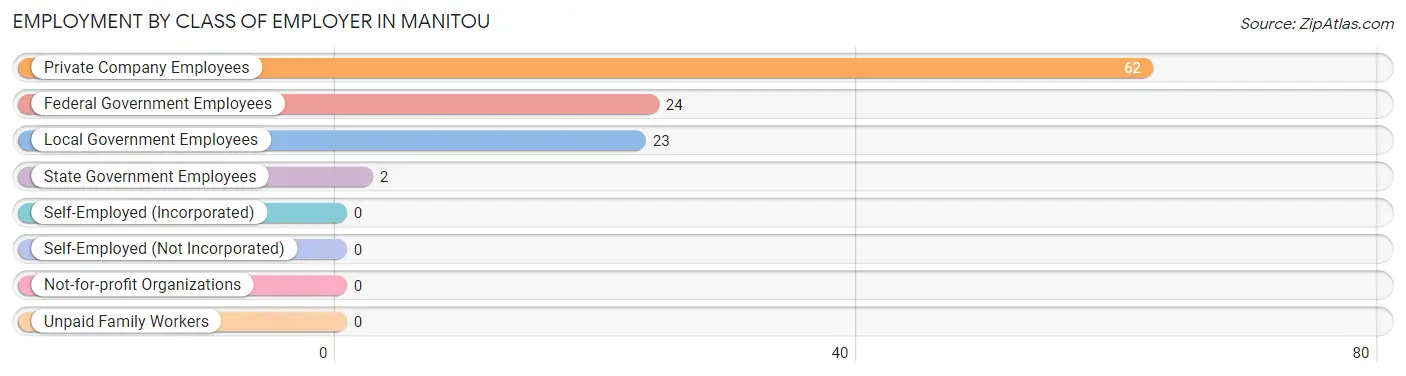
Employment by Class of Employer in Manitou
Among the 111 employed individuals in Manitou, private company employees (62 | 55.9%), federal government employees (24 | 21.6%), and local government employees (23 | 20.7%) make up the most common classes of employment.
| Employer Class | # Employees | % Employees |
| Private Company Employees | 62 | 55.9% |
| Self-Employed (Incorporated) | 0 | 0.0% |
| Self-Employed (Not Incorporated) | 0 | 0.0% |
| Not-for-profit Organizations | 0 | 0.0% |
| Local Government Employees | 23 | 20.7% |
| State Government Employees | 2 | 1.8% |
| Federal Government Employees | 24 | 21.6% |
| Unpaid Family Workers | 0 | 0.0% |
| Total | 111 | 100.0% |
Employment Status by Age in Manitou
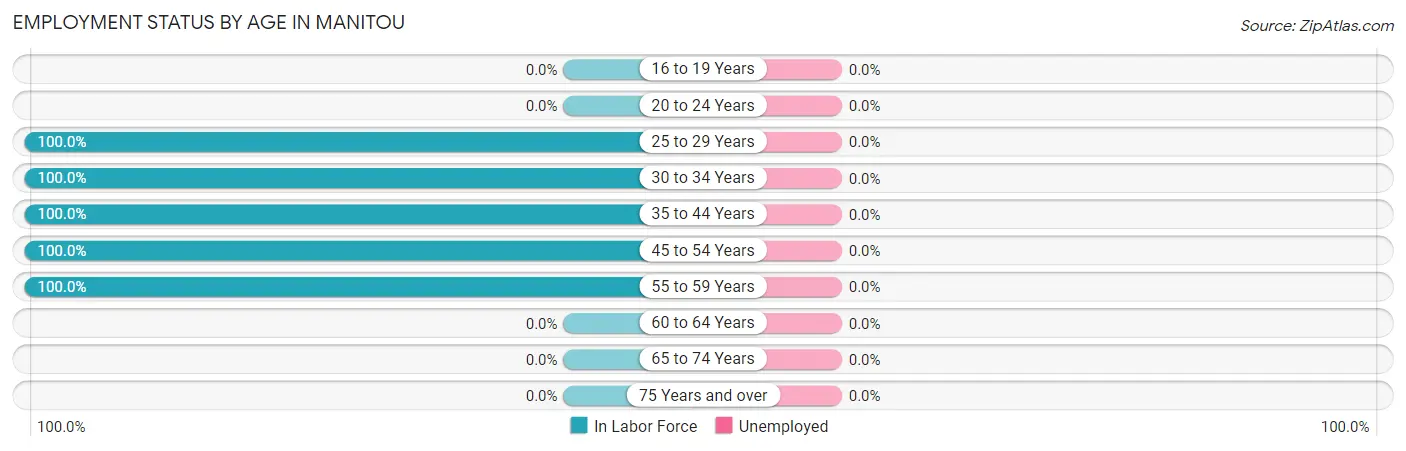
| Age Bracket | In Labor Force | Unemployed |
| 16 to 19 Years | 0 (0.0%) | 0 (0.0%) |
| 20 to 24 Years | 0 (0.0%) | 0 (0.0%) |
| 25 to 29 Years | 24 (100.0%) | 0 (0.0%) |
| 30 to 34 Years | 25 (100.0%) | 0 (0.0%) |
| 35 to 44 Years | 49 (100.0%) | 0 (0.0%) |
| 45 to 54 Years | 7 (100.0%) | 0 (0.0%) |
| 55 to 59 Years | 6 (100.0%) | 0 (0.0%) |
| 60 to 64 Years | 0 (0.0%) | 0 (0.0%) |
| 65 to 74 Years | 0 (0.0%) | 0 (0.0%) |
| 75 Years and over | 0 (0.0%) | 0 (0.0%) |
| Total | 111 (99.1%) | 0 (0.0%) |
Employment Status by Educational Attainment in Manitou
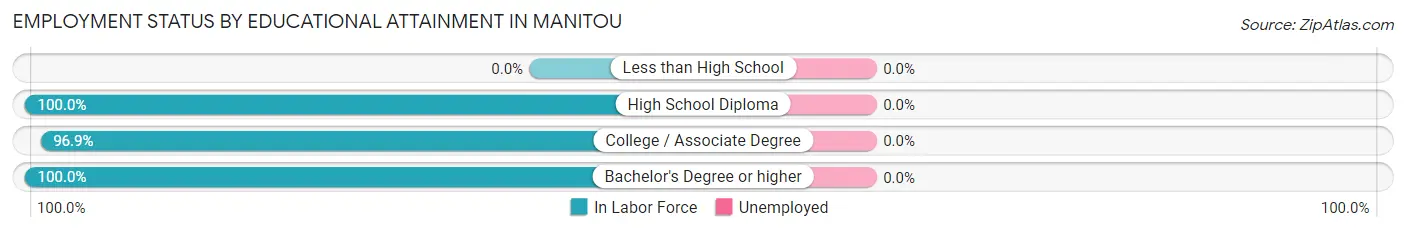
| Educational Attainment | In Labor Force | Unemployed |
| Less than High School | 0 (0.0%) | 0 (0.0%) |
| High School Diploma | 24 (100.0%) | 0 (0.0%) |
| College / Associate Degree | 31 (96.9%) | 0 (0.0%) |
| Bachelor's Degree or higher | 56 (100.0%) | 0 (0.0%) |
| Total | 111 (99.1%) | 0 (0.0%) |
Employment Occupations by Sex in Manitou
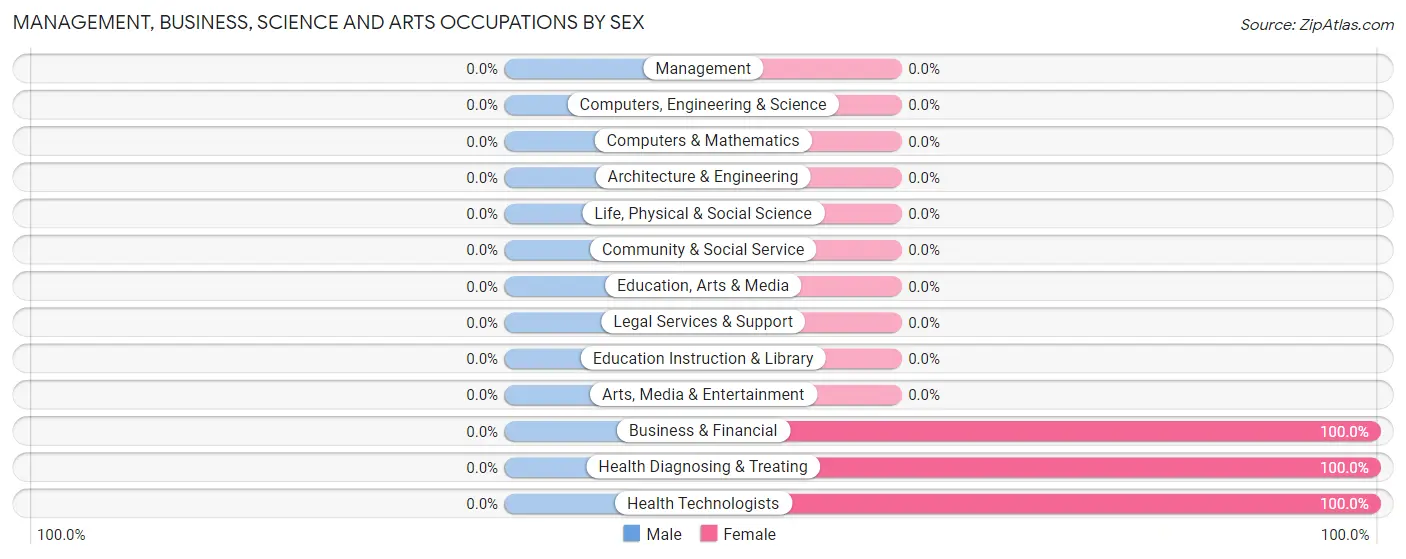
Management, Business, Science and Arts Occupations
The most common Management, Business, Science and Arts occupations in Manitou are Health Diagnosing & Treating (18 | 16.2%), Health Technologists (18 | 16.2%), and Business & Financial (2 | 1.8%).
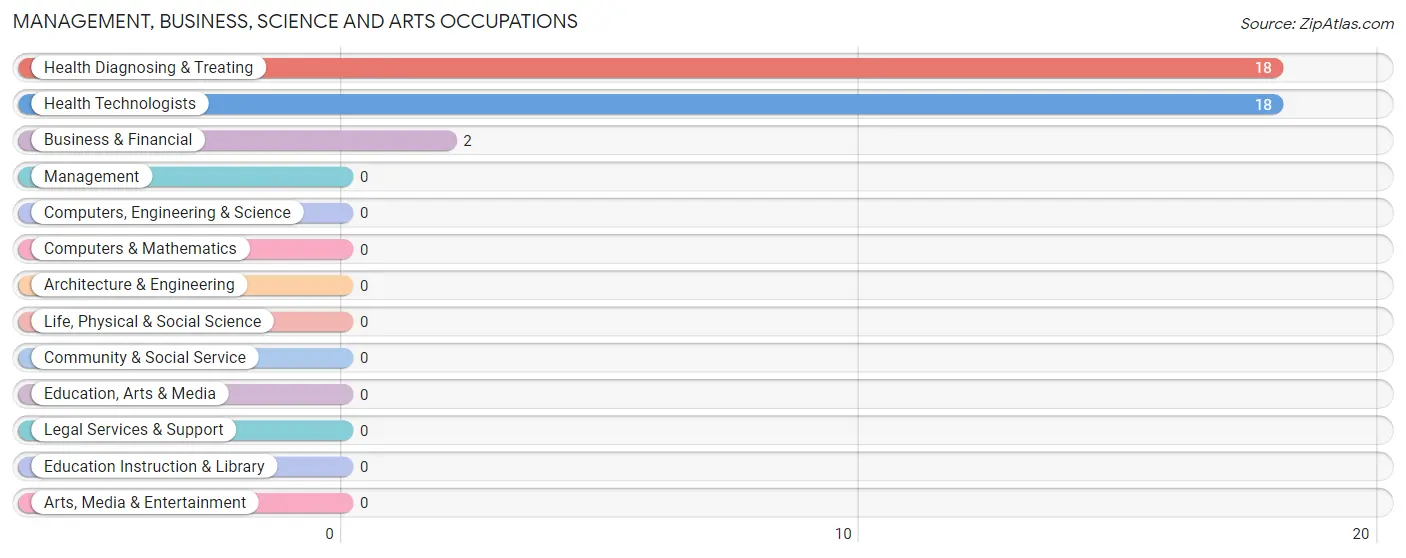
Management, Business, Science and Arts Occupations by Sex
| Occupation | Male | Female |
| Management | 0 (0.0%) | 0 (0.0%) |
| Business & Financial | 0 (0.0%) | 2 (100.0%) |
| Computers, Engineering & Science | 0 (0.0%) | 0 (0.0%) |
| Computers & Mathematics | 0 (0.0%) | 0 (0.0%) |
| Architecture & Engineering | 0 (0.0%) | 0 (0.0%) |
| Life, Physical & Social Science | 0 (0.0%) | 0 (0.0%) |
| Community & Social Service | 0 (0.0%) | 0 (0.0%) |
| Education, Arts & Media | 0 (0.0%) | 0 (0.0%) |
| Legal Services & Support | 0 (0.0%) | 0 (0.0%) |
| Education Instruction & Library | 0 (0.0%) | 0 (0.0%) |
| Arts, Media & Entertainment | 0 (0.0%) | 0 (0.0%) |
| Health Diagnosing & Treating | 0 (0.0%) | 18 (100.0%) |
| Health Technologists | 0 (0.0%) | 18 (100.0%) |
| Total (Category) | 0 (0.0%) | 20 (100.0%) |
| Total (Overall) | 54 (48.6%) | 57 (51.3%) |
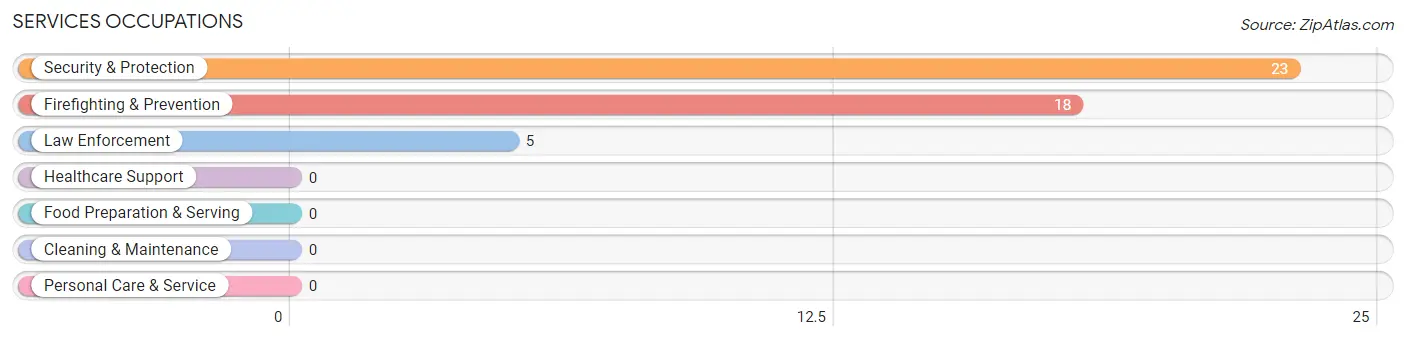
Services Occupations
The most common Services occupations in Manitou are Security & Protection (23 | 20.7%), Firefighting & Prevention (18 | 16.2%), and Law Enforcement (5 | 4.5%).
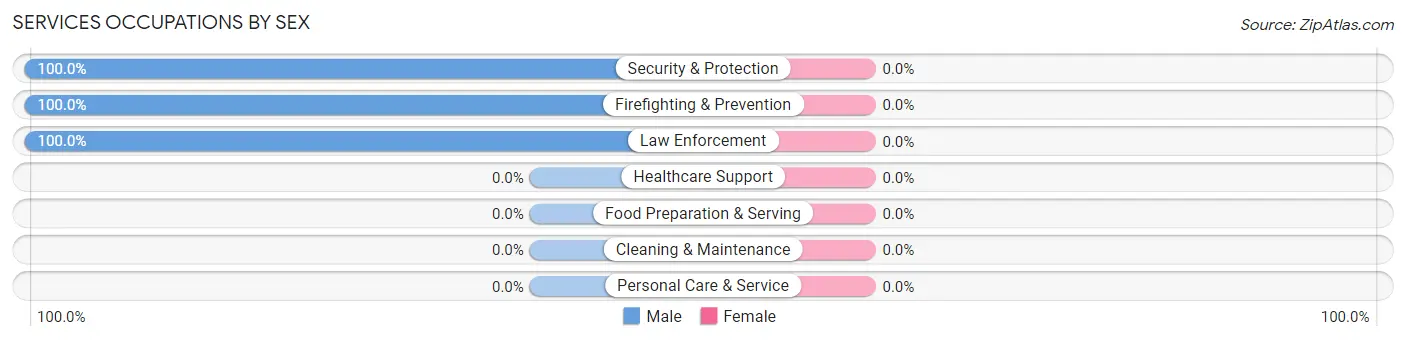
Services Occupations by Sex
| Occupation | Male | Female |
| Healthcare Support | 0 (0.0%) | 0 (0.0%) |
| Security & Protection | 23 (100.0%) | 0 (0.0%) |
| Firefighting & Prevention | 18 (100.0%) | 0 (0.0%) |
| Law Enforcement | 5 (100.0%) | 0 (0.0%) |
| Food Preparation & Serving | 0 (0.0%) | 0 (0.0%) |
| Cleaning & Maintenance | 0 (0.0%) | 0 (0.0%) |
| Personal Care & Service | 0 (0.0%) | 0 (0.0%) |
| Total (Category) | 23 (100.0%) | 0 (0.0%) |
| Total (Overall) | 54 (48.6%) | 57 (51.3%) |
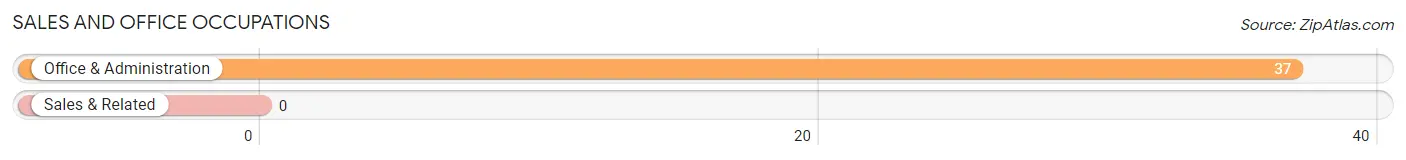
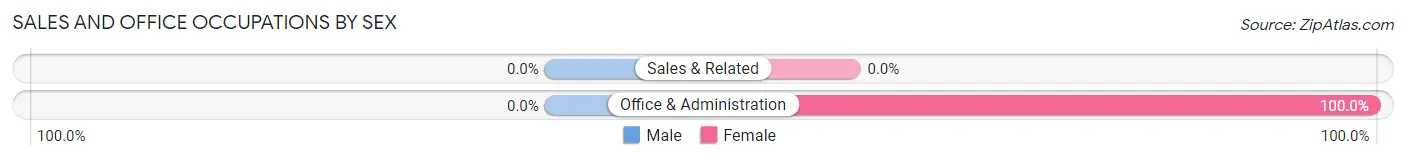
Sales and Office Occupations
The most common Sales and Office occupations in Manitou are , and Office & Administration (37 | 33.3%).
Sales and Office Occupations by Sex
| Occupation | Male | Female |
| Sales & Related | 0 (0.0%) | 0 (0.0%) |
| Office & Administration | 0 (0.0%) | 37 (100.0%) |
| Total (Category) | 0 (0.0%) | 37 (100.0%) |
| Total (Overall) | 54 (48.6%) | 57 (51.3%) |
Natural Resources, Construction and Maintenance Occupations
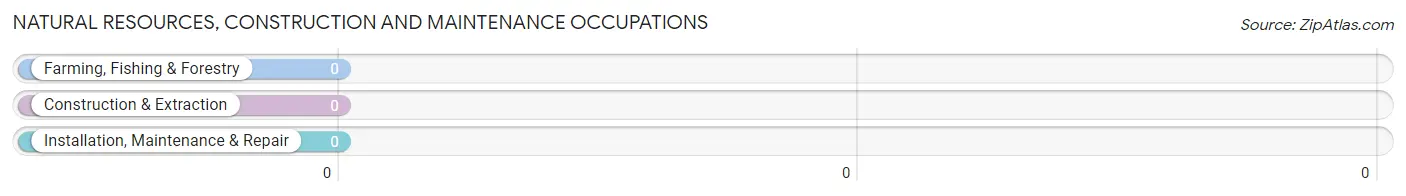
Natural Resources, Construction and Maintenance Occupations by Sex
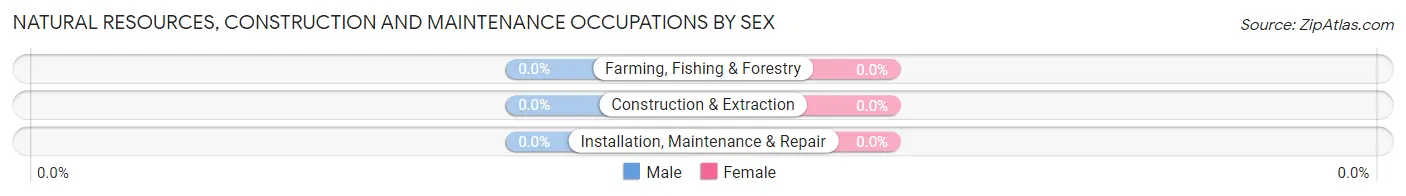
| Occupation | Male | Female |
| Farming, Fishing & Forestry | 0 (0.0%) | 0 (0.0%) |
| Construction & Extraction | 0 (0.0%) | 0 (0.0%) |
| Installation, Maintenance & Repair | 0 (0.0%) | 0 (0.0%) |
| Total (Category) | 0 (0.0%) | 0 (0.0%) |
| Total (Overall) | 54 (48.6%) | 57 (51.3%) |
Production, Transportation and Moving Occupations
The most common Production, Transportation and Moving occupations in Manitou are , and Transportation (31 | 27.9%).
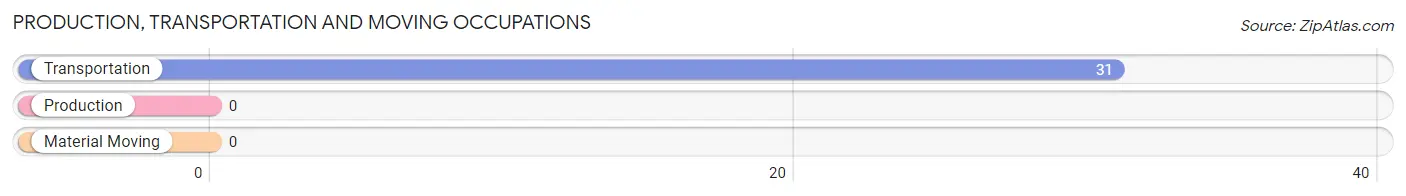
Production, Transportation and Moving Occupations by Sex
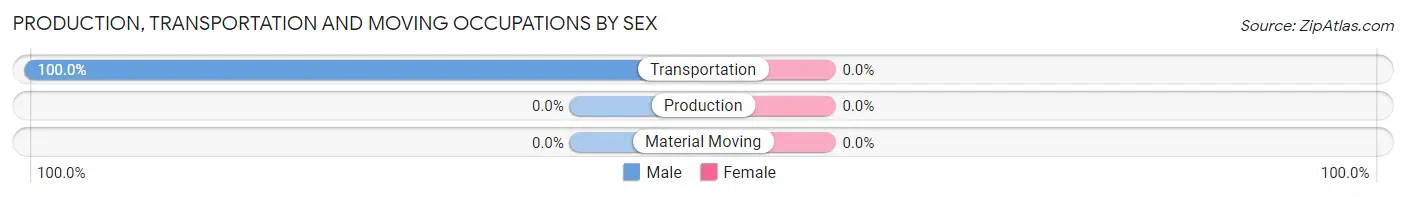
| Occupation | Male | Female |
| Production | 0 (0.0%) | 0 (0.0%) |
| Transportation | 31 (100.0%) | 0 (0.0%) |
| Material Moving | 0 (0.0%) | 0 (0.0%) |
| Total (Category) | 31 (100.0%) | 0 (0.0%) |
| Total (Overall) | 54 (48.6%) | 57 (51.3%) |
Employment Industries by Sex in Manitou
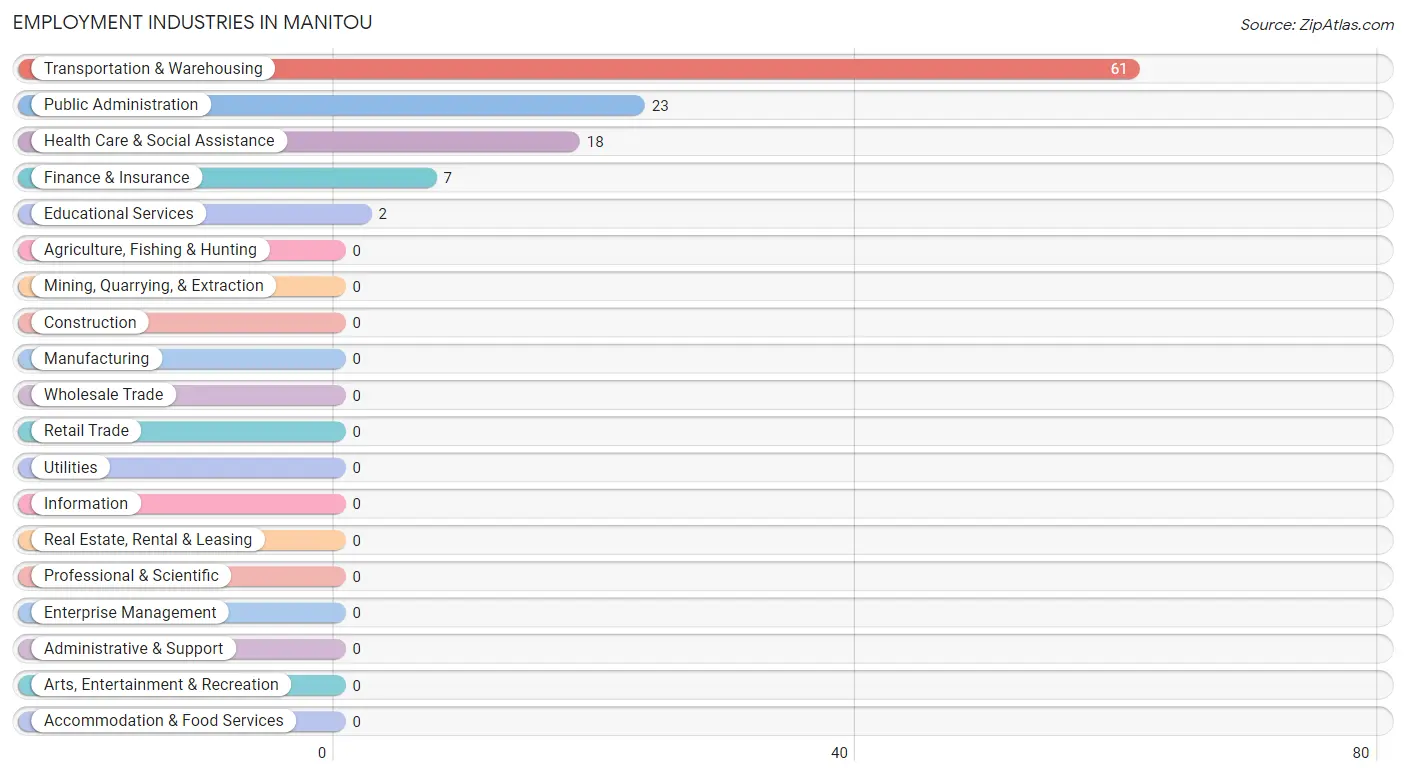
Employment Industries in Manitou
The major employment industries in Manitou include Transportation & Warehousing (61 | 54.9%), Public Administration (23 | 20.7%), Health Care & Social Assistance (18 | 16.2%), Finance & Insurance (7 | 6.3%), and Educational Services (2 | 1.8%).
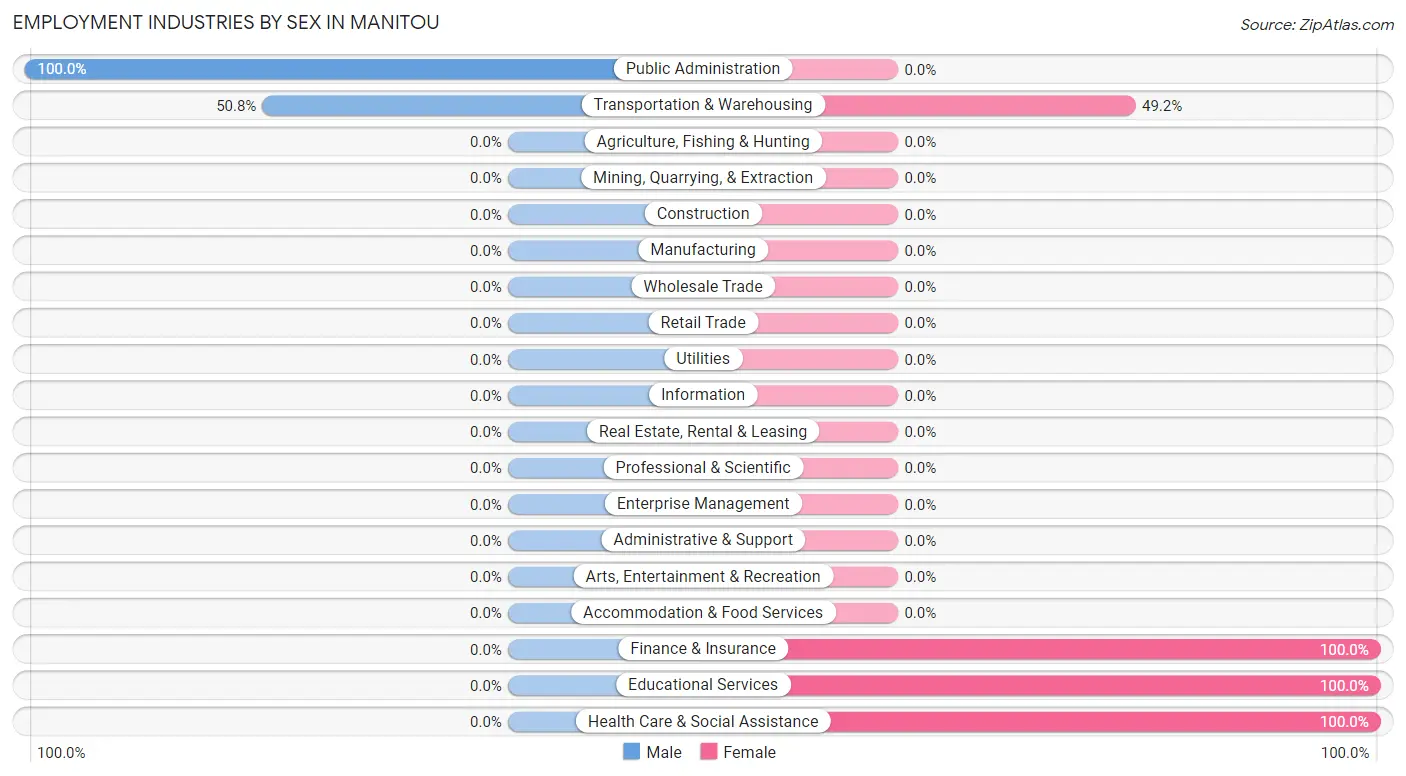
Employment Industries by Sex in Manitou
The Manitou industries that see more men than women are Public Administration (100.0%), and Transportation & Warehousing (50.8%), whereas the industries that tend to have a higher number of women are Finance & Insurance (100.0%), Educational Services (100.0%), and Health Care & Social Assistance (100.0%).
| Industry | Male | Female |
| Agriculture, Fishing & Hunting | 0 (0.0%) | 0 (0.0%) |
| Mining, Quarrying, & Extraction | 0 (0.0%) | 0 (0.0%) |
| Construction | 0 (0.0%) | 0 (0.0%) |
| Manufacturing | 0 (0.0%) | 0 (0.0%) |
| Wholesale Trade | 0 (0.0%) | 0 (0.0%) |
| Retail Trade | 0 (0.0%) | 0 (0.0%) |
| Transportation & Warehousing | 31 (50.8%) | 30 (49.2%) |
| Utilities | 0 (0.0%) | 0 (0.0%) |
| Information | 0 (0.0%) | 0 (0.0%) |
| Finance & Insurance | 0 (0.0%) | 7 (100.0%) |
| Real Estate, Rental & Leasing | 0 (0.0%) | 0 (0.0%) |
| Professional & Scientific | 0 (0.0%) | 0 (0.0%) |
| Enterprise Management | 0 (0.0%) | 0 (0.0%) |
| Administrative & Support | 0 (0.0%) | 0 (0.0%) |
| Educational Services | 0 (0.0%) | 2 (100.0%) |
| Health Care & Social Assistance | 0 (0.0%) | 18 (100.0%) |
| Arts, Entertainment & Recreation | 0 (0.0%) | 0 (0.0%) |
| Accommodation & Food Services | 0 (0.0%) | 0 (0.0%) |
| Public Administration | 23 (100.0%) | 0 (0.0%) |
| Total | 54 (48.6%) | 57 (51.3%) |
Education in Manitou
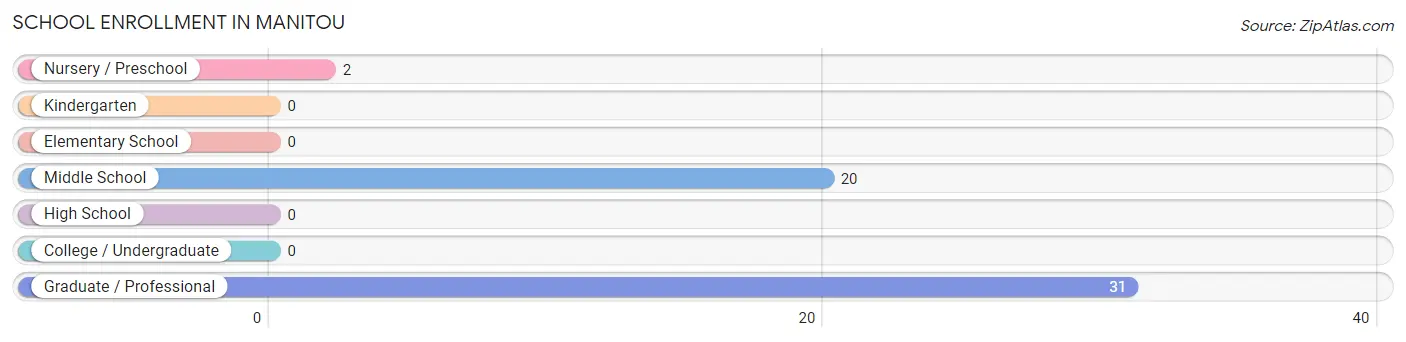
School Enrollment in Manitou
The most common levels of schooling among the 53 students in Manitou are graduate / professional (31 | 58.5%), middle school (20 | 37.7%), and nursery / preschool (2 | 3.8%).
| School Level | # Students | % Students |
| Nursery / Preschool | 2 | 3.8% |
| Kindergarten | 0 | 0.0% |
| Elementary School | 0 | 0.0% |
| Middle School | 20 | 37.7% |
| High School | 0 | 0.0% |
| College / Undergraduate | 0 | 0.0% |
| Graduate / Professional | 31 | 58.5% |
| Total | 53 | 100.0% |
School Enrollment by Age by Funding Source in Manitou
Out of a total of 53 students who are enrolled in schools in Manitou, 31 (58.5%) attend a private institution, while the remaining 22 (41.5%) are enrolled in public schools. The age group of 35 years and over has the highest likelihood of being enrolled in private schools, with 31 (100.0% in the age bracket) enrolled. Conversely, the age group of 5 to 9 year old has the lowest likelihood of being enrolled in a private school, with 2 (100.0% in the age bracket) attending a public institution.
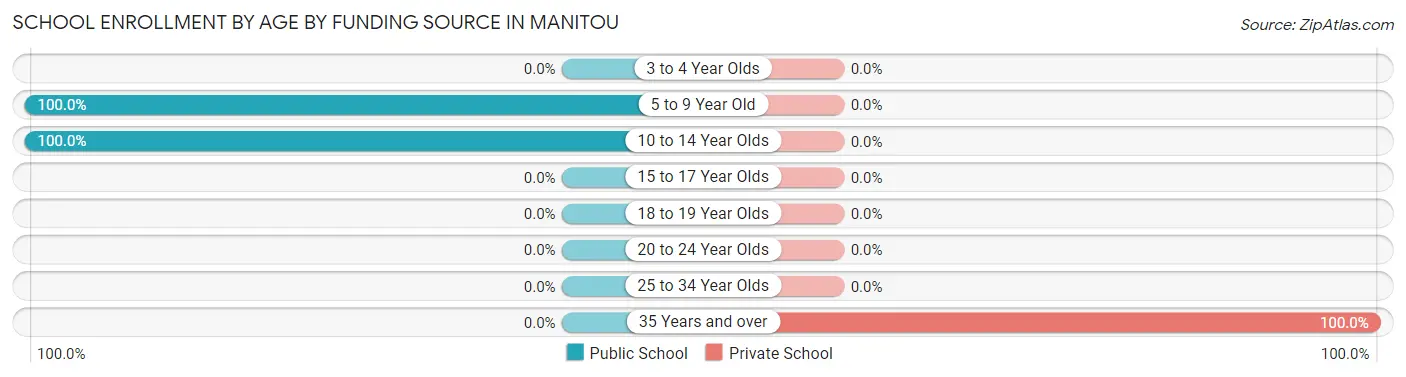
| Age Bracket | Public School | Private School |
| 3 to 4 Year Olds | 0 (0.0%) | 0 (0.0%) |
| 5 to 9 Year Old | 2 (100.0%) | 0 (0.0%) |
| 10 to 14 Year Olds | 20 (100.0%) | 0 (0.0%) |
| 15 to 17 Year Olds | 0 (0.0%) | 0 (0.0%) |
| 18 to 19 Year Olds | 0 (0.0%) | 0 (0.0%) |
| 20 to 24 Year Olds | 0 (0.0%) | 0 (0.0%) |
| 25 to 34 Year Olds | 0 (0.0%) | 0 (0.0%) |
| 35 Years and over | 0 (0.0%) | 31 (100.0%) |
| Total | 22 (41.5%) | 31 (58.5%) |
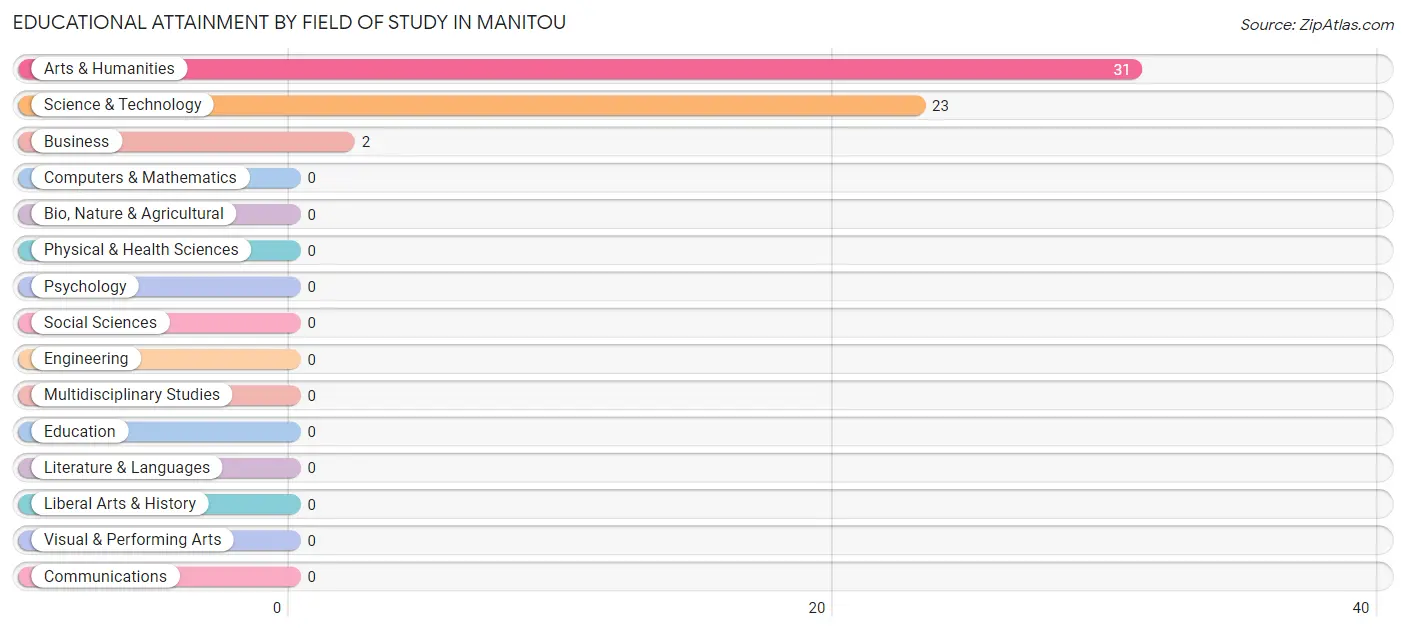
Educational Attainment by Field of Study in Manitou
Arts & humanities (31 | 55.4%), science & technology (23 | 41.1%), and business (2 | 3.6%) are the most common fields of study among 56 individuals in Manitou who have obtained a bachelor's degree or higher.
| Field of Study | # Graduates | % Graduates |
| Computers & Mathematics | 0 | 0.0% |
| Bio, Nature & Agricultural | 0 | 0.0% |
| Physical & Health Sciences | 0 | 0.0% |
| Psychology | 0 | 0.0% |
| Social Sciences | 0 | 0.0% |
| Engineering | 0 | 0.0% |
| Multidisciplinary Studies | 0 | 0.0% |
| Science & Technology | 23 | 41.1% |
| Business | 2 | 3.6% |
| Education | 0 | 0.0% |
| Literature & Languages | 0 | 0.0% |
| Liberal Arts & History | 0 | 0.0% |
| Visual & Performing Arts | 0 | 0.0% |
| Communications | 0 | 0.0% |
| Arts & Humanities | 31 | 55.4% |
| Total | 56 | 100.0% |
Transportation & Commute in Manitou
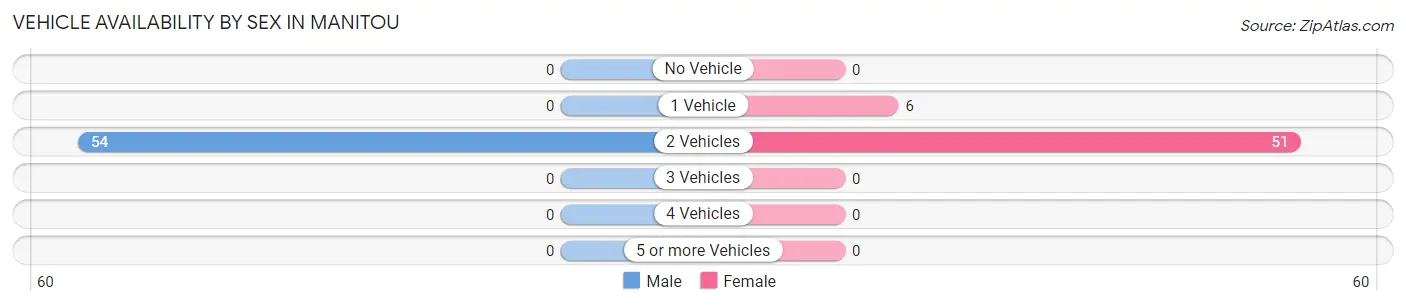
Vehicle Availability by Sex in Manitou
The most prevalent vehicle ownership categories in Manitou are males with 2 vehicles (54, accounting for 100.0%) and females with 2 vehicles (51, making up 94.7%).
| Vehicles Available | Male | Female |
| No Vehicle | 0 (0.0%) | 0 (0.0%) |
| 1 Vehicle | 0 (0.0%) | 6 (10.5%) |
| 2 Vehicles | 54 (100.0%) | 51 (89.5%) |
| 3 Vehicles | 0 (0.0%) | 0 (0.0%) |
| 4 Vehicles | 0 (0.0%) | 0 (0.0%) |
| 5 or more Vehicles | 0 (0.0%) | 0 (0.0%) |
| Total | 54 (100.0%) | 57 (100.0%) |
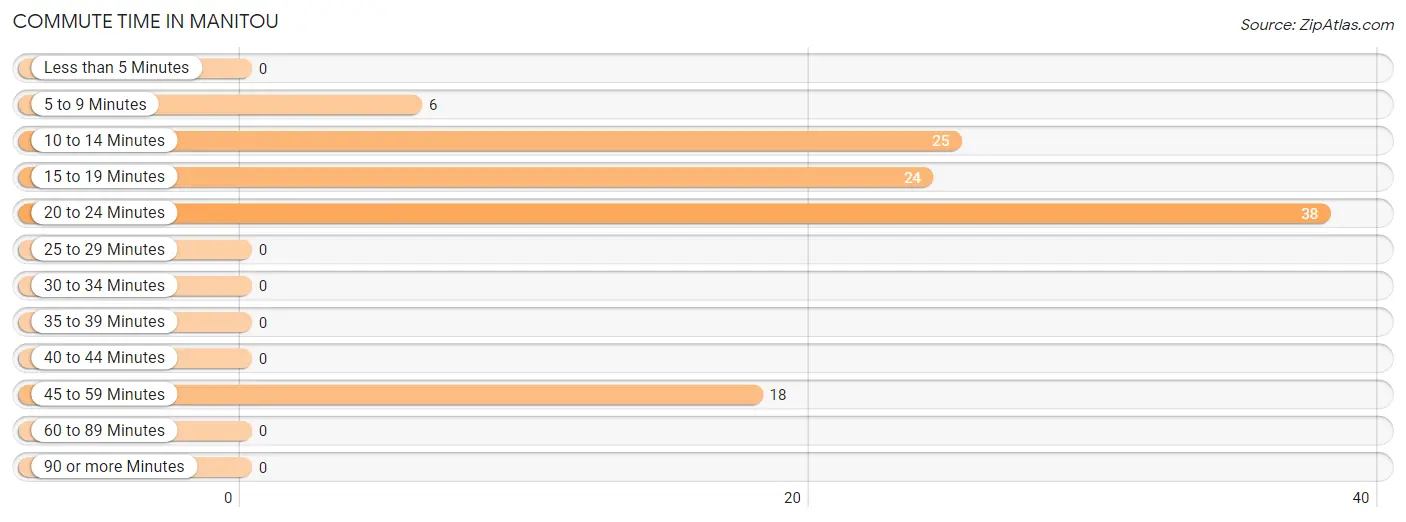
Commute Time in Manitou
The most frequently occuring commute durations in Manitou are 20 to 24 minutes (38 commuters, 34.2%), 10 to 14 minutes (25 commuters, 22.5%), and 15 to 19 minutes (24 commuters, 21.6%).
| Commute Time | # Commuters | % Commuters |
| Less than 5 Minutes | 0 | 0.0% |
| 5 to 9 Minutes | 6 | 5.4% |
| 10 to 14 Minutes | 25 | 22.5% |
| 15 to 19 Minutes | 24 | 21.6% |
| 20 to 24 Minutes | 38 | 34.2% |
| 25 to 29 Minutes | 0 | 0.0% |
| 30 to 34 Minutes | 0 | 0.0% |
| 35 to 39 Minutes | 0 | 0.0% |
| 40 to 44 Minutes | 0 | 0.0% |
| 45 to 59 Minutes | 18 | 16.2% |
| 60 to 89 Minutes | 0 | 0.0% |
| 90 or more Minutes | 0 | 0.0% |
Commute Time by Sex in Manitou
The most common commute times in Manitou are 20 to 24 minutes (31 commuters, 57.4%) for males and 15 to 19 minutes (24 commuters, 42.1%) for females.
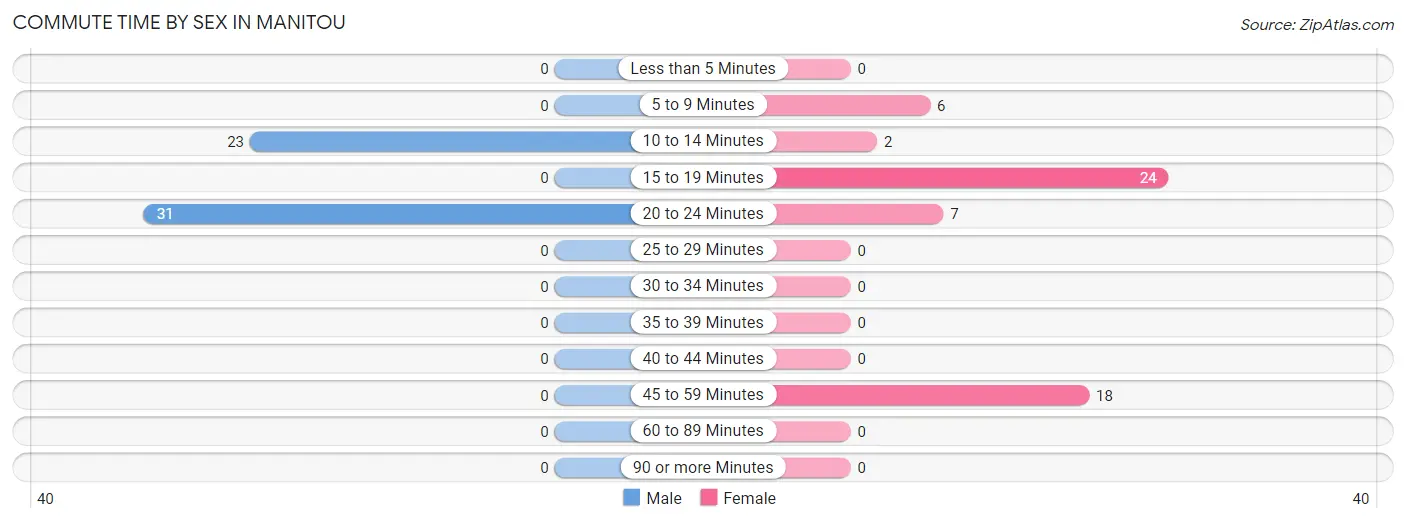
| Commute Time | Male | Female |
| Less than 5 Minutes | 0 (0.0%) | 0 (0.0%) |
| 5 to 9 Minutes | 0 (0.0%) | 6 (10.5%) |
| 10 to 14 Minutes | 23 (42.6%) | 2 (3.5%) |
| 15 to 19 Minutes | 0 (0.0%) | 24 (42.1%) |
| 20 to 24 Minutes | 31 (57.4%) | 7 (12.3%) |
| 25 to 29 Minutes | 0 (0.0%) | 0 (0.0%) |
| 30 to 34 Minutes | 0 (0.0%) | 0 (0.0%) |
| 35 to 39 Minutes | 0 (0.0%) | 0 (0.0%) |
| 40 to 44 Minutes | 0 (0.0%) | 0 (0.0%) |
| 45 to 59 Minutes | 0 (0.0%) | 18 (31.6%) |
| 60 to 89 Minutes | 0 (0.0%) | 0 (0.0%) |
| 90 or more Minutes | 0 (0.0%) | 0 (0.0%) |
Time of Departure to Work by Sex in Manitou
The most frequent times of departure to work in Manitou are 8:00 AM to 8:29 AM (31, 57.4%) for males and 7:00 AM to 7:29 AM (42, 73.7%) for females.
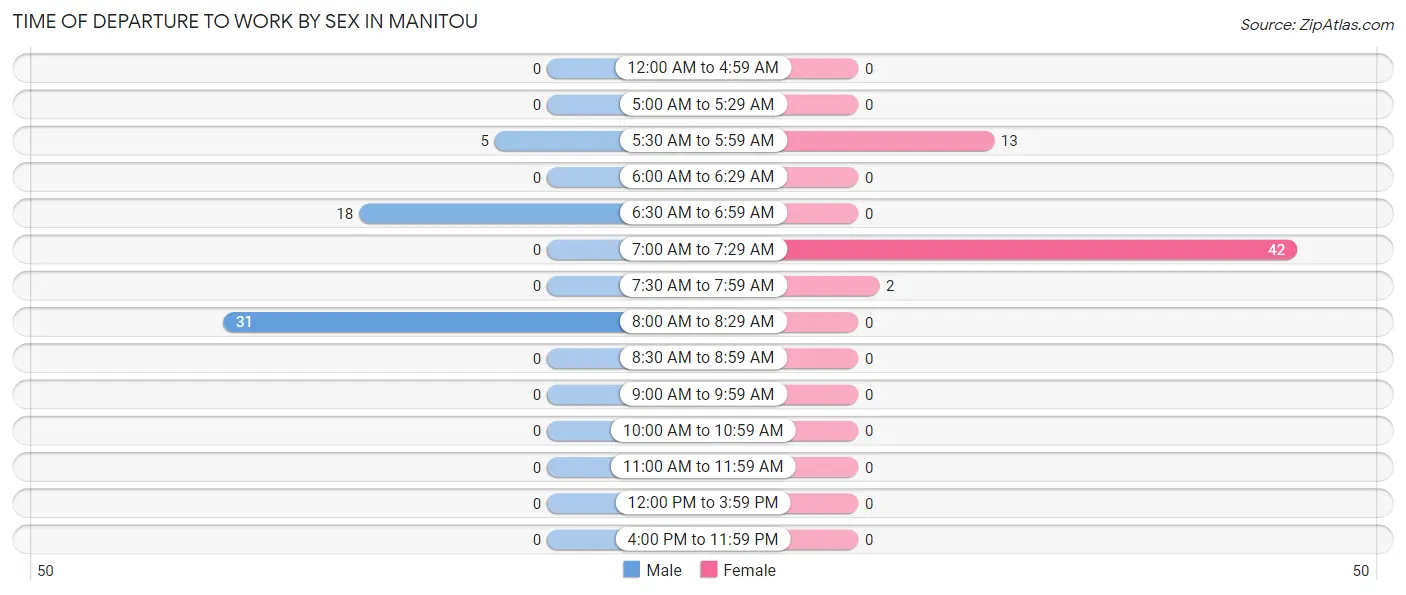
| Time of Departure | Male | Female |
| 12:00 AM to 4:59 AM | 0 (0.0%) | 0 (0.0%) |
| 5:00 AM to 5:29 AM | 0 (0.0%) | 0 (0.0%) |
| 5:30 AM to 5:59 AM | 5 (9.3%) | 13 (22.8%) |
| 6:00 AM to 6:29 AM | 0 (0.0%) | 0 (0.0%) |
| 6:30 AM to 6:59 AM | 18 (33.3%) | 0 (0.0%) |
| 7:00 AM to 7:29 AM | 0 (0.0%) | 42 (73.7%) |
| 7:30 AM to 7:59 AM | 0 (0.0%) | 2 (3.5%) |
| 8:00 AM to 8:29 AM | 31 (57.4%) | 0 (0.0%) |
| 8:30 AM to 8:59 AM | 0 (0.0%) | 0 (0.0%) |
| 9:00 AM to 9:59 AM | 0 (0.0%) | 0 (0.0%) |
| 10:00 AM to 10:59 AM | 0 (0.0%) | 0 (0.0%) |
| 11:00 AM to 11:59 AM | 0 (0.0%) | 0 (0.0%) |
| 12:00 PM to 3:59 PM | 0 (0.0%) | 0 (0.0%) |
| 4:00 PM to 11:59 PM | 0 (0.0%) | 0 (0.0%) |
| Total | 54 (100.0%) | 57 (100.0%) |
Housing Occupancy in Manitou
Occupancy by Ownership in Manitou
Of the total 58 dwellings in Manitou, owner-occupied units account for 40 (69.0%), while renter-occupied units make up 18 (31.0%).
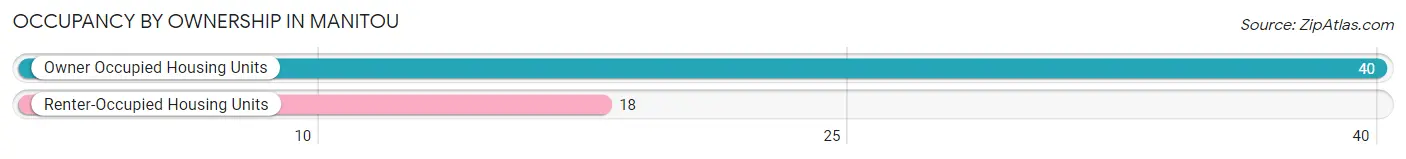
| Occupancy | # Housing Units | % Housing Units |
| Owner Occupied Housing Units | 40 | 69.0% |
| Renter-Occupied Housing Units | 18 | 31.0% |
| Total Occupied Housing Units | 58 | 100.0% |
Occupancy by Household Size in Manitou
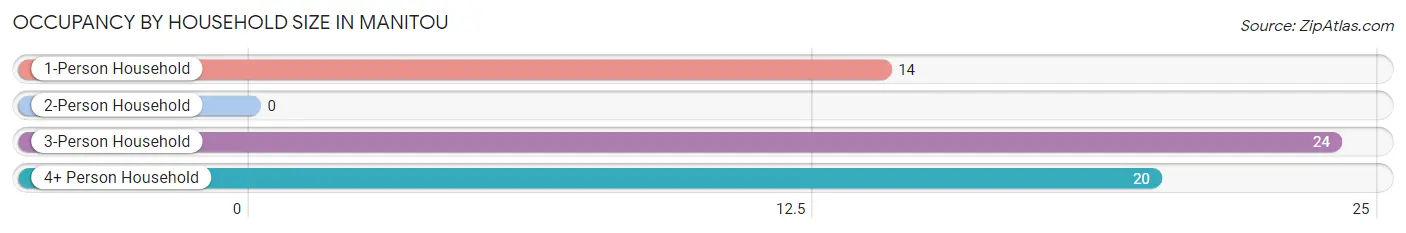
| Household Size | # Housing Units | % Housing Units |
| 1-Person Household | 14 | 24.1% |
| 2-Person Household | 0 | 0.0% |
| 3-Person Household | 24 | 41.4% |
| 4+ Person Household | 20 | 34.5% |
| Total Housing Units | 58 | 100.0% |
Occupancy by Ownership by Household Size in Manitou
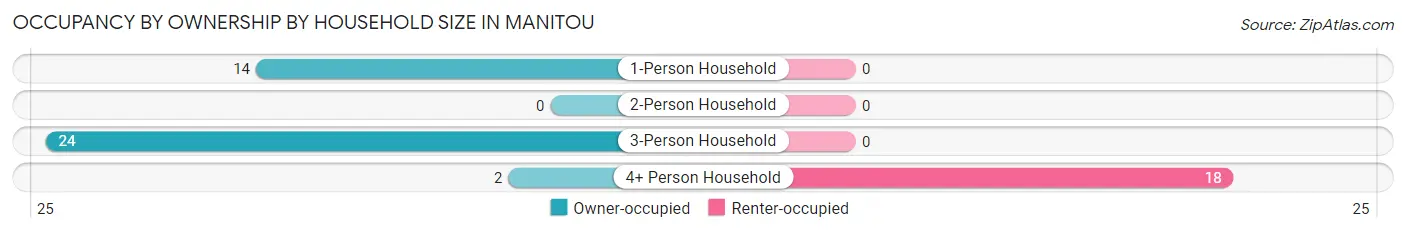
| Household Size | Owner-occupied | Renter-occupied |
| 1-Person Household | 14 (100.0%) | 0 (0.0%) |
| 2-Person Household | 0 (0.0%) | 0 (0.0%) |
| 3-Person Household | 24 (100.0%) | 0 (0.0%) |
| 4+ Person Household | 2 (10.0%) | 18 (90.0%) |
| Total Housing Units | 40 (69.0%) | 18 (31.0%) |
Occupancy by Educational Attainment in Manitou
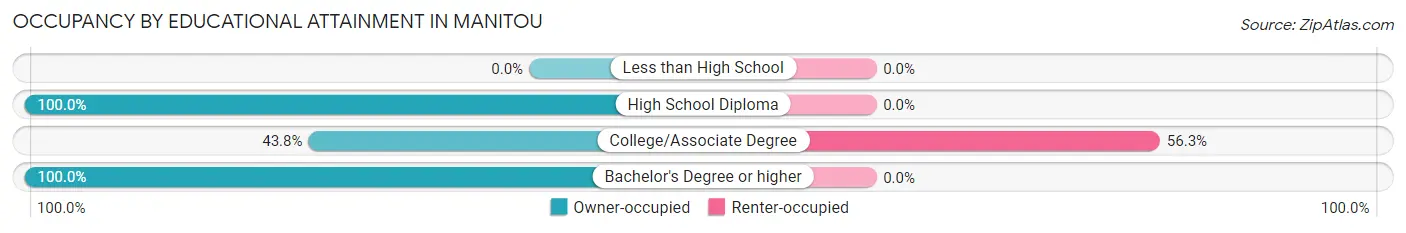
| Household Size | Owner-occupied | Renter-occupied |
| Less than High School | 0 (0.0%) | 0 (0.0%) |
| High School Diploma | 24 (100.0%) | 0 (0.0%) |
| College/Associate Degree | 14 (43.8%) | 18 (56.2%) |
| Bachelor's Degree or higher | 2 (100.0%) | 0 (0.0%) |
Occupancy by Age of Householder in Manitou
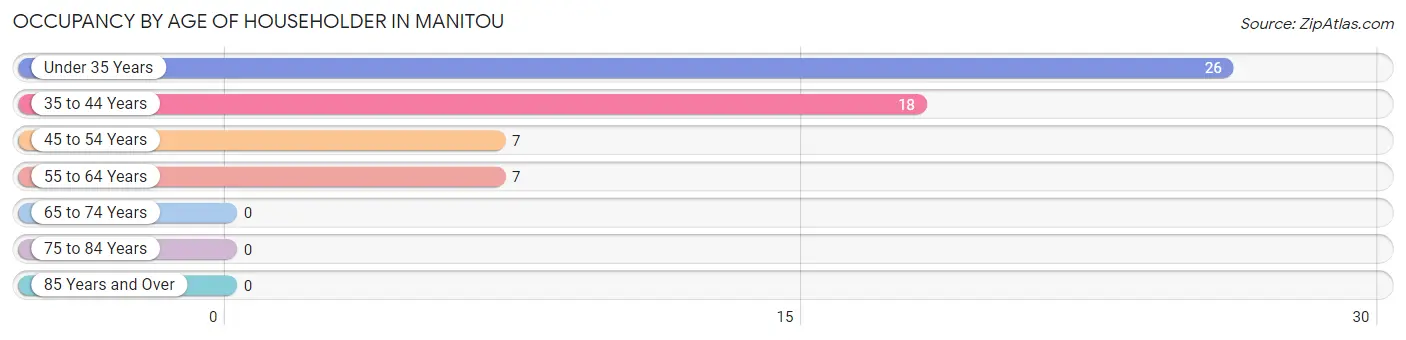
| Age Bracket | # Households | % Households |
| Under 35 Years | 26 | 44.8% |
| 35 to 44 Years | 18 | 31.0% |
| 45 to 54 Years | 7 | 12.1% |
| 55 to 64 Years | 7 | 12.1% |
| 65 to 74 Years | 0 | 0.0% |
| 75 to 84 Years | 0 | 0.0% |
| 85 Years and Over | 0 | 0.0% |
| Total | 58 | 100.0% |
Housing Finances in Manitou
Median Income by Occupancy in Manitou
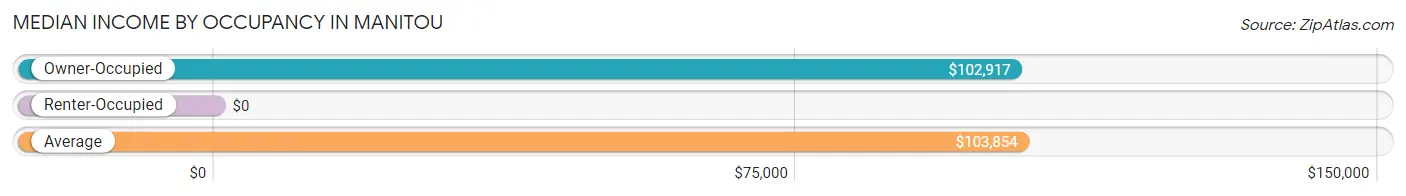
| Occupancy Type | # Households | Median Income |
| Owner-Occupied | 40 (69.0%) | $102,917 |
| Renter-Occupied | 18 (31.0%) | $0 |
| Average | 58 (100.0%) | $103,854 |
Occupancy by Householder Income Bracket in Manitou
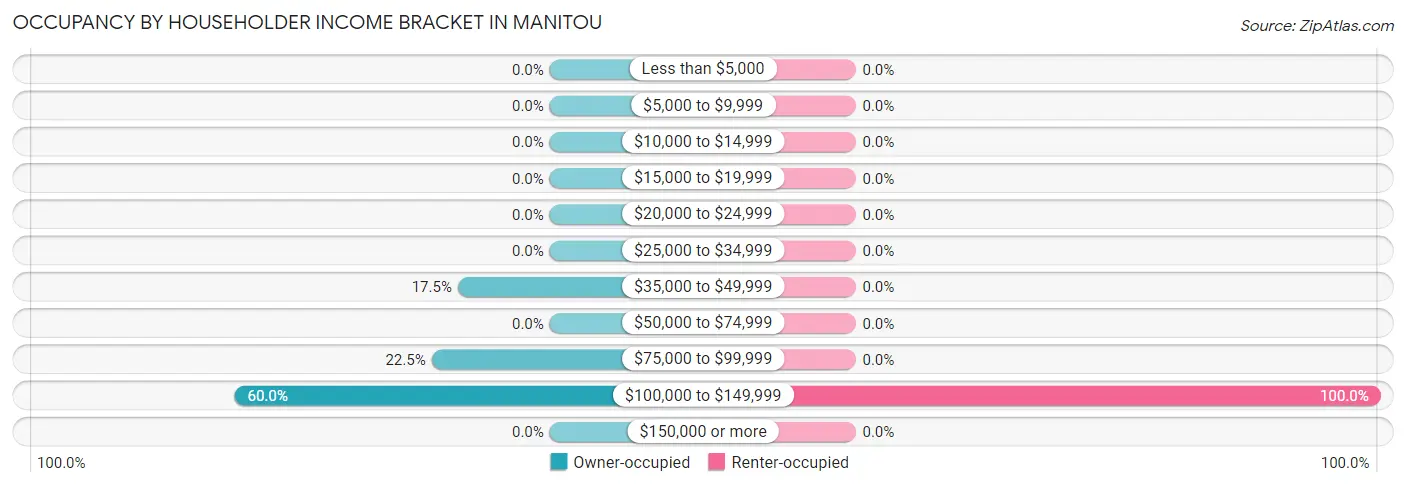
| Income Bracket | Owner-occupied | Renter-occupied |
| Less than $5,000 | 0 (0.0%) | 0 (0.0%) |
| $5,000 to $9,999 | 0 (0.0%) | 0 (0.0%) |
| $10,000 to $14,999 | 0 (0.0%) | 0 (0.0%) |
| $15,000 to $19,999 | 0 (0.0%) | 0 (0.0%) |
| $20,000 to $24,999 | 0 (0.0%) | 0 (0.0%) |
| $25,000 to $34,999 | 0 (0.0%) | 0 (0.0%) |
| $35,000 to $49,999 | 7 (17.5%) | 0 (0.0%) |
| $50,000 to $74,999 | 0 (0.0%) | 0 (0.0%) |
| $75,000 to $99,999 | 9 (22.5%) | 0 (0.0%) |
| $100,000 to $149,999 | 24 (60.0%) | 18 (100.0%) |
| $150,000 or more | 0 (0.0%) | 0 (0.0%) |
| Total | 40 (100.0%) | 18 (100.0%) |
Monthly Housing Cost Tiers in Manitou
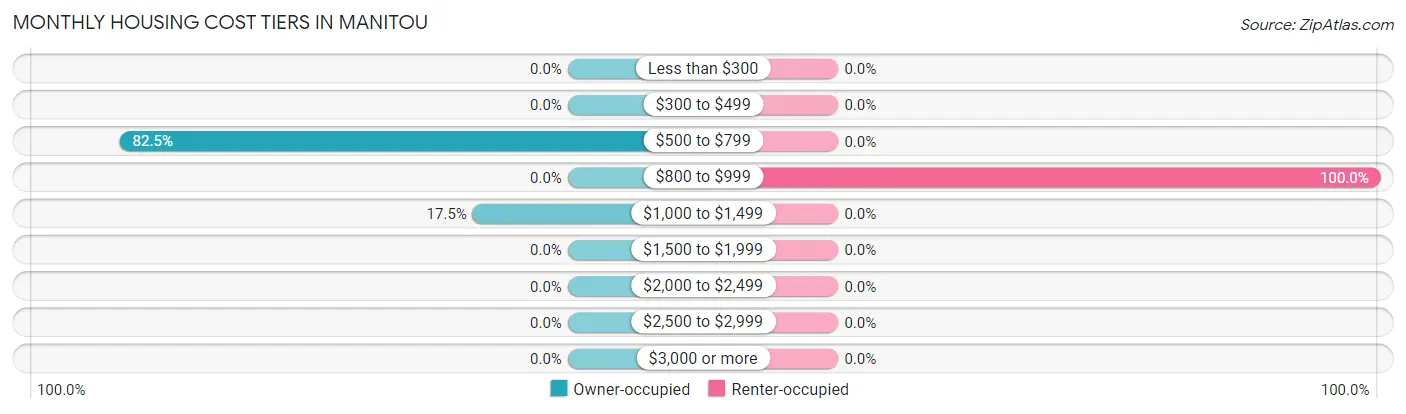
| Monthly Cost | Owner-occupied | Renter-occupied |
| Less than $300 | 0 (0.0%) | 0 (0.0%) |
| $300 to $499 | 0 (0.0%) | 0 (0.0%) |
| $500 to $799 | 33 (82.5%) | 0 (0.0%) |
| $800 to $999 | 0 (0.0%) | 18 (100.0%) |
| $1,000 to $1,499 | 7 (17.5%) | 0 (0.0%) |
| $1,500 to $1,999 | 0 (0.0%) | 0 (0.0%) |
| $2,000 to $2,499 | 0 (0.0%) | 0 (0.0%) |
| $2,500 to $2,999 | 0 (0.0%) | 0 (0.0%) |
| $3,000 or more | 0 (0.0%) | 0 (0.0%) |
| Total | 40 (100.0%) | 18 (100.0%) |
Physical Housing Characteristics in Manitou
Housing Structures in Manitou
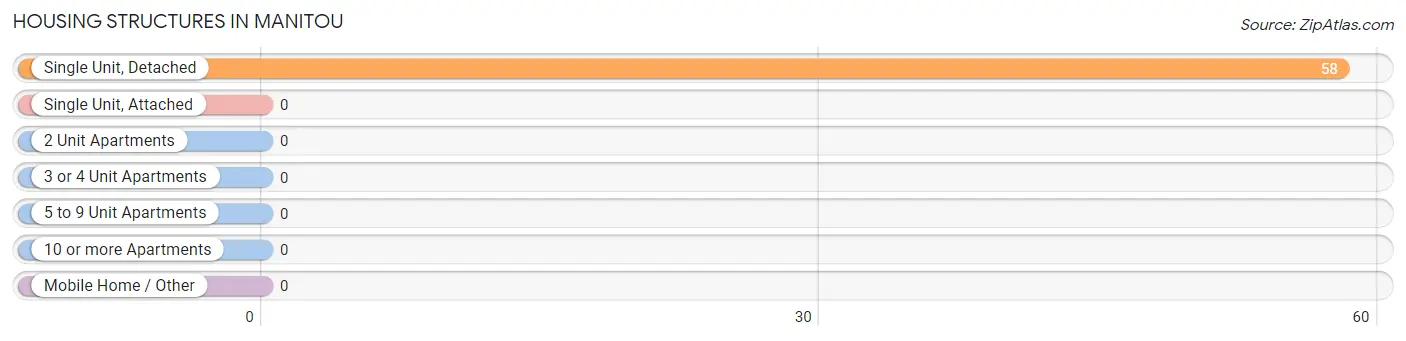
| Structure Type | # Housing Units | % Housing Units |
| Single Unit, Detached | 58 | 100.0% |
| Single Unit, Attached | 0 | 0.0% |
| 2 Unit Apartments | 0 | 0.0% |
| 3 or 4 Unit Apartments | 0 | 0.0% |
| 5 to 9 Unit Apartments | 0 | 0.0% |
| 10 or more Apartments | 0 | 0.0% |
| Mobile Home / Other | 0 | 0.0% |
| Total | 58 | 100.0% |
Housing Structures by Occupancy in Manitou
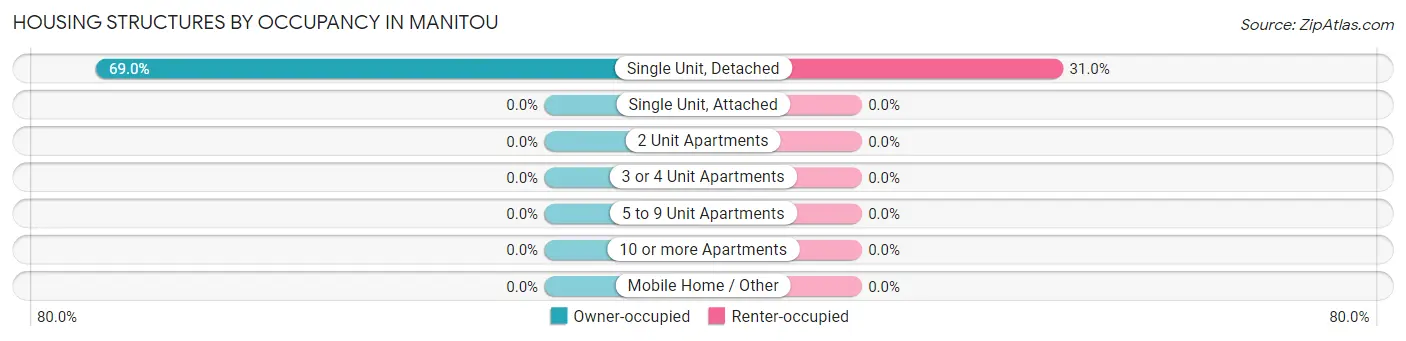
| Structure Type | Owner-occupied | Renter-occupied |
| Single Unit, Detached | 40 (69.0%) | 18 (31.0%) |
| Single Unit, Attached | 0 (0.0%) | 0 (0.0%) |
| 2 Unit Apartments | 0 (0.0%) | 0 (0.0%) |
| 3 or 4 Unit Apartments | 0 (0.0%) | 0 (0.0%) |
| 5 to 9 Unit Apartments | 0 (0.0%) | 0 (0.0%) |
| 10 or more Apartments | 0 (0.0%) | 0 (0.0%) |
| Mobile Home / Other | 0 (0.0%) | 0 (0.0%) |
| Total | 40 (69.0%) | 18 (31.0%) |
Housing Structures by Number of Rooms in Manitou
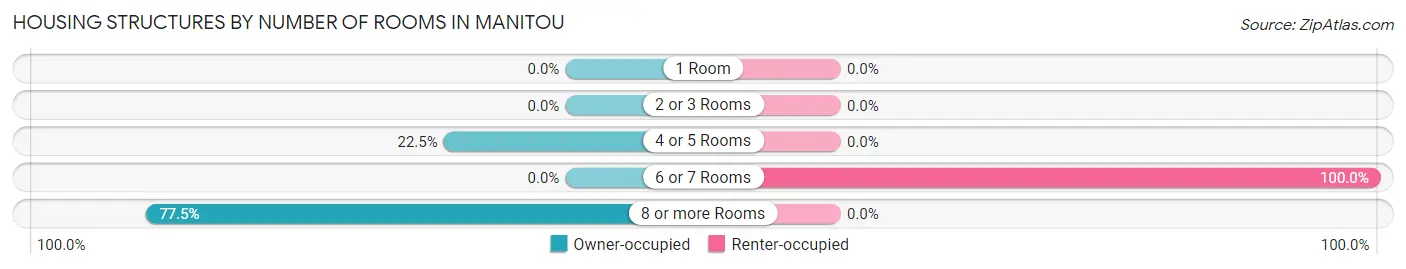
| Number of Rooms | Owner-occupied | Renter-occupied |
| 1 Room | 0 (0.0%) | 0 (0.0%) |
| 2 or 3 Rooms | 0 (0.0%) | 0 (0.0%) |
| 4 or 5 Rooms | 9 (22.5%) | 0 (0.0%) |
| 6 or 7 Rooms | 0 (0.0%) | 18 (100.0%) |
| 8 or more Rooms | 31 (77.5%) | 0 (0.0%) |
| Total | 40 (100.0%) | 18 (100.0%) |
Housing Structure by Heating Type in Manitou
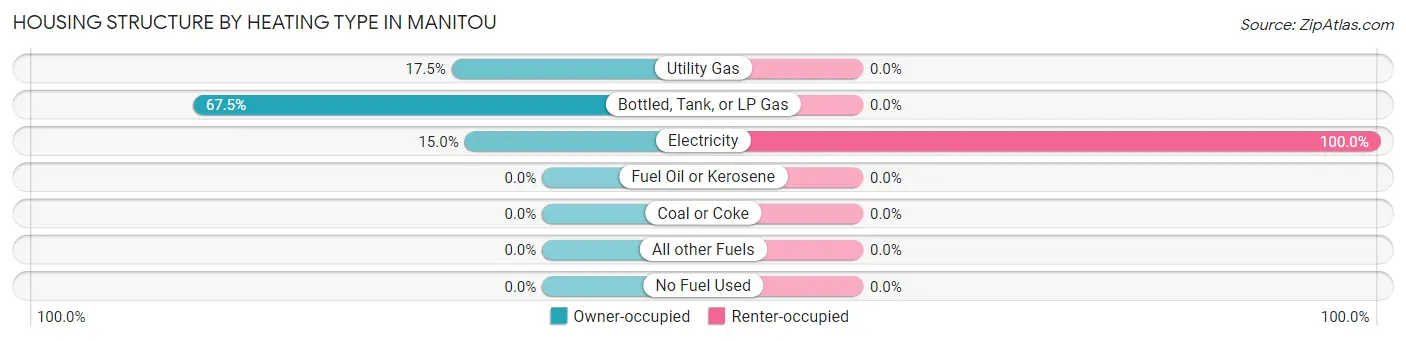
| Heating Type | Owner-occupied | Renter-occupied |
| Utility Gas | 7 (17.5%) | 0 (0.0%) |
| Bottled, Tank, or LP Gas | 27 (67.5%) | 0 (0.0%) |
| Electricity | 6 (15.0%) | 18 (100.0%) |
| Fuel Oil or Kerosene | 0 (0.0%) | 0 (0.0%) |
| Coal or Coke | 0 (0.0%) | 0 (0.0%) |
| All other Fuels | 0 (0.0%) | 0 (0.0%) |
| No Fuel Used | 0 (0.0%) | 0 (0.0%) |
| Total | 40 (100.0%) | 18 (100.0%) |
Household Vehicle Usage in Manitou
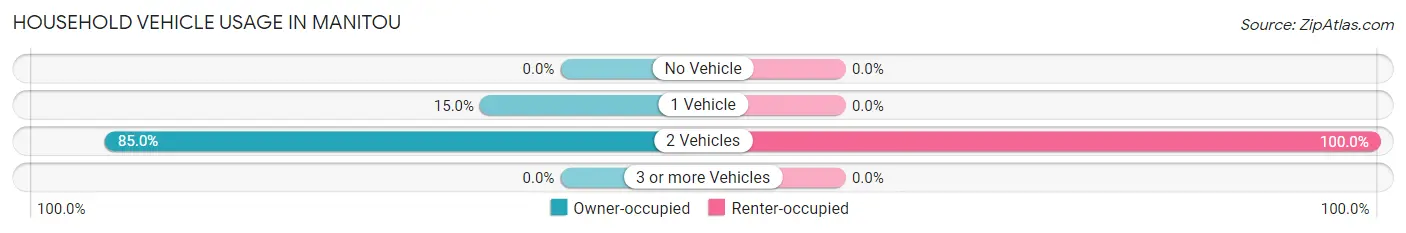
| Vehicles per Household | Owner-occupied | Renter-occupied |
| No Vehicle | 0 (0.0%) | 0 (0.0%) |
| 1 Vehicle | 6 (15.0%) | 0 (0.0%) |
| 2 Vehicles | 34 (85.0%) | 18 (100.0%) |
| 3 or more Vehicles | 0 (0.0%) | 0 (0.0%) |
| Total | 40 (100.0%) | 18 (100.0%) |
Real Estate & Mortgages in Manitou
Real Estate and Mortgage Overview in Manitou
| Characteristic | Without Mortgage | With Mortgage |
| Housing Units | 25 | 15 |
| Median Property Value | - | - |
| Median Household Income | - | - |
| Monthly Housing Costs | - | - |
| Real Estate Taxes | - | - |
Property Value by Mortgage Status in Manitou
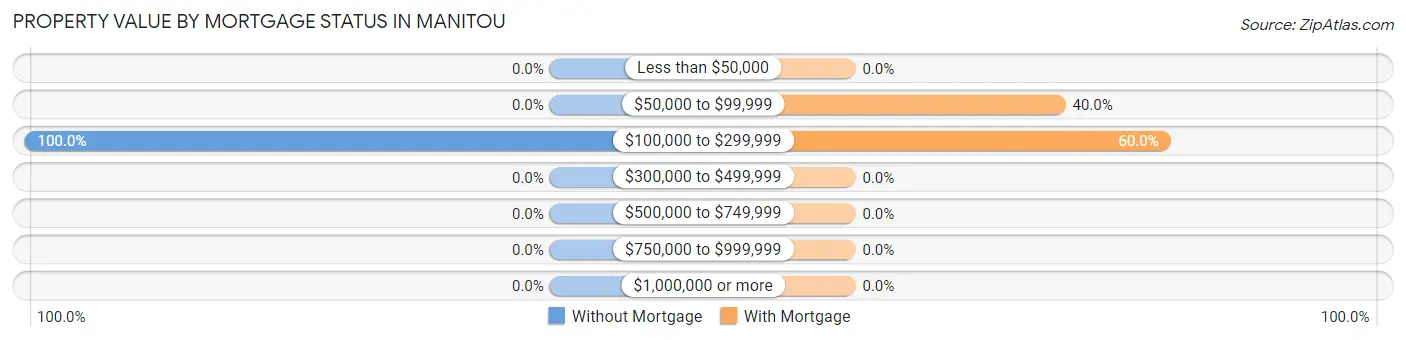
| Property Value | Without Mortgage | With Mortgage |
| Less than $50,000 | 0 (0.0%) | 0 (0.0%) |
| $50,000 to $99,999 | 0 (0.0%) | 6 (40.0%) |
| $100,000 to $299,999 | 25 (100.0%) | 9 (60.0%) |
| $300,000 to $499,999 | 0 (0.0%) | 0 (0.0%) |
| $500,000 to $749,999 | 0 (0.0%) | 0 (0.0%) |
| $750,000 to $999,999 | 0 (0.0%) | 0 (0.0%) |
| $1,000,000 or more | 0 (0.0%) | 0 (0.0%) |
| Total | 25 (100.0%) | 15 (100.0%) |
Household Income by Mortgage Status in Manitou
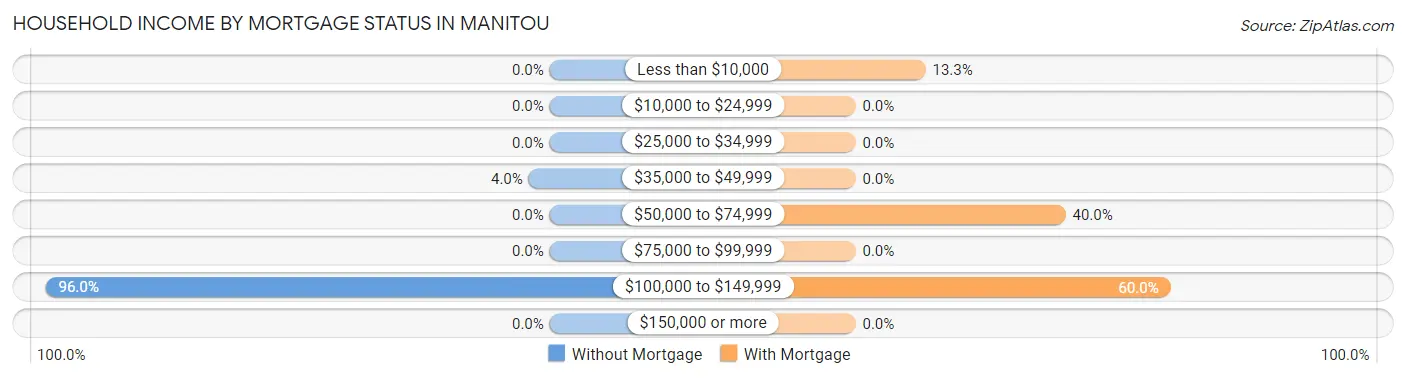
| Household Income | Without Mortgage | With Mortgage |
| Less than $10,000 | 0 (0.0%) | 2 (13.3%) |
| $10,000 to $24,999 | 0 (0.0%) | 0 (0.0%) |
| $25,000 to $34,999 | 0 (0.0%) | 0 (0.0%) |
| $35,000 to $49,999 | 1 (4.0%) | 0 (0.0%) |
| $50,000 to $74,999 | 0 (0.0%) | 6 (40.0%) |
| $75,000 to $99,999 | 0 (0.0%) | 0 (0.0%) |
| $100,000 to $149,999 | 24 (96.0%) | 9 (60.0%) |
| $150,000 or more | 0 (0.0%) | 0 (0.0%) |
| Total | 25 (100.0%) | 15 (100.0%) |
Property Value to Household Income Ratio in Manitou
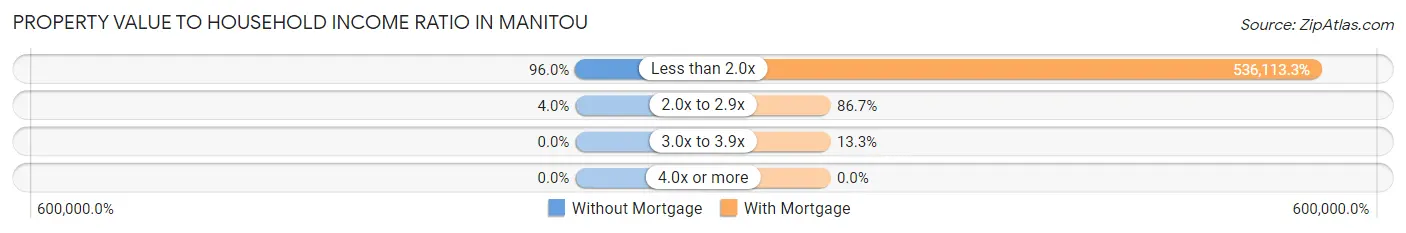
| Value-to-Income Ratio | Without Mortgage | With Mortgage |
| Less than 2.0x | 24 (96.0%) | 80,417 (536,113.3%) |
| 2.0x to 2.9x | 1 (4.0%) | 13 (86.7%) |
| 3.0x to 3.9x | 0 (0.0%) | 2 (13.3%) |
| 4.0x or more | 0 (0.0%) | 0 (0.0%) |
| Total | 25 (100.0%) | 15 (100.0%) |
Real Estate Taxes by Mortgage Status in Manitou
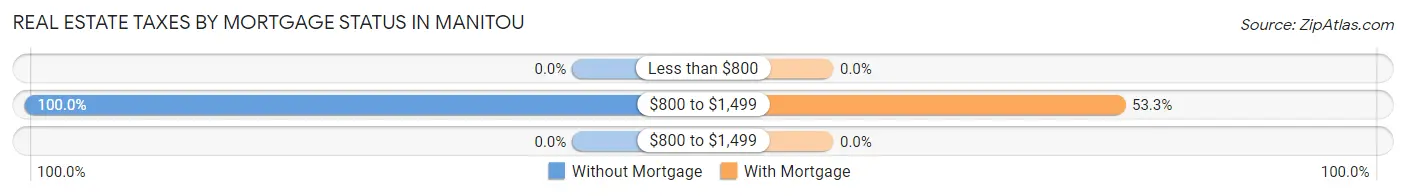
| Property Taxes | Without Mortgage | With Mortgage |
| Less than $800 | 0 (0.0%) | 0 (0.0%) |
| $800 to $1,499 | 25 (100.0%) | 8 (53.3%) |
| $800 to $1,499 | 0 (0.0%) | 0 (0.0%) |
| Total | 25 (100.0%) | 15 (100.0%) |
Health & Disability in Manitou
Health Insurance Coverage by Age in Manitou
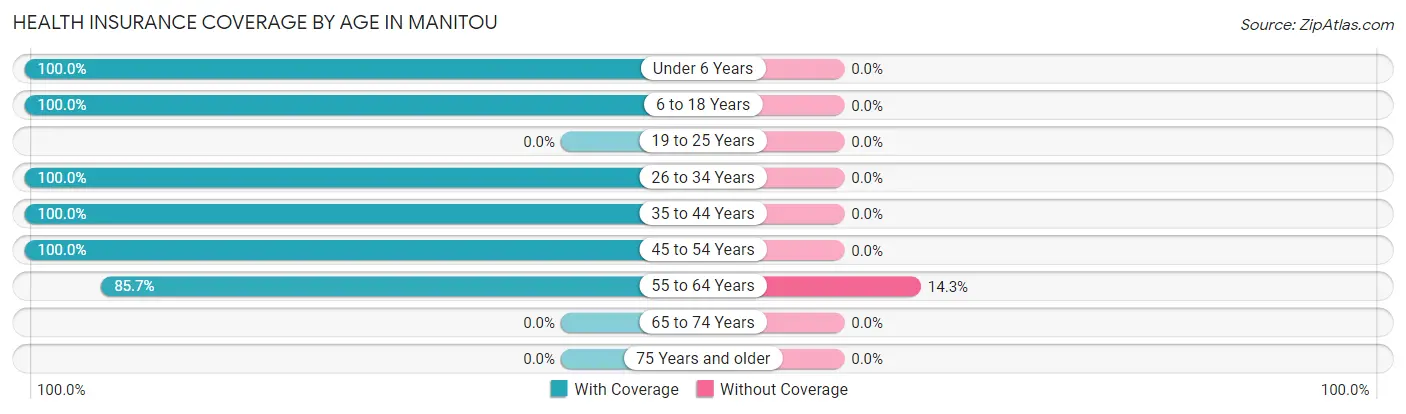
| Age Bracket | With Coverage | Without Coverage |
| Under 6 Years | 51 (100.0%) | 0 (0.0%) |
| 6 to 18 Years | 20 (100.0%) | 0 (0.0%) |
| 19 to 25 Years | 0 (0.0%) | 0 (0.0%) |
| 26 to 34 Years | 49 (100.0%) | 0 (0.0%) |
| 35 to 44 Years | 49 (100.0%) | 0 (0.0%) |
| 45 to 54 Years | 7 (100.0%) | 0 (0.0%) |
| 55 to 64 Years | 6 (85.7%) | 1 (14.3%) |
| 65 to 74 Years | 0 (0.0%) | 0 (0.0%) |
| 75 Years and older | 0 (0.0%) | 0 (0.0%) |
| Total | 182 (99.5%) | 1 (0.5%) |
Health Insurance Coverage by Citizenship Status in Manitou
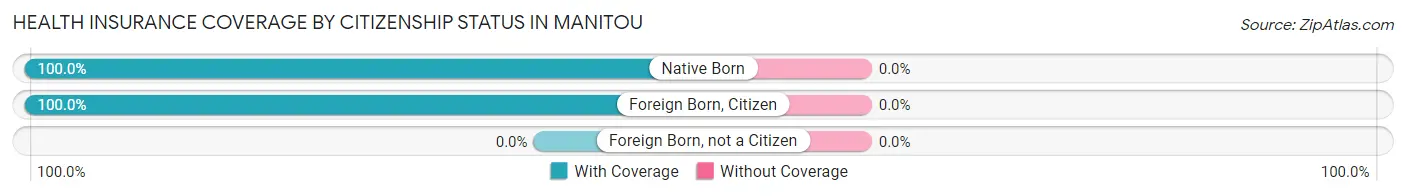
| Citizenship Status | With Coverage | Without Coverage |
| Native Born | 51 (100.0%) | 0 (0.0%) |
| Foreign Born, Citizen | 20 (100.0%) | 0 (0.0%) |
| Foreign Born, not a Citizen | 0 (0.0%) | 0 (0.0%) |
Health Insurance Coverage by Household Income in Manitou
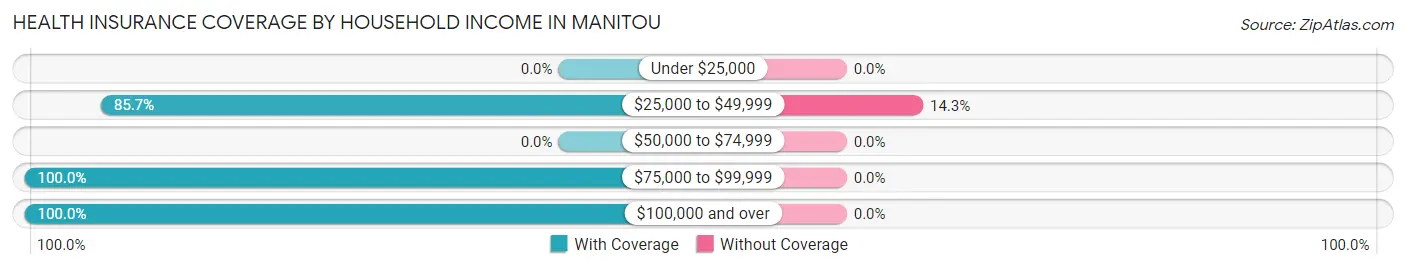
| Household Income | With Coverage | Without Coverage |
| Under $25,000 | 0 (0.0%) | 0 (0.0%) |
| $25,000 to $49,999 | 6 (85.7%) | 1 (14.3%) |
| $50,000 to $74,999 | 0 (0.0%) | 0 (0.0%) |
| $75,000 to $99,999 | 19 (100.0%) | 0 (0.0%) |
| $100,000 and over | 157 (100.0%) | 0 (0.0%) |
Public vs Private Health Insurance Coverage by Age in Manitou
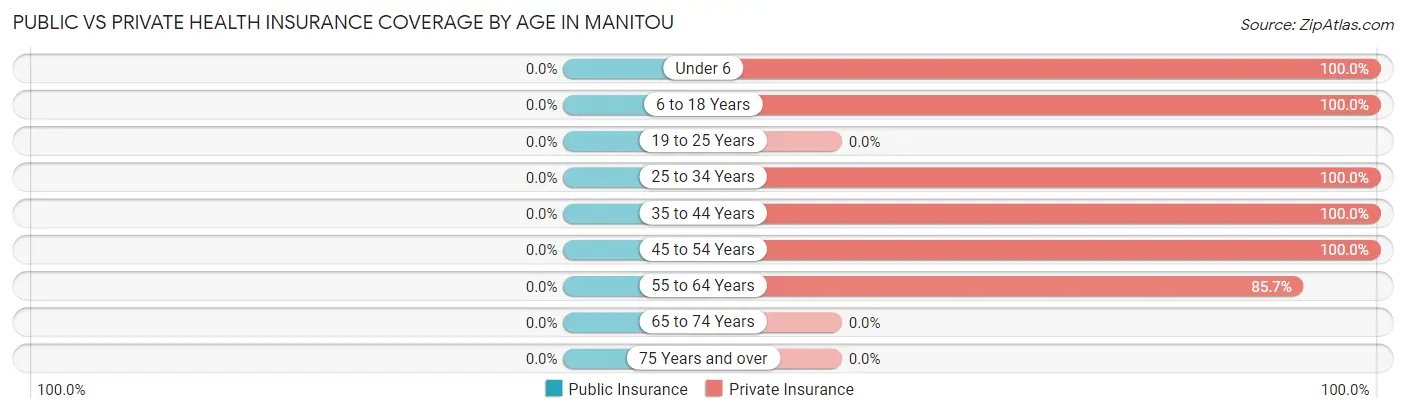
| Age Bracket | Public Insurance | Private Insurance |
| Under 6 | 0 (0.0%) | 51 (100.0%) |
| 6 to 18 Years | 0 (0.0%) | 20 (100.0%) |
| 19 to 25 Years | 0 (0.0%) | 0 (0.0%) |
| 25 to 34 Years | 0 (0.0%) | 49 (100.0%) |
| 35 to 44 Years | 0 (0.0%) | 49 (100.0%) |
| 45 to 54 Years | 0 (0.0%) | 7 (100.0%) |
| 55 to 64 Years | 0 (0.0%) | 6 (85.7%) |
| 65 to 74 Years | 0 (0.0%) | 0 (0.0%) |
| 75 Years and over | 0 (0.0%) | 0 (0.0%) |
| Total | 0 (0.0%) | 182 (99.5%) |
Disability Status by Sex by Age in Manitou
| Age Bracket | Male | Female |
| Under 5 Years | 0 (0.0%) | 0 (0.0%) |
| 5 to 17 Years | 0 (0.0%) | 0 (0.0%) |
| 18 to 34 Years | 0 (0.0%) | 0 (0.0%) |
| 35 to 64 Years | 0 (0.0%) | 0 (0.0%) |
| 65 to 74 Years | 0 (0.0%) | 0 (0.0%) |
| 75 Years and over | 0 (0.0%) | 0 (0.0%) |
Disability Class by Sex by Age in Manitou
Disability Class: Hearing Difficulty
| Age Bracket | Male | Female |
| Under 5 Years | 0 (0.0%) | 0 (0.0%) |
| 5 to 17 Years | 0 (0.0%) | 0 (0.0%) |
| 18 to 34 Years | 0 (0.0%) | 0 (0.0%) |
| 35 to 64 Years | 0 (0.0%) | 0 (0.0%) |
| 65 to 74 Years | 0 (0.0%) | 0 (0.0%) |
| 75 Years and over | 0 (0.0%) | 0 (0.0%) |
Disability Class: Vision Difficulty
| Age Bracket | Male | Female |
| Under 5 Years | 0 (0.0%) | 0 (0.0%) |
| 5 to 17 Years | 0 (0.0%) | 0 (0.0%) |
| 18 to 34 Years | 0 (0.0%) | 0 (0.0%) |
| 35 to 64 Years | 0 (0.0%) | 0 (0.0%) |
| 65 to 74 Years | 0 (0.0%) | 0 (0.0%) |
| 75 Years and over | 0 (0.0%) | 0 (0.0%) |
Disability Class: Cognitive Difficulty
| Age Bracket | Male | Female |
| 5 to 17 Years | 0 (0.0%) | 0 (0.0%) |
| 18 to 34 Years | 0 (0.0%) | 0 (0.0%) |
| 35 to 64 Years | 0 (0.0%) | 0 (0.0%) |
| 65 to 74 Years | 0 (0.0%) | 0 (0.0%) |
| 75 Years and over | 0 (0.0%) | 0 (0.0%) |
Disability Class: Ambulatory Difficulty
| Age Bracket | Male | Female |
| 5 to 17 Years | 0 (0.0%) | 0 (0.0%) |
| 18 to 34 Years | 0 (0.0%) | 0 (0.0%) |
| 35 to 64 Years | 0 (0.0%) | 0 (0.0%) |
| 65 to 74 Years | 0 (0.0%) | 0 (0.0%) |
| 75 Years and over | 0 (0.0%) | 0 (0.0%) |
Disability Class: Self-Care Difficulty
| Age Bracket | Male | Female |
| 5 to 17 Years | 0 (0.0%) | 0 (0.0%) |
| 18 to 34 Years | 0 (0.0%) | 0 (0.0%) |
| 35 to 64 Years | 0 (0.0%) | 0 (0.0%) |
| 65 to 74 Years | 0 (0.0%) | 0 (0.0%) |
| 75 Years and over | 0 (0.0%) | 0 (0.0%) |
Technology Access in Manitou
Computing Device Access in Manitou
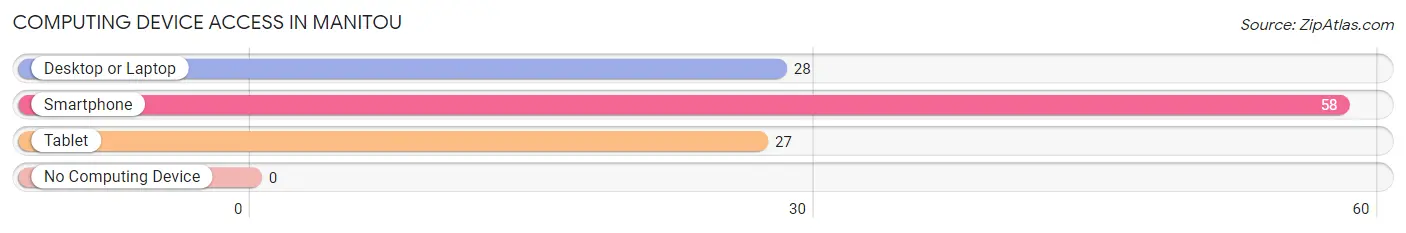
| Device Type | # Households | % Households |
| Desktop or Laptop | 28 | 48.3% |
| Smartphone | 58 | 100.0% |
| Tablet | 27 | 46.6% |
| No Computing Device | 0 | 0.0% |
| Total | 58 | 100.0% |
Internet Access in Manitou
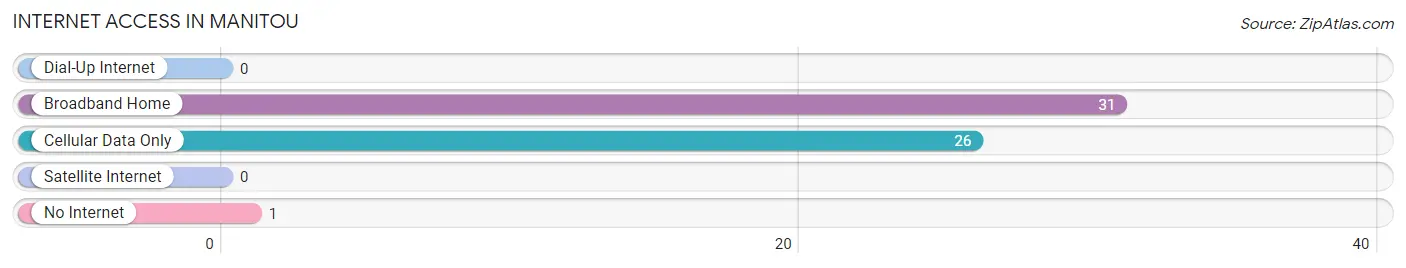
| Internet Type | # Households | % Households |
| Dial-Up Internet | 0 | 0.0% |
| Broadband Home | 31 | 53.4% |
| Cellular Data Only | 26 | 44.8% |
| Satellite Internet | 0 | 0.0% |
| No Internet | 1 | 1.7% |
| Total | 58 | 100.0% |
Manitou Summary
Manitou is a small unincorporated community located in the western part of Kentucky, in the United States. It is situated in the foothills of the Appalachian Mountains, in the county of McCreary. The population of Manitou was estimated to be around 200 people in the year 2000.
History
Manitou was first settled in the early 1800s by a group of settlers from North Carolina. The town was named after the Native American word for “spirit” or “mystery”. The town was originally a small farming community, but it soon grew to become a center for logging and coal mining. The town was also home to a number of small businesses, including a general store, a blacksmith, and a sawmill.
In the late 1800s, the town was connected to the rest of the country by the Louisville and Nashville Railroad. This allowed the town to become a popular tourist destination, as it was close to the Cumberland Gap and the Great Smoky Mountains.
Geography
Manitou is located in the western part of Kentucky, in the county of McCreary. The town is situated in the foothills of the Appalachian Mountains, and is surrounded by rolling hills and forests. The town is located near the Cumberland Gap, which is a natural passageway through the Appalachian Mountains.
The town is located at an elevation of 1,000 feet above sea level, and has a humid subtropical climate. The average temperature in the summer is around 80 degrees Fahrenheit, and the average temperature in the winter is around 40 degrees Fahrenheit.
Economy
The economy of Manitou is largely based on tourism and agriculture. The town is home to a number of small businesses, including a general store, a blacksmith, and a sawmill. The town is also home to a number of farms, which produce a variety of crops, including corn, soybeans, and tobacco.
The town is also home to a number of tourist attractions, including the Cumberland Gap National Historical Park, the Great Smoky Mountains National Park, and the Big South Fork National River and Recreation Area. These attractions draw a large number of visitors to the town each year.
Demographics
The population of Manitou was estimated to be around 200 people in the year 2000. The town is predominantly white, with a small minority population. The median household income in the town is around $30,000, and the median home value is around $90,000. The town has a low unemployment rate, and the majority of the population is employed in the tourism and agriculture industries.
Common Questions
What is Per Capita Income in Manitou?
Per Capita income in Manitou is $36,559.
What is the Median Household income in Manitou?
Median Household Income in Manitou is $103,854.
What is Income or Wage Gap in Manitou?
Income or Wage Gap in Manitou is 34.7%.
Women in Manitou earn 65.3 cents for every dollar earned by a man.
What is Inequality or Gini Index in Manitou?
Inequality or Gini Index in Manitou is 0.16.
What is the Total Population of Manitou?
Total Population of Manitou is 183.
What is the Total Male Population of Manitou?
Total Male Population of Manitou is 80.
What is the Total Female Population of Manitou?
Total Female Population of Manitou is 103.
What is the Ratio of Males per 100 Females in Manitou?
There are 77.67 Males per 100 Females in Manitou.
What is the Ratio of Females per 100 Males in Manitou?
There are 128.75 Females per 100 Males in Manitou.
What is the Median Population Age in Manitou?
Median Population Age in Manitou is 28.9 Years.
What is the Average Family Size in Manitou
Average Family Size in Manitou is 3.1 People.
What is the Average Household Size in Manitou
Average Household Size in Manitou is 3.2 People.
How Large is the Labor Force in Manitou?
There are 111 People in the Labor Forcein in Manitou.
What is the Percentage of People in the Labor Force in Manitou?
99.1% of People are in the Labor Force in Manitou.