Albany, KY Map & Demographics
Albany Map
Albany Overview
$22,092
PER CAPITA INCOME
$40,846
AVG FAMILY INCOME
$39,167
AVG HOUSEHOLD INCOME
31.8%
WAGE / INCOME GAP [ % ]
68.2¢/ $1
WAGE / INCOME GAP [ $ ]
0.46
INEQUALITY / GINI INDEX
2,264
TOTAL POPULATION
1,057
MALE POPULATION
1,207
FEMALE POPULATION
87.57
MALES / 100 FEMALES
114.19
FEMALES / 100 MALES
44.2
MEDIAN AGE
3.2
AVG FAMILY SIZE
2.4
AVG HOUSEHOLD SIZE
998
LABOR FORCE [ PEOPLE ]
52.7%
PERCENT IN LABOR FORCE
5.6%
UNEMPLOYMENT RATE
Albany Zip Codes
Albany Area Codes
Income in Albany
Income Overview in Albany
Per Capita Income in Albany is $22,092, while median incomes of families and households are $40,846 and $39,167 respectively.
| Characteristic | Number | Measure |
| Per Capita Income | 2,264 | $22,092 |
| Median Family Income | 500 | $40,846 |
| Mean Family Income | 500 | $58,090 |
| Median Household Income | 894 | $39,167 |
| Mean Household Income | 894 | $51,240 |
| Income Deficit | 500 | $0 |
| Wage / Income Gap (%) | 2,264 | 31.80% |
| Wage / Income Gap ($) | 2,264 | 68.20¢ per $1 |
| Gini / Inequality Index | 2,264 | 0.46 |
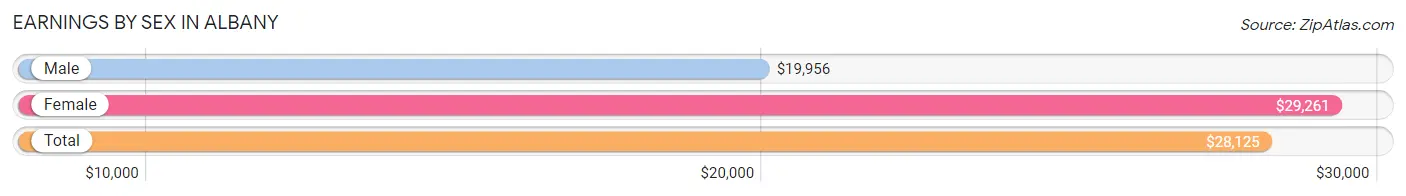
Earnings by Sex in Albany
Average Earnings in Albany are $28,125, $19,956 for men and $29,261 for women, a difference of 31.8%.
| Sex | Number | Average Earnings |
| Male | 460 (46.7%) | $19,956 |
| Female | 526 (53.3%) | $29,261 |
| Total | 986 (100.0%) | $28,125 |
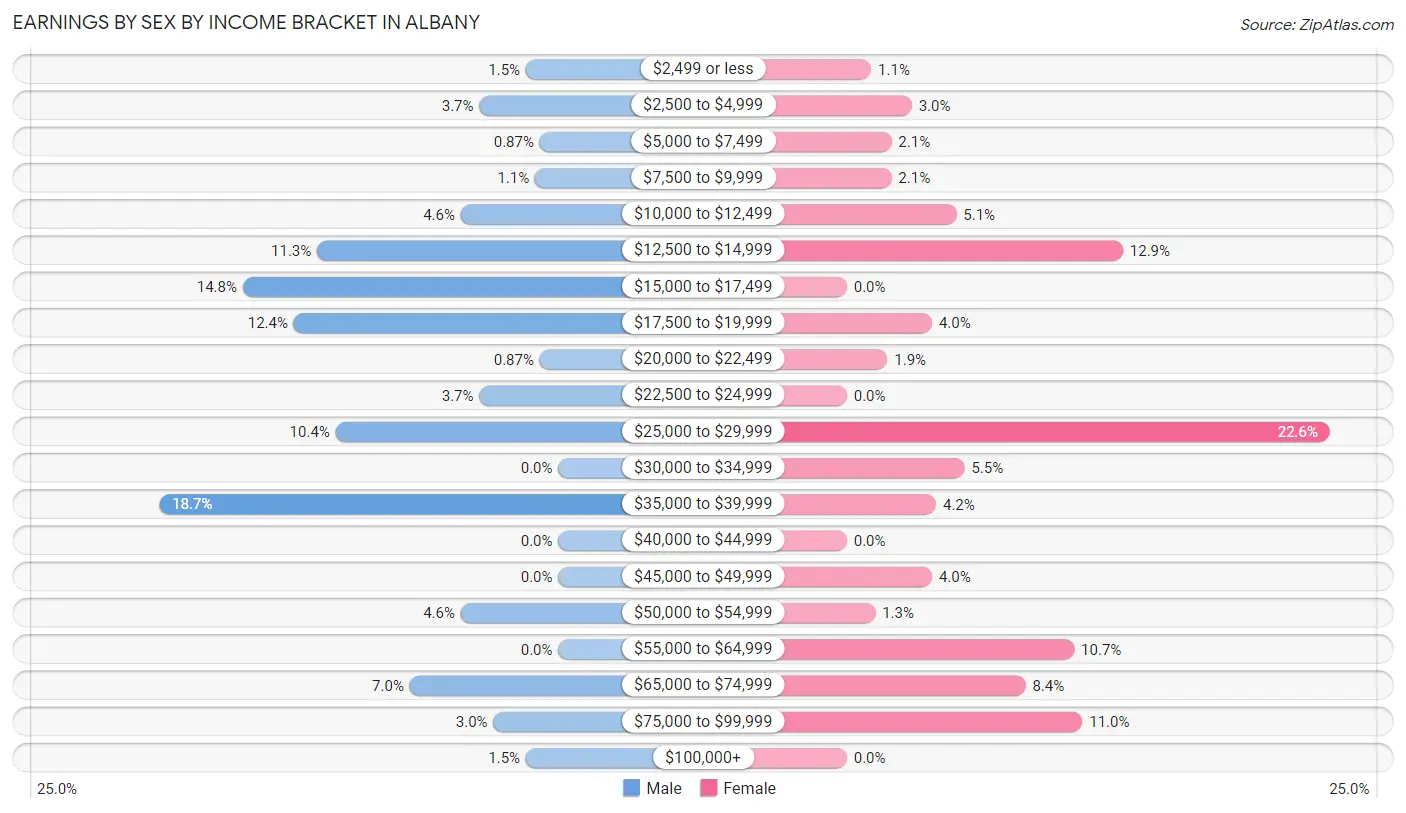
Earnings by Sex by Income Bracket in Albany
The most common earnings brackets in Albany are $35,000 to $39,999 for men (86 | 18.7%) and $25,000 to $29,999 for women (119 | 22.6%).
| Income | Male | Female |
| $2,499 or less | 7 (1.5%) | 6 (1.1%) |
| $2,500 to $4,999 | 17 (3.7%) | 16 (3.0%) |
| $5,000 to $7,499 | 4 (0.9%) | 11 (2.1%) |
| $7,500 to $9,999 | 5 (1.1%) | 11 (2.1%) |
| $10,000 to $12,499 | 21 (4.6%) | 27 (5.1%) |
| $12,500 to $14,999 | 52 (11.3%) | 68 (12.9%) |
| $15,000 to $17,499 | 68 (14.8%) | 0 (0.0%) |
| $17,500 to $19,999 | 57 (12.4%) | 21 (4.0%) |
| $20,000 to $22,499 | 4 (0.9%) | 10 (1.9%) |
| $22,500 to $24,999 | 17 (3.7%) | 0 (0.0%) |
| $25,000 to $29,999 | 48 (10.4%) | 119 (22.6%) |
| $30,000 to $34,999 | 0 (0.0%) | 29 (5.5%) |
| $35,000 to $39,999 | 86 (18.7%) | 22 (4.2%) |
| $40,000 to $44,999 | 0 (0.0%) | 0 (0.0%) |
| $45,000 to $49,999 | 0 (0.0%) | 21 (4.0%) |
| $50,000 to $54,999 | 21 (4.6%) | 7 (1.3%) |
| $55,000 to $64,999 | 0 (0.0%) | 56 (10.6%) |
| $65,000 to $74,999 | 32 (7.0%) | 44 (8.4%) |
| $75,000 to $99,999 | 14 (3.0%) | 58 (11.0%) |
| $100,000+ | 7 (1.5%) | 0 (0.0%) |
| Total | 460 (100.0%) | 526 (100.0%) |
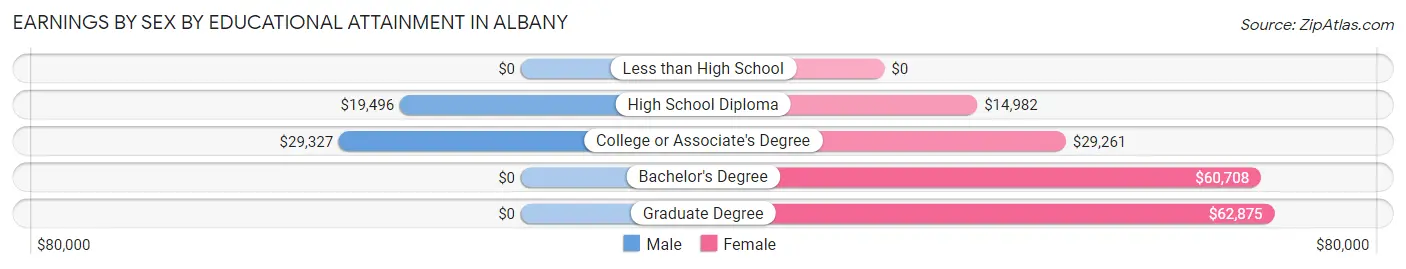
Earnings by Sex by Educational Attainment in Albany
Average earnings in Albany are $27,763 for men and $29,290 for women, a difference of 5.2%. Men with an educational attainment of college or associate's degree enjoy the highest average annual earnings of $29,327, while those with high school diploma education earn the least with $19,496. Women with an educational attainment of graduate degree earn the most with the average annual earnings of $62,875, while those with high school diploma education have the smallest earnings of $14,982.
| Educational Attainment | Male Income | Female Income |
| Less than High School | - | - |
| High School Diploma | $19,496 | $14,982 |
| College or Associate's Degree | $29,327 | $29,261 |
| Bachelor's Degree | - | - |
| Graduate Degree | - | - |
| Total | $27,763 | $29,290 |
Family Income in Albany
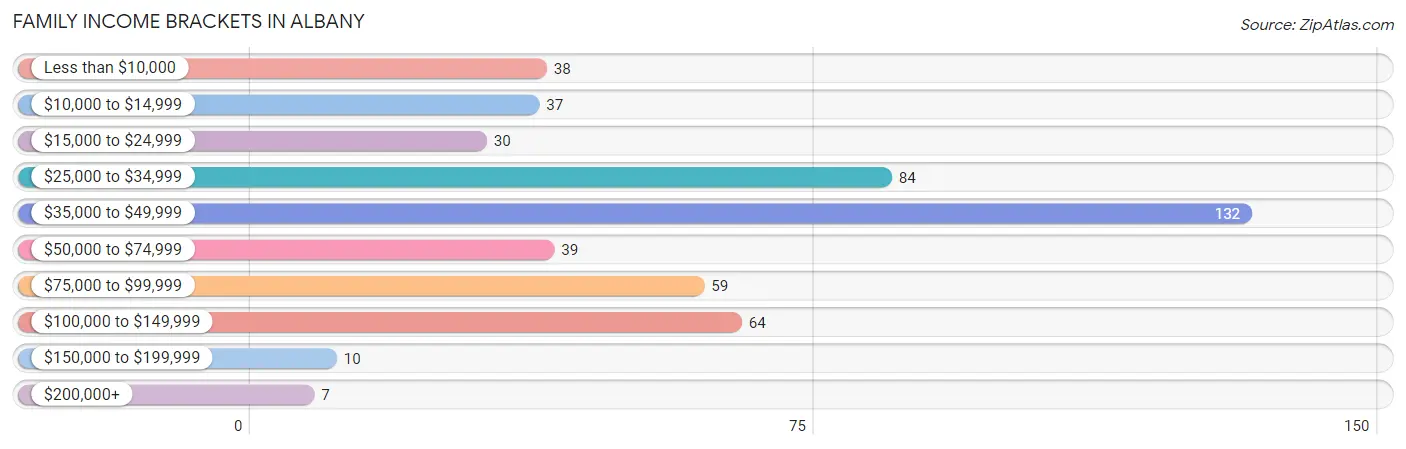
Family Income Brackets in Albany
According to the Albany family income data, there are 132 families falling into the $35,000 to $49,999 income range, which is the most common income bracket and makes up 26.4% of all families. Conversely, the $200,000+ income bracket is the least frequent group with only 7 families (1.4%) belonging to this category.
| Income Bracket | # Families | % Families |
| Less than $10,000 | 38 | 7.6% |
| $10,000 to $14,999 | 37 | 7.4% |
| $15,000 to $24,999 | 30 | 6.0% |
| $25,000 to $34,999 | 84 | 16.8% |
| $35,000 to $49,999 | 132 | 26.4% |
| $50,000 to $74,999 | 39 | 7.8% |
| $75,000 to $99,999 | 59 | 11.8% |
| $100,000 to $149,999 | 64 | 12.8% |
| $150,000 to $199,999 | 10 | 2.0% |
| $200,000+ | 7 | 1.4% |
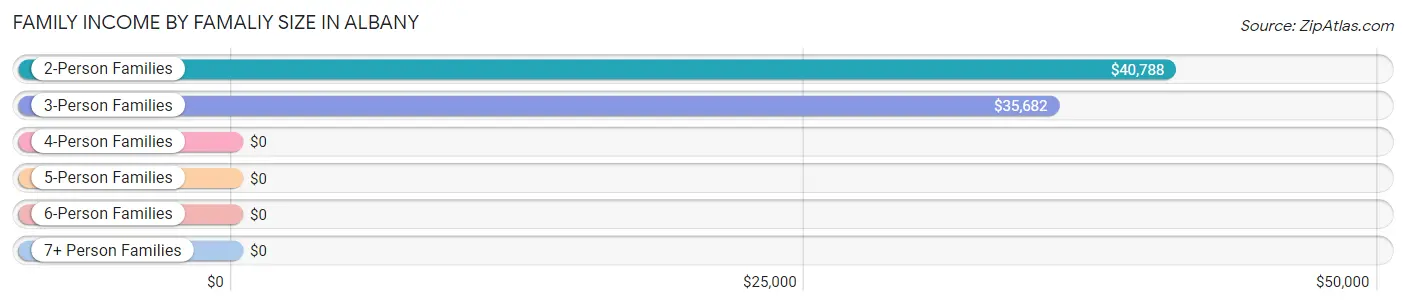
Family Income by Famaliy Size in Albany
2-person families (277 | 55.4%) account for the highest median family income in Albany with $40,788 per family, while 2-person families (277 | 55.4%) have the highest median income of $20,394 per family member.
| Income Bracket | # Families | Median Income |
| 2-Person Families | 277 (55.4%) | $40,788 |
| 3-Person Families | 98 (19.6%) | $35,682 |
| 4-Person Families | 71 (14.2%) | $0 |
| 5-Person Families | 54 (10.8%) | $0 |
| 6-Person Families | 0 (0.0%) | $0 |
| 7+ Person Families | 0 (0.0%) | $0 |
| Total | 500 (100.0%) | $40,846 |
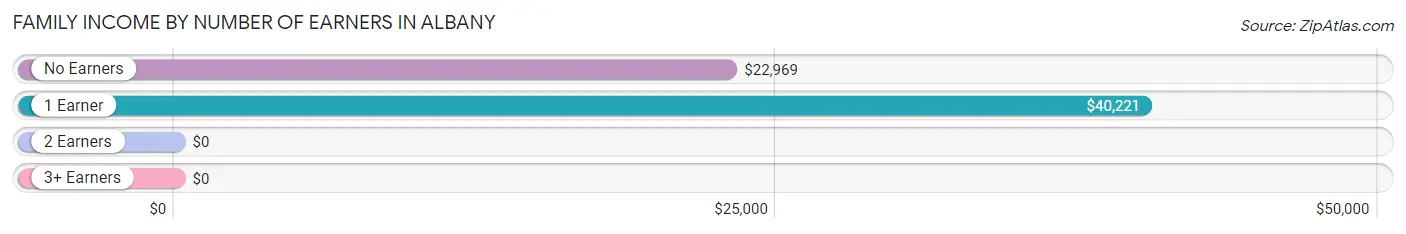
Family Income by Number of Earners in Albany
| Number of Earners | # Families | Median Income |
| No Earners | 121 (24.2%) | $22,969 |
| 1 Earner | 145 (29.0%) | $40,221 |
| 2 Earners | 215 (43.0%) | $0 |
| 3+ Earners | 19 (3.8%) | $0 |
| Total | 500 (100.0%) | $40,846 |
Household Income in Albany
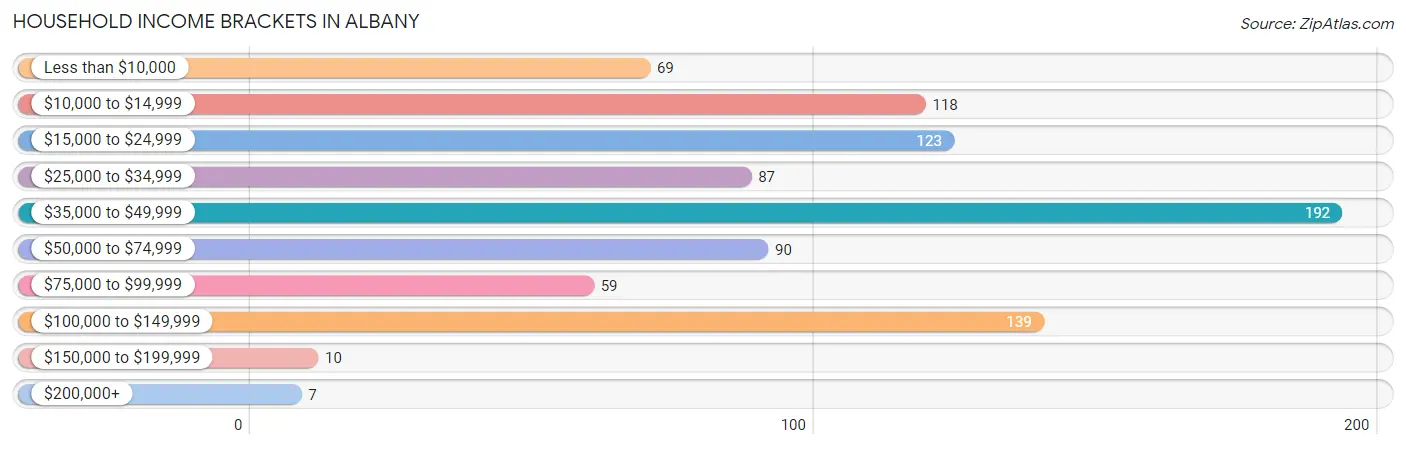
Household Income Brackets in Albany
With 192 households falling in the category, the $35,000 to $49,999 income range is the most frequent in Albany, accounting for 21.5% of all households. In contrast, only 7 households (0.8%) fall into the $200,000+ income bracket, making it the least populous group.
| Income Bracket | # Households | % Households |
| Less than $10,000 | 69 | 7.7% |
| $10,000 to $14,999 | 118 | 13.2% |
| $15,000 to $24,999 | 123 | 13.8% |
| $25,000 to $34,999 | 87 | 9.7% |
| $35,000 to $49,999 | 192 | 21.5% |
| $50,000 to $74,999 | 90 | 10.1% |
| $75,000 to $99,999 | 59 | 6.6% |
| $100,000 to $149,999 | 139 | 15.5% |
| $150,000 to $199,999 | 10 | 1.1% |
| $200,000+ | 7 | 0.8% |
Household Income by Householder Age in Albany
The median household income in Albany is $39,167, with the highest median household income of $54,167 found in the 25 to 44 years age bracket for the primary householder. A total of 202 households (22.6%) fall into this category.
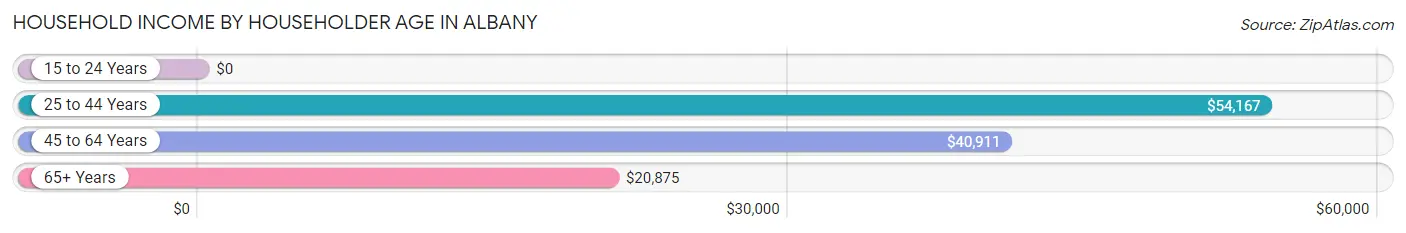
| Income Bracket | # Households | Median Income |
| 15 to 24 Years | 0 (0.0%) | $0 |
| 25 to 44 Years | 202 (22.6%) | $54,167 |
| 45 to 64 Years | 427 (47.8%) | $40,911 |
| 65+ Years | 265 (29.6%) | $20,875 |
| Total | 894 (100.0%) | $39,167 |
Poverty in Albany
Income Below Poverty by Sex and Age in Albany
With 23.8% poverty level for males and 30.5% for females among the residents of Albany, 35 to 44 year old males and 12 to 14 year old females are the most vulnerable to poverty, with 49 males (87.5%) and 27 females (100.0%) in their respective age groups living below the poverty level.
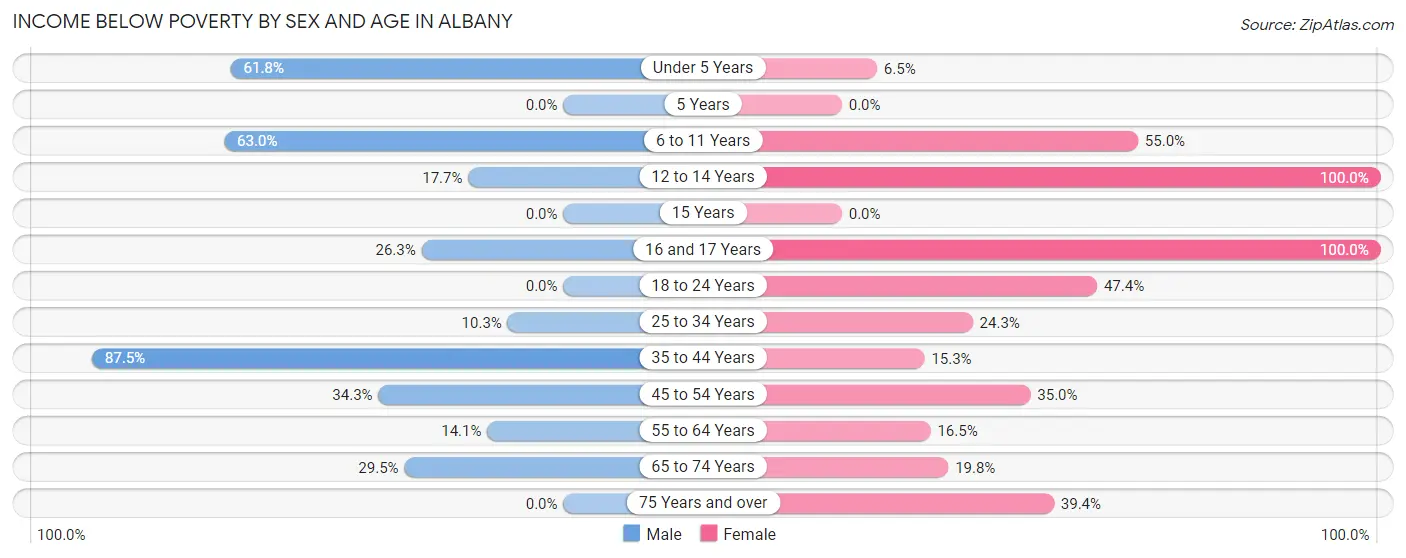
| Age Bracket | Male | Female |
| Under 5 Years | 21 (61.8%) | 3 (6.5%) |
| 5 Years | 0 (0.0%) | 0 (0.0%) |
| 6 to 11 Years | 17 (63.0%) | 72 (55.0%) |
| 12 to 14 Years | 12 (17.6%) | 27 (100.0%) |
| 15 Years | 0 (0.0%) | 0 (0.0%) |
| 16 and 17 Years | 10 (26.3%) | 15 (100.0%) |
| 18 to 24 Years | 0 (0.0%) | 18 (47.4%) |
| 25 to 34 Years | 18 (10.3%) | 34 (24.3%) |
| 35 to 44 Years | 49 (87.5%) | 25 (15.3%) |
| 45 to 54 Years | 46 (34.3%) | 63 (35.0%) |
| 55 to 64 Years | 23 (14.1%) | 26 (16.5%) |
| 65 to 74 Years | 41 (29.5%) | 31 (19.8%) |
| 75 Years and over | 0 (0.0%) | 37 (39.4%) |
| Total | 237 (23.8%) | 351 (30.5%) |
Income Above Poverty by Sex and Age in Albany
According to the poverty statistics in Albany, males aged 18 to 24 years and females aged under 5 years are the age groups that are most secure financially, with 100.0% of males and 93.5% of females in these age groups living above the poverty line.
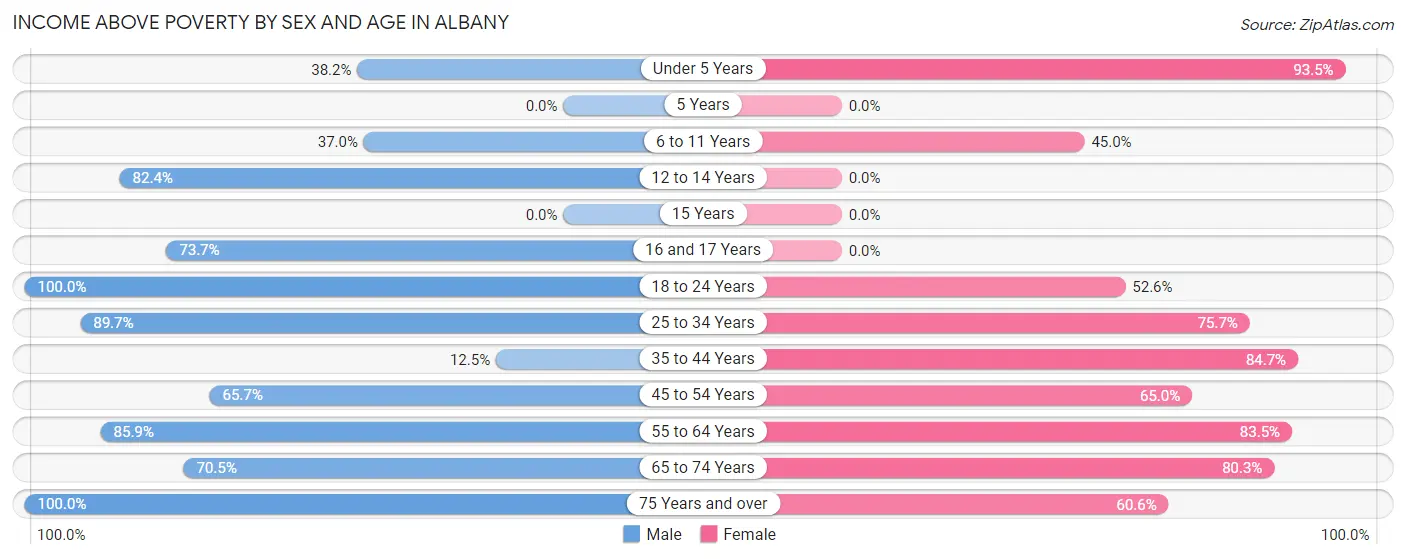
| Age Bracket | Male | Female |
| Under 5 Years | 13 (38.2%) | 43 (93.5%) |
| 5 Years | 0 (0.0%) | 0 (0.0%) |
| 6 to 11 Years | 10 (37.0%) | 59 (45.0%) |
| 12 to 14 Years | 56 (82.4%) | 0 (0.0%) |
| 15 Years | 0 (0.0%) | 0 (0.0%) |
| 16 and 17 Years | 28 (73.7%) | 0 (0.0%) |
| 18 to 24 Years | 118 (100.0%) | 20 (52.6%) |
| 25 to 34 Years | 156 (89.7%) | 106 (75.7%) |
| 35 to 44 Years | 7 (12.5%) | 138 (84.7%) |
| 45 to 54 Years | 88 (65.7%) | 117 (65.0%) |
| 55 to 64 Years | 140 (85.9%) | 132 (83.5%) |
| 65 to 74 Years | 98 (70.5%) | 126 (80.2%) |
| 75 Years and over | 44 (100.0%) | 57 (60.6%) |
| Total | 758 (76.2%) | 798 (69.5%) |
Income Below Poverty Among Married-Couple Families in Albany
The poverty statistics for married-couple families in Albany show that 1.4% or 4 of the total 281 families live below the poverty line. Families with 1 or 2 children have the highest poverty rate of 10.5%, comprising of 4 families. On the other hand, families with no children have the lowest poverty rate of 0.0%, which includes 0 families.
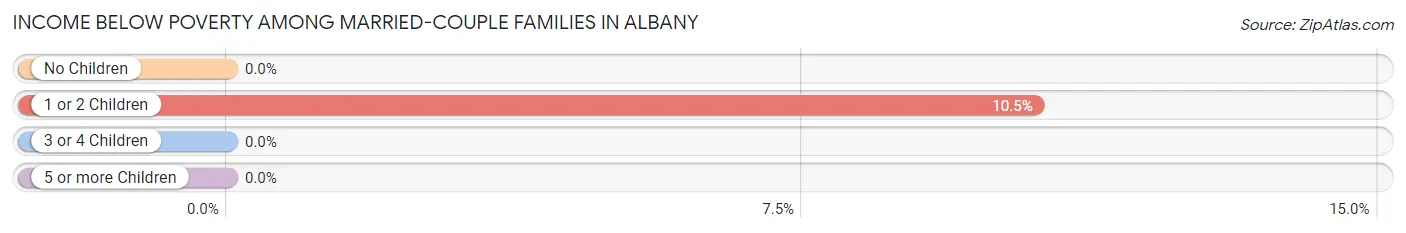
| Children | Above Poverty | Below Poverty |
| No Children | 202 (100.0%) | 0 (0.0%) |
| 1 or 2 Children | 34 (89.5%) | 4 (10.5%) |
| 3 or 4 Children | 41 (100.0%) | 0 (0.0%) |
| 5 or more Children | 0 (0.0%) | 0 (0.0%) |
| Total | 277 (98.6%) | 4 (1.4%) |
Income Below Poverty Among Single-Parent Households in Albany
According to the poverty data in Albany, 37.8% or 34 single-father households and 59.7% or 77 single-mother households are living below the poverty line. Among single-father households, those with 1 or 2 children have the highest poverty rate, with 26 households (66.7%) experiencing poverty. Likewise, among single-mother households, those with 1 or 2 children have the highest poverty rate, with 58 households (100.0%) falling below the poverty line.
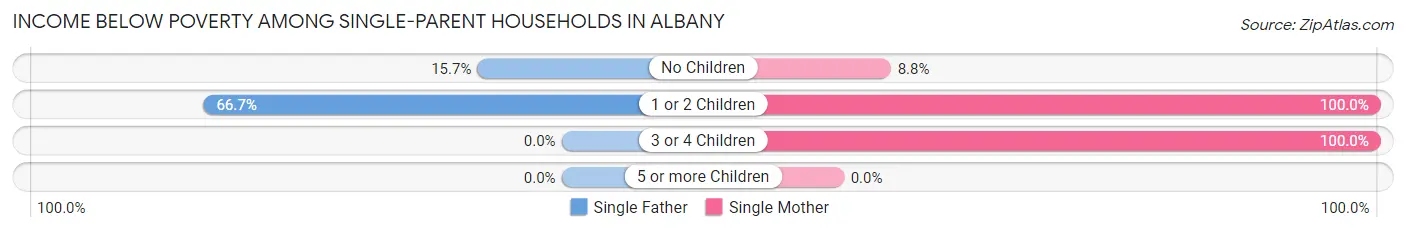
| Children | Single Father | Single Mother |
| No Children | 8 (15.7%) | 5 (8.8%) |
| 1 or 2 Children | 26 (66.7%) | 58 (100.0%) |
| 3 or 4 Children | 0 (0.0%) | 14 (100.0%) |
| 5 or more Children | 0 (0.0%) | 0 (0.0%) |
| Total | 34 (37.8%) | 77 (59.7%) |
Income Below Poverty Among Married-Couple vs Single-Parent Households in Albany
The poverty data for Albany shows that 4 of the married-couple family households (1.4%) and 111 of the single-parent households (50.7%) are living below the poverty level. Within the married-couple family households, those with 1 or 2 children have the highest poverty rate, with 4 households (10.5%) falling below the poverty line. Among the single-parent households, those with 3 or 4 children have the highest poverty rate, with 14 household (100.0%) living below poverty.
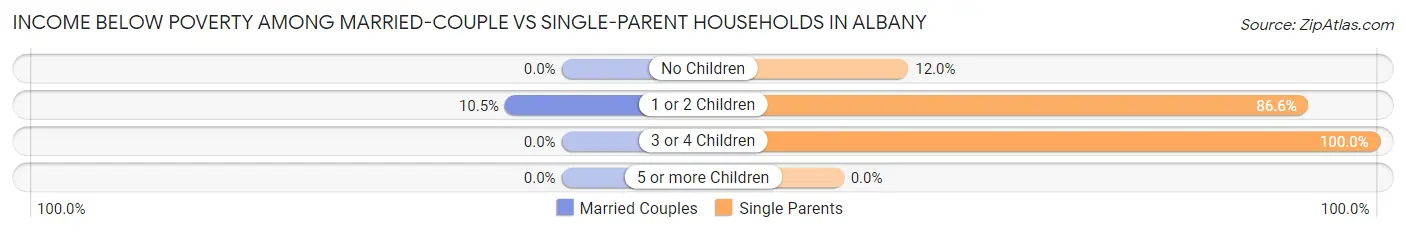
| Children | Married-Couple Families | Single-Parent Households |
| No Children | 0 (0.0%) | 13 (12.0%) |
| 1 or 2 Children | 4 (10.5%) | 84 (86.6%) |
| 3 or 4 Children | 0 (0.0%) | 14 (100.0%) |
| 5 or more Children | 0 (0.0%) | 0 (0.0%) |
| Total | 4 (1.4%) | 111 (50.7%) |
Race in Albany
The most populous races in Albany are White / Caucasian (2,095 | 92.5%), Hispanic or Latino (139 | 6.1%), and Some other Race (97 | 4.3%).
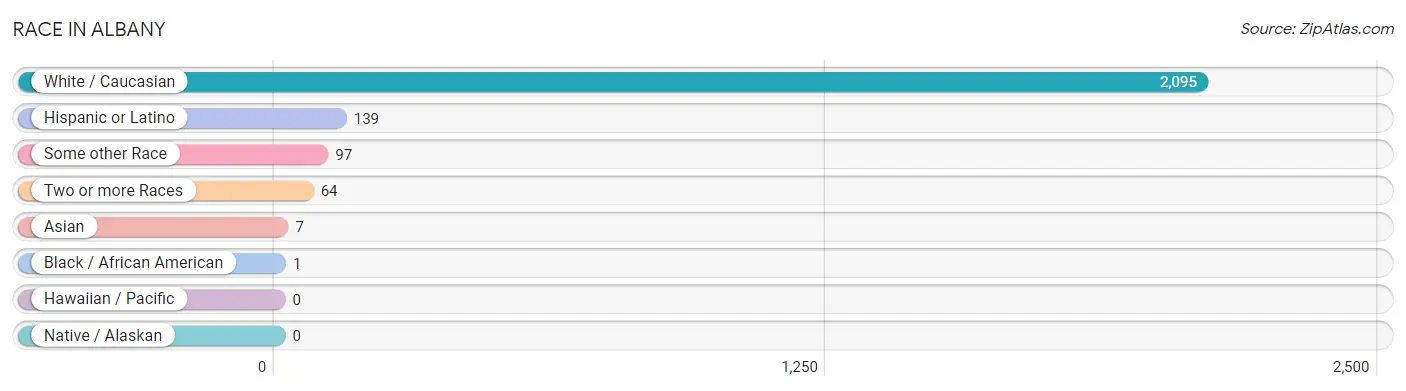
| Race | # Population | % Population |
| Asian | 7 | 0.3% |
| Black / African American | 1 | 0.0% |
| Hawaiian / Pacific | 0 | 0.0% |
| Hispanic or Latino | 139 | 6.1% |
| Native / Alaskan | 0 | 0.0% |
| White / Caucasian | 2,095 | 92.5% |
| Two or more Races | 64 | 2.8% |
| Some other Race | 97 | 4.3% |
| Total | 2,264 | 100.0% |
Ancestry in Albany
The most populous ancestries reported in Albany are English (380 | 16.8%), American (157 | 6.9%), Irish (132 | 5.8%), Cuban (94 | 4.2%), and Scotch-Irish (58 | 2.6%), together accounting for 36.2% of all Albany residents.
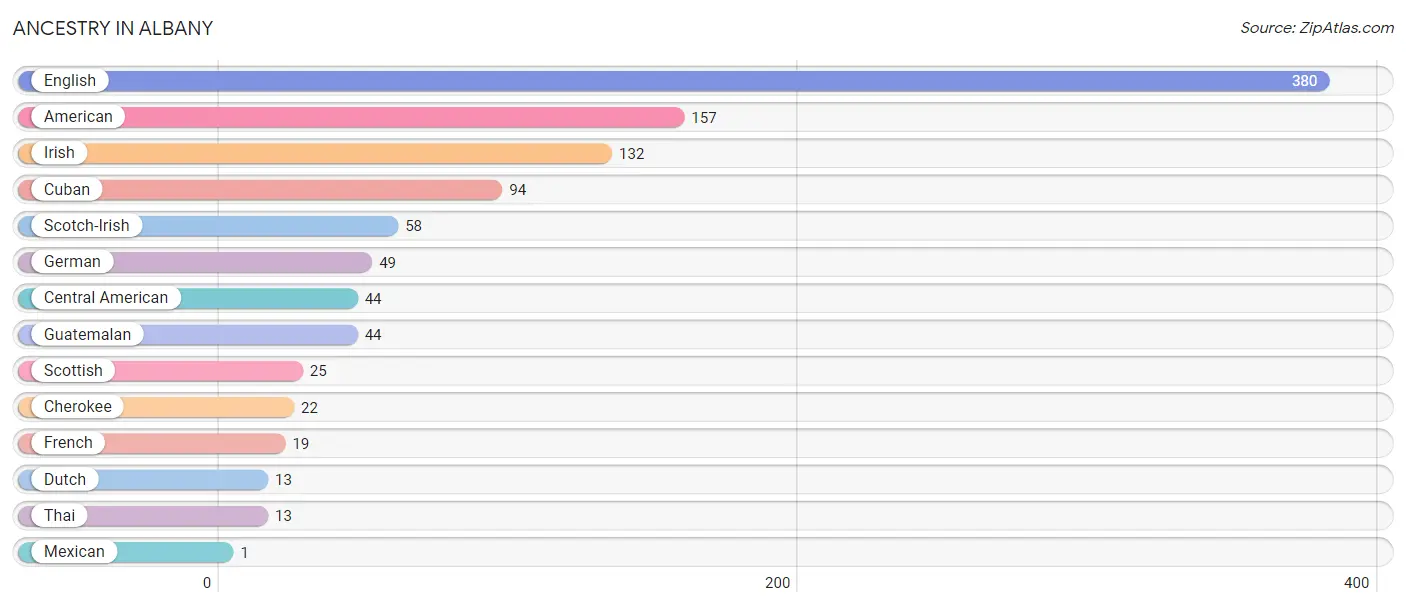
| Ancestry | # Population | % Population |
| American | 157 | 6.9% |
| Central American | 44 | 1.9% |
| Cherokee | 22 | 1.0% |
| Cuban | 94 | 4.2% |
| Dutch | 13 | 0.6% |
| English | 380 | 16.8% |
| French | 19 | 0.8% |
| German | 49 | 2.2% |
| Guatemalan | 44 | 1.9% |
| Irish | 132 | 5.8% |
| Mexican | 1 | 0.0% |
| Scotch-Irish | 58 | 2.6% |
| Scottish | 25 | 1.1% |
| Thai | 13 | 0.6% | View All 14 Rows |
Immigrants in Albany
The most numerous immigrant groups reported in Albany came from Latin America (95 | 4.2%), Caribbean (94 | 4.2%), Cuba (94 | 4.2%), Oceania (7 | 0.3%), and Central America (1 | 0.0%), together accounting for 12.9% of all Albany residents.
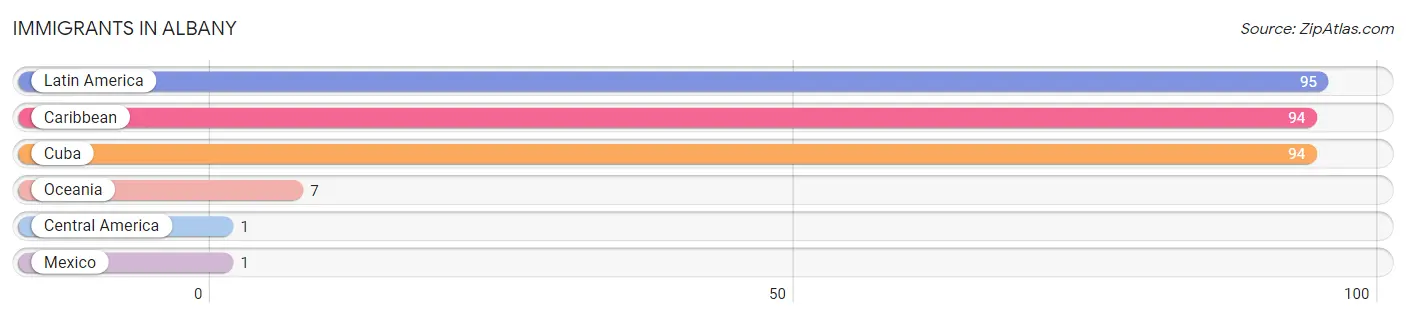
| Immigration Origin | # Population | % Population |
| Caribbean | 94 | 4.2% |
| Central America | 1 | 0.0% |
| Cuba | 94 | 4.2% |
| Latin America | 95 | 4.2% |
| Mexico | 1 | 0.0% |
| Oceania | 7 | 0.3% | View All 6 Rows |
Sex and Age in Albany
Sex and Age in Albany
The most populous age groups in Albany are 30 to 34 Years (124 | 11.7%) for men and 10 to 14 Years (143 | 11.8%) for women.
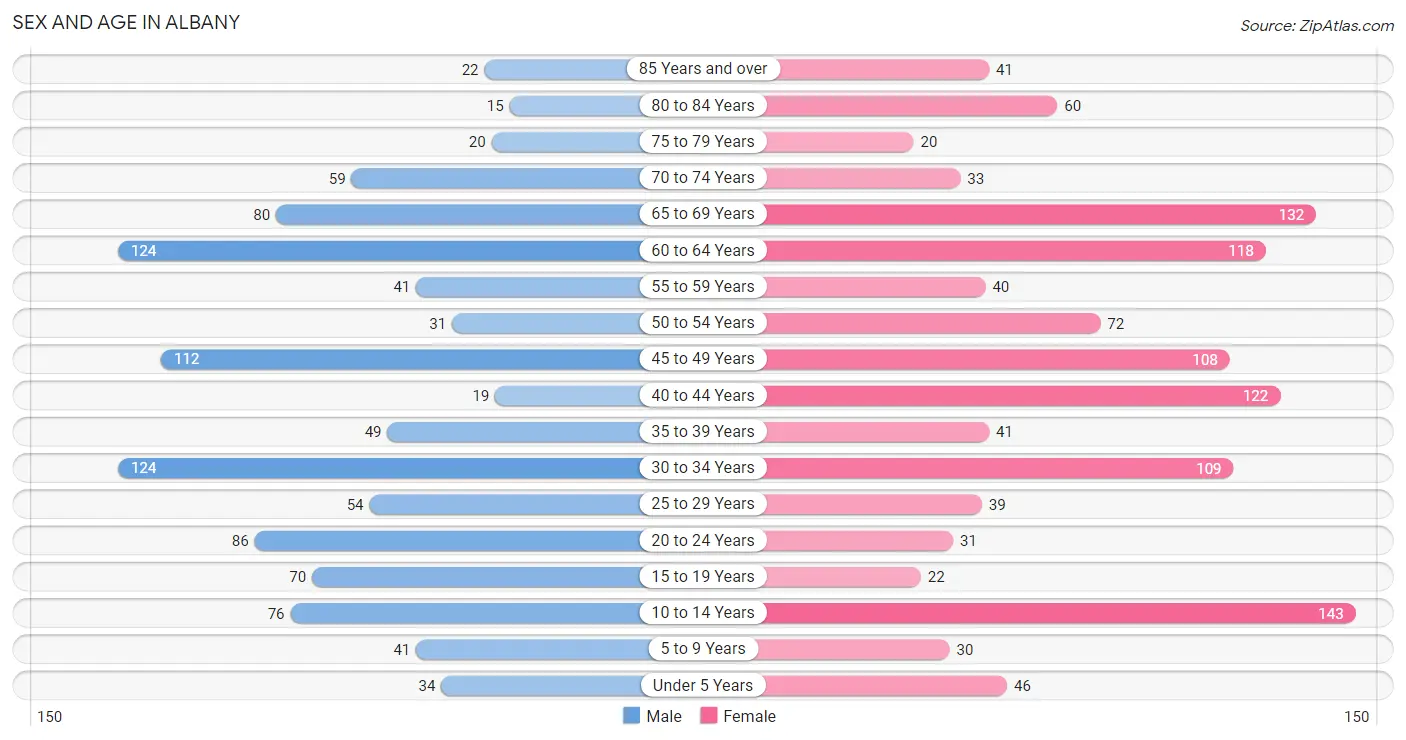
| Age Bracket | Male | Female |
| Under 5 Years | 34 (3.2%) | 46 (3.8%) |
| 5 to 9 Years | 41 (3.9%) | 30 (2.5%) |
| 10 to 14 Years | 76 (7.2%) | 143 (11.8%) |
| 15 to 19 Years | 70 (6.6%) | 22 (1.8%) |
| 20 to 24 Years | 86 (8.1%) | 31 (2.6%) |
| 25 to 29 Years | 54 (5.1%) | 39 (3.2%) |
| 30 to 34 Years | 124 (11.7%) | 109 (9.0%) |
| 35 to 39 Years | 49 (4.6%) | 41 (3.4%) |
| 40 to 44 Years | 19 (1.8%) | 122 (10.1%) |
| 45 to 49 Years | 112 (10.6%) | 108 (8.9%) |
| 50 to 54 Years | 31 (2.9%) | 72 (6.0%) |
| 55 to 59 Years | 41 (3.9%) | 40 (3.3%) |
| 60 to 64 Years | 124 (11.7%) | 118 (9.8%) |
| 65 to 69 Years | 80 (7.6%) | 132 (10.9%) |
| 70 to 74 Years | 59 (5.6%) | 33 (2.7%) |
| 75 to 79 Years | 20 (1.9%) | 20 (1.7%) |
| 80 to 84 Years | 15 (1.4%) | 60 (5.0%) |
| 85 Years and over | 22 (2.1%) | 41 (3.4%) |
| Total | 1,057 (100.0%) | 1,207 (100.0%) |
Families and Households in Albany
Median Family Size in Albany
The median family size in Albany is 3.18 persons per family, with single female/mother families (129 | 25.8%) accounting for the largest median family size of 3.72 persons per family. On the other hand, single male/father families (90 | 18.0%) represent the smallest median family size with 2.54 persons per family.
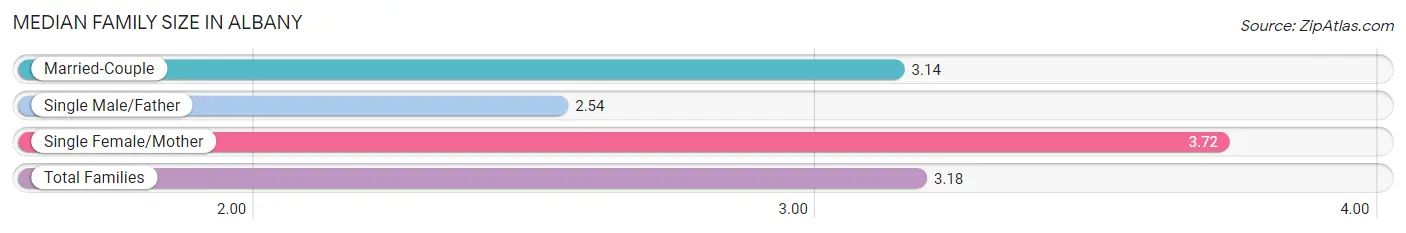
| Family Type | # Families | Family Size |
| Married-Couple | 281 (56.2%) | 3.14 |
| Single Male/Father | 90 (18.0%) | 2.54 |
| Single Female/Mother | 129 (25.8%) | 3.72 |
| Total Families | 500 (100.0%) | 3.18 |
Median Household Size in Albany
The median household size in Albany is 2.44 persons per household, with single female/mother households (129 | 14.4%) accounting for the largest median household size of 4.2 persons per household. non-family households (394 | 44.1%) represent the smallest median household size with 1.14 persons per household.
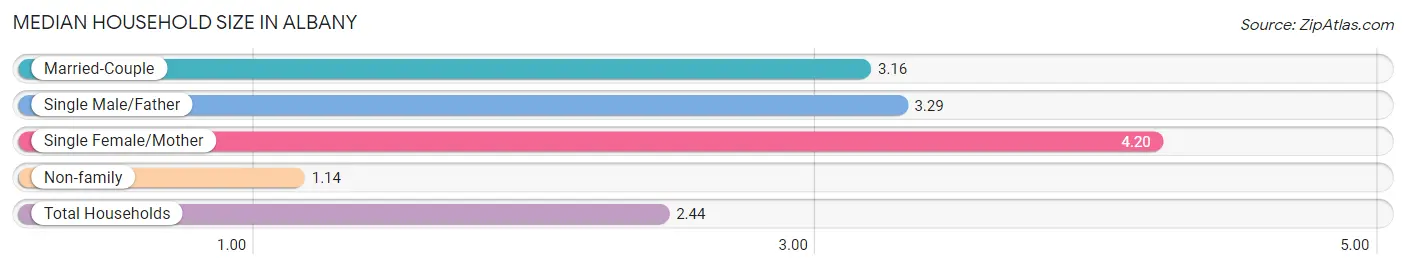
| Household Type | # Households | Household Size |
| Married-Couple | 281 (31.4%) | 3.16 |
| Single Male/Father | 90 (10.1%) | 3.29 |
| Single Female/Mother | 129 (14.4%) | 4.20 |
| Non-family | 394 (44.1%) | 1.14 |
| Total Households | 894 (100.0%) | 2.44 |
Household Size by Marriage Status in Albany
Out of a total of 894 households in Albany, 500 (55.9%) are family households, while 394 (44.1%) are nonfamily households. The most numerous type of family households are 2-person households, comprising 217, and the most common type of nonfamily households are 1-person households, comprising 334.
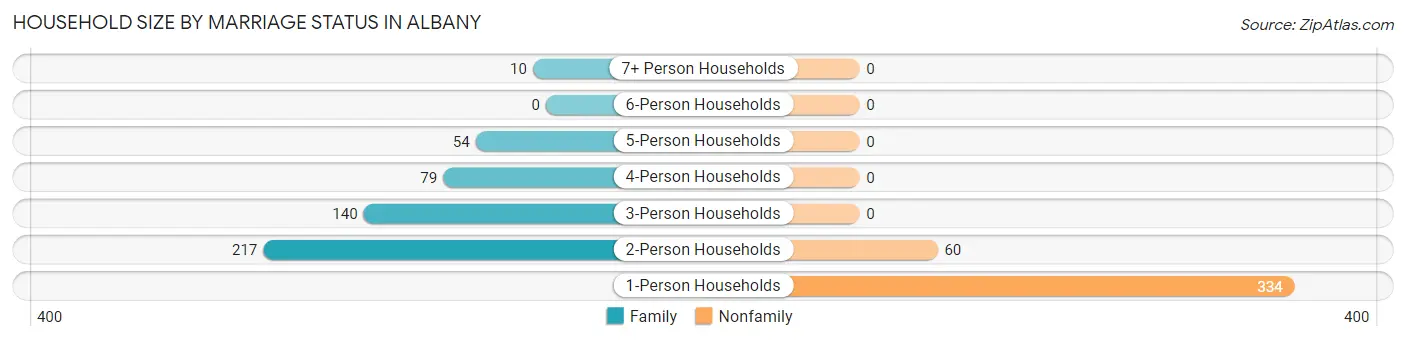
| Household Size | Family Households | Nonfamily Households |
| 1-Person Households | - | 334 (37.4%) |
| 2-Person Households | 217 (24.3%) | 60 (6.7%) |
| 3-Person Households | 140 (15.7%) | 0 (0.0%) |
| 4-Person Households | 79 (8.8%) | 0 (0.0%) |
| 5-Person Households | 54 (6.0%) | 0 (0.0%) |
| 6-Person Households | 0 (0.0%) | 0 (0.0%) |
| 7+ Person Households | 10 (1.1%) | 0 (0.0%) |
| Total | 500 (55.9%) | 394 (44.1%) |
Female Fertility in Albany
Fertility by Age in Albany
Average fertility rate in Albany is 12.0 births per 1,000 women. Women in the age bracket of 20 to 34 years have the highest fertility rate with 34.0 births per 1,000 women. Women in the age bracket of 20 to 34 years acount for 100.0% of all women with births.
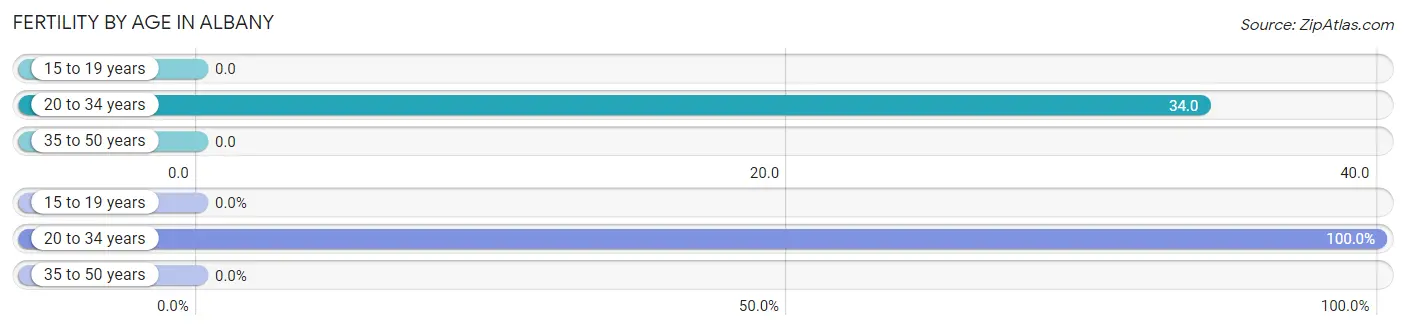
| Age Bracket | Women with Births | Births / 1,000 Women |
| 15 to 19 years | 0 (0.0%) | 0.0 |
| 20 to 34 years | 6 (100.0%) | 34.0 |
| 35 to 50 years | 0 (0.0%) | 0.0 |
| Total | 6 (100.0%) | 12.0 |
Fertility by Age by Marriage Status in Albany
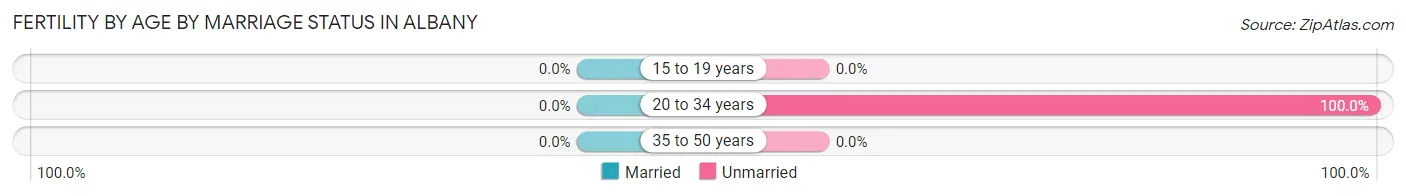
| Age Bracket | Married | Unmarried |
| 15 to 19 years | 0 (0.0%) | 0 (0.0%) |
| 20 to 34 years | 0 (0.0%) | 6 (100.0%) |
| 35 to 50 years | 0 (0.0%) | 0 (0.0%) |
| Total | 0 (0.0%) | 6 (100.0%) |
Fertility by Education in Albany
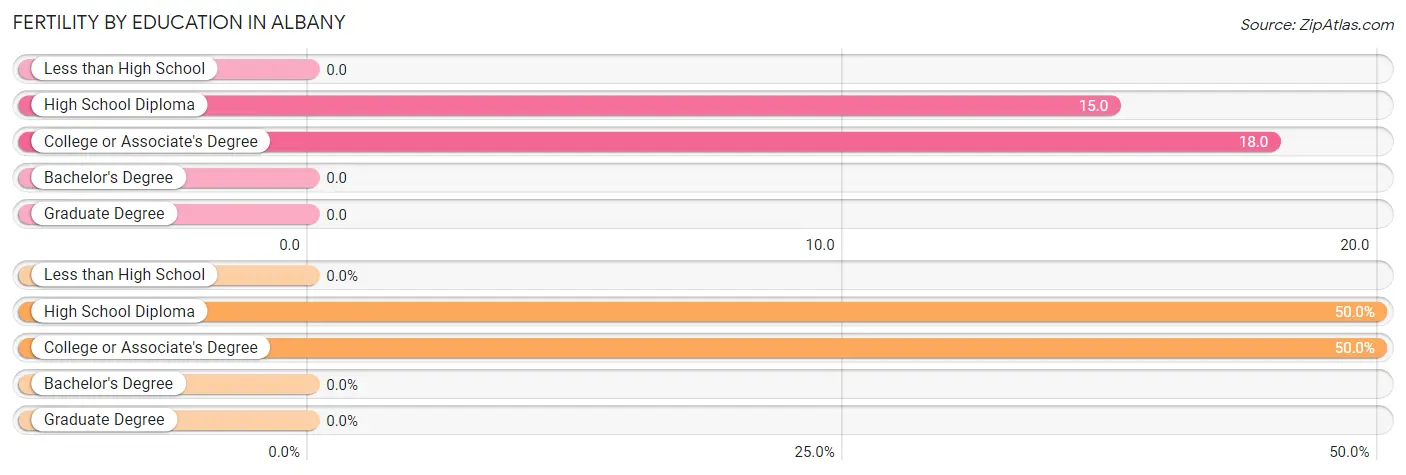
| Educational Attainment | Women with Births | Births / 1,000 Women |
| Less than High School | 0 (0.0%) | 0.0 |
| High School Diploma | 3 (50.0%) | 15.0 |
| College or Associate's Degree | 3 (50.0%) | 18.0 |
| Bachelor's Degree | 0 (0.0%) | 0.0 |
| Graduate Degree | 0 (0.0%) | 0.0 |
| Total | 6 (100.0%) | 12.0 |
Fertility by Education by Marriage Status in Albany
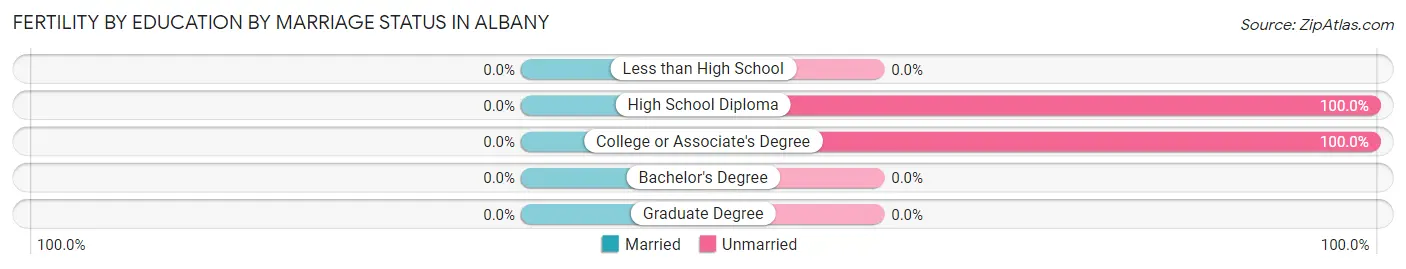
| Educational Attainment | Married | Unmarried |
| Less than High School | 0 (0.0%) | 0 (0.0%) |
| High School Diploma | 0 (0.0%) | 3 (100.0%) |
| College or Associate's Degree | 0 (0.0%) | 3 (100.0%) |
| Bachelor's Degree | 0 (0.0%) | 0 (0.0%) |
| Graduate Degree | 0 (0.0%) | 0 (0.0%) |
| Total | 0 (0.0%) | 6 (100.0%) |
Employment Characteristics in Albany
Employment by Class of Employer in Albany
Among the 928 employed individuals in Albany, private company employees (656 | 70.7%), self-employed (not incorporated) (95 | 10.2%), and state government employees (66 | 7.1%) make up the most common classes of employment.
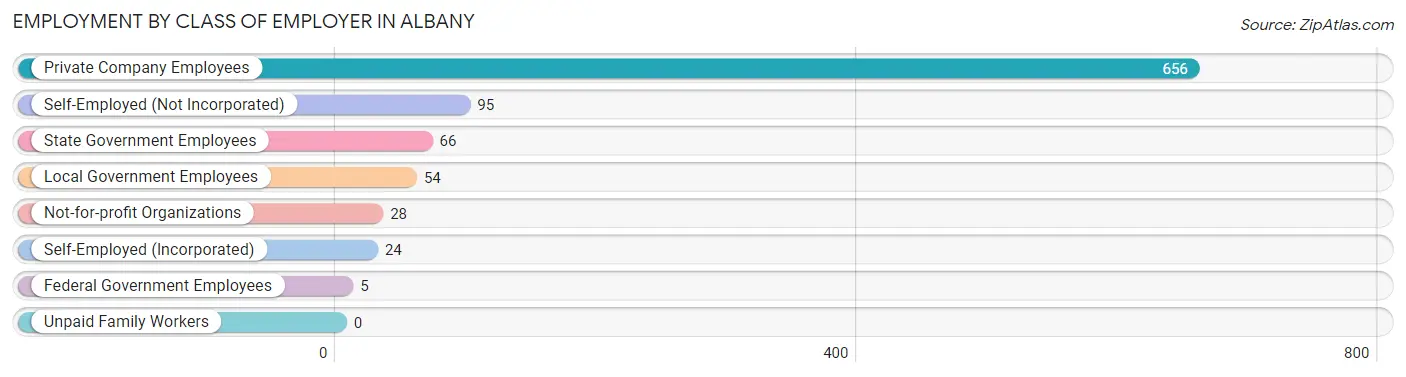
| Employer Class | # Employees | % Employees |
| Private Company Employees | 656 | 70.7% |
| Self-Employed (Incorporated) | 24 | 2.6% |
| Self-Employed (Not Incorporated) | 95 | 10.2% |
| Not-for-profit Organizations | 28 | 3.0% |
| Local Government Employees | 54 | 5.8% |
| State Government Employees | 66 | 7.1% |
| Federal Government Employees | 5 | 0.5% |
| Unpaid Family Workers | 0 | 0.0% |
| Total | 928 | 100.0% |
Employment Status by Age in Albany
According to the labor force statistics for Albany, out of the total population over 16 years of age (1,894), 52.7% or 998 individuals are in the labor force, with 5.6% or 56 of them unemployed. The age group with the highest labor force participation rate is 30 to 34 years, with 87.6% or 204 individuals in the labor force. Within the labor force, the 20 to 24 years age range has the highest percentage of unemployed individuals, with 55.2% or 37 of them being unemployed.
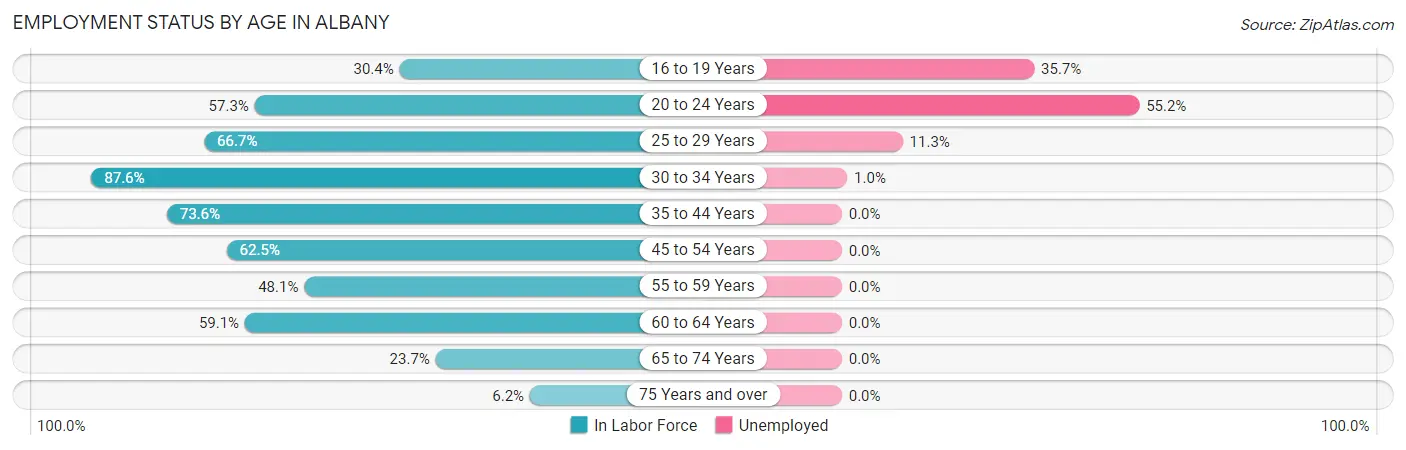
| Age Bracket | In Labor Force | Unemployed |
| 16 to 19 Years | 28 (30.4%) | 10 (35.7%) |
| 20 to 24 Years | 67 (57.3%) | 37 (55.2%) |
| 25 to 29 Years | 62 (66.7%) | 7 (11.3%) |
| 30 to 34 Years | 204 (87.6%) | 2 (1.0%) |
| 35 to 44 Years | 170 (73.6%) | 0 (0.0%) |
| 45 to 54 Years | 202 (62.5%) | 0 (0.0%) |
| 55 to 59 Years | 39 (48.1%) | 0 (0.0%) |
| 60 to 64 Years | 143 (59.1%) | 0 (0.0%) |
| 65 to 74 Years | 72 (23.7%) | 0 (0.0%) |
| 75 Years and over | 11 (6.2%) | 0 (0.0%) |
| Total | 998 (52.7%) | 56 (5.6%) |
Employment Status by Educational Attainment in Albany
According to labor force statistics for Albany, 68.2% of individuals (820) out of the total population between 25 and 64 years of age (1,203) are in the labor force, with 1.1% or 9 of them being unemployed. The group with the highest labor force participation rate are those with the educational attainment of bachelor's degree or higher, with 98.9% or 182 individuals in the labor force. Within the labor force, individuals with high school diploma education have the highest percentage of unemployment, with 2.6% or 9 of them being unemployed.
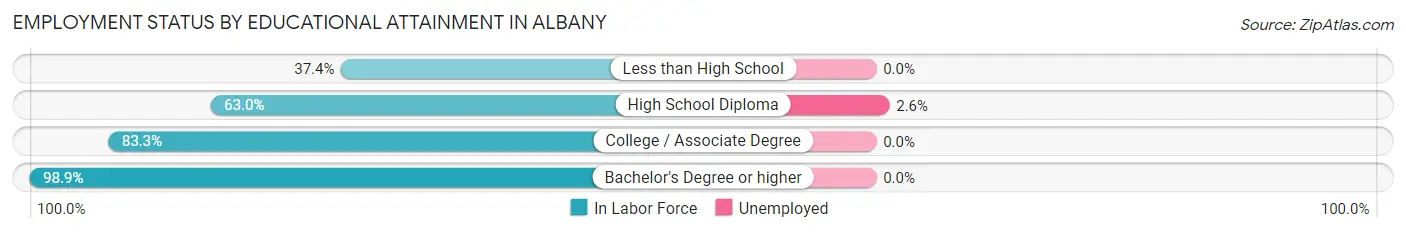
| Educational Attainment | In Labor Force | Unemployed |
| Less than High School | 82 (37.4%) | 0 (0.0%) |
| High School Diploma | 342 (63.0%) | 14 (2.6%) |
| College / Associate Degree | 214 (83.3%) | 0 (0.0%) |
| Bachelor's Degree or higher | 182 (98.9%) | 0 (0.0%) |
| Total | 820 (68.2%) | 13 (1.1%) |
Employment Occupations by Sex in Albany
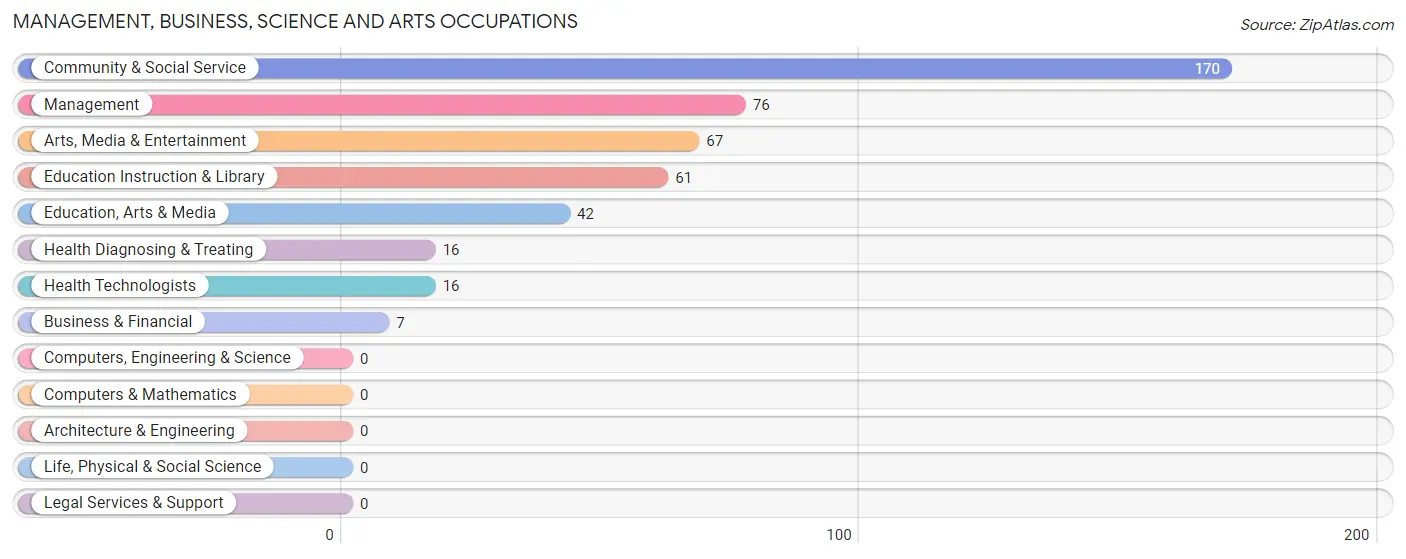
Management, Business, Science and Arts Occupations
The most common Management, Business, Science and Arts occupations in Albany are Community & Social Service (170 | 18.0%), Management (76 | 8.1%), Arts, Media & Entertainment (67 | 7.1%), Education Instruction & Library (61 | 6.5%), and Education, Arts & Media (42 | 4.5%).
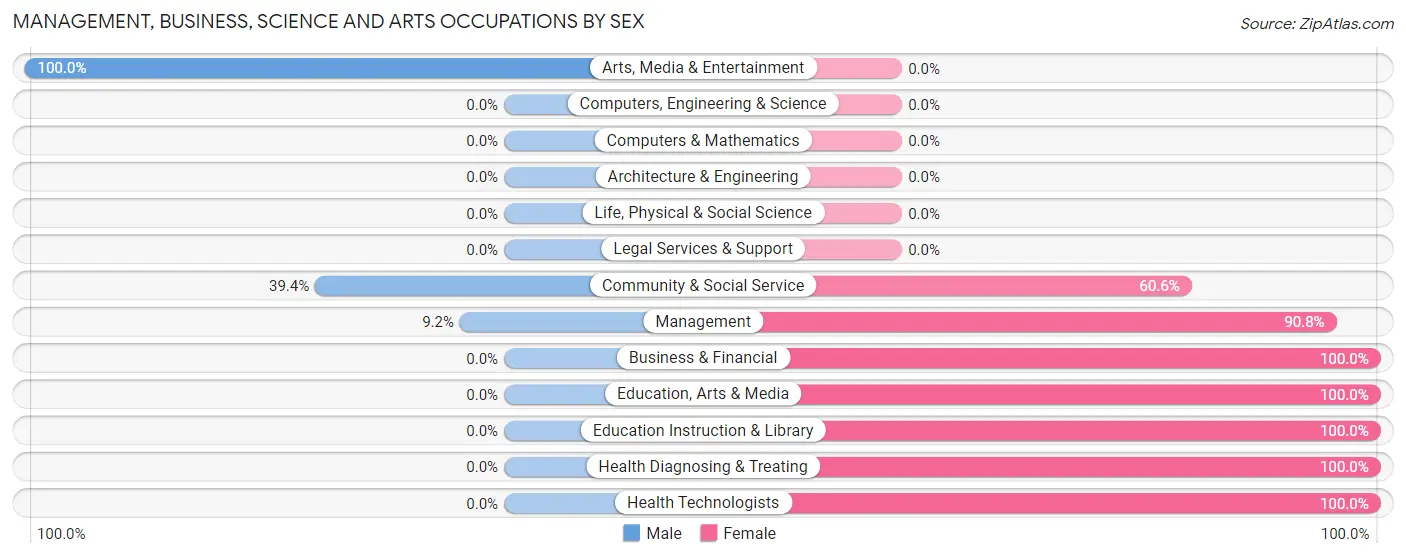
Management, Business, Science and Arts Occupations by Sex
Within the Management, Business, Science and Arts occupations in Albany, the most male-oriented occupations are Arts, Media & Entertainment (100.0%), Community & Social Service (39.4%), and Management (9.2%), while the most female-oriented occupations are Business & Financial (100.0%), Education, Arts & Media (100.0%), and Education Instruction & Library (100.0%).
| Occupation | Male | Female |
| Management | 7 (9.2%) | 69 (90.8%) |
| Business & Financial | 0 (0.0%) | 7 (100.0%) |
| Computers, Engineering & Science | 0 (0.0%) | 0 (0.0%) |
| Computers & Mathematics | 0 (0.0%) | 0 (0.0%) |
| Architecture & Engineering | 0 (0.0%) | 0 (0.0%) |
| Life, Physical & Social Science | 0 (0.0%) | 0 (0.0%) |
| Community & Social Service | 67 (39.4%) | 103 (60.6%) |
| Education, Arts & Media | 0 (0.0%) | 42 (100.0%) |
| Legal Services & Support | 0 (0.0%) | 0 (0.0%) |
| Education Instruction & Library | 0 (0.0%) | 61 (100.0%) |
| Arts, Media & Entertainment | 67 (100.0%) | 0 (0.0%) |
| Health Diagnosing & Treating | 0 (0.0%) | 16 (100.0%) |
| Health Technologists | 0 (0.0%) | 16 (100.0%) |
| Total (Category) | 74 (27.5%) | 195 (72.5%) |
| Total (Overall) | 425 (45.1%) | 517 (54.9%) |
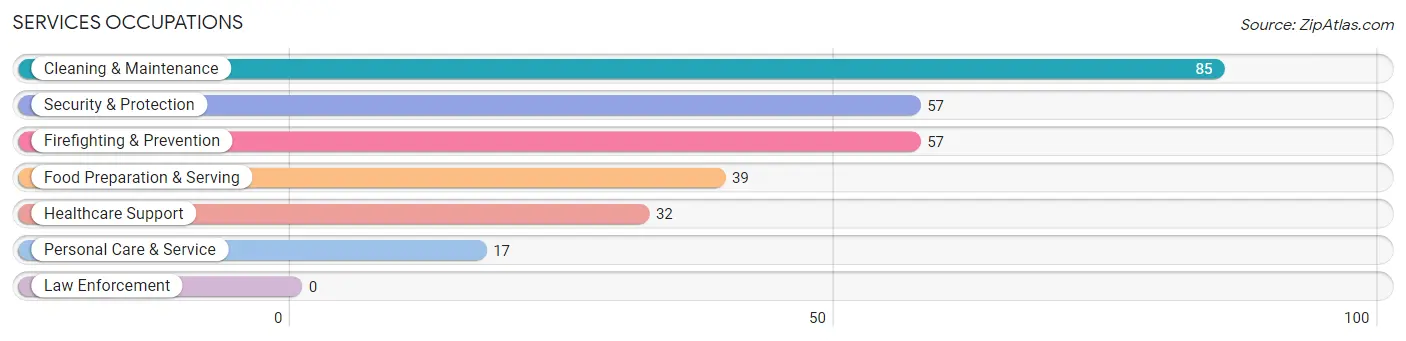
Services Occupations
The most common Services occupations in Albany are Cleaning & Maintenance (85 | 9.0%), Security & Protection (57 | 6.0%), Firefighting & Prevention (57 | 6.0%), Food Preparation & Serving (39 | 4.1%), and Healthcare Support (32 | 3.4%).
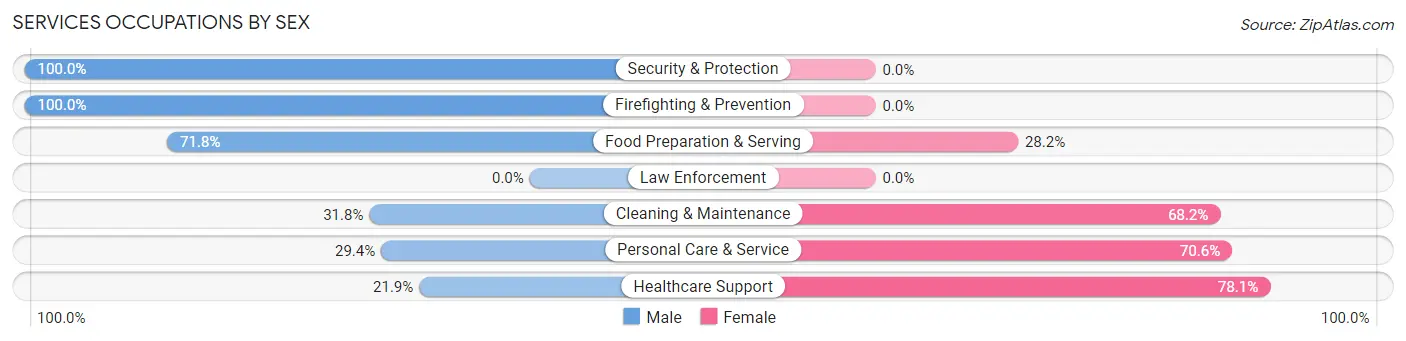
Services Occupations by Sex
Within the Services occupations in Albany, the most male-oriented occupations are Security & Protection (100.0%), Firefighting & Prevention (100.0%), and Food Preparation & Serving (71.8%), while the most female-oriented occupations are Healthcare Support (78.1%), Personal Care & Service (70.6%), and Cleaning & Maintenance (68.2%).
| Occupation | Male | Female |
| Healthcare Support | 7 (21.9%) | 25 (78.1%) |
| Security & Protection | 57 (100.0%) | 0 (0.0%) |
| Firefighting & Prevention | 57 (100.0%) | 0 (0.0%) |
| Law Enforcement | 0 (0.0%) | 0 (0.0%) |
| Food Preparation & Serving | 28 (71.8%) | 11 (28.2%) |
| Cleaning & Maintenance | 27 (31.8%) | 58 (68.2%) |
| Personal Care & Service | 5 (29.4%) | 12 (70.6%) |
| Total (Category) | 124 (53.9%) | 106 (46.1%) |
| Total (Overall) | 425 (45.1%) | 517 (54.9%) |
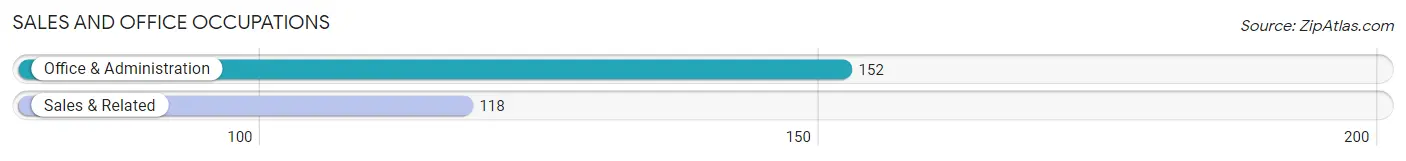
Sales and Office Occupations
The most common Sales and Office occupations in Albany are Office & Administration (152 | 16.1%), and Sales & Related (118 | 12.5%).
Sales and Office Occupations by Sex
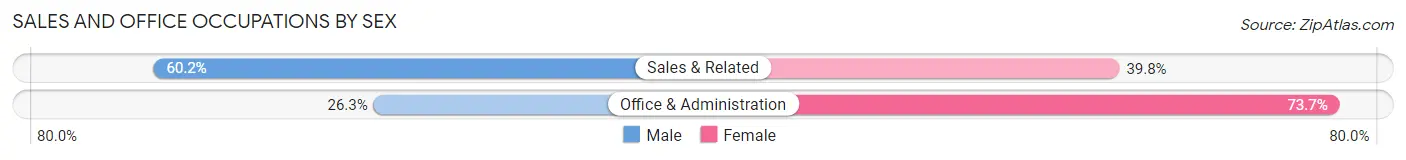
| Occupation | Male | Female |
| Sales & Related | 71 (60.2%) | 47 (39.8%) |
| Office & Administration | 40 (26.3%) | 112 (73.7%) |
| Total (Category) | 111 (41.1%) | 159 (58.9%) |
| Total (Overall) | 425 (45.1%) | 517 (54.9%) |
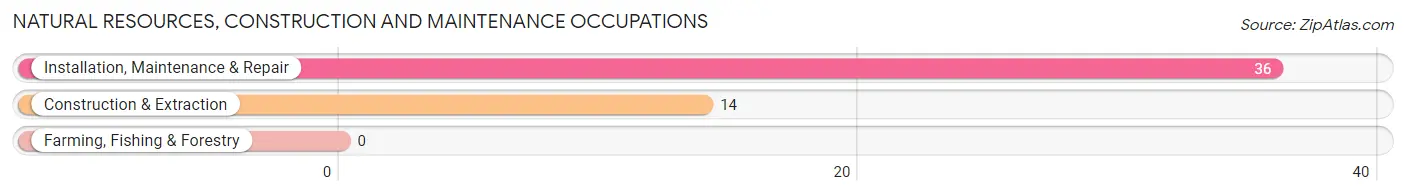
Natural Resources, Construction and Maintenance Occupations
The most common Natural Resources, Construction and Maintenance occupations in Albany are Installation, Maintenance & Repair (36 | 3.8%), and Construction & Extraction (14 | 1.5%).
Natural Resources, Construction and Maintenance Occupations by Sex
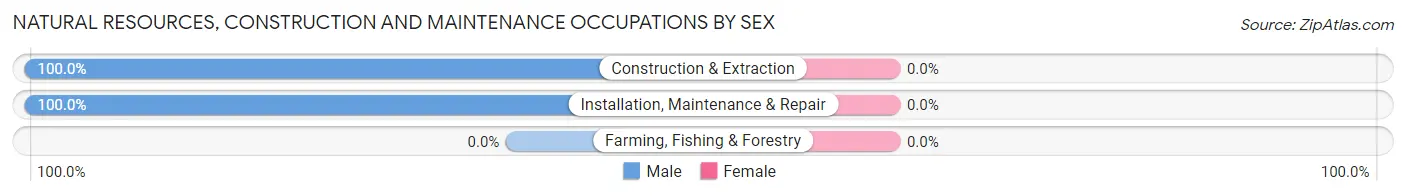
| Occupation | Male | Female |
| Farming, Fishing & Forestry | 0 (0.0%) | 0 (0.0%) |
| Construction & Extraction | 14 (100.0%) | 0 (0.0%) |
| Installation, Maintenance & Repair | 36 (100.0%) | 0 (0.0%) |
| Total (Category) | 50 (100.0%) | 0 (0.0%) |
| Total (Overall) | 425 (45.1%) | 517 (54.9%) |
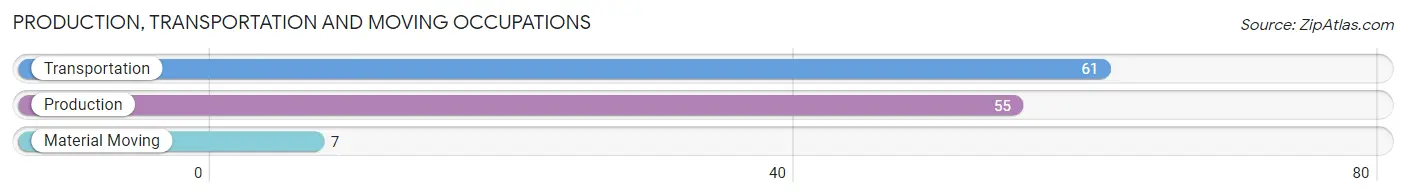
Production, Transportation and Moving Occupations
The most common Production, Transportation and Moving occupations in Albany are Transportation (61 | 6.5%), Production (55 | 5.8%), and Material Moving (7 | 0.7%).
Production, Transportation and Moving Occupations by Sex
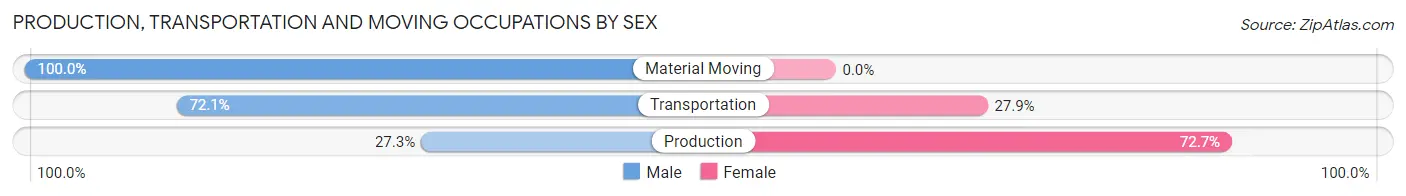
| Occupation | Male | Female |
| Production | 15 (27.3%) | 40 (72.7%) |
| Transportation | 44 (72.1%) | 17 (27.9%) |
| Material Moving | 7 (100.0%) | 0 (0.0%) |
| Total (Category) | 66 (53.7%) | 57 (46.3%) |
| Total (Overall) | 425 (45.1%) | 517 (54.9%) |
Employment Industries by Sex in Albany
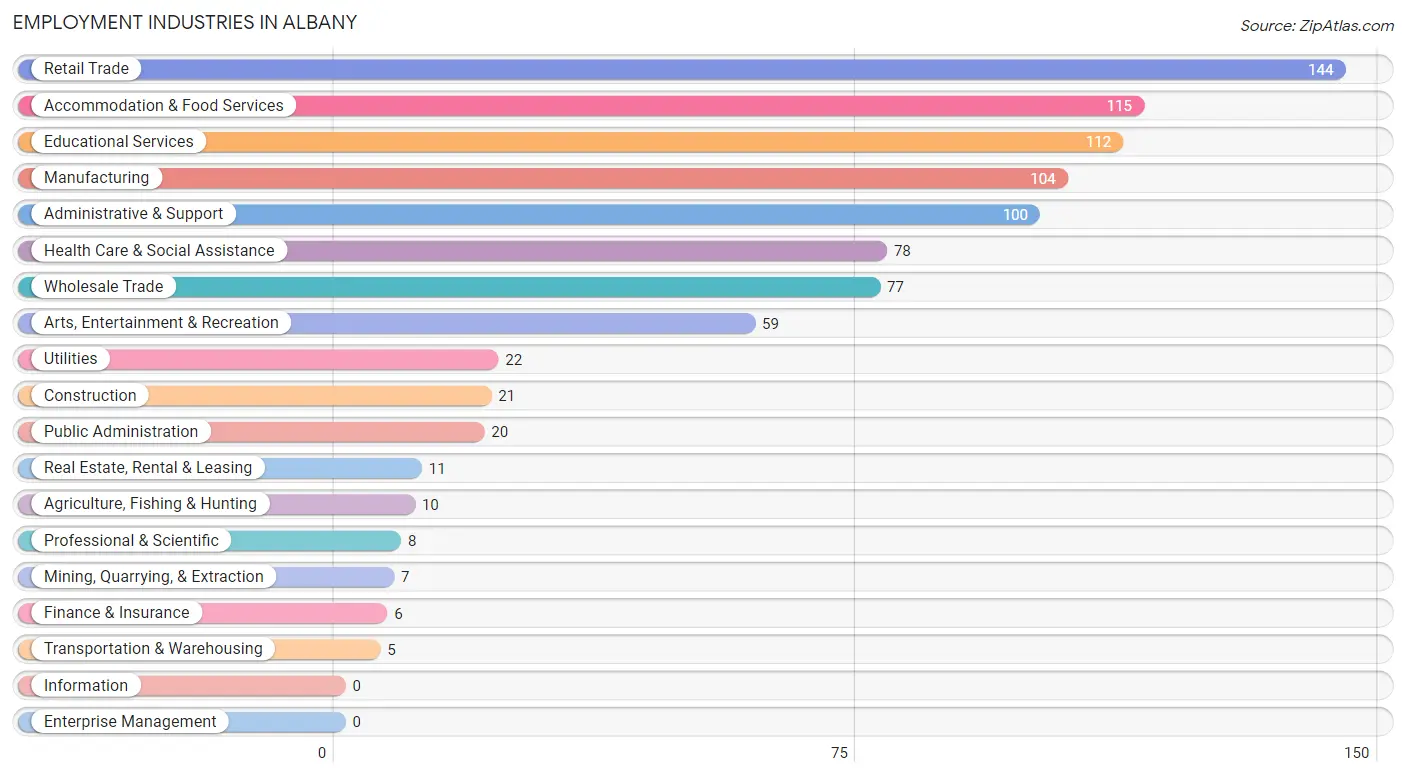
Employment Industries in Albany
The major employment industries in Albany include Retail Trade (144 | 15.3%), Accommodation & Food Services (115 | 12.2%), Educational Services (112 | 11.9%), Manufacturing (104 | 11.0%), and Administrative & Support (100 | 10.6%).
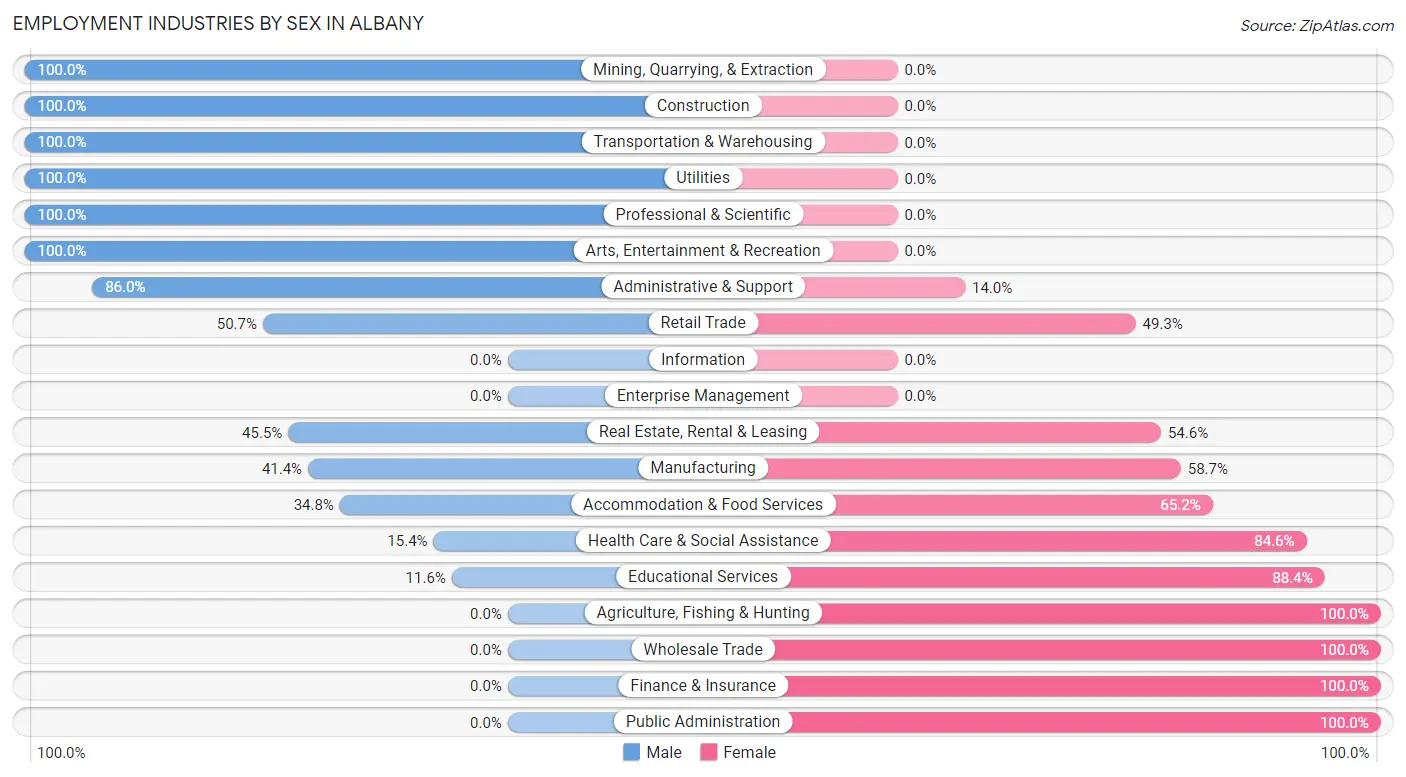
Employment Industries by Sex in Albany
The Albany industries that see more men than women are Mining, Quarrying, & Extraction (100.0%), Construction (100.0%), and Transportation & Warehousing (100.0%), whereas the industries that tend to have a higher number of women are Agriculture, Fishing & Hunting (100.0%), Wholesale Trade (100.0%), and Finance & Insurance (100.0%).
| Industry | Male | Female |
| Agriculture, Fishing & Hunting | 0 (0.0%) | 10 (100.0%) |
| Mining, Quarrying, & Extraction | 7 (100.0%) | 0 (0.0%) |
| Construction | 21 (100.0%) | 0 (0.0%) |
| Manufacturing | 43 (41.3%) | 61 (58.7%) |
| Wholesale Trade | 0 (0.0%) | 77 (100.0%) |
| Retail Trade | 73 (50.7%) | 71 (49.3%) |
| Transportation & Warehousing | 5 (100.0%) | 0 (0.0%) |
| Utilities | 22 (100.0%) | 0 (0.0%) |
| Information | 0 (0.0%) | 0 (0.0%) |
| Finance & Insurance | 0 (0.0%) | 6 (100.0%) |
| Real Estate, Rental & Leasing | 5 (45.5%) | 6 (54.5%) |
| Professional & Scientific | 8 (100.0%) | 0 (0.0%) |
| Enterprise Management | 0 (0.0%) | 0 (0.0%) |
| Administrative & Support | 86 (86.0%) | 14 (14.0%) |
| Educational Services | 13 (11.6%) | 99 (88.4%) |
| Health Care & Social Assistance | 12 (15.4%) | 66 (84.6%) |
| Arts, Entertainment & Recreation | 59 (100.0%) | 0 (0.0%) |
| Accommodation & Food Services | 40 (34.8%) | 75 (65.2%) |
| Public Administration | 0 (0.0%) | 20 (100.0%) |
| Total | 425 (45.1%) | 517 (54.9%) |
Education in Albany
School Enrollment in Albany
The most common levels of schooling among the 378 students in Albany are middle school (172 | 45.5%), elementary school (74 | 19.6%), and high school (74 | 19.6%).
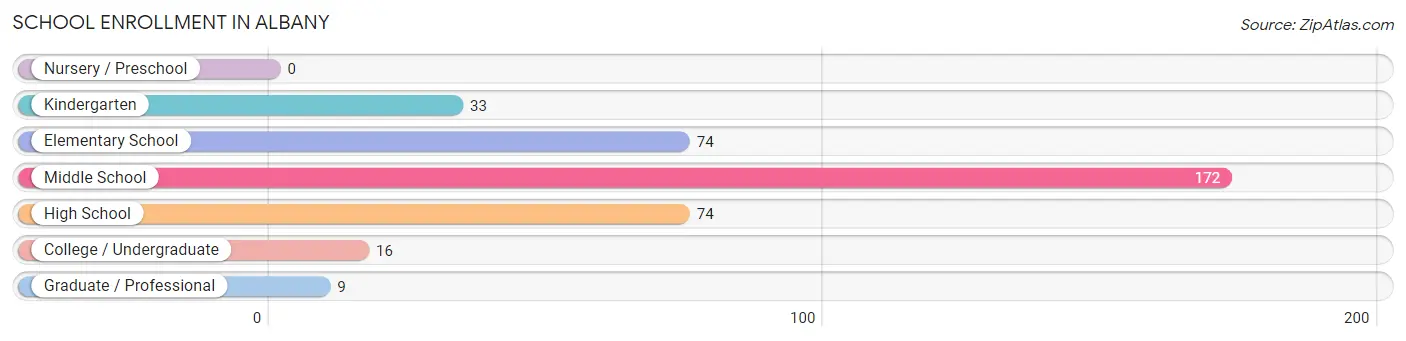
| School Level | # Students | % Students |
| Nursery / Preschool | 0 | 0.0% |
| Kindergarten | 33 | 8.7% |
| Elementary School | 74 | 19.6% |
| Middle School | 172 | 45.5% |
| High School | 74 | 19.6% |
| College / Undergraduate | 16 | 4.2% |
| Graduate / Professional | 9 | 2.4% |
| Total | 378 | 100.0% |
School Enrollment by Age by Funding Source in Albany
Out of a total of 378 students who are enrolled in schools in Albany, 35 (9.3%) attend a private institution, while the remaining 343 (90.7%) are enrolled in public schools. The age group of 15 to 17 year olds has the highest likelihood of being enrolled in private schools, with 14 (26.4% in the age bracket) enrolled. Conversely, the age group of 5 to 9 year old has the lowest likelihood of being enrolled in a private school, with 71 (100.0% in the age bracket) attending a public institution.
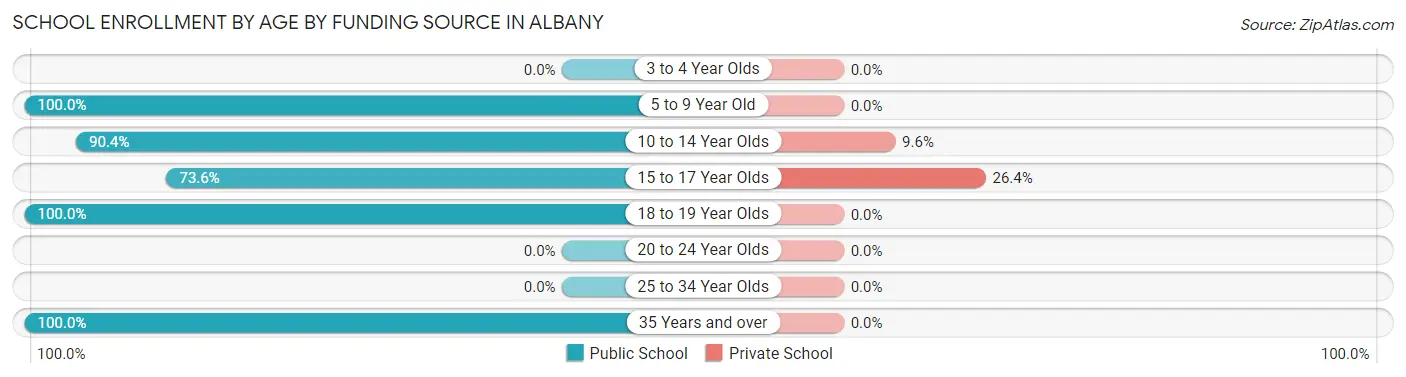
| Age Bracket | Public School | Private School |
| 3 to 4 Year Olds | 0 (0.0%) | 0 (0.0%) |
| 5 to 9 Year Old | 71 (100.0%) | 0 (0.0%) |
| 10 to 14 Year Olds | 198 (90.4%) | 21 (9.6%) |
| 15 to 17 Year Olds | 39 (73.6%) | 14 (26.4%) |
| 18 to 19 Year Olds | 26 (100.0%) | 0 (0.0%) |
| 20 to 24 Year Olds | 0 (0.0%) | 0 (0.0%) |
| 25 to 34 Year Olds | 0 (0.0%) | 0 (0.0%) |
| 35 Years and over | 9 (100.0%) | 0 (0.0%) |
| Total | 343 (90.7%) | 35 (9.3%) |
Educational Attainment by Field of Study in Albany
Bio, nature & agricultural (101 | 30.9%), education (46 | 14.1%), science & technology (43 | 13.2%), business (37 | 11.3%), and arts & humanities (28 | 8.6%) are the most common fields of study among 327 individuals in Albany who have obtained a bachelor's degree or higher.
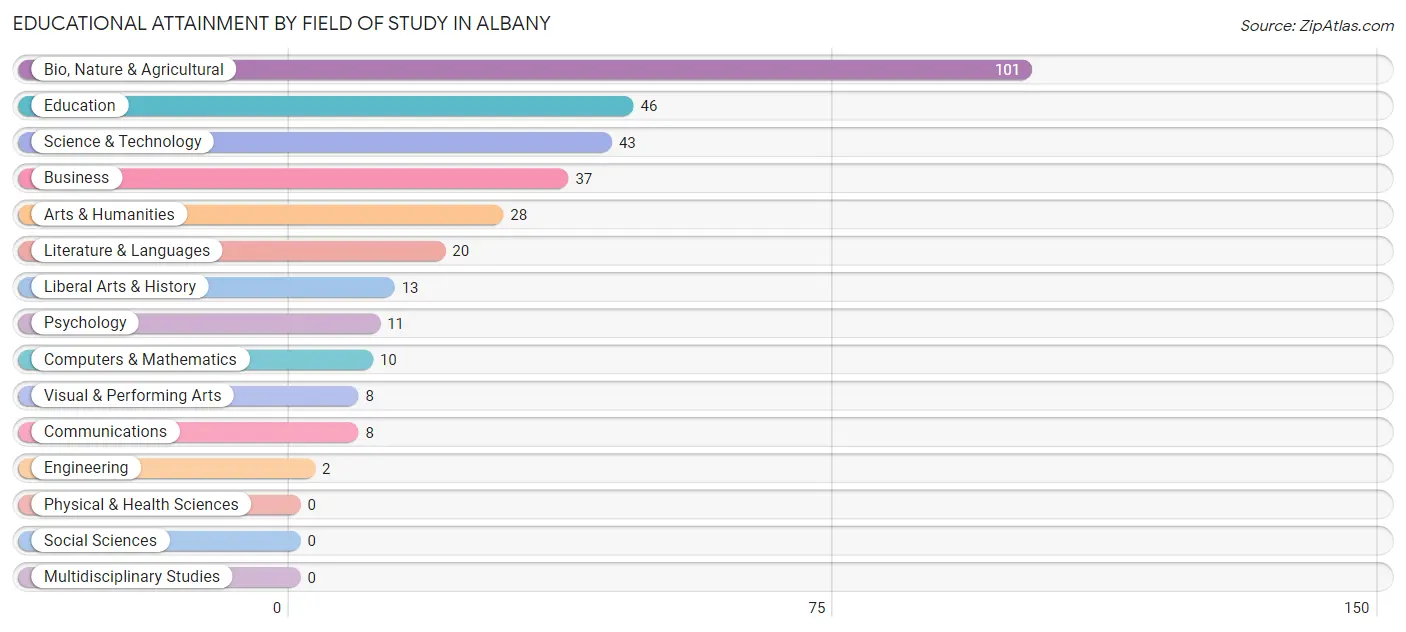
| Field of Study | # Graduates | % Graduates |
| Computers & Mathematics | 10 | 3.1% |
| Bio, Nature & Agricultural | 101 | 30.9% |
| Physical & Health Sciences | 0 | 0.0% |
| Psychology | 11 | 3.4% |
| Social Sciences | 0 | 0.0% |
| Engineering | 2 | 0.6% |
| Multidisciplinary Studies | 0 | 0.0% |
| Science & Technology | 43 | 13.2% |
| Business | 37 | 11.3% |
| Education | 46 | 14.1% |
| Literature & Languages | 20 | 6.1% |
| Liberal Arts & History | 13 | 4.0% |
| Visual & Performing Arts | 8 | 2.5% |
| Communications | 8 | 2.5% |
| Arts & Humanities | 28 | 8.6% |
| Total | 327 | 100.0% |
Transportation & Commute in Albany
Vehicle Availability by Sex in Albany
The most prevalent vehicle ownership categories in Albany are males with 2 vehicles (266, accounting for 62.7%) and females with 2 vehicles (279, making up 52.9%).
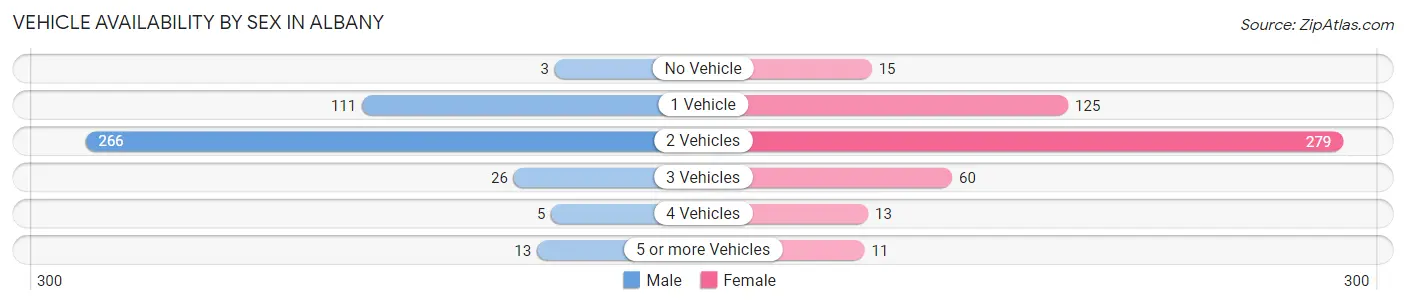
| Vehicles Available | Male | Female |
| No Vehicle | 3 (0.7%) | 15 (3.0%) |
| 1 Vehicle | 111 (26.2%) | 125 (24.8%) |
| 2 Vehicles | 266 (62.7%) | 279 (55.5%) |
| 3 Vehicles | 26 (6.1%) | 60 (11.9%) |
| 4 Vehicles | 5 (1.2%) | 13 (2.6%) |
| 5 or more Vehicles | 13 (3.1%) | 11 (2.2%) |
| Total | 424 (100.0%) | 503 (100.0%) |
Commute Time in Albany
The most frequently occuring commute durations in Albany are 15 to 19 minutes (226 commuters, 25.7%), 10 to 14 minutes (169 commuters, 19.3%), and less than 5 minutes (124 commuters, 14.1%).
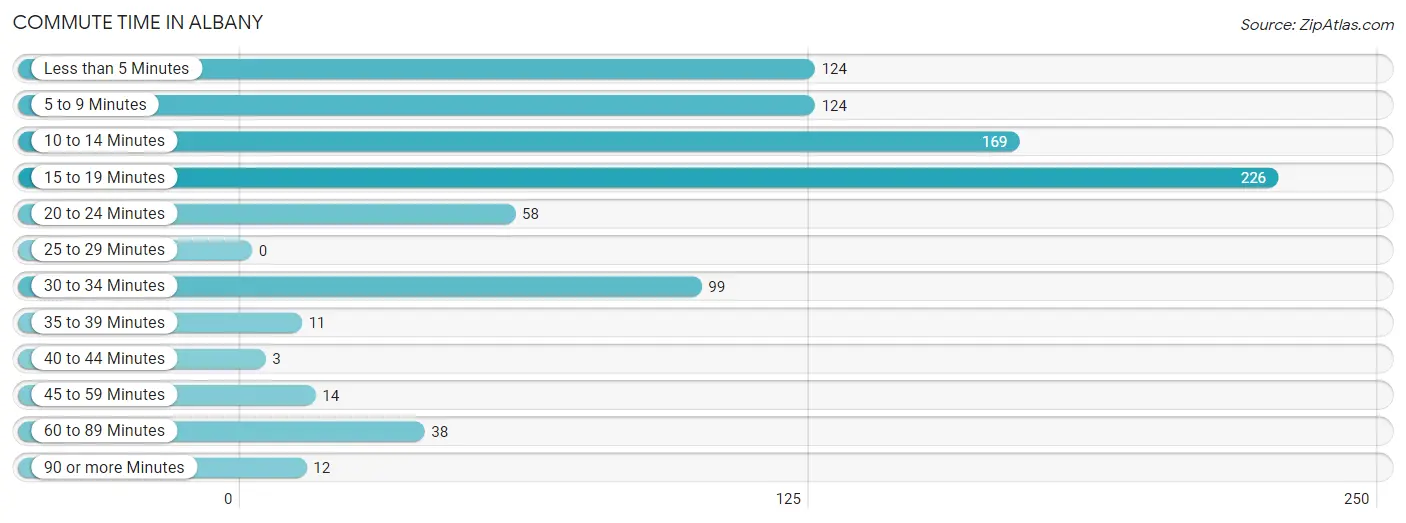
| Commute Time | # Commuters | % Commuters |
| Less than 5 Minutes | 124 | 14.1% |
| 5 to 9 Minutes | 124 | 14.1% |
| 10 to 14 Minutes | 169 | 19.3% |
| 15 to 19 Minutes | 226 | 25.7% |
| 20 to 24 Minutes | 58 | 6.6% |
| 25 to 29 Minutes | 0 | 0.0% |
| 30 to 34 Minutes | 99 | 11.3% |
| 35 to 39 Minutes | 11 | 1.3% |
| 40 to 44 Minutes | 3 | 0.3% |
| 45 to 59 Minutes | 14 | 1.6% |
| 60 to 89 Minutes | 38 | 4.3% |
| 90 or more Minutes | 12 | 1.4% |
Commute Time by Sex in Albany
The most common commute times in Albany are 15 to 19 minutes (125 commuters, 31.3%) for males and 15 to 19 minutes (101 commuters, 21.1%) for females.
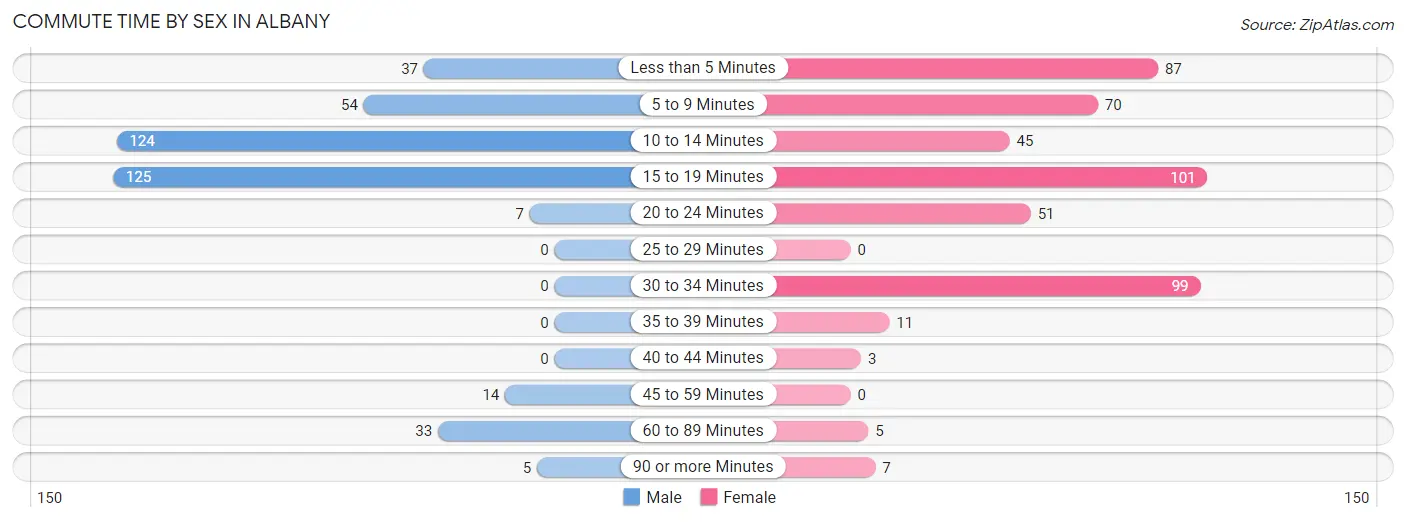
| Commute Time | Male | Female |
| Less than 5 Minutes | 37 (9.3%) | 87 (18.2%) |
| 5 to 9 Minutes | 54 (13.5%) | 70 (14.6%) |
| 10 to 14 Minutes | 124 (31.1%) | 45 (9.4%) |
| 15 to 19 Minutes | 125 (31.3%) | 101 (21.1%) |
| 20 to 24 Minutes | 7 (1.8%) | 51 (10.6%) |
| 25 to 29 Minutes | 0 (0.0%) | 0 (0.0%) |
| 30 to 34 Minutes | 0 (0.0%) | 99 (20.7%) |
| 35 to 39 Minutes | 0 (0.0%) | 11 (2.3%) |
| 40 to 44 Minutes | 0 (0.0%) | 3 (0.6%) |
| 45 to 59 Minutes | 14 (3.5%) | 0 (0.0%) |
| 60 to 89 Minutes | 33 (8.3%) | 5 (1.0%) |
| 90 or more Minutes | 5 (1.3%) | 7 (1.5%) |
Time of Departure to Work by Sex in Albany
The most frequent times of departure to work in Albany are 6:30 AM to 6:59 AM (154, 38.6%) for males and 12:00 AM to 4:59 AM (95, 19.8%) for females.
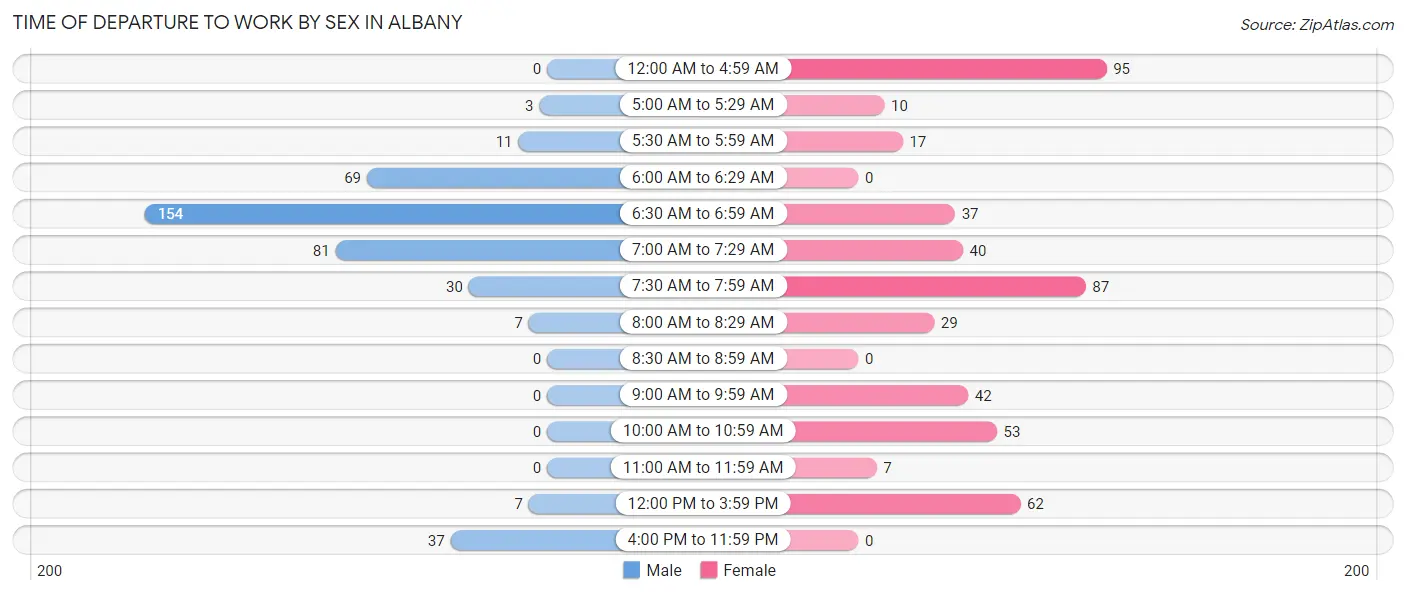
| Time of Departure | Male | Female |
| 12:00 AM to 4:59 AM | 0 (0.0%) | 95 (19.8%) |
| 5:00 AM to 5:29 AM | 3 (0.7%) | 10 (2.1%) |
| 5:30 AM to 5:59 AM | 11 (2.8%) | 17 (3.5%) |
| 6:00 AM to 6:29 AM | 69 (17.3%) | 0 (0.0%) |
| 6:30 AM to 6:59 AM | 154 (38.6%) | 37 (7.7%) |
| 7:00 AM to 7:29 AM | 81 (20.3%) | 40 (8.4%) |
| 7:30 AM to 7:59 AM | 30 (7.5%) | 87 (18.2%) |
| 8:00 AM to 8:29 AM | 7 (1.8%) | 29 (6.0%) |
| 8:30 AM to 8:59 AM | 0 (0.0%) | 0 (0.0%) |
| 9:00 AM to 9:59 AM | 0 (0.0%) | 42 (8.8%) |
| 10:00 AM to 10:59 AM | 0 (0.0%) | 53 (11.1%) |
| 11:00 AM to 11:59 AM | 0 (0.0%) | 7 (1.5%) |
| 12:00 PM to 3:59 PM | 7 (1.8%) | 62 (12.9%) |
| 4:00 PM to 11:59 PM | 37 (9.3%) | 0 (0.0%) |
| Total | 399 (100.0%) | 479 (100.0%) |
Housing Occupancy in Albany
Occupancy by Ownership in Albany
Of the total 894 dwellings in Albany, owner-occupied units account for 406 (45.4%), while renter-occupied units make up 488 (54.6%).
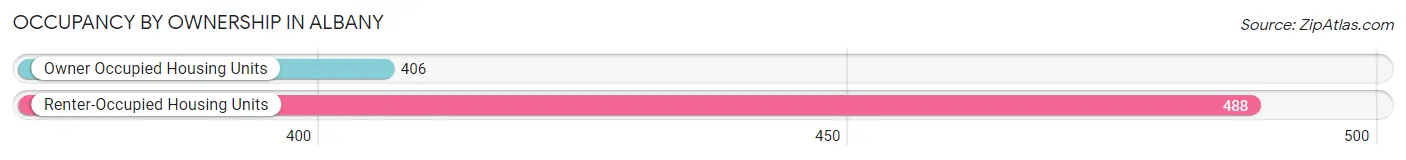
| Occupancy | # Housing Units | % Housing Units |
| Owner Occupied Housing Units | 406 | 45.4% |
| Renter-Occupied Housing Units | 488 | 54.6% |
| Total Occupied Housing Units | 894 | 100.0% |
Occupancy by Household Size in Albany
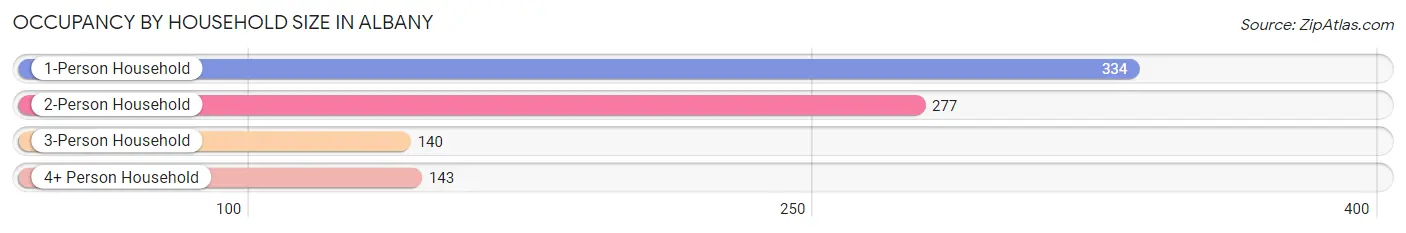
| Household Size | # Housing Units | % Housing Units |
| 1-Person Household | 334 | 37.4% |
| 2-Person Household | 277 | 31.0% |
| 3-Person Household | 140 | 15.7% |
| 4+ Person Household | 143 | 16.0% |
| Total Housing Units | 894 | 100.0% |
Occupancy by Ownership by Household Size in Albany
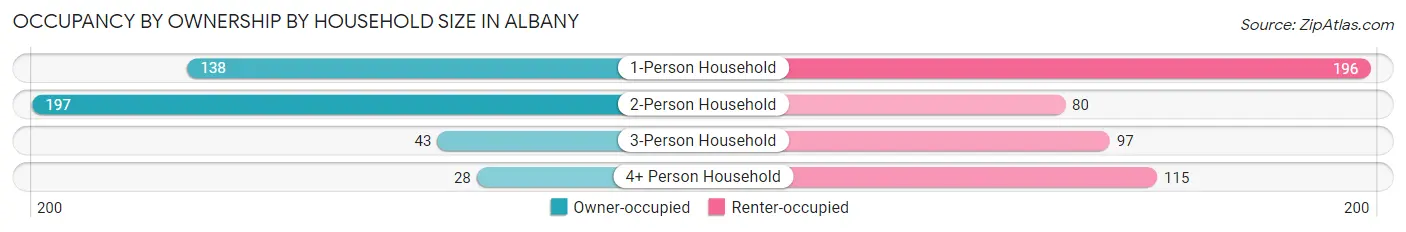
| Household Size | Owner-occupied | Renter-occupied |
| 1-Person Household | 138 (41.3%) | 196 (58.7%) |
| 2-Person Household | 197 (71.1%) | 80 (28.9%) |
| 3-Person Household | 43 (30.7%) | 97 (69.3%) |
| 4+ Person Household | 28 (19.6%) | 115 (80.4%) |
| Total Housing Units | 406 (45.4%) | 488 (54.6%) |
Occupancy by Educational Attainment in Albany
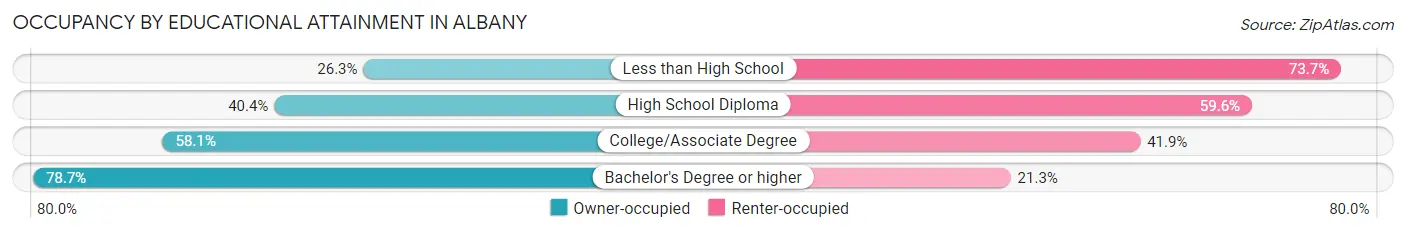
| Household Size | Owner-occupied | Renter-occupied |
| Less than High School | 62 (26.3%) | 174 (73.7%) |
| High School Diploma | 158 (40.4%) | 233 (59.6%) |
| College/Associate Degree | 68 (58.1%) | 49 (41.9%) |
| Bachelor's Degree or higher | 118 (78.7%) | 32 (21.3%) |
Occupancy by Age of Householder in Albany
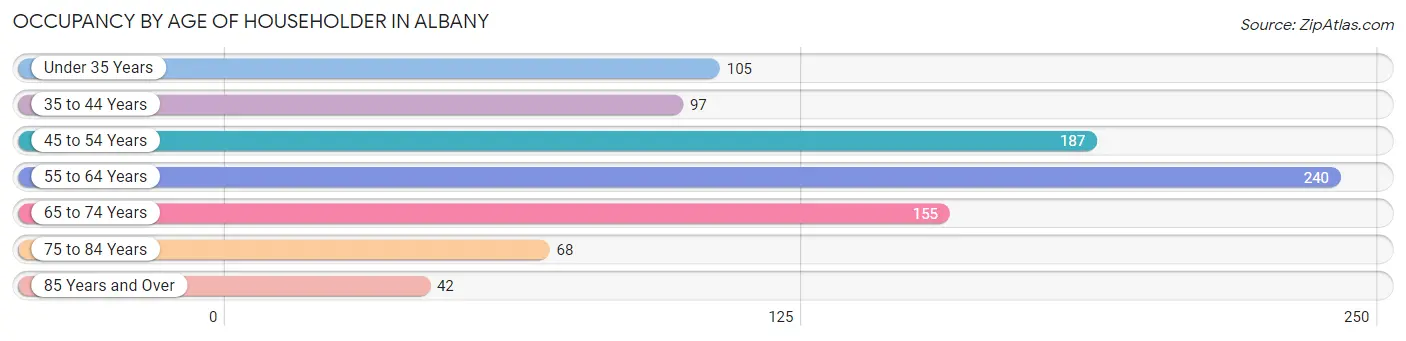
| Age Bracket | # Households | % Households |
| Under 35 Years | 105 | 11.7% |
| 35 to 44 Years | 97 | 10.8% |
| 45 to 54 Years | 187 | 20.9% |
| 55 to 64 Years | 240 | 26.9% |
| 65 to 74 Years | 155 | 17.3% |
| 75 to 84 Years | 68 | 7.6% |
| 85 Years and Over | 42 | 4.7% |
| Total | 894 | 100.0% |
Housing Finances in Albany
Median Income by Occupancy in Albany
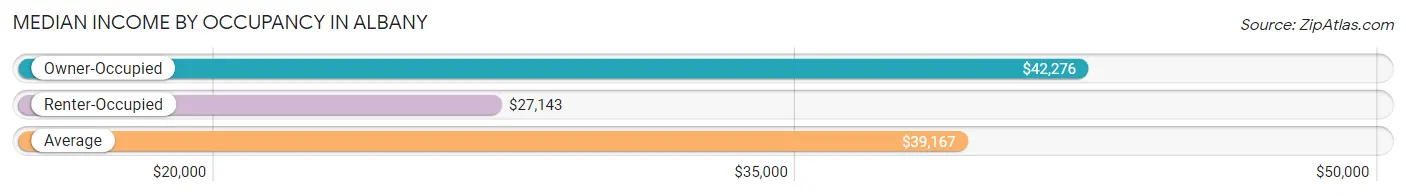
| Occupancy Type | # Households | Median Income |
| Owner-Occupied | 406 (45.4%) | $42,276 |
| Renter-Occupied | 488 (54.6%) | $27,143 |
| Average | 894 (100.0%) | $39,167 |
Occupancy by Householder Income Bracket in Albany
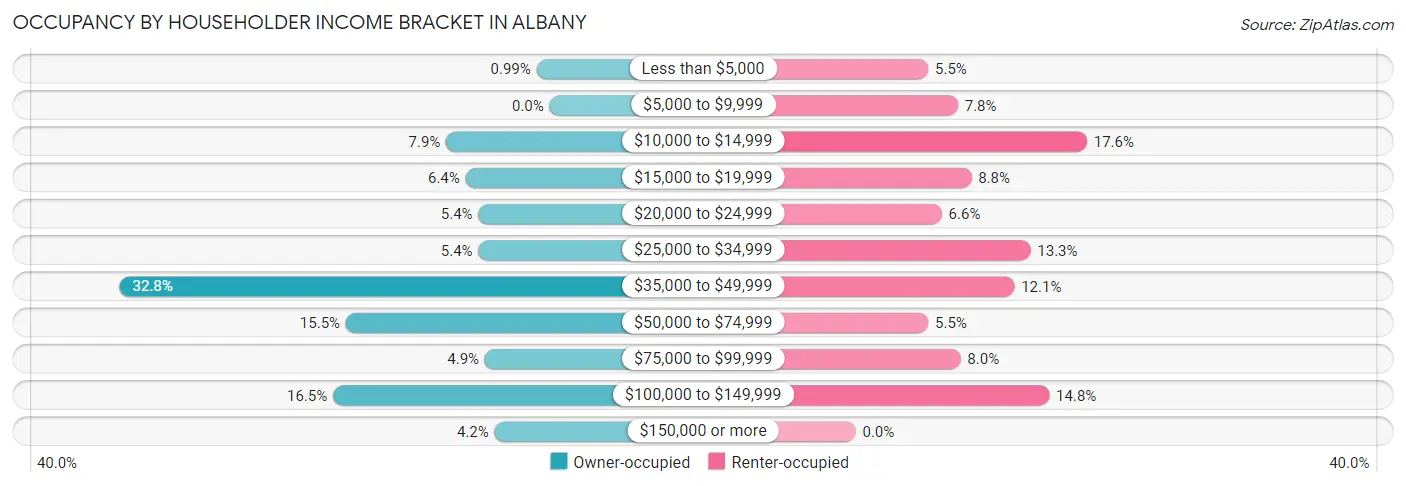
| Income Bracket | Owner-occupied | Renter-occupied |
| Less than $5,000 | 4 (1.0%) | 27 (5.5%) |
| $5,000 to $9,999 | 0 (0.0%) | 38 (7.8%) |
| $10,000 to $14,999 | 32 (7.9%) | 86 (17.6%) |
| $15,000 to $19,999 | 26 (6.4%) | 43 (8.8%) |
| $20,000 to $24,999 | 22 (5.4%) | 32 (6.6%) |
| $25,000 to $34,999 | 22 (5.4%) | 65 (13.3%) |
| $35,000 to $49,999 | 133 (32.8%) | 59 (12.1%) |
| $50,000 to $74,999 | 63 (15.5%) | 27 (5.5%) |
| $75,000 to $99,999 | 20 (4.9%) | 39 (8.0%) |
| $100,000 to $149,999 | 67 (16.5%) | 72 (14.7%) |
| $150,000 or more | 17 (4.2%) | 0 (0.0%) |
| Total | 406 (100.0%) | 488 (100.0%) |
Monthly Housing Cost Tiers in Albany
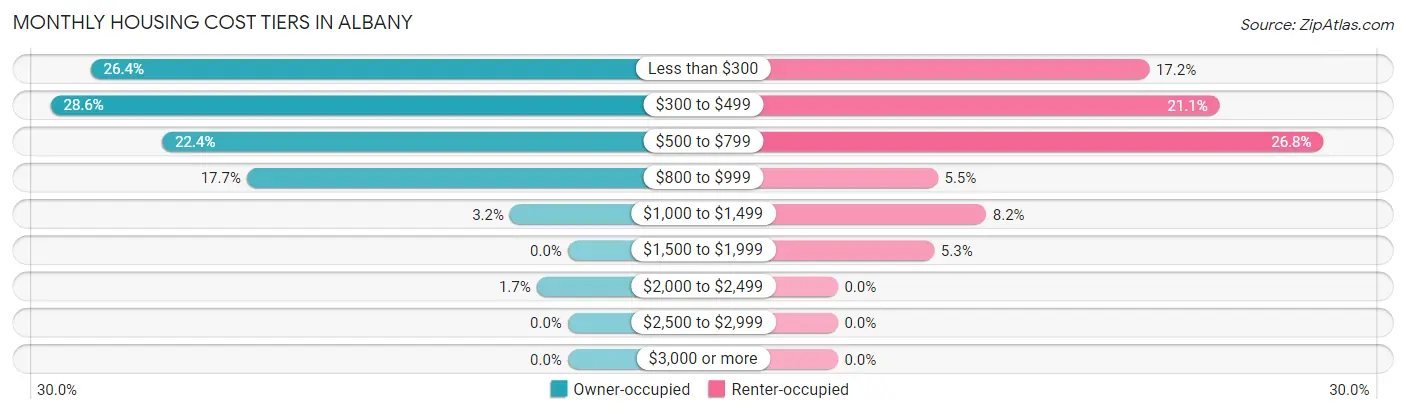
| Monthly Cost | Owner-occupied | Renter-occupied |
| Less than $300 | 107 (26.4%) | 84 (17.2%) |
| $300 to $499 | 116 (28.6%) | 103 (21.1%) |
| $500 to $799 | 91 (22.4%) | 131 (26.8%) |
| $800 to $999 | 72 (17.7%) | 27 (5.5%) |
| $1,000 to $1,499 | 13 (3.2%) | 40 (8.2%) |
| $1,500 to $1,999 | 0 (0.0%) | 26 (5.3%) |
| $2,000 to $2,499 | 7 (1.7%) | 0 (0.0%) |
| $2,500 to $2,999 | 0 (0.0%) | 0 (0.0%) |
| $3,000 or more | 0 (0.0%) | 0 (0.0%) |
| Total | 406 (100.0%) | 488 (100.0%) |
Physical Housing Characteristics in Albany
Housing Structures in Albany
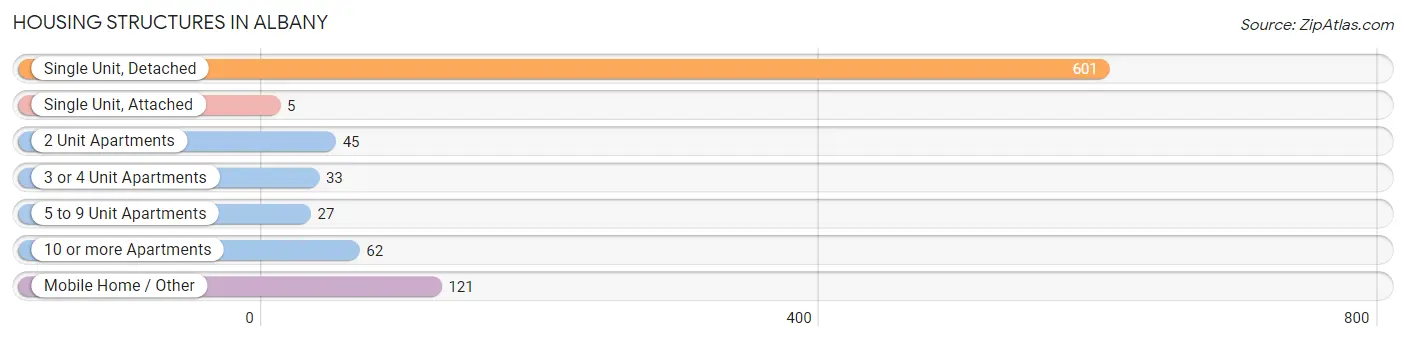
| Structure Type | # Housing Units | % Housing Units |
| Single Unit, Detached | 601 | 67.2% |
| Single Unit, Attached | 5 | 0.6% |
| 2 Unit Apartments | 45 | 5.0% |
| 3 or 4 Unit Apartments | 33 | 3.7% |
| 5 to 9 Unit Apartments | 27 | 3.0% |
| 10 or more Apartments | 62 | 6.9% |
| Mobile Home / Other | 121 | 13.5% |
| Total | 894 | 100.0% |
Housing Structures by Occupancy in Albany
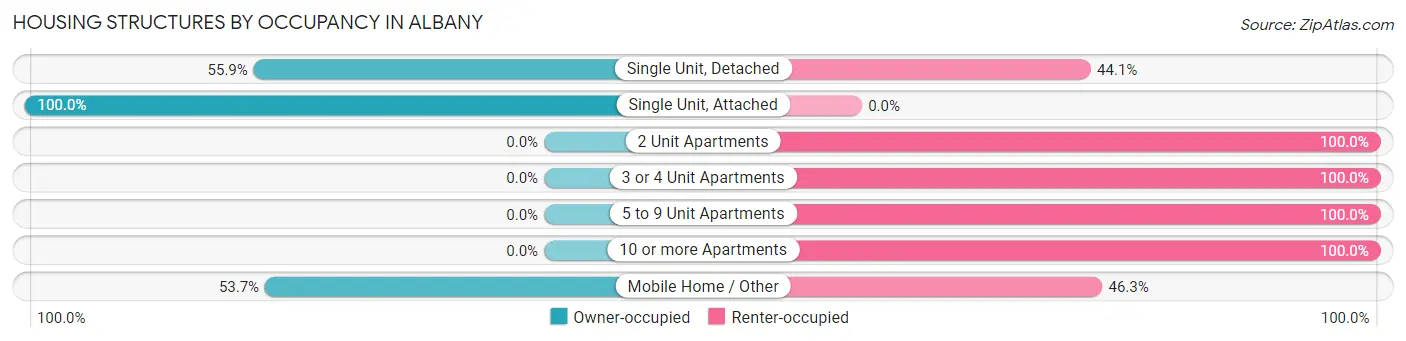
| Structure Type | Owner-occupied | Renter-occupied |
| Single Unit, Detached | 336 (55.9%) | 265 (44.1%) |
| Single Unit, Attached | 5 (100.0%) | 0 (0.0%) |
| 2 Unit Apartments | 0 (0.0%) | 45 (100.0%) |
| 3 or 4 Unit Apartments | 0 (0.0%) | 33 (100.0%) |
| 5 to 9 Unit Apartments | 0 (0.0%) | 27 (100.0%) |
| 10 or more Apartments | 0 (0.0%) | 62 (100.0%) |
| Mobile Home / Other | 65 (53.7%) | 56 (46.3%) |
| Total | 406 (45.4%) | 488 (54.6%) |
Housing Structures by Number of Rooms in Albany
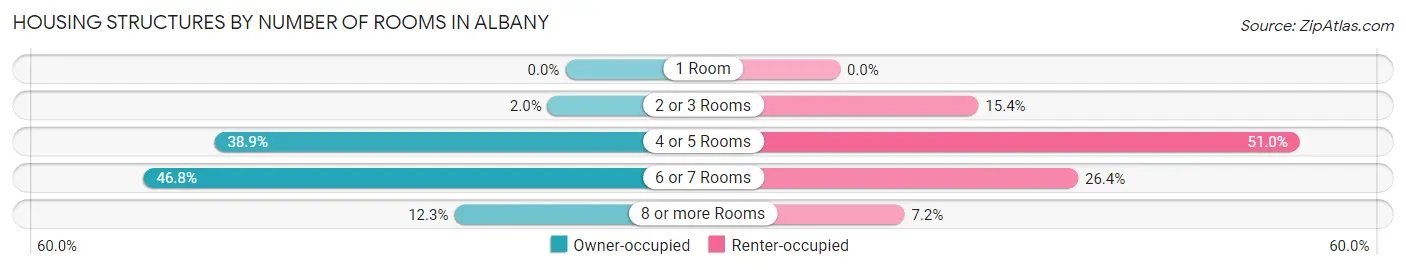
| Number of Rooms | Owner-occupied | Renter-occupied |
| 1 Room | 0 (0.0%) | 0 (0.0%) |
| 2 or 3 Rooms | 8 (2.0%) | 75 (15.4%) |
| 4 or 5 Rooms | 158 (38.9%) | 249 (51.0%) |
| 6 or 7 Rooms | 190 (46.8%) | 129 (26.4%) |
| 8 or more Rooms | 50 (12.3%) | 35 (7.2%) |
| Total | 406 (100.0%) | 488 (100.0%) |
Housing Structure by Heating Type in Albany
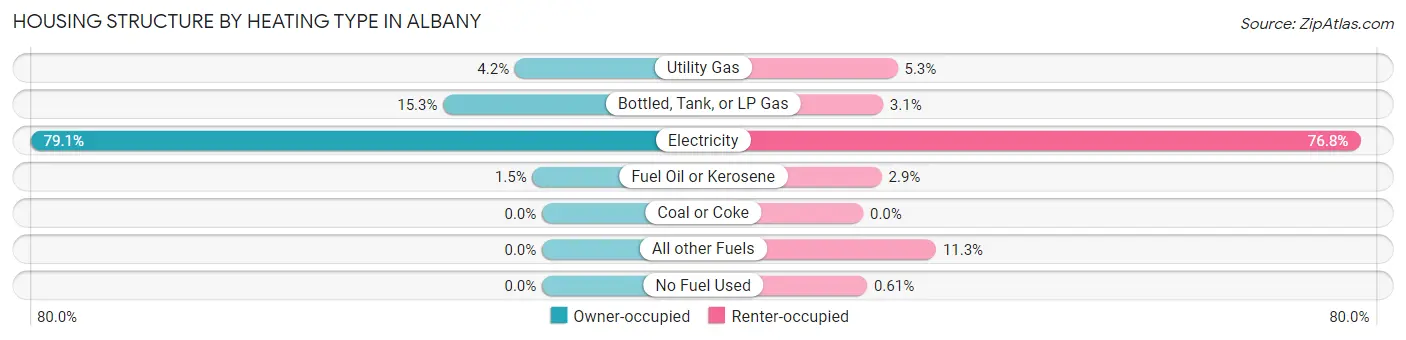
| Heating Type | Owner-occupied | Renter-occupied |
| Utility Gas | 17 (4.2%) | 26 (5.3%) |
| Bottled, Tank, or LP Gas | 62 (15.3%) | 15 (3.1%) |
| Electricity | 321 (79.1%) | 375 (76.8%) |
| Fuel Oil or Kerosene | 6 (1.5%) | 14 (2.9%) |
| Coal or Coke | 0 (0.0%) | 0 (0.0%) |
| All other Fuels | 0 (0.0%) | 55 (11.3%) |
| No Fuel Used | 0 (0.0%) | 3 (0.6%) |
| Total | 406 (100.0%) | 488 (100.0%) |
Household Vehicle Usage in Albany
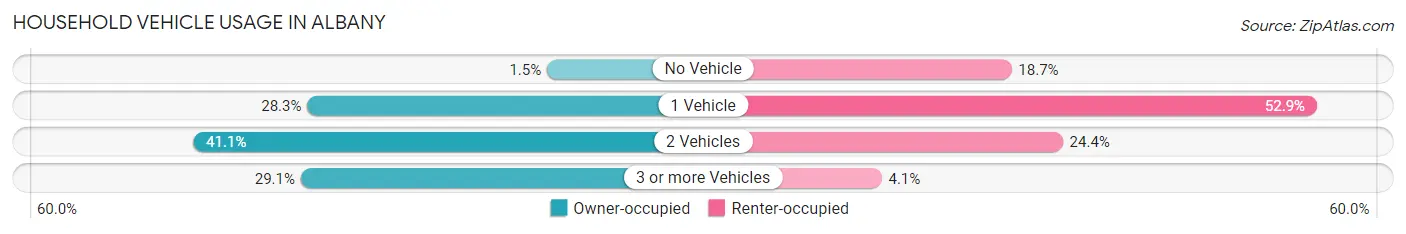
| Vehicles per Household | Owner-occupied | Renter-occupied |
| No Vehicle | 6 (1.5%) | 91 (18.6%) |
| 1 Vehicle | 115 (28.3%) | 258 (52.9%) |
| 2 Vehicles | 167 (41.1%) | 119 (24.4%) |
| 3 or more Vehicles | 118 (29.1%) | 20 (4.1%) |
| Total | 406 (100.0%) | 488 (100.0%) |
Real Estate & Mortgages in Albany
Real Estate and Mortgage Overview in Albany
| Characteristic | Without Mortgage | With Mortgage |
| Housing Units | 287 | 119 |
| Median Property Value | $96,000 | $96,400 |
| Median Household Income | $46,359 | $7 |
| Monthly Housing Costs | $342 | $0 |
| Real Estate Taxes | $542 | $0 |
Property Value by Mortgage Status in Albany
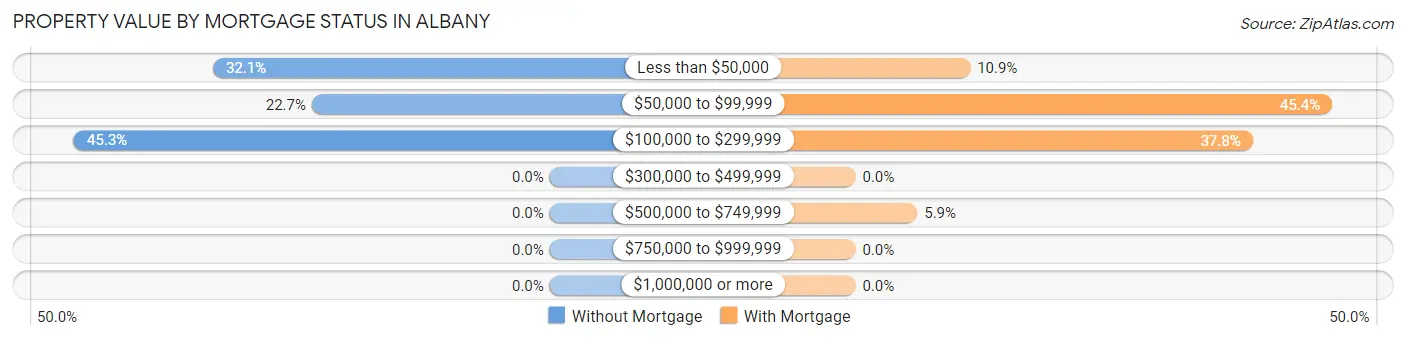
| Property Value | Without Mortgage | With Mortgage |
| Less than $50,000 | 92 (32.1%) | 13 (10.9%) |
| $50,000 to $99,999 | 65 (22.7%) | 54 (45.4%) |
| $100,000 to $299,999 | 130 (45.3%) | 45 (37.8%) |
| $300,000 to $499,999 | 0 (0.0%) | 0 (0.0%) |
| $500,000 to $749,999 | 0 (0.0%) | 7 (5.9%) |
| $750,000 to $999,999 | 0 (0.0%) | 0 (0.0%) |
| $1,000,000 or more | 0 (0.0%) | 0 (0.0%) |
| Total | 287 (100.0%) | 119 (100.0%) |
Household Income by Mortgage Status in Albany
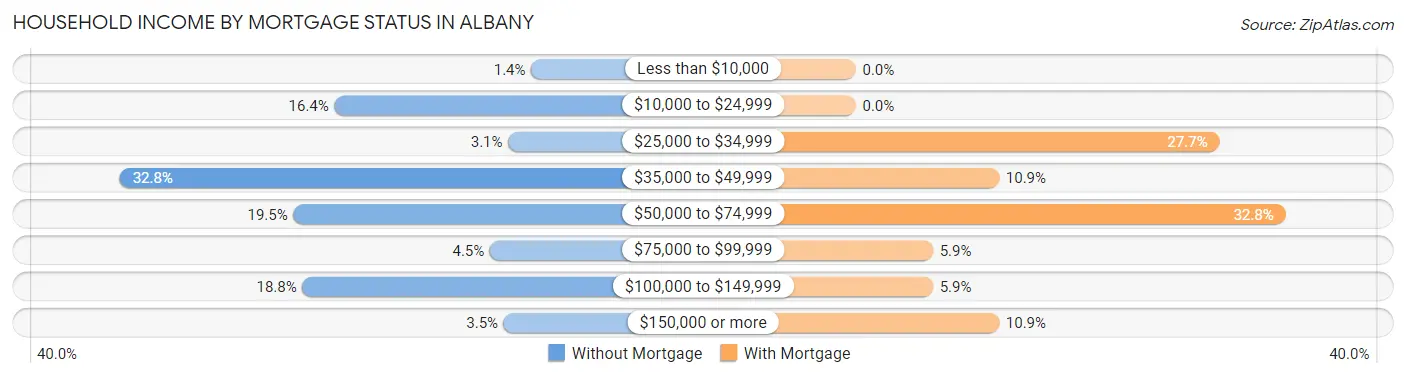
| Household Income | Without Mortgage | With Mortgage |
| Less than $10,000 | 4 (1.4%) | 0 (0.0%) |
| $10,000 to $24,999 | 47 (16.4%) | 0 (0.0%) |
| $25,000 to $34,999 | 9 (3.1%) | 33 (27.7%) |
| $35,000 to $49,999 | 94 (32.8%) | 13 (10.9%) |
| $50,000 to $74,999 | 56 (19.5%) | 39 (32.8%) |
| $75,000 to $99,999 | 13 (4.5%) | 7 (5.9%) |
| $100,000 to $149,999 | 54 (18.8%) | 7 (5.9%) |
| $150,000 or more | 10 (3.5%) | 13 (10.9%) |
| Total | 287 (100.0%) | 119 (100.0%) |
Property Value to Household Income Ratio in Albany
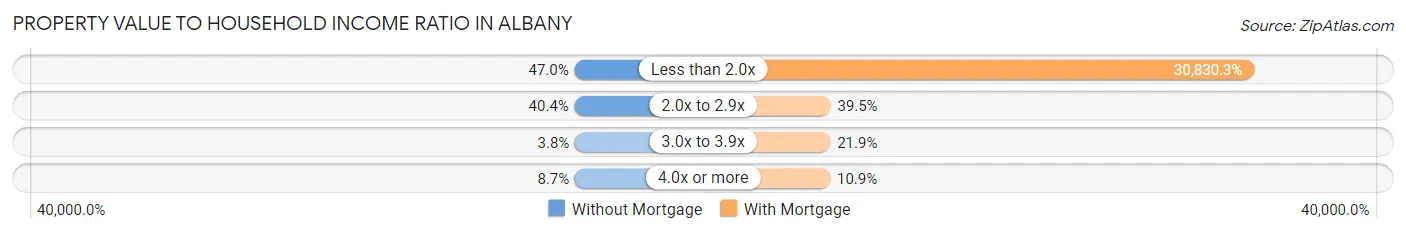
| Value-to-Income Ratio | Without Mortgage | With Mortgage |
| Less than 2.0x | 135 (47.0%) | 36,688 (30,830.3%) |
| 2.0x to 2.9x | 116 (40.4%) | 47 (39.5%) |
| 3.0x to 3.9x | 11 (3.8%) | 26 (21.8%) |
| 4.0x or more | 25 (8.7%) | 13 (10.9%) |
| Total | 287 (100.0%) | 119 (100.0%) |
Real Estate Taxes by Mortgage Status in Albany
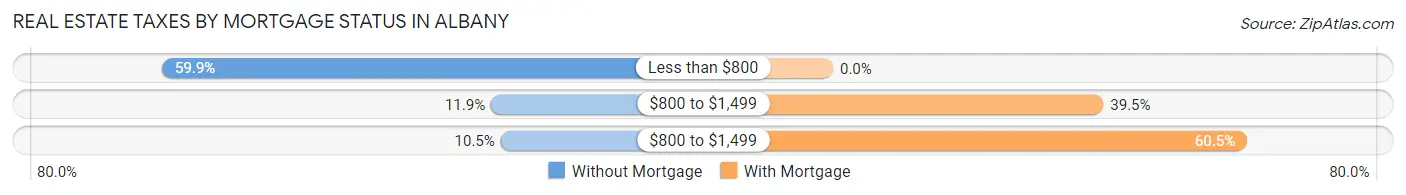
| Property Taxes | Without Mortgage | With Mortgage |
| Less than $800 | 172 (59.9%) | 0 (0.0%) |
| $800 to $1,499 | 34 (11.8%) | 47 (39.5%) |
| $800 to $1,499 | 30 (10.4%) | 72 (60.5%) |
| Total | 287 (100.0%) | 119 (100.0%) |
Health & Disability in Albany
Health Insurance Coverage by Age in Albany
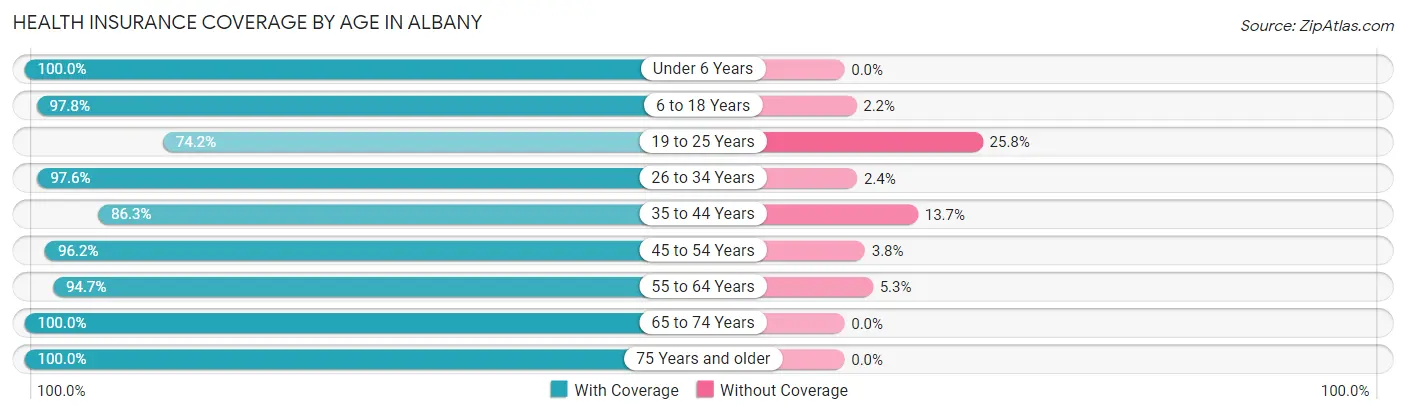
| Age Bracket | With Coverage | Without Coverage |
| Under 6 Years | 80 (100.0%) | 0 (0.0%) |
| 6 to 18 Years | 350 (97.8%) | 8 (2.2%) |
| 19 to 25 Years | 118 (74.2%) | 41 (25.8%) |
| 26 to 34 Years | 289 (97.6%) | 7 (2.4%) |
| 35 to 44 Years | 189 (86.3%) | 30 (13.7%) |
| 45 to 54 Years | 302 (96.2%) | 12 (3.8%) |
| 55 to 64 Years | 304 (94.7%) | 17 (5.3%) |
| 65 to 74 Years | 296 (100.0%) | 0 (0.0%) |
| 75 Years and older | 138 (100.0%) | 0 (0.0%) |
| Total | 2,066 (94.7%) | 115 (5.3%) |
Health Insurance Coverage by Citizenship Status in Albany
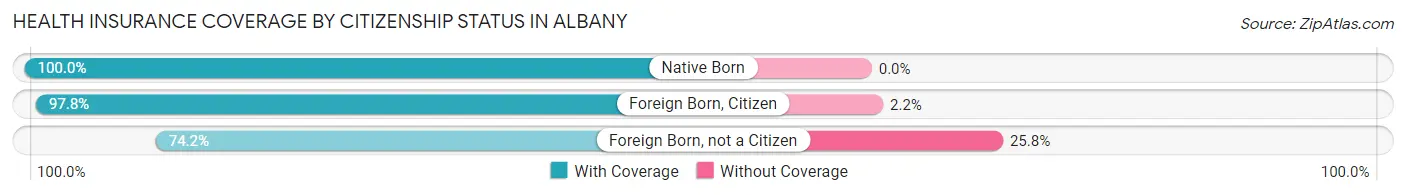
| Citizenship Status | With Coverage | Without Coverage |
| Native Born | 80 (100.0%) | 0 (0.0%) |
| Foreign Born, Citizen | 350 (97.8%) | 8 (2.2%) |
| Foreign Born, not a Citizen | 118 (74.2%) | 41 (25.8%) |
Health Insurance Coverage by Household Income in Albany
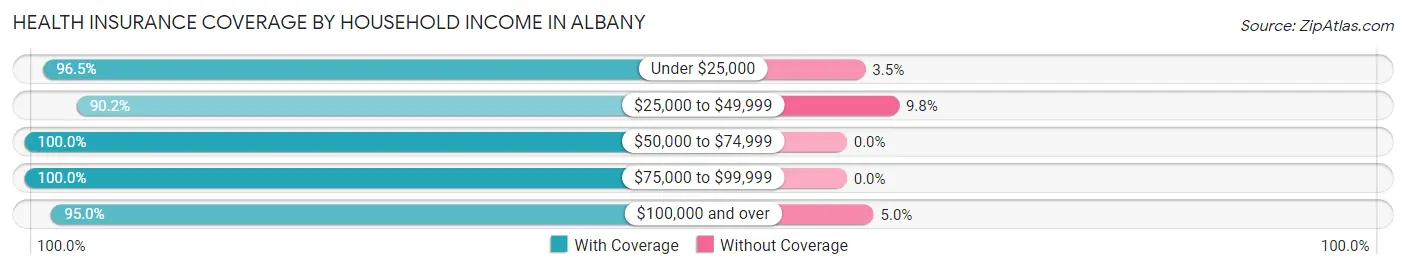
| Household Income | With Coverage | Without Coverage |
| Under $25,000 | 525 (96.5%) | 19 (3.5%) |
| $25,000 to $49,999 | 600 (90.2%) | 65 (9.8%) |
| $50,000 to $74,999 | 169 (100.0%) | 0 (0.0%) |
| $75,000 to $99,999 | 201 (100.0%) | 0 (0.0%) |
| $100,000 and over | 568 (95.0%) | 30 (5.0%) |
Public vs Private Health Insurance Coverage by Age in Albany
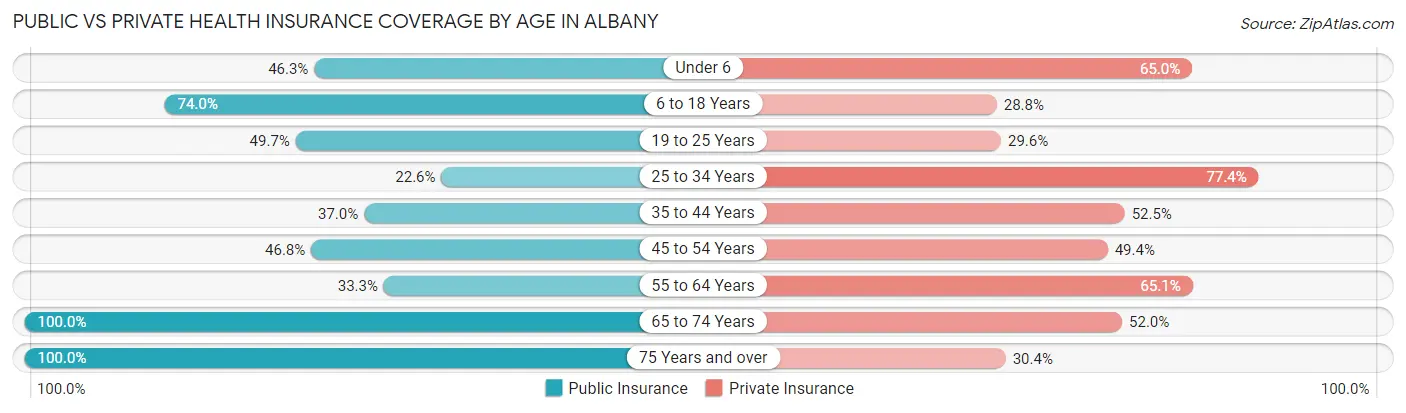
| Age Bracket | Public Insurance | Private Insurance |
| Under 6 | 37 (46.3%) | 52 (65.0%) |
| 6 to 18 Years | 265 (74.0%) | 103 (28.8%) |
| 19 to 25 Years | 79 (49.7%) | 47 (29.6%) |
| 25 to 34 Years | 67 (22.6%) | 229 (77.4%) |
| 35 to 44 Years | 81 (37.0%) | 115 (52.5%) |
| 45 to 54 Years | 147 (46.8%) | 155 (49.4%) |
| 55 to 64 Years | 107 (33.3%) | 209 (65.1%) |
| 65 to 74 Years | 296 (100.0%) | 154 (52.0%) |
| 75 Years and over | 138 (100.0%) | 42 (30.4%) |
| Total | 1,217 (55.8%) | 1,106 (50.7%) |
Disability Status by Sex by Age in Albany
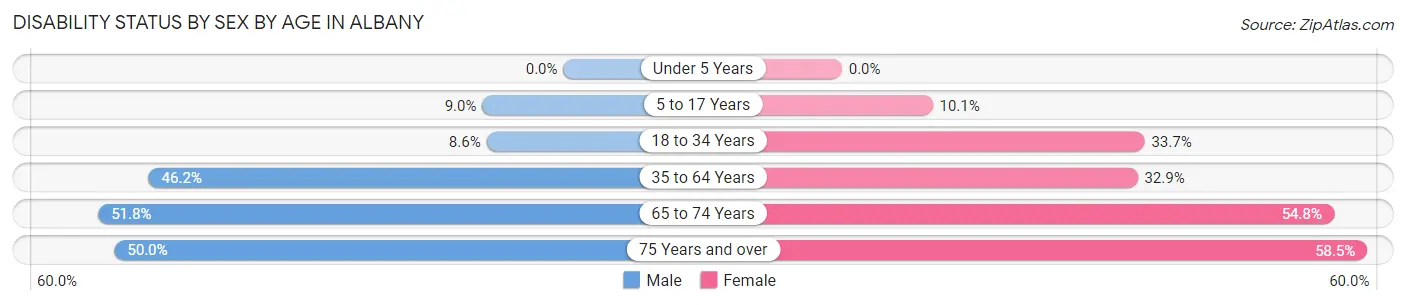
| Age Bracket | Male | Female |
| Under 5 Years | 0 (0.0%) | 0 (0.0%) |
| 5 to 17 Years | 14 (9.0%) | 19 (10.1%) |
| 18 to 34 Years | 25 (8.6%) | 60 (33.7%) |
| 35 to 64 Years | 163 (46.2%) | 165 (32.9%) |
| 65 to 74 Years | 72 (51.8%) | 86 (54.8%) |
| 75 Years and over | 22 (50.0%) | 55 (58.5%) |
Disability Class by Sex by Age in Albany
Disability Class: Hearing Difficulty
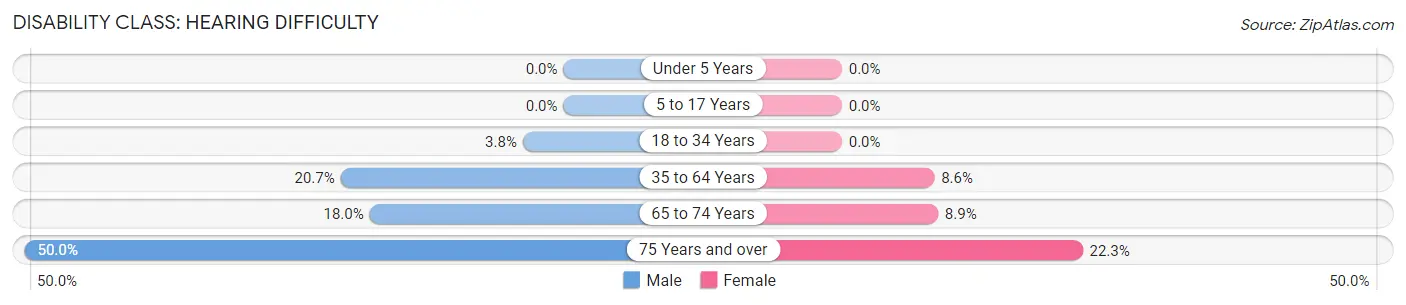
| Age Bracket | Male | Female |
| Under 5 Years | 0 (0.0%) | 0 (0.0%) |
| 5 to 17 Years | 0 (0.0%) | 0 (0.0%) |
| 18 to 34 Years | 11 (3.8%) | 0 (0.0%) |
| 35 to 64 Years | 73 (20.7%) | 43 (8.6%) |
| 65 to 74 Years | 25 (18.0%) | 14 (8.9%) |
| 75 Years and over | 22 (50.0%) | 21 (22.3%) |
Disability Class: Vision Difficulty
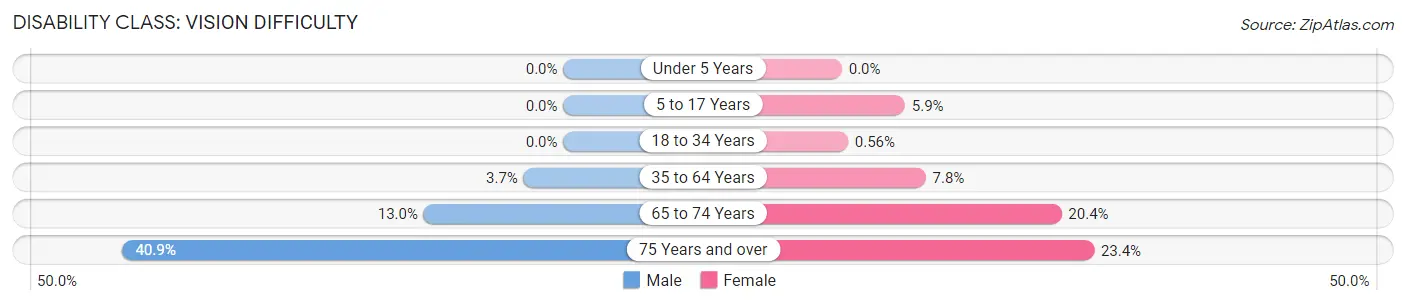
| Age Bracket | Male | Female |
| Under 5 Years | 0 (0.0%) | 0 (0.0%) |
| 5 to 17 Years | 0 (0.0%) | 11 (5.9%) |
| 18 to 34 Years | 0 (0.0%) | 1 (0.6%) |
| 35 to 64 Years | 13 (3.7%) | 39 (7.8%) |
| 65 to 74 Years | 18 (13.0%) | 32 (20.4%) |
| 75 Years and over | 18 (40.9%) | 22 (23.4%) |
Disability Class: Cognitive Difficulty
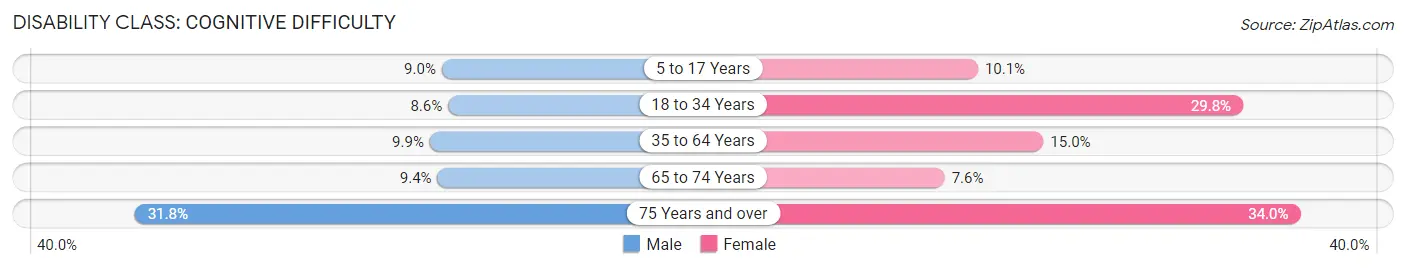
| Age Bracket | Male | Female |
| 5 to 17 Years | 14 (9.0%) | 19 (10.1%) |
| 18 to 34 Years | 25 (8.6%) | 53 (29.8%) |
| 35 to 64 Years | 35 (9.9%) | 75 (15.0%) |
| 65 to 74 Years | 13 (9.3%) | 12 (7.6%) |
| 75 Years and over | 14 (31.8%) | 32 (34.0%) |
Disability Class: Ambulatory Difficulty
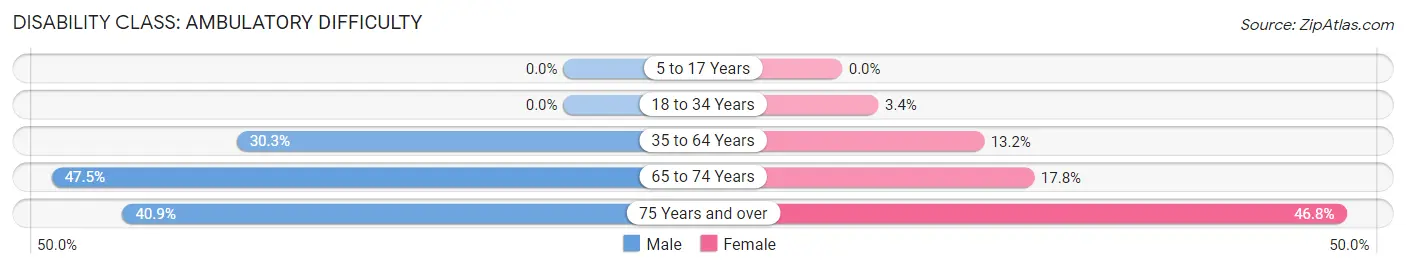
| Age Bracket | Male | Female |
| 5 to 17 Years | 0 (0.0%) | 0 (0.0%) |
| 18 to 34 Years | 0 (0.0%) | 6 (3.4%) |
| 35 to 64 Years | 107 (30.3%) | 66 (13.2%) |
| 65 to 74 Years | 66 (47.5%) | 28 (17.8%) |
| 75 Years and over | 18 (40.9%) | 44 (46.8%) |
Disability Class: Self-Care Difficulty
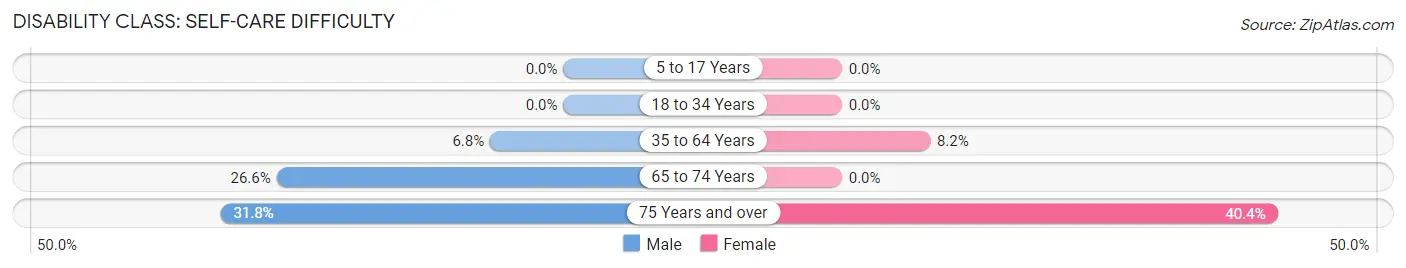
| Age Bracket | Male | Female |
| 5 to 17 Years | 0 (0.0%) | 0 (0.0%) |
| 18 to 34 Years | 0 (0.0%) | 0 (0.0%) |
| 35 to 64 Years | 24 (6.8%) | 41 (8.2%) |
| 65 to 74 Years | 37 (26.6%) | 0 (0.0%) |
| 75 Years and over | 14 (31.8%) | 38 (40.4%) |
Technology Access in Albany
Computing Device Access in Albany
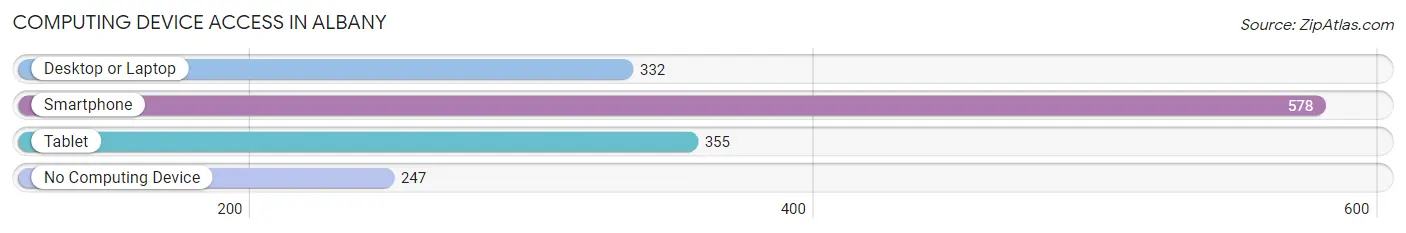
| Device Type | # Households | % Households |
| Desktop or Laptop | 332 | 37.1% |
| Smartphone | 578 | 64.6% |
| Tablet | 355 | 39.7% |
| No Computing Device | 247 | 27.6% |
| Total | 894 | 100.0% |
Internet Access in Albany
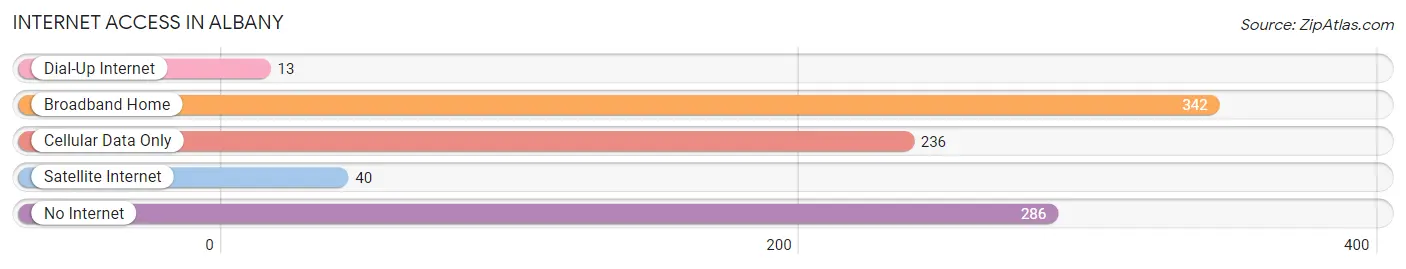
| Internet Type | # Households | % Households |
| Dial-Up Internet | 13 | 1.5% |
| Broadband Home | 342 | 38.3% |
| Cellular Data Only | 236 | 26.4% |
| Satellite Internet | 40 | 4.5% |
| No Internet | 286 | 32.0% |
| Total | 894 | 100.0% |
Albany Summary
Albany, Kentucky is a small city located in Clinton County in the south-central part of the state. It is situated on the banks of the Cumberland River, and is the county seat of Clinton County. The city has a population of approximately 2,000 people, and is part of the larger Bowling Green metropolitan area.
History
Albany was first settled in the early 1800s by a group of settlers from Virginia. The town was originally known as “Cumberland Crossing”, and was later renamed “Albany” after the city of Albany, New York. The town was officially incorporated in 1837.
During the Civil War, Albany was a major supply center for the Confederate Army. The town was also the site of a major battle in 1862, when Union forces attempted to capture the city. The Union forces were ultimately unsuccessful, and the city remained in Confederate hands until the end of the war.
In the late 19th century, Albany experienced a period of growth and prosperity. The city was home to several large businesses, including a flour mill, a sawmill, and a tobacco warehouse. The city also had a thriving riverboat trade, and was a popular stop for steamboats traveling up and down the Cumberland River.
Geography
Albany is located in south-central Kentucky, in Clinton County. The city is situated on the banks of the Cumberland River, and is surrounded by rolling hills and farmland. The city is located approximately 50 miles south of Louisville, and is part of the larger Bowling Green metropolitan area.
The climate in Albany is humid subtropical, with hot, humid summers and mild winters. The average annual temperature is around 60 degrees Fahrenheit, and the average annual precipitation is around 45 inches.
Economy
Albany’s economy is largely based on agriculture and tourism. The city is home to several large farms, and is a popular destination for outdoor recreation. The city is also home to several small businesses, including restaurants, shops, and other services.
The city is also home to a number of manufacturing companies, including a furniture factory and a plastics plant. The city is also home to a number of government offices, including the Clinton County Courthouse and the Clinton County Sheriff’s Office.
Demographics
As of the 2010 census, Albany had a population of 2,000 people. The racial makeup of the city was 95.2% White, 2.2% African American, 0.7% Native American, 0.3% Asian, and 1.6% from other races. The median household income was $30,000, and the median family income was $35,000.
Conclusion
Albany, Kentucky is a small city located in Clinton County in the south-central part of the state. It is situated on the banks of the Cumberland River, and is the county seat of Clinton County. The city has a population of approximately 2,000 people, and is part of the larger Bowling Green metropolitan area. The city’s economy is largely based on agriculture and tourism, and it is home to several large farms and manufacturing companies. The city is also home to a number of government offices, and the racial makeup of the city is 95.2% White, 2.2% African American, 0.7% Native American, 0.3% Asian, and 1.6% from other races.
Common Questions
What is Per Capita Income in Albany?
Per Capita income in Albany is $22,092.
What is the Median Family Income in Albany?
Median Family Income in Albany is $40,846.
What is the Median Household income in Albany?
Median Household Income in Albany is $39,167.
What is Income or Wage Gap in Albany?
Income or Wage Gap in Albany is 31.8%.
Women in Albany earn 68.2 cents for every dollar earned by a man.
What is Inequality or Gini Index in Albany?
Inequality or Gini Index in Albany is 0.46.
What is the Total Population of Albany?
Total Population of Albany is 2,264.
What is the Total Male Population of Albany?
Total Male Population of Albany is 1,057.
What is the Total Female Population of Albany?
Total Female Population of Albany is 1,207.
What is the Ratio of Males per 100 Females in Albany?
There are 87.57 Males per 100 Females in Albany.
What is the Ratio of Females per 100 Males in Albany?
There are 114.19 Females per 100 Males in Albany.
What is the Median Population Age in Albany?
Median Population Age in Albany is 44.2 Years.
What is the Average Family Size in Albany
Average Family Size in Albany is 3.2 People.
What is the Average Household Size in Albany
Average Household Size in Albany is 2.4 People.
How Large is the Labor Force in Albany?
There are 998 People in the Labor Forcein in Albany.
What is the Percentage of People in the Labor Force in Albany?
52.7% of People are in the Labor Force in Albany.
What is the Unemployment Rate in Albany?
Unemployment Rate in Albany is 5.6%.