Zip Codes with the Highest Percentage of Population Employed in Security & Protection in Owensboro, KY
RELATED REPORTS & OPTIONS
Security & Protection
Owensboro
Compare Zip Codes
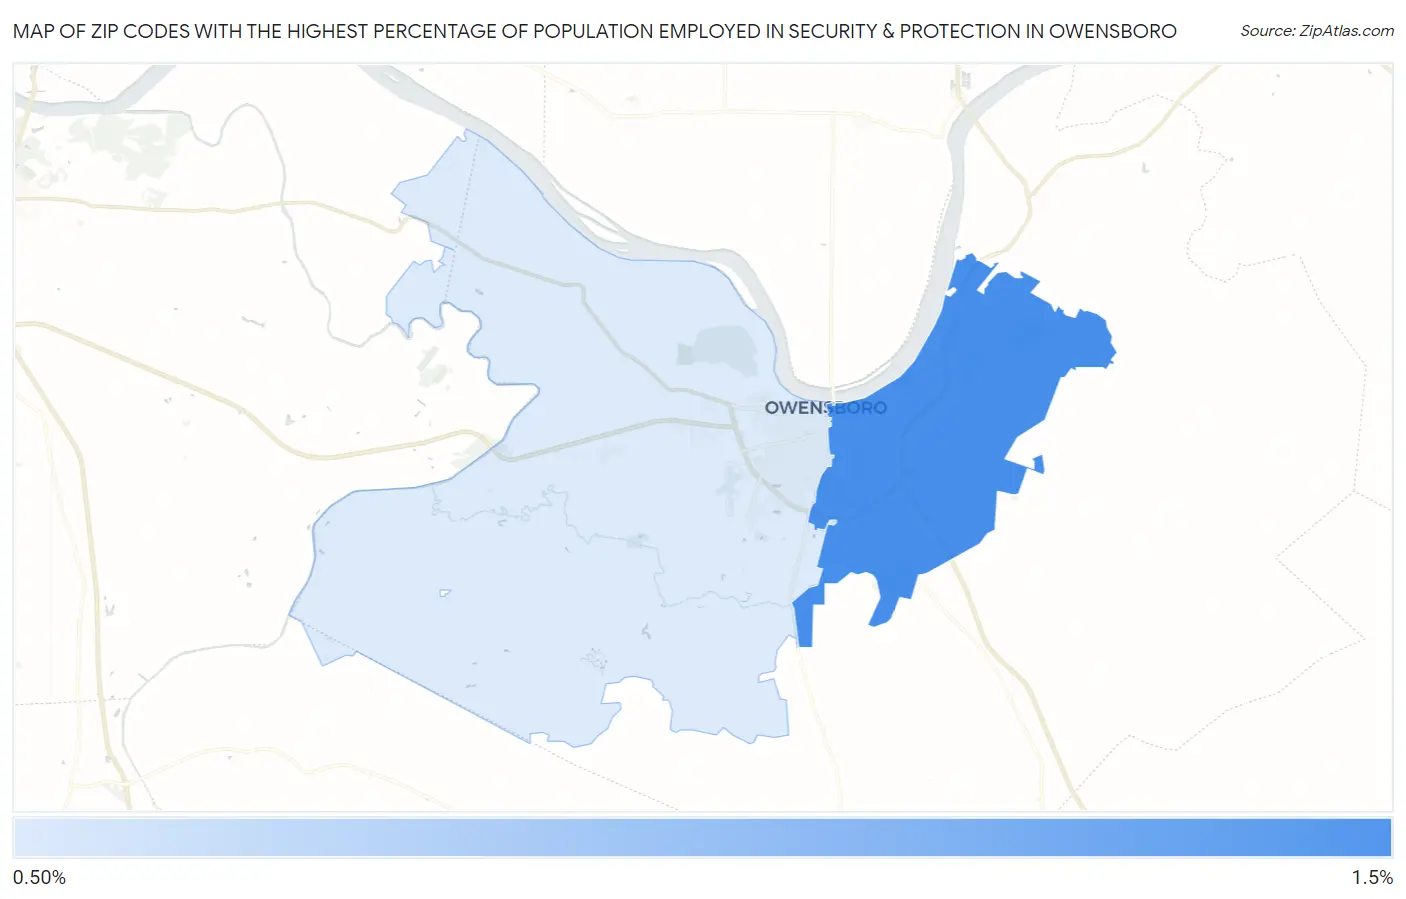
Map of Zip Codes with the Highest Percentage of Population Employed in Security & Protection in Owensboro
0.97%
1.3%
Zip Codes with the Highest Percentage of Population Employed in Security & Protection in Owensboro, KY
| Zip Code | % Employed | vs State | vs National | |
| 1. | 42303 | 1.3% | 2.0%(-0.711)#338 | 2.1%(-0.847)#17,727 |
| 2. | 42301 | 0.97% | 2.0%(-1.04)#379 | 2.1%(-1.18)#20,264 |
1
Common Questions
What are the Top Zip Codes with the Highest Percentage of Population Employed in Security & Protection in Owensboro, KY?
Top Zip Codes with the Highest Percentage of Population Employed in Security & Protection in Owensboro, KY are:
What zip code has the Highest Percentage of Population Employed in Security & Protection in Owensboro, KY?
42303 has the Highest Percentage of Population Employed in Security & Protection in Owensboro, KY with 1.3%.
What is the Percentage of Population Employed in Security & Protection in Owensboro, KY?
Percentage of Population Employed in Security & Protection in Owensboro is 1.2%.
What is the Percentage of Population Employed in Security & Protection in Kentucky?
Percentage of Population Employed in Security & Protection in Kentucky is 2.0%.
What is the Percentage of Population Employed in Security & Protection in the United States?
Percentage of Population Employed in Security & Protection in the United States is 2.1%.