Zip Codes with the Highest Percentage of Population Employed in Security & Protection in Kentucky
RELATED REPORTS & OPTIONS
Security & Protection
Kentucky
Compare Zip Codes
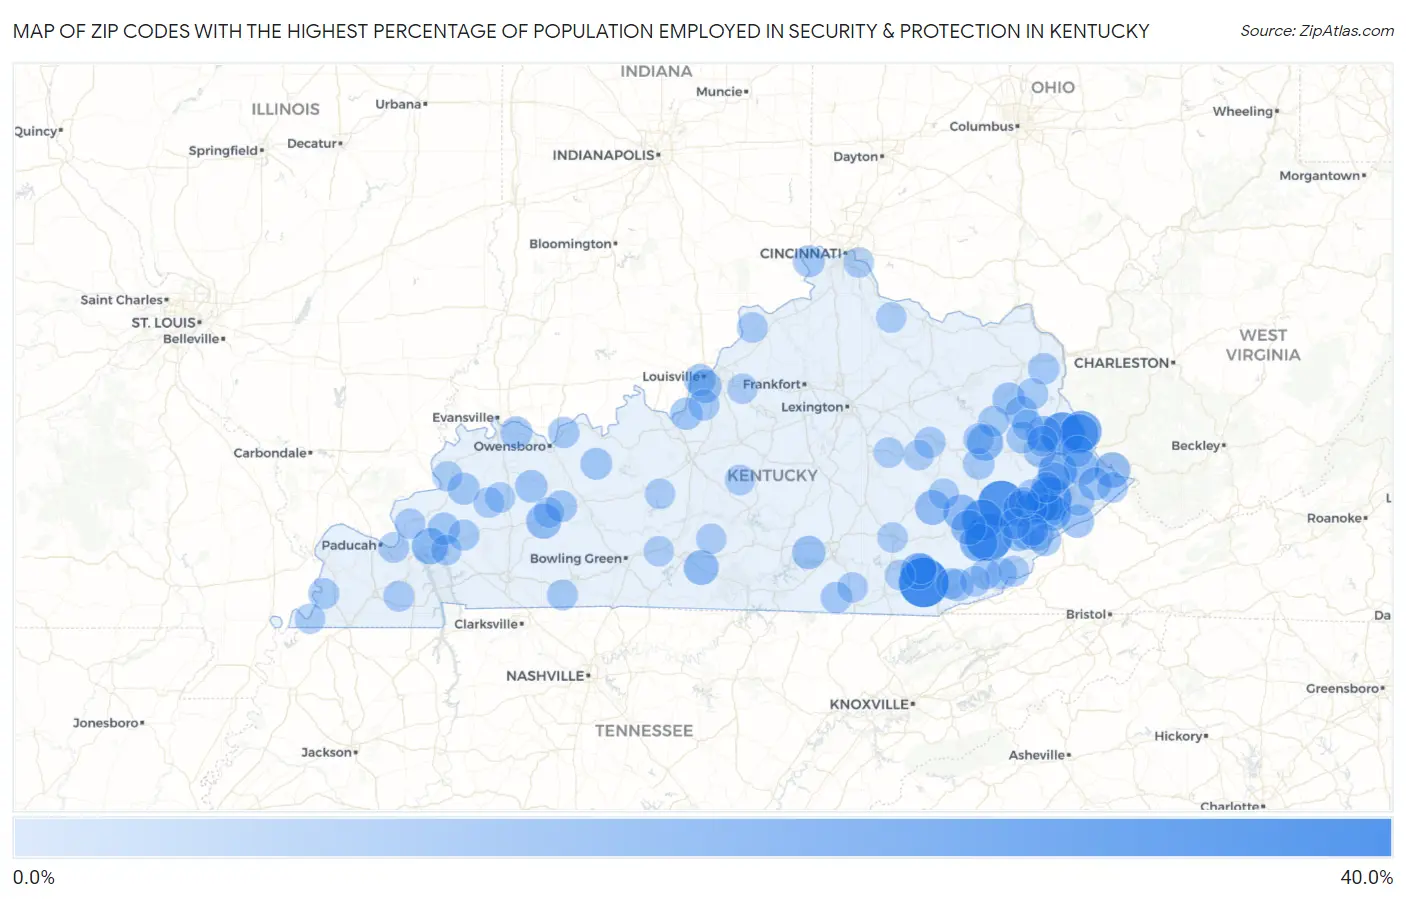
Map of Zip Codes with the Highest Percentage of Population Employed in Security & Protection in Kentucky
0.0%
40.0%
Zip Codes with the Highest Percentage of Population Employed in Security & Protection in Kentucky
| Zip Code | % Employed | vs State | vs National | |
| 1. | 40903 | 39.5% | 2.0%(+37.4)#1 | 2.1%(+37.3)#57 |
| 2. | 41764 | 33.9% | 2.0%(+31.9)#2 | 2.1%(+31.8)#73 |
| 3. | 41712 | 33.3% | 2.0%(+31.3)#3 | 2.1%(+31.2)#77 |
| 4. | 41636 | 27.5% | 2.0%(+25.5)#4 | 2.1%(+25.3)#113 |
| 5. | 41262 | 27.2% | 2.0%(+25.2)#5 | 2.1%(+25.1)#115 |
| 6. | 41723 | 23.3% | 2.0%(+21.3)#6 | 2.1%(+21.1)#144 |
| 7. | 41267 | 22.8% | 2.0%(+20.8)#7 | 2.1%(+20.7)#152 |
| 8. | 41203 | 20.7% | 2.0%(+18.7)#8 | 2.1%(+18.6)#183 |
| 9. | 41642 | 19.2% | 2.0%(+17.2)#9 | 2.1%(+17.0)#218 |
| 10. | 41775 | 17.8% | 2.0%(+15.8)#10 | 2.1%(+15.6)#260 |
| 11. | 40949 | 15.6% | 2.0%(+13.6)#11 | 2.1%(+13.5)#334 |
| 12. | 41667 | 15.5% | 2.0%(+13.4)#12 | 2.1%(+13.3)#340 |
| 13. | 41408 | 14.9% | 2.0%(+12.9)#13 | 2.1%(+12.7)#367 |
| 14. | 42055 | 14.9% | 2.0%(+12.8)#14 | 2.1%(+12.7)#368 |
| 15. | 41822 | 14.8% | 2.0%(+12.8)#15 | 2.1%(+12.7)#369 |
| 16. | 41571 | 14.1% | 2.0%(+12.1)#16 | 2.1%(+12.0)#408 |
| 17. | 41721 | 14.1% | 2.0%(+12.1)#17 | 2.1%(+12.0)#410 |
| 18. | 41263 | 13.6% | 2.0%(+11.6)#18 | 2.1%(+11.4)#439 |
| 19. | 41544 | 13.4% | 2.0%(+11.4)#19 | 2.1%(+11.3)#450 |
| 20. | 41862 | 13.4% | 2.0%(+11.4)#20 | 2.1%(+11.3)#453 |
| 21. | 42367 | 12.8% | 2.0%(+10.8)#21 | 2.1%(+10.7)#488 |
| 22. | 41749 | 12.6% | 2.0%(+10.5)#22 | 2.1%(+10.4)#501 |
| 23. | 42130 | 12.4% | 2.0%(+10.4)#23 | 2.1%(+10.2)#520 |
| 24. | 40983 | 12.1% | 2.0%(+10.1)#24 | 2.1%(+9.92)#546 |
| 25. | 41826 | 11.6% | 2.0%(+9.54)#25 | 2.1%(+9.40)#592 |
| 26. | 42544 | 9.6% | 2.0%(+7.63)#26 | 2.1%(+7.50)#811 |
| 27. | 41669 | 9.6% | 2.0%(+7.61)#27 | 2.1%(+7.48)#813 |
| 28. | 40209 | 9.6% | 2.0%(+7.56)#28 | 2.1%(+7.43)#826 |
| 29. | 41615 | 9.2% | 2.0%(+7.19)#29 | 2.1%(+7.05)#879 |
| 30. | 41512 | 9.1% | 2.0%(+7.13)#30 | 2.1%(+7.00)#885 |
| 31. | 41539 | 8.9% | 2.0%(+6.85)#31 | 2.1%(+6.71)#941 |
| 32. | 41216 | 8.3% | 2.0%(+6.24)#32 | 2.1%(+6.10)#1,084 |
| 33. | 41171 | 8.2% | 2.0%(+6.21)#33 | 2.1%(+6.07)#1,092 |
| 34. | 41159 | 8.1% | 2.0%(+6.13)#34 | 2.1%(+5.99)#1,113 |
| 35. | 42371 | 8.0% | 2.0%(+6.01)#35 | 2.1%(+5.87)#1,159 |
| 36. | 42411 | 7.9% | 2.0%(+5.85)#36 | 2.1%(+5.72)#1,217 |
| 37. | 41804 | 7.8% | 2.0%(+5.80)#37 | 2.1%(+5.66)#1,234 |
| 38. | 40845 | 7.8% | 2.0%(+5.80)#38 | 2.1%(+5.66)#1,235 |
| 39. | 41844 | 7.7% | 2.0%(+5.64)#39 | 2.1%(+5.50)#1,276 |
| 40. | 40177 | 7.6% | 2.0%(+5.61)#40 | 2.1%(+5.48)#1,284 |
| 41. | 41858 | 7.3% | 2.0%(+5.29)#41 | 2.1%(+5.16)#1,397 |
| 42. | 42463 | 7.3% | 2.0%(+5.26)#42 | 2.1%(+5.12)#1,410 |
| 43. | 40210 | 7.2% | 2.0%(+5.15)#43 | 2.1%(+5.02)#1,459 |
| 44. | 42451 | 7.1% | 2.0%(+5.13)#44 | 2.1%(+4.99)#1,472 |
| 45. | 41238 | 7.1% | 2.0%(+5.10)#45 | 2.1%(+4.97)#1,485 |
| 46. | 41837 | 7.1% | 2.0%(+5.06)#46 | 2.1%(+4.93)#1,504 |
| 47. | 42343 | 7.0% | 2.0%(+4.94)#47 | 2.1%(+4.81)#1,554 |
| 48. | 41824 | 6.9% | 2.0%(+4.87)#48 | 2.1%(+4.73)#1,589 |
| 49. | 41080 | 6.8% | 2.0%(+4.80)#49 | 2.1%(+4.67)#1,625 |
| 50. | 42369 | 6.7% | 2.0%(+4.65)#50 | 2.1%(+4.52)#1,707 |
| 51. | 41385 | 6.6% | 2.0%(+4.62)#51 | 2.1%(+4.49)#1,720 |
| 52. | 41839 | 6.5% | 2.0%(+4.53)#52 | 2.1%(+4.39)#1,772 |
| 53. | 41562 | 6.5% | 2.0%(+4.47)#53 | 2.1%(+4.33)#1,790 |
| 54. | 41168 | 6.4% | 2.0%(+4.38)#54 | 2.1%(+4.25)#1,831 |
| 55. | 41250 | 6.2% | 2.0%(+4.17)#55 | 2.1%(+4.03)#1,964 |
| 56. | 40828 | 6.1% | 2.0%(+4.09)#56 | 2.1%(+3.96)#2,010 |
| 57. | 42355 | 6.0% | 2.0%(+4.00)#57 | 2.1%(+3.86)#2,070 |
| 58. | 42647 | 6.0% | 2.0%(+3.99)#58 | 2.1%(+3.85)#2,079 |
| 59. | 40109 | 5.8% | 2.0%(+3.78)#59 | 2.1%(+3.64)#2,216 |
| 60. | 40380 | 5.8% | 2.0%(+3.77)#60 | 2.1%(+3.64)#2,219 |
| 61. | 41180 | 5.7% | 2.0%(+3.70)#61 | 2.1%(+3.57)#2,275 |
| 62. | 42445 | 5.7% | 2.0%(+3.70)#62 | 2.1%(+3.56)#2,286 |
| 63. | 40958 | 5.5% | 2.0%(+3.52)#63 | 2.1%(+3.39)#2,428 |
| 64. | 41472 | 5.5% | 2.0%(+3.46)#64 | 2.1%(+3.33)#2,472 |
| 65. | 41219 | 5.4% | 2.0%(+3.42)#65 | 2.1%(+3.28)#2,509 |
| 66. | 41619 | 5.4% | 2.0%(+3.37)#66 | 2.1%(+3.24)#2,555 |
| 67. | 40806 | 5.4% | 2.0%(+3.35)#67 | 2.1%(+3.22)#2,572 |
| 68. | 42032 | 5.3% | 2.0%(+3.32)#68 | 2.1%(+3.18)#2,603 |
| 69. | 42265 | 5.3% | 2.0%(+3.30)#69 | 2.1%(+3.16)#2,634 |
| 70. | 41240 | 5.2% | 2.0%(+3.21)#70 | 2.1%(+3.08)#2,691 |
| 71. | 41352 | 5.2% | 2.0%(+3.18)#71 | 2.1%(+3.05)#2,715 |
| 72. | 42054 | 5.2% | 2.0%(+3.17)#72 | 2.1%(+3.03)#2,729 |
| 73. | 40927 | 5.1% | 2.0%(+3.11)#73 | 2.1%(+2.97)#2,795 |
| 74. | 41759 | 5.0% | 2.0%(+3.01)#74 | 2.1%(+2.87)#2,902 |
| 75. | 41553 | 5.0% | 2.0%(+2.95)#75 | 2.1%(+2.81)#2,974 |
| 76. | 42058 | 4.9% | 2.0%(+2.93)#76 | 2.1%(+2.79)#2,998 |
| 77. | 40006 | 4.9% | 2.0%(+2.88)#77 | 2.1%(+2.75)#3,050 |
| 78. | 40824 | 4.9% | 2.0%(+2.84)#78 | 2.1%(+2.71)#3,102 |
| 79. | 42330 | 4.9% | 2.0%(+2.84)#79 | 2.1%(+2.70)#3,106 |
| 80. | 42038 | 4.8% | 2.0%(+2.75)#80 | 2.1%(+2.61)#3,224 |
| 81. | 40923 | 4.7% | 2.0%(+2.72)#81 | 2.1%(+2.58)#3,259 |
| 82. | 42653 | 4.7% | 2.0%(+2.69)#82 | 2.1%(+2.55)#3,299 |
| 83. | 41314 | 4.6% | 2.0%(+2.63)#83 | 2.1%(+2.50)#3,380 |
| 84. | 40060 | 4.6% | 2.0%(+2.60)#84 | 2.1%(+2.46)#3,420 |
| 85. | 42441 | 4.6% | 2.0%(+2.59)#85 | 2.1%(+2.45)#3,438 |
| 86. | 41831 | 4.6% | 2.0%(+2.59)#86 | 2.1%(+2.45)#3,451 |
| 87. | 42028 | 4.6% | 2.0%(+2.58)#87 | 2.1%(+2.44)#3,467 |
| 88. | 40472 | 4.5% | 2.0%(+2.50)#88 | 2.1%(+2.37)#3,588 |
| 89. | 40771 | 4.5% | 2.0%(+2.48)#89 | 2.1%(+2.35)#3,618 |
| 90. | 42436 | 4.5% | 2.0%(+2.46)#90 | 2.1%(+2.33)#3,646 |
| 91. | 42214 | 4.4% | 2.0%(+2.43)#91 | 2.1%(+2.30)#3,697 |
| 92. | 41004 | 4.4% | 2.0%(+2.42)#92 | 2.1%(+2.28)#3,721 |
| 93. | 40741 | 4.4% | 2.0%(+2.38)#93 | 2.1%(+2.24)#3,795 |
| 94. | 40385 | 4.4% | 2.0%(+2.37)#94 | 2.1%(+2.24)#3,799 |
| 95. | 42171 | 4.4% | 2.0%(+2.36)#95 | 2.1%(+2.22)#3,824 |
| 96. | 41085 | 4.2% | 2.0%(+2.24)#96 | 2.1%(+2.10)#4,026 |
| 97. | 40023 | 4.2% | 2.0%(+2.24)#97 | 2.1%(+2.10)#4,031 |
| 98. | 42726 | 4.2% | 2.0%(+2.22)#98 | 2.1%(+2.08)#4,070 |
| 99. | 42459 | 4.2% | 2.0%(+2.19)#99 | 2.1%(+2.06)#4,115 |
| 100. | 42050 | 4.2% | 2.0%(+2.15)#100 | 2.1%(+2.02)#4,183 |
Common Questions
What are the Top 10 Zip Codes with the Highest Percentage of Population Employed in Security & Protection in Kentucky?
Top 10 Zip Codes with the Highest Percentage of Population Employed in Security & Protection in Kentucky are:
What zip code has the Highest Percentage of Population Employed in Security & Protection in Kentucky?
40903 has the Highest Percentage of Population Employed in Security & Protection in Kentucky with 39.5%.
What is the Percentage of Population Employed in Security & Protection in the State of Kentucky?
Percentage of Population Employed in Security & Protection in Kentucky is 2.0%.
What is the Percentage of Population Employed in Security & Protection in the United States?
Percentage of Population Employed in Security & Protection in the United States is 2.1%.