Evarts, KY Map & Demographics
Evarts Map
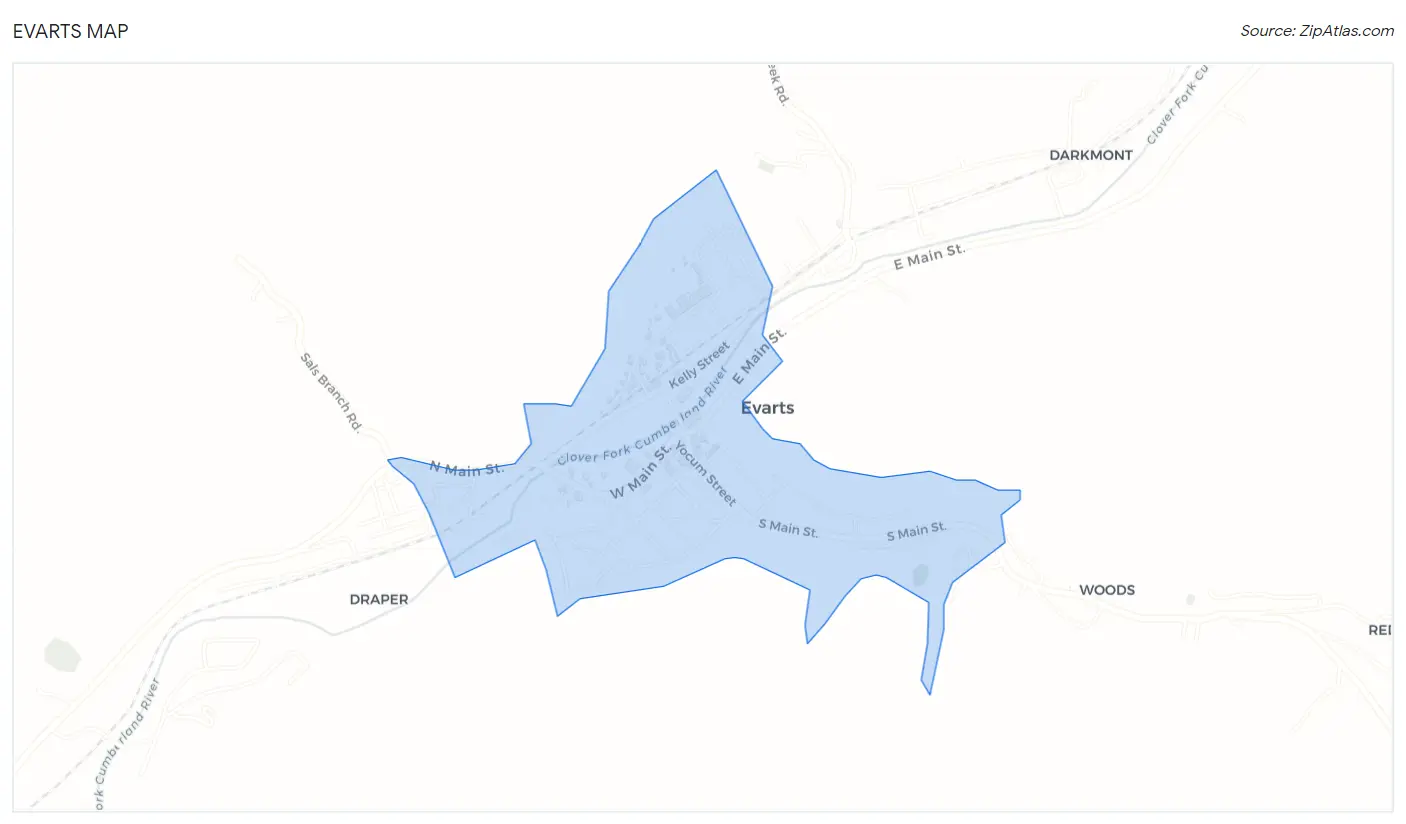
Evarts Overview
$14,220
PER CAPITA INCOME
$37,250
AVG FAMILY INCOME
$32,222
AVG HOUSEHOLD INCOME
0.37
INEQUALITY / GINI INDEX
874
TOTAL POPULATION
440
MALE POPULATION
434
FEMALE POPULATION
101.38
MALES / 100 FEMALES
98.64
FEMALES / 100 MALES
40.3
MEDIAN AGE
3.0
AVG FAMILY SIZE
2.7
AVG HOUSEHOLD SIZE
228
LABOR FORCE [ PEOPLE ]
30.9%
PERCENT IN LABOR FORCE
19.7%
UNEMPLOYMENT RATE
Evarts Zip Codes
Evarts Area Codes
Income in Evarts
Income Overview in Evarts
Per Capita Income in Evarts is $14,220, while median incomes of families and households are $37,250 and $32,222 respectively.
| Characteristic | Number | Measure |
| Per Capita Income | 874 | $14,220 |
| Median Family Income | 205 | $37,250 |
| Mean Family Income | 205 | $45,345 |
| Median Household Income | 250 | $32,222 |
| Mean Household Income | 250 | $41,336 |
| Income Deficit | 205 | $0 |
| Wage / Income Gap (%) | 874 | 0.00% |
| Wage / Income Gap ($) | 874 | 100.00¢ per $1 |
| Gini / Inequality Index | 874 | 0.37 |
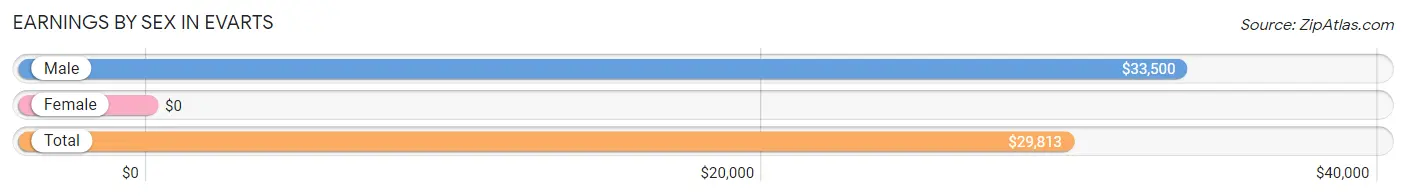
Earnings by Sex in Evarts
| Sex | Number | Average Earnings |
| Male | 126 (58.6%) | $33,500 |
| Female | 89 (41.4%) | $0 |
| Total | 215 (100.0%) | $29,813 |
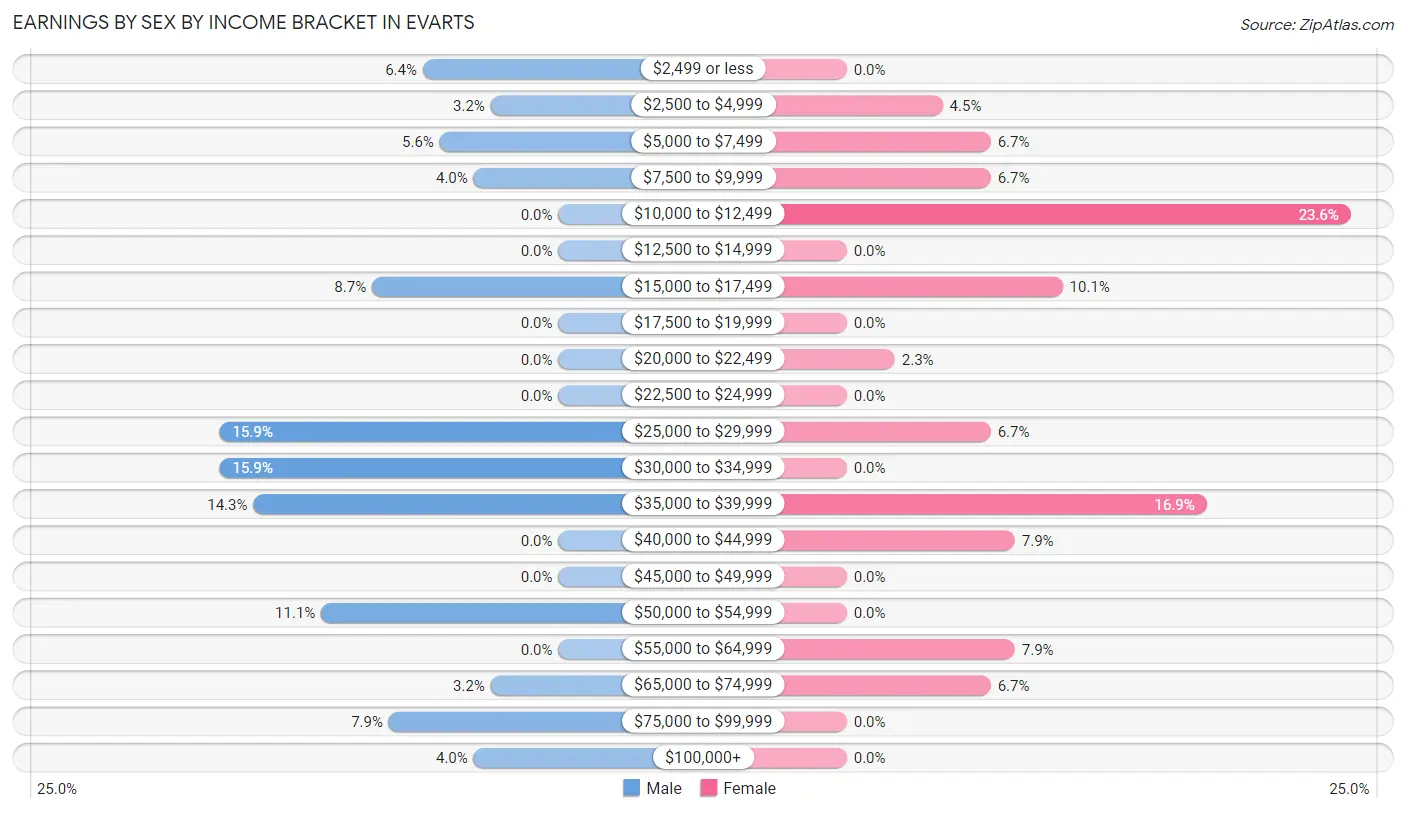
Earnings by Sex by Income Bracket in Evarts
The most common earnings brackets in Evarts are $25,000 to $29,999 for men (20 | 15.9%) and $10,000 to $12,499 for women (21 | 23.6%).
| Income | Male | Female |
| $2,499 or less | 8 (6.4%) | 0 (0.0%) |
| $2,500 to $4,999 | 4 (3.2%) | 4 (4.5%) |
| $5,000 to $7,499 | 7 (5.6%) | 6 (6.7%) |
| $7,500 to $9,999 | 5 (4.0%) | 6 (6.7%) |
| $10,000 to $12,499 | 0 (0.0%) | 21 (23.6%) |
| $12,500 to $14,999 | 0 (0.0%) | 0 (0.0%) |
| $15,000 to $17,499 | 11 (8.7%) | 9 (10.1%) |
| $17,500 to $19,999 | 0 (0.0%) | 0 (0.0%) |
| $20,000 to $22,499 | 0 (0.0%) | 2 (2.2%) |
| $22,500 to $24,999 | 0 (0.0%) | 0 (0.0%) |
| $25,000 to $29,999 | 20 (15.9%) | 6 (6.7%) |
| $30,000 to $34,999 | 20 (15.9%) | 0 (0.0%) |
| $35,000 to $39,999 | 18 (14.3%) | 15 (16.9%) |
| $40,000 to $44,999 | 0 (0.0%) | 7 (7.9%) |
| $45,000 to $49,999 | 0 (0.0%) | 0 (0.0%) |
| $50,000 to $54,999 | 14 (11.1%) | 0 (0.0%) |
| $55,000 to $64,999 | 0 (0.0%) | 7 (7.9%) |
| $65,000 to $74,999 | 4 (3.2%) | 6 (6.7%) |
| $75,000 to $99,999 | 10 (7.9%) | 0 (0.0%) |
| $100,000+ | 5 (4.0%) | 0 (0.0%) |
| Total | 126 (100.0%) | 89 (100.0%) |
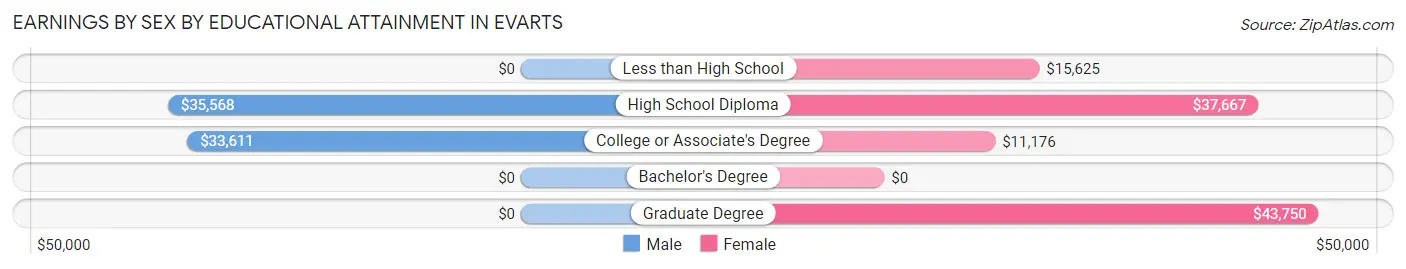
Earnings by Sex by Educational Attainment in Evarts
| Educational Attainment | Male Income | Female Income |
| Less than High School | - | - |
| High School Diploma | $35,568 | $37,667 |
| College or Associate's Degree | $33,611 | $11,176 |
| Bachelor's Degree | - | - |
| Graduate Degree | - | - |
| Total | $34,563 | $0 |
Family Income in Evarts
Family Income Brackets in Evarts
According to the Evarts family income data, there are 56 families falling into the $35,000 to $49,999 income range, which is the most common income bracket and makes up 27.3% of all families.
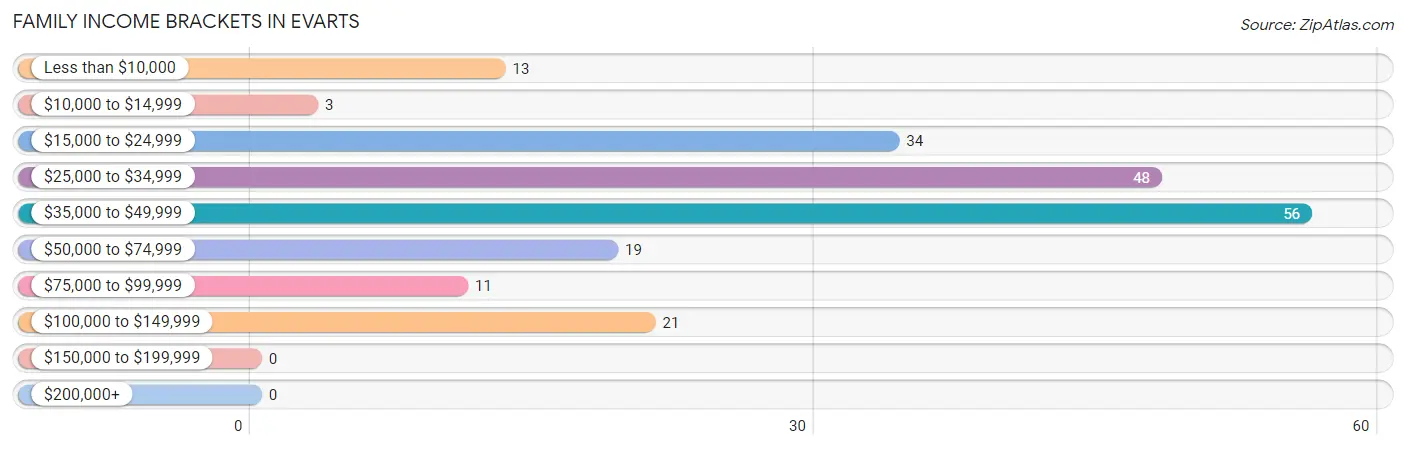
| Income Bracket | # Families | % Families |
| Less than $10,000 | 13 | 6.3% |
| $10,000 to $14,999 | 3 | 1.5% |
| $15,000 to $24,999 | 34 | 16.6% |
| $25,000 to $34,999 | 48 | 23.4% |
| $35,000 to $49,999 | 56 | 27.3% |
| $50,000 to $74,999 | 19 | 9.3% |
| $75,000 to $99,999 | 11 | 5.4% |
| $100,000 to $149,999 | 21 | 10.2% |
| $150,000 to $199,999 | 0 | 0.0% |
| $200,000+ | 0 | 0.0% |
Family Income by Famaliy Size in Evarts
2-person families (111 | 54.1%) account for the highest median family income in Evarts with $37,574 per family, while 2-person families (111 | 54.1%) have the highest median income of $18,787 per family member.
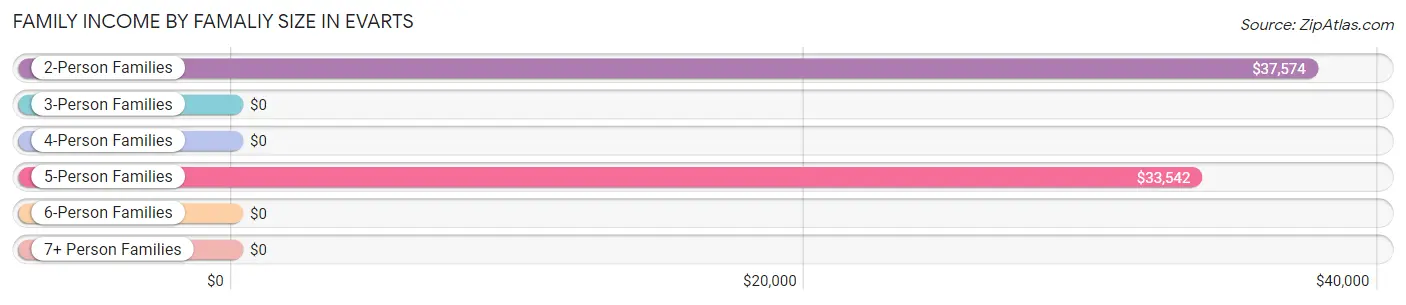
| Income Bracket | # Families | Median Income |
| 2-Person Families | 111 (54.1%) | $37,574 |
| 3-Person Families | 47 (22.9%) | $0 |
| 4-Person Families | 30 (14.6%) | $0 |
| 5-Person Families | 17 (8.3%) | $33,542 |
| 6-Person Families | 0 (0.0%) | $0 |
| 7+ Person Families | 0 (0.0%) | $0 |
| Total | 205 (100.0%) | $37,250 |
Family Income by Number of Earners in Evarts
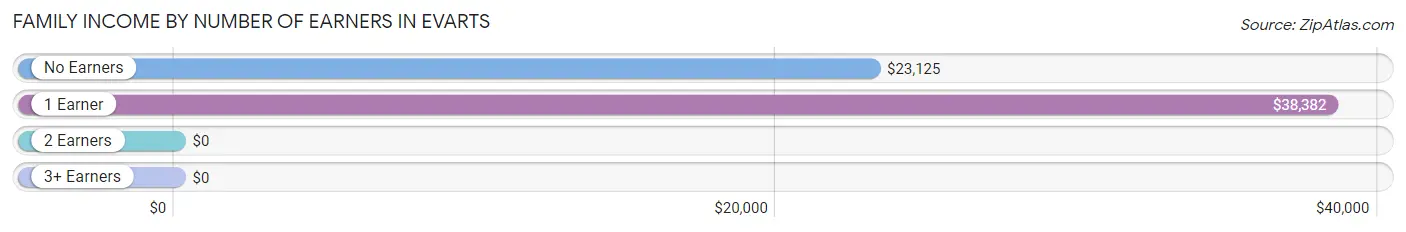
| Number of Earners | # Families | Median Income |
| No Earners | 73 (35.6%) | $23,125 |
| 1 Earner | 98 (47.8%) | $38,382 |
| 2 Earners | 25 (12.2%) | $0 |
| 3+ Earners | 9 (4.4%) | $0 |
| Total | 205 (100.0%) | $37,250 |
Household Income in Evarts
Household Income Brackets in Evarts
With 62 households falling in the category, the $35,000 to $49,999 income range is the most frequent in Evarts, accounting for 24.8% of all households.
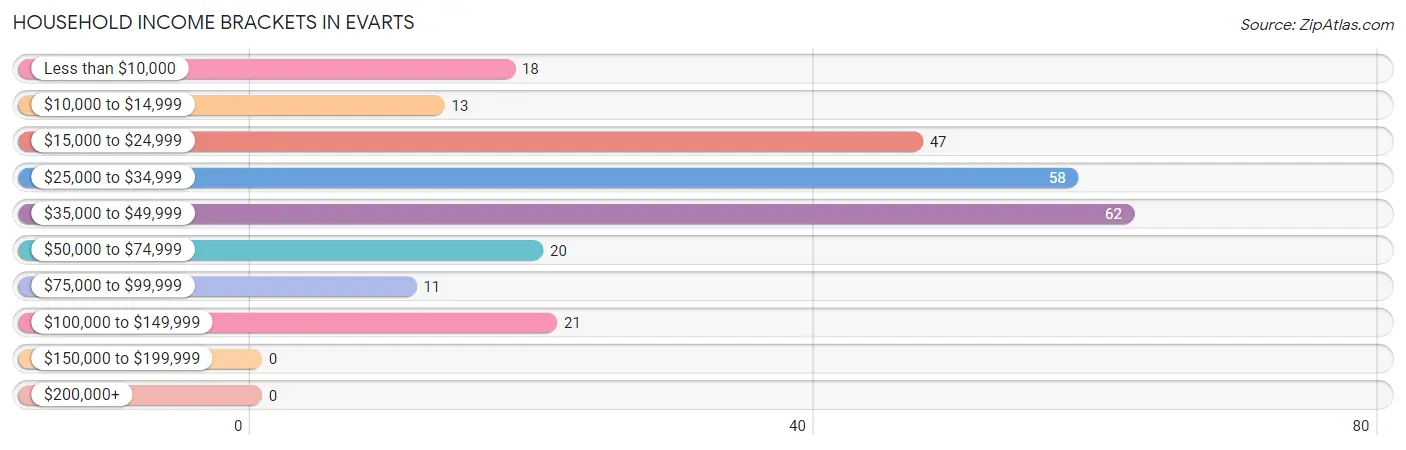
| Income Bracket | # Households | % Households |
| Less than $10,000 | 18 | 7.2% |
| $10,000 to $14,999 | 13 | 5.2% |
| $15,000 to $24,999 | 47 | 18.8% |
| $25,000 to $34,999 | 58 | 23.2% |
| $35,000 to $49,999 | 62 | 24.8% |
| $50,000 to $74,999 | 20 | 8.0% |
| $75,000 to $99,999 | 11 | 4.4% |
| $100,000 to $149,999 | 21 | 8.4% |
| $150,000 to $199,999 | 0 | 0.0% |
| $200,000+ | 0 | 0.0% |
Household Income by Householder Age in Evarts
The median household income in Evarts is $32,222, with the highest median household income of $40,962 found in the 65+ years age bracket for the primary householder. A total of 56 households (22.4%) fall into this category.
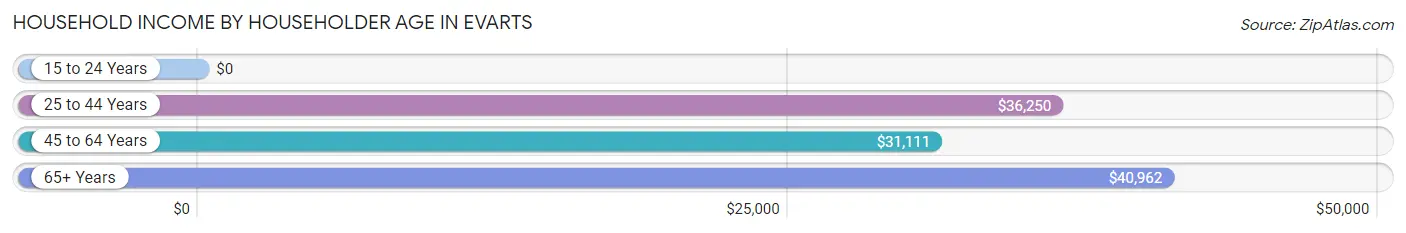
| Income Bracket | # Households | Median Income |
| 15 to 24 Years | 0 (0.0%) | $0 |
| 25 to 44 Years | 68 (27.2%) | $36,250 |
| 45 to 64 Years | 126 (50.4%) | $31,111 |
| 65+ Years | 56 (22.4%) | $40,962 |
| Total | 250 (100.0%) | $32,222 |
Poverty in Evarts
Income Below Poverty by Sex and Age in Evarts
With 22.6% poverty level for males and 34.1% for females among the residents of Evarts, under 5 year old males and 15 year old females are the most vulnerable to poverty, with 11 males (100.0%) and 2 females (100.0%) in their respective age groups living below the poverty level.
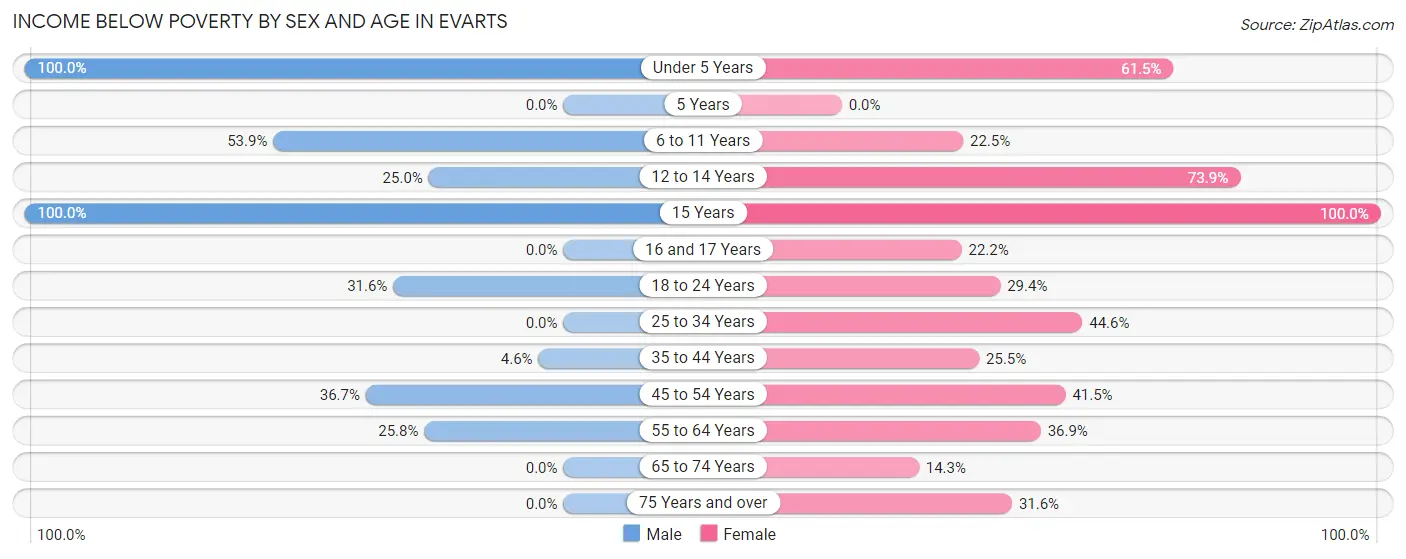
| Age Bracket | Male | Female |
| Under 5 Years | 11 (100.0%) | 8 (61.5%) |
| 5 Years | 0 (0.0%) | 0 (0.0%) |
| 6 to 11 Years | 7 (53.8%) | 9 (22.5%) |
| 12 to 14 Years | 2 (25.0%) | 17 (73.9%) |
| 15 Years | 3 (100.0%) | 2 (100.0%) |
| 16 and 17 Years | 0 (0.0%) | 2 (22.2%) |
| 18 to 24 Years | 6 (31.6%) | 5 (29.4%) |
| 25 to 34 Years | 0 (0.0%) | 25 (44.6%) |
| 35 to 44 Years | 3 (4.6%) | 13 (25.5%) |
| 45 to 54 Years | 22 (36.7%) | 22 (41.5%) |
| 55 to 64 Years | 8 (25.8%) | 24 (36.9%) |
| 65 to 74 Years | 0 (0.0%) | 5 (14.3%) |
| 75 Years and over | 0 (0.0%) | 6 (31.6%) |
| Total | 62 (22.6%) | 138 (34.1%) |
Income Above Poverty by Sex and Age in Evarts
According to the poverty statistics in Evarts, males aged 16 and 17 years and females aged 5 years are the age groups that are most secure financially, with 100.0% of males and 100.0% of females in these age groups living above the poverty line.
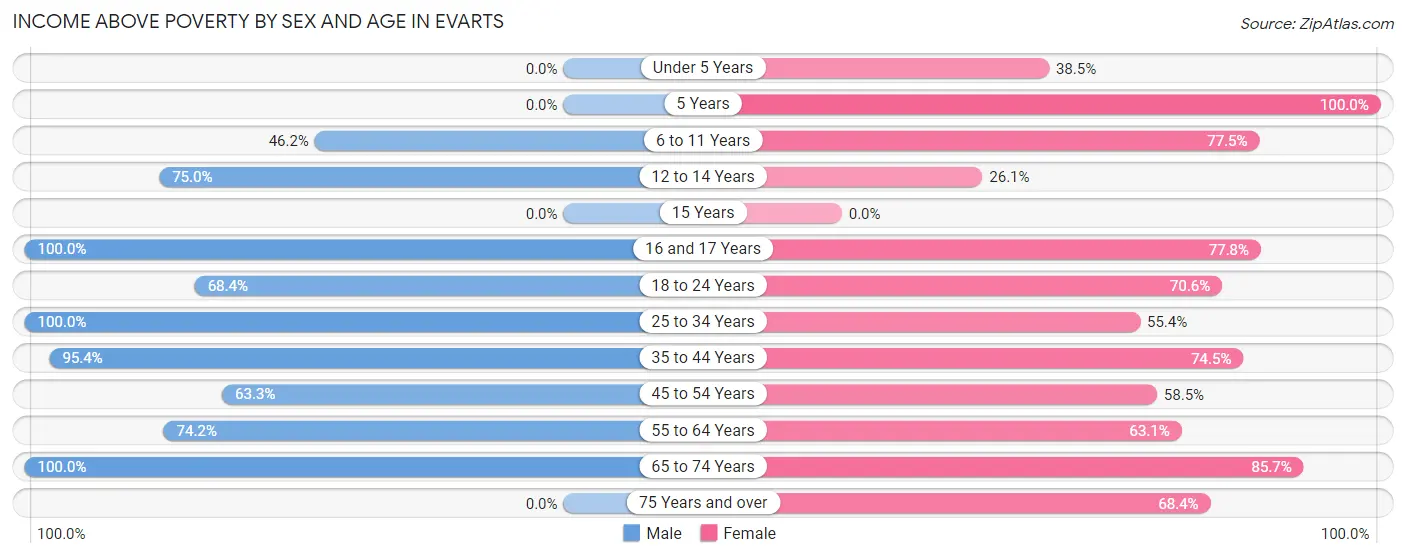
| Age Bracket | Male | Female |
| Under 5 Years | 0 (0.0%) | 5 (38.5%) |
| 5 Years | 0 (0.0%) | 22 (100.0%) |
| 6 to 11 Years | 6 (46.2%) | 31 (77.5%) |
| 12 to 14 Years | 6 (75.0%) | 6 (26.1%) |
| 15 Years | 0 (0.0%) | 0 (0.0%) |
| 16 and 17 Years | 5 (100.0%) | 7 (77.8%) |
| 18 to 24 Years | 13 (68.4%) | 12 (70.6%) |
| 25 to 34 Years | 13 (100.0%) | 31 (55.4%) |
| 35 to 44 Years | 62 (95.4%) | 38 (74.5%) |
| 45 to 54 Years | 38 (63.3%) | 31 (58.5%) |
| 55 to 64 Years | 23 (74.2%) | 41 (63.1%) |
| 65 to 74 Years | 46 (100.0%) | 30 (85.7%) |
| 75 Years and over | 0 (0.0%) | 13 (68.4%) |
| Total | 212 (77.4%) | 267 (65.9%) |
Income Below Poverty Among Married-Couple Families in Evarts
The poverty statistics for married-couple families in Evarts show that 14.6% or 20 of the total 137 families live below the poverty line. Families with 3 or 4 children have the highest poverty rate of 100.0%, comprising of 6 families. On the other hand, families with no children have the lowest poverty rate of 4.2%, which includes 3 families.
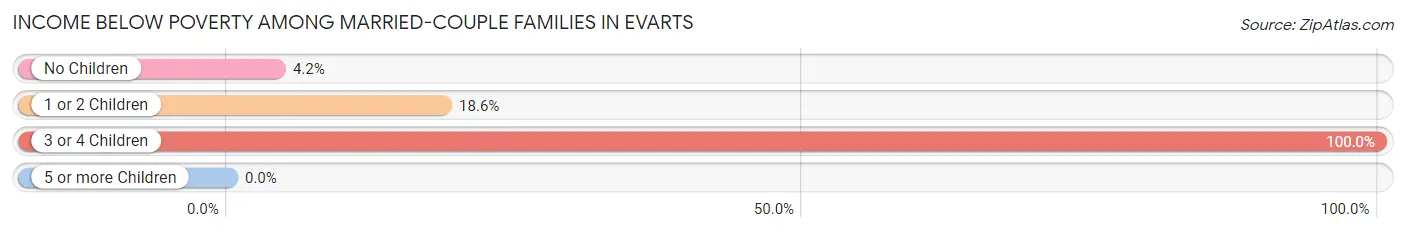
| Children | Above Poverty | Below Poverty |
| No Children | 69 (95.8%) | 3 (4.2%) |
| 1 or 2 Children | 48 (81.4%) | 11 (18.6%) |
| 3 or 4 Children | 0 (0.0%) | 6 (100.0%) |
| 5 or more Children | 0 (0.0%) | 0 (0.0%) |
| Total | 117 (85.4%) | 20 (14.6%) |
Income Below Poverty Among Single-Parent Households in Evarts
According to the poverty data in Evarts, 33.3% or 5 single-father households and 45.3% or 24 single-mother households are living below the poverty line. Among single-father households, those with 1 or 2 children have the highest poverty rate, with 5 households (55.6%) experiencing poverty. Likewise, among single-mother households, those with 3 or 4 children have the highest poverty rate, with 3 households (100.0%) falling below the poverty line.
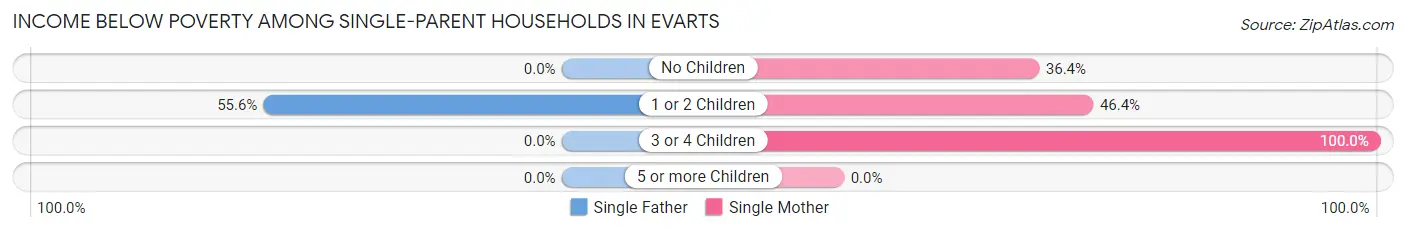
| Children | Single Father | Single Mother |
| No Children | 0 (0.0%) | 8 (36.4%) |
| 1 or 2 Children | 5 (55.6%) | 13 (46.4%) |
| 3 or 4 Children | 0 (0.0%) | 3 (100.0%) |
| 5 or more Children | 0 (0.0%) | 0 (0.0%) |
| Total | 5 (33.3%) | 24 (45.3%) |
Income Below Poverty Among Married-Couple vs Single-Parent Households in Evarts
The poverty data for Evarts shows that 20 of the married-couple family households (14.6%) and 29 of the single-parent households (42.6%) are living below the poverty level. Within the married-couple family households, those with 3 or 4 children have the highest poverty rate, with 6 households (100.0%) falling below the poverty line. Among the single-parent households, those with 3 or 4 children have the highest poverty rate, with 3 household (100.0%) living below poverty.
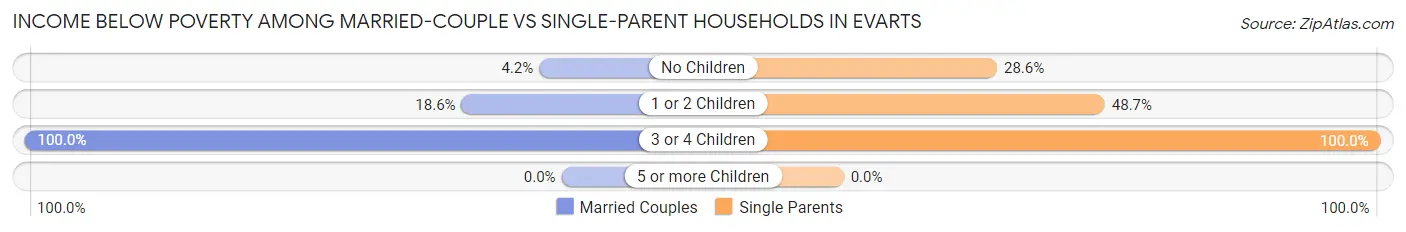
| Children | Married-Couple Families | Single-Parent Households |
| No Children | 3 (4.2%) | 8 (28.6%) |
| 1 or 2 Children | 11 (18.6%) | 18 (48.6%) |
| 3 or 4 Children | 6 (100.0%) | 3 (100.0%) |
| 5 or more Children | 0 (0.0%) | 0 (0.0%) |
| Total | 20 (14.6%) | 29 (42.6%) |
Race in Evarts
The most populous races in Evarts are White / Caucasian (816 | 93.4%), Two or more Races (28 | 3.2%), and Black / African American (16 | 1.8%).
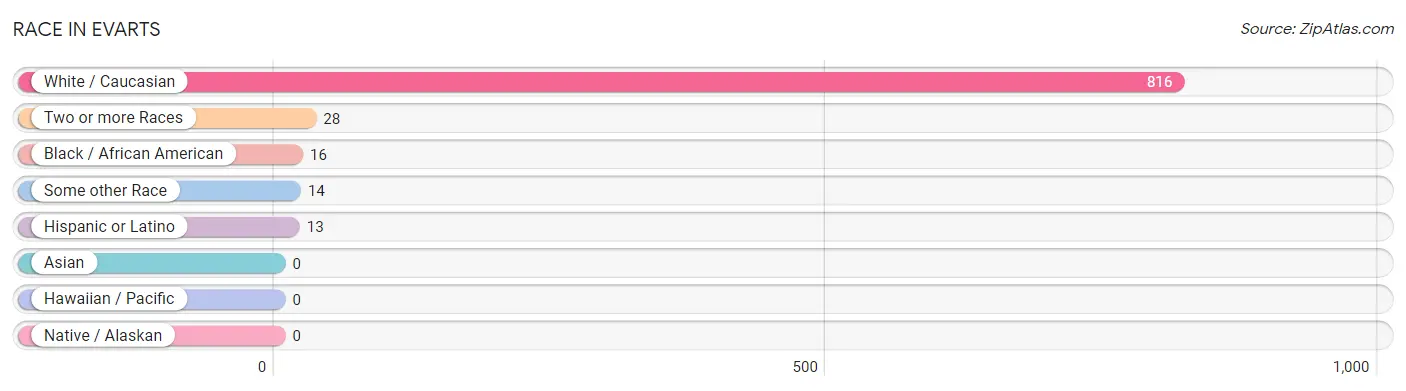
| Race | # Population | % Population |
| Asian | 0 | 0.0% |
| Black / African American | 16 | 1.8% |
| Hawaiian / Pacific | 0 | 0.0% |
| Hispanic or Latino | 13 | 1.5% |
| Native / Alaskan | 0 | 0.0% |
| White / Caucasian | 816 | 93.4% |
| Two or more Races | 28 | 3.2% |
| Some other Race | 14 | 1.6% |
| Total | 874 | 100.0% |
Ancestry in Evarts
The most populous ancestries reported in Evarts are Irish (102 | 11.7%), English (83 | 9.5%), German (76 | 8.7%), European (40 | 4.6%), and American (37 | 4.2%), together accounting for 38.7% of all Evarts residents.
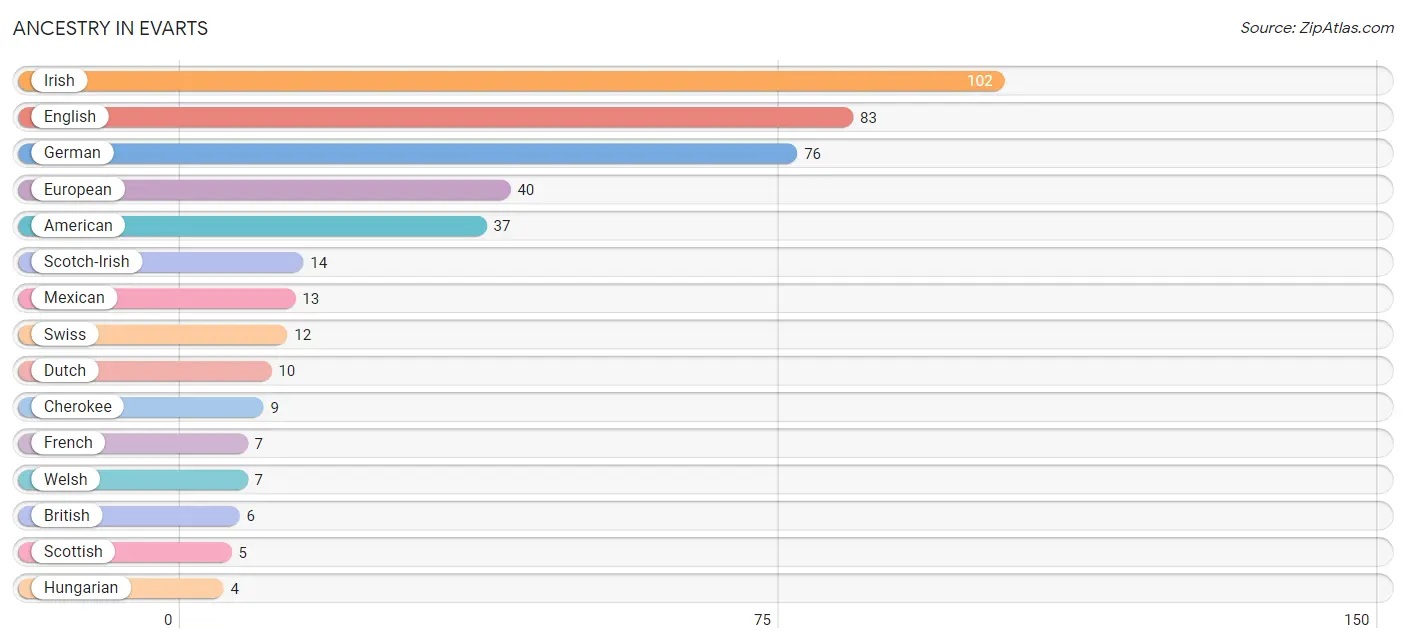
| Ancestry | # Population | % Population |
| American | 37 | 4.2% |
| British | 6 | 0.7% |
| Cherokee | 9 | 1.0% |
| Dutch | 10 | 1.1% |
| English | 83 | 9.5% |
| European | 40 | 4.6% |
| French | 7 | 0.8% |
| German | 76 | 8.7% |
| Hungarian | 4 | 0.5% |
| Irish | 102 | 11.7% |
| Mexican | 13 | 1.5% |
| Scotch-Irish | 14 | 1.6% |
| Scottish | 5 | 0.6% |
| Swiss | 12 | 1.4% |
| Welsh | 7 | 0.8% | View All 15 Rows |
Immigrants in Evarts
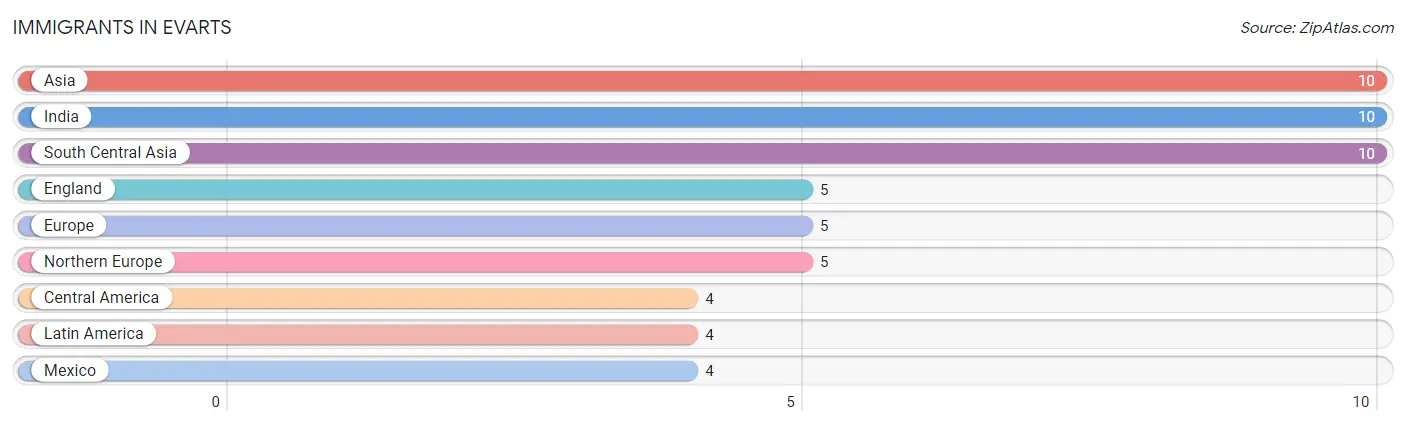
The most numerous immigrant groups reported in Evarts came from Asia (10 | 1.1%), India (10 | 1.1%), South Central Asia (10 | 1.1%), England (5 | 0.6%), and Europe (5 | 0.6%), together accounting for 4.6% of all Evarts residents.
| Immigration Origin | # Population | % Population |
| Asia | 10 | 1.1% |
| Central America | 4 | 0.5% |
| England | 5 | 0.6% |
| Europe | 5 | 0.6% |
| India | 10 | 1.1% |
| Latin America | 4 | 0.5% |
| Mexico | 4 | 0.5% |
| Northern Europe | 5 | 0.6% |
| South Central Asia | 10 | 1.1% | View All 9 Rows |
Sex and Age in Evarts
Sex and Age in Evarts
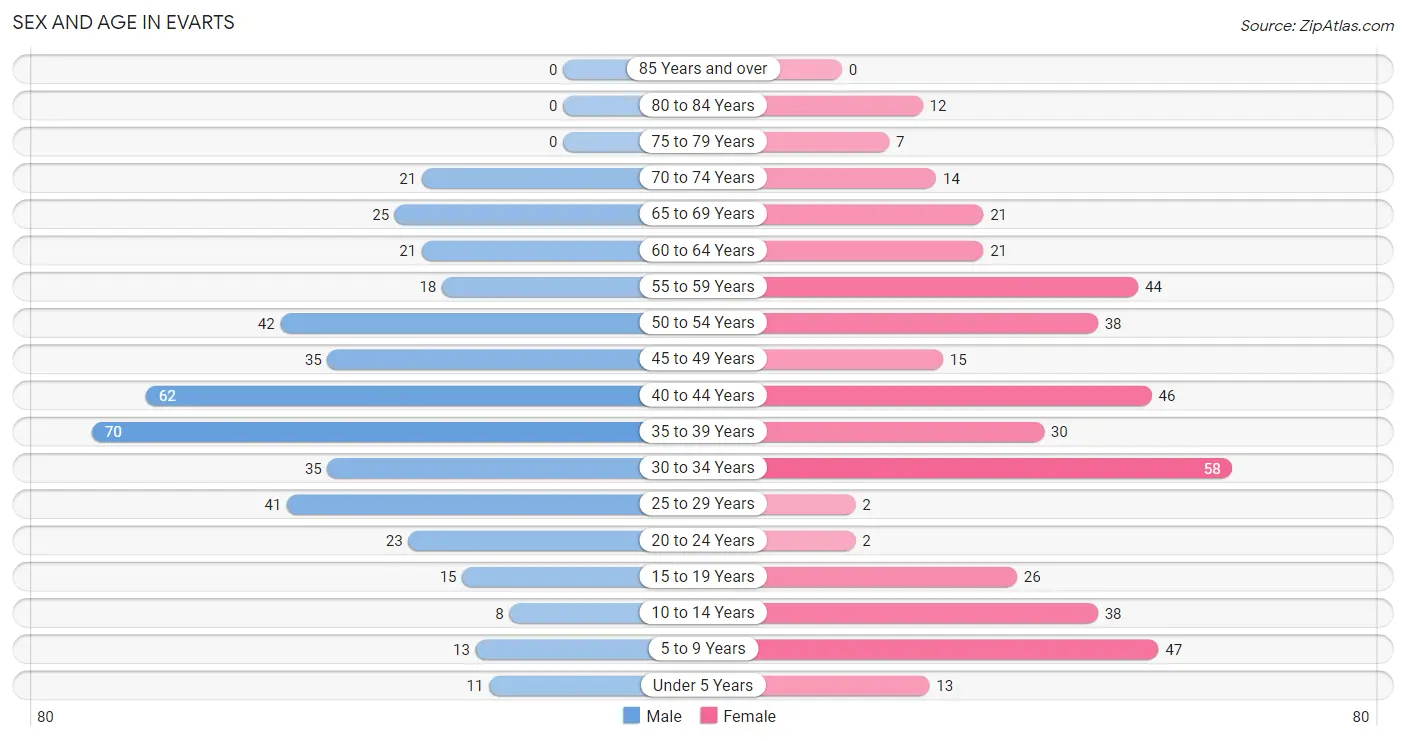
The most populous age groups in Evarts are 35 to 39 Years (70 | 15.9%) for men and 30 to 34 Years (58 | 13.4%) for women.
| Age Bracket | Male | Female |
| Under 5 Years | 11 (2.5%) | 13 (3.0%) |
| 5 to 9 Years | 13 (2.9%) | 47 (10.8%) |
| 10 to 14 Years | 8 (1.8%) | 38 (8.8%) |
| 15 to 19 Years | 15 (3.4%) | 26 (6.0%) |
| 20 to 24 Years | 23 (5.2%) | 2 (0.5%) |
| 25 to 29 Years | 41 (9.3%) | 2 (0.5%) |
| 30 to 34 Years | 35 (8.0%) | 58 (13.4%) |
| 35 to 39 Years | 70 (15.9%) | 30 (6.9%) |
| 40 to 44 Years | 62 (14.1%) | 46 (10.6%) |
| 45 to 49 Years | 35 (8.0%) | 15 (3.5%) |
| 50 to 54 Years | 42 (9.6%) | 38 (8.8%) |
| 55 to 59 Years | 18 (4.1%) | 44 (10.1%) |
| 60 to 64 Years | 21 (4.8%) | 21 (4.8%) |
| 65 to 69 Years | 25 (5.7%) | 21 (4.8%) |
| 70 to 74 Years | 21 (4.8%) | 14 (3.2%) |
| 75 to 79 Years | 0 (0.0%) | 7 (1.6%) |
| 80 to 84 Years | 0 (0.0%) | 12 (2.8%) |
| 85 Years and over | 0 (0.0%) | 0 (0.0%) |
| Total | 440 (100.0%) | 434 (100.0%) |
Families and Households in Evarts
Median Family Size in Evarts
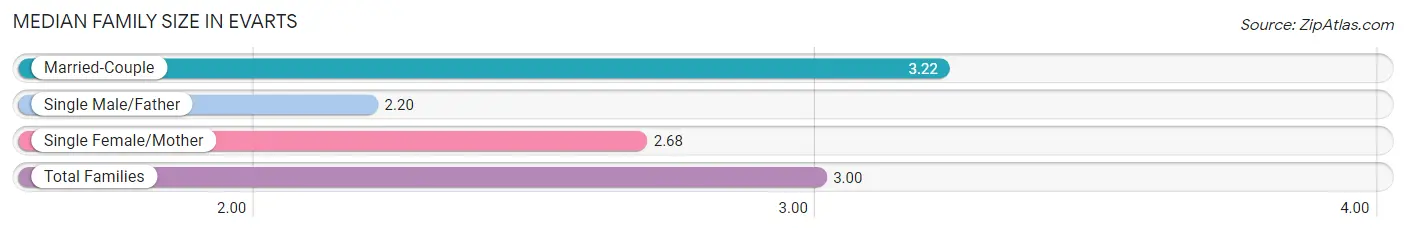
The median family size in Evarts is 3.00 persons per family, with married-couple families (137 | 66.8%) accounting for the largest median family size of 3.22 persons per family. On the other hand, single male/father families (15 | 7.3%) represent the smallest median family size with 2.20 persons per family.
| Family Type | # Families | Family Size |
| Married-Couple | 137 (66.8%) | 3.22 |
| Single Male/Father | 15 (7.3%) | 2.20 |
| Single Female/Mother | 53 (25.9%) | 2.68 |
| Total Families | 205 (100.0%) | 3.00 |
Median Household Size in Evarts
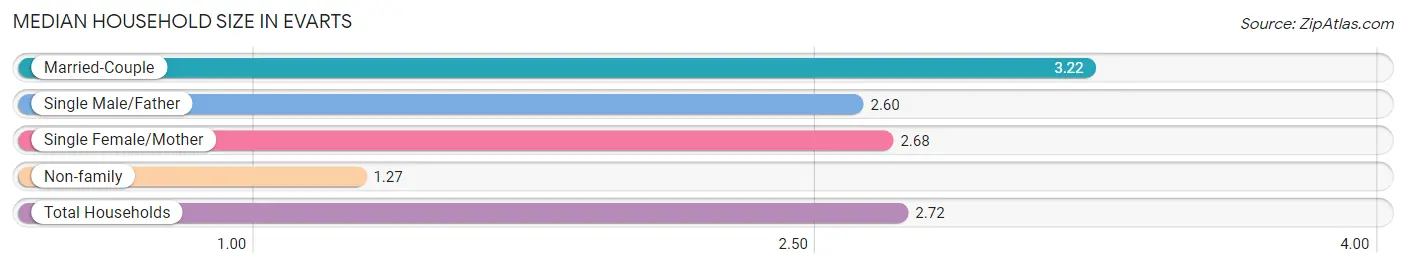
The median household size in Evarts is 2.72 persons per household, with married-couple households (137 | 54.8%) accounting for the largest median household size of 3.22 persons per household. non-family households (45 | 18.0%) represent the smallest median household size with 1.27 persons per household.
| Household Type | # Households | Household Size |
| Married-Couple | 137 (54.8%) | 3.22 |
| Single Male/Father | 15 (6.0%) | 2.60 |
| Single Female/Mother | 53 (21.2%) | 2.68 |
| Non-family | 45 (18.0%) | 1.27 |
| Total Households | 250 (100.0%) | 2.72 |
Household Size by Marriage Status in Evarts
Out of a total of 250 households in Evarts, 205 (82.0%) are family households, while 45 (18.0%) are nonfamily households. The most numerous type of family households are 2-person households, comprising 107, and the most common type of nonfamily households are 1-person households, comprising 38.
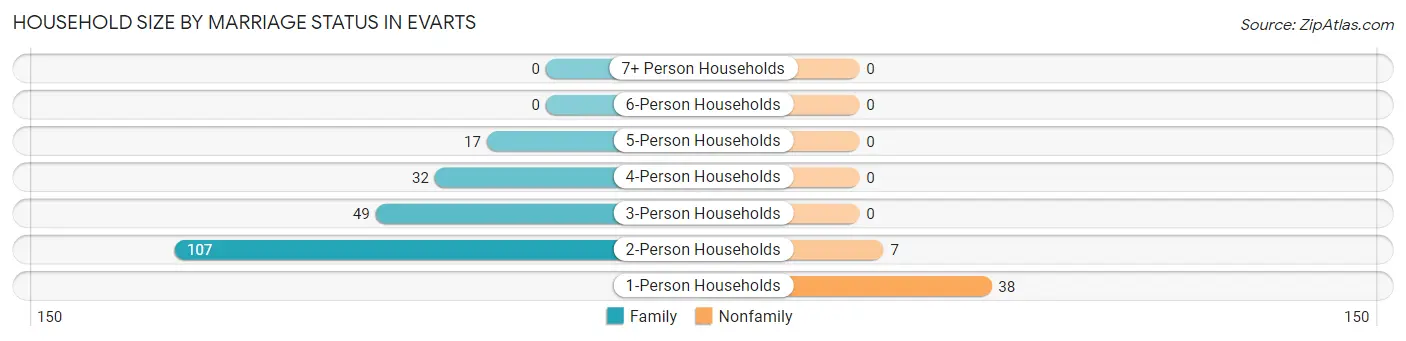
| Household Size | Family Households | Nonfamily Households |
| 1-Person Households | - | 38 (15.2%) |
| 2-Person Households | 107 (42.8%) | 7 (2.8%) |
| 3-Person Households | 49 (19.6%) | 0 (0.0%) |
| 4-Person Households | 32 (12.8%) | 0 (0.0%) |
| 5-Person Households | 17 (6.8%) | 0 (0.0%) |
| 6-Person Households | 0 (0.0%) | 0 (0.0%) |
| 7+ Person Households | 0 (0.0%) | 0 (0.0%) |
| Total | 205 (82.0%) | 45 (18.0%) |
Female Fertility in Evarts
Fertility by Age in Evarts
Average fertility rate in Evarts is 11.0 births per 1,000 women. Women in the age bracket of 35 to 50 years have the highest fertility rate with 21.0 births per 1,000 women. Women in the age bracket of 35 to 50 years acount for 100.0% of all women with births.
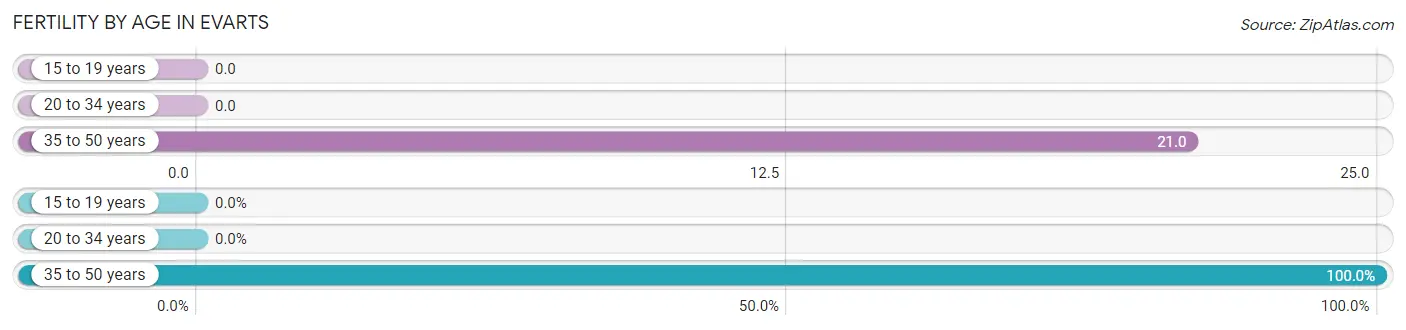
| Age Bracket | Women with Births | Births / 1,000 Women |
| 15 to 19 years | 0 (0.0%) | 0.0 |
| 20 to 34 years | 0 (0.0%) | 0.0 |
| 35 to 50 years | 2 (100.0%) | 21.0 |
| Total | 2 (100.0%) | 11.0 |
Fertility by Age by Marriage Status in Evarts
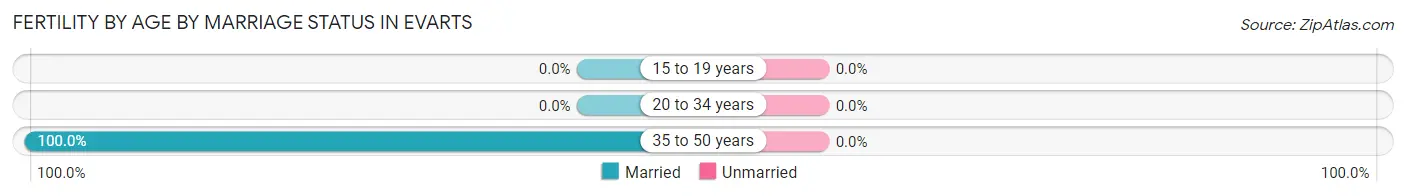
| Age Bracket | Married | Unmarried |
| 15 to 19 years | 0 (0.0%) | 0 (0.0%) |
| 20 to 34 years | 0 (0.0%) | 0 (0.0%) |
| 35 to 50 years | 2 (100.0%) | 0 (0.0%) |
| Total | 2 (100.0%) | 0 (0.0%) |
Fertility by Education in Evarts
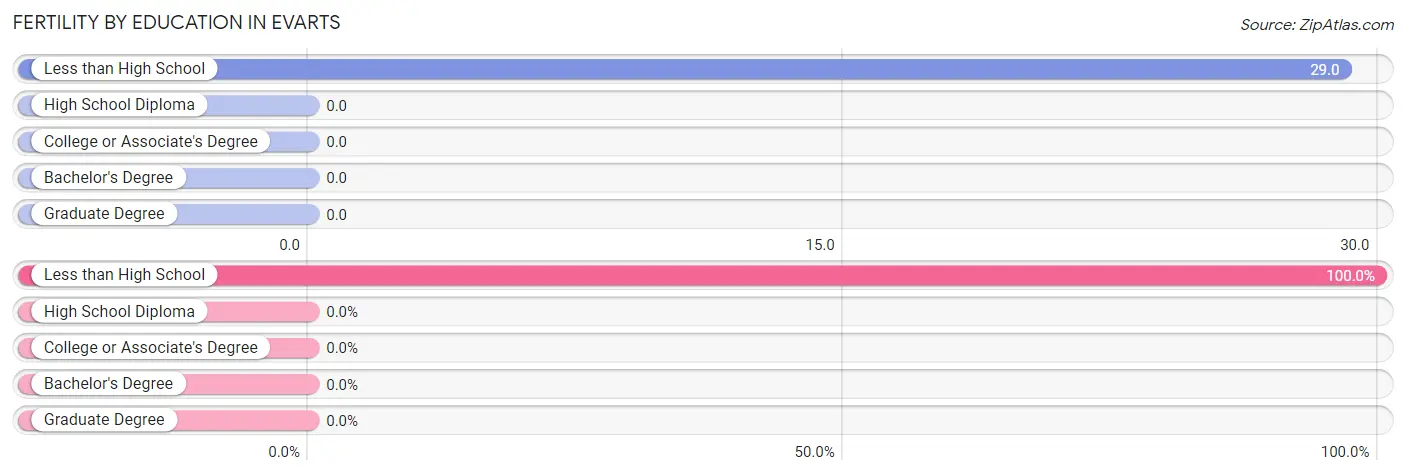
| Educational Attainment | Women with Births | Births / 1,000 Women |
| Less than High School | 2 (100.0%) | 29.0 |
| High School Diploma | 0 (0.0%) | 0.0 |
| College or Associate's Degree | 0 (0.0%) | 0.0 |
| Bachelor's Degree | 0 (0.0%) | 0.0 |
| Graduate Degree | 0 (0.0%) | 0.0 |
| Total | 2 (100.0%) | 11.0 |
Fertility by Education by Marriage Status in Evarts
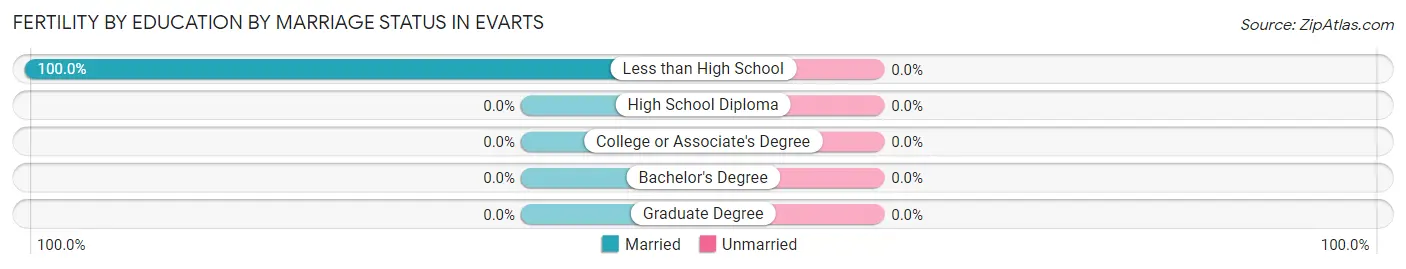
| Educational Attainment | Married | Unmarried |
| Less than High School | 2 (100.0%) | 0 (0.0%) |
| High School Diploma | 0 (0.0%) | 0 (0.0%) |
| College or Associate's Degree | 0 (0.0%) | 0 (0.0%) |
| Bachelor's Degree | 0 (0.0%) | 0 (0.0%) |
| Graduate Degree | 0 (0.0%) | 0 (0.0%) |
| Total | 2 (100.0%) | 0 (0.0%) |
Employment Characteristics in Evarts
Employment by Class of Employer in Evarts
Among the 172 employed individuals in Evarts, private company employees (89 | 51.7%), not-for-profit organizations (22 | 12.8%), and local government employees (22 | 12.8%) make up the most common classes of employment.
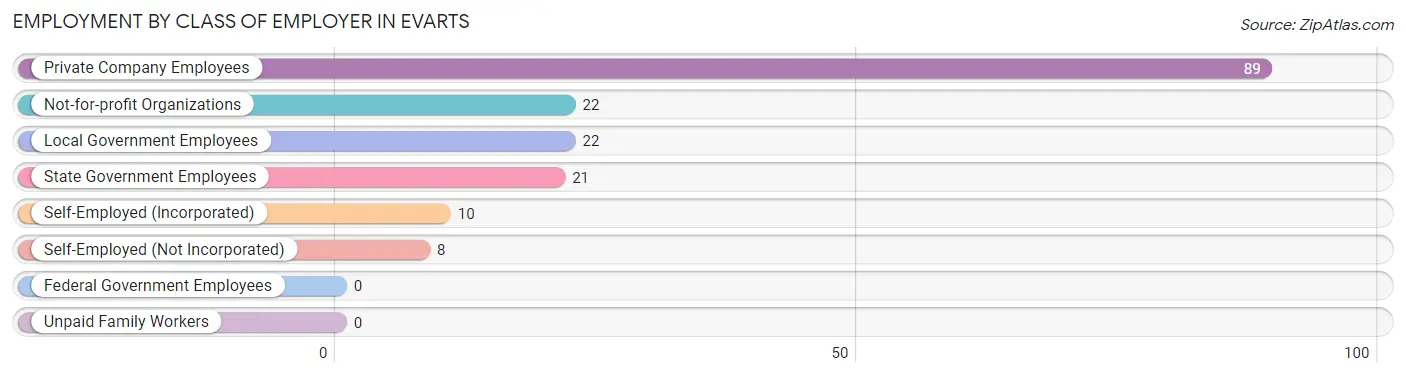
| Employer Class | # Employees | % Employees |
| Private Company Employees | 89 | 51.7% |
| Self-Employed (Incorporated) | 10 | 5.8% |
| Self-Employed (Not Incorporated) | 8 | 4.6% |
| Not-for-profit Organizations | 22 | 12.8% |
| Local Government Employees | 22 | 12.8% |
| State Government Employees | 21 | 12.2% |
| Federal Government Employees | 0 | 0.0% |
| Unpaid Family Workers | 0 | 0.0% |
| Total | 172 | 100.0% |
Employment Status by Age in Evarts
According to the labor force statistics for Evarts, out of the total population over 16 years of age (739), 30.9% or 228 individuals are in the labor force, with 19.7% or 45 of them unemployed. The age group with the highest labor force participation rate is 45 to 54 years, with 50.8% or 66 individuals in the labor force. Within the labor force, the 16 to 19 years age range has the highest percentage of unemployed individuals, with 71.4% or 10 of them being unemployed.
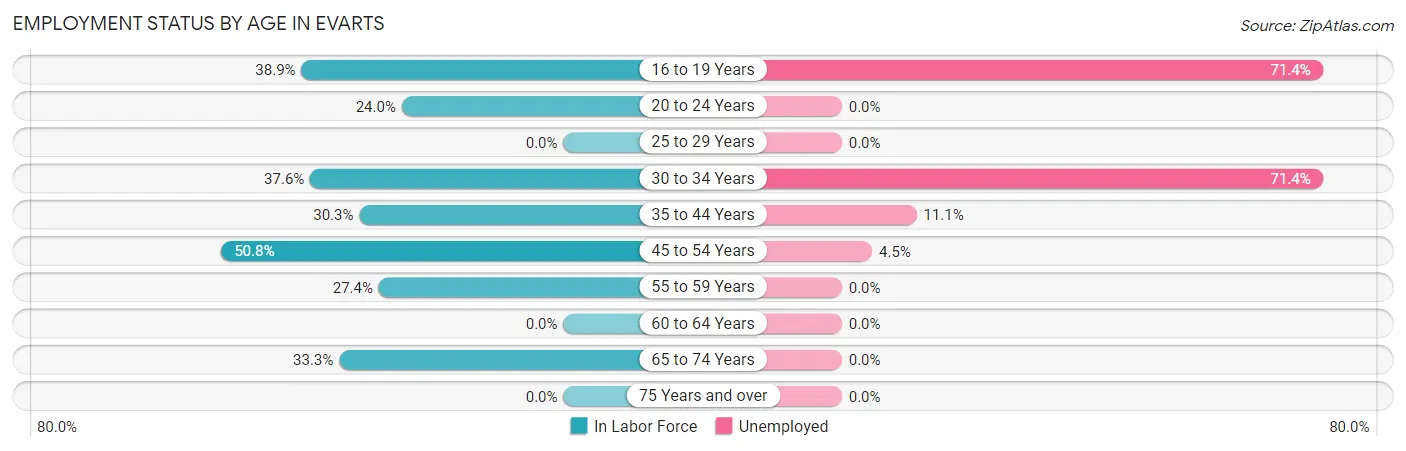
| Age Bracket | In Labor Force | Unemployed |
| 16 to 19 Years | 14 (38.9%) | 10 (71.4%) |
| 20 to 24 Years | 6 (24.0%) | 0 (0.0%) |
| 25 to 29 Years | 0 (0.0%) | 0 (0.0%) |
| 30 to 34 Years | 35 (37.6%) | 25 (71.4%) |
| 35 to 44 Years | 63 (30.3%) | 7 (11.1%) |
| 45 to 54 Years | 66 (50.8%) | 3 (4.5%) |
| 55 to 59 Years | 17 (27.4%) | 0 (0.0%) |
| 60 to 64 Years | 0 (0.0%) | 0 (0.0%) |
| 65 to 74 Years | 27 (33.3%) | 0 (0.0%) |
| 75 Years and over | 0 (0.0%) | 0 (0.0%) |
| Total | 228 (30.9%) | 45 (19.7%) |
Employment Status by Educational Attainment in Evarts
According to labor force statistics for Evarts, 31.3% of individuals (181) out of the total population between 25 and 64 years of age (578) are in the labor force, with 19.3% or 35 of them being unemployed. The group with the highest labor force participation rate are those with the educational attainment of bachelor's degree or higher, with 66.0% or 31 individuals in the labor force. Within the labor force, individuals with high school diploma education have the highest percentage of unemployment, with 35.9% or 28 of them being unemployed.
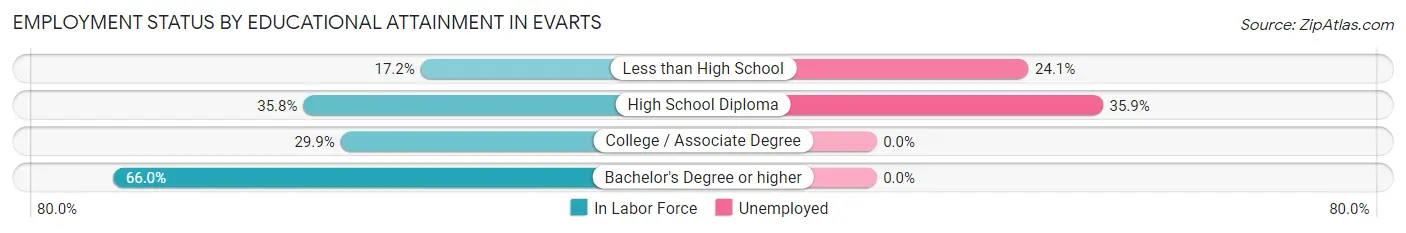
| Educational Attainment | In Labor Force | Unemployed |
| Less than High School | 29 (17.2%) | 41 (24.1%) |
| High School Diploma | 78 (35.8%) | 78 (35.9%) |
| College / Associate Degree | 43 (29.9%) | 0 (0.0%) |
| Bachelor's Degree or higher | 31 (66.0%) | 0 (0.0%) |
| Total | 181 (31.3%) | 112 (19.3%) |
Employment Occupations by Sex in Evarts
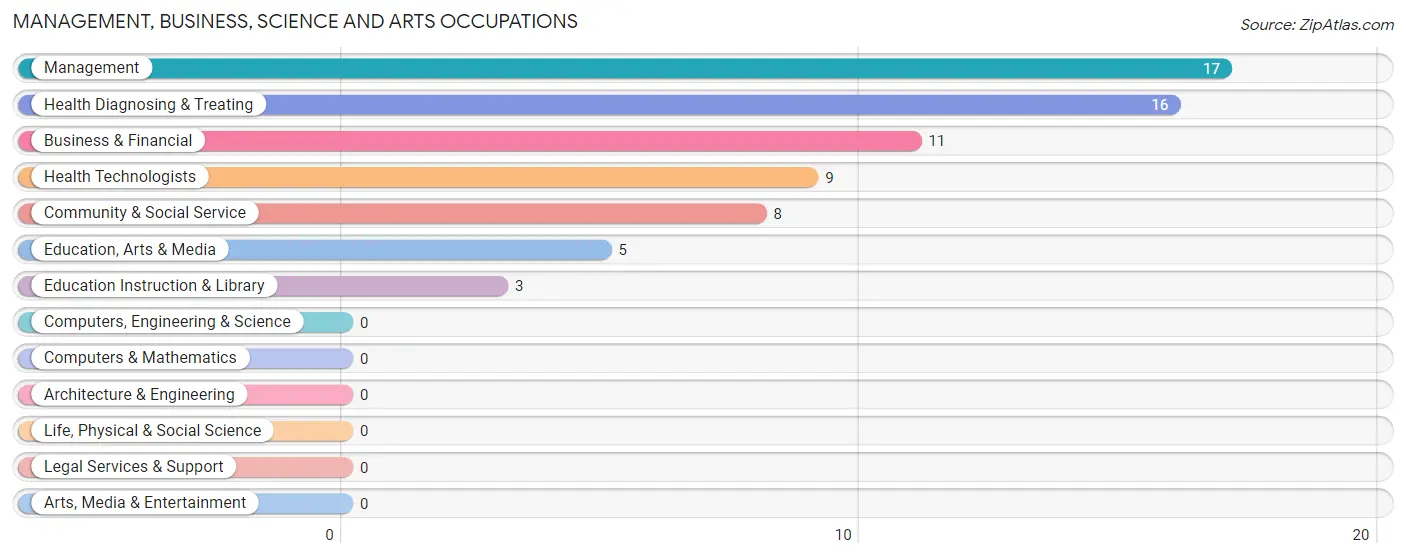
Management, Business, Science and Arts Occupations
The most common Management, Business, Science and Arts occupations in Evarts are Management (17 | 9.3%), Health Diagnosing & Treating (16 | 8.7%), Business & Financial (11 | 6.0%), Health Technologists (9 | 4.9%), and Community & Social Service (8 | 4.4%).
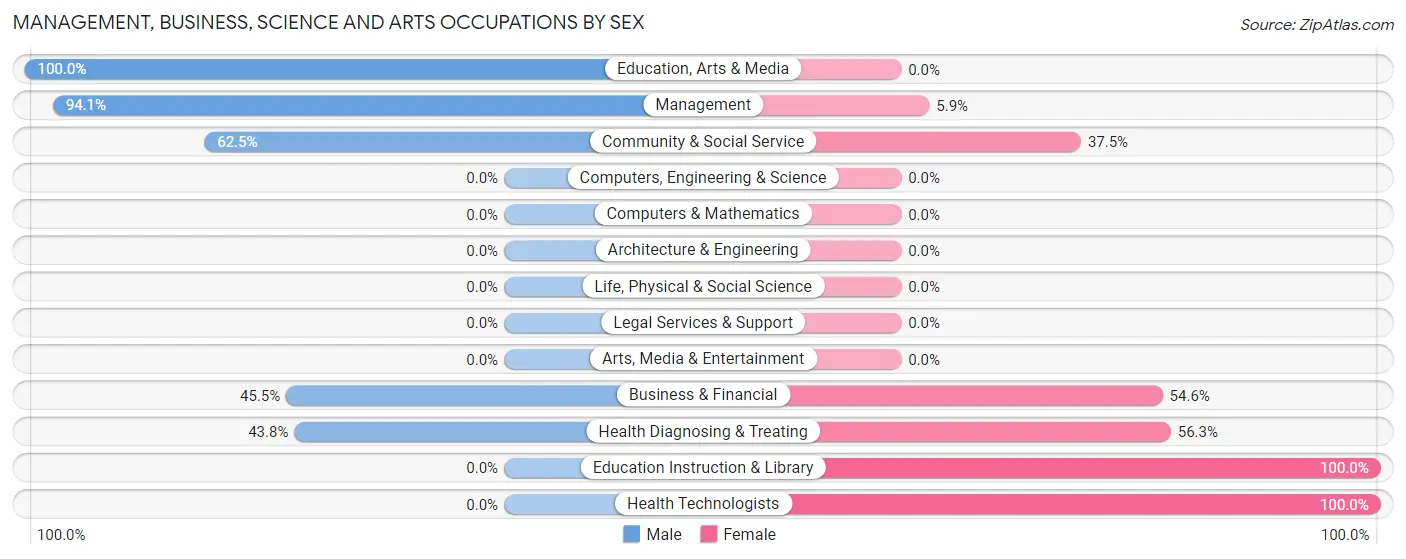
Management, Business, Science and Arts Occupations by Sex
Within the Management, Business, Science and Arts occupations in Evarts, the most male-oriented occupations are Education, Arts & Media (100.0%), Management (94.1%), and Community & Social Service (62.5%), while the most female-oriented occupations are Education Instruction & Library (100.0%), Health Technologists (100.0%), and Health Diagnosing & Treating (56.2%).
| Occupation | Male | Female |
| Management | 16 (94.1%) | 1 (5.9%) |
| Business & Financial | 5 (45.5%) | 6 (54.5%) |
| Computers, Engineering & Science | 0 (0.0%) | 0 (0.0%) |
| Computers & Mathematics | 0 (0.0%) | 0 (0.0%) |
| Architecture & Engineering | 0 (0.0%) | 0 (0.0%) |
| Life, Physical & Social Science | 0 (0.0%) | 0 (0.0%) |
| Community & Social Service | 5 (62.5%) | 3 (37.5%) |
| Education, Arts & Media | 5 (100.0%) | 0 (0.0%) |
| Legal Services & Support | 0 (0.0%) | 0 (0.0%) |
| Education Instruction & Library | 0 (0.0%) | 3 (100.0%) |
| Arts, Media & Entertainment | 0 (0.0%) | 0 (0.0%) |
| Health Diagnosing & Treating | 7 (43.8%) | 9 (56.2%) |
| Health Technologists | 0 (0.0%) | 9 (100.0%) |
| Total (Category) | 33 (63.5%) | 19 (36.5%) |
| Total (Overall) | 102 (55.7%) | 81 (44.3%) |
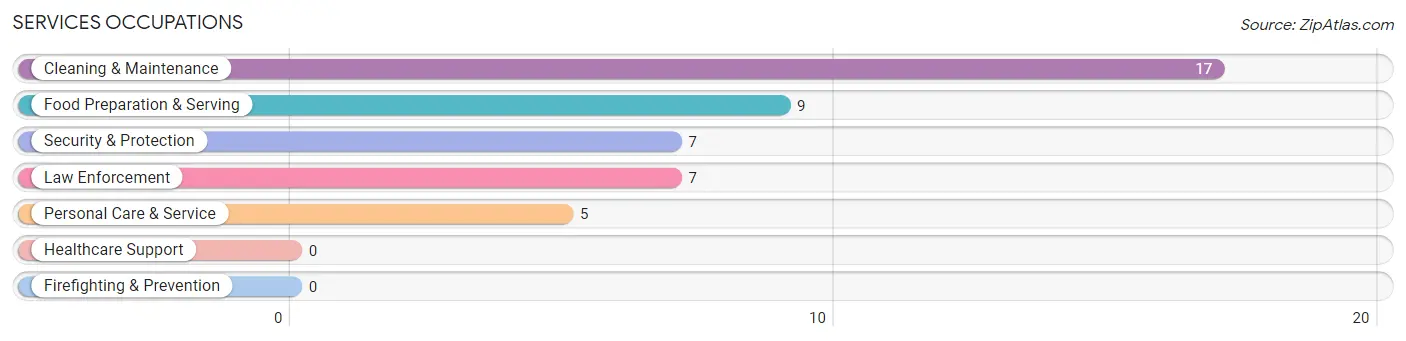
Services Occupations
The most common Services occupations in Evarts are Cleaning & Maintenance (17 | 9.3%), Food Preparation & Serving (9 | 4.9%), Security & Protection (7 | 3.8%), Law Enforcement (7 | 3.8%), and Personal Care & Service (5 | 2.7%).
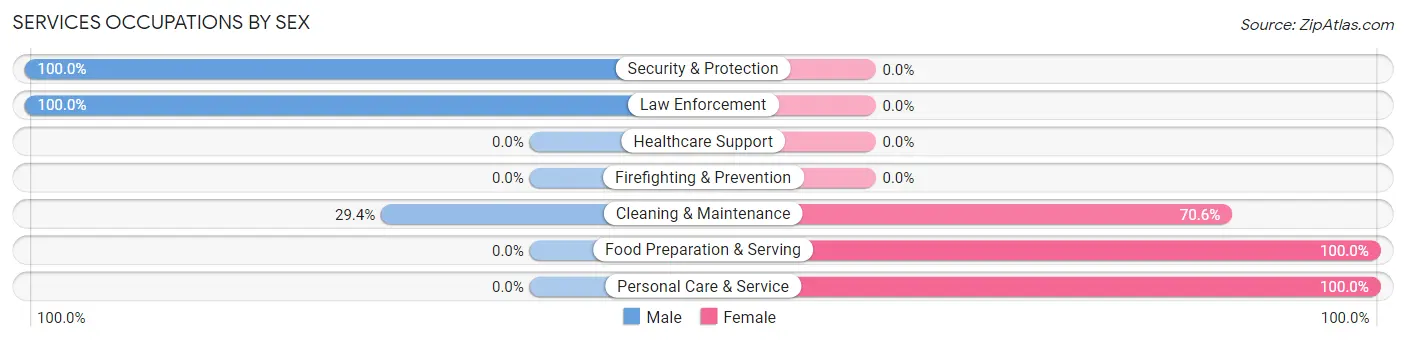
Services Occupations by Sex
Within the Services occupations in Evarts, the most male-oriented occupations are Security & Protection (100.0%), Law Enforcement (100.0%), and Cleaning & Maintenance (29.4%), while the most female-oriented occupations are Food Preparation & Serving (100.0%), Personal Care & Service (100.0%), and Cleaning & Maintenance (70.6%).
| Occupation | Male | Female |
| Healthcare Support | 0 (0.0%) | 0 (0.0%) |
| Security & Protection | 7 (100.0%) | 0 (0.0%) |
| Firefighting & Prevention | 0 (0.0%) | 0 (0.0%) |
| Law Enforcement | 7 (100.0%) | 0 (0.0%) |
| Food Preparation & Serving | 0 (0.0%) | 9 (100.0%) |
| Cleaning & Maintenance | 5 (29.4%) | 12 (70.6%) |
| Personal Care & Service | 0 (0.0%) | 5 (100.0%) |
| Total (Category) | 12 (31.6%) | 26 (68.4%) |
| Total (Overall) | 102 (55.7%) | 81 (44.3%) |
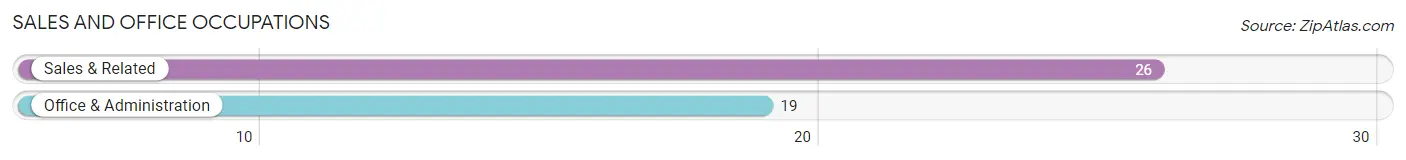
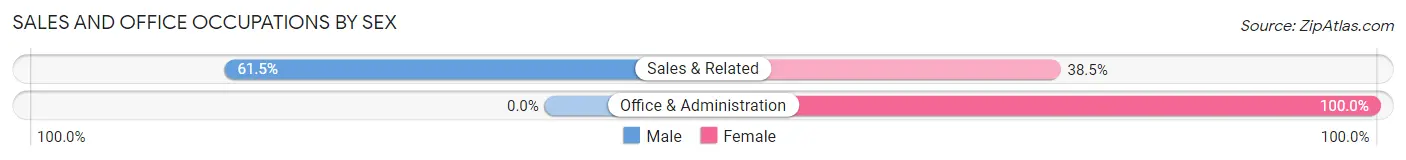
Sales and Office Occupations
The most common Sales and Office occupations in Evarts are Sales & Related (26 | 14.2%), and Office & Administration (19 | 10.4%).
Sales and Office Occupations by Sex
| Occupation | Male | Female |
| Sales & Related | 16 (61.5%) | 10 (38.5%) |
| Office & Administration | 0 (0.0%) | 19 (100.0%) |
| Total (Category) | 16 (35.6%) | 29 (64.4%) |
| Total (Overall) | 102 (55.7%) | 81 (44.3%) |
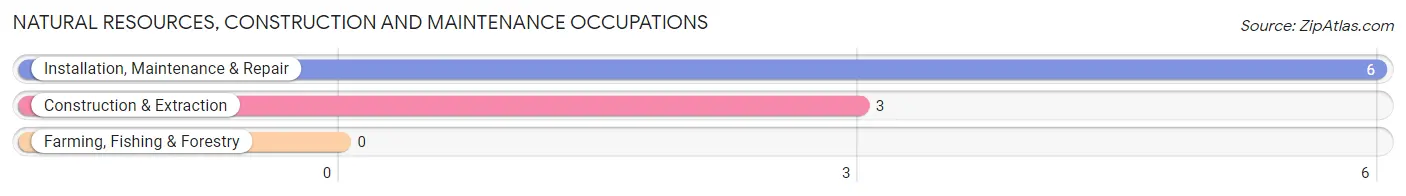
Natural Resources, Construction and Maintenance Occupations
The most common Natural Resources, Construction and Maintenance occupations in Evarts are Installation, Maintenance & Repair (6 | 3.3%), and Construction & Extraction (3 | 1.6%).
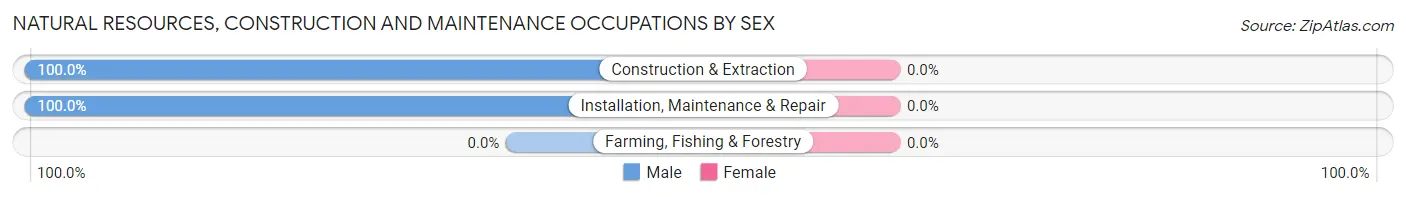
Natural Resources, Construction and Maintenance Occupations by Sex
| Occupation | Male | Female |
| Farming, Fishing & Forestry | 0 (0.0%) | 0 (0.0%) |
| Construction & Extraction | 3 (100.0%) | 0 (0.0%) |
| Installation, Maintenance & Repair | 6 (100.0%) | 0 (0.0%) |
| Total (Category) | 9 (100.0%) | 0 (0.0%) |
| Total (Overall) | 102 (55.7%) | 81 (44.3%) |
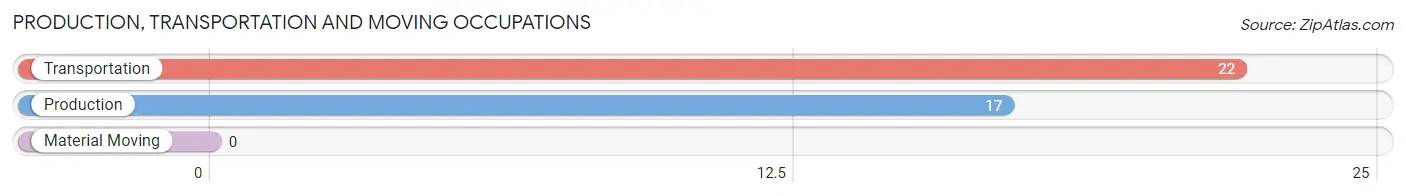
Production, Transportation and Moving Occupations
The most common Production, Transportation and Moving occupations in Evarts are Transportation (22 | 12.0%), and Production (17 | 9.3%).
Production, Transportation and Moving Occupations by Sex
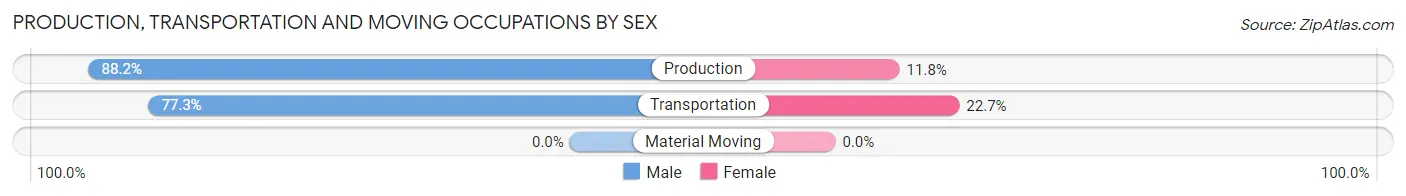
| Occupation | Male | Female |
| Production | 15 (88.2%) | 2 (11.8%) |
| Transportation | 17 (77.3%) | 5 (22.7%) |
| Material Moving | 0 (0.0%) | 0 (0.0%) |
| Total (Category) | 32 (82.1%) | 7 (17.9%) |
| Total (Overall) | 102 (55.7%) | 81 (44.3%) |
Employment Industries by Sex in Evarts
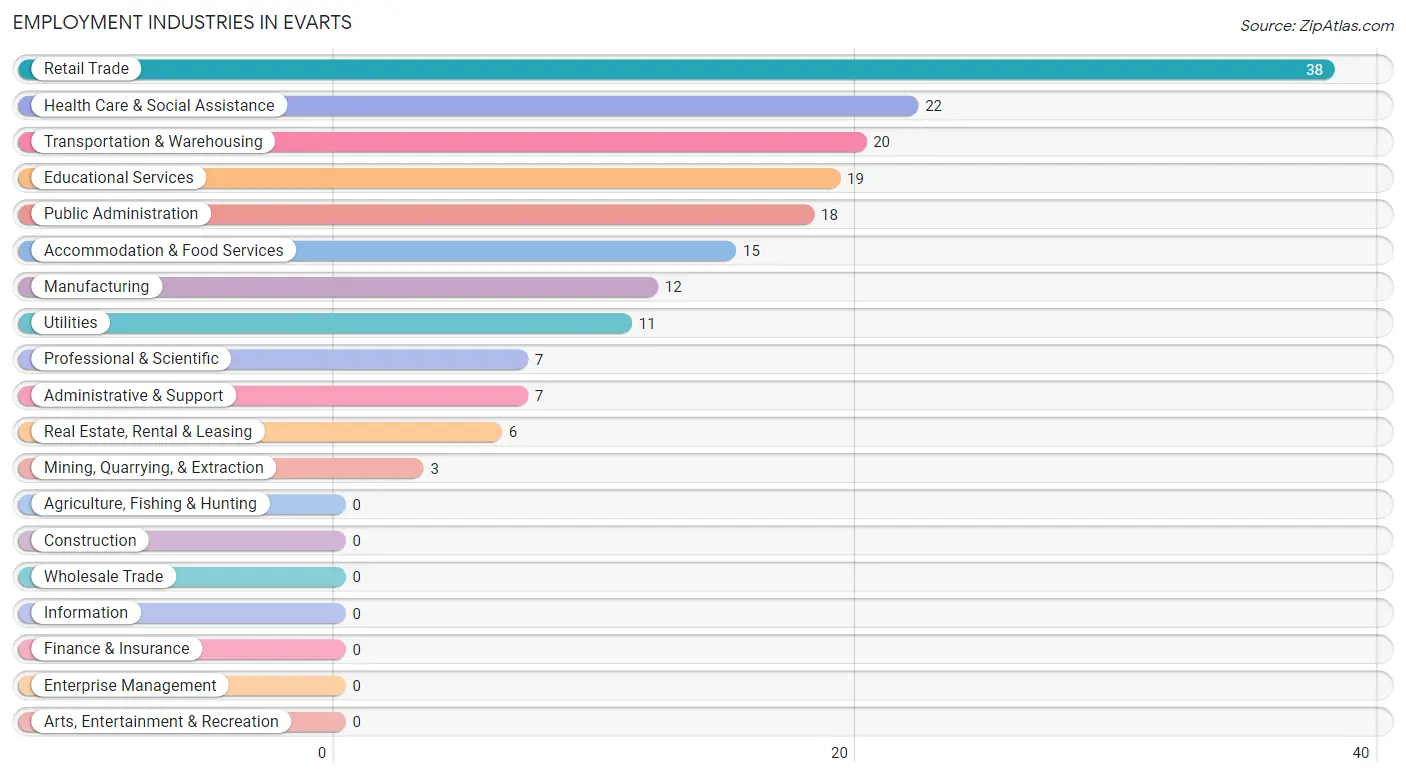
Employment Industries in Evarts
The major employment industries in Evarts include Retail Trade (38 | 20.8%), Health Care & Social Assistance (22 | 12.0%), Transportation & Warehousing (20 | 10.9%), Educational Services (19 | 10.4%), and Public Administration (18 | 9.8%).
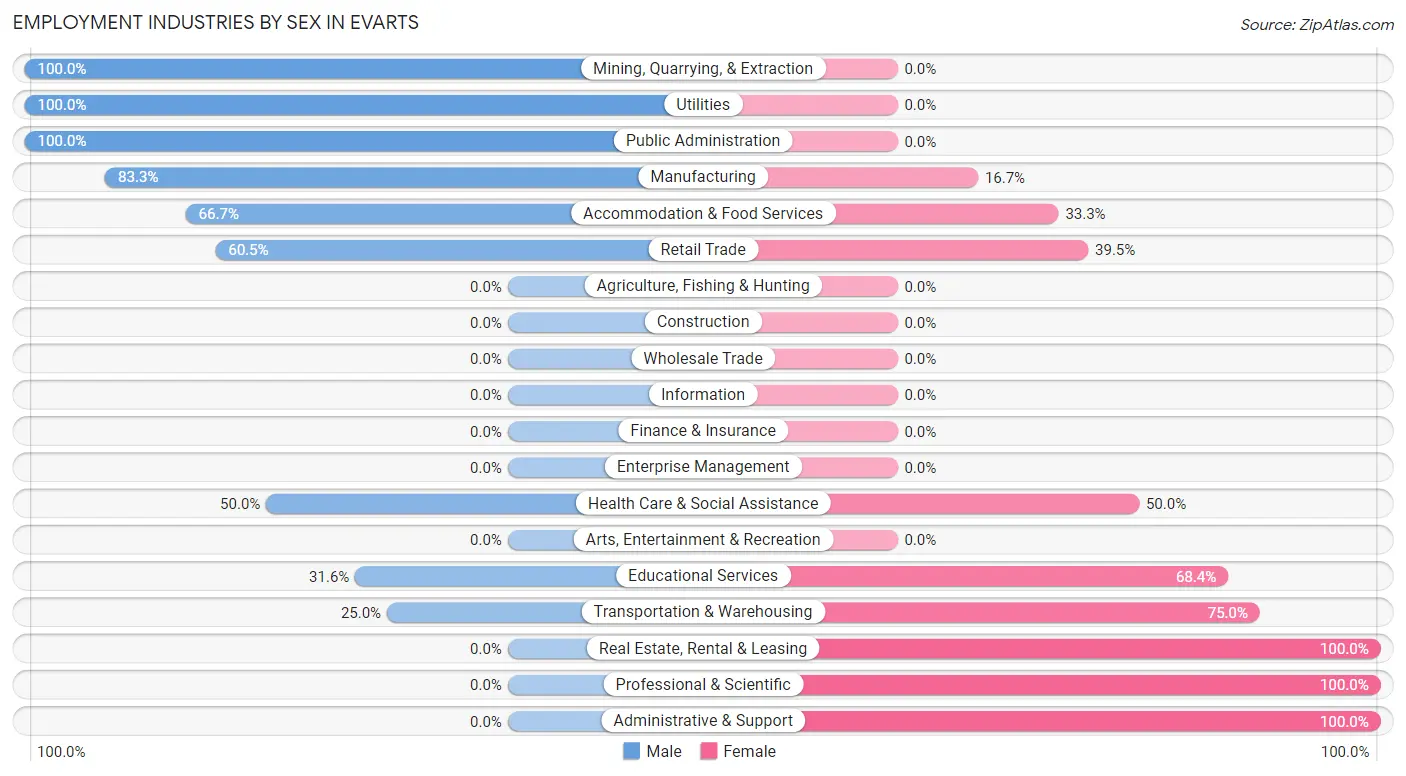
Employment Industries by Sex in Evarts
The Evarts industries that see more men than women are Mining, Quarrying, & Extraction (100.0%), Utilities (100.0%), and Public Administration (100.0%), whereas the industries that tend to have a higher number of women are Real Estate, Rental & Leasing (100.0%), Professional & Scientific (100.0%), and Administrative & Support (100.0%).
| Industry | Male | Female |
| Agriculture, Fishing & Hunting | 0 (0.0%) | 0 (0.0%) |
| Mining, Quarrying, & Extraction | 3 (100.0%) | 0 (0.0%) |
| Construction | 0 (0.0%) | 0 (0.0%) |
| Manufacturing | 10 (83.3%) | 2 (16.7%) |
| Wholesale Trade | 0 (0.0%) | 0 (0.0%) |
| Retail Trade | 23 (60.5%) | 15 (39.5%) |
| Transportation & Warehousing | 5 (25.0%) | 15 (75.0%) |
| Utilities | 11 (100.0%) | 0 (0.0%) |
| Information | 0 (0.0%) | 0 (0.0%) |
| Finance & Insurance | 0 (0.0%) | 0 (0.0%) |
| Real Estate, Rental & Leasing | 0 (0.0%) | 6 (100.0%) |
| Professional & Scientific | 0 (0.0%) | 7 (100.0%) |
| Enterprise Management | 0 (0.0%) | 0 (0.0%) |
| Administrative & Support | 0 (0.0%) | 7 (100.0%) |
| Educational Services | 6 (31.6%) | 13 (68.4%) |
| Health Care & Social Assistance | 11 (50.0%) | 11 (50.0%) |
| Arts, Entertainment & Recreation | 0 (0.0%) | 0 (0.0%) |
| Accommodation & Food Services | 10 (66.7%) | 5 (33.3%) |
| Public Administration | 18 (100.0%) | 0 (0.0%) |
| Total | 102 (55.7%) | 81 (44.3%) |
Education in Evarts
School Enrollment in Evarts
The most common levels of schooling among the 142 students in Evarts are middle school (41 | 28.9%), nursery / preschool (38 | 26.8%), and high school (28 | 19.7%).
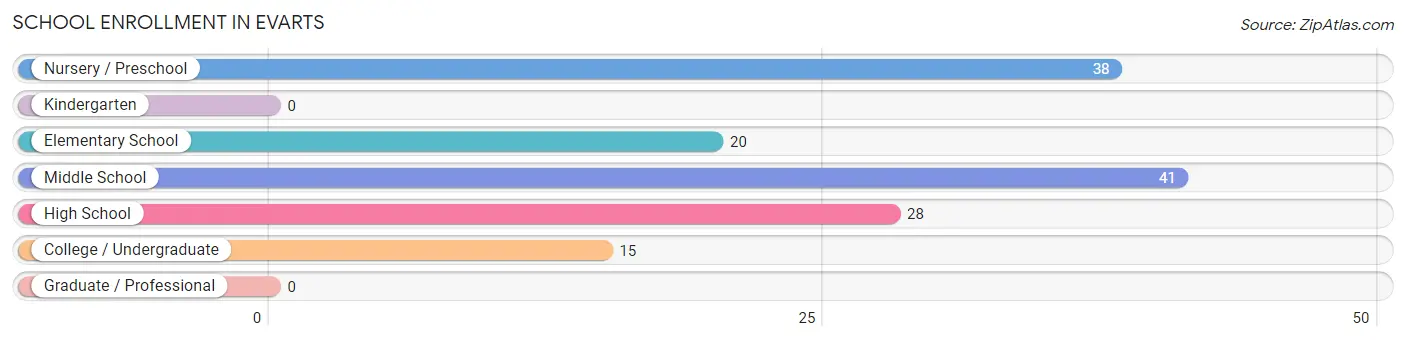
| School Level | # Students | % Students |
| Nursery / Preschool | 38 | 26.8% |
| Kindergarten | 0 | 0.0% |
| Elementary School | 20 | 14.1% |
| Middle School | 41 | 28.9% |
| High School | 28 | 19.7% |
| College / Undergraduate | 15 | 10.6% |
| Graduate / Professional | 0 | 0.0% |
| Total | 142 | 100.0% |
School Enrollment by Age by Funding Source in Evarts
Out of a total of 142 students who are enrolled in schools in Evarts, 10 (7.0%) attend a private institution, while the remaining 132 (93.0%) are enrolled in public schools. The age group of 35 years and over has the highest likelihood of being enrolled in private schools, with 4 (100.0% in the age bracket) enrolled. Conversely, the age group of 3 to 4 year olds has the lowest likelihood of being enrolled in a private school, with 16 (100.0% in the age bracket) attending a public institution.
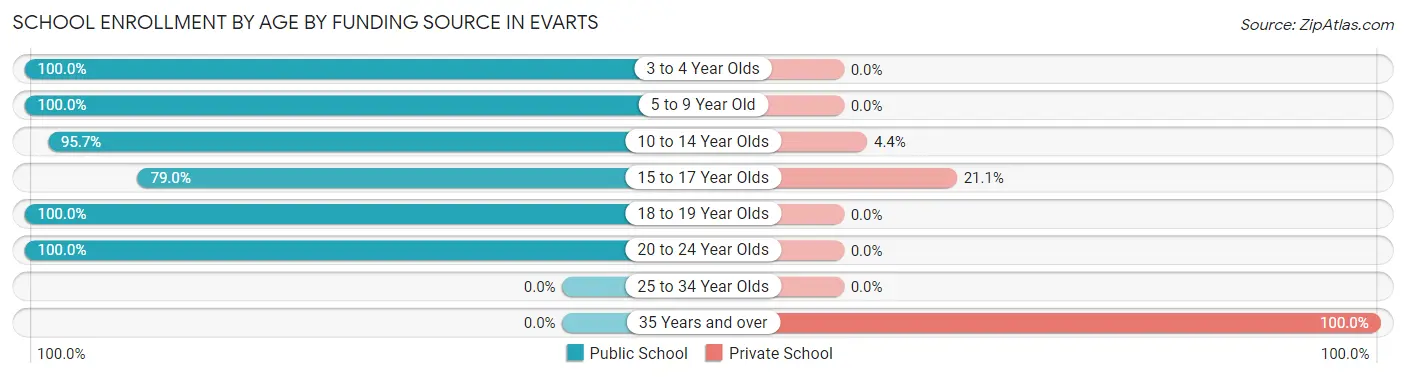
| Age Bracket | Public School | Private School |
| 3 to 4 Year Olds | 16 (100.0%) | 0 (0.0%) |
| 5 to 9 Year Old | 42 (100.0%) | 0 (0.0%) |
| 10 to 14 Year Olds | 44 (95.7%) | 2 (4.3%) |
| 15 to 17 Year Olds | 15 (78.9%) | 4 (21.0%) |
| 18 to 19 Year Olds | 9 (100.0%) | 0 (0.0%) |
| 20 to 24 Year Olds | 6 (100.0%) | 0 (0.0%) |
| 25 to 34 Year Olds | 0 (0.0%) | 0 (0.0%) |
| 35 Years and over | 0 (0.0%) | 4 (100.0%) |
| Total | 132 (93.0%) | 10 (7.0%) |
Educational Attainment by Field of Study in Evarts
Business (28 | 44.4%), education (16 | 25.4%), arts & humanities (10 | 15.9%), bio, nature & agricultural (5 | 7.9%), and liberal arts & history (4 | 6.4%) are the most common fields of study among 63 individuals in Evarts who have obtained a bachelor's degree or higher.
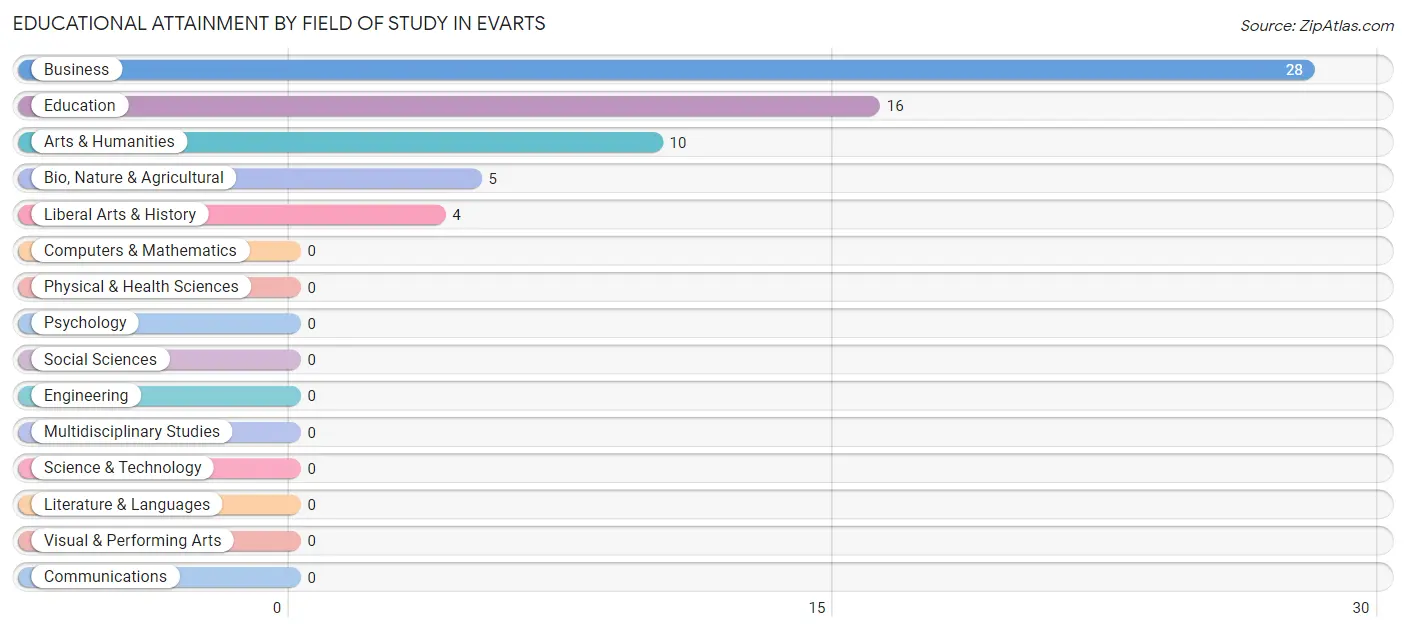
| Field of Study | # Graduates | % Graduates |
| Computers & Mathematics | 0 | 0.0% |
| Bio, Nature & Agricultural | 5 | 7.9% |
| Physical & Health Sciences | 0 | 0.0% |
| Psychology | 0 | 0.0% |
| Social Sciences | 0 | 0.0% |
| Engineering | 0 | 0.0% |
| Multidisciplinary Studies | 0 | 0.0% |
| Science & Technology | 0 | 0.0% |
| Business | 28 | 44.4% |
| Education | 16 | 25.4% |
| Literature & Languages | 0 | 0.0% |
| Liberal Arts & History | 4 | 6.4% |
| Visual & Performing Arts | 0 | 0.0% |
| Communications | 0 | 0.0% |
| Arts & Humanities | 10 | 15.9% |
| Total | 63 | 100.0% |
Transportation & Commute in Evarts
Vehicle Availability by Sex in Evarts
The most prevalent vehicle ownership categories in Evarts are males with 3 vehicles (40, accounting for 41.7%) and females with 3 vehicles (15, making up 52.6%).
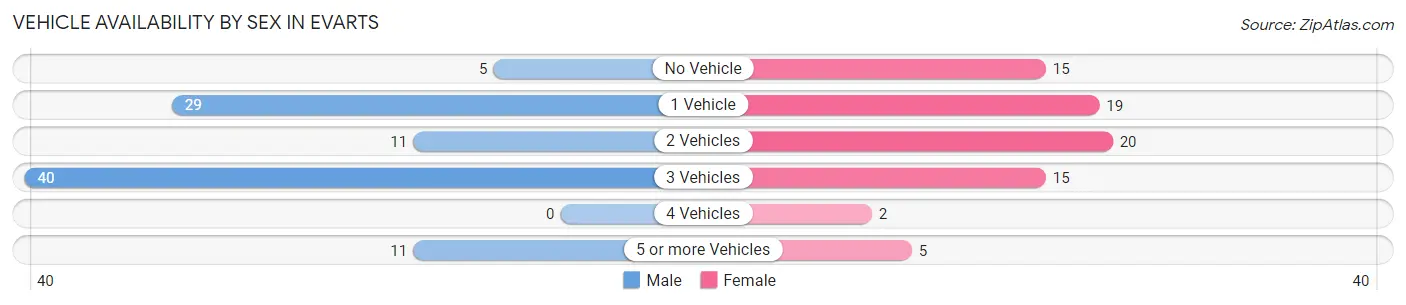
| Vehicles Available | Male | Female |
| No Vehicle | 5 (5.2%) | 15 (19.7%) |
| 1 Vehicle | 29 (30.2%) | 19 (25.0%) |
| 2 Vehicles | 11 (11.5%) | 20 (26.3%) |
| 3 Vehicles | 40 (41.7%) | 15 (19.7%) |
| 4 Vehicles | 0 (0.0%) | 2 (2.6%) |
| 5 or more Vehicles | 11 (11.5%) | 5 (6.6%) |
| Total | 96 (100.0%) | 76 (100.0%) |
Commute Time in Evarts
The most frequently occuring commute durations in Evarts are 15 to 19 minutes (46 commuters, 27.7%), less than 5 minutes (32 commuters, 19.3%), and 20 to 24 minutes (24 commuters, 14.5%).
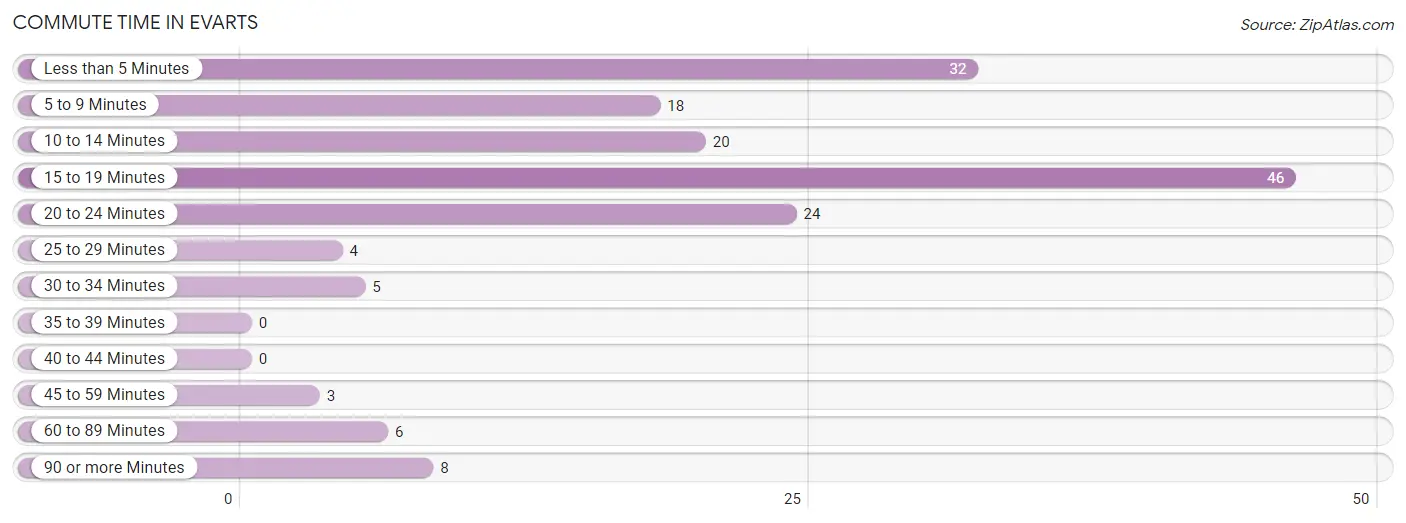
| Commute Time | # Commuters | % Commuters |
| Less than 5 Minutes | 32 | 19.3% |
| 5 to 9 Minutes | 18 | 10.8% |
| 10 to 14 Minutes | 20 | 12.0% |
| 15 to 19 Minutes | 46 | 27.7% |
| 20 to 24 Minutes | 24 | 14.5% |
| 25 to 29 Minutes | 4 | 2.4% |
| 30 to 34 Minutes | 5 | 3.0% |
| 35 to 39 Minutes | 0 | 0.0% |
| 40 to 44 Minutes | 0 | 0.0% |
| 45 to 59 Minutes | 3 | 1.8% |
| 60 to 89 Minutes | 6 | 3.6% |
| 90 or more Minutes | 8 | 4.8% |
Commute Time by Sex in Evarts
The most common commute times in Evarts are 20 to 24 minutes (24 commuters, 25.0%) for males and 15 to 19 minutes (26 commuters, 37.1%) for females.
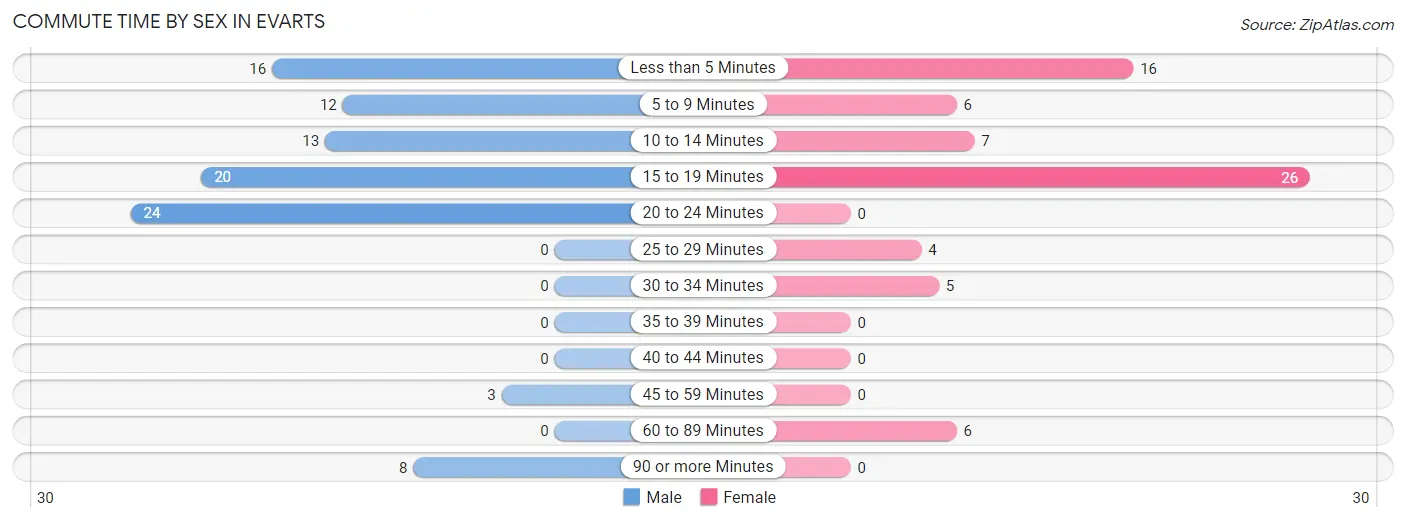
| Commute Time | Male | Female |
| Less than 5 Minutes | 16 (16.7%) | 16 (22.9%) |
| 5 to 9 Minutes | 12 (12.5%) | 6 (8.6%) |
| 10 to 14 Minutes | 13 (13.5%) | 7 (10.0%) |
| 15 to 19 Minutes | 20 (20.8%) | 26 (37.1%) |
| 20 to 24 Minutes | 24 (25.0%) | 0 (0.0%) |
| 25 to 29 Minutes | 0 (0.0%) | 4 (5.7%) |
| 30 to 34 Minutes | 0 (0.0%) | 5 (7.1%) |
| 35 to 39 Minutes | 0 (0.0%) | 0 (0.0%) |
| 40 to 44 Minutes | 0 (0.0%) | 0 (0.0%) |
| 45 to 59 Minutes | 3 (3.1%) | 0 (0.0%) |
| 60 to 89 Minutes | 0 (0.0%) | 6 (8.6%) |
| 90 or more Minutes | 8 (8.3%) | 0 (0.0%) |
Time of Departure to Work by Sex in Evarts
The most frequent times of departure to work in Evarts are 7:30 AM to 7:59 AM (38, 39.6%) for males and 8:00 AM to 8:29 AM (15, 21.4%) for females.
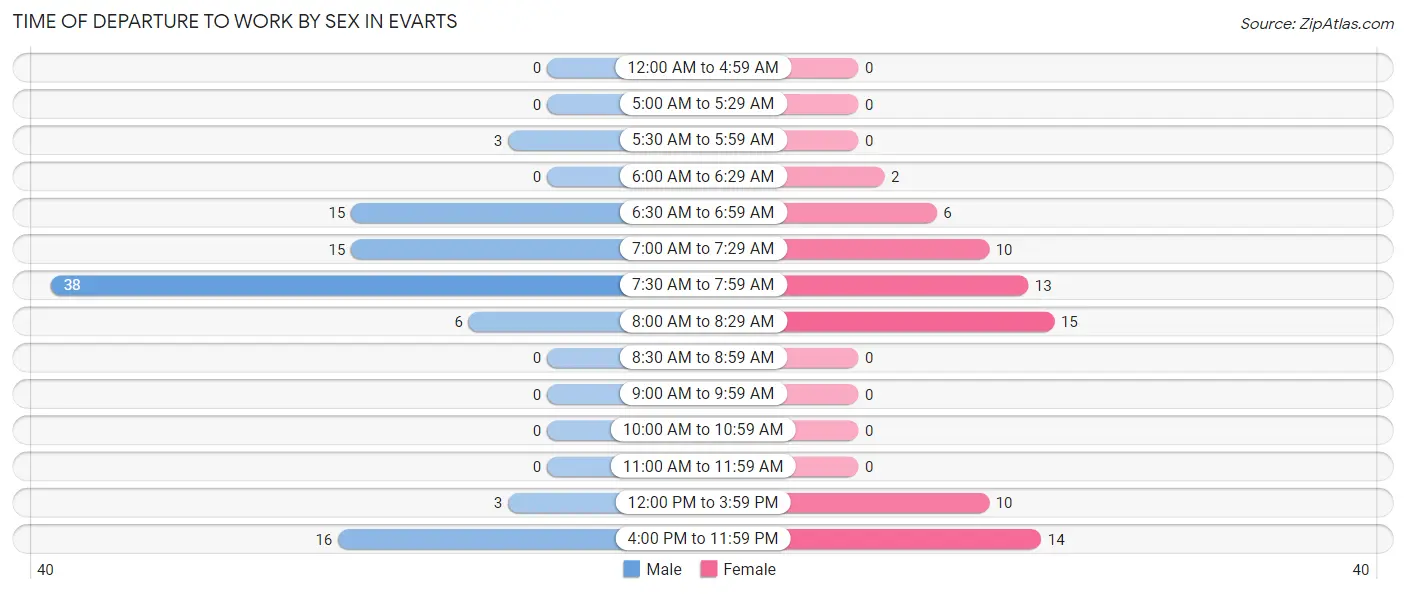
| Time of Departure | Male | Female |
| 12:00 AM to 4:59 AM | 0 (0.0%) | 0 (0.0%) |
| 5:00 AM to 5:29 AM | 0 (0.0%) | 0 (0.0%) |
| 5:30 AM to 5:59 AM | 3 (3.1%) | 0 (0.0%) |
| 6:00 AM to 6:29 AM | 0 (0.0%) | 2 (2.9%) |
| 6:30 AM to 6:59 AM | 15 (15.6%) | 6 (8.6%) |
| 7:00 AM to 7:29 AM | 15 (15.6%) | 10 (14.3%) |
| 7:30 AM to 7:59 AM | 38 (39.6%) | 13 (18.6%) |
| 8:00 AM to 8:29 AM | 6 (6.2%) | 15 (21.4%) |
| 8:30 AM to 8:59 AM | 0 (0.0%) | 0 (0.0%) |
| 9:00 AM to 9:59 AM | 0 (0.0%) | 0 (0.0%) |
| 10:00 AM to 10:59 AM | 0 (0.0%) | 0 (0.0%) |
| 11:00 AM to 11:59 AM | 0 (0.0%) | 0 (0.0%) |
| 12:00 PM to 3:59 PM | 3 (3.1%) | 10 (14.3%) |
| 4:00 PM to 11:59 PM | 16 (16.7%) | 14 (20.0%) |
| Total | 96 (100.0%) | 70 (100.0%) |
Housing Occupancy in Evarts
Occupancy by Ownership in Evarts
Of the total 250 dwellings in Evarts, owner-occupied units account for 156 (62.4%), while renter-occupied units make up 94 (37.6%).
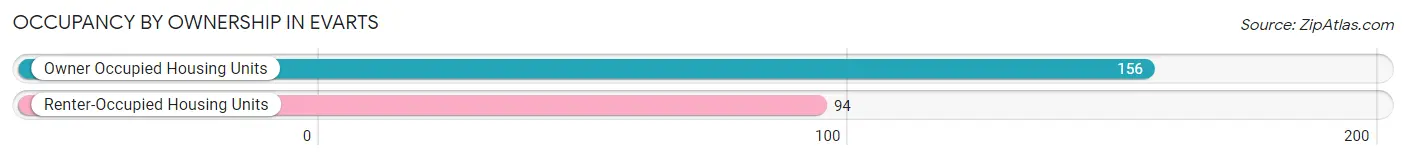
| Occupancy | # Housing Units | % Housing Units |
| Owner Occupied Housing Units | 156 | 62.4% |
| Renter-Occupied Housing Units | 94 | 37.6% |
| Total Occupied Housing Units | 250 | 100.0% |
Occupancy by Household Size in Evarts
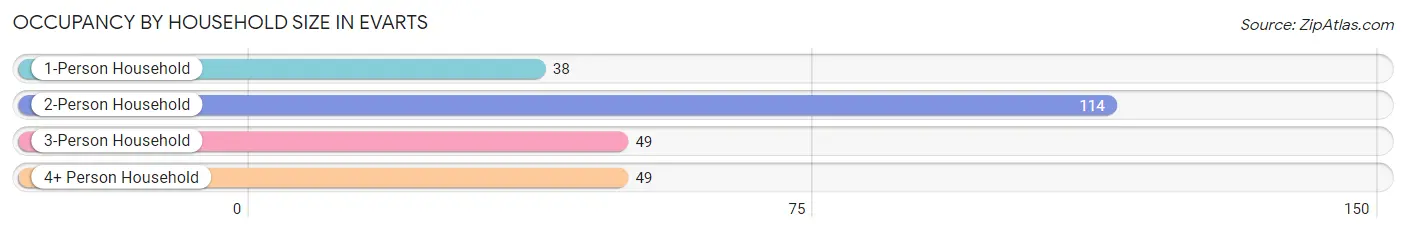
| Household Size | # Housing Units | % Housing Units |
| 1-Person Household | 38 | 15.2% |
| 2-Person Household | 114 | 45.6% |
| 3-Person Household | 49 | 19.6% |
| 4+ Person Household | 49 | 19.6% |
| Total Housing Units | 250 | 100.0% |
Occupancy by Ownership by Household Size in Evarts
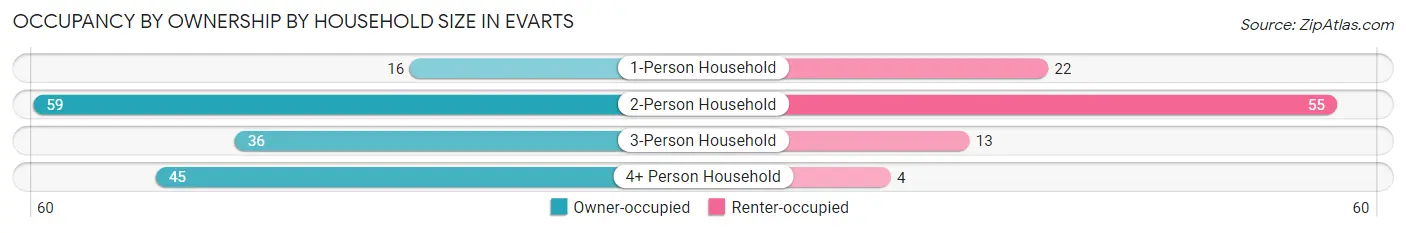
| Household Size | Owner-occupied | Renter-occupied |
| 1-Person Household | 16 (42.1%) | 22 (57.9%) |
| 2-Person Household | 59 (51.7%) | 55 (48.2%) |
| 3-Person Household | 36 (73.5%) | 13 (26.5%) |
| 4+ Person Household | 45 (91.8%) | 4 (8.2%) |
| Total Housing Units | 156 (62.4%) | 94 (37.6%) |
Occupancy by Educational Attainment in Evarts
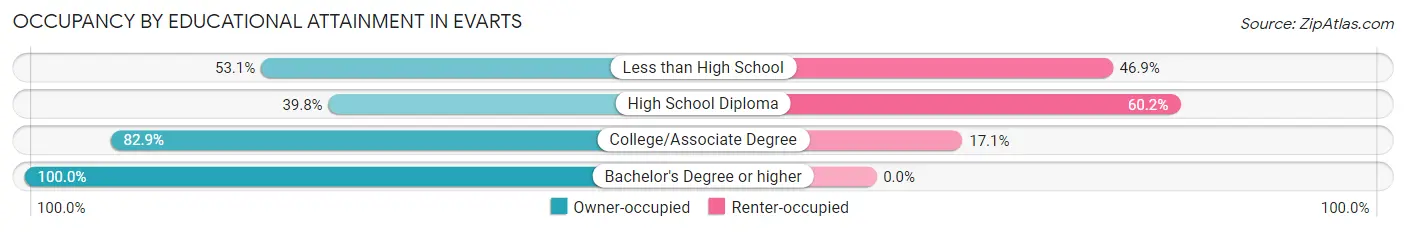
| Household Size | Owner-occupied | Renter-occupied |
| Less than High School | 34 (53.1%) | 30 (46.9%) |
| High School Diploma | 33 (39.8%) | 50 (60.2%) |
| College/Associate Degree | 68 (82.9%) | 14 (17.1%) |
| Bachelor's Degree or higher | 21 (100.0%) | 0 (0.0%) |
Occupancy by Age of Householder in Evarts
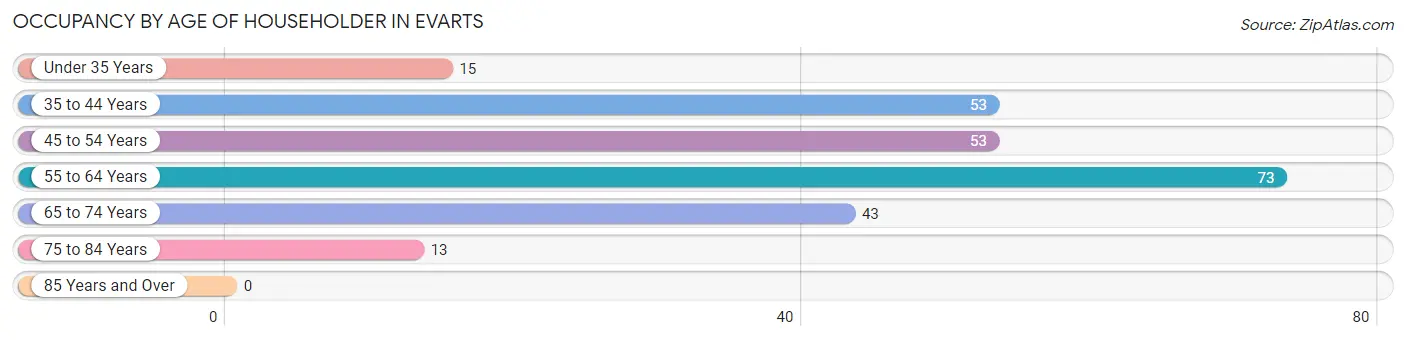
| Age Bracket | # Households | % Households |
| Under 35 Years | 15 | 6.0% |
| 35 to 44 Years | 53 | 21.2% |
| 45 to 54 Years | 53 | 21.2% |
| 55 to 64 Years | 73 | 29.2% |
| 65 to 74 Years | 43 | 17.2% |
| 75 to 84 Years | 13 | 5.2% |
| 85 Years and Over | 0 | 0.0% |
| Total | 250 | 100.0% |
Housing Finances in Evarts
Median Income by Occupancy in Evarts
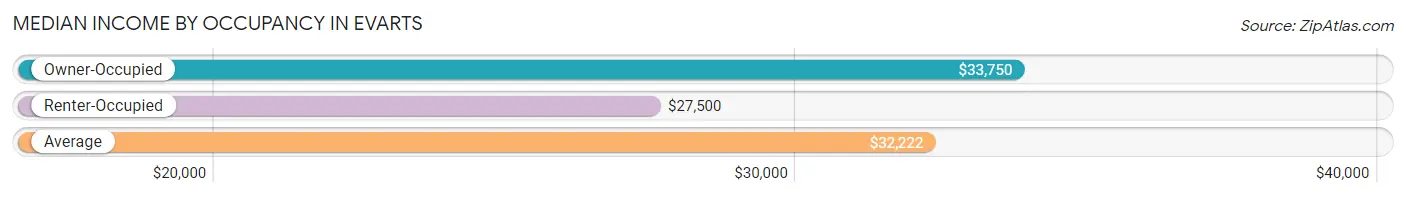
| Occupancy Type | # Households | Median Income |
| Owner-Occupied | 156 (62.4%) | $33,750 |
| Renter-Occupied | 94 (37.6%) | $27,500 |
| Average | 250 (100.0%) | $32,222 |
Occupancy by Householder Income Bracket in Evarts
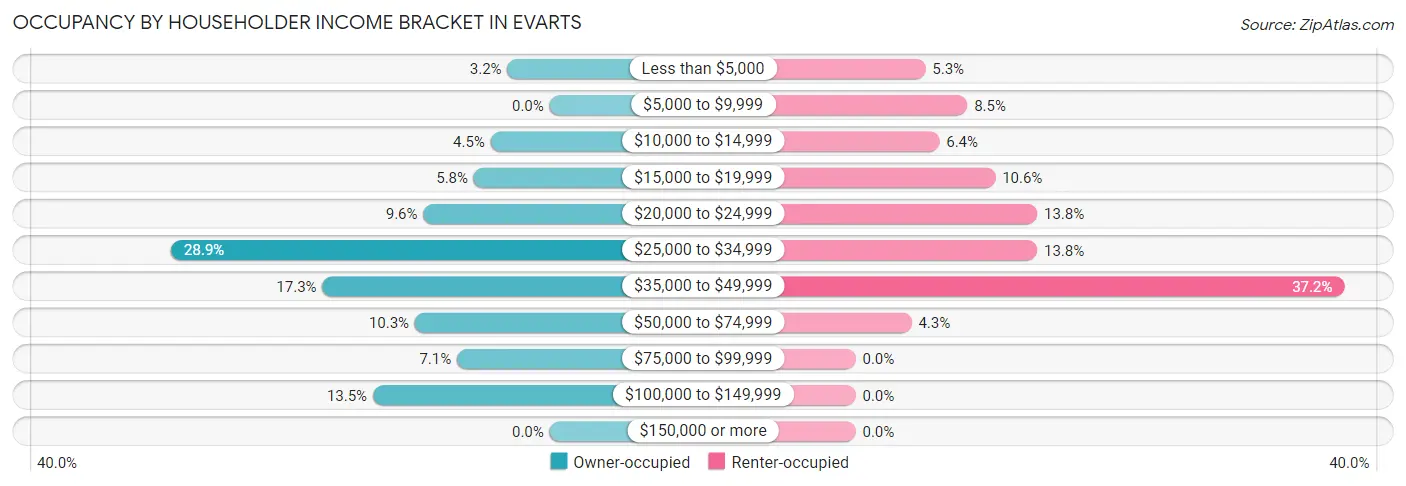
| Income Bracket | Owner-occupied | Renter-occupied |
| Less than $5,000 | 5 (3.2%) | 5 (5.3%) |
| $5,000 to $9,999 | 0 (0.0%) | 8 (8.5%) |
| $10,000 to $14,999 | 7 (4.5%) | 6 (6.4%) |
| $15,000 to $19,999 | 9 (5.8%) | 10 (10.6%) |
| $20,000 to $24,999 | 15 (9.6%) | 13 (13.8%) |
| $25,000 to $34,999 | 45 (28.8%) | 13 (13.8%) |
| $35,000 to $49,999 | 27 (17.3%) | 35 (37.2%) |
| $50,000 to $74,999 | 16 (10.3%) | 4 (4.3%) |
| $75,000 to $99,999 | 11 (7.0%) | 0 (0.0%) |
| $100,000 to $149,999 | 21 (13.5%) | 0 (0.0%) |
| $150,000 or more | 0 (0.0%) | 0 (0.0%) |
| Total | 156 (100.0%) | 94 (100.0%) |
Monthly Housing Cost Tiers in Evarts
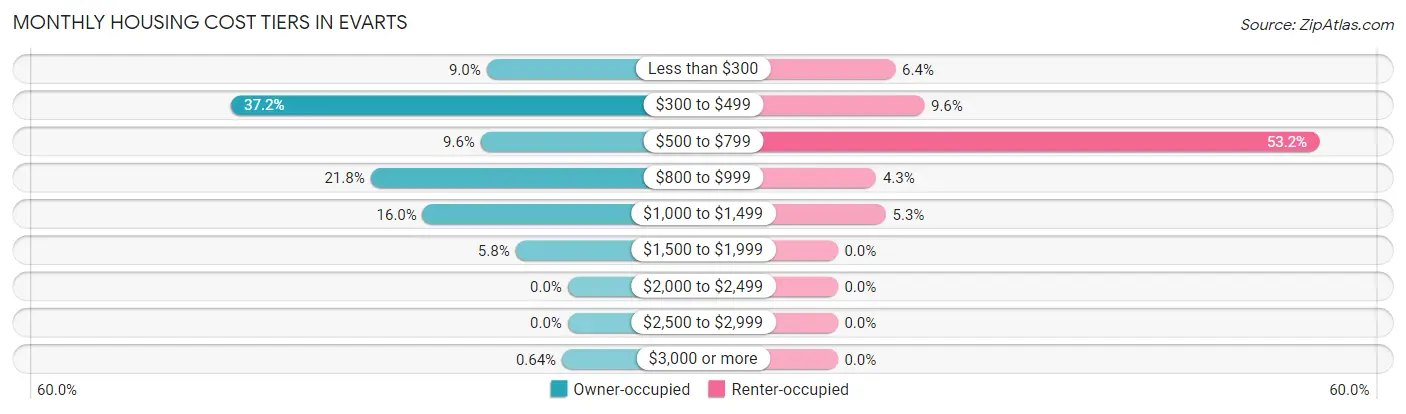
| Monthly Cost | Owner-occupied | Renter-occupied |
| Less than $300 | 14 (9.0%) | 6 (6.4%) |
| $300 to $499 | 58 (37.2%) | 9 (9.6%) |
| $500 to $799 | 15 (9.6%) | 50 (53.2%) |
| $800 to $999 | 34 (21.8%) | 4 (4.3%) |
| $1,000 to $1,499 | 25 (16.0%) | 5 (5.3%) |
| $1,500 to $1,999 | 9 (5.8%) | 0 (0.0%) |
| $2,000 to $2,499 | 0 (0.0%) | 0 (0.0%) |
| $2,500 to $2,999 | 0 (0.0%) | 0 (0.0%) |
| $3,000 or more | 1 (0.6%) | 0 (0.0%) |
| Total | 156 (100.0%) | 94 (100.0%) |
Physical Housing Characteristics in Evarts
Housing Structures in Evarts
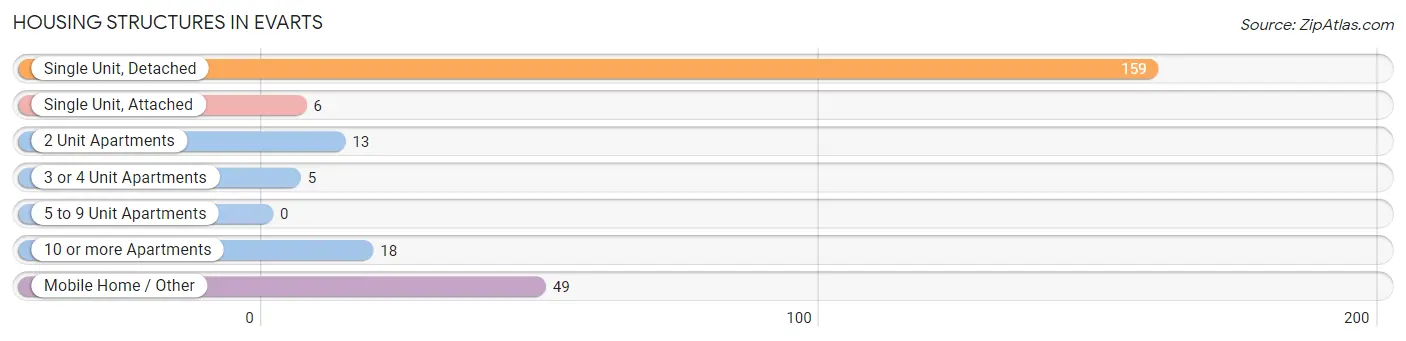
| Structure Type | # Housing Units | % Housing Units |
| Single Unit, Detached | 159 | 63.6% |
| Single Unit, Attached | 6 | 2.4% |
| 2 Unit Apartments | 13 | 5.2% |
| 3 or 4 Unit Apartments | 5 | 2.0% |
| 5 to 9 Unit Apartments | 0 | 0.0% |
| 10 or more Apartments | 18 | 7.2% |
| Mobile Home / Other | 49 | 19.6% |
| Total | 250 | 100.0% |
Housing Structures by Occupancy in Evarts
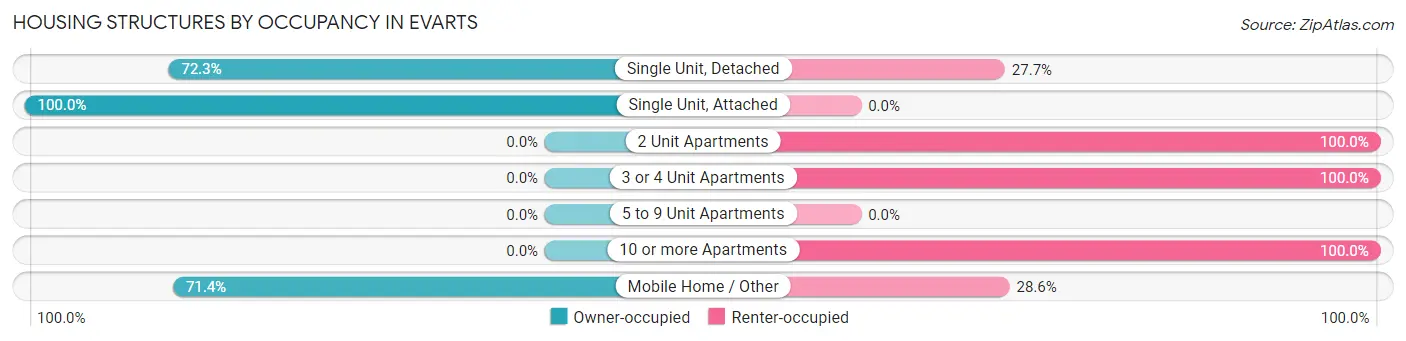
| Structure Type | Owner-occupied | Renter-occupied |
| Single Unit, Detached | 115 (72.3%) | 44 (27.7%) |
| Single Unit, Attached | 6 (100.0%) | 0 (0.0%) |
| 2 Unit Apartments | 0 (0.0%) | 13 (100.0%) |
| 3 or 4 Unit Apartments | 0 (0.0%) | 5 (100.0%) |
| 5 to 9 Unit Apartments | 0 (0.0%) | 0 (0.0%) |
| 10 or more Apartments | 0 (0.0%) | 18 (100.0%) |
| Mobile Home / Other | 35 (71.4%) | 14 (28.6%) |
| Total | 156 (62.4%) | 94 (37.6%) |
Housing Structures by Number of Rooms in Evarts
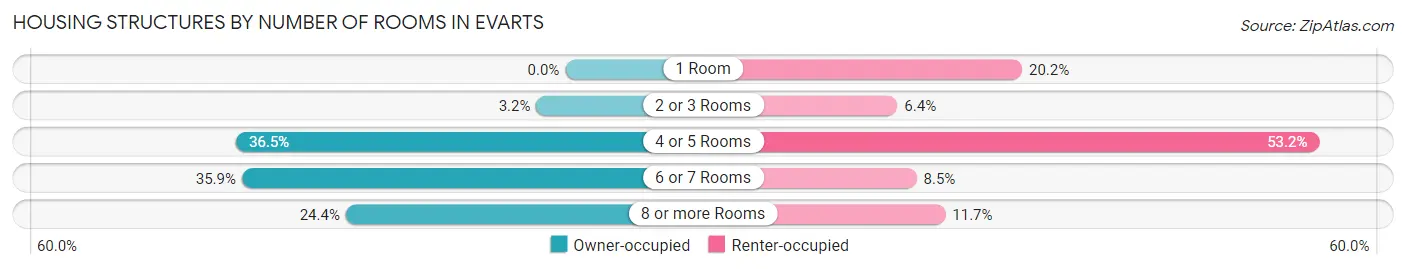
| Number of Rooms | Owner-occupied | Renter-occupied |
| 1 Room | 0 (0.0%) | 19 (20.2%) |
| 2 or 3 Rooms | 5 (3.2%) | 6 (6.4%) |
| 4 or 5 Rooms | 57 (36.5%) | 50 (53.2%) |
| 6 or 7 Rooms | 56 (35.9%) | 8 (8.5%) |
| 8 or more Rooms | 38 (24.4%) | 11 (11.7%) |
| Total | 156 (100.0%) | 94 (100.0%) |
Housing Structure by Heating Type in Evarts
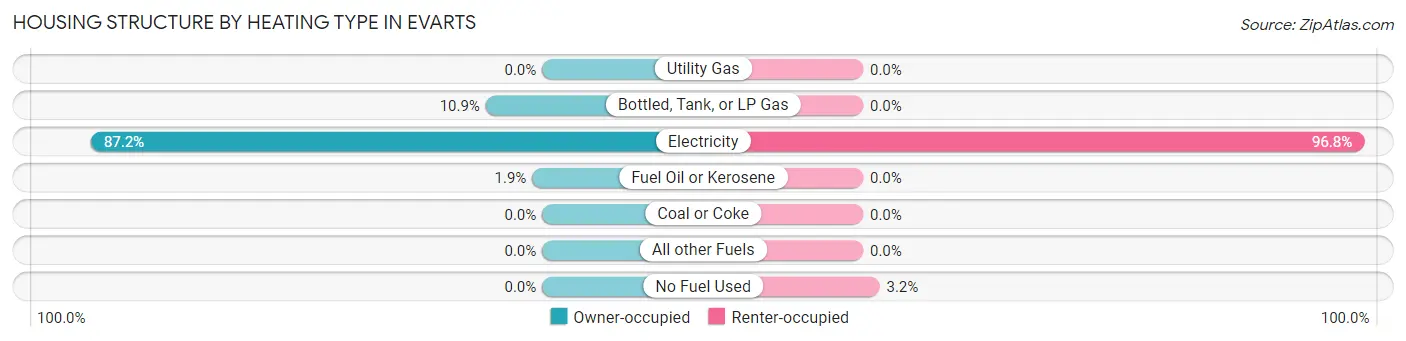
| Heating Type | Owner-occupied | Renter-occupied |
| Utility Gas | 0 (0.0%) | 0 (0.0%) |
| Bottled, Tank, or LP Gas | 17 (10.9%) | 0 (0.0%) |
| Electricity | 136 (87.2%) | 91 (96.8%) |
| Fuel Oil or Kerosene | 3 (1.9%) | 0 (0.0%) |
| Coal or Coke | 0 (0.0%) | 0 (0.0%) |
| All other Fuels | 0 (0.0%) | 0 (0.0%) |
| No Fuel Used | 0 (0.0%) | 3 (3.2%) |
| Total | 156 (100.0%) | 94 (100.0%) |
Household Vehicle Usage in Evarts
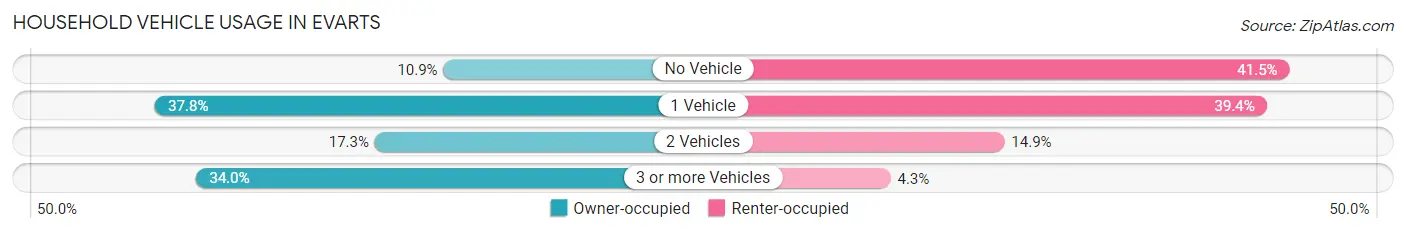
| Vehicles per Household | Owner-occupied | Renter-occupied |
| No Vehicle | 17 (10.9%) | 39 (41.5%) |
| 1 Vehicle | 59 (37.8%) | 37 (39.4%) |
| 2 Vehicles | 27 (17.3%) | 14 (14.9%) |
| 3 or more Vehicles | 53 (34.0%) | 4 (4.3%) |
| Total | 156 (100.0%) | 94 (100.0%) |
Real Estate & Mortgages in Evarts
Real Estate and Mortgage Overview in Evarts
| Characteristic | Without Mortgage | With Mortgage |
| Housing Units | 87 | 69 |
| Median Property Value | $45,900 | $117,000 |
| Median Household Income | $29,375 | $0 |
| Monthly Housing Costs | $388 | $1 |
| Real Estate Taxes | $692 | $14 |
Property Value by Mortgage Status in Evarts
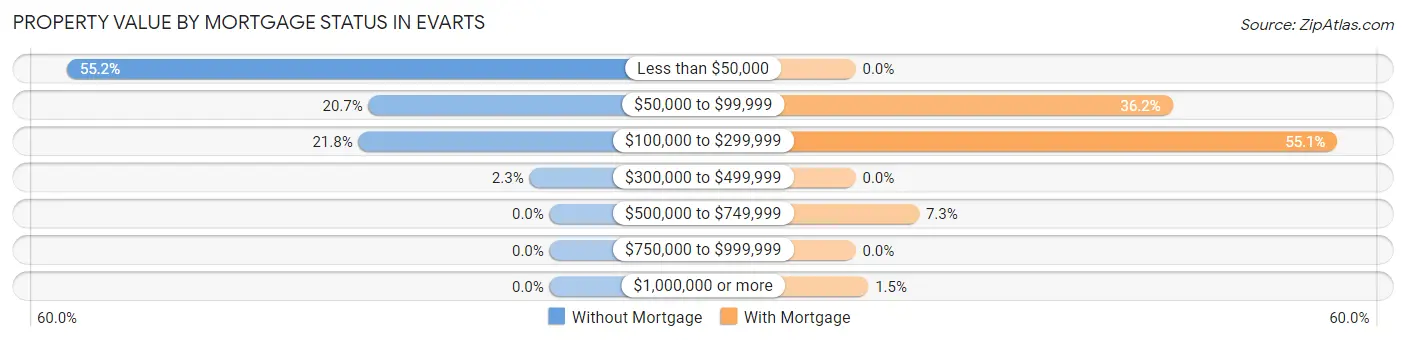
| Property Value | Without Mortgage | With Mortgage |
| Less than $50,000 | 48 (55.2%) | 0 (0.0%) |
| $50,000 to $99,999 | 18 (20.7%) | 25 (36.2%) |
| $100,000 to $299,999 | 19 (21.8%) | 38 (55.1%) |
| $300,000 to $499,999 | 2 (2.3%) | 0 (0.0%) |
| $500,000 to $749,999 | 0 (0.0%) | 5 (7.2%) |
| $750,000 to $999,999 | 0 (0.0%) | 0 (0.0%) |
| $1,000,000 or more | 0 (0.0%) | 1 (1.5%) |
| Total | 87 (100.0%) | 69 (100.0%) |
Household Income by Mortgage Status in Evarts
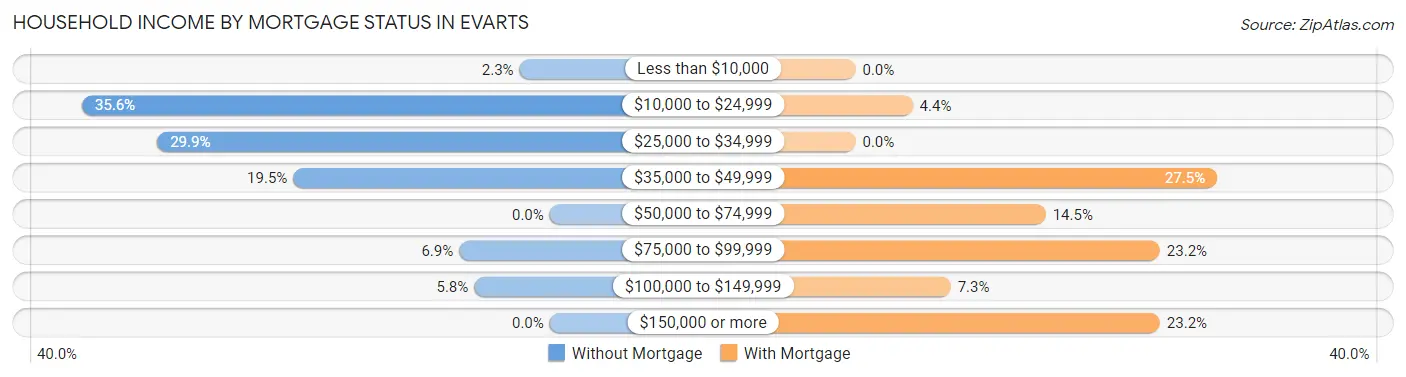
| Household Income | Without Mortgage | With Mortgage |
| Less than $10,000 | 2 (2.3%) | 0 (0.0%) |
| $10,000 to $24,999 | 31 (35.6%) | 3 (4.3%) |
| $25,000 to $34,999 | 26 (29.9%) | 0 (0.0%) |
| $35,000 to $49,999 | 17 (19.5%) | 19 (27.5%) |
| $50,000 to $74,999 | 0 (0.0%) | 10 (14.5%) |
| $75,000 to $99,999 | 6 (6.9%) | 16 (23.2%) |
| $100,000 to $149,999 | 5 (5.8%) | 5 (7.2%) |
| $150,000 or more | 0 (0.0%) | 16 (23.2%) |
| Total | 87 (100.0%) | 69 (100.0%) |
Property Value to Household Income Ratio in Evarts
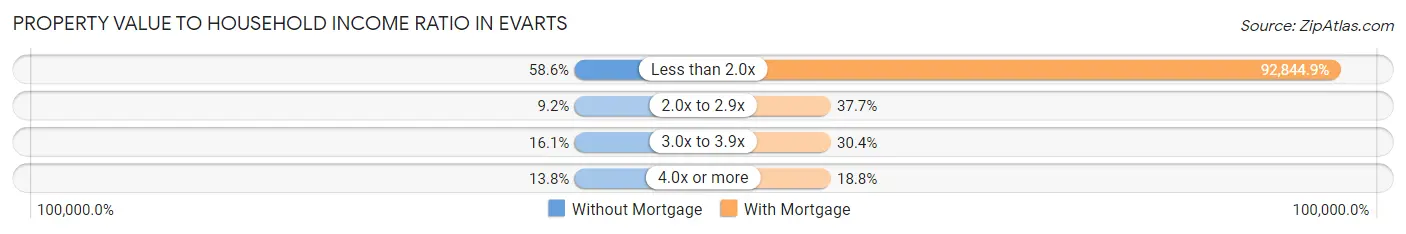
| Value-to-Income Ratio | Without Mortgage | With Mortgage |
| Less than 2.0x | 51 (58.6%) | 64,063 (92,844.9%) |
| 2.0x to 2.9x | 8 (9.2%) | 26 (37.7%) |
| 3.0x to 3.9x | 14 (16.1%) | 21 (30.4%) |
| 4.0x or more | 12 (13.8%) | 13 (18.8%) |
| Total | 87 (100.0%) | 69 (100.0%) |
Real Estate Taxes by Mortgage Status in Evarts
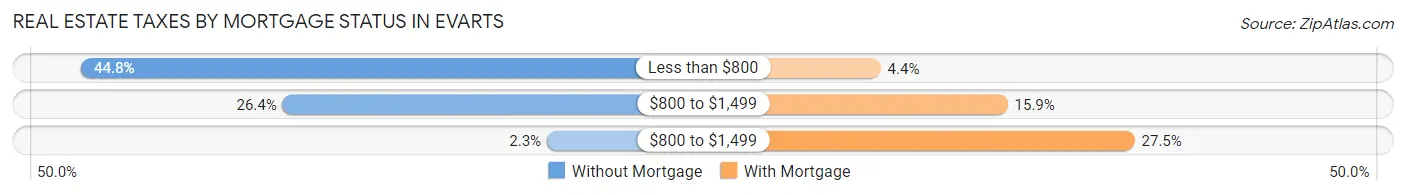
| Property Taxes | Without Mortgage | With Mortgage |
| Less than $800 | 39 (44.8%) | 3 (4.3%) |
| $800 to $1,499 | 23 (26.4%) | 11 (15.9%) |
| $800 to $1,499 | 2 (2.3%) | 19 (27.5%) |
| Total | 87 (100.0%) | 69 (100.0%) |
Health & Disability in Evarts
Health Insurance Coverage by Age in Evarts
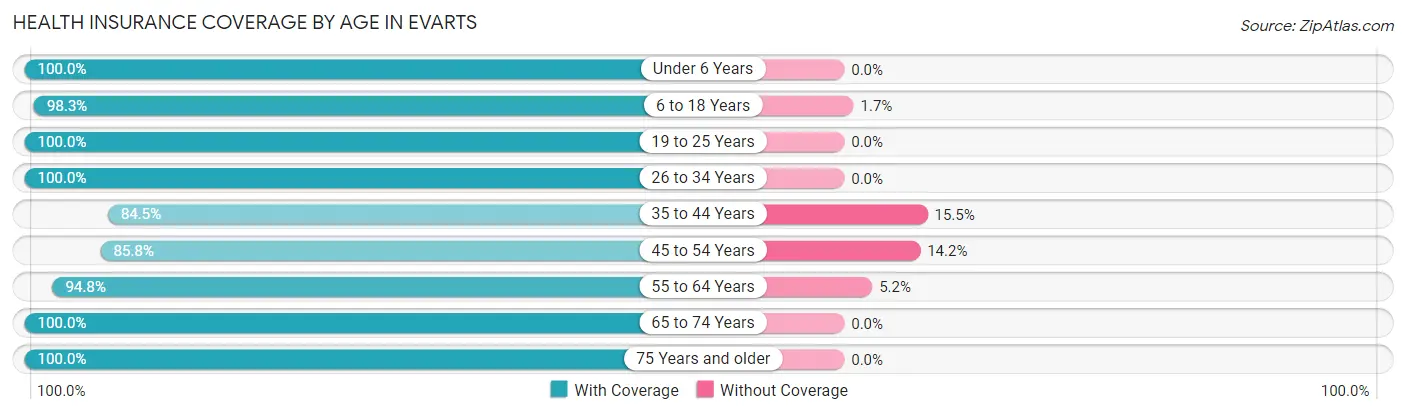
| Age Bracket | With Coverage | Without Coverage |
| Under 6 Years | 46 (100.0%) | 0 (0.0%) |
| 6 to 18 Years | 113 (98.3%) | 2 (1.7%) |
| 19 to 25 Years | 24 (100.0%) | 0 (0.0%) |
| 26 to 34 Years | 69 (100.0%) | 0 (0.0%) |
| 35 to 44 Years | 98 (84.5%) | 18 (15.5%) |
| 45 to 54 Years | 97 (85.8%) | 16 (14.2%) |
| 55 to 64 Years | 91 (94.8%) | 5 (5.2%) |
| 65 to 74 Years | 81 (100.0%) | 0 (0.0%) |
| 75 Years and older | 19 (100.0%) | 0 (0.0%) |
| Total | 638 (94.0%) | 41 (6.0%) |
Health Insurance Coverage by Citizenship Status in Evarts
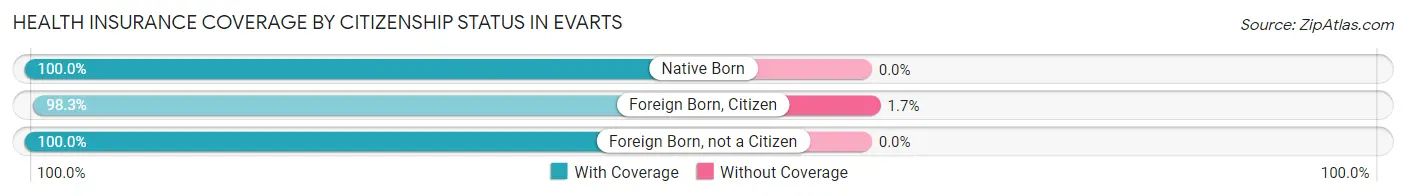
| Citizenship Status | With Coverage | Without Coverage |
| Native Born | 46 (100.0%) | 0 (0.0%) |
| Foreign Born, Citizen | 113 (98.3%) | 2 (1.7%) |
| Foreign Born, not a Citizen | 24 (100.0%) | 0 (0.0%) |
Health Insurance Coverage by Household Income in Evarts
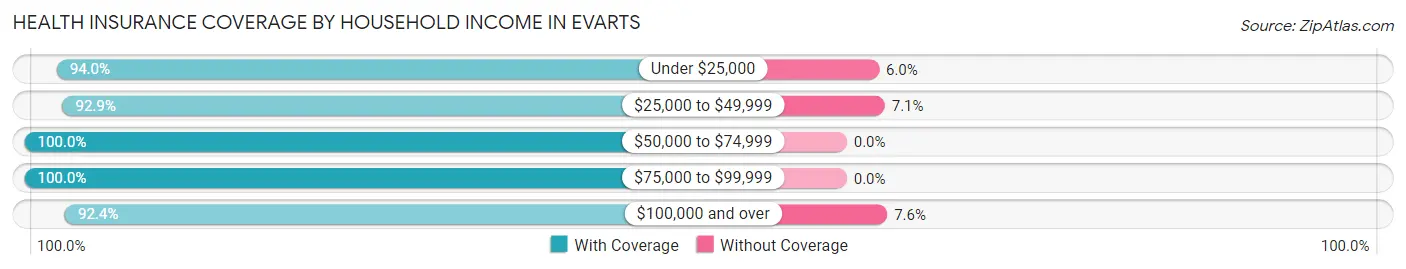
| Household Income | With Coverage | Without Coverage |
| Under $25,000 | 140 (94.0%) | 9 (6.0%) |
| $25,000 to $49,999 | 352 (92.9%) | 27 (7.1%) |
| $50,000 to $74,999 | 57 (100.0%) | 0 (0.0%) |
| $75,000 to $99,999 | 28 (100.0%) | 0 (0.0%) |
| $100,000 and over | 61 (92.4%) | 5 (7.6%) |
Public vs Private Health Insurance Coverage by Age in Evarts
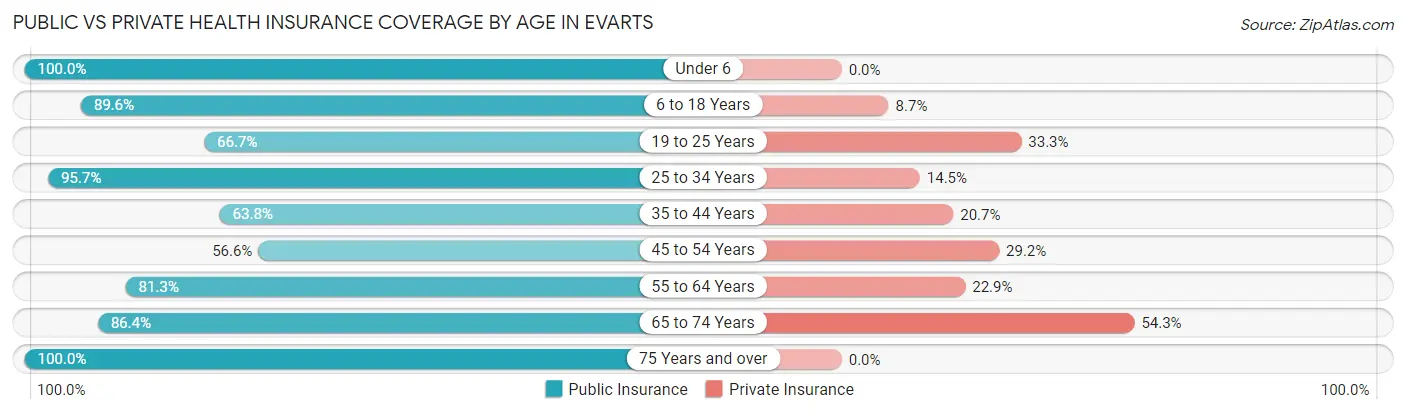
| Age Bracket | Public Insurance | Private Insurance |
| Under 6 | 46 (100.0%) | 0 (0.0%) |
| 6 to 18 Years | 103 (89.6%) | 10 (8.7%) |
| 19 to 25 Years | 16 (66.7%) | 8 (33.3%) |
| 25 to 34 Years | 66 (95.7%) | 10 (14.5%) |
| 35 to 44 Years | 74 (63.8%) | 24 (20.7%) |
| 45 to 54 Years | 64 (56.6%) | 33 (29.2%) |
| 55 to 64 Years | 78 (81.2%) | 22 (22.9%) |
| 65 to 74 Years | 70 (86.4%) | 44 (54.3%) |
| 75 Years and over | 19 (100.0%) | 0 (0.0%) |
| Total | 536 (78.9%) | 151 (22.2%) |
Disability Status by Sex by Age in Evarts
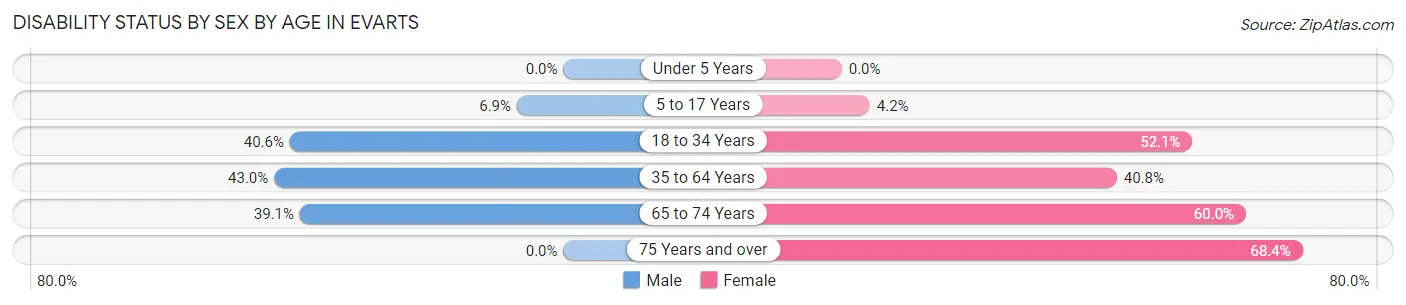
| Age Bracket | Male | Female |
| Under 5 Years | 0 (0.0%) | 0 (0.0%) |
| 5 to 17 Years | 2 (6.9%) | 4 (4.2%) |
| 18 to 34 Years | 13 (40.6%) | 38 (52.0%) |
| 35 to 64 Years | 67 (42.9%) | 69 (40.8%) |
| 65 to 74 Years | 18 (39.1%) | 21 (60.0%) |
| 75 Years and over | 0 (0.0%) | 13 (68.4%) |
Disability Class by Sex by Age in Evarts
Disability Class: Hearing Difficulty
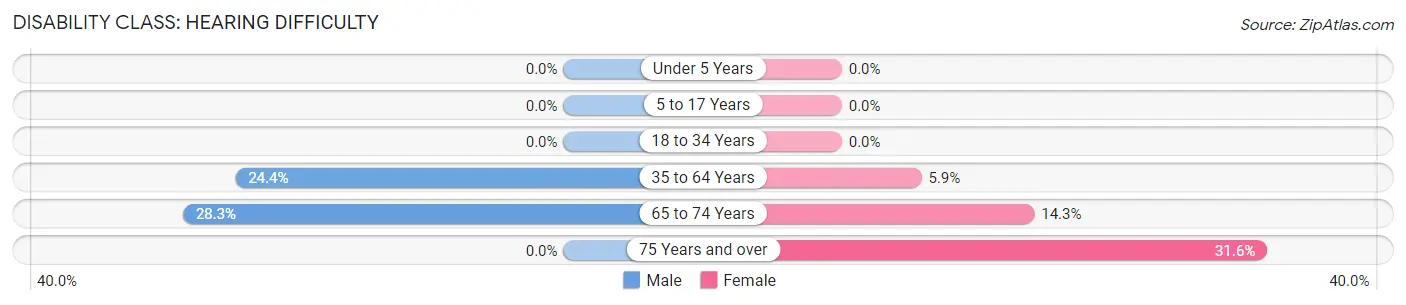
| Age Bracket | Male | Female |
| Under 5 Years | 0 (0.0%) | 0 (0.0%) |
| 5 to 17 Years | 0 (0.0%) | 0 (0.0%) |
| 18 to 34 Years | 0 (0.0%) | 0 (0.0%) |
| 35 to 64 Years | 38 (24.4%) | 10 (5.9%) |
| 65 to 74 Years | 13 (28.3%) | 5 (14.3%) |
| 75 Years and over | 0 (0.0%) | 6 (31.6%) |
Disability Class: Vision Difficulty
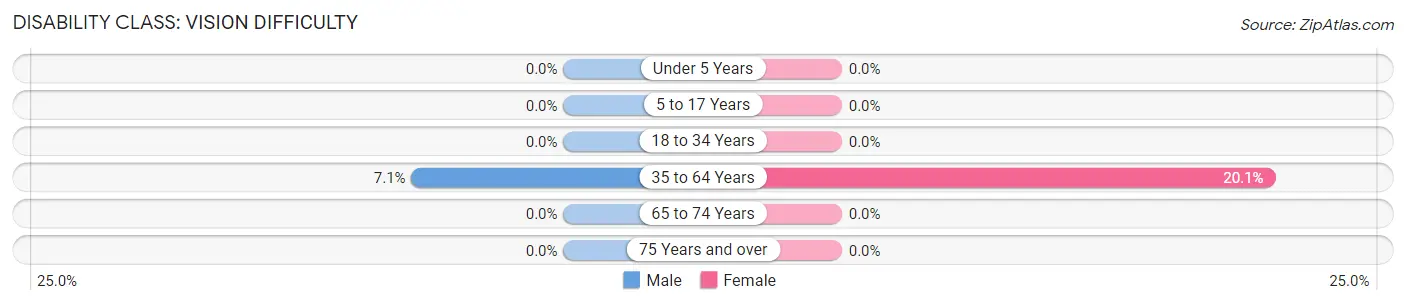
| Age Bracket | Male | Female |
| Under 5 Years | 0 (0.0%) | 0 (0.0%) |
| 5 to 17 Years | 0 (0.0%) | 0 (0.0%) |
| 18 to 34 Years | 0 (0.0%) | 0 (0.0%) |
| 35 to 64 Years | 11 (7.0%) | 34 (20.1%) |
| 65 to 74 Years | 0 (0.0%) | 0 (0.0%) |
| 75 Years and over | 0 (0.0%) | 0 (0.0%) |
Disability Class: Cognitive Difficulty
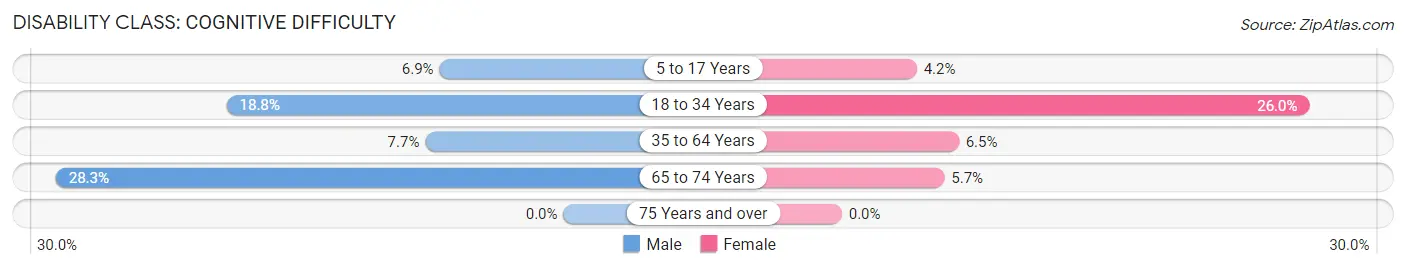
| Age Bracket | Male | Female |
| 5 to 17 Years | 2 (6.9%) | 4 (4.2%) |
| 18 to 34 Years | 6 (18.8%) | 19 (26.0%) |
| 35 to 64 Years | 12 (7.7%) | 11 (6.5%) |
| 65 to 74 Years | 13 (28.3%) | 2 (5.7%) |
| 75 Years and over | 0 (0.0%) | 0 (0.0%) |
Disability Class: Ambulatory Difficulty
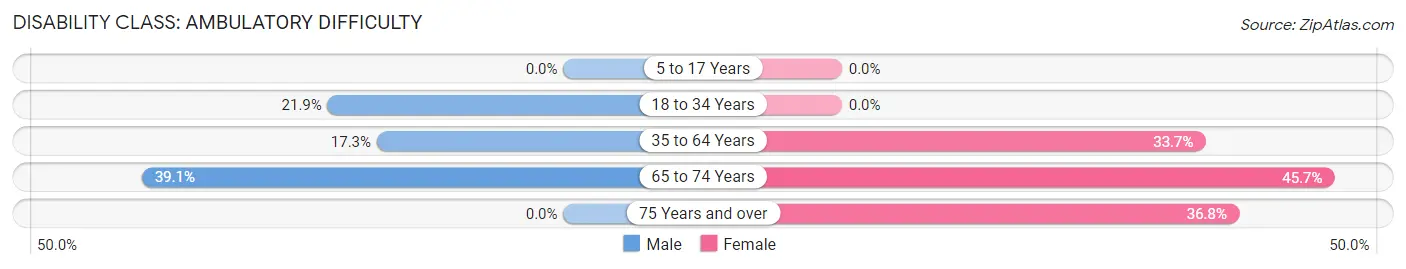
| Age Bracket | Male | Female |
| 5 to 17 Years | 0 (0.0%) | 0 (0.0%) |
| 18 to 34 Years | 7 (21.9%) | 0 (0.0%) |
| 35 to 64 Years | 27 (17.3%) | 57 (33.7%) |
| 65 to 74 Years | 18 (39.1%) | 16 (45.7%) |
| 75 Years and over | 0 (0.0%) | 7 (36.8%) |
Disability Class: Self-Care Difficulty
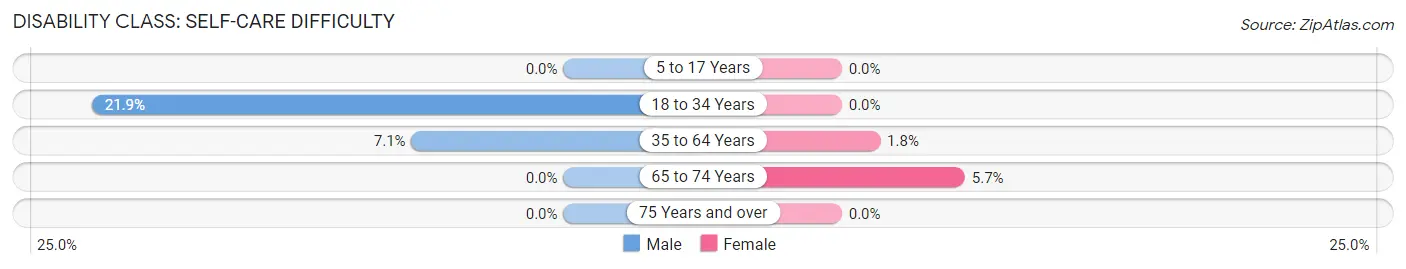
| Age Bracket | Male | Female |
| 5 to 17 Years | 0 (0.0%) | 0 (0.0%) |
| 18 to 34 Years | 7 (21.9%) | 0 (0.0%) |
| 35 to 64 Years | 11 (7.0%) | 3 (1.8%) |
| 65 to 74 Years | 0 (0.0%) | 2 (5.7%) |
| 75 Years and over | 0 (0.0%) | 0 (0.0%) |
Technology Access in Evarts
Computing Device Access in Evarts
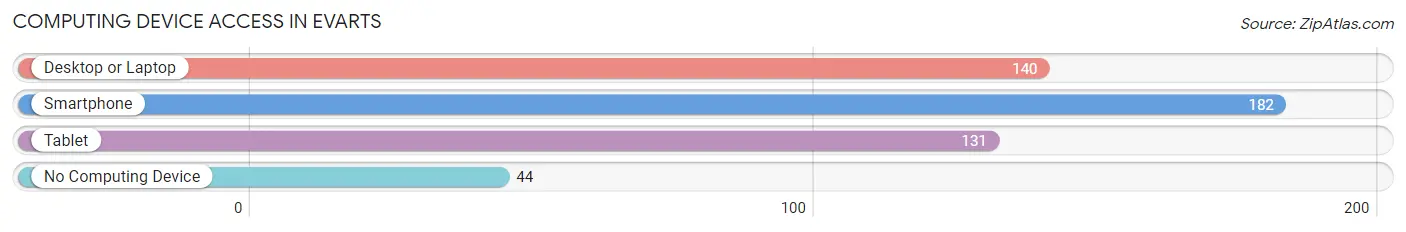
| Device Type | # Households | % Households |
| Desktop or Laptop | 140 | 56.0% |
| Smartphone | 182 | 72.8% |
| Tablet | 131 | 52.4% |
| No Computing Device | 44 | 17.6% |
| Total | 250 | 100.0% |
Internet Access in Evarts
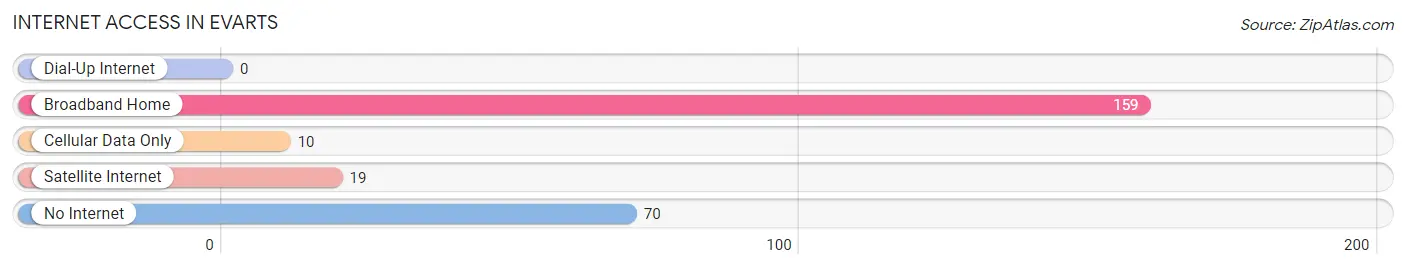
| Internet Type | # Households | % Households |
| Dial-Up Internet | 0 | 0.0% |
| Broadband Home | 159 | 63.6% |
| Cellular Data Only | 10 | 4.0% |
| Satellite Internet | 19 | 7.6% |
| No Internet | 70 | 28.0% |
| Total | 250 | 100.0% |
Evarts Summary
Evarts is a small city located in Harlan County, Kentucky. It is situated in the southeastern corner of the state, near the Virginia border. The city has a population of 1,717 people, according to the 2010 census.
Geography
Evarts is located in the Appalachian Mountains of southeastern Kentucky. The city is situated in a valley between two mountain ridges, the Pine Mountain and the Cumberland Mountains. The city is located at an elevation of 1,845 feet above sea level. The city is surrounded by the Daniel Boone National Forest, which provides a variety of recreational activities.
The city is located along the Cumberland River, which provides a source of water for the city. The city is also located near the Kentucky-Virginia border, which is approximately 20 miles away.
Climate
Evarts has a humid subtropical climate, with hot summers and mild winters. The average temperature in the summer is around 80 degrees Fahrenheit, while the average temperature in the winter is around 40 degrees Fahrenheit. The city receives an average of 45 inches of precipitation per year.
Demographics
As of the 2010 census, the population of Evarts was 1,717 people. The racial makeup of the city was 97.2% White, 0.9% African American, 0.2% Native American, 0.2% Asian, 0.1% Pacific Islander, 0.3% from other races, and 0.9% from two or more races. Hispanic or Latino of any race were 1.2% of the population.
Economy
Evarts is a small city with a limited economy. The city is home to several small businesses, including a grocery store, a hardware store, and a few restaurants. The city is also home to a few manufacturing companies, including a furniture manufacturer and a plastics manufacturer.
The city is also home to a few coal mines, which provide employment for many of the city's residents. The city is also home to a few tourist attractions, including the Pine Mountain State Park and the Cumberland Gap National Historical Park.
History
Evarts was founded in 1883 by a group of settlers from Virginia. The city was named after the Evarts family, who were among the first settlers in the area. The city was incorporated in 1891.
In the early 1900s, the city experienced a period of growth due to the coal mining industry. The city was home to several coal mines, which provided employment for many of the city's residents.
In the 1950s, the city experienced a period of decline due to the decline of the coal mining industry. The city's population decreased significantly during this time.
In the late 1970s, the city experienced a period of revitalization due to the development of the Daniel Boone National Forest. The city is now home to several tourist attractions, including the Pine Mountain State Park and the Cumberland Gap National Historical Park.
Conclusion
Evarts is a small city located in Harlan County, Kentucky. It is situated in the Appalachian Mountains of southeastern Kentucky, near the Virginia border. The city has a population of 1,717 people, according to the 2010 census. The city is home to several small businesses, manufacturing companies, and coal mines. The city is also home to several tourist attractions, including the Pine Mountain State Park and the Cumberland Gap National Historical Park. The city experienced a period of growth in the early 1900s due to the coal mining industry, and a period of revitalization in the late 1970s due to the development of the Daniel Boone National Forest.
Common Questions
What is Per Capita Income in Evarts?
Per Capita income in Evarts is $14,220.
What is the Median Family Income in Evarts?
Median Family Income in Evarts is $37,250.
What is the Median Household income in Evarts?
Median Household Income in Evarts is $32,222.
What is Inequality or Gini Index in Evarts?
Inequality or Gini Index in Evarts is 0.37.
What is the Total Population of Evarts?
Total Population of Evarts is 874.
What is the Total Male Population of Evarts?
Total Male Population of Evarts is 440.
What is the Total Female Population of Evarts?
Total Female Population of Evarts is 434.
What is the Ratio of Males per 100 Females in Evarts?
There are 101.38 Males per 100 Females in Evarts.
What is the Ratio of Females per 100 Males in Evarts?
There are 98.64 Females per 100 Males in Evarts.
What is the Median Population Age in Evarts?
Median Population Age in Evarts is 40.3 Years.
What is the Average Family Size in Evarts
Average Family Size in Evarts is 3.0 People.
What is the Average Household Size in Evarts
Average Household Size in Evarts is 2.7 People.
How Large is the Labor Force in Evarts?
There are 228 People in the Labor Forcein in Evarts.
What is the Percentage of People in the Labor Force in Evarts?
30.9% of People are in the Labor Force in Evarts.
What is the Unemployment Rate in Evarts?
Unemployment Rate in Evarts is 19.7%.