Falmouth, KY Map & Demographics
Falmouth Map
Falmouth Overview
$17,882
PER CAPITA INCOME
$51,000
AVG FAMILY INCOME
$38,021
AVG HOUSEHOLD INCOME
62.9%
WAGE / INCOME GAP [ % ]
37.1¢/ $1
WAGE / INCOME GAP [ $ ]
$15,035
FAMILY INCOME DEFICIT
0.45
INEQUALITY / GINI INDEX
2,548
TOTAL POPULATION
1,151
MALE POPULATION
1,397
FEMALE POPULATION
82.39
MALES / 100 FEMALES
121.37
FEMALES / 100 MALES
35.2
MEDIAN AGE
3.2
AVG FAMILY SIZE
2.5
AVG HOUSEHOLD SIZE
1,098
LABOR FORCE [ PEOPLE ]
58.3%
PERCENT IN LABOR FORCE
6.5%
UNEMPLOYMENT RATE
Falmouth Zip Codes
Falmouth Area Codes
Income in Falmouth
Income Overview in Falmouth
Per Capita Income in Falmouth is $17,882, while median incomes of families and households are $51,000 and $38,021 respectively.
| Characteristic | Number | Measure |
| Per Capita Income | 2,548 | $17,882 |
| Median Family Income | 632 | $51,000 |
| Mean Family Income | 632 | $53,410 |
| Median Household Income | 996 | $38,021 |
| Mean Household Income | 996 | $43,911 |
| Income Deficit | 632 | $15,035 |
| Wage / Income Gap (%) | 2,548 | 62.86% |
| Wage / Income Gap ($) | 2,548 | 37.14¢ per $1 |
| Gini / Inequality Index | 2,548 | 0.45 |
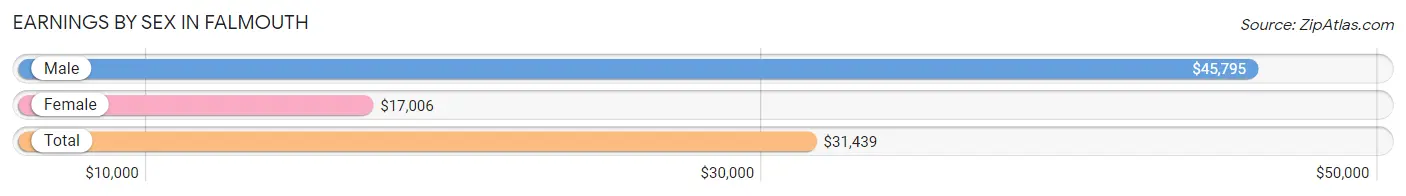
Earnings by Sex in Falmouth
Average Earnings in Falmouth are $31,439, $45,795 for men and $17,006 for women, a difference of 62.9%.
| Sex | Number | Average Earnings |
| Male | 536 (49.9%) | $45,795 |
| Female | 537 (50.0%) | $17,006 |
| Total | 1,073 (100.0%) | $31,439 |
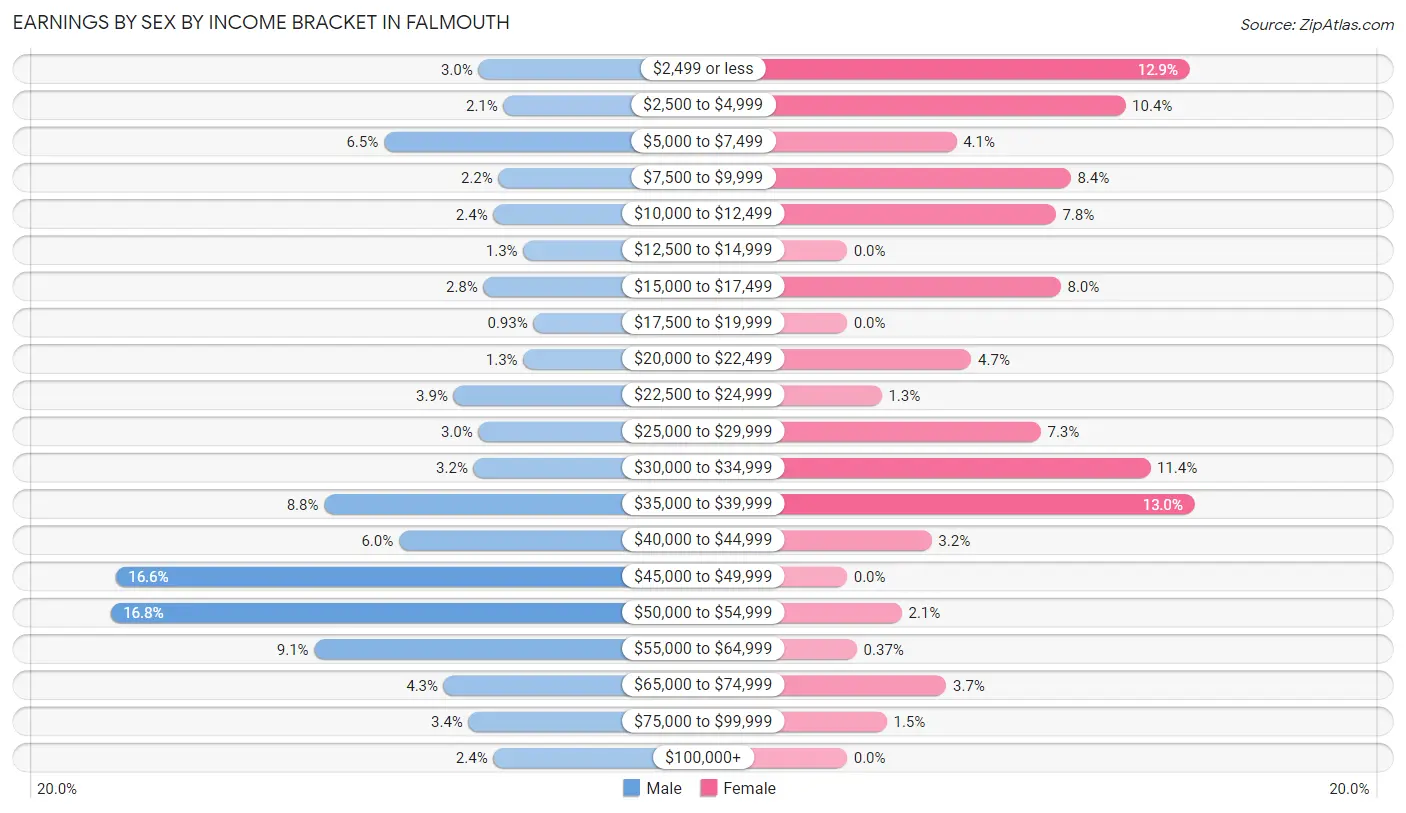
Earnings by Sex by Income Bracket in Falmouth
The most common earnings brackets in Falmouth are $50,000 to $54,999 for men (90 | 16.8%) and $35,000 to $39,999 for women (70 | 13.0%).
| Income | Male | Female |
| $2,499 or less | 16 (3.0%) | 69 (12.9%) |
| $2,500 to $4,999 | 11 (2.1%) | 56 (10.4%) |
| $5,000 to $7,499 | 35 (6.5%) | 22 (4.1%) |
| $7,500 to $9,999 | 12 (2.2%) | 45 (8.4%) |
| $10,000 to $12,499 | 13 (2.4%) | 42 (7.8%) |
| $12,500 to $14,999 | 7 (1.3%) | 0 (0.0%) |
| $15,000 to $17,499 | 15 (2.8%) | 43 (8.0%) |
| $17,500 to $19,999 | 5 (0.9%) | 0 (0.0%) |
| $20,000 to $22,499 | 7 (1.3%) | 25 (4.7%) |
| $22,500 to $24,999 | 21 (3.9%) | 7 (1.3%) |
| $25,000 to $29,999 | 16 (3.0%) | 39 (7.3%) |
| $30,000 to $34,999 | 17 (3.2%) | 61 (11.4%) |
| $35,000 to $39,999 | 47 (8.8%) | 70 (13.0%) |
| $40,000 to $44,999 | 32 (6.0%) | 17 (3.2%) |
| $45,000 to $49,999 | 89 (16.6%) | 0 (0.0%) |
| $50,000 to $54,999 | 90 (16.8%) | 11 (2.1%) |
| $55,000 to $64,999 | 49 (9.1%) | 2 (0.4%) |
| $65,000 to $74,999 | 23 (4.3%) | 20 (3.7%) |
| $75,000 to $99,999 | 18 (3.4%) | 8 (1.5%) |
| $100,000+ | 13 (2.4%) | 0 (0.0%) |
| Total | 536 (100.0%) | 537 (100.0%) |
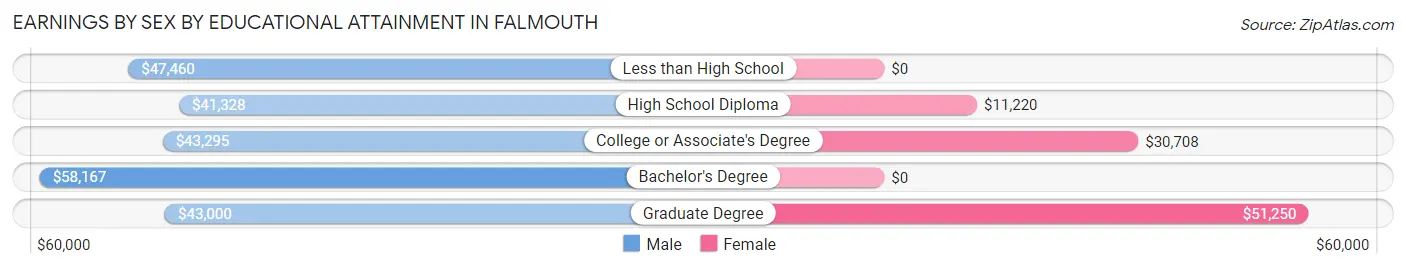
Earnings by Sex by Educational Attainment in Falmouth
Average earnings in Falmouth are $46,960 for men and $17,471 for women, a difference of 62.8%. Men with an educational attainment of bachelor's degree enjoy the highest average annual earnings of $58,167, while those with high school diploma education earn the least with $41,328. Women with an educational attainment of graduate degree earn the most with the average annual earnings of $51,250, while those with high school diploma education have the smallest earnings of $11,220.
| Educational Attainment | Male Income | Female Income |
| Less than High School | $47,460 | $0 |
| High School Diploma | $41,328 | $11,220 |
| College or Associate's Degree | $43,295 | $30,708 |
| Bachelor's Degree | $58,167 | $0 |
| Graduate Degree | $43,000 | $51,250 |
| Total | $46,960 | $17,471 |
Family Income in Falmouth
Family Income Brackets in Falmouth
According to the Falmouth family income data, there are 183 families falling into the $50,000 to $74,999 income range, which is the most common income bracket and makes up 29.0% of all families.
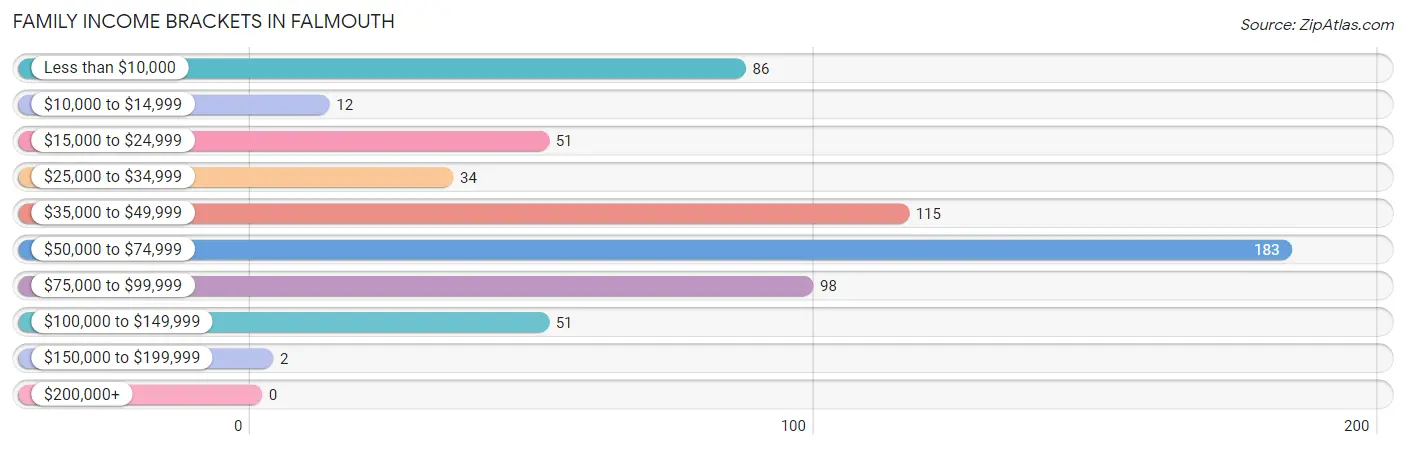
| Income Bracket | # Families | % Families |
| Less than $10,000 | 86 | 13.6% |
| $10,000 to $14,999 | 12 | 1.9% |
| $15,000 to $24,999 | 51 | 8.1% |
| $25,000 to $34,999 | 34 | 5.4% |
| $35,000 to $49,999 | 115 | 18.2% |
| $50,000 to $74,999 | 183 | 29.0% |
| $75,000 to $99,999 | 98 | 15.5% |
| $100,000 to $149,999 | 51 | 8.1% |
| $150,000 to $199,999 | 2 | 0.3% |
| $200,000+ | 0 | 0.0% |
Family Income by Famaliy Size in Falmouth
3-person families (255 | 40.4%) account for the highest median family income in Falmouth with $53,533 per family, while 2-person families (256 | 40.5%) have the highest median income of $25,384 per family member.
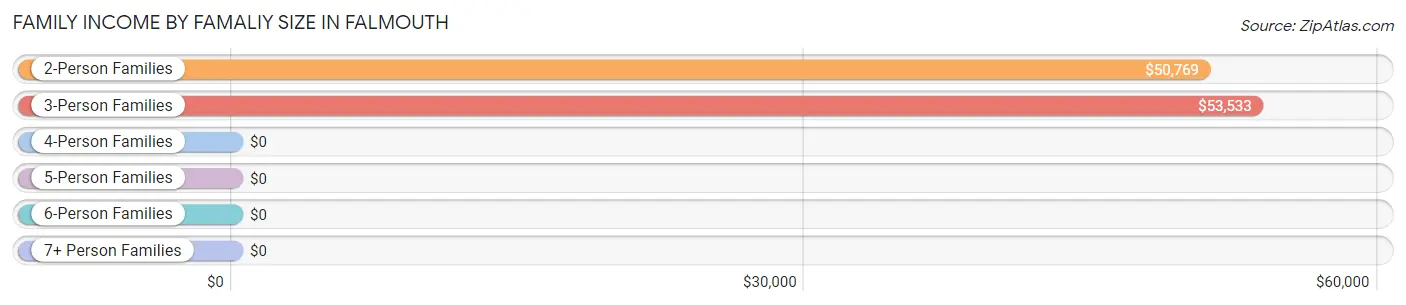
| Income Bracket | # Families | Median Income |
| 2-Person Families | 256 (40.5%) | $50,769 |
| 3-Person Families | 255 (40.4%) | $53,533 |
| 4-Person Families | 47 (7.4%) | $0 |
| 5-Person Families | 38 (6.0%) | $0 |
| 6-Person Families | 0 (0.0%) | $0 |
| 7+ Person Families | 36 (5.7%) | $0 |
| Total | 632 (100.0%) | $51,000 |
Family Income by Number of Earners in Falmouth
The median family income in Falmouth is $51,000, with families comprising 3+ earners (30) having the highest median family income of $110,000, while families with no earners (91) have the lowest median family income of $34,250, accounting for 4.8% and 14.4% of families, respectively.
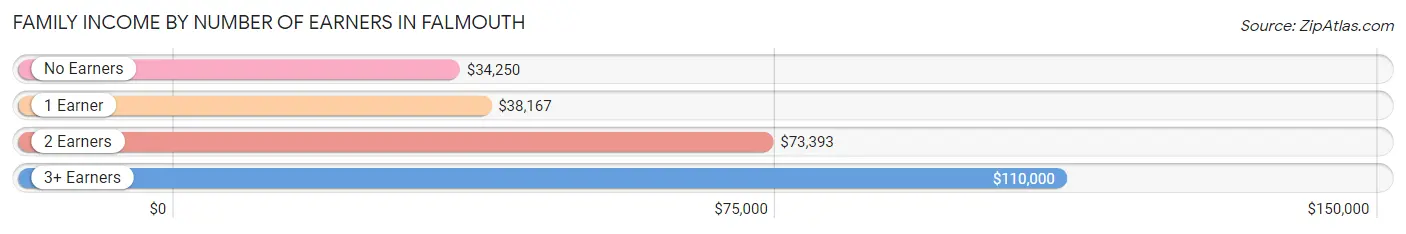
| Number of Earners | # Families | Median Income |
| No Earners | 91 (14.4%) | $34,250 |
| 1 Earner | 274 (43.3%) | $38,167 |
| 2 Earners | 237 (37.5%) | $73,393 |
| 3+ Earners | 30 (4.8%) | $110,000 |
| Total | 632 (100.0%) | $51,000 |
Household Income in Falmouth
Household Income Brackets in Falmouth
With 222 households falling in the category, the less than $10,000 income range is the most frequent in Falmouth, accounting for 22.3% of all households.
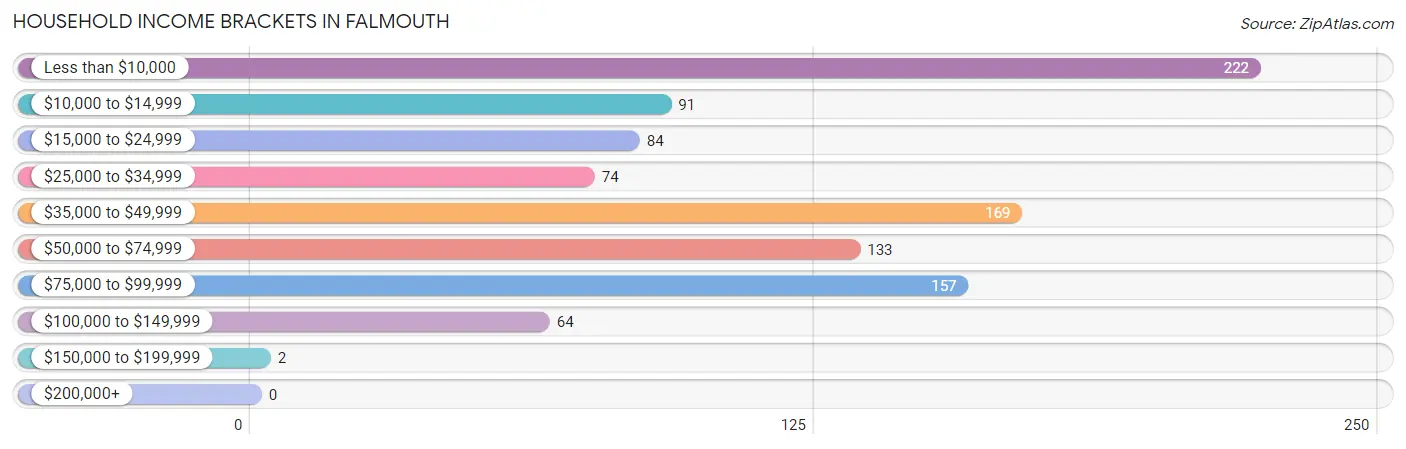
| Income Bracket | # Households | % Households |
| Less than $10,000 | 222 | 22.3% |
| $10,000 to $14,999 | 91 | 9.1% |
| $15,000 to $24,999 | 84 | 8.4% |
| $25,000 to $34,999 | 74 | 7.4% |
| $35,000 to $49,999 | 169 | 17.0% |
| $50,000 to $74,999 | 133 | 13.4% |
| $75,000 to $99,999 | 157 | 15.8% |
| $100,000 to $149,999 | 64 | 6.4% |
| $150,000 to $199,999 | 2 | 0.2% |
| $200,000+ | 0 | 0.0% |
Household Income by Householder Age in Falmouth
The median household income in Falmouth is $38,021, with the highest median household income of $51,667 found in the 25 to 44 years age bracket for the primary householder. A total of 344 households (34.5%) fall into this category. Meanwhile, the 15 to 24 years age bracket for the primary householder has the lowest median household income of $0, with 19 households (1.9%) in this group.
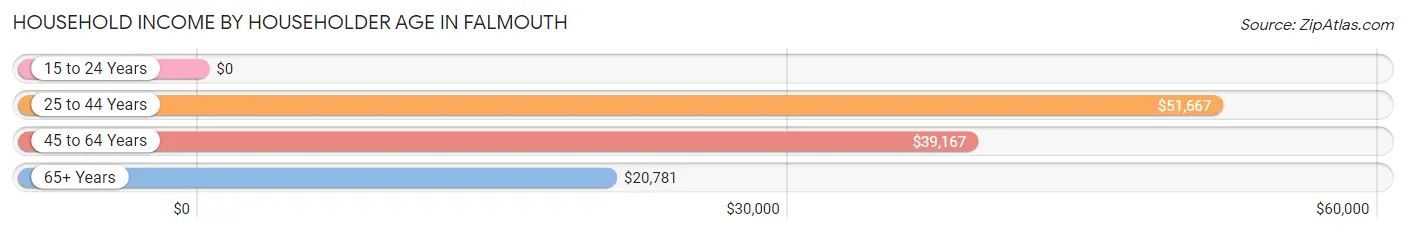
| Income Bracket | # Households | Median Income |
| 15 to 24 Years | 19 (1.9%) | $0 |
| 25 to 44 Years | 344 (34.5%) | $51,667 |
| 45 to 64 Years | 390 (39.2%) | $39,167 |
| 65+ Years | 243 (24.4%) | $20,781 |
| Total | 996 (100.0%) | $38,021 |
Poverty in Falmouth
Income Below Poverty by Sex and Age in Falmouth
With 28.3% poverty level for males and 35.0% for females among the residents of Falmouth, 5 year old males and 12 to 14 year old females are the most vulnerable to poverty, with 13 males (100.0%) and 69 females (62.2%) in their respective age groups living below the poverty level.
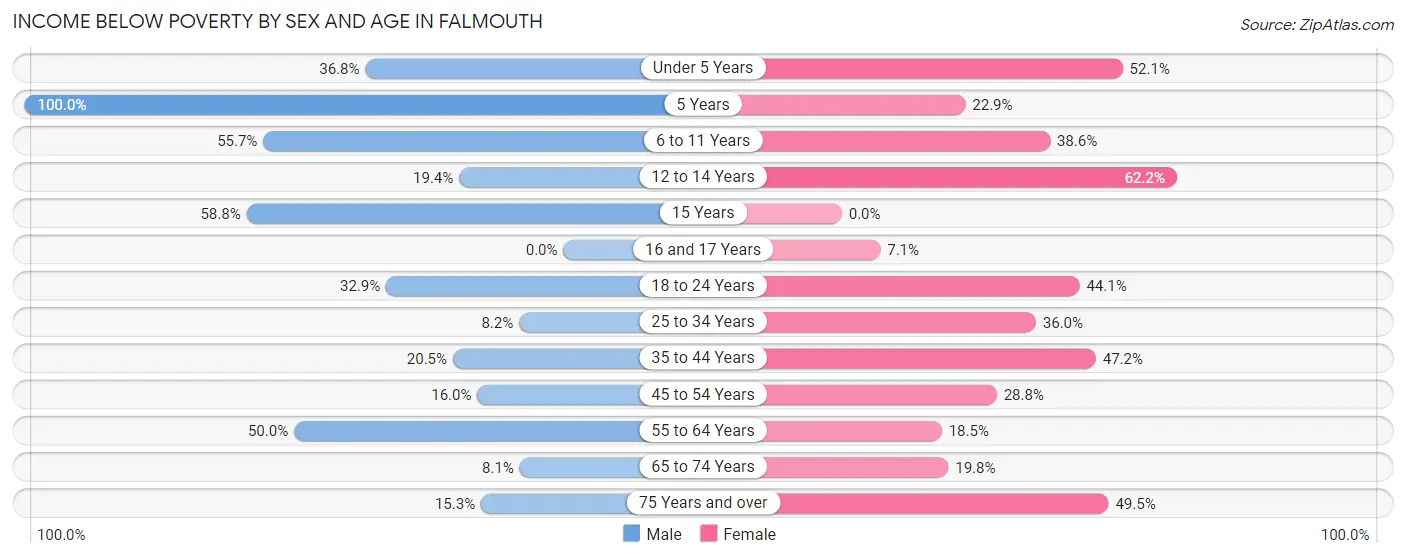
| Age Bracket | Male | Female |
| Under 5 Years | 61 (36.7%) | 49 (52.1%) |
| 5 Years | 13 (100.0%) | 25 (22.9%) |
| 6 to 11 Years | 39 (55.7%) | 17 (38.6%) |
| 12 to 14 Years | 6 (19.4%) | 69 (62.2%) |
| 15 Years | 10 (58.8%) | 0 (0.0%) |
| 16 and 17 Years | 0 (0.0%) | 2 (7.1%) |
| 18 to 24 Years | 26 (32.9%) | 30 (44.1%) |
| 25 to 34 Years | 18 (8.2%) | 76 (36.0%) |
| 35 to 44 Years | 16 (20.5%) | 58 (47.1%) |
| 45 to 54 Years | 19 (16.0%) | 46 (28.7%) |
| 55 to 64 Years | 98 (50.0%) | 28 (18.5%) |
| 65 to 74 Years | 6 (8.1%) | 35 (19.8%) |
| 75 Years and over | 13 (15.3%) | 50 (49.5%) |
| Total | 325 (28.3%) | 485 (35.0%) |
Income Above Poverty by Sex and Age in Falmouth
According to the poverty statistics in Falmouth, males aged 65 to 74 years and females aged 15 years are the age groups that are most secure financially, with 91.9% of males and 100.0% of females in these age groups living above the poverty line.
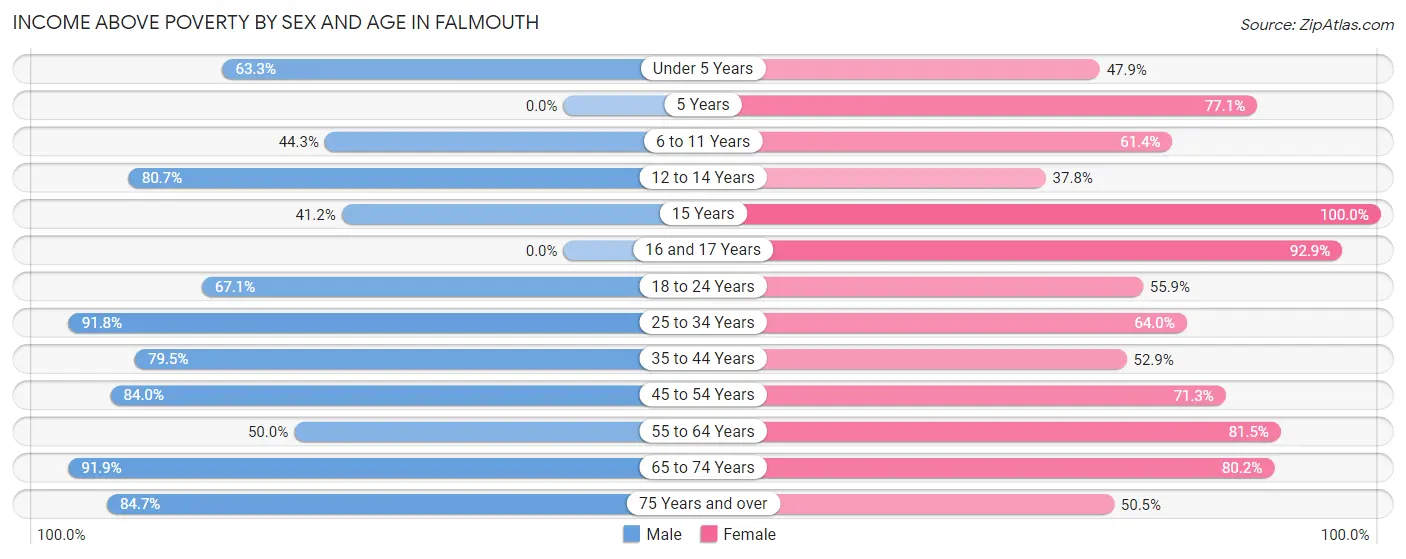
| Age Bracket | Male | Female |
| Under 5 Years | 105 (63.2%) | 45 (47.9%) |
| 5 Years | 0 (0.0%) | 84 (77.1%) |
| 6 to 11 Years | 31 (44.3%) | 27 (61.4%) |
| 12 to 14 Years | 25 (80.6%) | 42 (37.8%) |
| 15 Years | 7 (41.2%) | 10 (100.0%) |
| 16 and 17 Years | 0 (0.0%) | 26 (92.9%) |
| 18 to 24 Years | 53 (67.1%) | 38 (55.9%) |
| 25 to 34 Years | 201 (91.8%) | 135 (64.0%) |
| 35 to 44 Years | 62 (79.5%) | 65 (52.8%) |
| 45 to 54 Years | 100 (84.0%) | 114 (71.3%) |
| 55 to 64 Years | 98 (50.0%) | 123 (81.5%) |
| 65 to 74 Years | 68 (91.9%) | 142 (80.2%) |
| 75 Years and over | 72 (84.7%) | 51 (50.5%) |
| Total | 822 (71.7%) | 902 (65.0%) |
Income Below Poverty Among Married-Couple Families in Falmouth
The poverty statistics for married-couple families in Falmouth show that 10.7% or 38 of the total 354 families live below the poverty line. Families with 3 or 4 children have the highest poverty rate of 31.2%, comprising of 10 families. On the other hand, families with 5 or more children have the lowest poverty rate of 0.0%, which includes 0 families.
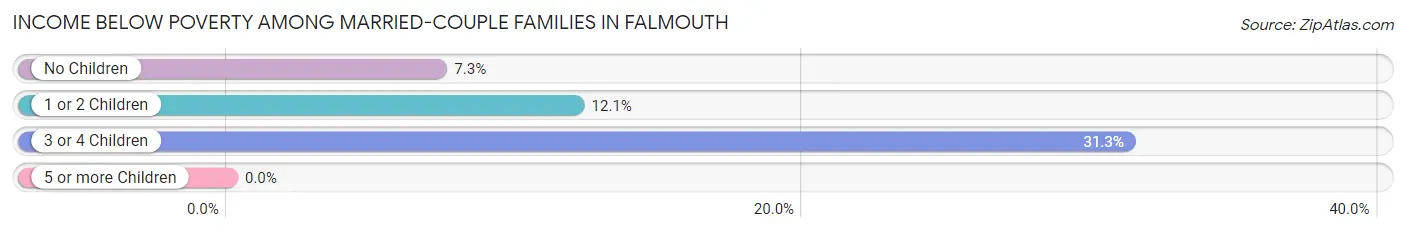
| Children | Above Poverty | Below Poverty |
| No Children | 178 (92.7%) | 14 (7.3%) |
| 1 or 2 Children | 102 (87.9%) | 14 (12.1%) |
| 3 or 4 Children | 22 (68.8%) | 10 (31.2%) |
| 5 or more Children | 14 (100.0%) | 0 (0.0%) |
| Total | 316 (89.3%) | 38 (10.7%) |
Income Below Poverty Among Single-Parent Households in Falmouth
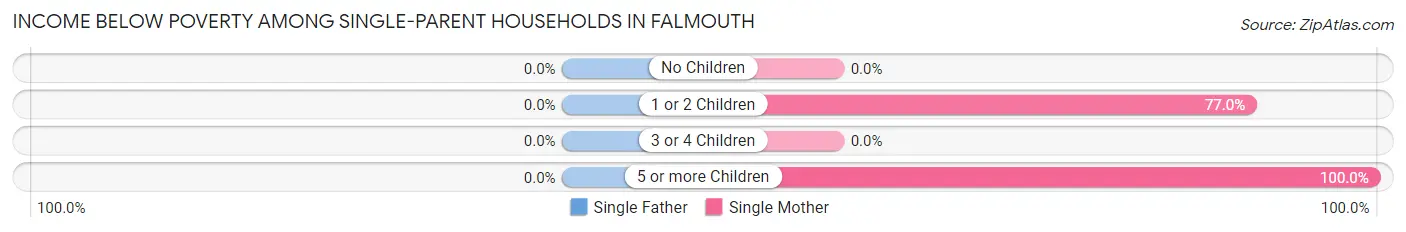
| Children | Single Father | Single Mother |
| No Children | 0 (0.0%) | 0 (0.0%) |
| 1 or 2 Children | 0 (0.0%) | 97 (77.0%) |
| 3 or 4 Children | 0 (0.0%) | 0 (0.0%) |
| 5 or more Children | 0 (0.0%) | 12 (100.0%) |
| Total | 0 (0.0%) | 109 (64.1%) |
Income Below Poverty Among Married-Couple vs Single-Parent Households in Falmouth
The poverty data for Falmouth shows that 38 of the married-couple family households (10.7%) and 109 of the single-parent households (39.2%) are living below the poverty level. Within the married-couple family households, those with 3 or 4 children have the highest poverty rate, with 10 households (31.2%) falling below the poverty line. Among the single-parent households, those with 5 or more children have the highest poverty rate, with 12 household (100.0%) living below poverty.
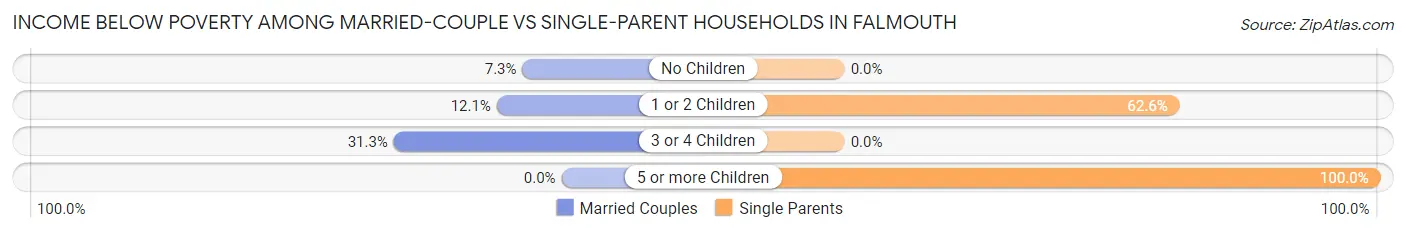
| Children | Married-Couple Families | Single-Parent Households |
| No Children | 14 (7.3%) | 0 (0.0%) |
| 1 or 2 Children | 14 (12.1%) | 97 (62.6%) |
| 3 or 4 Children | 10 (31.2%) | 0 (0.0%) |
| 5 or more Children | 0 (0.0%) | 12 (100.0%) |
| Total | 38 (10.7%) | 109 (39.2%) |
Race in Falmouth
The most populous races in Falmouth are White / Caucasian (2,485 | 97.5%), Two or more Races (40 | 1.6%), and Black / African American (18 | 0.7%).
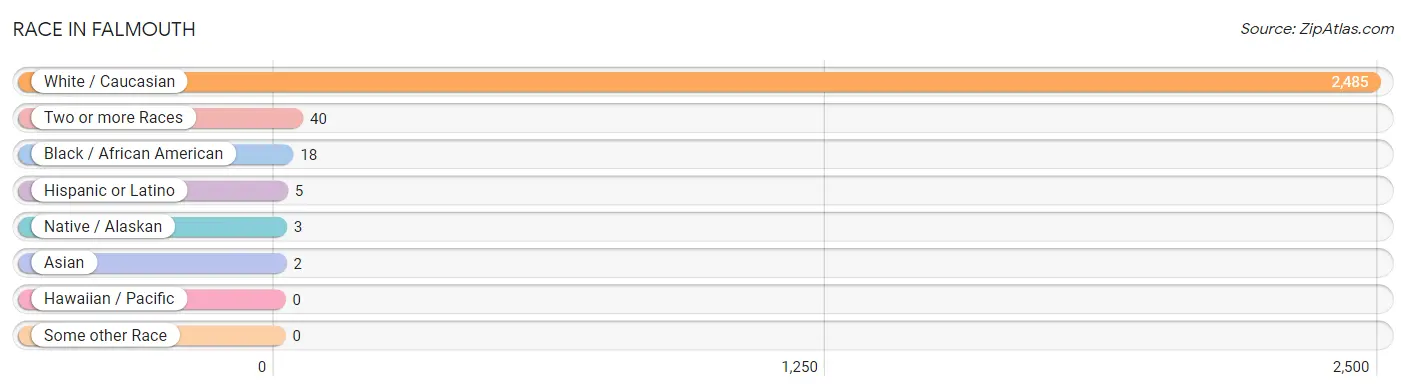
| Race | # Population | % Population |
| Asian | 2 | 0.1% |
| Black / African American | 18 | 0.7% |
| Hawaiian / Pacific | 0 | 0.0% |
| Hispanic or Latino | 5 | 0.2% |
| Native / Alaskan | 3 | 0.1% |
| White / Caucasian | 2,485 | 97.5% |
| Two or more Races | 40 | 1.6% |
| Some other Race | 0 | 0.0% |
| Total | 2,548 | 100.0% |
Ancestry in Falmouth
The most populous ancestries reported in Falmouth are German (556 | 21.8%), American (348 | 13.7%), Irish (286 | 11.2%), English (274 | 10.7%), and Italian (65 | 2.5%), together accounting for 60.0% of all Falmouth residents.
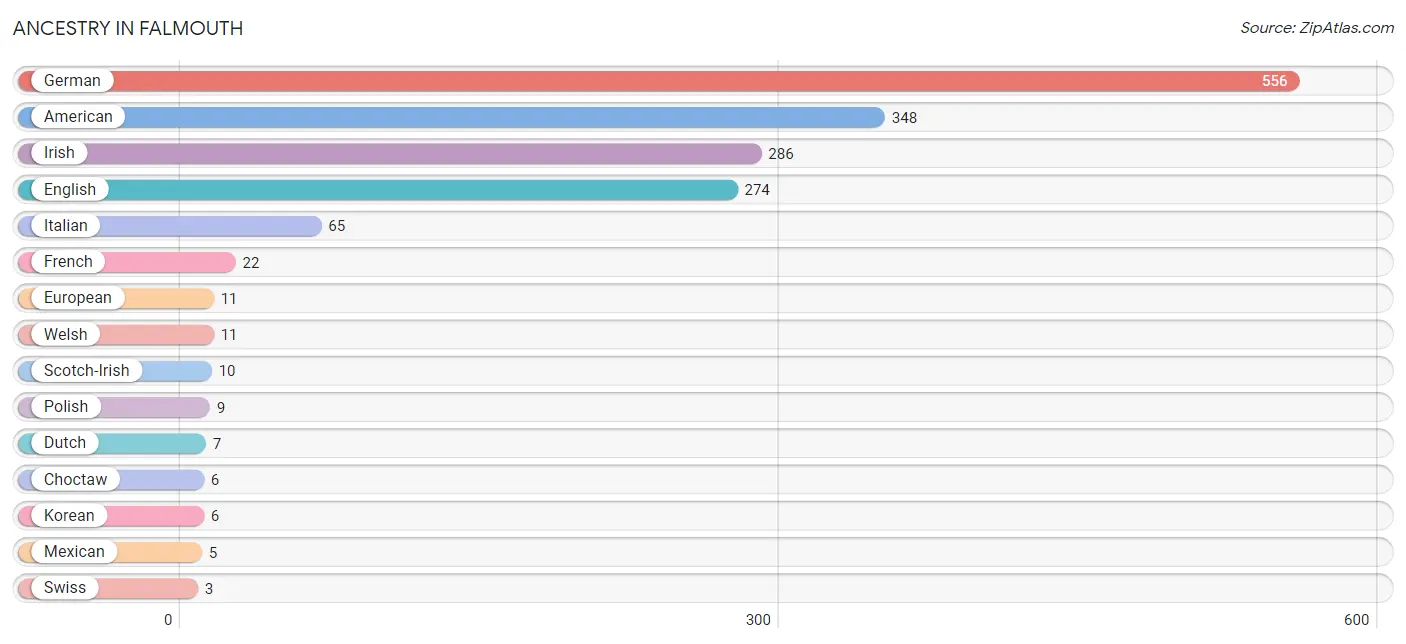
| Ancestry | # Population | % Population |
| American | 348 | 13.7% |
| Choctaw | 6 | 0.2% |
| Dutch | 7 | 0.3% |
| English | 274 | 10.7% |
| European | 11 | 0.4% |
| French | 22 | 0.9% |
| German | 556 | 21.8% |
| Irish | 286 | 11.2% |
| Italian | 65 | 2.5% |
| Korean | 6 | 0.2% |
| Mexican | 5 | 0.2% |
| Polish | 9 | 0.4% |
| Scotch-Irish | 10 | 0.4% |
| Swiss | 3 | 0.1% |
| Welsh | 11 | 0.4% | View All 15 Rows |
Immigrants in Falmouth
The most numerous immigrant groups reported in Falmouth came from Caribbean (4 | 0.2%), Latin America (4 | 0.2%), Asia (2 | 0.1%), Philippines (2 | 0.1%), and South Eastern Asia (2 | 0.1%), together accounting for 0.6% of all Falmouth residents.
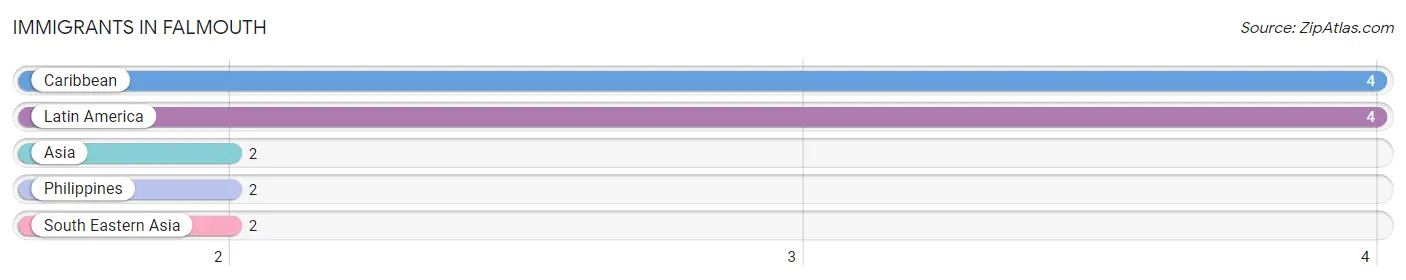
| Immigration Origin | # Population | % Population |
| Asia | 2 | 0.1% |
| Caribbean | 4 | 0.2% |
| Latin America | 4 | 0.2% |
| Philippines | 2 | 0.1% |
| South Eastern Asia | 2 | 0.1% | View All 5 Rows |
Sex and Age in Falmouth
Sex and Age in Falmouth
The most populous age groups in Falmouth are Under 5 Years (166 | 14.4%) for men and 5 to 9 Years (148 | 10.6%) for women.
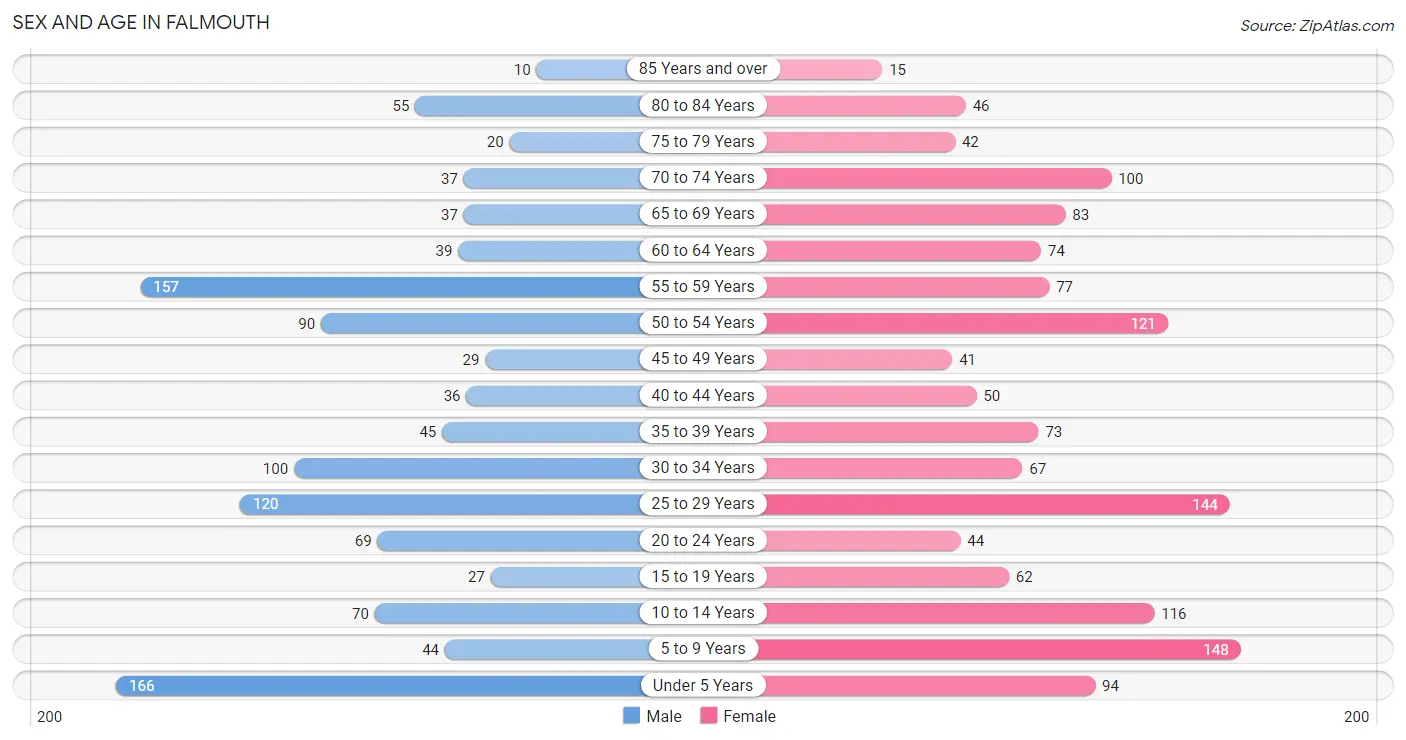
| Age Bracket | Male | Female |
| Under 5 Years | 166 (14.4%) | 94 (6.7%) |
| 5 to 9 Years | 44 (3.8%) | 148 (10.6%) |
| 10 to 14 Years | 70 (6.1%) | 116 (8.3%) |
| 15 to 19 Years | 27 (2.4%) | 62 (4.4%) |
| 20 to 24 Years | 69 (6.0%) | 44 (3.2%) |
| 25 to 29 Years | 120 (10.4%) | 144 (10.3%) |
| 30 to 34 Years | 100 (8.7%) | 67 (4.8%) |
| 35 to 39 Years | 45 (3.9%) | 73 (5.2%) |
| 40 to 44 Years | 36 (3.1%) | 50 (3.6%) |
| 45 to 49 Years | 29 (2.5%) | 41 (2.9%) |
| 50 to 54 Years | 90 (7.8%) | 121 (8.7%) |
| 55 to 59 Years | 157 (13.6%) | 77 (5.5%) |
| 60 to 64 Years | 39 (3.4%) | 74 (5.3%) |
| 65 to 69 Years | 37 (3.2%) | 83 (5.9%) |
| 70 to 74 Years | 37 (3.2%) | 100 (7.2%) |
| 75 to 79 Years | 20 (1.7%) | 42 (3.0%) |
| 80 to 84 Years | 55 (4.8%) | 46 (3.3%) |
| 85 Years and over | 10 (0.9%) | 15 (1.1%) |
| Total | 1,151 (100.0%) | 1,397 (100.0%) |
Families and Households in Falmouth
Median Family Size in Falmouth
The median family size in Falmouth is 3.25 persons per family, with married-couple families (354 | 56.0%) accounting for the largest median family size of 3.38 persons per family. On the other hand, single male/father families (108 | 17.1%) represent the smallest median family size with 3.05 persons per family.
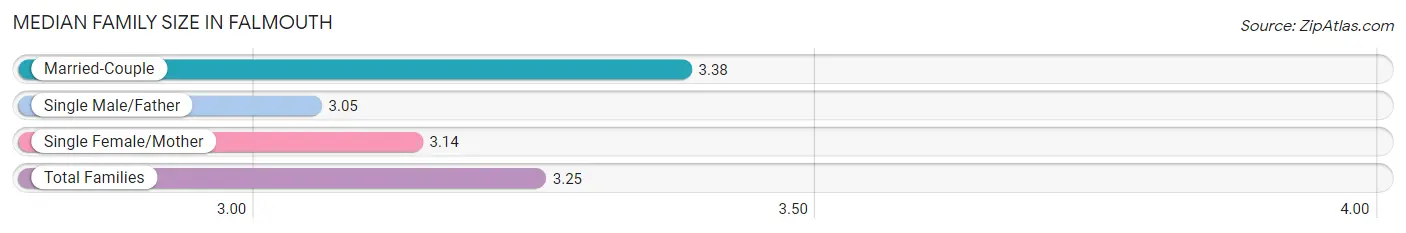
| Family Type | # Families | Family Size |
| Married-Couple | 354 (56.0%) | 3.38 |
| Single Male/Father | 108 (17.1%) | 3.05 |
| Single Female/Mother | 170 (26.9%) | 3.14 |
| Total Families | 632 (100.0%) | 3.25 |
Median Household Size in Falmouth
The median household size in Falmouth is 2.52 persons per household, with single male/father households (108 | 10.8%) accounting for the largest median household size of 3.58 persons per household. non-family households (364 | 36.5%) represent the smallest median household size with 1.04 persons per household.
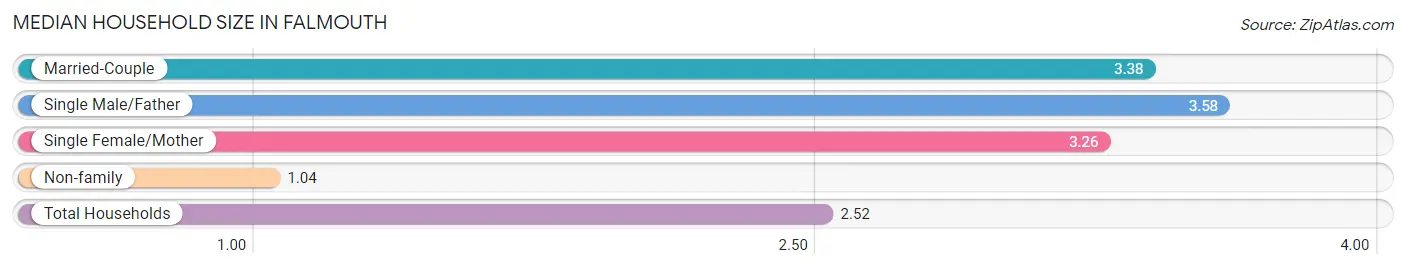
| Household Type | # Households | Household Size |
| Married-Couple | 354 (35.5%) | 3.38 |
| Single Male/Father | 108 (10.8%) | 3.58 |
| Single Female/Mother | 170 (17.1%) | 3.26 |
| Non-family | 364 (36.5%) | 1.04 |
| Total Households | 996 (100.0%) | 2.52 |
Household Size by Marriage Status in Falmouth
Out of a total of 996 households in Falmouth, 632 (63.4%) are family households, while 364 (36.5%) are nonfamily households. The most numerous type of family households are 3-person households, comprising 268, and the most common type of nonfamily households are 1-person households, comprising 350.
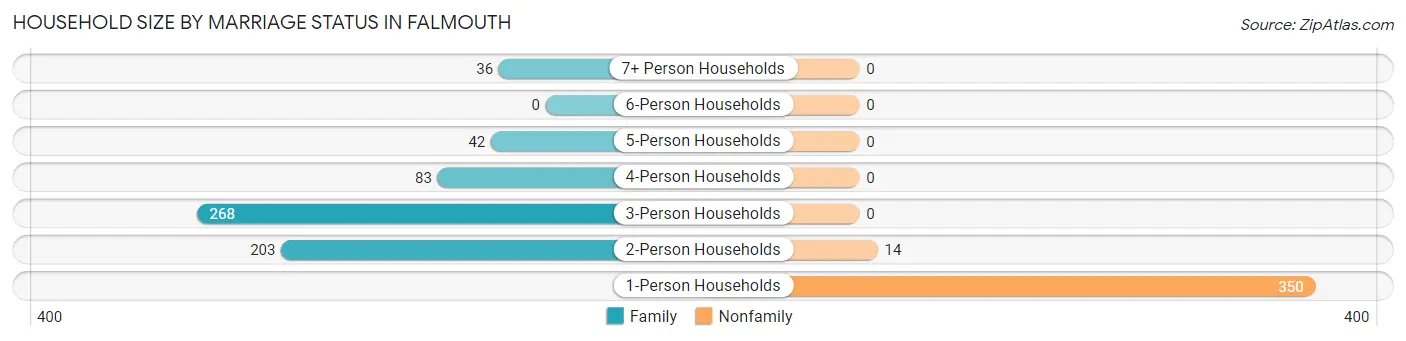
| Household Size | Family Households | Nonfamily Households |
| 1-Person Households | - | 350 (35.1%) |
| 2-Person Households | 203 (20.4%) | 14 (1.4%) |
| 3-Person Households | 268 (26.9%) | 0 (0.0%) |
| 4-Person Households | 83 (8.3%) | 0 (0.0%) |
| 5-Person Households | 42 (4.2%) | 0 (0.0%) |
| 6-Person Households | 0 (0.0%) | 0 (0.0%) |
| 7+ Person Households | 36 (3.6%) | 0 (0.0%) |
| Total | 632 (63.4%) | 364 (36.5%) |
Female Fertility in Falmouth
Fertility by Age in Falmouth
Average fertility rate in Falmouth is 237.0 births per 1,000 women. Women in the age bracket of 20 to 34 years have the highest fertility rate with 349.0 births per 1,000 women. Women in the age bracket of 20 to 34 years acount for 77.4% of all women with births.
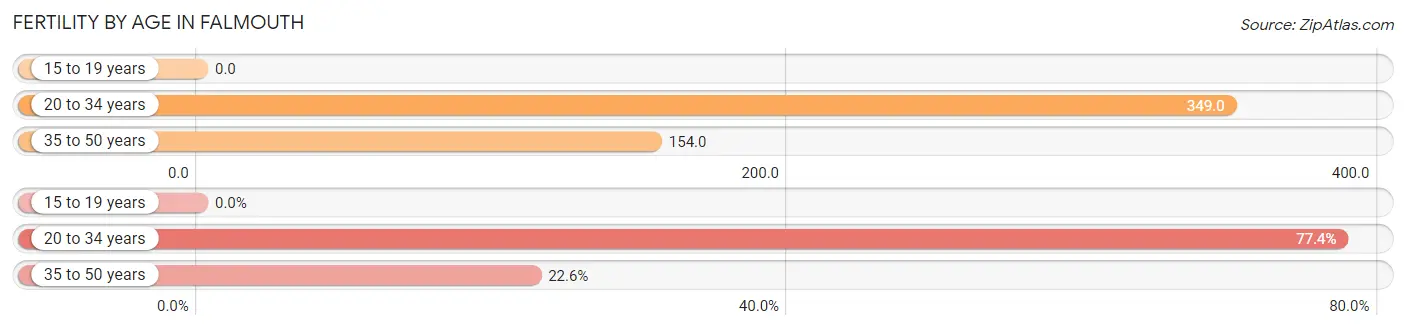
| Age Bracket | Women with Births | Births / 1,000 Women |
| 15 to 19 years | 0 (0.0%) | 0.0 |
| 20 to 34 years | 89 (77.4%) | 349.0 |
| 35 to 50 years | 26 (22.6%) | 154.0 |
| Total | 115 (100.0%) | 237.0 |
Fertility by Age by Marriage Status in Falmouth
73.0% of women with births (115) in Falmouth are married. The highest percentage of unmarried women with births falls into 35 to 50 years age bracket with 73.1% of them unmarried at the time of birth, while the lowest percentage of unmarried women with births belong to 20 to 34 years age bracket with 13.5% of them unmarried.
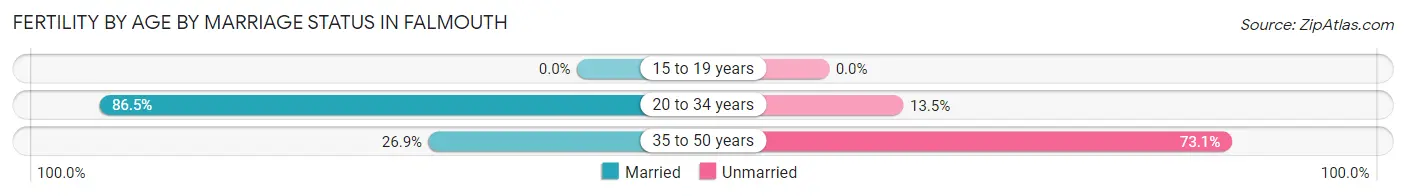
| Age Bracket | Married | Unmarried |
| 15 to 19 years | 0 (0.0%) | 0 (0.0%) |
| 20 to 34 years | 77 (86.5%) | 12 (13.5%) |
| 35 to 50 years | 7 (26.9%) | 19 (73.1%) |
| Total | 84 (73.0%) | 31 (27.0%) |
Fertility by Education in Falmouth
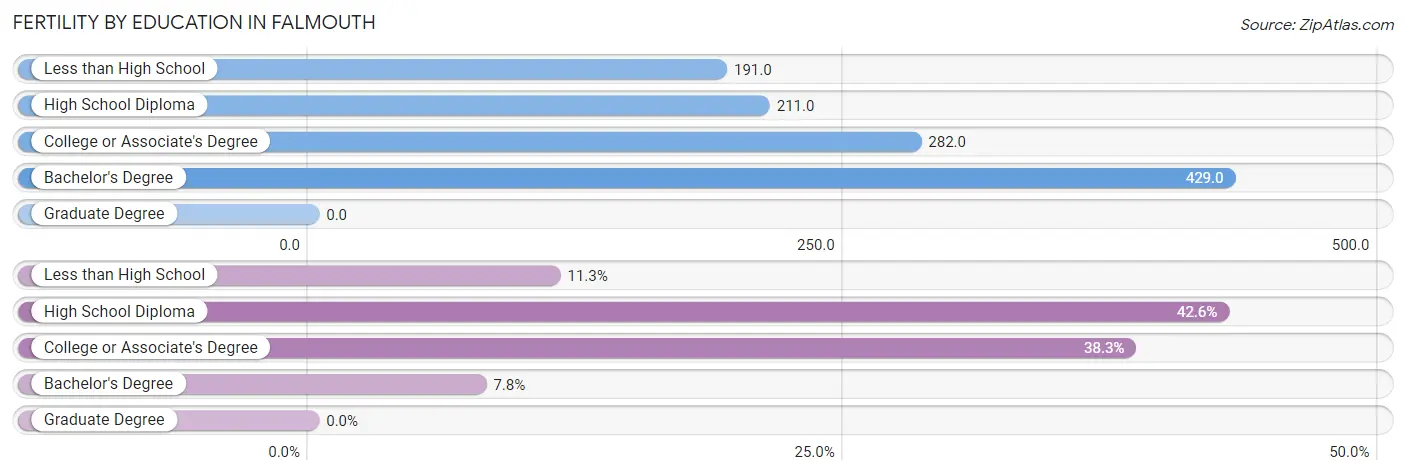
| Educational Attainment | Women with Births | Births / 1,000 Women |
| Less than High School | 13 (11.3%) | 191.0 |
| High School Diploma | 49 (42.6%) | 211.0 |
| College or Associate's Degree | 44 (38.3%) | 282.0 |
| Bachelor's Degree | 9 (7.8%) | 429.0 |
| Graduate Degree | 0 (0.0%) | 0.0 |
| Total | 115 (100.0%) | 237.0 |
Fertility by Education by Marriage Status in Falmouth
27.0% of women with births in Falmouth are unmarried. Women with the educational attainment of less than high school are most likely to be married with 100.0% of them married at childbirth, while women with the educational attainment of college or associate's degree are least likely to be married with 43.2% of them unmarried at childbirth.
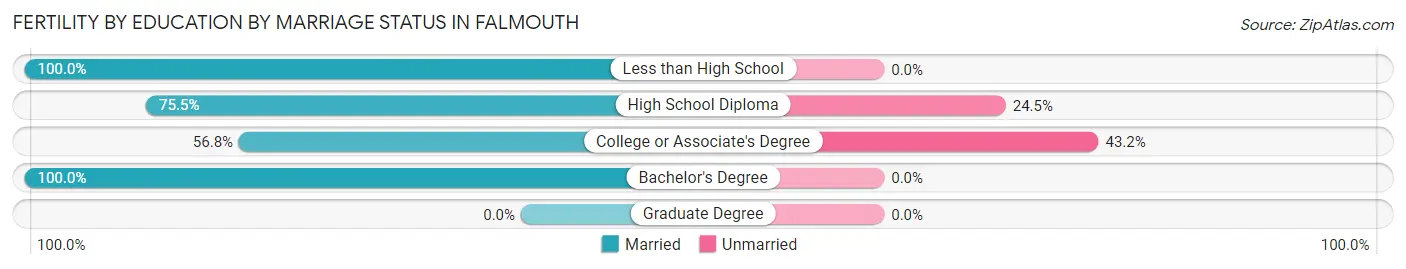
| Educational Attainment | Married | Unmarried |
| Less than High School | 13 (100.0%) | 0 (0.0%) |
| High School Diploma | 37 (75.5%) | 12 (24.5%) |
| College or Associate's Degree | 25 (56.8%) | 19 (43.2%) |
| Bachelor's Degree | 9 (100.0%) | 0 (0.0%) |
| Graduate Degree | 0 (0.0%) | 0 (0.0%) |
| Total | 84 (73.0%) | 31 (27.0%) |
Employment Characteristics in Falmouth
Employment by Class of Employer in Falmouth
Among the 1,020 employed individuals in Falmouth, private company employees (762 | 74.7%), local government employees (86 | 8.4%), and not-for-profit organizations (85 | 8.3%) make up the most common classes of employment.
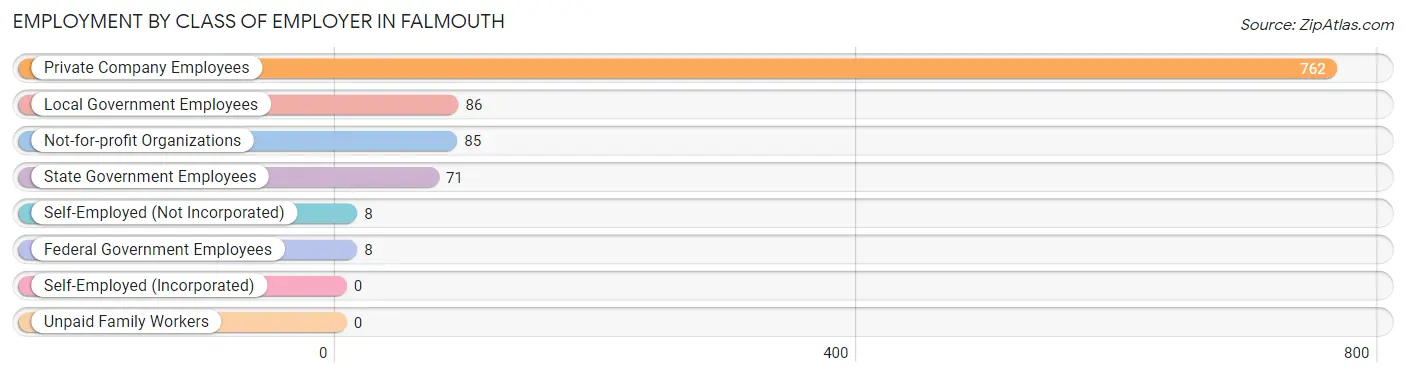
| Employer Class | # Employees | % Employees |
| Private Company Employees | 762 | 74.7% |
| Self-Employed (Incorporated) | 0 | 0.0% |
| Self-Employed (Not Incorporated) | 8 | 0.8% |
| Not-for-profit Organizations | 85 | 8.3% |
| Local Government Employees | 86 | 8.4% |
| State Government Employees | 71 | 7.0% |
| Federal Government Employees | 8 | 0.8% |
| Unpaid Family Workers | 0 | 0.0% |
| Total | 1,020 | 100.0% |
Employment Status by Age in Falmouth
According to the labor force statistics for Falmouth, out of the total population over 16 years of age (1,883), 58.3% or 1,098 individuals are in the labor force, with 6.5% or 71 of them unemployed. The age group with the highest labor force participation rate is 25 to 29 years, with 95.8% or 253 individuals in the labor force. Within the labor force, the 20 to 24 years age range has the highest percentage of unemployed individuals, with 24.5% or 25 of them being unemployed.
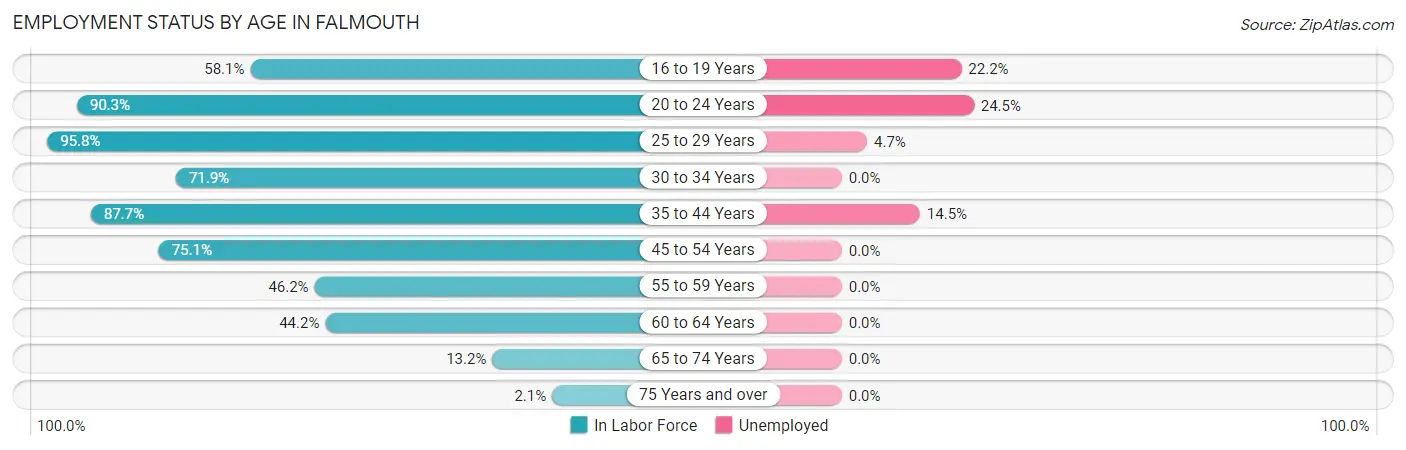
| Age Bracket | In Labor Force | Unemployed |
| 16 to 19 Years | 36 (58.1%) | 8 (22.2%) |
| 20 to 24 Years | 102 (90.3%) | 25 (24.5%) |
| 25 to 29 Years | 253 (95.8%) | 12 (4.7%) |
| 30 to 34 Years | 120 (71.9%) | 0 (0.0%) |
| 35 to 44 Years | 179 (87.7%) | 26 (14.5%) |
| 45 to 54 Years | 211 (75.1%) | 0 (0.0%) |
| 55 to 59 Years | 108 (46.2%) | 0 (0.0%) |
| 60 to 64 Years | 50 (44.2%) | 0 (0.0%) |
| 65 to 74 Years | 34 (13.2%) | 0 (0.0%) |
| 75 Years and over | 4 (2.1%) | 0 (0.0%) |
| Total | 1,098 (58.3%) | 71 (6.5%) |
Employment Status by Educational Attainment in Falmouth
According to labor force statistics for Falmouth, 72.9% of individuals (921) out of the total population between 25 and 64 years of age (1,263) are in the labor force, with 4.1% or 38 of them being unemployed. The group with the highest labor force participation rate are those with the educational attainment of bachelor's degree or higher, with 91.5% or 97 individuals in the labor force. Within the labor force, individuals with college / associate degree education have the highest percentage of unemployment, with 6.9% or 19 of them being unemployed.
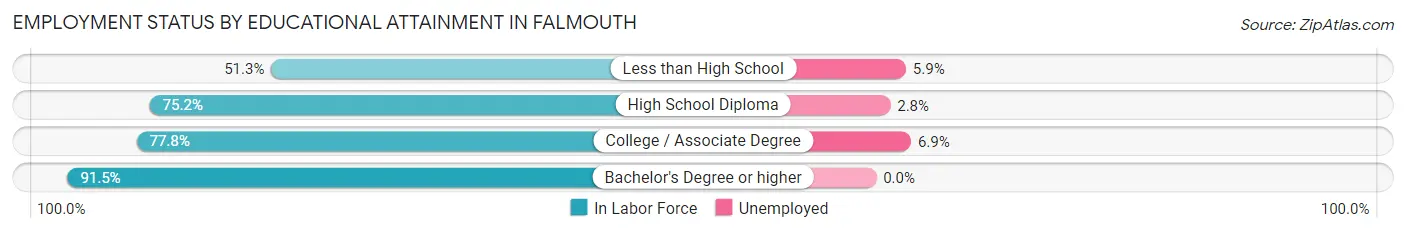
| Educational Attainment | In Labor Force | Unemployed |
| Less than High School | 119 (51.3%) | 14 (5.9%) |
| High School Diploma | 428 (75.2%) | 16 (2.8%) |
| College / Associate Degree | 277 (77.8%) | 25 (6.9%) |
| Bachelor's Degree or higher | 97 (91.5%) | 0 (0.0%) |
| Total | 921 (72.9%) | 52 (4.1%) |
Employment Occupations by Sex in Falmouth
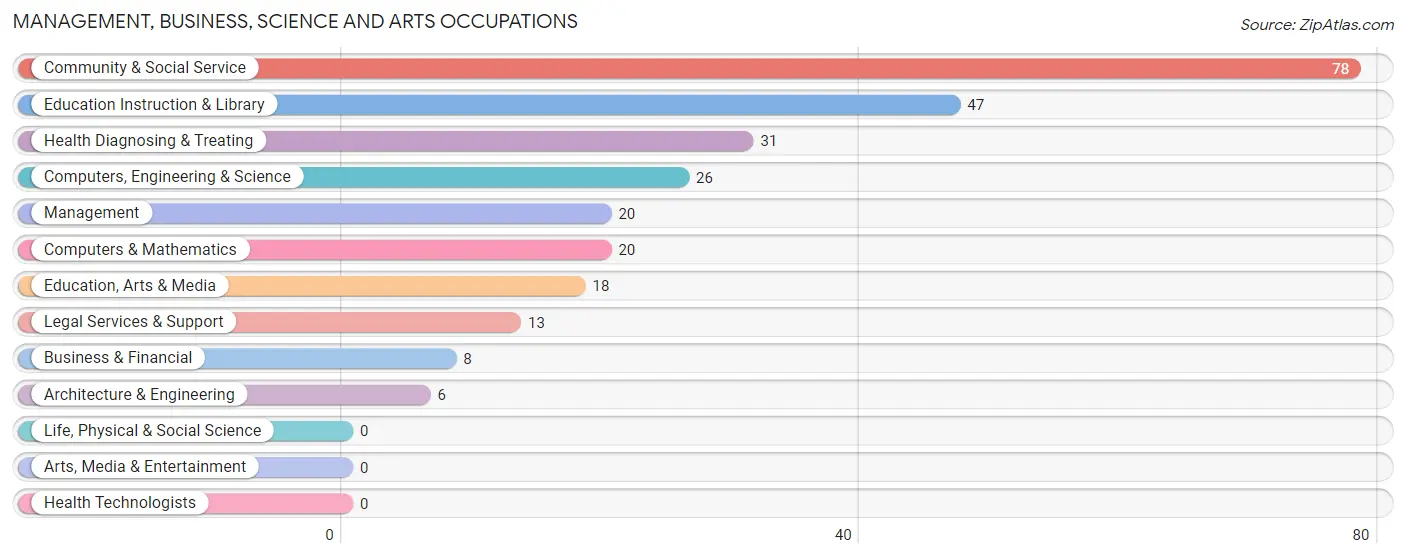
Management, Business, Science and Arts Occupations
The most common Management, Business, Science and Arts occupations in Falmouth are Community & Social Service (78 | 7.6%), Education Instruction & Library (47 | 4.6%), Health Diagnosing & Treating (31 | 3.0%), Computers, Engineering & Science (26 | 2.5%), and Management (20 | 1.9%).
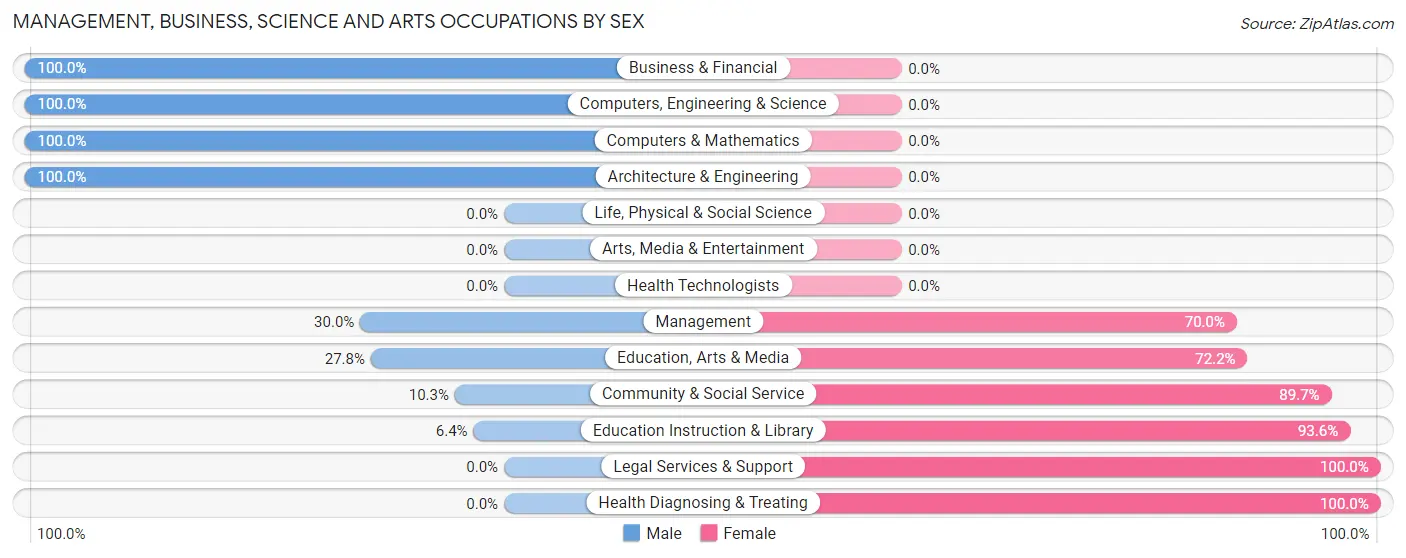
Management, Business, Science and Arts Occupations by Sex
Within the Management, Business, Science and Arts occupations in Falmouth, the most male-oriented occupations are Business & Financial (100.0%), Computers, Engineering & Science (100.0%), and Computers & Mathematics (100.0%), while the most female-oriented occupations are Legal Services & Support (100.0%), Health Diagnosing & Treating (100.0%), and Education Instruction & Library (93.6%).
| Occupation | Male | Female |
| Management | 6 (30.0%) | 14 (70.0%) |
| Business & Financial | 8 (100.0%) | 0 (0.0%) |
| Computers, Engineering & Science | 26 (100.0%) | 0 (0.0%) |
| Computers & Mathematics | 20 (100.0%) | 0 (0.0%) |
| Architecture & Engineering | 6 (100.0%) | 0 (0.0%) |
| Life, Physical & Social Science | 0 (0.0%) | 0 (0.0%) |
| Community & Social Service | 8 (10.3%) | 70 (89.7%) |
| Education, Arts & Media | 5 (27.8%) | 13 (72.2%) |
| Legal Services & Support | 0 (0.0%) | 13 (100.0%) |
| Education Instruction & Library | 3 (6.4%) | 44 (93.6%) |
| Arts, Media & Entertainment | 0 (0.0%) | 0 (0.0%) |
| Health Diagnosing & Treating | 0 (0.0%) | 31 (100.0%) |
| Health Technologists | 0 (0.0%) | 0 (0.0%) |
| Total (Category) | 48 (29.4%) | 115 (70.6%) |
| Total (Overall) | 527 (51.4%) | 499 (48.6%) |
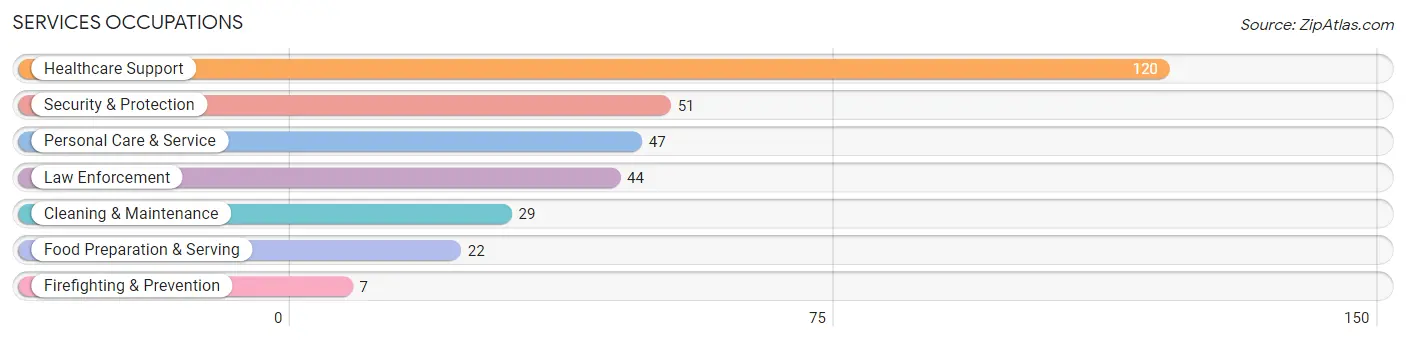
Services Occupations
The most common Services occupations in Falmouth are Healthcare Support (120 | 11.7%), Security & Protection (51 | 5.0%), Personal Care & Service (47 | 4.6%), Law Enforcement (44 | 4.3%), and Cleaning & Maintenance (29 | 2.8%).
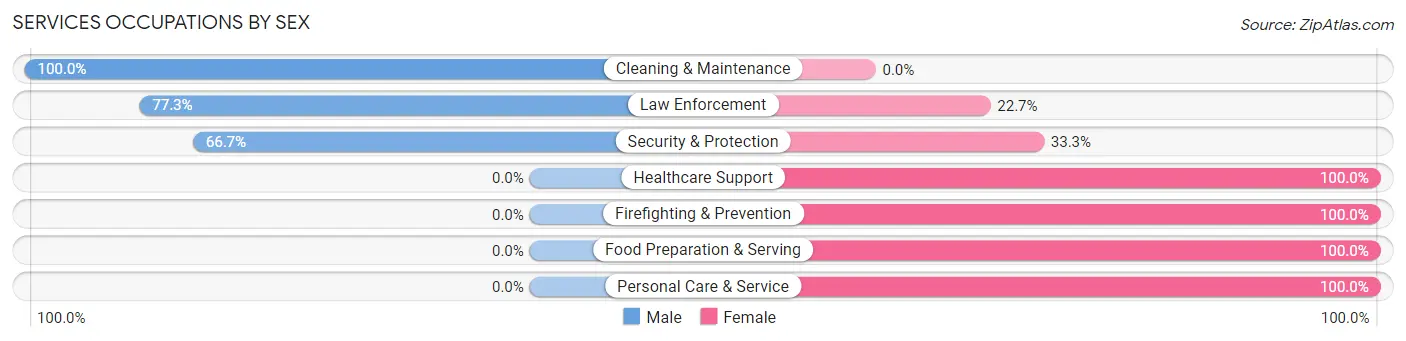
Services Occupations by Sex
Within the Services occupations in Falmouth, the most male-oriented occupations are Cleaning & Maintenance (100.0%), Law Enforcement (77.3%), and Security & Protection (66.7%), while the most female-oriented occupations are Healthcare Support (100.0%), Firefighting & Prevention (100.0%), and Food Preparation & Serving (100.0%).
| Occupation | Male | Female |
| Healthcare Support | 0 (0.0%) | 120 (100.0%) |
| Security & Protection | 34 (66.7%) | 17 (33.3%) |
| Firefighting & Prevention | 0 (0.0%) | 7 (100.0%) |
| Law Enforcement | 34 (77.3%) | 10 (22.7%) |
| Food Preparation & Serving | 0 (0.0%) | 22 (100.0%) |
| Cleaning & Maintenance | 29 (100.0%) | 0 (0.0%) |
| Personal Care & Service | 0 (0.0%) | 47 (100.0%) |
| Total (Category) | 63 (23.4%) | 206 (76.6%) |
| Total (Overall) | 527 (51.4%) | 499 (48.6%) |
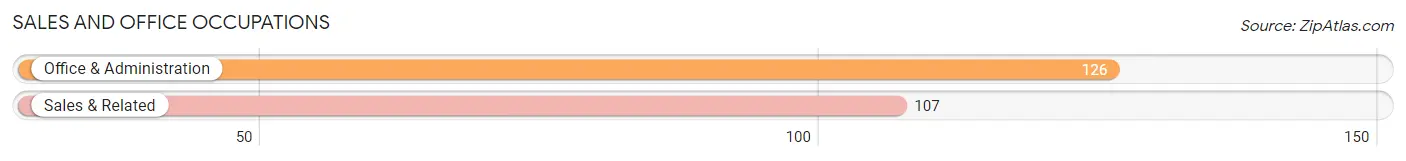
Sales and Office Occupations
The most common Sales and Office occupations in Falmouth are Office & Administration (126 | 12.3%), and Sales & Related (107 | 10.4%).
Sales and Office Occupations by Sex
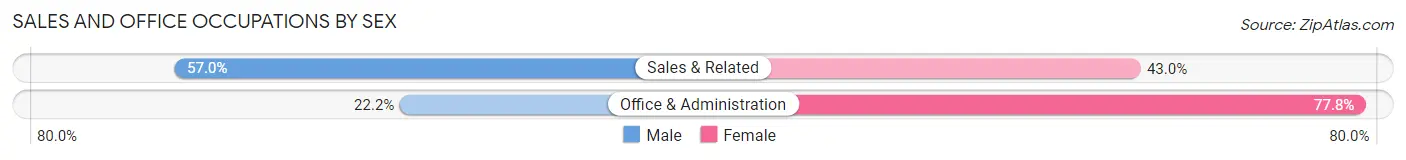
| Occupation | Male | Female |
| Sales & Related | 61 (57.0%) | 46 (43.0%) |
| Office & Administration | 28 (22.2%) | 98 (77.8%) |
| Total (Category) | 89 (38.2%) | 144 (61.8%) |
| Total (Overall) | 527 (51.4%) | 499 (48.6%) |
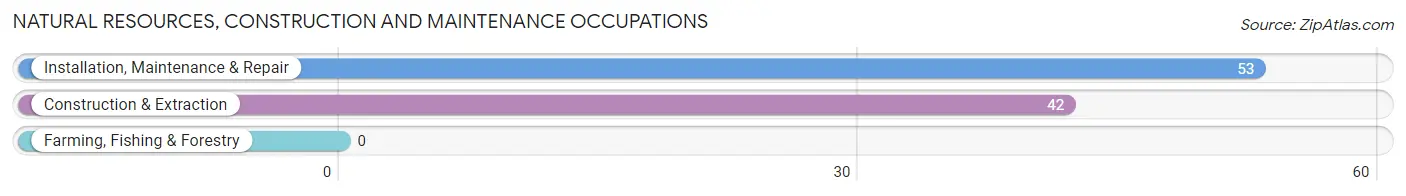
Natural Resources, Construction and Maintenance Occupations
The most common Natural Resources, Construction and Maintenance occupations in Falmouth are Installation, Maintenance & Repair (53 | 5.2%), and Construction & Extraction (42 | 4.1%).
Natural Resources, Construction and Maintenance Occupations by Sex
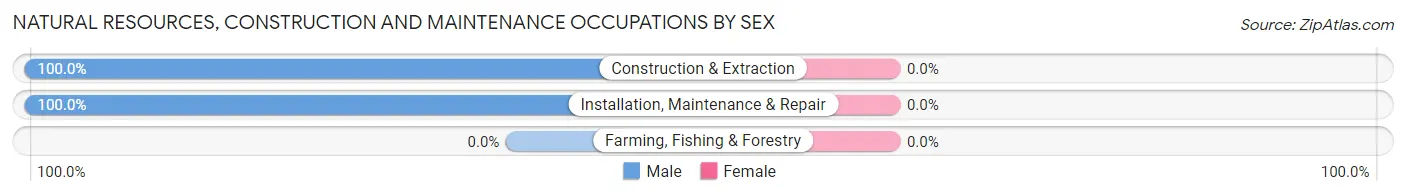
| Occupation | Male | Female |
| Farming, Fishing & Forestry | 0 (0.0%) | 0 (0.0%) |
| Construction & Extraction | 42 (100.0%) | 0 (0.0%) |
| Installation, Maintenance & Repair | 53 (100.0%) | 0 (0.0%) |
| Total (Category) | 95 (100.0%) | 0 (0.0%) |
| Total (Overall) | 527 (51.4%) | 499 (48.6%) |
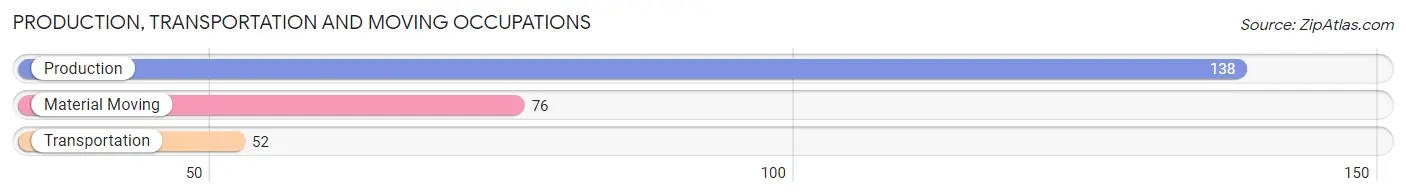
Production, Transportation and Moving Occupations
The most common Production, Transportation and Moving occupations in Falmouth are Production (138 | 13.5%), Material Moving (76 | 7.4%), and Transportation (52 | 5.1%).
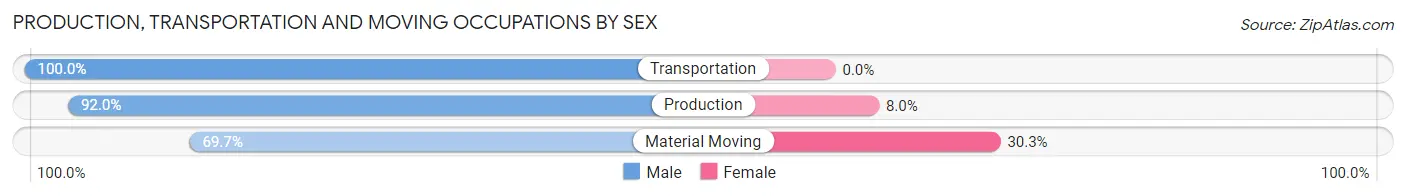
Production, Transportation and Moving Occupations by Sex
| Occupation | Male | Female |
| Production | 127 (92.0%) | 11 (8.0%) |
| Transportation | 52 (100.0%) | 0 (0.0%) |
| Material Moving | 53 (69.7%) | 23 (30.3%) |
| Total (Category) | 232 (87.2%) | 34 (12.8%) |
| Total (Overall) | 527 (51.4%) | 499 (48.6%) |
Employment Industries by Sex in Falmouth
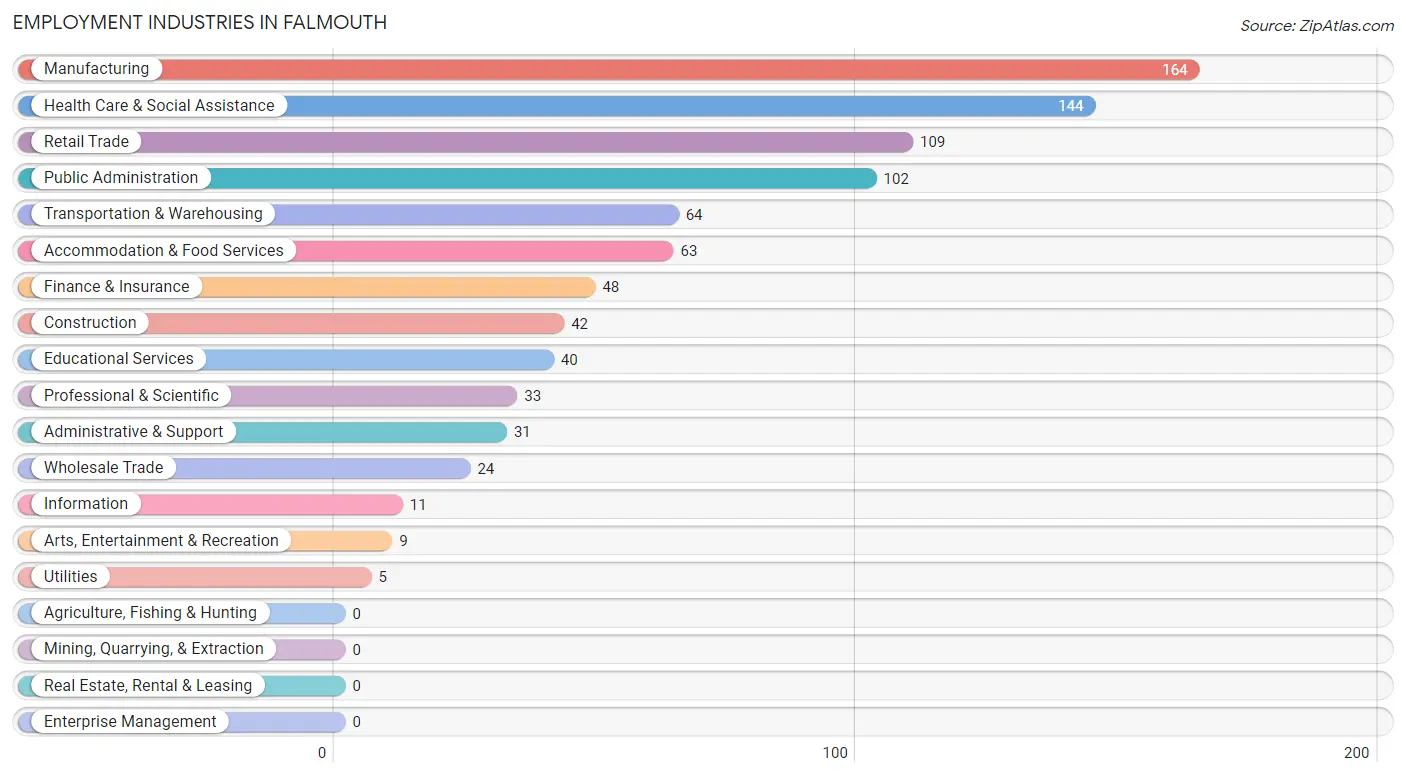
Employment Industries in Falmouth
The major employment industries in Falmouth include Manufacturing (164 | 16.0%), Health Care & Social Assistance (144 | 14.0%), Retail Trade (109 | 10.6%), Public Administration (102 | 9.9%), and Transportation & Warehousing (64 | 6.2%).
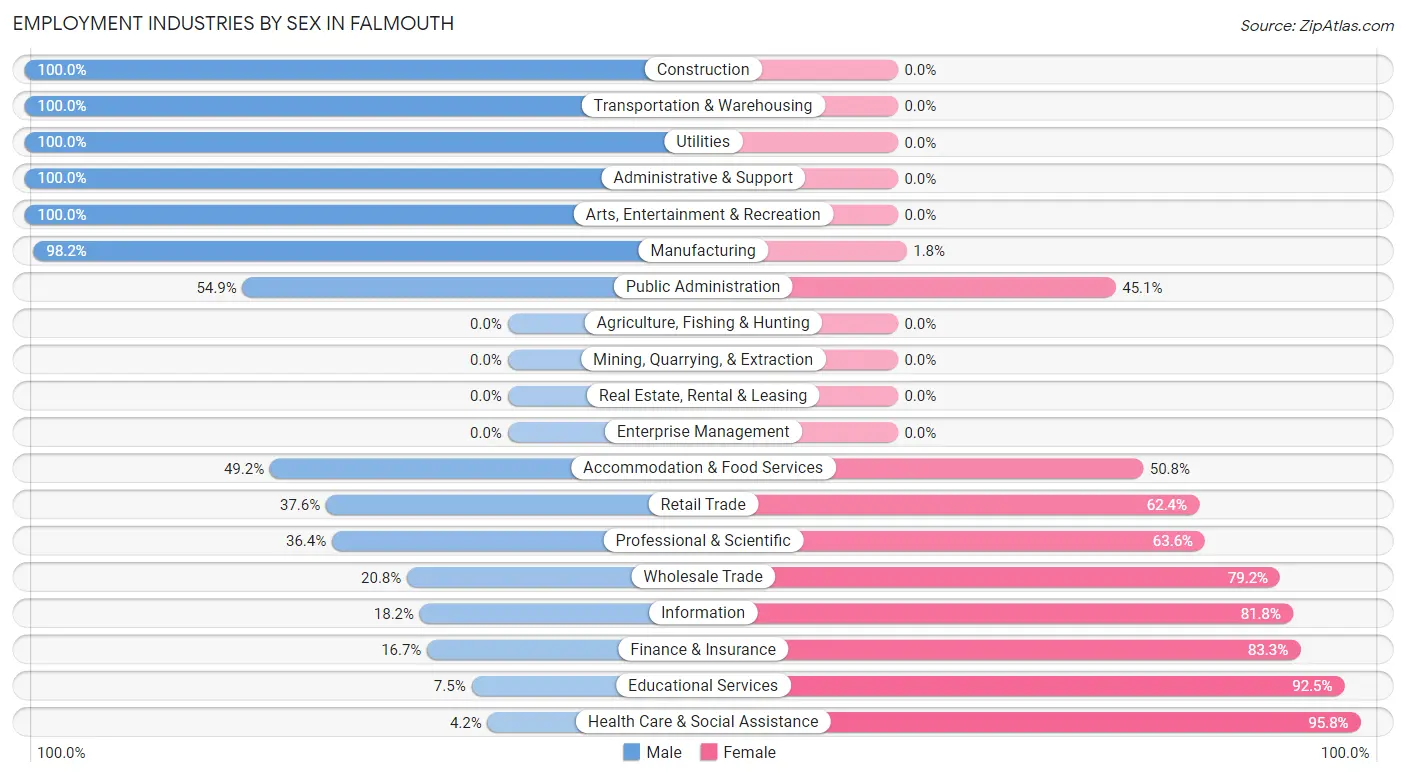
Employment Industries by Sex in Falmouth
The Falmouth industries that see more men than women are Construction (100.0%), Transportation & Warehousing (100.0%), and Utilities (100.0%), whereas the industries that tend to have a higher number of women are Health Care & Social Assistance (95.8%), Educational Services (92.5%), and Finance & Insurance (83.3%).
| Industry | Male | Female |
| Agriculture, Fishing & Hunting | 0 (0.0%) | 0 (0.0%) |
| Mining, Quarrying, & Extraction | 0 (0.0%) | 0 (0.0%) |
| Construction | 42 (100.0%) | 0 (0.0%) |
| Manufacturing | 161 (98.2%) | 3 (1.8%) |
| Wholesale Trade | 5 (20.8%) | 19 (79.2%) |
| Retail Trade | 41 (37.6%) | 68 (62.4%) |
| Transportation & Warehousing | 64 (100.0%) | 0 (0.0%) |
| Utilities | 5 (100.0%) | 0 (0.0%) |
| Information | 2 (18.2%) | 9 (81.8%) |
| Finance & Insurance | 8 (16.7%) | 40 (83.3%) |
| Real Estate, Rental & Leasing | 0 (0.0%) | 0 (0.0%) |
| Professional & Scientific | 12 (36.4%) | 21 (63.6%) |
| Enterprise Management | 0 (0.0%) | 0 (0.0%) |
| Administrative & Support | 31 (100.0%) | 0 (0.0%) |
| Educational Services | 3 (7.5%) | 37 (92.5%) |
| Health Care & Social Assistance | 6 (4.2%) | 138 (95.8%) |
| Arts, Entertainment & Recreation | 9 (100.0%) | 0 (0.0%) |
| Accommodation & Food Services | 31 (49.2%) | 32 (50.8%) |
| Public Administration | 56 (54.9%) | 46 (45.1%) |
| Total | 527 (51.4%) | 499 (48.6%) |
Education in Falmouth
School Enrollment in Falmouth
The most common levels of schooling among the 485 students in Falmouth are middle school (153 | 31.6%), nursery / preschool (86 | 17.7%), and elementary school (76 | 15.7%).
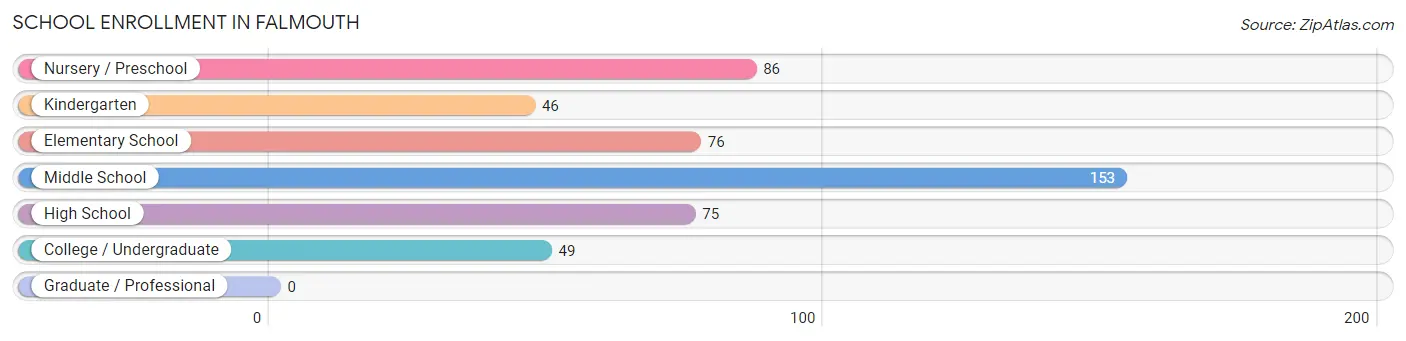
| School Level | # Students | % Students |
| Nursery / Preschool | 86 | 17.7% |
| Kindergarten | 46 | 9.5% |
| Elementary School | 76 | 15.7% |
| Middle School | 153 | 31.6% |
| High School | 75 | 15.5% |
| College / Undergraduate | 49 | 10.1% |
| Graduate / Professional | 0 | 0.0% |
| Total | 485 | 100.0% |
School Enrollment by Age by Funding Source in Falmouth
Out of a total of 485 students who are enrolled in schools in Falmouth, 11 (2.3%) attend a private institution, while the remaining 474 (97.7%) are enrolled in public schools. The age group of 15 to 17 year olds has the highest likelihood of being enrolled in private schools, with 7 (14.0% in the age bracket) enrolled. Conversely, the age group of 3 to 4 year olds has the lowest likelihood of being enrolled in a private school, with 19 (100.0% in the age bracket) attending a public institution.
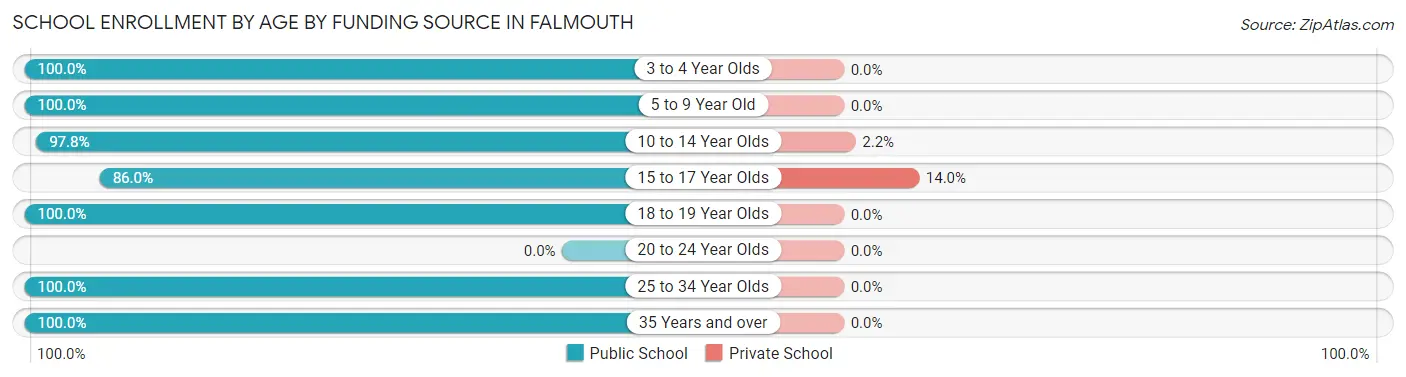
| Age Bracket | Public School | Private School |
| 3 to 4 Year Olds | 19 (100.0%) | 0 (0.0%) |
| 5 to 9 Year Old | 183 (100.0%) | 0 (0.0%) |
| 10 to 14 Year Olds | 180 (97.8%) | 4 (2.2%) |
| 15 to 17 Year Olds | 43 (86.0%) | 7 (14.0%) |
| 18 to 19 Year Olds | 26 (100.0%) | 0 (0.0%) |
| 20 to 24 Year Olds | 0 (0.0%) | 0 (0.0%) |
| 25 to 34 Year Olds | 17 (100.0%) | 0 (0.0%) |
| 35 Years and over | 6 (100.0%) | 0 (0.0%) |
| Total | 474 (97.7%) | 11 (2.3%) |
Educational Attainment by Field of Study in Falmouth
Education (45 | 32.4%), business (23 | 16.6%), liberal arts & history (21 | 15.1%), computers & mathematics (15 | 10.8%), and science & technology (12 | 8.6%) are the most common fields of study among 139 individuals in Falmouth who have obtained a bachelor's degree or higher.
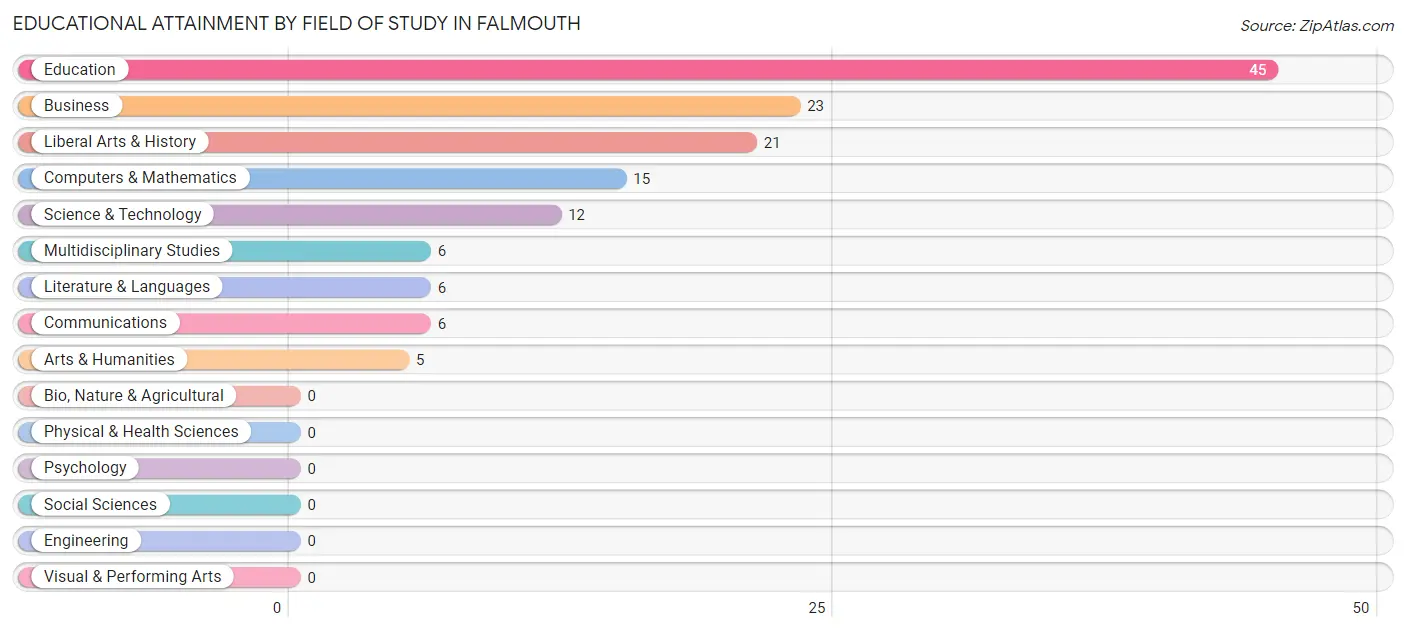
| Field of Study | # Graduates | % Graduates |
| Computers & Mathematics | 15 | 10.8% |
| Bio, Nature & Agricultural | 0 | 0.0% |
| Physical & Health Sciences | 0 | 0.0% |
| Psychology | 0 | 0.0% |
| Social Sciences | 0 | 0.0% |
| Engineering | 0 | 0.0% |
| Multidisciplinary Studies | 6 | 4.3% |
| Science & Technology | 12 | 8.6% |
| Business | 23 | 16.6% |
| Education | 45 | 32.4% |
| Literature & Languages | 6 | 4.3% |
| Liberal Arts & History | 21 | 15.1% |
| Visual & Performing Arts | 0 | 0.0% |
| Communications | 6 | 4.3% |
| Arts & Humanities | 5 | 3.6% |
| Total | 139 | 100.0% |
Transportation & Commute in Falmouth
Vehicle Availability by Sex in Falmouth
The most prevalent vehicle ownership categories in Falmouth are males with 2 vehicles (247, accounting for 46.9%) and females with 2 vehicles (154, making up 50.1%).
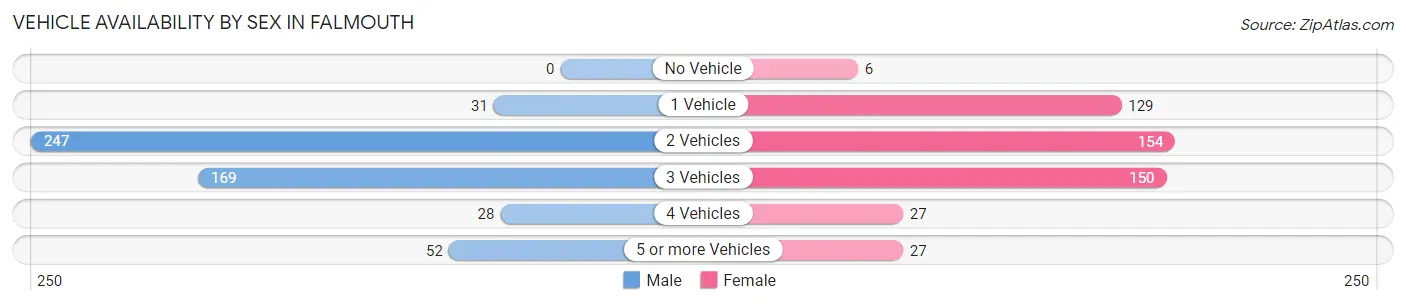
| Vehicles Available | Male | Female |
| No Vehicle | 0 (0.0%) | 6 (1.2%) |
| 1 Vehicle | 31 (5.9%) | 129 (26.2%) |
| 2 Vehicles | 247 (46.9%) | 154 (31.2%) |
| 3 Vehicles | 169 (32.1%) | 150 (30.4%) |
| 4 Vehicles | 28 (5.3%) | 27 (5.5%) |
| 5 or more Vehicles | 52 (9.9%) | 27 (5.5%) |
| Total | 527 (100.0%) | 493 (100.0%) |
Commute Time in Falmouth
The most frequently occuring commute durations in Falmouth are 45 to 59 minutes (215 commuters, 22.1%), 30 to 34 minutes (140 commuters, 14.4%), and 10 to 14 minutes (113 commuters, 11.6%).
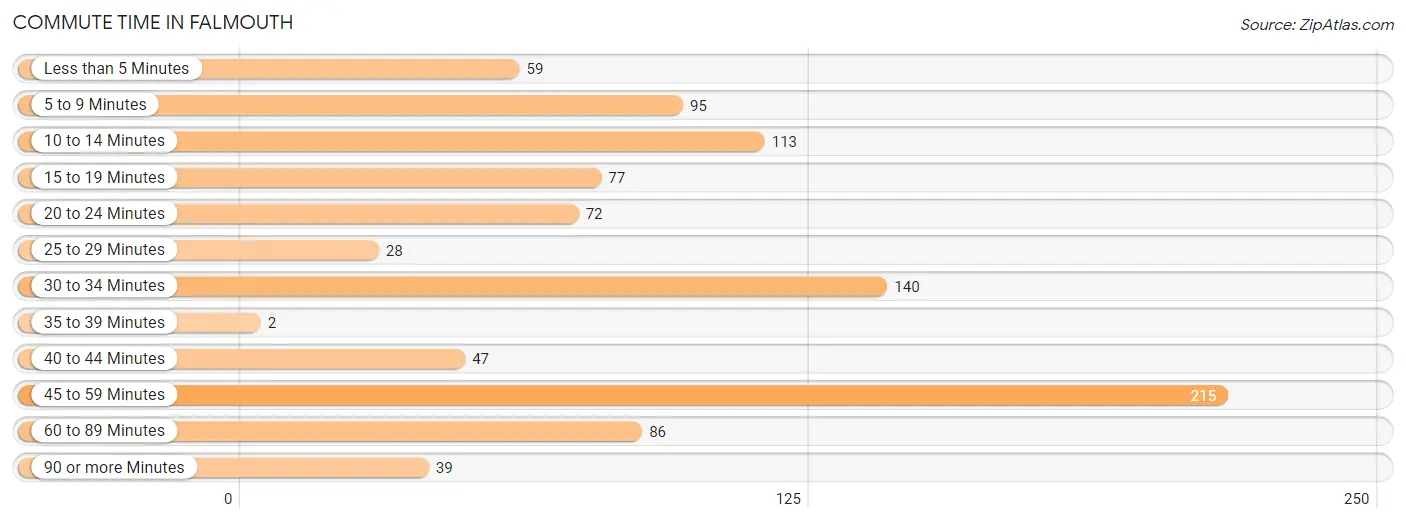
| Commute Time | # Commuters | % Commuters |
| Less than 5 Minutes | 59 | 6.1% |
| 5 to 9 Minutes | 95 | 9.8% |
| 10 to 14 Minutes | 113 | 11.6% |
| 15 to 19 Minutes | 77 | 7.9% |
| 20 to 24 Minutes | 72 | 7.4% |
| 25 to 29 Minutes | 28 | 2.9% |
| 30 to 34 Minutes | 140 | 14.4% |
| 35 to 39 Minutes | 2 | 0.2% |
| 40 to 44 Minutes | 47 | 4.8% |
| 45 to 59 Minutes | 215 | 22.1% |
| 60 to 89 Minutes | 86 | 8.8% |
| 90 or more Minutes | 39 | 4.0% |
Commute Time by Sex in Falmouth
The most common commute times in Falmouth are 45 to 59 minutes (116 commuters, 22.5%) for males and 45 to 59 minutes (99 commuters, 21.7%) for females.
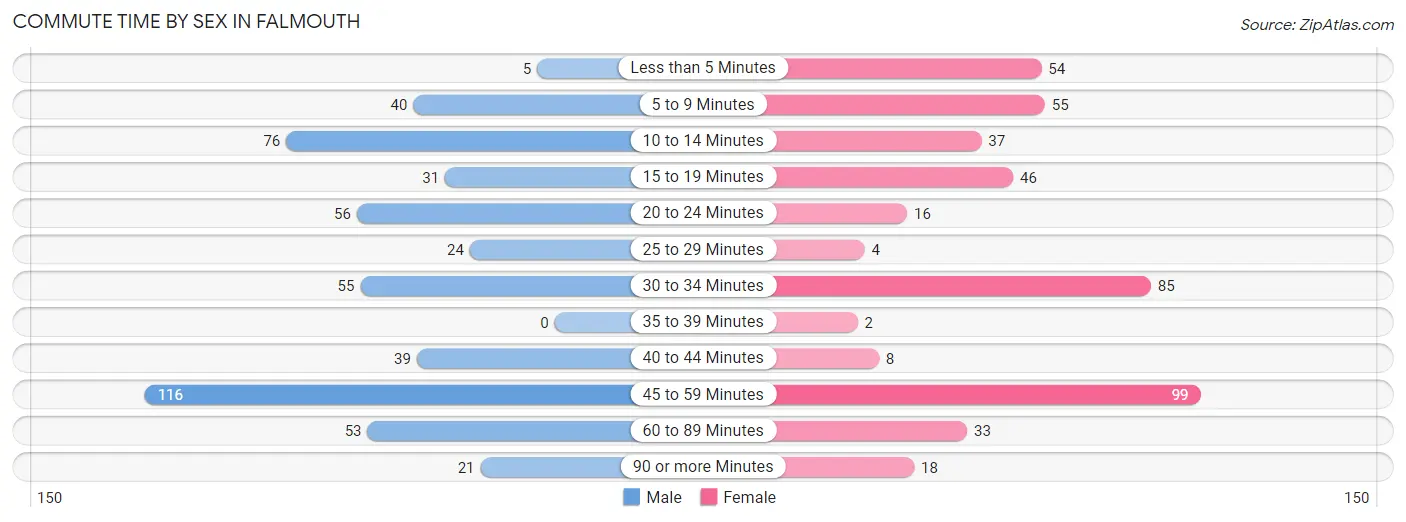
| Commute Time | Male | Female |
| Less than 5 Minutes | 5 (1.0%) | 54 (11.8%) |
| 5 to 9 Minutes | 40 (7.7%) | 55 (12.0%) |
| 10 to 14 Minutes | 76 (14.7%) | 37 (8.1%) |
| 15 to 19 Minutes | 31 (6.0%) | 46 (10.1%) |
| 20 to 24 Minutes | 56 (10.8%) | 16 (3.5%) |
| 25 to 29 Minutes | 24 (4.6%) | 4 (0.9%) |
| 30 to 34 Minutes | 55 (10.7%) | 85 (18.6%) |
| 35 to 39 Minutes | 0 (0.0%) | 2 (0.4%) |
| 40 to 44 Minutes | 39 (7.6%) | 8 (1.8%) |
| 45 to 59 Minutes | 116 (22.5%) | 99 (21.7%) |
| 60 to 89 Minutes | 53 (10.3%) | 33 (7.2%) |
| 90 or more Minutes | 21 (4.1%) | 18 (3.9%) |
Time of Departure to Work by Sex in Falmouth
The most frequent times of departure to work in Falmouth are 4:00 PM to 11:59 PM (146, 28.3%) for males and 7:30 AM to 7:59 AM (106, 23.2%) for females.
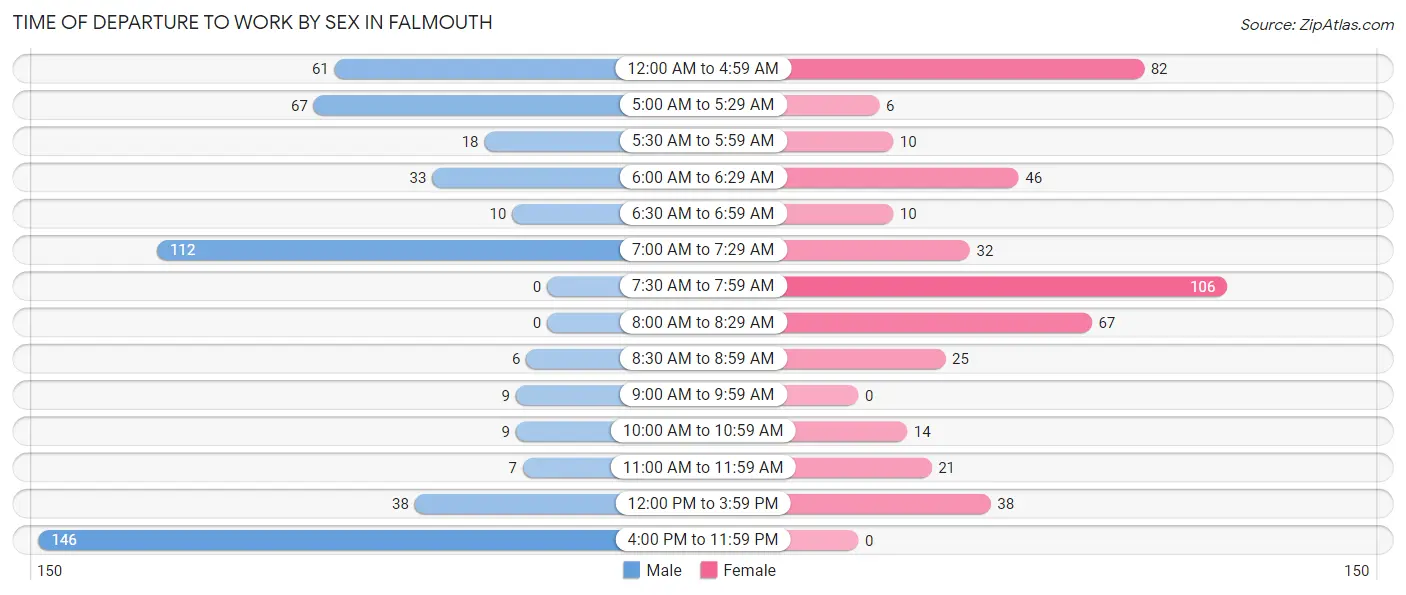
| Time of Departure | Male | Female |
| 12:00 AM to 4:59 AM | 61 (11.8%) | 82 (17.9%) |
| 5:00 AM to 5:29 AM | 67 (13.0%) | 6 (1.3%) |
| 5:30 AM to 5:59 AM | 18 (3.5%) | 10 (2.2%) |
| 6:00 AM to 6:29 AM | 33 (6.4%) | 46 (10.1%) |
| 6:30 AM to 6:59 AM | 10 (1.9%) | 10 (2.2%) |
| 7:00 AM to 7:29 AM | 112 (21.7%) | 32 (7.0%) |
| 7:30 AM to 7:59 AM | 0 (0.0%) | 106 (23.2%) |
| 8:00 AM to 8:29 AM | 0 (0.0%) | 67 (14.7%) |
| 8:30 AM to 8:59 AM | 6 (1.2%) | 25 (5.5%) |
| 9:00 AM to 9:59 AM | 9 (1.7%) | 0 (0.0%) |
| 10:00 AM to 10:59 AM | 9 (1.7%) | 14 (3.1%) |
| 11:00 AM to 11:59 AM | 7 (1.4%) | 21 (4.6%) |
| 12:00 PM to 3:59 PM | 38 (7.4%) | 38 (8.3%) |
| 4:00 PM to 11:59 PM | 146 (28.3%) | 0 (0.0%) |
| Total | 516 (100.0%) | 457 (100.0%) |
Housing Occupancy in Falmouth
Occupancy by Ownership in Falmouth
Of the total 996 dwellings in Falmouth, owner-occupied units account for 476 (47.8%), while renter-occupied units make up 520 (52.2%).
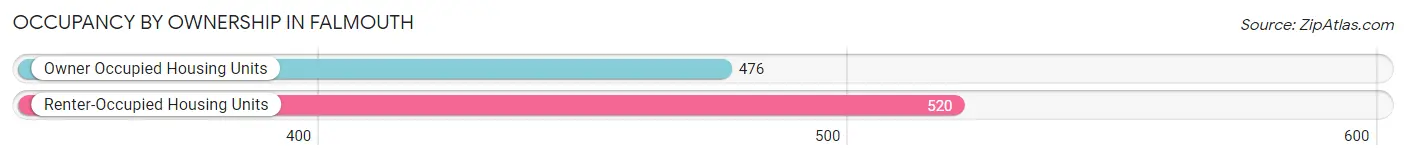
| Occupancy | # Housing Units | % Housing Units |
| Owner Occupied Housing Units | 476 | 47.8% |
| Renter-Occupied Housing Units | 520 | 52.2% |
| Total Occupied Housing Units | 996 | 100.0% |
Occupancy by Household Size in Falmouth
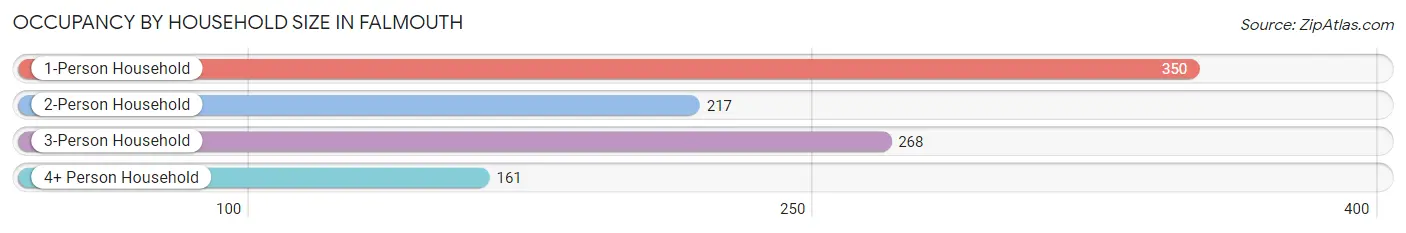
| Household Size | # Housing Units | % Housing Units |
| 1-Person Household | 350 | 35.1% |
| 2-Person Household | 217 | 21.8% |
| 3-Person Household | 268 | 26.9% |
| 4+ Person Household | 161 | 16.2% |
| Total Housing Units | 996 | 100.0% |
Occupancy by Ownership by Household Size in Falmouth
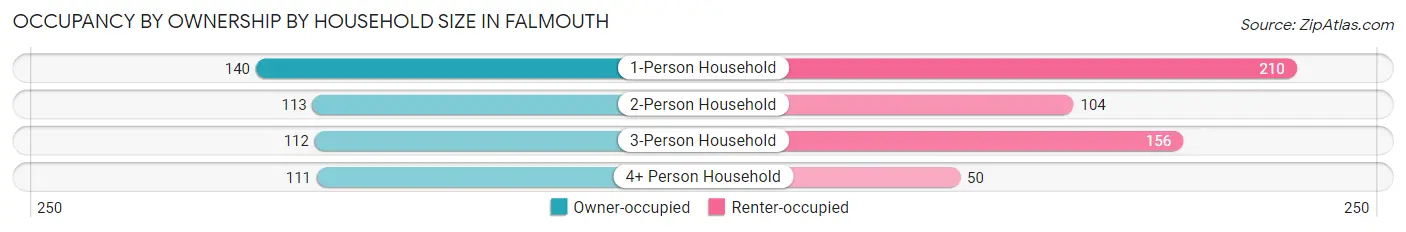
| Household Size | Owner-occupied | Renter-occupied |
| 1-Person Household | 140 (40.0%) | 210 (60.0%) |
| 2-Person Household | 113 (52.1%) | 104 (47.9%) |
| 3-Person Household | 112 (41.8%) | 156 (58.2%) |
| 4+ Person Household | 111 (68.9%) | 50 (31.1%) |
| Total Housing Units | 476 (47.8%) | 520 (52.2%) |
Occupancy by Educational Attainment in Falmouth
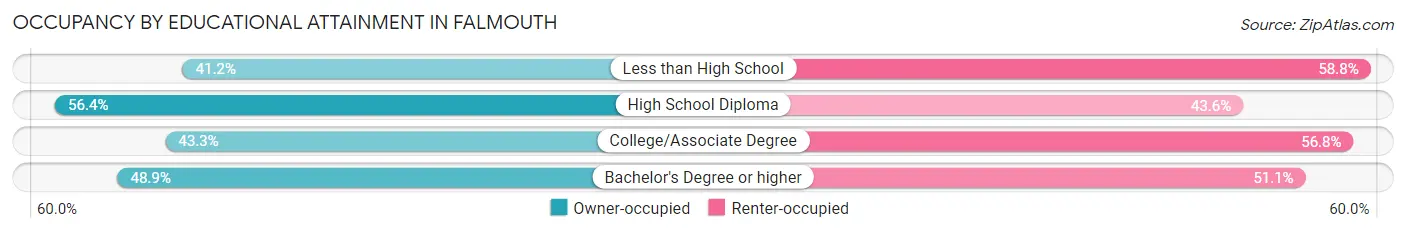
| Household Size | Owner-occupied | Renter-occupied |
| Less than High School | 110 (41.2%) | 157 (58.8%) |
| High School Diploma | 195 (56.4%) | 151 (43.6%) |
| College/Associate Degree | 125 (43.2%) | 164 (56.8%) |
| Bachelor's Degree or higher | 46 (48.9%) | 48 (51.1%) |
Occupancy by Age of Householder in Falmouth
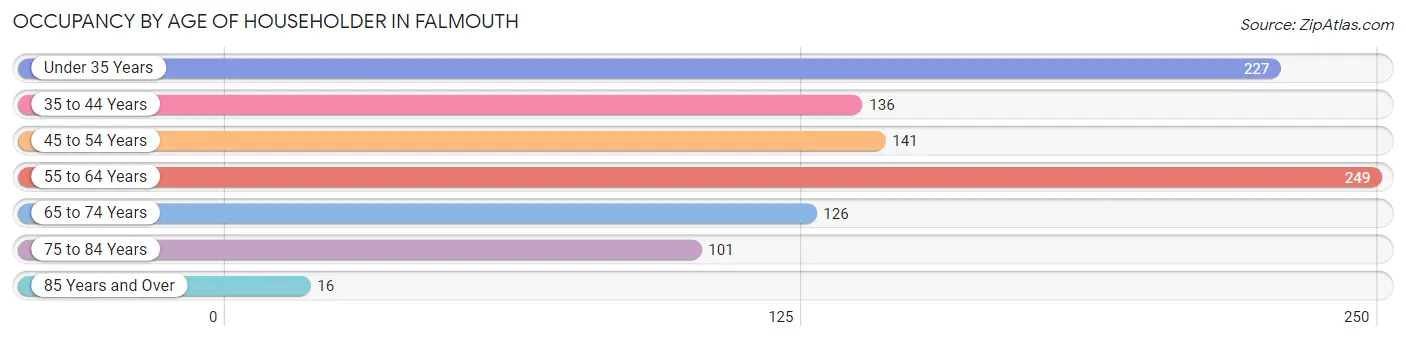
| Age Bracket | # Households | % Households |
| Under 35 Years | 227 | 22.8% |
| 35 to 44 Years | 136 | 13.7% |
| 45 to 54 Years | 141 | 14.2% |
| 55 to 64 Years | 249 | 25.0% |
| 65 to 74 Years | 126 | 12.7% |
| 75 to 84 Years | 101 | 10.1% |
| 85 Years and Over | 16 | 1.6% |
| Total | 996 | 100.0% |
Housing Finances in Falmouth
Median Income by Occupancy in Falmouth
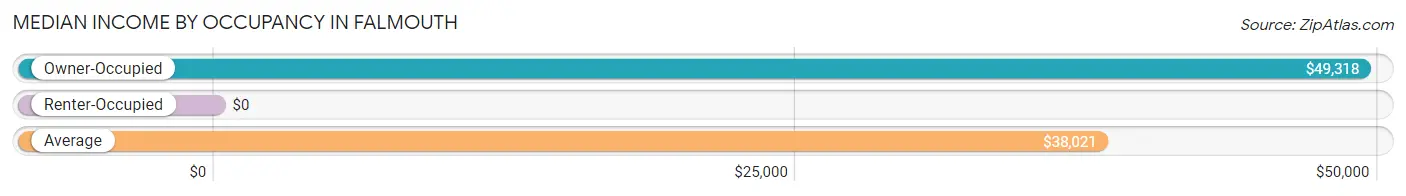
| Occupancy Type | # Households | Median Income |
| Owner-Occupied | 476 (47.8%) | $49,318 |
| Renter-Occupied | 520 (52.2%) | $0 |
| Average | 996 (100.0%) | $38,021 |
Occupancy by Householder Income Bracket in Falmouth
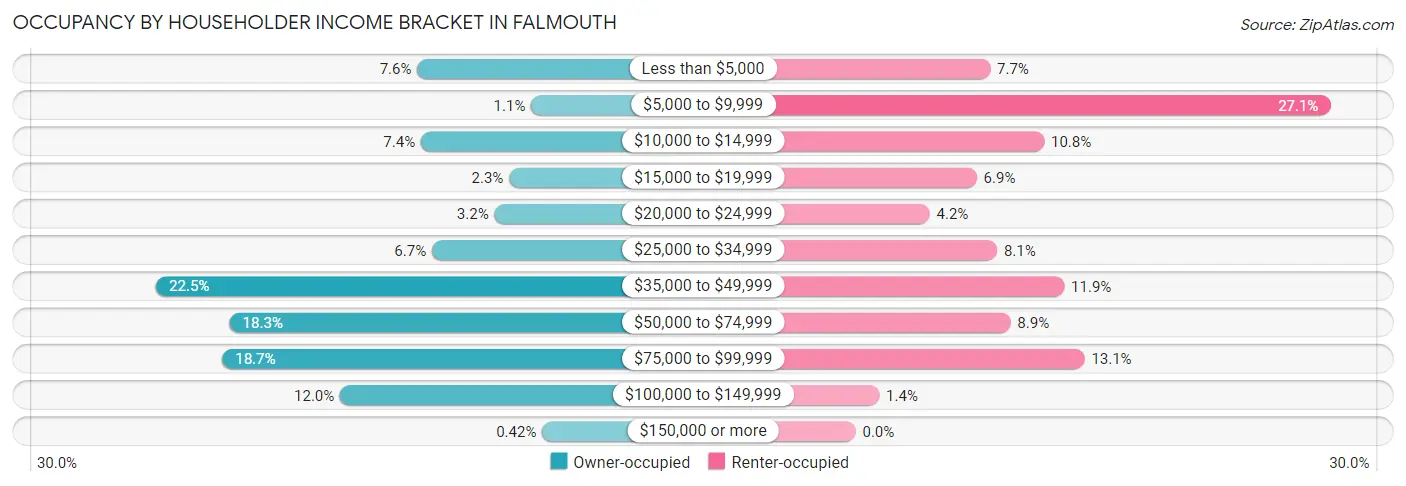
| Income Bracket | Owner-occupied | Renter-occupied |
| Less than $5,000 | 36 (7.6%) | 40 (7.7%) |
| $5,000 to $9,999 | 5 (1.1%) | 141 (27.1%) |
| $10,000 to $14,999 | 35 (7.3%) | 56 (10.8%) |
| $15,000 to $19,999 | 11 (2.3%) | 36 (6.9%) |
| $20,000 to $24,999 | 15 (3.2%) | 22 (4.2%) |
| $25,000 to $34,999 | 32 (6.7%) | 42 (8.1%) |
| $35,000 to $49,999 | 107 (22.5%) | 62 (11.9%) |
| $50,000 to $74,999 | 87 (18.3%) | 46 (8.8%) |
| $75,000 to $99,999 | 89 (18.7%) | 68 (13.1%) |
| $100,000 to $149,999 | 57 (12.0%) | 7 (1.3%) |
| $150,000 or more | 2 (0.4%) | 0 (0.0%) |
| Total | 476 (100.0%) | 520 (100.0%) |
Monthly Housing Cost Tiers in Falmouth
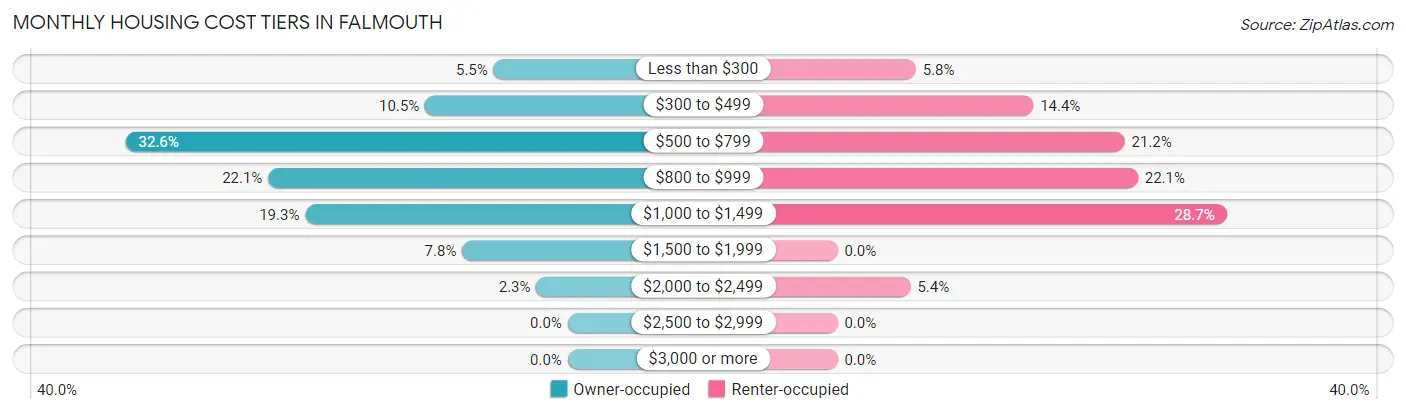
| Monthly Cost | Owner-occupied | Renter-occupied |
| Less than $300 | 26 (5.5%) | 30 (5.8%) |
| $300 to $499 | 50 (10.5%) | 75 (14.4%) |
| $500 to $799 | 155 (32.6%) | 110 (21.1%) |
| $800 to $999 | 105 (22.1%) | 115 (22.1%) |
| $1,000 to $1,499 | 92 (19.3%) | 149 (28.6%) |
| $1,500 to $1,999 | 37 (7.8%) | 0 (0.0%) |
| $2,000 to $2,499 | 11 (2.3%) | 28 (5.4%) |
| $2,500 to $2,999 | 0 (0.0%) | 0 (0.0%) |
| $3,000 or more | 0 (0.0%) | 0 (0.0%) |
| Total | 476 (100.0%) | 520 (100.0%) |
Physical Housing Characteristics in Falmouth
Housing Structures in Falmouth
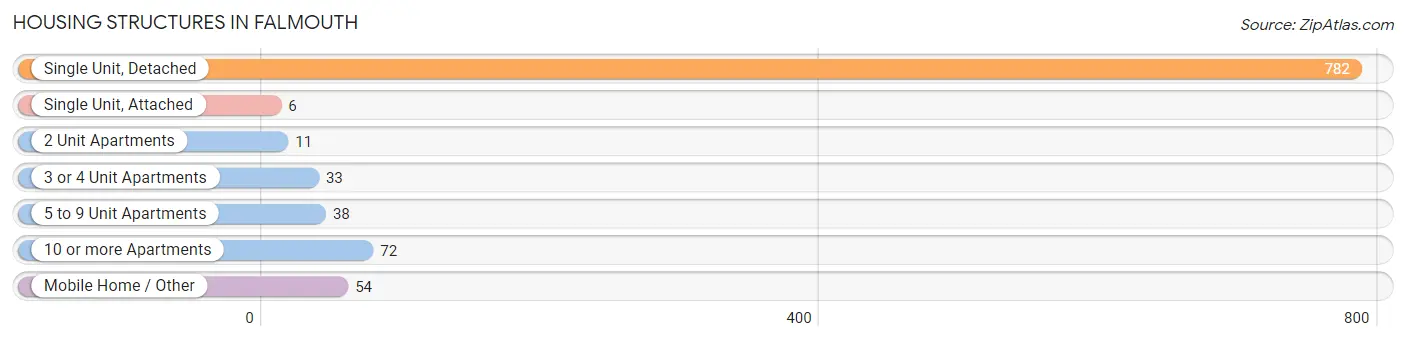
| Structure Type | # Housing Units | % Housing Units |
| Single Unit, Detached | 782 | 78.5% |
| Single Unit, Attached | 6 | 0.6% |
| 2 Unit Apartments | 11 | 1.1% |
| 3 or 4 Unit Apartments | 33 | 3.3% |
| 5 to 9 Unit Apartments | 38 | 3.8% |
| 10 or more Apartments | 72 | 7.2% |
| Mobile Home / Other | 54 | 5.4% |
| Total | 996 | 100.0% |
Housing Structures by Occupancy in Falmouth
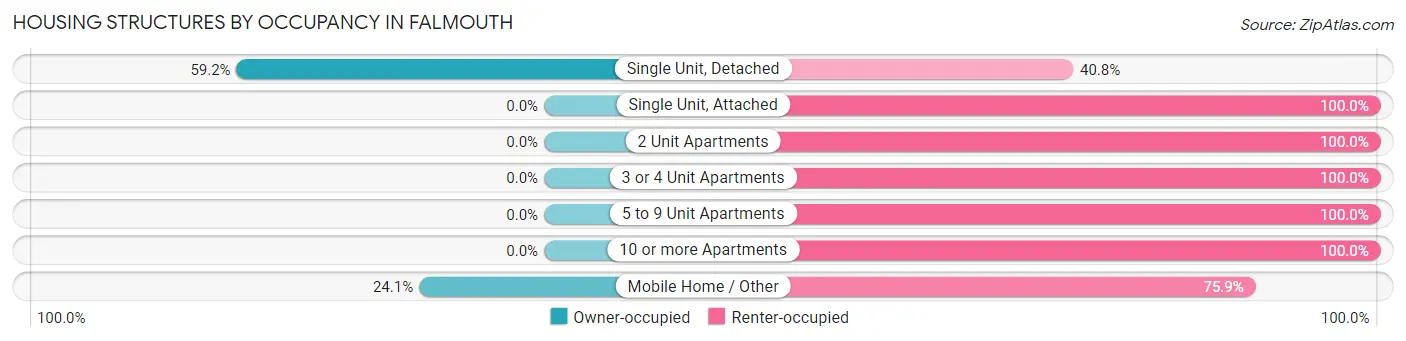
| Structure Type | Owner-occupied | Renter-occupied |
| Single Unit, Detached | 463 (59.2%) | 319 (40.8%) |
| Single Unit, Attached | 0 (0.0%) | 6 (100.0%) |
| 2 Unit Apartments | 0 (0.0%) | 11 (100.0%) |
| 3 or 4 Unit Apartments | 0 (0.0%) | 33 (100.0%) |
| 5 to 9 Unit Apartments | 0 (0.0%) | 38 (100.0%) |
| 10 or more Apartments | 0 (0.0%) | 72 (100.0%) |
| Mobile Home / Other | 13 (24.1%) | 41 (75.9%) |
| Total | 476 (47.8%) | 520 (52.2%) |
Housing Structures by Number of Rooms in Falmouth
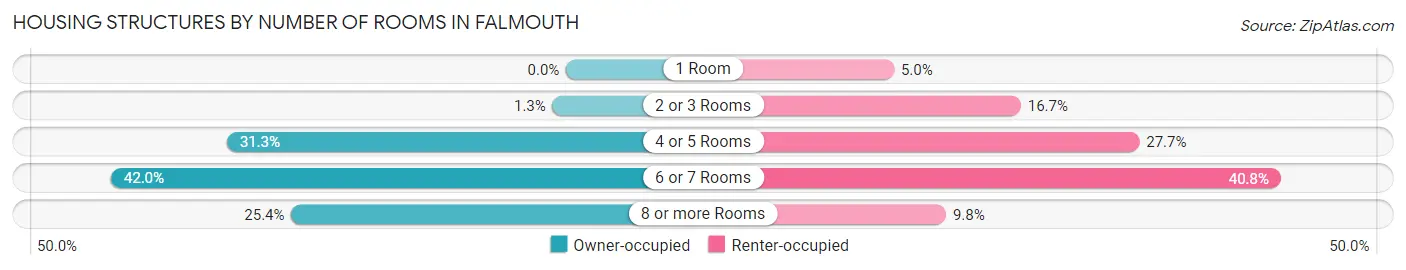
| Number of Rooms | Owner-occupied | Renter-occupied |
| 1 Room | 0 (0.0%) | 26 (5.0%) |
| 2 or 3 Rooms | 6 (1.3%) | 87 (16.7%) |
| 4 or 5 Rooms | 149 (31.3%) | 144 (27.7%) |
| 6 or 7 Rooms | 200 (42.0%) | 212 (40.8%) |
| 8 or more Rooms | 121 (25.4%) | 51 (9.8%) |
| Total | 476 (100.0%) | 520 (100.0%) |
Housing Structure by Heating Type in Falmouth
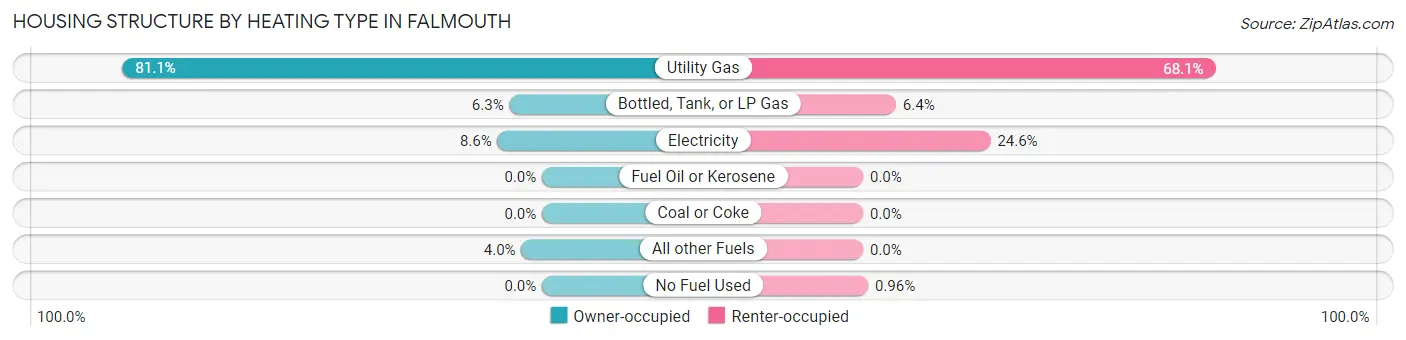
| Heating Type | Owner-occupied | Renter-occupied |
| Utility Gas | 386 (81.1%) | 354 (68.1%) |
| Bottled, Tank, or LP Gas | 30 (6.3%) | 33 (6.4%) |
| Electricity | 41 (8.6%) | 128 (24.6%) |
| Fuel Oil or Kerosene | 0 (0.0%) | 0 (0.0%) |
| Coal or Coke | 0 (0.0%) | 0 (0.0%) |
| All other Fuels | 19 (4.0%) | 0 (0.0%) |
| No Fuel Used | 0 (0.0%) | 5 (1.0%) |
| Total | 476 (100.0%) | 520 (100.0%) |
Household Vehicle Usage in Falmouth
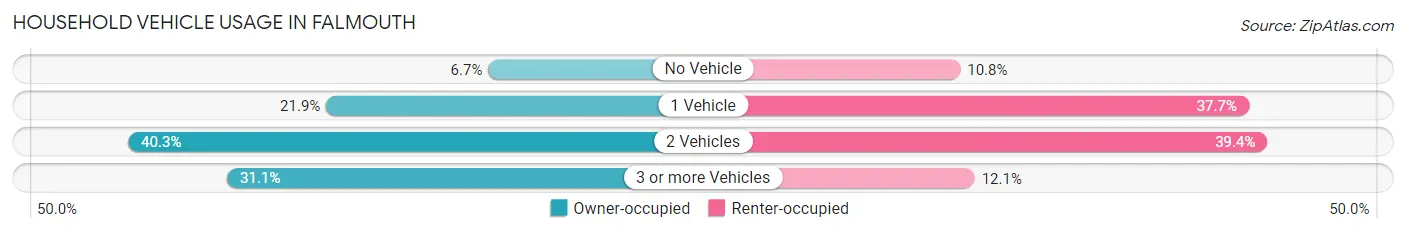
| Vehicles per Household | Owner-occupied | Renter-occupied |
| No Vehicle | 32 (6.7%) | 56 (10.8%) |
| 1 Vehicle | 104 (21.8%) | 196 (37.7%) |
| 2 Vehicles | 192 (40.3%) | 205 (39.4%) |
| 3 or more Vehicles | 148 (31.1%) | 63 (12.1%) |
| Total | 476 (100.0%) | 520 (100.0%) |
Real Estate & Mortgages in Falmouth
Real Estate and Mortgage Overview in Falmouth
| Characteristic | Without Mortgage | With Mortgage |
| Housing Units | 193 | 283 |
| Median Property Value | $88,700 | $97,300 |
| Median Household Income | $46,140 | $0 |
| Monthly Housing Costs | $533 | $0 |
| Real Estate Taxes | $797 | $0 |
Property Value by Mortgage Status in Falmouth
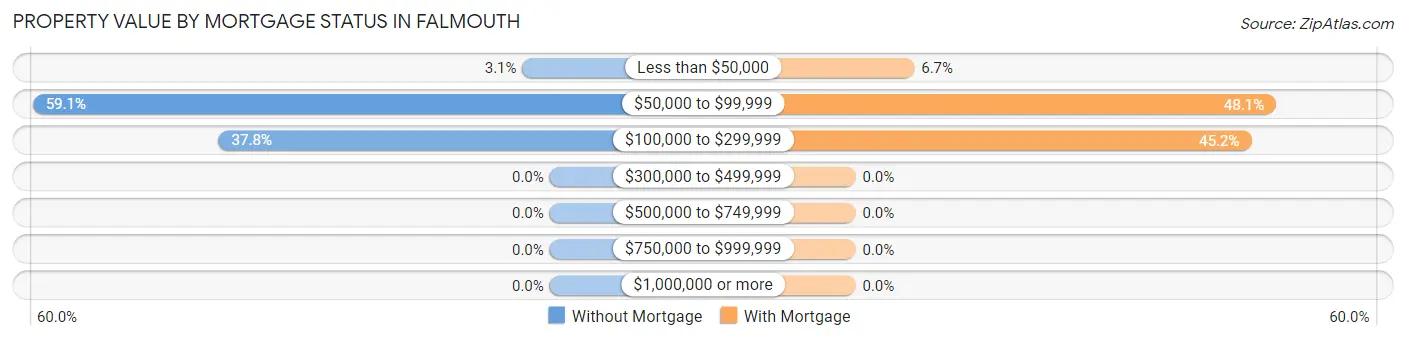
| Property Value | Without Mortgage | With Mortgage |
| Less than $50,000 | 6 (3.1%) | 19 (6.7%) |
| $50,000 to $99,999 | 114 (59.1%) | 136 (48.1%) |
| $100,000 to $299,999 | 73 (37.8%) | 128 (45.2%) |
| $300,000 to $499,999 | 0 (0.0%) | 0 (0.0%) |
| $500,000 to $749,999 | 0 (0.0%) | 0 (0.0%) |
| $750,000 to $999,999 | 0 (0.0%) | 0 (0.0%) |
| $1,000,000 or more | 0 (0.0%) | 0 (0.0%) |
| Total | 193 (100.0%) | 283 (100.0%) |
Household Income by Mortgage Status in Falmouth
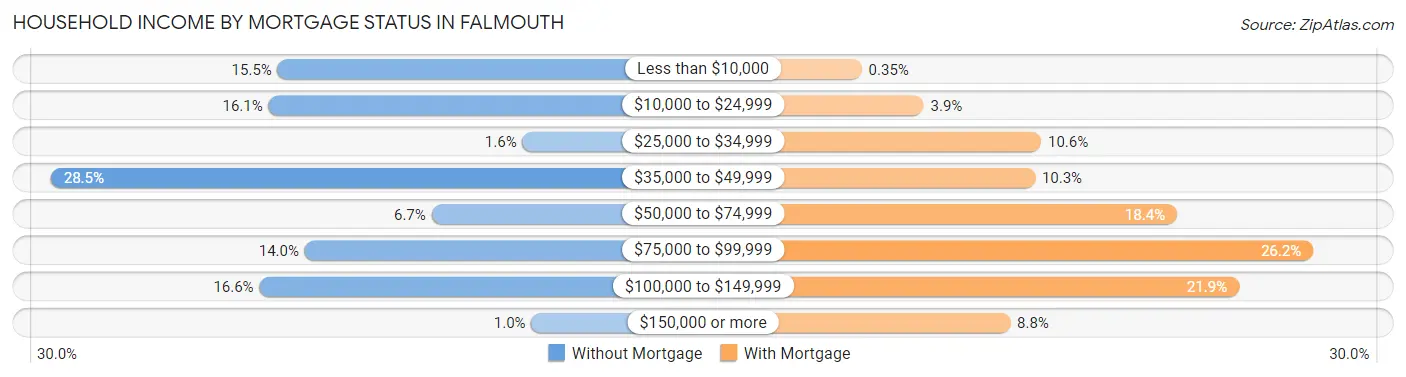
| Household Income | Without Mortgage | With Mortgage |
| Less than $10,000 | 30 (15.5%) | 1 (0.4%) |
| $10,000 to $24,999 | 31 (16.1%) | 11 (3.9%) |
| $25,000 to $34,999 | 3 (1.5%) | 30 (10.6%) |
| $35,000 to $49,999 | 55 (28.5%) | 29 (10.2%) |
| $50,000 to $74,999 | 13 (6.7%) | 52 (18.4%) |
| $75,000 to $99,999 | 27 (14.0%) | 74 (26.2%) |
| $100,000 to $149,999 | 32 (16.6%) | 62 (21.9%) |
| $150,000 or more | 2 (1.0%) | 25 (8.8%) |
| Total | 193 (100.0%) | 283 (100.0%) |
Property Value to Household Income Ratio in Falmouth
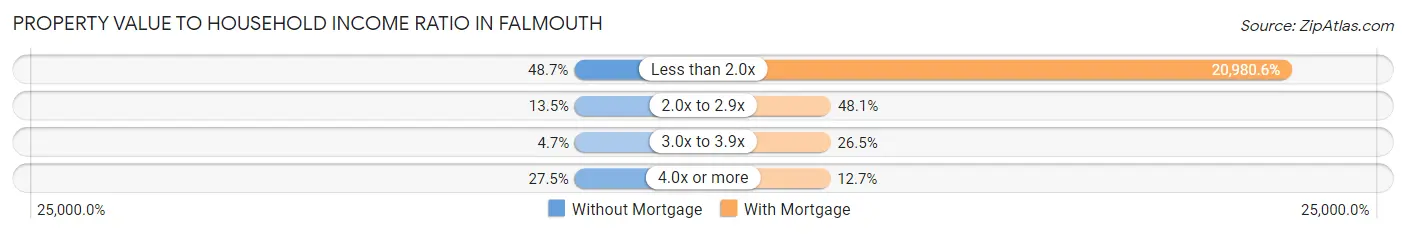
| Value-to-Income Ratio | Without Mortgage | With Mortgage |
| Less than 2.0x | 94 (48.7%) | 59,375 (20,980.6%) |
| 2.0x to 2.9x | 26 (13.5%) | 136 (48.1%) |
| 3.0x to 3.9x | 9 (4.7%) | 75 (26.5%) |
| 4.0x or more | 53 (27.5%) | 36 (12.7%) |
| Total | 193 (100.0%) | 283 (100.0%) |
Real Estate Taxes by Mortgage Status in Falmouth
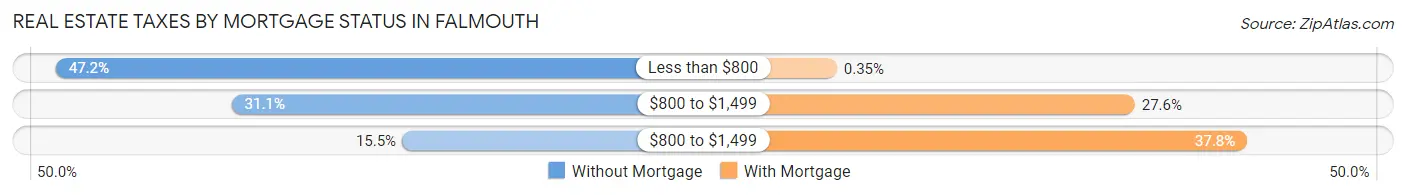
| Property Taxes | Without Mortgage | With Mortgage |
| Less than $800 | 91 (47.1%) | 1 (0.4%) |
| $800 to $1,499 | 60 (31.1%) | 78 (27.6%) |
| $800 to $1,499 | 30 (15.5%) | 107 (37.8%) |
| Total | 193 (100.0%) | 283 (100.0%) |
Health & Disability in Falmouth
Health Insurance Coverage by Age in Falmouth
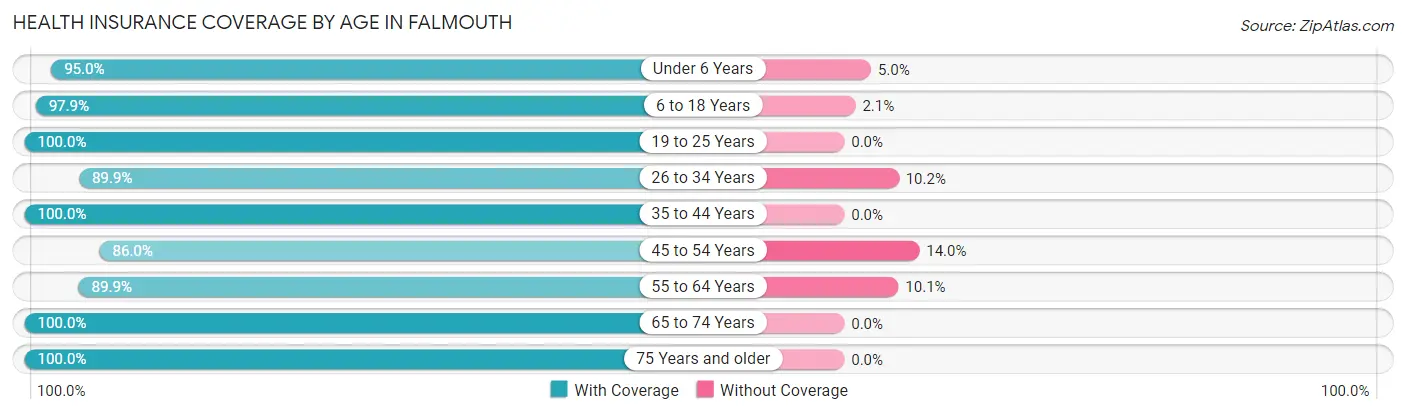
| Age Bracket | With Coverage | Without Coverage |
| Under 6 Years | 363 (95.0%) | 19 (5.0%) |
| 6 to 18 Years | 330 (97.9%) | 7 (2.1%) |
| 19 to 25 Years | 157 (100.0%) | 0 (0.0%) |
| 26 to 34 Years | 354 (89.8%) | 40 (10.2%) |
| 35 to 44 Years | 201 (100.0%) | 0 (0.0%) |
| 45 to 54 Years | 240 (86.0%) | 39 (14.0%) |
| 55 to 64 Years | 312 (89.9%) | 35 (10.1%) |
| 65 to 74 Years | 251 (100.0%) | 0 (0.0%) |
| 75 Years and older | 186 (100.0%) | 0 (0.0%) |
| Total | 2,394 (94.5%) | 140 (5.5%) |
Health Insurance Coverage by Citizenship Status in Falmouth
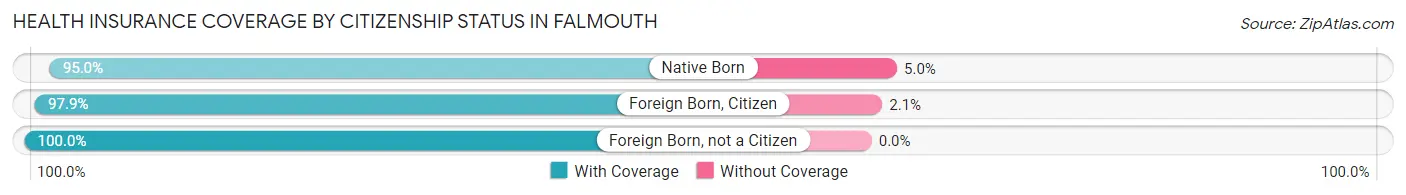
| Citizenship Status | With Coverage | Without Coverage |
| Native Born | 363 (95.0%) | 19 (5.0%) |
| Foreign Born, Citizen | 330 (97.9%) | 7 (2.1%) |
| Foreign Born, not a Citizen | 157 (100.0%) | 0 (0.0%) |
Health Insurance Coverage by Household Income in Falmouth
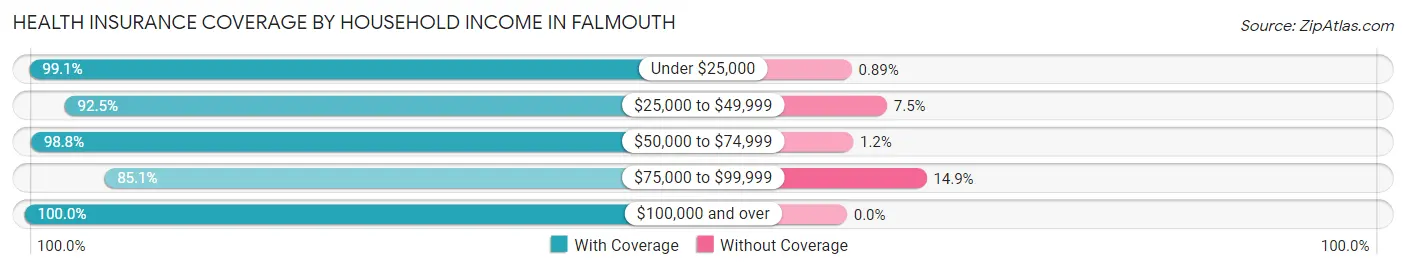
| Household Income | With Coverage | Without Coverage |
| Under $25,000 | 669 (99.1%) | 6 (0.9%) |
| $25,000 to $49,999 | 505 (92.5%) | 41 (7.5%) |
| $50,000 to $74,999 | 507 (98.8%) | 6 (1.2%) |
| $75,000 to $99,999 | 496 (85.1%) | 87 (14.9%) |
| $100,000 and over | 197 (100.0%) | 0 (0.0%) |
Public vs Private Health Insurance Coverage by Age in Falmouth
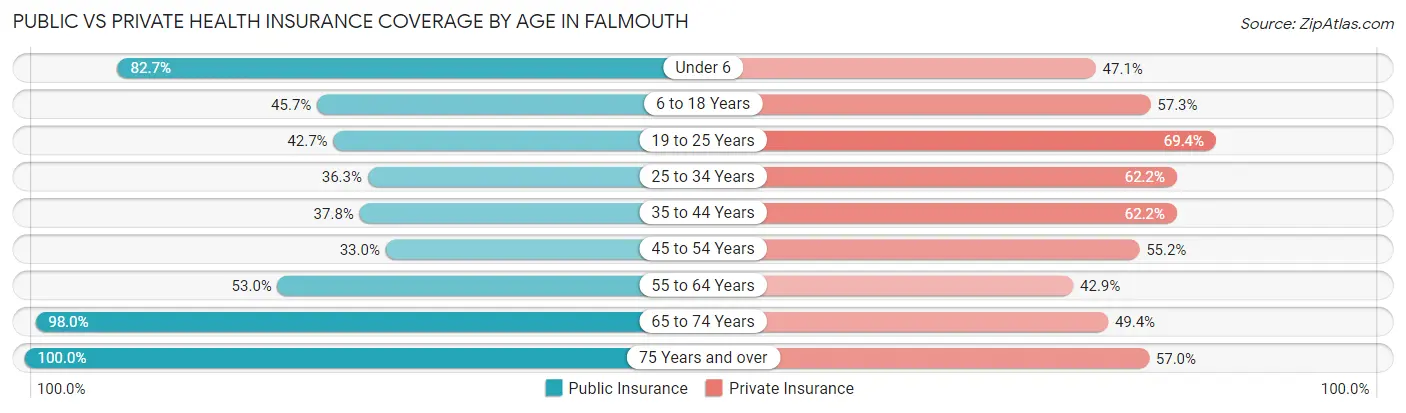
| Age Bracket | Public Insurance | Private Insurance |
| Under 6 | 316 (82.7%) | 180 (47.1%) |
| 6 to 18 Years | 154 (45.7%) | 193 (57.3%) |
| 19 to 25 Years | 67 (42.7%) | 109 (69.4%) |
| 25 to 34 Years | 143 (36.3%) | 245 (62.2%) |
| 35 to 44 Years | 76 (37.8%) | 125 (62.2%) |
| 45 to 54 Years | 92 (33.0%) | 154 (55.2%) |
| 55 to 64 Years | 184 (53.0%) | 149 (42.9%) |
| 65 to 74 Years | 246 (98.0%) | 124 (49.4%) |
| 75 Years and over | 186 (100.0%) | 106 (57.0%) |
| Total | 1,464 (57.8%) | 1,385 (54.7%) |
Disability Status by Sex by Age in Falmouth
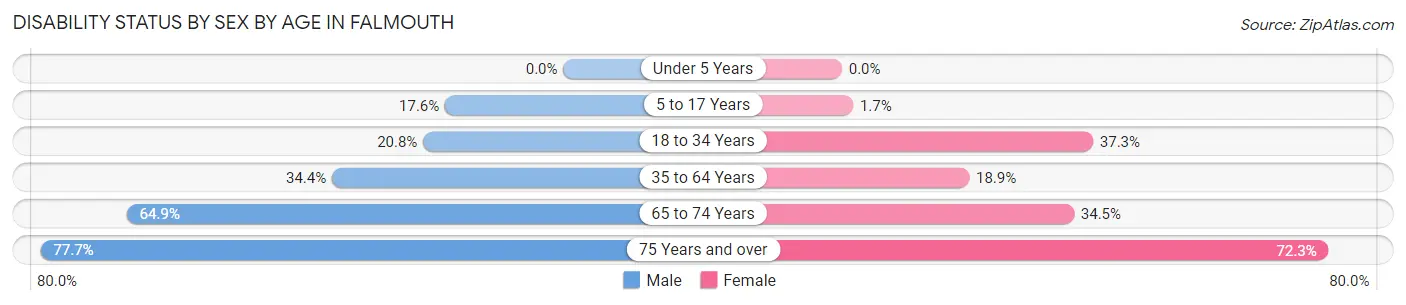
| Age Bracket | Male | Female |
| Under 5 Years | 0 (0.0%) | 0 (0.0%) |
| 5 to 17 Years | 23 (17.6%) | 5 (1.7%) |
| 18 to 34 Years | 62 (20.8%) | 104 (37.3%) |
| 35 to 64 Years | 135 (34.4%) | 82 (18.9%) |
| 65 to 74 Years | 48 (64.9%) | 61 (34.5%) |
| 75 Years and over | 66 (77.6%) | 73 (72.3%) |
Disability Class by Sex by Age in Falmouth
Disability Class: Hearing Difficulty
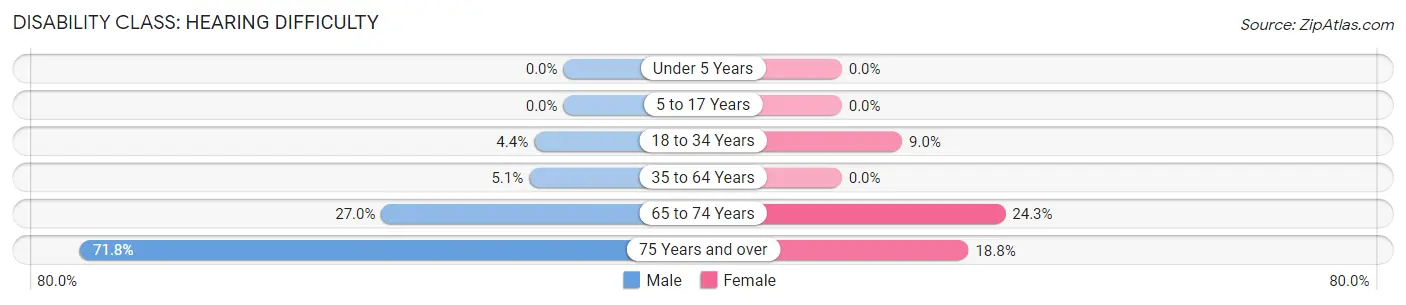
| Age Bracket | Male | Female |
| Under 5 Years | 0 (0.0%) | 0 (0.0%) |
| 5 to 17 Years | 0 (0.0%) | 0 (0.0%) |
| 18 to 34 Years | 13 (4.4%) | 25 (9.0%) |
| 35 to 64 Years | 20 (5.1%) | 0 (0.0%) |
| 65 to 74 Years | 20 (27.0%) | 43 (24.3%) |
| 75 Years and over | 61 (71.8%) | 19 (18.8%) |
Disability Class: Vision Difficulty
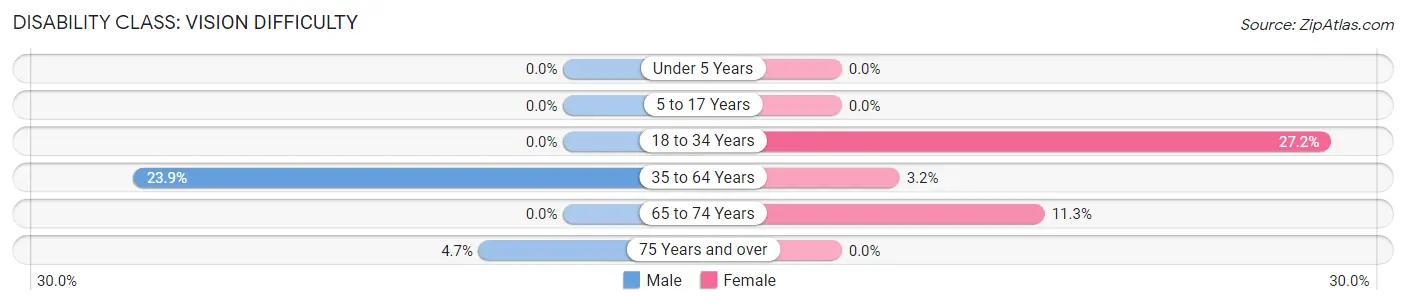
| Age Bracket | Male | Female |
| Under 5 Years | 0 (0.0%) | 0 (0.0%) |
| 5 to 17 Years | 0 (0.0%) | 0 (0.0%) |
| 18 to 34 Years | 0 (0.0%) | 76 (27.2%) |
| 35 to 64 Years | 94 (23.9%) | 14 (3.2%) |
| 65 to 74 Years | 0 (0.0%) | 20 (11.3%) |
| 75 Years and over | 4 (4.7%) | 0 (0.0%) |
Disability Class: Cognitive Difficulty
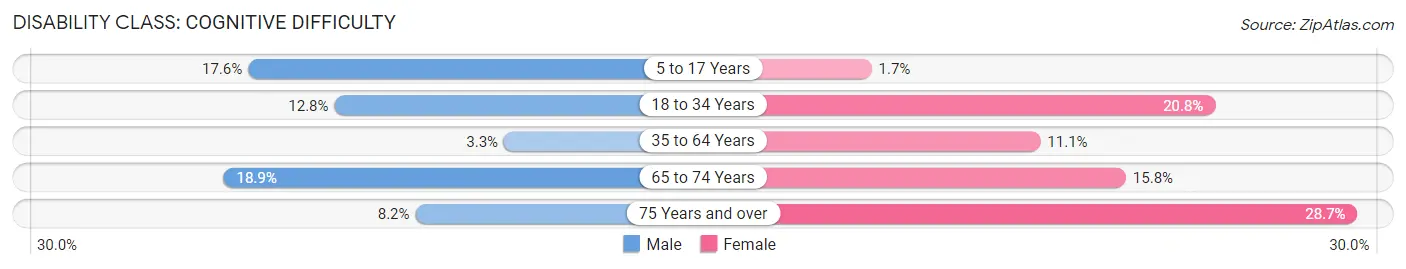
| Age Bracket | Male | Female |
| 5 to 17 Years | 23 (17.6%) | 5 (1.7%) |
| 18 to 34 Years | 38 (12.8%) | 58 (20.8%) |
| 35 to 64 Years | 13 (3.3%) | 48 (11.1%) |
| 65 to 74 Years | 14 (18.9%) | 28 (15.8%) |
| 75 Years and over | 7 (8.2%) | 29 (28.7%) |
Disability Class: Ambulatory Difficulty
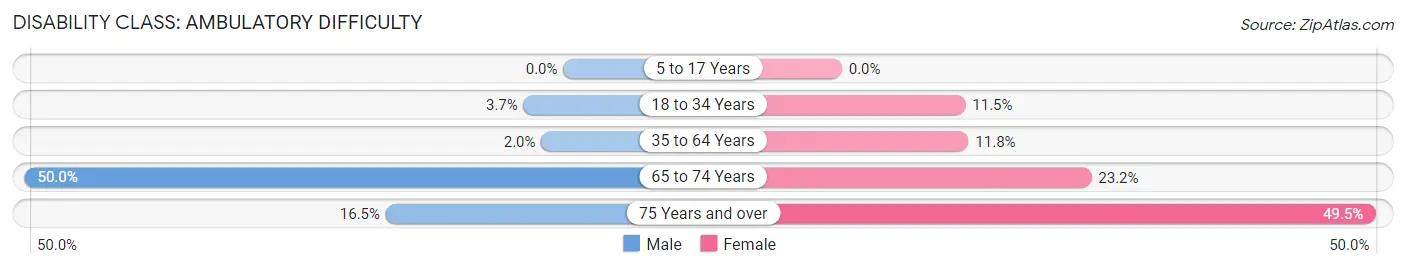
| Age Bracket | Male | Female |
| 5 to 17 Years | 0 (0.0%) | 0 (0.0%) |
| 18 to 34 Years | 11 (3.7%) | 32 (11.5%) |
| 35 to 64 Years | 8 (2.0%) | 51 (11.7%) |
| 65 to 74 Years | 37 (50.0%) | 41 (23.2%) |
| 75 Years and over | 14 (16.5%) | 50 (49.5%) |
Disability Class: Self-Care Difficulty
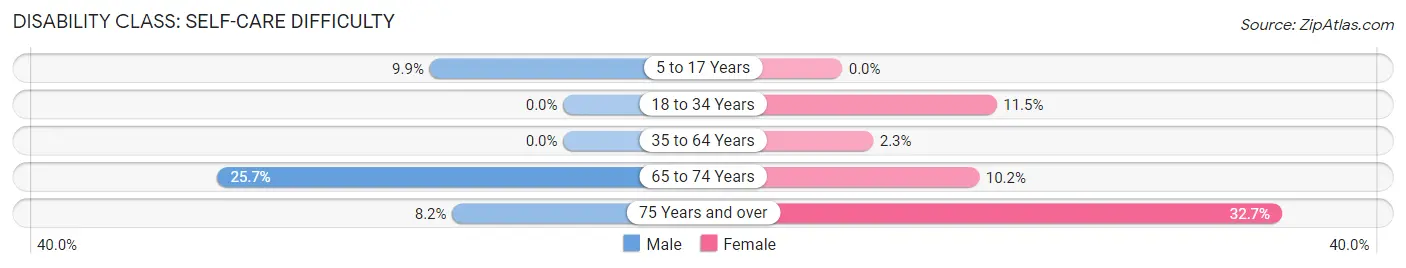
| Age Bracket | Male | Female |
| 5 to 17 Years | 13 (9.9%) | 0 (0.0%) |
| 18 to 34 Years | 0 (0.0%) | 32 (11.5%) |
| 35 to 64 Years | 0 (0.0%) | 10 (2.3%) |
| 65 to 74 Years | 19 (25.7%) | 18 (10.2%) |
| 75 Years and over | 7 (8.2%) | 33 (32.7%) |
Technology Access in Falmouth
Computing Device Access in Falmouth
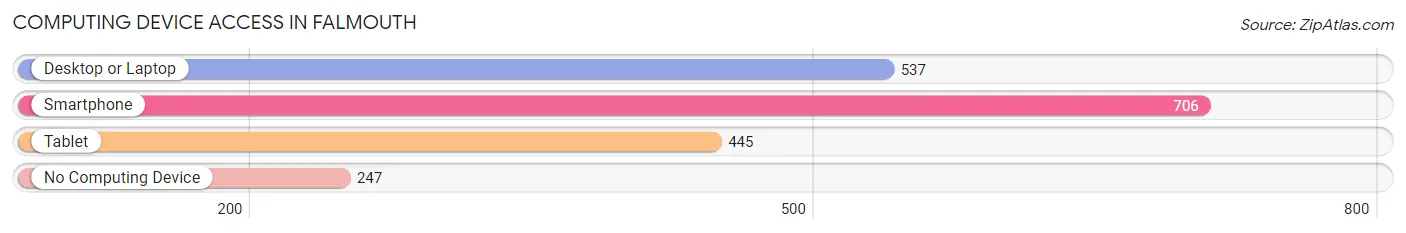
| Device Type | # Households | % Households |
| Desktop or Laptop | 537 | 53.9% |
| Smartphone | 706 | 70.9% |
| Tablet | 445 | 44.7% |
| No Computing Device | 247 | 24.8% |
| Total | 996 | 100.0% |
Internet Access in Falmouth
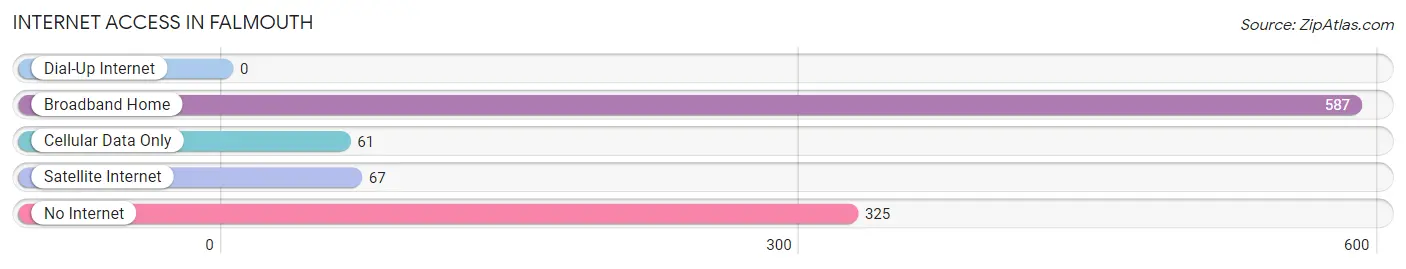
| Internet Type | # Households | % Households |
| Dial-Up Internet | 0 | 0.0% |
| Broadband Home | 587 | 58.9% |
| Cellular Data Only | 61 | 6.1% |
| Satellite Internet | 67 | 6.7% |
| No Internet | 325 | 32.6% |
| Total | 996 | 100.0% |
Falmouth Summary
Falmouth, Kentucky is a small city located in Pendleton County, Kentucky. It is situated on the banks of the Licking River, approximately halfway between Cincinnati, Ohio and Lexington, Kentucky. The city has a population of approximately 2,000 people and is the county seat of Pendleton County.
History
Falmouth was founded in 1793 by Colonel William Fleming, who was a Revolutionary War veteran. He named the town after Falmouth, England, which was the hometown of his wife. The town was incorporated in 1836 and was the county seat of Pendleton County.
In the early 19th century, Falmouth was a bustling river port and a major stop on the Underground Railroad. It was also a major stop on the Ohio and Kentucky Railroad, which connected Cincinnati and Lexington.
Geography
Falmouth is located in the Bluegrass region of Kentucky, which is known for its rolling hills and lush green pastures. The city is situated on the banks of the Licking River, which is a tributary of the Ohio River. The city is located approximately halfway between Cincinnati, Ohio and Lexington, Kentucky.
The climate in Falmouth is humid subtropical, with hot summers and mild winters. The average annual temperature is around 60 degrees Fahrenheit. The average annual precipitation is around 40 inches.
Economy
The economy of Falmouth is largely based on agriculture and tourism. The city is home to several farms, which produce corn, soybeans, wheat, and other crops. The city is also home to several wineries, which produce a variety of wines.
Tourism is also an important part of the economy. The city is home to several historic sites, including the Pendleton County Courthouse, the Falmouth Historic District, and the Pendleton County Museum. The city also hosts several festivals throughout the year, including the Falmouth Festival of the Arts and the Falmouth Country Music Festival.
Demographics
As of the 2010 census, the population of Falmouth was 2,039. The racial makeup of the city was 95.3% White, 1.7% African American, 0.3% Native American, 0.3% Asian, 0.1% Pacific Islander, 0.7% from other races, and 1.6% from two or more races. Hispanic or Latino of any race were 1.7% of the population.
The median household income in Falmouth was $37,917, and the median family income was $45,938. The per capita income was $19,945. About 11.3% of families and 14.2% of the population were below the poverty line, including 18.2% of those under age 18 and 8.3% of those age 65 or over.
The population of Falmouth is largely Christian, with the majority of residents belonging to the Protestant faith. The city is also home to a small Jewish community.
Common Questions
What is Per Capita Income in Falmouth?
Per Capita income in Falmouth is $17,882.
What is the Median Family Income in Falmouth?
Median Family Income in Falmouth is $51,000.
What is the Median Household income in Falmouth?
Median Household Income in Falmouth is $38,021.
What is Income or Wage Gap in Falmouth?
Income or Wage Gap in Falmouth is 62.9%.
Women in Falmouth earn 37.1 cents for every dollar earned by a man.
What is Family Income Deficit in Falmouth?
Family Income Deficit in Falmouth is $15,035.
Families that are below poverty line in Falmouth earn $15,035 less on average than the poverty threshold level.
What is Inequality or Gini Index in Falmouth?
Inequality or Gini Index in Falmouth is 0.45.
What is the Total Population of Falmouth?
Total Population of Falmouth is 2,548.
What is the Total Male Population of Falmouth?
Total Male Population of Falmouth is 1,151.
What is the Total Female Population of Falmouth?
Total Female Population of Falmouth is 1,397.
What is the Ratio of Males per 100 Females in Falmouth?
There are 82.39 Males per 100 Females in Falmouth.
What is the Ratio of Females per 100 Males in Falmouth?
There are 121.37 Females per 100 Males in Falmouth.
What is the Median Population Age in Falmouth?
Median Population Age in Falmouth is 35.2 Years.
What is the Average Family Size in Falmouth
Average Family Size in Falmouth is 3.2 People.
What is the Average Household Size in Falmouth
Average Household Size in Falmouth is 2.5 People.
How Large is the Labor Force in Falmouth?
There are 1,098 People in the Labor Forcein in Falmouth.
What is the Percentage of People in the Labor Force in Falmouth?
58.3% of People are in the Labor Force in Falmouth.
What is the Unemployment Rate in Falmouth?
Unemployment Rate in Falmouth is 6.5%.