Summersville, KY Map & Demographics
Summersville Map
Summersville Overview
$19,842
PER CAPITA INCOME
$48,269
AVG HOUSEHOLD INCOME
48.2%
WAGE / INCOME GAP [ % ]
51.8¢/ $1
WAGE / INCOME GAP [ $ ]
0.47
INEQUALITY / GINI INDEX
366
TOTAL POPULATION
161
MALE POPULATION
205
FEMALE POPULATION
78.54
MALES / 100 FEMALES
127.33
FEMALES / 100 MALES
24.0
MEDIAN AGE
3.5
AVG FAMILY SIZE
2.6
AVG HOUSEHOLD SIZE
146
LABOR FORCE [ PEOPLE ]
50.7%
PERCENT IN LABOR FORCE
Summersville Zip Codes
Summersville Area Codes
Income in Summersville
Income Overview in Summersville
| Characteristic | Number | Measure |
| Per Capita Income | 366 | $19,842 |
| Median Family Income | 90 | $0 |
| Mean Family Income | 90 | $68,093 |
| Median Household Income | 140 | $48,269 |
| Mean Household Income | 140 | $56,384 |
| Income Deficit | 90 | $0 |
| Wage / Income Gap (%) | 366 | 48.18% |
| Wage / Income Gap ($) | 366 | 51.82¢ per $1 |
| Gini / Inequality Index | 366 | 0.47 |
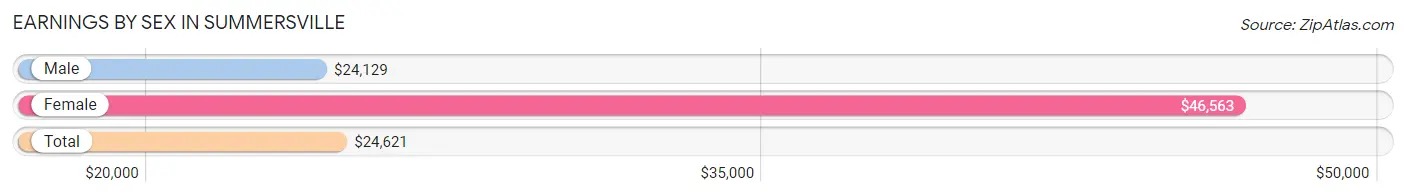
Earnings by Sex in Summersville
Average Earnings in Summersville are $24,621, $24,129 for men and $46,563 for women, a difference of 48.2%.
| Sex | Number | Average Earnings |
| Male | 87 (59.6%) | $24,129 |
| Female | 59 (40.4%) | $46,563 |
| Total | 146 (100.0%) | $24,621 |
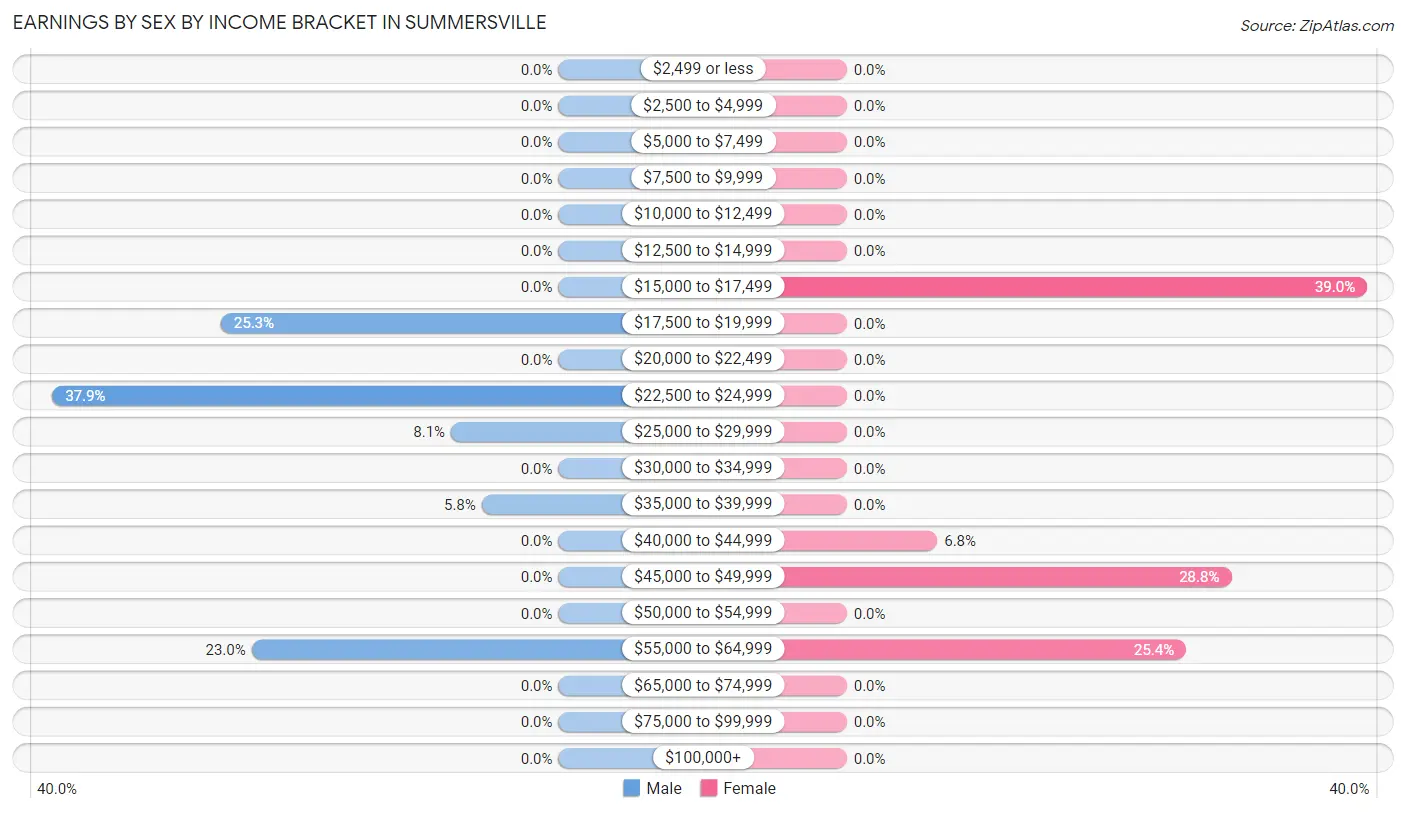
Earnings by Sex by Income Bracket in Summersville
The most common earnings brackets in Summersville are $22,500 to $24,999 for men (33 | 37.9%) and $15,000 to $17,499 for women (23 | 39.0%).
| Income | Male | Female |
| $2,499 or less | 0 (0.0%) | 0 (0.0%) |
| $2,500 to $4,999 | 0 (0.0%) | 0 (0.0%) |
| $5,000 to $7,499 | 0 (0.0%) | 0 (0.0%) |
| $7,500 to $9,999 | 0 (0.0%) | 0 (0.0%) |
| $10,000 to $12,499 | 0 (0.0%) | 0 (0.0%) |
| $12,500 to $14,999 | 0 (0.0%) | 0 (0.0%) |
| $15,000 to $17,499 | 0 (0.0%) | 23 (39.0%) |
| $17,500 to $19,999 | 22 (25.3%) | 0 (0.0%) |
| $20,000 to $22,499 | 0 (0.0%) | 0 (0.0%) |
| $22,500 to $24,999 | 33 (37.9%) | 0 (0.0%) |
| $25,000 to $29,999 | 7 (8.1%) | 0 (0.0%) |
| $30,000 to $34,999 | 0 (0.0%) | 0 (0.0%) |
| $35,000 to $39,999 | 5 (5.8%) | 0 (0.0%) |
| $40,000 to $44,999 | 0 (0.0%) | 4 (6.8%) |
| $45,000 to $49,999 | 0 (0.0%) | 17 (28.8%) |
| $50,000 to $54,999 | 0 (0.0%) | 0 (0.0%) |
| $55,000 to $64,999 | 20 (23.0%) | 15 (25.4%) |
| $65,000 to $74,999 | 0 (0.0%) | 0 (0.0%) |
| $75,000 to $99,999 | 0 (0.0%) | 0 (0.0%) |
| $100,000+ | 0 (0.0%) | 0 (0.0%) |
| Total | 87 (100.0%) | 59 (100.0%) |
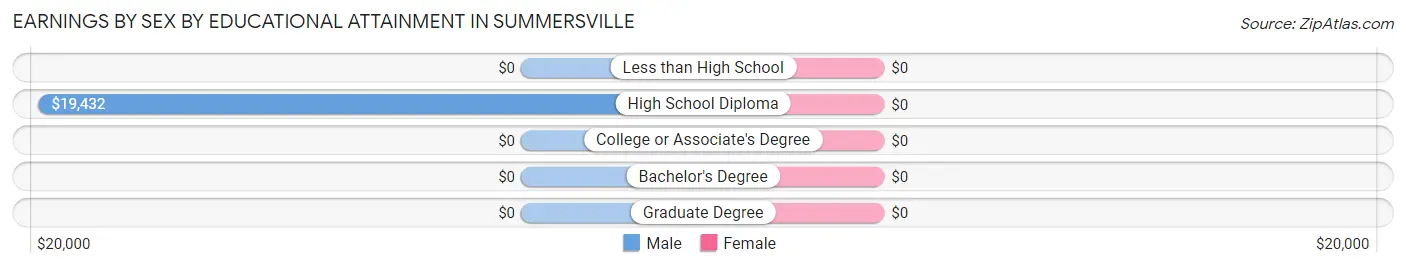
Earnings by Sex by Educational Attainment in Summersville
| Educational Attainment | Male Income | Female Income |
| Less than High School | - | - |
| High School Diploma | $19,432 | $0 |
| College or Associate's Degree | - | - |
| Bachelor's Degree | - | - |
| Graduate Degree | - | - |
| Total | - | - |
Family Income in Summersville
Family Income Brackets in Summersville
According to the Summersville family income data, there are 39 families falling into the $100,000 to $149,999 income range, which is the most common income bracket and makes up 43.3% of all families.
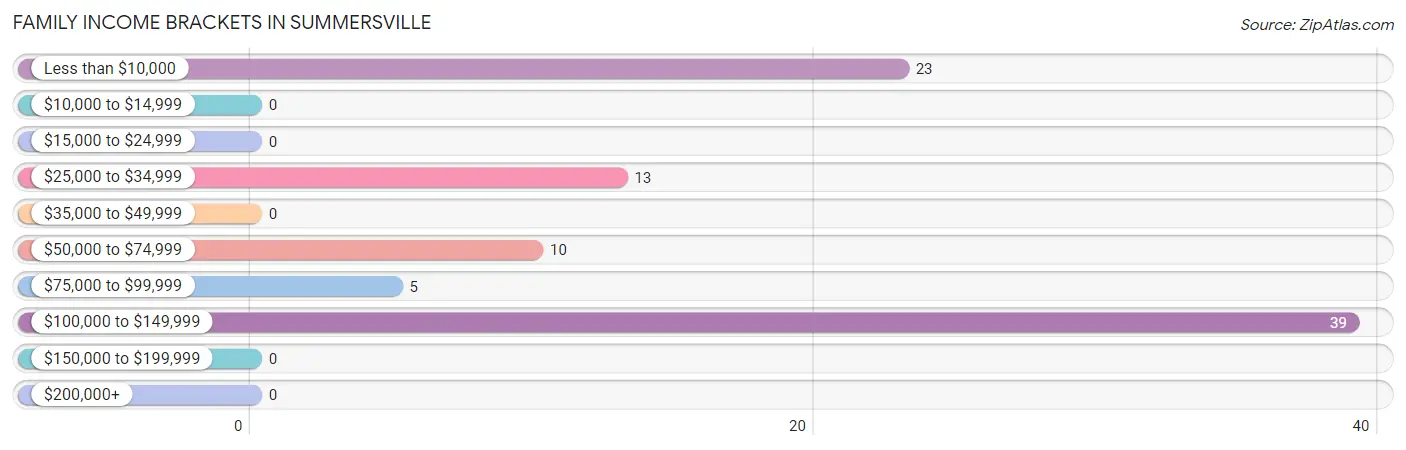
| Income Bracket | # Families | % Families |
| Less than $10,000 | 23 | 25.6% |
| $10,000 to $14,999 | 0 | 0.0% |
| $15,000 to $24,999 | 0 | 0.0% |
| $25,000 to $34,999 | 13 | 14.4% |
| $35,000 to $49,999 | 0 | 0.0% |
| $50,000 to $74,999 | 10 | 11.1% |
| $75,000 to $99,999 | 5 | 5.6% |
| $100,000 to $149,999 | 39 | 43.3% |
| $150,000 to $199,999 | 0 | 0.0% |
| $200,000+ | 0 | 0.0% |
Family Income by Famaliy Size in Summersville
| Income Bracket | # Families | Median Income |
| 2-Person Families | 45 (50.0%) | $0 |
| 3-Person Families | 5 (5.6%) | $0 |
| 4-Person Families | 23 (25.6%) | $0 |
| 5-Person Families | 0 (0.0%) | $0 |
| 6-Person Families | 0 (0.0%) | $0 |
| 7+ Person Families | 17 (18.9%) | $0 |
| Total | 90 (100.0%) | $0 |
Family Income by Number of Earners in Summersville
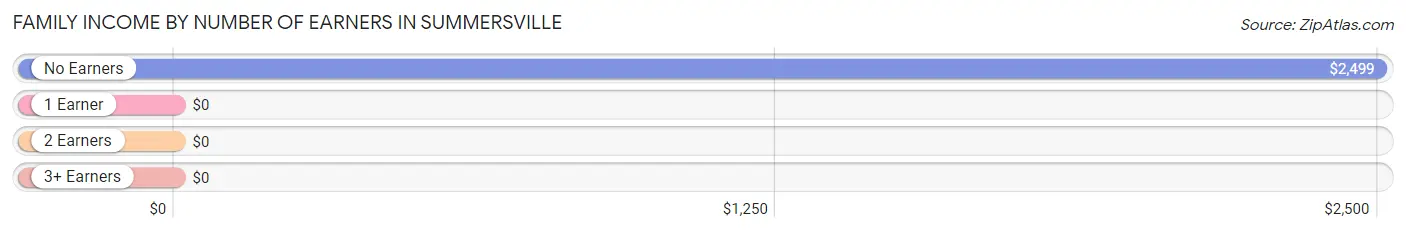
| Number of Earners | # Families | Median Income |
| No Earners | 43 (47.8%) | $2,499 |
| 1 Earner | 3 (3.3%) | $0 |
| 2 Earners | 27 (30.0%) | $0 |
| 3+ Earners | 17 (18.9%) | $0 |
| Total | 90 (100.0%) | $0 |
Household Income in Summersville
Household Income Brackets in Summersville
With 42 households falling in the category, the $100,000 to $149,999 income range is the most frequent in Summersville, accounting for 30.0% of all households.
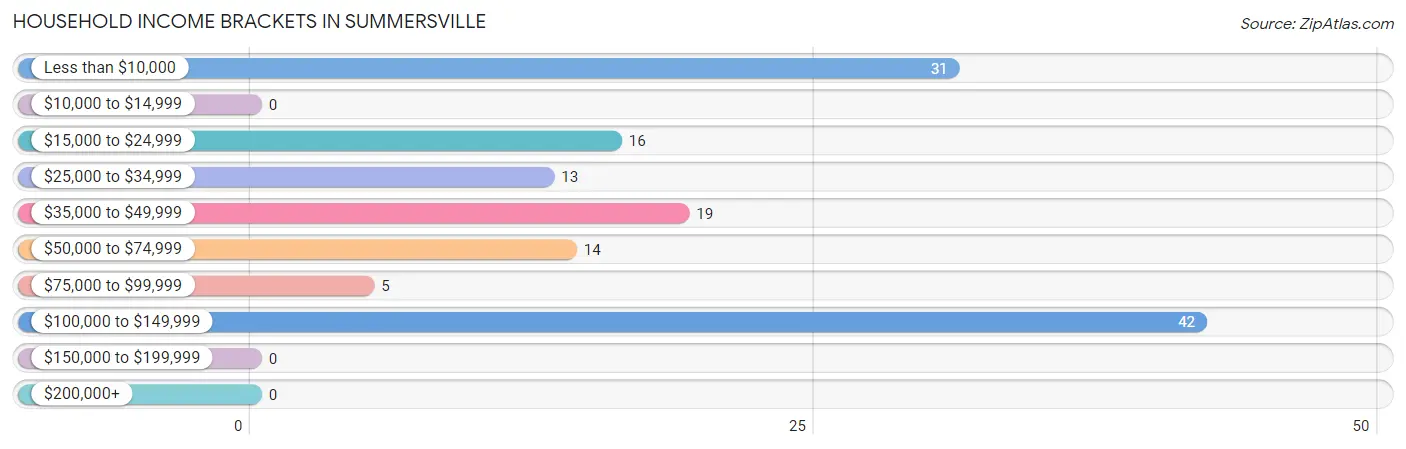
| Income Bracket | # Households | % Households |
| Less than $10,000 | 31 | 22.1% |
| $10,000 to $14,999 | 0 | 0.0% |
| $15,000 to $24,999 | 16 | 11.4% |
| $25,000 to $34,999 | 13 | 9.3% |
| $35,000 to $49,999 | 19 | 13.6% |
| $50,000 to $74,999 | 14 | 10.0% |
| $75,000 to $99,999 | 5 | 3.6% |
| $100,000 to $149,999 | 42 | 30.0% |
| $150,000 to $199,999 | 0 | 0.0% |
| $200,000+ | 0 | 0.0% |
Household Income by Householder Age in Summersville
The median household income in Summersville is $48,269, with the highest median household income of $121,477 found in the 45 to 64 years age bracket for the primary householder. A total of 52 households (37.1%) fall into this category. Meanwhile, the 15 to 24 years age bracket for the primary householder has the lowest median household income of $0, with 26 households (18.6%) in this group.
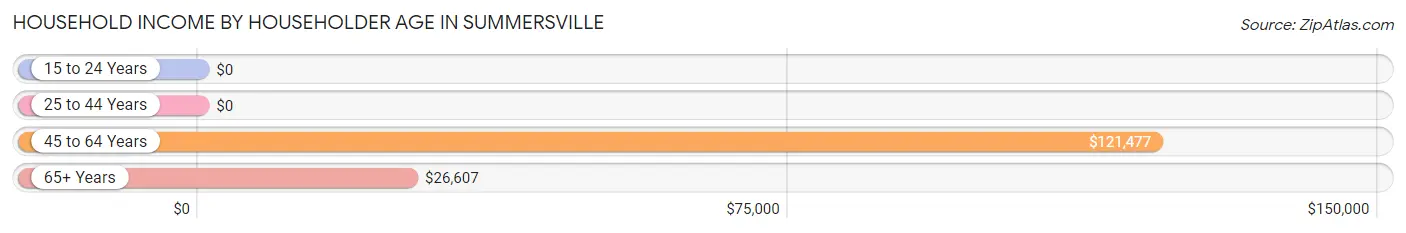
| Income Bracket | # Households | Median Income |
| 15 to 24 Years | 26 (18.6%) | $0 |
| 25 to 44 Years | 5 (3.6%) | $0 |
| 45 to 64 Years | 52 (37.1%) | $121,477 |
| 65+ Years | 57 (40.7%) | $26,607 |
| Total | 140 (100.0%) | $48,269 |
Poverty in Summersville
Income Below Poverty by Sex and Age in Summersville
With 31.7% poverty level for males and 28.3% for females among the residents of Summersville, under 5 year old males and under 5 year old females are the most vulnerable to poverty, with 28 males (96.6%) and 7 females (100.0%) in their respective age groups living below the poverty level.
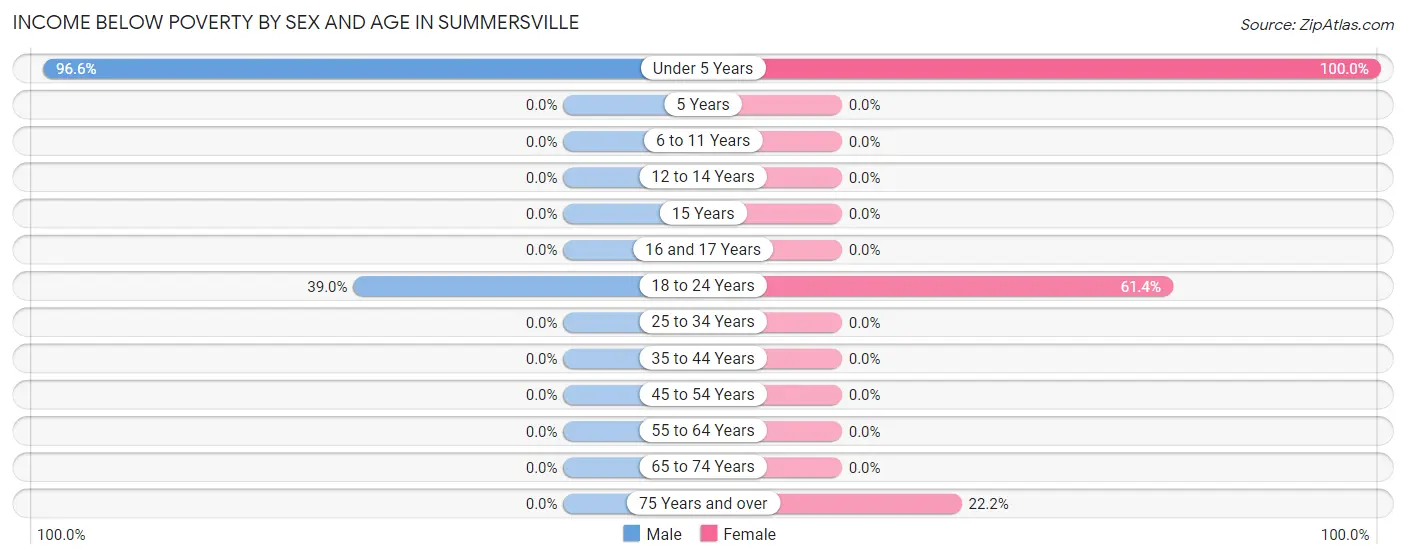
| Age Bracket | Male | Female |
| Under 5 Years | 28 (96.6%) | 7 (100.0%) |
| 5 Years | 0 (0.0%) | 0 (0.0%) |
| 6 to 11 Years | 0 (0.0%) | 0 (0.0%) |
| 12 to 14 Years | 0 (0.0%) | 0 (0.0%) |
| 15 Years | 0 (0.0%) | 0 (0.0%) |
| 16 and 17 Years | 0 (0.0%) | 0 (0.0%) |
| 18 to 24 Years | 23 (39.0%) | 43 (61.4%) |
| 25 to 34 Years | 0 (0.0%) | 0 (0.0%) |
| 35 to 44 Years | 0 (0.0%) | 0 (0.0%) |
| 45 to 54 Years | 0 (0.0%) | 0 (0.0%) |
| 55 to 64 Years | 0 (0.0%) | 0 (0.0%) |
| 65 to 74 Years | 0 (0.0%) | 0 (0.0%) |
| 75 Years and over | 0 (0.0%) | 8 (22.2%) |
| Total | 51 (31.7%) | 58 (28.3%) |
Income Above Poverty by Sex and Age in Summersville
According to the poverty statistics in Summersville, males aged 15 years and females aged 6 to 11 years are the age groups that are most secure financially, with 100.0% of males and 100.0% of females in these age groups living above the poverty line.
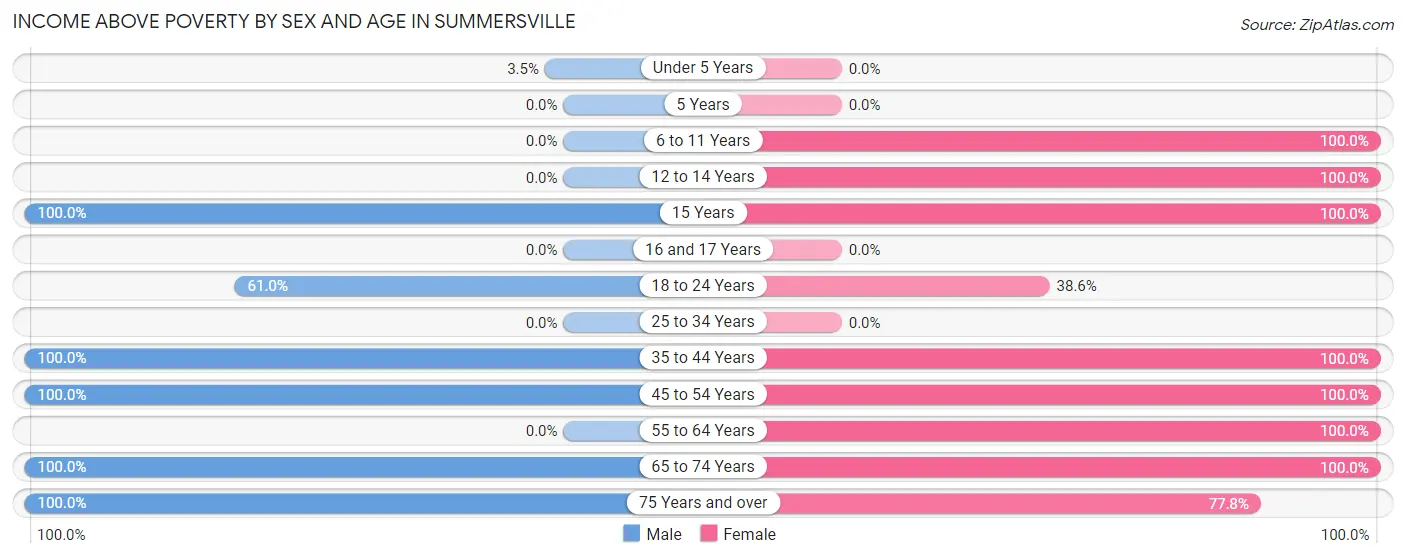
| Age Bracket | Male | Female |
| Under 5 Years | 1 (3.5%) | 0 (0.0%) |
| 5 Years | 0 (0.0%) | 0 (0.0%) |
| 6 to 11 Years | 0 (0.0%) | 13 (100.0%) |
| 12 to 14 Years | 0 (0.0%) | 10 (100.0%) |
| 15 Years | 4 (100.0%) | 15 (100.0%) |
| 16 and 17 Years | 0 (0.0%) | 0 (0.0%) |
| 18 to 24 Years | 36 (61.0%) | 27 (38.6%) |
| 25 to 34 Years | 0 (0.0%) | 0 (0.0%) |
| 35 to 44 Years | 5 (100.0%) | 4 (100.0%) |
| 45 to 54 Years | 39 (100.0%) | 20 (100.0%) |
| 55 to 64 Years | 0 (0.0%) | 15 (100.0%) |
| 65 to 74 Years | 12 (100.0%) | 15 (100.0%) |
| 75 Years and over | 13 (100.0%) | 28 (77.8%) |
| Total | 110 (68.3%) | 147 (71.7%) |
Income Below Poverty Among Married-Couple Families in Summersville
The poverty statistics for married-couple families in Summersville show that 26.4% or 23 of the total 87 families live below the poverty line. Families with 1 or 2 children have the highest poverty rate of 82.1%, comprising of 23 families. On the other hand, families with no children have the lowest poverty rate of 0.0%, which includes 0 families.
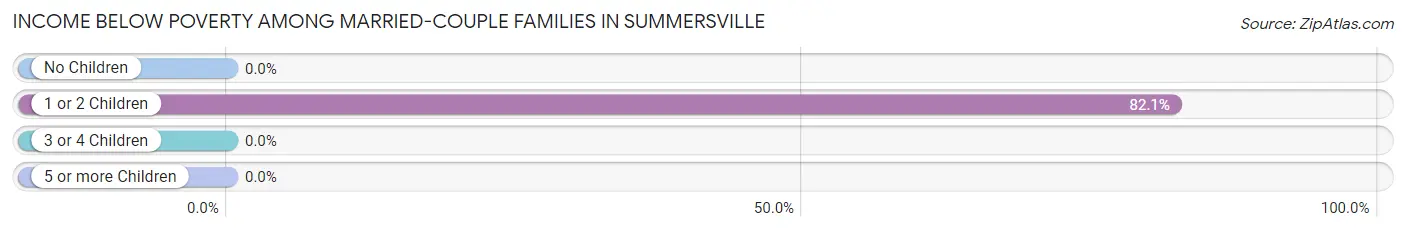
| Children | Above Poverty | Below Poverty |
| No Children | 42 (100.0%) | 0 (0.0%) |
| 1 or 2 Children | 5 (17.9%) | 23 (82.1%) |
| 3 or 4 Children | 17 (100.0%) | 0 (0.0%) |
| 5 or more Children | 0 (0.0%) | 0 (0.0%) |
| Total | 64 (73.6%) | 23 (26.4%) |
Income Below Poverty Among Single-Parent Households in Summersville
| Children | Single Father | Single Mother |
| No Children | 0 (0.0%) | 0 (0.0%) |
| 1 or 2 Children | 0 (0.0%) | 0 (0.0%) |
| 3 or 4 Children | 0 (0.0%) | 0 (0.0%) |
| 5 or more Children | 0 (0.0%) | 0 (0.0%) |
| Total | 0 (0.0%) | 0 (0.0%) |
Income Below Poverty Among Married-Couple vs Single-Parent Households in Summersville
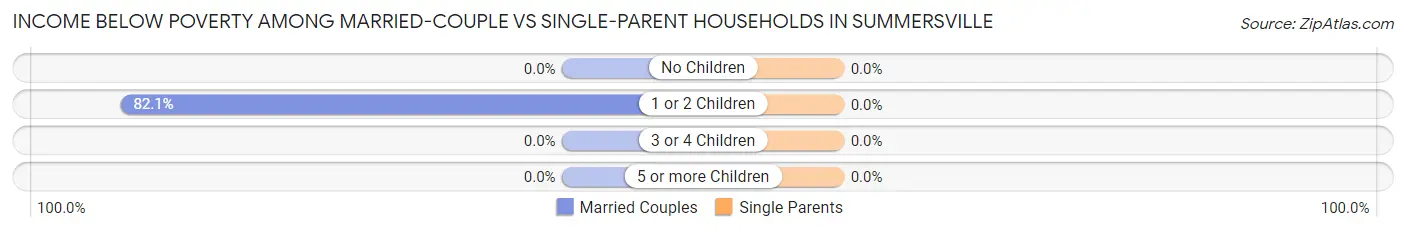
| Children | Married-Couple Families | Single-Parent Households |
| No Children | 0 (0.0%) | 0 (0.0%) |
| 1 or 2 Children | 23 (82.1%) | 0 (0.0%) |
| 3 or 4 Children | 0 (0.0%) | 0 (0.0%) |
| 5 or more Children | 0 (0.0%) | 0 (0.0%) |
| Total | 23 (26.4%) | 0 (0.0%) |
Race in Summersville
The most populous races in Summersville are , and White / Caucasian (366 | 100.0%).
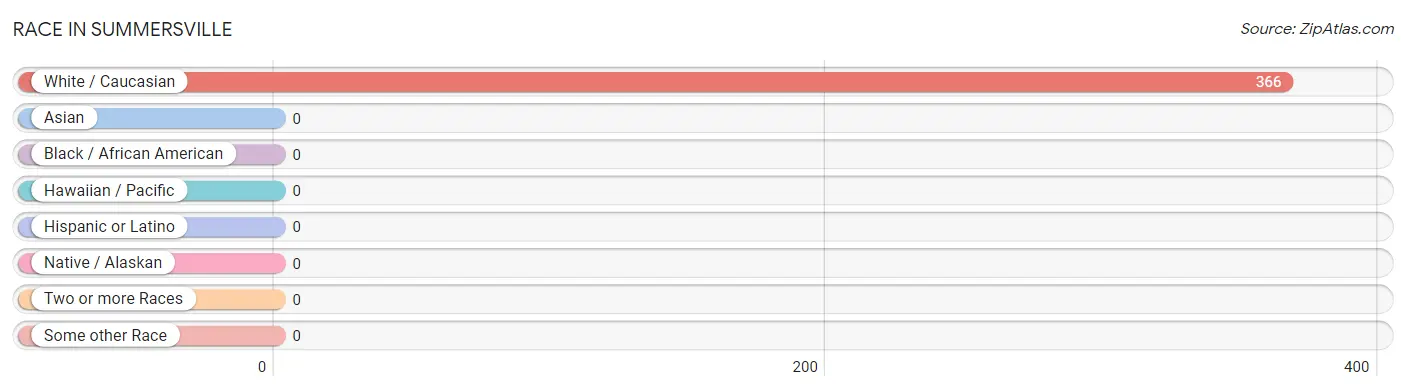
| Race | # Population | % Population |
| Asian | 0 | 0.0% |
| Black / African American | 0 | 0.0% |
| Hawaiian / Pacific | 0 | 0.0% |
| Hispanic or Latino | 0 | 0.0% |
| Native / Alaskan | 0 | 0.0% |
| White / Caucasian | 366 | 100.0% |
| Two or more Races | 0 | 0.0% |
| Some other Race | 0 | 0.0% |
| Total | 366 | 100.0% |
Ancestry in Summersville
The most populous ancestries reported in Summersville are American (141 | 38.5%), English (65 | 17.8%), Scottish (22 | 6.0%), and German (15 | 4.1%), together accounting for 66.4% of all Summersville residents.
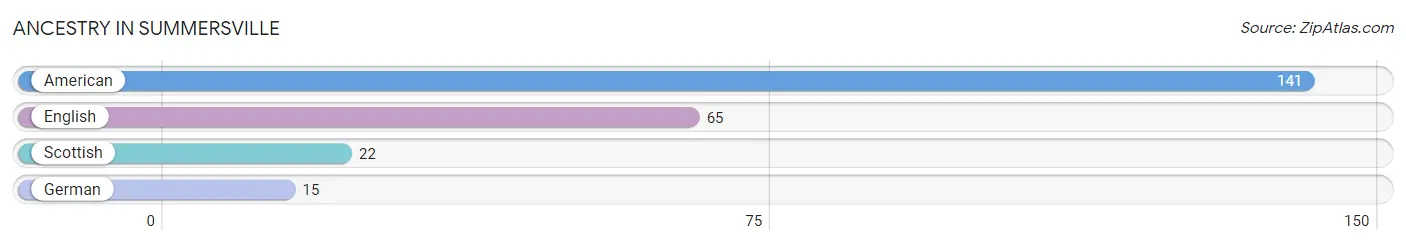
| Ancestry | # Population | % Population |
| American | 141 | 38.5% |
| English | 65 | 17.8% |
| German | 15 | 4.1% |
| Scottish | 22 | 6.0% | View All 4 Rows |
Immigrants in Summersville

| Immigration Origin | # Population | % Population | View All 0 Rows |
Sex and Age in Summersville
Sex and Age in Summersville
The most populous age groups in Summersville are 20 to 24 Years (47 | 29.2%) for men and 20 to 24 Years (70 | 34.2%) for women.
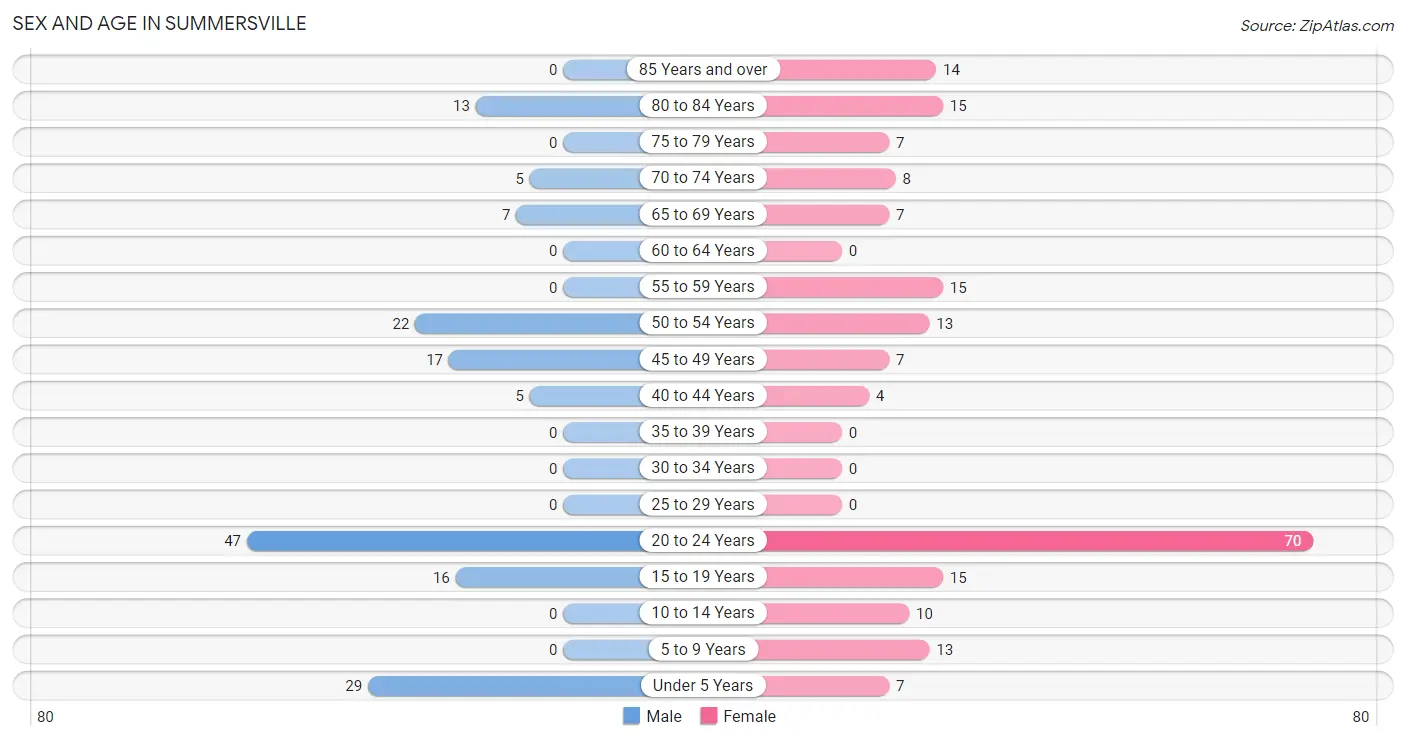
| Age Bracket | Male | Female |
| Under 5 Years | 29 (18.0%) | 7 (3.4%) |
| 5 to 9 Years | 0 (0.0%) | 13 (6.3%) |
| 10 to 14 Years | 0 (0.0%) | 10 (4.9%) |
| 15 to 19 Years | 16 (9.9%) | 15 (7.3%) |
| 20 to 24 Years | 47 (29.2%) | 70 (34.2%) |
| 25 to 29 Years | 0 (0.0%) | 0 (0.0%) |
| 30 to 34 Years | 0 (0.0%) | 0 (0.0%) |
| 35 to 39 Years | 0 (0.0%) | 0 (0.0%) |
| 40 to 44 Years | 5 (3.1%) | 4 (1.9%) |
| 45 to 49 Years | 17 (10.6%) | 7 (3.4%) |
| 50 to 54 Years | 22 (13.7%) | 13 (6.3%) |
| 55 to 59 Years | 0 (0.0%) | 15 (7.3%) |
| 60 to 64 Years | 0 (0.0%) | 0 (0.0%) |
| 65 to 69 Years | 7 (4.3%) | 7 (3.4%) |
| 70 to 74 Years | 5 (3.1%) | 8 (3.9%) |
| 75 to 79 Years | 0 (0.0%) | 7 (3.4%) |
| 80 to 84 Years | 13 (8.1%) | 15 (7.3%) |
| 85 Years and over | 0 (0.0%) | 14 (6.8%) |
| Total | 161 (100.0%) | 205 (100.0%) |
Families and Households in Summersville
Median Family Size in Summersville
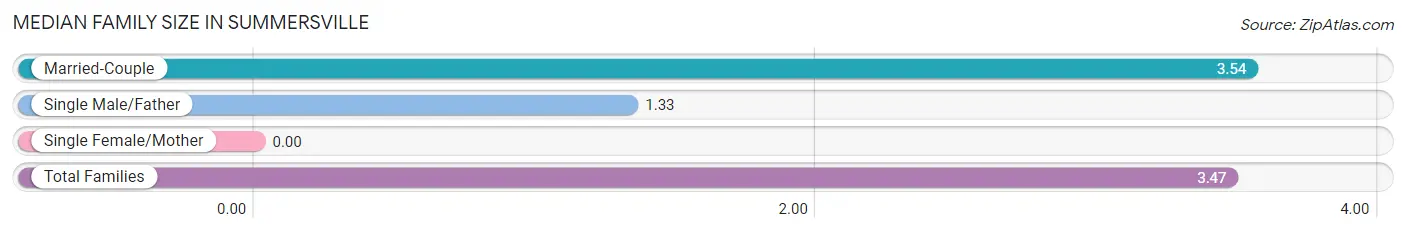
| Family Type | # Families | Family Size |
| Married-Couple | 87 (96.7%) | 3.54 |
| Single Male/Father | 3 (3.3%) | 1.33 |
| Single Female/Mother | 0 (0.0%) | - |
| Total Families | 90 (100.0%) | 3.47 |
Median Household Size in Summersville
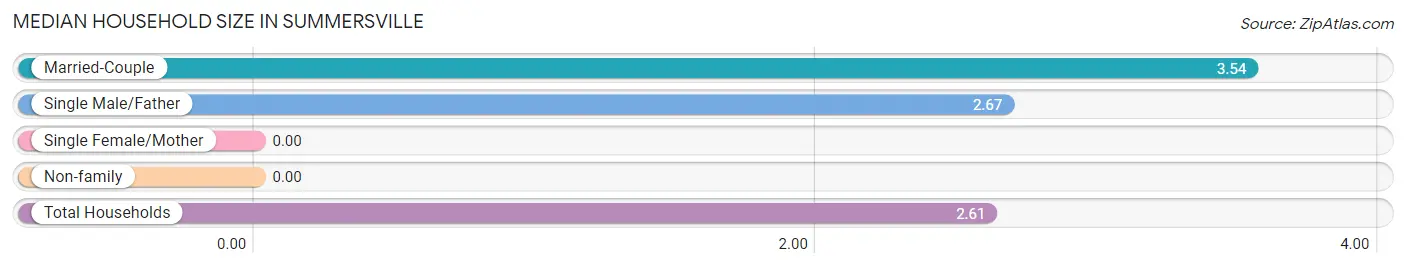
| Household Type | # Households | Household Size |
| Married-Couple | 87 (62.1%) | 3.54 |
| Single Male/Father | 3 (2.1%) | 2.67 |
| Single Female/Mother | 0 (0.0%) | - |
| Non-family | 50 (35.7%) | - |
| Total Households | 140 (100.0%) | 2.61 |
Household Size by Marriage Status in Summersville
Out of a total of 140 households in Summersville, 90 (64.3%) are family households, while 50 (35.7%) are nonfamily households. The most numerous type of family households are 2-person households, comprising 42, and the most common type of nonfamily households are 1-person households, comprising 50.
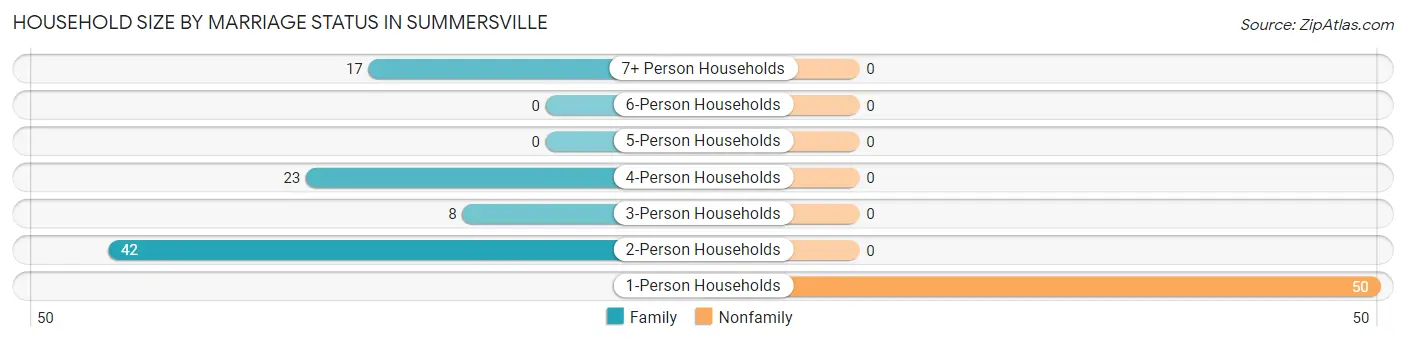
| Household Size | Family Households | Nonfamily Households |
| 1-Person Households | - | 50 (35.7%) |
| 2-Person Households | 42 (30.0%) | 0 (0.0%) |
| 3-Person Households | 8 (5.7%) | 0 (0.0%) |
| 4-Person Households | 23 (16.4%) | 0 (0.0%) |
| 5-Person Households | 0 (0.0%) | 0 (0.0%) |
| 6-Person Households | 0 (0.0%) | 0 (0.0%) |
| 7+ Person Households | 17 (12.1%) | 0 (0.0%) |
| Total | 90 (64.3%) | 50 (35.7%) |
Female Fertility in Summersville
Fertility by Age in Summersville
Average fertility rate in Summersville is 448.0 births per 1,000 women. Women in the age bracket of 20 to 34 years have the highest fertility rate with 614.0 births per 1,000 women. Women in the age bracket of 20 to 34 years acount for 100.0% of all women with births.
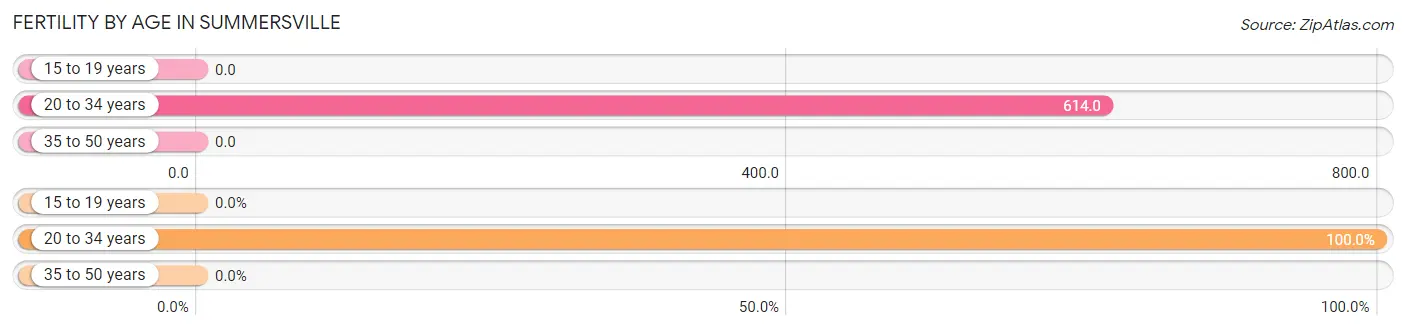
| Age Bracket | Women with Births | Births / 1,000 Women |
| 15 to 19 years | 0 (0.0%) | 0.0 |
| 20 to 34 years | 43 (100.0%) | 614.0 |
| 35 to 50 years | 0 (0.0%) | 0.0 |
| Total | 43 (100.0%) | 448.0 |
Fertility by Age by Marriage Status in Summersville
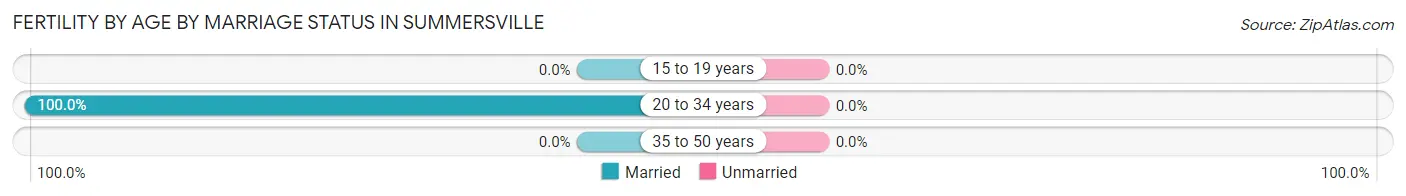
| Age Bracket | Married | Unmarried |
| 15 to 19 years | 0 (0.0%) | 0 (0.0%) |
| 20 to 34 years | 43 (100.0%) | 0 (0.0%) |
| 35 to 50 years | 0 (0.0%) | 0 (0.0%) |
| Total | 43 (100.0%) | 0 (0.0%) |
Fertility by Education in Summersville
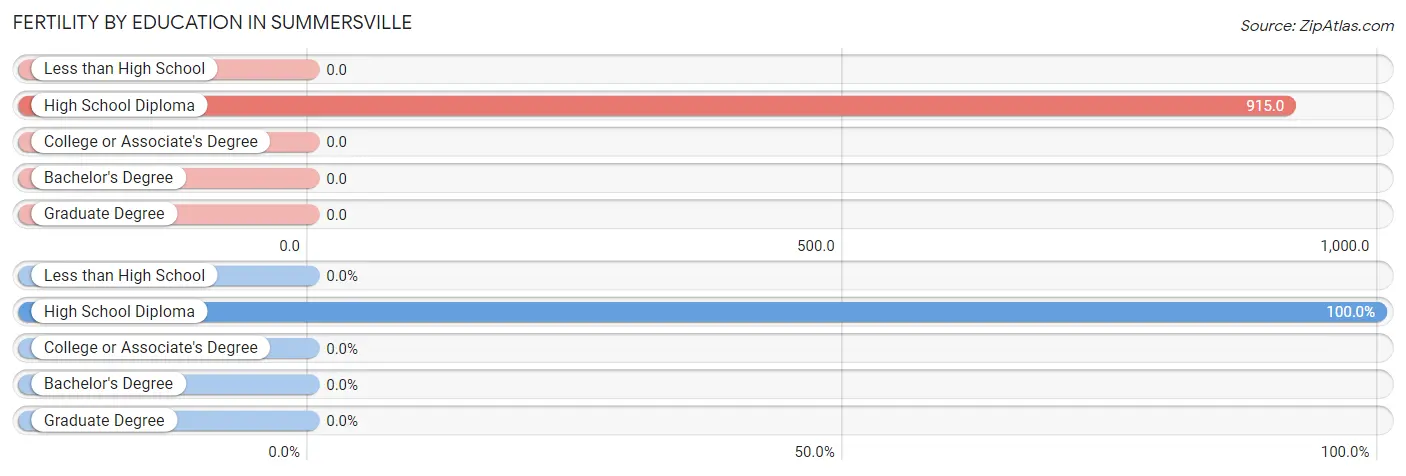
| Educational Attainment | Women with Births | Births / 1,000 Women |
| Less than High School | 0 (0.0%) | 0.0 |
| High School Diploma | 43 (100.0%) | 915.0 |
| College or Associate's Degree | 0 (0.0%) | 0.0 |
| Bachelor's Degree | 0 (0.0%) | 0.0 |
| Graduate Degree | 0 (0.0%) | 0.0 |
| Total | 43 (100.0%) | 448.0 |
Fertility by Education by Marriage Status in Summersville
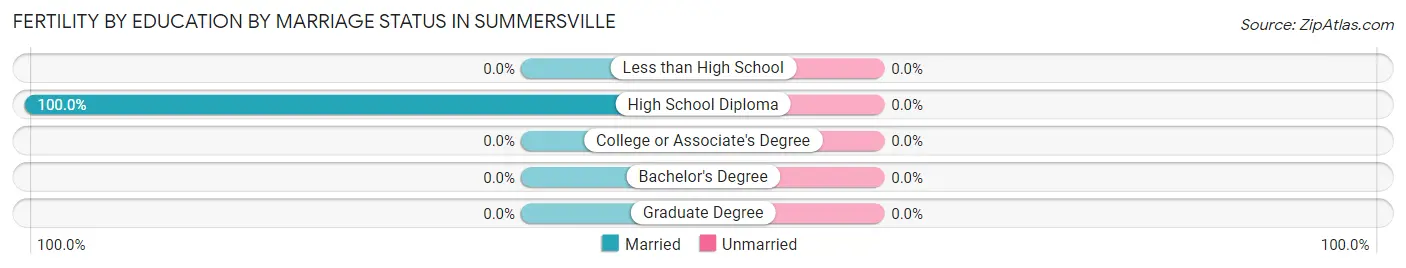
| Educational Attainment | Married | Unmarried |
| Less than High School | 0 (0.0%) | 0 (0.0%) |
| High School Diploma | 43 (100.0%) | 0 (0.0%) |
| College or Associate's Degree | 0 (0.0%) | 0 (0.0%) |
| Bachelor's Degree | 0 (0.0%) | 0 (0.0%) |
| Graduate Degree | 0 (0.0%) | 0 (0.0%) |
| Total | 43 (100.0%) | 0 (0.0%) |
Employment Characteristics in Summersville
Employment by Class of Employer in Summersville
Among the 131 employed individuals in Summersville, private company employees (93 | 71.0%), local government employees (27 | 20.6%), and federal government employees (7 | 5.3%) make up the most common classes of employment.
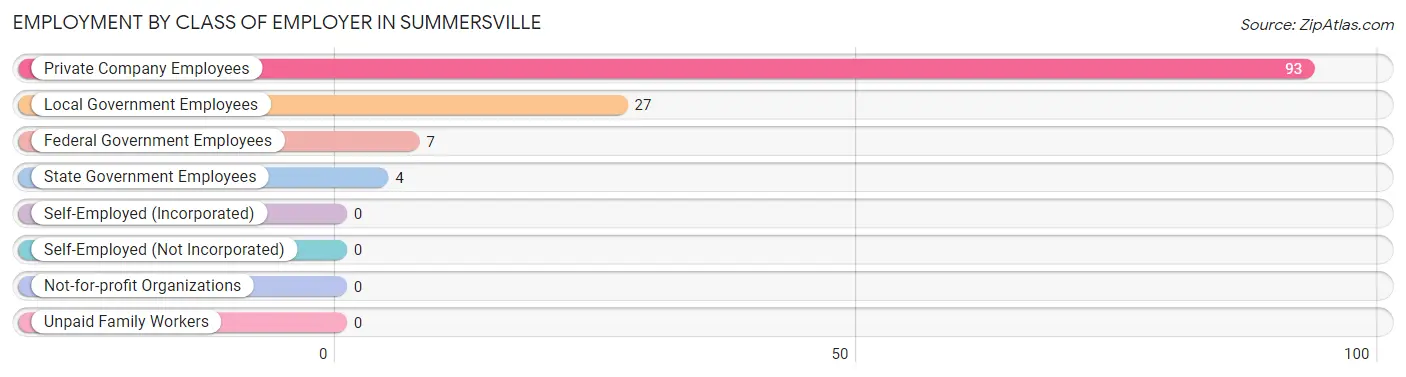
| Employer Class | # Employees | % Employees |
| Private Company Employees | 93 | 71.0% |
| Self-Employed (Incorporated) | 0 | 0.0% |
| Self-Employed (Not Incorporated) | 0 | 0.0% |
| Not-for-profit Organizations | 0 | 0.0% |
| Local Government Employees | 27 | 20.6% |
| State Government Employees | 4 | 3.0% |
| Federal Government Employees | 7 | 5.3% |
| Unpaid Family Workers | 0 | 0.0% |
| Total | 131 | 100.0% |
Employment Status by Age in Summersville
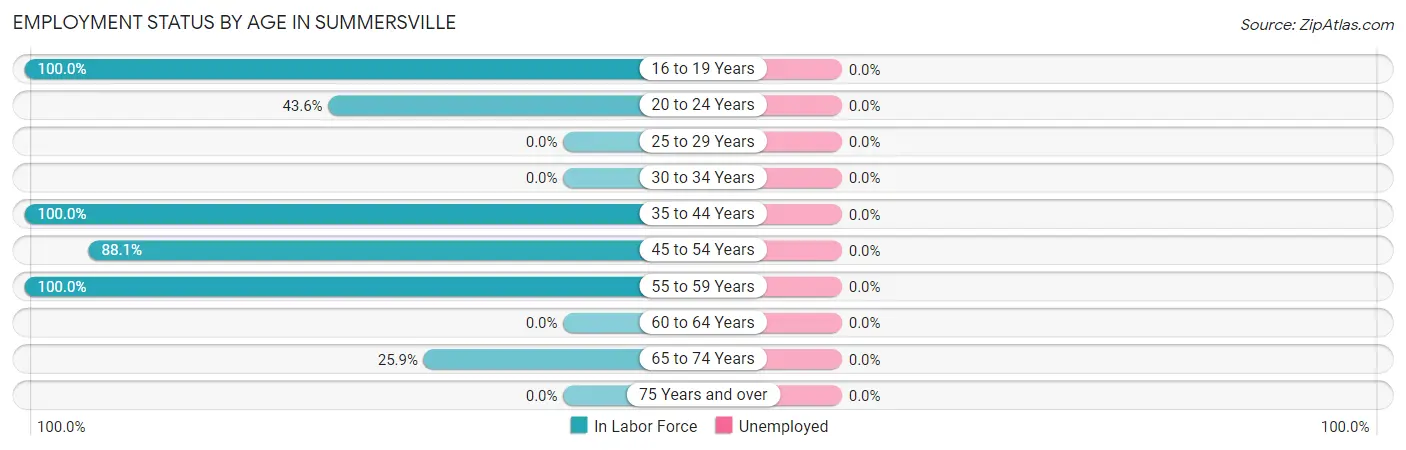
| Age Bracket | In Labor Force | Unemployed |
| 16 to 19 Years | 12 (100.0%) | 0 (0.0%) |
| 20 to 24 Years | 51 (43.6%) | 0 (0.0%) |
| 25 to 29 Years | 0 (0.0%) | 0 (0.0%) |
| 30 to 34 Years | 0 (0.0%) | 0 (0.0%) |
| 35 to 44 Years | 9 (100.0%) | 0 (0.0%) |
| 45 to 54 Years | 52 (88.1%) | 0 (0.0%) |
| 55 to 59 Years | 15 (100.0%) | 0 (0.0%) |
| 60 to 64 Years | 0 (0.0%) | 0 (0.0%) |
| 65 to 74 Years | 7 (25.9%) | 0 (0.0%) |
| 75 Years and over | 0 (0.0%) | 0 (0.0%) |
| Total | 146 (50.7%) | 0 (0.0%) |
Employment Status by Educational Attainment in Summersville
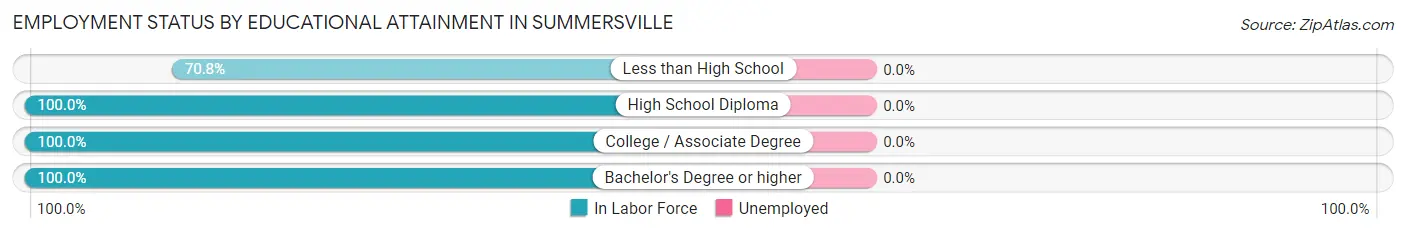
| Educational Attainment | In Labor Force | Unemployed |
| Less than High School | 17 (70.8%) | 0 (0.0%) |
| High School Diploma | 27 (100.0%) | 0 (0.0%) |
| College / Associate Degree | 13 (100.0%) | 0 (0.0%) |
| Bachelor's Degree or higher | 19 (100.0%) | 0 (0.0%) |
| Total | 76 (91.6%) | 0 (0.0%) |
Employment Occupations by Sex in Summersville
Management, Business, Science and Arts Occupations
The most common Management, Business, Science and Arts occupations in Summersville are Health Diagnosing & Treating (13 | 8.9%), Health Technologists (13 | 8.9%), Community & Social Service (4 | 2.7%), and Education, Arts & Media (4 | 2.7%).
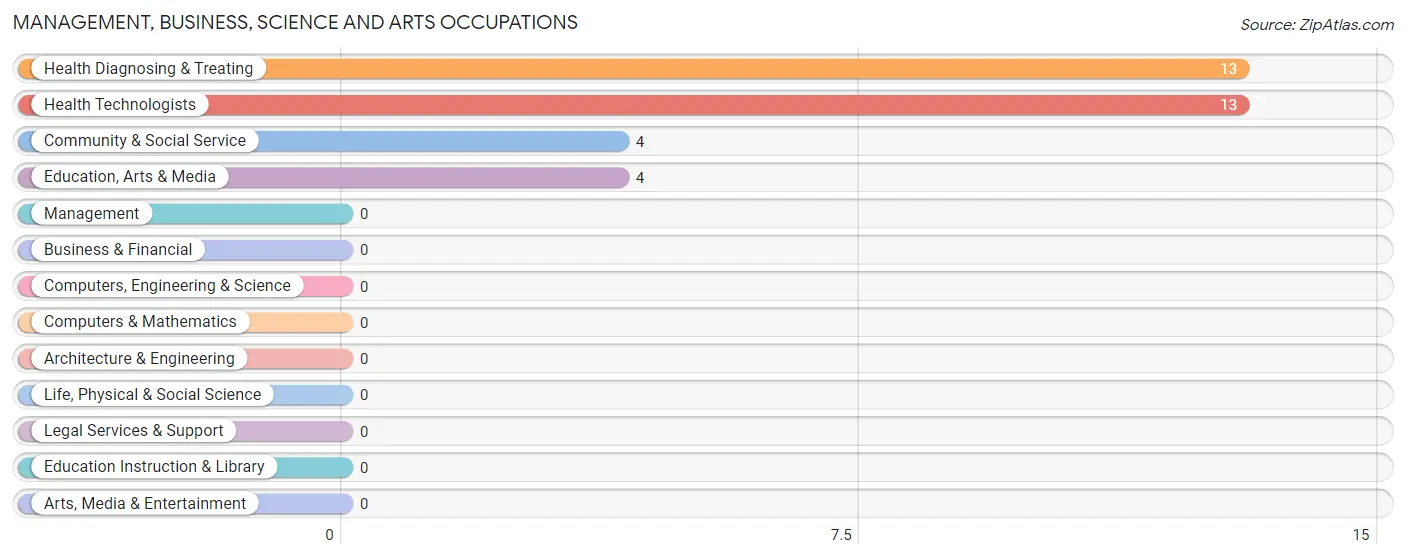
Management, Business, Science and Arts Occupations by Sex
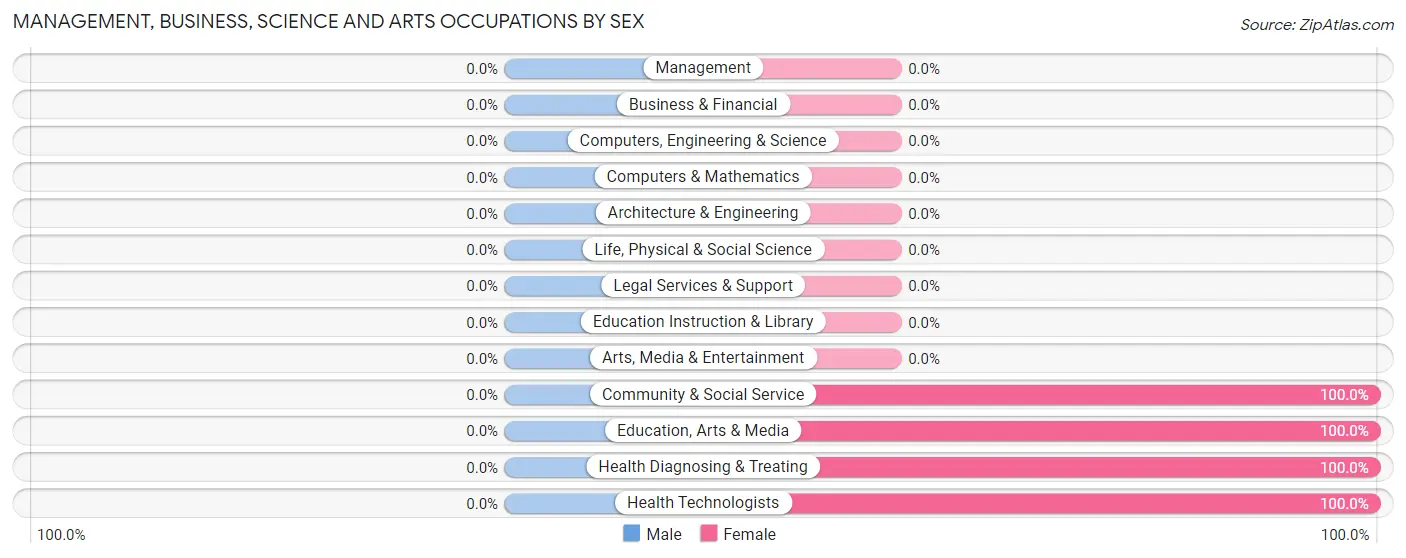
| Occupation | Male | Female |
| Management | 0 (0.0%) | 0 (0.0%) |
| Business & Financial | 0 (0.0%) | 0 (0.0%) |
| Computers, Engineering & Science | 0 (0.0%) | 0 (0.0%) |
| Computers & Mathematics | 0 (0.0%) | 0 (0.0%) |
| Architecture & Engineering | 0 (0.0%) | 0 (0.0%) |
| Life, Physical & Social Science | 0 (0.0%) | 0 (0.0%) |
| Community & Social Service | 0 (0.0%) | 4 (100.0%) |
| Education, Arts & Media | 0 (0.0%) | 4 (100.0%) |
| Legal Services & Support | 0 (0.0%) | 0 (0.0%) |
| Education Instruction & Library | 0 (0.0%) | 0 (0.0%) |
| Arts, Media & Entertainment | 0 (0.0%) | 0 (0.0%) |
| Health Diagnosing & Treating | 0 (0.0%) | 13 (100.0%) |
| Health Technologists | 0 (0.0%) | 13 (100.0%) |
| Total (Category) | 0 (0.0%) | 17 (100.0%) |
| Total (Overall) | 87 (59.6%) | 59 (40.4%) |
Services Occupations
The most common Services occupations in Summersville are Security & Protection (5 | 3.4%), Law Enforcement (5 | 3.4%), and Personal Care & Service (4 | 2.7%).
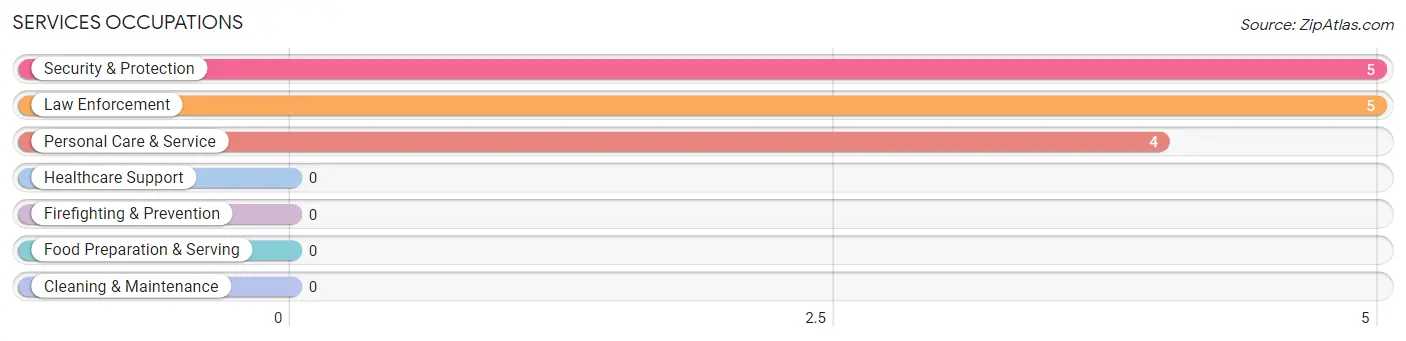
Services Occupations by Sex
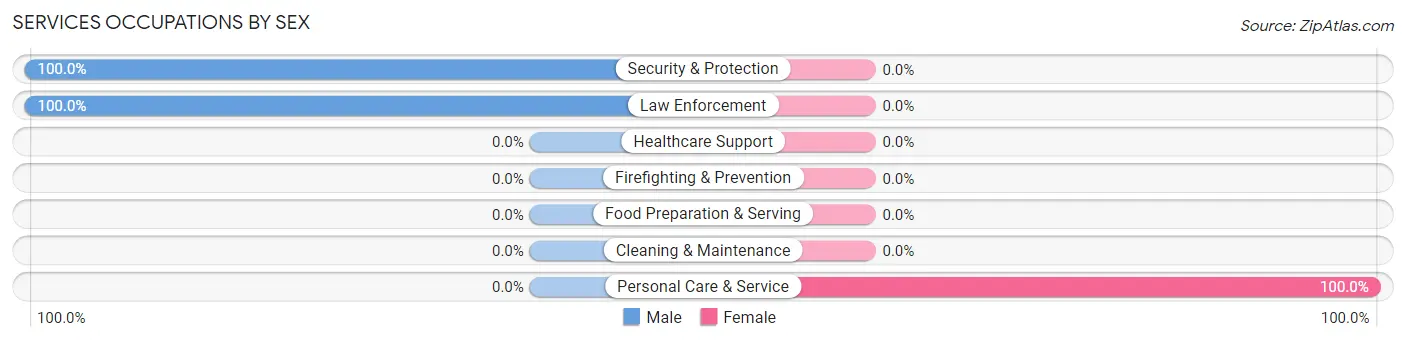
| Occupation | Male | Female |
| Healthcare Support | 0 (0.0%) | 0 (0.0%) |
| Security & Protection | 5 (100.0%) | 0 (0.0%) |
| Firefighting & Prevention | 0 (0.0%) | 0 (0.0%) |
| Law Enforcement | 5 (100.0%) | 0 (0.0%) |
| Food Preparation & Serving | 0 (0.0%) | 0 (0.0%) |
| Cleaning & Maintenance | 0 (0.0%) | 0 (0.0%) |
| Personal Care & Service | 0 (0.0%) | 4 (100.0%) |
| Total (Category) | 5 (55.6%) | 4 (44.4%) |
| Total (Overall) | 87 (59.6%) | 59 (40.4%) |
Sales and Office Occupations
The most common Sales and Office occupations in Summersville are , and Sales & Related (15 | 10.3%).
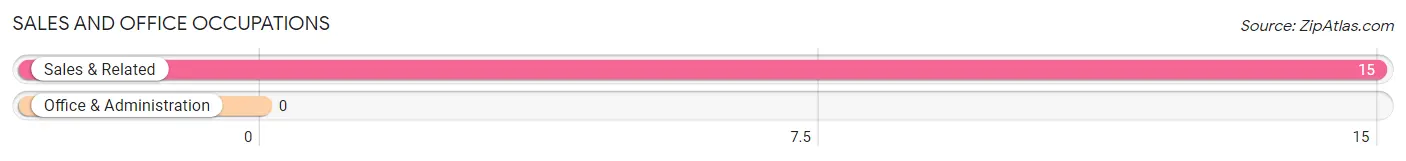
Sales and Office Occupations by Sex
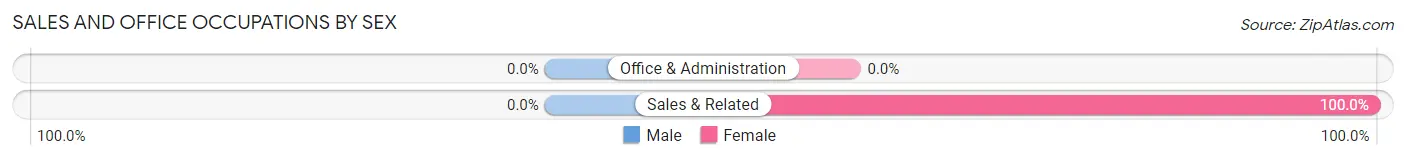
| Occupation | Male | Female |
| Sales & Related | 0 (0.0%) | 15 (100.0%) |
| Office & Administration | 0 (0.0%) | 0 (0.0%) |
| Total (Category) | 0 (0.0%) | 15 (100.0%) |
| Total (Overall) | 87 (59.6%) | 59 (40.4%) |
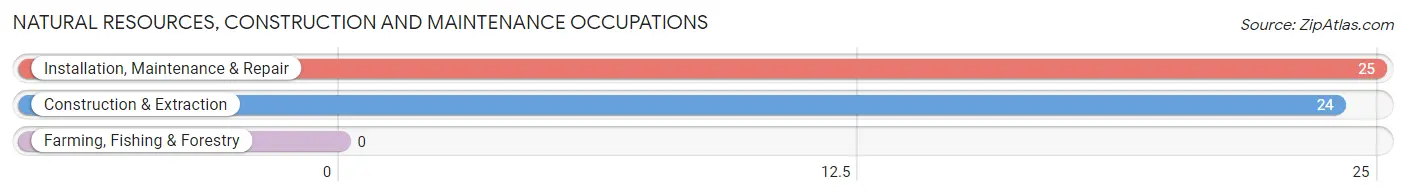
Natural Resources, Construction and Maintenance Occupations
The most common Natural Resources, Construction and Maintenance occupations in Summersville are Installation, Maintenance & Repair (25 | 17.1%), and Construction & Extraction (24 | 16.4%).
Natural Resources, Construction and Maintenance Occupations by Sex
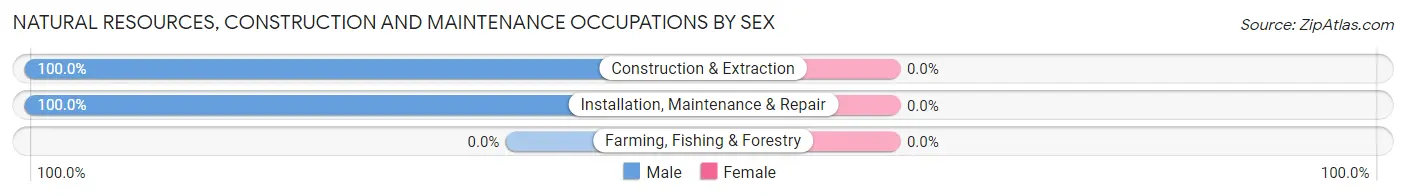
| Occupation | Male | Female |
| Farming, Fishing & Forestry | 0 (0.0%) | 0 (0.0%) |
| Construction & Extraction | 24 (100.0%) | 0 (0.0%) |
| Installation, Maintenance & Repair | 25 (100.0%) | 0 (0.0%) |
| Total (Category) | 49 (100.0%) | 0 (0.0%) |
| Total (Overall) | 87 (59.6%) | 59 (40.4%) |
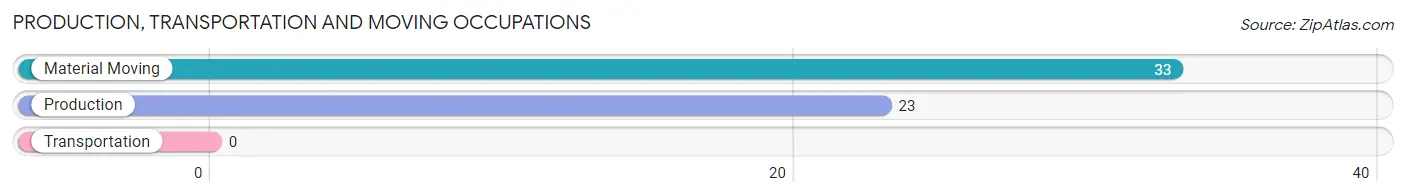
Production, Transportation and Moving Occupations
The most common Production, Transportation and Moving occupations in Summersville are Material Moving (33 | 22.6%), and Production (23 | 15.8%).
Production, Transportation and Moving Occupations by Sex
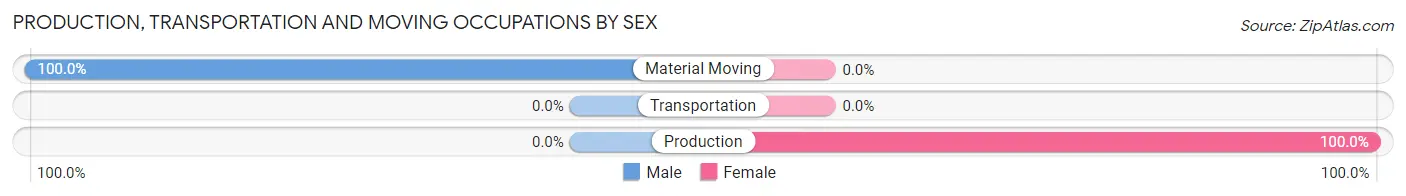
| Occupation | Male | Female |
| Production | 0 (0.0%) | 23 (100.0%) |
| Transportation | 0 (0.0%) | 0 (0.0%) |
| Material Moving | 33 (100.0%) | 0 (0.0%) |
| Total (Category) | 33 (58.9%) | 23 (41.1%) |
| Total (Overall) | 87 (59.6%) | 59 (40.4%) |
Employment Industries by Sex in Summersville
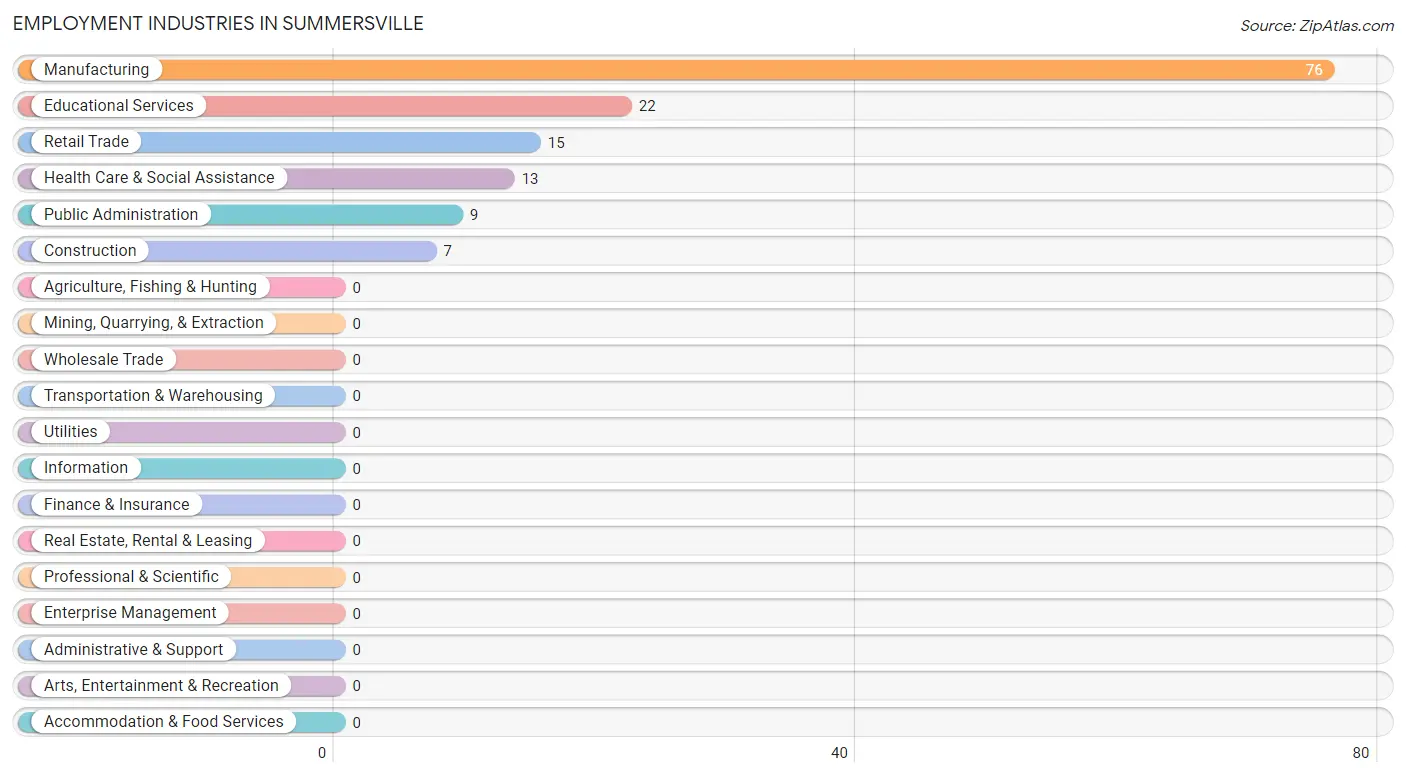
Employment Industries in Summersville
The major employment industries in Summersville include Manufacturing (76 | 52.0%), Educational Services (22 | 15.1%), Retail Trade (15 | 10.3%), Health Care & Social Assistance (13 | 8.9%), and Public Administration (9 | 6.2%).
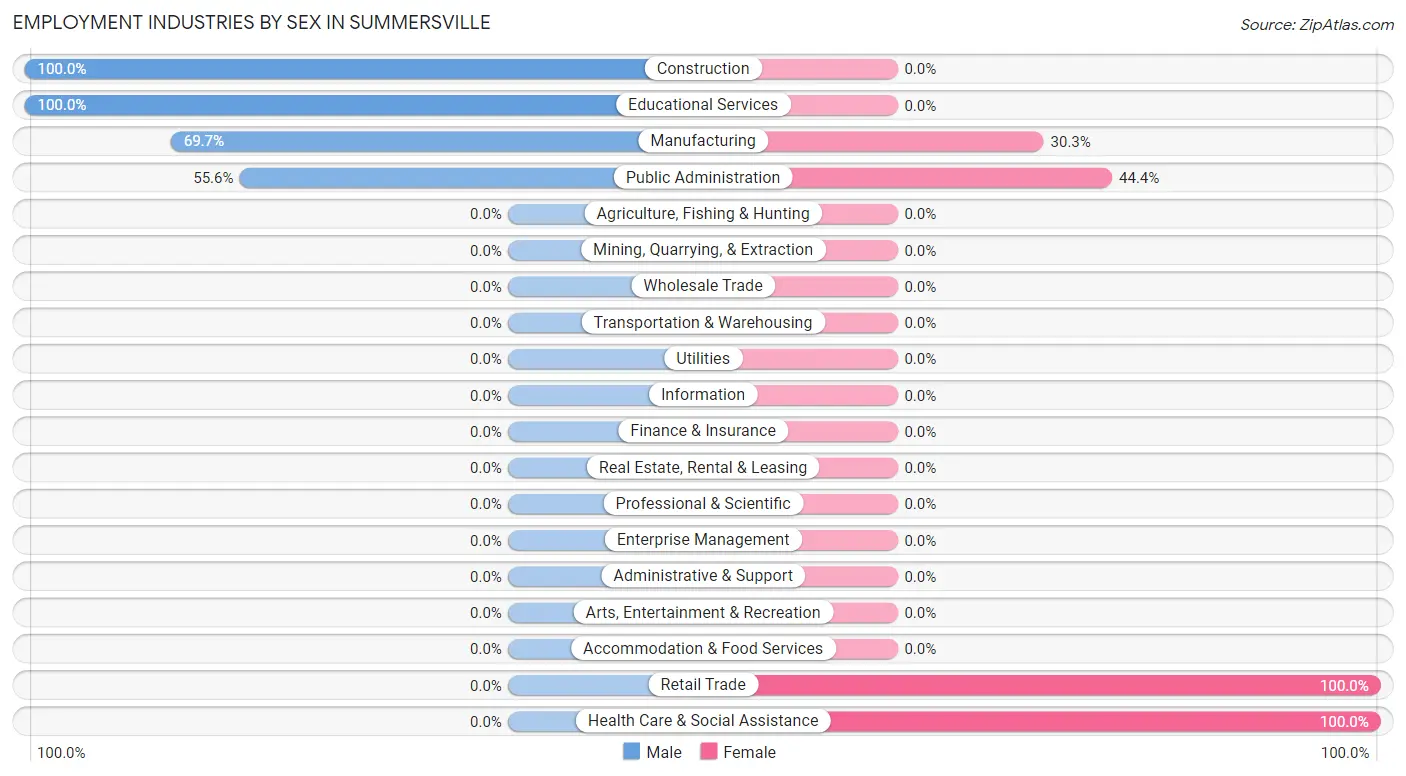
Employment Industries by Sex in Summersville
The Summersville industries that see more men than women are Construction (100.0%), Educational Services (100.0%), and Manufacturing (69.7%), whereas the industries that tend to have a higher number of women are Retail Trade (100.0%), Health Care & Social Assistance (100.0%), and Public Administration (44.4%).
| Industry | Male | Female |
| Agriculture, Fishing & Hunting | 0 (0.0%) | 0 (0.0%) |
| Mining, Quarrying, & Extraction | 0 (0.0%) | 0 (0.0%) |
| Construction | 7 (100.0%) | 0 (0.0%) |
| Manufacturing | 53 (69.7%) | 23 (30.3%) |
| Wholesale Trade | 0 (0.0%) | 0 (0.0%) |
| Retail Trade | 0 (0.0%) | 15 (100.0%) |
| Transportation & Warehousing | 0 (0.0%) | 0 (0.0%) |
| Utilities | 0 (0.0%) | 0 (0.0%) |
| Information | 0 (0.0%) | 0 (0.0%) |
| Finance & Insurance | 0 (0.0%) | 0 (0.0%) |
| Real Estate, Rental & Leasing | 0 (0.0%) | 0 (0.0%) |
| Professional & Scientific | 0 (0.0%) | 0 (0.0%) |
| Enterprise Management | 0 (0.0%) | 0 (0.0%) |
| Administrative & Support | 0 (0.0%) | 0 (0.0%) |
| Educational Services | 22 (100.0%) | 0 (0.0%) |
| Health Care & Social Assistance | 0 (0.0%) | 13 (100.0%) |
| Arts, Entertainment & Recreation | 0 (0.0%) | 0 (0.0%) |
| Accommodation & Food Services | 0 (0.0%) | 0 (0.0%) |
| Public Administration | 5 (55.6%) | 4 (44.4%) |
| Total | 87 (59.6%) | 59 (40.4%) |
Education in Summersville
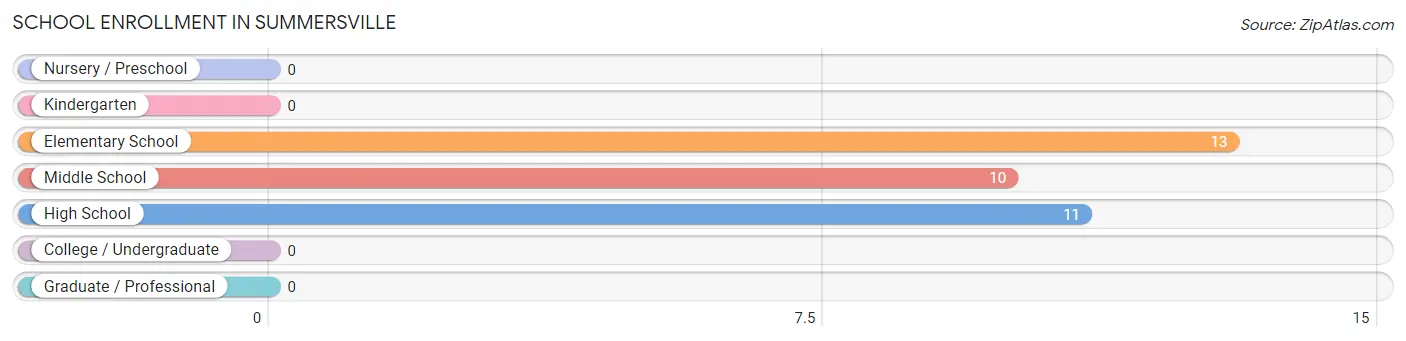
School Enrollment in Summersville
The most common levels of schooling among the 34 students in Summersville are elementary school (13 | 38.2%), high school (11 | 32.4%), and middle school (10 | 29.4%).
| School Level | # Students | % Students |
| Nursery / Preschool | 0 | 0.0% |
| Kindergarten | 0 | 0.0% |
| Elementary School | 13 | 38.2% |
| Middle School | 10 | 29.4% |
| High School | 11 | 32.4% |
| College / Undergraduate | 0 | 0.0% |
| Graduate / Professional | 0 | 0.0% |
| Total | 34 | 100.0% |
School Enrollment by Age by Funding Source in Summersville
Out of a total of 34 students who are enrolled in schools in Summersville, 23 (67.6%) attend a private institution, while the remaining 11 (32.4%) are enrolled in public schools. The age group of 5 to 9 year old has the highest likelihood of being enrolled in private schools, with 13 (100.0% in the age bracket) enrolled. Conversely, the age group of 15 to 17 year olds has the lowest likelihood of being enrolled in a private school, with 4 (100.0% in the age bracket) attending a public institution.
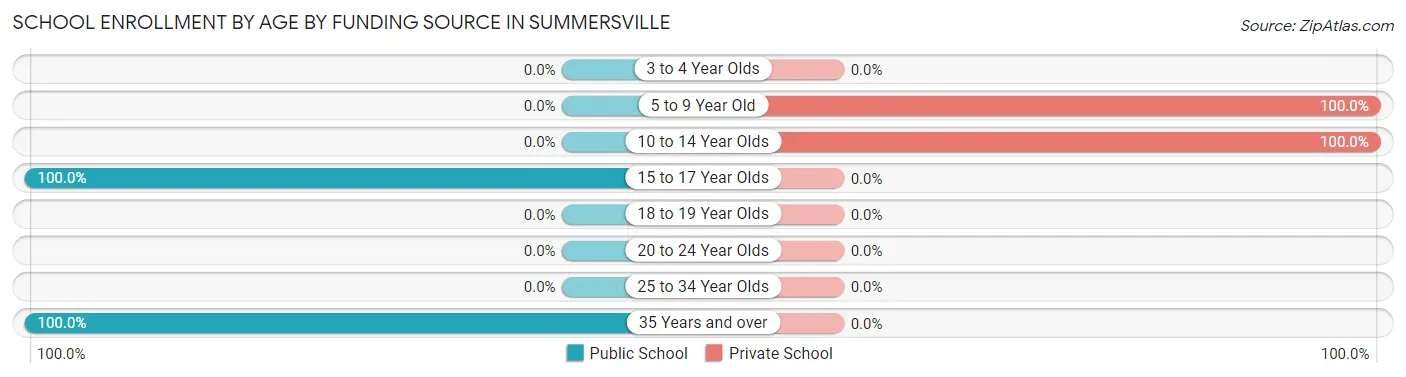
| Age Bracket | Public School | Private School |
| 3 to 4 Year Olds | 0 (0.0%) | 0 (0.0%) |
| 5 to 9 Year Old | 0 (0.0%) | 13 (100.0%) |
| 10 to 14 Year Olds | 0 (0.0%) | 10 (100.0%) |
| 15 to 17 Year Olds | 4 (100.0%) | 0 (0.0%) |
| 18 to 19 Year Olds | 0 (0.0%) | 0 (0.0%) |
| 20 to 24 Year Olds | 0 (0.0%) | 0 (0.0%) |
| 25 to 34 Year Olds | 0 (0.0%) | 0 (0.0%) |
| 35 Years and over | 7 (100.0%) | 0 (0.0%) |
| Total | 11 (32.4%) | 23 (67.6%) |
Educational Attainment by Field of Study in Summersville
Education (15 | 78.9%), and arts & humanities (4 | 21.0%) are the most common fields of study among 19 individuals in Summersville who have obtained a bachelor's degree or higher.
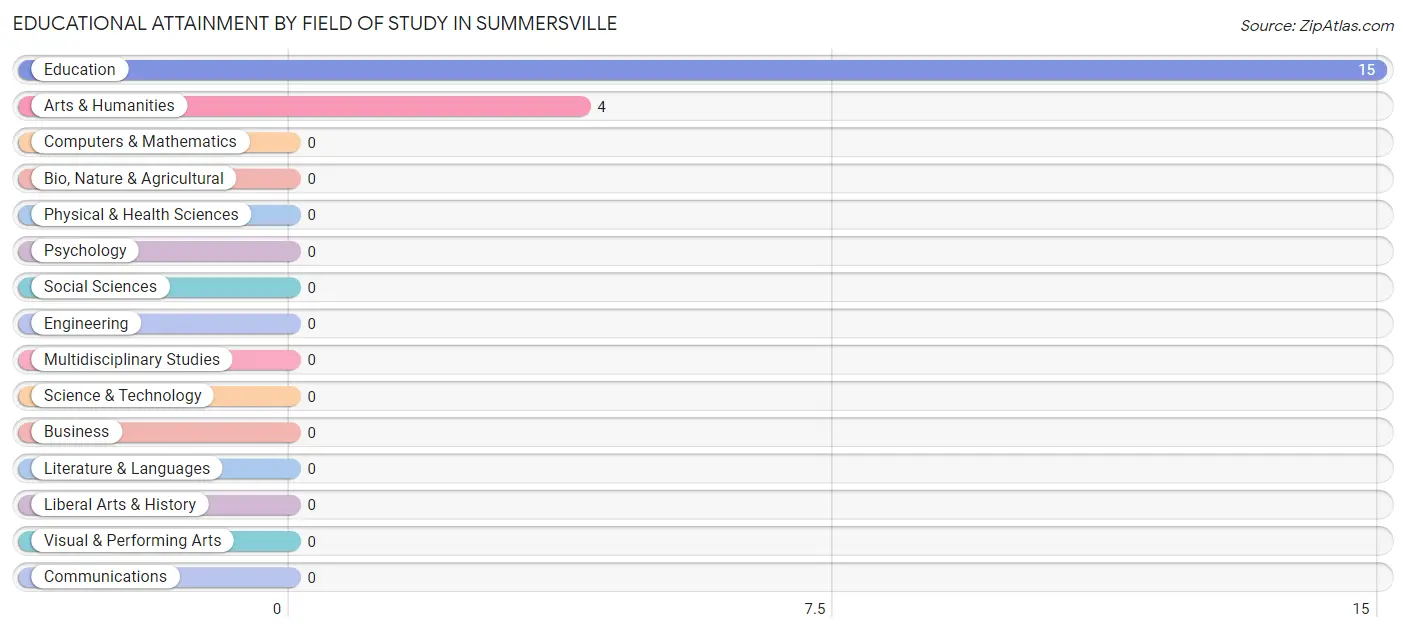
| Field of Study | # Graduates | % Graduates |
| Computers & Mathematics | 0 | 0.0% |
| Bio, Nature & Agricultural | 0 | 0.0% |
| Physical & Health Sciences | 0 | 0.0% |
| Psychology | 0 | 0.0% |
| Social Sciences | 0 | 0.0% |
| Engineering | 0 | 0.0% |
| Multidisciplinary Studies | 0 | 0.0% |
| Science & Technology | 0 | 0.0% |
| Business | 0 | 0.0% |
| Education | 15 | 78.9% |
| Literature & Languages | 0 | 0.0% |
| Liberal Arts & History | 0 | 0.0% |
| Visual & Performing Arts | 0 | 0.0% |
| Communications | 0 | 0.0% |
| Arts & Humanities | 4 | 21.0% |
| Total | 19 | 100.0% |
Transportation & Commute in Summersville
Vehicle Availability by Sex in Summersville
The most prevalent vehicle ownership categories in Summersville are males with 5 or more vehicles (50, accounting for 57.5%) and females with 5 or more vehicles (23, making up 113.6%).
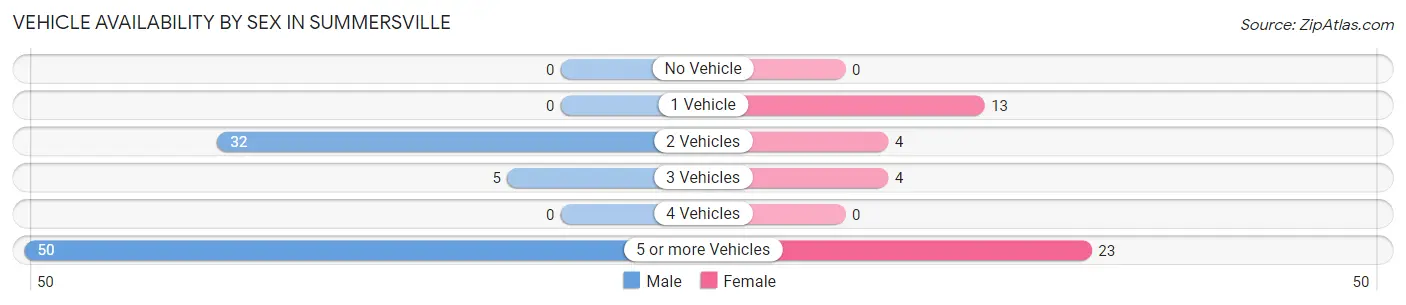
| Vehicles Available | Male | Female |
| No Vehicle | 0 (0.0%) | 0 (0.0%) |
| 1 Vehicle | 0 (0.0%) | 13 (29.5%) |
| 2 Vehicles | 32 (36.8%) | 4 (9.1%) |
| 3 Vehicles | 5 (5.8%) | 4 (9.1%) |
| 4 Vehicles | 0 (0.0%) | 0 (0.0%) |
| 5 or more Vehicles | 50 (57.5%) | 23 (52.3%) |
| Total | 87 (100.0%) | 44 (100.0%) |
Commute Time in Summersville
The most frequently occuring commute durations in Summersville are 5 to 9 minutes (55 commuters, 42.0%), 10 to 14 minutes (26 commuters, 19.9%), and 15 to 19 minutes (23 commuters, 17.6%).
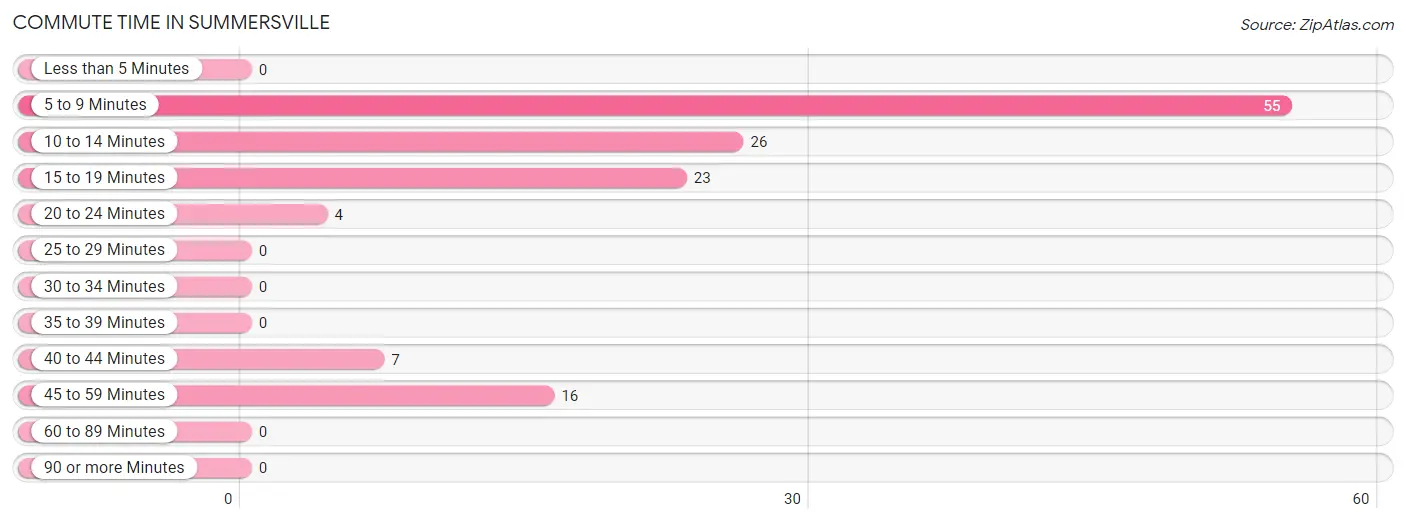
| Commute Time | # Commuters | % Commuters |
| Less than 5 Minutes | 0 | 0.0% |
| 5 to 9 Minutes | 55 | 42.0% |
| 10 to 14 Minutes | 26 | 19.9% |
| 15 to 19 Minutes | 23 | 17.6% |
| 20 to 24 Minutes | 4 | 3.0% |
| 25 to 29 Minutes | 0 | 0.0% |
| 30 to 34 Minutes | 0 | 0.0% |
| 35 to 39 Minutes | 0 | 0.0% |
| 40 to 44 Minutes | 7 | 5.3% |
| 45 to 59 Minutes | 16 | 12.2% |
| 60 to 89 Minutes | 0 | 0.0% |
| 90 or more Minutes | 0 | 0.0% |
Commute Time by Sex in Summersville
The most common commute times in Summersville are 5 to 9 minutes (55 commuters, 63.2%) for males and 15 to 19 minutes (23 commuters, 52.3%) for females.
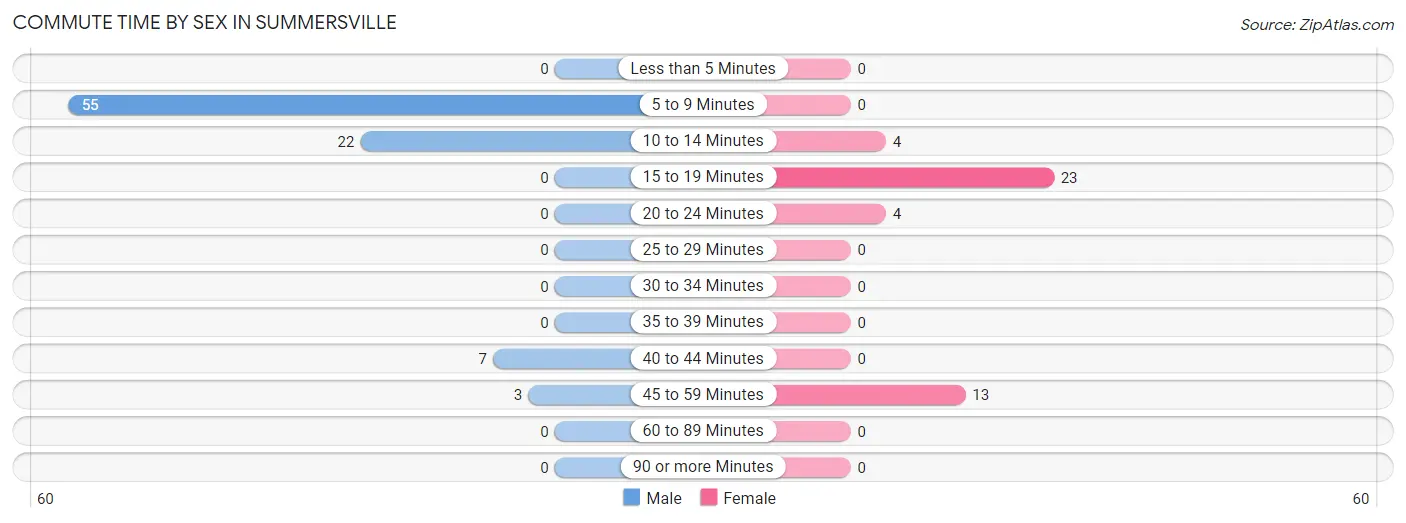
| Commute Time | Male | Female |
| Less than 5 Minutes | 0 (0.0%) | 0 (0.0%) |
| 5 to 9 Minutes | 55 (63.2%) | 0 (0.0%) |
| 10 to 14 Minutes | 22 (25.3%) | 4 (9.1%) |
| 15 to 19 Minutes | 0 (0.0%) | 23 (52.3%) |
| 20 to 24 Minutes | 0 (0.0%) | 4 (9.1%) |
| 25 to 29 Minutes | 0 (0.0%) | 0 (0.0%) |
| 30 to 34 Minutes | 0 (0.0%) | 0 (0.0%) |
| 35 to 39 Minutes | 0 (0.0%) | 0 (0.0%) |
| 40 to 44 Minutes | 7 (8.1%) | 0 (0.0%) |
| 45 to 59 Minutes | 3 (3.5%) | 13 (29.5%) |
| 60 to 89 Minutes | 0 (0.0%) | 0 (0.0%) |
| 90 or more Minutes | 0 (0.0%) | 0 (0.0%) |
Time of Departure to Work by Sex in Summersville
The most frequent times of departure to work in Summersville are 5:30 AM to 5:59 AM (50, 57.5%) for males and 8:00 AM to 8:29 AM (23, 52.3%) for females.
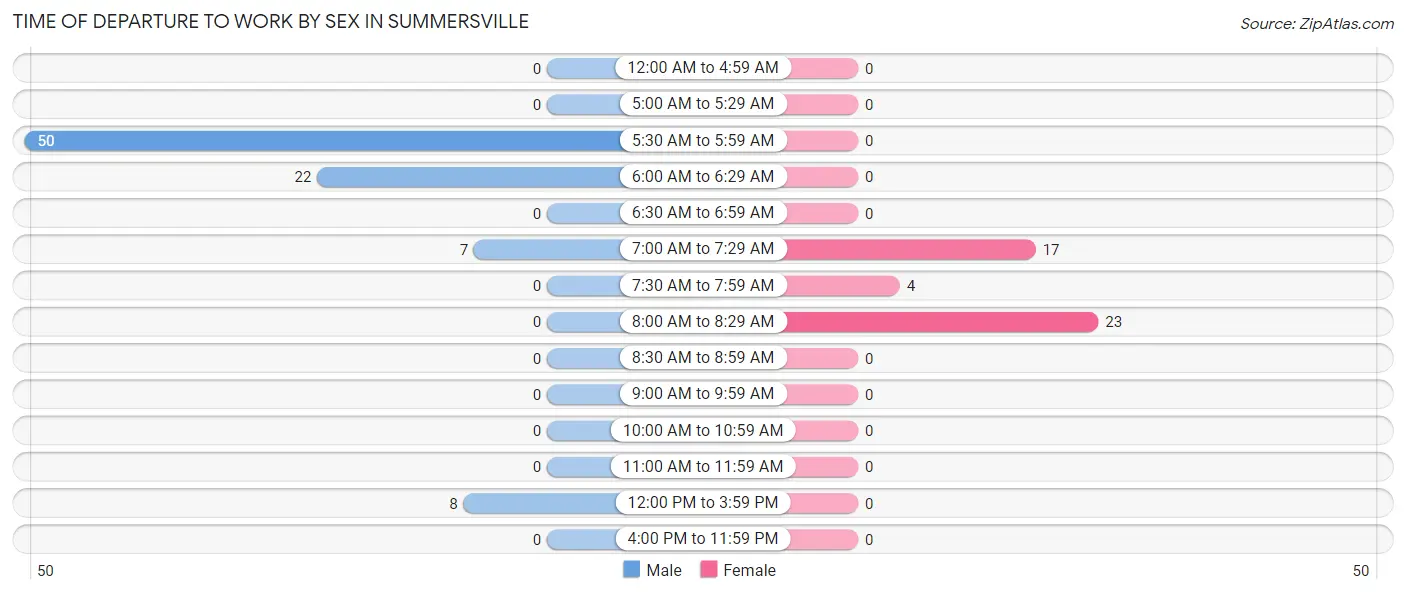
| Time of Departure | Male | Female |
| 12:00 AM to 4:59 AM | 0 (0.0%) | 0 (0.0%) |
| 5:00 AM to 5:29 AM | 0 (0.0%) | 0 (0.0%) |
| 5:30 AM to 5:59 AM | 50 (57.5%) | 0 (0.0%) |
| 6:00 AM to 6:29 AM | 22 (25.3%) | 0 (0.0%) |
| 6:30 AM to 6:59 AM | 0 (0.0%) | 0 (0.0%) |
| 7:00 AM to 7:29 AM | 7 (8.1%) | 17 (38.6%) |
| 7:30 AM to 7:59 AM | 0 (0.0%) | 4 (9.1%) |
| 8:00 AM to 8:29 AM | 0 (0.0%) | 23 (52.3%) |
| 8:30 AM to 8:59 AM | 0 (0.0%) | 0 (0.0%) |
| 9:00 AM to 9:59 AM | 0 (0.0%) | 0 (0.0%) |
| 10:00 AM to 10:59 AM | 0 (0.0%) | 0 (0.0%) |
| 11:00 AM to 11:59 AM | 0 (0.0%) | 0 (0.0%) |
| 12:00 PM to 3:59 PM | 8 (9.2%) | 0 (0.0%) |
| 4:00 PM to 11:59 PM | 0 (0.0%) | 0 (0.0%) |
| Total | 87 (100.0%) | 44 (100.0%) |
Housing Occupancy in Summersville
Occupancy by Ownership in Summersville
Of the total 140 dwellings in Summersville, owner-occupied units account for 93 (66.4%), while renter-occupied units make up 47 (33.6%).
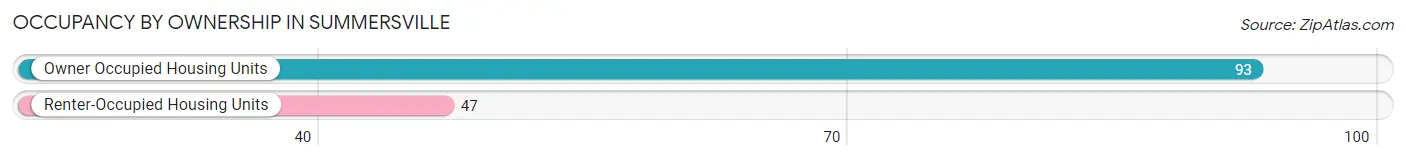
| Occupancy | # Housing Units | % Housing Units |
| Owner Occupied Housing Units | 93 | 66.4% |
| Renter-Occupied Housing Units | 47 | 33.6% |
| Total Occupied Housing Units | 140 | 100.0% |
Occupancy by Household Size in Summersville
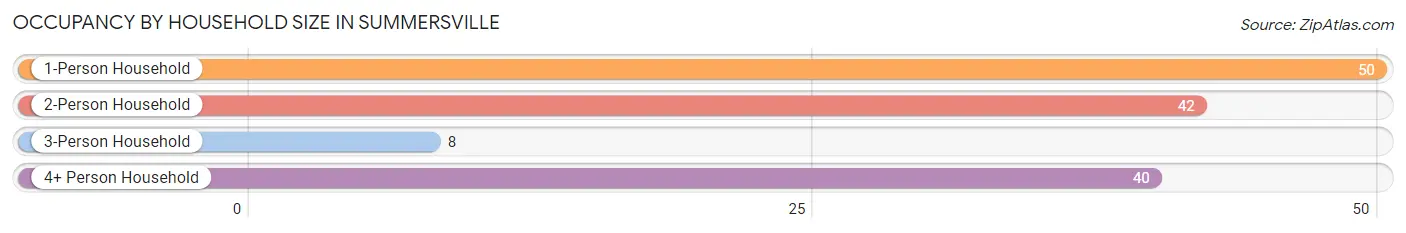
| Household Size | # Housing Units | % Housing Units |
| 1-Person Household | 50 | 35.7% |
| 2-Person Household | 42 | 30.0% |
| 3-Person Household | 8 | 5.7% |
| 4+ Person Household | 40 | 28.6% |
| Total Housing Units | 140 | 100.0% |
Occupancy by Ownership by Household Size in Summersville
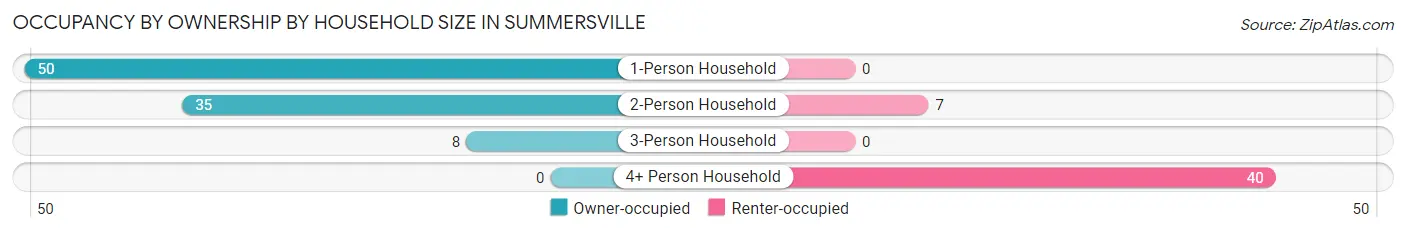
| Household Size | Owner-occupied | Renter-occupied |
| 1-Person Household | 50 (100.0%) | 0 (0.0%) |
| 2-Person Household | 35 (83.3%) | 7 (16.7%) |
| 3-Person Household | 8 (100.0%) | 0 (0.0%) |
| 4+ Person Household | 0 (0.0%) | 40 (100.0%) |
| Total Housing Units | 93 (66.4%) | 47 (33.6%) |
Occupancy by Educational Attainment in Summersville
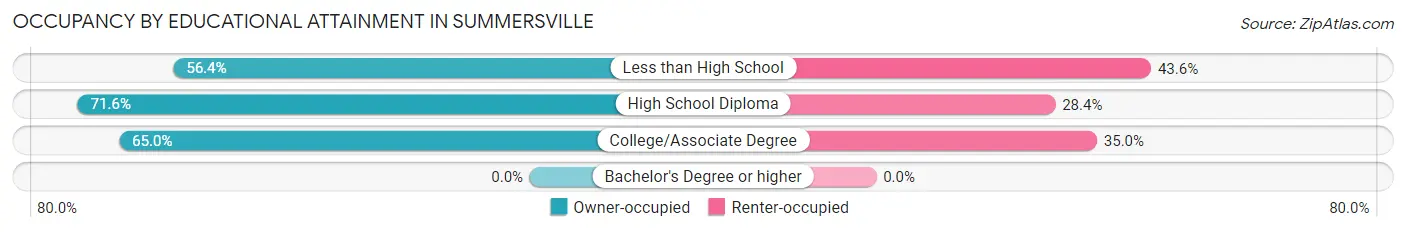
| Household Size | Owner-occupied | Renter-occupied |
| Less than High School | 22 (56.4%) | 17 (43.6%) |
| High School Diploma | 58 (71.6%) | 23 (28.4%) |
| College/Associate Degree | 13 (65.0%) | 7 (35.0%) |
| Bachelor's Degree or higher | 0 (0.0%) | 0 (0.0%) |
Occupancy by Age of Householder in Summersville
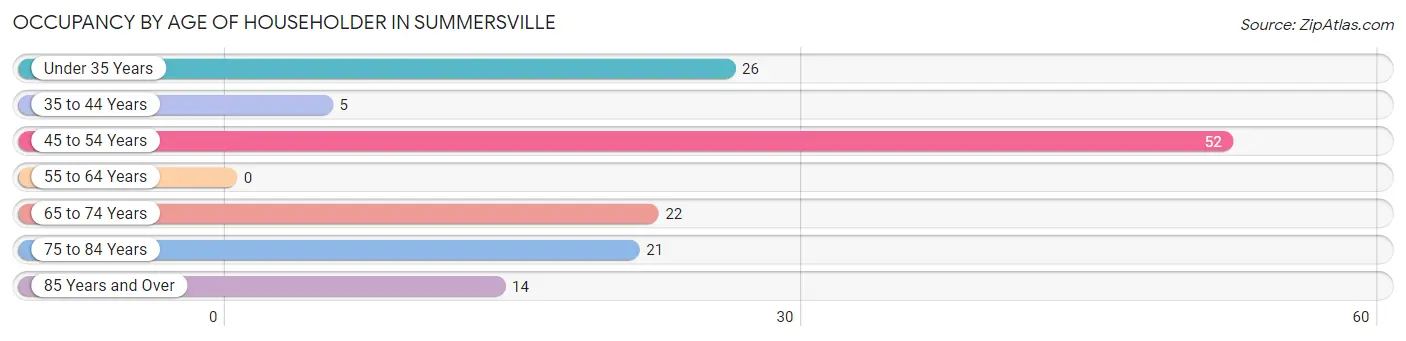
| Age Bracket | # Households | % Households |
| Under 35 Years | 26 | 18.6% |
| 35 to 44 Years | 5 | 3.6% |
| 45 to 54 Years | 52 | 37.1% |
| 55 to 64 Years | 0 | 0.0% |
| 65 to 74 Years | 22 | 15.7% |
| 75 to 84 Years | 21 | 15.0% |
| 85 Years and Over | 14 | 10.0% |
| Total | 140 | 100.0% |
Housing Finances in Summersville
Median Income by Occupancy in Summersville
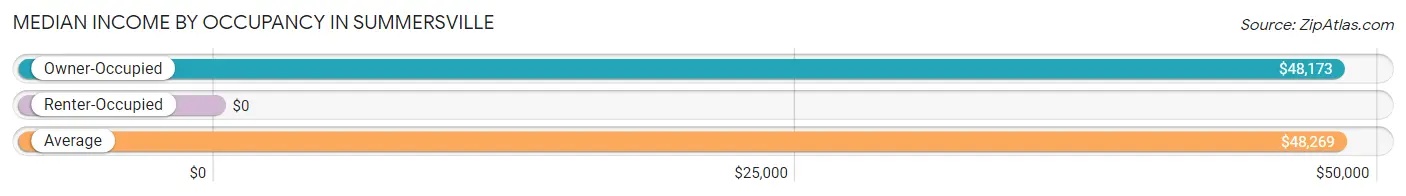
| Occupancy Type | # Households | Median Income |
| Owner-Occupied | 93 (66.4%) | $48,173 |
| Renter-Occupied | 47 (33.6%) | $0 |
| Average | 140 (100.0%) | $48,269 |
Occupancy by Householder Income Bracket in Summersville
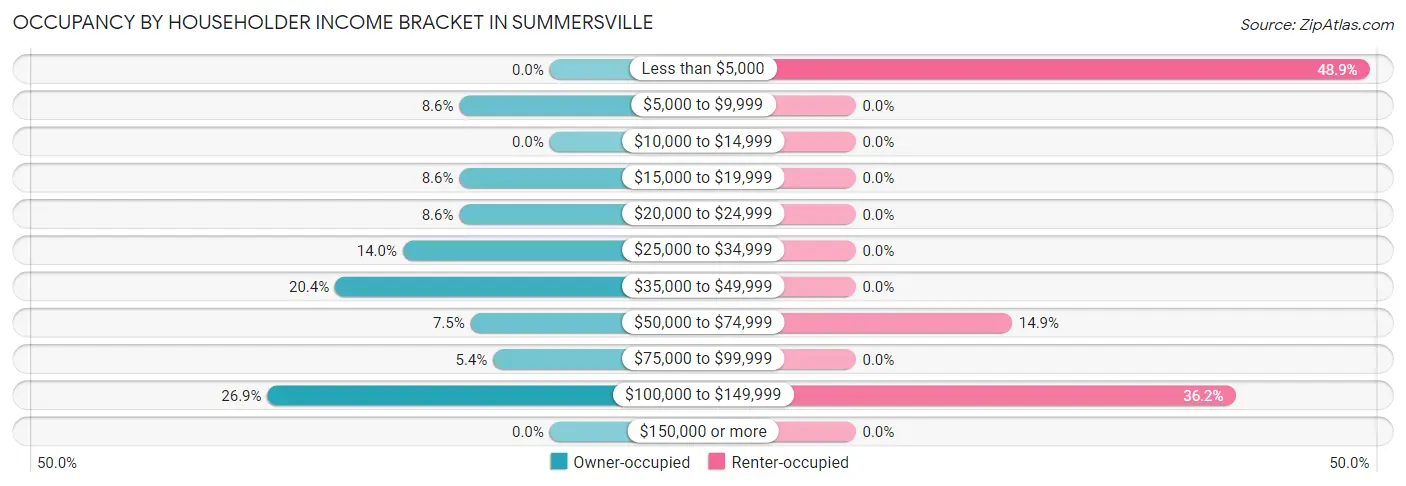
| Income Bracket | Owner-occupied | Renter-occupied |
| Less than $5,000 | 0 (0.0%) | 23 (48.9%) |
| $5,000 to $9,999 | 8 (8.6%) | 0 (0.0%) |
| $10,000 to $14,999 | 0 (0.0%) | 0 (0.0%) |
| $15,000 to $19,999 | 8 (8.6%) | 0 (0.0%) |
| $20,000 to $24,999 | 8 (8.6%) | 0 (0.0%) |
| $25,000 to $34,999 | 13 (14.0%) | 0 (0.0%) |
| $35,000 to $49,999 | 19 (20.4%) | 0 (0.0%) |
| $50,000 to $74,999 | 7 (7.5%) | 7 (14.9%) |
| $75,000 to $99,999 | 5 (5.4%) | 0 (0.0%) |
| $100,000 to $149,999 | 25 (26.9%) | 17 (36.2%) |
| $150,000 or more | 0 (0.0%) | 0 (0.0%) |
| Total | 93 (100.0%) | 47 (100.0%) |
Monthly Housing Cost Tiers in Summersville
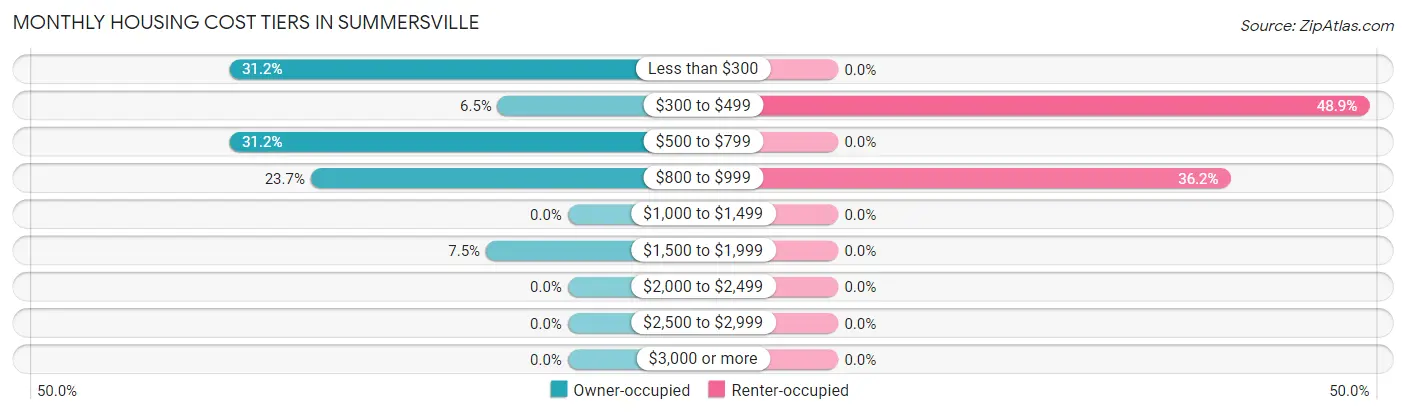
| Monthly Cost | Owner-occupied | Renter-occupied |
| Less than $300 | 29 (31.2%) | 0 (0.0%) |
| $300 to $499 | 6 (6.5%) | 23 (48.9%) |
| $500 to $799 | 29 (31.2%) | 0 (0.0%) |
| $800 to $999 | 22 (23.7%) | 17 (36.2%) |
| $1,000 to $1,499 | 0 (0.0%) | 0 (0.0%) |
| $1,500 to $1,999 | 7 (7.5%) | 0 (0.0%) |
| $2,000 to $2,499 | 0 (0.0%) | 0 (0.0%) |
| $2,500 to $2,999 | 0 (0.0%) | 0 (0.0%) |
| $3,000 or more | 0 (0.0%) | 0 (0.0%) |
| Total | 93 (100.0%) | 47 (100.0%) |
Physical Housing Characteristics in Summersville
Housing Structures in Summersville
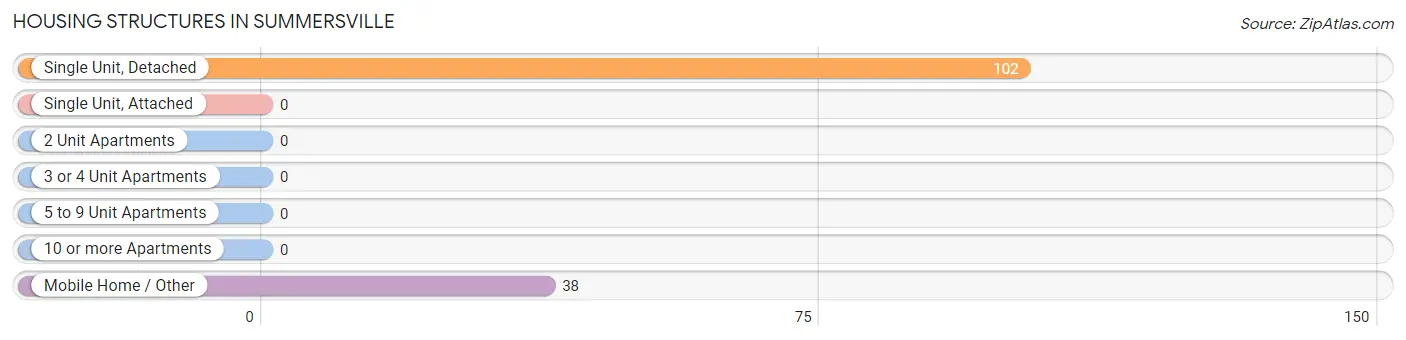
| Structure Type | # Housing Units | % Housing Units |
| Single Unit, Detached | 102 | 72.9% |
| Single Unit, Attached | 0 | 0.0% |
| 2 Unit Apartments | 0 | 0.0% |
| 3 or 4 Unit Apartments | 0 | 0.0% |
| 5 to 9 Unit Apartments | 0 | 0.0% |
| 10 or more Apartments | 0 | 0.0% |
| Mobile Home / Other | 38 | 27.1% |
| Total | 140 | 100.0% |
Housing Structures by Occupancy in Summersville
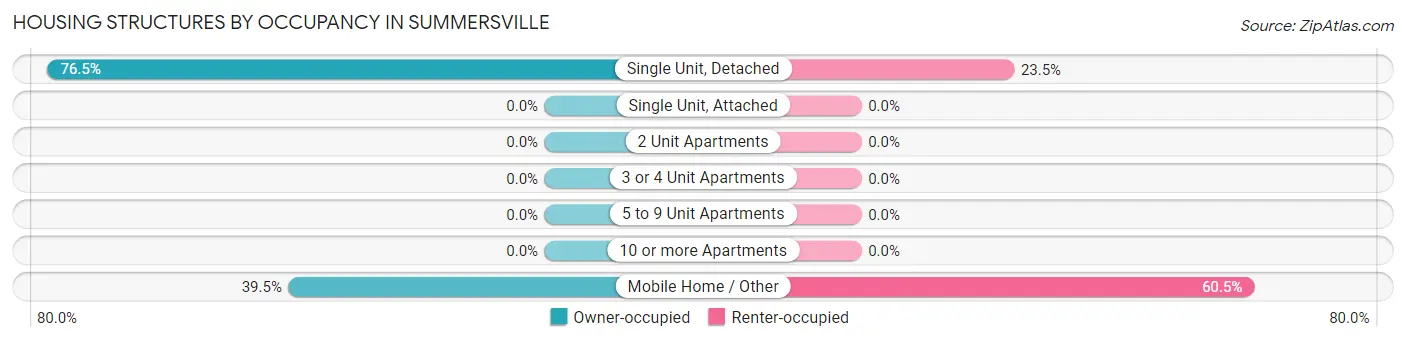
| Structure Type | Owner-occupied | Renter-occupied |
| Single Unit, Detached | 78 (76.5%) | 24 (23.5%) |
| Single Unit, Attached | 0 (0.0%) | 0 (0.0%) |
| 2 Unit Apartments | 0 (0.0%) | 0 (0.0%) |
| 3 or 4 Unit Apartments | 0 (0.0%) | 0 (0.0%) |
| 5 to 9 Unit Apartments | 0 (0.0%) | 0 (0.0%) |
| 10 or more Apartments | 0 (0.0%) | 0 (0.0%) |
| Mobile Home / Other | 15 (39.5%) | 23 (60.5%) |
| Total | 93 (66.4%) | 47 (33.6%) |
Housing Structures by Number of Rooms in Summersville
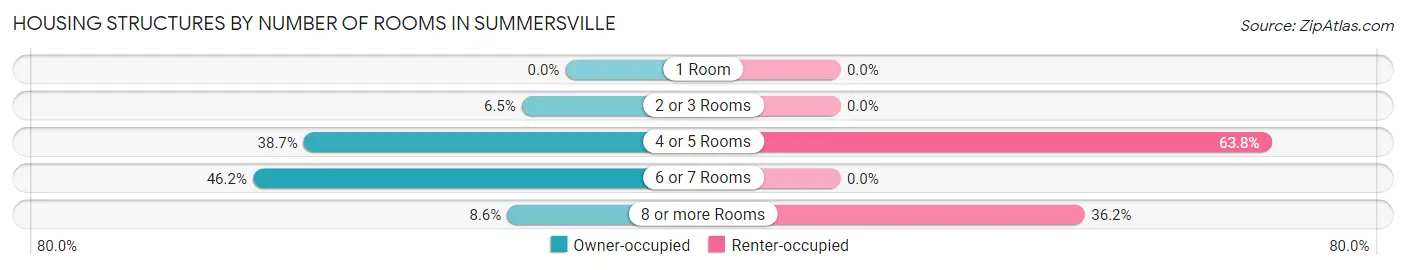
| Number of Rooms | Owner-occupied | Renter-occupied |
| 1 Room | 0 (0.0%) | 0 (0.0%) |
| 2 or 3 Rooms | 6 (6.5%) | 0 (0.0%) |
| 4 or 5 Rooms | 36 (38.7%) | 30 (63.8%) |
| 6 or 7 Rooms | 43 (46.2%) | 0 (0.0%) |
| 8 or more Rooms | 8 (8.6%) | 17 (36.2%) |
| Total | 93 (100.0%) | 47 (100.0%) |
Housing Structure by Heating Type in Summersville
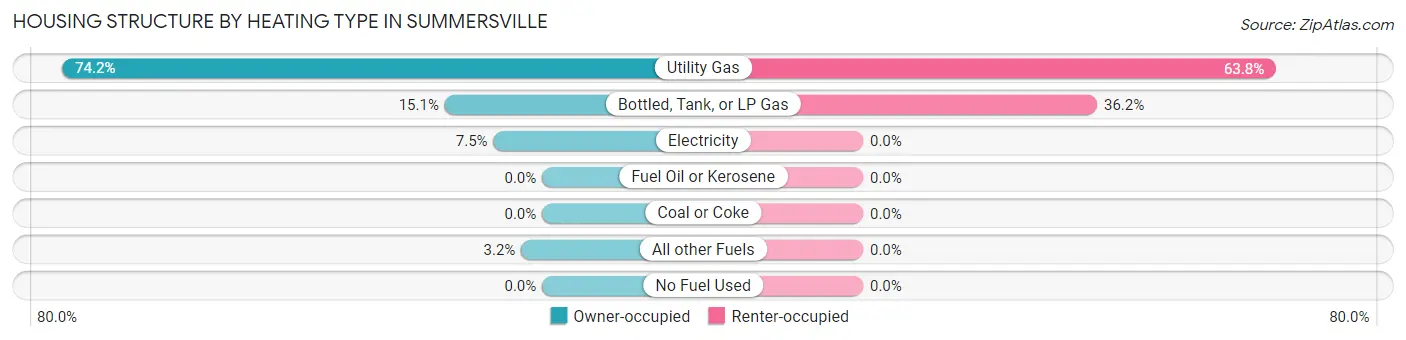
| Heating Type | Owner-occupied | Renter-occupied |
| Utility Gas | 69 (74.2%) | 30 (63.8%) |
| Bottled, Tank, or LP Gas | 14 (15.0%) | 17 (36.2%) |
| Electricity | 7 (7.5%) | 0 (0.0%) |
| Fuel Oil or Kerosene | 0 (0.0%) | 0 (0.0%) |
| Coal or Coke | 0 (0.0%) | 0 (0.0%) |
| All other Fuels | 3 (3.2%) | 0 (0.0%) |
| No Fuel Used | 0 (0.0%) | 0 (0.0%) |
| Total | 93 (100.0%) | 47 (100.0%) |
Household Vehicle Usage in Summersville
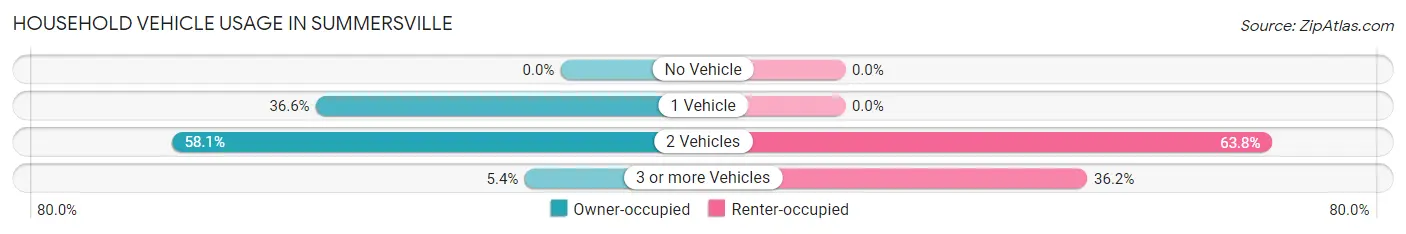
| Vehicles per Household | Owner-occupied | Renter-occupied |
| No Vehicle | 0 (0.0%) | 0 (0.0%) |
| 1 Vehicle | 34 (36.6%) | 0 (0.0%) |
| 2 Vehicles | 54 (58.1%) | 30 (63.8%) |
| 3 or more Vehicles | 5 (5.4%) | 17 (36.2%) |
| Total | 93 (100.0%) | 47 (100.0%) |
Real Estate & Mortgages in Summersville
Real Estate and Mortgage Overview in Summersville
| Characteristic | Without Mortgage | With Mortgage |
| Housing Units | 43 | 50 |
| Median Property Value | $65,000 | $95,200 |
| Median Household Income | $21,719 | $0 |
| Monthly Housing Costs | $273 | $0 |
| Real Estate Taxes | - | - |
Property Value by Mortgage Status in Summersville
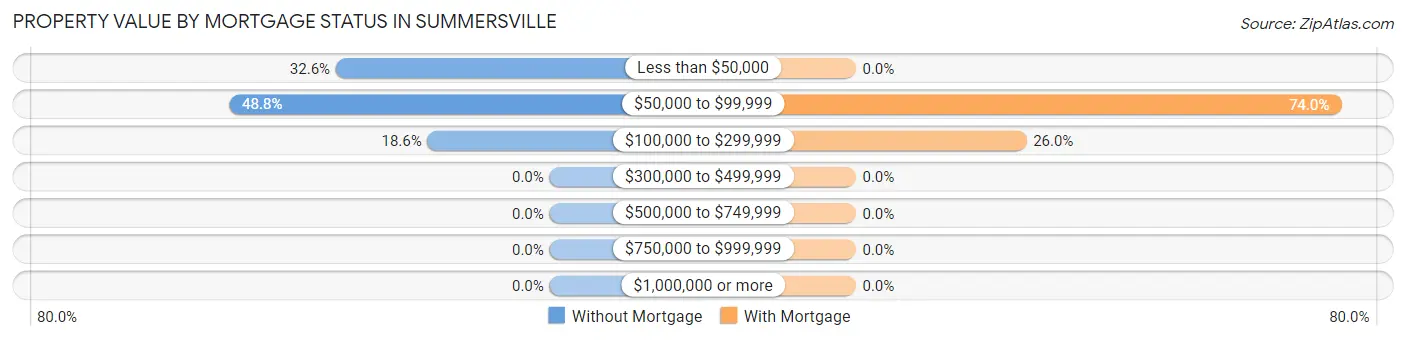
| Property Value | Without Mortgage | With Mortgage |
| Less than $50,000 | 14 (32.6%) | 0 (0.0%) |
| $50,000 to $99,999 | 21 (48.8%) | 37 (74.0%) |
| $100,000 to $299,999 | 8 (18.6%) | 13 (26.0%) |
| $300,000 to $499,999 | 0 (0.0%) | 0 (0.0%) |
| $500,000 to $749,999 | 0 (0.0%) | 0 (0.0%) |
| $750,000 to $999,999 | 0 (0.0%) | 0 (0.0%) |
| $1,000,000 or more | 0 (0.0%) | 0 (0.0%) |
| Total | 43 (100.0%) | 50 (100.0%) |
Household Income by Mortgage Status in Summersville
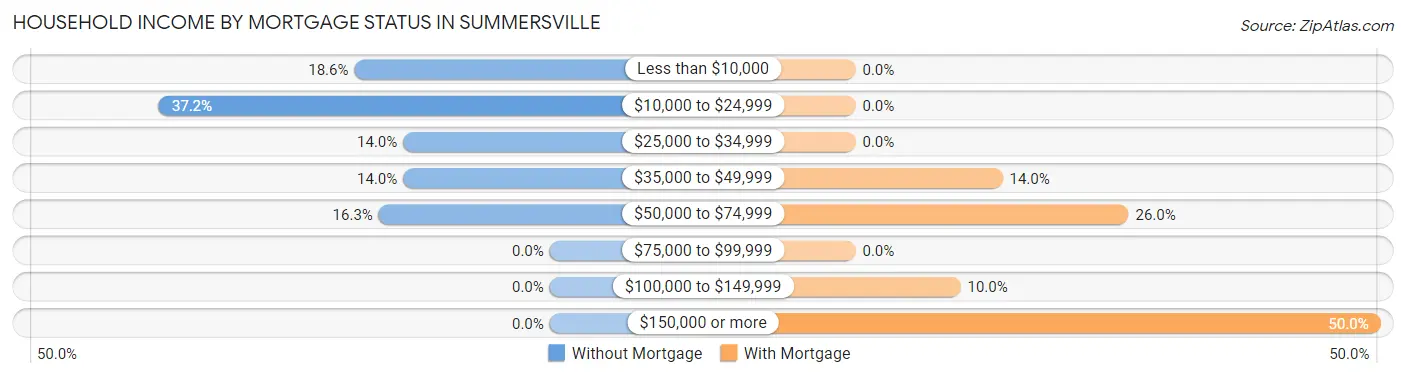
| Household Income | Without Mortgage | With Mortgage |
| Less than $10,000 | 8 (18.6%) | 0 (0.0%) |
| $10,000 to $24,999 | 16 (37.2%) | 0 (0.0%) |
| $25,000 to $34,999 | 6 (14.0%) | 0 (0.0%) |
| $35,000 to $49,999 | 6 (14.0%) | 7 (14.0%) |
| $50,000 to $74,999 | 7 (16.3%) | 13 (26.0%) |
| $75,000 to $99,999 | 0 (0.0%) | 0 (0.0%) |
| $100,000 to $149,999 | 0 (0.0%) | 5 (10.0%) |
| $150,000 or more | 0 (0.0%) | 25 (50.0%) |
| Total | 43 (100.0%) | 50 (100.0%) |
Property Value to Household Income Ratio in Summersville
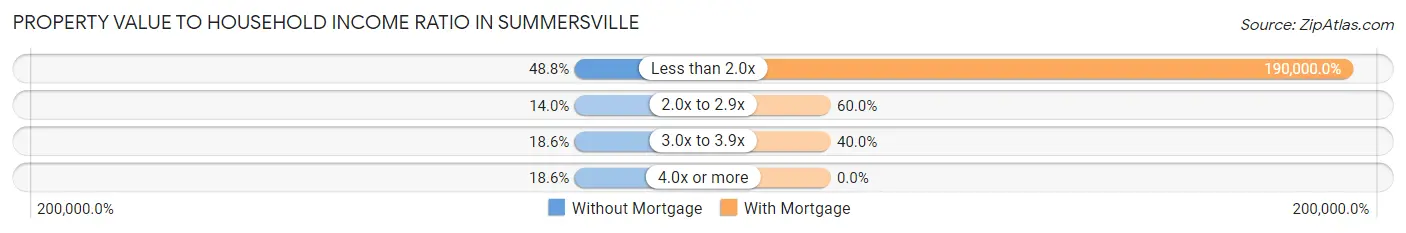
| Value-to-Income Ratio | Without Mortgage | With Mortgage |
| Less than 2.0x | 21 (48.8%) | 95,000 (190,000.0%) |
| 2.0x to 2.9x | 6 (14.0%) | 30 (60.0%) |
| 3.0x to 3.9x | 8 (18.6%) | 20 (40.0%) |
| 4.0x or more | 8 (18.6%) | 0 (0.0%) |
| Total | 43 (100.0%) | 50 (100.0%) |
Real Estate Taxes by Mortgage Status in Summersville
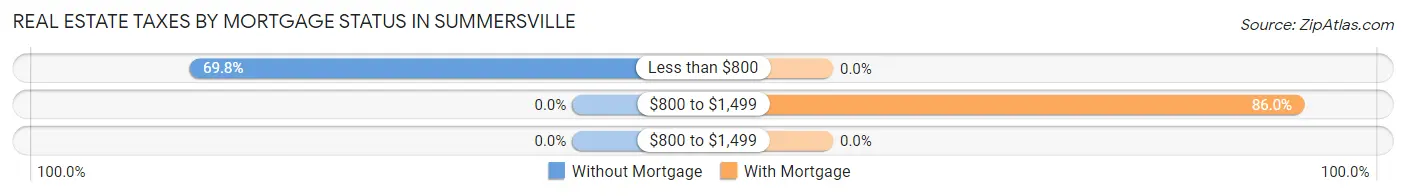
| Property Taxes | Without Mortgage | With Mortgage |
| Less than $800 | 30 (69.8%) | 0 (0.0%) |
| $800 to $1,499 | 0 (0.0%) | 43 (86.0%) |
| $800 to $1,499 | 0 (0.0%) | 0 (0.0%) |
| Total | 43 (100.0%) | 50 (100.0%) |
Health & Disability in Summersville
Health Insurance Coverage by Age in Summersville
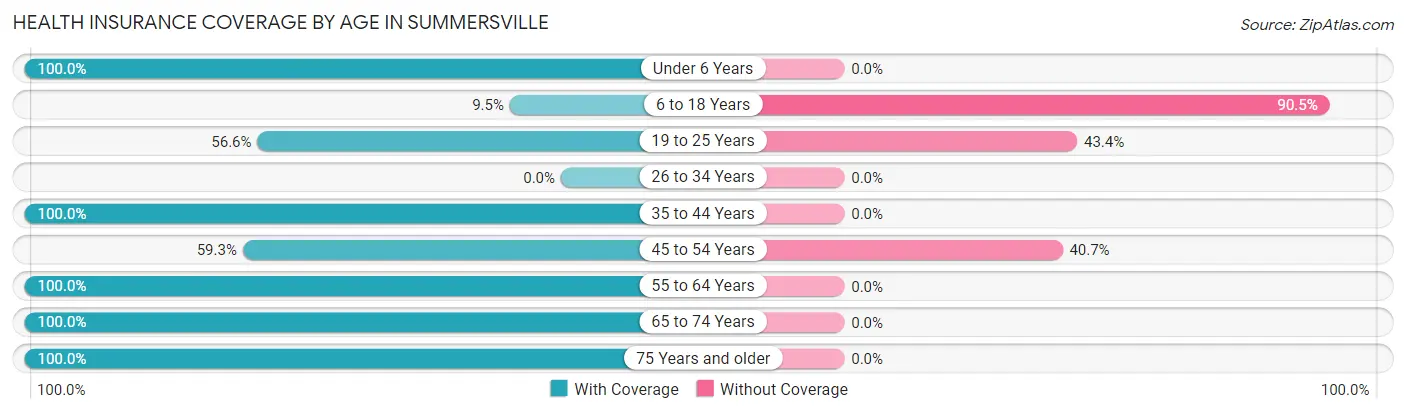
| Age Bracket | With Coverage | Without Coverage |
| Under 6 Years | 36 (100.0%) | 0 (0.0%) |
| 6 to 18 Years | 4 (9.5%) | 38 (90.5%) |
| 19 to 25 Years | 73 (56.6%) | 56 (43.4%) |
| 26 to 34 Years | 0 (0.0%) | 0 (0.0%) |
| 35 to 44 Years | 9 (100.0%) | 0 (0.0%) |
| 45 to 54 Years | 35 (59.3%) | 24 (40.7%) |
| 55 to 64 Years | 15 (100.0%) | 0 (0.0%) |
| 65 to 74 Years | 27 (100.0%) | 0 (0.0%) |
| 75 Years and older | 49 (100.0%) | 0 (0.0%) |
| Total | 248 (67.8%) | 118 (32.2%) |
Health Insurance Coverage by Citizenship Status in Summersville
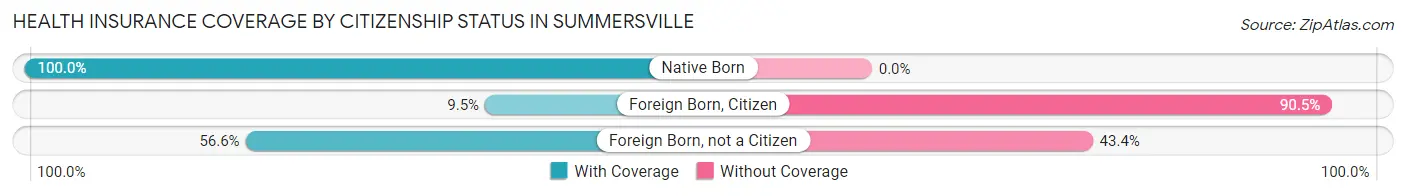
| Citizenship Status | With Coverage | Without Coverage |
| Native Born | 36 (100.0%) | 0 (0.0%) |
| Foreign Born, Citizen | 4 (9.5%) | 38 (90.5%) |
| Foreign Born, not a Citizen | 73 (56.6%) | 56 (43.4%) |
Health Insurance Coverage by Household Income in Summersville
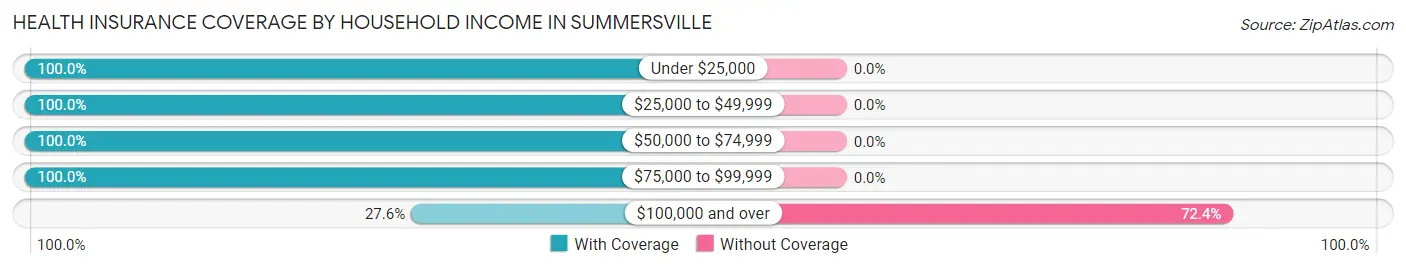
| Household Income | With Coverage | Without Coverage |
| Under $25,000 | 125 (100.0%) | 0 (0.0%) |
| $25,000 to $49,999 | 44 (100.0%) | 0 (0.0%) |
| $50,000 to $74,999 | 21 (100.0%) | 0 (0.0%) |
| $75,000 to $99,999 | 13 (100.0%) | 0 (0.0%) |
| $100,000 and over | 45 (27.6%) | 118 (72.4%) |
Public vs Private Health Insurance Coverage by Age in Summersville
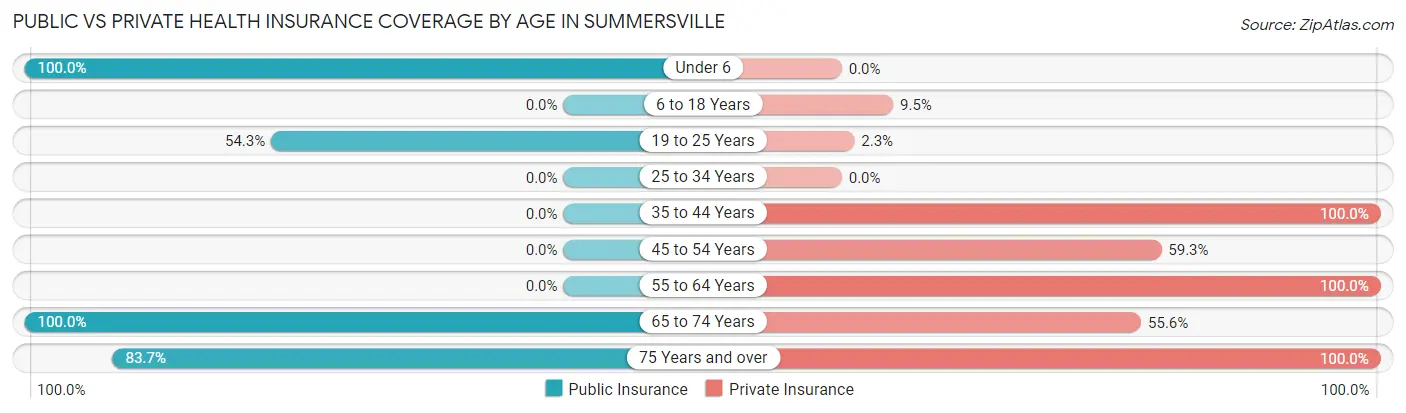
| Age Bracket | Public Insurance | Private Insurance |
| Under 6 | 36 (100.0%) | 0 (0.0%) |
| 6 to 18 Years | 0 (0.0%) | 4 (9.5%) |
| 19 to 25 Years | 70 (54.3%) | 3 (2.3%) |
| 25 to 34 Years | 0 (0.0%) | 0 (0.0%) |
| 35 to 44 Years | 0 (0.0%) | 9 (100.0%) |
| 45 to 54 Years | 0 (0.0%) | 35 (59.3%) |
| 55 to 64 Years | 0 (0.0%) | 15 (100.0%) |
| 65 to 74 Years | 27 (100.0%) | 15 (55.6%) |
| 75 Years and over | 41 (83.7%) | 49 (100.0%) |
| Total | 174 (47.5%) | 130 (35.5%) |
Disability Status by Sex by Age in Summersville
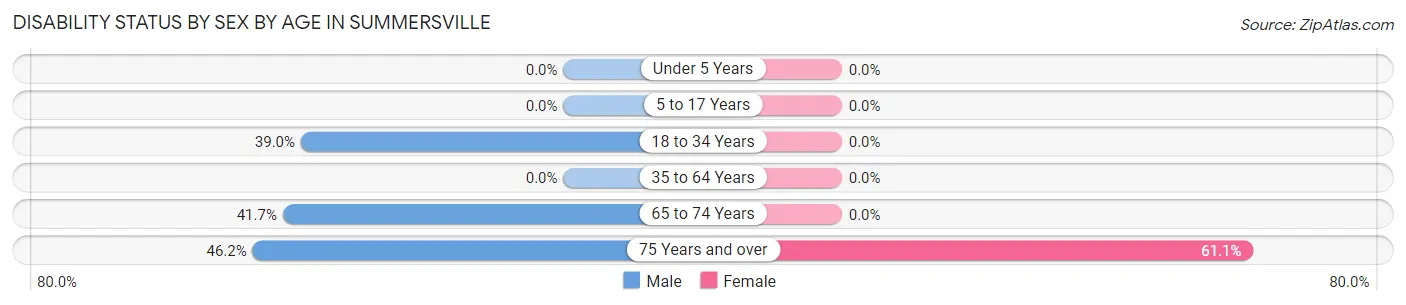
| Age Bracket | Male | Female |
| Under 5 Years | 0 (0.0%) | 0 (0.0%) |
| 5 to 17 Years | 0 (0.0%) | 0 (0.0%) |
| 18 to 34 Years | 23 (39.0%) | 0 (0.0%) |
| 35 to 64 Years | 0 (0.0%) | 0 (0.0%) |
| 65 to 74 Years | 5 (41.7%) | 0 (0.0%) |
| 75 Years and over | 6 (46.2%) | 22 (61.1%) |
Disability Class by Sex by Age in Summersville
Disability Class: Hearing Difficulty
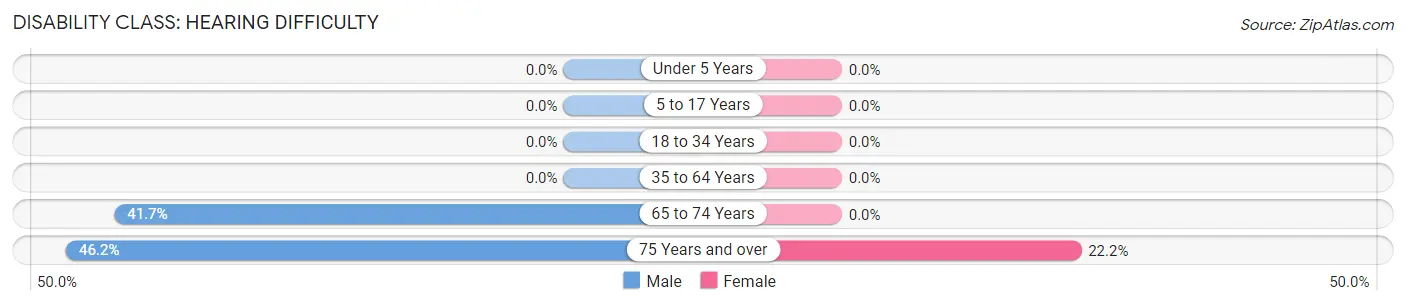
| Age Bracket | Male | Female |
| Under 5 Years | 0 (0.0%) | 0 (0.0%) |
| 5 to 17 Years | 0 (0.0%) | 0 (0.0%) |
| 18 to 34 Years | 0 (0.0%) | 0 (0.0%) |
| 35 to 64 Years | 0 (0.0%) | 0 (0.0%) |
| 65 to 74 Years | 5 (41.7%) | 0 (0.0%) |
| 75 Years and over | 6 (46.2%) | 8 (22.2%) |
Disability Class: Vision Difficulty
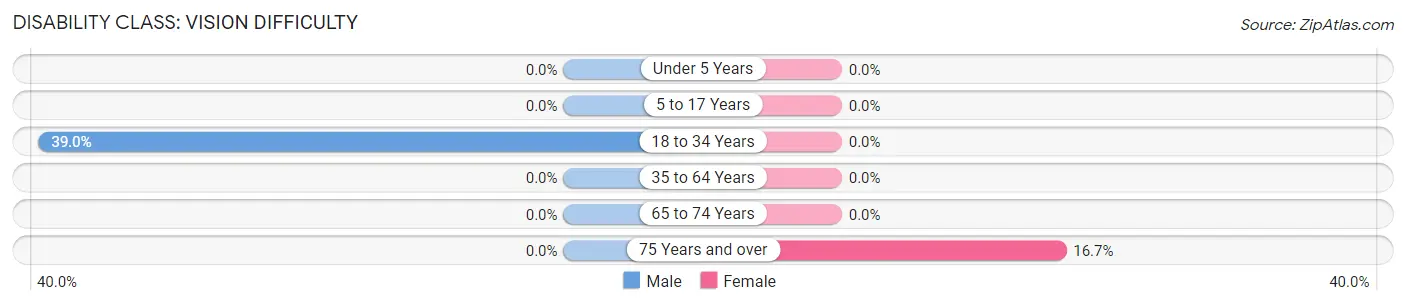
| Age Bracket | Male | Female |
| Under 5 Years | 0 (0.0%) | 0 (0.0%) |
| 5 to 17 Years | 0 (0.0%) | 0 (0.0%) |
| 18 to 34 Years | 23 (39.0%) | 0 (0.0%) |
| 35 to 64 Years | 0 (0.0%) | 0 (0.0%) |
| 65 to 74 Years | 0 (0.0%) | 0 (0.0%) |
| 75 Years and over | 0 (0.0%) | 6 (16.7%) |
Disability Class: Cognitive Difficulty
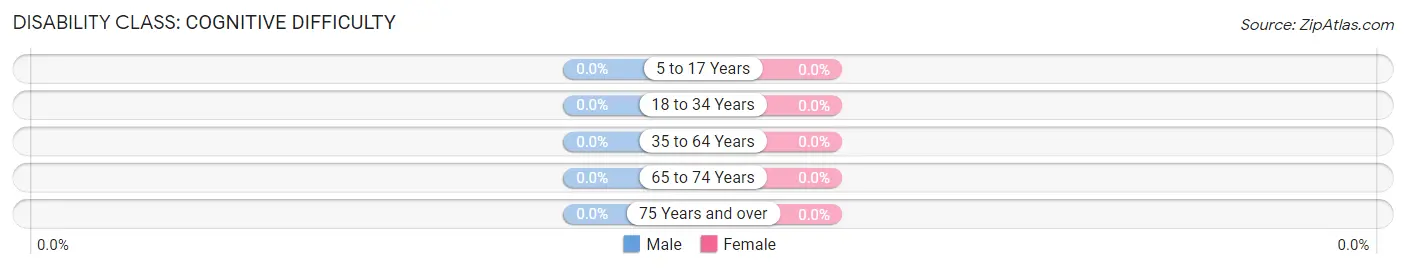
| Age Bracket | Male | Female |
| 5 to 17 Years | 0 (0.0%) | 0 (0.0%) |
| 18 to 34 Years | 0 (0.0%) | 0 (0.0%) |
| 35 to 64 Years | 0 (0.0%) | 0 (0.0%) |
| 65 to 74 Years | 0 (0.0%) | 0 (0.0%) |
| 75 Years and over | 0 (0.0%) | 0 (0.0%) |
Disability Class: Ambulatory Difficulty
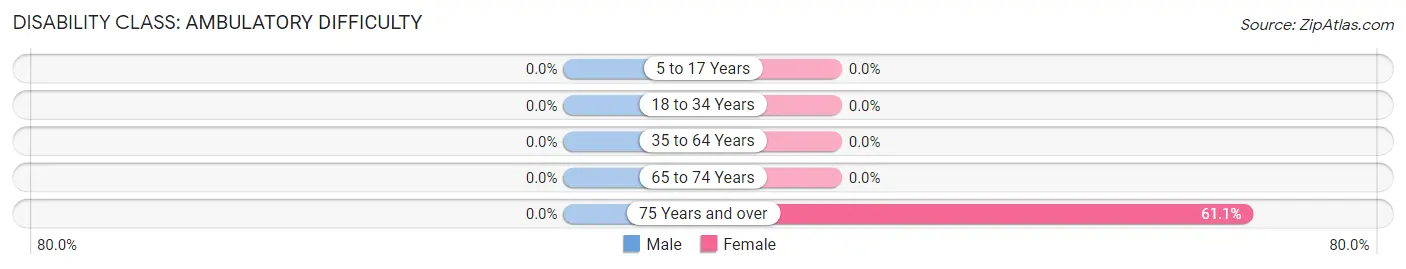
| Age Bracket | Male | Female |
| 5 to 17 Years | 0 (0.0%) | 0 (0.0%) |
| 18 to 34 Years | 0 (0.0%) | 0 (0.0%) |
| 35 to 64 Years | 0 (0.0%) | 0 (0.0%) |
| 65 to 74 Years | 0 (0.0%) | 0 (0.0%) |
| 75 Years and over | 0 (0.0%) | 22 (61.1%) |
Disability Class: Self-Care Difficulty
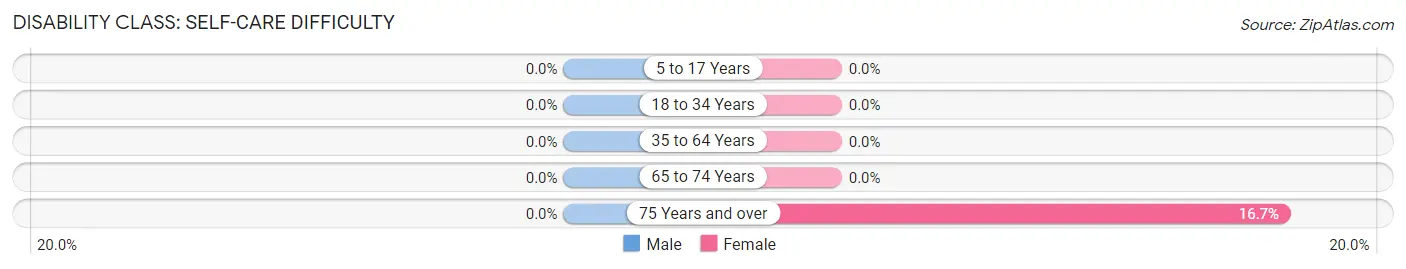
| Age Bracket | Male | Female |
| 5 to 17 Years | 0 (0.0%) | 0 (0.0%) |
| 18 to 34 Years | 0 (0.0%) | 0 (0.0%) |
| 35 to 64 Years | 0 (0.0%) | 0 (0.0%) |
| 65 to 74 Years | 0 (0.0%) | 0 (0.0%) |
| 75 Years and over | 0 (0.0%) | 6 (16.7%) |
Technology Access in Summersville
Computing Device Access in Summersville
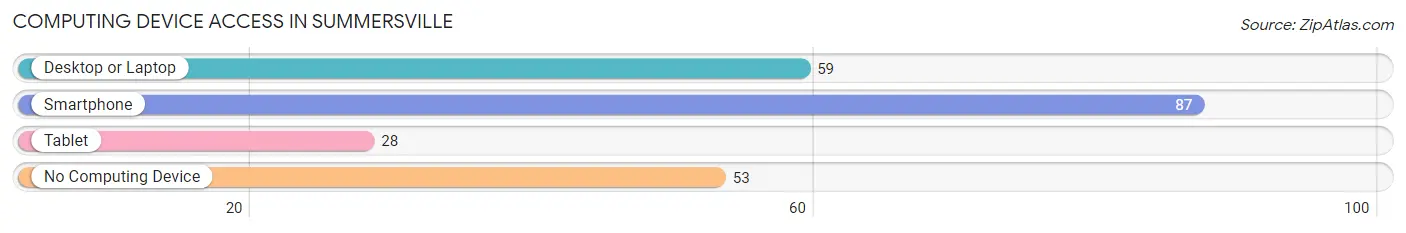
| Device Type | # Households | % Households |
| Desktop or Laptop | 59 | 42.1% |
| Smartphone | 87 | 62.1% |
| Tablet | 28 | 20.0% |
| No Computing Device | 53 | 37.9% |
| Total | 140 | 100.0% |
Internet Access in Summersville
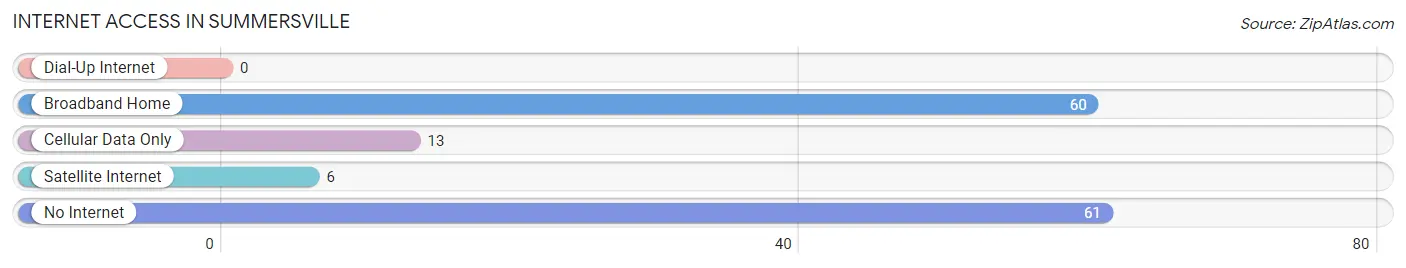
| Internet Type | # Households | % Households |
| Dial-Up Internet | 0 | 0.0% |
| Broadband Home | 60 | 42.9% |
| Cellular Data Only | 13 | 9.3% |
| Satellite Internet | 6 | 4.3% |
| No Internet | 61 | 43.6% |
| Total | 140 | 100.0% |
Summersville Summary
Summersville, Kentucky is a small town located in the western part of the state, in the foothills of the Appalachian Mountains. It is situated in the heart of the Daniel Boone National Forest, and is surrounded by rolling hills and lush forests. The town is home to a population of just over 1,000 people, and is the county seat of Green County.
History
Summersville was founded in 1818 by a group of settlers from Virginia. The town was named after the Summers family, who were among the first settlers. The Summers family had a large farm in the area, and the town was built around it. The town quickly grew, and by the mid-1800s, it had become a thriving community.
In the late 1800s, Summersville was a major stop on the Louisville and Nashville Railroad. This allowed the town to become a hub for trade and commerce, and it soon became a popular destination for tourists. The town was also home to several mills, which provided employment for many of the town's residents.
Geography
Summersville is located in the western part of Kentucky, in the foothills of the Appalachian Mountains. The town is situated in the heart of the Daniel Boone National Forest, and is surrounded by rolling hills and lush forests. The town is located at the intersection of US Highway 68 and KY Highway 90.
The climate in Summersville is humid subtropical, with hot summers and mild winters. The average annual temperature is around 60 degrees Fahrenheit, and the average annual precipitation is around 45 inches.
Economy
The economy of Summersville is largely based on agriculture and tourism. The town is home to several farms, which produce a variety of crops, including corn, soybeans, and tobacco. The town is also home to several tourist attractions, including the Daniel Boone National Forest, the Green River, and the Summersville Lake.
The town is also home to several small businesses, including restaurants, shops, and other services. The town is also home to a small manufacturing sector, which produces a variety of products, including furniture, clothing, and other items.
Demographics
As of the 2010 census, the population of Summersville was 1,072. The racial makeup of the town was 97.2% White, 0.9% African American, 0.2% Native American, 0.2% Asian, 0.1% Pacific Islander, 0.3% from other races, and 0.9% from two or more races. Hispanic or Latino of any race were 1.2% of the population.
The median household income in Summersville was $31,250, and the median family income was $37,500. The per capita income for the town was $17,845. About 16.2% of the population was below the poverty line.
Conclusion
Summersville, Kentucky is a small town located in the western part of the state, in the foothills of the Appalachian Mountains. It is situated in the heart of the Daniel Boone National Forest, and is surrounded by rolling hills and lush forests. The town is home to a population of just over 1,000 people, and is the county seat of Green County. The economy of Summersville is largely based on agriculture and tourism, and the town is home to several small businesses, including restaurants, shops, and other services. The racial makeup of the town is predominantly White, with a small percentage of African American, Native American, Asian, and Pacific Islander residents. The median household income in Summersville is $31,250, and the per capita income is $17,845.
Common Questions
What is Per Capita Income in Summersville?
Per Capita income in Summersville is $19,842.
What is the Median Household income in Summersville?
Median Household Income in Summersville is $48,269.
What is Income or Wage Gap in Summersville?
Income or Wage Gap in Summersville is 48.2%.
Women in Summersville earn 51.8 cents for every dollar earned by a man.
What is Inequality or Gini Index in Summersville?
Inequality or Gini Index in Summersville is 0.47.
What is the Total Population of Summersville?
Total Population of Summersville is 366.
What is the Total Male Population of Summersville?
Total Male Population of Summersville is 161.
What is the Total Female Population of Summersville?
Total Female Population of Summersville is 205.
What is the Ratio of Males per 100 Females in Summersville?
There are 78.54 Males per 100 Females in Summersville.
What is the Ratio of Females per 100 Males in Summersville?
There are 127.33 Females per 100 Males in Summersville.
What is the Median Population Age in Summersville?
Median Population Age in Summersville is 24.0 Years.
What is the Average Family Size in Summersville
Average Family Size in Summersville is 3.5 People.
What is the Average Household Size in Summersville
Average Household Size in Summersville is 2.6 People.
How Large is the Labor Force in Summersville?
There are 146 People in the Labor Forcein in Summersville.
What is the Percentage of People in the Labor Force in Summersville?
50.7% of People are in the Labor Force in Summersville.