Beaver Dam, KY Map & Demographics
Beaver Dam Map
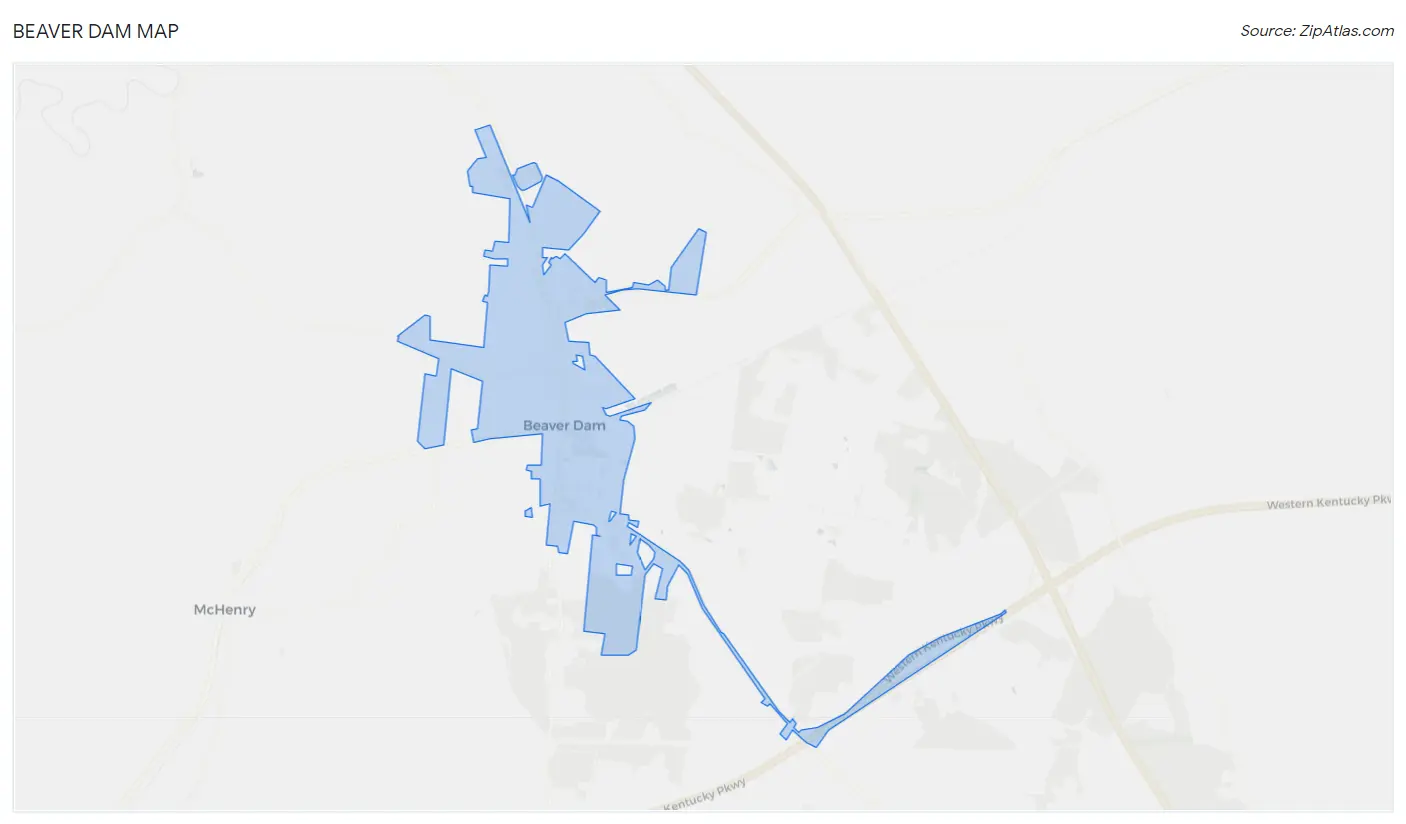
Beaver Dam Overview
$29,182
PER CAPITA INCOME
$56,486
AVG FAMILY INCOME
$48,991
AVG HOUSEHOLD INCOME
57.2%
WAGE / INCOME GAP [ % ]
42.8¢/ $1
WAGE / INCOME GAP [ $ ]
0.52
INEQUALITY / GINI INDEX
3,535
TOTAL POPULATION
1,976
MALE POPULATION
1,559
FEMALE POPULATION
126.75
MALES / 100 FEMALES
78.90
FEMALES / 100 MALES
45.1
MEDIAN AGE
2.9
AVG FAMILY SIZE
2.4
AVG HOUSEHOLD SIZE
1,537
LABOR FORCE [ PEOPLE ]
51.8%
PERCENT IN LABOR FORCE
8.8%
UNEMPLOYMENT RATE
Beaver Dam Zip Codes
Beaver Dam Area Codes
Income in Beaver Dam
Income Overview in Beaver Dam
Per Capita Income in Beaver Dam is $29,182, while median incomes of families and households are $56,486 and $48,991 respectively.
| Characteristic | Number | Measure |
| Per Capita Income | 3,535 | $29,182 |
| Median Family Income | 971 | $56,486 |
| Mean Family Income | 971 | $83,962 |
| Median Household Income | 1,472 | $48,991 |
| Mean Household Income | 1,472 | $63,980 |
| Income Deficit | 971 | $0 |
| Wage / Income Gap (%) | 3,535 | 57.25% |
| Wage / Income Gap ($) | 3,535 | 42.75¢ per $1 |
| Gini / Inequality Index | 3,535 | 0.52 |
Earnings by Sex in Beaver Dam
Average Earnings in Beaver Dam are $27,455, $35,000 for men and $14,964 for women, a difference of 57.3%.
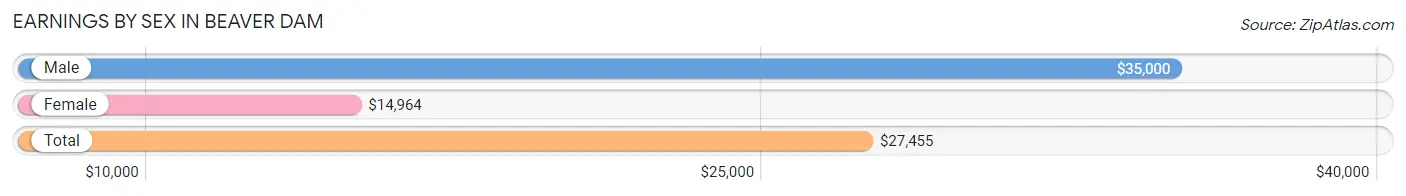
| Sex | Number | Average Earnings |
| Male | 956 (61.1%) | $35,000 |
| Female | 608 (38.9%) | $14,964 |
| Total | 1,564 (100.0%) | $27,455 |
Earnings by Sex by Income Bracket in Beaver Dam
The most common earnings brackets in Beaver Dam are $40,000 to $44,999 for men (117 | 12.2%) and $12,500 to $14,999 for women (208 | 34.2%).
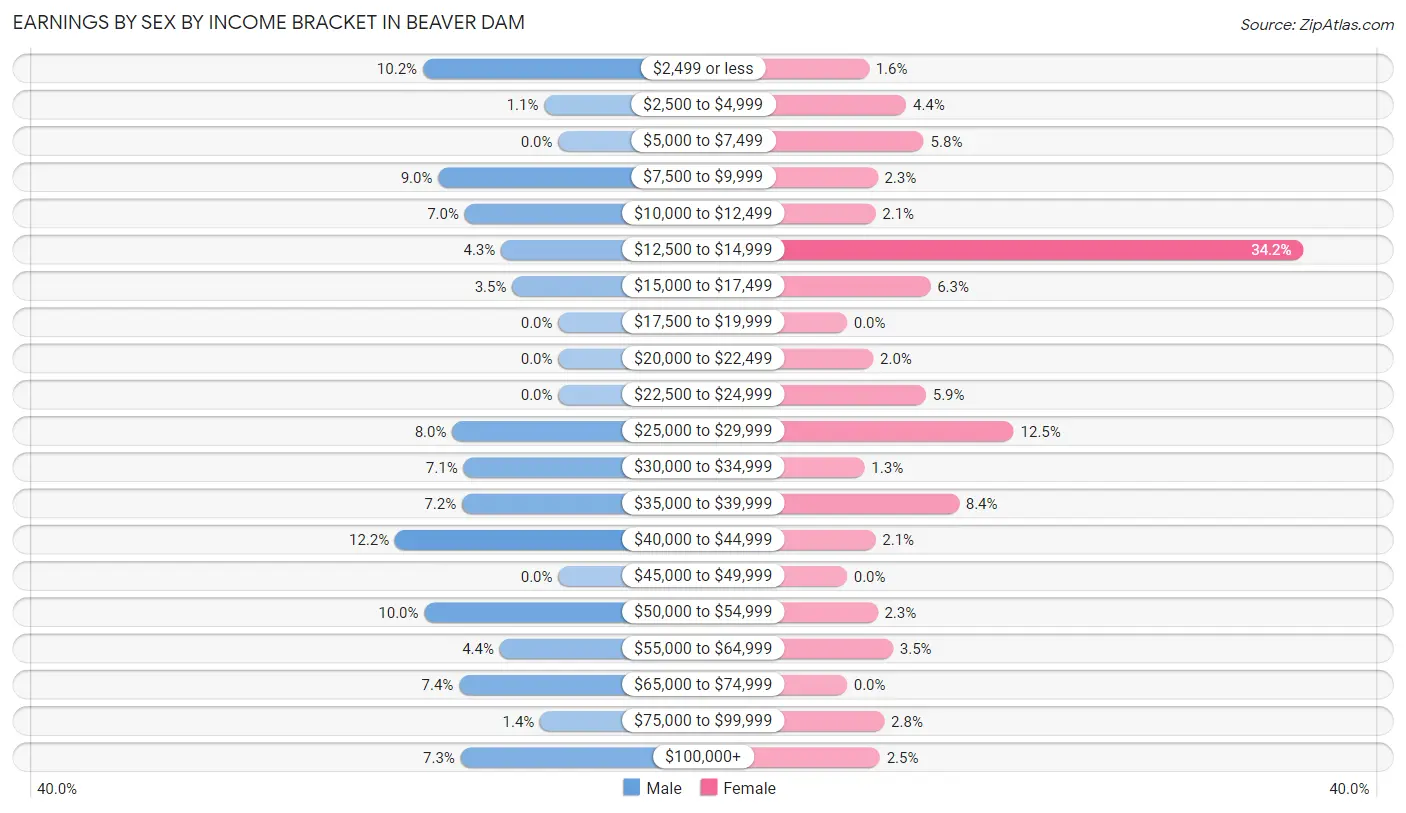
| Income | Male | Female |
| $2,499 or less | 97 (10.2%) | 10 (1.6%) |
| $2,500 to $4,999 | 10 (1.1%) | 27 (4.4%) |
| $5,000 to $7,499 | 0 (0.0%) | 35 (5.8%) |
| $7,500 to $9,999 | 86 (9.0%) | 14 (2.3%) |
| $10,000 to $12,499 | 67 (7.0%) | 13 (2.1%) |
| $12,500 to $14,999 | 41 (4.3%) | 208 (34.2%) |
| $15,000 to $17,499 | 33 (3.5%) | 38 (6.2%) |
| $17,500 to $19,999 | 0 (0.0%) | 0 (0.0%) |
| $20,000 to $22,499 | 0 (0.0%) | 12 (2.0%) |
| $22,500 to $24,999 | 0 (0.0%) | 36 (5.9%) |
| $25,000 to $29,999 | 76 (8.0%) | 76 (12.5%) |
| $30,000 to $34,999 | 68 (7.1%) | 8 (1.3%) |
| $35,000 to $39,999 | 69 (7.2%) | 51 (8.4%) |
| $40,000 to $44,999 | 117 (12.2%) | 13 (2.1%) |
| $45,000 to $49,999 | 0 (0.0%) | 0 (0.0%) |
| $50,000 to $54,999 | 96 (10.0%) | 14 (2.3%) |
| $55,000 to $64,999 | 42 (4.4%) | 21 (3.5%) |
| $65,000 to $74,999 | 71 (7.4%) | 0 (0.0%) |
| $75,000 to $99,999 | 13 (1.4%) | 17 (2.8%) |
| $100,000+ | 70 (7.3%) | 15 (2.5%) |
| Total | 956 (100.0%) | 608 (100.0%) |
Earnings by Sex by Educational Attainment in Beaver Dam
Average earnings in Beaver Dam are $41,023 for men and $22,639 for women, a difference of 44.8%. Men with an educational attainment of college or associate's degree enjoy the highest average annual earnings of $44,940, while those with high school diploma education earn the least with $33,578. Women with an educational attainment of high school diploma earn the most with the average annual earnings of $27,279, while those with college or associate's degree education have the smallest earnings of $14,280.
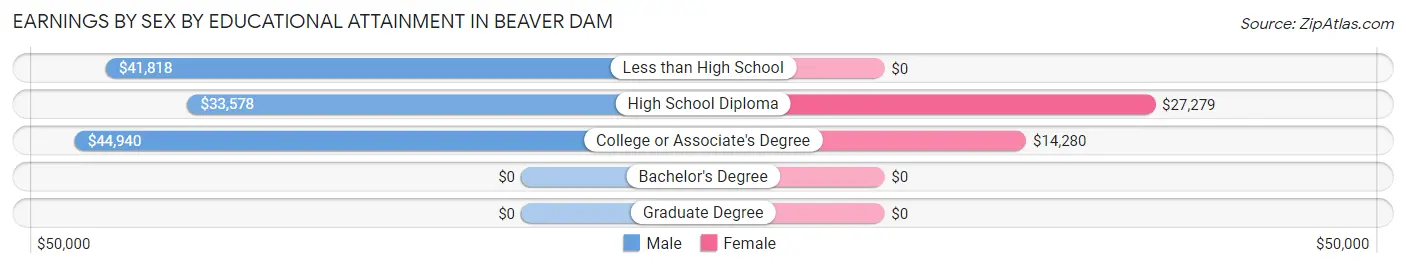
| Educational Attainment | Male Income | Female Income |
| Less than High School | $41,818 | $0 |
| High School Diploma | $33,578 | $27,279 |
| College or Associate's Degree | $44,940 | $14,280 |
| Bachelor's Degree | - | - |
| Graduate Degree | - | - |
| Total | $41,023 | $22,639 |
Family Income in Beaver Dam
Family Income Brackets in Beaver Dam
According to the Beaver Dam family income data, there are 226 families falling into the $75,000 to $99,999 income range, which is the most common income bracket and makes up 23.3% of all families. Conversely, the $200,000+ income bracket is the least frequent group with only 6 families (0.6%) belonging to this category.
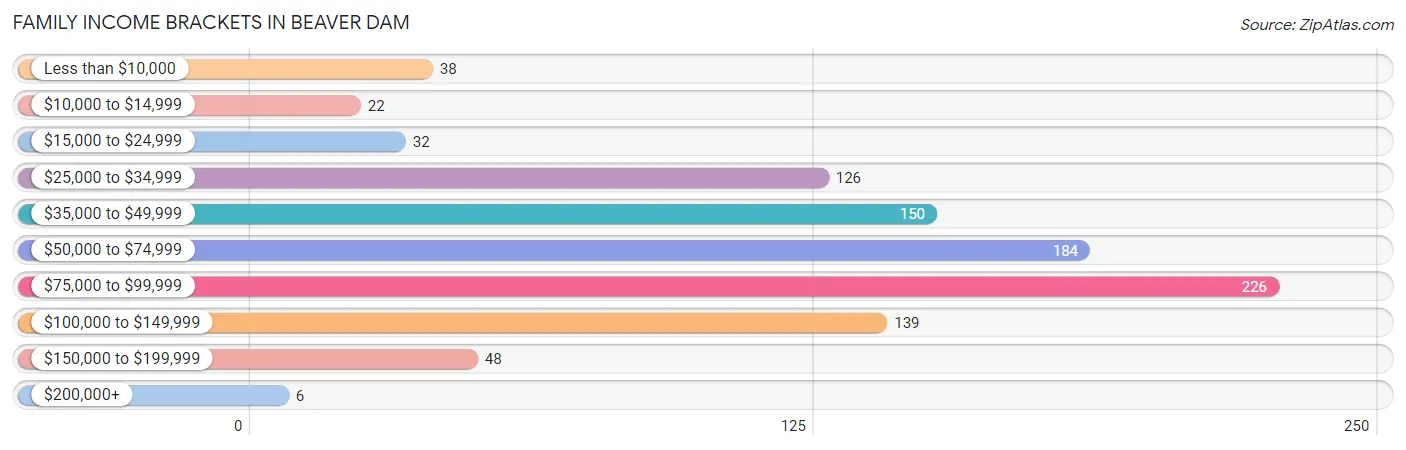
| Income Bracket | # Families | % Families |
| Less than $10,000 | 38 | 3.9% |
| $10,000 to $14,999 | 22 | 2.3% |
| $15,000 to $24,999 | 32 | 3.3% |
| $25,000 to $34,999 | 126 | 13.0% |
| $35,000 to $49,999 | 150 | 15.4% |
| $50,000 to $74,999 | 184 | 18.9% |
| $75,000 to $99,999 | 226 | 23.3% |
| $100,000 to $149,999 | 139 | 14.3% |
| $150,000 to $199,999 | 48 | 4.9% |
| $200,000+ | 6 | 0.6% |
Family Income by Famaliy Size in Beaver Dam
4-person families (120 | 12.4%) account for the highest median family income in Beaver Dam with $90,283 per family, while 2-person families (519 | 53.4%) have the highest median income of $36,424 per family member.
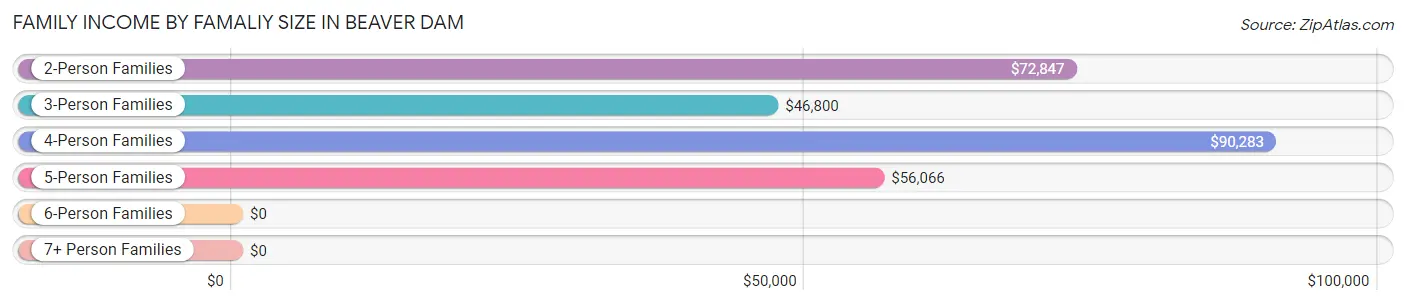
| Income Bracket | # Families | Median Income |
| 2-Person Families | 519 (53.4%) | $72,847 |
| 3-Person Families | 259 (26.7%) | $46,800 |
| 4-Person Families | 120 (12.4%) | $90,283 |
| 5-Person Families | 73 (7.5%) | $56,066 |
| 6-Person Families | 0 (0.0%) | $0 |
| 7+ Person Families | 0 (0.0%) | $0 |
| Total | 971 (100.0%) | $56,486 |
Family Income by Number of Earners in Beaver Dam
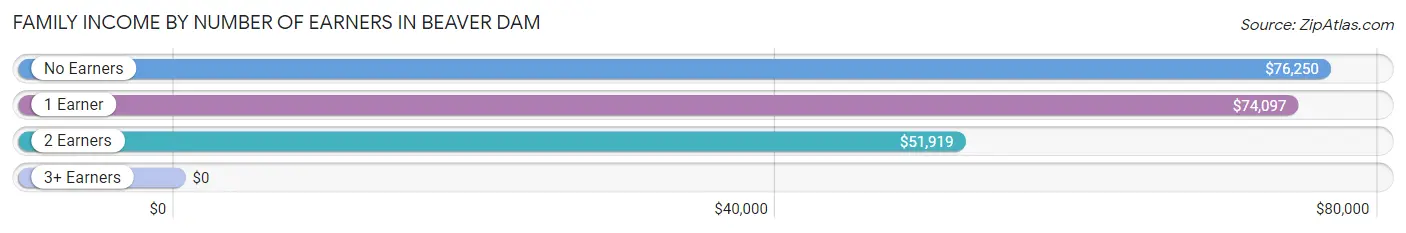
| Number of Earners | # Families | Median Income |
| No Earners | 202 (20.8%) | $76,250 |
| 1 Earner | 349 (35.9%) | $74,097 |
| 2 Earners | 410 (42.2%) | $51,919 |
| 3+ Earners | 10 (1.0%) | $0 |
| Total | 971 (100.0%) | $56,486 |
Household Income in Beaver Dam
Household Income Brackets in Beaver Dam
With 265 households falling in the category, the $50,000 to $74,999 income range is the most frequent in Beaver Dam, accounting for 18.0% of all households. In contrast, only 6 households (0.4%) fall into the $200,000+ income bracket, making it the least populous group.
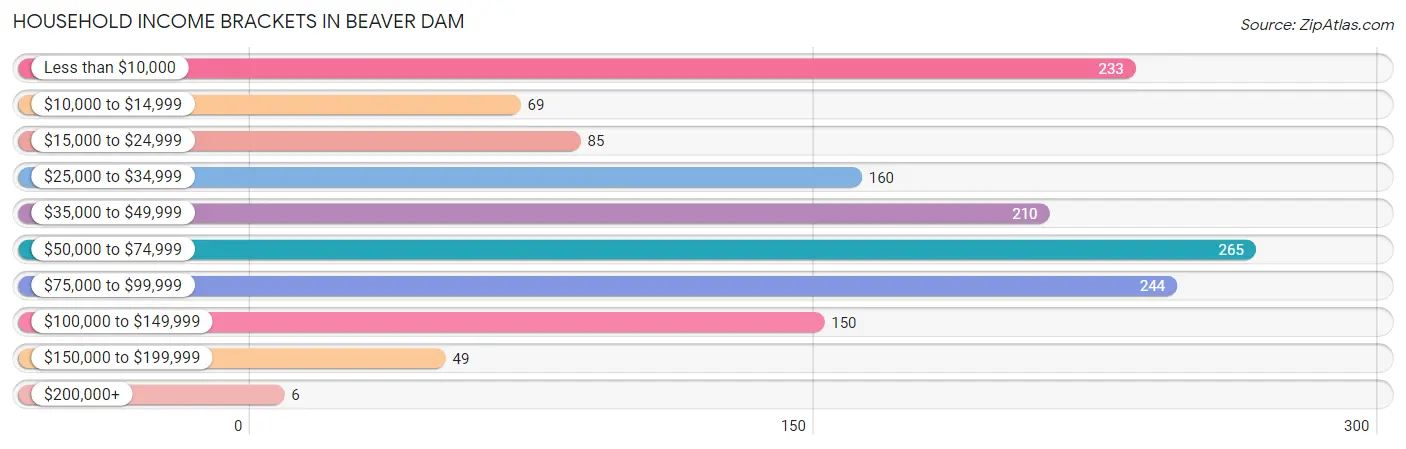
| Income Bracket | # Households | % Households |
| Less than $10,000 | 233 | 15.8% |
| $10,000 to $14,999 | 69 | 4.7% |
| $15,000 to $24,999 | 85 | 5.8% |
| $25,000 to $34,999 | 160 | 10.9% |
| $35,000 to $49,999 | 210 | 14.3% |
| $50,000 to $74,999 | 265 | 18.0% |
| $75,000 to $99,999 | 244 | 16.6% |
| $100,000 to $149,999 | 150 | 10.2% |
| $150,000 to $199,999 | 49 | 3.3% |
| $200,000+ | 6 | 0.4% |
Household Income by Householder Age in Beaver Dam
The median household income in Beaver Dam is $48,991, with the highest median household income of $51,970 found in the 65+ years age bracket for the primary householder. A total of 434 households (29.5%) fall into this category. Meanwhile, the 15 to 24 years age bracket for the primary householder has the lowest median household income of $0, with 69 households (4.7%) in this group.
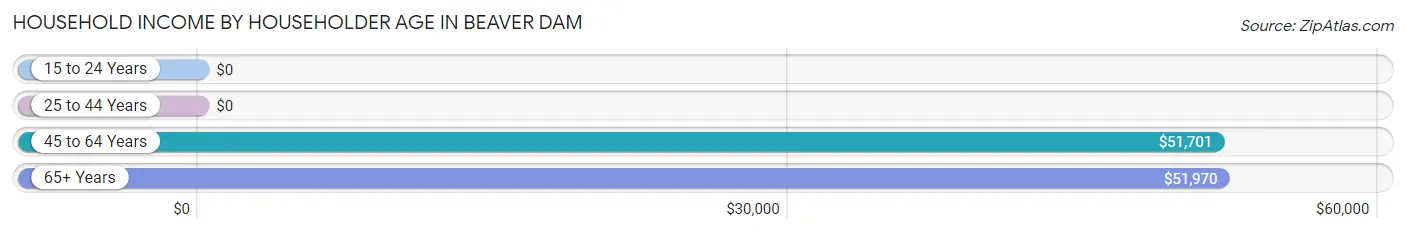
| Income Bracket | # Households | Median Income |
| 15 to 24 Years | 69 (4.7%) | $0 |
| 25 to 44 Years | 456 (31.0%) | $0 |
| 45 to 64 Years | 513 (34.8%) | $51,701 |
| 65+ Years | 434 (29.5%) | $51,970 |
| Total | 1,472 (100.0%) | $48,991 |
Poverty in Beaver Dam
Income Below Poverty by Sex and Age in Beaver Dam
With 18.8% poverty level for males and 20.4% for females among the residents of Beaver Dam, 25 to 34 year old males and 35 to 44 year old females are the most vulnerable to poverty, with 243 males (70.9%) and 84 females (52.5%) in their respective age groups living below the poverty level.
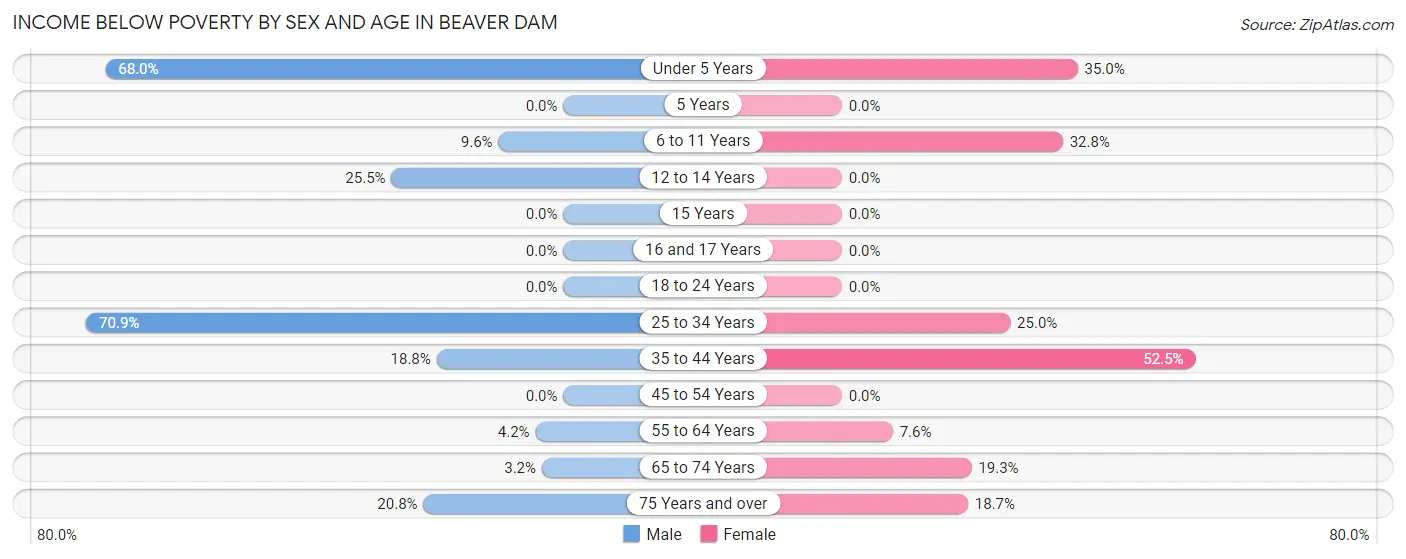
| Age Bracket | Male | Female |
| Under 5 Years | 17 (68.0%) | 42 (35.0%) |
| 5 Years | 0 (0.0%) | 0 (0.0%) |
| 6 to 11 Years | 16 (9.6%) | 41 (32.8%) |
| 12 to 14 Years | 24 (25.5%) | 0 (0.0%) |
| 15 Years | 0 (0.0%) | 0 (0.0%) |
| 16 and 17 Years | 0 (0.0%) | 0 (0.0%) |
| 18 to 24 Years | 0 (0.0%) | 0 (0.0%) |
| 25 to 34 Years | 243 (70.9%) | 54 (25.0%) |
| 35 to 44 Years | 16 (18.8%) | 84 (52.5%) |
| 45 to 54 Years | 0 (0.0%) | 0 (0.0%) |
| 55 to 64 Years | 17 (4.2%) | 31 (7.6%) |
| 65 to 74 Years | 6 (3.2%) | 31 (19.3%) |
| 75 Years and over | 32 (20.8%) | 35 (18.7%) |
| Total | 371 (18.8%) | 318 (20.4%) |
Income Above Poverty by Sex and Age in Beaver Dam
According to the poverty statistics in Beaver Dam, males aged 15 years and females aged 12 to 14 years are the age groups that are most secure financially, with 100.0% of males and 100.0% of females in these age groups living above the poverty line.
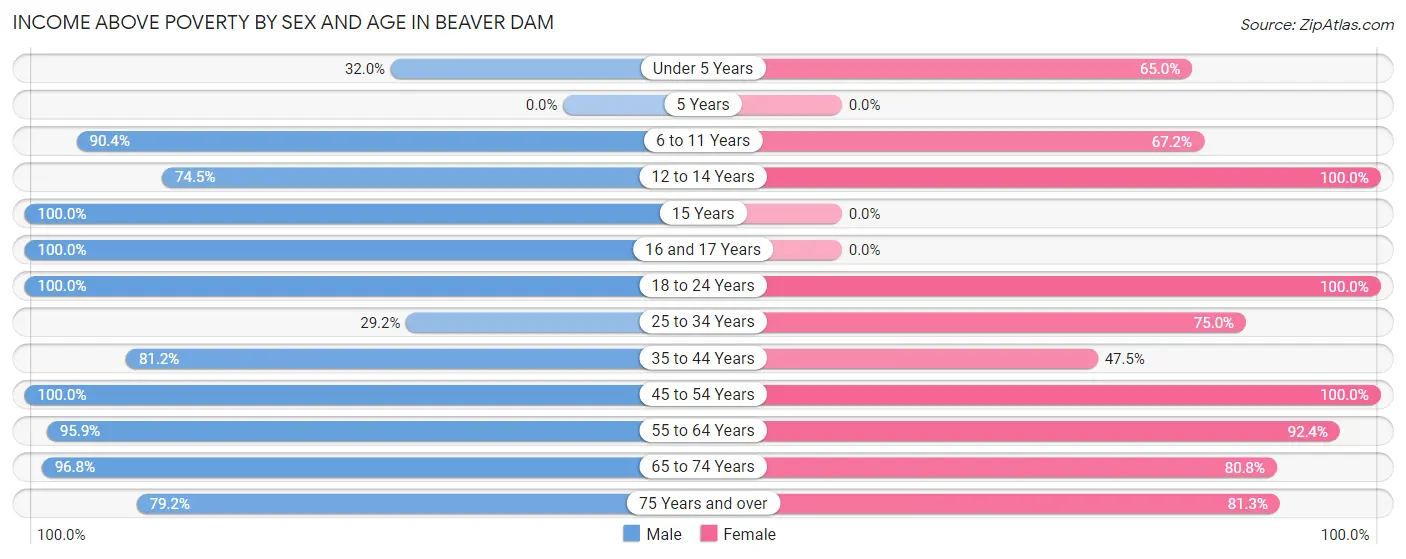
| Age Bracket | Male | Female |
| Under 5 Years | 8 (32.0%) | 78 (65.0%) |
| 5 Years | 0 (0.0%) | 0 (0.0%) |
| 6 to 11 Years | 150 (90.4%) | 84 (67.2%) |
| 12 to 14 Years | 70 (74.5%) | 19 (100.0%) |
| 15 Years | 19 (100.0%) | 0 (0.0%) |
| 16 and 17 Years | 133 (100.0%) | 0 (0.0%) |
| 18 to 24 Years | 145 (100.0%) | 110 (100.0%) |
| 25 to 34 Years | 100 (29.1%) | 162 (75.0%) |
| 35 to 44 Years | 69 (81.2%) | 76 (47.5%) |
| 45 to 54 Years | 214 (100.0%) | 51 (100.0%) |
| 55 to 64 Years | 393 (95.9%) | 379 (92.4%) |
| 65 to 74 Years | 182 (96.8%) | 130 (80.7%) |
| 75 Years and over | 122 (79.2%) | 152 (81.3%) |
| Total | 1,605 (81.2%) | 1,241 (79.6%) |
Income Below Poverty Among Married-Couple Families in Beaver Dam
The poverty statistics for married-couple families in Beaver Dam show that 7.4% or 49 of the total 662 families live below the poverty line. Families with 3 or 4 children have the highest poverty rate of 39.3%, comprising of 22 families. On the other hand, families with no children have the lowest poverty rate of 1.3%, which includes 6 families.
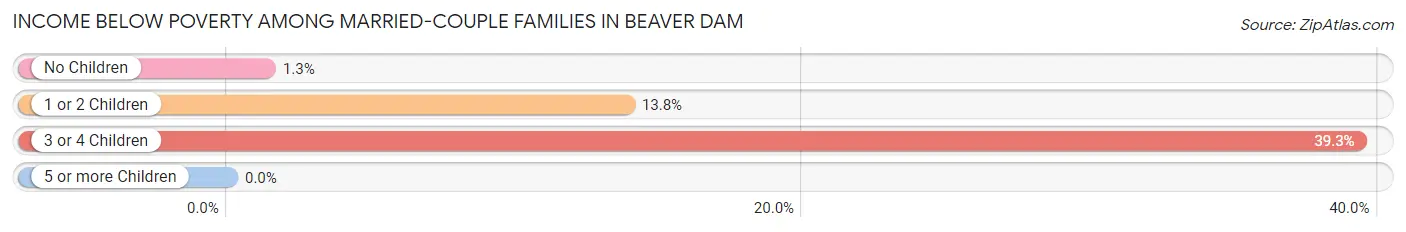
| Children | Above Poverty | Below Poverty |
| No Children | 448 (98.7%) | 6 (1.3%) |
| 1 or 2 Children | 131 (86.2%) | 21 (13.8%) |
| 3 or 4 Children | 34 (60.7%) | 22 (39.3%) |
| 5 or more Children | 0 (0.0%) | 0 (0.0%) |
| Total | 613 (92.6%) | 49 (7.4%) |
Income Below Poverty Among Single-Parent Households in Beaver Dam
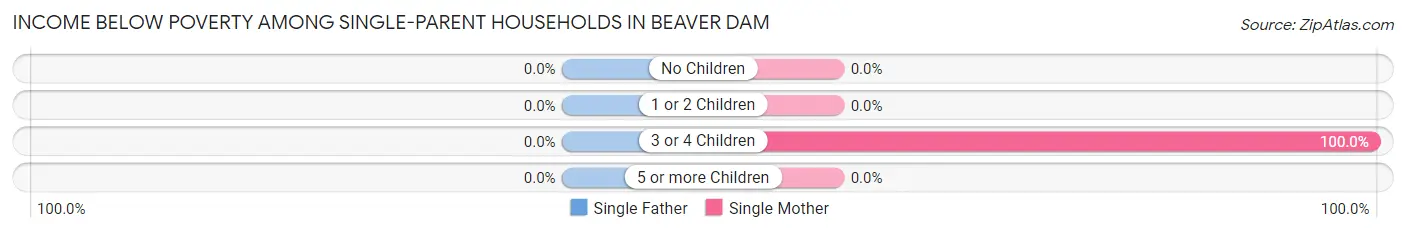
| Children | Single Father | Single Mother |
| No Children | 0 (0.0%) | 0 (0.0%) |
| 1 or 2 Children | 0 (0.0%) | 0 (0.0%) |
| 3 or 4 Children | 0 (0.0%) | 11 (100.0%) |
| 5 or more Children | 0 (0.0%) | 0 (0.0%) |
| Total | 0 (0.0%) | 11 (8.0%) |
Income Below Poverty Among Married-Couple vs Single-Parent Households in Beaver Dam
The poverty data for Beaver Dam shows that 49 of the married-couple family households (7.4%) and 11 of the single-parent households (3.6%) are living below the poverty level. Within the married-couple family households, those with 3 or 4 children have the highest poverty rate, with 22 households (39.3%) falling below the poverty line. Among the single-parent households, those with 3 or 4 children have the highest poverty rate, with 11 household (36.7%) living below poverty.
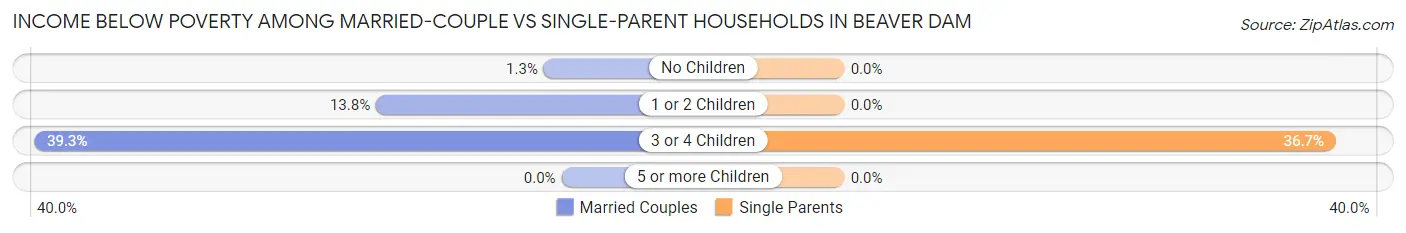
| Children | Married-Couple Families | Single-Parent Households |
| No Children | 6 (1.3%) | 0 (0.0%) |
| 1 or 2 Children | 21 (13.8%) | 0 (0.0%) |
| 3 or 4 Children | 22 (39.3%) | 11 (36.7%) |
| 5 or more Children | 0 (0.0%) | 0 (0.0%) |
| Total | 49 (7.4%) | 11 (3.6%) |
Race in Beaver Dam
The most populous races in Beaver Dam are White / Caucasian (2,990 | 84.6%), Two or more Races (398 | 11.3%), and Hispanic or Latino (344 | 9.7%).
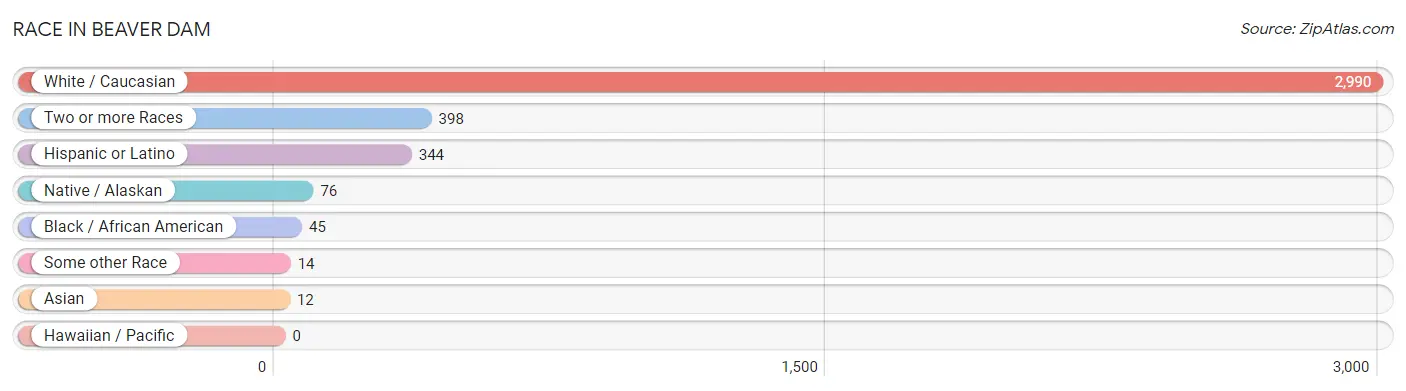
| Race | # Population | % Population |
| Asian | 12 | 0.3% |
| Black / African American | 45 | 1.3% |
| Hawaiian / Pacific | 0 | 0.0% |
| Hispanic or Latino | 344 | 9.7% |
| Native / Alaskan | 76 | 2.1% |
| White / Caucasian | 2,990 | 84.6% |
| Two or more Races | 398 | 11.3% |
| Some other Race | 14 | 0.4% |
| Total | 3,535 | 100.0% |
Ancestry in Beaver Dam
The most populous ancestries reported in Beaver Dam are American (856 | 24.2%), English (428 | 12.1%), Irish (288 | 8.2%), Mexican (270 | 7.6%), and German (239 | 6.8%), together accounting for 58.9% of all Beaver Dam residents.
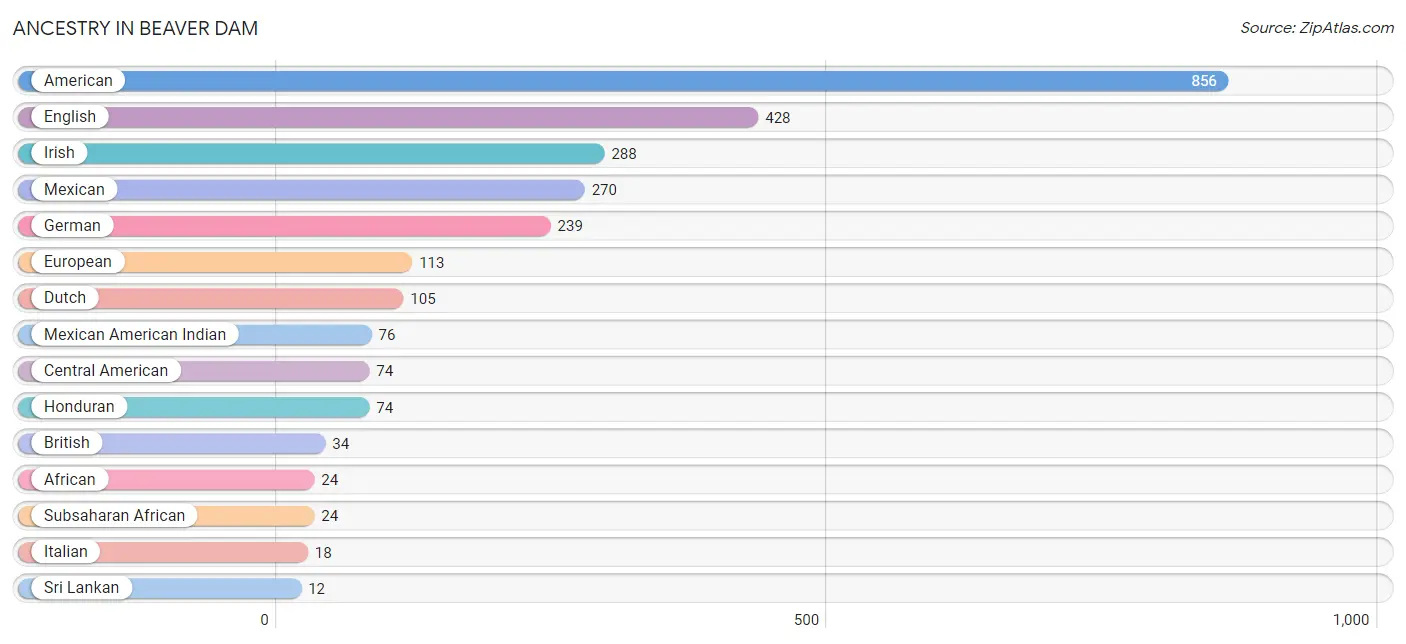
| Ancestry | # Population | % Population |
| African | 24 | 0.7% |
| American | 856 | 24.2% |
| British | 34 | 1.0% |
| Central American | 74 | 2.1% |
| Chippewa | 10 | 0.3% |
| Dutch | 105 | 3.0% |
| English | 428 | 12.1% |
| European | 113 | 3.2% |
| German | 239 | 6.8% |
| Honduran | 74 | 2.1% |
| Irish | 288 | 8.2% |
| Italian | 18 | 0.5% |
| Mexican | 270 | 7.6% |
| Mexican American Indian | 76 | 2.1% |
| Sri Lankan | 12 | 0.3% |
| Subsaharan African | 24 | 0.7% | View All 16 Rows |
Immigrants in Beaver Dam
The most numerous immigrant groups reported in Beaver Dam came from Central America (303 | 8.6%), Latin America (303 | 8.6%), Mexico (229 | 6.5%), Honduras (74 | 2.1%), and Asia (12 | 0.3%), together accounting for 26.1% of all Beaver Dam residents.
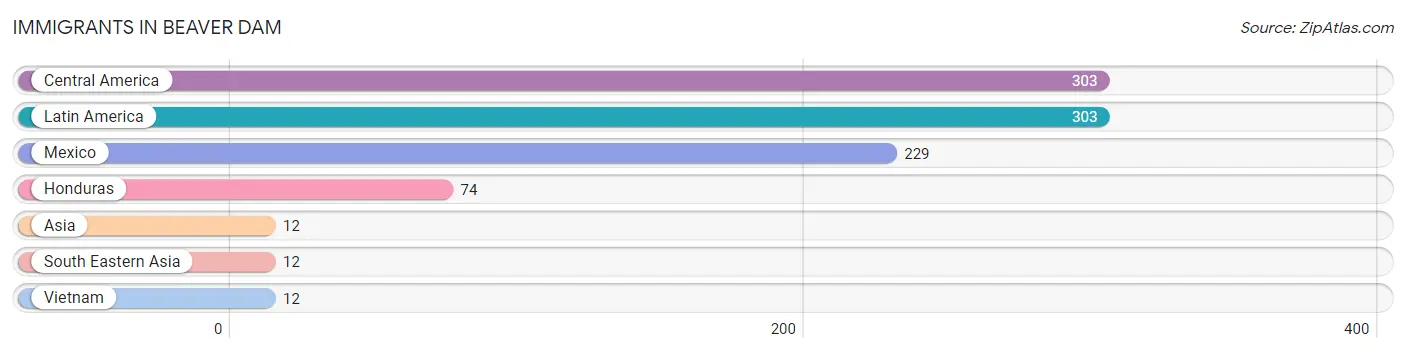
| Immigration Origin | # Population | % Population |
| Asia | 12 | 0.3% |
| Central America | 303 | 8.6% |
| Honduras | 74 | 2.1% |
| Latin America | 303 | 8.6% |
| Mexico | 229 | 6.5% |
| South Eastern Asia | 12 | 0.3% |
| Vietnam | 12 | 0.3% | View All 7 Rows |
Sex and Age in Beaver Dam
Sex and Age in Beaver Dam
The most populous age groups in Beaver Dam are 60 to 64 Years (279 | 14.1%) for men and 60 to 64 Years (319 | 20.5%) for women.
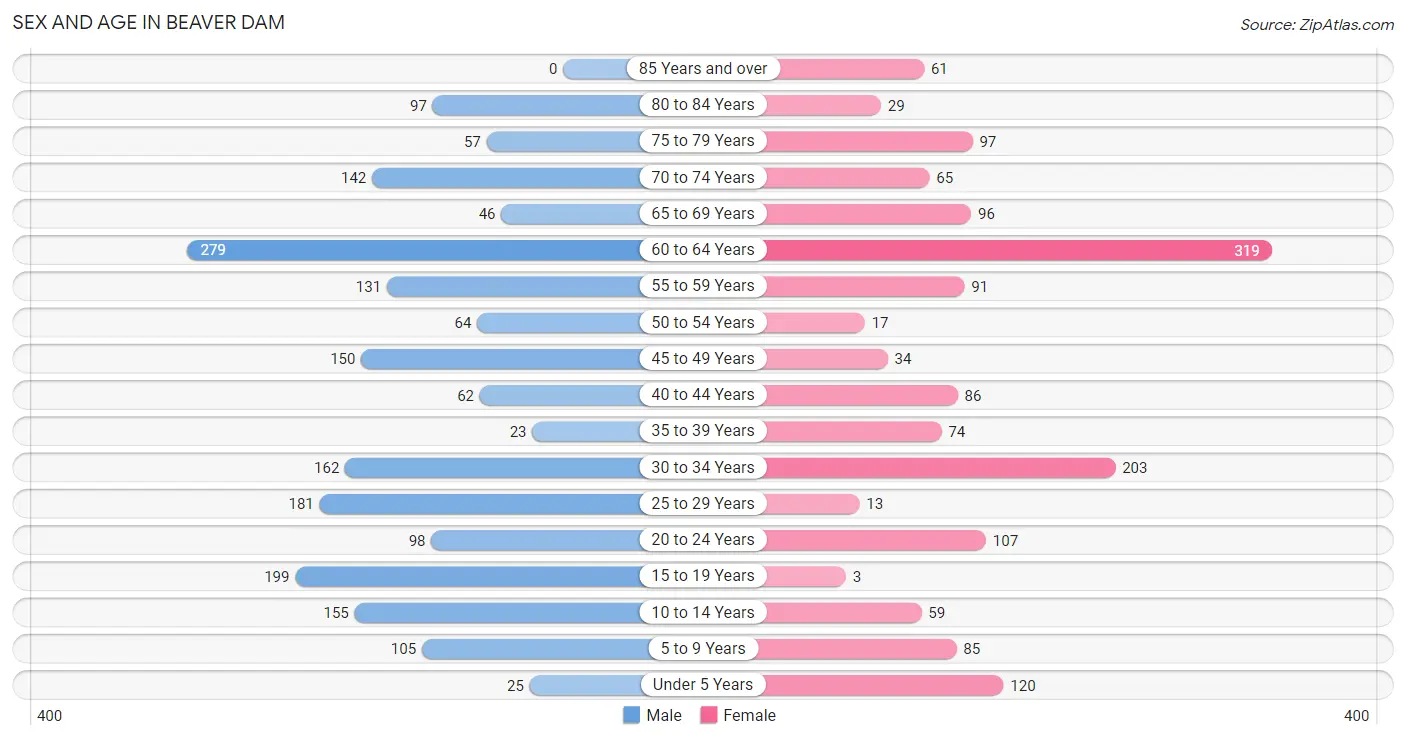
| Age Bracket | Male | Female |
| Under 5 Years | 25 (1.3%) | 120 (7.7%) |
| 5 to 9 Years | 105 (5.3%) | 85 (5.4%) |
| 10 to 14 Years | 155 (7.8%) | 59 (3.8%) |
| 15 to 19 Years | 199 (10.1%) | 3 (0.2%) |
| 20 to 24 Years | 98 (5.0%) | 107 (6.9%) |
| 25 to 29 Years | 181 (9.2%) | 13 (0.8%) |
| 30 to 34 Years | 162 (8.2%) | 203 (13.0%) |
| 35 to 39 Years | 23 (1.2%) | 74 (4.8%) |
| 40 to 44 Years | 62 (3.1%) | 86 (5.5%) |
| 45 to 49 Years | 150 (7.6%) | 34 (2.2%) |
| 50 to 54 Years | 64 (3.2%) | 17 (1.1%) |
| 55 to 59 Years | 131 (6.6%) | 91 (5.8%) |
| 60 to 64 Years | 279 (14.1%) | 319 (20.5%) |
| 65 to 69 Years | 46 (2.3%) | 96 (6.2%) |
| 70 to 74 Years | 142 (7.2%) | 65 (4.2%) |
| 75 to 79 Years | 57 (2.9%) | 97 (6.2%) |
| 80 to 84 Years | 97 (4.9%) | 29 (1.9%) |
| 85 Years and over | 0 (0.0%) | 61 (3.9%) |
| Total | 1,976 (100.0%) | 1,559 (100.0%) |
Families and Households in Beaver Dam
Median Family Size in Beaver Dam
The median family size in Beaver Dam is 2.91 persons per family, with single female/mother families (137 | 14.1%) accounting for the largest median family size of 3.01 persons per family. On the other hand, single male/father families (172 | 17.7%) represent the smallest median family size with 2.55 persons per family.
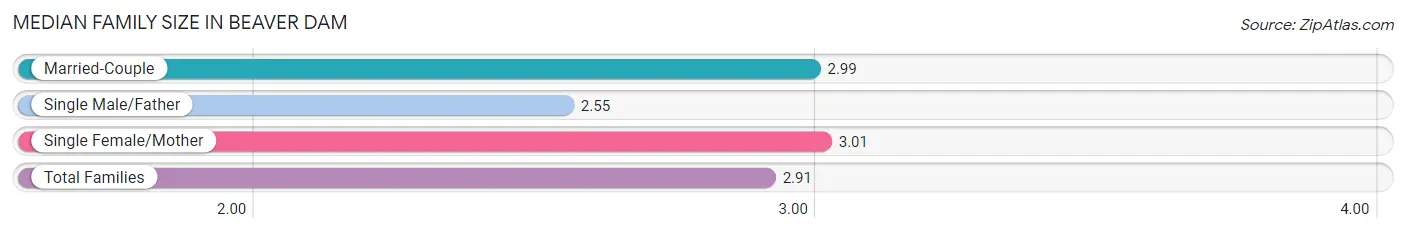
| Family Type | # Families | Family Size |
| Married-Couple | 662 (68.2%) | 2.99 |
| Single Male/Father | 172 (17.7%) | 2.55 |
| Single Female/Mother | 137 (14.1%) | 3.01 |
| Total Families | 971 (100.0%) | 2.91 |
Median Household Size in Beaver Dam
The median household size in Beaver Dam is 2.40 persons per household, with single female/mother households (137 | 9.3%) accounting for the largest median household size of 3.26 persons per household. non-family households (501 | 34.0%) represent the smallest median household size with 1.25 persons per household.
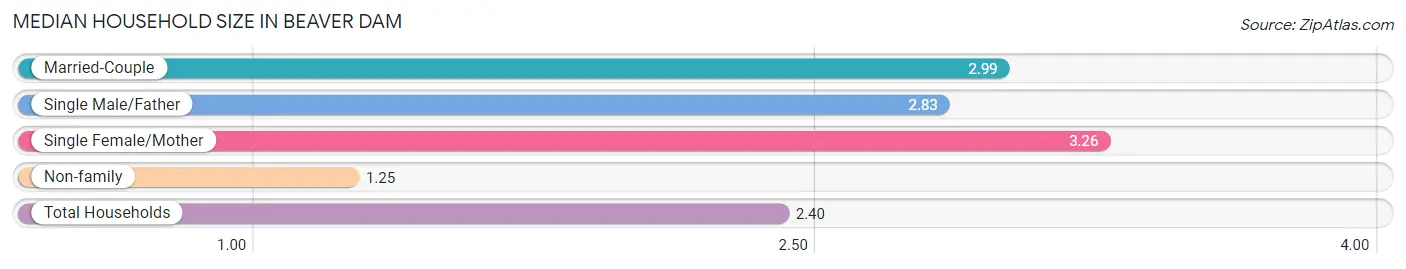
| Household Type | # Households | Household Size |
| Married-Couple | 662 (45.0%) | 2.99 |
| Single Male/Father | 172 (11.7%) | 2.83 |
| Single Female/Mother | 137 (9.3%) | 3.26 |
| Non-family | 501 (34.0%) | 1.25 |
| Total Households | 1,472 (100.0%) | 2.40 |
Household Size by Marriage Status in Beaver Dam
Out of a total of 1,472 households in Beaver Dam, 971 (66.0%) are family households, while 501 (34.0%) are nonfamily households. The most numerous type of family households are 2-person households, comprising 501, and the most common type of nonfamily households are 1-person households, comprising 265.
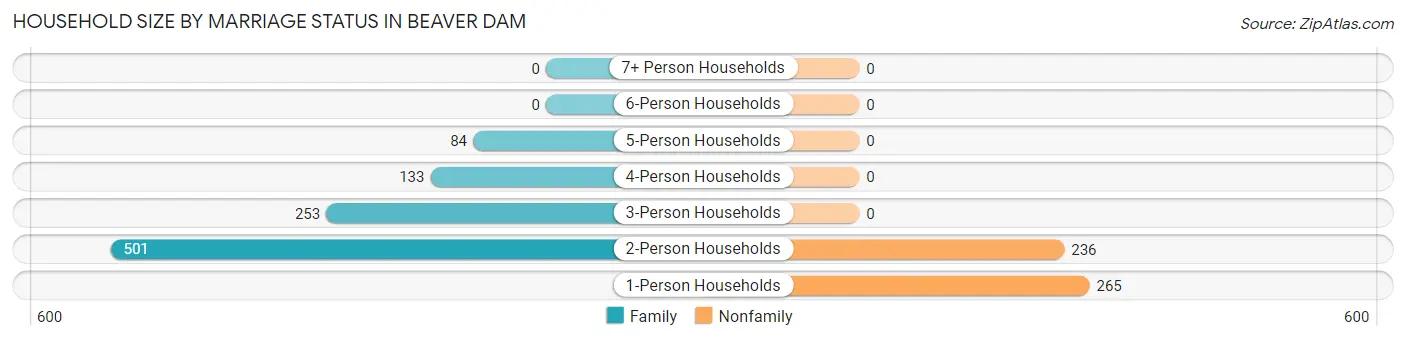
| Household Size | Family Households | Nonfamily Households |
| 1-Person Households | - | 265 (18.0%) |
| 2-Person Households | 501 (34.0%) | 236 (16.0%) |
| 3-Person Households | 253 (17.2%) | 0 (0.0%) |
| 4-Person Households | 133 (9.0%) | 0 (0.0%) |
| 5-Person Households | 84 (5.7%) | 0 (0.0%) |
| 6-Person Households | 0 (0.0%) | 0 (0.0%) |
| 7+ Person Households | 0 (0.0%) | 0 (0.0%) |
| Total | 971 (66.0%) | 501 (34.0%) |
Female Fertility in Beaver Dam
Fertility by Age in Beaver Dam
Average fertility rate in Beaver Dam is 94.0 births per 1,000 women. Women in the age bracket of 20 to 34 years have the highest fertility rate with 152.0 births per 1,000 women. Women in the age bracket of 20 to 34 years acount for 100.0% of all women with births.
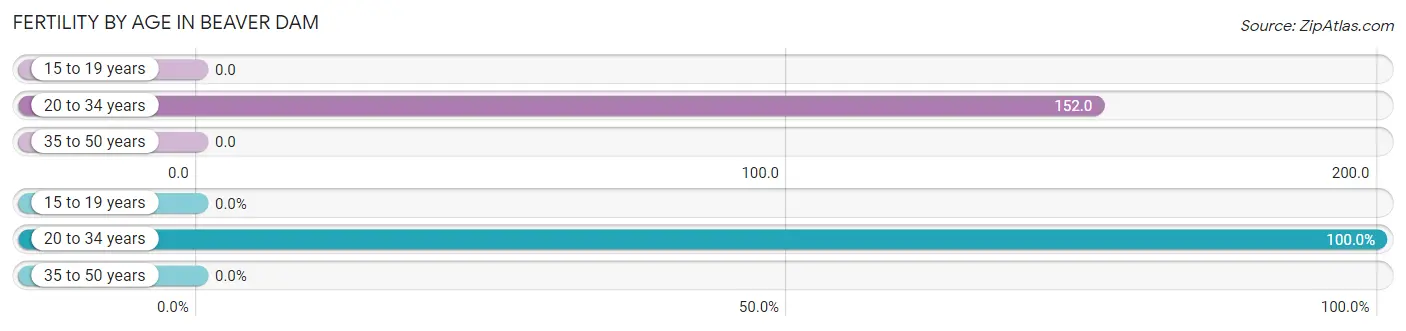
| Age Bracket | Women with Births | Births / 1,000 Women |
| 15 to 19 years | 0 (0.0%) | 0.0 |
| 20 to 34 years | 49 (100.0%) | 152.0 |
| 35 to 50 years | 0 (0.0%) | 0.0 |
| Total | 49 (100.0%) | 94.0 |
Fertility by Age by Marriage Status in Beaver Dam
77.6% of women with births (49) in Beaver Dam are married. The highest percentage of unmarried women with births falls into 20 to 34 years age bracket with 22.5% of them unmarried at the time of birth, while the lowest percentage of unmarried women with births belong to 20 to 34 years age bracket with 22.5% of them unmarried.
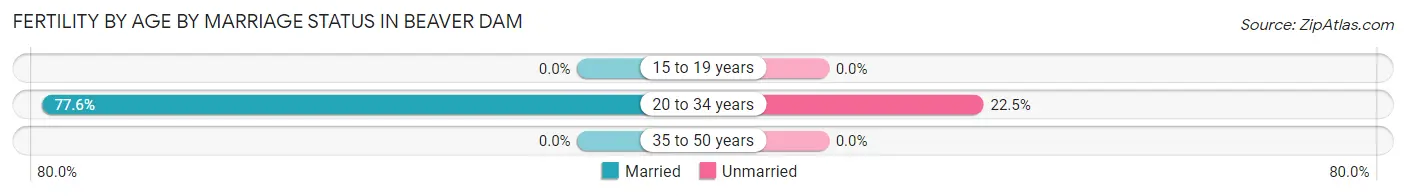
| Age Bracket | Married | Unmarried |
| 15 to 19 years | 0 (0.0%) | 0 (0.0%) |
| 20 to 34 years | 38 (77.5%) | 11 (22.5%) |
| 35 to 50 years | 0 (0.0%) | 0 (0.0%) |
| Total | 38 (77.5%) | 11 (22.5%) |
Fertility by Education in Beaver Dam
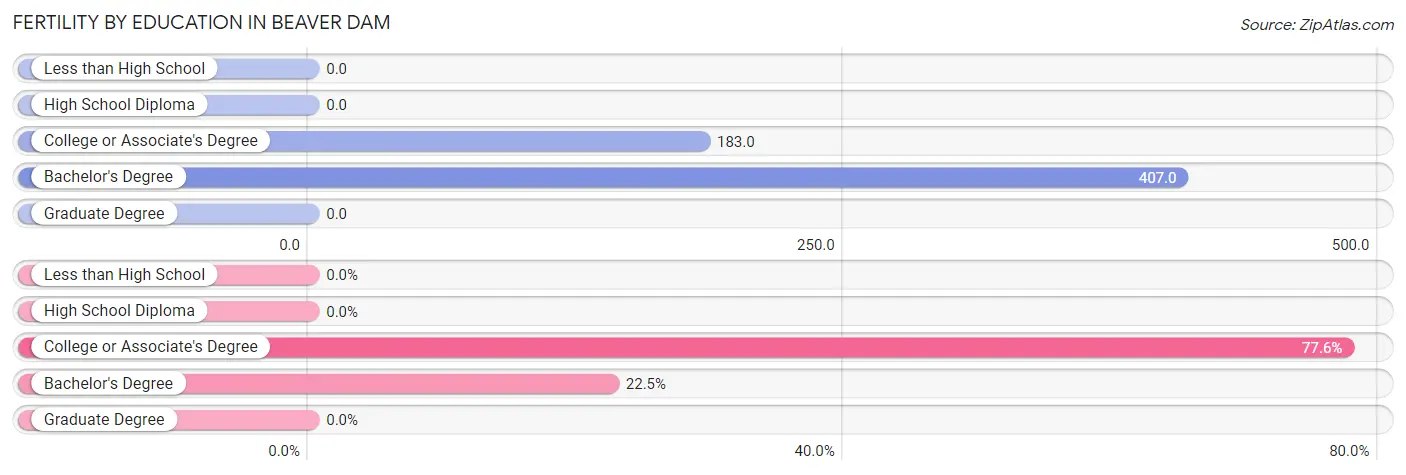
| Educational Attainment | Women with Births | Births / 1,000 Women |
| Less than High School | 0 (0.0%) | 0.0 |
| High School Diploma | 0 (0.0%) | 0.0 |
| College or Associate's Degree | 38 (77.5%) | 183.0 |
| Bachelor's Degree | 11 (22.5%) | 407.0 |
| Graduate Degree | 0 (0.0%) | 0.0 |
| Total | 49 (100.0%) | 94.0 |
Fertility by Education by Marriage Status in Beaver Dam
22.5% of women with births in Beaver Dam are unmarried. Women with the educational attainment of college or associate's degree are most likely to be married with 100.0% of them married at childbirth, while women with the educational attainment of bachelor's degree are least likely to be married with 100.0% of them unmarried at childbirth.
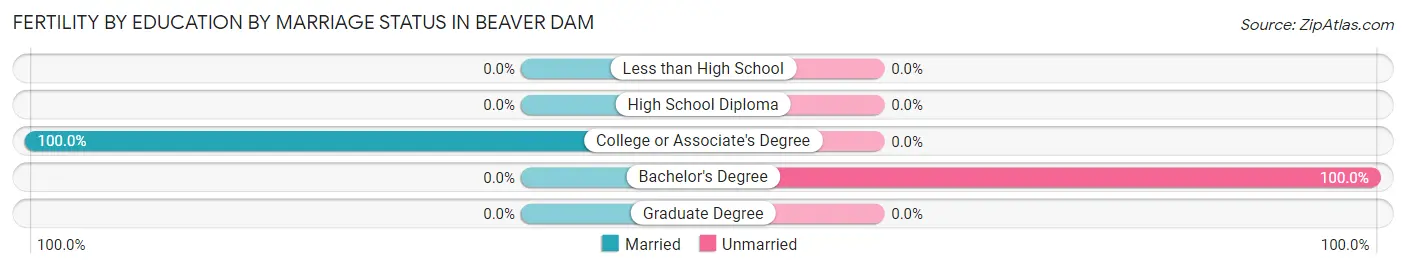
| Educational Attainment | Married | Unmarried |
| Less than High School | 0 (0.0%) | 0 (0.0%) |
| High School Diploma | 0 (0.0%) | 0 (0.0%) |
| College or Associate's Degree | 38 (100.0%) | 0 (0.0%) |
| Bachelor's Degree | 0 (0.0%) | 11 (100.0%) |
| Graduate Degree | 0 (0.0%) | 0 (0.0%) |
| Total | 38 (77.5%) | 11 (22.5%) |
Employment Characteristics in Beaver Dam
Employment by Class of Employer in Beaver Dam
Among the 1,189 employed individuals in Beaver Dam, private company employees (834 | 70.1%), not-for-profit organizations (194 | 16.3%), and local government employees (75 | 6.3%) make up the most common classes of employment.
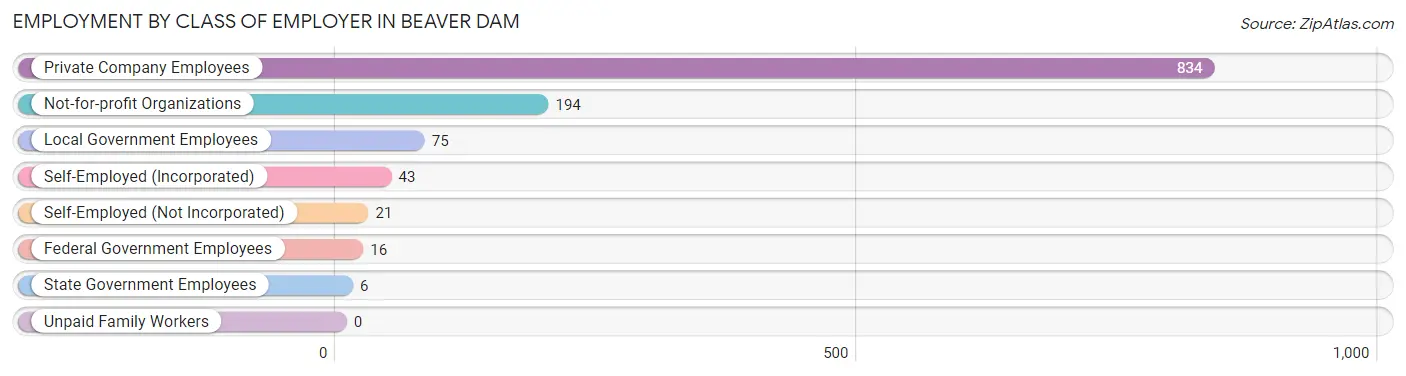
| Employer Class | # Employees | % Employees |
| Private Company Employees | 834 | 70.1% |
| Self-Employed (Incorporated) | 43 | 3.6% |
| Self-Employed (Not Incorporated) | 21 | 1.8% |
| Not-for-profit Organizations | 194 | 16.3% |
| Local Government Employees | 75 | 6.3% |
| State Government Employees | 6 | 0.5% |
| Federal Government Employees | 16 | 1.3% |
| Unpaid Family Workers | 0 | 0.0% |
| Total | 1,189 | 100.0% |
Employment Status by Age in Beaver Dam
According to the labor force statistics for Beaver Dam, out of the total population over 16 years of age (2,967), 51.8% or 1,537 individuals are in the labor force, with 8.8% or 135 of them unemployed. The age group with the highest labor force participation rate is 30 to 34 years, with 82.2% or 300 individuals in the labor force. Within the labor force, the 25 to 29 years age range has the highest percentage of unemployed individuals, with 100.0% or 13 of them being unemployed.
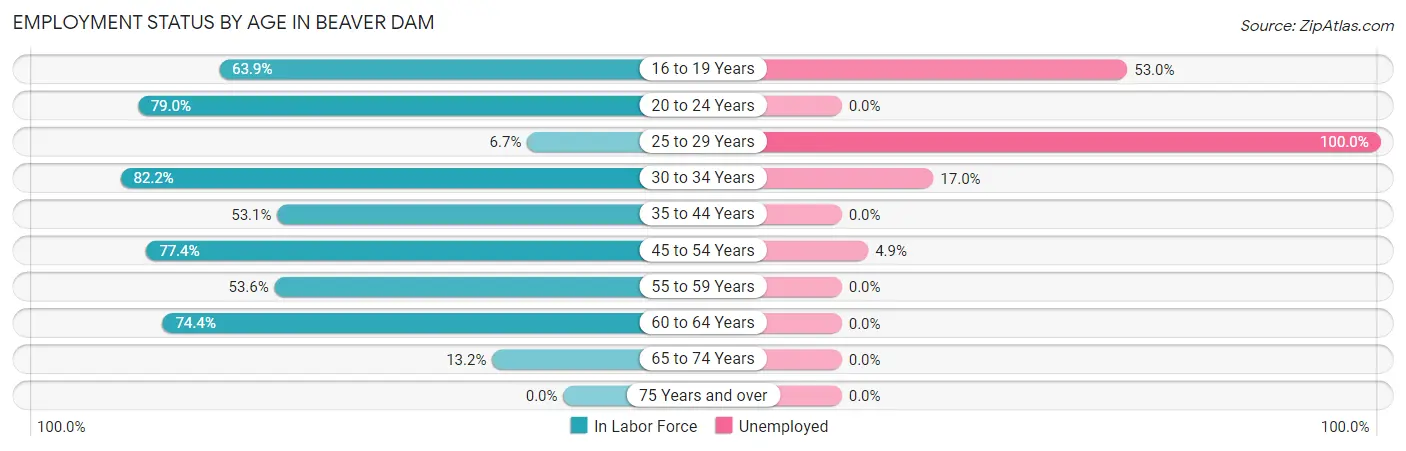
| Age Bracket | In Labor Force | Unemployed |
| 16 to 19 Years | 117 (63.9%) | 62 (53.0%) |
| 20 to 24 Years | 162 (79.0%) | 0 (0.0%) |
| 25 to 29 Years | 13 (6.7%) | 13 (100.0%) |
| 30 to 34 Years | 300 (82.2%) | 51 (17.0%) |
| 35 to 44 Years | 130 (53.1%) | 0 (0.0%) |
| 45 to 54 Years | 205 (77.4%) | 10 (4.9%) |
| 55 to 59 Years | 119 (53.6%) | 0 (0.0%) |
| 60 to 64 Years | 445 (74.4%) | 0 (0.0%) |
| 65 to 74 Years | 46 (13.2%) | 0 (0.0%) |
| 75 Years and over | 0 (0.0%) | 0 (0.0%) |
| Total | 1,537 (51.8%) | 135 (8.8%) |
Employment Status by Educational Attainment in Beaver Dam
According to labor force statistics for Beaver Dam, 64.2% of individuals (1,213) out of the total population between 25 and 64 years of age (1,889) are in the labor force, with 6.1% or 74 of them being unemployed. The group with the highest labor force participation rate are those with the educational attainment of bachelor's degree or higher, with 94.6% or 194 individuals in the labor force. Within the labor force, individuals with high school diploma education have the highest percentage of unemployment, with 15.1% or 64 of them being unemployed.
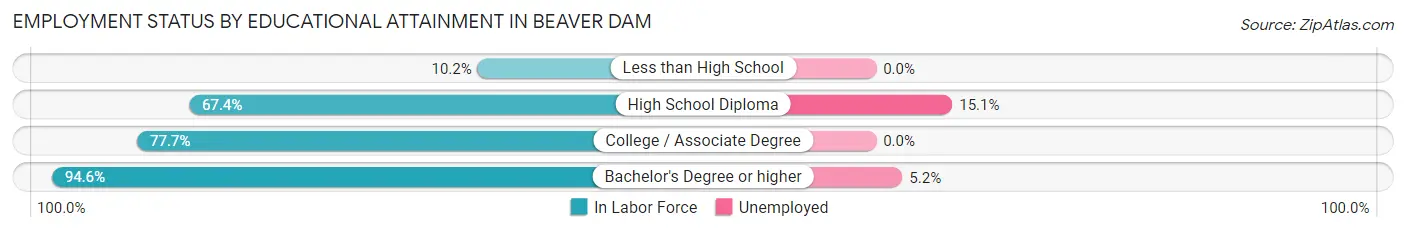
| Educational Attainment | In Labor Force | Unemployed |
| Less than High School | 34 (10.2%) | 0 (0.0%) |
| High School Diploma | 423 (67.4%) | 95 (15.1%) |
| College / Associate Degree | 561 (77.7%) | 0 (0.0%) |
| Bachelor's Degree or higher | 194 (94.6%) | 11 (5.2%) |
| Total | 1,213 (64.2%) | 115 (6.1%) |
Employment Occupations by Sex in Beaver Dam
Management, Business, Science and Arts Occupations
The most common Management, Business, Science and Arts occupations in Beaver Dam are Community & Social Service (287 | 20.5%), Education Instruction & Library (201 | 14.3%), Computers, Engineering & Science (139 | 9.9%), Architecture & Engineering (113 | 8.1%), and Health Diagnosing & Treating (93 | 6.6%).
Management, Business, Science and Arts Occupations by Sex
Within the Management, Business, Science and Arts occupations in Beaver Dam, the most male-oriented occupations are Computers & Mathematics (100.0%), Architecture & Engineering (100.0%), and Education, Arts & Media (100.0%), while the most female-oriented occupations are Business & Financial (100.0%), Life, Physical & Social Science (100.0%), and Education Instruction & Library (100.0%).
| Occupation | Male | Female |
| Management | 5 (35.7%) | 9 (64.3%) |
| Business & Financial | 0 (0.0%) | 10 (100.0%) |
| Computers, Engineering & Science | 131 (94.2%) | 8 (5.8%) |
| Computers & Mathematics | 18 (100.0%) | 0 (0.0%) |
| Architecture & Engineering | 113 (100.0%) | 0 (0.0%) |
| Life, Physical & Social Science | 0 (0.0%) | 8 (100.0%) |
| Community & Social Service | 86 (30.0%) | 201 (70.0%) |
| Education, Arts & Media | 86 (100.0%) | 0 (0.0%) |
| Legal Services & Support | 0 (0.0%) | 0 (0.0%) |
| Education Instruction & Library | 0 (0.0%) | 201 (100.0%) |
| Arts, Media & Entertainment | 0 (0.0%) | 0 (0.0%) |
| Health Diagnosing & Treating | 8 (8.6%) | 85 (91.4%) |
| Health Technologists | 0 (0.0%) | 17 (100.0%) |
| Total (Category) | 230 (42.4%) | 313 (57.6%) |
| Total (Overall) | 841 (60.0%) | 560 (40.0%) |
Services Occupations
The most common Services occupations in Beaver Dam are Security & Protection (71 | 5.1%), Firefighting & Prevention (71 | 5.1%), Healthcare Support (70 | 5.0%), Cleaning & Maintenance (56 | 4.0%), and Food Preparation & Serving (52 | 3.7%).
Services Occupations by Sex
Within the Services occupations in Beaver Dam, the most male-oriented occupations are Food Preparation & Serving (100.0%), Security & Protection (80.3%), and Firefighting & Prevention (80.3%), while the most female-oriented occupations are Healthcare Support (100.0%), Cleaning & Maintenance (39.3%), and Security & Protection (19.7%).
| Occupation | Male | Female |
| Healthcare Support | 0 (0.0%) | 70 (100.0%) |
| Security & Protection | 57 (80.3%) | 14 (19.7%) |
| Firefighting & Prevention | 57 (80.3%) | 14 (19.7%) |
| Law Enforcement | 0 (0.0%) | 0 (0.0%) |
| Food Preparation & Serving | 52 (100.0%) | 0 (0.0%) |
| Cleaning & Maintenance | 34 (60.7%) | 22 (39.3%) |
| Personal Care & Service | 0 (0.0%) | 0 (0.0%) |
| Total (Category) | 143 (57.4%) | 106 (42.6%) |
| Total (Overall) | 841 (60.0%) | 560 (40.0%) |
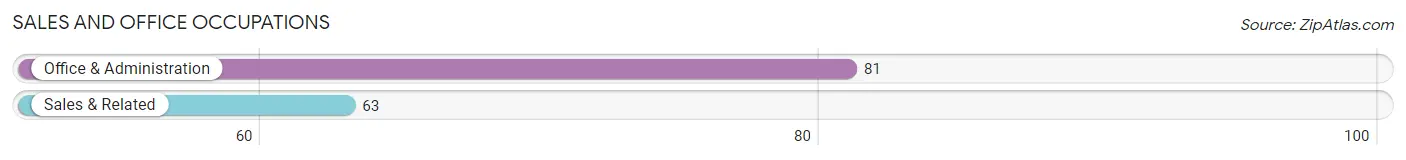
Sales and Office Occupations
The most common Sales and Office occupations in Beaver Dam are Office & Administration (81 | 5.8%), and Sales & Related (63 | 4.5%).
Sales and Office Occupations by Sex
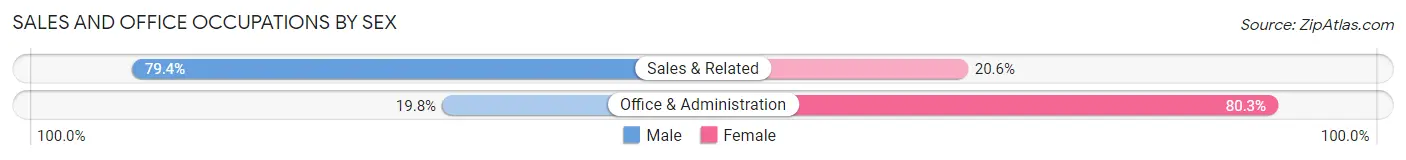
| Occupation | Male | Female |
| Sales & Related | 50 (79.4%) | 13 (20.6%) |
| Office & Administration | 16 (19.8%) | 65 (80.2%) |
| Total (Category) | 66 (45.8%) | 78 (54.2%) |
| Total (Overall) | 841 (60.0%) | 560 (40.0%) |
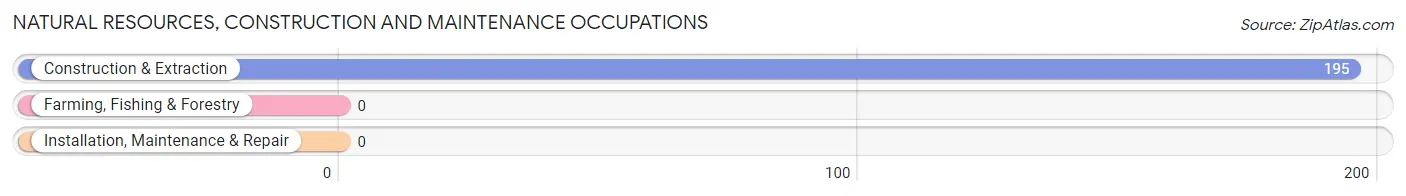
Natural Resources, Construction and Maintenance Occupations
The most common Natural Resources, Construction and Maintenance occupations in Beaver Dam are , and Construction & Extraction (195 | 13.9%).
Natural Resources, Construction and Maintenance Occupations by Sex
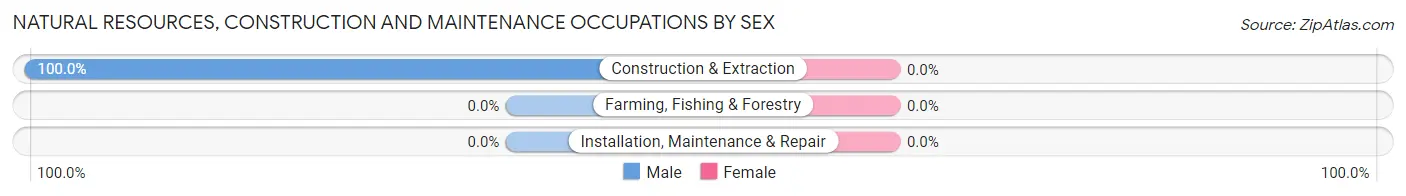
| Occupation | Male | Female |
| Farming, Fishing & Forestry | 0 (0.0%) | 0 (0.0%) |
| Construction & Extraction | 195 (100.0%) | 0 (0.0%) |
| Installation, Maintenance & Repair | 0 (0.0%) | 0 (0.0%) |
| Total (Category) | 195 (100.0%) | 0 (0.0%) |
| Total (Overall) | 841 (60.0%) | 560 (40.0%) |
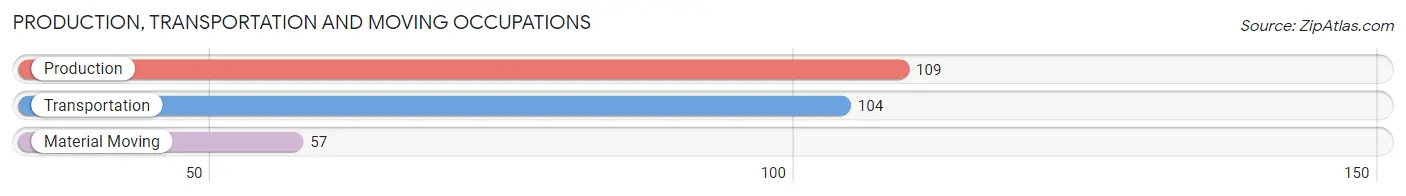
Production, Transportation and Moving Occupations
The most common Production, Transportation and Moving occupations in Beaver Dam are Production (109 | 7.8%), Transportation (104 | 7.4%), and Material Moving (57 | 4.1%).
Production, Transportation and Moving Occupations by Sex
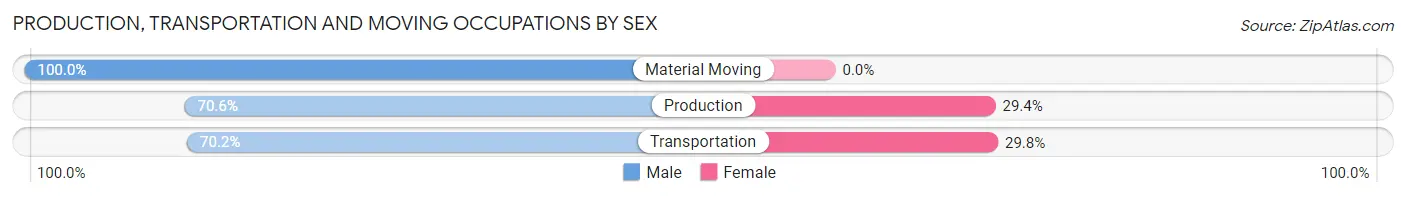
| Occupation | Male | Female |
| Production | 77 (70.6%) | 32 (29.4%) |
| Transportation | 73 (70.2%) | 31 (29.8%) |
| Material Moving | 57 (100.0%) | 0 (0.0%) |
| Total (Category) | 207 (76.7%) | 63 (23.3%) |
| Total (Overall) | 841 (60.0%) | 560 (40.0%) |
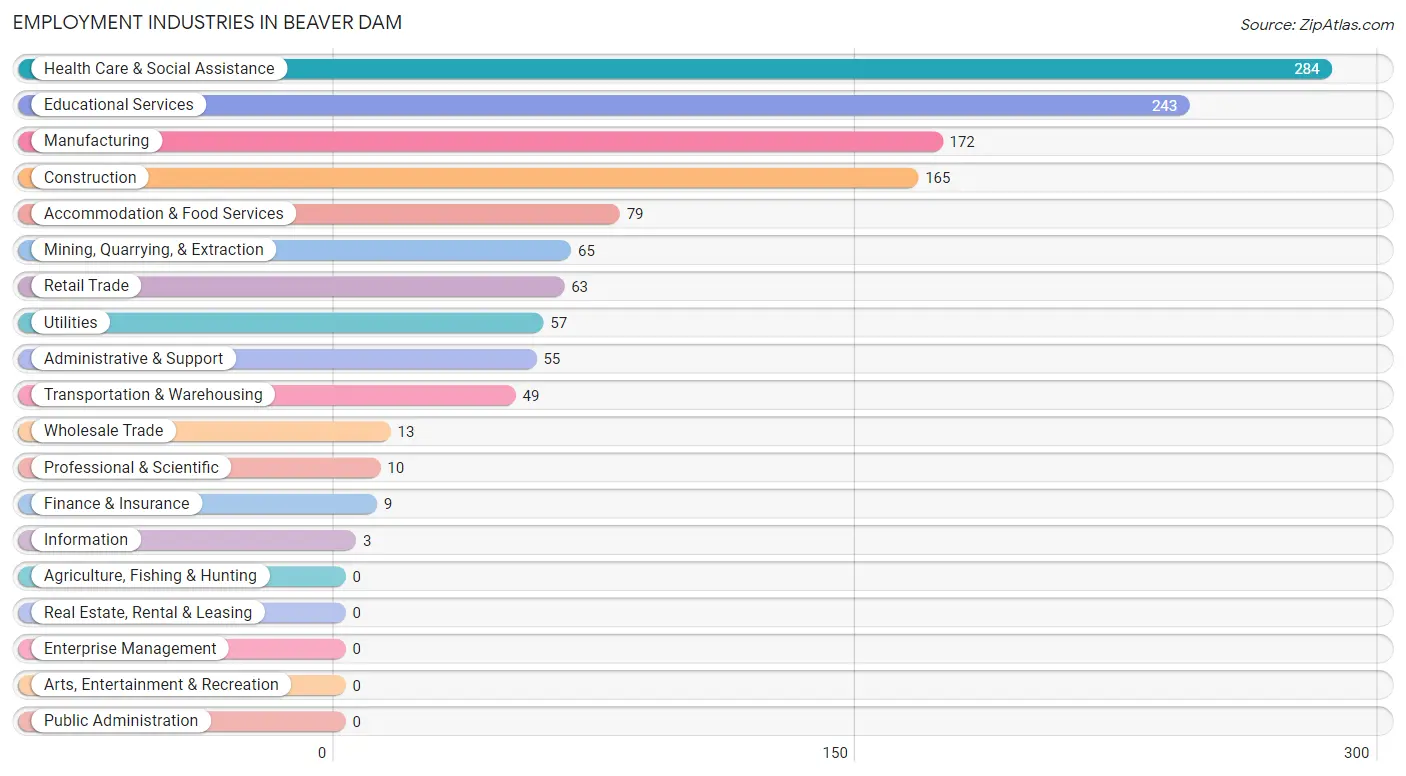
Employment Industries by Sex in Beaver Dam
Employment Industries in Beaver Dam
The major employment industries in Beaver Dam include Health Care & Social Assistance (284 | 20.3%), Educational Services (243 | 17.3%), Manufacturing (172 | 12.3%), Construction (165 | 11.8%), and Accommodation & Food Services (79 | 5.6%).
Employment Industries by Sex in Beaver Dam
The Beaver Dam industries that see more men than women are Mining, Quarrying, & Extraction (100.0%), Construction (100.0%), and Transportation & Warehousing (100.0%), whereas the industries that tend to have a higher number of women are Wholesale Trade (100.0%), Information (100.0%), and Finance & Insurance (100.0%).
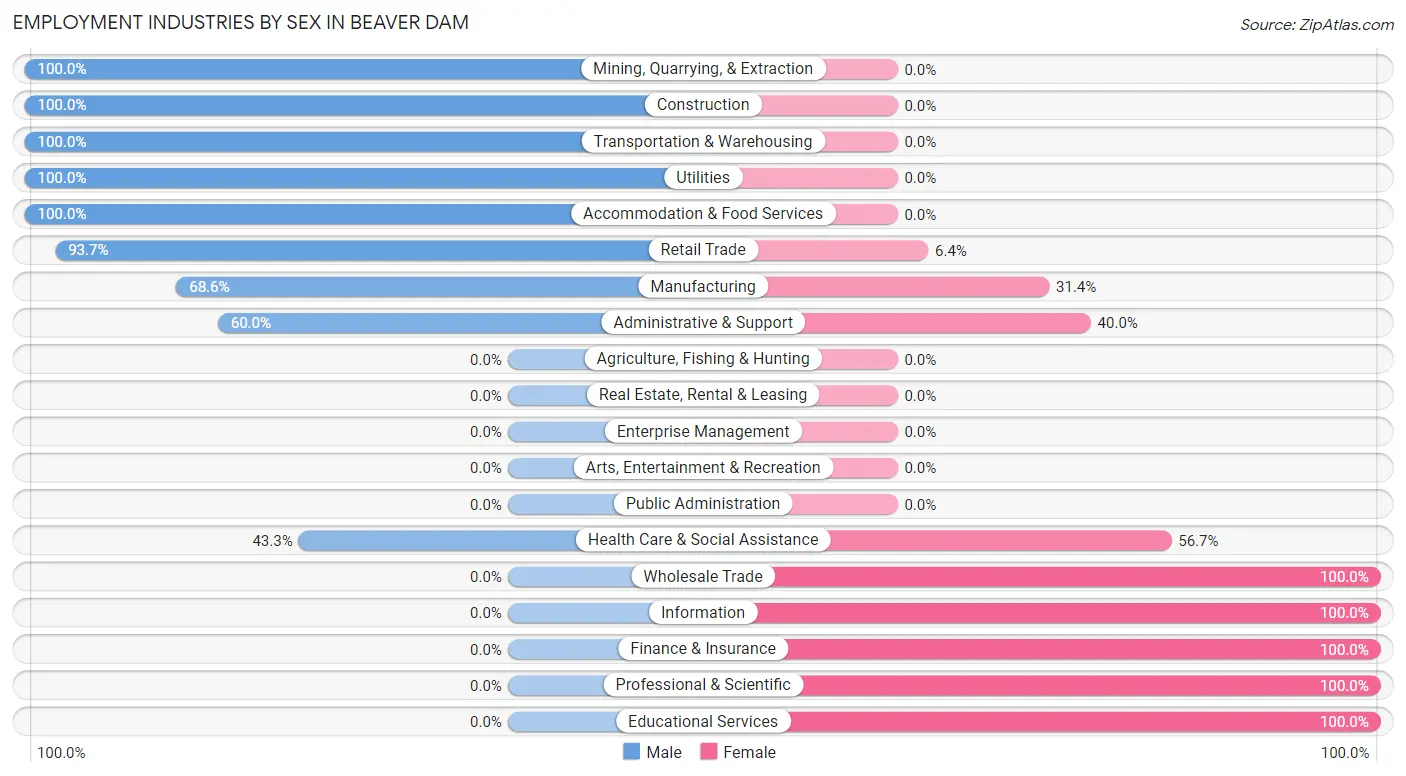
| Industry | Male | Female |
| Agriculture, Fishing & Hunting | 0 (0.0%) | 0 (0.0%) |
| Mining, Quarrying, & Extraction | 65 (100.0%) | 0 (0.0%) |
| Construction | 165 (100.0%) | 0 (0.0%) |
| Manufacturing | 118 (68.6%) | 54 (31.4%) |
| Wholesale Trade | 0 (0.0%) | 13 (100.0%) |
| Retail Trade | 59 (93.6%) | 4 (6.4%) |
| Transportation & Warehousing | 49 (100.0%) | 0 (0.0%) |
| Utilities | 57 (100.0%) | 0 (0.0%) |
| Information | 0 (0.0%) | 3 (100.0%) |
| Finance & Insurance | 0 (0.0%) | 9 (100.0%) |
| Real Estate, Rental & Leasing | 0 (0.0%) | 0 (0.0%) |
| Professional & Scientific | 0 (0.0%) | 10 (100.0%) |
| Enterprise Management | 0 (0.0%) | 0 (0.0%) |
| Administrative & Support | 33 (60.0%) | 22 (40.0%) |
| Educational Services | 0 (0.0%) | 243 (100.0%) |
| Health Care & Social Assistance | 123 (43.3%) | 161 (56.7%) |
| Arts, Entertainment & Recreation | 0 (0.0%) | 0 (0.0%) |
| Accommodation & Food Services | 79 (100.0%) | 0 (0.0%) |
| Public Administration | 0 (0.0%) | 0 (0.0%) |
| Total | 841 (60.0%) | 560 (40.0%) |
Education in Beaver Dam
School Enrollment in Beaver Dam
The most common levels of schooling among the 806 students in Beaver Dam are high school (228 | 28.3%), elementary school (176 | 21.8%), and middle school (169 | 21.0%).
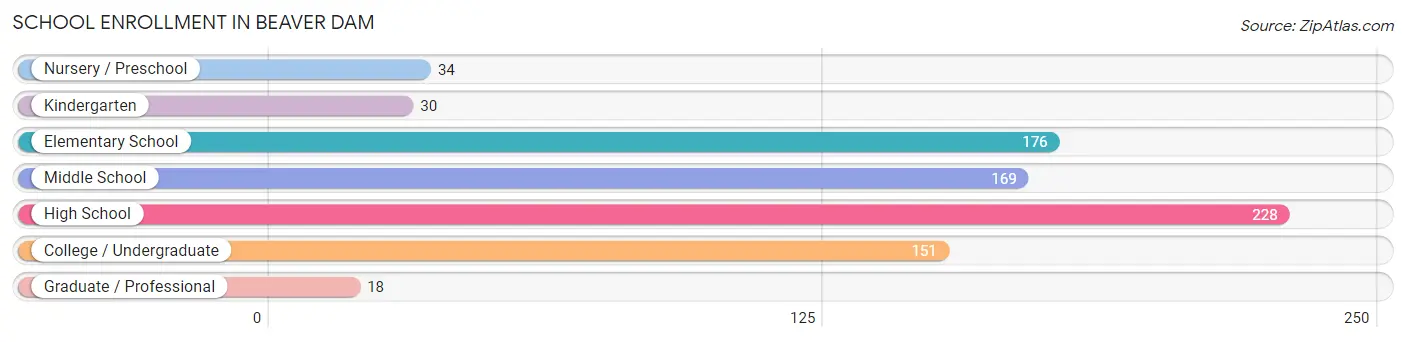
| School Level | # Students | % Students |
| Nursery / Preschool | 34 | 4.2% |
| Kindergarten | 30 | 3.7% |
| Elementary School | 176 | 21.8% |
| Middle School | 169 | 21.0% |
| High School | 228 | 28.3% |
| College / Undergraduate | 151 | 18.7% |
| Graduate / Professional | 18 | 2.2% |
| Total | 806 | 100.0% |
School Enrollment by Age by Funding Source in Beaver Dam
Out of a total of 806 students who are enrolled in schools in Beaver Dam, 52 (6.5%) attend a private institution, while the remaining 754 (93.5%) are enrolled in public schools. The age group of 15 to 17 year olds has the highest likelihood of being enrolled in private schools, with 52 (34.2% in the age bracket) enrolled. Conversely, the age group of 3 to 4 year olds has the lowest likelihood of being enrolled in a private school, with 34 (100.0% in the age bracket) attending a public institution.
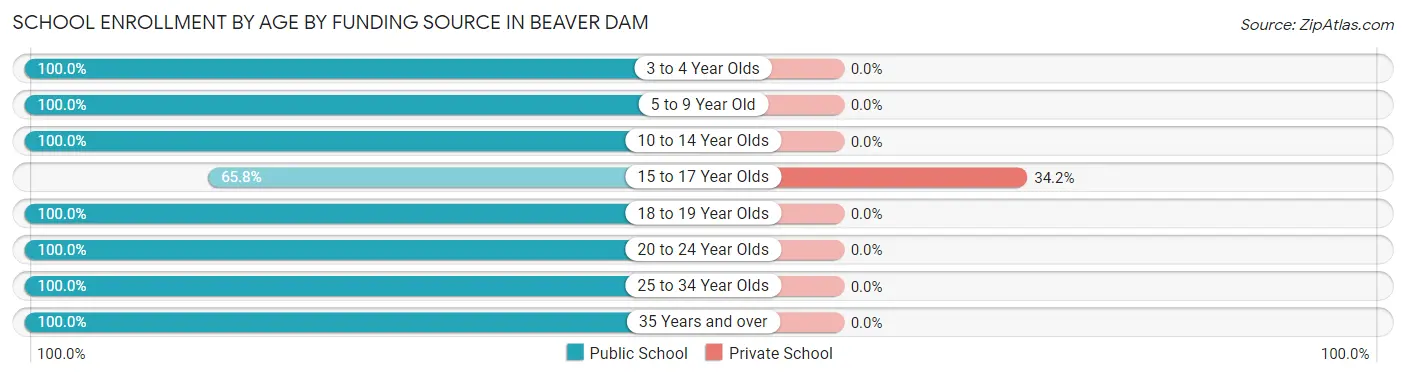
| Age Bracket | Public School | Private School |
| 3 to 4 Year Olds | 34 (100.0%) | 0 (0.0%) |
| 5 to 9 Year Old | 190 (100.0%) | 0 (0.0%) |
| 10 to 14 Year Olds | 214 (100.0%) | 0 (0.0%) |
| 15 to 17 Year Olds | 100 (65.8%) | 52 (34.2%) |
| 18 to 19 Year Olds | 50 (100.0%) | 0 (0.0%) |
| 20 to 24 Year Olds | 132 (100.0%) | 0 (0.0%) |
| 25 to 34 Year Olds | 18 (100.0%) | 0 (0.0%) |
| 35 Years and over | 16 (100.0%) | 0 (0.0%) |
| Total | 754 (93.5%) | 52 (6.5%) |
Educational Attainment by Field of Study in Beaver Dam
Liberal arts & history (86 | 19.7%), science & technology (62 | 14.2%), psychology (52 | 11.9%), multidisciplinary studies (50 | 11.5%), and engineering (43 | 9.9%) are the most common fields of study among 436 individuals in Beaver Dam who have obtained a bachelor's degree or higher.
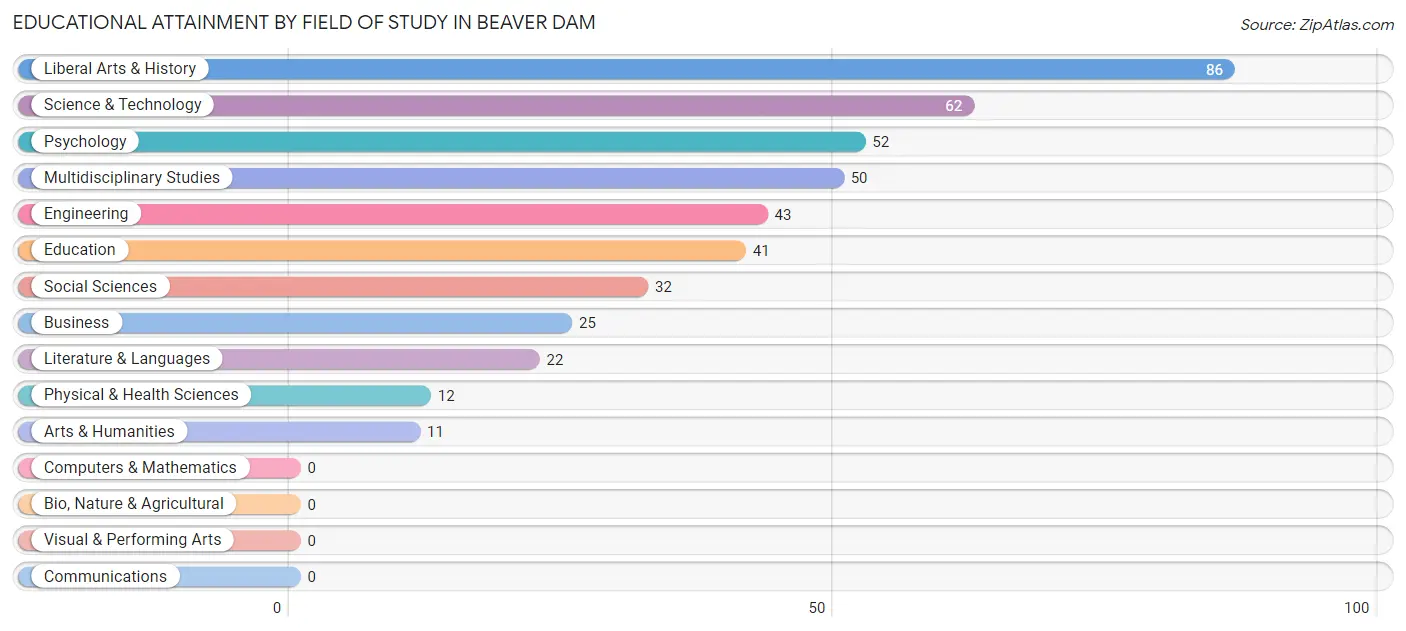
| Field of Study | # Graduates | % Graduates |
| Computers & Mathematics | 0 | 0.0% |
| Bio, Nature & Agricultural | 0 | 0.0% |
| Physical & Health Sciences | 12 | 2.8% |
| Psychology | 52 | 11.9% |
| Social Sciences | 32 | 7.3% |
| Engineering | 43 | 9.9% |
| Multidisciplinary Studies | 50 | 11.5% |
| Science & Technology | 62 | 14.2% |
| Business | 25 | 5.7% |
| Education | 41 | 9.4% |
| Literature & Languages | 22 | 5.1% |
| Liberal Arts & History | 86 | 19.7% |
| Visual & Performing Arts | 0 | 0.0% |
| Communications | 0 | 0.0% |
| Arts & Humanities | 11 | 2.5% |
| Total | 436 | 100.0% |
Transportation & Commute in Beaver Dam
Vehicle Availability by Sex in Beaver Dam
The most prevalent vehicle ownership categories in Beaver Dam are males with 2 vehicles (359, accounting for 44.4%) and females with 2 vehicles (89, making up 94.2%).
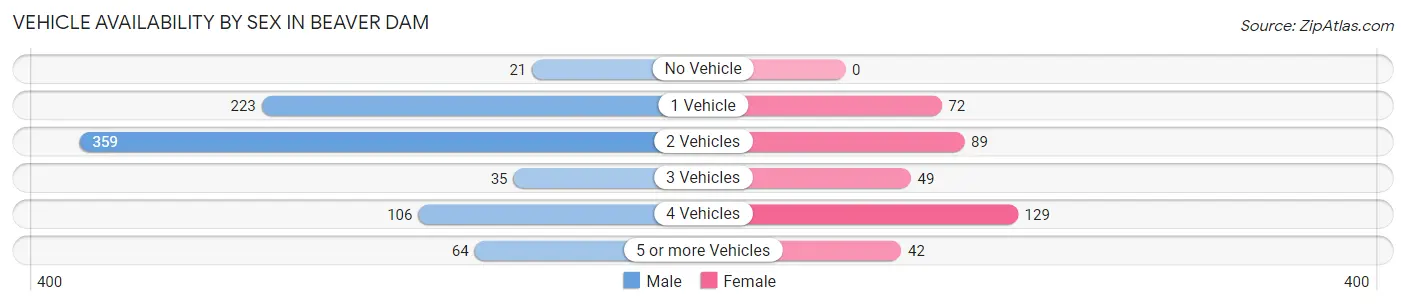
| Vehicles Available | Male | Female |
| No Vehicle | 21 (2.6%) | 0 (0.0%) |
| 1 Vehicle | 223 (27.6%) | 72 (18.9%) |
| 2 Vehicles | 359 (44.4%) | 89 (23.4%) |
| 3 Vehicles | 35 (4.3%) | 49 (12.9%) |
| 4 Vehicles | 106 (13.1%) | 129 (33.9%) |
| 5 or more Vehicles | 64 (7.9%) | 42 (11.0%) |
| Total | 808 (100.0%) | 381 (100.0%) |
Commute Time in Beaver Dam
The most frequently occuring commute durations in Beaver Dam are 10 to 14 minutes (245 commuters, 21.3%), 30 to 34 minutes (183 commuters, 15.9%), and 60 to 89 minutes (171 commuters, 14.9%).
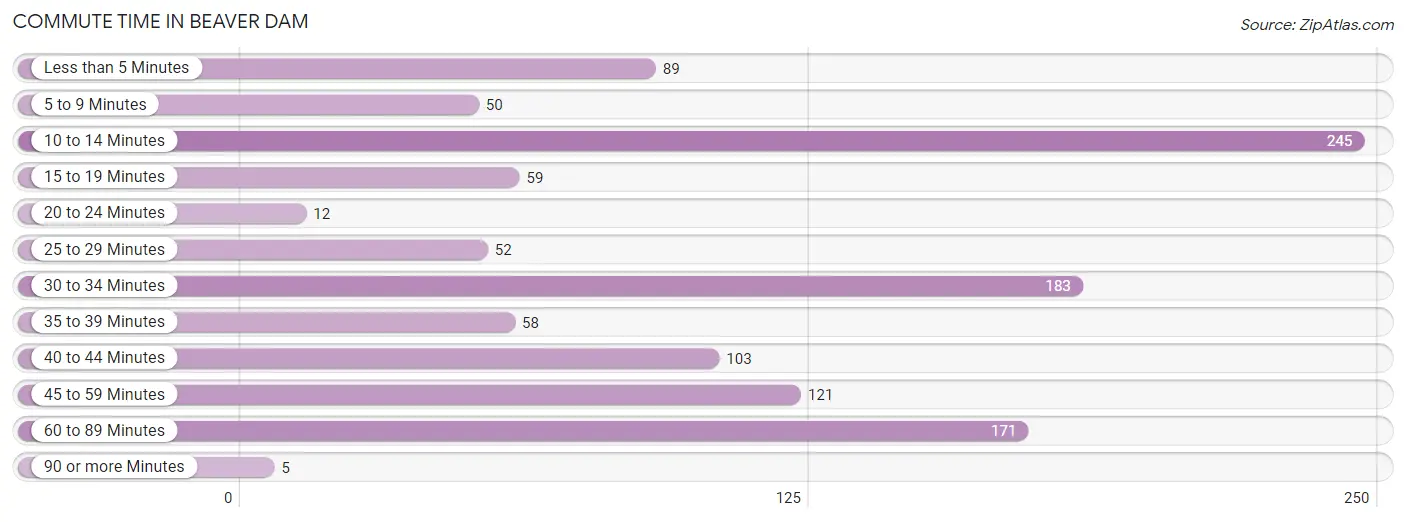
| Commute Time | # Commuters | % Commuters |
| Less than 5 Minutes | 89 | 7.7% |
| 5 to 9 Minutes | 50 | 4.4% |
| 10 to 14 Minutes | 245 | 21.3% |
| 15 to 19 Minutes | 59 | 5.1% |
| 20 to 24 Minutes | 12 | 1.1% |
| 25 to 29 Minutes | 52 | 4.5% |
| 30 to 34 Minutes | 183 | 15.9% |
| 35 to 39 Minutes | 58 | 5.1% |
| 40 to 44 Minutes | 103 | 9.0% |
| 45 to 59 Minutes | 121 | 10.5% |
| 60 to 89 Minutes | 171 | 14.9% |
| 90 or more Minutes | 5 | 0.4% |
Commute Time by Sex in Beaver Dam
The most common commute times in Beaver Dam are 10 to 14 minutes (173 commuters, 21.4%) for males and 10 to 14 minutes (72 commuters, 21.2%) for females.
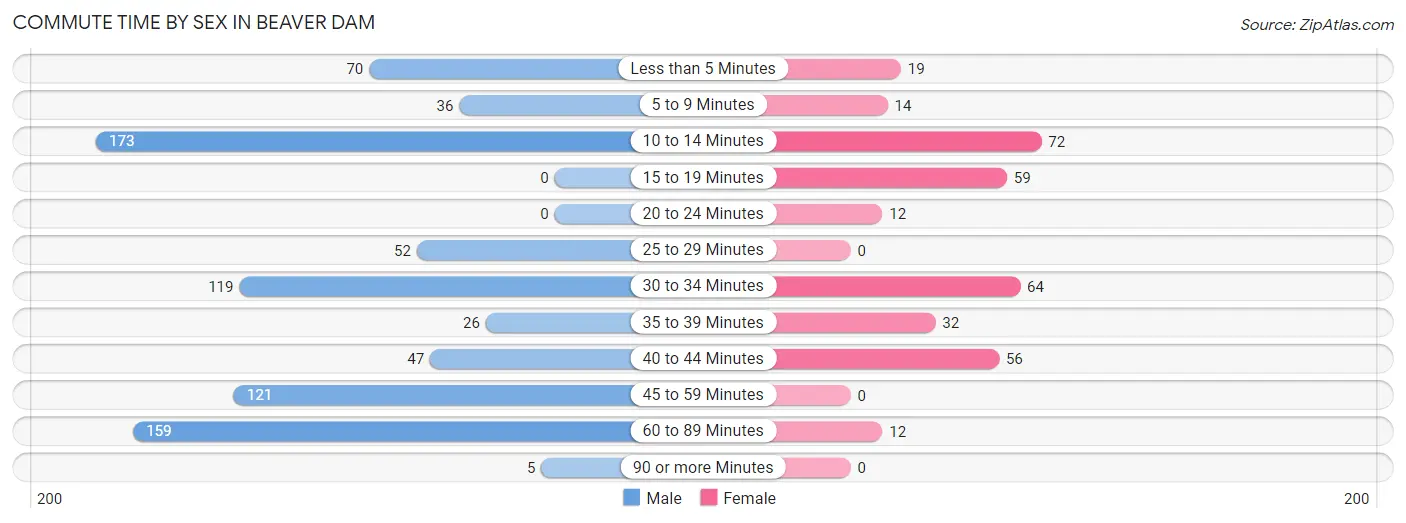
| Commute Time | Male | Female |
| Less than 5 Minutes | 70 (8.7%) | 19 (5.6%) |
| 5 to 9 Minutes | 36 (4.5%) | 14 (4.1%) |
| 10 to 14 Minutes | 173 (21.4%) | 72 (21.2%) |
| 15 to 19 Minutes | 0 (0.0%) | 59 (17.3%) |
| 20 to 24 Minutes | 0 (0.0%) | 12 (3.5%) |
| 25 to 29 Minutes | 52 (6.4%) | 0 (0.0%) |
| 30 to 34 Minutes | 119 (14.7%) | 64 (18.8%) |
| 35 to 39 Minutes | 26 (3.2%) | 32 (9.4%) |
| 40 to 44 Minutes | 47 (5.8%) | 56 (16.5%) |
| 45 to 59 Minutes | 121 (15.0%) | 0 (0.0%) |
| 60 to 89 Minutes | 159 (19.7%) | 12 (3.5%) |
| 90 or more Minutes | 5 (0.6%) | 0 (0.0%) |
Time of Departure to Work by Sex in Beaver Dam
The most frequent times of departure to work in Beaver Dam are 9:00 AM to 9:59 AM (138, 17.1%) for males and 7:30 AM to 7:59 AM (76, 22.4%) for females.
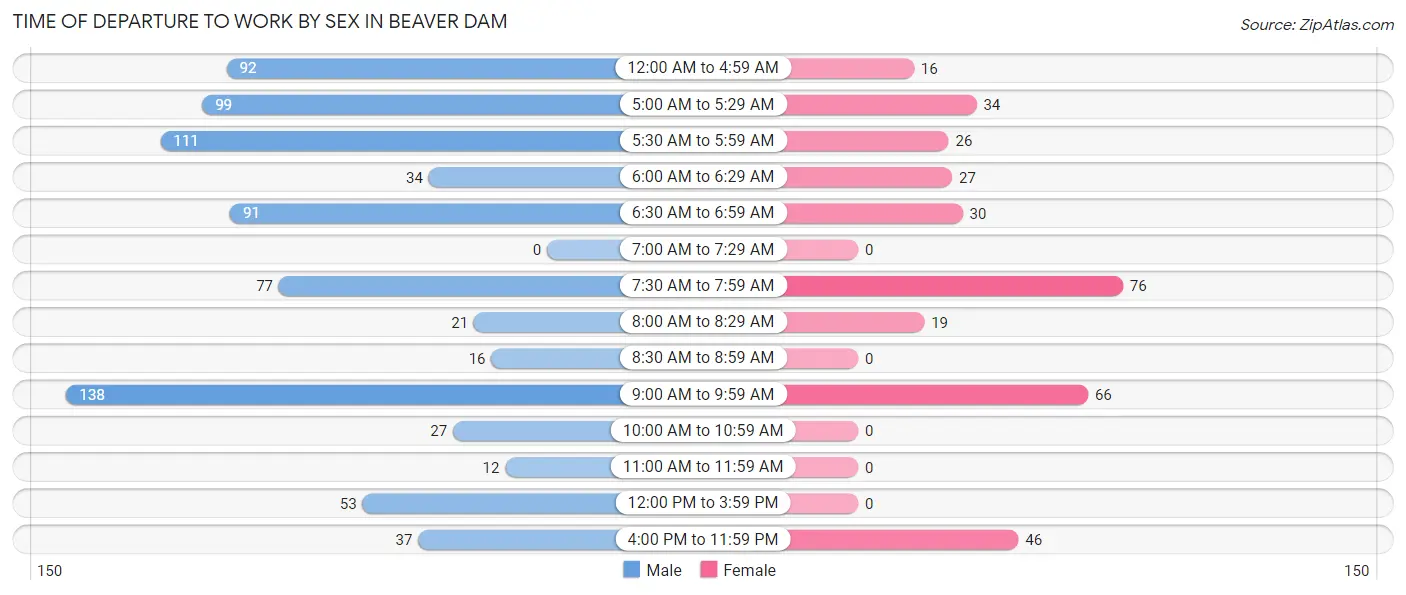
| Time of Departure | Male | Female |
| 12:00 AM to 4:59 AM | 92 (11.4%) | 16 (4.7%) |
| 5:00 AM to 5:29 AM | 99 (12.2%) | 34 (10.0%) |
| 5:30 AM to 5:59 AM | 111 (13.7%) | 26 (7.6%) |
| 6:00 AM to 6:29 AM | 34 (4.2%) | 27 (7.9%) |
| 6:30 AM to 6:59 AM | 91 (11.3%) | 30 (8.8%) |
| 7:00 AM to 7:29 AM | 0 (0.0%) | 0 (0.0%) |
| 7:30 AM to 7:59 AM | 77 (9.5%) | 76 (22.4%) |
| 8:00 AM to 8:29 AM | 21 (2.6%) | 19 (5.6%) |
| 8:30 AM to 8:59 AM | 16 (2.0%) | 0 (0.0%) |
| 9:00 AM to 9:59 AM | 138 (17.1%) | 66 (19.4%) |
| 10:00 AM to 10:59 AM | 27 (3.3%) | 0 (0.0%) |
| 11:00 AM to 11:59 AM | 12 (1.5%) | 0 (0.0%) |
| 12:00 PM to 3:59 PM | 53 (6.6%) | 0 (0.0%) |
| 4:00 PM to 11:59 PM | 37 (4.6%) | 46 (13.5%) |
| Total | 808 (100.0%) | 340 (100.0%) |
Housing Occupancy in Beaver Dam
Occupancy by Ownership in Beaver Dam
Of the total 1,472 dwellings in Beaver Dam, owner-occupied units account for 843 (57.3%), while renter-occupied units make up 629 (42.7%).
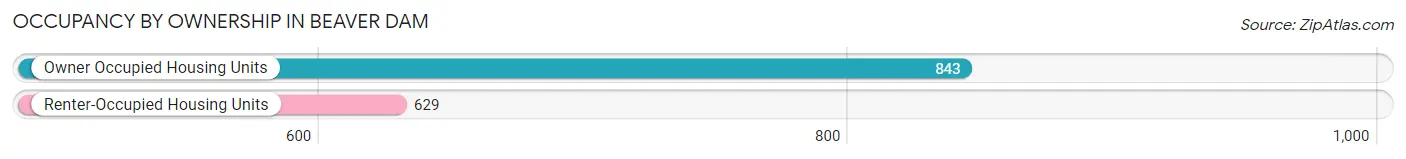
| Occupancy | # Housing Units | % Housing Units |
| Owner Occupied Housing Units | 843 | 57.3% |
| Renter-Occupied Housing Units | 629 | 42.7% |
| Total Occupied Housing Units | 1,472 | 100.0% |
Occupancy by Household Size in Beaver Dam
| Household Size | # Housing Units | % Housing Units |
| 1-Person Household | 265 | 18.0% |
| 2-Person Household | 737 | 50.1% |
| 3-Person Household | 253 | 17.2% |
| 4+ Person Household | 217 | 14.7% |
| Total Housing Units | 1,472 | 100.0% |
Occupancy by Ownership by Household Size in Beaver Dam
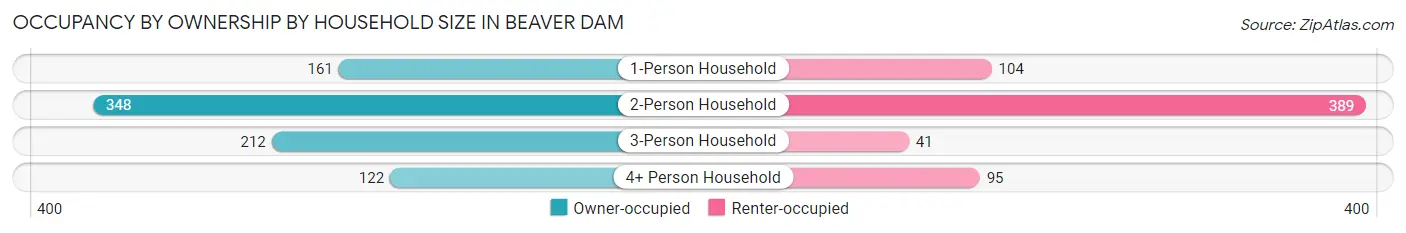
| Household Size | Owner-occupied | Renter-occupied |
| 1-Person Household | 161 (60.8%) | 104 (39.3%) |
| 2-Person Household | 348 (47.2%) | 389 (52.8%) |
| 3-Person Household | 212 (83.8%) | 41 (16.2%) |
| 4+ Person Household | 122 (56.2%) | 95 (43.8%) |
| Total Housing Units | 843 (57.3%) | 629 (42.7%) |
Occupancy by Educational Attainment in Beaver Dam
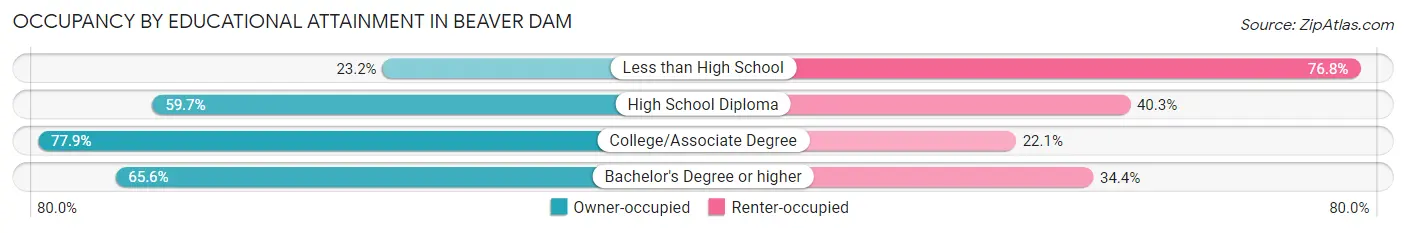
| Household Size | Owner-occupied | Renter-occupied |
| Less than High School | 79 (23.2%) | 261 (76.8%) |
| High School Diploma | 273 (59.7%) | 184 (40.3%) |
| College/Associate Degree | 306 (77.9%) | 87 (22.1%) |
| Bachelor's Degree or higher | 185 (65.6%) | 97 (34.4%) |
Occupancy by Age of Householder in Beaver Dam
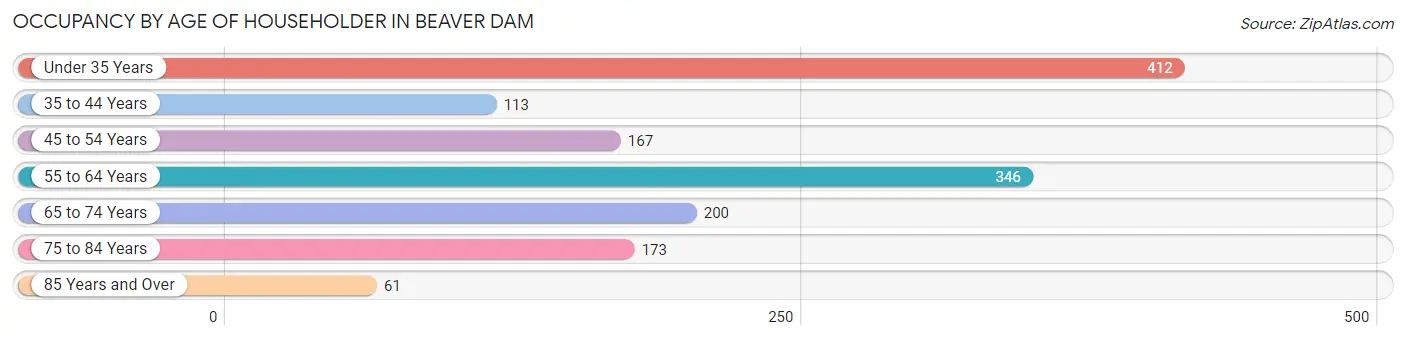
| Age Bracket | # Households | % Households |
| Under 35 Years | 412 | 28.0% |
| 35 to 44 Years | 113 | 7.7% |
| 45 to 54 Years | 167 | 11.4% |
| 55 to 64 Years | 346 | 23.5% |
| 65 to 74 Years | 200 | 13.6% |
| 75 to 84 Years | 173 | 11.7% |
| 85 Years and Over | 61 | 4.1% |
| Total | 1,472 | 100.0% |
Housing Finances in Beaver Dam
Median Income by Occupancy in Beaver Dam
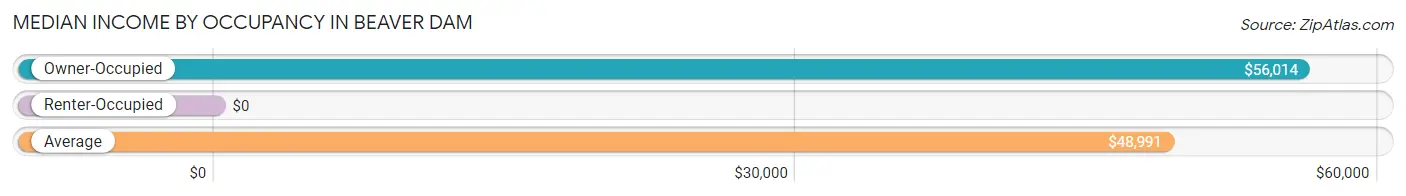
| Occupancy Type | # Households | Median Income |
| Owner-Occupied | 843 (57.3%) | $56,014 |
| Renter-Occupied | 629 (42.7%) | $0 |
| Average | 1,472 (100.0%) | $48,991 |
Occupancy by Householder Income Bracket in Beaver Dam
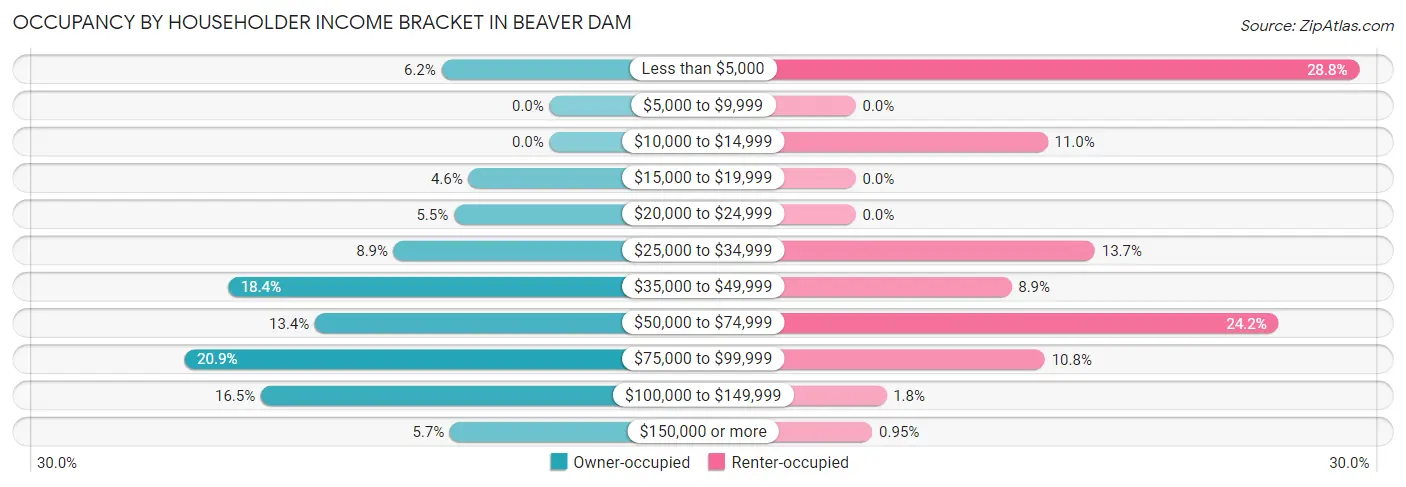
| Income Bracket | Owner-occupied | Renter-occupied |
| Less than $5,000 | 52 (6.2%) | 181 (28.8%) |
| $5,000 to $9,999 | 0 (0.0%) | 0 (0.0%) |
| $10,000 to $14,999 | 0 (0.0%) | 69 (11.0%) |
| $15,000 to $19,999 | 39 (4.6%) | 0 (0.0%) |
| $20,000 to $24,999 | 46 (5.5%) | 0 (0.0%) |
| $25,000 to $34,999 | 75 (8.9%) | 86 (13.7%) |
| $35,000 to $49,999 | 155 (18.4%) | 56 (8.9%) |
| $50,000 to $74,999 | 113 (13.4%) | 152 (24.2%) |
| $75,000 to $99,999 | 176 (20.9%) | 68 (10.8%) |
| $100,000 to $149,999 | 139 (16.5%) | 11 (1.8%) |
| $150,000 or more | 48 (5.7%) | 6 (0.9%) |
| Total | 843 (100.0%) | 629 (100.0%) |
Monthly Housing Cost Tiers in Beaver Dam
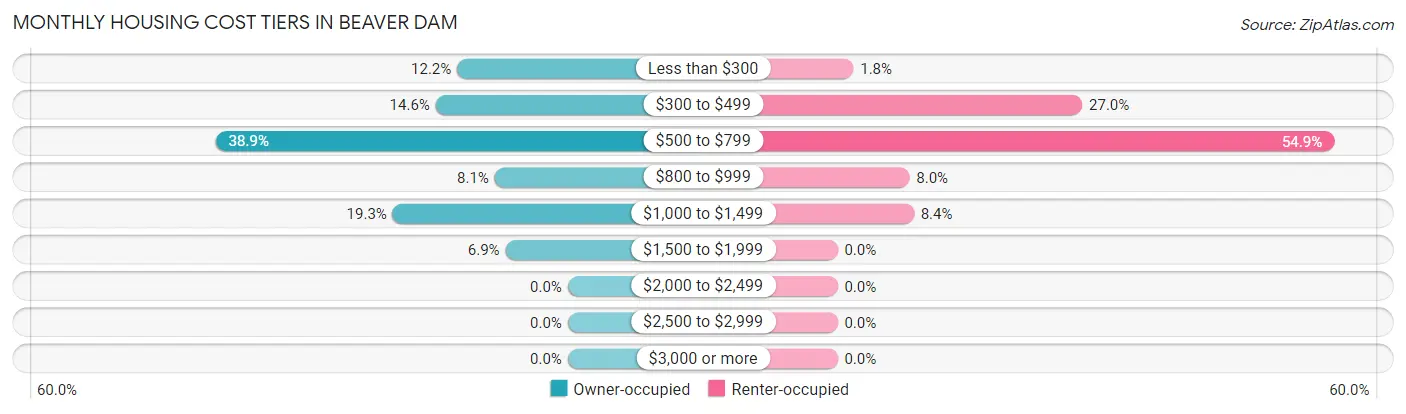
| Monthly Cost | Owner-occupied | Renter-occupied |
| Less than $300 | 103 (12.2%) | 11 (1.8%) |
| $300 to $499 | 123 (14.6%) | 170 (27.0%) |
| $500 to $799 | 328 (38.9%) | 345 (54.8%) |
| $800 to $999 | 68 (8.1%) | 50 (8.0%) |
| $1,000 to $1,499 | 163 (19.3%) | 53 (8.4%) |
| $1,500 to $1,999 | 58 (6.9%) | 0 (0.0%) |
| $2,000 to $2,499 | 0 (0.0%) | 0 (0.0%) |
| $2,500 to $2,999 | 0 (0.0%) | 0 (0.0%) |
| $3,000 or more | 0 (0.0%) | 0 (0.0%) |
| Total | 843 (100.0%) | 629 (100.0%) |
Physical Housing Characteristics in Beaver Dam
Housing Structures in Beaver Dam
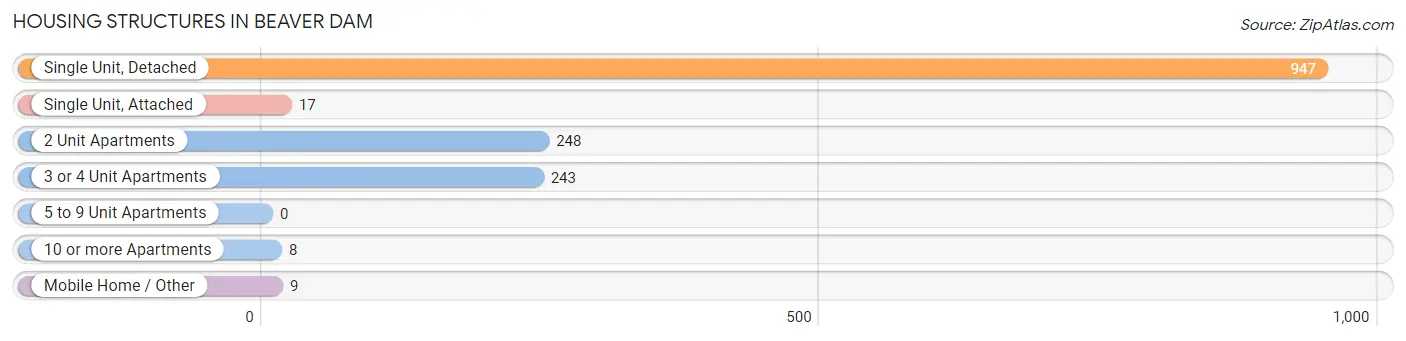
| Structure Type | # Housing Units | % Housing Units |
| Single Unit, Detached | 947 | 64.3% |
| Single Unit, Attached | 17 | 1.1% |
| 2 Unit Apartments | 248 | 16.9% |
| 3 or 4 Unit Apartments | 243 | 16.5% |
| 5 to 9 Unit Apartments | 0 | 0.0% |
| 10 or more Apartments | 8 | 0.5% |
| Mobile Home / Other | 9 | 0.6% |
| Total | 1,472 | 100.0% |
Housing Structures by Occupancy in Beaver Dam
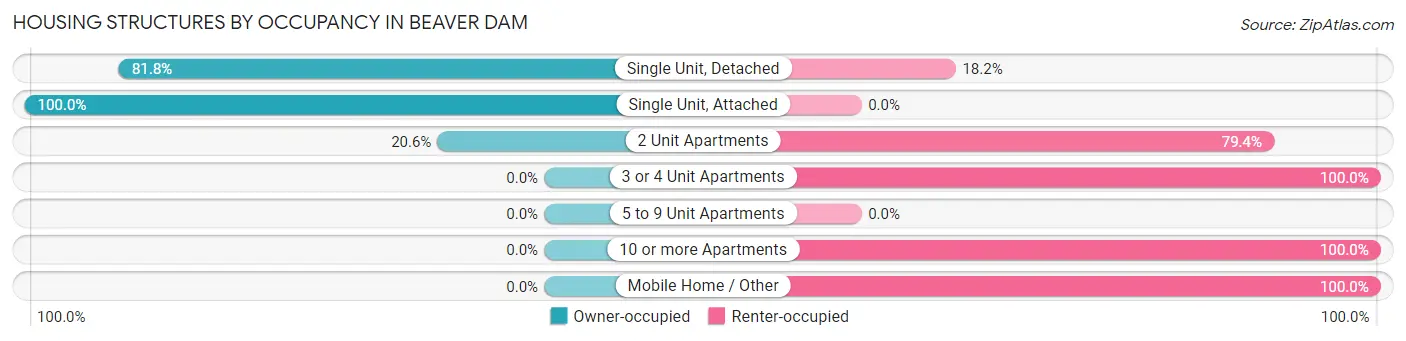
| Structure Type | Owner-occupied | Renter-occupied |
| Single Unit, Detached | 775 (81.8%) | 172 (18.2%) |
| Single Unit, Attached | 17 (100.0%) | 0 (0.0%) |
| 2 Unit Apartments | 51 (20.6%) | 197 (79.4%) |
| 3 or 4 Unit Apartments | 0 (0.0%) | 243 (100.0%) |
| 5 to 9 Unit Apartments | 0 (0.0%) | 0 (0.0%) |
| 10 or more Apartments | 0 (0.0%) | 8 (100.0%) |
| Mobile Home / Other | 0 (0.0%) | 9 (100.0%) |
| Total | 843 (57.3%) | 629 (42.7%) |
Housing Structures by Number of Rooms in Beaver Dam
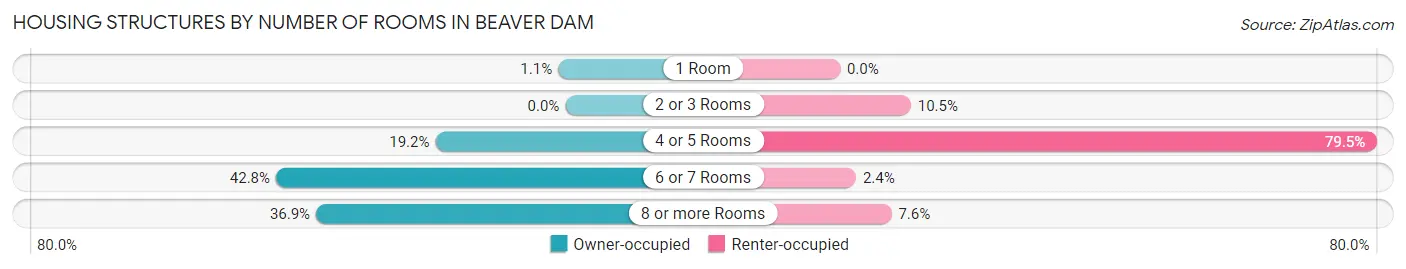
| Number of Rooms | Owner-occupied | Renter-occupied |
| 1 Room | 9 (1.1%) | 0 (0.0%) |
| 2 or 3 Rooms | 0 (0.0%) | 66 (10.5%) |
| 4 or 5 Rooms | 162 (19.2%) | 500 (79.5%) |
| 6 or 7 Rooms | 361 (42.8%) | 15 (2.4%) |
| 8 or more Rooms | 311 (36.9%) | 48 (7.6%) |
| Total | 843 (100.0%) | 629 (100.0%) |
Housing Structure by Heating Type in Beaver Dam
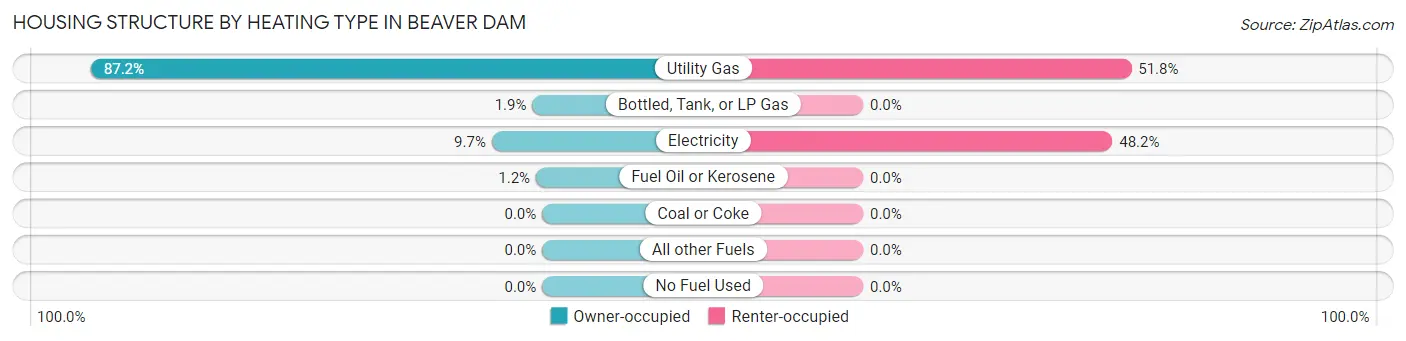
| Heating Type | Owner-occupied | Renter-occupied |
| Utility Gas | 735 (87.2%) | 326 (51.8%) |
| Bottled, Tank, or LP Gas | 16 (1.9%) | 0 (0.0%) |
| Electricity | 82 (9.7%) | 303 (48.2%) |
| Fuel Oil or Kerosene | 10 (1.2%) | 0 (0.0%) |
| Coal or Coke | 0 (0.0%) | 0 (0.0%) |
| All other Fuels | 0 (0.0%) | 0 (0.0%) |
| No Fuel Used | 0 (0.0%) | 0 (0.0%) |
| Total | 843 (100.0%) | 629 (100.0%) |
Household Vehicle Usage in Beaver Dam
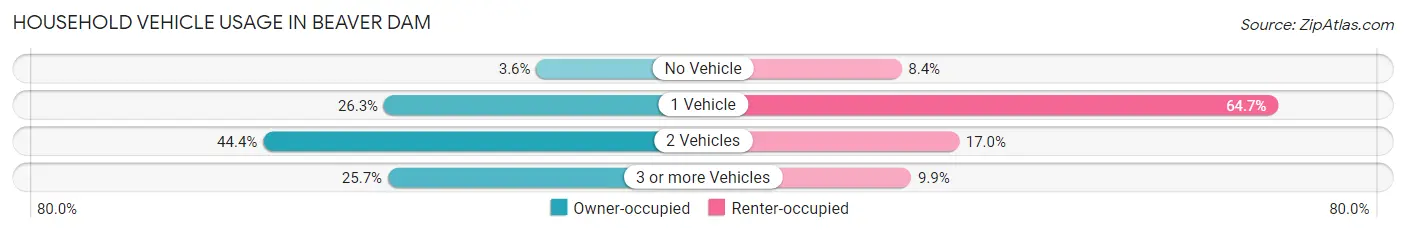
| Vehicles per Household | Owner-occupied | Renter-occupied |
| No Vehicle | 30 (3.6%) | 53 (8.4%) |
| 1 Vehicle | 222 (26.3%) | 407 (64.7%) |
| 2 Vehicles | 374 (44.4%) | 107 (17.0%) |
| 3 or more Vehicles | 217 (25.7%) | 62 (9.9%) |
| Total | 843 (100.0%) | 629 (100.0%) |
Real Estate & Mortgages in Beaver Dam
Real Estate and Mortgage Overview in Beaver Dam
| Characteristic | Without Mortgage | With Mortgage |
| Housing Units | 477 | 366 |
| Median Property Value | $159,700 | $125,700 |
| Median Household Income | $49,375 | $48 |
| Monthly Housing Costs | $518 | $0 |
| Real Estate Taxes | $749 | $0 |
Property Value by Mortgage Status in Beaver Dam
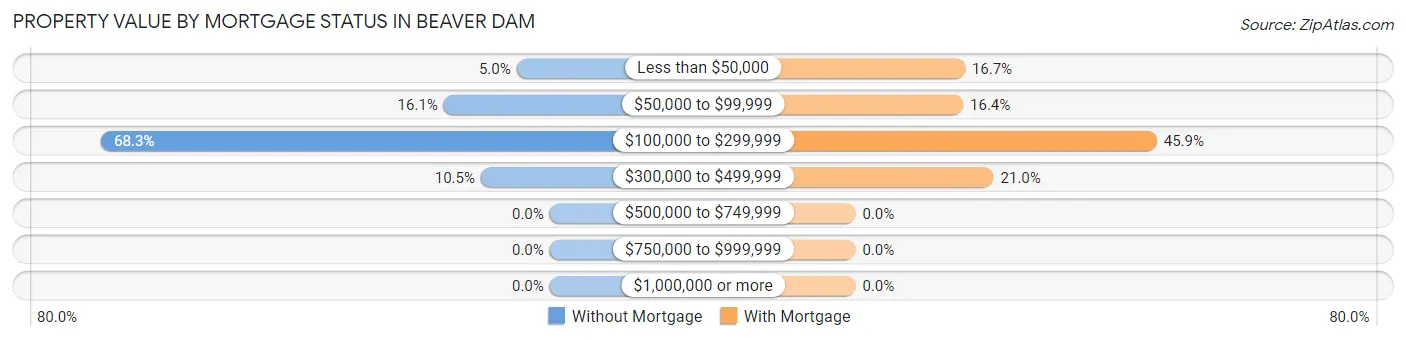
| Property Value | Without Mortgage | With Mortgage |
| Less than $50,000 | 24 (5.0%) | 61 (16.7%) |
| $50,000 to $99,999 | 77 (16.1%) | 60 (16.4%) |
| $100,000 to $299,999 | 326 (68.3%) | 168 (45.9%) |
| $300,000 to $499,999 | 50 (10.5%) | 77 (21.0%) |
| $500,000 to $749,999 | 0 (0.0%) | 0 (0.0%) |
| $750,000 to $999,999 | 0 (0.0%) | 0 (0.0%) |
| $1,000,000 or more | 0 (0.0%) | 0 (0.0%) |
| Total | 477 (100.0%) | 366 (100.0%) |
Household Income by Mortgage Status in Beaver Dam
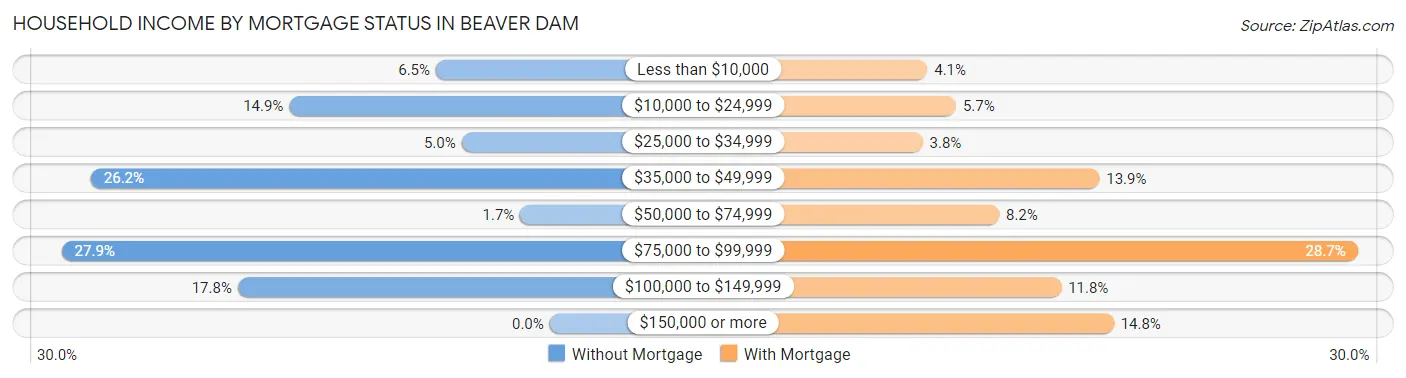
| Household Income | Without Mortgage | With Mortgage |
| Less than $10,000 | 31 (6.5%) | 15 (4.1%) |
| $10,000 to $24,999 | 71 (14.9%) | 21 (5.7%) |
| $25,000 to $34,999 | 24 (5.0%) | 14 (3.8%) |
| $35,000 to $49,999 | 125 (26.2%) | 51 (13.9%) |
| $50,000 to $74,999 | 8 (1.7%) | 30 (8.2%) |
| $75,000 to $99,999 | 133 (27.9%) | 105 (28.7%) |
| $100,000 to $149,999 | 85 (17.8%) | 43 (11.7%) |
| $150,000 or more | 0 (0.0%) | 54 (14.7%) |
| Total | 477 (100.0%) | 366 (100.0%) |
Property Value to Household Income Ratio in Beaver Dam
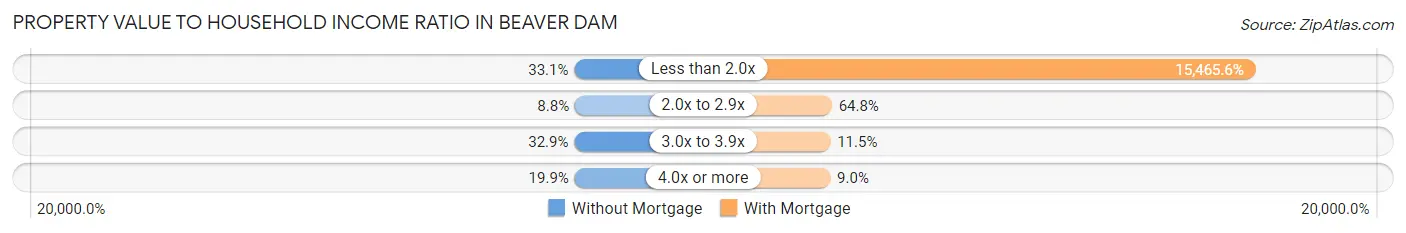
| Value-to-Income Ratio | Without Mortgage | With Mortgage |
| Less than 2.0x | 158 (33.1%) | 56,604 (15,465.6%) |
| 2.0x to 2.9x | 42 (8.8%) | 237 (64.7%) |
| 3.0x to 3.9x | 157 (32.9%) | 42 (11.5%) |
| 4.0x or more | 95 (19.9%) | 33 (9.0%) |
| Total | 477 (100.0%) | 366 (100.0%) |
Real Estate Taxes by Mortgage Status in Beaver Dam
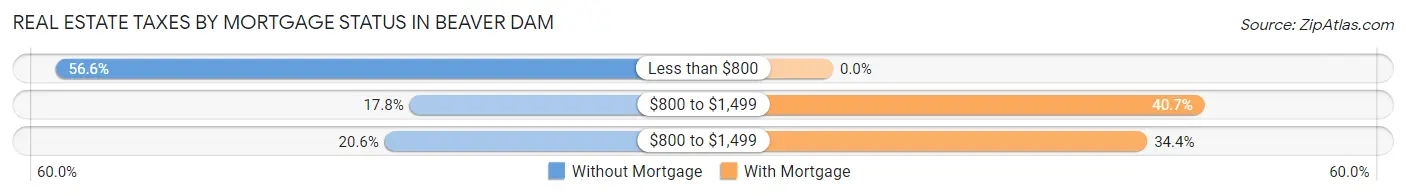
| Property Taxes | Without Mortgage | With Mortgage |
| Less than $800 | 270 (56.6%) | 0 (0.0%) |
| $800 to $1,499 | 85 (17.8%) | 149 (40.7%) |
| $800 to $1,499 | 98 (20.5%) | 126 (34.4%) |
| Total | 477 (100.0%) | 366 (100.0%) |
Health & Disability in Beaver Dam
Health Insurance Coverage by Age in Beaver Dam
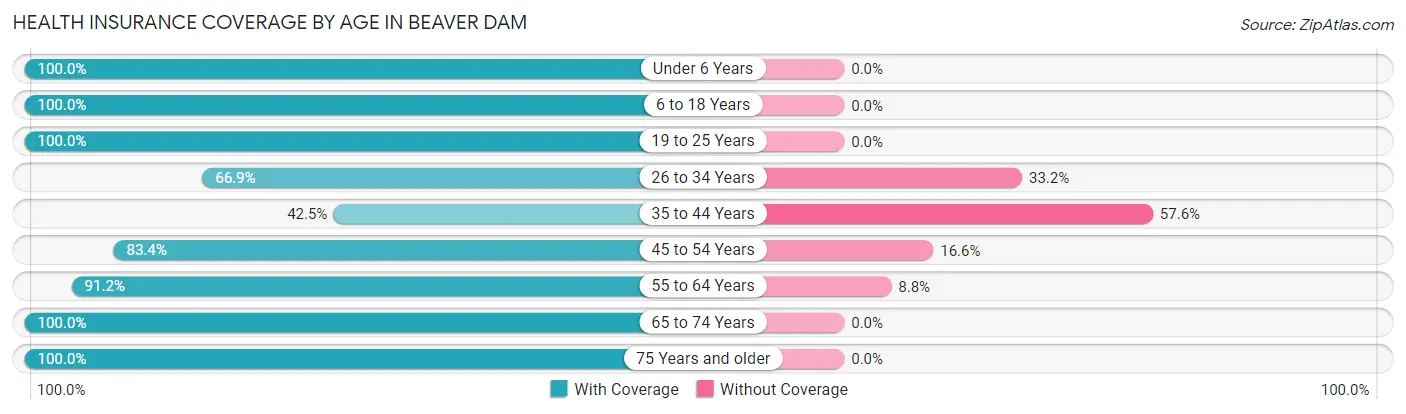
| Age Bracket | With Coverage | Without Coverage |
| Under 6 Years | 145 (100.0%) | 0 (0.0%) |
| 6 to 18 Years | 603 (100.0%) | 0 (0.0%) |
| 19 to 25 Years | 221 (100.0%) | 0 (0.0%) |
| 26 to 34 Years | 365 (66.8%) | 181 (33.2%) |
| 35 to 44 Years | 104 (42.4%) | 141 (57.6%) |
| 45 to 54 Years | 221 (83.4%) | 44 (16.6%) |
| 55 to 64 Years | 748 (91.2%) | 72 (8.8%) |
| 65 to 74 Years | 349 (100.0%) | 0 (0.0%) |
| 75 Years and older | 341 (100.0%) | 0 (0.0%) |
| Total | 3,097 (87.6%) | 438 (12.4%) |
Health Insurance Coverage by Citizenship Status in Beaver Dam
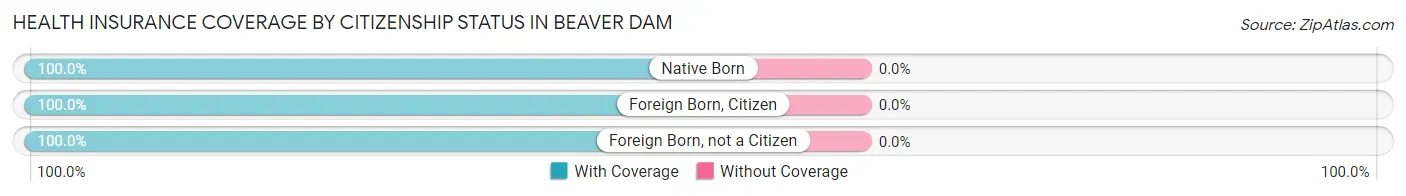
| Citizenship Status | With Coverage | Without Coverage |
| Native Born | 145 (100.0%) | 0 (0.0%) |
| Foreign Born, Citizen | 603 (100.0%) | 0 (0.0%) |
| Foreign Born, not a Citizen | 221 (100.0%) | 0 (0.0%) |
Health Insurance Coverage by Household Income in Beaver Dam
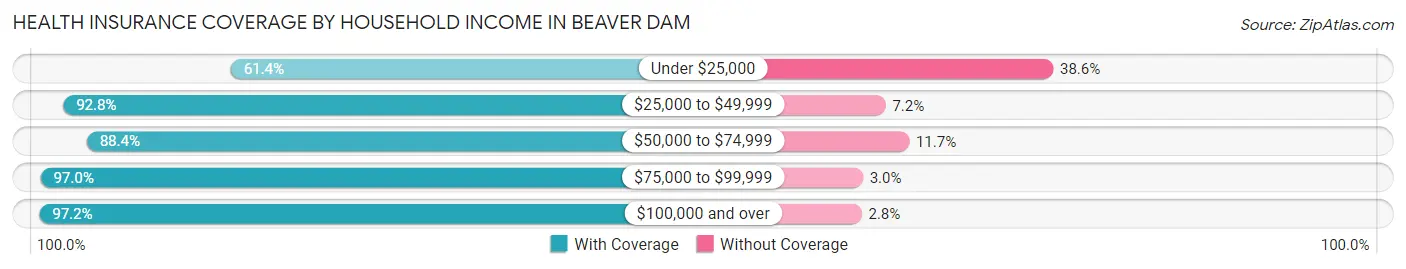
| Household Income | With Coverage | Without Coverage |
| Under $25,000 | 405 (61.4%) | 255 (38.6%) |
| $25,000 to $49,999 | 756 (92.8%) | 59 (7.2%) |
| $50,000 to $74,999 | 652 (88.3%) | 86 (11.7%) |
| $75,000 to $99,999 | 684 (97.0%) | 21 (3.0%) |
| $100,000 and over | 600 (97.2%) | 17 (2.8%) |
Public vs Private Health Insurance Coverage by Age in Beaver Dam
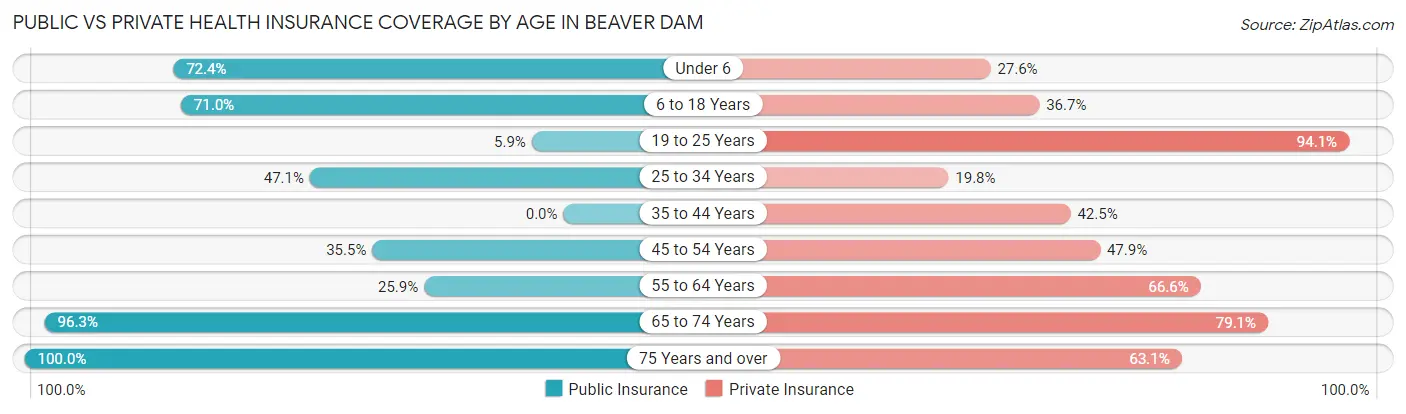
| Age Bracket | Public Insurance | Private Insurance |
| Under 6 | 105 (72.4%) | 40 (27.6%) |
| 6 to 18 Years | 428 (71.0%) | 221 (36.6%) |
| 19 to 25 Years | 13 (5.9%) | 208 (94.1%) |
| 25 to 34 Years | 257 (47.1%) | 108 (19.8%) |
| 35 to 44 Years | 0 (0.0%) | 104 (42.4%) |
| 45 to 54 Years | 94 (35.5%) | 127 (47.9%) |
| 55 to 64 Years | 212 (25.9%) | 546 (66.6%) |
| 65 to 74 Years | 336 (96.3%) | 276 (79.1%) |
| 75 Years and over | 341 (100.0%) | 215 (63.0%) |
| Total | 1,786 (50.5%) | 1,845 (52.2%) |
Disability Status by Sex by Age in Beaver Dam
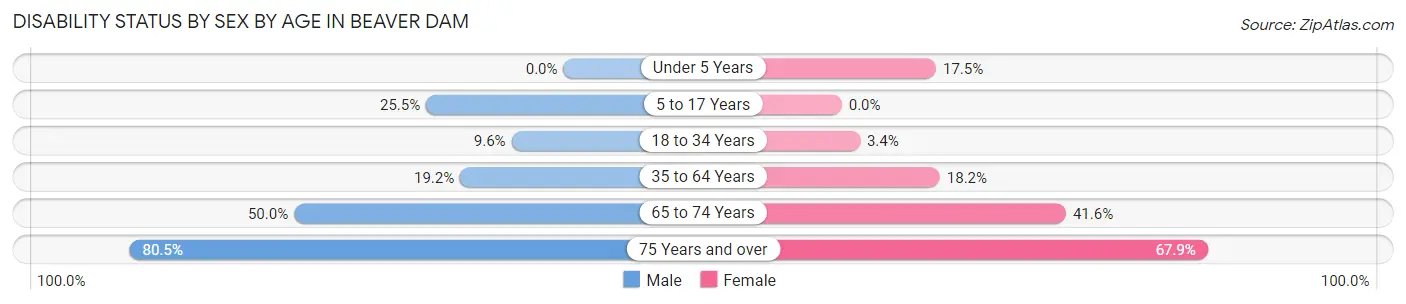
| Age Bracket | Male | Female |
| Under 5 Years | 0 (0.0%) | 21 (17.5%) |
| 5 to 17 Years | 105 (25.5%) | 0 (0.0%) |
| 18 to 34 Years | 47 (9.6%) | 11 (3.4%) |
| 35 to 64 Years | 136 (19.2%) | 113 (18.2%) |
| 65 to 74 Years | 94 (50.0%) | 67 (41.6%) |
| 75 Years and over | 124 (80.5%) | 127 (67.9%) |
Disability Class by Sex by Age in Beaver Dam
Disability Class: Hearing Difficulty
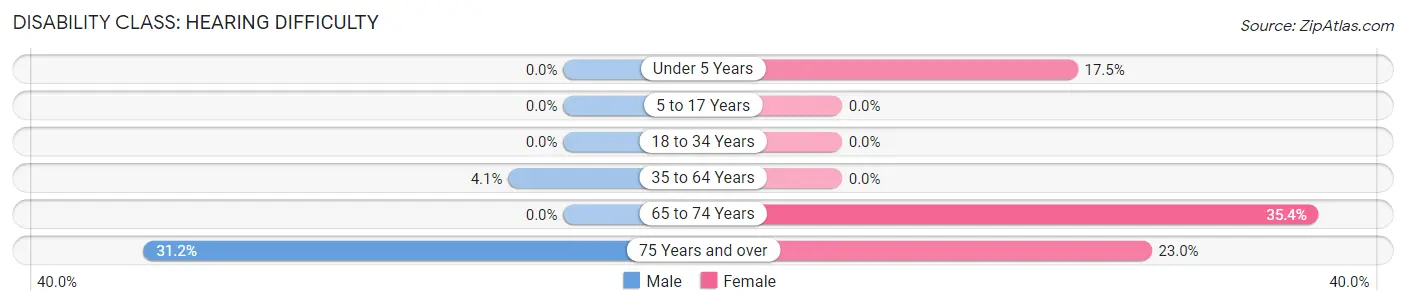
| Age Bracket | Male | Female |
| Under 5 Years | 0 (0.0%) | 21 (17.5%) |
| 5 to 17 Years | 0 (0.0%) | 0 (0.0%) |
| 18 to 34 Years | 0 (0.0%) | 0 (0.0%) |
| 35 to 64 Years | 29 (4.1%) | 0 (0.0%) |
| 65 to 74 Years | 0 (0.0%) | 57 (35.4%) |
| 75 Years and over | 48 (31.2%) | 43 (23.0%) |
Disability Class: Vision Difficulty
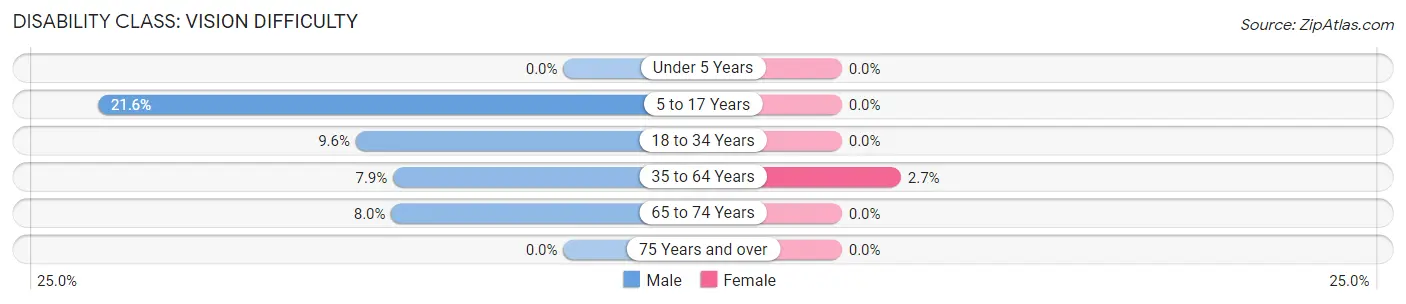
| Age Bracket | Male | Female |
| Under 5 Years | 0 (0.0%) | 0 (0.0%) |
| 5 to 17 Years | 89 (21.6%) | 0 (0.0%) |
| 18 to 34 Years | 47 (9.6%) | 0 (0.0%) |
| 35 to 64 Years | 56 (7.9%) | 17 (2.7%) |
| 65 to 74 Years | 15 (8.0%) | 0 (0.0%) |
| 75 Years and over | 0 (0.0%) | 0 (0.0%) |
Disability Class: Cognitive Difficulty
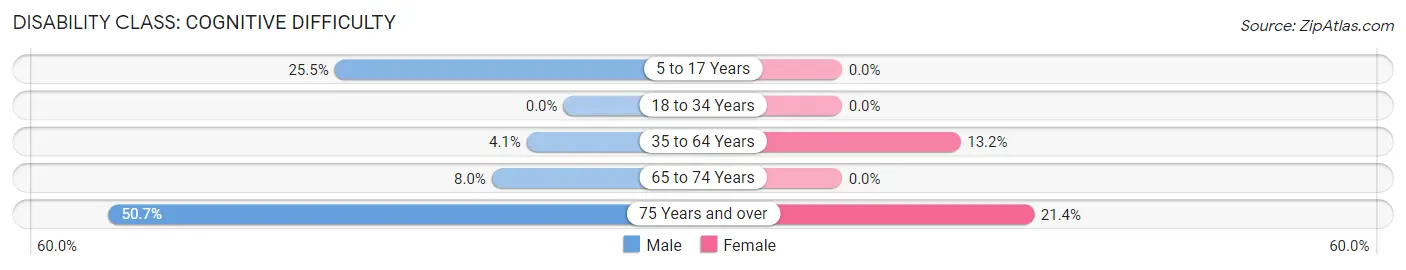
| Age Bracket | Male | Female |
| 5 to 17 Years | 105 (25.5%) | 0 (0.0%) |
| 18 to 34 Years | 0 (0.0%) | 0 (0.0%) |
| 35 to 64 Years | 29 (4.1%) | 82 (13.2%) |
| 65 to 74 Years | 15 (8.0%) | 0 (0.0%) |
| 75 Years and over | 78 (50.6%) | 40 (21.4%) |
Disability Class: Ambulatory Difficulty
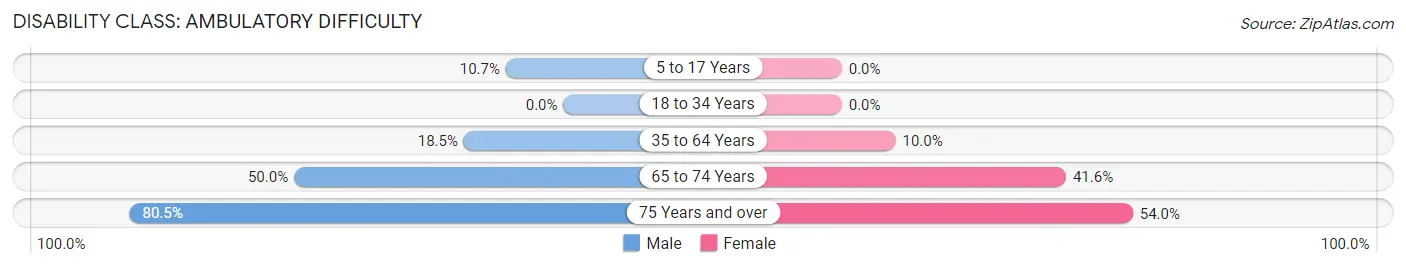
| Age Bracket | Male | Female |
| 5 to 17 Years | 44 (10.7%) | 0 (0.0%) |
| 18 to 34 Years | 0 (0.0%) | 0 (0.0%) |
| 35 to 64 Years | 131 (18.5%) | 62 (10.0%) |
| 65 to 74 Years | 94 (50.0%) | 67 (41.6%) |
| 75 Years and over | 124 (80.5%) | 101 (54.0%) |
Disability Class: Self-Care Difficulty
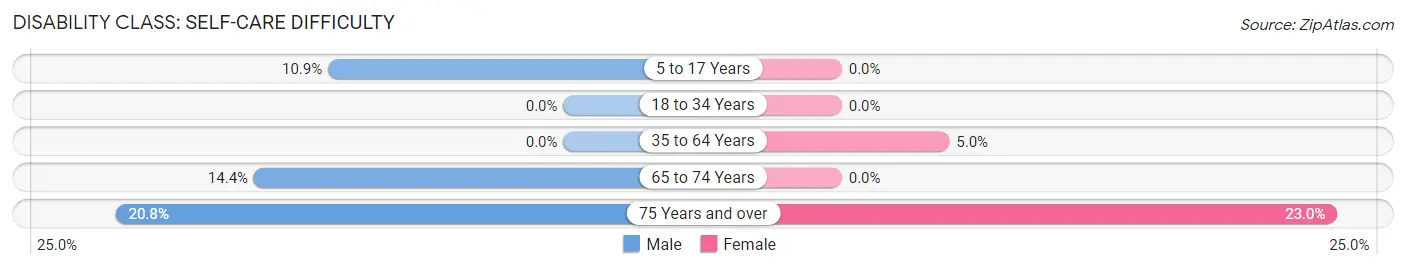
| Age Bracket | Male | Female |
| 5 to 17 Years | 45 (10.9%) | 0 (0.0%) |
| 18 to 34 Years | 0 (0.0%) | 0 (0.0%) |
| 35 to 64 Years | 0 (0.0%) | 31 (5.0%) |
| 65 to 74 Years | 27 (14.4%) | 0 (0.0%) |
| 75 Years and over | 32 (20.8%) | 43 (23.0%) |
Technology Access in Beaver Dam
Computing Device Access in Beaver Dam
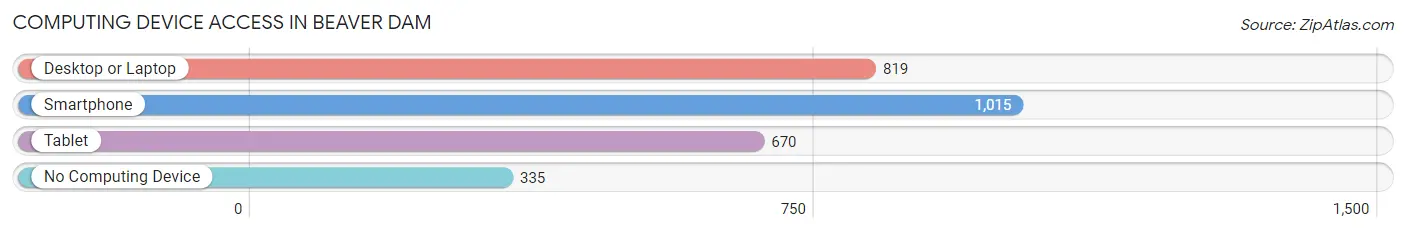
| Device Type | # Households | % Households |
| Desktop or Laptop | 819 | 55.6% |
| Smartphone | 1,015 | 69.0% |
| Tablet | 670 | 45.5% |
| No Computing Device | 335 | 22.8% |
| Total | 1,472 | 100.0% |
Internet Access in Beaver Dam
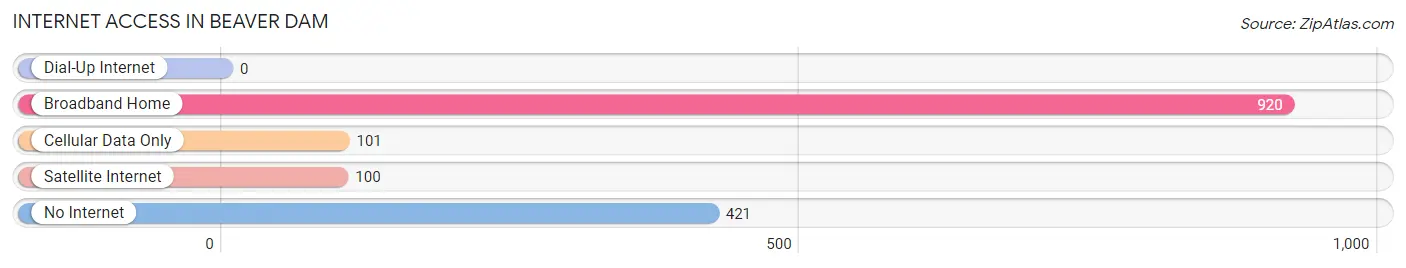
| Internet Type | # Households | % Households |
| Dial-Up Internet | 0 | 0.0% |
| Broadband Home | 920 | 62.5% |
| Cellular Data Only | 101 | 6.9% |
| Satellite Internet | 100 | 6.8% |
| No Internet | 421 | 28.6% |
| Total | 1,472 | 100.0% |
Beaver Dam Summary
Beaver Dam is a small city located in Ohio County, Kentucky, United States. It is situated along the Ohio River, approximately 40 miles southwest of Owensboro. The city has a population of approximately 3,000 people and is the county seat of Ohio County.
History
Beaver Dam was founded in 1820 by a group of settlers from Virginia. The city was named after the nearby Beaver Dam Creek, which was named for the large number of beavers that lived in the area. The city was incorporated in 1838 and was the first city in Ohio County.
In the late 19th century, Beaver Dam was a thriving river port and a major center for the tobacco industry. The city was also home to several large manufacturing plants, including a cotton mill, a paper mill, and a furniture factory.
Geography
Beaver Dam is located in the western part of Ohio County, along the Ohio River. The city is situated at an elevation of 463 feet above sea level. The city has a total area of 2.2 square miles, all of which is land.
The climate in Beaver Dam is humid subtropical, with hot, humid summers and mild winters. The average annual temperature is around 60 degrees Fahrenheit. The average annual precipitation is around 45 inches.
Economy
Beaver Dam’s economy is largely based on agriculture and manufacturing. The city is home to several large manufacturing plants, including a cotton mill, a paper mill, and a furniture factory. The city is also home to several small businesses, including restaurants, retail stores, and service providers.
Demographics
As of the 2010 census, Beaver Dam had a population of 3,039 people. The racial makeup of the city was 95.3% White, 1.2% African American, 0.3% Native American, 0.3% Asian, 0.1% Pacific Islander, 1.2% from other races, and 1.7% from two or more races. Hispanic or Latino of any race were 2.7% of the population.
The median household income in Beaver Dam was $31,250, and the median family income was $37,500. The per capita income for the city was $17,845. About 17.2% of families and 20.2% of the population were below the poverty line, including 28.2% of those under age 18 and 11.2% of those age 65 or over.
Beaver Dam is served by the Ohio County School District. The city is home to two elementary schools, one middle school, and one high school. The city also has several private schools, including a Catholic school and a Christian school.
Common Questions
What is Per Capita Income in Beaver Dam?
Per Capita income in Beaver Dam is $29,182.
What is the Median Family Income in Beaver Dam?
Median Family Income in Beaver Dam is $56,486.
What is the Median Household income in Beaver Dam?
Median Household Income in Beaver Dam is $48,991.
What is Income or Wage Gap in Beaver Dam?
Income or Wage Gap in Beaver Dam is 57.2%.
Women in Beaver Dam earn 42.8 cents for every dollar earned by a man.
What is Inequality or Gini Index in Beaver Dam?
Inequality or Gini Index in Beaver Dam is 0.52.
What is the Total Population of Beaver Dam?
Total Population of Beaver Dam is 3,535.
What is the Total Male Population of Beaver Dam?
Total Male Population of Beaver Dam is 1,976.
What is the Total Female Population of Beaver Dam?
Total Female Population of Beaver Dam is 1,559.
What is the Ratio of Males per 100 Females in Beaver Dam?
There are 126.75 Males per 100 Females in Beaver Dam.
What is the Ratio of Females per 100 Males in Beaver Dam?
There are 78.90 Females per 100 Males in Beaver Dam.
What is the Median Population Age in Beaver Dam?
Median Population Age in Beaver Dam is 45.1 Years.
What is the Average Family Size in Beaver Dam
Average Family Size in Beaver Dam is 2.9 People.
What is the Average Household Size in Beaver Dam
Average Household Size in Beaver Dam is 2.4 People.
How Large is the Labor Force in Beaver Dam?
There are 1,537 People in the Labor Forcein in Beaver Dam.
What is the Percentage of People in the Labor Force in Beaver Dam?
51.8% of People are in the Labor Force in Beaver Dam.
What is the Unemployment Rate in Beaver Dam?
Unemployment Rate in Beaver Dam is 8.8%.