Artemus, KY Map & Demographics
Artemus Map
Artemus Overview
$12,910
PER CAPITA INCOME
$25,729
AVG HOUSEHOLD INCOME
0.44
INEQUALITY / GINI INDEX
689
TOTAL POPULATION
419
MALE POPULATION
270
FEMALE POPULATION
155.19
MALES / 100 FEMALES
64.44
FEMALES / 100 MALES
27.9
MEDIAN AGE
3.5
AVG FAMILY SIZE
3.7
AVG HOUSEHOLD SIZE
224
LABOR FORCE [ PEOPLE ]
46.8%
PERCENT IN LABOR FORCE
24.6%
UNEMPLOYMENT RATE
Artemus Zip Codes
Artemus Area Codes
Income in Artemus
Income Overview in Artemus
| Characteristic | Number | Measure |
| Per Capita Income | 689 | $12,910 |
| Median Family Income | 163 | $0 |
| Mean Family Income | 163 | $45,274 |
| Median Household Income | 184 | $25,729 |
| Mean Household Income | 184 | $43,122 |
| Income Deficit | 163 | $0 |
| Wage / Income Gap (%) | 689 | 0.00% |
| Wage / Income Gap ($) | 689 | 100.00¢ per $1 |
| Gini / Inequality Index | 689 | 0.44 |
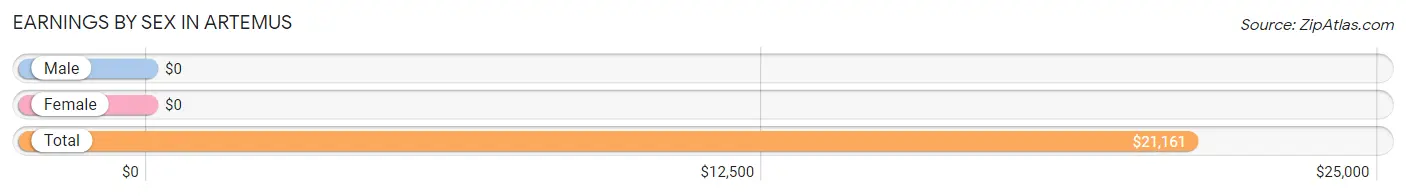
Earnings by Sex in Artemus
| Sex | Number | Average Earnings |
| Male | 102 (47.9%) | $0 |
| Female | 111 (52.1%) | $0 |
| Total | 213 (100.0%) | $21,161 |
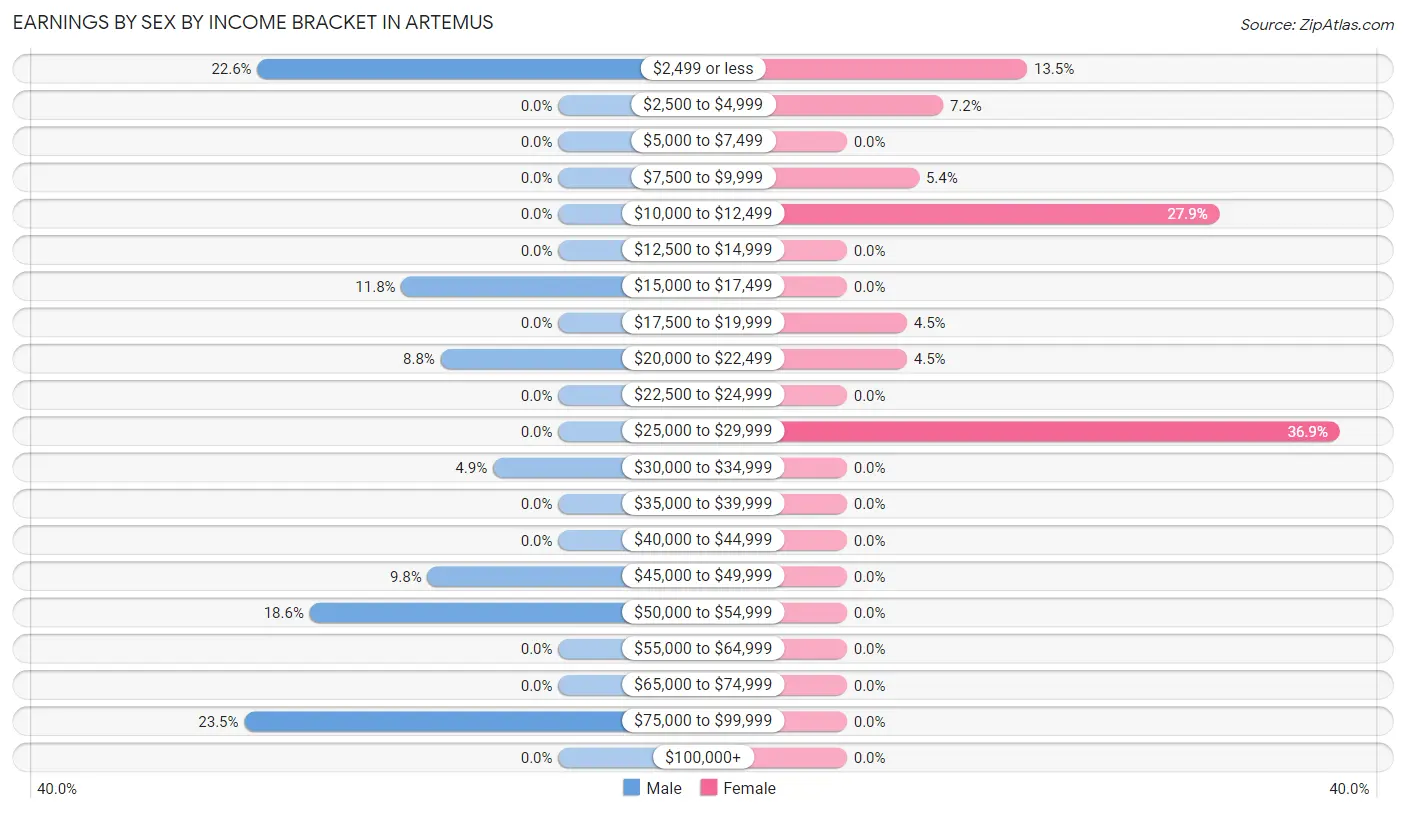
Earnings by Sex by Income Bracket in Artemus
The most common earnings brackets in Artemus are $75,000 to $99,999 for men (24 | 23.5%) and $25,000 to $29,999 for women (41 | 36.9%).
| Income | Male | Female |
| $2,499 or less | 23 (22.6%) | 15 (13.5%) |
| $2,500 to $4,999 | 0 (0.0%) | 8 (7.2%) |
| $5,000 to $7,499 | 0 (0.0%) | 0 (0.0%) |
| $7,500 to $9,999 | 0 (0.0%) | 6 (5.4%) |
| $10,000 to $12,499 | 0 (0.0%) | 31 (27.9%) |
| $12,500 to $14,999 | 0 (0.0%) | 0 (0.0%) |
| $15,000 to $17,499 | 12 (11.8%) | 0 (0.0%) |
| $17,500 to $19,999 | 0 (0.0%) | 5 (4.5%) |
| $20,000 to $22,499 | 9 (8.8%) | 5 (4.5%) |
| $22,500 to $24,999 | 0 (0.0%) | 0 (0.0%) |
| $25,000 to $29,999 | 0 (0.0%) | 41 (36.9%) |
| $30,000 to $34,999 | 5 (4.9%) | 0 (0.0%) |
| $35,000 to $39,999 | 0 (0.0%) | 0 (0.0%) |
| $40,000 to $44,999 | 0 (0.0%) | 0 (0.0%) |
| $45,000 to $49,999 | 10 (9.8%) | 0 (0.0%) |
| $50,000 to $54,999 | 19 (18.6%) | 0 (0.0%) |
| $55,000 to $64,999 | 0 (0.0%) | 0 (0.0%) |
| $65,000 to $74,999 | 0 (0.0%) | 0 (0.0%) |
| $75,000 to $99,999 | 24 (23.5%) | 0 (0.0%) |
| $100,000+ | 0 (0.0%) | 0 (0.0%) |
| Total | 102 (100.0%) | 111 (100.0%) |
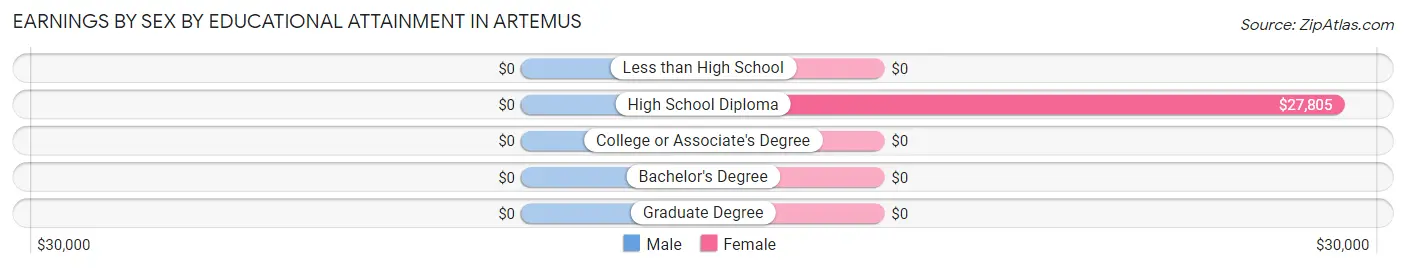
Earnings by Sex by Educational Attainment in Artemus
| Educational Attainment | Male Income | Female Income |
| Less than High School | - | - |
| High School Diploma | - | - |
| College or Associate's Degree | - | - |
| Bachelor's Degree | - | - |
| Graduate Degree | - | - |
| Total | $53,750 | $21,000 |
Family Income in Artemus
Family Income Brackets in Artemus
According to the Artemus family income data, there are 37 families falling into the $10,000 to $14,999 income range, which is the most common income bracket and makes up 22.7% of all families.
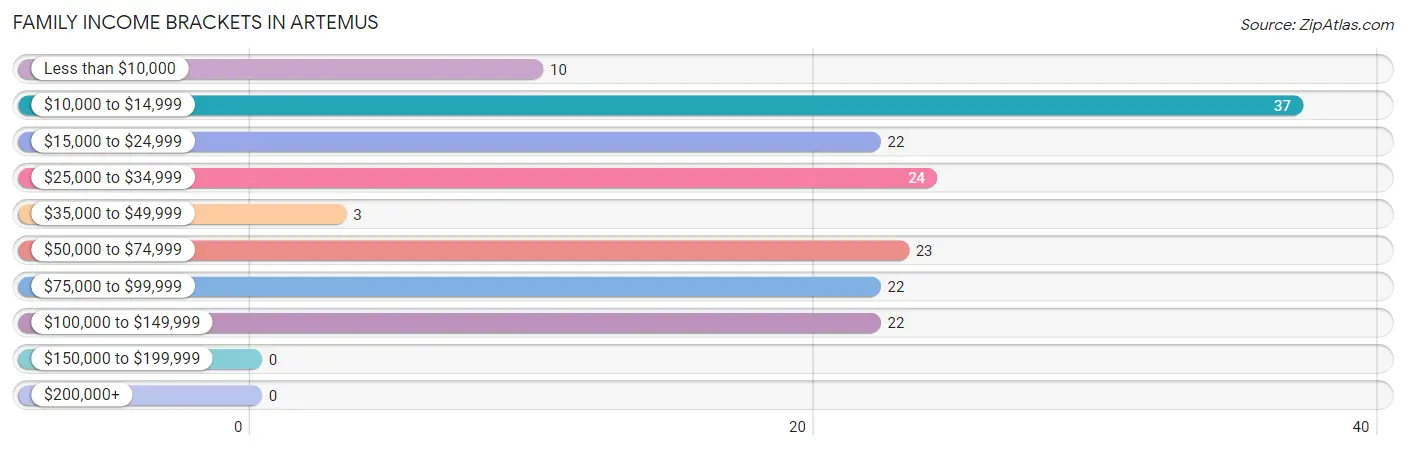
| Income Bracket | # Families | % Families |
| Less than $10,000 | 10 | 6.1% |
| $10,000 to $14,999 | 37 | 22.7% |
| $15,000 to $24,999 | 22 | 13.5% |
| $25,000 to $34,999 | 24 | 14.7% |
| $35,000 to $49,999 | 3 | 1.8% |
| $50,000 to $74,999 | 23 | 14.1% |
| $75,000 to $99,999 | 22 | 13.5% |
| $100,000 to $149,999 | 22 | 13.5% |
| $150,000 to $199,999 | 0 | 0.0% |
| $200,000+ | 0 | 0.0% |
Family Income by Famaliy Size in Artemus
2-person families (58 | 35.6%) account for the highest median family income in Artemus with $81,667 per family, while 2-person families (58 | 35.6%) have the highest median income of $40,834 per family member.
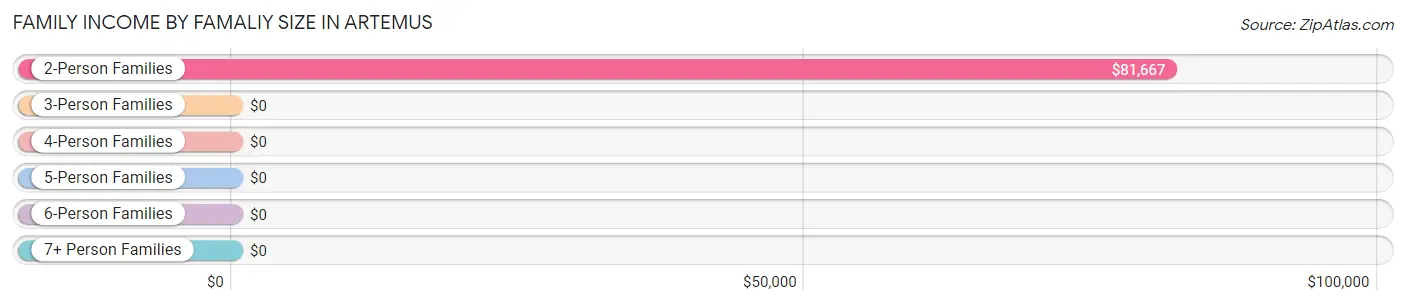
| Income Bracket | # Families | Median Income |
| 2-Person Families | 58 (35.6%) | $81,667 |
| 3-Person Families | 59 (36.2%) | $0 |
| 4-Person Families | 9 (5.5%) | $0 |
| 5-Person Families | 31 (19.0%) | $0 |
| 6-Person Families | 6 (3.7%) | $0 |
| 7+ Person Families | 0 (0.0%) | $0 |
| Total | 163 (100.0%) | $0 |
Family Income by Number of Earners in Artemus
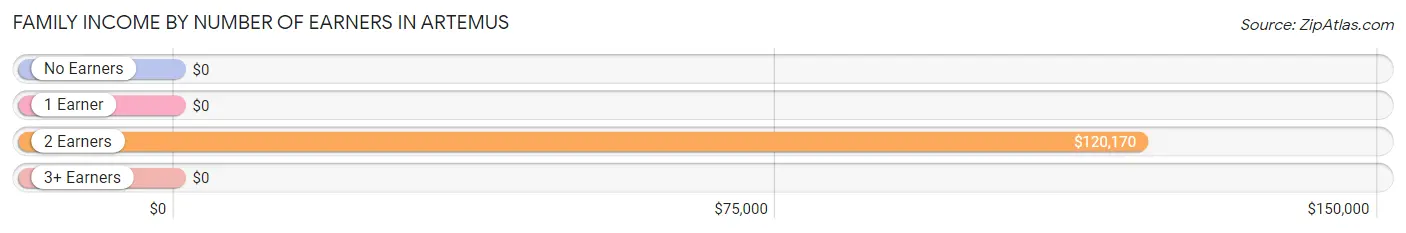
| Number of Earners | # Families | Median Income |
| No Earners | 50 (30.7%) | $0 |
| 1 Earner | 72 (44.2%) | $0 |
| 2 Earners | 41 (25.2%) | $120,170 |
| 3+ Earners | 0 (0.0%) | $0 |
| Total | 163 (100.0%) | $0 |
Household Income in Artemus
Household Income Brackets in Artemus
With 69 households falling in the category, the $15,000 to $24,999 income range is the most frequent in Artemus, accounting for 37.5% of all households.
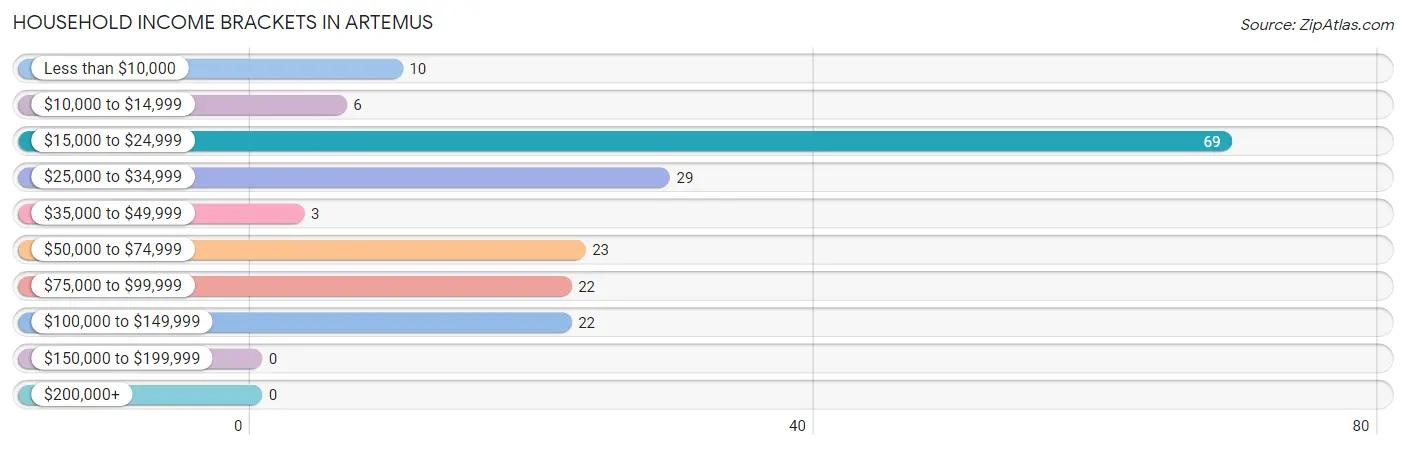
| Income Bracket | # Households | % Households |
| Less than $10,000 | 10 | 5.4% |
| $10,000 to $14,999 | 6 | 3.3% |
| $15,000 to $24,999 | 69 | 37.5% |
| $25,000 to $34,999 | 29 | 15.8% |
| $35,000 to $49,999 | 3 | 1.6% |
| $50,000 to $74,999 | 23 | 12.5% |
| $75,000 to $99,999 | 22 | 12.0% |
| $100,000 to $149,999 | 22 | 12.0% |
| $150,000 to $199,999 | 0 | 0.0% |
| $200,000+ | 0 | 0.0% |
Household Income by Householder Age in Artemus
The median household income in Artemus is $25,729, with the highest median household income of $17,016 found in the 25 to 44 years age bracket for the primary householder. A total of 62 households (33.7%) fall into this category. Meanwhile, the 15 to 24 years age bracket for the primary householder has the lowest median household income of $0, with 8 households (4.3%) in this group.
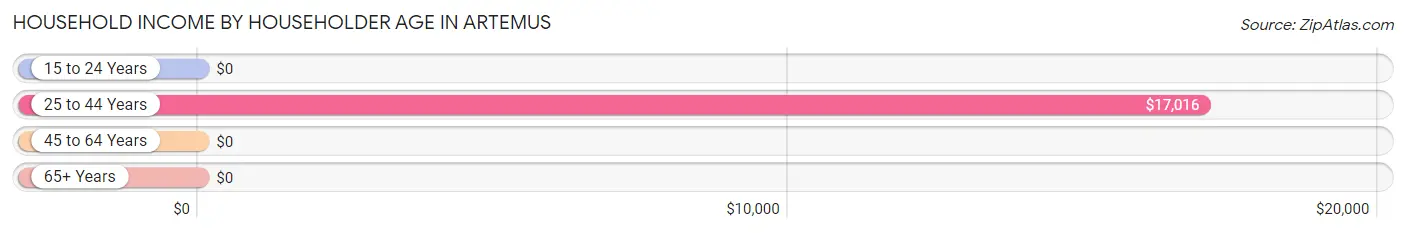
| Income Bracket | # Households | Median Income |
| 15 to 24 Years | 8 (4.3%) | $0 |
| 25 to 44 Years | 62 (33.7%) | $17,016 |
| 45 to 64 Years | 40 (21.7%) | $0 |
| 65+ Years | 74 (40.2%) | $0 |
| Total | 184 (100.0%) | $25,729 |
Poverty in Artemus
Income Below Poverty by Sex and Age in Artemus
With 48.7% poverty level for males and 53.3% for females among the residents of Artemus, under 5 year old males and under 5 year old females are the most vulnerable to poverty, with 65 males (100.0%) and 10 females (100.0%) in their respective age groups living below the poverty level.
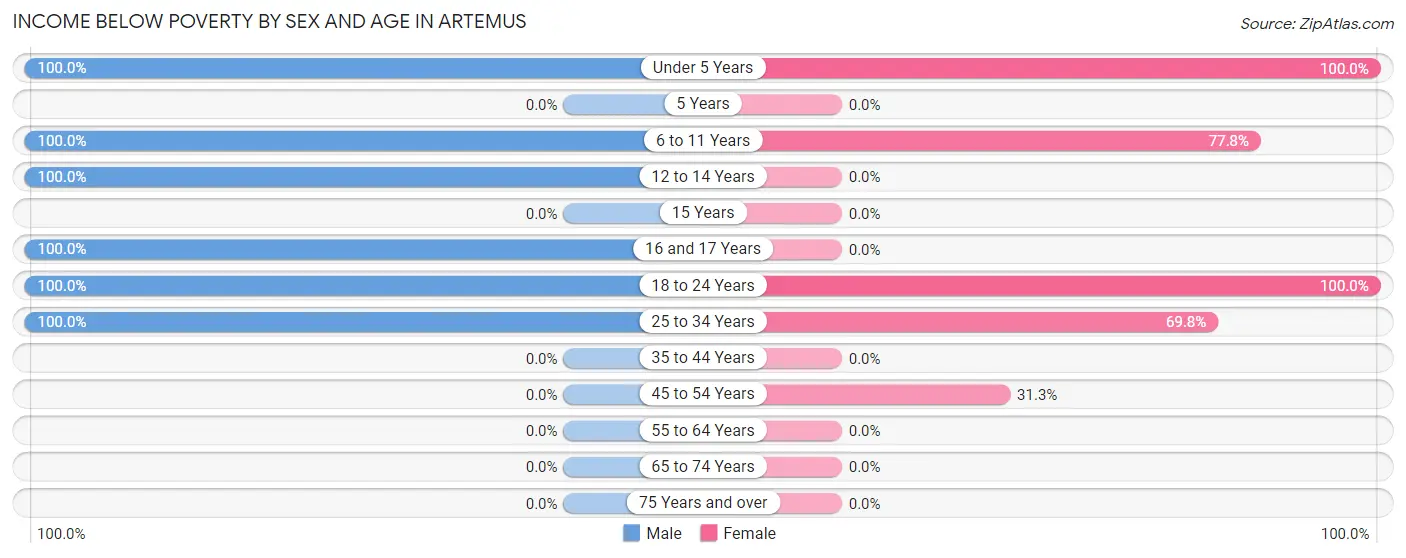
| Age Bracket | Male | Female |
| Under 5 Years | 65 (100.0%) | 10 (100.0%) |
| 5 Years | 0 (0.0%) | 0 (0.0%) |
| 6 to 11 Years | 41 (100.0%) | 42 (77.8%) |
| 12 to 14 Years | 12 (100.0%) | 0 (0.0%) |
| 15 Years | 0 (0.0%) | 0 (0.0%) |
| 16 and 17 Years | 10 (100.0%) | 0 (0.0%) |
| 18 to 24 Years | 35 (100.0%) | 23 (100.0%) |
| 25 to 34 Years | 41 (100.0%) | 44 (69.8%) |
| 35 to 44 Years | 0 (0.0%) | 0 (0.0%) |
| 45 to 54 Years | 0 (0.0%) | 10 (31.2%) |
| 55 to 64 Years | 0 (0.0%) | 0 (0.0%) |
| 65 to 74 Years | 0 (0.0%) | 0 (0.0%) |
| 75 Years and over | 0 (0.0%) | 0 (0.0%) |
| Total | 204 (48.7%) | 129 (53.3%) |
Income Above Poverty by Sex and Age in Artemus
According to the poverty statistics in Artemus, males aged 35 to 44 years and females aged 55 to 64 years are the age groups that are most secure financially, with 100.0% of males and 100.0% of females in these age groups living above the poverty line.
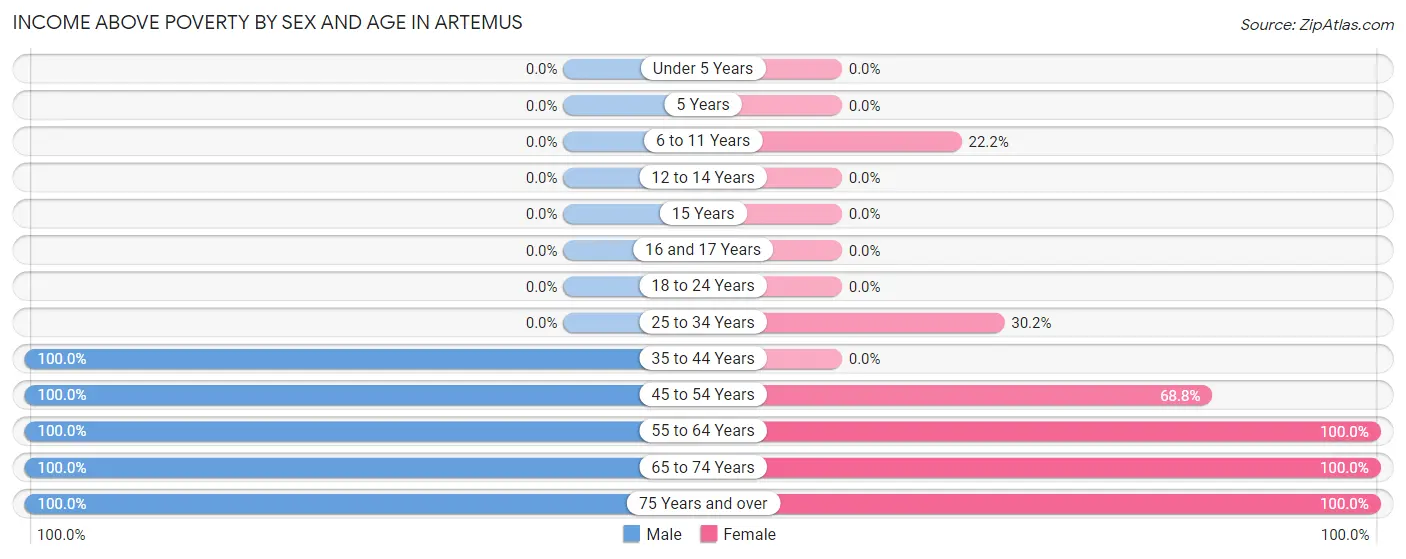
| Age Bracket | Male | Female |
| Under 5 Years | 0 (0.0%) | 0 (0.0%) |
| 5 Years | 0 (0.0%) | 0 (0.0%) |
| 6 to 11 Years | 0 (0.0%) | 12 (22.2%) |
| 12 to 14 Years | 0 (0.0%) | 0 (0.0%) |
| 15 Years | 0 (0.0%) | 0 (0.0%) |
| 16 and 17 Years | 0 (0.0%) | 0 (0.0%) |
| 18 to 24 Years | 0 (0.0%) | 0 (0.0%) |
| 25 to 34 Years | 0 (0.0%) | 19 (30.2%) |
| 35 to 44 Years | 15 (100.0%) | 0 (0.0%) |
| 45 to 54 Years | 21 (100.0%) | 22 (68.8%) |
| 55 to 64 Years | 122 (100.0%) | 7 (100.0%) |
| 65 to 74 Years | 12 (100.0%) | 29 (100.0%) |
| 75 Years and over | 45 (100.0%) | 24 (100.0%) |
| Total | 215 (51.3%) | 113 (46.7%) |
Income Below Poverty Among Married-Couple Families in Artemus
The poverty statistics for married-couple families in Artemus show that 18.5% or 17 of the total 92 families live below the poverty line. Families with 1 or 2 children have the highest poverty rate of 60.7%, comprising of 17 families. On the other hand, families with no children have the lowest poverty rate of 0.0%, which includes 0 families.
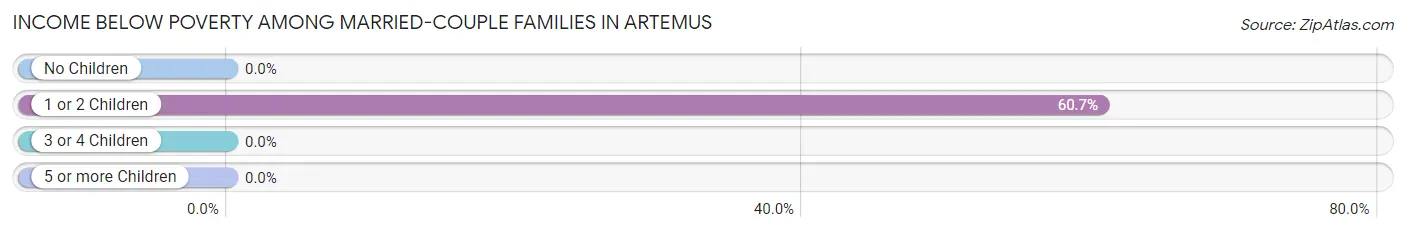
| Children | Above Poverty | Below Poverty |
| No Children | 64 (100.0%) | 0 (0.0%) |
| 1 or 2 Children | 11 (39.3%) | 17 (60.7%) |
| 3 or 4 Children | 0 (0.0%) | 0 (0.0%) |
| 5 or more Children | 0 (0.0%) | 0 (0.0%) |
| Total | 75 (81.5%) | 17 (18.5%) |
Income Below Poverty Among Single-Parent Households in Artemus
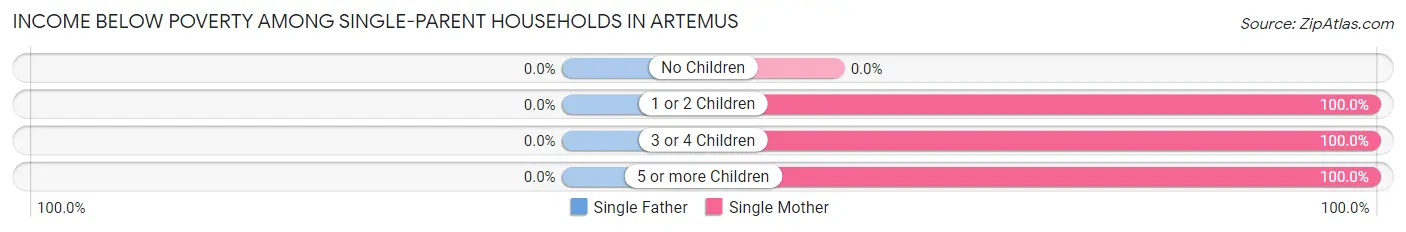
| Children | Single Father | Single Mother |
| No Children | 0 (0.0%) | 0 (0.0%) |
| 1 or 2 Children | 0 (0.0%) | 10 (100.0%) |
| 3 or 4 Children | 0 (0.0%) | 31 (100.0%) |
| 5 or more Children | 0 (0.0%) | 6 (100.0%) |
| Total | 0 (0.0%) | 47 (66.2%) |
Income Below Poverty Among Married-Couple vs Single-Parent Households in Artemus
The poverty data for Artemus shows that 17 of the married-couple family households (18.5%) and 47 of the single-parent households (66.2%) are living below the poverty level. Within the married-couple family households, those with 1 or 2 children have the highest poverty rate, with 17 households (60.7%) falling below the poverty line. Among the single-parent households, those with 1 or 2 children have the highest poverty rate, with 10 household (100.0%) living below poverty.
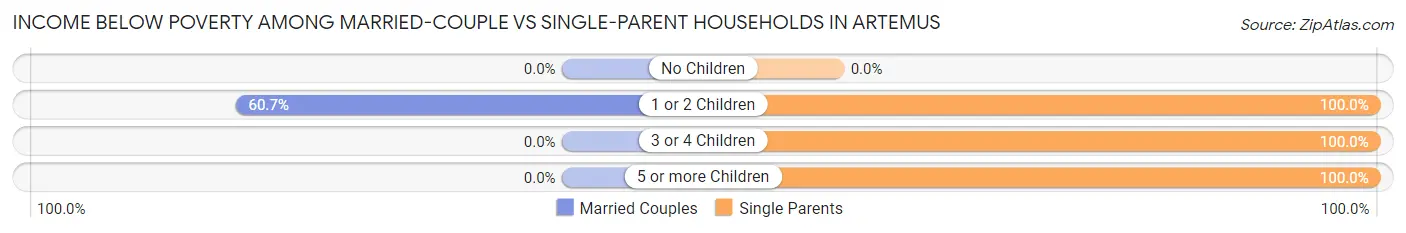
| Children | Married-Couple Families | Single-Parent Households |
| No Children | 0 (0.0%) | 0 (0.0%) |
| 1 or 2 Children | 17 (60.7%) | 10 (100.0%) |
| 3 or 4 Children | 0 (0.0%) | 31 (100.0%) |
| 5 or more Children | 0 (0.0%) | 6 (100.0%) |
| Total | 17 (18.5%) | 47 (66.2%) |
Race in Artemus
The most populous races in Artemus are , and White / Caucasian (689 | 100.0%).
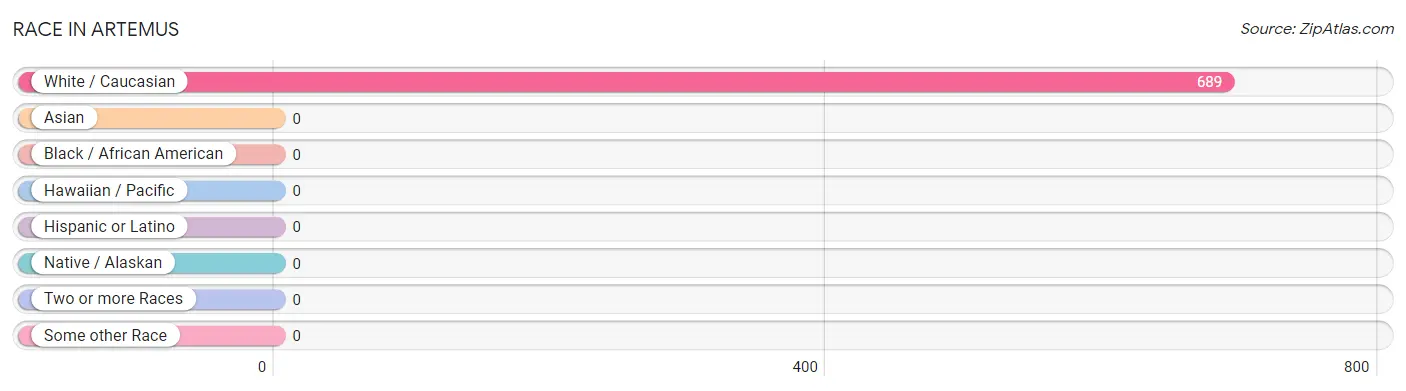
| Race | # Population | % Population |
| Asian | 0 | 0.0% |
| Black / African American | 0 | 0.0% |
| Hawaiian / Pacific | 0 | 0.0% |
| Hispanic or Latino | 0 | 0.0% |
| Native / Alaskan | 0 | 0.0% |
| White / Caucasian | 689 | 100.0% |
| Two or more Races | 0 | 0.0% |
| Some other Race | 0 | 0.0% |
| Total | 689 | 100.0% |
Ancestry in Artemus
The most populous ancestries reported in Artemus are American (191 | 27.7%), Italian (25 | 3.6%), Irish (17 | 2.5%), British (16 | 2.3%), and Scotch-Irish (11 | 1.6%), together accounting for 37.7% of all Artemus residents.
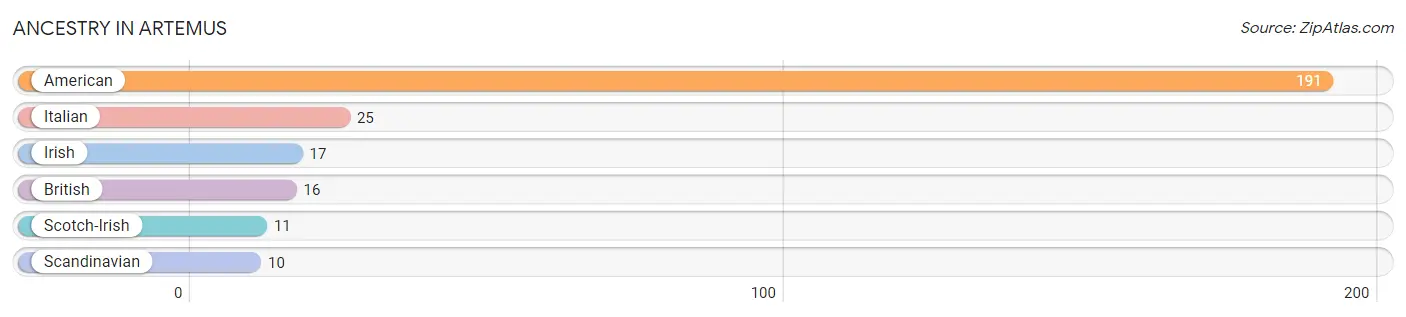
| Ancestry | # Population | % Population |
| American | 191 | 27.7% |
| British | 16 | 2.3% |
| Irish | 17 | 2.5% |
| Italian | 25 | 3.6% |
| Scandinavian | 10 | 1.5% |
| Scotch-Irish | 11 | 1.6% | View All 6 Rows |
Immigrants in Artemus

| Immigration Origin | # Population | % Population | View All 0 Rows |
Sex and Age in Artemus
Sex and Age in Artemus
The most populous age groups in Artemus are 60 to 64 Years (95 | 22.7%) for men and Under 5 Years (38 | 14.1%) for women.
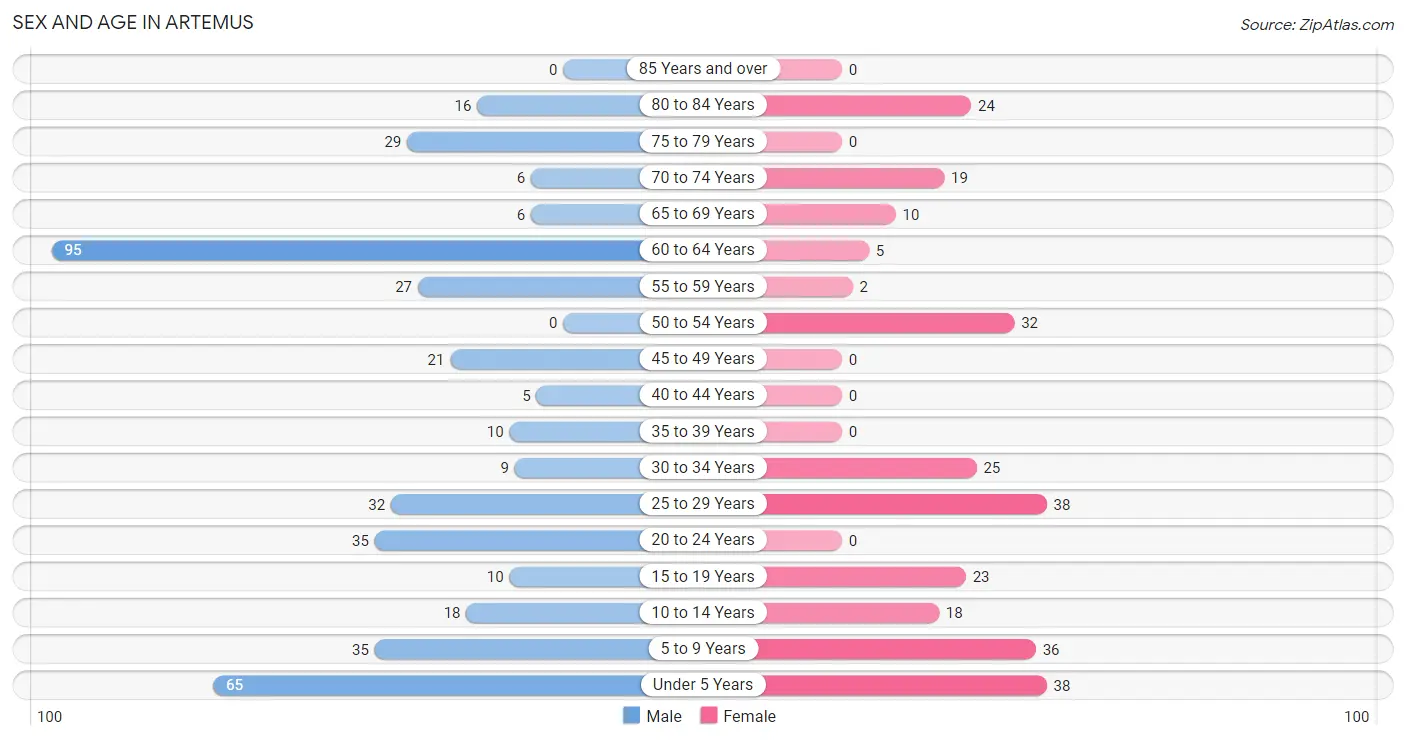
| Age Bracket | Male | Female |
| Under 5 Years | 65 (15.5%) | 38 (14.1%) |
| 5 to 9 Years | 35 (8.4%) | 36 (13.3%) |
| 10 to 14 Years | 18 (4.3%) | 18 (6.7%) |
| 15 to 19 Years | 10 (2.4%) | 23 (8.5%) |
| 20 to 24 Years | 35 (8.4%) | 0 (0.0%) |
| 25 to 29 Years | 32 (7.6%) | 38 (14.1%) |
| 30 to 34 Years | 9 (2.1%) | 25 (9.3%) |
| 35 to 39 Years | 10 (2.4%) | 0 (0.0%) |
| 40 to 44 Years | 5 (1.2%) | 0 (0.0%) |
| 45 to 49 Years | 21 (5.0%) | 0 (0.0%) |
| 50 to 54 Years | 0 (0.0%) | 32 (11.8%) |
| 55 to 59 Years | 27 (6.4%) | 2 (0.7%) |
| 60 to 64 Years | 95 (22.7%) | 5 (1.8%) |
| 65 to 69 Years | 6 (1.4%) | 10 (3.7%) |
| 70 to 74 Years | 6 (1.4%) | 19 (7.0%) |
| 75 to 79 Years | 29 (6.9%) | 0 (0.0%) |
| 80 to 84 Years | 16 (3.8%) | 24 (8.9%) |
| 85 Years and over | 0 (0.0%) | 0 (0.0%) |
| Total | 419 (100.0%) | 270 (100.0%) |
Families and Households in Artemus
Median Family Size in Artemus
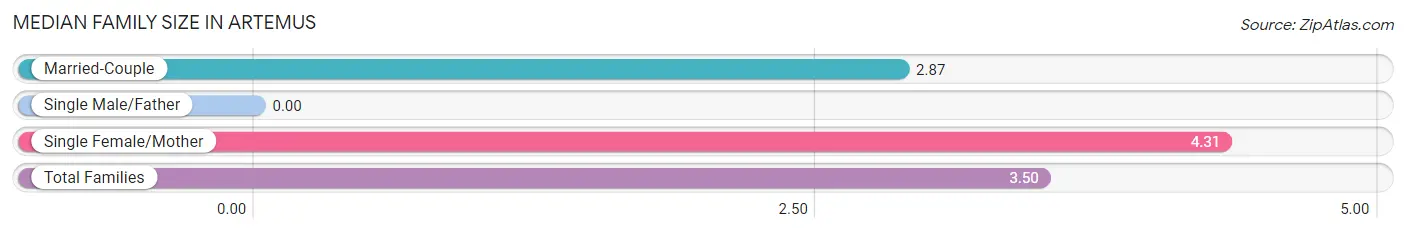
| Family Type | # Families | Family Size |
| Married-Couple | 92 (56.4%) | 2.87 |
| Single Male/Father | 0 (0.0%) | - |
| Single Female/Mother | 71 (43.6%) | 4.31 |
| Total Families | 163 (100.0%) | 3.50 |
Median Household Size in Artemus
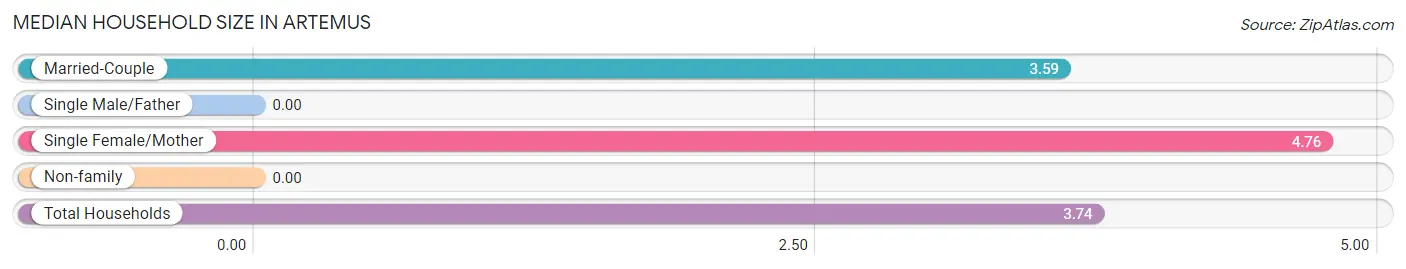
| Household Type | # Households | Household Size |
| Married-Couple | 92 (50.0%) | 3.59 |
| Single Male/Father | 0 (0.0%) | - |
| Single Female/Mother | 71 (38.6%) | 4.76 |
| Non-family | 21 (11.4%) | - |
| Total Households | 184 (100.0%) | 3.74 |
Household Size by Marriage Status in Artemus
Out of a total of 184 households in Artemus, 163 (88.6%) are family households, while 21 (11.4%) are nonfamily households. The most numerous type of family households are 2-person households, comprising 58, and the most common type of nonfamily households are 1-person households, comprising 21.
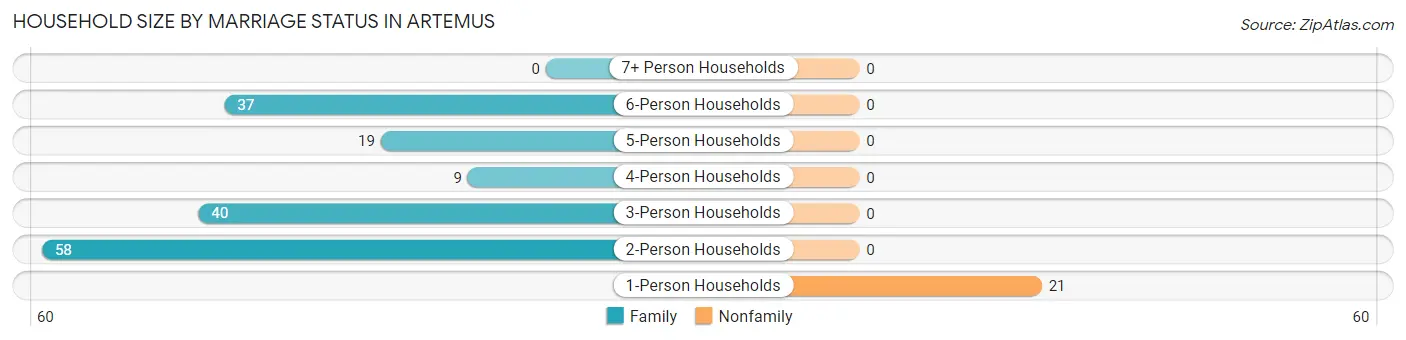
| Household Size | Family Households | Nonfamily Households |
| 1-Person Households | - | 21 (11.4%) |
| 2-Person Households | 58 (31.5%) | 0 (0.0%) |
| 3-Person Households | 40 (21.7%) | 0 (0.0%) |
| 4-Person Households | 9 (4.9%) | 0 (0.0%) |
| 5-Person Households | 19 (10.3%) | 0 (0.0%) |
| 6-Person Households | 37 (20.1%) | 0 (0.0%) |
| 7+ Person Households | 0 (0.0%) | 0 (0.0%) |
| Total | 163 (88.6%) | 21 (11.4%) |
Female Fertility in Artemus
Fertility by Age in Artemus
Average fertility rate in Artemus is 453.0 births per 1,000 women. Women in the age bracket of 20 to 34 years have the highest fertility rate with 492.0 births per 1,000 women. Women in the age bracket of 20 to 34 years acount for 79.5% of all women with births.
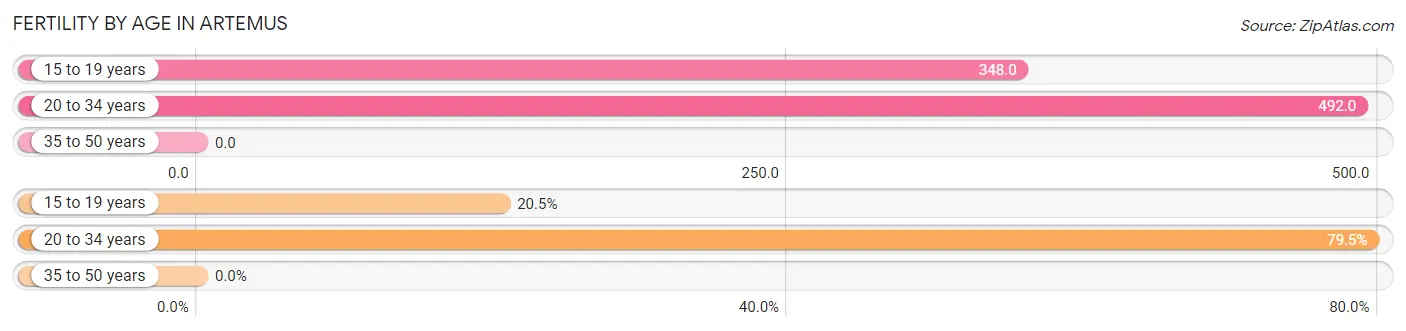
| Age Bracket | Women with Births | Births / 1,000 Women |
| 15 to 19 years | 8 (20.5%) | 348.0 |
| 20 to 34 years | 31 (79.5%) | 492.0 |
| 35 to 50 years | 0 (0.0%) | 0.0 |
| Total | 39 (100.0%) | 453.0 |
Fertility by Age by Marriage Status in Artemus
20.5% of women with births (39) in Artemus are married. The highest percentage of unmarried women with births falls into 20 to 34 years age bracket with 100.0% of them unmarried at the time of birth, while the lowest percentage of unmarried women with births belong to 15 to 19 years age bracket with 0.0% of them unmarried.
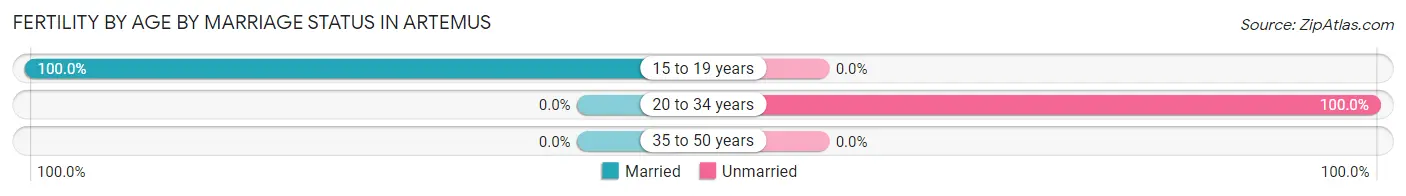
| Age Bracket | Married | Unmarried |
| 15 to 19 years | 8 (100.0%) | 0 (0.0%) |
| 20 to 34 years | 0 (0.0%) | 31 (100.0%) |
| 35 to 50 years | 0 (0.0%) | 0 (0.0%) |
| Total | 8 (20.5%) | 31 (79.5%) |
Fertility by Education in Artemus
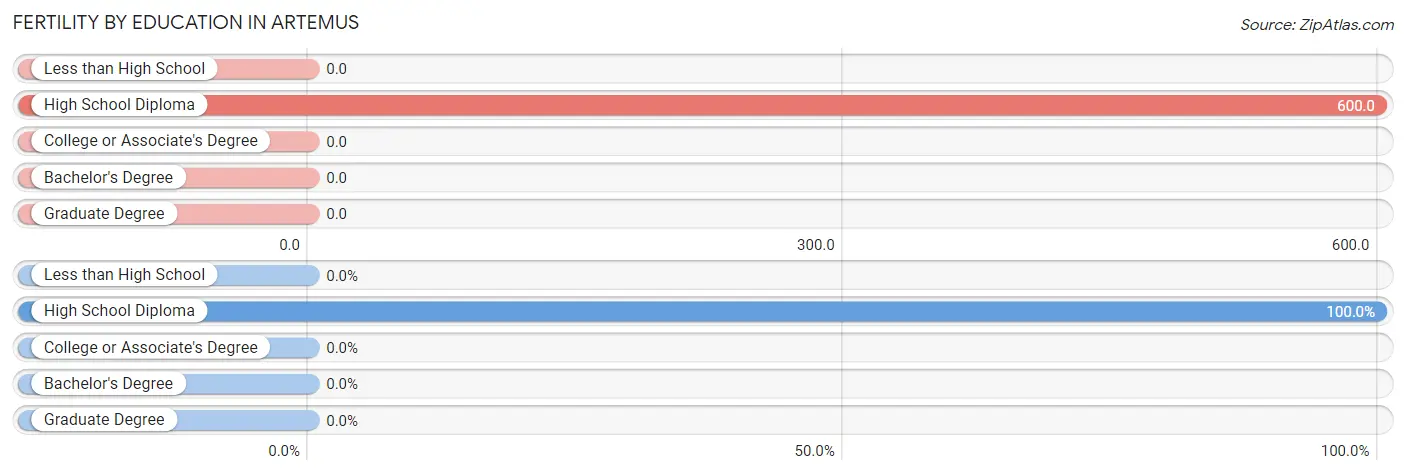
| Educational Attainment | Women with Births | Births / 1,000 Women |
| Less than High School | 0 (0.0%) | 0.0 |
| High School Diploma | 39 (100.0%) | 600.0 |
| College or Associate's Degree | 0 (0.0%) | 0.0 |
| Bachelor's Degree | 0 (0.0%) | 0.0 |
| Graduate Degree | 0 (0.0%) | 0.0 |
| Total | 39 (100.0%) | 453.0 |
Fertility by Education by Marriage Status in Artemus
79.5% of women with births in Artemus are unmarried. Women with the educational attainment of high school diploma are most likely to be married with 20.5% of them married at childbirth, while women with the educational attainment of high school diploma are least likely to be married with 79.5% of them unmarried at childbirth.
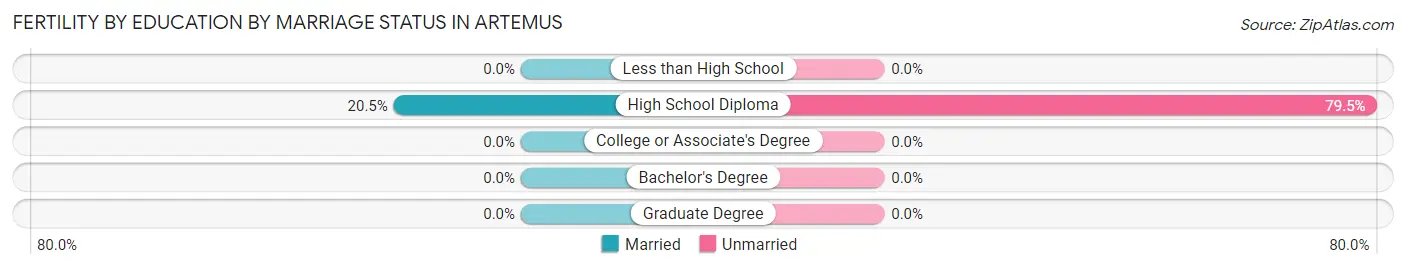
| Educational Attainment | Married | Unmarried |
| Less than High School | 0 (0.0%) | 0 (0.0%) |
| High School Diploma | 8 (20.5%) | 31 (79.5%) |
| College or Associate's Degree | 0 (0.0%) | 0 (0.0%) |
| Bachelor's Degree | 0 (0.0%) | 0 (0.0%) |
| Graduate Degree | 0 (0.0%) | 0 (0.0%) |
| Total | 8 (20.5%) | 31 (79.5%) |
Employment Characteristics in Artemus
Employment by Class of Employer in Artemus
Among the 126 employed individuals in Artemus, private company employees (104 | 82.5%), and local government employees (22 | 17.5%) make up the most common classes of employment.
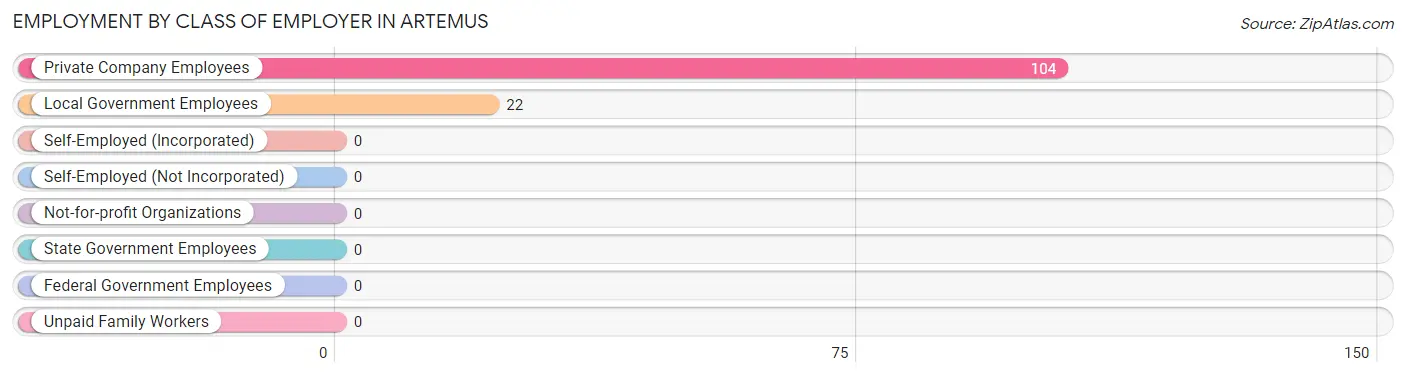
| Employer Class | # Employees | % Employees |
| Private Company Employees | 104 | 82.5% |
| Self-Employed (Incorporated) | 0 | 0.0% |
| Self-Employed (Not Incorporated) | 0 | 0.0% |
| Not-for-profit Organizations | 0 | 0.0% |
| Local Government Employees | 22 | 17.5% |
| State Government Employees | 0 | 0.0% |
| Federal Government Employees | 0 | 0.0% |
| Unpaid Family Workers | 0 | 0.0% |
| Total | 126 | 100.0% |
Employment Status by Age in Artemus
According to the labor force statistics for Artemus, out of the total population over 16 years of age (479), 46.8% or 224 individuals are in the labor force, with 24.6% or 55 of them unemployed. The age group with the highest labor force participation rate is 20 to 24 years, with 100.0% or 35 individuals in the labor force. Within the labor force, the 20 to 24 years age range has the highest percentage of unemployed individuals, with 65.7% or 23 of them being unemployed.
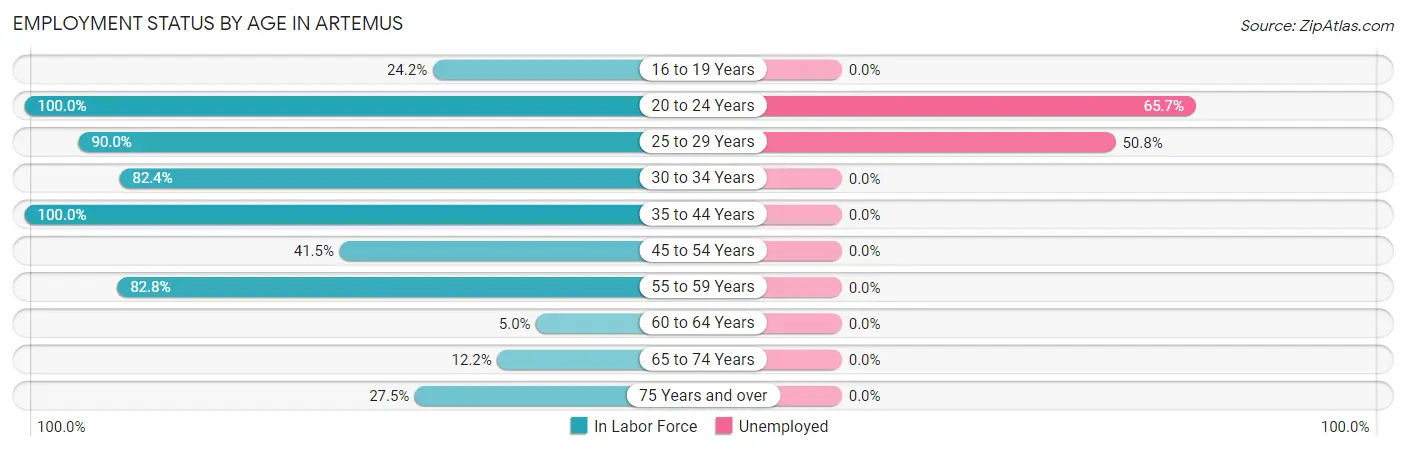
| Age Bracket | In Labor Force | Unemployed |
| 16 to 19 Years | 8 (24.2%) | 0 (0.0%) |
| 20 to 24 Years | 35 (100.0%) | 23 (65.7%) |
| 25 to 29 Years | 63 (90.0%) | 32 (50.8%) |
| 30 to 34 Years | 28 (82.4%) | 0 (0.0%) |
| 35 to 44 Years | 15 (100.0%) | 0 (0.0%) |
| 45 to 54 Years | 22 (41.5%) | 0 (0.0%) |
| 55 to 59 Years | 24 (82.8%) | 0 (0.0%) |
| 60 to 64 Years | 5 (5.0%) | 0 (0.0%) |
| 65 to 74 Years | 5 (12.2%) | 0 (0.0%) |
| 75 Years and over | 19 (27.5%) | 0 (0.0%) |
| Total | 224 (46.8%) | 55 (24.6%) |
Employment Status by Educational Attainment in Artemus
According to labor force statistics for Artemus, 52.2% of individuals (157) out of the total population between 25 and 64 years of age (301) are in the labor force, with 20.4% or 32 of them being unemployed. The group with the highest labor force participation rate are those with the educational attainment of bachelor's degree or higher, with 100.0% or 5 individuals in the labor force. Within the labor force, individuals with high school diploma education have the highest percentage of unemployment, with 21.8% or 32 of them being unemployed.
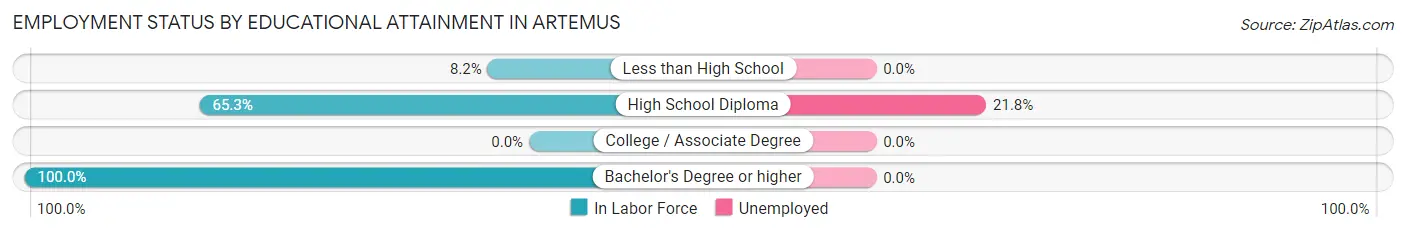
| Educational Attainment | In Labor Force | Unemployed |
| Less than High School | 5 (8.2%) | 0 (0.0%) |
| High School Diploma | 147 (65.3%) | 49 (21.8%) |
| College / Associate Degree | 0 (0.0%) | 0 (0.0%) |
| Bachelor's Degree or higher | 5 (100.0%) | 0 (0.0%) |
| Total | 157 (52.2%) | 61 (20.4%) |
Employment Occupations by Sex in Artemus
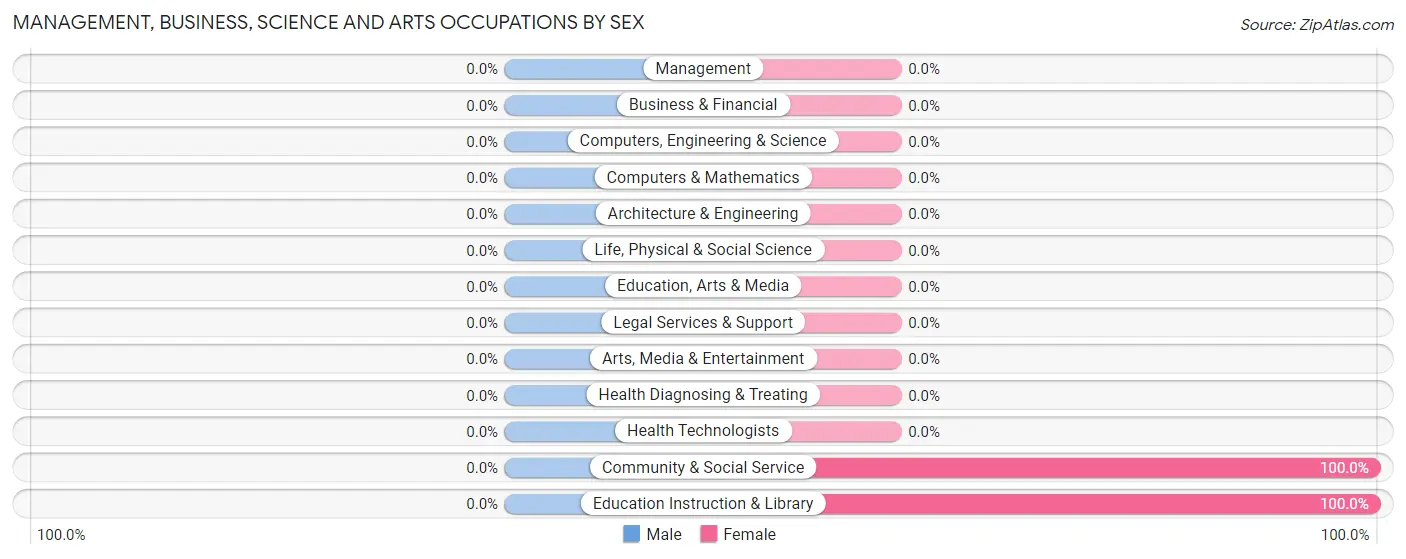
Management, Business, Science and Arts Occupations
The most common Management, Business, Science and Arts occupations in Artemus are Community & Social Service (31 | 18.3%), and Education Instruction & Library (31 | 18.3%).
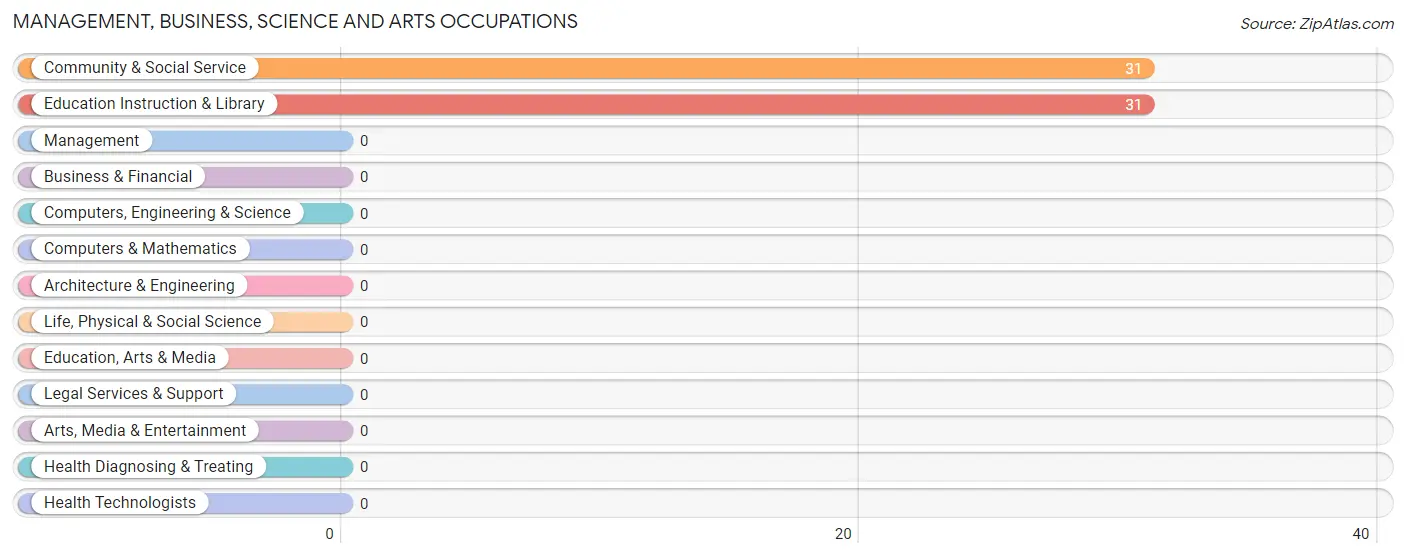
Management, Business, Science and Arts Occupations by Sex
| Occupation | Male | Female |
| Management | 0 (0.0%) | 0 (0.0%) |
| Business & Financial | 0 (0.0%) | 0 (0.0%) |
| Computers, Engineering & Science | 0 (0.0%) | 0 (0.0%) |
| Computers & Mathematics | 0 (0.0%) | 0 (0.0%) |
| Architecture & Engineering | 0 (0.0%) | 0 (0.0%) |
| Life, Physical & Social Science | 0 (0.0%) | 0 (0.0%) |
| Community & Social Service | 0 (0.0%) | 31 (100.0%) |
| Education, Arts & Media | 0 (0.0%) | 0 (0.0%) |
| Legal Services & Support | 0 (0.0%) | 0 (0.0%) |
| Education Instruction & Library | 0 (0.0%) | 31 (100.0%) |
| Arts, Media & Entertainment | 0 (0.0%) | 0 (0.0%) |
| Health Diagnosing & Treating | 0 (0.0%) | 0 (0.0%) |
| Health Technologists | 0 (0.0%) | 0 (0.0%) |
| Total (Category) | 0 (0.0%) | 31 (100.0%) |
| Total (Overall) | 79 (46.8%) | 90 (53.2%) |
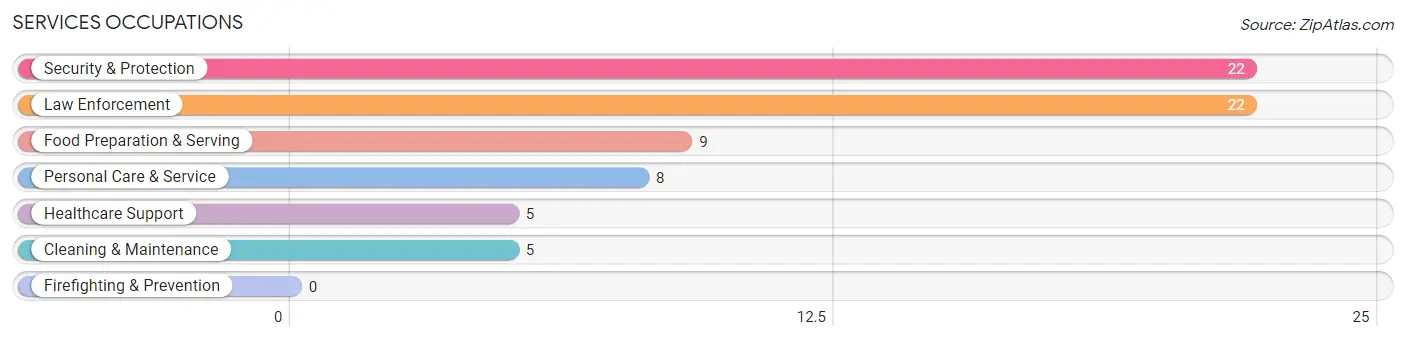
Services Occupations
The most common Services occupations in Artemus are Security & Protection (22 | 13.0%), Law Enforcement (22 | 13.0%), Food Preparation & Serving (9 | 5.3%), Personal Care & Service (8 | 4.7%), and Healthcare Support (5 | 3.0%).
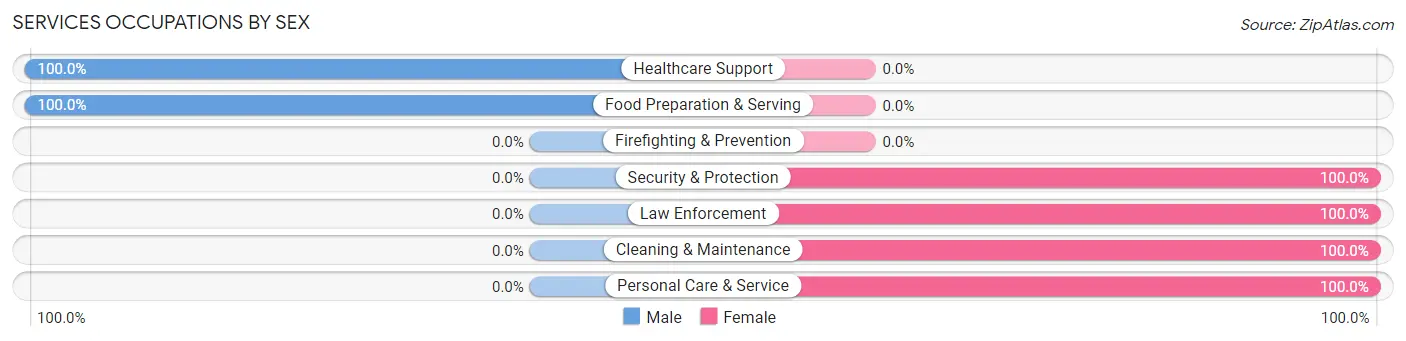
Services Occupations by Sex
Within the Services occupations in Artemus, the most male-oriented occupations are Healthcare Support (100.0%), and Food Preparation & Serving (100.0%), while the most female-oriented occupations are Security & Protection (100.0%), Law Enforcement (100.0%), and Cleaning & Maintenance (100.0%).
| Occupation | Male | Female |
| Healthcare Support | 5 (100.0%) | 0 (0.0%) |
| Security & Protection | 0 (0.0%) | 22 (100.0%) |
| Firefighting & Prevention | 0 (0.0%) | 0 (0.0%) |
| Law Enforcement | 0 (0.0%) | 22 (100.0%) |
| Food Preparation & Serving | 9 (100.0%) | 0 (0.0%) |
| Cleaning & Maintenance | 0 (0.0%) | 5 (100.0%) |
| Personal Care & Service | 0 (0.0%) | 8 (100.0%) |
| Total (Category) | 14 (28.6%) | 35 (71.4%) |
| Total (Overall) | 79 (46.8%) | 90 (53.2%) |
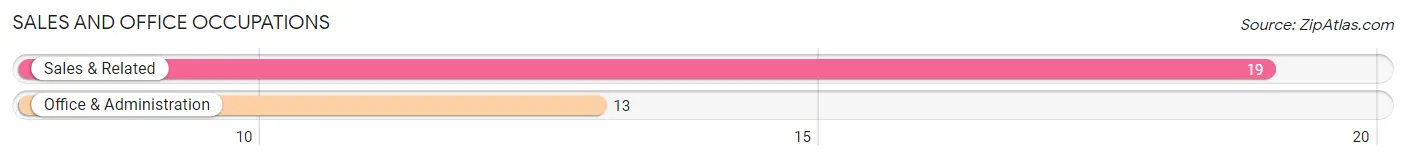
Sales and Office Occupations
The most common Sales and Office occupations in Artemus are Sales & Related (19 | 11.2%), and Office & Administration (13 | 7.7%).
Sales and Office Occupations by Sex
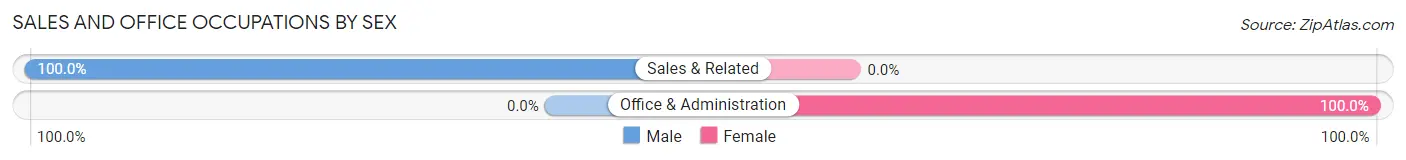
| Occupation | Male | Female |
| Sales & Related | 19 (100.0%) | 0 (0.0%) |
| Office & Administration | 0 (0.0%) | 13 (100.0%) |
| Total (Category) | 19 (59.4%) | 13 (40.6%) |
| Total (Overall) | 79 (46.8%) | 90 (53.2%) |
Natural Resources, Construction and Maintenance Occupations
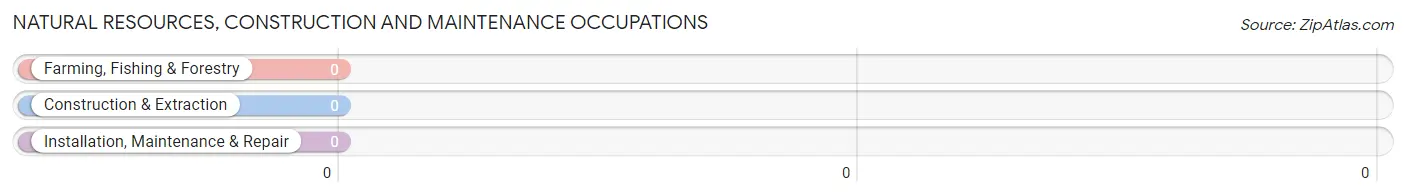
Natural Resources, Construction and Maintenance Occupations by Sex
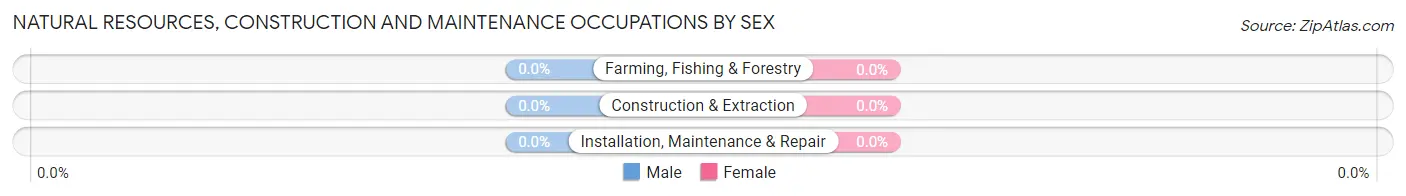
| Occupation | Male | Female |
| Farming, Fishing & Forestry | 0 (0.0%) | 0 (0.0%) |
| Construction & Extraction | 0 (0.0%) | 0 (0.0%) |
| Installation, Maintenance & Repair | 0 (0.0%) | 0 (0.0%) |
| Total (Category) | 0 (0.0%) | 0 (0.0%) |
| Total (Overall) | 79 (46.8%) | 90 (53.2%) |
Production, Transportation and Moving Occupations
The most common Production, Transportation and Moving occupations in Artemus are Production (35 | 20.7%), Material Moving (12 | 7.1%), and Transportation (10 | 5.9%).
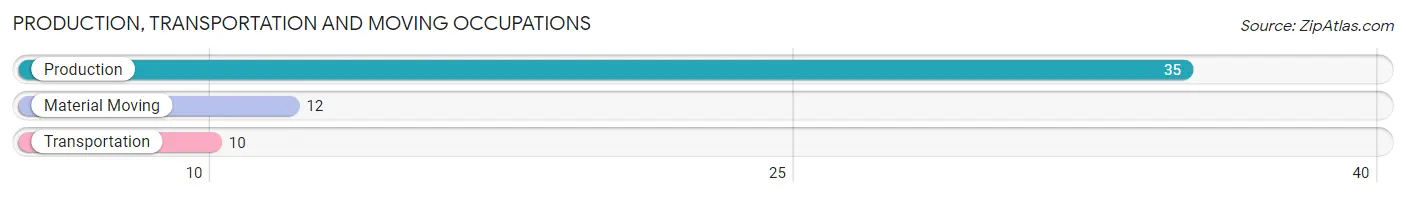
Production, Transportation and Moving Occupations by Sex
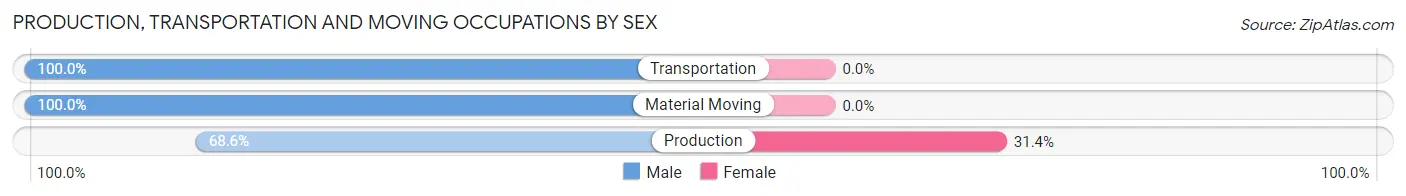
| Occupation | Male | Female |
| Production | 24 (68.6%) | 11 (31.4%) |
| Transportation | 10 (100.0%) | 0 (0.0%) |
| Material Moving | 12 (100.0%) | 0 (0.0%) |
| Total (Category) | 46 (80.7%) | 11 (19.3%) |
| Total (Overall) | 79 (46.8%) | 90 (53.2%) |
Employment Industries by Sex in Artemus
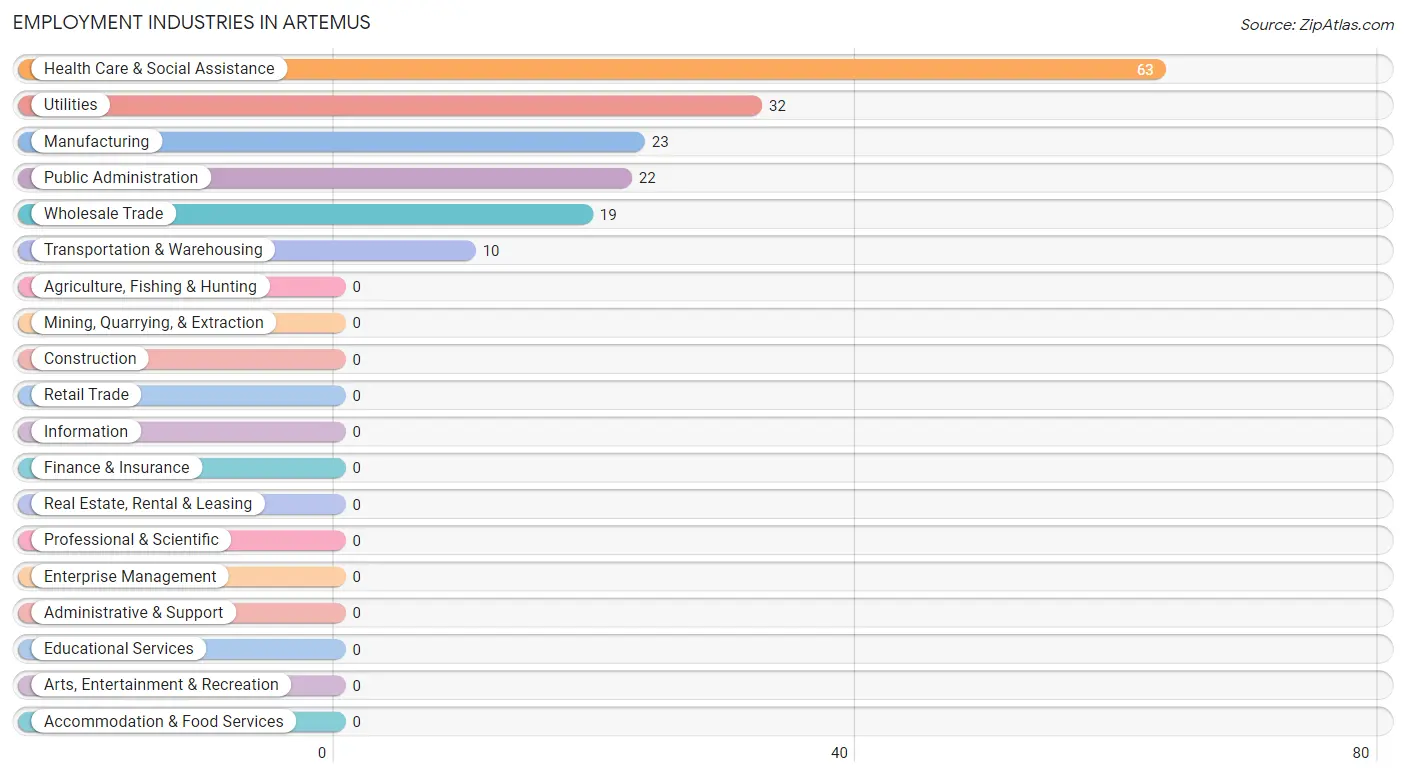
Employment Industries in Artemus
The major employment industries in Artemus include Health Care & Social Assistance (63 | 37.3%), Utilities (32 | 18.9%), Manufacturing (23 | 13.6%), Public Administration (22 | 13.0%), and Wholesale Trade (19 | 11.2%).
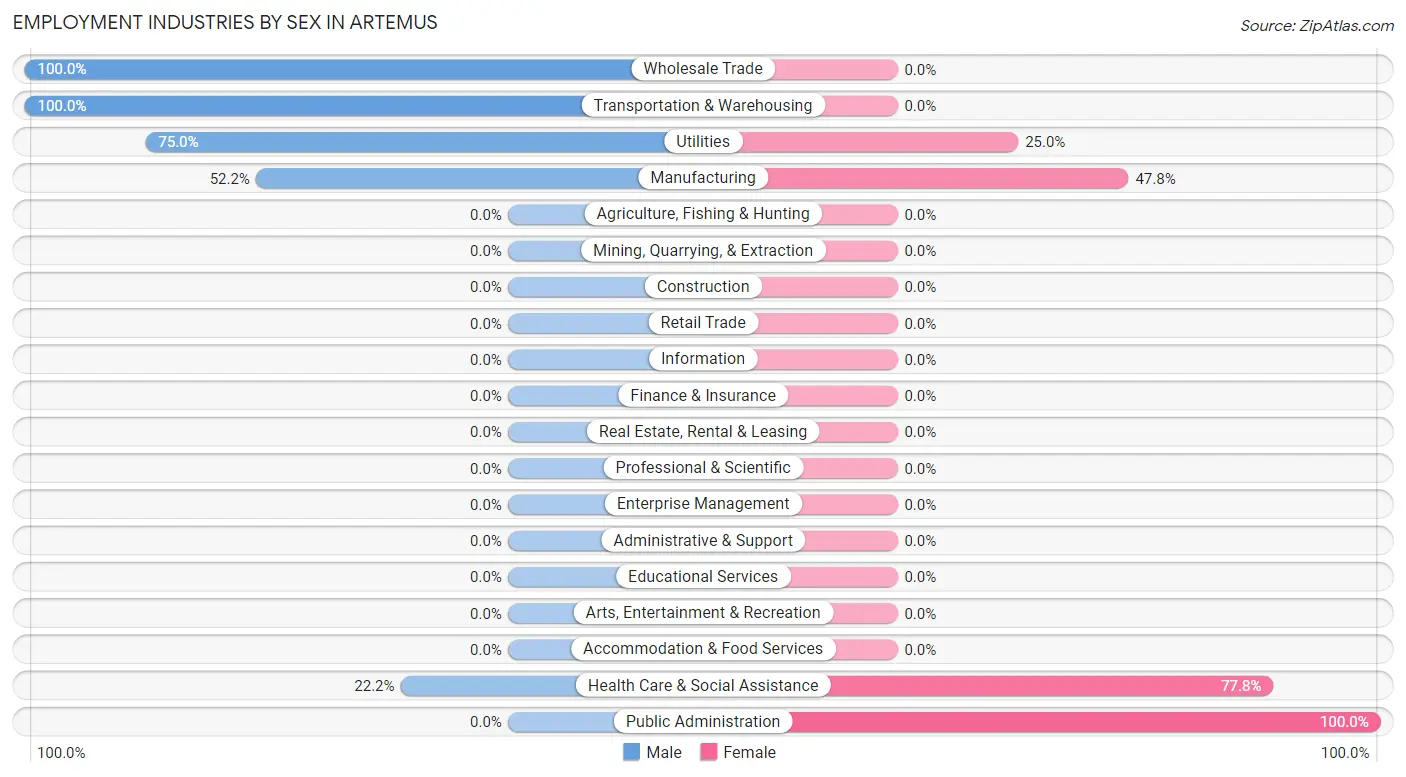
Employment Industries by Sex in Artemus
The Artemus industries that see more men than women are Wholesale Trade (100.0%), Transportation & Warehousing (100.0%), and Utilities (75.0%), whereas the industries that tend to have a higher number of women are Public Administration (100.0%), Health Care & Social Assistance (77.8%), and Manufacturing (47.8%).
| Industry | Male | Female |
| Agriculture, Fishing & Hunting | 0 (0.0%) | 0 (0.0%) |
| Mining, Quarrying, & Extraction | 0 (0.0%) | 0 (0.0%) |
| Construction | 0 (0.0%) | 0 (0.0%) |
| Manufacturing | 12 (52.2%) | 11 (47.8%) |
| Wholesale Trade | 19 (100.0%) | 0 (0.0%) |
| Retail Trade | 0 (0.0%) | 0 (0.0%) |
| Transportation & Warehousing | 10 (100.0%) | 0 (0.0%) |
| Utilities | 24 (75.0%) | 8 (25.0%) |
| Information | 0 (0.0%) | 0 (0.0%) |
| Finance & Insurance | 0 (0.0%) | 0 (0.0%) |
| Real Estate, Rental & Leasing | 0 (0.0%) | 0 (0.0%) |
| Professional & Scientific | 0 (0.0%) | 0 (0.0%) |
| Enterprise Management | 0 (0.0%) | 0 (0.0%) |
| Administrative & Support | 0 (0.0%) | 0 (0.0%) |
| Educational Services | 0 (0.0%) | 0 (0.0%) |
| Health Care & Social Assistance | 14 (22.2%) | 49 (77.8%) |
| Arts, Entertainment & Recreation | 0 (0.0%) | 0 (0.0%) |
| Accommodation & Food Services | 0 (0.0%) | 0 (0.0%) |
| Public Administration | 0 (0.0%) | 22 (100.0%) |
| Total | 79 (46.8%) | 90 (53.2%) |
Education in Artemus
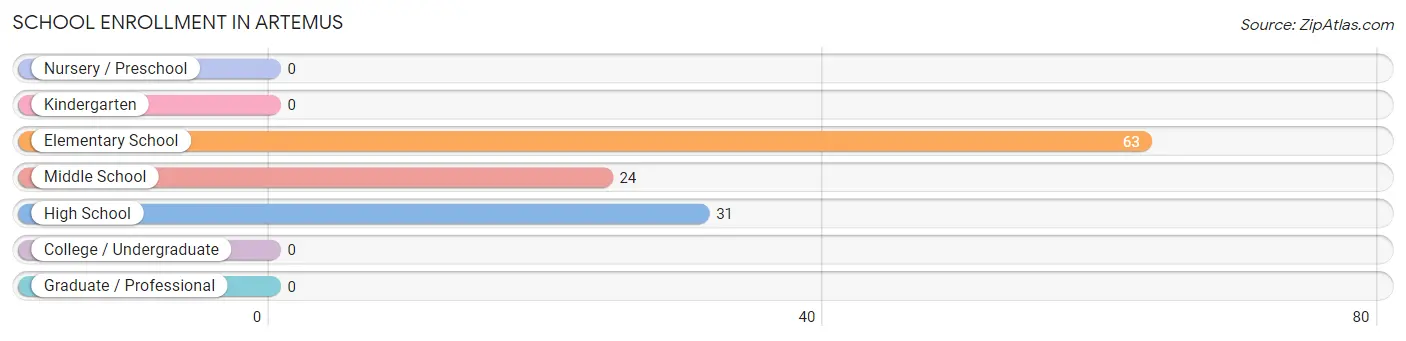
School Enrollment in Artemus
The most common levels of schooling among the 118 students in Artemus are elementary school (63 | 53.4%), high school (31 | 26.3%), and middle school (24 | 20.3%).
| School Level | # Students | % Students |
| Nursery / Preschool | 0 | 0.0% |
| Kindergarten | 0 | 0.0% |
| Elementary School | 63 | 53.4% |
| Middle School | 24 | 20.3% |
| High School | 31 | 26.3% |
| College / Undergraduate | 0 | 0.0% |
| Graduate / Professional | 0 | 0.0% |
| Total | 118 | 100.0% |
School Enrollment by Age by Funding Source in Artemus
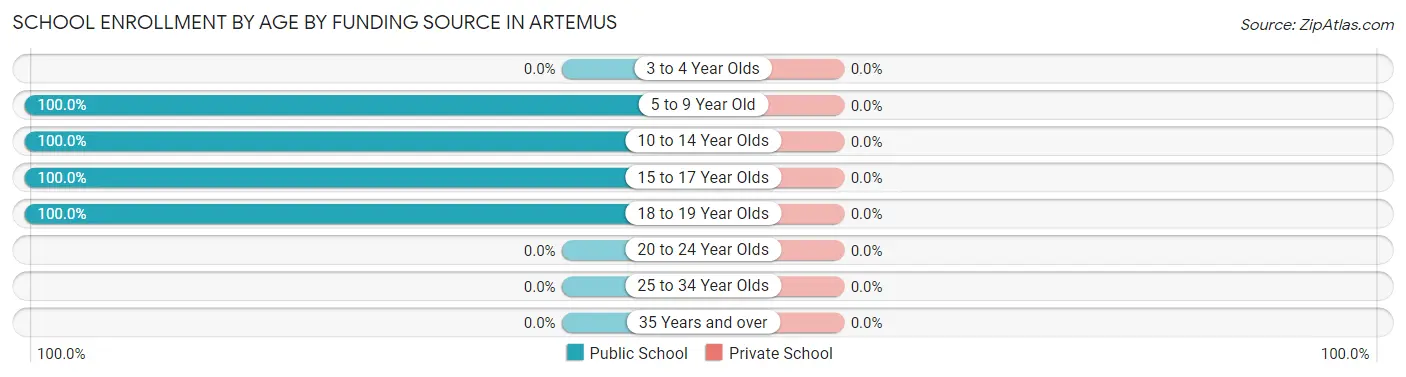
| Age Bracket | Public School | Private School |
| 3 to 4 Year Olds | 0 (0.0%) | 0 (0.0%) |
| 5 to 9 Year Old | 57 (100.0%) | 0 (0.0%) |
| 10 to 14 Year Olds | 36 (100.0%) | 0 (0.0%) |
| 15 to 17 Year Olds | 10 (100.0%) | 0 (0.0%) |
| 18 to 19 Year Olds | 15 (100.0%) | 0 (0.0%) |
| 20 to 24 Year Olds | 0 (0.0%) | 0 (0.0%) |
| 25 to 34 Year Olds | 0 (0.0%) | 0 (0.0%) |
| 35 Years and over | 0 (0.0%) | 0 (0.0%) |
| Total | 118 (100.0%) | 0 (0.0%) |
Educational Attainment by Field of Study in Artemus
, and business (5 | 100.0%) are the most common fields of study among 5 individuals in Artemus who have obtained a bachelor's degree or higher.
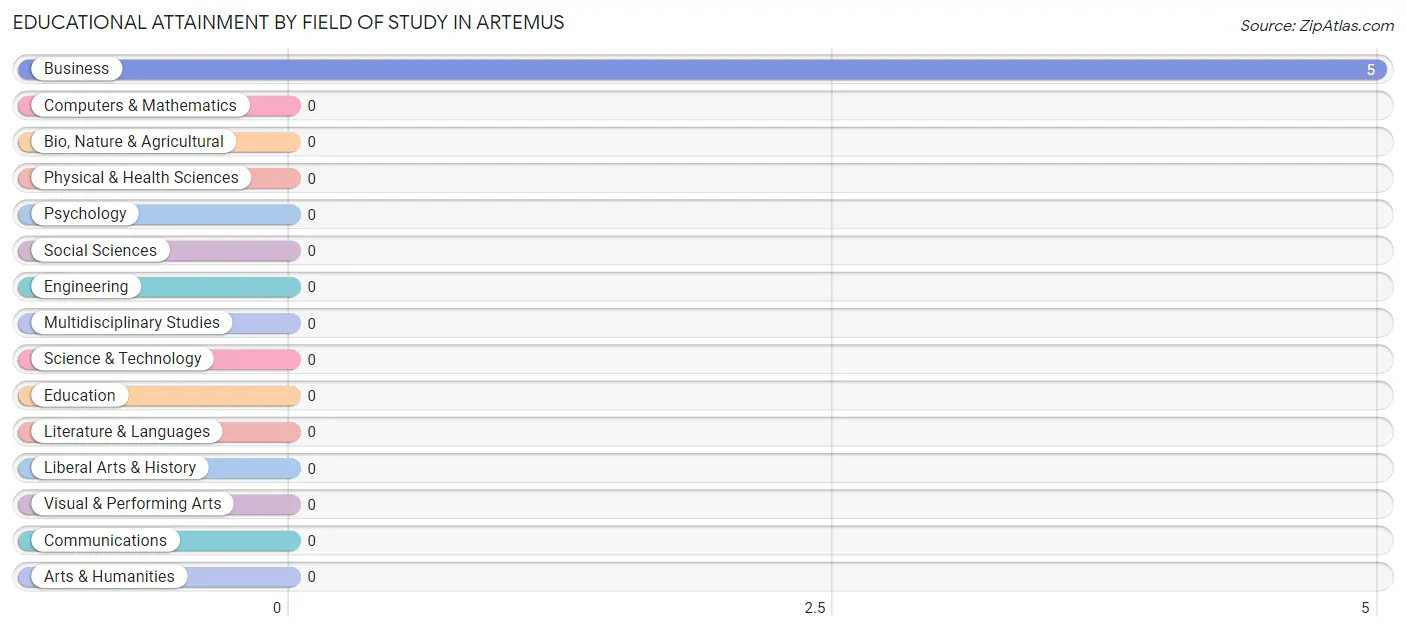
| Field of Study | # Graduates | % Graduates |
| Computers & Mathematics | 0 | 0.0% |
| Bio, Nature & Agricultural | 0 | 0.0% |
| Physical & Health Sciences | 0 | 0.0% |
| Psychology | 0 | 0.0% |
| Social Sciences | 0 | 0.0% |
| Engineering | 0 | 0.0% |
| Multidisciplinary Studies | 0 | 0.0% |
| Science & Technology | 0 | 0.0% |
| Business | 5 | 100.0% |
| Education | 0 | 0.0% |
| Literature & Languages | 0 | 0.0% |
| Liberal Arts & History | 0 | 0.0% |
| Visual & Performing Arts | 0 | 0.0% |
| Communications | 0 | 0.0% |
| Arts & Humanities | 0 | 0.0% |
| Total | 5 | 100.0% |
Transportation & Commute in Artemus
Vehicle Availability by Sex in Artemus
The most prevalent vehicle ownership categories in Artemus are males with 4 vehicles (53, accounting for 79.1%) and females with 4 vehicles (38, making up 89.8%).
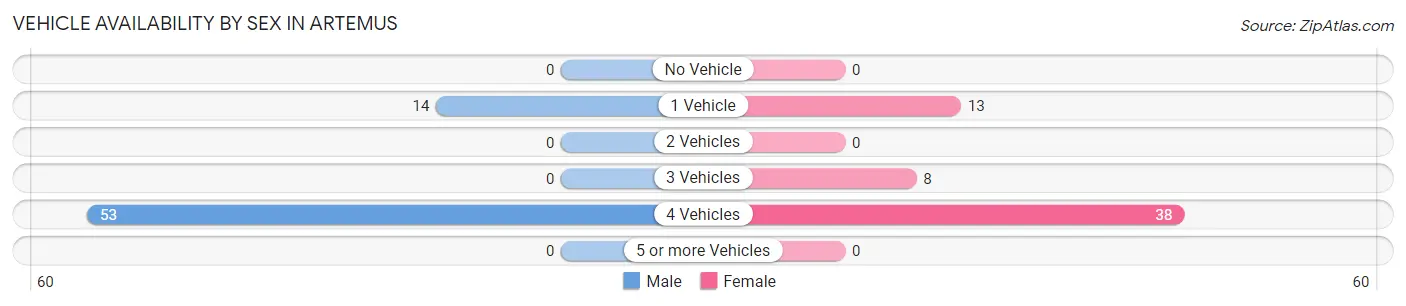
| Vehicles Available | Male | Female |
| No Vehicle | 0 (0.0%) | 0 (0.0%) |
| 1 Vehicle | 14 (20.9%) | 13 (22.0%) |
| 2 Vehicles | 0 (0.0%) | 0 (0.0%) |
| 3 Vehicles | 0 (0.0%) | 8 (13.6%) |
| 4 Vehicles | 53 (79.1%) | 38 (64.4%) |
| 5 or more Vehicles | 0 (0.0%) | 0 (0.0%) |
| Total | 67 (100.0%) | 59 (100.0%) |
Commute Time in Artemus
The most frequently occuring commute durations in Artemus are 20 to 24 minutes (37 commuters, 29.4%), 15 to 19 minutes (33 commuters, 26.2%), and 30 to 34 minutes (28 commuters, 22.2%).
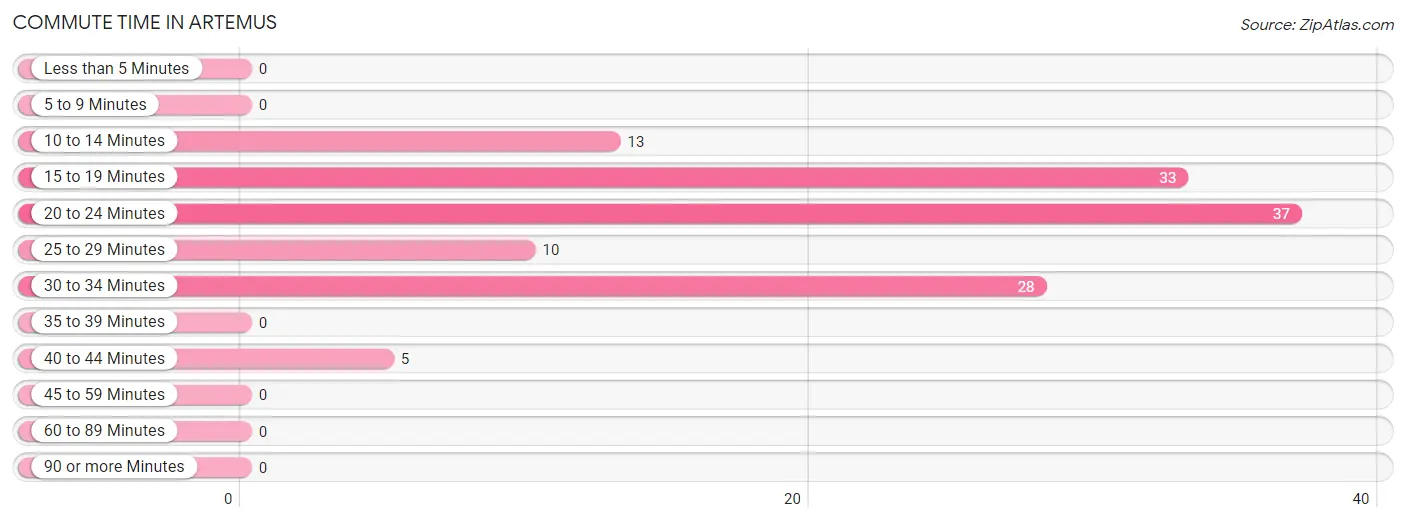
| Commute Time | # Commuters | % Commuters |
| Less than 5 Minutes | 0 | 0.0% |
| 5 to 9 Minutes | 0 | 0.0% |
| 10 to 14 Minutes | 13 | 10.3% |
| 15 to 19 Minutes | 33 | 26.2% |
| 20 to 24 Minutes | 37 | 29.4% |
| 25 to 29 Minutes | 10 | 7.9% |
| 30 to 34 Minutes | 28 | 22.2% |
| 35 to 39 Minutes | 0 | 0.0% |
| 40 to 44 Minutes | 5 | 4.0% |
| 45 to 59 Minutes | 0 | 0.0% |
| 60 to 89 Minutes | 0 | 0.0% |
| 90 or more Minutes | 0 | 0.0% |
Commute Time by Sex in Artemus
The most common commute times in Artemus are 30 to 34 minutes (28 commuters, 41.8%) for males and 15 to 19 minutes (33 commuters, 55.9%) for females.
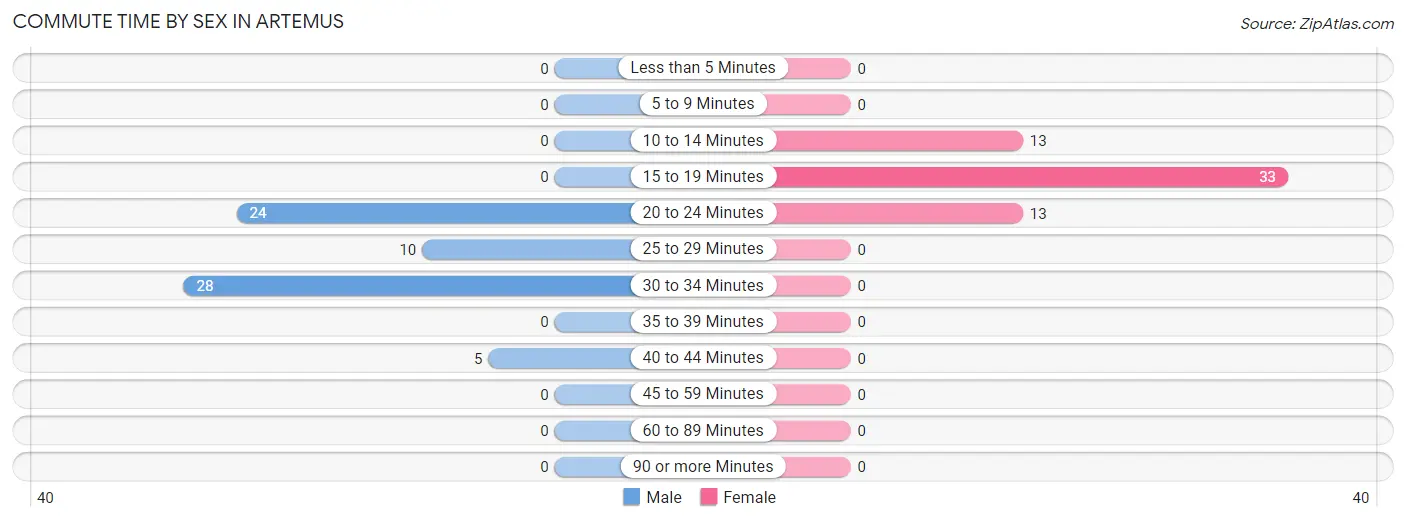
| Commute Time | Male | Female |
| Less than 5 Minutes | 0 (0.0%) | 0 (0.0%) |
| 5 to 9 Minutes | 0 (0.0%) | 0 (0.0%) |
| 10 to 14 Minutes | 0 (0.0%) | 13 (22.0%) |
| 15 to 19 Minutes | 0 (0.0%) | 33 (55.9%) |
| 20 to 24 Minutes | 24 (35.8%) | 13 (22.0%) |
| 25 to 29 Minutes | 10 (14.9%) | 0 (0.0%) |
| 30 to 34 Minutes | 28 (41.8%) | 0 (0.0%) |
| 35 to 39 Minutes | 0 (0.0%) | 0 (0.0%) |
| 40 to 44 Minutes | 5 (7.5%) | 0 (0.0%) |
| 45 to 59 Minutes | 0 (0.0%) | 0 (0.0%) |
| 60 to 89 Minutes | 0 (0.0%) | 0 (0.0%) |
| 90 or more Minutes | 0 (0.0%) | 0 (0.0%) |
Time of Departure to Work by Sex in Artemus
The most frequent times of departure to work in Artemus are 7:00 AM to 7:29 AM (38, 56.7%) for males and 7:00 AM to 7:29 AM (41, 69.5%) for females.
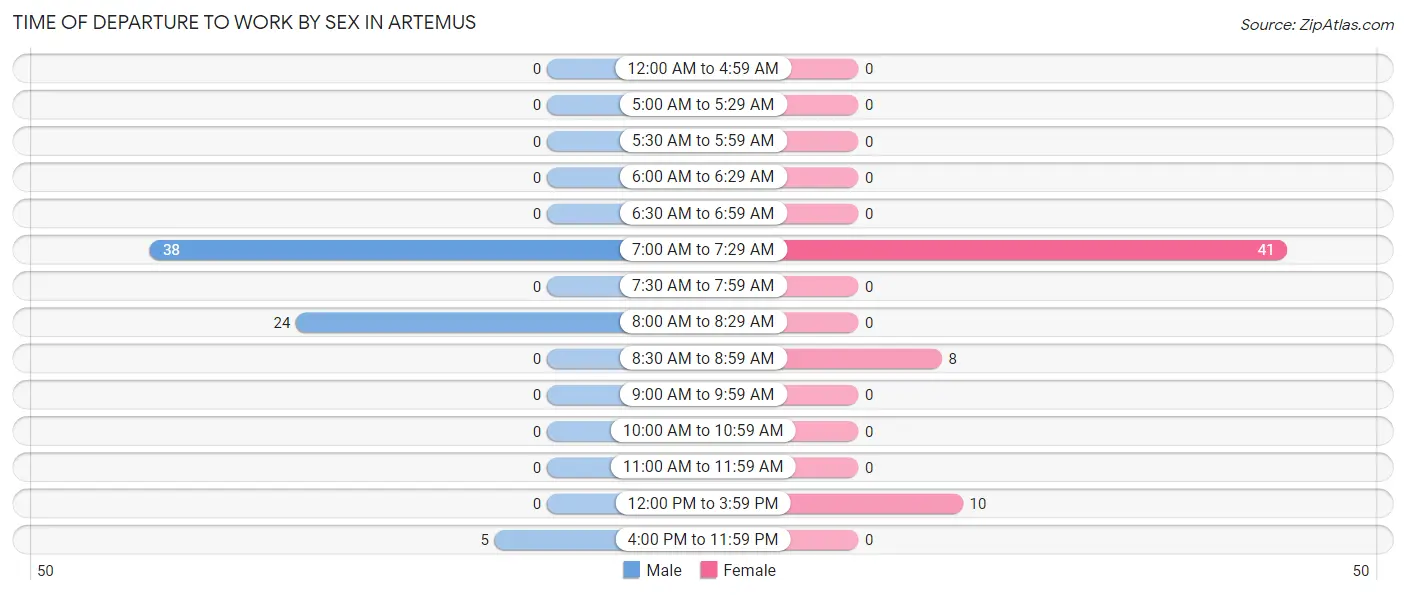
| Time of Departure | Male | Female |
| 12:00 AM to 4:59 AM | 0 (0.0%) | 0 (0.0%) |
| 5:00 AM to 5:29 AM | 0 (0.0%) | 0 (0.0%) |
| 5:30 AM to 5:59 AM | 0 (0.0%) | 0 (0.0%) |
| 6:00 AM to 6:29 AM | 0 (0.0%) | 0 (0.0%) |
| 6:30 AM to 6:59 AM | 0 (0.0%) | 0 (0.0%) |
| 7:00 AM to 7:29 AM | 38 (56.7%) | 41 (69.5%) |
| 7:30 AM to 7:59 AM | 0 (0.0%) | 0 (0.0%) |
| 8:00 AM to 8:29 AM | 24 (35.8%) | 0 (0.0%) |
| 8:30 AM to 8:59 AM | 0 (0.0%) | 8 (13.6%) |
| 9:00 AM to 9:59 AM | 0 (0.0%) | 0 (0.0%) |
| 10:00 AM to 10:59 AM | 0 (0.0%) | 0 (0.0%) |
| 11:00 AM to 11:59 AM | 0 (0.0%) | 0 (0.0%) |
| 12:00 PM to 3:59 PM | 0 (0.0%) | 10 (17.0%) |
| 4:00 PM to 11:59 PM | 5 (7.5%) | 0 (0.0%) |
| Total | 67 (100.0%) | 59 (100.0%) |
Housing Occupancy in Artemus
Occupancy by Ownership in Artemus
Of the total 184 dwellings in Artemus, owner-occupied units account for 113 (61.4%), while renter-occupied units make up 71 (38.6%).
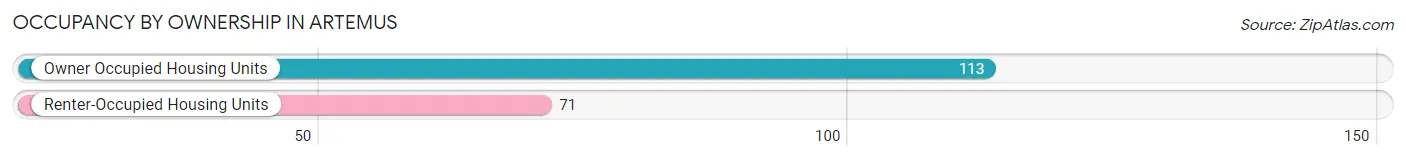
| Occupancy | # Housing Units | % Housing Units |
| Owner Occupied Housing Units | 113 | 61.4% |
| Renter-Occupied Housing Units | 71 | 38.6% |
| Total Occupied Housing Units | 184 | 100.0% |
Occupancy by Household Size in Artemus
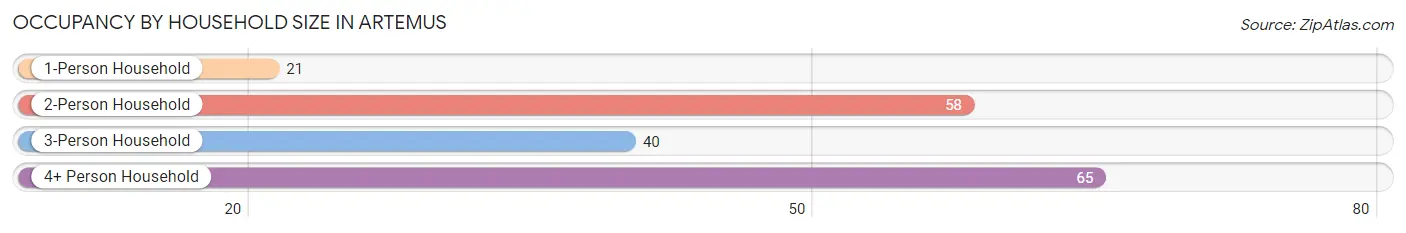
| Household Size | # Housing Units | % Housing Units |
| 1-Person Household | 21 | 11.4% |
| 2-Person Household | 58 | 31.5% |
| 3-Person Household | 40 | 21.7% |
| 4+ Person Household | 65 | 35.3% |
| Total Housing Units | 184 | 100.0% |
Occupancy by Ownership by Household Size in Artemus
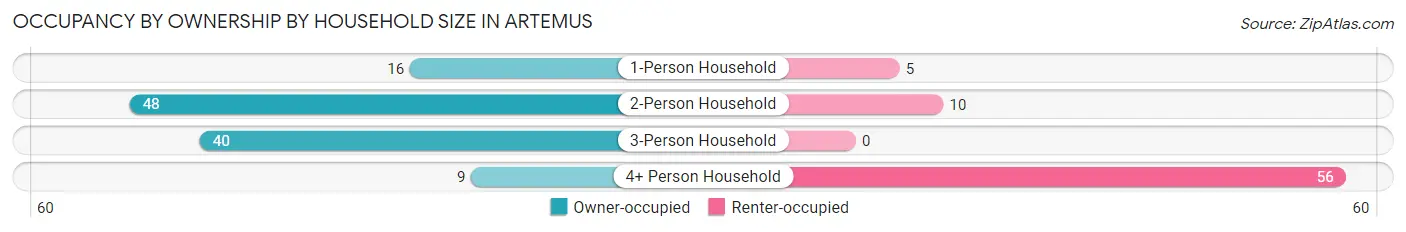
| Household Size | Owner-occupied | Renter-occupied |
| 1-Person Household | 16 (76.2%) | 5 (23.8%) |
| 2-Person Household | 48 (82.8%) | 10 (17.2%) |
| 3-Person Household | 40 (100.0%) | 0 (0.0%) |
| 4+ Person Household | 9 (13.9%) | 56 (86.2%) |
| Total Housing Units | 113 (61.4%) | 71 (38.6%) |
Occupancy by Educational Attainment in Artemus
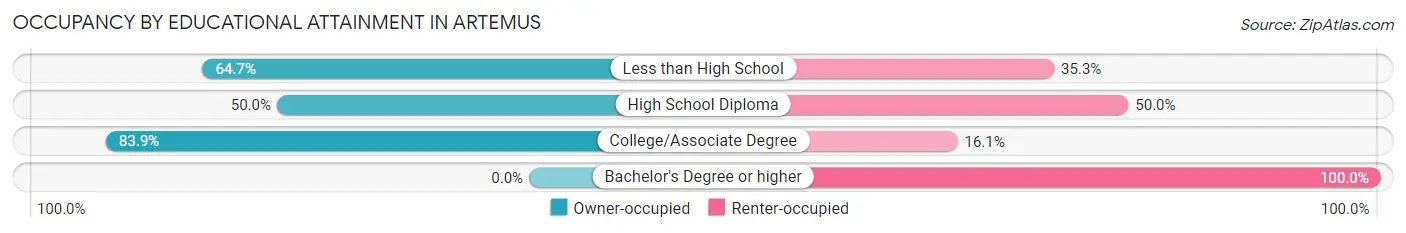
| Household Size | Owner-occupied | Renter-occupied |
| Less than High School | 11 (64.7%) | 6 (35.3%) |
| High School Diploma | 50 (50.0%) | 50 (50.0%) |
| College/Associate Degree | 52 (83.9%) | 10 (16.1%) |
| Bachelor's Degree or higher | 0 (0.0%) | 5 (100.0%) |
Occupancy by Age of Householder in Artemus
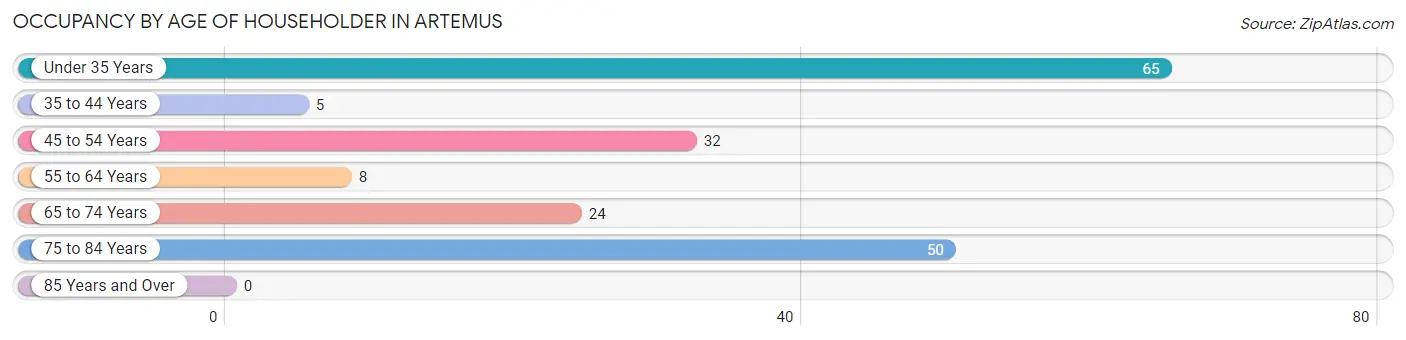
| Age Bracket | # Households | % Households |
| Under 35 Years | 65 | 35.3% |
| 35 to 44 Years | 5 | 2.7% |
| 45 to 54 Years | 32 | 17.4% |
| 55 to 64 Years | 8 | 4.3% |
| 65 to 74 Years | 24 | 13.0% |
| 75 to 84 Years | 50 | 27.2% |
| 85 Years and Over | 0 | 0.0% |
| Total | 184 | 100.0% |
Housing Finances in Artemus
Median Income by Occupancy in Artemus
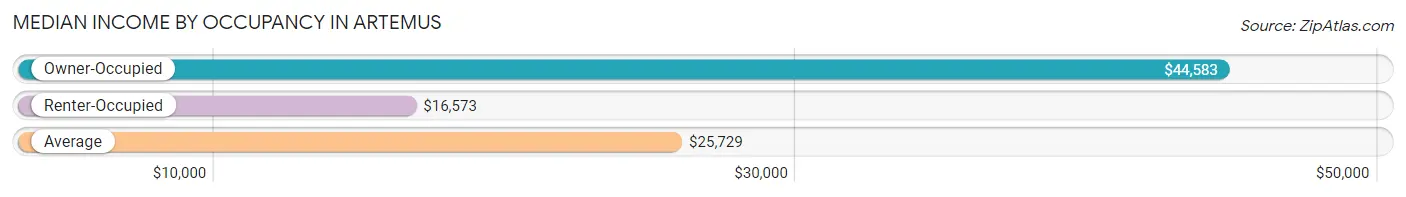
| Occupancy Type | # Households | Median Income |
| Owner-Occupied | 113 (61.4%) | $44,583 |
| Renter-Occupied | 71 (38.6%) | $16,573 |
| Average | 184 (100.0%) | $25,729 |
Occupancy by Householder Income Bracket in Artemus
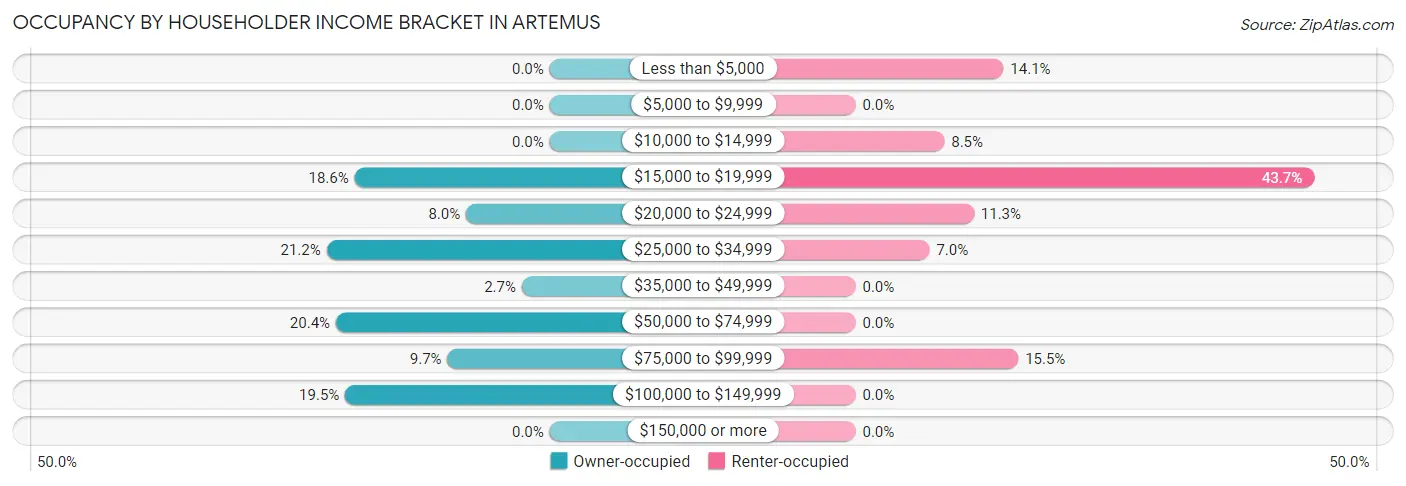
| Income Bracket | Owner-occupied | Renter-occupied |
| Less than $5,000 | 0 (0.0%) | 10 (14.1%) |
| $5,000 to $9,999 | 0 (0.0%) | 0 (0.0%) |
| $10,000 to $14,999 | 0 (0.0%) | 6 (8.5%) |
| $15,000 to $19,999 | 21 (18.6%) | 31 (43.7%) |
| $20,000 to $24,999 | 9 (8.0%) | 8 (11.3%) |
| $25,000 to $34,999 | 24 (21.2%) | 5 (7.0%) |
| $35,000 to $49,999 | 3 (2.6%) | 0 (0.0%) |
| $50,000 to $74,999 | 23 (20.3%) | 0 (0.0%) |
| $75,000 to $99,999 | 11 (9.7%) | 11 (15.5%) |
| $100,000 to $149,999 | 22 (19.5%) | 0 (0.0%) |
| $150,000 or more | 0 (0.0%) | 0 (0.0%) |
| Total | 113 (100.0%) | 71 (100.0%) |
Monthly Housing Cost Tiers in Artemus
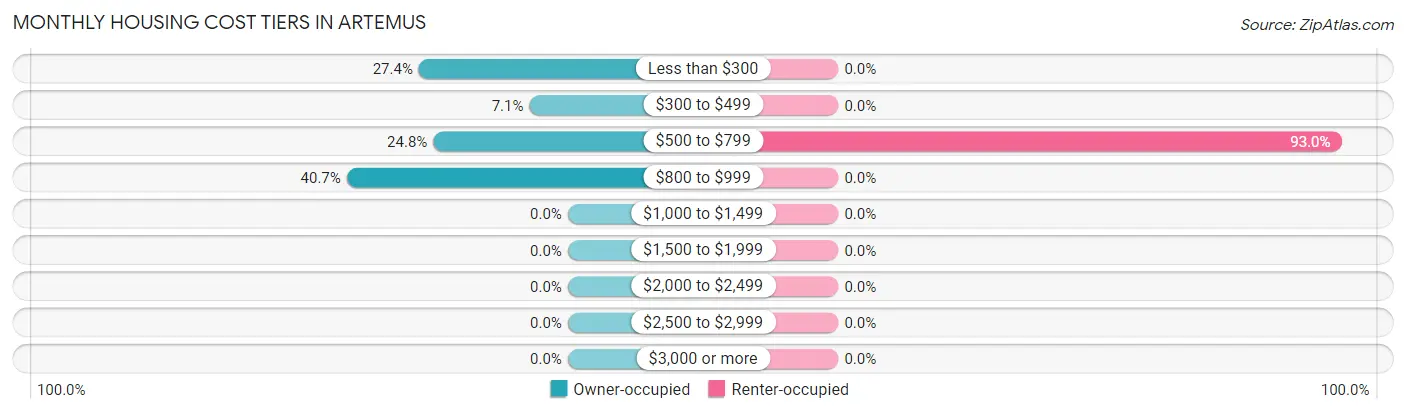
| Monthly Cost | Owner-occupied | Renter-occupied |
| Less than $300 | 31 (27.4%) | 0 (0.0%) |
| $300 to $499 | 8 (7.1%) | 0 (0.0%) |
| $500 to $799 | 28 (24.8%) | 66 (93.0%) |
| $800 to $999 | 46 (40.7%) | 0 (0.0%) |
| $1,000 to $1,499 | 0 (0.0%) | 0 (0.0%) |
| $1,500 to $1,999 | 0 (0.0%) | 0 (0.0%) |
| $2,000 to $2,499 | 0 (0.0%) | 0 (0.0%) |
| $2,500 to $2,999 | 0 (0.0%) | 0 (0.0%) |
| $3,000 or more | 0 (0.0%) | 0 (0.0%) |
| Total | 113 (100.0%) | 71 (100.0%) |
Physical Housing Characteristics in Artemus
Housing Structures in Artemus
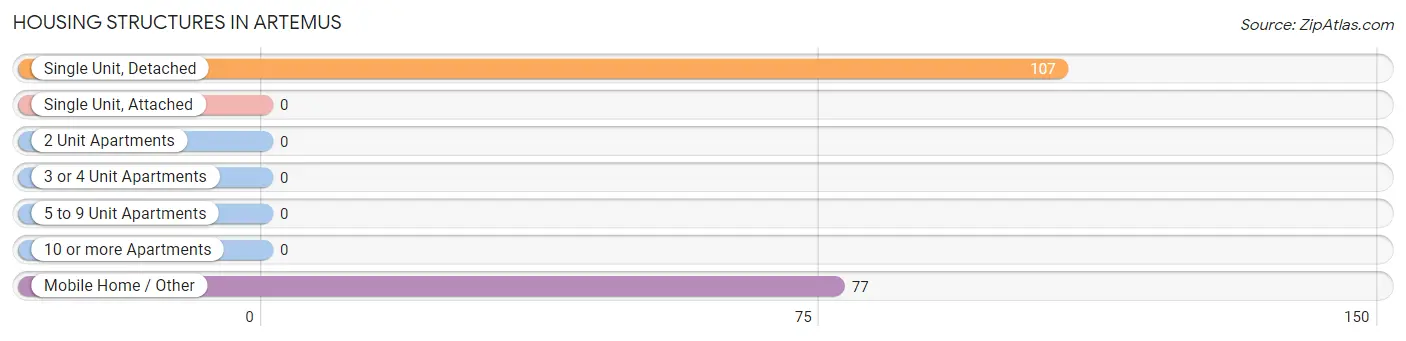
| Structure Type | # Housing Units | % Housing Units |
| Single Unit, Detached | 107 | 58.2% |
| Single Unit, Attached | 0 | 0.0% |
| 2 Unit Apartments | 0 | 0.0% |
| 3 or 4 Unit Apartments | 0 | 0.0% |
| 5 to 9 Unit Apartments | 0 | 0.0% |
| 10 or more Apartments | 0 | 0.0% |
| Mobile Home / Other | 77 | 41.8% |
| Total | 184 | 100.0% |
Housing Structures by Occupancy in Artemus
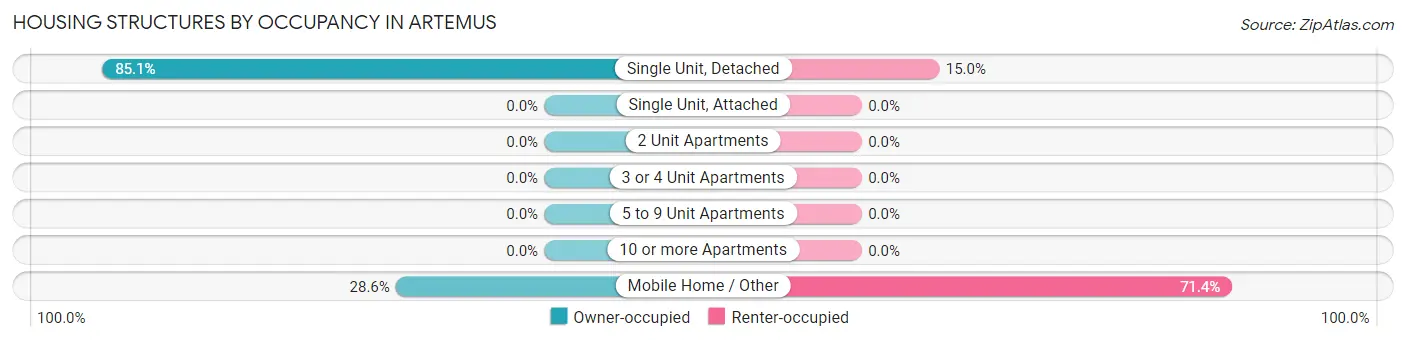
| Structure Type | Owner-occupied | Renter-occupied |
| Single Unit, Detached | 91 (85.1%) | 16 (14.9%) |
| Single Unit, Attached | 0 (0.0%) | 0 (0.0%) |
| 2 Unit Apartments | 0 (0.0%) | 0 (0.0%) |
| 3 or 4 Unit Apartments | 0 (0.0%) | 0 (0.0%) |
| 5 to 9 Unit Apartments | 0 (0.0%) | 0 (0.0%) |
| 10 or more Apartments | 0 (0.0%) | 0 (0.0%) |
| Mobile Home / Other | 22 (28.6%) | 55 (71.4%) |
| Total | 113 (61.4%) | 71 (38.6%) |
Housing Structures by Number of Rooms in Artemus
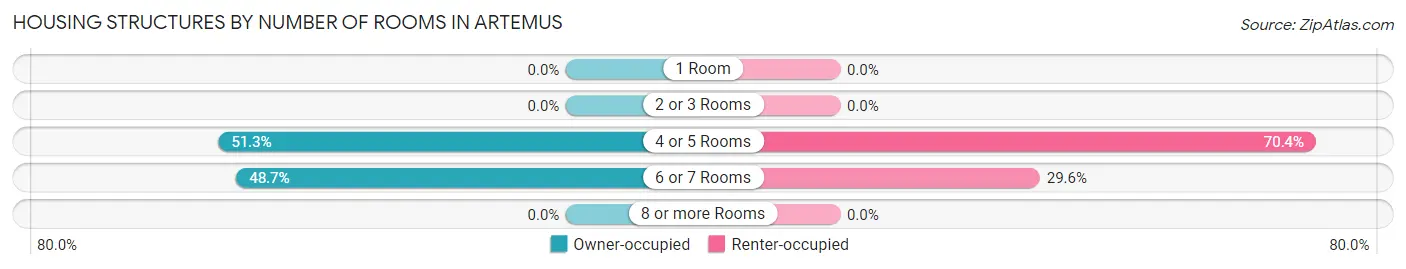
| Number of Rooms | Owner-occupied | Renter-occupied |
| 1 Room | 0 (0.0%) | 0 (0.0%) |
| 2 or 3 Rooms | 0 (0.0%) | 0 (0.0%) |
| 4 or 5 Rooms | 58 (51.3%) | 50 (70.4%) |
| 6 or 7 Rooms | 55 (48.7%) | 21 (29.6%) |
| 8 or more Rooms | 0 (0.0%) | 0 (0.0%) |
| Total | 113 (100.0%) | 71 (100.0%) |
Housing Structure by Heating Type in Artemus
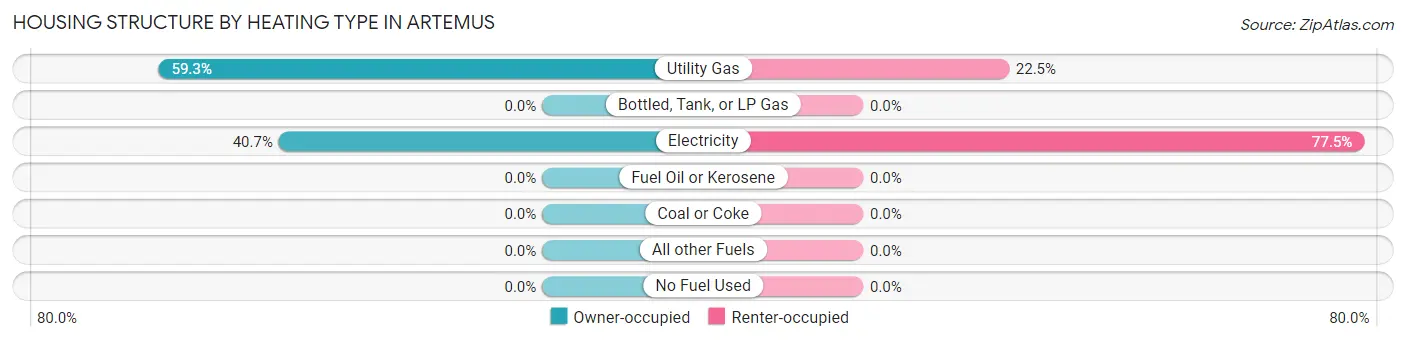
| Heating Type | Owner-occupied | Renter-occupied |
| Utility Gas | 67 (59.3%) | 16 (22.5%) |
| Bottled, Tank, or LP Gas | 0 (0.0%) | 0 (0.0%) |
| Electricity | 46 (40.7%) | 55 (77.5%) |
| Fuel Oil or Kerosene | 0 (0.0%) | 0 (0.0%) |
| Coal or Coke | 0 (0.0%) | 0 (0.0%) |
| All other Fuels | 0 (0.0%) | 0 (0.0%) |
| No Fuel Used | 0 (0.0%) | 0 (0.0%) |
| Total | 113 (100.0%) | 71 (100.0%) |
Household Vehicle Usage in Artemus
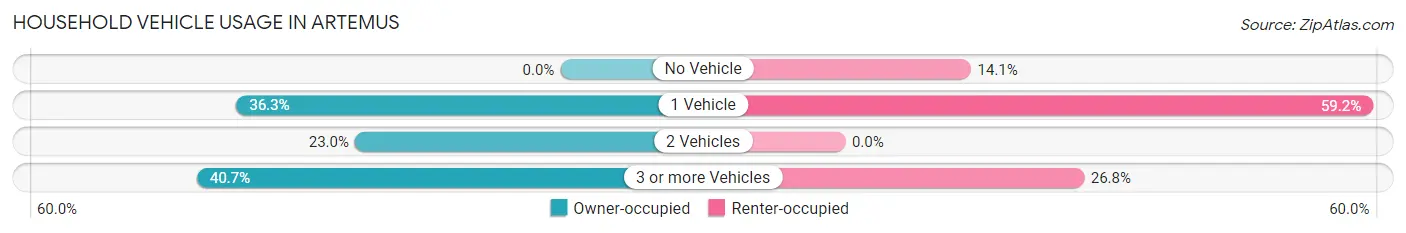
| Vehicles per Household | Owner-occupied | Renter-occupied |
| No Vehicle | 0 (0.0%) | 10 (14.1%) |
| 1 Vehicle | 41 (36.3%) | 42 (59.2%) |
| 2 Vehicles | 26 (23.0%) | 0 (0.0%) |
| 3 or more Vehicles | 46 (40.7%) | 19 (26.8%) |
| Total | 113 (100.0%) | 71 (100.0%) |
Real Estate & Mortgages in Artemus
Real Estate and Mortgage Overview in Artemus
| Characteristic | Without Mortgage | With Mortgage |
| Housing Units | 59 | 54 |
| Median Property Value | - | - |
| Median Household Income | $53,365 | $0 |
| Monthly Housing Costs | - | - |
| Real Estate Taxes | - | - |
Property Value by Mortgage Status in Artemus
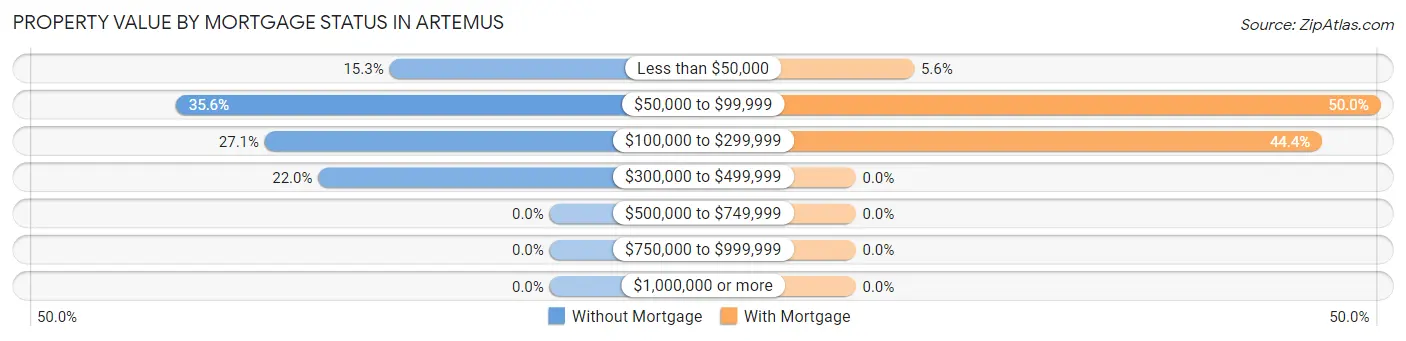
| Property Value | Without Mortgage | With Mortgage |
| Less than $50,000 | 9 (15.2%) | 3 (5.6%) |
| $50,000 to $99,999 | 21 (35.6%) | 27 (50.0%) |
| $100,000 to $299,999 | 16 (27.1%) | 24 (44.4%) |
| $300,000 to $499,999 | 13 (22.0%) | 0 (0.0%) |
| $500,000 to $749,999 | 0 (0.0%) | 0 (0.0%) |
| $750,000 to $999,999 | 0 (0.0%) | 0 (0.0%) |
| $1,000,000 or more | 0 (0.0%) | 0 (0.0%) |
| Total | 59 (100.0%) | 54 (100.0%) |
Household Income by Mortgage Status in Artemus
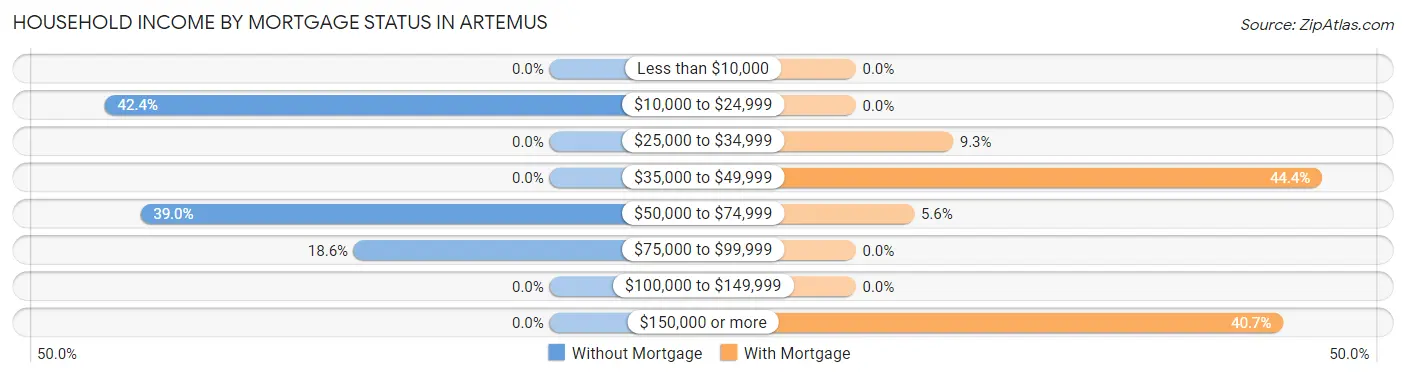
| Household Income | Without Mortgage | With Mortgage |
| Less than $10,000 | 0 (0.0%) | 0 (0.0%) |
| $10,000 to $24,999 | 25 (42.4%) | 0 (0.0%) |
| $25,000 to $34,999 | 0 (0.0%) | 5 (9.3%) |
| $35,000 to $49,999 | 0 (0.0%) | 24 (44.4%) |
| $50,000 to $74,999 | 23 (39.0%) | 3 (5.6%) |
| $75,000 to $99,999 | 11 (18.6%) | 0 (0.0%) |
| $100,000 to $149,999 | 0 (0.0%) | 0 (0.0%) |
| $150,000 or more | 0 (0.0%) | 22 (40.7%) |
| Total | 59 (100.0%) | 54 (100.0%) |
Property Value to Household Income Ratio in Artemus
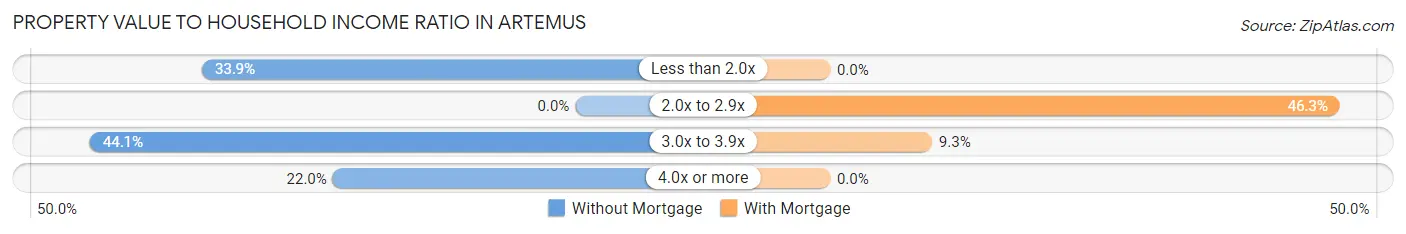
| Value-to-Income Ratio | Without Mortgage | With Mortgage |
| Less than 2.0x | 20 (33.9%) | 0 (0.0%) |
| 2.0x to 2.9x | 0 (0.0%) | 25 (46.3%) |
| 3.0x to 3.9x | 26 (44.1%) | 5 (9.3%) |
| 4.0x or more | 13 (22.0%) | 0 (0.0%) |
| Total | 59 (100.0%) | 54 (100.0%) |
Real Estate Taxes by Mortgage Status in Artemus
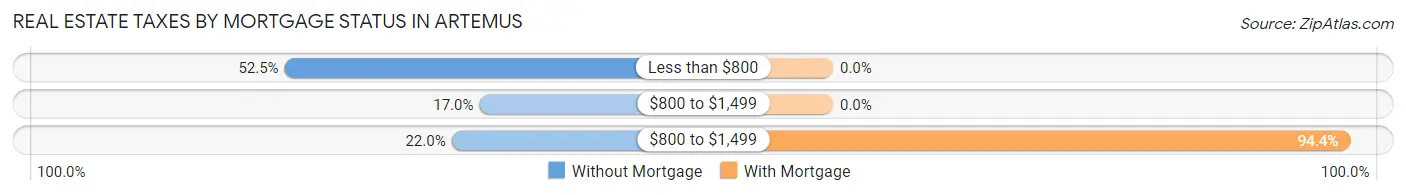
| Property Taxes | Without Mortgage | With Mortgage |
| Less than $800 | 31 (52.5%) | 0 (0.0%) |
| $800 to $1,499 | 10 (17.0%) | 0 (0.0%) |
| $800 to $1,499 | 13 (22.0%) | 51 (94.4%) |
| Total | 59 (100.0%) | 54 (100.0%) |
Health & Disability in Artemus
Health Insurance Coverage by Age in Artemus
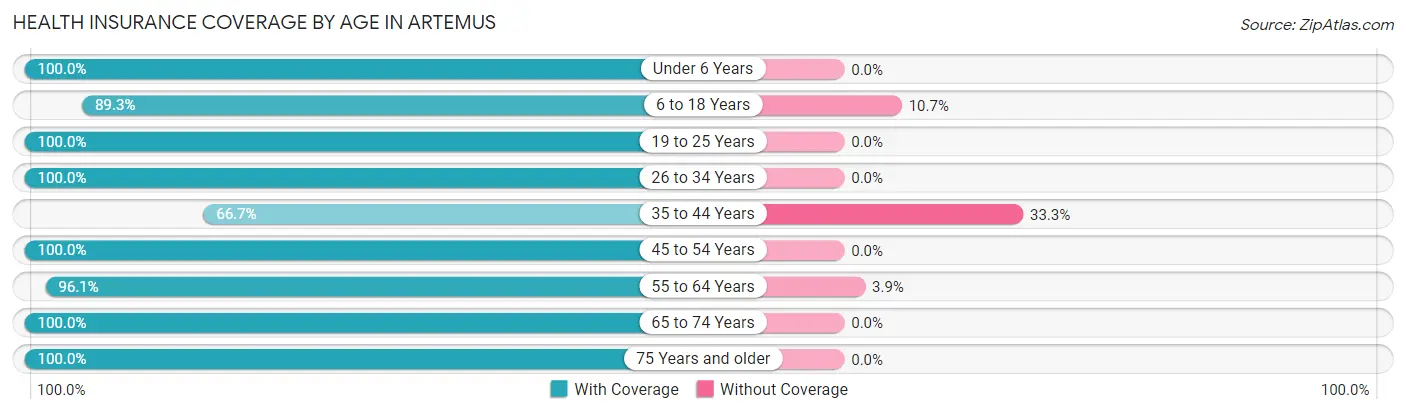
| Age Bracket | With Coverage | Without Coverage |
| Under 6 Years | 103 (100.0%) | 0 (0.0%) |
| 6 to 18 Years | 125 (89.3%) | 15 (10.7%) |
| 19 to 25 Years | 35 (100.0%) | 0 (0.0%) |
| 26 to 34 Years | 104 (100.0%) | 0 (0.0%) |
| 35 to 44 Years | 10 (66.7%) | 5 (33.3%) |
| 45 to 54 Years | 53 (100.0%) | 0 (0.0%) |
| 55 to 64 Years | 124 (96.1%) | 5 (3.9%) |
| 65 to 74 Years | 41 (100.0%) | 0 (0.0%) |
| 75 Years and older | 69 (100.0%) | 0 (0.0%) |
| Total | 664 (96.4%) | 25 (3.6%) |
Health Insurance Coverage by Citizenship Status in Artemus
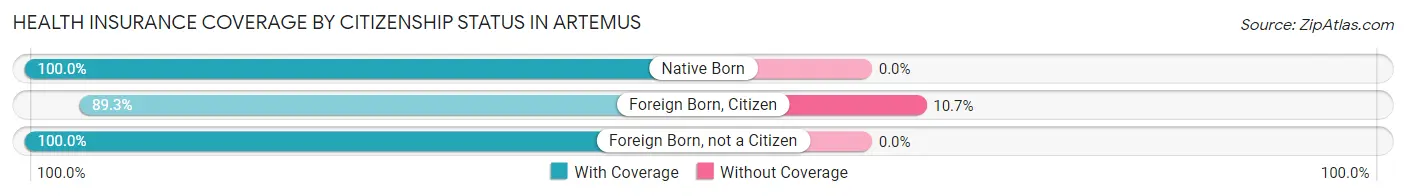
| Citizenship Status | With Coverage | Without Coverage |
| Native Born | 103 (100.0%) | 0 (0.0%) |
| Foreign Born, Citizen | 125 (89.3%) | 15 (10.7%) |
| Foreign Born, not a Citizen | 35 (100.0%) | 0 (0.0%) |
Health Insurance Coverage by Household Income in Artemus
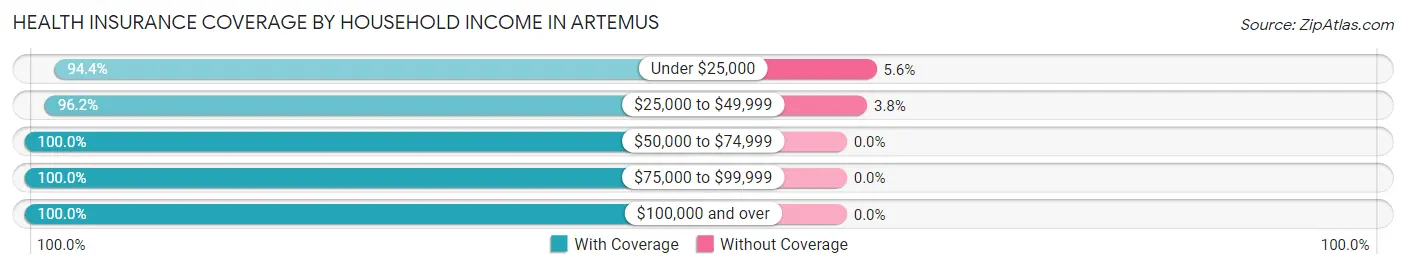
| Household Income | With Coverage | Without Coverage |
| Under $25,000 | 339 (94.4%) | 20 (5.6%) |
| $25,000 to $49,999 | 127 (96.2%) | 5 (3.8%) |
| $50,000 to $74,999 | 69 (100.0%) | 0 (0.0%) |
| $75,000 to $99,999 | 83 (100.0%) | 0 (0.0%) |
| $100,000 and over | 46 (100.0%) | 0 (0.0%) |
Public vs Private Health Insurance Coverage by Age in Artemus
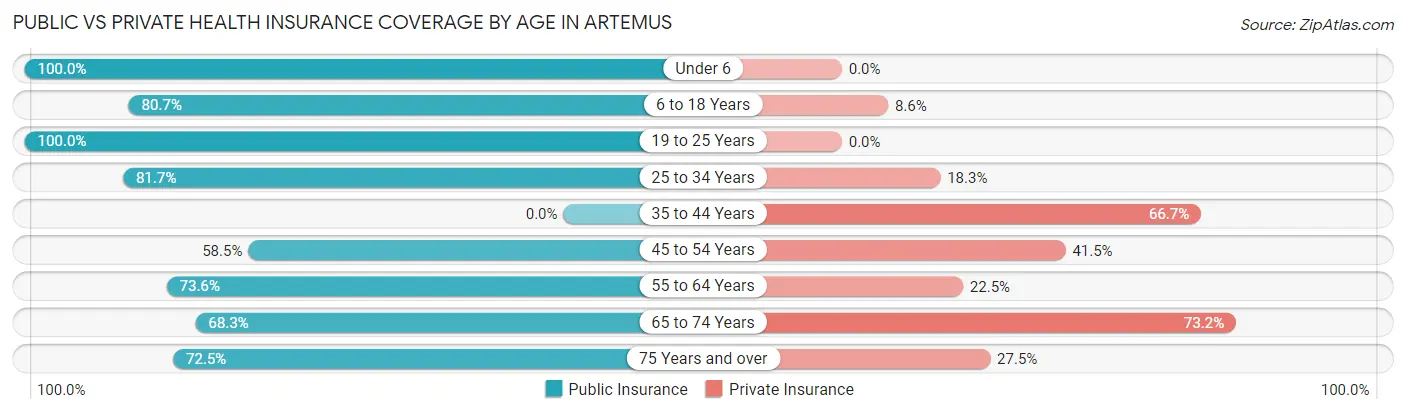
| Age Bracket | Public Insurance | Private Insurance |
| Under 6 | 103 (100.0%) | 0 (0.0%) |
| 6 to 18 Years | 113 (80.7%) | 12 (8.6%) |
| 19 to 25 Years | 35 (100.0%) | 0 (0.0%) |
| 25 to 34 Years | 85 (81.7%) | 19 (18.3%) |
| 35 to 44 Years | 0 (0.0%) | 10 (66.7%) |
| 45 to 54 Years | 31 (58.5%) | 22 (41.5%) |
| 55 to 64 Years | 95 (73.6%) | 29 (22.5%) |
| 65 to 74 Years | 28 (68.3%) | 30 (73.2%) |
| 75 Years and over | 50 (72.5%) | 19 (27.5%) |
| Total | 540 (78.4%) | 141 (20.5%) |
Disability Status by Sex by Age in Artemus
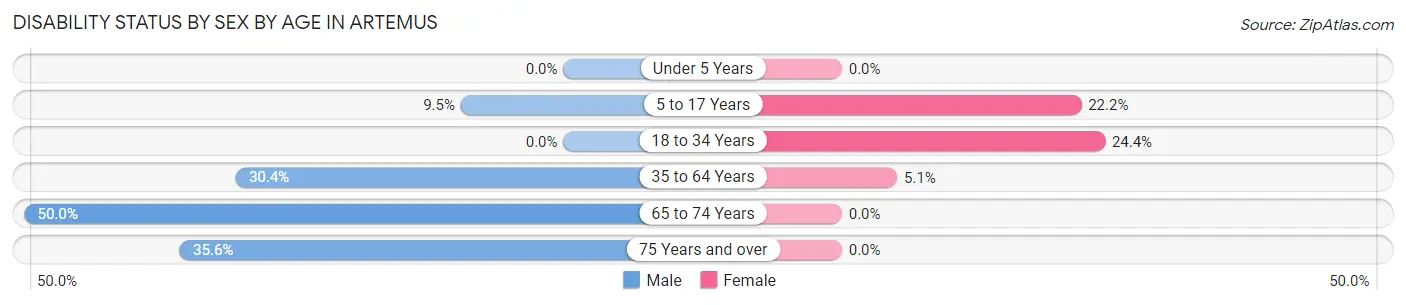
| Age Bracket | Male | Female |
| Under 5 Years | 0 (0.0%) | 0 (0.0%) |
| 5 to 17 Years | 6 (9.5%) | 12 (22.2%) |
| 18 to 34 Years | 0 (0.0%) | 21 (24.4%) |
| 35 to 64 Years | 48 (30.4%) | 2 (5.1%) |
| 65 to 74 Years | 6 (50.0%) | 0 (0.0%) |
| 75 Years and over | 16 (35.6%) | 0 (0.0%) |
Disability Class by Sex by Age in Artemus
Disability Class: Hearing Difficulty
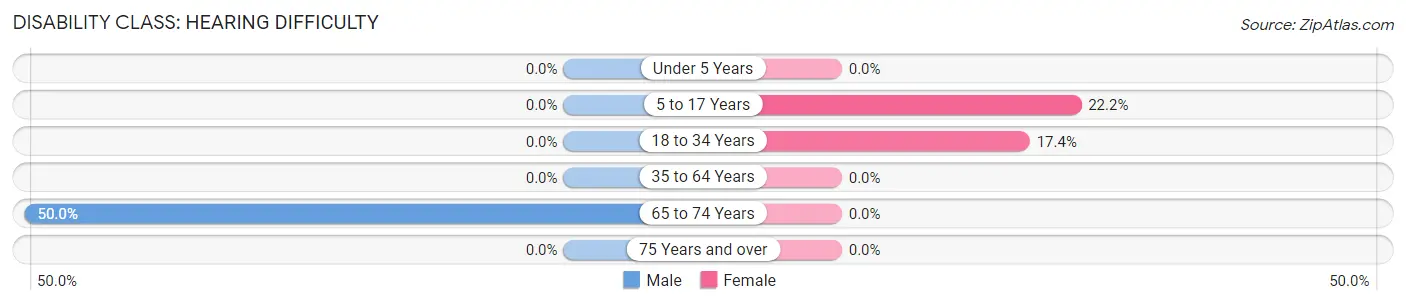
| Age Bracket | Male | Female |
| Under 5 Years | 0 (0.0%) | 0 (0.0%) |
| 5 to 17 Years | 0 (0.0%) | 12 (22.2%) |
| 18 to 34 Years | 0 (0.0%) | 15 (17.4%) |
| 35 to 64 Years | 0 (0.0%) | 0 (0.0%) |
| 65 to 74 Years | 6 (50.0%) | 0 (0.0%) |
| 75 Years and over | 0 (0.0%) | 0 (0.0%) |
Disability Class: Vision Difficulty
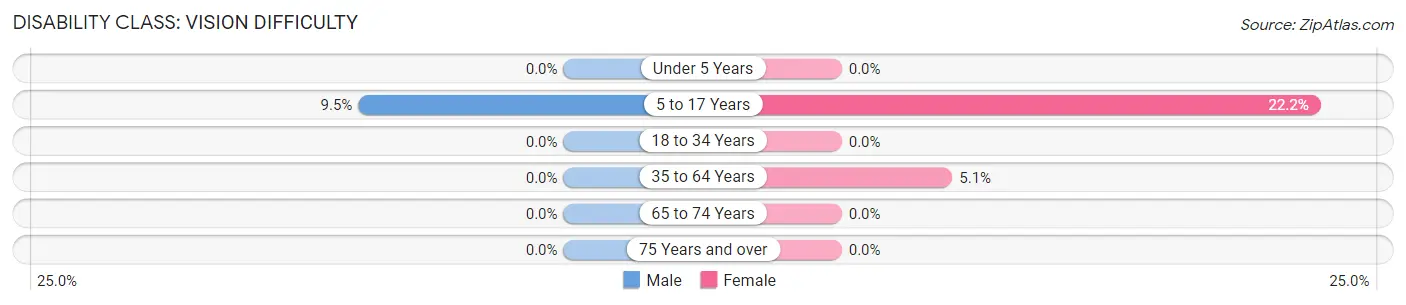
| Age Bracket | Male | Female |
| Under 5 Years | 0 (0.0%) | 0 (0.0%) |
| 5 to 17 Years | 6 (9.5%) | 12 (22.2%) |
| 18 to 34 Years | 0 (0.0%) | 0 (0.0%) |
| 35 to 64 Years | 0 (0.0%) | 2 (5.1%) |
| 65 to 74 Years | 0 (0.0%) | 0 (0.0%) |
| 75 Years and over | 0 (0.0%) | 0 (0.0%) |
Disability Class: Cognitive Difficulty
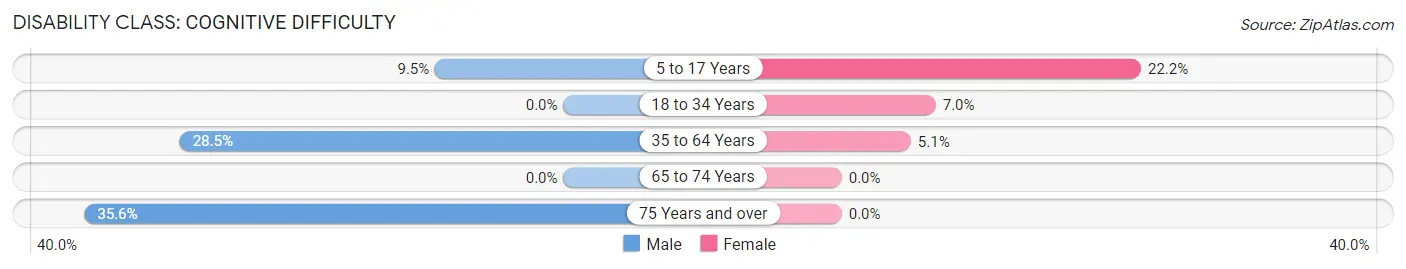
| Age Bracket | Male | Female |
| 5 to 17 Years | 6 (9.5%) | 12 (22.2%) |
| 18 to 34 Years | 0 (0.0%) | 6 (7.0%) |
| 35 to 64 Years | 45 (28.5%) | 2 (5.1%) |
| 65 to 74 Years | 0 (0.0%) | 0 (0.0%) |
| 75 Years and over | 16 (35.6%) | 0 (0.0%) |
Disability Class: Ambulatory Difficulty
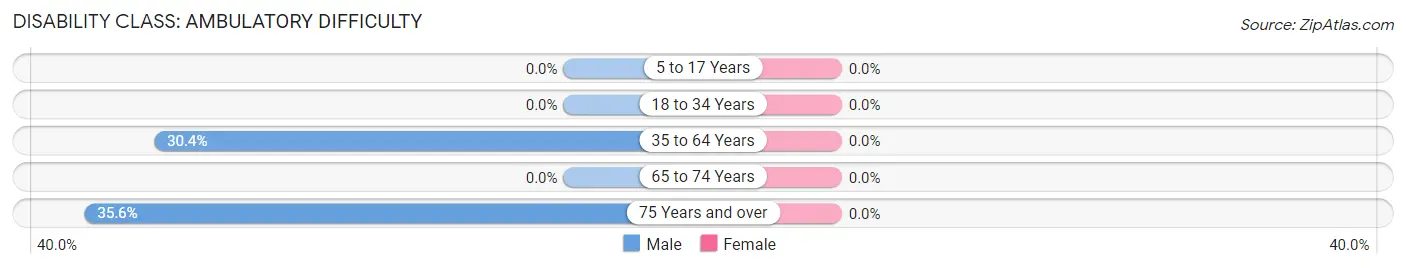
| Age Bracket | Male | Female |
| 5 to 17 Years | 0 (0.0%) | 0 (0.0%) |
| 18 to 34 Years | 0 (0.0%) | 0 (0.0%) |
| 35 to 64 Years | 48 (30.4%) | 0 (0.0%) |
| 65 to 74 Years | 0 (0.0%) | 0 (0.0%) |
| 75 Years and over | 16 (35.6%) | 0 (0.0%) |
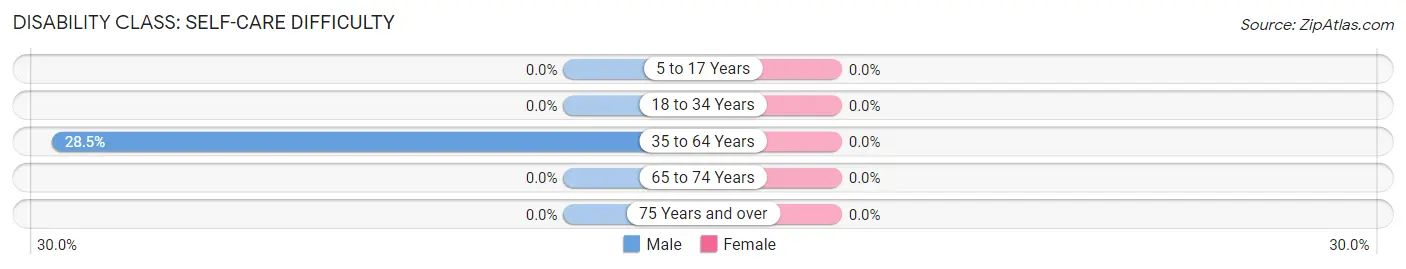
Disability Class: Self-Care Difficulty
| Age Bracket | Male | Female |
| 5 to 17 Years | 0 (0.0%) | 0 (0.0%) |
| 18 to 34 Years | 0 (0.0%) | 0 (0.0%) |
| 35 to 64 Years | 45 (28.5%) | 0 (0.0%) |
| 65 to 74 Years | 0 (0.0%) | 0 (0.0%) |
| 75 Years and over | 0 (0.0%) | 0 (0.0%) |
Technology Access in Artemus
Computing Device Access in Artemus
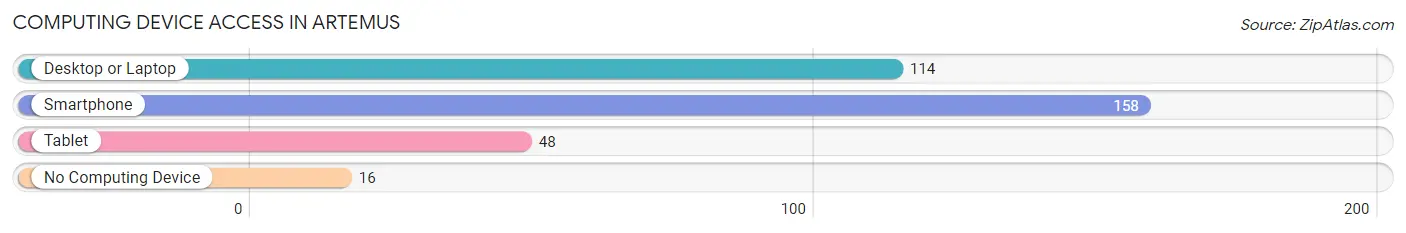
| Device Type | # Households | % Households |
| Desktop or Laptop | 114 | 62.0% |
| Smartphone | 158 | 85.9% |
| Tablet | 48 | 26.1% |
| No Computing Device | 16 | 8.7% |
| Total | 184 | 100.0% |
Internet Access in Artemus
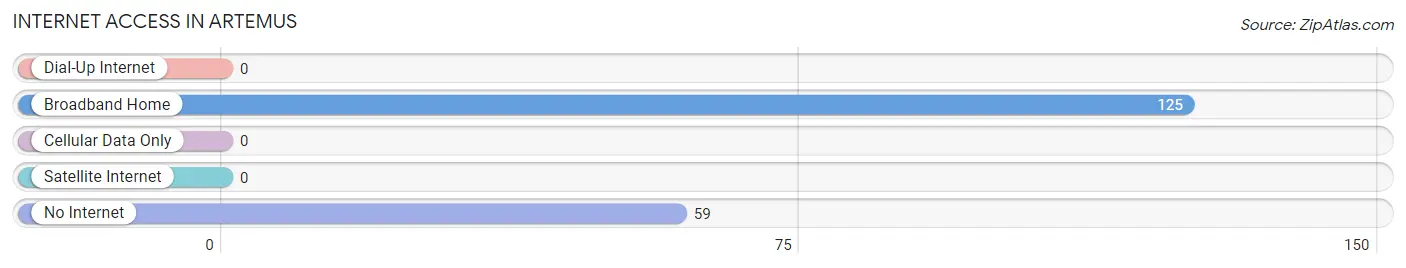
| Internet Type | # Households | % Households |
| Dial-Up Internet | 0 | 0.0% |
| Broadband Home | 125 | 67.9% |
| Cellular Data Only | 0 | 0.0% |
| Satellite Internet | 0 | 0.0% |
| No Internet | 59 | 32.1% |
| Total | 184 | 100.0% |
Artemus Summary
Artemus is a small unincorporated community located in Knox County, Kentucky. It is situated in the foothills of the Appalachian Mountains, approximately 10 miles south of Barbourville. The population of Artemus was estimated to be around 200 people in 2020.
History
Artemus was first settled in the early 1800s by a group of settlers from Virginia. The town was named after Artemus Ward, a prominent local politician. The town was incorporated in 1883 and was home to a variety of businesses, including a general store, a blacksmith shop, a grist mill, and a sawmill.
In the early 1900s, the town experienced a period of growth and prosperity. The railroad was extended to Artemus in 1906, and the town became a hub for the surrounding area. The railroad brought new businesses and jobs to the area, and the population of Artemus grew to over 500 people by the 1920s.
The Great Depression hit Artemus hard, and the population began to decline. The railroad was abandoned in the 1940s, and many of the businesses in town closed. By the 1950s, the population had dropped to around 200 people.
Geography
Artemus is located in the foothills of the Appalachian Mountains, approximately 10 miles south of Barbourville. The town is situated in a valley, surrounded by rolling hills and forests. The town is located near the headwaters of the Cumberland River, and the area is known for its scenic beauty.
The climate in Artemus is humid subtropical, with hot summers and mild winters. The average annual temperature is around 60 degrees Fahrenheit, and the average annual precipitation is around 45 inches.
Economy
The economy of Artemus is largely based on agriculture. The town is home to several farms, and the surrounding area is known for its production of tobacco, corn, and hay.
The town also has a few small businesses, including a general store, a gas station, and a restaurant. The town is also home to a few small manufacturing companies, which produce a variety of products, including furniture and clothing.
Demographics
The population of Artemus was estimated to be around 200 people in 2020. The town is predominantly white, with a small African American population. The median household income in Artemus is around $30,000, and the median home value is around $90,000.
The town is served by the Knox County School District, and the town has one elementary school. The town also has a few churches, including a Baptist church and a Methodist church.
Conclusion
Artemus is a small unincorporated community located in Knox County, Kentucky. It is situated in the foothills of the Appalachian Mountains, approximately 10 miles south of Barbourville. The population of Artemus was estimated to be around 200 people in 2020. The town is predominantly white, with a small African American population. The economy of Artemus is largely based on agriculture, and the town is home to several small businesses. The town is served by the Knox County School District, and the town has one elementary school. Artemus is known for its scenic beauty and its rural charm, and it is a great place to live and work.
Common Questions
What is Per Capita Income in Artemus?
Per Capita income in Artemus is $12,910.
What is the Median Household income in Artemus?
Median Household Income in Artemus is $25,729.
What is Inequality or Gini Index in Artemus?
Inequality or Gini Index in Artemus is 0.44.
What is the Total Population of Artemus?
Total Population of Artemus is 689.
What is the Total Male Population of Artemus?
Total Male Population of Artemus is 419.
What is the Total Female Population of Artemus?
Total Female Population of Artemus is 270.
What is the Ratio of Males per 100 Females in Artemus?
There are 155.19 Males per 100 Females in Artemus.
What is the Ratio of Females per 100 Males in Artemus?
There are 64.44 Females per 100 Males in Artemus.
What is the Median Population Age in Artemus?
Median Population Age in Artemus is 27.9 Years.
What is the Average Family Size in Artemus
Average Family Size in Artemus is 3.5 People.
What is the Average Household Size in Artemus
Average Household Size in Artemus is 3.7 People.
How Large is the Labor Force in Artemus?
There are 224 People in the Labor Forcein in Artemus.
What is the Percentage of People in the Labor Force in Artemus?
46.8% of People are in the Labor Force in Artemus.
What is the Unemployment Rate in Artemus?
Unemployment Rate in Artemus is 24.6%.