Crittenden, KY Map & Demographics
Crittenden Map
Crittenden Overview
$21,671
PER CAPITA INCOME
$51,875
AVG FAMILY INCOME
$52,217
AVG HOUSEHOLD INCOME
45.8%
WAGE / INCOME GAP [ % ]
54.2¢/ $1
WAGE / INCOME GAP [ $ ]
$8,547
FAMILY INCOME DEFICIT
0.36
INEQUALITY / GINI INDEX
4,033
TOTAL POPULATION
2,325
MALE POPULATION
1,708
FEMALE POPULATION
136.12
MALES / 100 FEMALES
73.46
FEMALES / 100 MALES
24.3
MEDIAN AGE
3.5
AVG FAMILY SIZE
3.3
AVG HOUSEHOLD SIZE
1,886
LABOR FORCE [ PEOPLE ]
66.1%
PERCENT IN LABOR FORCE
5.7%
UNEMPLOYMENT RATE
Crittenden Zip Codes
Crittenden Area Codes
Income in Crittenden
Income Overview in Crittenden
Per Capita Income in Crittenden is $21,671, while median incomes of families and households are $51,875 and $52,217 respectively.
| Characteristic | Number | Measure |
| Per Capita Income | 4,033 | $21,671 |
| Median Family Income | 934 | $51,875 |
| Mean Family Income | 934 | $69,146 |
| Median Household Income | 1,237 | $52,217 |
| Mean Household Income | 1,237 | $68,019 |
| Income Deficit | 934 | $8,547 |
| Wage / Income Gap (%) | 4,033 | 45.80% |
| Wage / Income Gap ($) | 4,033 | 54.20¢ per $1 |
| Gini / Inequality Index | 4,033 | 0.36 |
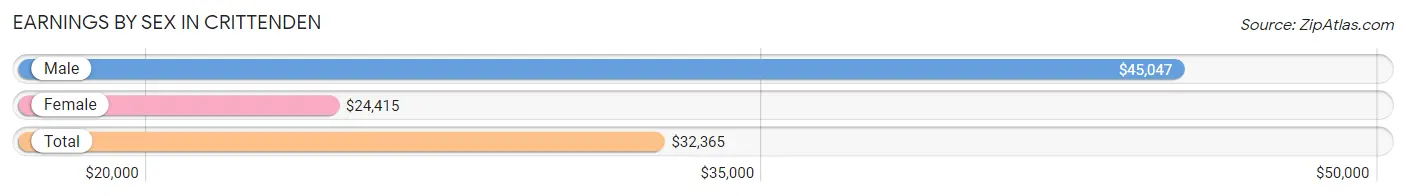
Earnings by Sex in Crittenden
Average Earnings in Crittenden are $32,365, $45,047 for men and $24,415 for women, a difference of 45.8%.
| Sex | Number | Average Earnings |
| Male | 1,036 (52.9%) | $45,047 |
| Female | 923 (47.1%) | $24,415 |
| Total | 1,959 (100.0%) | $32,365 |
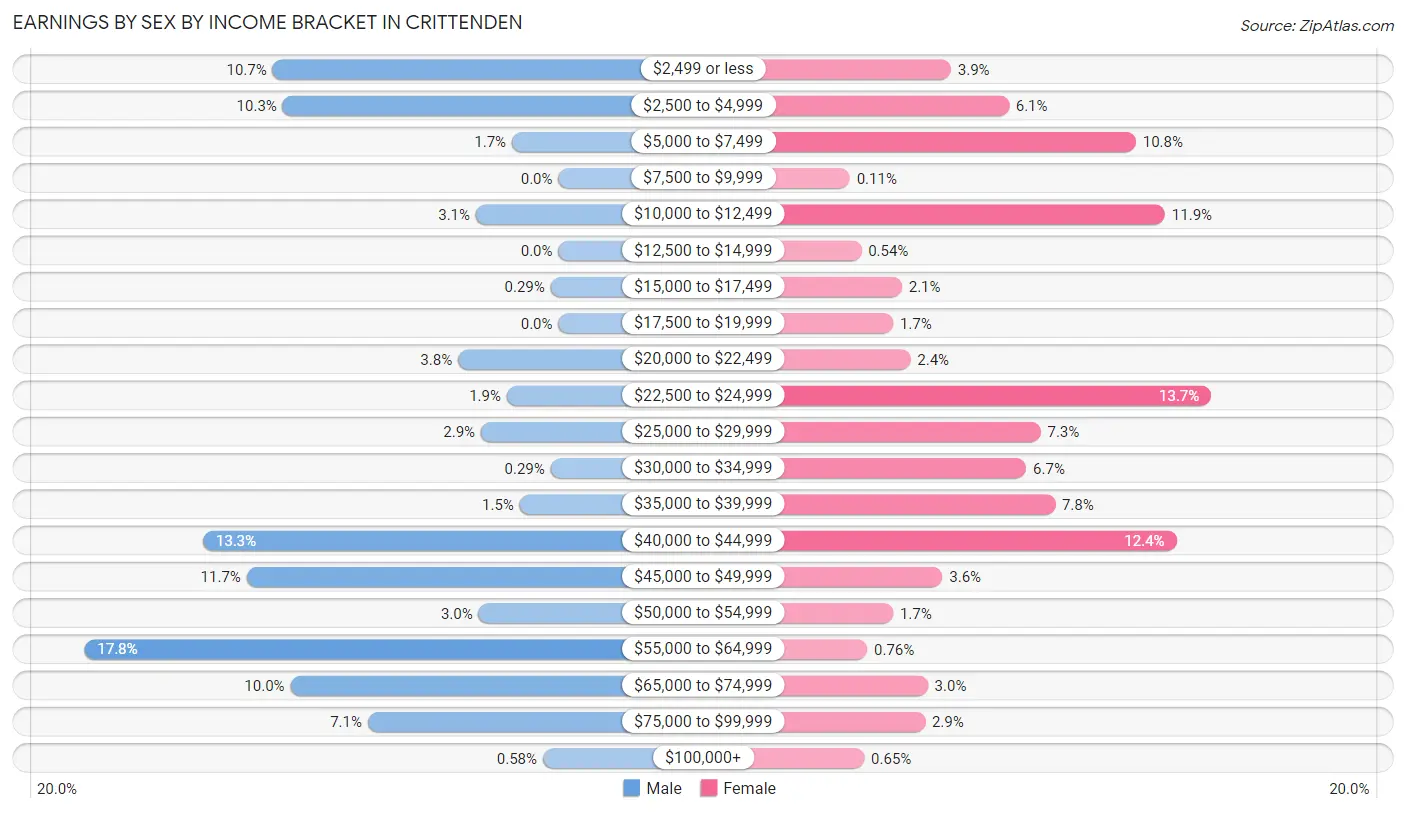
Earnings by Sex by Income Bracket in Crittenden
The most common earnings brackets in Crittenden are $55,000 to $64,999 for men (184 | 17.8%) and $22,500 to $24,999 for women (126 | 13.7%).
| Income | Male | Female |
| $2,499 or less | 111 (10.7%) | 36 (3.9%) |
| $2,500 to $4,999 | 107 (10.3%) | 56 (6.1%) |
| $5,000 to $7,499 | 18 (1.7%) | 100 (10.8%) |
| $7,500 to $9,999 | 0 (0.0%) | 1 (0.1%) |
| $10,000 to $12,499 | 32 (3.1%) | 110 (11.9%) |
| $12,500 to $14,999 | 0 (0.0%) | 5 (0.5%) |
| $15,000 to $17,499 | 3 (0.3%) | 19 (2.1%) |
| $17,500 to $19,999 | 0 (0.0%) | 16 (1.7%) |
| $20,000 to $22,499 | 39 (3.8%) | 22 (2.4%) |
| $22,500 to $24,999 | 20 (1.9%) | 126 (13.7%) |
| $25,000 to $29,999 | 30 (2.9%) | 67 (7.3%) |
| $30,000 to $34,999 | 3 (0.3%) | 62 (6.7%) |
| $35,000 to $39,999 | 15 (1.5%) | 72 (7.8%) |
| $40,000 to $44,999 | 138 (13.3%) | 114 (12.3%) |
| $45,000 to $49,999 | 121 (11.7%) | 33 (3.6%) |
| $50,000 to $54,999 | 31 (3.0%) | 16 (1.7%) |
| $55,000 to $64,999 | 184 (17.8%) | 7 (0.8%) |
| $65,000 to $74,999 | 104 (10.0%) | 28 (3.0%) |
| $75,000 to $99,999 | 74 (7.1%) | 27 (2.9%) |
| $100,000+ | 6 (0.6%) | 6 (0.6%) |
| Total | 1,036 (100.0%) | 923 (100.0%) |
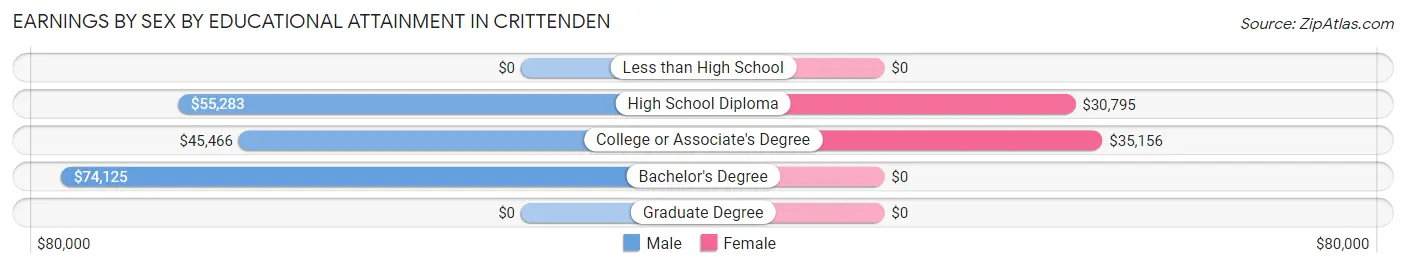
Earnings by Sex by Educational Attainment in Crittenden
Average earnings in Crittenden are $52,000 for men and $28,505 for women, a difference of 45.2%. Men with an educational attainment of bachelor's degree enjoy the highest average annual earnings of $74,125, while those with college or associate's degree education earn the least with $45,466. Women with an educational attainment of college or associate's degree earn the most with the average annual earnings of $35,156, while those with high school diploma education have the smallest earnings of $30,795.
| Educational Attainment | Male Income | Female Income |
| Less than High School | - | - |
| High School Diploma | $55,283 | $30,795 |
| College or Associate's Degree | $45,466 | $35,156 |
| Bachelor's Degree | $74,125 | $0 |
| Graduate Degree | - | - |
| Total | $52,000 | $28,505 |
Family Income in Crittenden
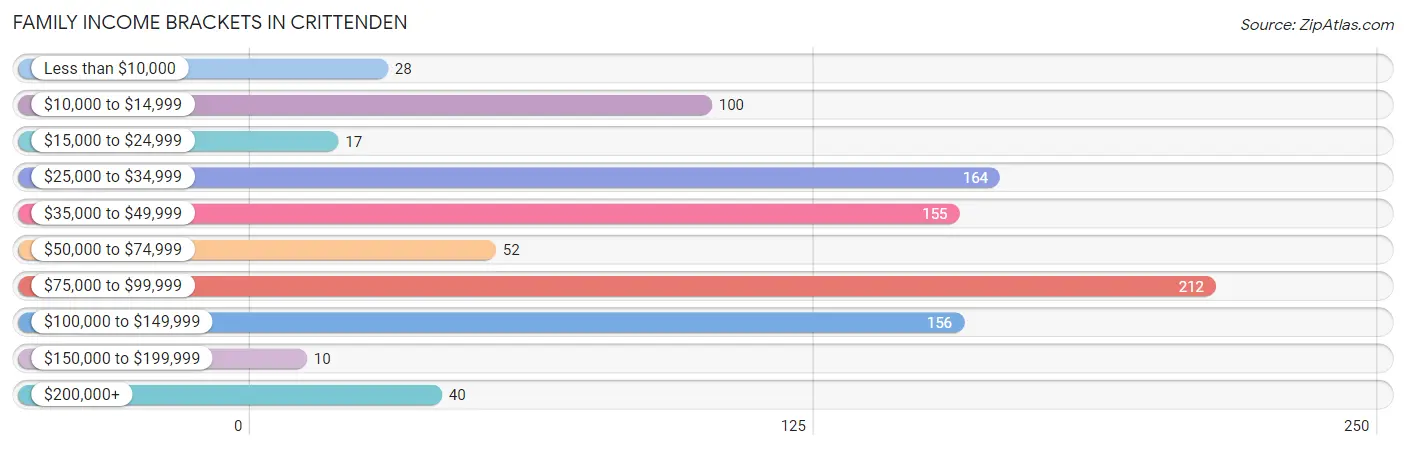
Family Income Brackets in Crittenden
According to the Crittenden family income data, there are 212 families falling into the $75,000 to $99,999 income range, which is the most common income bracket and makes up 22.7% of all families. Conversely, the $150,000 to $199,999 income bracket is the least frequent group with only 10 families (1.1%) belonging to this category.
| Income Bracket | # Families | % Families |
| Less than $10,000 | 28 | 3.0% |
| $10,000 to $14,999 | 100 | 10.7% |
| $15,000 to $24,999 | 17 | 1.8% |
| $25,000 to $34,999 | 164 | 17.6% |
| $35,000 to $49,999 | 155 | 16.6% |
| $50,000 to $74,999 | 52 | 5.6% |
| $75,000 to $99,999 | 212 | 22.7% |
| $100,000 to $149,999 | 156 | 16.7% |
| $150,000 to $199,999 | 10 | 1.1% |
| $200,000+ | 40 | 4.3% |
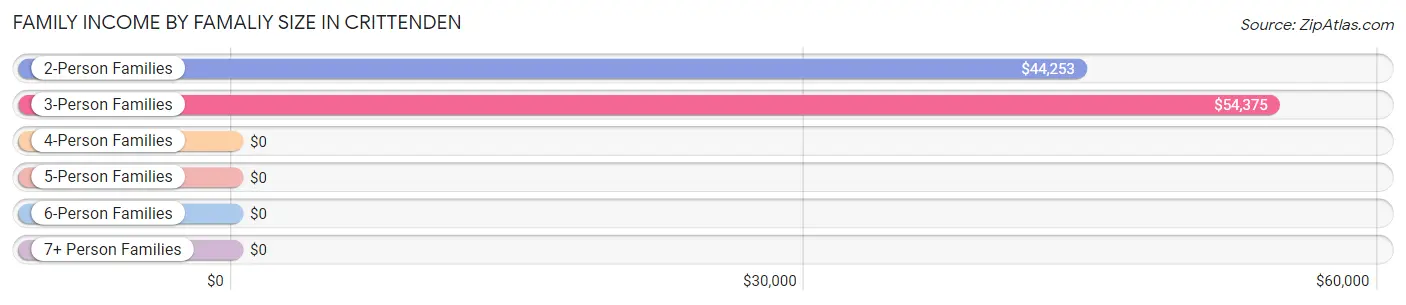
Family Income by Famaliy Size in Crittenden
3-person families (142 | 15.2%) account for the highest median family income in Crittenden with $54,375 per family, while 2-person families (561 | 60.1%) have the highest median income of $22,126 per family member.
| Income Bracket | # Families | Median Income |
| 2-Person Families | 561 (60.1%) | $44,253 |
| 3-Person Families | 142 (15.2%) | $54,375 |
| 4-Person Families | 129 (13.8%) | $0 |
| 5-Person Families | 75 (8.0%) | $0 |
| 6-Person Families | 0 (0.0%) | $0 |
| 7+ Person Families | 27 (2.9%) | $0 |
| Total | 934 (100.0%) | $51,875 |
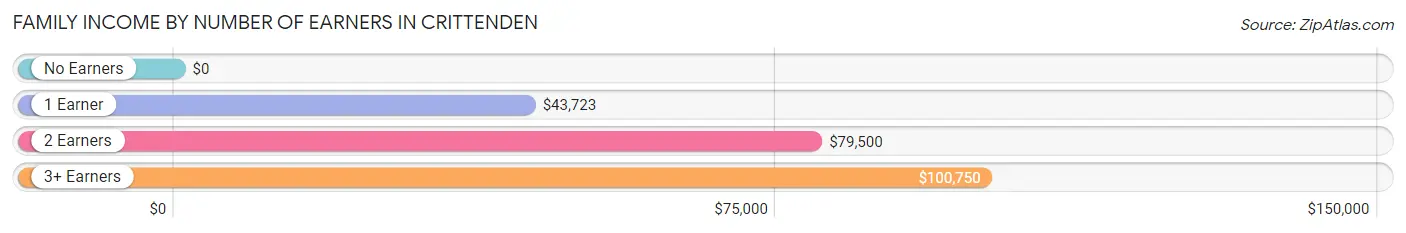
Family Income by Number of Earners in Crittenden
| Number of Earners | # Families | Median Income |
| No Earners | 160 (17.1%) | $0 |
| 1 Earner | 316 (33.8%) | $43,723 |
| 2 Earners | 354 (37.9%) | $79,500 |
| 3+ Earners | 104 (11.1%) | $100,750 |
| Total | 934 (100.0%) | $51,875 |
Household Income in Crittenden
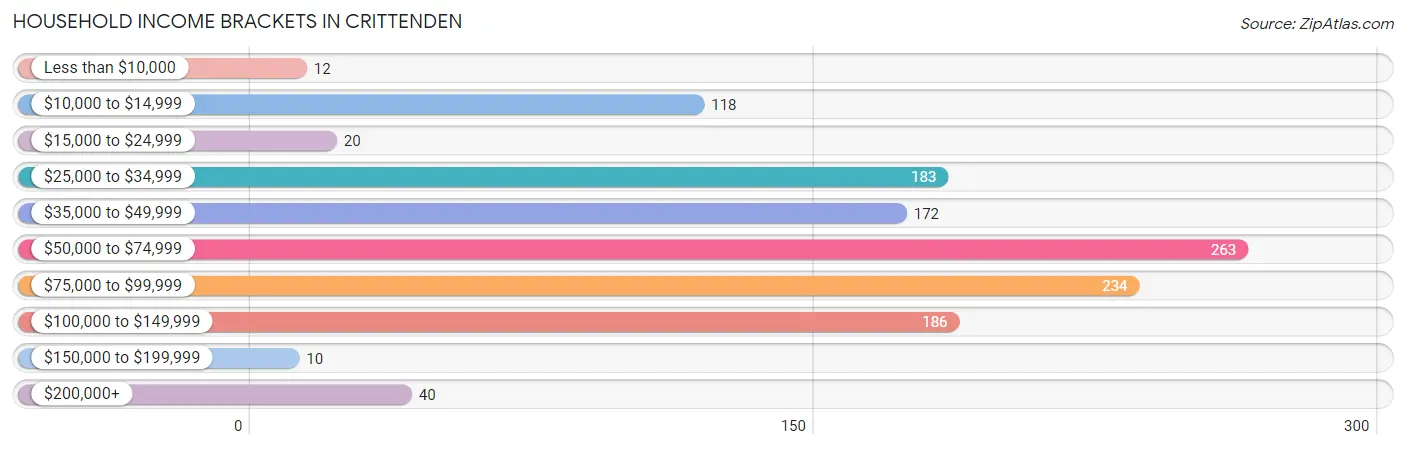
Household Income Brackets in Crittenden
With 263 households falling in the category, the $50,000 to $74,999 income range is the most frequent in Crittenden, accounting for 21.3% of all households. In contrast, only 10 households (0.8%) fall into the $150,000 to $199,999 income bracket, making it the least populous group.
| Income Bracket | # Households | % Households |
| Less than $10,000 | 12 | 1.0% |
| $10,000 to $14,999 | 118 | 9.5% |
| $15,000 to $24,999 | 20 | 1.6% |
| $25,000 to $34,999 | 183 | 14.8% |
| $35,000 to $49,999 | 172 | 13.9% |
| $50,000 to $74,999 | 263 | 21.3% |
| $75,000 to $99,999 | 234 | 18.9% |
| $100,000 to $149,999 | 186 | 15.0% |
| $150,000 to $199,999 | 10 | 0.8% |
| $200,000+ | 40 | 3.2% |
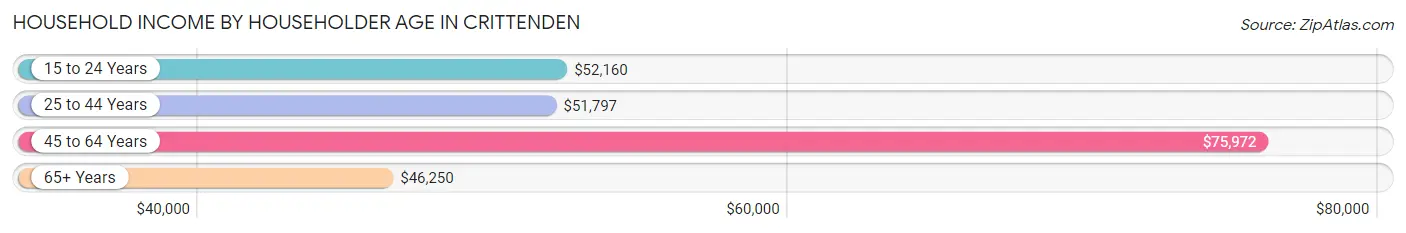
Household Income by Householder Age in Crittenden
The median household income in Crittenden is $52,217, with the highest median household income of $75,972 found in the 45 to 64 years age bracket for the primary householder. A total of 339 households (27.4%) fall into this category. Meanwhile, the 65+ years age bracket for the primary householder has the lowest median household income of $46,250, with 159 households (12.9%) in this group.
| Income Bracket | # Households | Median Income |
| 15 to 24 Years | 167 (13.5%) | $52,160 |
| 25 to 44 Years | 572 (46.2%) | $51,797 |
| 45 to 64 Years | 339 (27.4%) | $75,972 |
| 65+ Years | 159 (12.9%) | $46,250 |
| Total | 1,237 (100.0%) | $52,217 |
Poverty in Crittenden
Income Below Poverty by Sex and Age in Crittenden
With 12.0% poverty level for males and 18.4% for females among the residents of Crittenden, 25 to 34 year old males and 18 to 24 year old females are the most vulnerable to poverty, with 115 males (30.2%) and 128 females (75.3%) in their respective age groups living below the poverty level.
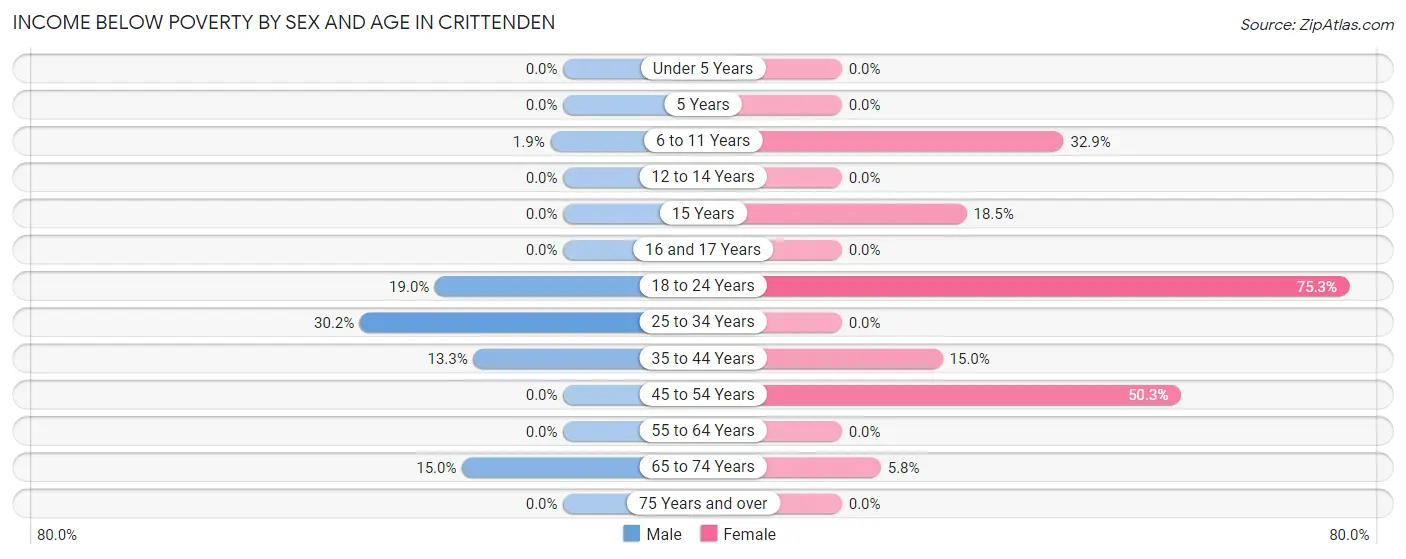
| Age Bracket | Male | Female |
| Under 5 Years | 0 (0.0%) | 0 (0.0%) |
| 5 Years | 0 (0.0%) | 0 (0.0%) |
| 6 to 11 Years | 6 (1.9%) | 27 (32.9%) |
| 12 to 14 Years | 0 (0.0%) | 0 (0.0%) |
| 15 Years | 0 (0.0%) | 5 (18.5%) |
| 16 and 17 Years | 0 (0.0%) | 0 (0.0%) |
| 18 to 24 Years | 111 (19.0%) | 128 (75.3%) |
| 25 to 34 Years | 115 (30.2%) | 0 (0.0%) |
| 35 to 44 Years | 24 (13.3%) | 47 (15.0%) |
| 45 to 54 Years | 0 (0.0%) | 100 (50.2%) |
| 55 to 64 Years | 0 (0.0%) | 0 (0.0%) |
| 65 to 74 Years | 12 (15.0%) | 7 (5.8%) |
| 75 Years and over | 0 (0.0%) | 0 (0.0%) |
| Total | 268 (12.0%) | 314 (18.4%) |
Income Above Poverty by Sex and Age in Crittenden
According to the poverty statistics in Crittenden, males aged under 5 years and females aged under 5 years are the age groups that are most secure financially, with 100.0% of males and 100.0% of females in these age groups living above the poverty line.
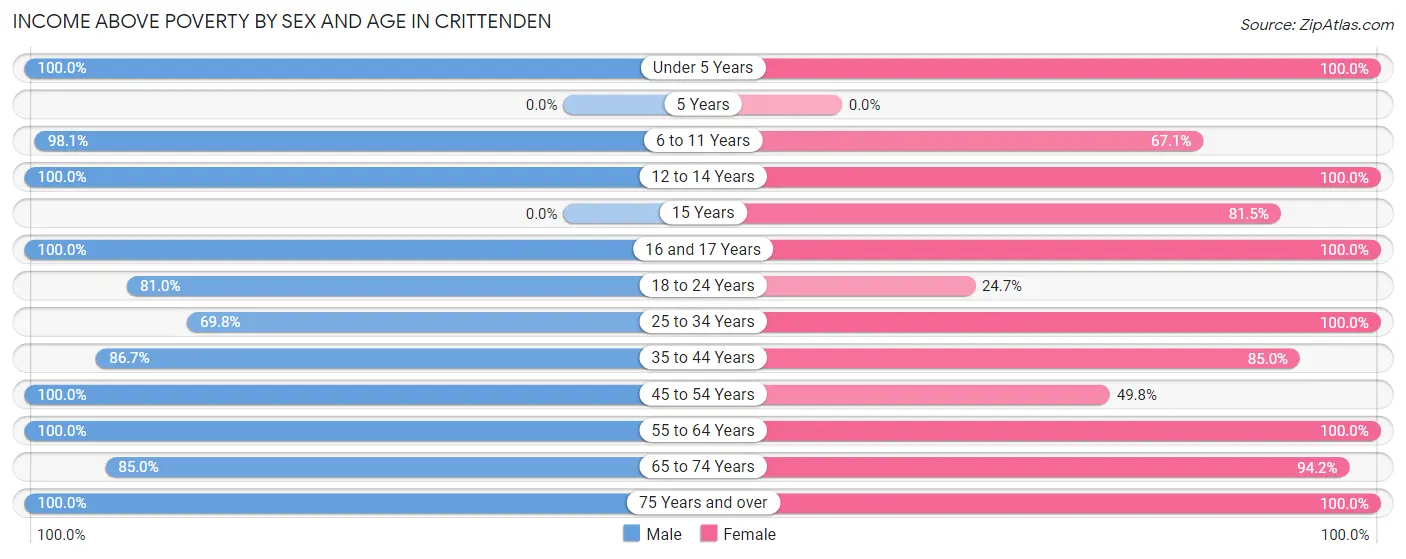
| Age Bracket | Male | Female |
| Under 5 Years | 168 (100.0%) | 233 (100.0%) |
| 5 Years | 0 (0.0%) | 0 (0.0%) |
| 6 to 11 Years | 308 (98.1%) | 55 (67.1%) |
| 12 to 14 Years | 143 (100.0%) | 126 (100.0%) |
| 15 Years | 0 (0.0%) | 22 (81.5%) |
| 16 and 17 Years | 70 (100.0%) | 63 (100.0%) |
| 18 to 24 Years | 472 (81.0%) | 42 (24.7%) |
| 25 to 34 Years | 266 (69.8%) | 228 (100.0%) |
| 35 to 44 Years | 156 (86.7%) | 267 (85.0%) |
| 45 to 54 Years | 203 (100.0%) | 99 (49.7%) |
| 55 to 64 Years | 51 (100.0%) | 110 (100.0%) |
| 65 to 74 Years | 68 (85.0%) | 114 (94.2%) |
| 75 Years and over | 65 (100.0%) | 35 (100.0%) |
| Total | 1,970 (88.0%) | 1,394 (81.6%) |
Income Below Poverty Among Married-Couple Families in Crittenden
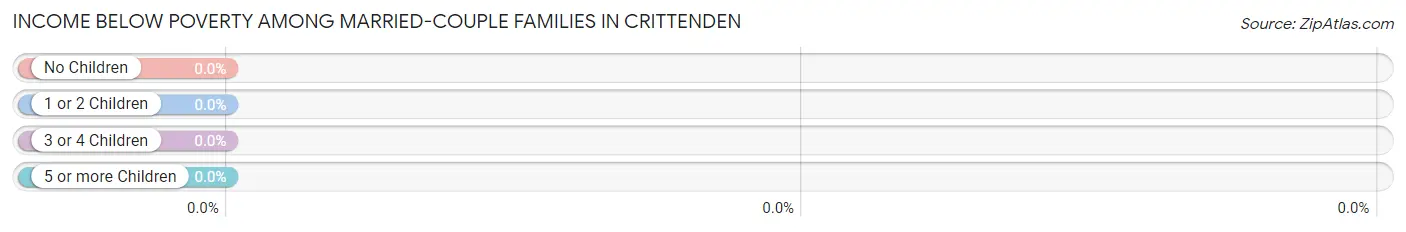
| Children | Above Poverty | Below Poverty |
| No Children | 188 (100.0%) | 0 (0.0%) |
| 1 or 2 Children | 223 (100.0%) | 0 (0.0%) |
| 3 or 4 Children | 11 (100.0%) | 0 (0.0%) |
| 5 or more Children | 0 (0.0%) | 0 (0.0%) |
| Total | 422 (100.0%) | 0 (0.0%) |
Income Below Poverty Among Single-Parent Households in Crittenden
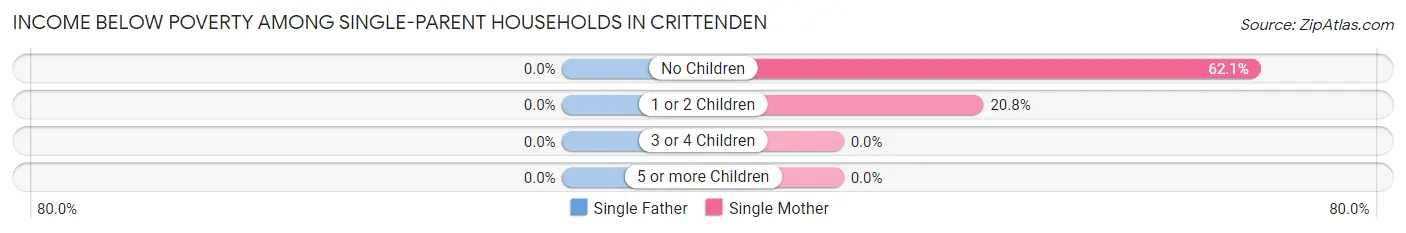
| Children | Single Father | Single Mother |
| No Children | 0 (0.0%) | 100 (62.1%) |
| 1 or 2 Children | 0 (0.0%) | 35 (20.8%) |
| 3 or 4 Children | 0 (0.0%) | 0 (0.0%) |
| 5 or more Children | 0 (0.0%) | 0 (0.0%) |
| Total | 0 (0.0%) | 135 (39.1%) |
Income Below Poverty Among Married-Couple vs Single-Parent Households in Crittenden
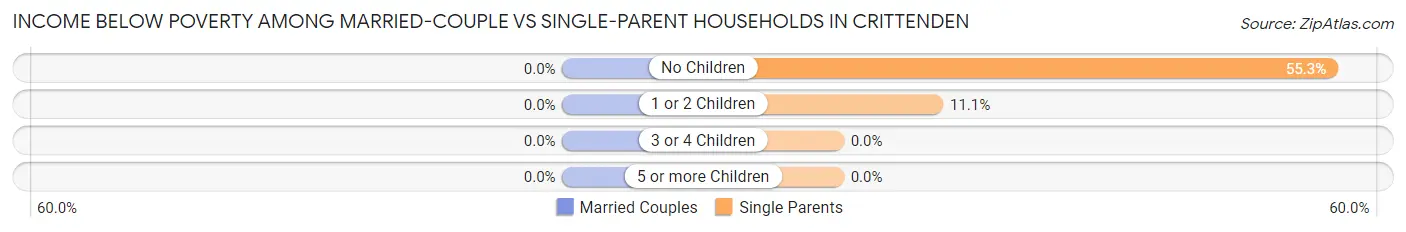
| Children | Married-Couple Families | Single-Parent Households |
| No Children | 0 (0.0%) | 100 (55.2%) |
| 1 or 2 Children | 0 (0.0%) | 35 (11.1%) |
| 3 or 4 Children | 0 (0.0%) | 0 (0.0%) |
| 5 or more Children | 0 (0.0%) | 0 (0.0%) |
| Total | 0 (0.0%) | 135 (26.4%) |
Race in Crittenden
The most populous races in Crittenden are White / Caucasian (3,417 | 84.7%), Hispanic or Latino (370 | 9.2%), and Black / African American (211 | 5.2%).
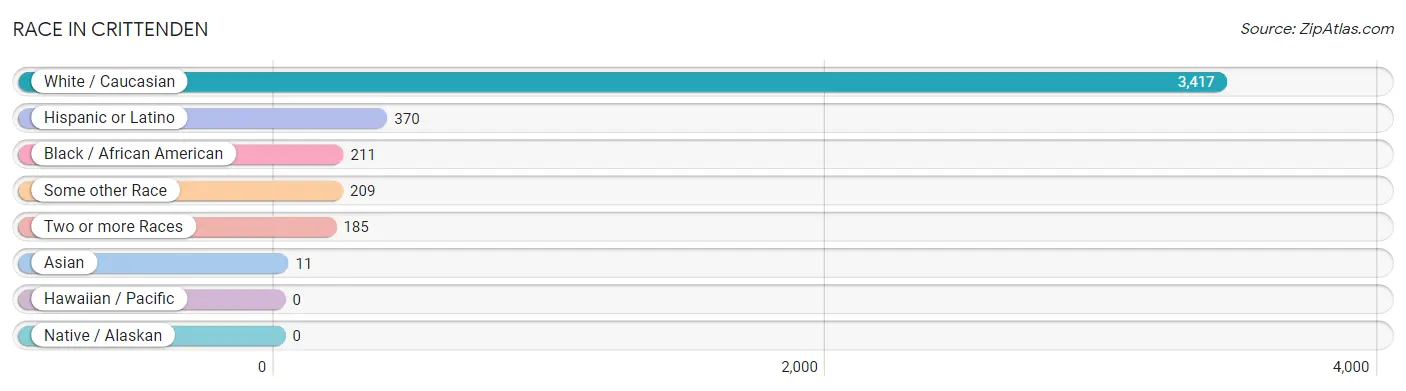
| Race | # Population | % Population |
| Asian | 11 | 0.3% |
| Black / African American | 211 | 5.2% |
| Hawaiian / Pacific | 0 | 0.0% |
| Hispanic or Latino | 370 | 9.2% |
| Native / Alaskan | 0 | 0.0% |
| White / Caucasian | 3,417 | 84.7% |
| Two or more Races | 185 | 4.6% |
| Some other Race | 209 | 5.2% |
| Total | 4,033 | 100.0% |
Ancestry in Crittenden
The most populous ancestries reported in Crittenden are German (566 | 14.0%), American (379 | 9.4%), English (219 | 5.4%), Irish (207 | 5.1%), and Central American (190 | 4.7%), together accounting for 38.7% of all Crittenden residents.
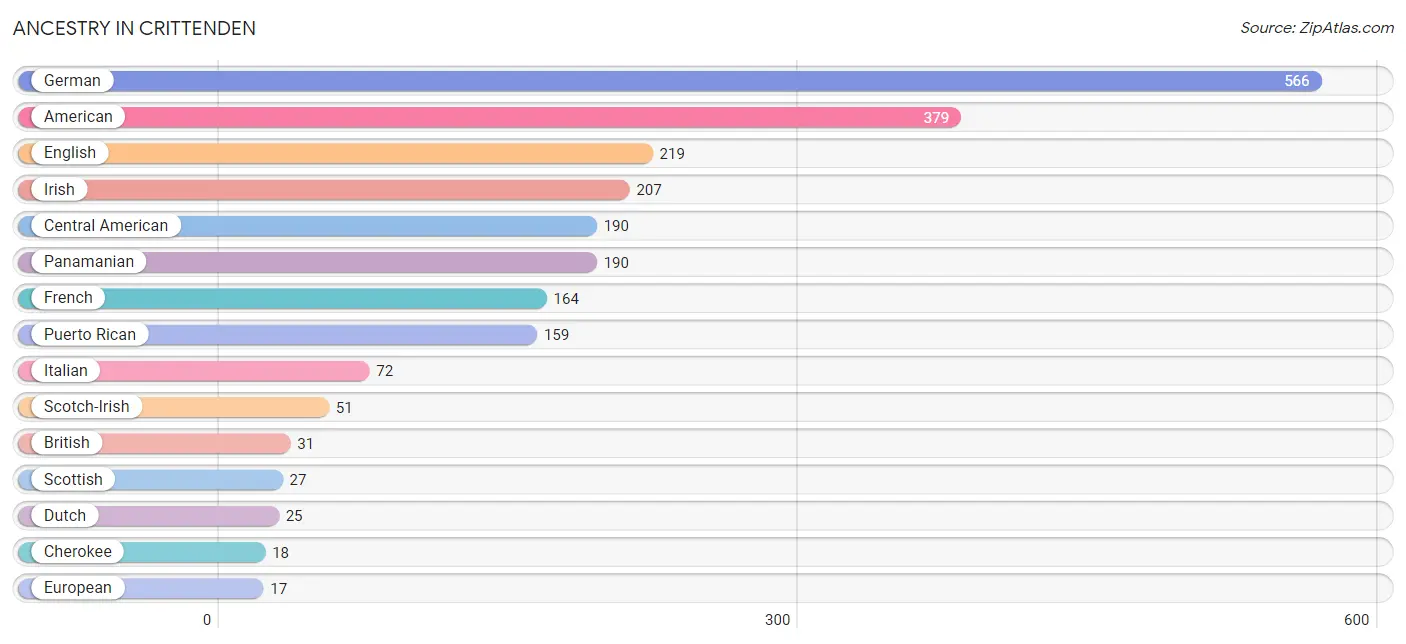
| Ancestry | # Population | % Population |
| American | 379 | 9.4% |
| Blackfeet | 4 | 0.1% |
| British | 31 | 0.8% |
| Central American | 190 | 4.7% |
| Cherokee | 18 | 0.4% |
| Dutch | 25 | 0.6% |
| English | 219 | 5.4% |
| European | 17 | 0.4% |
| Finnish | 9 | 0.2% |
| French | 164 | 4.1% |
| German | 566 | 14.0% |
| Irish | 207 | 5.1% |
| Italian | 72 | 1.8% |
| Japanese | 11 | 0.3% |
| Panamanian | 190 | 4.7% |
| Puerto Rican | 159 | 3.9% |
| Scotch-Irish | 51 | 1.3% |
| Scottish | 27 | 0.7% | View All 18 Rows |
Immigrants in Crittenden
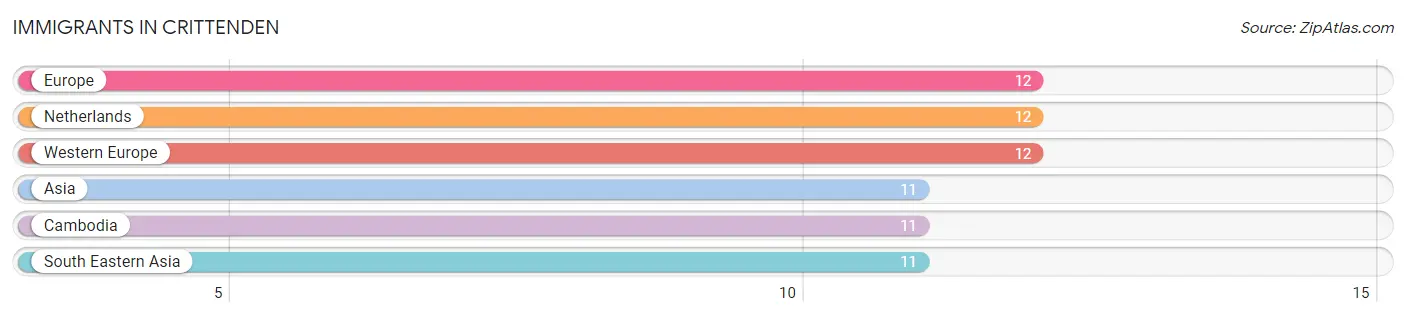
The most numerous immigrant groups reported in Crittenden came from Europe (12 | 0.3%), Netherlands (12 | 0.3%), Western Europe (12 | 0.3%), Asia (11 | 0.3%), and Cambodia (11 | 0.3%), together accounting for 1.4% of all Crittenden residents.
| Immigration Origin | # Population | % Population |
| Asia | 11 | 0.3% |
| Cambodia | 11 | 0.3% |
| Europe | 12 | 0.3% |
| Netherlands | 12 | 0.3% |
| South Eastern Asia | 11 | 0.3% |
| Western Europe | 12 | 0.3% | View All 6 Rows |
Sex and Age in Crittenden
Sex and Age in Crittenden
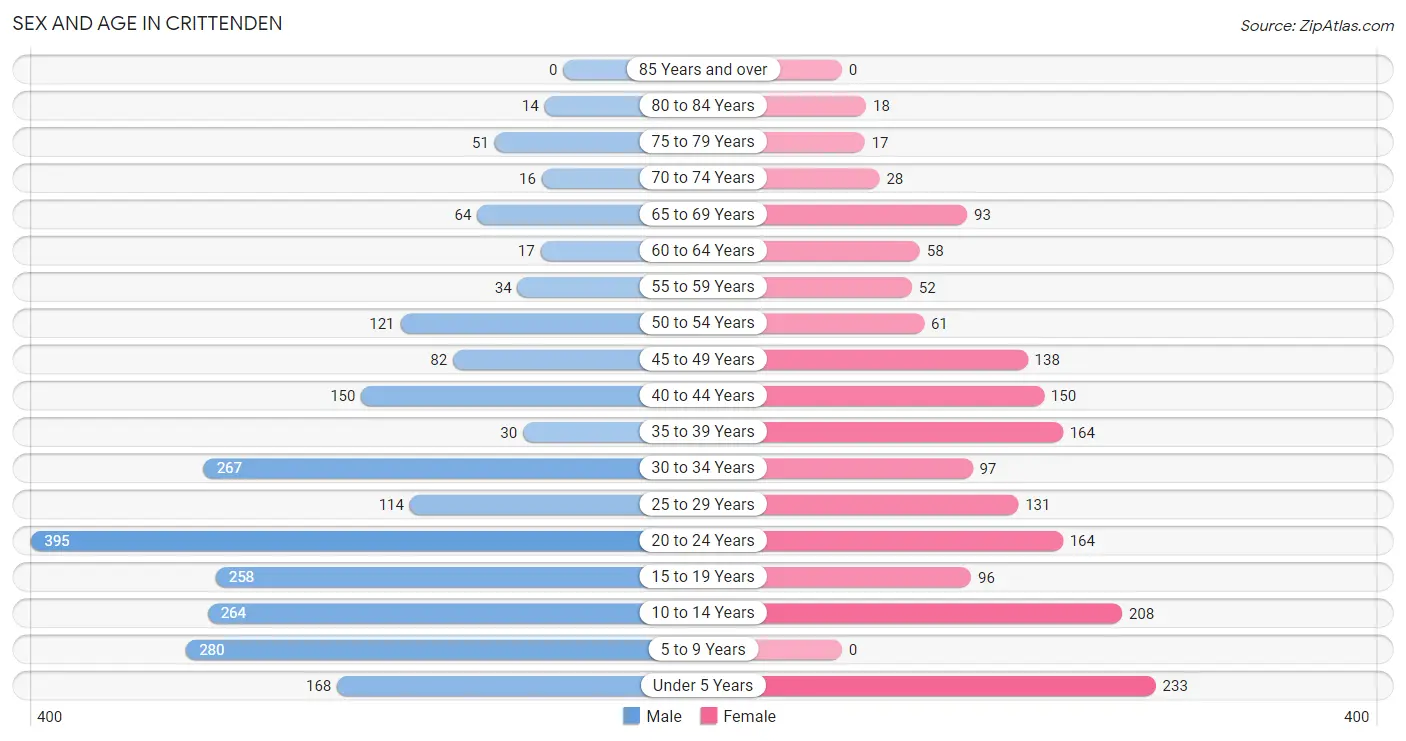
The most populous age groups in Crittenden are 20 to 24 Years (395 | 17.0%) for men and Under 5 Years (233 | 13.6%) for women.
| Age Bracket | Male | Female |
| Under 5 Years | 168 (7.2%) | 233 (13.6%) |
| 5 to 9 Years | 280 (12.0%) | 0 (0.0%) |
| 10 to 14 Years | 264 (11.4%) | 208 (12.2%) |
| 15 to 19 Years | 258 (11.1%) | 96 (5.6%) |
| 20 to 24 Years | 395 (17.0%) | 164 (9.6%) |
| 25 to 29 Years | 114 (4.9%) | 131 (7.7%) |
| 30 to 34 Years | 267 (11.5%) | 97 (5.7%) |
| 35 to 39 Years | 30 (1.3%) | 164 (9.6%) |
| 40 to 44 Years | 150 (6.5%) | 150 (8.8%) |
| 45 to 49 Years | 82 (3.5%) | 138 (8.1%) |
| 50 to 54 Years | 121 (5.2%) | 61 (3.6%) |
| 55 to 59 Years | 34 (1.5%) | 52 (3.0%) |
| 60 to 64 Years | 17 (0.7%) | 58 (3.4%) |
| 65 to 69 Years | 64 (2.8%) | 93 (5.4%) |
| 70 to 74 Years | 16 (0.7%) | 28 (1.6%) |
| 75 to 79 Years | 51 (2.2%) | 17 (1.0%) |
| 80 to 84 Years | 14 (0.6%) | 18 (1.1%) |
| 85 Years and over | 0 (0.0%) | 0 (0.0%) |
| Total | 2,325 (100.0%) | 1,708 (100.0%) |
Families and Households in Crittenden
Median Family Size in Crittenden
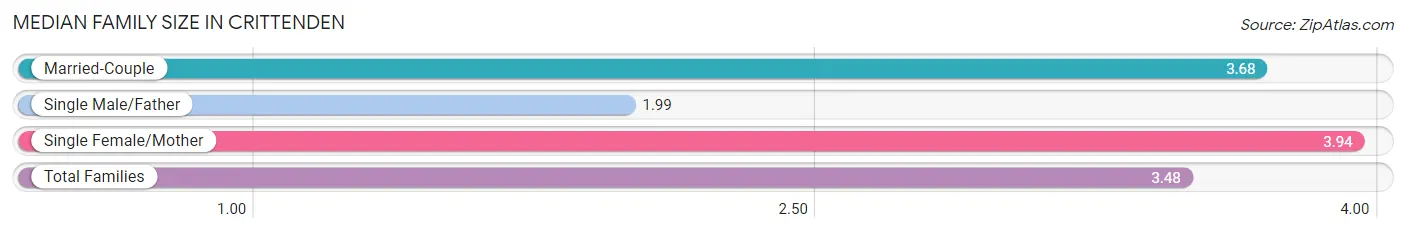
The median family size in Crittenden is 3.48 persons per family, with single female/mother families (345 | 36.9%) accounting for the largest median family size of 3.94 persons per family. On the other hand, single male/father families (167 | 17.9%) represent the smallest median family size with 1.99 persons per family.
| Family Type | # Families | Family Size |
| Married-Couple | 422 (45.2%) | 3.68 |
| Single Male/Father | 167 (17.9%) | 1.99 |
| Single Female/Mother | 345 (36.9%) | 3.94 |
| Total Families | 934 (100.0%) | 3.48 |
Median Household Size in Crittenden
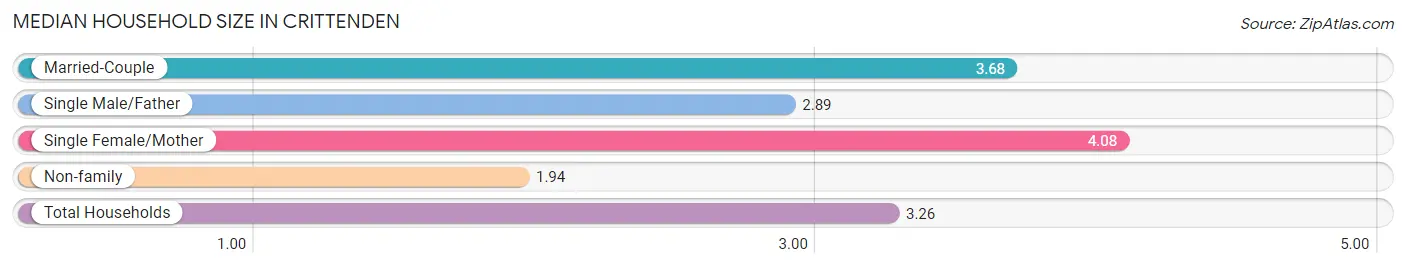
The median household size in Crittenden is 3.26 persons per household, with single female/mother households (345 | 27.9%) accounting for the largest median household size of 4.08 persons per household. non-family households (303 | 24.5%) represent the smallest median household size with 1.94 persons per household.
| Household Type | # Households | Household Size |
| Married-Couple | 422 (34.1%) | 3.68 |
| Single Male/Father | 167 (13.5%) | 2.89 |
| Single Female/Mother | 345 (27.9%) | 4.08 |
| Non-family | 303 (24.5%) | 1.94 |
| Total Households | 1,237 (100.0%) | 3.26 |
Household Size by Marriage Status in Crittenden
Out of a total of 1,237 households in Crittenden, 934 (75.5%) are family households, while 303 (24.5%) are nonfamily households. The most numerous type of family households are 2-person households, comprising 386, and the most common type of nonfamily households are 1-person households, comprising 155.
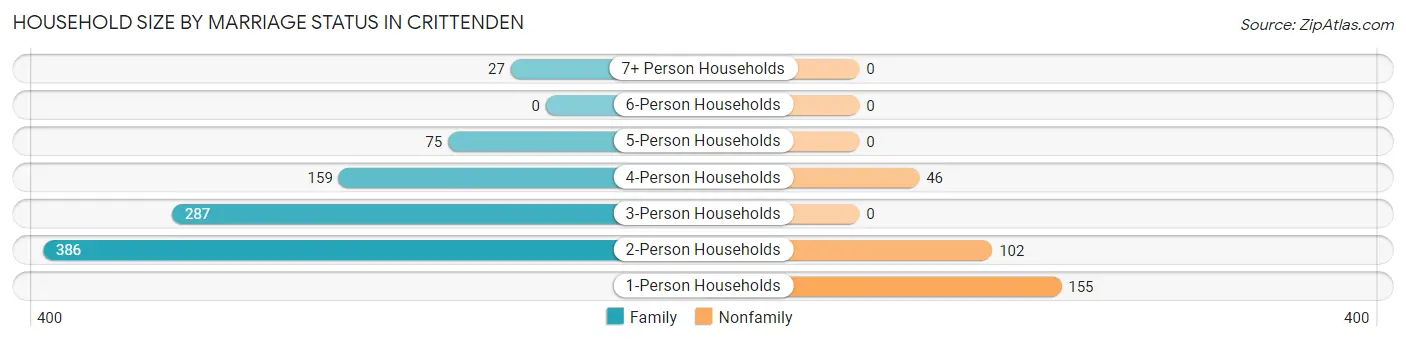
| Household Size | Family Households | Nonfamily Households |
| 1-Person Households | - | 155 (12.5%) |
| 2-Person Households | 386 (31.2%) | 102 (8.3%) |
| 3-Person Households | 287 (23.2%) | 0 (0.0%) |
| 4-Person Households | 159 (12.9%) | 46 (3.7%) |
| 5-Person Households | 75 (6.1%) | 0 (0.0%) |
| 6-Person Households | 0 (0.0%) | 0 (0.0%) |
| 7+ Person Households | 27 (2.2%) | 0 (0.0%) |
| Total | 934 (75.5%) | 303 (24.5%) |
Female Fertility in Crittenden
Fertility by Age in Crittenden
Average fertility rate in Crittenden is 78.0 births per 1,000 women. Women in the age bracket of 20 to 34 years have the highest fertility rate with 135.0 births per 1,000 women. Women in the age bracket of 20 to 34 years acount for 72.6% of all women with births.
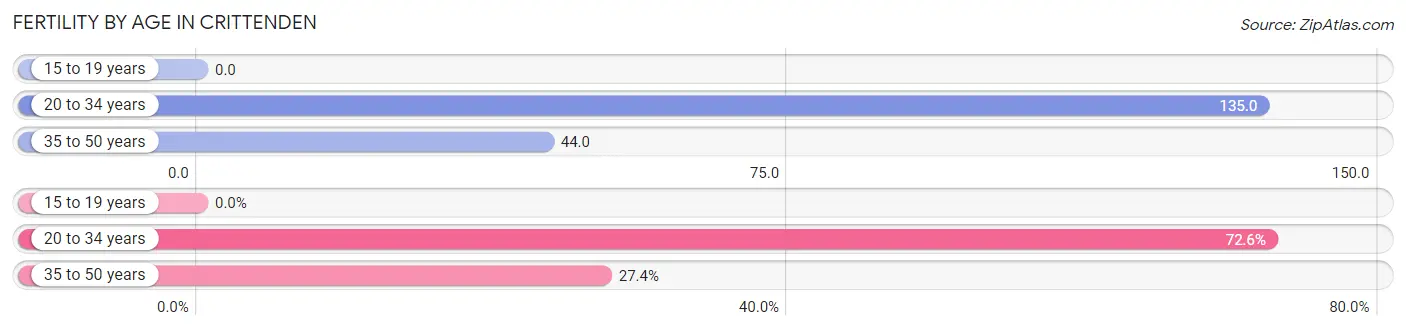
| Age Bracket | Women with Births | Births / 1,000 Women |
| 15 to 19 years | 0 (0.0%) | 0.0 |
| 20 to 34 years | 53 (72.6%) | 135.0 |
| 35 to 50 years | 20 (27.4%) | 44.0 |
| Total | 73 (100.0%) | 78.0 |
Fertility by Age by Marriage Status in Crittenden
27.4% of women with births (73) in Crittenden are married. The highest percentage of unmarried women with births falls into 20 to 34 years age bracket with 100.0% of them unmarried at the time of birth, while the lowest percentage of unmarried women with births belong to 35 to 50 years age bracket with 0.0% of them unmarried.
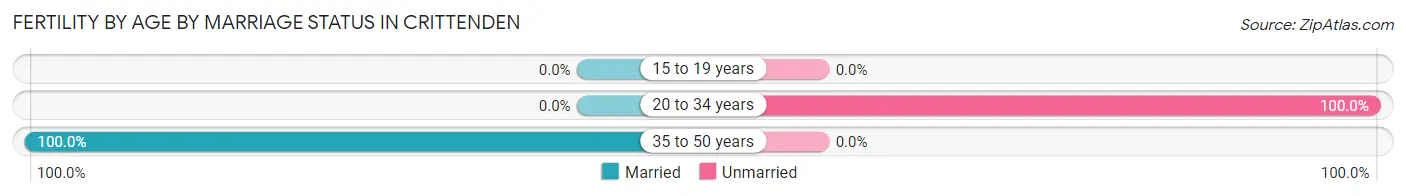
| Age Bracket | Married | Unmarried |
| 15 to 19 years | 0 (0.0%) | 0 (0.0%) |
| 20 to 34 years | 0 (0.0%) | 53 (100.0%) |
| 35 to 50 years | 20 (100.0%) | 0 (0.0%) |
| Total | 20 (27.4%) | 53 (72.6%) |
Fertility by Education in Crittenden
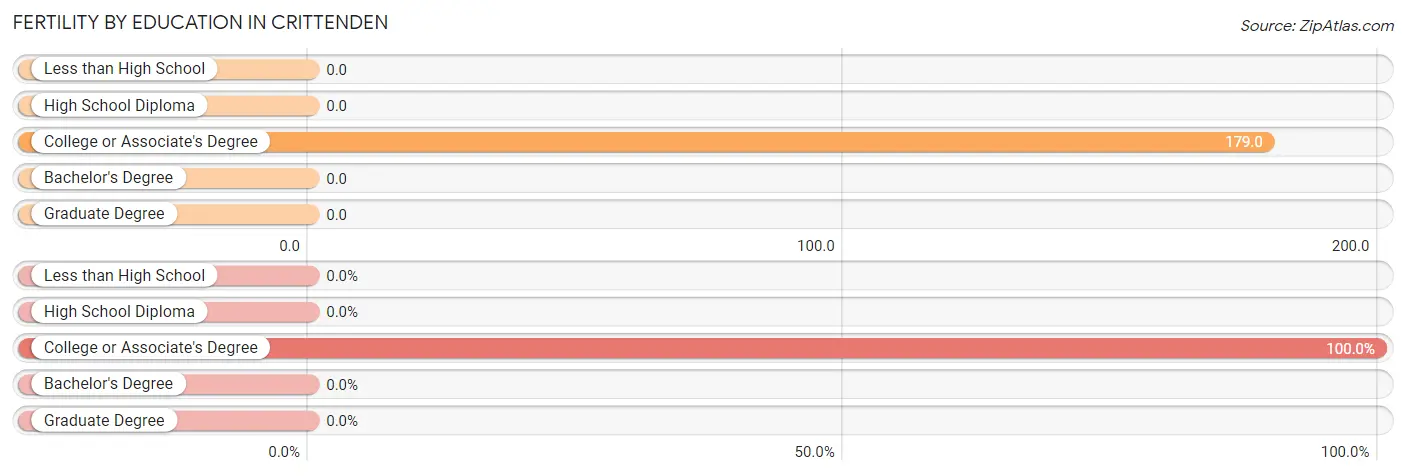
| Educational Attainment | Women with Births | Births / 1,000 Women |
| Less than High School | 0 (0.0%) | 0.0 |
| High School Diploma | 0 (0.0%) | 0.0 |
| College or Associate's Degree | 73 (100.0%) | 179.0 |
| Bachelor's Degree | 0 (0.0%) | 0.0 |
| Graduate Degree | 0 (0.0%) | 0.0 |
| Total | 73 (100.0%) | 78.0 |
Fertility by Education by Marriage Status in Crittenden
72.6% of women with births in Crittenden are unmarried. Women with the educational attainment of college or associate's degree are most likely to be married with 27.4% of them married at childbirth, while women with the educational attainment of college or associate's degree are least likely to be married with 72.6% of them unmarried at childbirth.
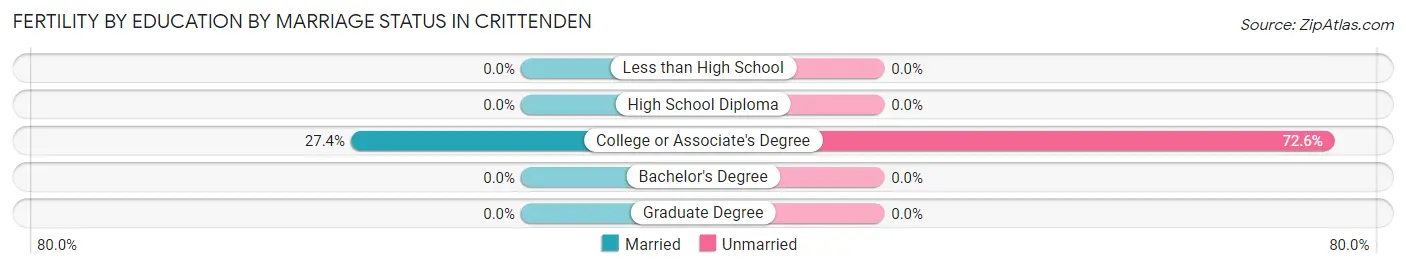
| Educational Attainment | Married | Unmarried |
| Less than High School | 0 (0.0%) | 0 (0.0%) |
| High School Diploma | 0 (0.0%) | 0 (0.0%) |
| College or Associate's Degree | 20 (27.4%) | 53 (72.6%) |
| Bachelor's Degree | 0 (0.0%) | 0 (0.0%) |
| Graduate Degree | 0 (0.0%) | 0 (0.0%) |
| Total | 20 (27.4%) | 53 (72.6%) |
Employment Characteristics in Crittenden
Employment by Class of Employer in Crittenden
Among the 1,757 employed individuals in Crittenden, private company employees (1,515 | 86.2%), local government employees (103 | 5.9%), and not-for-profit organizations (100 | 5.7%) make up the most common classes of employment.
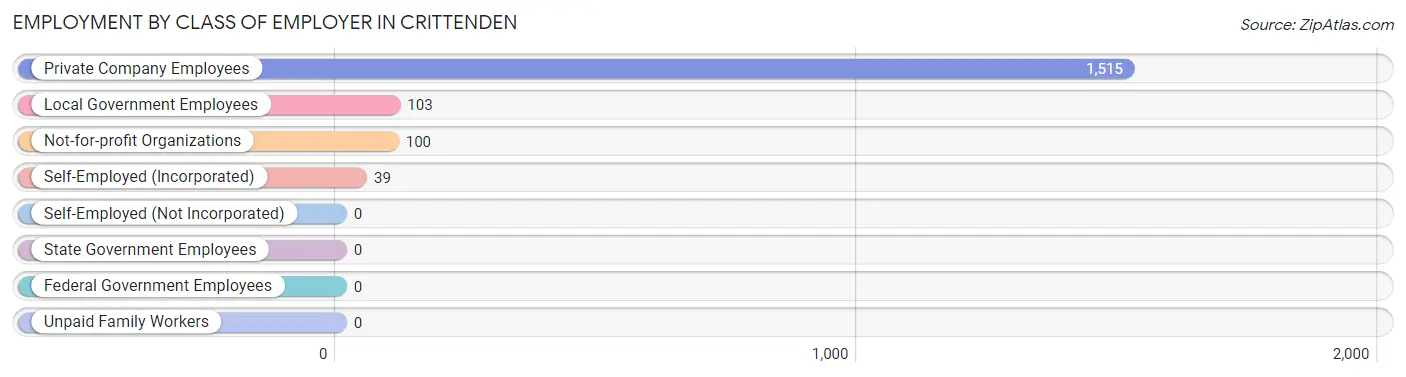
| Employer Class | # Employees | % Employees |
| Private Company Employees | 1,515 | 86.2% |
| Self-Employed (Incorporated) | 39 | 2.2% |
| Self-Employed (Not Incorporated) | 0 | 0.0% |
| Not-for-profit Organizations | 100 | 5.7% |
| Local Government Employees | 103 | 5.9% |
| State Government Employees | 0 | 0.0% |
| Federal Government Employees | 0 | 0.0% |
| Unpaid Family Workers | 0 | 0.0% |
| Total | 1,757 | 100.0% |
Employment Status by Age in Crittenden
According to the labor force statistics for Crittenden, out of the total population over 16 years of age (2,853), 66.1% or 1,886 individuals are in the labor force, with 5.7% or 108 of them unemployed. The age group with the highest labor force participation rate is 25 to 29 years, with 97.6% or 239 individuals in the labor force. Within the labor force, the 16 to 19 years age range has the highest percentage of unemployed individuals, with 32.7% or 56 of them being unemployed.
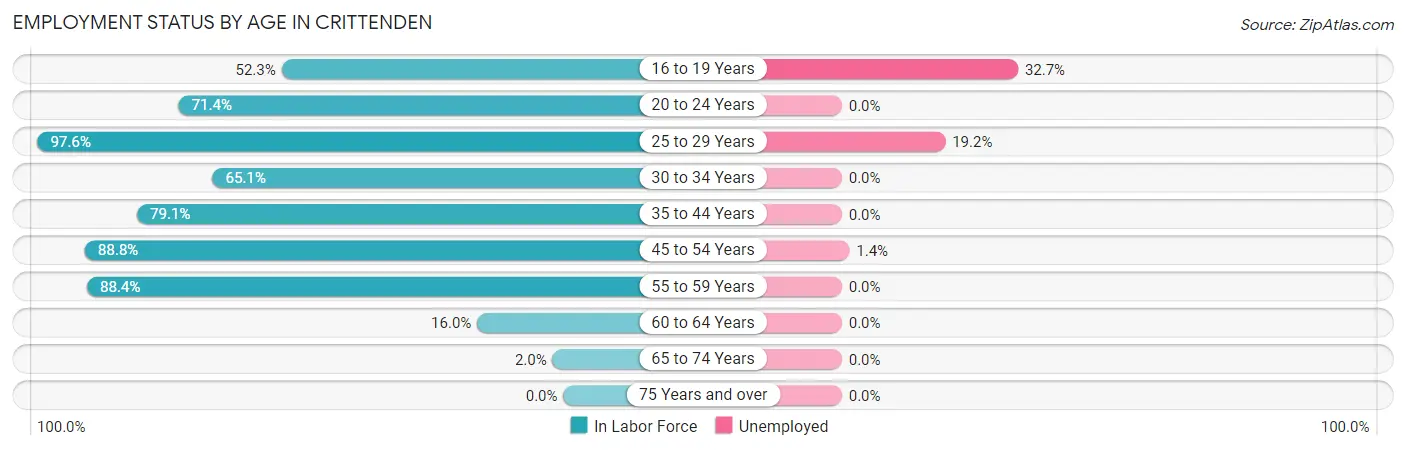
| Age Bracket | In Labor Force | Unemployed |
| 16 to 19 Years | 171 (52.3%) | 56 (32.7%) |
| 20 to 24 Years | 399 (71.4%) | 0 (0.0%) |
| 25 to 29 Years | 239 (97.6%) | 46 (19.2%) |
| 30 to 34 Years | 237 (65.1%) | 0 (0.0%) |
| 35 to 44 Years | 391 (79.1%) | 0 (0.0%) |
| 45 to 54 Years | 357 (88.8%) | 5 (1.4%) |
| 55 to 59 Years | 76 (88.4%) | 0 (0.0%) |
| 60 to 64 Years | 12 (16.0%) | 0 (0.0%) |
| 65 to 74 Years | 4 (2.0%) | 0 (0.0%) |
| 75 Years and over | 0 (0.0%) | 0 (0.0%) |
| Total | 1,886 (66.1%) | 108 (5.7%) |
Employment Status by Educational Attainment in Crittenden
According to labor force statistics for Crittenden, 78.8% of individuals (1,313) out of the total population between 25 and 64 years of age (1,666) are in the labor force, with 3.9% or 51 of them being unemployed. The group with the highest labor force participation rate are those with the educational attainment of less than high school, with 100.0% or 73 individuals in the labor force. Within the labor force, individuals with college / associate degree education have the highest percentage of unemployment, with 10.0% or 51 of them being unemployed.
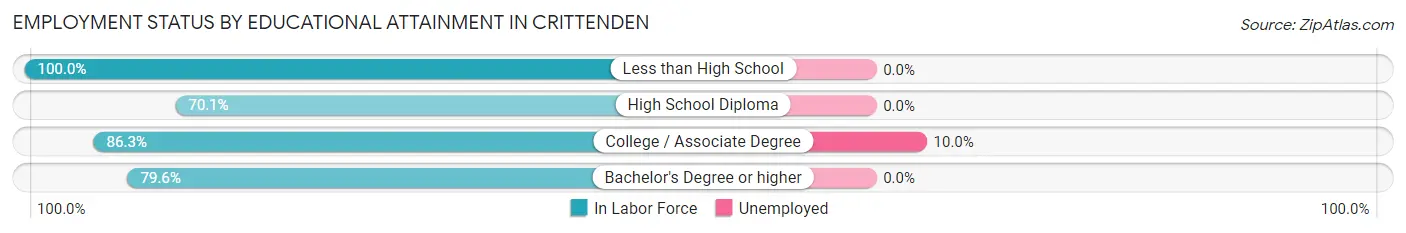
| Educational Attainment | In Labor Force | Unemployed |
| Less than High School | 73 (100.0%) | 0 (0.0%) |
| High School Diploma | 507 (70.1%) | 0 (0.0%) |
| College / Associate Degree | 510 (86.3%) | 59 (10.0%) |
| Bachelor's Degree or higher | 222 (79.6%) | 0 (0.0%) |
| Total | 1,313 (78.8%) | 65 (3.9%) |
Employment Occupations by Sex in Crittenden
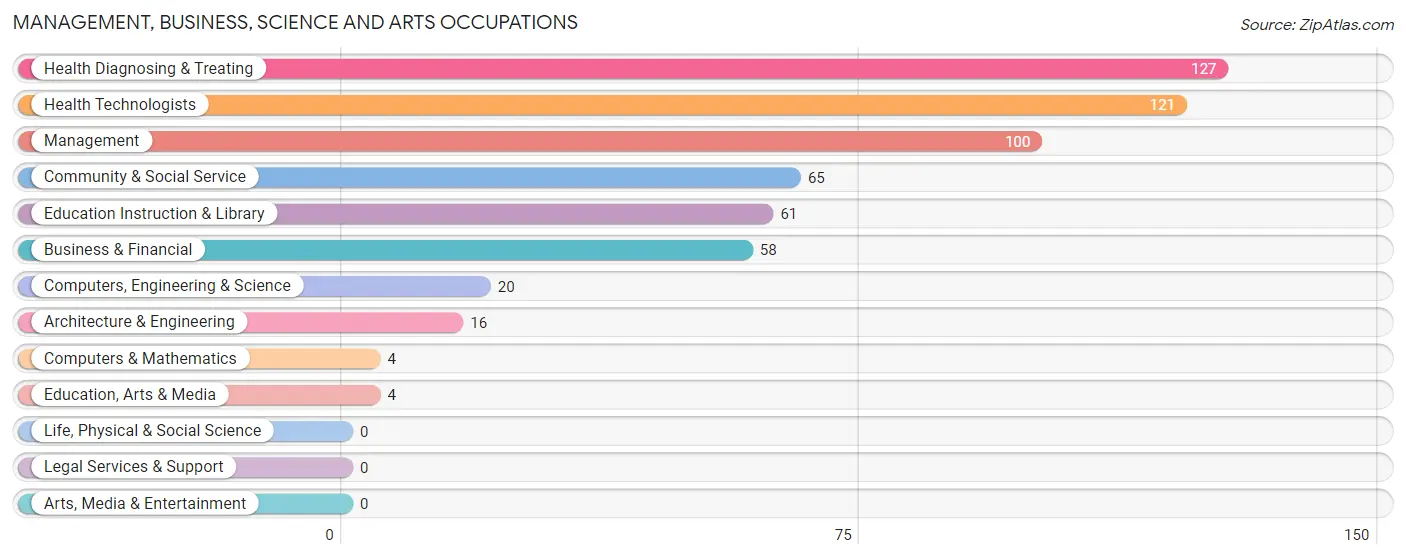
Management, Business, Science and Arts Occupations
The most common Management, Business, Science and Arts occupations in Crittenden are Health Diagnosing & Treating (127 | 7.1%), Health Technologists (121 | 6.8%), Management (100 | 5.6%), Community & Social Service (65 | 3.6%), and Education Instruction & Library (61 | 3.4%).
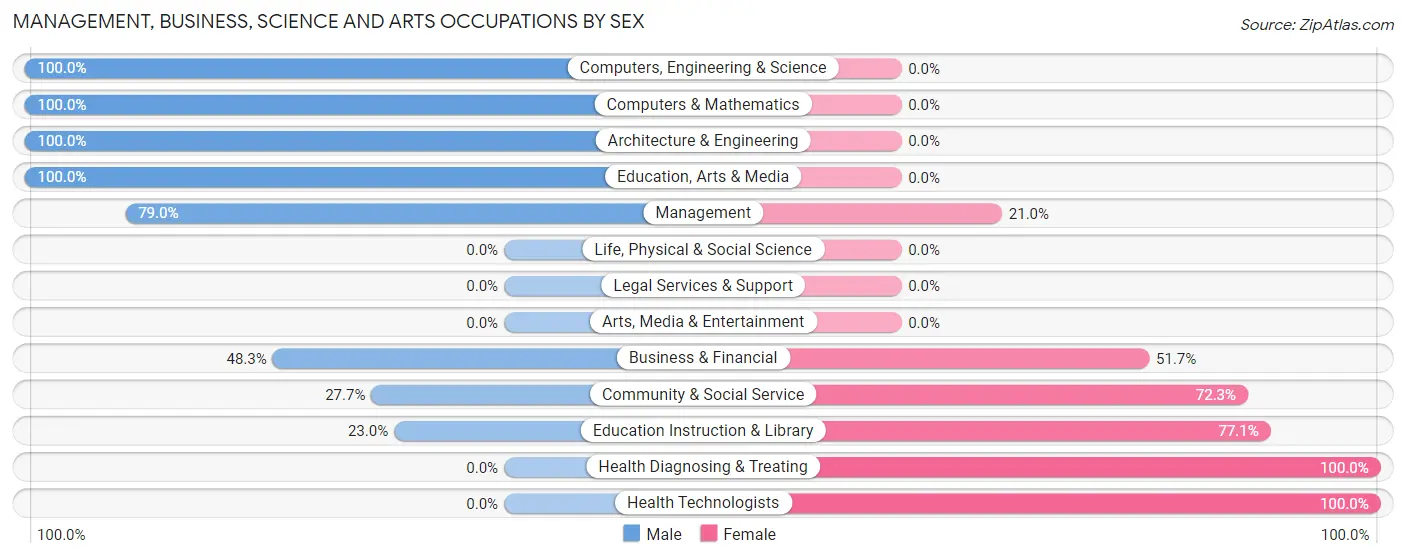
Management, Business, Science and Arts Occupations by Sex
Within the Management, Business, Science and Arts occupations in Crittenden, the most male-oriented occupations are Computers, Engineering & Science (100.0%), Computers & Mathematics (100.0%), and Architecture & Engineering (100.0%), while the most female-oriented occupations are Health Diagnosing & Treating (100.0%), Health Technologists (100.0%), and Education Instruction & Library (77.0%).
| Occupation | Male | Female |
| Management | 79 (79.0%) | 21 (21.0%) |
| Business & Financial | 28 (48.3%) | 30 (51.7%) |
| Computers, Engineering & Science | 20 (100.0%) | 0 (0.0%) |
| Computers & Mathematics | 4 (100.0%) | 0 (0.0%) |
| Architecture & Engineering | 16 (100.0%) | 0 (0.0%) |
| Life, Physical & Social Science | 0 (0.0%) | 0 (0.0%) |
| Community & Social Service | 18 (27.7%) | 47 (72.3%) |
| Education, Arts & Media | 4 (100.0%) | 0 (0.0%) |
| Legal Services & Support | 0 (0.0%) | 0 (0.0%) |
| Education Instruction & Library | 14 (23.0%) | 47 (77.0%) |
| Arts, Media & Entertainment | 0 (0.0%) | 0 (0.0%) |
| Health Diagnosing & Treating | 0 (0.0%) | 127 (100.0%) |
| Health Technologists | 0 (0.0%) | 121 (100.0%) |
| Total (Category) | 145 (39.2%) | 225 (60.8%) |
| Total (Overall) | 917 (51.5%) | 862 (48.4%) |
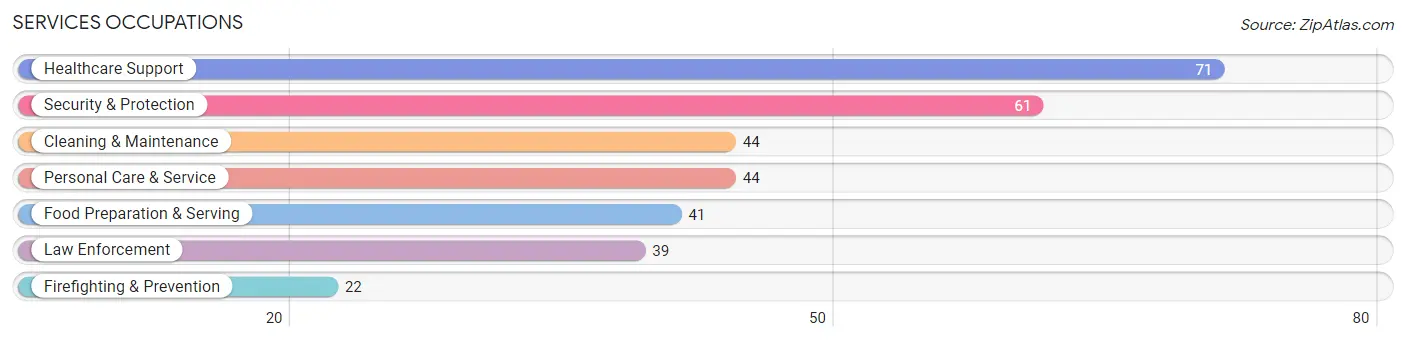
Services Occupations
The most common Services occupations in Crittenden are Healthcare Support (71 | 4.0%), Security & Protection (61 | 3.4%), Cleaning & Maintenance (44 | 2.5%), Personal Care & Service (44 | 2.5%), and Food Preparation & Serving (41 | 2.3%).
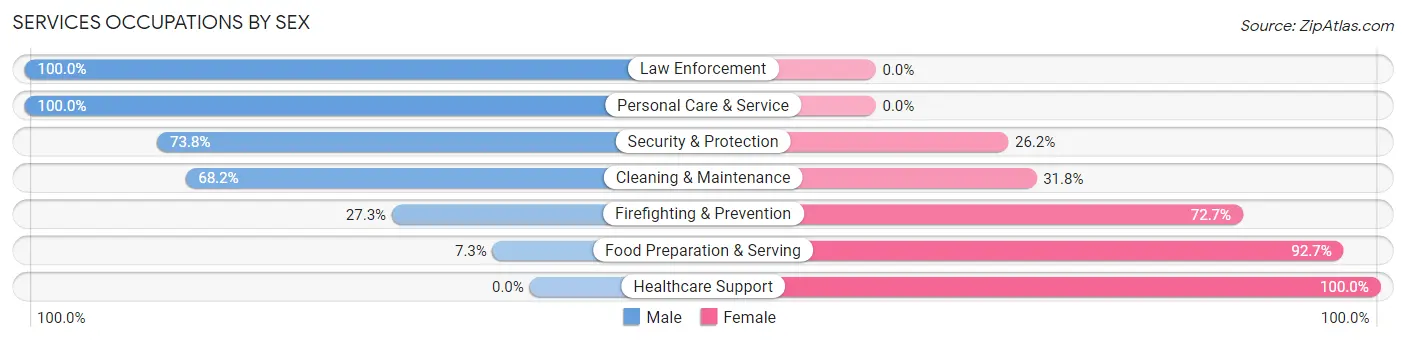
Services Occupations by Sex
Within the Services occupations in Crittenden, the most male-oriented occupations are Law Enforcement (100.0%), Personal Care & Service (100.0%), and Security & Protection (73.8%), while the most female-oriented occupations are Healthcare Support (100.0%), Food Preparation & Serving (92.7%), and Firefighting & Prevention (72.7%).
| Occupation | Male | Female |
| Healthcare Support | 0 (0.0%) | 71 (100.0%) |
| Security & Protection | 45 (73.8%) | 16 (26.2%) |
| Firefighting & Prevention | 6 (27.3%) | 16 (72.7%) |
| Law Enforcement | 39 (100.0%) | 0 (0.0%) |
| Food Preparation & Serving | 3 (7.3%) | 38 (92.7%) |
| Cleaning & Maintenance | 30 (68.2%) | 14 (31.8%) |
| Personal Care & Service | 44 (100.0%) | 0 (0.0%) |
| Total (Category) | 122 (46.7%) | 139 (53.3%) |
| Total (Overall) | 917 (51.5%) | 862 (48.4%) |
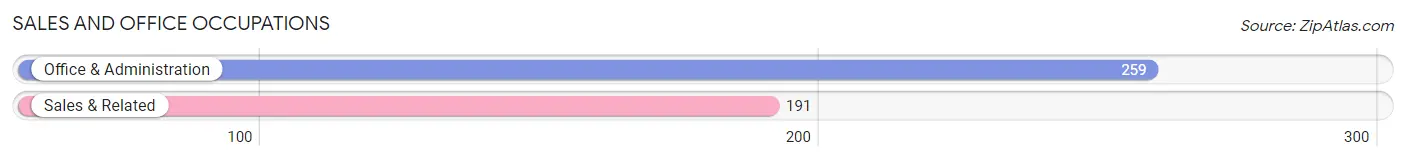
Sales and Office Occupations
The most common Sales and Office occupations in Crittenden are Office & Administration (259 | 14.6%), and Sales & Related (191 | 10.7%).
Sales and Office Occupations by Sex
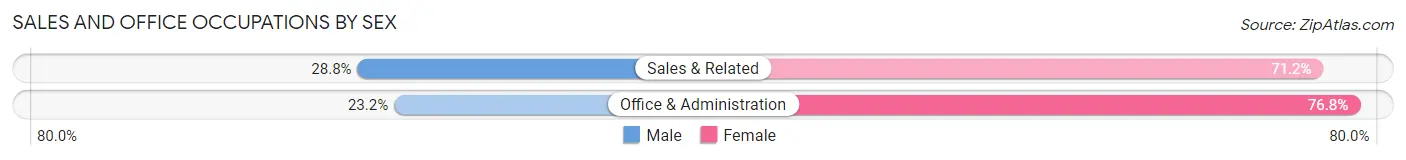
| Occupation | Male | Female |
| Sales & Related | 55 (28.8%) | 136 (71.2%) |
| Office & Administration | 60 (23.2%) | 199 (76.8%) |
| Total (Category) | 115 (25.6%) | 335 (74.4%) |
| Total (Overall) | 917 (51.5%) | 862 (48.4%) |
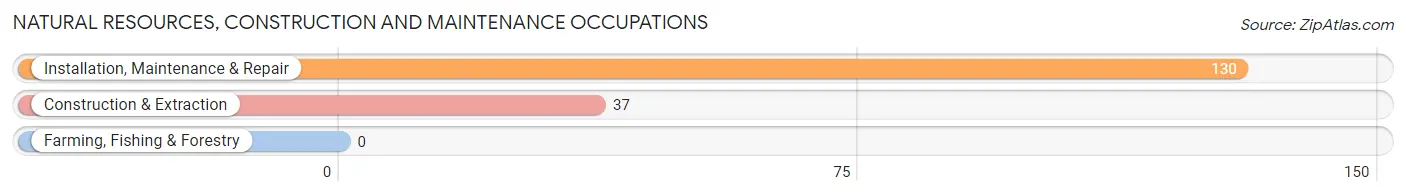
Natural Resources, Construction and Maintenance Occupations
The most common Natural Resources, Construction and Maintenance occupations in Crittenden are Installation, Maintenance & Repair (130 | 7.3%), and Construction & Extraction (37 | 2.1%).
Natural Resources, Construction and Maintenance Occupations by Sex
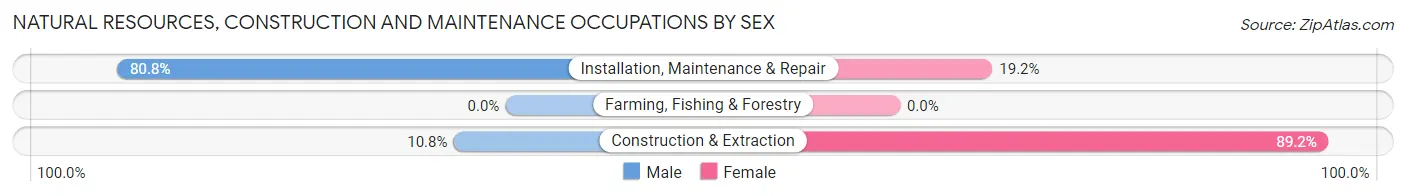
| Occupation | Male | Female |
| Farming, Fishing & Forestry | 0 (0.0%) | 0 (0.0%) |
| Construction & Extraction | 4 (10.8%) | 33 (89.2%) |
| Installation, Maintenance & Repair | 105 (80.8%) | 25 (19.2%) |
| Total (Category) | 109 (65.3%) | 58 (34.7%) |
| Total (Overall) | 917 (51.5%) | 862 (48.4%) |
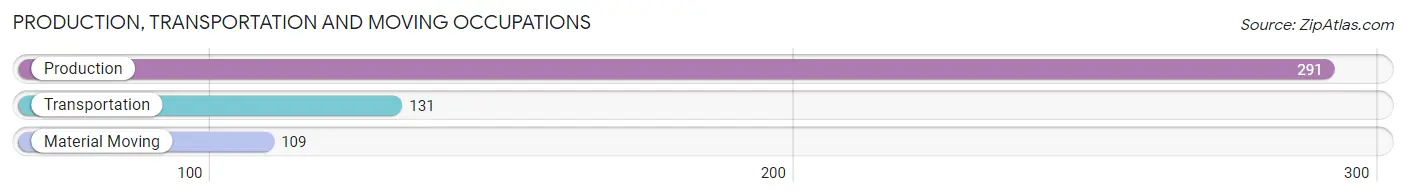
Production, Transportation and Moving Occupations
The most common Production, Transportation and Moving occupations in Crittenden are Production (291 | 16.4%), Transportation (131 | 7.4%), and Material Moving (109 | 6.1%).
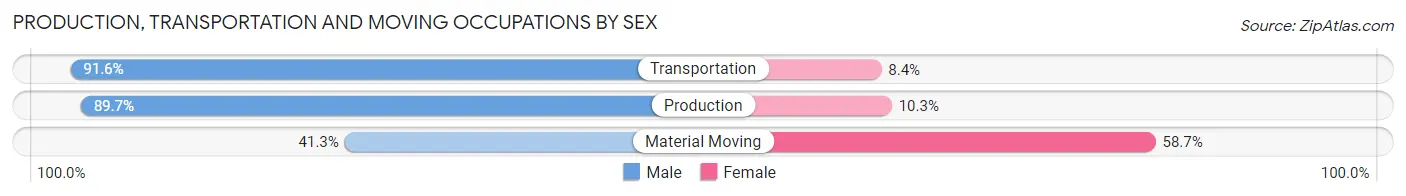
Production, Transportation and Moving Occupations by Sex
| Occupation | Male | Female |
| Production | 261 (89.7%) | 30 (10.3%) |
| Transportation | 120 (91.6%) | 11 (8.4%) |
| Material Moving | 45 (41.3%) | 64 (58.7%) |
| Total (Category) | 426 (80.2%) | 105 (19.8%) |
| Total (Overall) | 917 (51.5%) | 862 (48.4%) |
Employment Industries by Sex in Crittenden
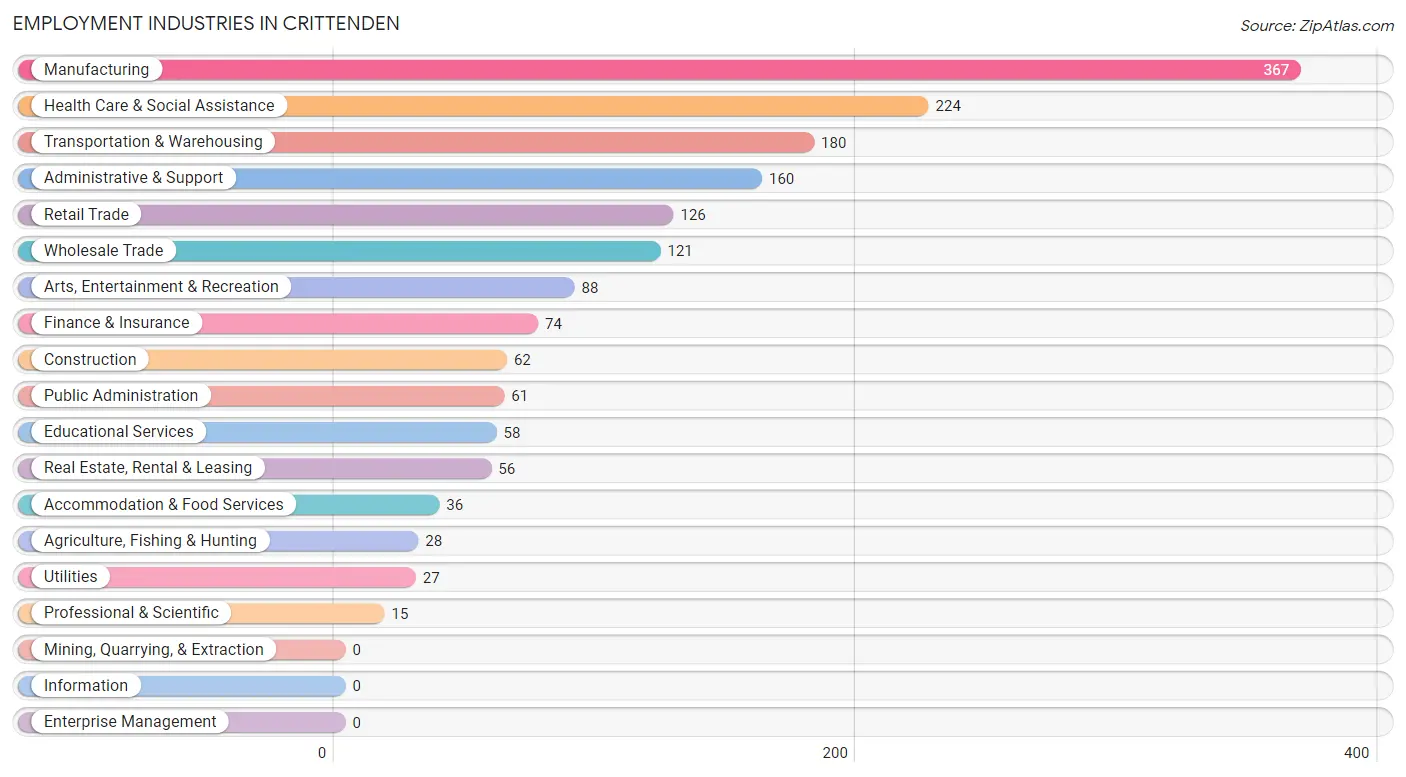
Employment Industries in Crittenden
The major employment industries in Crittenden include Manufacturing (367 | 20.6%), Health Care & Social Assistance (224 | 12.6%), Transportation & Warehousing (180 | 10.1%), Administrative & Support (160 | 9.0%), and Retail Trade (126 | 7.1%).
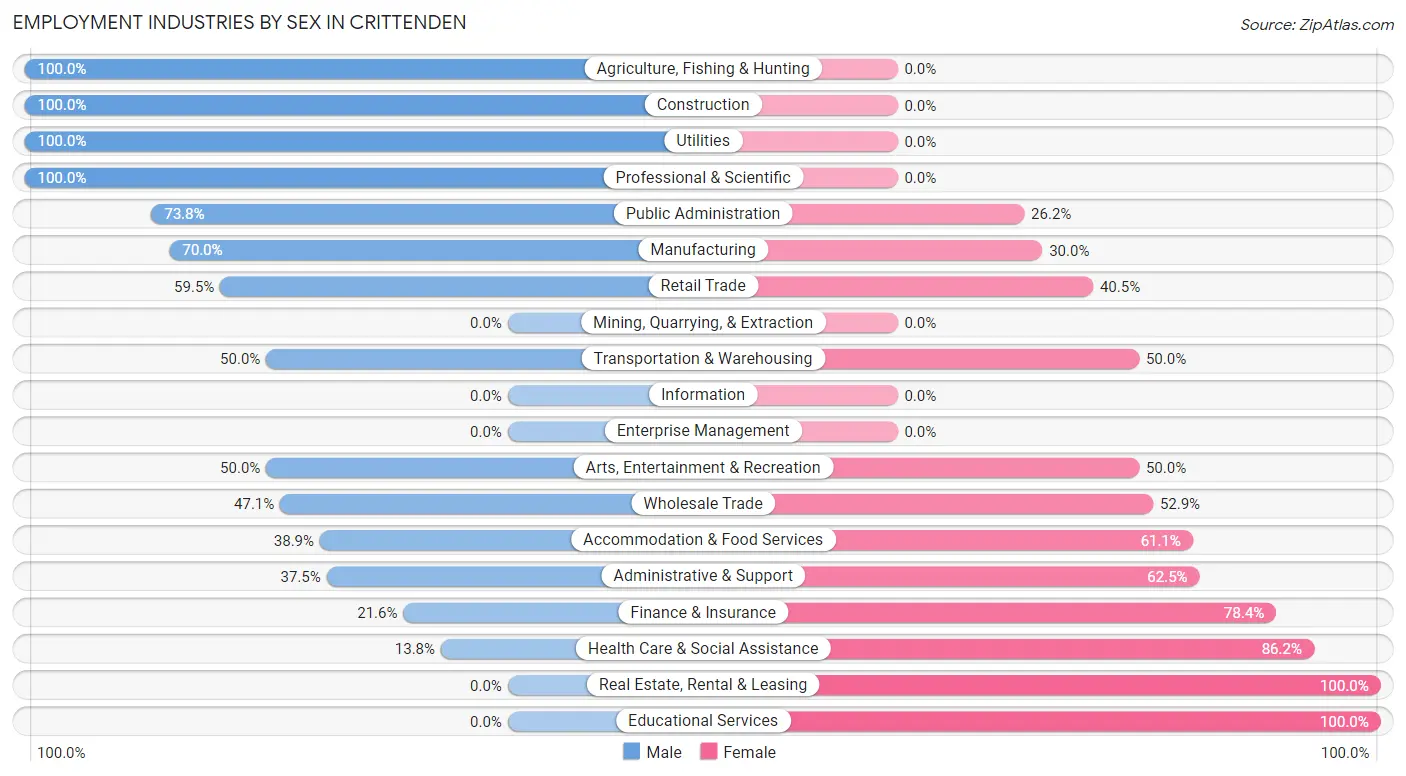
Employment Industries by Sex in Crittenden
The Crittenden industries that see more men than women are Agriculture, Fishing & Hunting (100.0%), Construction (100.0%), and Utilities (100.0%), whereas the industries that tend to have a higher number of women are Real Estate, Rental & Leasing (100.0%), Educational Services (100.0%), and Health Care & Social Assistance (86.2%).
| Industry | Male | Female |
| Agriculture, Fishing & Hunting | 28 (100.0%) | 0 (0.0%) |
| Mining, Quarrying, & Extraction | 0 (0.0%) | 0 (0.0%) |
| Construction | 62 (100.0%) | 0 (0.0%) |
| Manufacturing | 257 (70.0%) | 110 (30.0%) |
| Wholesale Trade | 57 (47.1%) | 64 (52.9%) |
| Retail Trade | 75 (59.5%) | 51 (40.5%) |
| Transportation & Warehousing | 90 (50.0%) | 90 (50.0%) |
| Utilities | 27 (100.0%) | 0 (0.0%) |
| Information | 0 (0.0%) | 0 (0.0%) |
| Finance & Insurance | 16 (21.6%) | 58 (78.4%) |
| Real Estate, Rental & Leasing | 0 (0.0%) | 56 (100.0%) |
| Professional & Scientific | 15 (100.0%) | 0 (0.0%) |
| Enterprise Management | 0 (0.0%) | 0 (0.0%) |
| Administrative & Support | 60 (37.5%) | 100 (62.5%) |
| Educational Services | 0 (0.0%) | 58 (100.0%) |
| Health Care & Social Assistance | 31 (13.8%) | 193 (86.2%) |
| Arts, Entertainment & Recreation | 44 (50.0%) | 44 (50.0%) |
| Accommodation & Food Services | 14 (38.9%) | 22 (61.1%) |
| Public Administration | 45 (73.8%) | 16 (26.2%) |
| Total | 917 (51.5%) | 862 (48.4%) |
Education in Crittenden
School Enrollment in Crittenden
The most common levels of schooling among the 1,229 students in Crittenden are high school (420 | 34.2%), elementary school (351 | 28.6%), and middle school (234 | 19.0%).
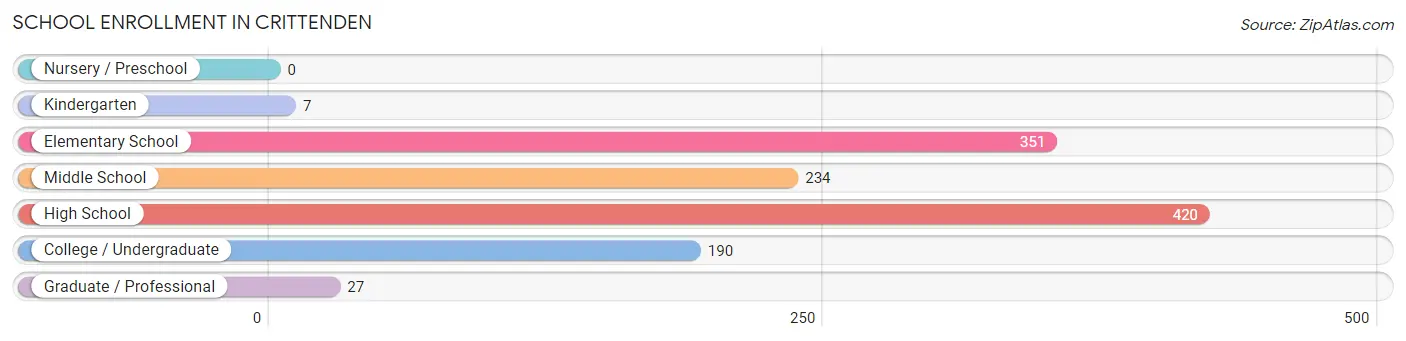
| School Level | # Students | % Students |
| Nursery / Preschool | 0 | 0.0% |
| Kindergarten | 7 | 0.6% |
| Elementary School | 351 | 28.6% |
| Middle School | 234 | 19.0% |
| High School | 420 | 34.2% |
| College / Undergraduate | 190 | 15.5% |
| Graduate / Professional | 27 | 2.2% |
| Total | 1,229 | 100.0% |
School Enrollment by Age by Funding Source in Crittenden
Out of a total of 1,229 students who are enrolled in schools in Crittenden, 111 (9.0%) attend a private institution, while the remaining 1,118 (91.0%) are enrolled in public schools. The age group of 18 to 19 year olds has the highest likelihood of being enrolled in private schools, with 44 (30.6% in the age bracket) enrolled. Conversely, the age group of 10 to 14 year olds has the lowest likelihood of being enrolled in a private school, with 472 (100.0% in the age bracket) attending a public institution.
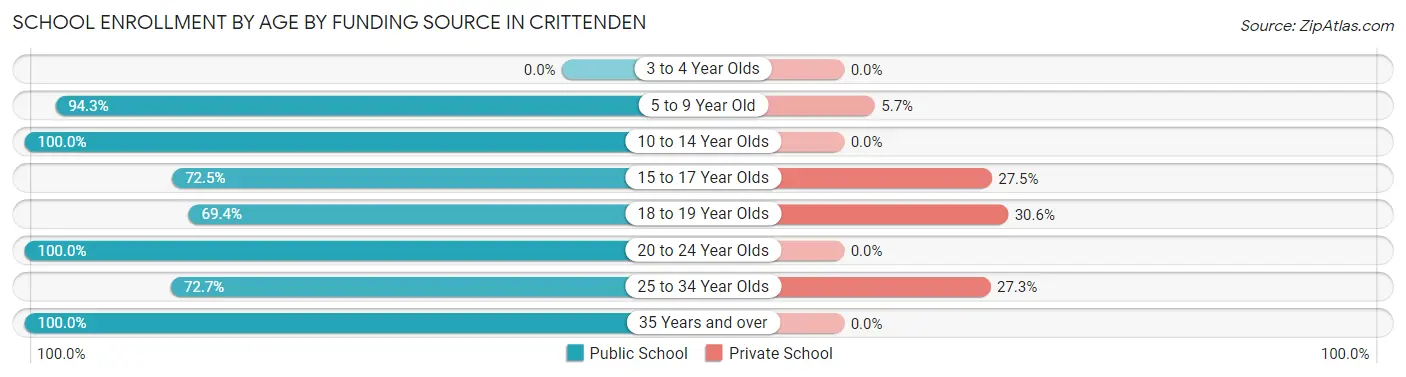
| Age Bracket | Public School | Private School |
| 3 to 4 Year Olds | 0 (0.0%) | 0 (0.0%) |
| 5 to 9 Year Old | 264 (94.3%) | 16 (5.7%) |
| 10 to 14 Year Olds | 472 (100.0%) | 0 (0.0%) |
| 15 to 17 Year Olds | 116 (72.5%) | 44 (27.5%) |
| 18 to 19 Year Olds | 100 (69.4%) | 44 (30.6%) |
| 20 to 24 Year Olds | 124 (100.0%) | 0 (0.0%) |
| 25 to 34 Year Olds | 16 (72.7%) | 6 (27.3%) |
| 35 Years and over | 27 (100.0%) | 0 (0.0%) |
| Total | 1,118 (91.0%) | 111 (9.0%) |
Educational Attainment by Field of Study in Crittenden
Literature & languages (100 | 33.7%), communications (63 | 21.2%), business (40 | 13.5%), science & technology (35 | 11.8%), and education (33 | 11.1%) are the most common fields of study among 297 individuals in Crittenden who have obtained a bachelor's degree or higher.
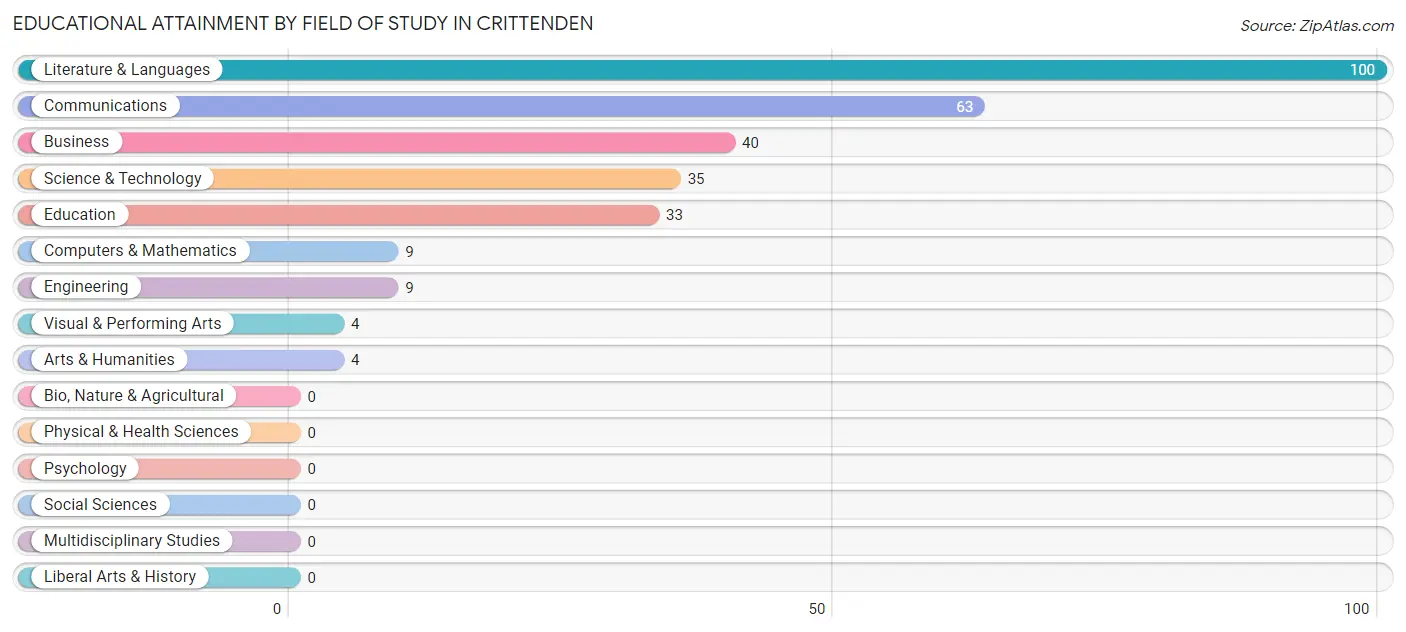
| Field of Study | # Graduates | % Graduates |
| Computers & Mathematics | 9 | 3.0% |
| Bio, Nature & Agricultural | 0 | 0.0% |
| Physical & Health Sciences | 0 | 0.0% |
| Psychology | 0 | 0.0% |
| Social Sciences | 0 | 0.0% |
| Engineering | 9 | 3.0% |
| Multidisciplinary Studies | 0 | 0.0% |
| Science & Technology | 35 | 11.8% |
| Business | 40 | 13.5% |
| Education | 33 | 11.1% |
| Literature & Languages | 100 | 33.7% |
| Liberal Arts & History | 0 | 0.0% |
| Visual & Performing Arts | 4 | 1.3% |
| Communications | 63 | 21.2% |
| Arts & Humanities | 4 | 1.3% |
| Total | 297 | 100.0% |
Transportation & Commute in Crittenden
Vehicle Availability by Sex in Crittenden
The most prevalent vehicle ownership categories in Crittenden are males with 2 vehicles (485, accounting for 52.9%) and females with 2 vehicles (456, making up 57.7%).
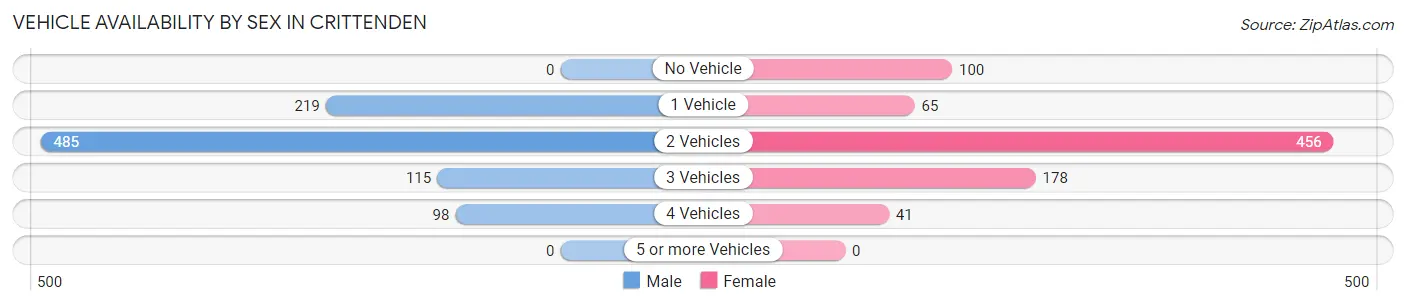
| Vehicles Available | Male | Female |
| No Vehicle | 0 (0.0%) | 100 (11.9%) |
| 1 Vehicle | 219 (23.9%) | 65 (7.7%) |
| 2 Vehicles | 485 (52.9%) | 456 (54.3%) |
| 3 Vehicles | 115 (12.5%) | 178 (21.2%) |
| 4 Vehicles | 98 (10.7%) | 41 (4.9%) |
| 5 or more Vehicles | 0 (0.0%) | 0 (0.0%) |
| Total | 917 (100.0%) | 840 (100.0%) |
Commute Time in Crittenden
The most frequently occuring commute durations in Crittenden are 20 to 24 minutes (626 commuters, 36.3%), 30 to 34 minutes (256 commuters, 14.8%), and 15 to 19 minutes (185 commuters, 10.7%).
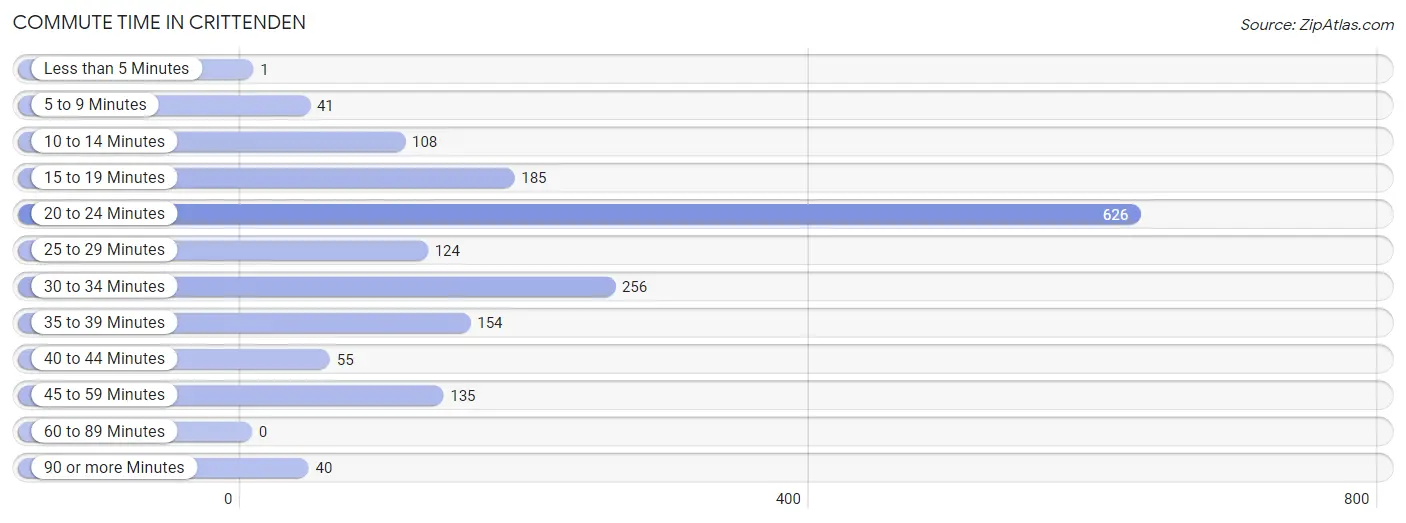
| Commute Time | # Commuters | % Commuters |
| Less than 5 Minutes | 1 | 0.1% |
| 5 to 9 Minutes | 41 | 2.4% |
| 10 to 14 Minutes | 108 | 6.3% |
| 15 to 19 Minutes | 185 | 10.7% |
| 20 to 24 Minutes | 626 | 36.3% |
| 25 to 29 Minutes | 124 | 7.2% |
| 30 to 34 Minutes | 256 | 14.8% |
| 35 to 39 Minutes | 154 | 8.9% |
| 40 to 44 Minutes | 55 | 3.2% |
| 45 to 59 Minutes | 135 | 7.8% |
| 60 to 89 Minutes | 0 | 0.0% |
| 90 or more Minutes | 40 | 2.3% |
Commute Time by Sex in Crittenden
The most common commute times in Crittenden are 20 to 24 minutes (265 commuters, 29.9%) for males and 20 to 24 minutes (361 commuters, 43.0%) for females.
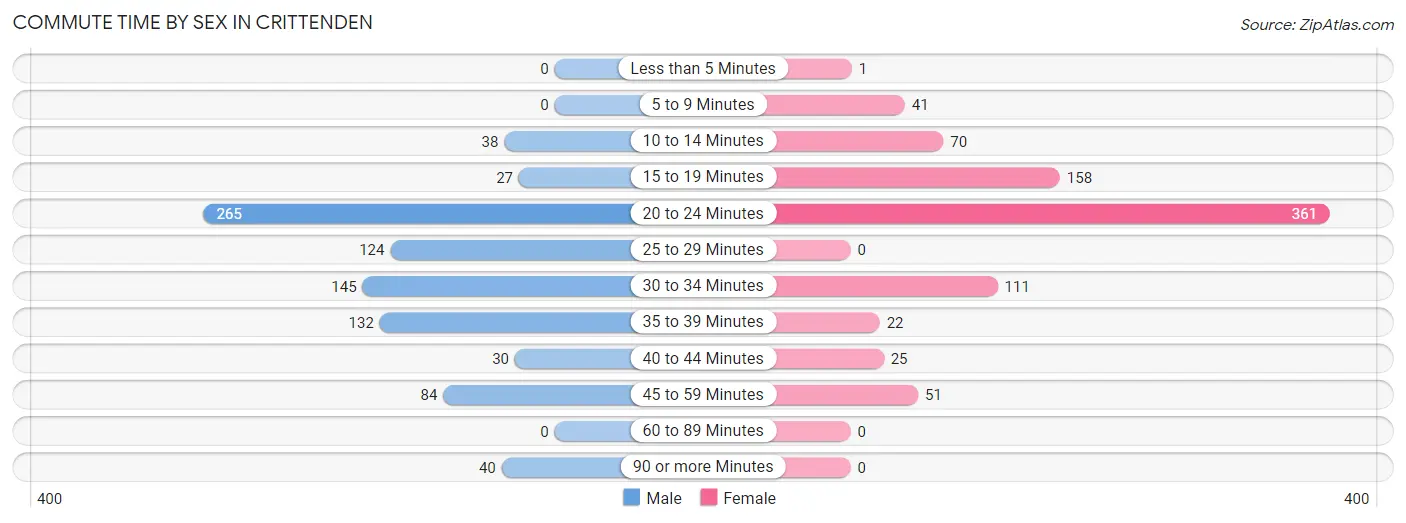
| Commute Time | Male | Female |
| Less than 5 Minutes | 0 (0.0%) | 1 (0.1%) |
| 5 to 9 Minutes | 0 (0.0%) | 41 (4.9%) |
| 10 to 14 Minutes | 38 (4.3%) | 70 (8.3%) |
| 15 to 19 Minutes | 27 (3.0%) | 158 (18.8%) |
| 20 to 24 Minutes | 265 (29.9%) | 361 (43.0%) |
| 25 to 29 Minutes | 124 (14.0%) | 0 (0.0%) |
| 30 to 34 Minutes | 145 (16.4%) | 111 (13.2%) |
| 35 to 39 Minutes | 132 (14.9%) | 22 (2.6%) |
| 40 to 44 Minutes | 30 (3.4%) | 25 (3.0%) |
| 45 to 59 Minutes | 84 (9.5%) | 51 (6.1%) |
| 60 to 89 Minutes | 0 (0.0%) | 0 (0.0%) |
| 90 or more Minutes | 40 (4.5%) | 0 (0.0%) |
Time of Departure to Work by Sex in Crittenden
The most frequent times of departure to work in Crittenden are 6:00 AM to 6:29 AM (166, 18.8%) for males and 4:00 PM to 11:59 PM (196, 23.3%) for females.
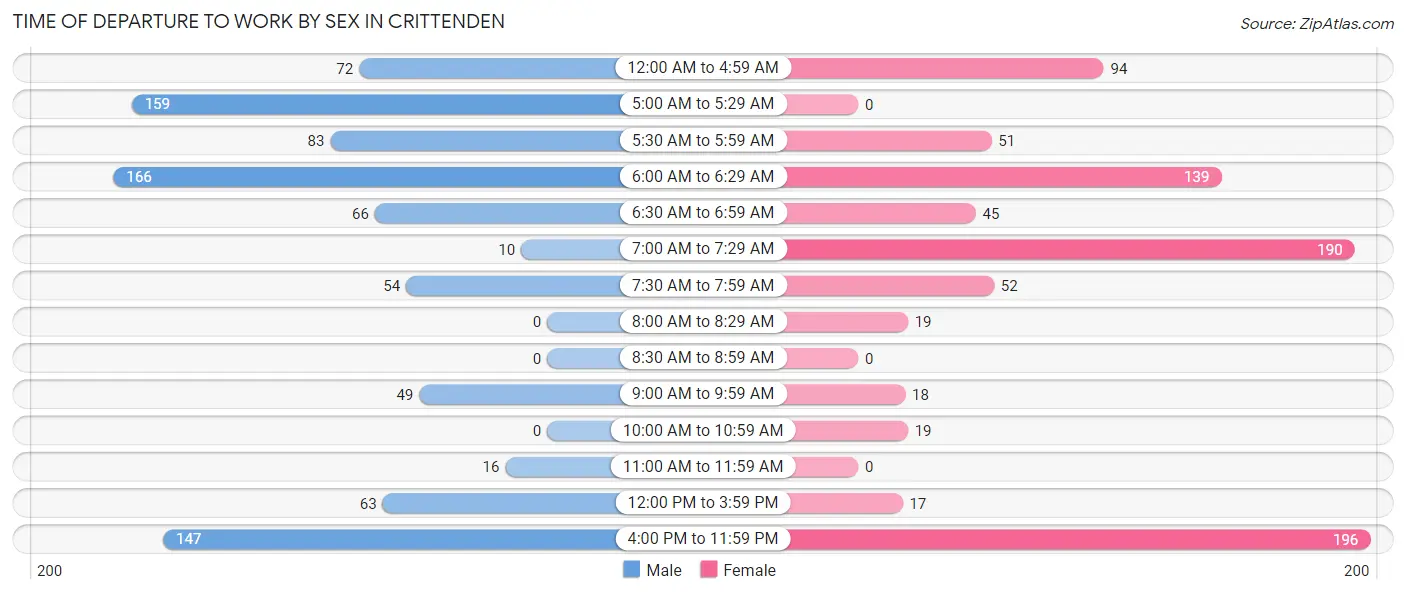
| Time of Departure | Male | Female |
| 12:00 AM to 4:59 AM | 72 (8.1%) | 94 (11.2%) |
| 5:00 AM to 5:29 AM | 159 (18.0%) | 0 (0.0%) |
| 5:30 AM to 5:59 AM | 83 (9.4%) | 51 (6.1%) |
| 6:00 AM to 6:29 AM | 166 (18.8%) | 139 (16.6%) |
| 6:30 AM to 6:59 AM | 66 (7.5%) | 45 (5.4%) |
| 7:00 AM to 7:29 AM | 10 (1.1%) | 190 (22.6%) |
| 7:30 AM to 7:59 AM | 54 (6.1%) | 52 (6.2%) |
| 8:00 AM to 8:29 AM | 0 (0.0%) | 19 (2.3%) |
| 8:30 AM to 8:59 AM | 0 (0.0%) | 0 (0.0%) |
| 9:00 AM to 9:59 AM | 49 (5.5%) | 18 (2.1%) |
| 10:00 AM to 10:59 AM | 0 (0.0%) | 19 (2.3%) |
| 11:00 AM to 11:59 AM | 16 (1.8%) | 0 (0.0%) |
| 12:00 PM to 3:59 PM | 63 (7.1%) | 17 (2.0%) |
| 4:00 PM to 11:59 PM | 147 (16.6%) | 196 (23.3%) |
| Total | 885 (100.0%) | 840 (100.0%) |
Housing Occupancy in Crittenden
Occupancy by Ownership in Crittenden
Of the total 1,237 dwellings in Crittenden, owner-occupied units account for 725 (58.6%), while renter-occupied units make up 512 (41.4%).
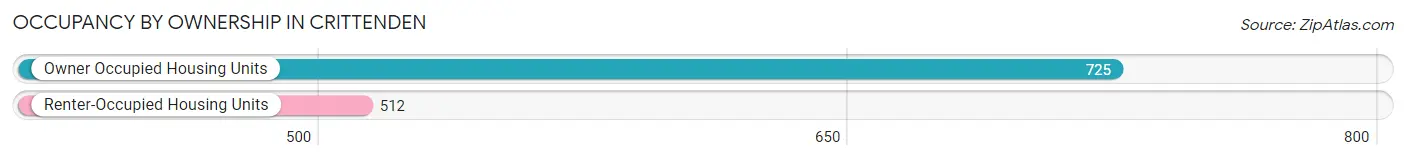
| Occupancy | # Housing Units | % Housing Units |
| Owner Occupied Housing Units | 725 | 58.6% |
| Renter-Occupied Housing Units | 512 | 41.4% |
| Total Occupied Housing Units | 1,237 | 100.0% |
Occupancy by Household Size in Crittenden
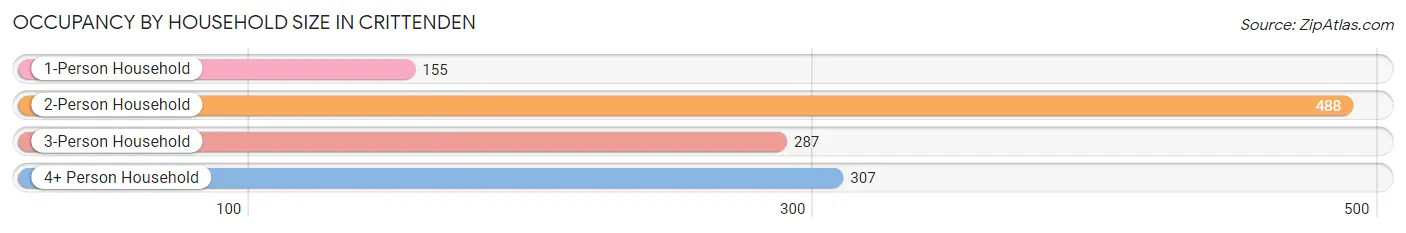
| Household Size | # Housing Units | % Housing Units |
| 1-Person Household | 155 | 12.5% |
| 2-Person Household | 488 | 39.5% |
| 3-Person Household | 287 | 23.2% |
| 4+ Person Household | 307 | 24.8% |
| Total Housing Units | 1,237 | 100.0% |
Occupancy by Ownership by Household Size in Crittenden
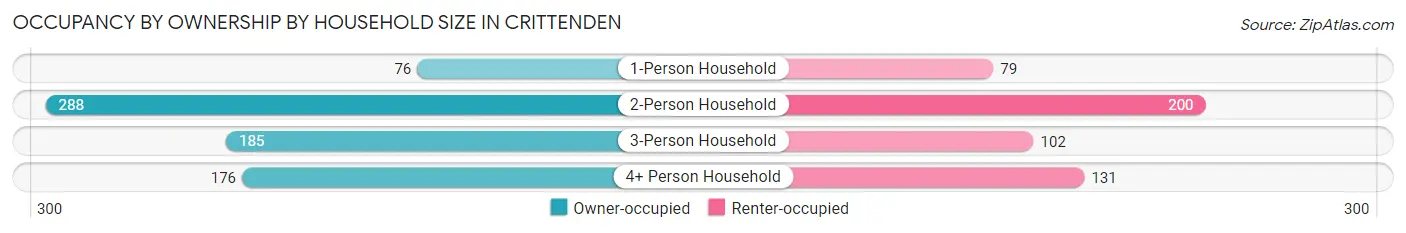
| Household Size | Owner-occupied | Renter-occupied |
| 1-Person Household | 76 (49.0%) | 79 (51.0%) |
| 2-Person Household | 288 (59.0%) | 200 (41.0%) |
| 3-Person Household | 185 (64.5%) | 102 (35.5%) |
| 4+ Person Household | 176 (57.3%) | 131 (42.7%) |
| Total Housing Units | 725 (58.6%) | 512 (41.4%) |
Occupancy by Educational Attainment in Crittenden
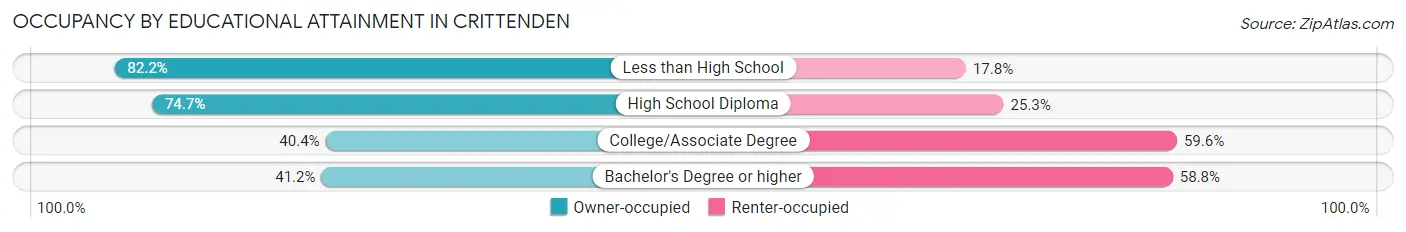
| Household Size | Owner-occupied | Renter-occupied |
| Less than High School | 120 (82.2%) | 26 (17.8%) |
| High School Diploma | 355 (74.7%) | 120 (25.3%) |
| College/Associate Degree | 180 (40.4%) | 266 (59.6%) |
| Bachelor's Degree or higher | 70 (41.2%) | 100 (58.8%) |
Occupancy by Age of Householder in Crittenden
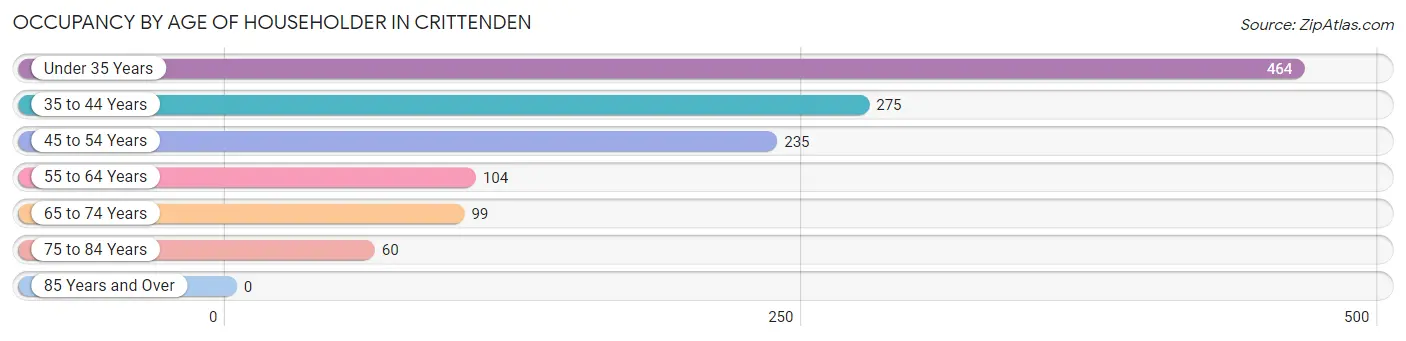
| Age Bracket | # Households | % Households |
| Under 35 Years | 464 | 37.5% |
| 35 to 44 Years | 275 | 22.2% |
| 45 to 54 Years | 235 | 19.0% |
| 55 to 64 Years | 104 | 8.4% |
| 65 to 74 Years | 99 | 8.0% |
| 75 to 84 Years | 60 | 4.9% |
| 85 Years and Over | 0 | 0.0% |
| Total | 1,237 | 100.0% |
Housing Finances in Crittenden
Median Income by Occupancy in Crittenden
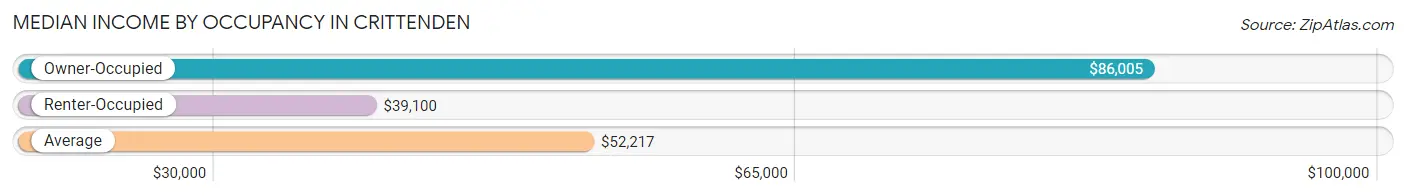
| Occupancy Type | # Households | Median Income |
| Owner-Occupied | 725 (58.6%) | $86,005 |
| Renter-Occupied | 512 (41.4%) | $39,100 |
| Average | 1,237 (100.0%) | $52,217 |
Occupancy by Householder Income Bracket in Crittenden
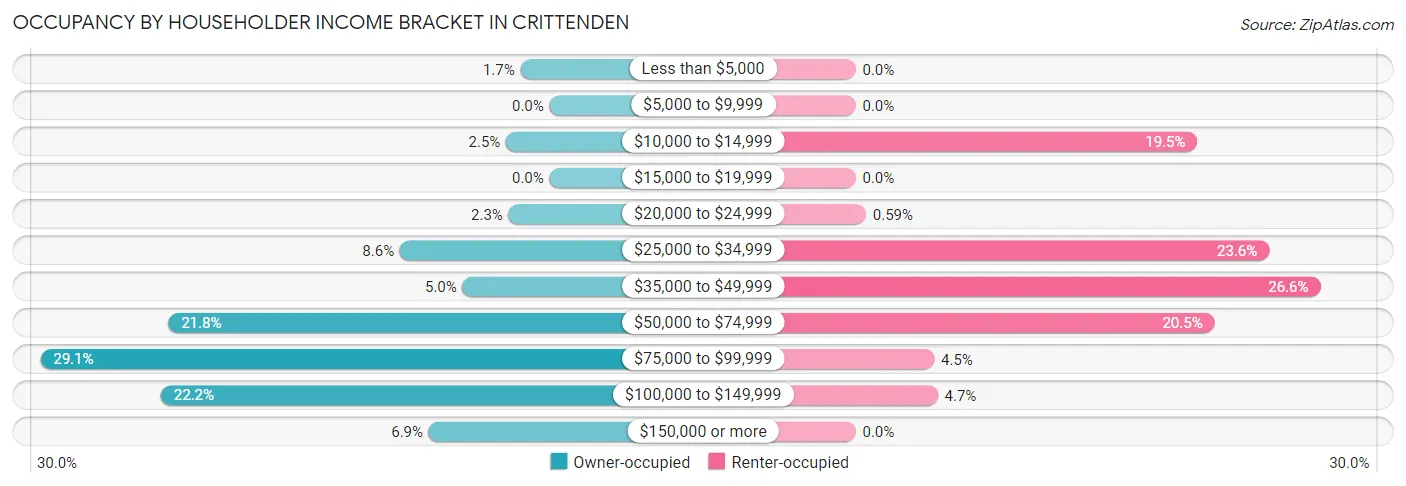
| Income Bracket | Owner-occupied | Renter-occupied |
| Less than $5,000 | 12 (1.7%) | 0 (0.0%) |
| $5,000 to $9,999 | 0 (0.0%) | 0 (0.0%) |
| $10,000 to $14,999 | 18 (2.5%) | 100 (19.5%) |
| $15,000 to $19,999 | 0 (0.0%) | 0 (0.0%) |
| $20,000 to $24,999 | 17 (2.3%) | 3 (0.6%) |
| $25,000 to $34,999 | 62 (8.6%) | 121 (23.6%) |
| $35,000 to $49,999 | 36 (5.0%) | 136 (26.6%) |
| $50,000 to $74,999 | 158 (21.8%) | 105 (20.5%) |
| $75,000 to $99,999 | 211 (29.1%) | 23 (4.5%) |
| $100,000 to $149,999 | 161 (22.2%) | 24 (4.7%) |
| $150,000 or more | 50 (6.9%) | 0 (0.0%) |
| Total | 725 (100.0%) | 512 (100.0%) |
Monthly Housing Cost Tiers in Crittenden
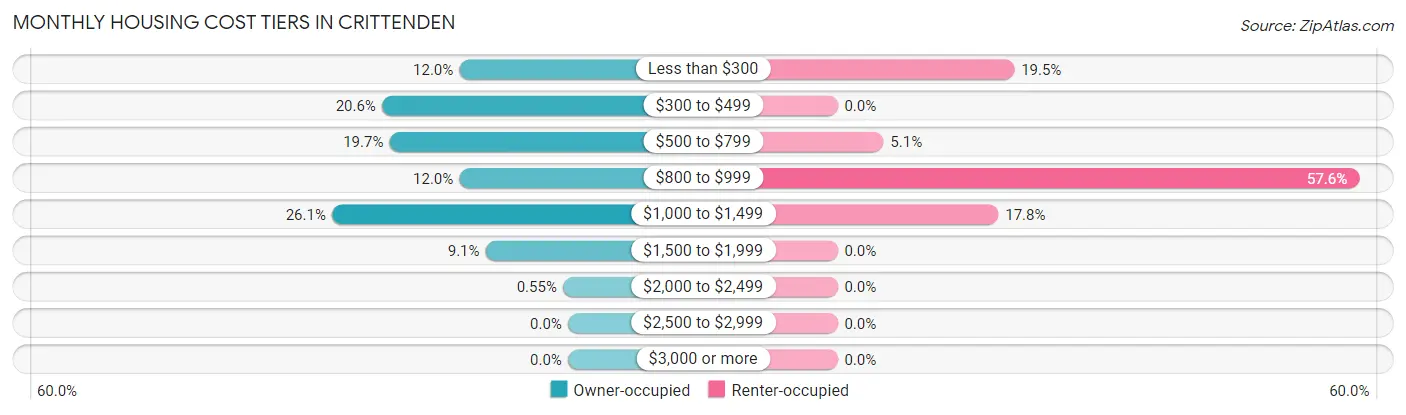
| Monthly Cost | Owner-occupied | Renter-occupied |
| Less than $300 | 87 (12.0%) | 100 (19.5%) |
| $300 to $499 | 149 (20.5%) | 0 (0.0%) |
| $500 to $799 | 143 (19.7%) | 26 (5.1%) |
| $800 to $999 | 87 (12.0%) | 295 (57.6%) |
| $1,000 to $1,499 | 189 (26.1%) | 91 (17.8%) |
| $1,500 to $1,999 | 66 (9.1%) | 0 (0.0%) |
| $2,000 to $2,499 | 4 (0.5%) | 0 (0.0%) |
| $2,500 to $2,999 | 0 (0.0%) | 0 (0.0%) |
| $3,000 or more | 0 (0.0%) | 0 (0.0%) |
| Total | 725 (100.0%) | 512 (100.0%) |
Physical Housing Characteristics in Crittenden
Housing Structures in Crittenden
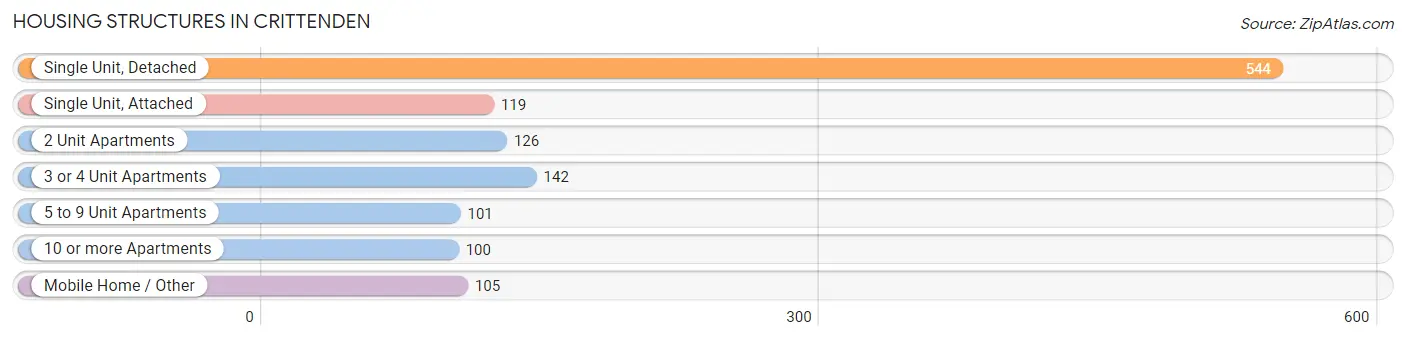
| Structure Type | # Housing Units | % Housing Units |
| Single Unit, Detached | 544 | 44.0% |
| Single Unit, Attached | 119 | 9.6% |
| 2 Unit Apartments | 126 | 10.2% |
| 3 or 4 Unit Apartments | 142 | 11.5% |
| 5 to 9 Unit Apartments | 101 | 8.2% |
| 10 or more Apartments | 100 | 8.1% |
| Mobile Home / Other | 105 | 8.5% |
| Total | 1,237 | 100.0% |
Housing Structures by Occupancy in Crittenden
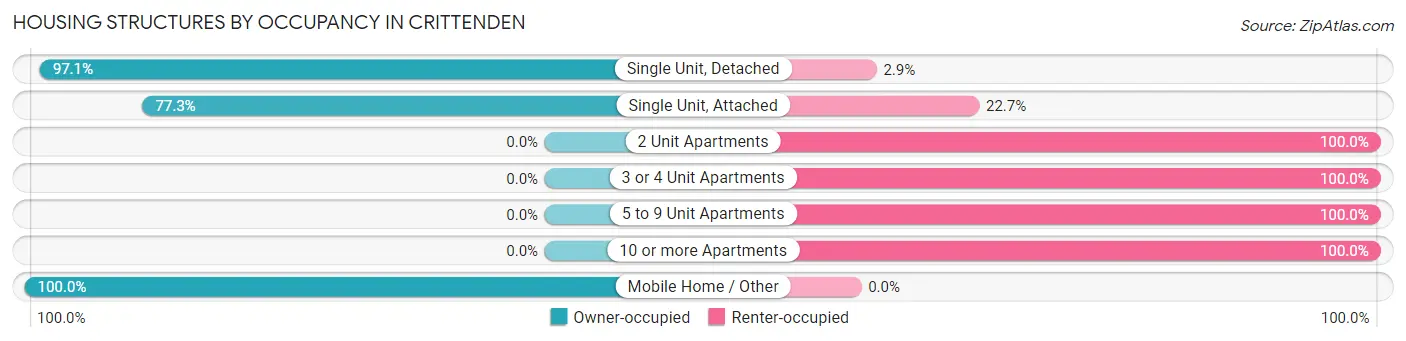
| Structure Type | Owner-occupied | Renter-occupied |
| Single Unit, Detached | 528 (97.1%) | 16 (2.9%) |
| Single Unit, Attached | 92 (77.3%) | 27 (22.7%) |
| 2 Unit Apartments | 0 (0.0%) | 126 (100.0%) |
| 3 or 4 Unit Apartments | 0 (0.0%) | 142 (100.0%) |
| 5 to 9 Unit Apartments | 0 (0.0%) | 101 (100.0%) |
| 10 or more Apartments | 0 (0.0%) | 100 (100.0%) |
| Mobile Home / Other | 105 (100.0%) | 0 (0.0%) |
| Total | 725 (58.6%) | 512 (41.4%) |
Housing Structures by Number of Rooms in Crittenden
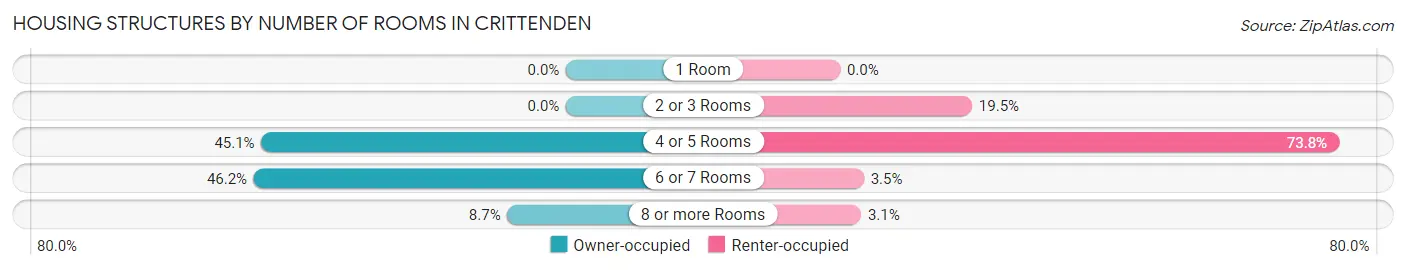
| Number of Rooms | Owner-occupied | Renter-occupied |
| 1 Room | 0 (0.0%) | 0 (0.0%) |
| 2 or 3 Rooms | 0 (0.0%) | 100 (19.5%) |
| 4 or 5 Rooms | 327 (45.1%) | 378 (73.8%) |
| 6 or 7 Rooms | 335 (46.2%) | 18 (3.5%) |
| 8 or more Rooms | 63 (8.7%) | 16 (3.1%) |
| Total | 725 (100.0%) | 512 (100.0%) |
Housing Structure by Heating Type in Crittenden
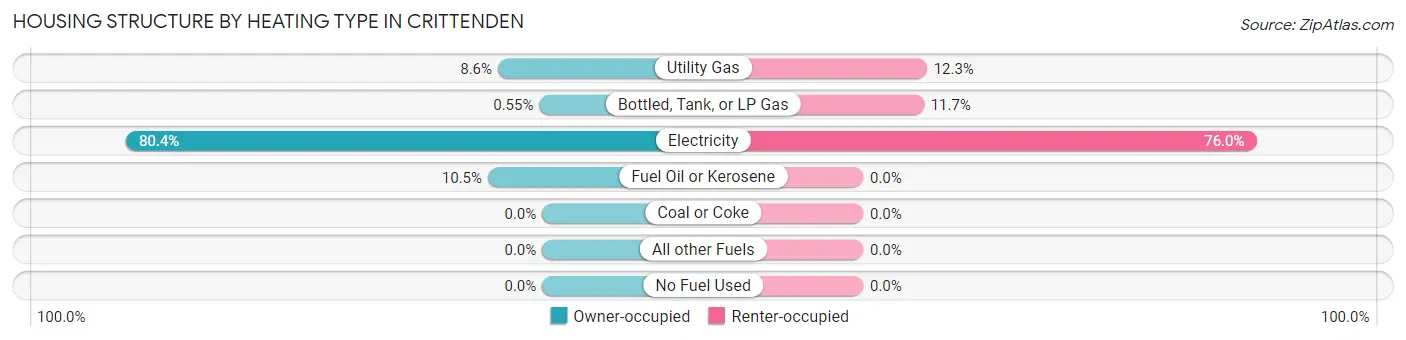
| Heating Type | Owner-occupied | Renter-occupied |
| Utility Gas | 62 (8.6%) | 63 (12.3%) |
| Bottled, Tank, or LP Gas | 4 (0.5%) | 60 (11.7%) |
| Electricity | 583 (80.4%) | 389 (76.0%) |
| Fuel Oil or Kerosene | 76 (10.5%) | 0 (0.0%) |
| Coal or Coke | 0 (0.0%) | 0 (0.0%) |
| All other Fuels | 0 (0.0%) | 0 (0.0%) |
| No Fuel Used | 0 (0.0%) | 0 (0.0%) |
| Total | 725 (100.0%) | 512 (100.0%) |
Household Vehicle Usage in Crittenden
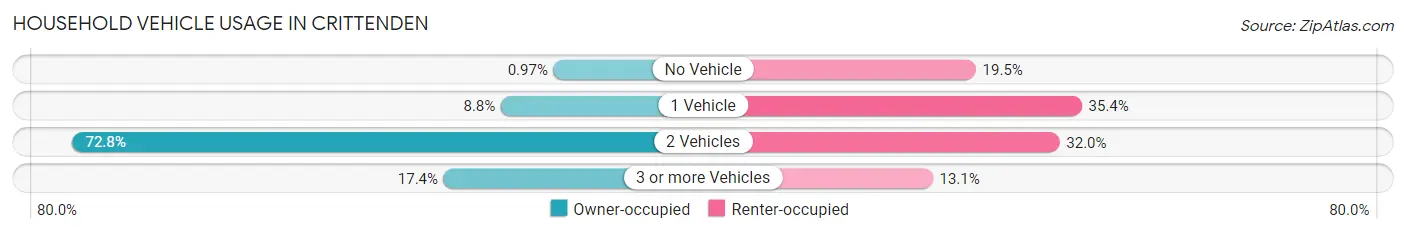
| Vehicles per Household | Owner-occupied | Renter-occupied |
| No Vehicle | 7 (1.0%) | 100 (19.5%) |
| 1 Vehicle | 64 (8.8%) | 181 (35.3%) |
| 2 Vehicles | 528 (72.8%) | 164 (32.0%) |
| 3 or more Vehicles | 126 (17.4%) | 67 (13.1%) |
| Total | 725 (100.0%) | 512 (100.0%) |
Real Estate & Mortgages in Crittenden
Real Estate and Mortgage Overview in Crittenden
| Characteristic | Without Mortgage | With Mortgage |
| Housing Units | 368 | 357 |
| Median Property Value | - | - |
| Median Household Income | $66,667 | $16 |
| Monthly Housing Costs | $387 | $0 |
| Real Estate Taxes | $642 | $0 |
Property Value by Mortgage Status in Crittenden
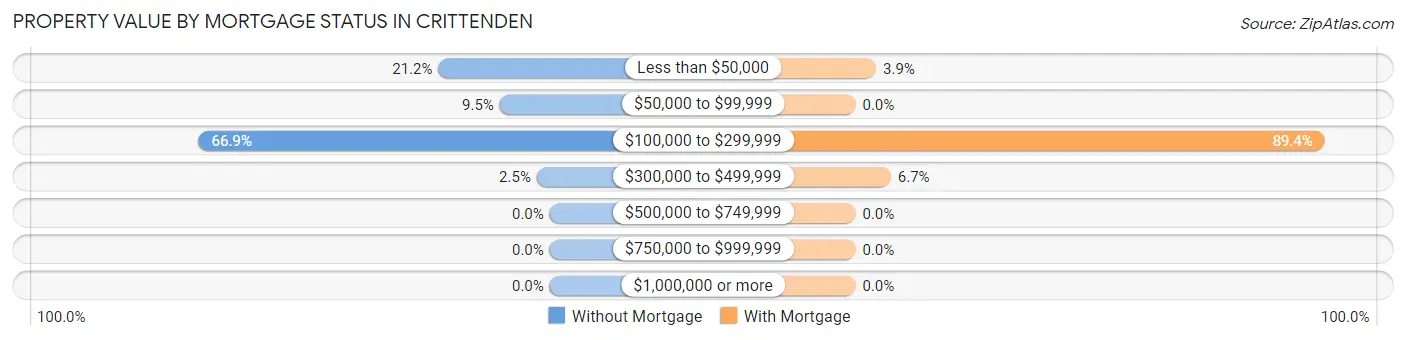
| Property Value | Without Mortgage | With Mortgage |
| Less than $50,000 | 78 (21.2%) | 14 (3.9%) |
| $50,000 to $99,999 | 35 (9.5%) | 0 (0.0%) |
| $100,000 to $299,999 | 246 (66.8%) | 319 (89.4%) |
| $300,000 to $499,999 | 9 (2.5%) | 24 (6.7%) |
| $500,000 to $749,999 | 0 (0.0%) | 0 (0.0%) |
| $750,000 to $999,999 | 0 (0.0%) | 0 (0.0%) |
| $1,000,000 or more | 0 (0.0%) | 0 (0.0%) |
| Total | 368 (100.0%) | 357 (100.0%) |
Household Income by Mortgage Status in Crittenden
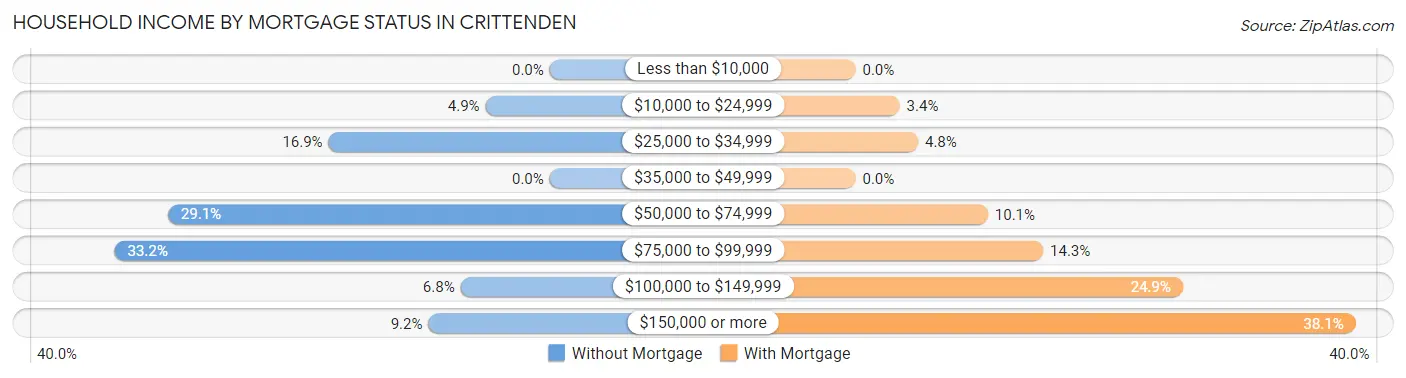
| Household Income | Without Mortgage | With Mortgage |
| Less than $10,000 | 0 (0.0%) | 0 (0.0%) |
| $10,000 to $24,999 | 18 (4.9%) | 12 (3.4%) |
| $25,000 to $34,999 | 62 (16.9%) | 17 (4.8%) |
| $35,000 to $49,999 | 0 (0.0%) | 0 (0.0%) |
| $50,000 to $74,999 | 107 (29.1%) | 36 (10.1%) |
| $75,000 to $99,999 | 122 (33.2%) | 51 (14.3%) |
| $100,000 to $149,999 | 25 (6.8%) | 89 (24.9%) |
| $150,000 or more | 34 (9.2%) | 136 (38.1%) |
| Total | 368 (100.0%) | 357 (100.0%) |
Property Value to Household Income Ratio in Crittenden
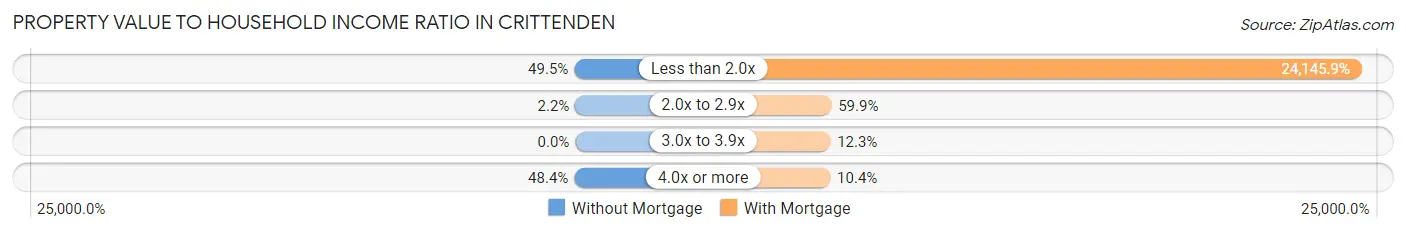
| Value-to-Income Ratio | Without Mortgage | With Mortgage |
| Less than 2.0x | 182 (49.5%) | 86,201 (24,145.9%) |
| 2.0x to 2.9x | 8 (2.2%) | 214 (59.9%) |
| 3.0x to 3.9x | 0 (0.0%) | 44 (12.3%) |
| 4.0x or more | 178 (48.4%) | 37 (10.4%) |
| Total | 368 (100.0%) | 357 (100.0%) |
Real Estate Taxes by Mortgage Status in Crittenden
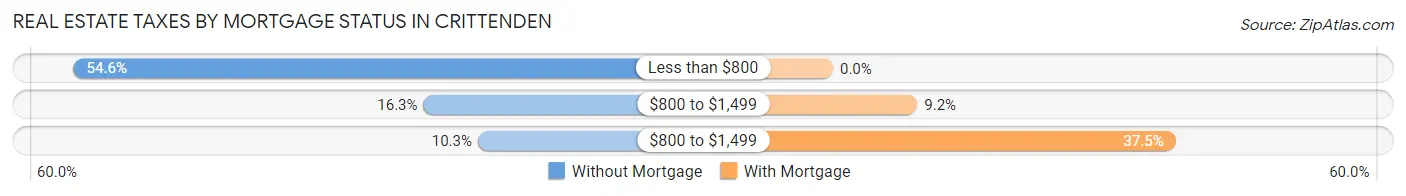
| Property Taxes | Without Mortgage | With Mortgage |
| Less than $800 | 201 (54.6%) | 0 (0.0%) |
| $800 to $1,499 | 60 (16.3%) | 33 (9.2%) |
| $800 to $1,499 | 38 (10.3%) | 134 (37.5%) |
| Total | 368 (100.0%) | 357 (100.0%) |
Health & Disability in Crittenden
Health Insurance Coverage by Age in Crittenden
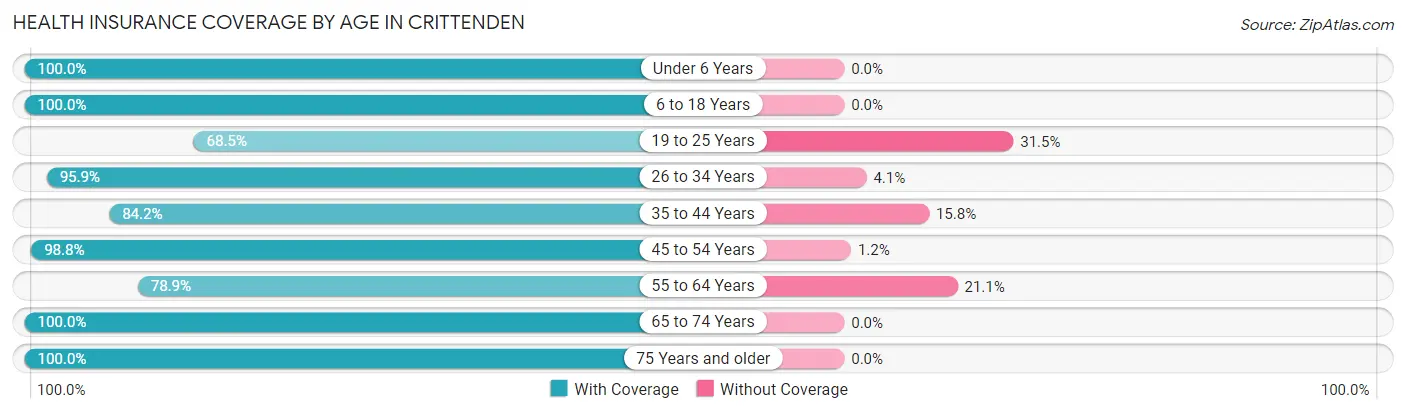
| Age Bracket | With Coverage | Without Coverage |
| Under 6 Years | 401 (100.0%) | 0 (0.0%) |
| 6 to 18 Years | 1,038 (100.0%) | 0 (0.0%) |
| 19 to 25 Years | 465 (68.5%) | 214 (31.5%) |
| 26 to 34 Years | 534 (95.9%) | 23 (4.1%) |
| 35 to 44 Years | 416 (84.2%) | 78 (15.8%) |
| 45 to 54 Years | 397 (98.8%) | 5 (1.2%) |
| 55 to 64 Years | 127 (78.9%) | 34 (21.1%) |
| 65 to 74 Years | 201 (100.0%) | 0 (0.0%) |
| 75 Years and older | 100 (100.0%) | 0 (0.0%) |
| Total | 3,679 (91.2%) | 354 (8.8%) |
Health Insurance Coverage by Citizenship Status in Crittenden
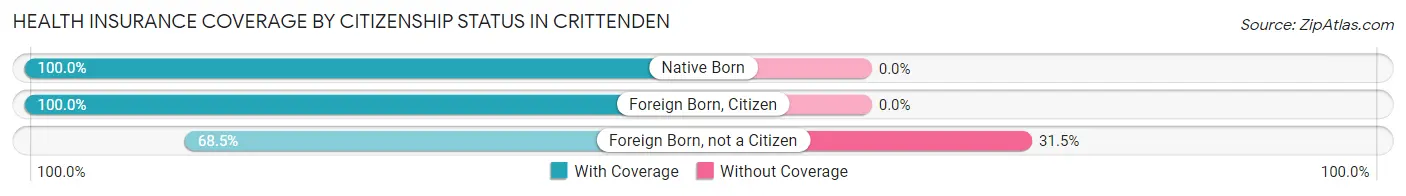
| Citizenship Status | With Coverage | Without Coverage |
| Native Born | 401 (100.0%) | 0 (0.0%) |
| Foreign Born, Citizen | 1,038 (100.0%) | 0 (0.0%) |
| Foreign Born, not a Citizen | 465 (68.5%) | 214 (31.5%) |
Health Insurance Coverage by Household Income in Crittenden
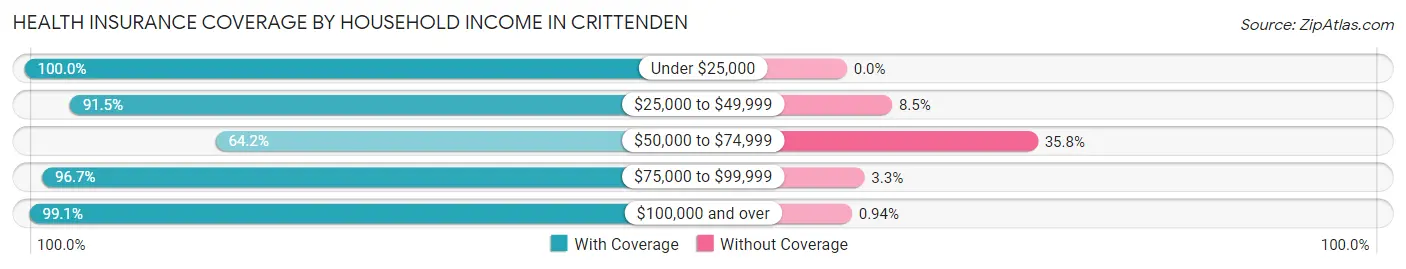
| Household Income | With Coverage | Without Coverage |
| Under $25,000 | 292 (100.0%) | 0 (0.0%) |
| $25,000 to $49,999 | 843 (91.5%) | 78 (8.5%) |
| $50,000 to $74,999 | 422 (64.2%) | 235 (35.8%) |
| $75,000 to $99,999 | 851 (96.7%) | 29 (3.3%) |
| $100,000 and over | 1,271 (99.1%) | 12 (0.9%) |
Public vs Private Health Insurance Coverage by Age in Crittenden
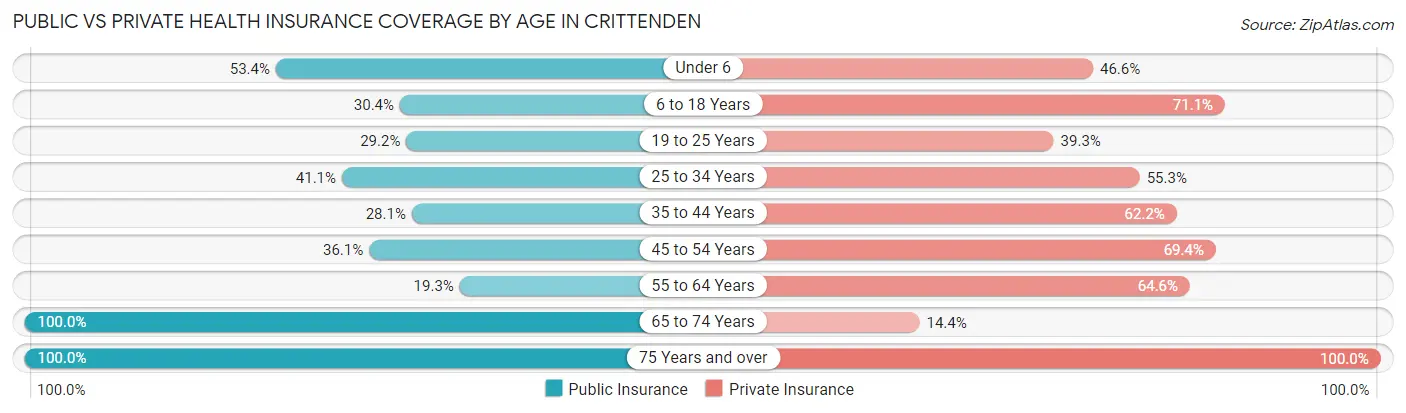
| Age Bracket | Public Insurance | Private Insurance |
| Under 6 | 214 (53.4%) | 187 (46.6%) |
| 6 to 18 Years | 315 (30.3%) | 738 (71.1%) |
| 19 to 25 Years | 198 (29.2%) | 267 (39.3%) |
| 25 to 34 Years | 229 (41.1%) | 308 (55.3%) |
| 35 to 44 Years | 139 (28.1%) | 307 (62.2%) |
| 45 to 54 Years | 145 (36.1%) | 279 (69.4%) |
| 55 to 64 Years | 31 (19.3%) | 104 (64.6%) |
| 65 to 74 Years | 201 (100.0%) | 29 (14.4%) |
| 75 Years and over | 100 (100.0%) | 100 (100.0%) |
| Total | 1,572 (39.0%) | 2,319 (57.5%) |
Disability Status by Sex by Age in Crittenden
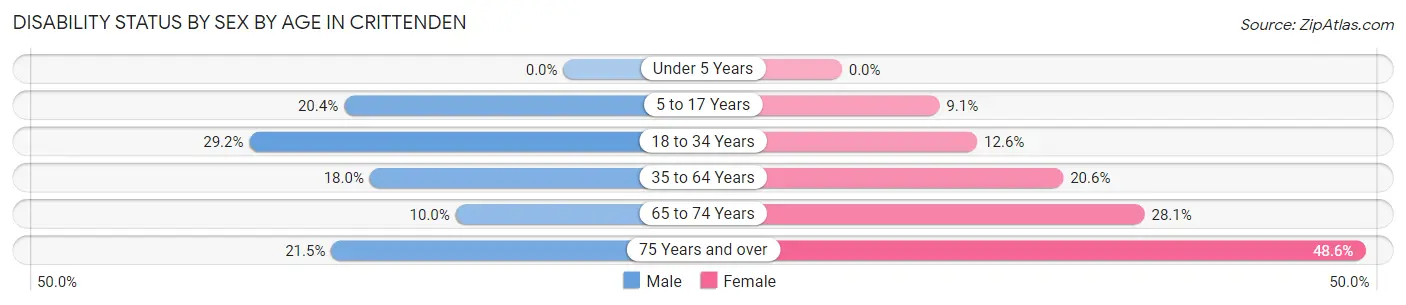
| Age Bracket | Male | Female |
| Under 5 Years | 0 (0.0%) | 0 (0.0%) |
| 5 to 17 Years | 125 (20.4%) | 27 (9.1%) |
| 18 to 34 Years | 281 (29.1%) | 50 (12.6%) |
| 35 to 64 Years | 78 (18.0%) | 128 (20.5%) |
| 65 to 74 Years | 8 (10.0%) | 34 (28.1%) |
| 75 Years and over | 14 (21.5%) | 17 (48.6%) |
Disability Class by Sex by Age in Crittenden
Disability Class: Hearing Difficulty
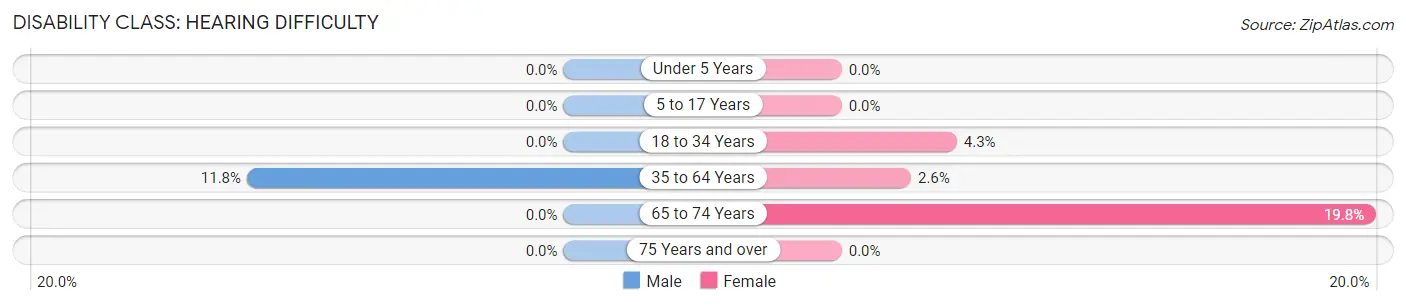
| Age Bracket | Male | Female |
| Under 5 Years | 0 (0.0%) | 0 (0.0%) |
| 5 to 17 Years | 0 (0.0%) | 0 (0.0%) |
| 18 to 34 Years | 0 (0.0%) | 17 (4.3%) |
| 35 to 64 Years | 51 (11.7%) | 16 (2.6%) |
| 65 to 74 Years | 0 (0.0%) | 24 (19.8%) |
| 75 Years and over | 0 (0.0%) | 0 (0.0%) |
Disability Class: Vision Difficulty
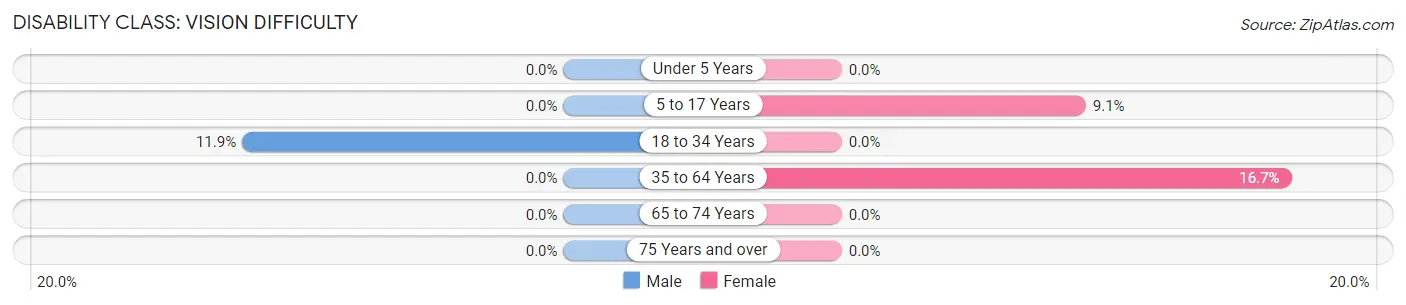
| Age Bracket | Male | Female |
| Under 5 Years | 0 (0.0%) | 0 (0.0%) |
| 5 to 17 Years | 0 (0.0%) | 27 (9.1%) |
| 18 to 34 Years | 115 (11.9%) | 0 (0.0%) |
| 35 to 64 Years | 0 (0.0%) | 104 (16.7%) |
| 65 to 74 Years | 0 (0.0%) | 0 (0.0%) |
| 75 Years and over | 0 (0.0%) | 0 (0.0%) |
Disability Class: Cognitive Difficulty
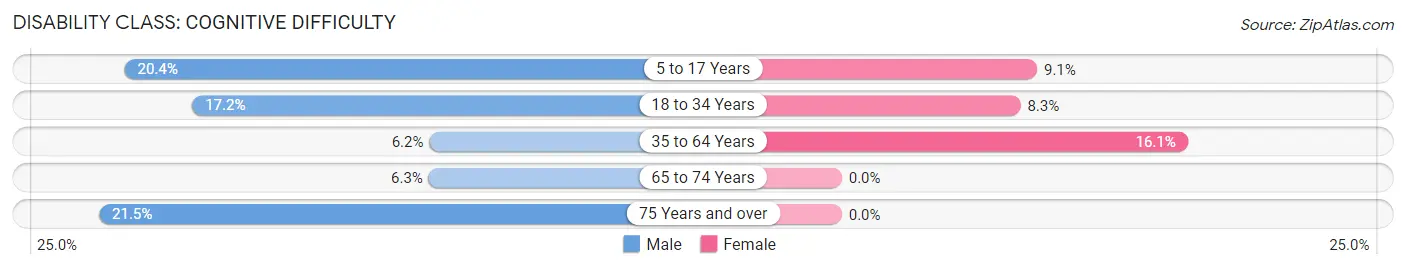
| Age Bracket | Male | Female |
| 5 to 17 Years | 125 (20.4%) | 27 (9.1%) |
| 18 to 34 Years | 166 (17.2%) | 33 (8.3%) |
| 35 to 64 Years | 27 (6.2%) | 100 (16.1%) |
| 65 to 74 Years | 5 (6.2%) | 0 (0.0%) |
| 75 Years and over | 14 (21.5%) | 0 (0.0%) |
Disability Class: Ambulatory Difficulty
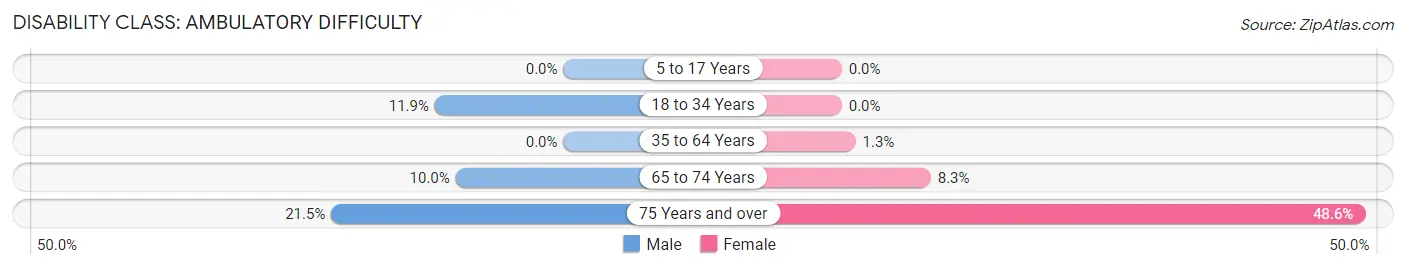
| Age Bracket | Male | Female |
| 5 to 17 Years | 0 (0.0%) | 0 (0.0%) |
| 18 to 34 Years | 115 (11.9%) | 0 (0.0%) |
| 35 to 64 Years | 0 (0.0%) | 8 (1.3%) |
| 65 to 74 Years | 8 (10.0%) | 10 (8.3%) |
| 75 Years and over | 14 (21.5%) | 17 (48.6%) |
Disability Class: Self-Care Difficulty
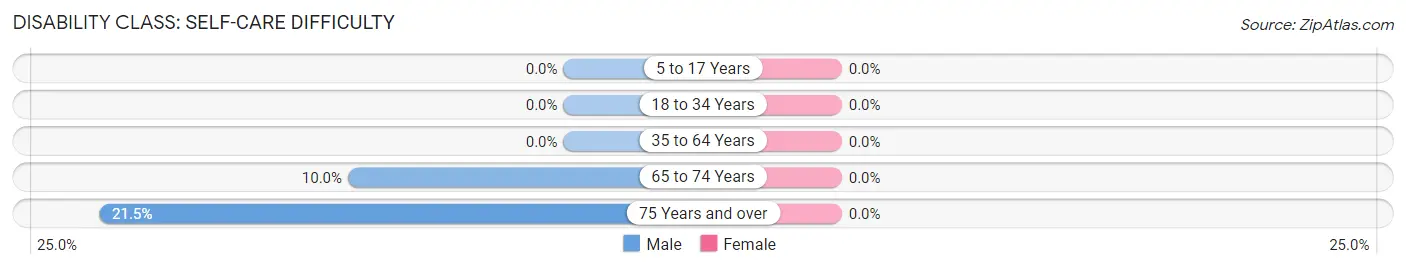
| Age Bracket | Male | Female |
| 5 to 17 Years | 0 (0.0%) | 0 (0.0%) |
| 18 to 34 Years | 0 (0.0%) | 0 (0.0%) |
| 35 to 64 Years | 0 (0.0%) | 0 (0.0%) |
| 65 to 74 Years | 8 (10.0%) | 0 (0.0%) |
| 75 Years and over | 14 (21.5%) | 0 (0.0%) |
Technology Access in Crittenden
Computing Device Access in Crittenden
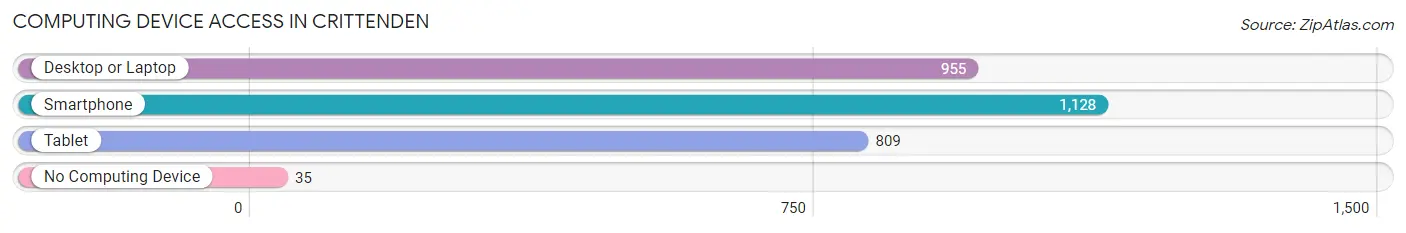
| Device Type | # Households | % Households |
| Desktop or Laptop | 955 | 77.2% |
| Smartphone | 1,128 | 91.2% |
| Tablet | 809 | 65.4% |
| No Computing Device | 35 | 2.8% |
| Total | 1,237 | 100.0% |
Internet Access in Crittenden
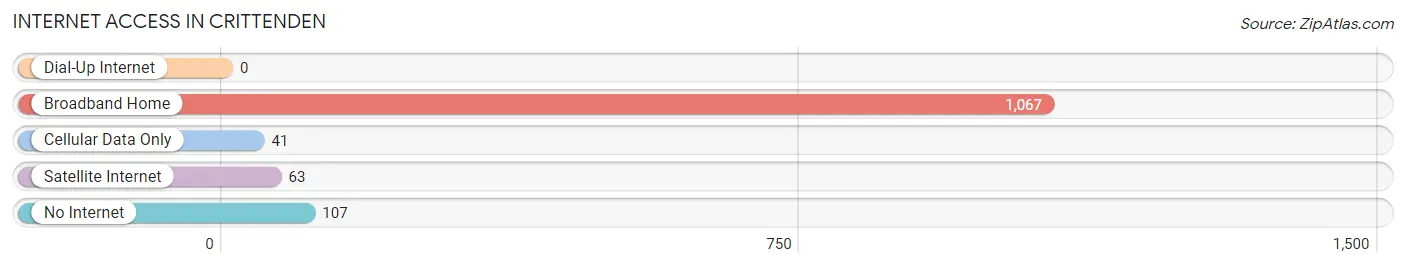
| Internet Type | # Households | % Households |
| Dial-Up Internet | 0 | 0.0% |
| Broadband Home | 1,067 | 86.3% |
| Cellular Data Only | 41 | 3.3% |
| Satellite Internet | 63 | 5.1% |
| No Internet | 107 | 8.6% |
| Total | 1,237 | 100.0% |
Crittenden Summary
Crittenden, Kentucky is a small town located in the western part of the state, in the county of Grant. It is situated on the banks of the Ohio River, and is home to a population of just over 1,000 people. The town is known for its rural charm and its close proximity to the larger cities of Cincinnati and Louisville.
History
Crittenden was first settled in the early 1800s by a group of settlers from Virginia. The town was originally known as “Crittenden’s Station”, and was named after the first settler, William Crittenden. The town was incorporated in 1845, and was the first town in Grant County.
In the late 1800s, the town was a major stop on the Louisville and Nashville Railroad. This allowed the town to become a major hub for the transportation of goods and services. The railroad also allowed the town to become a major center for the production of tobacco, which was a major industry in the area.
The town was also home to a number of other industries, including a flour mill, a sawmill, and a brickyard. The town also had a number of stores, including a general store, a drug store, and a hardware store.
Geography
Crittenden is located in the western part of Grant County, on the banks of the Ohio River. The town is situated on the edge of the Bluegrass region of Kentucky, and is surrounded by rolling hills and farmland. The town is located approximately 30 miles from the larger cities of Cincinnati and Louisville.
The town is located at an elevation of 590 feet above sea level, and has a total area of 1.2 square miles. The town is located in a humid subtropical climate zone, and experiences hot, humid summers and mild winters.
Economy
The economy of Crittenden is largely based on agriculture and tourism. The town is home to a number of farms, which produce a variety of crops, including corn, soybeans, and tobacco. The town is also home to a number of tourist attractions, including the Grant County Historical Museum and the Grant County Fairgrounds.
The town is also home to a number of small businesses, including restaurants, retail stores, and service providers. The town is also home to a number of manufacturing companies, which produce a variety of products, including furniture, clothing, and automotive parts.
Demographics
As of the 2010 census, the population of Crittenden was 1,072. The town has a population density of 890 people per square mile. The median age of the population is 43.7 years, and the median household income is $37,917.
The town is predominantly white, with a population that is 97.2% white. The town also has a small African American population, which makes up 1.2% of the population. The town also has a small Hispanic population, which makes up 0.7% of the population.
Conclusion
Crittenden, Kentucky is a small town located in the western part of the state, in the county of Grant. The town is known for its rural charm and its close proximity to the larger cities of Cincinnati and Louisville. The town has a population of just over 1,000 people, and is largely based on agriculture and tourism. The town is predominantly white, with a population that is 97.2% white. The town also has a small African American population, which makes up 1.2% of the population, and a small Hispanic population, which makes up 0.7% of the population.
Common Questions
What is Per Capita Income in Crittenden?
Per Capita income in Crittenden is $21,671.
What is the Median Family Income in Crittenden?
Median Family Income in Crittenden is $51,875.
What is the Median Household income in Crittenden?
Median Household Income in Crittenden is $52,217.
What is Income or Wage Gap in Crittenden?
Income or Wage Gap in Crittenden is 45.8%.
Women in Crittenden earn 54.2 cents for every dollar earned by a man.
What is Family Income Deficit in Crittenden?
Family Income Deficit in Crittenden is $8,547.
Families that are below poverty line in Crittenden earn $8,547 less on average than the poverty threshold level.
What is Inequality or Gini Index in Crittenden?
Inequality or Gini Index in Crittenden is 0.36.
What is the Total Population of Crittenden?
Total Population of Crittenden is 4,033.
What is the Total Male Population of Crittenden?
Total Male Population of Crittenden is 2,325.
What is the Total Female Population of Crittenden?
Total Female Population of Crittenden is 1,708.
What is the Ratio of Males per 100 Females in Crittenden?
There are 136.12 Males per 100 Females in Crittenden.
What is the Ratio of Females per 100 Males in Crittenden?
There are 73.46 Females per 100 Males in Crittenden.
What is the Median Population Age in Crittenden?
Median Population Age in Crittenden is 24.3 Years.
What is the Average Family Size in Crittenden
Average Family Size in Crittenden is 3.5 People.
What is the Average Household Size in Crittenden
Average Household Size in Crittenden is 3.3 People.
How Large is the Labor Force in Crittenden?
There are 1,886 People in the Labor Forcein in Crittenden.
What is the Percentage of People in the Labor Force in Crittenden?
66.1% of People are in the Labor Force in Crittenden.
What is the Unemployment Rate in Crittenden?
Unemployment Rate in Crittenden is 5.7%.