Zip Codes with the Highest Percentage of Population Employed in Security & Protection in Louisville, KY

RELATED REPORTS & OPTIONS

Security & Protection
Population
Families and Households
Female Fertility
Female Fertility (Unmarried)
Race (Community Size)
Race (Percentage)
Ancestry (Community Size)
AfghanAfricanAlaska NativeAlbanianAlsatianAmericanApacheArabArgentineanArmenianAssyrian / Chaldean / SyriacAustralianAustrianBahamianBangladeshiBarbadianBelgianBelizeanBhutaneseBlackfeetBolivianBrazilianBritishBritish West IndianBulgarianBurmeseCajunCambodianCanadianCape VerdeanCelticCentral AmericanCentral American IndianCherokeeChickasawChileanChippewaChoctawColombianComancheCosta RicanCreekCroatianCrowCubanCzechCzechoslovakianDanishDominicanDutchEastern EuropeanEcuadorianEgyptianEnglishEstonianEthiopianEuropeanFilipinoFinnishFrenchFrench American IndianFrench CanadianGermanGhanaianGreekGuamanian / ChamorroGuatemalanHaitianHonduranHungarianIcelanderIndian (Asian)IndonesianInupiatIranianIraqiIrishIroquoisIsraeliItalianJamaicanJapaneseJordanianKenyanKoreanLaotianLatvianLebaneseLiberianLithuanianLumbeeLuxembourgerMalaysianMexicanMexican American IndianMongolianMoroccanNative HawaiianNew ZealanderNicaraguanNigerianNorthern EuropeanNorwegianOsagePakistaniPalestinianPanamanianParaguayanPennsylvania GermanPeruvianPolishPortuguesePotawatomiPuebloPuerto RicanRomanianRussianSalvadoranSamoanScandinavianScotch-IrishScottishSeminoleSerbianSiouxSlavicSlovakSloveneSomaliSouth AfricanSouth AmericanSpaniardSpanishSri LankanSubsaharan AfricanSudaneseSwedishSwissSyrianThaiTohono O'OdhamTrinidadian and TobagonianTurkishU.S. Virgin IslanderUgandanUkrainianVenezuelanWelshWest IndianYugoslavian
Ancestry (Percentage)
AfghanAfricanAlaska NativeAlbanianAlsatianAmericanApacheArabArgentineanArmenianAssyrian / Chaldean / SyriacAustralianAustrianBahamianBangladeshiBarbadianBelgianBelizeanBhutaneseBlackfeetBolivianBrazilianBritishBritish West IndianBulgarianBurmeseCajunCambodianCanadianCape VerdeanCelticCentral AmericanCentral American IndianCherokeeChickasawChileanChippewaChoctawColombianComancheCosta RicanCreekCroatianCrowCubanCzechCzechoslovakianDanishDominicanDutchEastern EuropeanEcuadorianEgyptianEnglishEstonianEthiopianEuropeanFilipinoFinnishFrenchFrench American IndianFrench CanadianGermanGhanaianGreekGuamanian / ChamorroGuatemalanHaitianHonduranHungarianIcelanderIndian (Asian)IndonesianInupiatIranianIraqiIrishIroquoisIsraeliItalianJamaicanJapaneseJordanianKenyanKoreanLaotianLatvianLebaneseLiberianLithuanianLumbeeLuxembourgerMalaysianMexicanMexican American IndianMongolianMoroccanNative HawaiianNew ZealanderNicaraguanNigerianNorthern EuropeanNorwegianOsagePakistaniPalestinianPanamanianParaguayanPennsylvania GermanPeruvianPolishPortuguesePotawatomiPuebloPuerto RicanRomanianRussianSalvadoranSamoanScandinavianScotch-IrishScottishSeminoleSerbianSiouxSlavicSlovakSloveneSomaliSouth AfricanSouth AmericanSpaniardSpanishSri LankanSubsaharan AfricanSudaneseSwedishSwissSyrianThaiTohono O'OdhamTrinidadian and TobagonianTurkishU.S. Virgin IslanderUgandanUkrainianVenezuelanWelshWest IndianYugoslavian
Immigrant Origin (Total)
AfghanistanAfricaAlbaniaArgentinaAsiaAustraliaAustriaBangladeshBarbadosBelarusBelgiumBelizeBoliviaBosnia and HerzegovinaBrazilBulgariaBurma / MyanmarCambodiaCameroonCanadaCaribbeanCentral AmericaChileChinaColombiaCongoCosta RicaCroatiaCubaCzechoslovakiaDenmarkDominican RepublicEastern AfricaEastern AsiaEastern EuropeEcuadorEgyptEl SalvadorEnglandEritreaEthiopiaEuropeFranceGermanyGhanaGuatemalaGuyanaHaitiHondurasHong KongHungaryIndiaIndonesiaIranIraqIrelandIsraelItalyJamaicaJapanJordanKazakhstanKenyaKoreaKuwaitLaosLatin AmericaLebanonLiberiaLithuaniaMalaysiaMexicoMicronesiaMiddle AfricaMoldovaMoroccoNepalNetherlandsNicaraguaNigeriaNorthern AfricaNorthern EuropeNorwayOceaniaPakistanPanamaPeruPhilippinesPolandPortugalRomaniaRussiaSaudi ArabiaScotlandSenegalSerbiaSingaporeSomaliaSouth AfricaSouth AmericaSouth Central AsiaSouth Eastern AsiaSouthern EuropeSpainSri LankaSudanSwedenSyriaTaiwanThailandTrinidad and TobagoTurkeyUgandaUkraineUzbekistanVenezuelaVietnamWestern AfricaWestern AsiaWestern EuropeZaire
Immigrant Origin (Percentage)
AfghanistanAfricaAlbaniaArgentinaAsiaAustraliaAustriaBangladeshBarbadosBelarusBelgiumBelizeBoliviaBosnia and HerzegovinaBrazilBulgariaBurma / MyanmarCambodiaCameroonCanadaCaribbeanCentral AmericaChileChinaColombiaCongoCosta RicaCroatiaCubaCzechoslovakiaDenmarkDominican RepublicEastern AfricaEastern AsiaEastern EuropeEcuadorEgyptEl SalvadorEnglandEritreaEthiopiaEuropeFranceGermanyGhanaGuatemalaGuyanaHaitiHondurasHong KongHungaryIndiaIndonesiaIranIraqIrelandIsraelItalyJamaicaJapanJordanKazakhstanKenyaKoreaKuwaitLaosLatin AmericaLebanonLiberiaLithuaniaMalaysiaMexicoMicronesiaMiddle AfricaMoldovaMoroccoNepalNetherlandsNicaraguaNigeriaNorthern AfricaNorthern EuropeNorwayOceaniaPakistanPanamaPeruPhilippinesPolandPortugalRomaniaRussiaSaudi ArabiaScotlandSenegalSerbiaSingaporeSomaliaSouth AfricaSouth AmericaSouth Central AsiaSouth Eastern AsiaSouthern EuropeSpainSri LankaSudanSwedenSyriaTaiwanThailandTrinidad and TobagoTurkeyUgandaUkraineUzbekistanVenezuelaVietnamWestern AfricaWestern AsiaWestern EuropeZaire
Income
Income (Families)
Income (Households)
Poverty
Poverty (Families)
Unemployment
Employment Occupations
Employment Industries
Employer Class
Commute Time
Commute Means
School Enrollment
Education by Degree Field
Occupancy
Finances
Physical Characteristics
Louisville
Compare Zip Codes
Comparison Subject

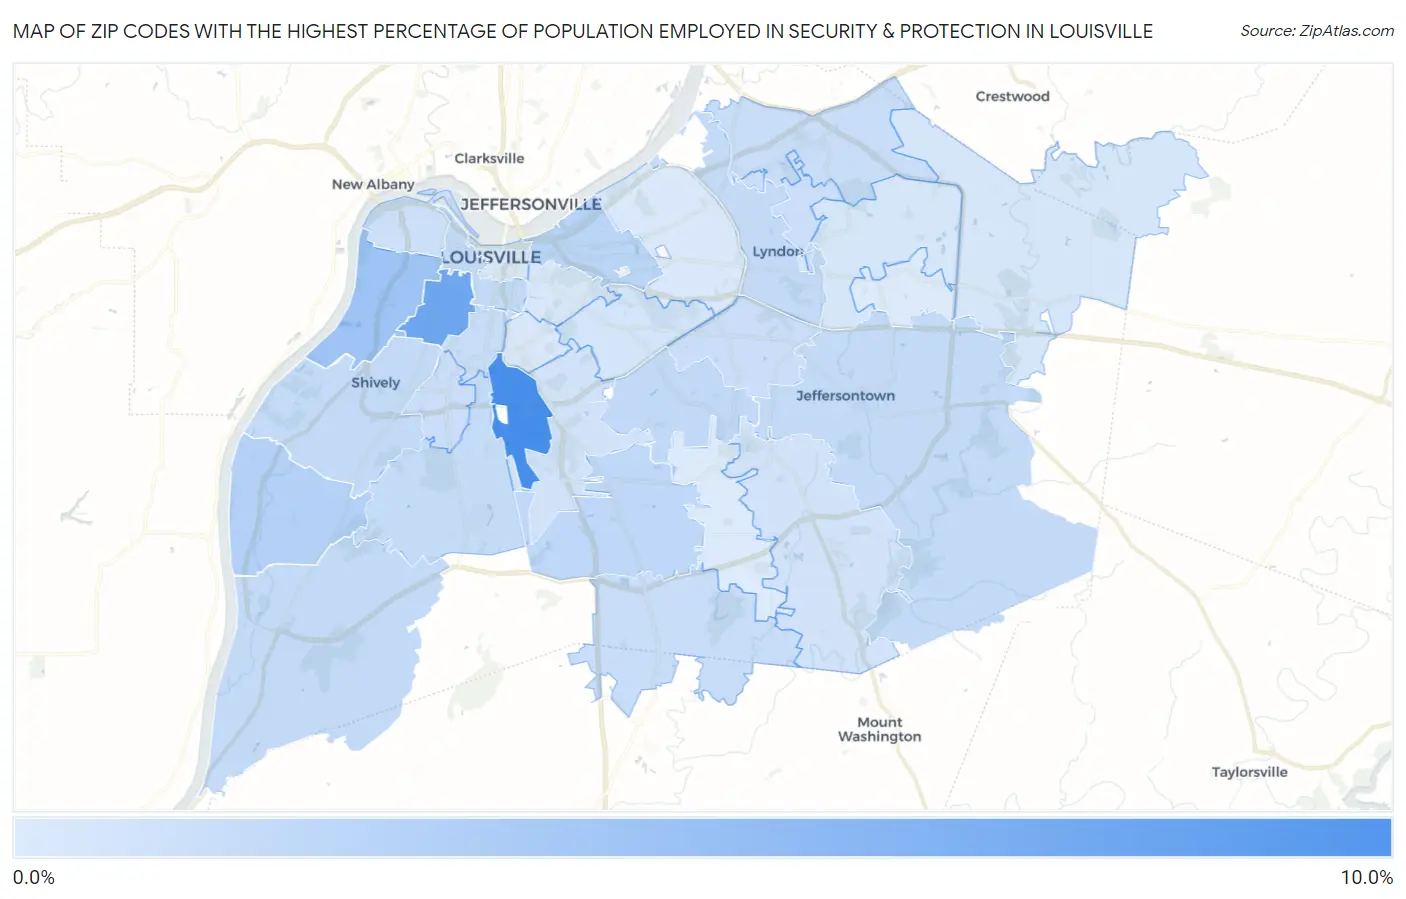
Map of Zip Codes with the Highest Percentage of Population Employed in Security & Protection in Louisville

0.0%
10.0%
Zip Codes with the Highest Percentage of Population Employed in Security & Protection in Louisville Map

Zip Codes with the Highest Percentage of Population Employed in Security & Protection in Louisville, KY

Zip Code % Employed vs State vs National
1.402099.6%2.0%(+7.56)#282.1%(+7.43)#826
2.402107.2%2.0%(+5.15)#432.1%(+5.02)#1,459
3.402114.1%2.0%(+2.11)#1032.1%(+1.98)#4,253
4.402583.0%2.0%(+1.000)#1512.1%(+0.863)#7,186
5.402062.5%2.0%(+0.490)#2012.1%(+0.354)#9,495
6.402192.3%2.0%(+0.315)#2142.1%(+0.178)#10,474
7.402182.1%2.0%(+0.065)#2422.1%(-0.071)#12,067
8.402032.1%2.0%(+0.058)#2442.1%(-0.078)#12,110
9.402992.0%2.0%(-0.027)#2532.1%(-0.164)#12,652
10.402222.0%2.0%(-0.040)#2572.1%(-0.177)#12,747
11.402162.0%2.0%(-0.040)#2582.1%(-0.177)#12,748
12.402722.0%2.0%(-0.050)#2602.1%(-0.186)#12,809
13.402141.8%2.0%(-0.191)#2732.1%(-0.328)#13,776
14.402081.7%2.0%(-0.306)#2842.1%(-0.443)#14,637
15.402411.7%2.0%(-0.334)#2892.1%(-0.470)#14,840
16.402291.7%2.0%(-0.343)#2902.1%(-0.480)#14,907
17.402151.7%2.0%(-0.347)#2922.1%(-0.483)#14,940
18.402201.6%2.0%(-0.404)#2982.1%(-0.540)#15,350
19.402421.6%2.0%(-0.412)#3002.1%(-0.549)#15,416
20.402121.5%2.0%(-0.494)#3122.1%(-0.630)#16,049
21.402911.3%2.0%(-0.754)#3492.1%(-0.890)#18,076
22.402131.2%2.0%(-0.854)#3592.1%(-0.990)#18,827
23.402051.1%2.0%(-0.947)#3692.1%(-1.08)#19,545
24.402230.99%2.0%(-1.02)#3762.1%(-1.16)#20,142
25.402450.91%2.0%(-1.10)#3862.1%(-1.24)#20,719
26.402040.86%2.0%(-1.16)#3902.1%(-1.29)#21,065
27.402170.77%2.0%(-1.24)#3982.1%(-1.38)#21,606
28.402020.74%2.0%(-1.27)#4002.1%(-1.40)#21,771
29.402070.64%2.0%(-1.38)#4132.1%(-1.51)#22,461
30.402430.59%2.0%(-1.42)#4162.1%(-1.56)#22,736
31.402280.53%2.0%(-1.48)#4222.1%(-1.62)#23,090

Common Questions

What are the Top 10 Zip Codes with the Highest Percentage of Population Employed in Security & Protection in Louisville, KY?
Top 10 Zip Codes with the Highest Percentage of Population Employed in Security & Protection in Louisville, KY are:
#1
9.6%
#2
7.2%
#3
4.1%
#4
3.0%
#5
2.5%
#6
2.3%
#7
2.1%
#8
2.1%
#9
2.0%
#10
2.0%
What zip code has the Highest Percentage of Population Employed in Security & Protection in Louisville, KY?
40209 has the Highest Percentage of Population Employed in Security & Protection in Louisville, KY with 9.6%.
What is the Percentage of Population Employed in Security & Protection in Louisville, KY?
Percentage of Population Employed in Security & Protection in Louisville is 1.9%.
What is the Percentage of Population Employed in Security & Protection in Kentucky?
Percentage of Population Employed in Security & Protection in Kentucky is 2.0%.
What is the Percentage of Population Employed in Security & Protection in the United States?
Percentage of Population Employed in Security & Protection in the United States is 2.1%.