Hopkinsville, KY Map & Demographics
Hopkinsville Map
Hopkinsville Overview
$25,884
PER CAPITA INCOME
$56,219
AVG FAMILY INCOME
$43,577
AVG HOUSEHOLD INCOME
1.8%
WAGE / INCOME GAP [ % ]
98.2¢/ $1
WAGE / INCOME GAP [ $ ]
$11,927
FAMILY INCOME DEFICIT
0.48
INEQUALITY / GINI INDEX
31,042
TOTAL POPULATION
15,533
MALE POPULATION
15,509
FEMALE POPULATION
100.15
MALES / 100 FEMALES
99.85
FEMALES / 100 MALES
34.9
MEDIAN AGE
3.0
AVG FAMILY SIZE
2.4
AVG HOUSEHOLD SIZE
13,199
LABOR FORCE [ PEOPLE ]
54.4%
PERCENT IN LABOR FORCE
7.8%
UNEMPLOYMENT RATE
Hopkinsville Zip Codes
Hopkinsville Area Codes
Income in Hopkinsville
Income Overview in Hopkinsville
Per Capita Income in Hopkinsville is $25,884, while median incomes of families and households are $56,219 and $43,577 respectively.
| Characteristic | Number | Measure |
| Per Capita Income | 31,042 | $25,884 |
| Median Family Income | 7,268 | $56,219 |
| Mean Family Income | 7,268 | $75,488 |
| Median Household Income | 12,473 | $43,577 |
| Mean Household Income | 12,473 | $61,320 |
| Income Deficit | 7,268 | $11,927 |
| Wage / Income Gap (%) | 31,042 | 1.76% |
| Wage / Income Gap ($) | 31,042 | 98.24¢ per $1 |
| Gini / Inequality Index | 31,042 | 0.48 |
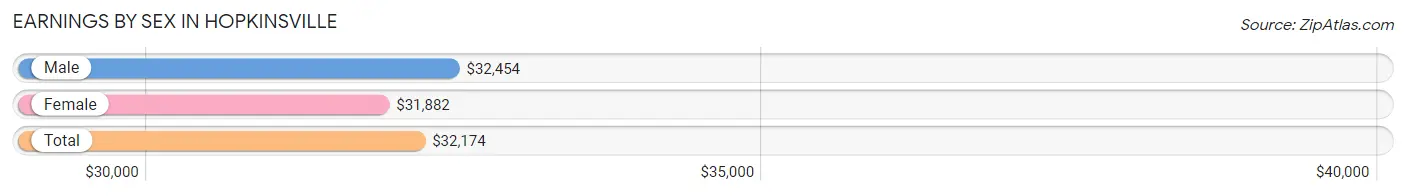
Earnings by Sex in Hopkinsville
Average Earnings in Hopkinsville are $32,174, $32,454 for men and $31,882 for women, a difference of 1.8%.
| Sex | Number | Average Earnings |
| Male | 7,462 (54.5%) | $32,454 |
| Female | 6,234 (45.5%) | $31,882 |
| Total | 13,696 (100.0%) | $32,174 |
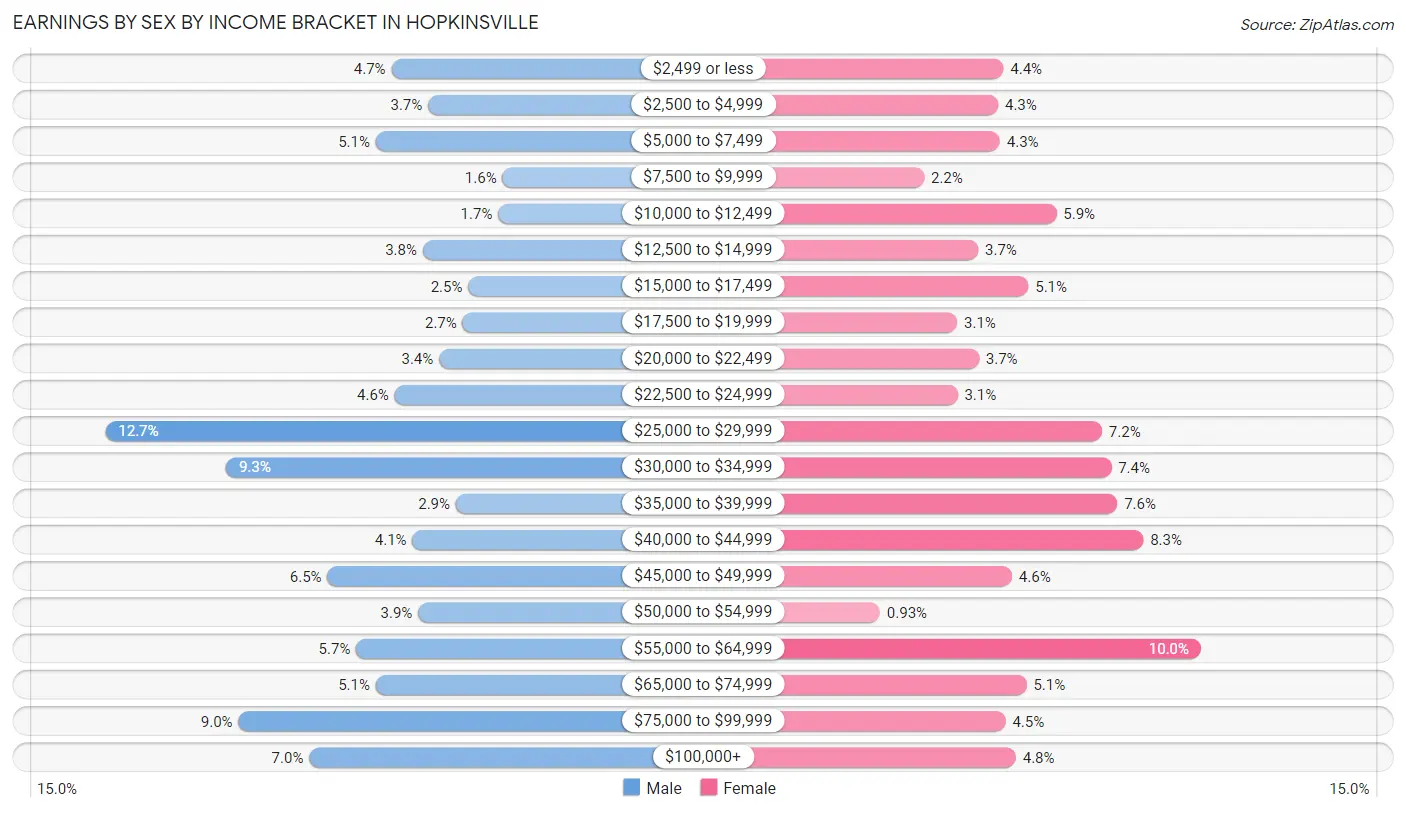
Earnings by Sex by Income Bracket in Hopkinsville
The most common earnings brackets in Hopkinsville are $25,000 to $29,999 for men (950 | 12.7%) and $55,000 to $64,999 for women (620 | 10.0%).
| Income | Male | Female |
| $2,499 or less | 350 (4.7%) | 274 (4.4%) |
| $2,500 to $4,999 | 273 (3.7%) | 265 (4.3%) |
| $5,000 to $7,499 | 383 (5.1%) | 268 (4.3%) |
| $7,500 to $9,999 | 117 (1.6%) | 135 (2.2%) |
| $10,000 to $12,499 | 126 (1.7%) | 367 (5.9%) |
| $12,500 to $14,999 | 284 (3.8%) | 230 (3.7%) |
| $15,000 to $17,499 | 189 (2.5%) | 318 (5.1%) |
| $17,500 to $19,999 | 201 (2.7%) | 193 (3.1%) |
| $20,000 to $22,499 | 250 (3.4%) | 231 (3.7%) |
| $22,500 to $24,999 | 343 (4.6%) | 194 (3.1%) |
| $25,000 to $29,999 | 950 (12.7%) | 447 (7.2%) |
| $30,000 to $34,999 | 697 (9.3%) | 463 (7.4%) |
| $35,000 to $39,999 | 215 (2.9%) | 474 (7.6%) |
| $40,000 to $44,999 | 306 (4.1%) | 519 (8.3%) |
| $45,000 to $49,999 | 484 (6.5%) | 289 (4.6%) |
| $50,000 to $54,999 | 294 (3.9%) | 58 (0.9%) |
| $55,000 to $64,999 | 424 (5.7%) | 620 (10.0%) |
| $65,000 to $74,999 | 383 (5.1%) | 315 (5.1%) |
| $75,000 to $99,999 | 671 (9.0%) | 278 (4.5%) |
| $100,000+ | 522 (7.0%) | 296 (4.8%) |
| Total | 7,462 (100.0%) | 6,234 (100.0%) |
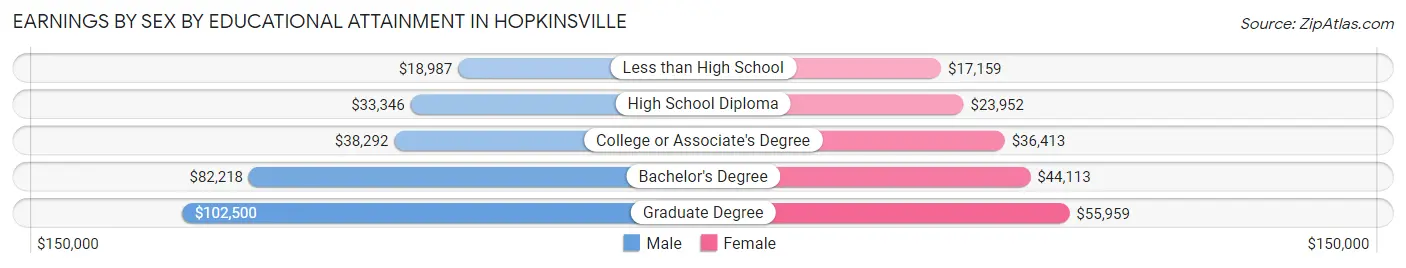
Earnings by Sex by Educational Attainment in Hopkinsville
Average earnings in Hopkinsville are $38,556 for men and $36,723 for women, a difference of 4.8%. Men with an educational attainment of graduate degree enjoy the highest average annual earnings of $102,500, while those with less than high school education earn the least with $18,987. Women with an educational attainment of graduate degree earn the most with the average annual earnings of $55,959, while those with less than high school education have the smallest earnings of $17,159.
| Educational Attainment | Male Income | Female Income |
| Less than High School | $18,987 | $17,159 |
| High School Diploma | $33,346 | $23,952 |
| College or Associate's Degree | $38,292 | $36,413 |
| Bachelor's Degree | $82,218 | $44,113 |
| Graduate Degree | $102,500 | $55,959 |
| Total | $38,556 | $36,723 |
Family Income in Hopkinsville
Family Income Brackets in Hopkinsville
According to the Hopkinsville family income data, there are 1,381 families falling into the $50,000 to $74,999 income range, which is the most common income bracket and makes up 19.0% of all families. Conversely, the $10,000 to $14,999 income bracket is the least frequent group with only 167 families (2.3%) belonging to this category.
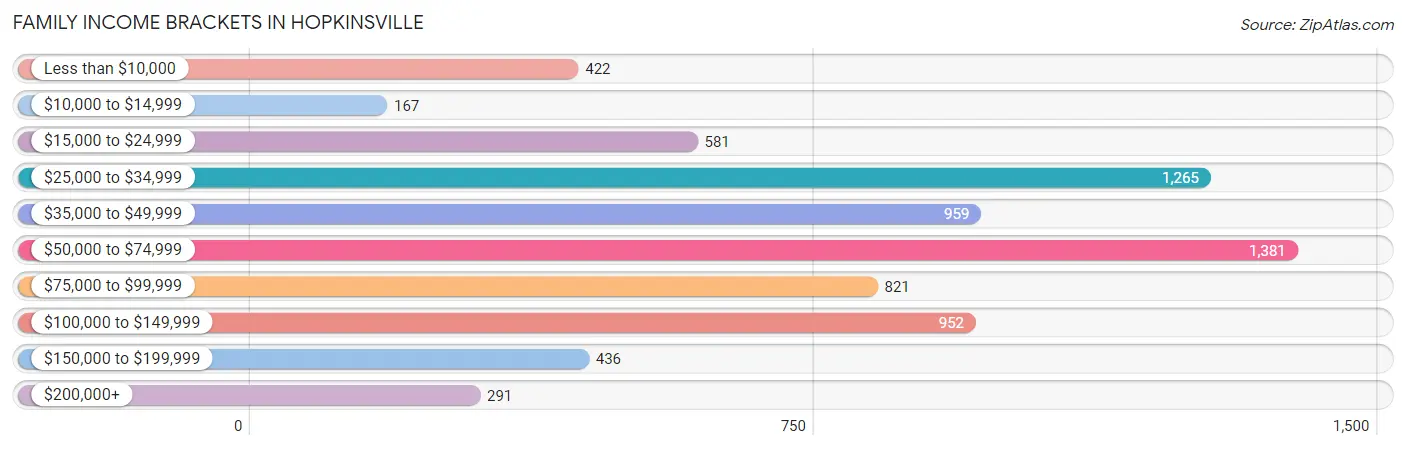
| Income Bracket | # Families | % Families |
| Less than $10,000 | 422 | 5.8% |
| $10,000 to $14,999 | 167 | 2.3% |
| $15,000 to $24,999 | 581 | 8.0% |
| $25,000 to $34,999 | 1,265 | 17.4% |
| $35,000 to $49,999 | 959 | 13.2% |
| $50,000 to $74,999 | 1,381 | 19.0% |
| $75,000 to $99,999 | 821 | 11.3% |
| $100,000 to $149,999 | 952 | 13.1% |
| $150,000 to $199,999 | 436 | 6.0% |
| $200,000+ | 291 | 4.0% |
Family Income by Famaliy Size in Hopkinsville
4-person families (1,078 | 14.8%) account for the highest median family income in Hopkinsville with $76,802 per family, while 2-person families (3,916 | 53.9%) have the highest median income of $27,795 per family member.
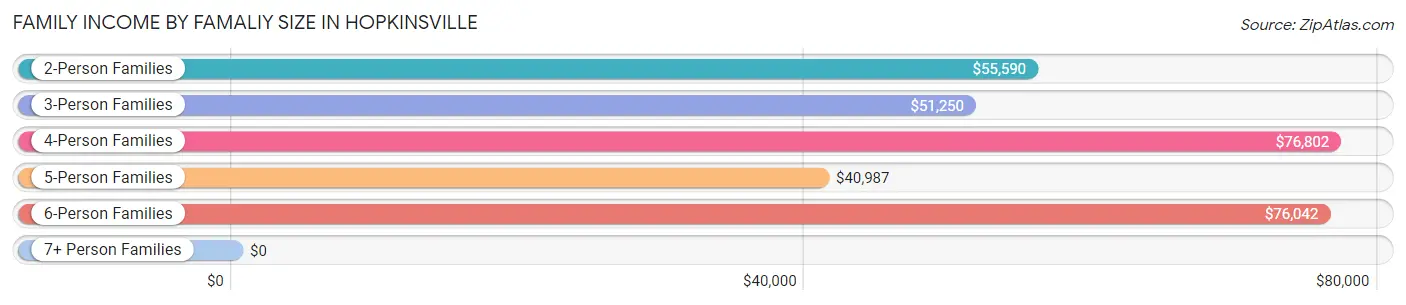
| Income Bracket | # Families | Median Income |
| 2-Person Families | 3,916 (53.9%) | $55,590 |
| 3-Person Families | 1,657 (22.8%) | $51,250 |
| 4-Person Families | 1,078 (14.8%) | $76,802 |
| 5-Person Families | 403 (5.5%) | $40,987 |
| 6-Person Families | 130 (1.8%) | $76,042 |
| 7+ Person Families | 84 (1.2%) | $0 |
| Total | 7,268 (100.0%) | $56,219 |
Family Income by Number of Earners in Hopkinsville
The median family income in Hopkinsville is $56,219, with families comprising 2 earners (1,818) having the highest median family income of $110,929, while families with no earners (1,368) have the lowest median family income of $36,953, accounting for 25.0% and 18.8% of families, respectively.
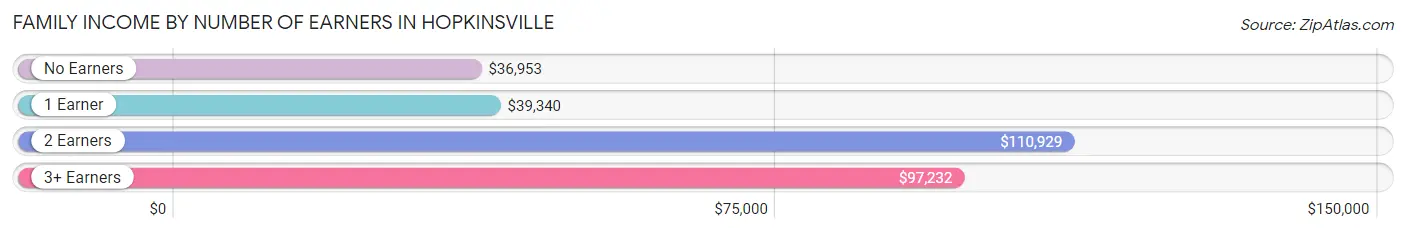
| Number of Earners | # Families | Median Income |
| No Earners | 1,368 (18.8%) | $36,953 |
| 1 Earner | 3,809 (52.4%) | $39,340 |
| 2 Earners | 1,818 (25.0%) | $110,929 |
| 3+ Earners | 273 (3.8%) | $97,232 |
| Total | 7,268 (100.0%) | $56,219 |
Household Income in Hopkinsville
Household Income Brackets in Hopkinsville
With 2,220 households falling in the category, the $50,000 to $74,999 income range is the most frequent in Hopkinsville, accounting for 17.8% of all households. In contrast, only 337 households (2.7%) fall into the $200,000+ income bracket, making it the least populous group.
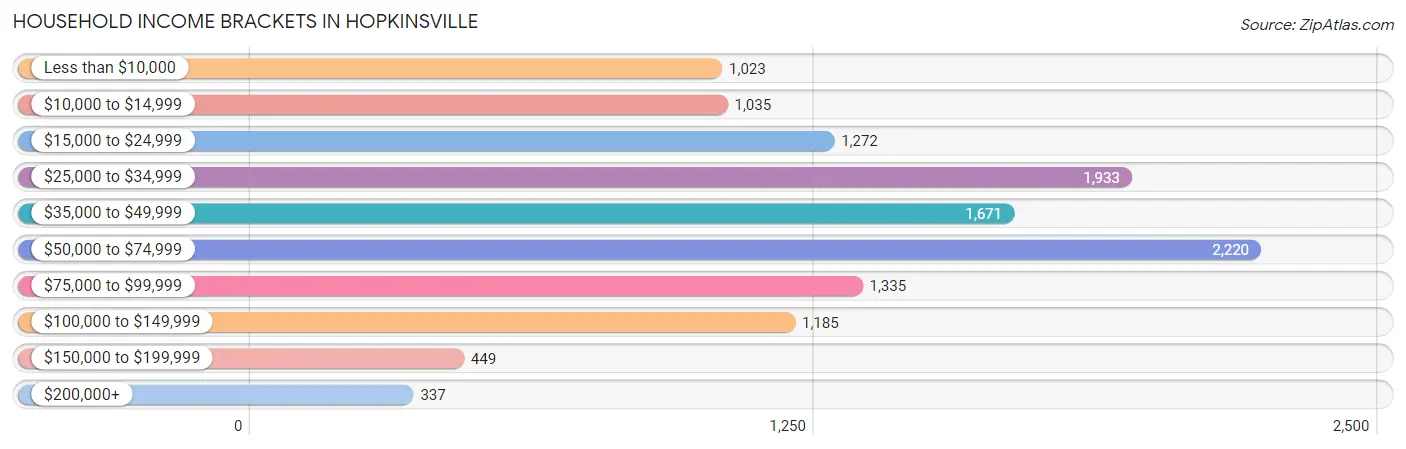
| Income Bracket | # Households | % Households |
| Less than $10,000 | 1,023 | 8.2% |
| $10,000 to $14,999 | 1,035 | 8.3% |
| $15,000 to $24,999 | 1,272 | 10.2% |
| $25,000 to $34,999 | 1,933 | 15.5% |
| $35,000 to $49,999 | 1,671 | 13.4% |
| $50,000 to $74,999 | 2,220 | 17.8% |
| $75,000 to $99,999 | 1,335 | 10.7% |
| $100,000 to $149,999 | 1,185 | 9.5% |
| $150,000 to $199,999 | 449 | 3.6% |
| $200,000+ | 337 | 2.7% |
Household Income by Householder Age in Hopkinsville
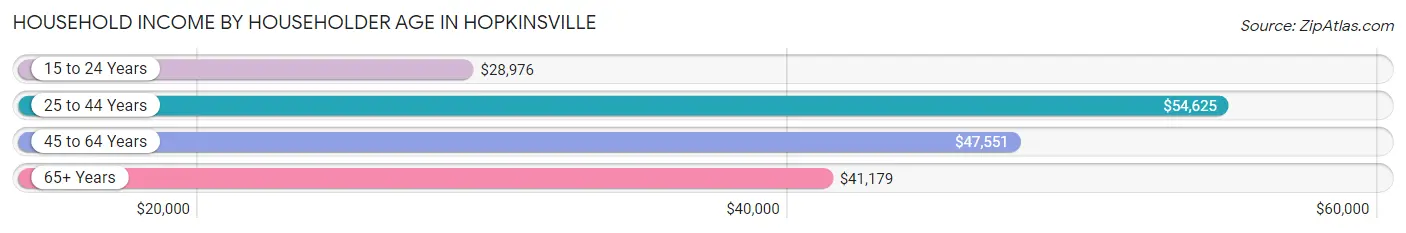
The median household income in Hopkinsville is $43,577, with the highest median household income of $54,625 found in the 25 to 44 years age bracket for the primary householder. A total of 3,849 households (30.9%) fall into this category. Meanwhile, the 15 to 24 years age bracket for the primary householder has the lowest median household income of $28,976, with 1,433 households (11.5%) in this group.
| Income Bracket | # Households | Median Income |
| 15 to 24 Years | 1,433 (11.5%) | $28,976 |
| 25 to 44 Years | 3,849 (30.9%) | $54,625 |
| 45 to 64 Years | 3,987 (32.0%) | $47,551 |
| 65+ Years | 3,204 (25.7%) | $41,179 |
| Total | 12,473 (100.0%) | $43,577 |
Poverty in Hopkinsville
Income Below Poverty by Sex and Age in Hopkinsville
With 15.9% poverty level for males and 24.5% for females among the residents of Hopkinsville, 15 year old males and under 5 year old females are the most vulnerable to poverty, with 82 males (47.7%) and 286 females (37.5%) in their respective age groups living below the poverty level.
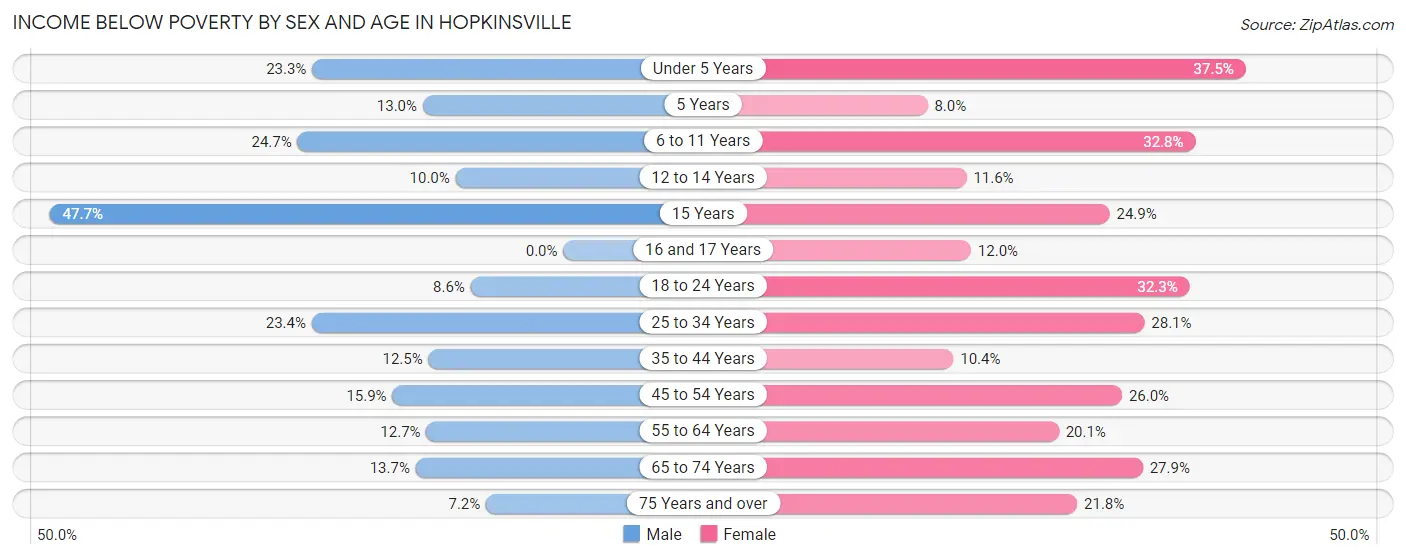
| Age Bracket | Male | Female |
| Under 5 Years | 262 (23.3%) | 286 (37.5%) |
| 5 Years | 21 (13.0%) | 7 (8.0%) |
| 6 to 11 Years | 354 (24.7%) | 518 (32.8%) |
| 12 to 14 Years | 54 (10.0%) | 61 (11.6%) |
| 15 Years | 82 (47.7%) | 41 (24.8%) |
| 16 and 17 Years | 0 (0.0%) | 58 (12.0%) |
| 18 to 24 Years | 183 (8.6%) | 416 (32.3%) |
| 25 to 34 Years | 488 (23.4%) | 581 (28.1%) |
| 35 to 44 Years | 190 (12.5%) | 158 (10.3%) |
| 45 to 54 Years | 213 (15.9%) | 457 (26.0%) |
| 55 to 64 Years | 195 (12.7%) | 377 (20.1%) |
| 65 to 74 Years | 160 (13.7%) | 431 (27.9%) |
| 75 Years and over | 58 (7.2%) | 306 (21.8%) |
| Total | 2,260 (15.9%) | 3,697 (24.5%) |
Income Above Poverty by Sex and Age in Hopkinsville
According to the poverty statistics in Hopkinsville, males aged 16 and 17 years and females aged 5 years are the age groups that are most secure financially, with 100.0% of males and 92.0% of females in these age groups living above the poverty line.
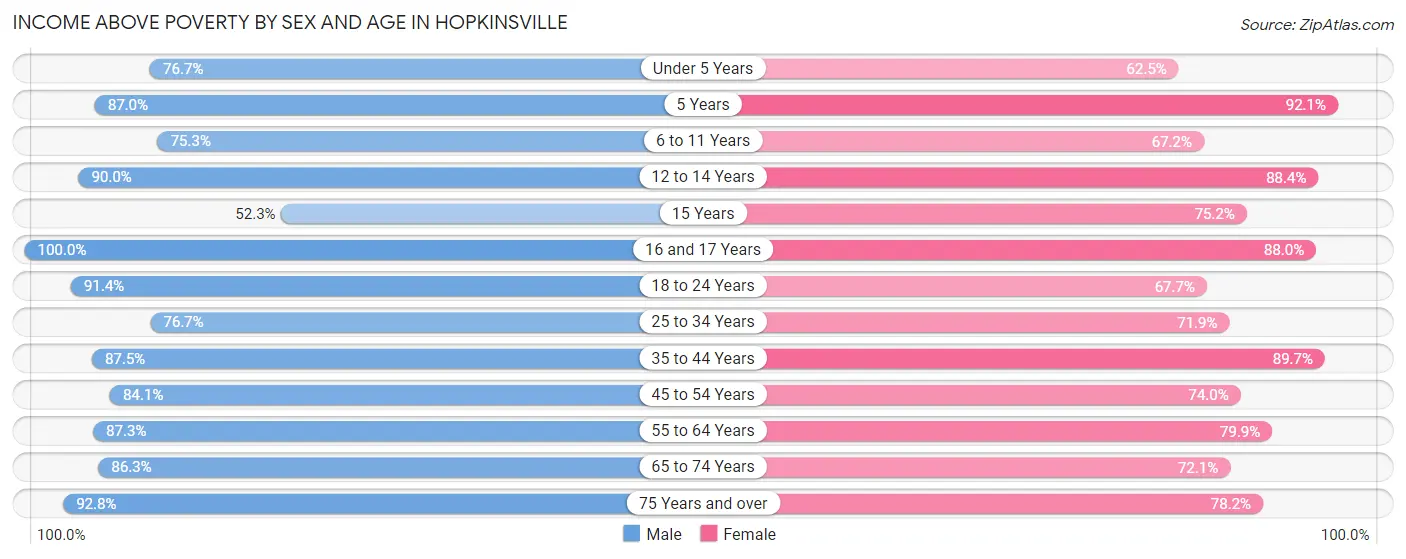
| Age Bracket | Male | Female |
| Under 5 Years | 862 (76.7%) | 477 (62.5%) |
| 5 Years | 140 (87.0%) | 81 (92.0%) |
| 6 to 11 Years | 1,081 (75.3%) | 1,061 (67.2%) |
| 12 to 14 Years | 486 (90.0%) | 466 (88.4%) |
| 15 Years | 90 (52.3%) | 124 (75.1%) |
| 16 and 17 Years | 170 (100.0%) | 426 (88.0%) |
| 18 to 24 Years | 1,946 (91.4%) | 873 (67.7%) |
| 25 to 34 Years | 1,602 (76.6%) | 1,488 (71.9%) |
| 35 to 44 Years | 1,329 (87.5%) | 1,369 (89.6%) |
| 45 to 54 Years | 1,130 (84.1%) | 1,301 (74.0%) |
| 55 to 64 Years | 1,339 (87.3%) | 1,496 (79.9%) |
| 65 to 74 Years | 1,008 (86.3%) | 1,112 (72.1%) |
| 75 Years and over | 751 (92.8%) | 1,095 (78.2%) |
| Total | 11,934 (84.1%) | 11,369 (75.5%) |
Income Below Poverty Among Married-Couple Families in Hopkinsville
The poverty statistics for married-couple families in Hopkinsville show that 7.7% or 293 of the total 3,788 families live below the poverty line. Families with 3 or 4 children have the highest poverty rate of 42.5%, comprising of 125 families. On the other hand, families with 5 or more children have the lowest poverty rate of 0.0%, which includes 0 families.
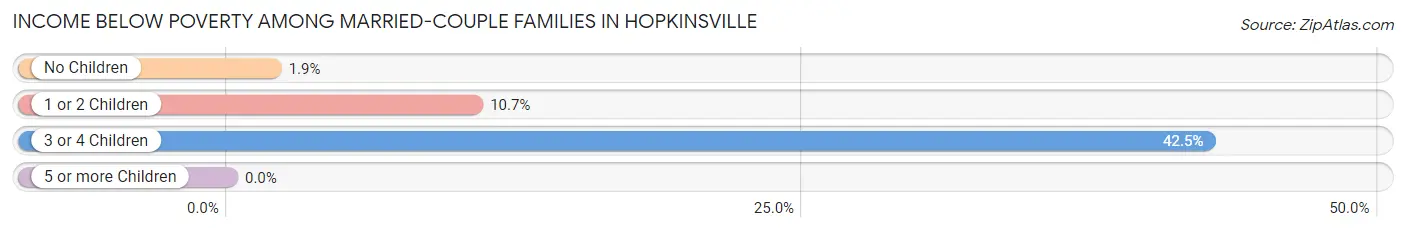
| Children | Above Poverty | Below Poverty |
| No Children | 2,224 (98.1%) | 43 (1.9%) |
| 1 or 2 Children | 1,047 (89.3%) | 125 (10.7%) |
| 3 or 4 Children | 169 (57.5%) | 125 (42.5%) |
| 5 or more Children | 55 (100.0%) | 0 (0.0%) |
| Total | 3,495 (92.3%) | 293 (7.7%) |
Income Below Poverty Among Single-Parent Households in Hopkinsville
According to the poverty data in Hopkinsville, 8.4% or 86 single-father households and 27.6% or 678 single-mother households are living below the poverty line. Among single-father households, those with 1 or 2 children have the highest poverty rate, with 78 households (10.9%) experiencing poverty. Likewise, among single-mother households, those with 3 or 4 children have the highest poverty rate, with 88 households (43.3%) falling below the poverty line.
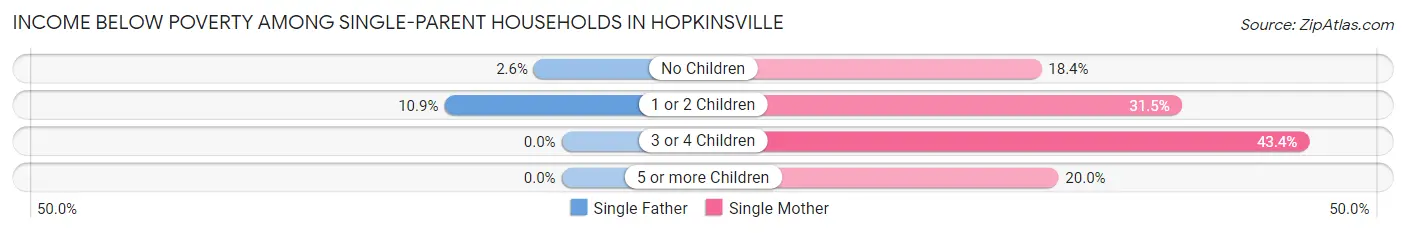
| Children | Single Father | Single Mother |
| No Children | 8 (2.6%) | 158 (18.4%) |
| 1 or 2 Children | 78 (10.9%) | 420 (31.5%) |
| 3 or 4 Children | 0 (0.0%) | 88 (43.3%) |
| 5 or more Children | 0 (0.0%) | 12 (20.0%) |
| Total | 86 (8.4%) | 678 (27.6%) |
Income Below Poverty Among Married-Couple vs Single-Parent Households in Hopkinsville
The poverty data for Hopkinsville shows that 293 of the married-couple family households (7.7%) and 764 of the single-parent households (22.0%) are living below the poverty level. Within the married-couple family households, those with 3 or 4 children have the highest poverty rate, with 125 households (42.5%) falling below the poverty line. Among the single-parent households, those with 3 or 4 children have the highest poverty rate, with 88 household (43.3%) living below poverty.
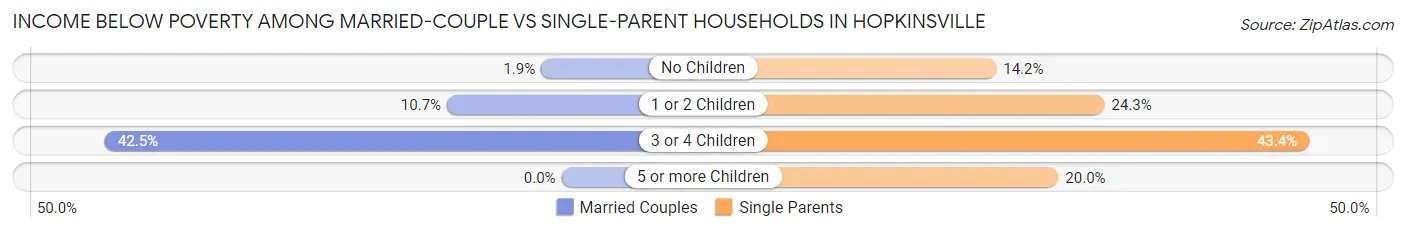
| Children | Married-Couple Families | Single-Parent Households |
| No Children | 43 (1.9%) | 166 (14.2%) |
| 1 or 2 Children | 125 (10.7%) | 498 (24.3%) |
| 3 or 4 Children | 125 (42.5%) | 88 (43.3%) |
| 5 or more Children | 0 (0.0%) | 12 (20.0%) |
| Total | 293 (7.7%) | 764 (22.0%) |
Race in Hopkinsville
The most populous races in Hopkinsville are White / Caucasian (18,792 | 60.5%), Black / African American (8,980 | 28.9%), and Two or more Races (2,156 | 7.0%).
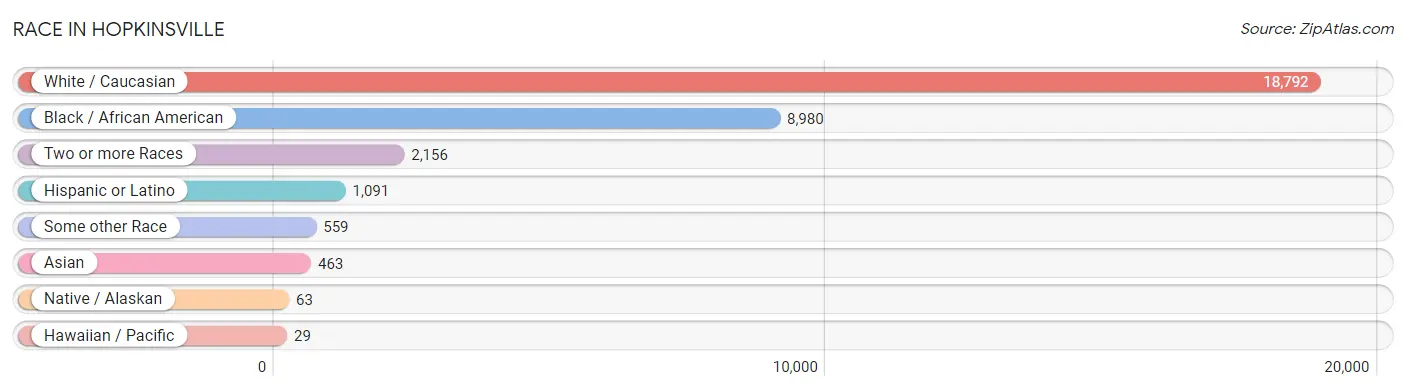
| Race | # Population | % Population |
| Asian | 463 | 1.5% |
| Black / African American | 8,980 | 28.9% |
| Hawaiian / Pacific | 29 | 0.1% |
| Hispanic or Latino | 1,091 | 3.5% |
| Native / Alaskan | 63 | 0.2% |
| White / Caucasian | 18,792 | 60.5% |
| Two or more Races | 2,156 | 7.0% |
| Some other Race | 559 | 1.8% |
| Total | 31,042 | 100.0% |
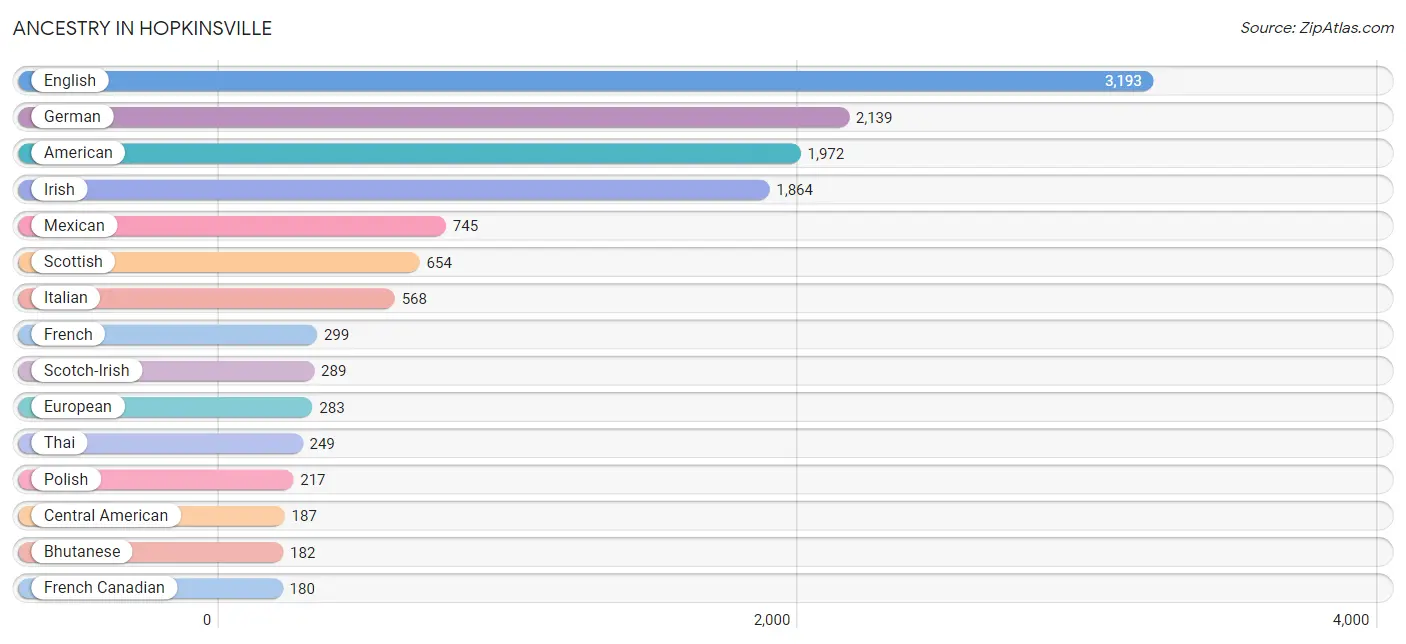
Ancestry in Hopkinsville
The most populous ancestries reported in Hopkinsville are English (3,193 | 10.3%), German (2,139 | 6.9%), American (1,972 | 6.4%), Irish (1,864 | 6.0%), and Mexican (745 | 2.4%), together accounting for 31.9% of all Hopkinsville residents.
| Ancestry | # Population | % Population |
| African | 93 | 0.3% |
| American | 1,972 | 6.4% |
| Arab | 44 | 0.1% |
| Armenian | 7 | 0.0% |
| Bahamian | 59 | 0.2% |
| Barbadian | 7 | 0.0% |
| Bhutanese | 182 | 0.6% |
| British | 120 | 0.4% |
| British West Indian | 12 | 0.0% |
| Burmese | 43 | 0.1% |
| Cajun | 37 | 0.1% |
| Canadian | 8 | 0.0% |
| Central American | 187 | 0.6% |
| Central American Indian | 13 | 0.0% |
| Cherokee | 107 | 0.3% |
| Choctaw | 10 | 0.0% |
| Cuban | 18 | 0.1% |
| Czech | 49 | 0.2% |
| Danish | 24 | 0.1% |
| Dominican | 39 | 0.1% |
| Dutch | 127 | 0.4% |
| Eastern European | 3 | 0.0% |
| Egyptian | 44 | 0.1% |
| English | 3,193 | 10.3% |
| European | 283 | 0.9% |
| Finnish | 8 | 0.0% |
| French | 299 | 1.0% |
| French Canadian | 180 | 0.6% |
| German | 2,139 | 6.9% |
| Greek | 25 | 0.1% |
| Haitian | 94 | 0.3% |
| Honduran | 17 | 0.1% |
| Irish | 1,864 | 6.0% |
| Israeli | 30 | 0.1% |
| Italian | 568 | 1.8% |
| Jamaican | 54 | 0.2% |
| Korean | 59 | 0.2% |
| Lithuanian | 39 | 0.1% |
| Mexican | 745 | 2.4% |
| Native Hawaiian | 7 | 0.0% |
| Nicaraguan | 37 | 0.1% |
| Nigerian | 22 | 0.1% |
| Norwegian | 112 | 0.4% |
| Pakistani | 1 | 0.0% |
| Polish | 217 | 0.7% |
| Potawatomi | 8 | 0.0% |
| Puerto Rican | 94 | 0.3% |
| Russian | 39 | 0.1% |
| Salvadoran | 133 | 0.4% |
| Scandinavian | 30 | 0.1% |
| Scotch-Irish | 289 | 0.9% |
| Scottish | 654 | 2.1% |
| Senegalese | 21 | 0.1% |
| Sioux | 8 | 0.0% |
| Sri Lankan | 88 | 0.3% |
| Subsaharan African | 136 | 0.4% |
| Swedish | 76 | 0.2% |
| Thai | 249 | 0.8% |
| Welsh | 100 | 0.3% | View All 59 Rows |
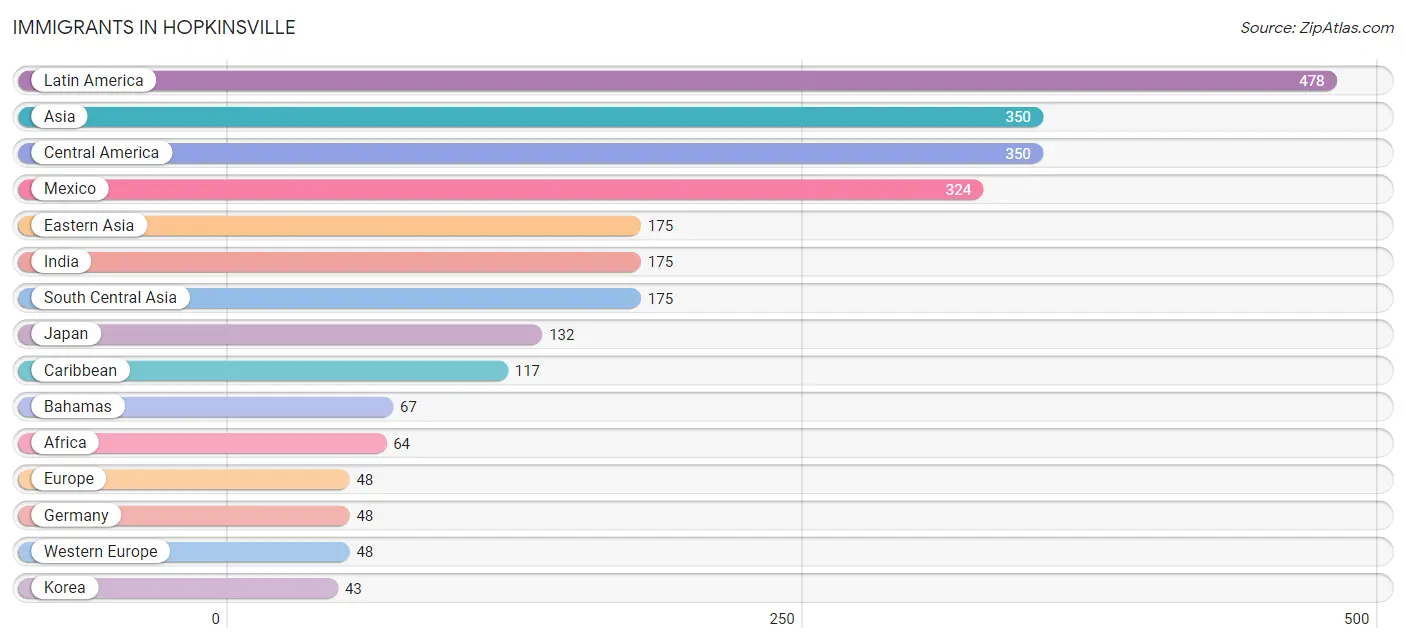
Immigrants in Hopkinsville
The most numerous immigrant groups reported in Hopkinsville came from Latin America (478 | 1.5%), Asia (350 | 1.1%), Central America (350 | 1.1%), Mexico (324 | 1.0%), and Eastern Asia (175 | 0.6%), together accounting for 5.4% of all Hopkinsville residents.
| Immigration Origin | # Population | % Population |
| Africa | 64 | 0.2% |
| Asia | 350 | 1.1% |
| Bahamas | 67 | 0.2% |
| Barbados | 35 | 0.1% |
| Caribbean | 117 | 0.4% |
| Central America | 350 | 1.1% |
| Colombia | 11 | 0.0% |
| Eastern Africa | 28 | 0.1% |
| Eastern Asia | 175 | 0.6% |
| Eritrea | 10 | 0.0% |
| Europe | 48 | 0.2% |
| Germany | 48 | 0.2% |
| India | 175 | 0.6% |
| Jamaica | 8 | 0.0% |
| Japan | 132 | 0.4% |
| Korea | 43 | 0.1% |
| Latin America | 478 | 1.5% |
| Mexico | 324 | 1.0% |
| Nicaragua | 26 | 0.1% |
| South America | 11 | 0.0% |
| South Central Asia | 175 | 0.6% |
| Western Africa | 36 | 0.1% |
| Western Europe | 48 | 0.2% | View All 23 Rows |
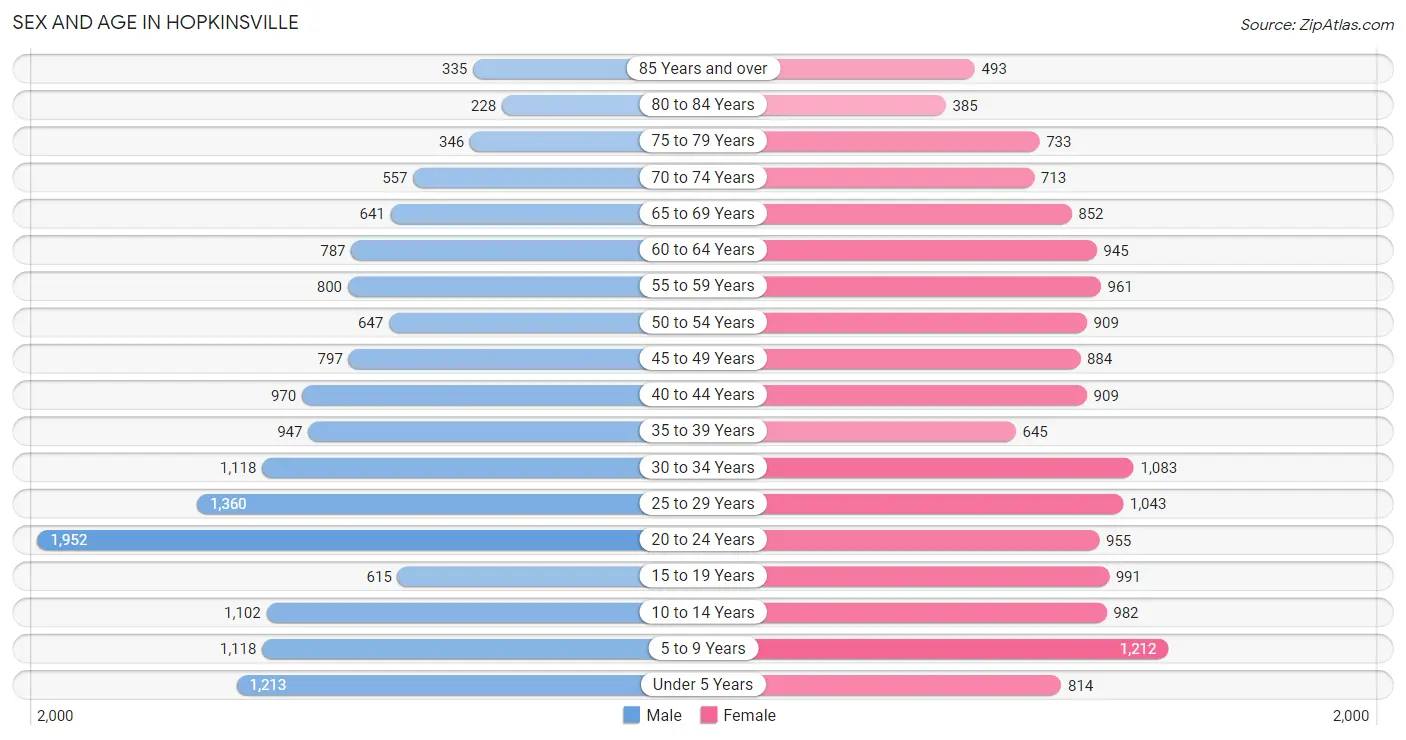
Sex and Age in Hopkinsville
Sex and Age in Hopkinsville
The most populous age groups in Hopkinsville are 20 to 24 Years (1,952 | 12.6%) for men and 5 to 9 Years (1,212 | 7.8%) for women.
| Age Bracket | Male | Female |
| Under 5 Years | 1,213 (7.8%) | 814 (5.2%) |
| 5 to 9 Years | 1,118 (7.2%) | 1,212 (7.8%) |
| 10 to 14 Years | 1,102 (7.1%) | 982 (6.3%) |
| 15 to 19 Years | 615 (4.0%) | 991 (6.4%) |
| 20 to 24 Years | 1,952 (12.6%) | 955 (6.2%) |
| 25 to 29 Years | 1,360 (8.8%) | 1,043 (6.7%) |
| 30 to 34 Years | 1,118 (7.2%) | 1,083 (7.0%) |
| 35 to 39 Years | 947 (6.1%) | 645 (4.2%) |
| 40 to 44 Years | 970 (6.2%) | 909 (5.9%) |
| 45 to 49 Years | 797 (5.1%) | 884 (5.7%) |
| 50 to 54 Years | 647 (4.2%) | 909 (5.9%) |
| 55 to 59 Years | 800 (5.1%) | 961 (6.2%) |
| 60 to 64 Years | 787 (5.1%) | 945 (6.1%) |
| 65 to 69 Years | 641 (4.1%) | 852 (5.5%) |
| 70 to 74 Years | 557 (3.6%) | 713 (4.6%) |
| 75 to 79 Years | 346 (2.2%) | 733 (4.7%) |
| 80 to 84 Years | 228 (1.5%) | 385 (2.5%) |
| 85 Years and over | 335 (2.2%) | 493 (3.2%) |
| Total | 15,533 (100.0%) | 15,509 (100.0%) |
Families and Households in Hopkinsville
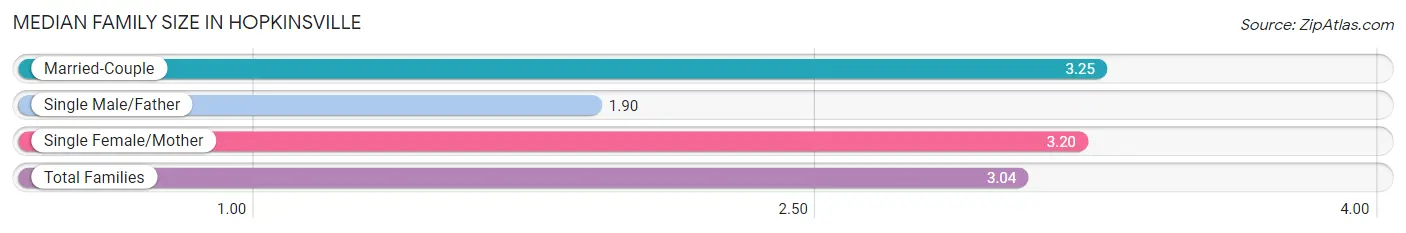
Median Family Size in Hopkinsville
The median family size in Hopkinsville is 3.04 persons per family, with married-couple families (3,788 | 52.1%) accounting for the largest median family size of 3.25 persons per family. On the other hand, single male/father families (1,024 | 14.1%) represent the smallest median family size with 1.90 persons per family.
| Family Type | # Families | Family Size |
| Married-Couple | 3,788 (52.1%) | 3.25 |
| Single Male/Father | 1,024 (14.1%) | 1.90 |
| Single Female/Mother | 2,456 (33.8%) | 3.20 |
| Total Families | 7,268 (100.0%) | 3.04 |
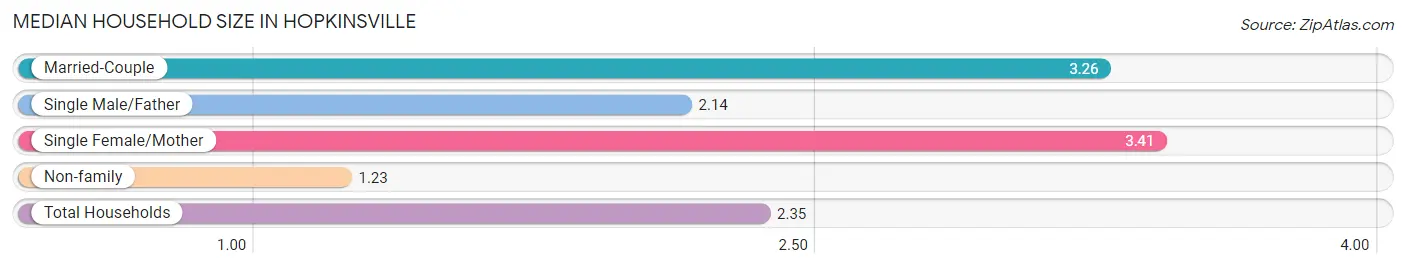
Median Household Size in Hopkinsville
The median household size in Hopkinsville is 2.35 persons per household, with single female/mother households (2,456 | 19.7%) accounting for the largest median household size of 3.41 persons per household. non-family households (5,205 | 41.7%) represent the smallest median household size with 1.23 persons per household.
| Household Type | # Households | Household Size |
| Married-Couple | 3,788 (30.4%) | 3.26 |
| Single Male/Father | 1,024 (8.2%) | 2.14 |
| Single Female/Mother | 2,456 (19.7%) | 3.41 |
| Non-family | 5,205 (41.7%) | 1.23 |
| Total Households | 12,473 (100.0%) | 2.35 |
Household Size by Marriage Status in Hopkinsville
Out of a total of 12,473 households in Hopkinsville, 7,268 (58.3%) are family households, while 5,205 (41.7%) are nonfamily households. The most numerous type of family households are 2-person households, comprising 3,162, and the most common type of nonfamily households are 1-person households, comprising 4,344.
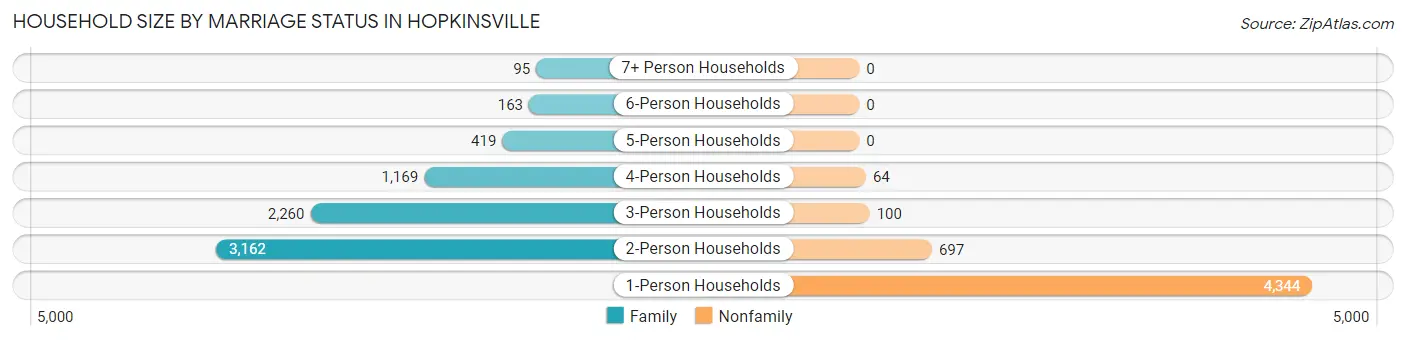
| Household Size | Family Households | Nonfamily Households |
| 1-Person Households | - | 4,344 (34.8%) |
| 2-Person Households | 3,162 (25.4%) | 697 (5.6%) |
| 3-Person Households | 2,260 (18.1%) | 100 (0.8%) |
| 4-Person Households | 1,169 (9.4%) | 64 (0.5%) |
| 5-Person Households | 419 (3.4%) | 0 (0.0%) |
| 6-Person Households | 163 (1.3%) | 0 (0.0%) |
| 7+ Person Households | 95 (0.8%) | 0 (0.0%) |
| Total | 7,268 (58.3%) | 5,205 (41.7%) |
Female Fertility in Hopkinsville
Fertility by Age in Hopkinsville
Average fertility rate in Hopkinsville is 63.0 births per 1,000 women. Women in the age bracket of 20 to 34 years have the highest fertility rate with 124.0 births per 1,000 women. Women in the age bracket of 20 to 34 years acount for 90.8% of all women with births.
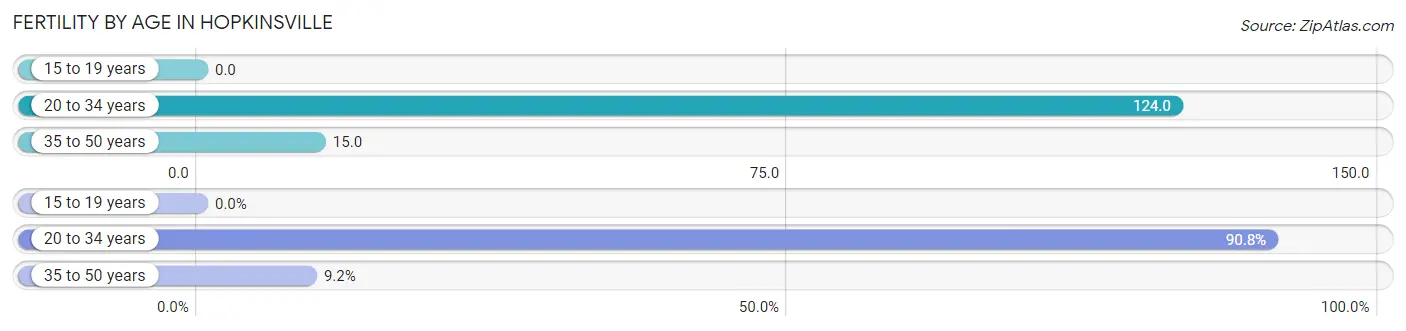
| Age Bracket | Women with Births | Births / 1,000 Women |
| 15 to 19 years | 0 (0.0%) | 0.0 |
| 20 to 34 years | 383 (90.8%) | 124.0 |
| 35 to 50 years | 39 (9.2%) | 15.0 |
| Total | 422 (100.0%) | 63.0 |
Fertility by Age by Marriage Status in Hopkinsville
40.5% of women with births (422) in Hopkinsville are married. The highest percentage of unmarried women with births falls into 35 to 50 years age bracket with 61.5% of them unmarried at the time of birth, while the lowest percentage of unmarried women with births belong to 20 to 34 years age bracket with 59.3% of them unmarried.
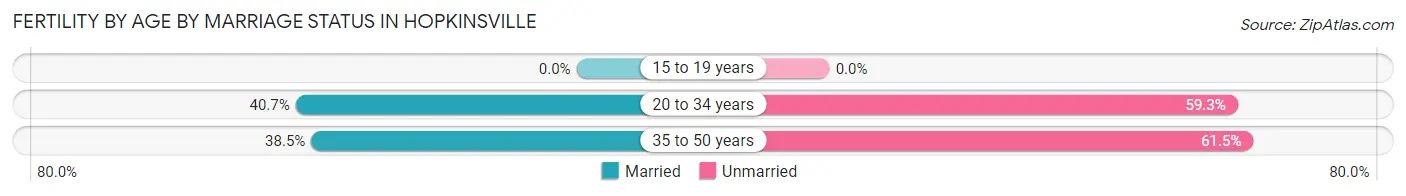
| Age Bracket | Married | Unmarried |
| 15 to 19 years | 0 (0.0%) | 0 (0.0%) |
| 20 to 34 years | 156 (40.7%) | 227 (59.3%) |
| 35 to 50 years | 15 (38.5%) | 24 (61.5%) |
| Total | 171 (40.5%) | 251 (59.5%) |
Fertility by Education in Hopkinsville
Average fertility rate in Hopkinsville is 63.0 births per 1,000 women. Women with the education attainment of college or associate's degree have the highest fertility rate of 84.0 births per 1,000 women, while women with the education attainment of bachelor's degree have the lowest fertility at 17.0 births per 1,000 women. Women with the education attainment of college or associate's degree represent 49.3% of all women with births.
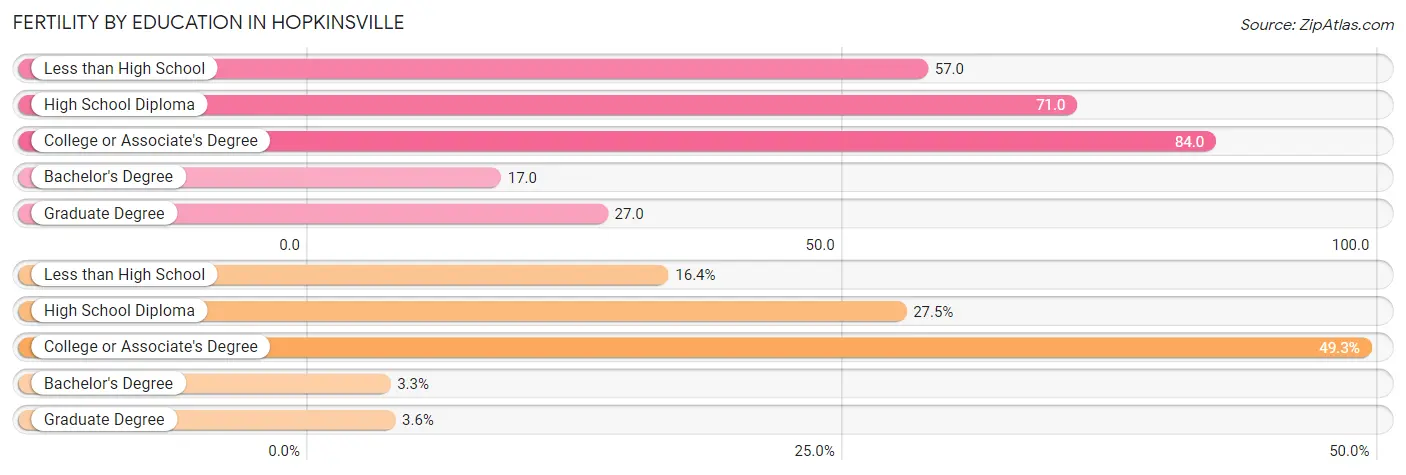
| Educational Attainment | Women with Births | Births / 1,000 Women |
| Less than High School | 69 (16.4%) | 57.0 |
| High School Diploma | 116 (27.5%) | 71.0 |
| College or Associate's Degree | 208 (49.3%) | 84.0 |
| Bachelor's Degree | 14 (3.3%) | 17.0 |
| Graduate Degree | 15 (3.5%) | 27.0 |
| Total | 422 (100.0%) | 63.0 |
Fertility by Education by Marriage Status in Hopkinsville
59.5% of women with births in Hopkinsville are unmarried. Women with the educational attainment of less than high school are most likely to be married with 100.0% of them married at childbirth, while women with the educational attainment of high school diploma are least likely to be married with 100.0% of them unmarried at childbirth.
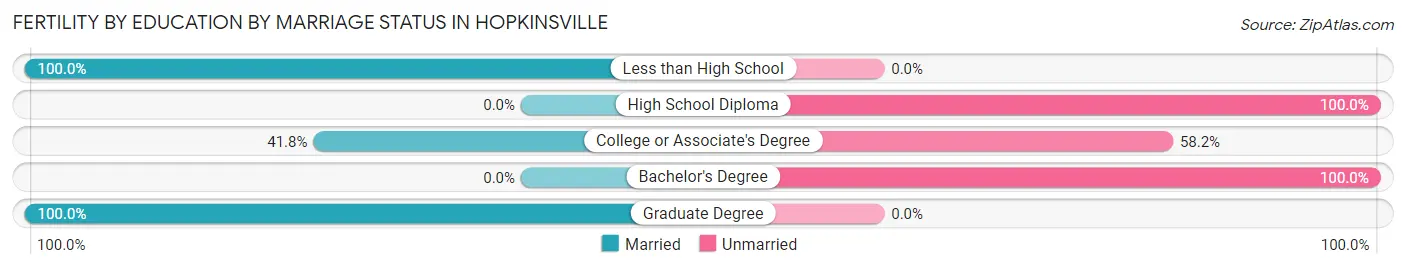
| Educational Attainment | Married | Unmarried |
| Less than High School | 69 (100.0%) | 0 (0.0%) |
| High School Diploma | 0 (0.0%) | 116 (100.0%) |
| College or Associate's Degree | 87 (41.8%) | 121 (58.2%) |
| Bachelor's Degree | 0 (0.0%) | 14 (100.0%) |
| Graduate Degree | 15 (100.0%) | 0 (0.0%) |
| Total | 171 (40.5%) | 251 (59.5%) |
Employment Characteristics in Hopkinsville
Employment by Class of Employer in Hopkinsville
Among the 11,986 employed individuals in Hopkinsville, private company employees (8,182 | 68.3%), local government employees (921 | 7.7%), and not-for-profit organizations (847 | 7.1%) make up the most common classes of employment.
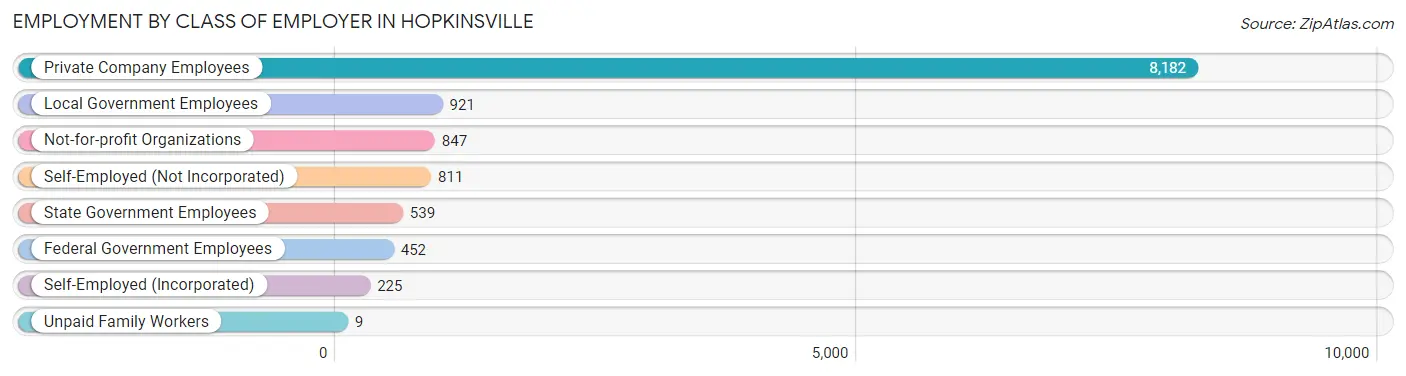
| Employer Class | # Employees | % Employees |
| Private Company Employees | 8,182 | 68.3% |
| Self-Employed (Incorporated) | 225 | 1.9% |
| Self-Employed (Not Incorporated) | 811 | 6.8% |
| Not-for-profit Organizations | 847 | 7.1% |
| Local Government Employees | 921 | 7.7% |
| State Government Employees | 539 | 4.5% |
| Federal Government Employees | 452 | 3.8% |
| Unpaid Family Workers | 9 | 0.1% |
| Total | 11,986 | 100.0% |
Employment Status by Age in Hopkinsville
According to the labor force statistics for Hopkinsville, out of the total population over 16 years of age (24,262), 54.4% or 13,199 individuals are in the labor force, with 7.8% or 1,030 of them unemployed. The age group with the highest labor force participation rate is 20 to 24 years, with 73.8% or 2,145 individuals in the labor force. Within the labor force, the 16 to 19 years age range has the highest percentage of unemployed individuals, with 19.2% or 146 of them being unemployed.
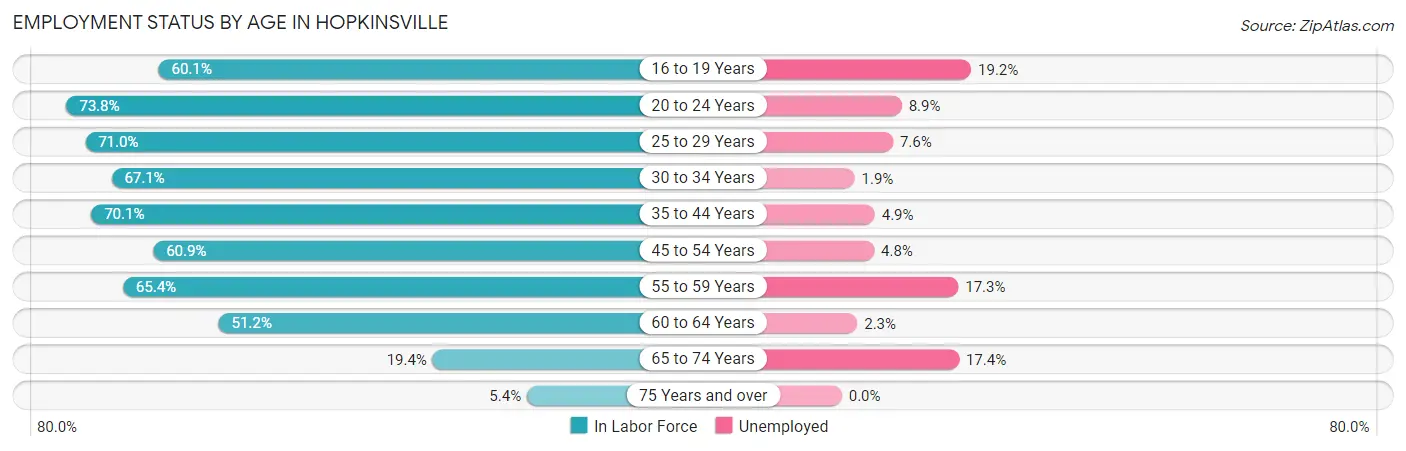
| Age Bracket | In Labor Force | Unemployed |
| 16 to 19 Years | 761 (60.1%) | 146 (19.2%) |
| 20 to 24 Years | 2,145 (73.8%) | 191 (8.9%) |
| 25 to 29 Years | 1,706 (71.0%) | 130 (7.6%) |
| 30 to 34 Years | 1,477 (67.1%) | 28 (1.9%) |
| 35 to 44 Years | 2,433 (70.1%) | 119 (4.9%) |
| 45 to 54 Years | 1,971 (60.9%) | 95 (4.8%) |
| 55 to 59 Years | 1,152 (65.4%) | 199 (17.3%) |
| 60 to 64 Years | 887 (51.2%) | 20 (2.3%) |
| 65 to 74 Years | 536 (19.4%) | 93 (17.4%) |
| 75 Years and over | 136 (5.4%) | 0 (0.0%) |
| Total | 13,199 (54.4%) | 1,030 (7.8%) |
Employment Status by Educational Attainment in Hopkinsville
According to labor force statistics for Hopkinsville, 65.0% of individuals (9,623) out of the total population between 25 and 64 years of age (14,805) are in the labor force, with 6.2% or 597 of them being unemployed. The group with the highest labor force participation rate are those with the educational attainment of bachelor's degree or higher, with 87.0% or 2,593 individuals in the labor force. Within the labor force, individuals with less than high school education have the highest percentage of unemployment, with 12.9% or 104 of them being unemployed.
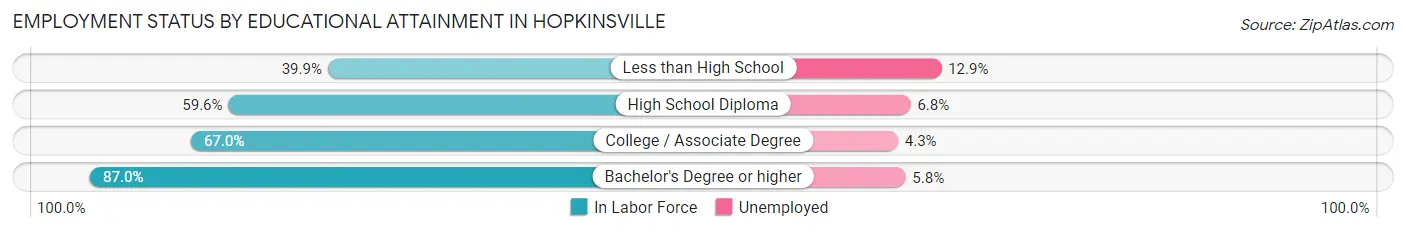
| Educational Attainment | In Labor Force | Unemployed |
| Less than High School | 808 (39.9%) | 261 (12.9%) |
| High School Diploma | 2,768 (59.6%) | 316 (6.8%) |
| College / Associate Degree | 3,455 (67.0%) | 222 (4.3%) |
| Bachelor's Degree or higher | 2,593 (87.0%) | 173 (5.8%) |
| Total | 9,623 (65.0%) | 918 (6.2%) |
Employment Occupations by Sex in Hopkinsville
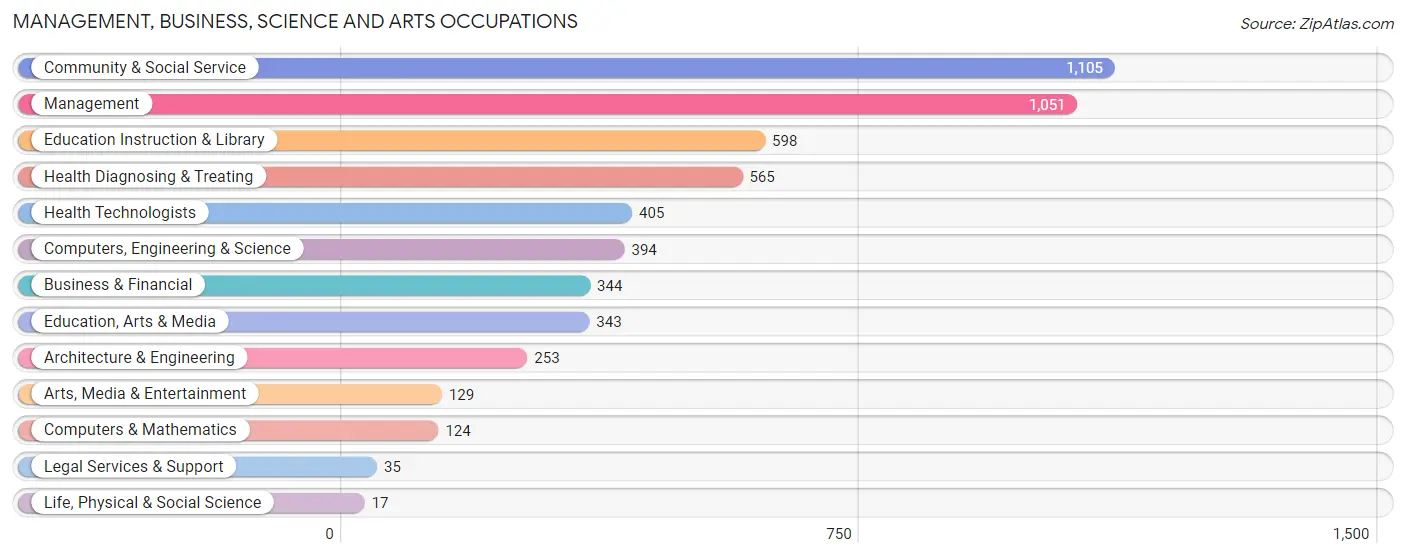
Management, Business, Science and Arts Occupations
The most common Management, Business, Science and Arts occupations in Hopkinsville are Community & Social Service (1,105 | 9.2%), Management (1,051 | 8.7%), Education Instruction & Library (598 | 5.0%), Health Diagnosing & Treating (565 | 4.7%), and Health Technologists (405 | 3.4%).
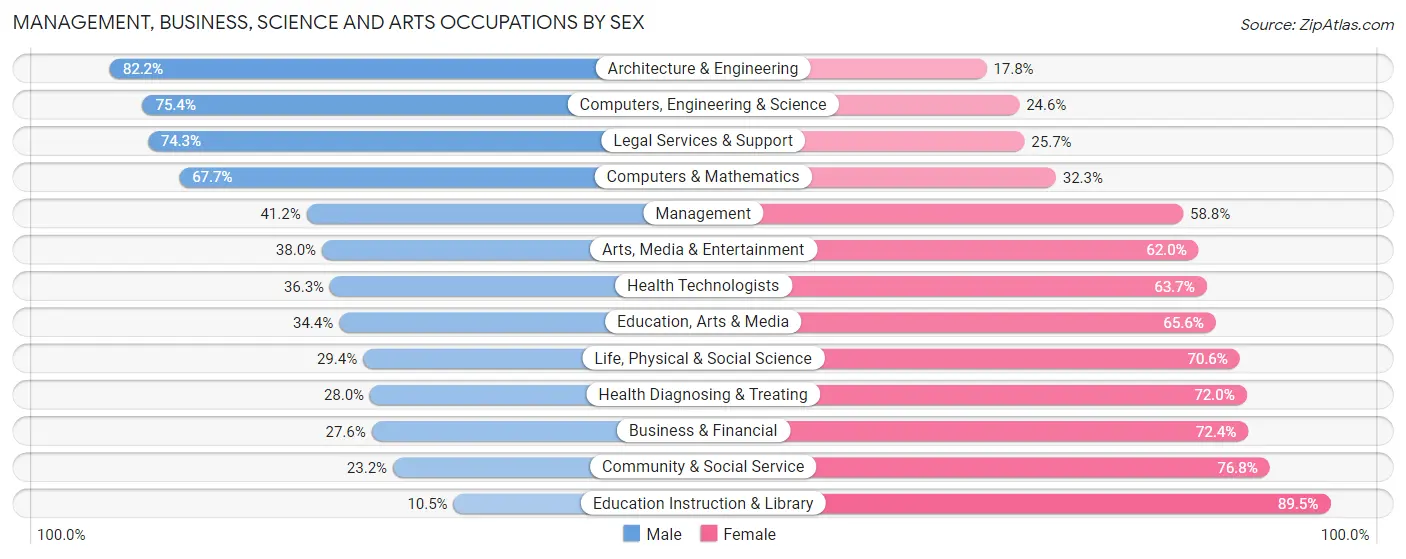
Management, Business, Science and Arts Occupations by Sex
Within the Management, Business, Science and Arts occupations in Hopkinsville, the most male-oriented occupations are Architecture & Engineering (82.2%), Computers, Engineering & Science (75.4%), and Legal Services & Support (74.3%), while the most female-oriented occupations are Education Instruction & Library (89.5%), Community & Social Service (76.8%), and Business & Financial (72.4%).
| Occupation | Male | Female |
| Management | 433 (41.2%) | 618 (58.8%) |
| Business & Financial | 95 (27.6%) | 249 (72.4%) |
| Computers, Engineering & Science | 297 (75.4%) | 97 (24.6%) |
| Computers & Mathematics | 84 (67.7%) | 40 (32.3%) |
| Architecture & Engineering | 208 (82.2%) | 45 (17.8%) |
| Life, Physical & Social Science | 5 (29.4%) | 12 (70.6%) |
| Community & Social Service | 256 (23.2%) | 849 (76.8%) |
| Education, Arts & Media | 118 (34.4%) | 225 (65.6%) |
| Legal Services & Support | 26 (74.3%) | 9 (25.7%) |
| Education Instruction & Library | 63 (10.5%) | 535 (89.5%) |
| Arts, Media & Entertainment | 49 (38.0%) | 80 (62.0%) |
| Health Diagnosing & Treating | 158 (28.0%) | 407 (72.0%) |
| Health Technologists | 147 (36.3%) | 258 (63.7%) |
| Total (Category) | 1,239 (35.8%) | 2,220 (64.2%) |
| Total (Overall) | 6,403 (53.1%) | 5,662 (46.9%) |
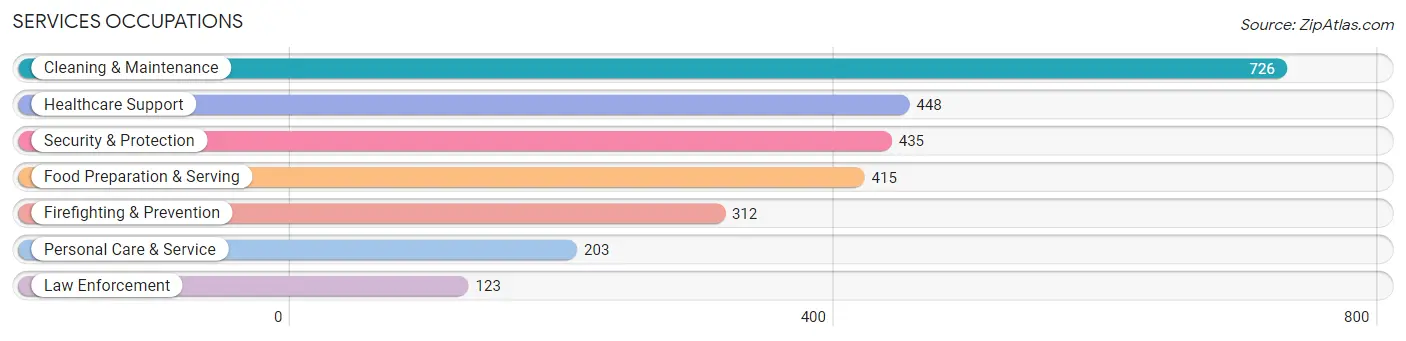
Services Occupations
The most common Services occupations in Hopkinsville are Cleaning & Maintenance (726 | 6.0%), Healthcare Support (448 | 3.7%), Security & Protection (435 | 3.6%), Food Preparation & Serving (415 | 3.4%), and Firefighting & Prevention (312 | 2.6%).
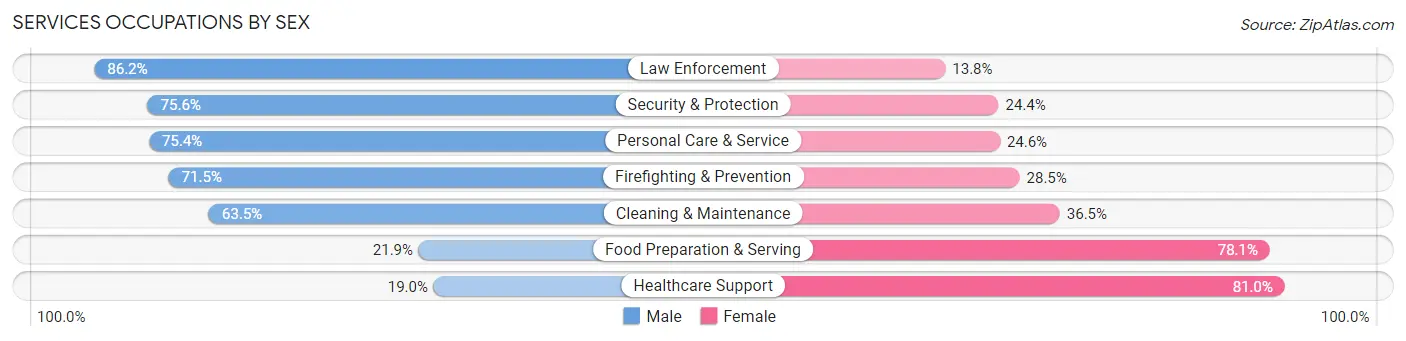
Services Occupations by Sex
Within the Services occupations in Hopkinsville, the most male-oriented occupations are Law Enforcement (86.2%), Security & Protection (75.6%), and Personal Care & Service (75.4%), while the most female-oriented occupations are Healthcare Support (81.0%), Food Preparation & Serving (78.1%), and Cleaning & Maintenance (36.5%).
| Occupation | Male | Female |
| Healthcare Support | 85 (19.0%) | 363 (81.0%) |
| Security & Protection | 329 (75.6%) | 106 (24.4%) |
| Firefighting & Prevention | 223 (71.5%) | 89 (28.5%) |
| Law Enforcement | 106 (86.2%) | 17 (13.8%) |
| Food Preparation & Serving | 91 (21.9%) | 324 (78.1%) |
| Cleaning & Maintenance | 461 (63.5%) | 265 (36.5%) |
| Personal Care & Service | 153 (75.4%) | 50 (24.6%) |
| Total (Category) | 1,119 (50.2%) | 1,108 (49.7%) |
| Total (Overall) | 6,403 (53.1%) | 5,662 (46.9%) |
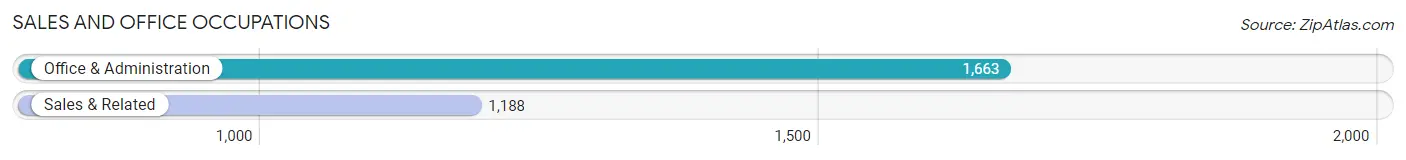
Sales and Office Occupations
The most common Sales and Office occupations in Hopkinsville are Office & Administration (1,663 | 13.8%), and Sales & Related (1,188 | 9.9%).
Sales and Office Occupations by Sex
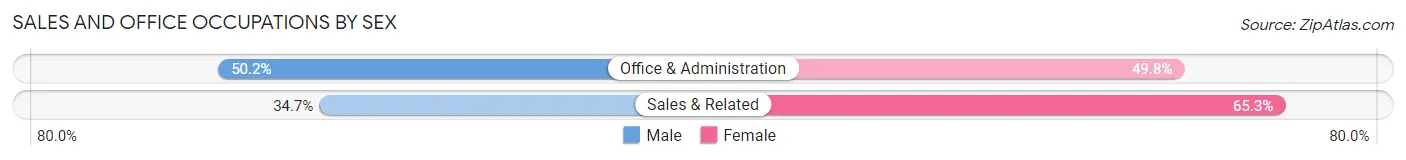
| Occupation | Male | Female |
| Sales & Related | 412 (34.7%) | 776 (65.3%) |
| Office & Administration | 835 (50.2%) | 828 (49.8%) |
| Total (Category) | 1,247 (43.7%) | 1,604 (56.3%) |
| Total (Overall) | 6,403 (53.1%) | 5,662 (46.9%) |
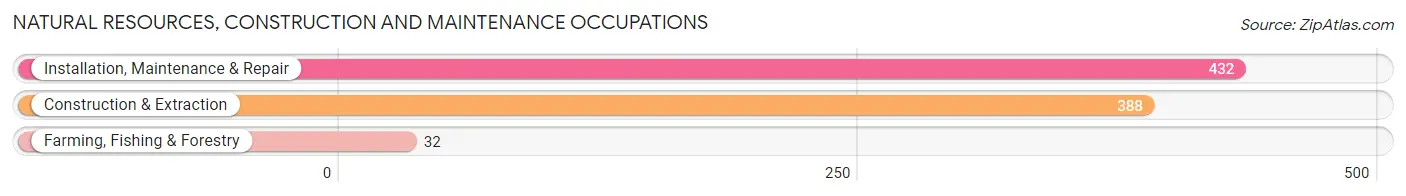
Natural Resources, Construction and Maintenance Occupations
The most common Natural Resources, Construction and Maintenance occupations in Hopkinsville are Installation, Maintenance & Repair (432 | 3.6%), Construction & Extraction (388 | 3.2%), and Farming, Fishing & Forestry (32 | 0.3%).
Natural Resources, Construction and Maintenance Occupations by Sex
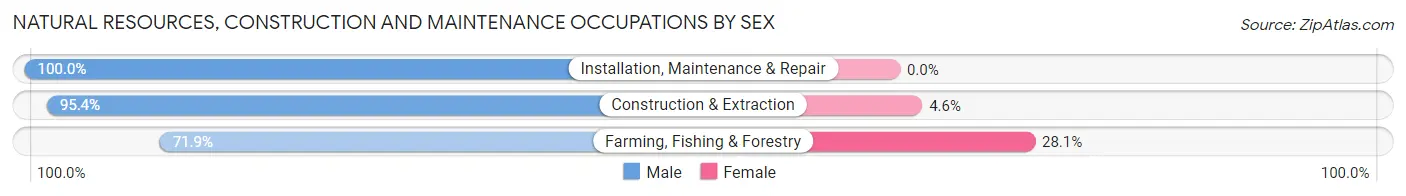
| Occupation | Male | Female |
| Farming, Fishing & Forestry | 23 (71.9%) | 9 (28.1%) |
| Construction & Extraction | 370 (95.4%) | 18 (4.6%) |
| Installation, Maintenance & Repair | 432 (100.0%) | 0 (0.0%) |
| Total (Category) | 825 (96.8%) | 27 (3.2%) |
| Total (Overall) | 6,403 (53.1%) | 5,662 (46.9%) |
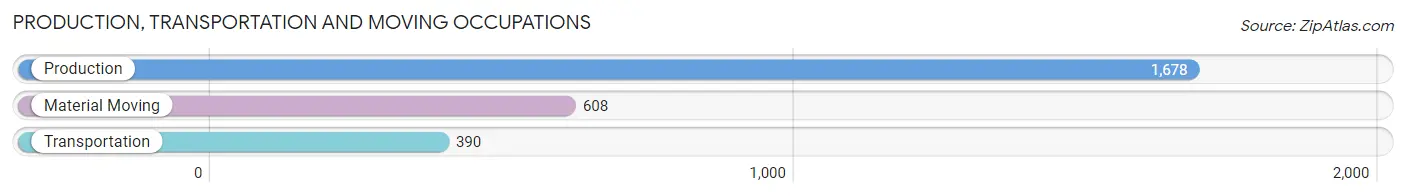
Production, Transportation and Moving Occupations
The most common Production, Transportation and Moving occupations in Hopkinsville are Production (1,678 | 13.9%), Material Moving (608 | 5.0%), and Transportation (390 | 3.2%).
Production, Transportation and Moving Occupations by Sex
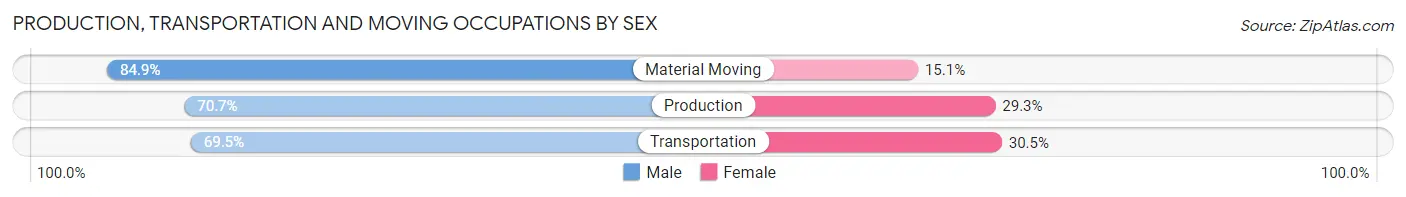
| Occupation | Male | Female |
| Production | 1,186 (70.7%) | 492 (29.3%) |
| Transportation | 271 (69.5%) | 119 (30.5%) |
| Material Moving | 516 (84.9%) | 92 (15.1%) |
| Total (Category) | 1,973 (73.7%) | 703 (26.3%) |
| Total (Overall) | 6,403 (53.1%) | 5,662 (46.9%) |
Employment Industries by Sex in Hopkinsville
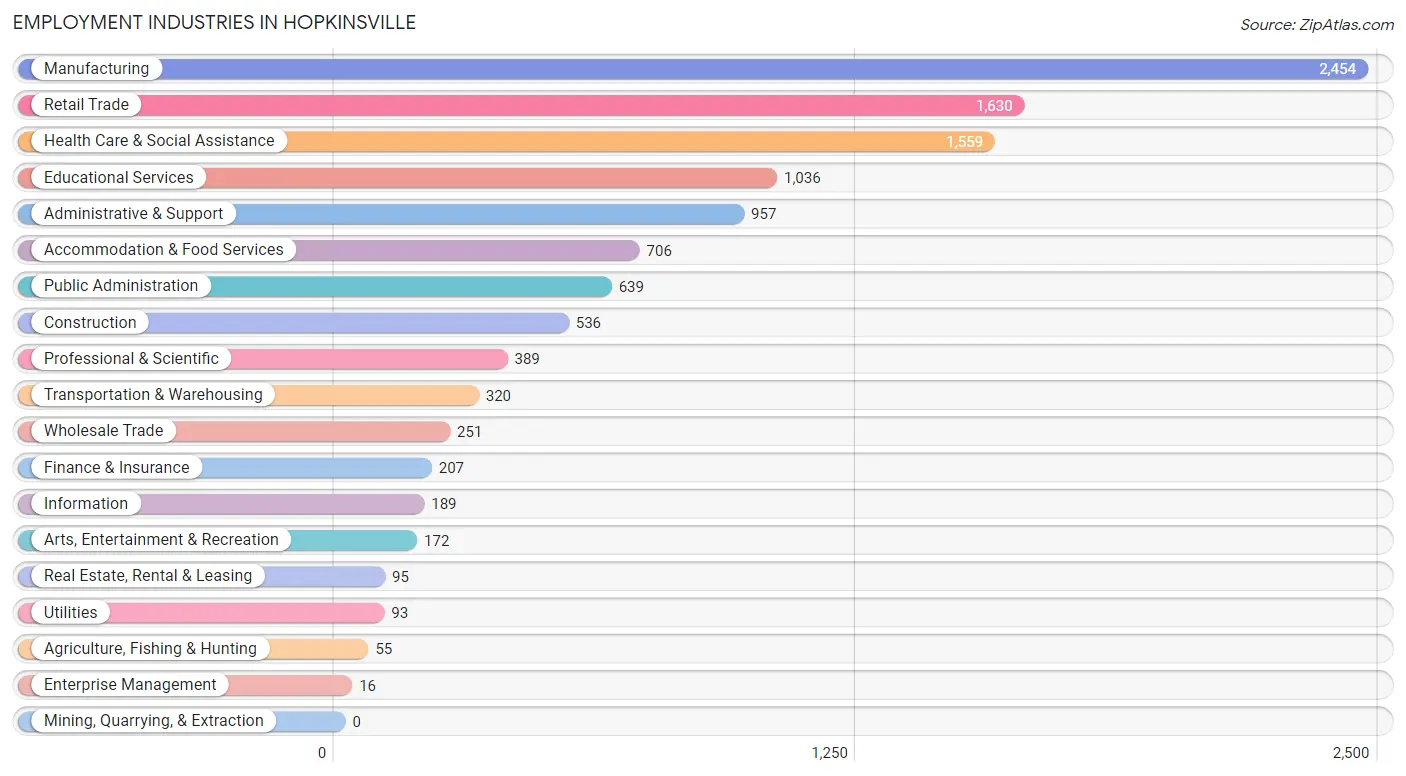
Employment Industries in Hopkinsville
The major employment industries in Hopkinsville include Manufacturing (2,454 | 20.3%), Retail Trade (1,630 | 13.5%), Health Care & Social Assistance (1,559 | 12.9%), Educational Services (1,036 | 8.6%), and Administrative & Support (957 | 7.9%).
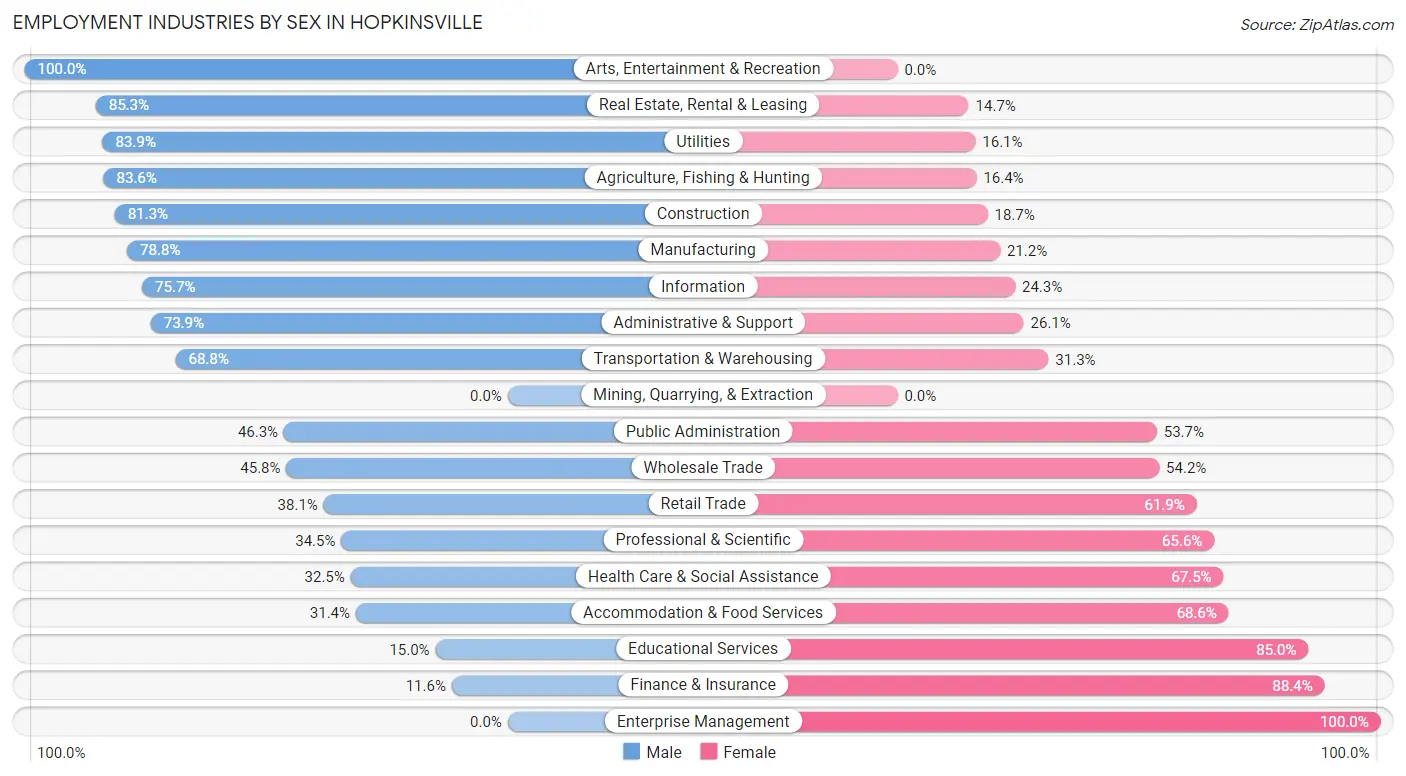
Employment Industries by Sex in Hopkinsville
The Hopkinsville industries that see more men than women are Arts, Entertainment & Recreation (100.0%), Real Estate, Rental & Leasing (85.3%), and Utilities (83.9%), whereas the industries that tend to have a higher number of women are Enterprise Management (100.0%), Finance & Insurance (88.4%), and Educational Services (85.0%).
| Industry | Male | Female |
| Agriculture, Fishing & Hunting | 46 (83.6%) | 9 (16.4%) |
| Mining, Quarrying, & Extraction | 0 (0.0%) | 0 (0.0%) |
| Construction | 436 (81.3%) | 100 (18.7%) |
| Manufacturing | 1,933 (78.8%) | 521 (21.2%) |
| Wholesale Trade | 115 (45.8%) | 136 (54.2%) |
| Retail Trade | 621 (38.1%) | 1,009 (61.9%) |
| Transportation & Warehousing | 220 (68.8%) | 100 (31.2%) |
| Utilities | 78 (83.9%) | 15 (16.1%) |
| Information | 143 (75.7%) | 46 (24.3%) |
| Finance & Insurance | 24 (11.6%) | 183 (88.4%) |
| Real Estate, Rental & Leasing | 81 (85.3%) | 14 (14.7%) |
| Professional & Scientific | 134 (34.4%) | 255 (65.5%) |
| Enterprise Management | 0 (0.0%) | 16 (100.0%) |
| Administrative & Support | 707 (73.9%) | 250 (26.1%) |
| Educational Services | 155 (15.0%) | 881 (85.0%) |
| Health Care & Social Assistance | 507 (32.5%) | 1,052 (67.5%) |
| Arts, Entertainment & Recreation | 172 (100.0%) | 0 (0.0%) |
| Accommodation & Food Services | 222 (31.4%) | 484 (68.6%) |
| Public Administration | 296 (46.3%) | 343 (53.7%) |
| Total | 6,403 (53.1%) | 5,662 (46.9%) |
Education in Hopkinsville
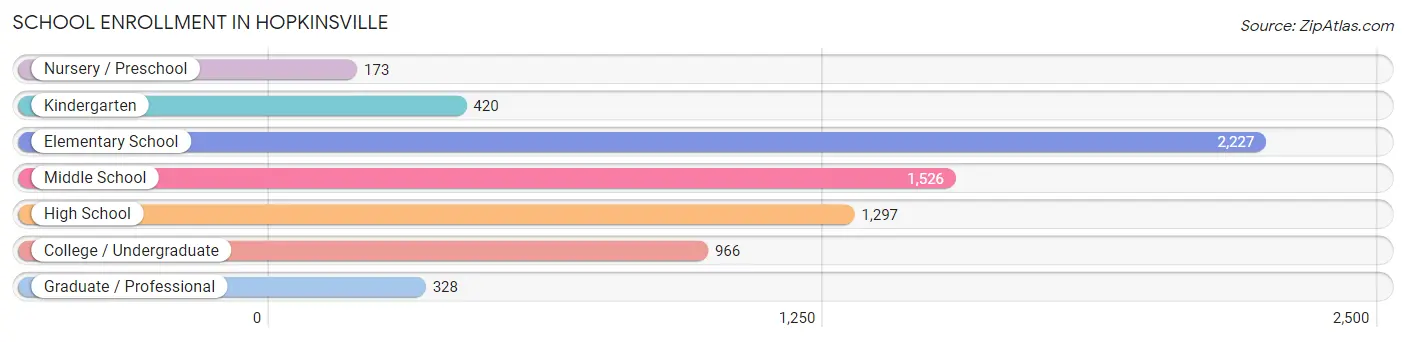
School Enrollment in Hopkinsville
The most common levels of schooling among the 6,937 students in Hopkinsville are elementary school (2,227 | 32.1%), middle school (1,526 | 22.0%), and high school (1,297 | 18.7%).
| School Level | # Students | % Students |
| Nursery / Preschool | 173 | 2.5% |
| Kindergarten | 420 | 6.0% |
| Elementary School | 2,227 | 32.1% |
| Middle School | 1,526 | 22.0% |
| High School | 1,297 | 18.7% |
| College / Undergraduate | 966 | 13.9% |
| Graduate / Professional | 328 | 4.7% |
| Total | 6,937 | 100.0% |
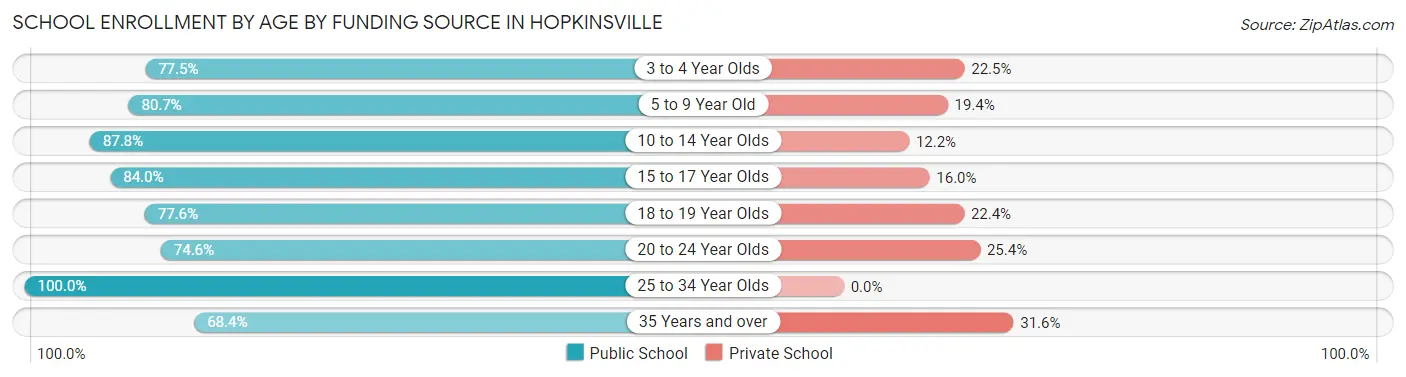
School Enrollment by Age by Funding Source in Hopkinsville
Out of a total of 6,937 students who are enrolled in schools in Hopkinsville, 1,172 (16.9%) attend a private institution, while the remaining 5,765 (83.1%) are enrolled in public schools. The age group of 35 years and over has the highest likelihood of being enrolled in private schools, with 97 (31.6% in the age bracket) enrolled. Conversely, the age group of 25 to 34 year olds has the lowest likelihood of being enrolled in a private school, with 336 (100.0% in the age bracket) attending a public institution.
| Age Bracket | Public School | Private School |
| 3 to 4 Year Olds | 69 (77.5%) | 20 (22.5%) |
| 5 to 9 Year Old | 1,825 (80.6%) | 438 (19.4%) |
| 10 to 14 Year Olds | 1,813 (87.8%) | 251 (12.2%) |
| 15 to 17 Year Olds | 837 (84.0%) | 159 (16.0%) |
| 18 to 19 Year Olds | 388 (77.6%) | 112 (22.4%) |
| 20 to 24 Year Olds | 285 (74.6%) | 97 (25.4%) |
| 25 to 34 Year Olds | 336 (100.0%) | 0 (0.0%) |
| 35 Years and over | 210 (68.4%) | 97 (31.6%) |
| Total | 5,765 (83.1%) | 1,172 (16.9%) |
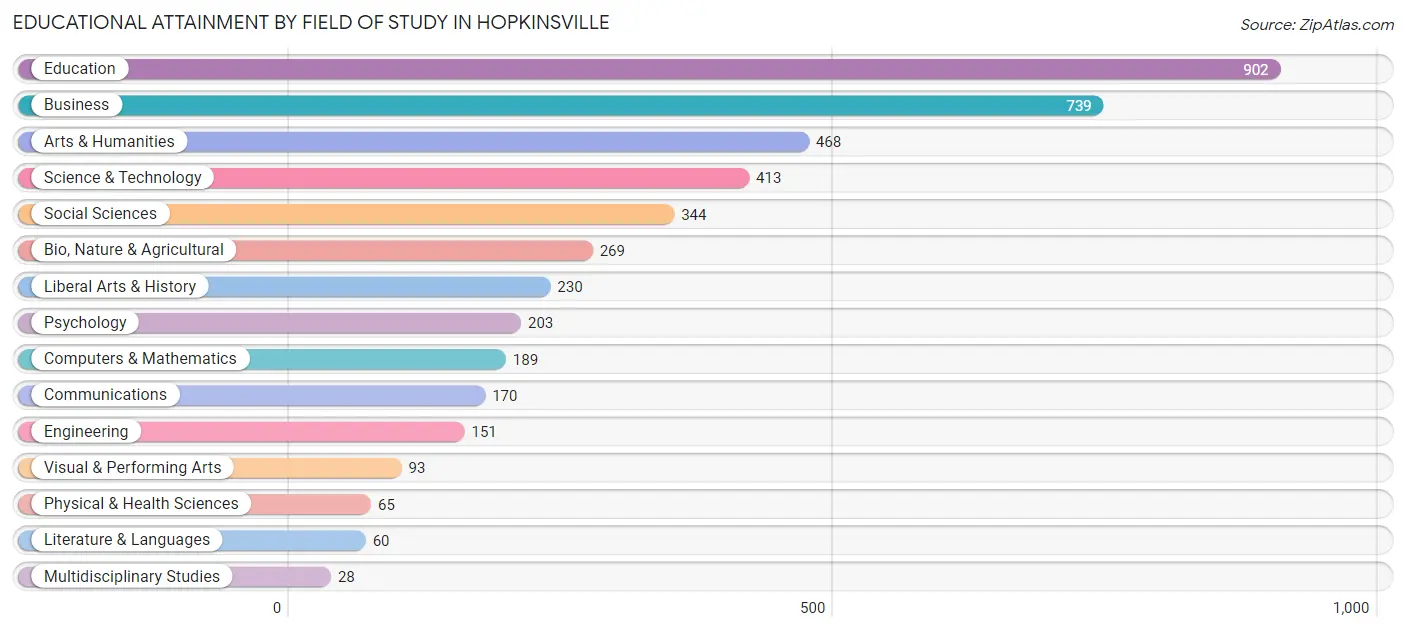
Educational Attainment by Field of Study in Hopkinsville
Education (902 | 20.9%), business (739 | 17.1%), arts & humanities (468 | 10.8%), science & technology (413 | 9.6%), and social sciences (344 | 8.0%) are the most common fields of study among 4,324 individuals in Hopkinsville who have obtained a bachelor's degree or higher.
| Field of Study | # Graduates | % Graduates |
| Computers & Mathematics | 189 | 4.4% |
| Bio, Nature & Agricultural | 269 | 6.2% |
| Physical & Health Sciences | 65 | 1.5% |
| Psychology | 203 | 4.7% |
| Social Sciences | 344 | 8.0% |
| Engineering | 151 | 3.5% |
| Multidisciplinary Studies | 28 | 0.6% |
| Science & Technology | 413 | 9.6% |
| Business | 739 | 17.1% |
| Education | 902 | 20.9% |
| Literature & Languages | 60 | 1.4% |
| Liberal Arts & History | 230 | 5.3% |
| Visual & Performing Arts | 93 | 2.1% |
| Communications | 170 | 3.9% |
| Arts & Humanities | 468 | 10.8% |
| Total | 4,324 | 100.0% |
Transportation & Commute in Hopkinsville
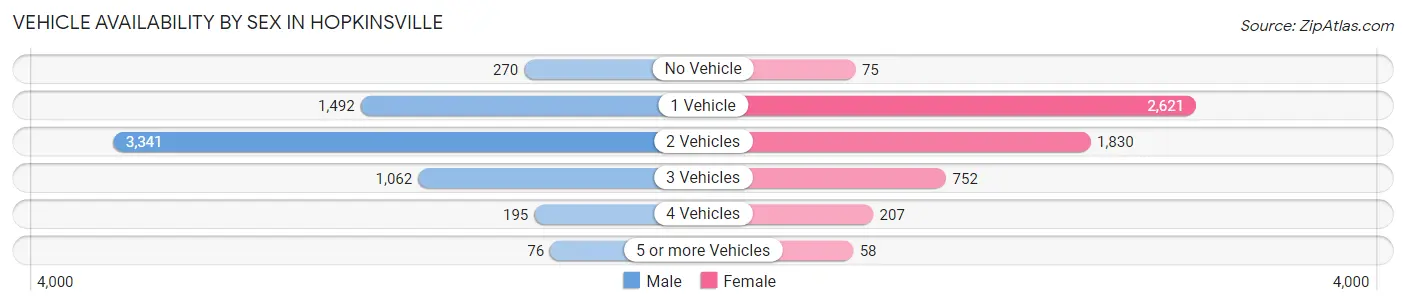
Vehicle Availability by Sex in Hopkinsville
The most prevalent vehicle ownership categories in Hopkinsville are males with 2 vehicles (3,341, accounting for 51.9%) and females with 2 vehicles (1,830, making up 60.3%).
| Vehicles Available | Male | Female |
| No Vehicle | 270 (4.2%) | 75 (1.3%) |
| 1 Vehicle | 1,492 (23.2%) | 2,621 (47.3%) |
| 2 Vehicles | 3,341 (51.9%) | 1,830 (33.0%) |
| 3 Vehicles | 1,062 (16.5%) | 752 (13.6%) |
| 4 Vehicles | 195 (3.0%) | 207 (3.7%) |
| 5 or more Vehicles | 76 (1.2%) | 58 (1.1%) |
| Total | 6,436 (100.0%) | 5,543 (100.0%) |
Commute Time in Hopkinsville
The most frequently occuring commute durations in Hopkinsville are 10 to 14 minutes (3,278 commuters, 28.1%), 15 to 19 minutes (2,275 commuters, 19.5%), and 5 to 9 minutes (1,879 commuters, 16.1%).
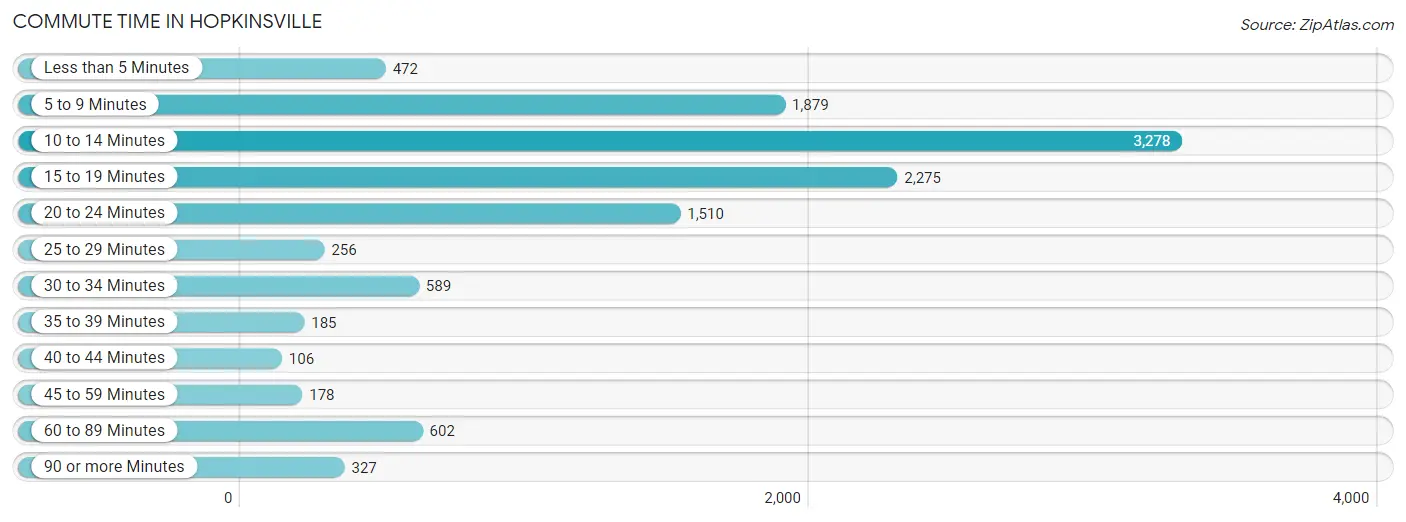
| Commute Time | # Commuters | % Commuters |
| Less than 5 Minutes | 472 | 4.1% |
| 5 to 9 Minutes | 1,879 | 16.1% |
| 10 to 14 Minutes | 3,278 | 28.1% |
| 15 to 19 Minutes | 2,275 | 19.5% |
| 20 to 24 Minutes | 1,510 | 13.0% |
| 25 to 29 Minutes | 256 | 2.2% |
| 30 to 34 Minutes | 589 | 5.1% |
| 35 to 39 Minutes | 185 | 1.6% |
| 40 to 44 Minutes | 106 | 0.9% |
| 45 to 59 Minutes | 178 | 1.5% |
| 60 to 89 Minutes | 602 | 5.2% |
| 90 or more Minutes | 327 | 2.8% |
Commute Time by Sex in Hopkinsville
The most common commute times in Hopkinsville are 10 to 14 minutes (1,856 commuters, 29.5%) for males and 10 to 14 minutes (1,422 commuters, 26.5%) for females.
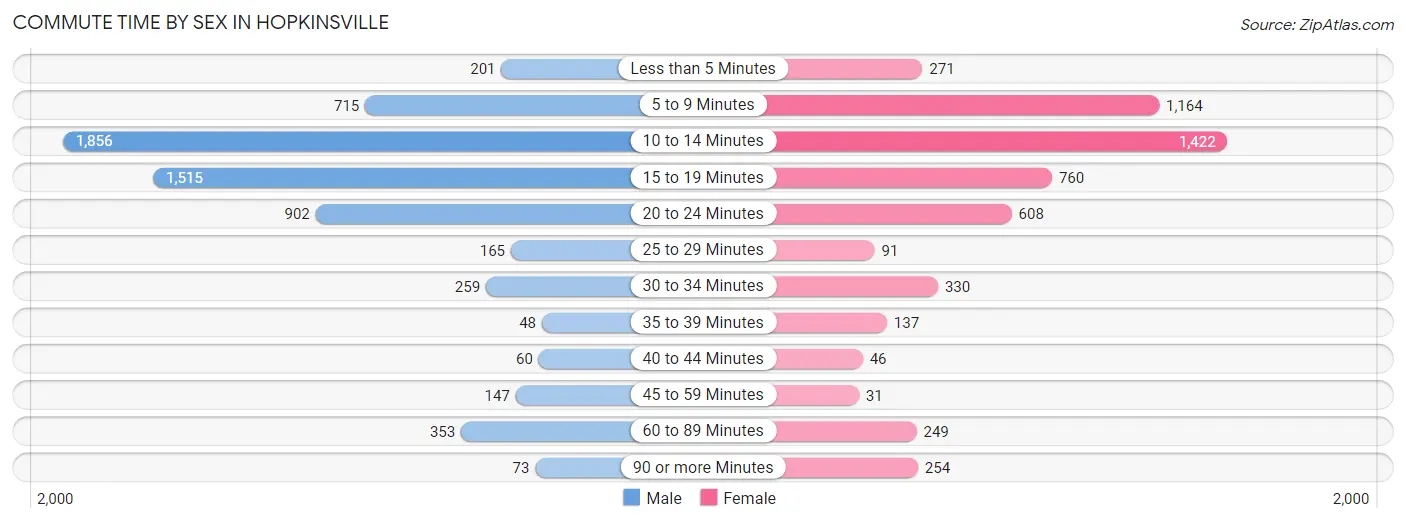
| Commute Time | Male | Female |
| Less than 5 Minutes | 201 (3.2%) | 271 (5.1%) |
| 5 to 9 Minutes | 715 (11.4%) | 1,164 (21.7%) |
| 10 to 14 Minutes | 1,856 (29.5%) | 1,422 (26.5%) |
| 15 to 19 Minutes | 1,515 (24.1%) | 760 (14.2%) |
| 20 to 24 Minutes | 902 (14.3%) | 608 (11.3%) |
| 25 to 29 Minutes | 165 (2.6%) | 91 (1.7%) |
| 30 to 34 Minutes | 259 (4.1%) | 330 (6.1%) |
| 35 to 39 Minutes | 48 (0.8%) | 137 (2.5%) |
| 40 to 44 Minutes | 60 (0.9%) | 46 (0.9%) |
| 45 to 59 Minutes | 147 (2.3%) | 31 (0.6%) |
| 60 to 89 Minutes | 353 (5.6%) | 249 (4.6%) |
| 90 or more Minutes | 73 (1.2%) | 254 (4.7%) |
Time of Departure to Work by Sex in Hopkinsville
The most frequent times of departure to work in Hopkinsville are 8:00 AM to 8:29 AM (1,035, 16.4%) for males and 7:00 AM to 7:29 AM (775, 14.4%) for females.
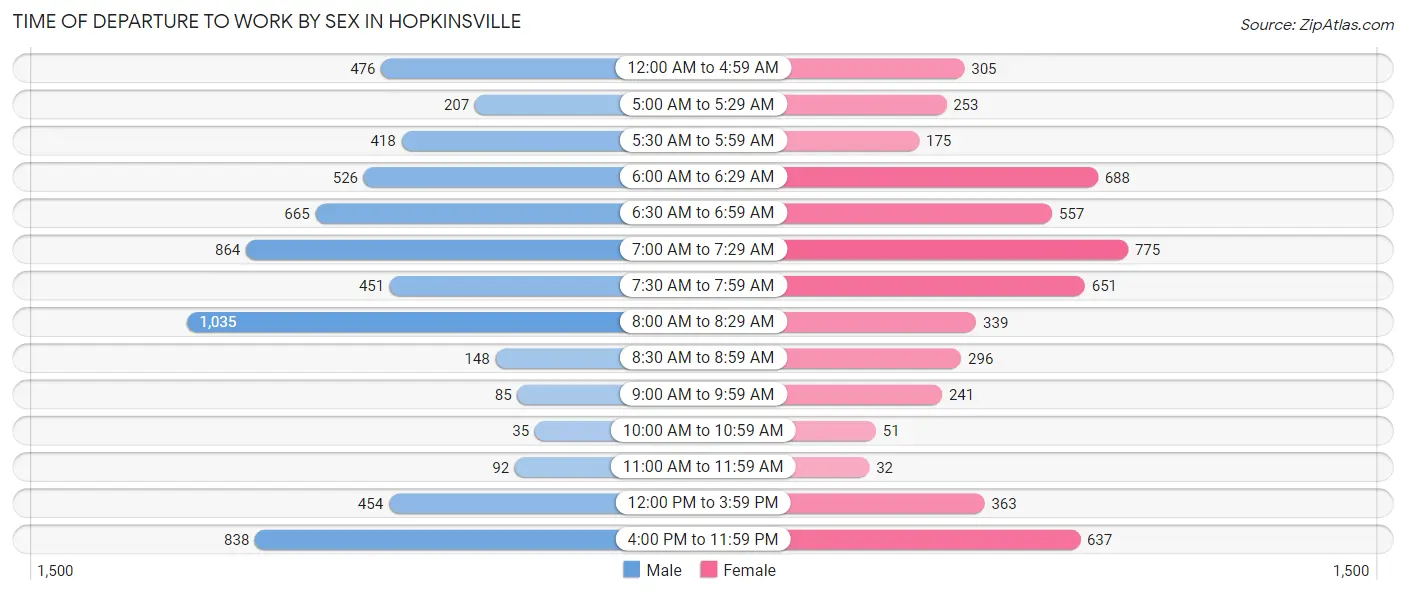
| Time of Departure | Male | Female |
| 12:00 AM to 4:59 AM | 476 (7.6%) | 305 (5.7%) |
| 5:00 AM to 5:29 AM | 207 (3.3%) | 253 (4.7%) |
| 5:30 AM to 5:59 AM | 418 (6.6%) | 175 (3.3%) |
| 6:00 AM to 6:29 AM | 526 (8.4%) | 688 (12.8%) |
| 6:30 AM to 6:59 AM | 665 (10.6%) | 557 (10.4%) |
| 7:00 AM to 7:29 AM | 864 (13.7%) | 775 (14.4%) |
| 7:30 AM to 7:59 AM | 451 (7.2%) | 651 (12.1%) |
| 8:00 AM to 8:29 AM | 1,035 (16.4%) | 339 (6.3%) |
| 8:30 AM to 8:59 AM | 148 (2.4%) | 296 (5.5%) |
| 9:00 AM to 9:59 AM | 85 (1.3%) | 241 (4.5%) |
| 10:00 AM to 10:59 AM | 35 (0.6%) | 51 (0.9%) |
| 11:00 AM to 11:59 AM | 92 (1.5%) | 32 (0.6%) |
| 12:00 PM to 3:59 PM | 454 (7.2%) | 363 (6.8%) |
| 4:00 PM to 11:59 PM | 838 (13.3%) | 637 (11.9%) |
| Total | 6,294 (100.0%) | 5,363 (100.0%) |
Housing Occupancy in Hopkinsville
Occupancy by Ownership in Hopkinsville
Of the total 12,473 dwellings in Hopkinsville, owner-occupied units account for 5,786 (46.4%), while renter-occupied units make up 6,687 (53.6%).
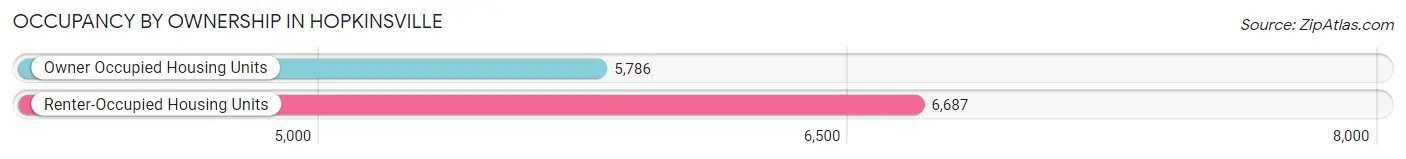
| Occupancy | # Housing Units | % Housing Units |
| Owner Occupied Housing Units | 5,786 | 46.4% |
| Renter-Occupied Housing Units | 6,687 | 53.6% |
| Total Occupied Housing Units | 12,473 | 100.0% |
Occupancy by Household Size in Hopkinsville
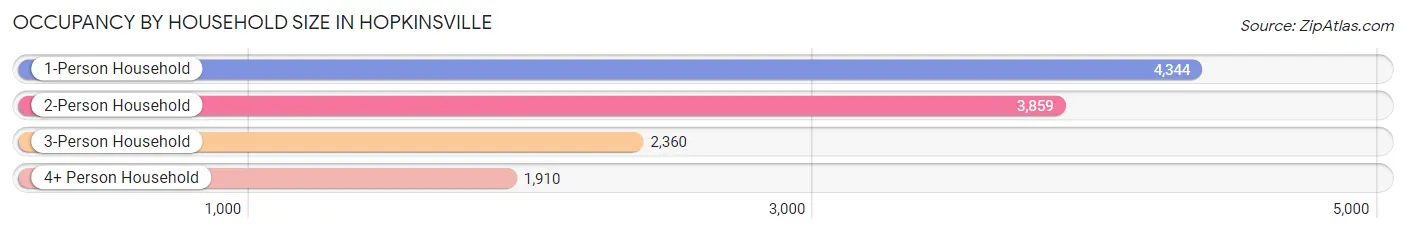
| Household Size | # Housing Units | % Housing Units |
| 1-Person Household | 4,344 | 34.8% |
| 2-Person Household | 3,859 | 30.9% |
| 3-Person Household | 2,360 | 18.9% |
| 4+ Person Household | 1,910 | 15.3% |
| Total Housing Units | 12,473 | 100.0% |
Occupancy by Ownership by Household Size in Hopkinsville
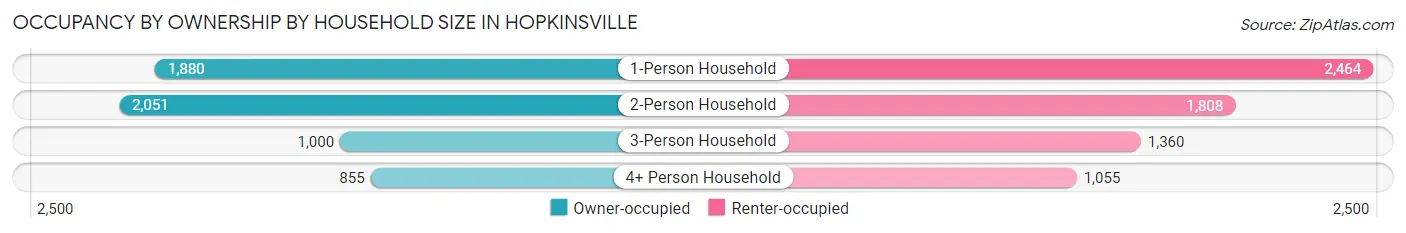
| Household Size | Owner-occupied | Renter-occupied |
| 1-Person Household | 1,880 (43.3%) | 2,464 (56.7%) |
| 2-Person Household | 2,051 (53.1%) | 1,808 (46.9%) |
| 3-Person Household | 1,000 (42.4%) | 1,360 (57.6%) |
| 4+ Person Household | 855 (44.8%) | 1,055 (55.2%) |
| Total Housing Units | 5,786 (46.4%) | 6,687 (53.6%) |
Occupancy by Educational Attainment in Hopkinsville
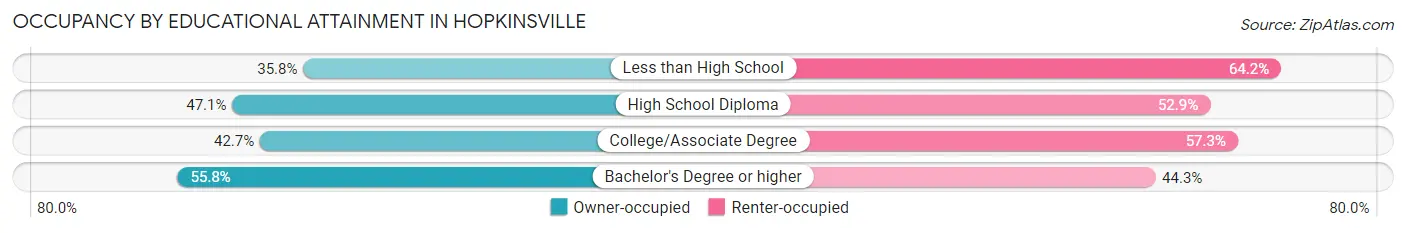
| Household Size | Owner-occupied | Renter-occupied |
| Less than High School | 451 (35.8%) | 809 (64.2%) |
| High School Diploma | 1,697 (47.1%) | 1,909 (52.9%) |
| College/Associate Degree | 1,966 (42.7%) | 2,642 (57.3%) |
| Bachelor's Degree or higher | 1,672 (55.7%) | 1,327 (44.3%) |
Occupancy by Age of Householder in Hopkinsville
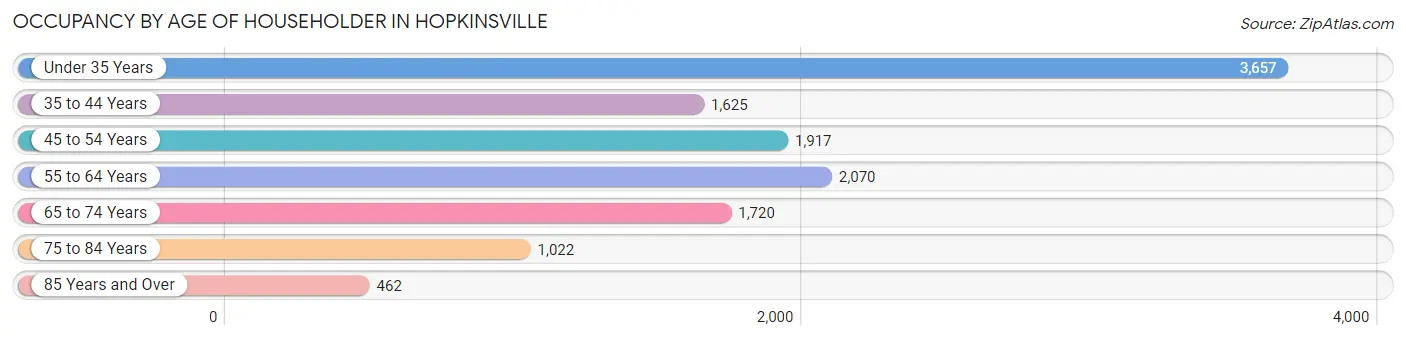
| Age Bracket | # Households | % Households |
| Under 35 Years | 3,657 | 29.3% |
| 35 to 44 Years | 1,625 | 13.0% |
| 45 to 54 Years | 1,917 | 15.4% |
| 55 to 64 Years | 2,070 | 16.6% |
| 65 to 74 Years | 1,720 | 13.8% |
| 75 to 84 Years | 1,022 | 8.2% |
| 85 Years and Over | 462 | 3.7% |
| Total | 12,473 | 100.0% |
Housing Finances in Hopkinsville
Median Income by Occupancy in Hopkinsville
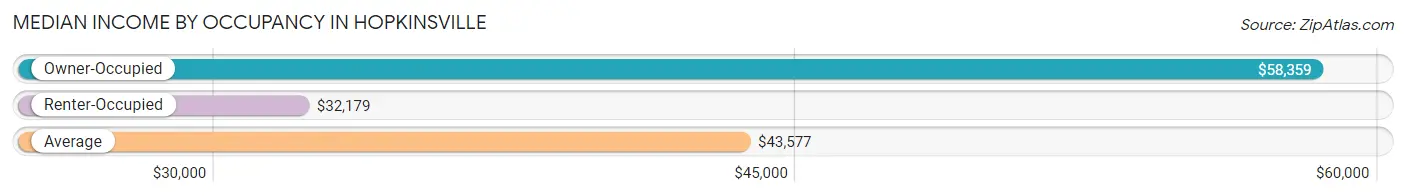
| Occupancy Type | # Households | Median Income |
| Owner-Occupied | 5,786 (46.4%) | $58,359 |
| Renter-Occupied | 6,687 (53.6%) | $32,179 |
| Average | 12,473 (100.0%) | $43,577 |
Occupancy by Householder Income Bracket in Hopkinsville
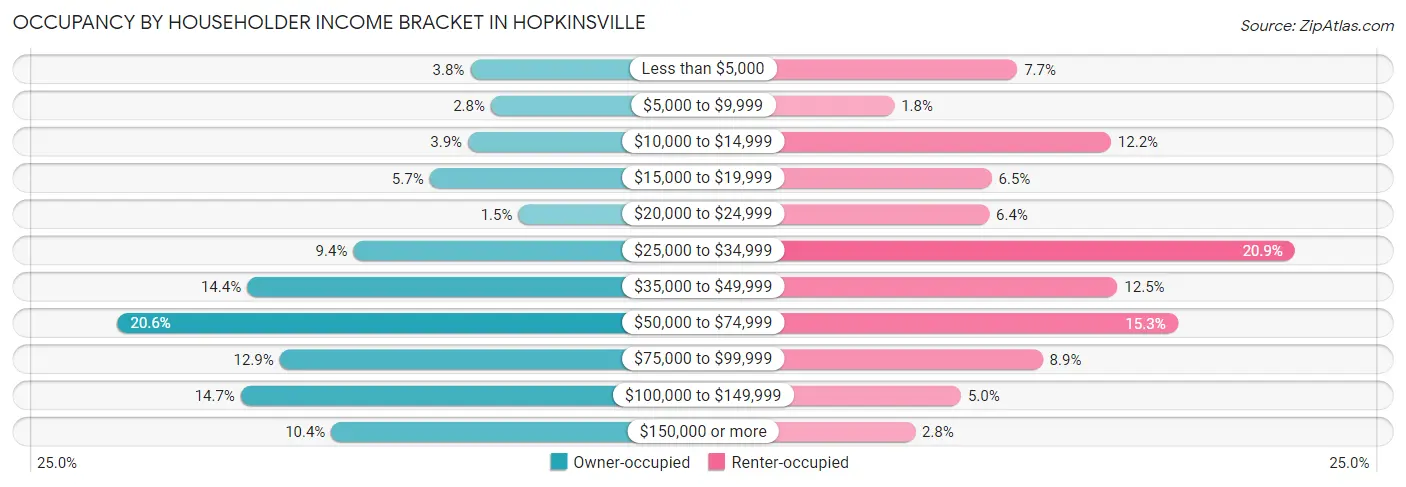
| Income Bracket | Owner-occupied | Renter-occupied |
| Less than $5,000 | 219 (3.8%) | 515 (7.7%) |
| $5,000 to $9,999 | 162 (2.8%) | 123 (1.8%) |
| $10,000 to $14,999 | 225 (3.9%) | 813 (12.2%) |
| $15,000 to $19,999 | 331 (5.7%) | 433 (6.5%) |
| $20,000 to $24,999 | 86 (1.5%) | 425 (6.4%) |
| $25,000 to $34,999 | 541 (9.3%) | 1,398 (20.9%) |
| $35,000 to $49,999 | 834 (14.4%) | 834 (12.5%) |
| $50,000 to $74,999 | 1,191 (20.6%) | 1,025 (15.3%) |
| $75,000 to $99,999 | 744 (12.9%) | 596 (8.9%) |
| $100,000 to $149,999 | 851 (14.7%) | 336 (5.0%) |
| $150,000 or more | 602 (10.4%) | 189 (2.8%) |
| Total | 5,786 (100.0%) | 6,687 (100.0%) |
Monthly Housing Cost Tiers in Hopkinsville
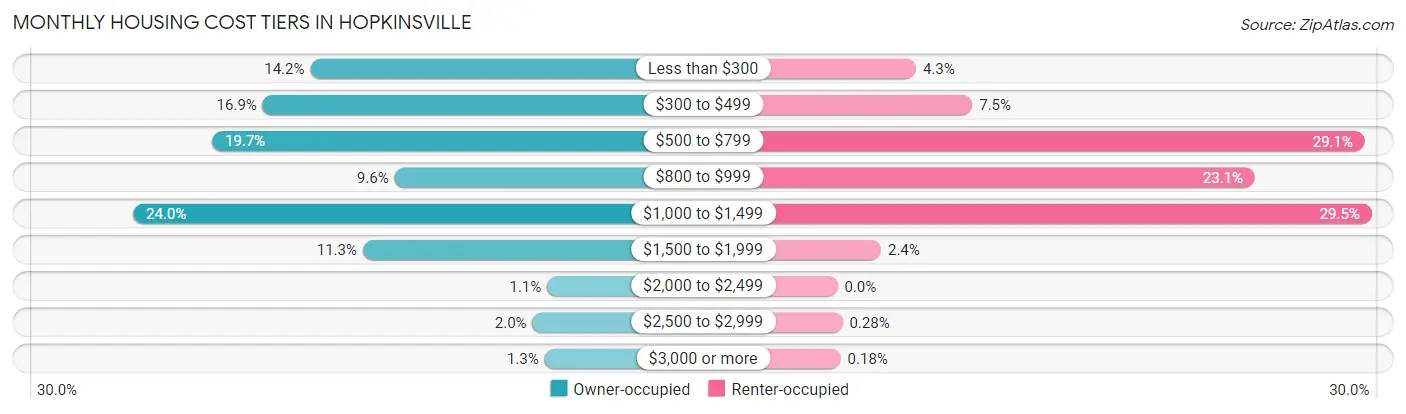
| Monthly Cost | Owner-occupied | Renter-occupied |
| Less than $300 | 823 (14.2%) | 290 (4.3%) |
| $300 to $499 | 975 (16.9%) | 498 (7.4%) |
| $500 to $799 | 1,137 (19.7%) | 1,948 (29.1%) |
| $800 to $999 | 554 (9.6%) | 1,542 (23.1%) |
| $1,000 to $1,499 | 1,389 (24.0%) | 1,973 (29.5%) |
| $1,500 to $1,999 | 655 (11.3%) | 161 (2.4%) |
| $2,000 to $2,499 | 66 (1.1%) | 0 (0.0%) |
| $2,500 to $2,999 | 113 (1.9%) | 19 (0.3%) |
| $3,000 or more | 74 (1.3%) | 12 (0.2%) |
| Total | 5,786 (100.0%) | 6,687 (100.0%) |
Physical Housing Characteristics in Hopkinsville
Housing Structures in Hopkinsville
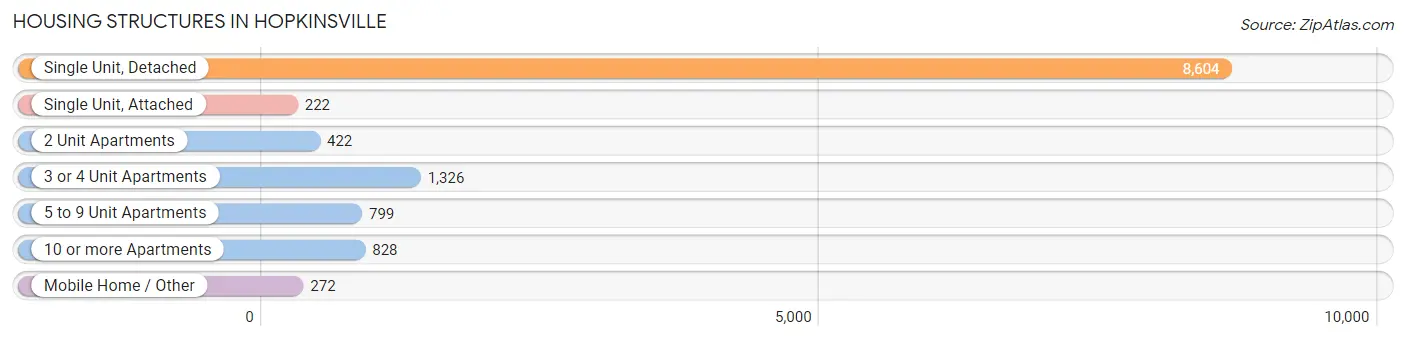
| Structure Type | # Housing Units | % Housing Units |
| Single Unit, Detached | 8,604 | 69.0% |
| Single Unit, Attached | 222 | 1.8% |
| 2 Unit Apartments | 422 | 3.4% |
| 3 or 4 Unit Apartments | 1,326 | 10.6% |
| 5 to 9 Unit Apartments | 799 | 6.4% |
| 10 or more Apartments | 828 | 6.6% |
| Mobile Home / Other | 272 | 2.2% |
| Total | 12,473 | 100.0% |
Housing Structures by Occupancy in Hopkinsville
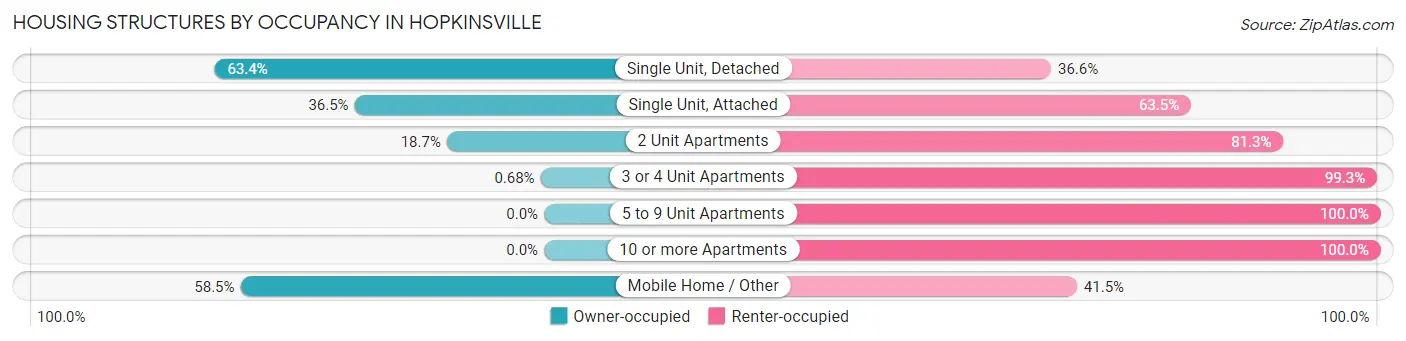
| Structure Type | Owner-occupied | Renter-occupied |
| Single Unit, Detached | 5,458 (63.4%) | 3,146 (36.6%) |
| Single Unit, Attached | 81 (36.5%) | 141 (63.5%) |
| 2 Unit Apartments | 79 (18.7%) | 343 (81.3%) |
| 3 or 4 Unit Apartments | 9 (0.7%) | 1,317 (99.3%) |
| 5 to 9 Unit Apartments | 0 (0.0%) | 799 (100.0%) |
| 10 or more Apartments | 0 (0.0%) | 828 (100.0%) |
| Mobile Home / Other | 159 (58.5%) | 113 (41.5%) |
| Total | 5,786 (46.4%) | 6,687 (53.6%) |
Housing Structures by Number of Rooms in Hopkinsville
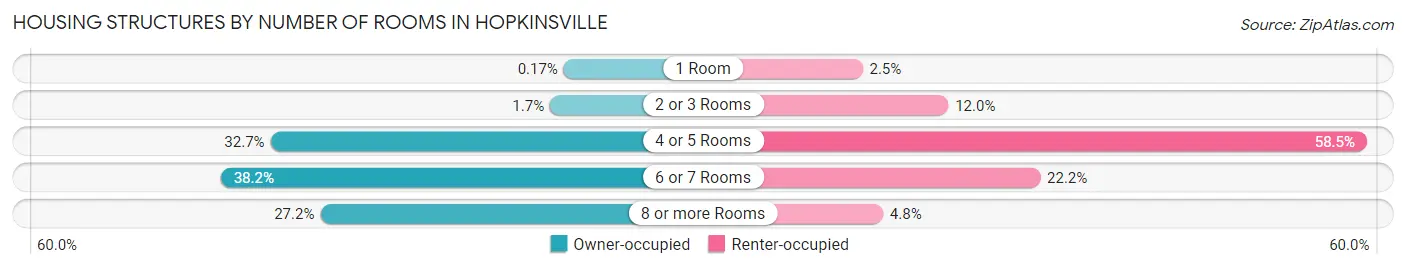
| Number of Rooms | Owner-occupied | Renter-occupied |
| 1 Room | 10 (0.2%) | 168 (2.5%) |
| 2 or 3 Rooms | 98 (1.7%) | 804 (12.0%) |
| 4 or 5 Rooms | 1,893 (32.7%) | 3,910 (58.5%) |
| 6 or 7 Rooms | 2,212 (38.2%) | 1,486 (22.2%) |
| 8 or more Rooms | 1,573 (27.2%) | 319 (4.8%) |
| Total | 5,786 (100.0%) | 6,687 (100.0%) |
Housing Structure by Heating Type in Hopkinsville
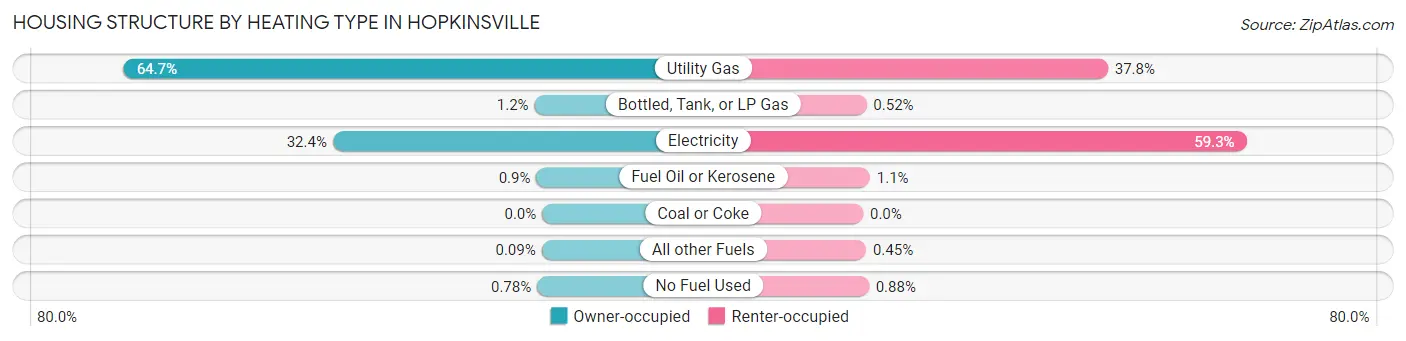
| Heating Type | Owner-occupied | Renter-occupied |
| Utility Gas | 3,742 (64.7%) | 2,530 (37.8%) |
| Bottled, Tank, or LP Gas | 69 (1.2%) | 35 (0.5%) |
| Electricity | 1,873 (32.4%) | 3,963 (59.3%) |
| Fuel Oil or Kerosene | 52 (0.9%) | 70 (1.1%) |
| Coal or Coke | 0 (0.0%) | 0 (0.0%) |
| All other Fuels | 5 (0.1%) | 30 (0.4%) |
| No Fuel Used | 45 (0.8%) | 59 (0.9%) |
| Total | 5,786 (100.0%) | 6,687 (100.0%) |
Household Vehicle Usage in Hopkinsville
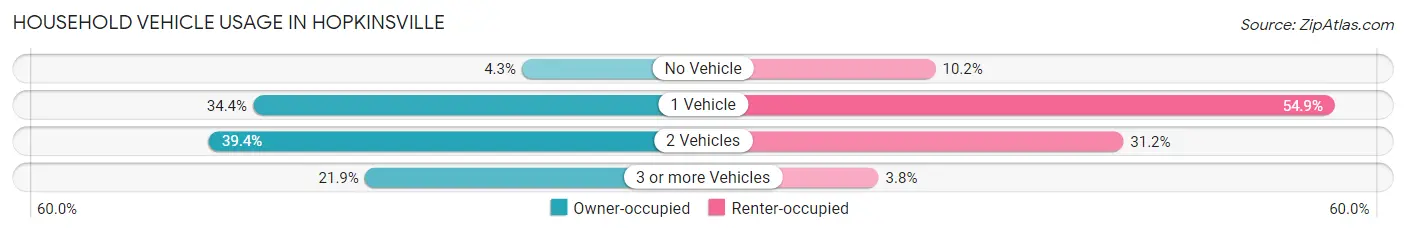
| Vehicles per Household | Owner-occupied | Renter-occupied |
| No Vehicle | 249 (4.3%) | 679 (10.2%) |
| 1 Vehicle | 1,992 (34.4%) | 3,669 (54.9%) |
| 2 Vehicles | 2,277 (39.4%) | 2,086 (31.2%) |
| 3 or more Vehicles | 1,268 (21.9%) | 253 (3.8%) |
| Total | 5,786 (100.0%) | 6,687 (100.0%) |
Real Estate & Mortgages in Hopkinsville
Real Estate and Mortgage Overview in Hopkinsville
| Characteristic | Without Mortgage | With Mortgage |
| Housing Units | 2,575 | 3,211 |
| Median Property Value | $110,500 | $148,500 |
| Median Household Income | $51,404 | $283 |
| Monthly Housing Costs | $392 | $74 |
| Real Estate Taxes | $844 | $213 |
Property Value by Mortgage Status in Hopkinsville
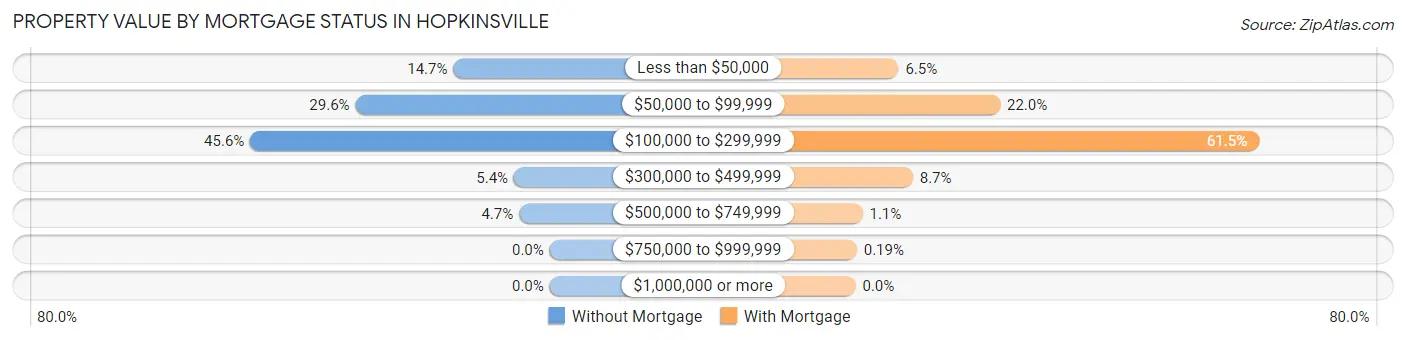
| Property Value | Without Mortgage | With Mortgage |
| Less than $50,000 | 378 (14.7%) | 210 (6.5%) |
| $50,000 to $99,999 | 762 (29.6%) | 707 (22.0%) |
| $100,000 to $299,999 | 1,175 (45.6%) | 1,974 (61.5%) |
| $300,000 to $499,999 | 140 (5.4%) | 280 (8.7%) |
| $500,000 to $749,999 | 120 (4.7%) | 34 (1.1%) |
| $750,000 to $999,999 | 0 (0.0%) | 6 (0.2%) |
| $1,000,000 or more | 0 (0.0%) | 0 (0.0%) |
| Total | 2,575 (100.0%) | 3,211 (100.0%) |
Household Income by Mortgage Status in Hopkinsville
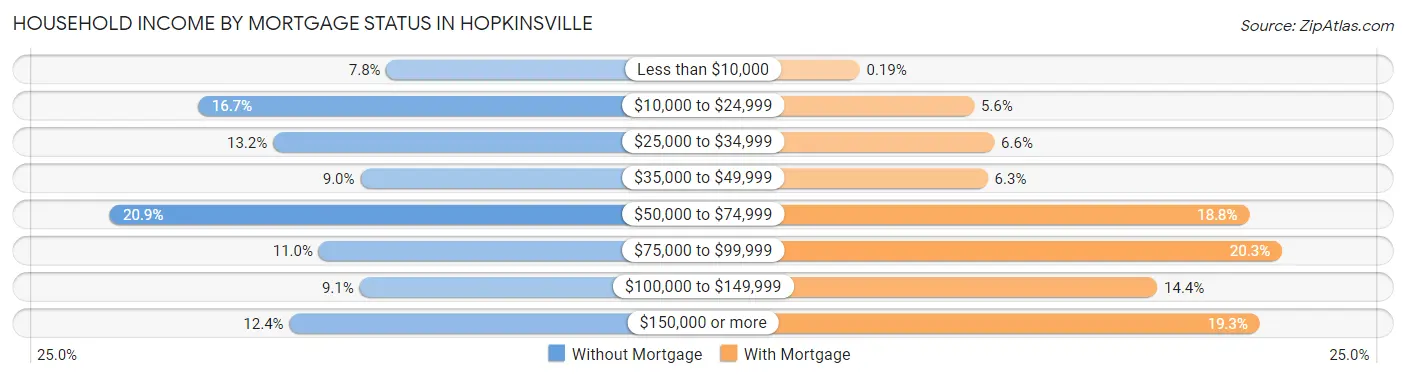
| Household Income | Without Mortgage | With Mortgage |
| Less than $10,000 | 200 (7.8%) | 6 (0.2%) |
| $10,000 to $24,999 | 430 (16.7%) | 181 (5.6%) |
| $25,000 to $34,999 | 339 (13.2%) | 212 (6.6%) |
| $35,000 to $49,999 | 232 (9.0%) | 202 (6.3%) |
| $50,000 to $74,999 | 539 (20.9%) | 602 (18.8%) |
| $75,000 to $99,999 | 283 (11.0%) | 652 (20.3%) |
| $100,000 to $149,999 | 233 (9.0%) | 461 (14.4%) |
| $150,000 or more | 319 (12.4%) | 618 (19.3%) |
| Total | 2,575 (100.0%) | 3,211 (100.0%) |
Property Value to Household Income Ratio in Hopkinsville
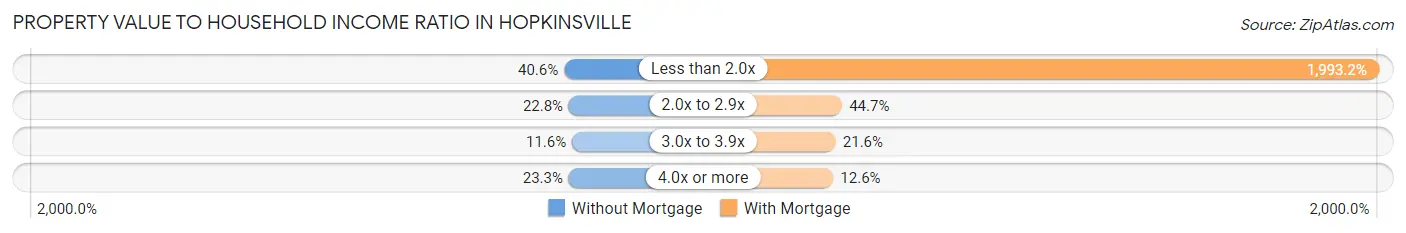
| Value-to-Income Ratio | Without Mortgage | With Mortgage |
| Less than 2.0x | 1,046 (40.6%) | 64,003 (1,993.2%) |
| 2.0x to 2.9x | 588 (22.8%) | 1,434 (44.7%) |
| 3.0x to 3.9x | 299 (11.6%) | 692 (21.5%) |
| 4.0x or more | 599 (23.3%) | 406 (12.6%) |
| Total | 2,575 (100.0%) | 3,211 (100.0%) |
Real Estate Taxes by Mortgage Status in Hopkinsville
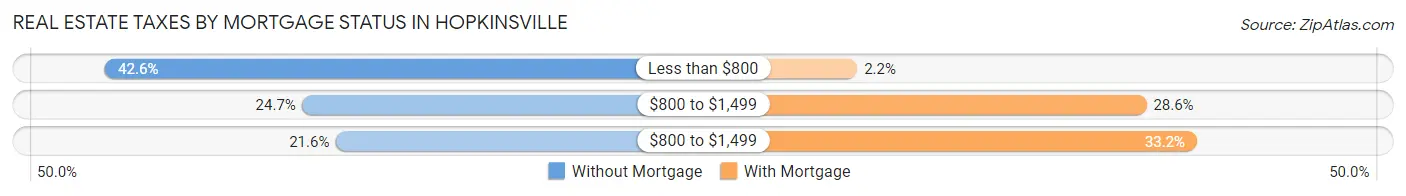
| Property Taxes | Without Mortgage | With Mortgage |
| Less than $800 | 1,098 (42.6%) | 71 (2.2%) |
| $800 to $1,499 | 636 (24.7%) | 919 (28.6%) |
| $800 to $1,499 | 557 (21.6%) | 1,067 (33.2%) |
| Total | 2,575 (100.0%) | 3,211 (100.0%) |
Health & Disability in Hopkinsville
Health Insurance Coverage by Age in Hopkinsville
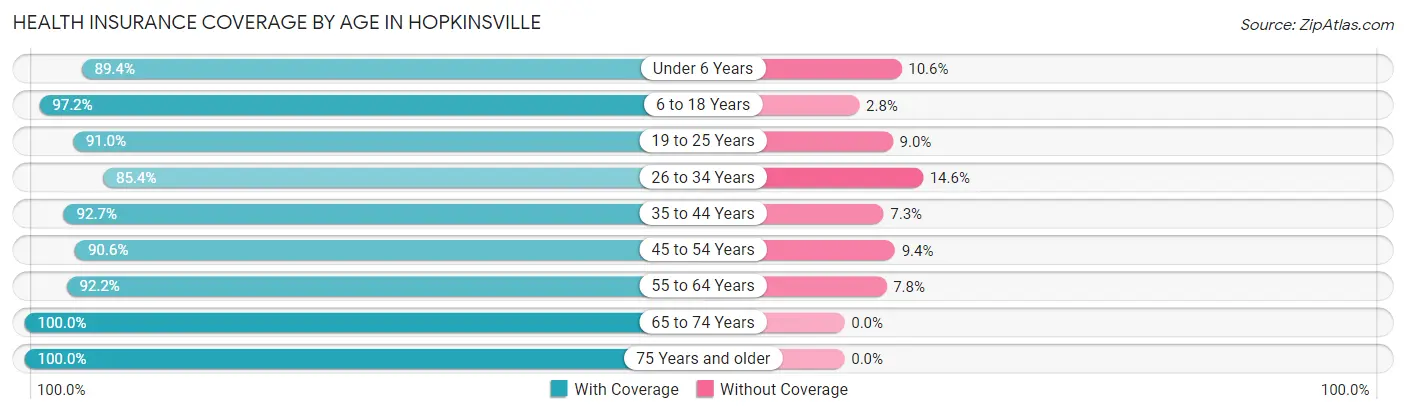
| Age Bracket | With Coverage | Without Coverage |
| Under 6 Years | 2,034 (89.4%) | 242 (10.6%) |
| 6 to 18 Years | 5,258 (97.2%) | 149 (2.8%) |
| 19 to 25 Years | 3,176 (91.0%) | 314 (9.0%) |
| 26 to 34 Years | 3,210 (85.4%) | 550 (14.6%) |
| 35 to 44 Years | 2,801 (92.7%) | 220 (7.3%) |
| 45 to 54 Years | 2,785 (90.6%) | 289 (9.4%) |
| 55 to 64 Years | 3,141 (92.2%) | 266 (7.8%) |
| 65 to 74 Years | 2,711 (100.0%) | 0 (0.0%) |
| 75 Years and older | 2,210 (100.0%) | 0 (0.0%) |
| Total | 27,326 (93.1%) | 2,030 (6.9%) |
Health Insurance Coverage by Citizenship Status in Hopkinsville
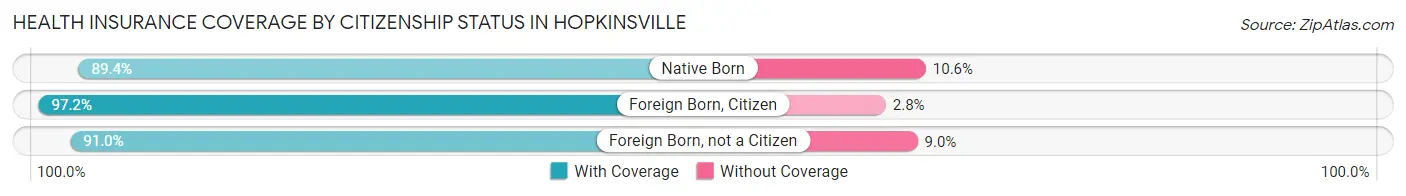
| Citizenship Status | With Coverage | Without Coverage |
| Native Born | 2,034 (89.4%) | 242 (10.6%) |
| Foreign Born, Citizen | 5,258 (97.2%) | 149 (2.8%) |
| Foreign Born, not a Citizen | 3,176 (91.0%) | 314 (9.0%) |
Health Insurance Coverage by Household Income in Hopkinsville
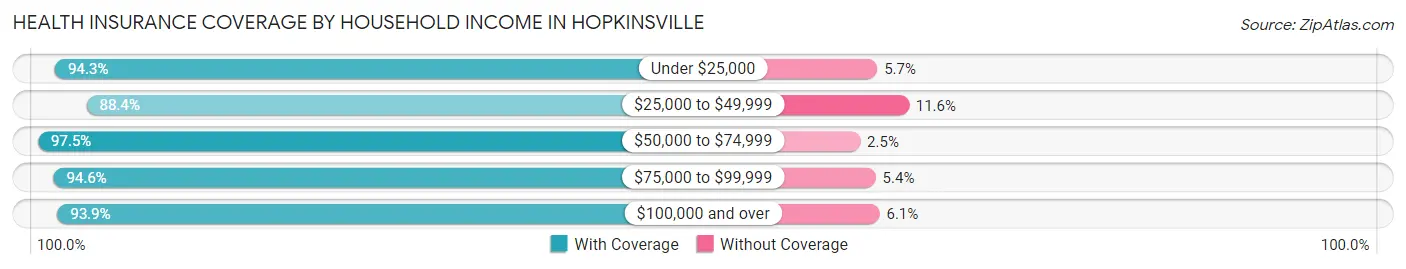
| Household Income | With Coverage | Without Coverage |
| Under $25,000 | 5,377 (94.3%) | 325 (5.7%) |
| $25,000 to $49,999 | 7,575 (88.4%) | 995 (11.6%) |
| $50,000 to $74,999 | 4,755 (97.5%) | 122 (2.5%) |
| $75,000 to $99,999 | 3,902 (94.6%) | 223 (5.4%) |
| $100,000 and over | 5,554 (93.9%) | 363 (6.1%) |
Public vs Private Health Insurance Coverage by Age in Hopkinsville
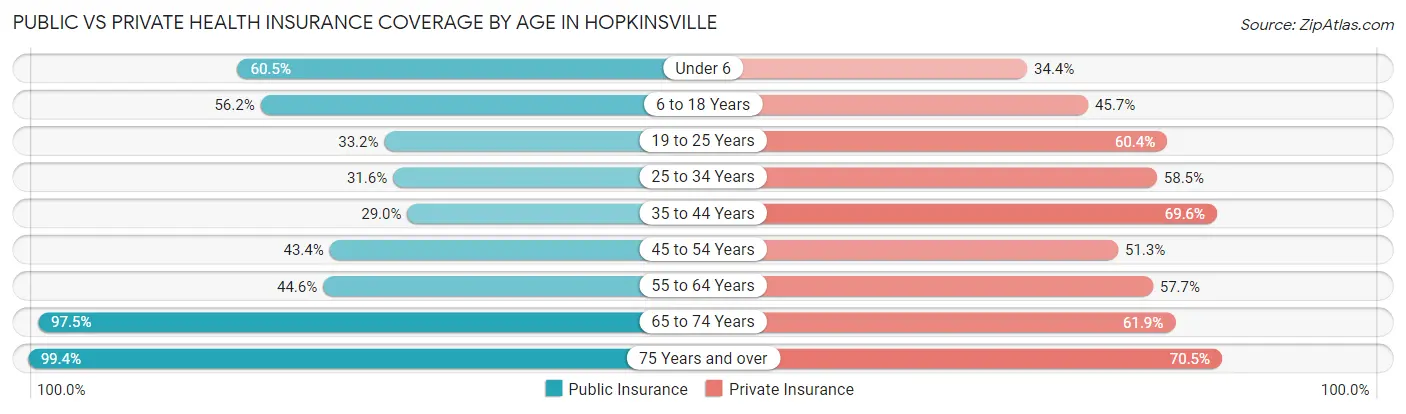
| Age Bracket | Public Insurance | Private Insurance |
| Under 6 | 1,376 (60.5%) | 783 (34.4%) |
| 6 to 18 Years | 3,040 (56.2%) | 2,472 (45.7%) |
| 19 to 25 Years | 1,160 (33.2%) | 2,107 (60.4%) |
| 25 to 34 Years | 1,189 (31.6%) | 2,199 (58.5%) |
| 35 to 44 Years | 875 (29.0%) | 2,103 (69.6%) |
| 45 to 54 Years | 1,334 (43.4%) | 1,576 (51.3%) |
| 55 to 64 Years | 1,520 (44.6%) | 1,967 (57.7%) |
| 65 to 74 Years | 2,643 (97.5%) | 1,677 (61.9%) |
| 75 Years and over | 2,197 (99.4%) | 1,559 (70.5%) |
| Total | 15,334 (52.2%) | 16,443 (56.0%) |
Disability Status by Sex by Age in Hopkinsville
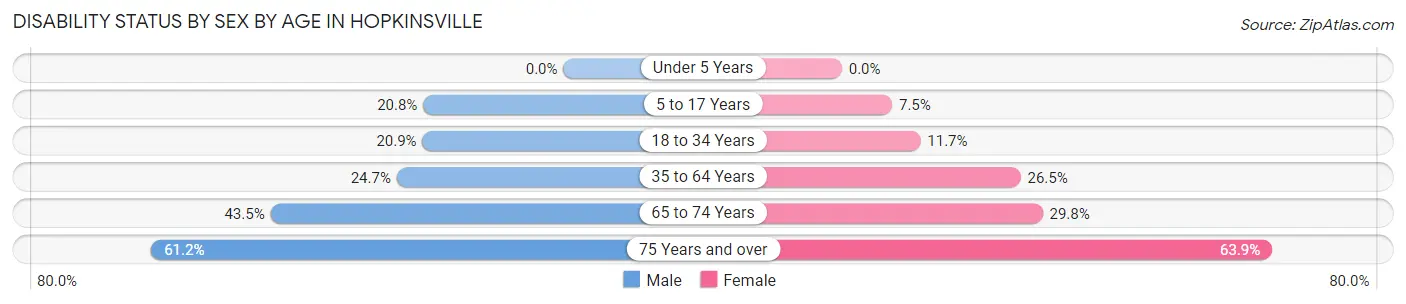
| Age Bracket | Male | Female |
| Under 5 Years | 0 (0.0%) | 0 (0.0%) |
| 5 to 17 Years | 533 (20.8%) | 212 (7.5%) |
| 18 to 34 Years | 867 (20.9%) | 392 (11.7%) |
| 35 to 64 Years | 1,085 (24.7%) | 1,358 (26.5%) |
| 65 to 74 Years | 508 (43.5%) | 460 (29.8%) |
| 75 Years and over | 495 (61.2%) | 895 (63.9%) |
Disability Class by Sex by Age in Hopkinsville
Disability Class: Hearing Difficulty
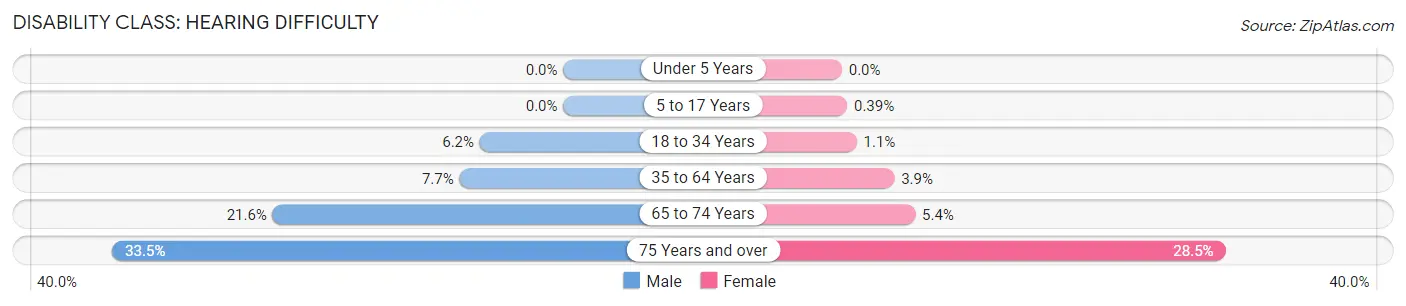
| Age Bracket | Male | Female |
| Under 5 Years | 0 (0.0%) | 0 (0.0%) |
| 5 to 17 Years | 0 (0.0%) | 11 (0.4%) |
| 18 to 34 Years | 257 (6.2%) | 37 (1.1%) |
| 35 to 64 Years | 338 (7.7%) | 199 (3.9%) |
| 65 to 74 Years | 252 (21.6%) | 84 (5.4%) |
| 75 Years and over | 271 (33.5%) | 399 (28.5%) |
Disability Class: Vision Difficulty
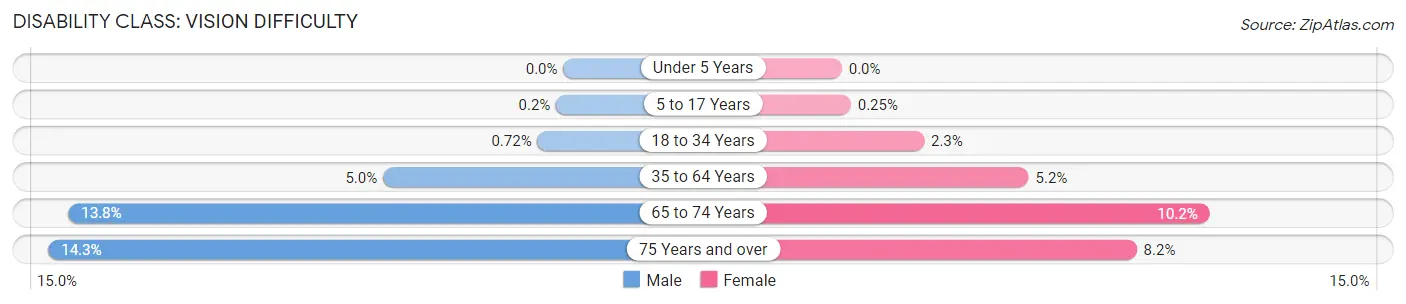
| Age Bracket | Male | Female |
| Under 5 Years | 0 (0.0%) | 0 (0.0%) |
| 5 to 17 Years | 5 (0.2%) | 7 (0.3%) |
| 18 to 34 Years | 30 (0.7%) | 77 (2.3%) |
| 35 to 64 Years | 220 (5.0%) | 266 (5.2%) |
| 65 to 74 Years | 161 (13.8%) | 158 (10.2%) |
| 75 Years and over | 116 (14.3%) | 115 (8.2%) |
Disability Class: Cognitive Difficulty
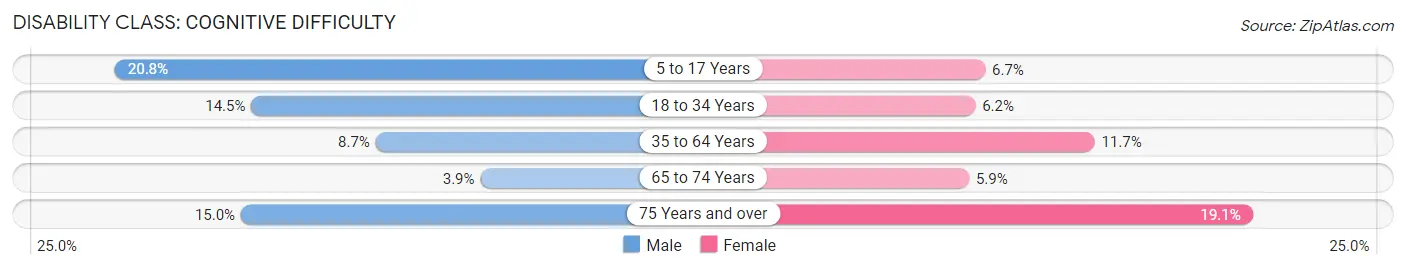
| Age Bracket | Male | Female |
| 5 to 17 Years | 533 (20.8%) | 189 (6.7%) |
| 18 to 34 Years | 600 (14.5%) | 208 (6.2%) |
| 35 to 64 Years | 382 (8.7%) | 600 (11.7%) |
| 65 to 74 Years | 45 (3.8%) | 91 (5.9%) |
| 75 Years and over | 121 (15.0%) | 267 (19.1%) |
Disability Class: Ambulatory Difficulty
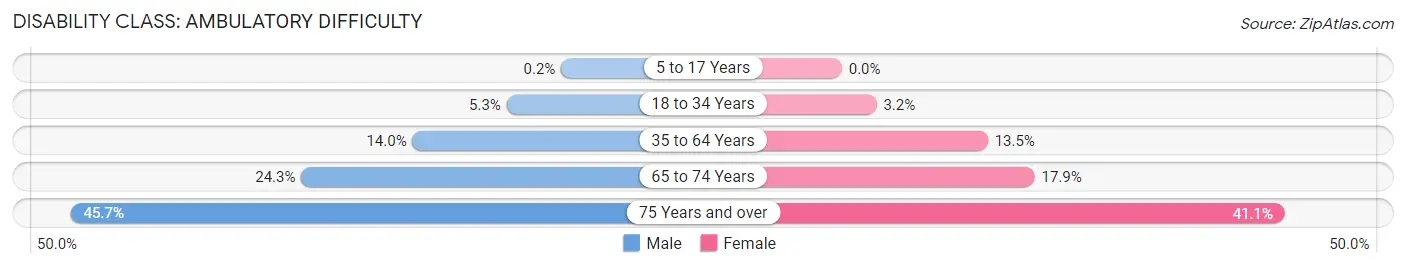
| Age Bracket | Male | Female |
| 5 to 17 Years | 5 (0.2%) | 0 (0.0%) |
| 18 to 34 Years | 218 (5.3%) | 108 (3.2%) |
| 35 to 64 Years | 614 (14.0%) | 693 (13.5%) |
| 65 to 74 Years | 284 (24.3%) | 276 (17.9%) |
| 75 Years and over | 370 (45.7%) | 576 (41.1%) |
Disability Class: Self-Care Difficulty
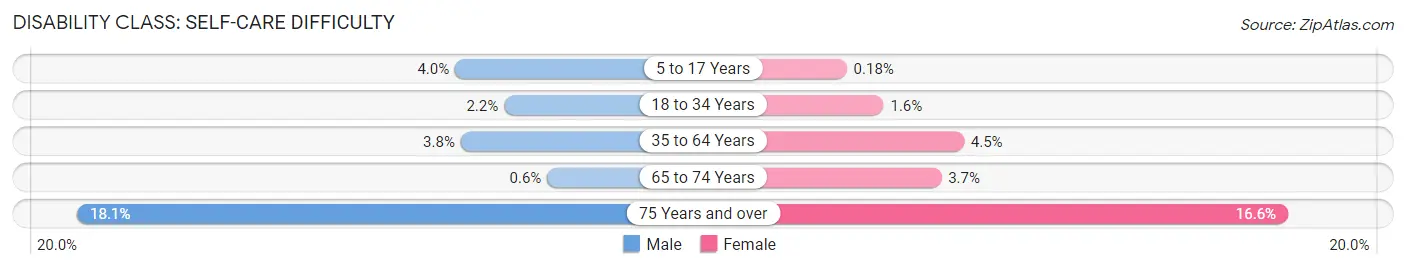
| Age Bracket | Male | Female |
| 5 to 17 Years | 103 (4.0%) | 5 (0.2%) |
| 18 to 34 Years | 91 (2.2%) | 52 (1.5%) |
| 35 to 64 Years | 167 (3.8%) | 232 (4.5%) |
| 65 to 74 Years | 7 (0.6%) | 57 (3.7%) |
| 75 Years and over | 146 (18.0%) | 232 (16.6%) |
Technology Access in Hopkinsville
Computing Device Access in Hopkinsville
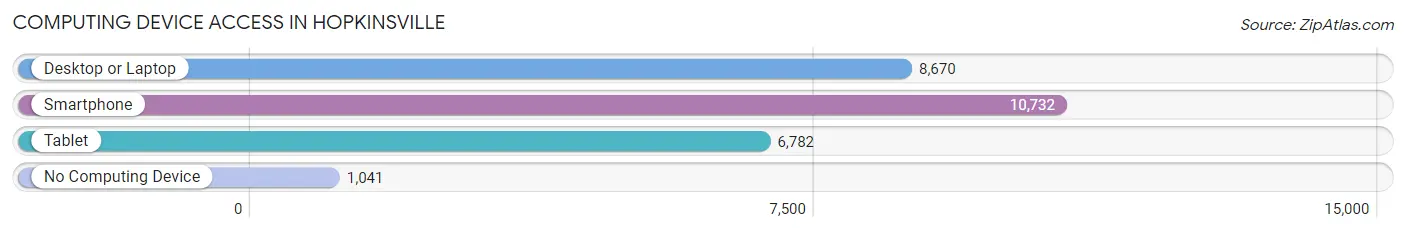
| Device Type | # Households | % Households |
| Desktop or Laptop | 8,670 | 69.5% |
| Smartphone | 10,732 | 86.0% |
| Tablet | 6,782 | 54.4% |
| No Computing Device | 1,041 | 8.4% |
| Total | 12,473 | 100.0% |
Internet Access in Hopkinsville
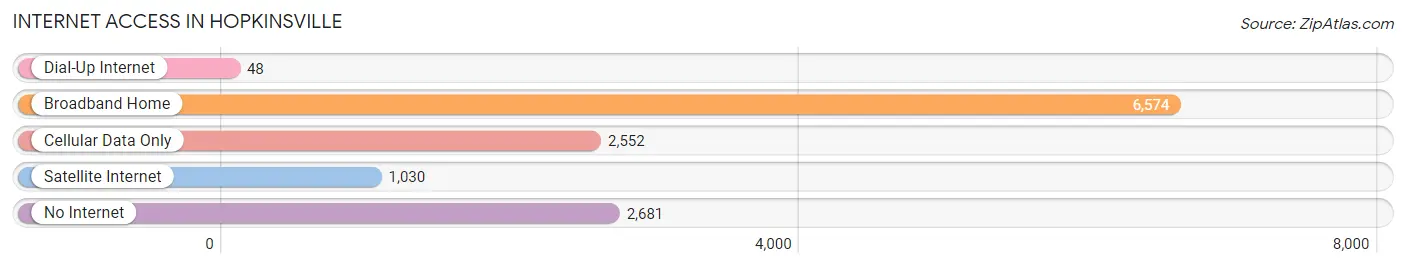
| Internet Type | # Households | % Households |
| Dial-Up Internet | 48 | 0.4% |
| Broadband Home | 6,574 | 52.7% |
| Cellular Data Only | 2,552 | 20.5% |
| Satellite Internet | 1,030 | 8.3% |
| No Internet | 2,681 | 21.5% |
| Total | 12,473 | 100.0% |
Hopkinsville Summary
Hopkinsville, Kentucky is a city located in Christian County, Kentucky, United States. It is the county seat of Christian County and the principal city of the Hopkinsville, Kentucky Metropolitan Statistical Area, which includes all of Christian and Todd counties. As of the 2010 census, the city had a population of 31,577.
History
The area of present-day Hopkinsville was initially claimed in 1796 by Bartholomew Wood as part of a 1,200 acre land grant from the state of Virginia. The city was founded in 1798 by brothers William and Charles Hopkins, who named the city after their father, Samuel Hopkins. The city was incorporated in 1804 and became the county seat of Christian County in 1807.
During the Civil War, Hopkinsville was the site of the Battle of Hopkinsville, also known as the "Christmas Raid" of 1862. Confederate forces under General Nathan Bedford Forrest attacked the town, but were eventually driven off by Union forces.
Geography
Hopkinsville is located at 36°51'N 87°29'W (36.851, -87.485). According to the United States Census Bureau, the city has a total area of 24.2 square miles (62.7 km2), of which 24.1 square miles (62.4 km2) is land and 0.1 square miles (0.3 km2) is water.
Economy
Hopkinsville is a regional center for healthcare, retail, and manufacturing. The city is home to Jennie Stuart Medical Center, a regional medical center, and several large retail stores. The city is also home to several manufacturing companies, including the Hopkinsville Milling Company, which produces flour and other grain products.
Demographics
As of the 2010 census, there were 31,577 people, 11,845 households, and 7,845 families residing in the city. The population density was 1,310.2 people per square mile (505.7/km2). There were 13,068 housing units at an average density of 539.3 per square mile (208.3/km2). The racial makeup of the city was 68.2% White, 28.3% African American, 0.3% Native American, 0.7% Asian, 0.1% Pacific Islander, 0.7% from other races, and 1.7% from two or more races. Hispanic or Latino of any race were 2.2% of the population.
The median income for a household in the city was $35,945, and the median income for a family was $45,867. Males had a median income of $32,845 versus $25,841 for females. The per capita income for the city was $19,945. About 14.2% of families and 17.7% of the population were below the poverty line, including 25.2% of those under age 18 and 13.2% of those age 65 or over.
Common Questions
What is Per Capita Income in Hopkinsville?
Per Capita income in Hopkinsville is $25,884.
What is the Median Family Income in Hopkinsville?
Median Family Income in Hopkinsville is $56,219.
What is the Median Household income in Hopkinsville?
Median Household Income in Hopkinsville is $43,577.
What is Income or Wage Gap in Hopkinsville?
Income or Wage Gap in Hopkinsville is 1.8%.
Women in Hopkinsville earn 98.2 cents for every dollar earned by a man.
What is Family Income Deficit in Hopkinsville?
Family Income Deficit in Hopkinsville is $11,927.
Families that are below poverty line in Hopkinsville earn $11,927 less on average than the poverty threshold level.
What is Inequality or Gini Index in Hopkinsville?
Inequality or Gini Index in Hopkinsville is 0.48.
What is the Total Population of Hopkinsville?
Total Population of Hopkinsville is 31,042.
What is the Total Male Population of Hopkinsville?
Total Male Population of Hopkinsville is 15,533.
What is the Total Female Population of Hopkinsville?
Total Female Population of Hopkinsville is 15,509.
What is the Ratio of Males per 100 Females in Hopkinsville?
There are 100.15 Males per 100 Females in Hopkinsville.
What is the Ratio of Females per 100 Males in Hopkinsville?
There are 99.85 Females per 100 Males in Hopkinsville.
What is the Median Population Age in Hopkinsville?
Median Population Age in Hopkinsville is 34.9 Years.
What is the Average Family Size in Hopkinsville
Average Family Size in Hopkinsville is 3.0 People.
What is the Average Household Size in Hopkinsville
Average Household Size in Hopkinsville is 2.4 People.
How Large is the Labor Force in Hopkinsville?
There are 13,199 People in the Labor Forcein in Hopkinsville.
What is the Percentage of People in the Labor Force in Hopkinsville?
54.4% of People are in the Labor Force in Hopkinsville.
What is the Unemployment Rate in Hopkinsville?
Unemployment Rate in Hopkinsville is 7.8%.