Rabbit Hash, KY Map & Demographics
Rabbit Hash Map
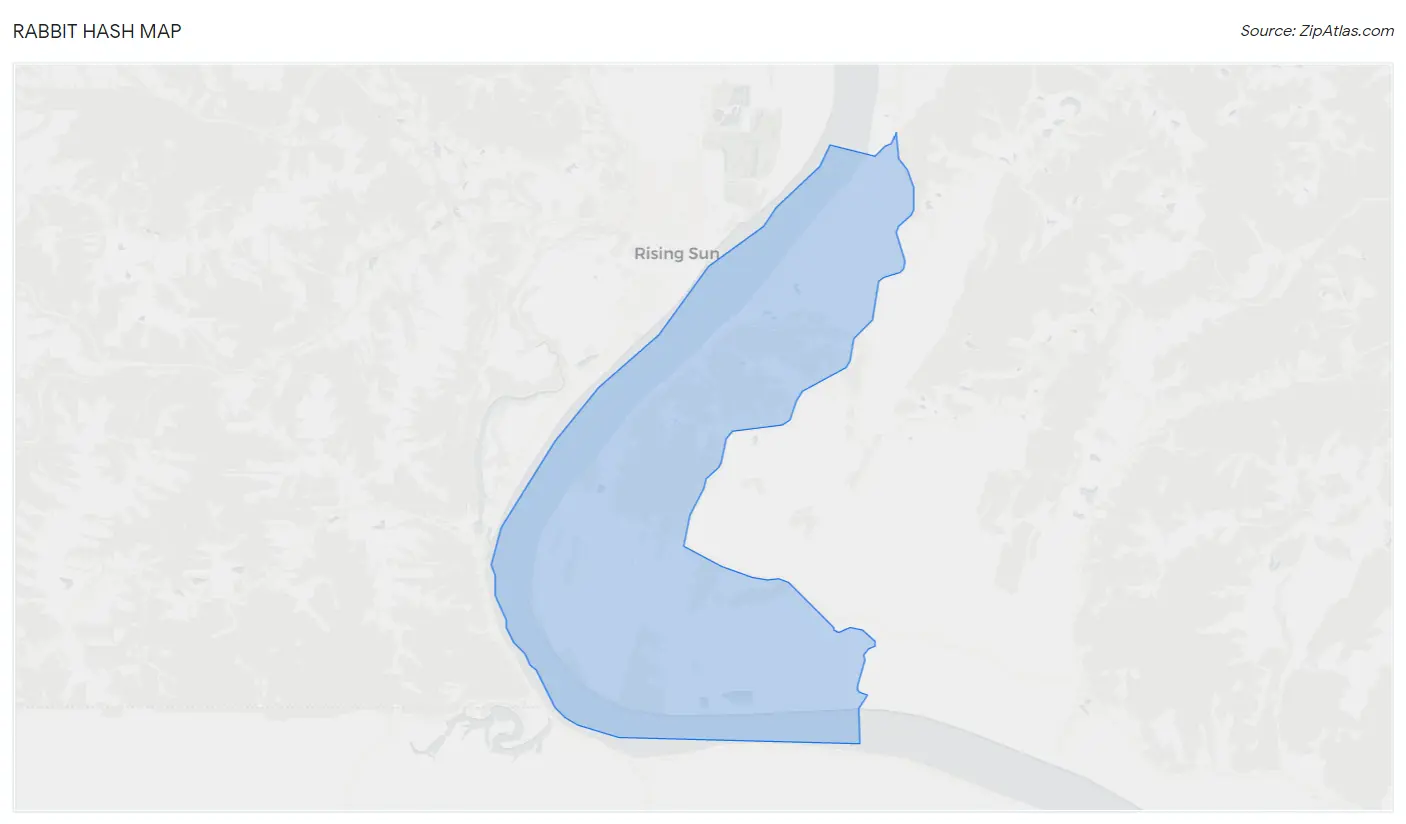
Rabbit Hash Overview
$81,139
PER CAPITA INCOME
$155,469
AVG FAMILY INCOME
$148,077
AVG HOUSEHOLD INCOME
0.24
INEQUALITY / GINI INDEX
117
TOTAL POPULATION
72
MALE POPULATION
45
FEMALE POPULATION
160.00
MALES / 100 FEMALES
62.50
FEMALES / 100 MALES
58.6
MEDIAN AGE
2.0
AVG FAMILY SIZE
1.5
AVG HOUSEHOLD SIZE
85
LABOR FORCE [ PEOPLE ]
72.6%
PERCENT IN LABOR FORCE
Rabbit Hash Area Codes
Income in Rabbit Hash
Income Overview in Rabbit Hash
Per Capita Income in Rabbit Hash is $81,139, while median incomes of families and households are $155,469 and $148,077 respectively.
| Characteristic | Number | Measure |
| Per Capita Income | 117 | $81,139 |
| Median Family Income | 37 | $155,469 |
| Mean Family Income | 37 | $134,046 |
| Median Household Income | 80 | $148,077 |
| Mean Household Income | 80 | $118,603 |
| Income Deficit | 37 | $0 |
| Wage / Income Gap (%) | 117 | 0.00% |
| Wage / Income Gap ($) | 117 | 100.00¢ per $1 |
| Gini / Inequality Index | 117 | 0.24 |
Earnings by Sex in Rabbit Hash
| Sex | Number | Average Earnings |
| Male | 64 (69.6%) | $0 |
| Female | 28 (30.4%) | $0 |
| Total | 92 (100.0%) | $0 |
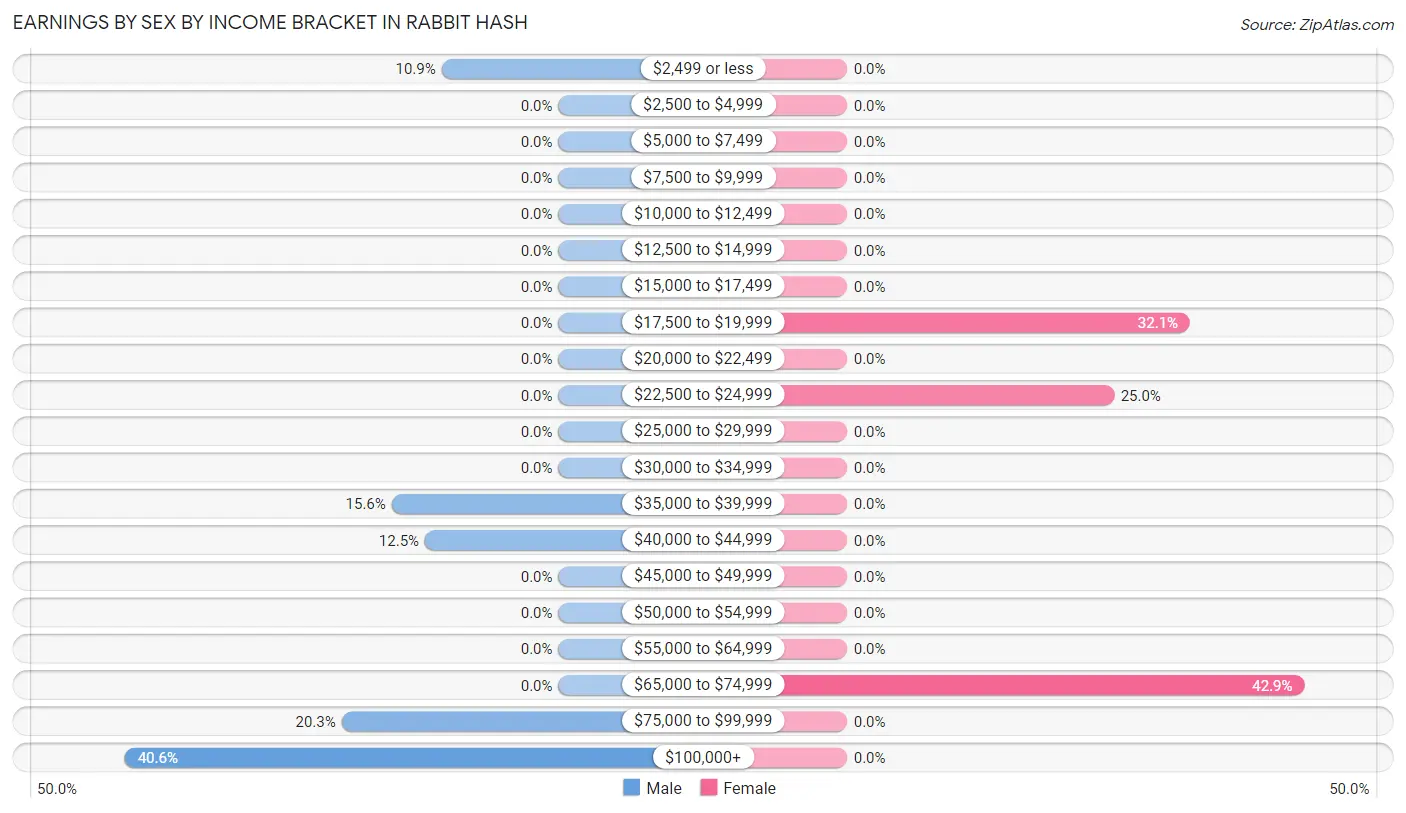
Earnings by Sex by Income Bracket in Rabbit Hash
The most common earnings brackets in Rabbit Hash are $100,000+ for men (26 | 40.6%) and $65,000 to $74,999 for women (12 | 42.9%).
| Income | Male | Female |
| $2,499 or less | 7 (10.9%) | 0 (0.0%) |
| $2,500 to $4,999 | 0 (0.0%) | 0 (0.0%) |
| $5,000 to $7,499 | 0 (0.0%) | 0 (0.0%) |
| $7,500 to $9,999 | 0 (0.0%) | 0 (0.0%) |
| $10,000 to $12,499 | 0 (0.0%) | 0 (0.0%) |
| $12,500 to $14,999 | 0 (0.0%) | 0 (0.0%) |
| $15,000 to $17,499 | 0 (0.0%) | 0 (0.0%) |
| $17,500 to $19,999 | 0 (0.0%) | 9 (32.1%) |
| $20,000 to $22,499 | 0 (0.0%) | 0 (0.0%) |
| $22,500 to $24,999 | 0 (0.0%) | 7 (25.0%) |
| $25,000 to $29,999 | 0 (0.0%) | 0 (0.0%) |
| $30,000 to $34,999 | 0 (0.0%) | 0 (0.0%) |
| $35,000 to $39,999 | 10 (15.6%) | 0 (0.0%) |
| $40,000 to $44,999 | 8 (12.5%) | 0 (0.0%) |
| $45,000 to $49,999 | 0 (0.0%) | 0 (0.0%) |
| $50,000 to $54,999 | 0 (0.0%) | 0 (0.0%) |
| $55,000 to $64,999 | 0 (0.0%) | 0 (0.0%) |
| $65,000 to $74,999 | 0 (0.0%) | 12 (42.9%) |
| $75,000 to $99,999 | 13 (20.3%) | 0 (0.0%) |
| $100,000+ | 26 (40.6%) | 0 (0.0%) |
| Total | 64 (100.0%) | 28 (100.0%) |
Earnings by Sex by Educational Attainment in Rabbit Hash
| Educational Attainment | Male Income | Female Income |
| Less than High School | - | - |
| High School Diploma | - | - |
| College or Associate's Degree | - | - |
| Bachelor's Degree | - | - |
| Graduate Degree | - | - |
| Total | - | - |
Family Income in Rabbit Hash
Family Income Brackets in Rabbit Hash
According to the Rabbit Hash family income data, there are 20 families falling into the $150,000 to $199,999 income range, which is the most common income bracket and makes up 54.0% of all families.
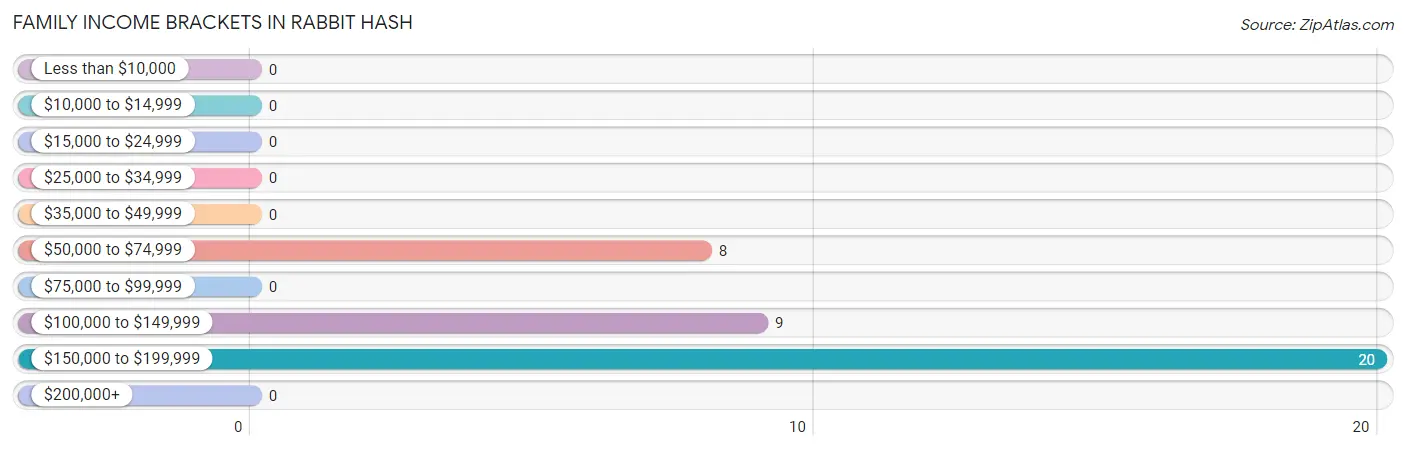
| Income Bracket | # Families | % Families |
| Less than $10,000 | 0 | 0.0% |
| $10,000 to $14,999 | 0 | 0.0% |
| $15,000 to $24,999 | 0 | 0.0% |
| $25,000 to $34,999 | 0 | 0.0% |
| $35,000 to $49,999 | 0 | 0.0% |
| $50,000 to $74,999 | 8 | 21.6% |
| $75,000 to $99,999 | 0 | 0.0% |
| $100,000 to $149,999 | 9 | 24.3% |
| $150,000 to $199,999 | 20 | 54.1% |
| $200,000+ | 0 | 0.0% |
Family Income by Famaliy Size in Rabbit Hash
2-person families (37 | 100.0%) account for the highest median family income in Rabbit Hash with $155,469 per family, while 2-person families (37 | 100.0%) have the highest median income of $77,734 per family member.
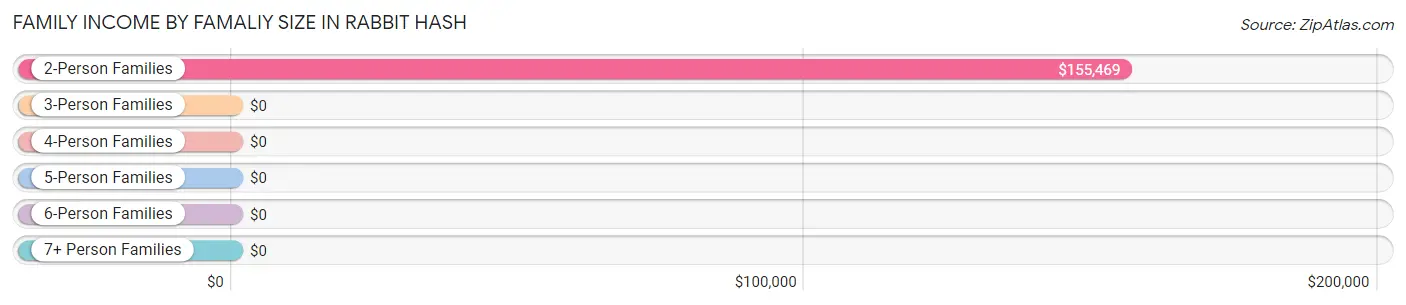
| Income Bracket | # Families | Median Income |
| 2-Person Families | 37 (100.0%) | $155,469 |
| 3-Person Families | 0 (0.0%) | $0 |
| 4-Person Families | 0 (0.0%) | $0 |
| 5-Person Families | 0 (0.0%) | $0 |
| 6-Person Families | 0 (0.0%) | $0 |
| 7+ Person Families | 0 (0.0%) | $0 |
| Total | 37 (100.0%) | $155,469 |
Family Income by Number of Earners in Rabbit Hash
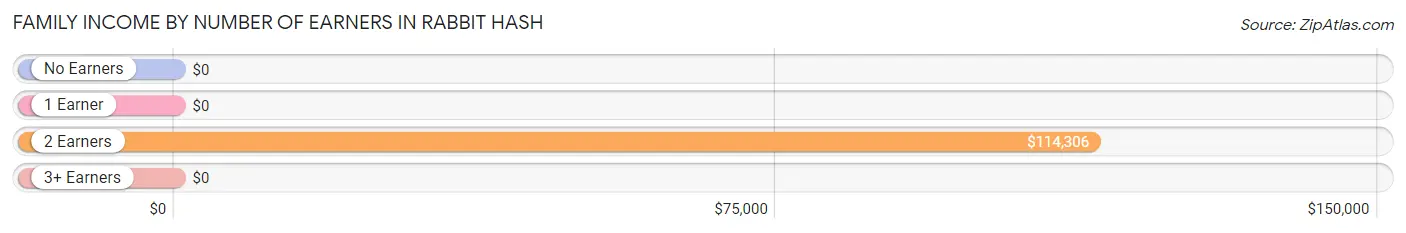
| Number of Earners | # Families | Median Income |
| No Earners | 0 (0.0%) | $0 |
| 1 Earner | 8 (21.6%) | $0 |
| 2 Earners | 29 (78.4%) | $114,306 |
| 3+ Earners | 0 (0.0%) | $0 |
| Total | 37 (100.0%) | $155,469 |
Household Income in Rabbit Hash
Household Income Brackets in Rabbit Hash
With 35 households falling in the category, the $100,000 to $149,999 income range is the most frequent in Rabbit Hash, accounting for 43.8% of all households.
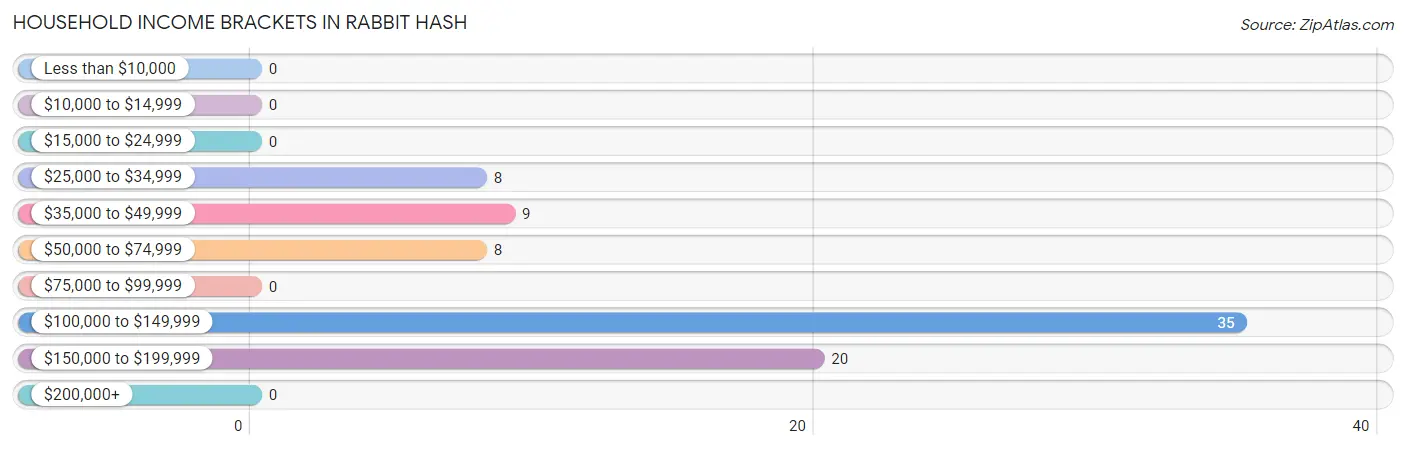
| Income Bracket | # Households | % Households |
| Less than $10,000 | 0 | 0.0% |
| $10,000 to $14,999 | 0 | 0.0% |
| $15,000 to $24,999 | 0 | 0.0% |
| $25,000 to $34,999 | 8 | 10.0% |
| $35,000 to $49,999 | 9 | 11.3% |
| $50,000 to $74,999 | 8 | 10.0% |
| $75,000 to $99,999 | 0 | 0.0% |
| $100,000 to $149,999 | 35 | 43.8% |
| $150,000 to $199,999 | 20 | 25.0% |
| $200,000+ | 0 | 0.0% |
Household Income by Householder Age in Rabbit Hash
The median household income in Rabbit Hash is $148,077, with the highest median household income of $147,933 found in the 45 to 64 years age bracket for the primary householder. A total of 43 households (53.7%) fall into this category.
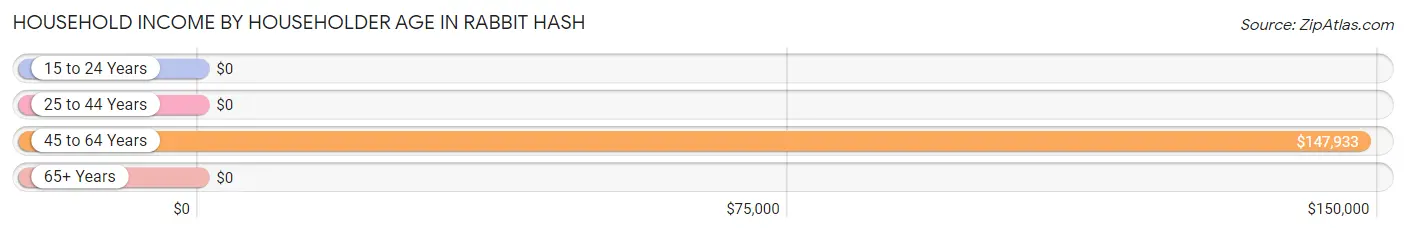
| Income Bracket | # Households | Median Income |
| 15 to 24 Years | 0 (0.0%) | $0 |
| 25 to 44 Years | 12 (15.0%) | $0 |
| 45 to 64 Years | 43 (53.7%) | $147,933 |
| 65+ Years | 25 (31.2%) | $0 |
| Total | 80 (100.0%) | $148,077 |
Poverty in Rabbit Hash
Income Below Poverty by Sex and Age in Rabbit Hash
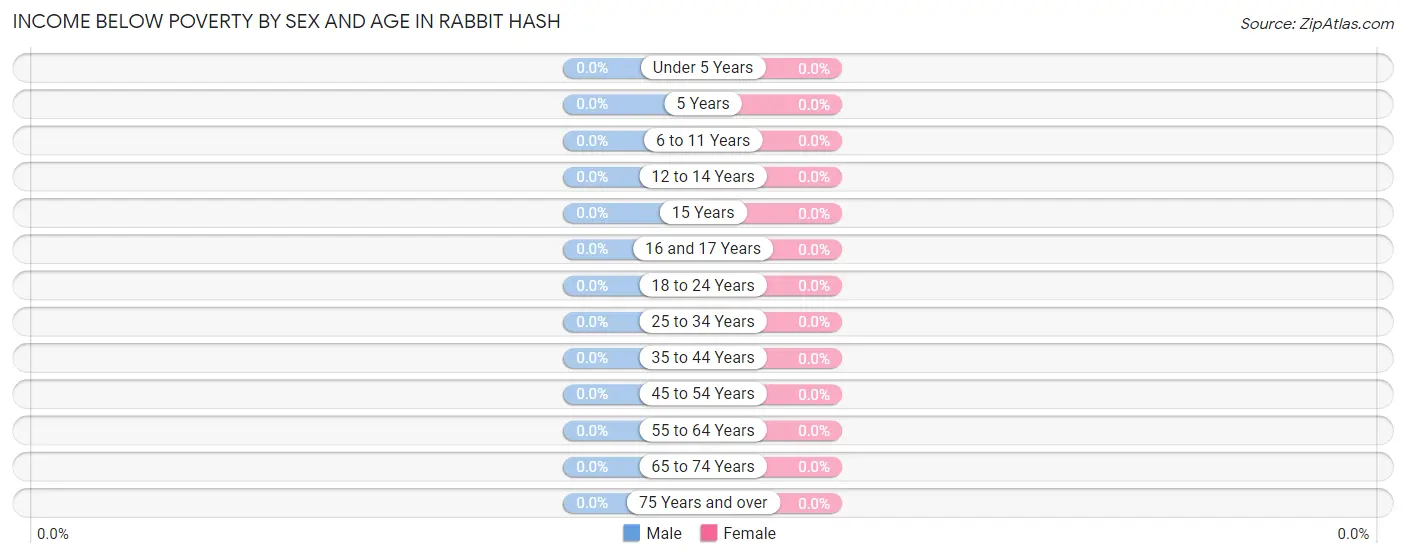
| Age Bracket | Male | Female |
| Under 5 Years | 0 (0.0%) | 0 (0.0%) |
| 5 Years | 0 (0.0%) | 0 (0.0%) |
| 6 to 11 Years | 0 (0.0%) | 0 (0.0%) |
| 12 to 14 Years | 0 (0.0%) | 0 (0.0%) |
| 15 Years | 0 (0.0%) | 0 (0.0%) |
| 16 and 17 Years | 0 (0.0%) | 0 (0.0%) |
| 18 to 24 Years | 0 (0.0%) | 0 (0.0%) |
| 25 to 34 Years | 0 (0.0%) | 0 (0.0%) |
| 35 to 44 Years | 0 (0.0%) | 0 (0.0%) |
| 45 to 54 Years | 0 (0.0%) | 0 (0.0%) |
| 55 to 64 Years | 0 (0.0%) | 0 (0.0%) |
| 65 to 74 Years | 0 (0.0%) | 0 (0.0%) |
| 75 Years and over | 0 (0.0%) | 0 (0.0%) |
| Total | 0 (0.0%) | 0 (0.0%) |
Income Above Poverty by Sex and Age in Rabbit Hash
According to the poverty statistics in Rabbit Hash, males aged 45 to 54 years and females aged 35 to 44 years are the age groups that are most secure financially, with 100.0% of males and 100.0% of females in these age groups living above the poverty line.
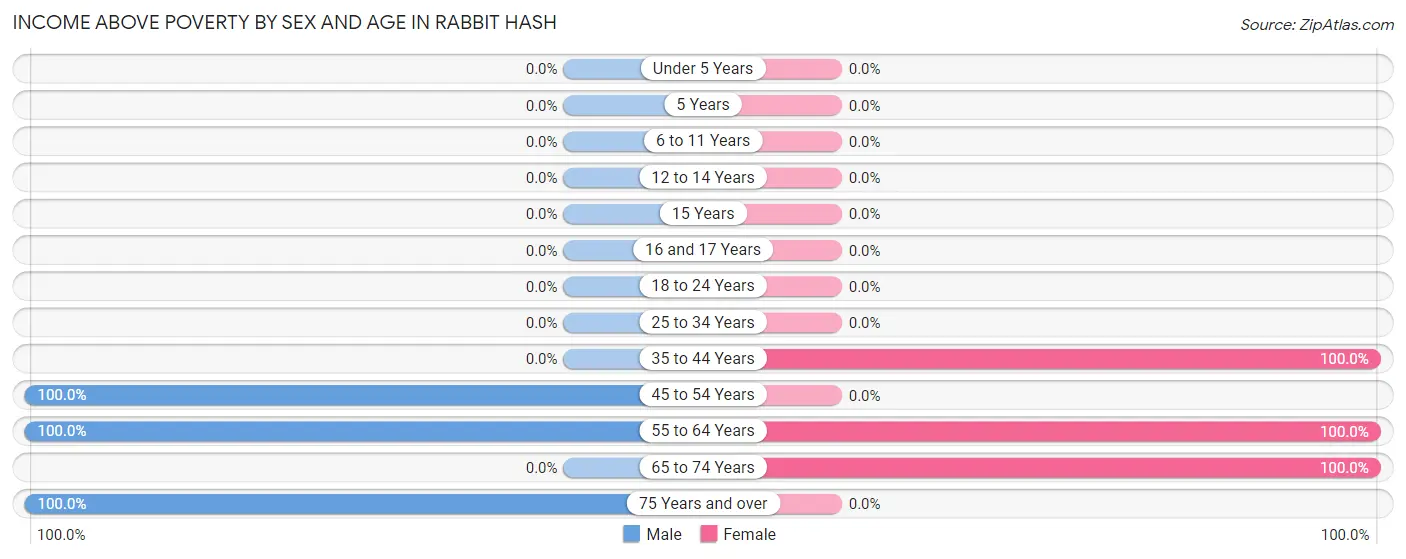
| Age Bracket | Male | Female |
| Under 5 Years | 0 (0.0%) | 0 (0.0%) |
| 5 Years | 0 (0.0%) | 0 (0.0%) |
| 6 to 11 Years | 0 (0.0%) | 0 (0.0%) |
| 12 to 14 Years | 0 (0.0%) | 0 (0.0%) |
| 15 Years | 0 (0.0%) | 0 (0.0%) |
| 16 and 17 Years | 0 (0.0%) | 0 (0.0%) |
| 18 to 24 Years | 0 (0.0%) | 0 (0.0%) |
| 25 to 34 Years | 0 (0.0%) | 0 (0.0%) |
| 35 to 44 Years | 0 (0.0%) | 12 (100.0%) |
| 45 to 54 Years | 13 (100.0%) | 0 (0.0%) |
| 55 to 64 Years | 44 (100.0%) | 16 (100.0%) |
| 65 to 74 Years | 0 (0.0%) | 17 (100.0%) |
| 75 Years and over | 15 (100.0%) | 0 (0.0%) |
| Total | 72 (100.0%) | 45 (100.0%) |
Income Below Poverty Among Married-Couple Families in Rabbit Hash
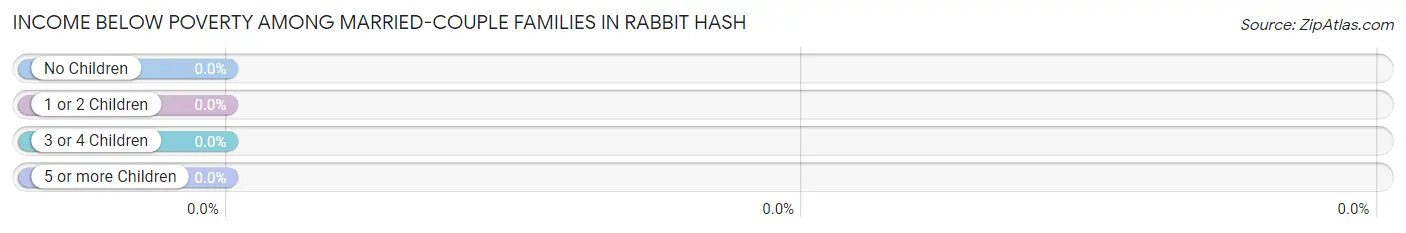
| Children | Above Poverty | Below Poverty |
| No Children | 37 (100.0%) | 0 (0.0%) |
| 1 or 2 Children | 0 (0.0%) | 0 (0.0%) |
| 3 or 4 Children | 0 (0.0%) | 0 (0.0%) |
| 5 or more Children | 0 (0.0%) | 0 (0.0%) |
| Total | 37 (100.0%) | 0 (0.0%) |
Income Below Poverty Among Single-Parent Households in Rabbit Hash
| Children | Single Father | Single Mother |
| No Children | 0 (0.0%) | 0 (0.0%) |
| 1 or 2 Children | 0 (0.0%) | 0 (0.0%) |
| 3 or 4 Children | 0 (0.0%) | 0 (0.0%) |
| 5 or more Children | 0 (0.0%) | 0 (0.0%) |
| Total | 0 (0.0%) | 0 (0.0%) |
Income Below Poverty Among Married-Couple vs Single-Parent Households in Rabbit Hash
| Children | Married-Couple Families | Single-Parent Households |
| No Children | 0 (0.0%) | 0 (0.0%) |
| 1 or 2 Children | 0 (0.0%) | 0 (0.0%) |
| 3 or 4 Children | 0 (0.0%) | 0 (0.0%) |
| 5 or more Children | 0 (0.0%) | 0 (0.0%) |
| Total | 0 (0.0%) | 0 (0.0%) |
Race in Rabbit Hash
The most populous races in Rabbit Hash are White / Caucasian (105 | 89.7%), and Two or more Races (12 | 10.3%).
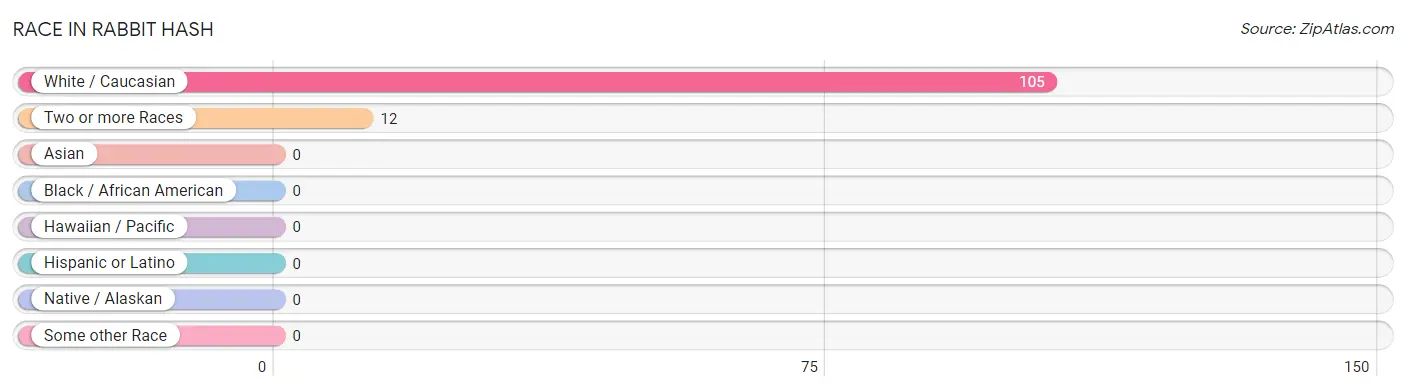
| Race | # Population | % Population |
| Asian | 0 | 0.0% |
| Black / African American | 0 | 0.0% |
| Hawaiian / Pacific | 0 | 0.0% |
| Hispanic or Latino | 0 | 0.0% |
| Native / Alaskan | 0 | 0.0% |
| White / Caucasian | 105 | 89.7% |
| Two or more Races | 12 | 10.3% |
| Some other Race | 0 | 0.0% |
| Total | 117 | 100.0% |
Ancestry in Rabbit Hash
The most populous ancestries reported in Rabbit Hash are German (34 | 29.1%), Irish (21 | 17.9%), American (15 | 12.8%), English (13 | 11.1%), and Bhutanese (12 | 10.3%), together accounting for 81.2% of all Rabbit Hash residents.
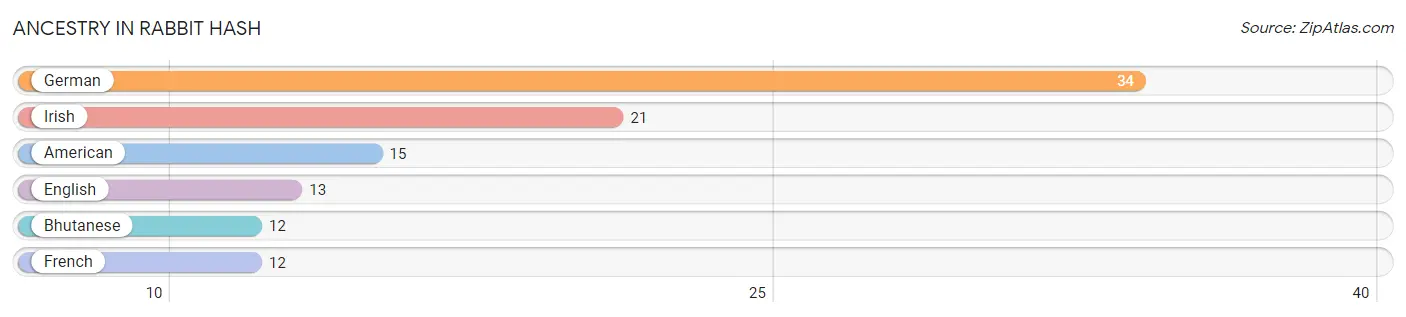
| Ancestry | # Population | % Population |
| American | 15 | 12.8% |
| Bhutanese | 12 | 10.3% |
| English | 13 | 11.1% |
| French | 12 | 10.3% |
| German | 34 | 29.1% |
| Irish | 21 | 17.9% | View All 6 Rows |
Immigrants in Rabbit Hash

| Immigration Origin | # Population | % Population | View All 0 Rows |
Sex and Age in Rabbit Hash
Sex and Age in Rabbit Hash
The most populous age groups in Rabbit Hash are 55 to 59 Years (36 | 50.0%) for men and 70 to 74 Years (17 | 37.8%) for women.
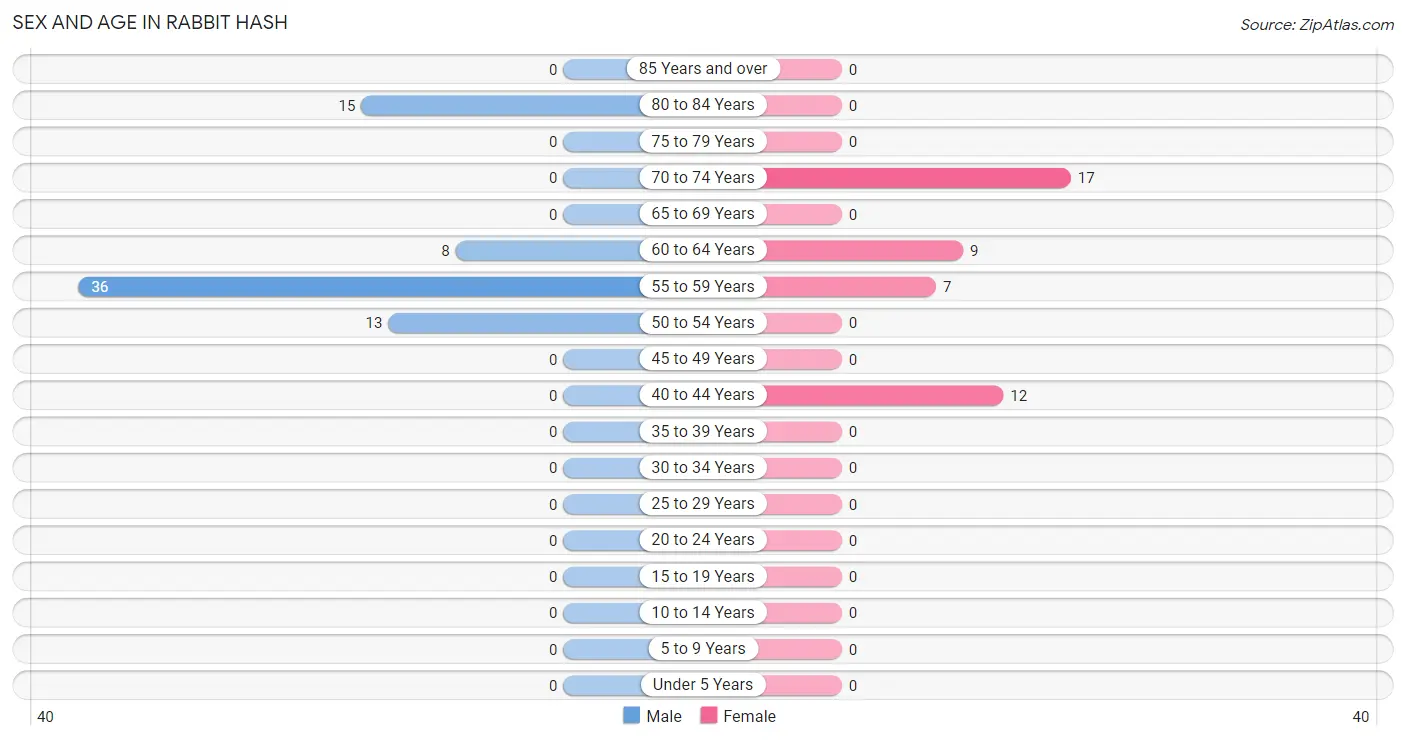
| Age Bracket | Male | Female |
| Under 5 Years | 0 (0.0%) | 0 (0.0%) |
| 5 to 9 Years | 0 (0.0%) | 0 (0.0%) |
| 10 to 14 Years | 0 (0.0%) | 0 (0.0%) |
| 15 to 19 Years | 0 (0.0%) | 0 (0.0%) |
| 20 to 24 Years | 0 (0.0%) | 0 (0.0%) |
| 25 to 29 Years | 0 (0.0%) | 0 (0.0%) |
| 30 to 34 Years | 0 (0.0%) | 0 (0.0%) |
| 35 to 39 Years | 0 (0.0%) | 0 (0.0%) |
| 40 to 44 Years | 0 (0.0%) | 12 (26.7%) |
| 45 to 49 Years | 0 (0.0%) | 0 (0.0%) |
| 50 to 54 Years | 13 (18.1%) | 0 (0.0%) |
| 55 to 59 Years | 36 (50.0%) | 7 (15.6%) |
| 60 to 64 Years | 8 (11.1%) | 9 (20.0%) |
| 65 to 69 Years | 0 (0.0%) | 0 (0.0%) |
| 70 to 74 Years | 0 (0.0%) | 17 (37.8%) |
| 75 to 79 Years | 0 (0.0%) | 0 (0.0%) |
| 80 to 84 Years | 15 (20.8%) | 0 (0.0%) |
| 85 Years and over | 0 (0.0%) | 0 (0.0%) |
| Total | 72 (100.0%) | 45 (100.0%) |
Families and Households in Rabbit Hash
Median Family Size in Rabbit Hash
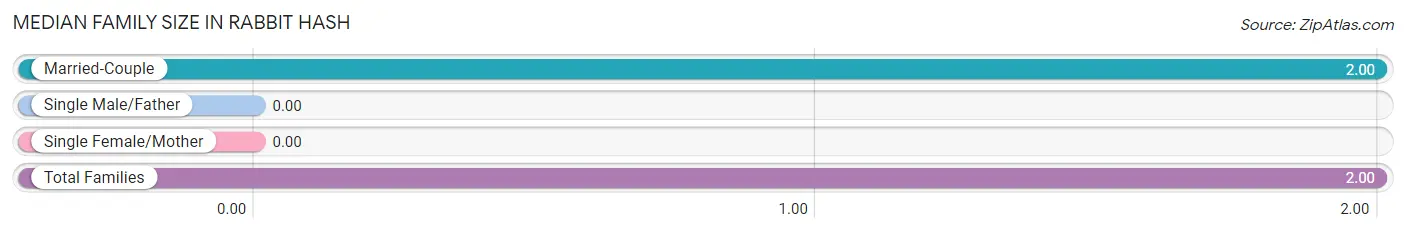
| Family Type | # Families | Family Size |
| Married-Couple | 37 (100.0%) | 2.00 |
| Single Male/Father | 0 (0.0%) | - |
| Single Female/Mother | 0 (0.0%) | - |
| Total Families | 37 (100.0%) | 2.00 |
Median Household Size in Rabbit Hash
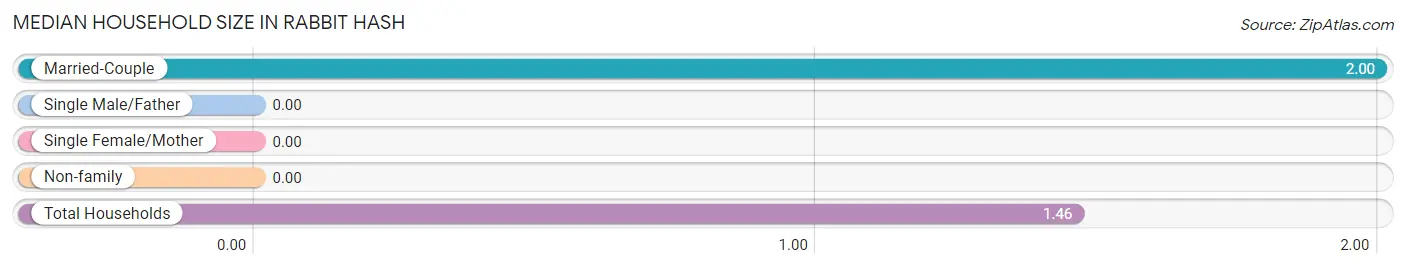
| Household Type | # Households | Household Size |
| Married-Couple | 37 (46.3%) | 2.00 |
| Single Male/Father | 0 (0.0%) | - |
| Single Female/Mother | 0 (0.0%) | - |
| Non-family | 43 (53.7%) | - |
| Total Households | 80 (100.0%) | 1.46 |
Household Size by Marriage Status in Rabbit Hash
Out of a total of 80 households in Rabbit Hash, 37 (46.3%) are family households, while 43 (53.7%) are nonfamily households. The most numerous type of family households are 2-person households, comprising 37, and the most common type of nonfamily households are 1-person households, comprising 43.
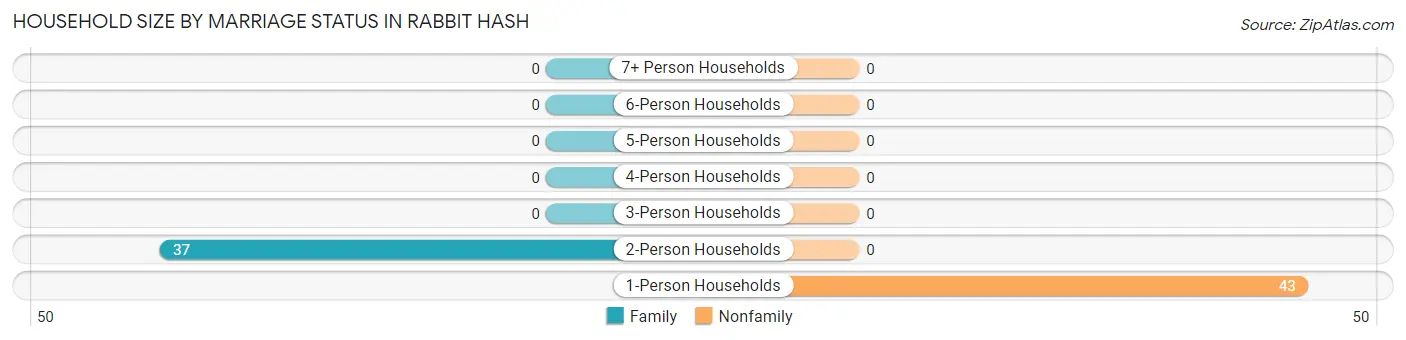
| Household Size | Family Households | Nonfamily Households |
| 1-Person Households | - | 43 (53.7%) |
| 2-Person Households | 37 (46.3%) | 0 (0.0%) |
| 3-Person Households | 0 (0.0%) | 0 (0.0%) |
| 4-Person Households | 0 (0.0%) | 0 (0.0%) |
| 5-Person Households | 0 (0.0%) | 0 (0.0%) |
| 6-Person Households | 0 (0.0%) | 0 (0.0%) |
| 7+ Person Households | 0 (0.0%) | 0 (0.0%) |
| Total | 37 (46.3%) | 43 (53.7%) |
Female Fertility in Rabbit Hash
Fertility by Age in Rabbit Hash
| Age Bracket | Women with Births | Births / 1,000 Women |
| 15 to 19 years | 0 (0.0%) | 0.0 |
| 20 to 34 years | 0 (0.0%) | 0.0 |
| 35 to 50 years | 0 (0.0%) | 0.0 |
| Total | 0 (0.0%) | 0.0 |
Fertility by Age by Marriage Status in Rabbit Hash
| Age Bracket | Married | Unmarried |
| 15 to 19 years | 0 (0.0%) | 0 (0.0%) |
| 20 to 34 years | 0 (0.0%) | 0 (0.0%) |
| 35 to 50 years | 0 (0.0%) | 0 (0.0%) |
| Total | 0 (0.0%) | 0 (0.0%) |
Fertility by Education in Rabbit Hash
| Educational Attainment | Women with Births | Births / 1,000 Women |
| Less than High School | 0 (0.0%) | 0.0 |
| High School Diploma | 0 (0.0%) | 0.0 |
| College or Associate's Degree | 0 (0.0%) | 0.0 |
| Bachelor's Degree | 0 (0.0%) | 0.0 |
| Graduate Degree | 0 (0.0%) | 0.0 |
| Total | 0 (0.0%) | 0.0 |
Fertility by Education by Marriage Status in Rabbit Hash
| Educational Attainment | Married | Unmarried |
| Less than High School | 0 (0.0%) | 0 (0.0%) |
| High School Diploma | 0 (0.0%) | 0 (0.0%) |
| College or Associate's Degree | 0 (0.0%) | 0 (0.0%) |
| Bachelor's Degree | 0 (0.0%) | 0 (0.0%) |
| Graduate Degree | 0 (0.0%) | 0 (0.0%) |
| Total | 0 (0.0%) | 0 (0.0%) |
Employment Characteristics in Rabbit Hash
Employment by Class of Employer in Rabbit Hash
Among the 77 employed individuals in Rabbit Hash, private company employees (46 | 59.7%), local government employees (19 | 24.7%), and not-for-profit organizations (12 | 15.6%) make up the most common classes of employment.
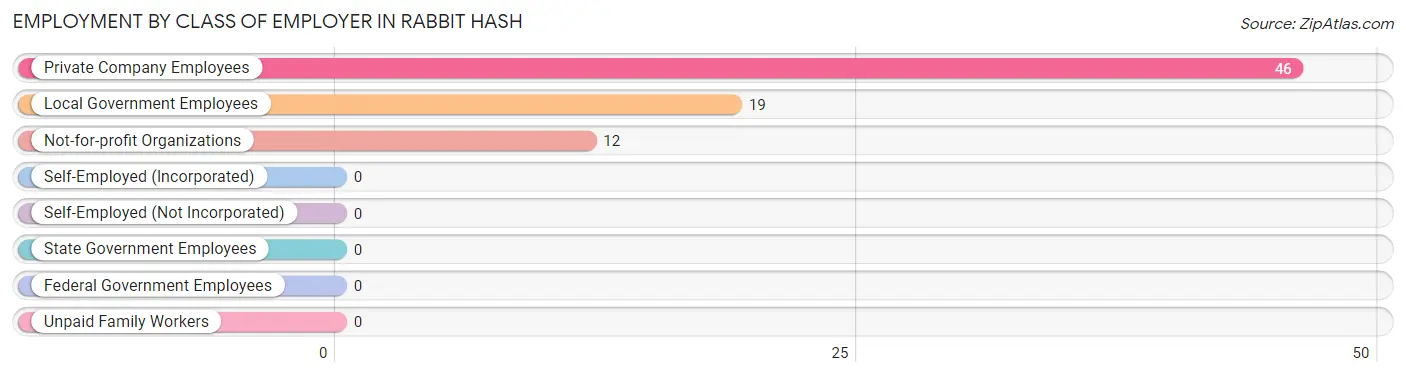
| Employer Class | # Employees | % Employees |
| Private Company Employees | 46 | 59.7% |
| Self-Employed (Incorporated) | 0 | 0.0% |
| Self-Employed (Not Incorporated) | 0 | 0.0% |
| Not-for-profit Organizations | 12 | 15.6% |
| Local Government Employees | 19 | 24.7% |
| State Government Employees | 0 | 0.0% |
| Federal Government Employees | 0 | 0.0% |
| Unpaid Family Workers | 0 | 0.0% |
| Total | 77 | 100.0% |
Employment Status by Age in Rabbit Hash
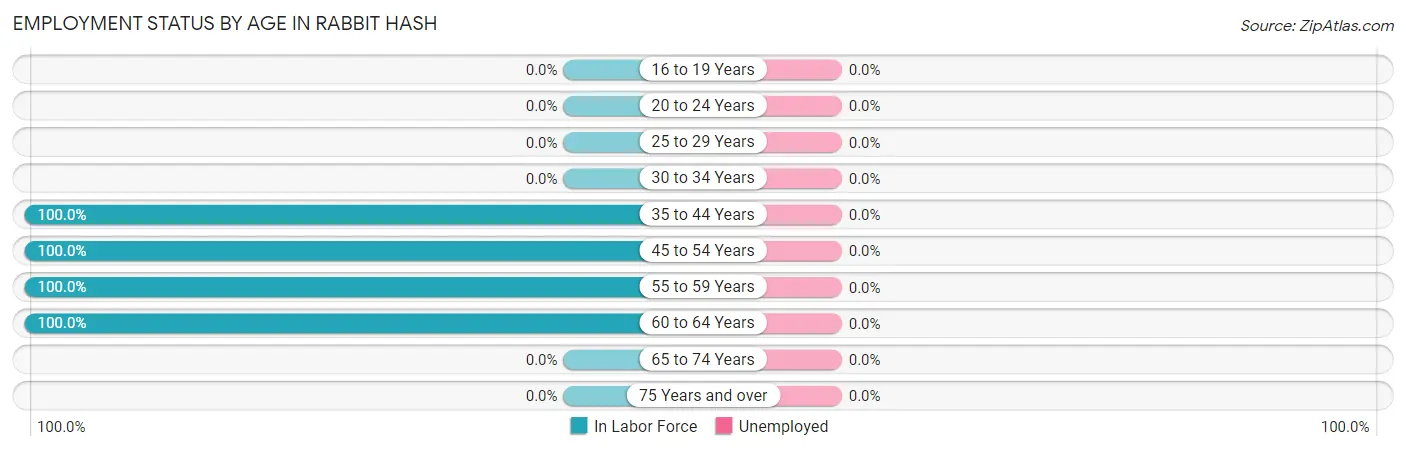
| Age Bracket | In Labor Force | Unemployed |
| 16 to 19 Years | 0 (0.0%) | 0 (0.0%) |
| 20 to 24 Years | 0 (0.0%) | 0 (0.0%) |
| 25 to 29 Years | 0 (0.0%) | 0 (0.0%) |
| 30 to 34 Years | 0 (0.0%) | 0 (0.0%) |
| 35 to 44 Years | 12 (100.0%) | 0 (0.0%) |
| 45 to 54 Years | 13 (100.0%) | 0 (0.0%) |
| 55 to 59 Years | 43 (100.0%) | 0 (0.0%) |
| 60 to 64 Years | 17 (100.0%) | 0 (0.0%) |
| 65 to 74 Years | 0 (0.0%) | 0 (0.0%) |
| 75 Years and over | 0 (0.0%) | 0 (0.0%) |
| Total | 85 (72.6%) | 0 (0.0%) |
Employment Status by Educational Attainment in Rabbit Hash
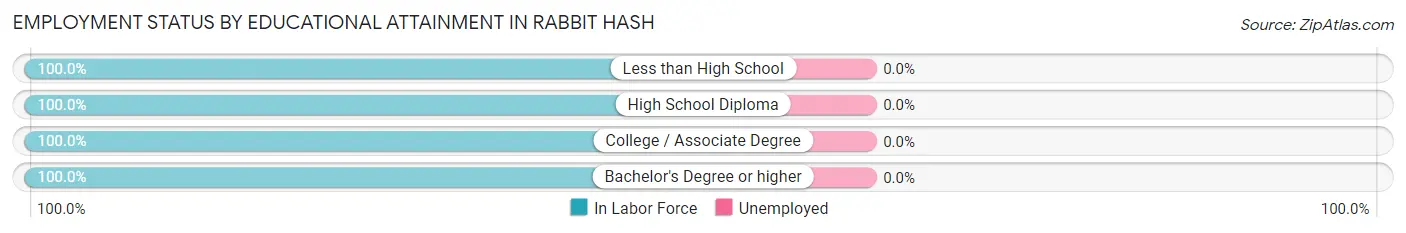
| Educational Attainment | In Labor Force | Unemployed |
| Less than High School | 13 (100.0%) | 0 (0.0%) |
| High School Diploma | 8 (100.0%) | 0 (0.0%) |
| College / Associate Degree | 45 (100.0%) | 0 (0.0%) |
| Bachelor's Degree or higher | 19 (100.0%) | 0 (0.0%) |
| Total | 85 (100.0%) | 0 (0.0%) |
Employment Occupations by Sex in Rabbit Hash
Management, Business, Science and Arts Occupations
The most common Management, Business, Science and Arts occupations in Rabbit Hash are Health Diagnosing & Treating (21 | 24.7%), Business & Financial (13 | 15.3%), and Health Technologists (12 | 14.1%).
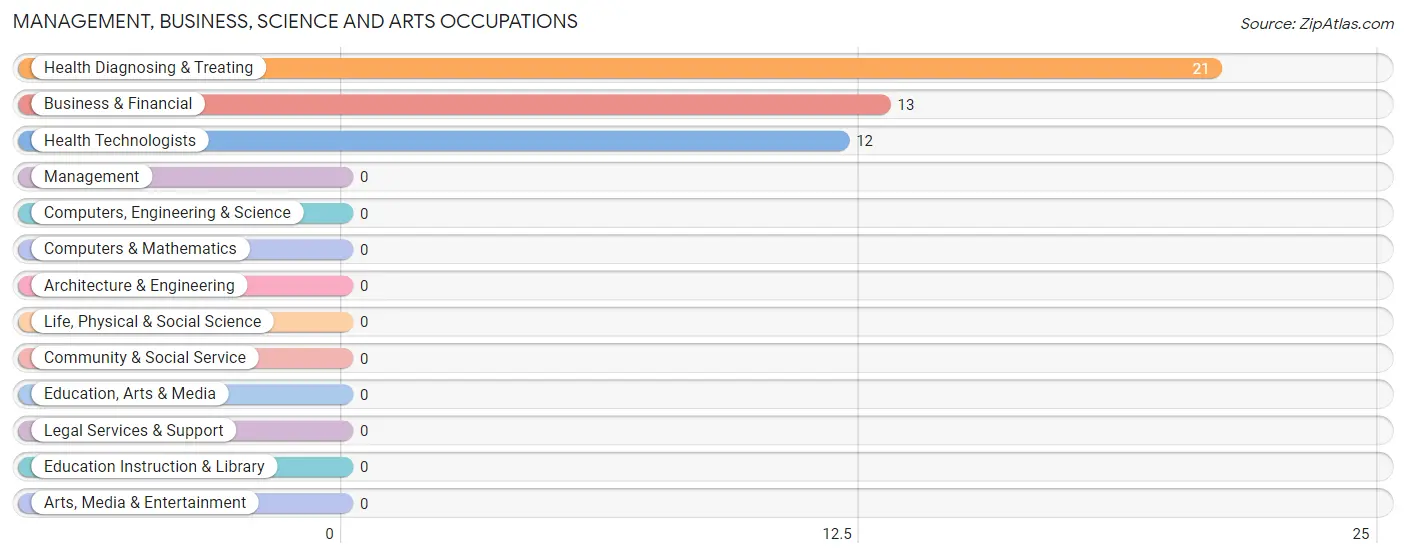
Management, Business, Science and Arts Occupations by Sex
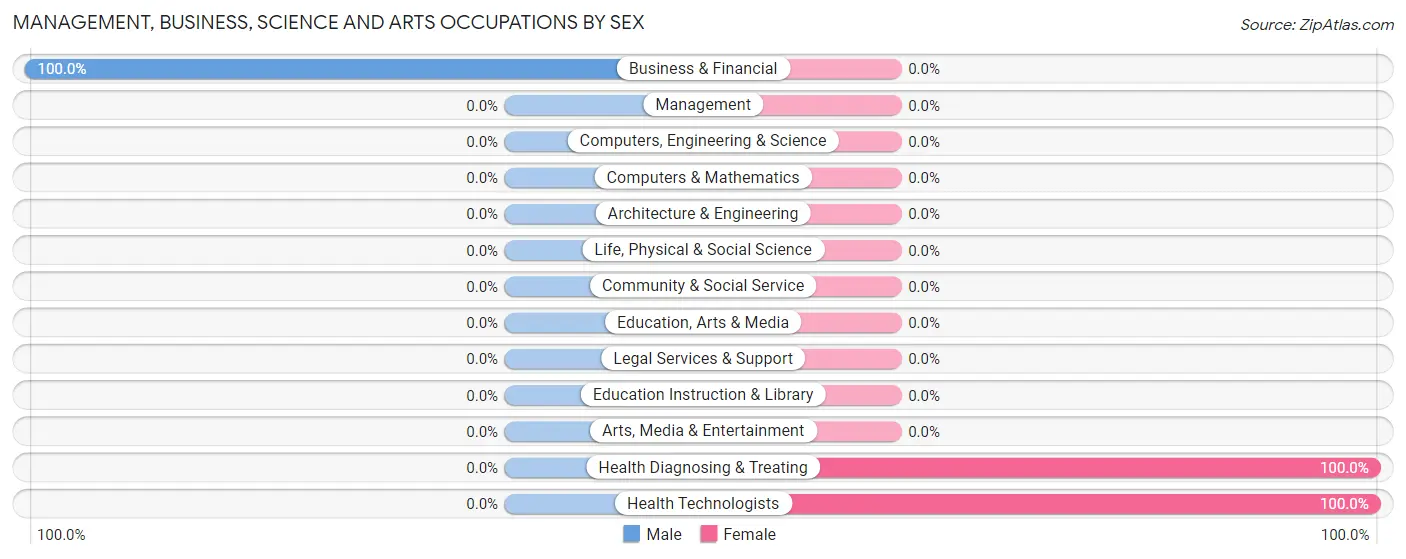
| Occupation | Male | Female |
| Management | 0 (0.0%) | 0 (0.0%) |
| Business & Financial | 13 (100.0%) | 0 (0.0%) |
| Computers, Engineering & Science | 0 (0.0%) | 0 (0.0%) |
| Computers & Mathematics | 0 (0.0%) | 0 (0.0%) |
| Architecture & Engineering | 0 (0.0%) | 0 (0.0%) |
| Life, Physical & Social Science | 0 (0.0%) | 0 (0.0%) |
| Community & Social Service | 0 (0.0%) | 0 (0.0%) |
| Education, Arts & Media | 0 (0.0%) | 0 (0.0%) |
| Legal Services & Support | 0 (0.0%) | 0 (0.0%) |
| Education Instruction & Library | 0 (0.0%) | 0 (0.0%) |
| Arts, Media & Entertainment | 0 (0.0%) | 0 (0.0%) |
| Health Diagnosing & Treating | 0 (0.0%) | 21 (100.0%) |
| Health Technologists | 0 (0.0%) | 12 (100.0%) |
| Total (Category) | 13 (38.2%) | 21 (61.8%) |
| Total (Overall) | 57 (67.1%) | 28 (32.9%) |
Services Occupations
The most common Services occupations in Rabbit Hash are Security & Protection (10 | 11.8%), and Firefighting & Prevention (10 | 11.8%).
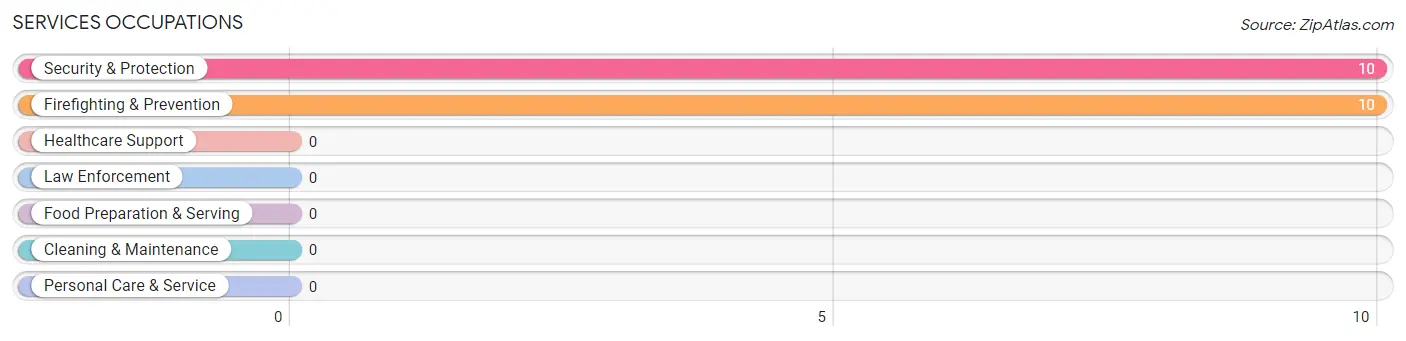
Services Occupations by Sex
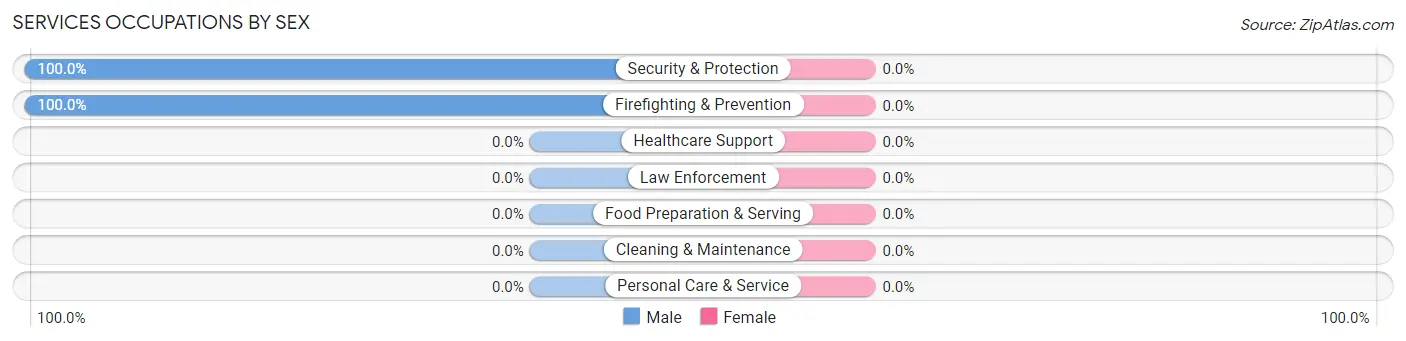
| Occupation | Male | Female |
| Healthcare Support | 0 (0.0%) | 0 (0.0%) |
| Security & Protection | 10 (100.0%) | 0 (0.0%) |
| Firefighting & Prevention | 10 (100.0%) | 0 (0.0%) |
| Law Enforcement | 0 (0.0%) | 0 (0.0%) |
| Food Preparation & Serving | 0 (0.0%) | 0 (0.0%) |
| Cleaning & Maintenance | 0 (0.0%) | 0 (0.0%) |
| Personal Care & Service | 0 (0.0%) | 0 (0.0%) |
| Total (Category) | 10 (100.0%) | 0 (0.0%) |
| Total (Overall) | 57 (67.1%) | 28 (32.9%) |
Sales and Office Occupations
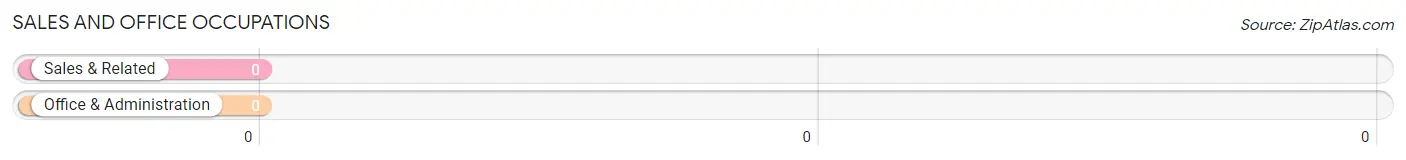
Sales and Office Occupations by Sex
| Occupation | Male | Female |
| Sales & Related | 0 (0.0%) | 0 (0.0%) |
| Office & Administration | 0 (0.0%) | 0 (0.0%) |
| Total (Category) | 0 (0.0%) | 0 (0.0%) |
| Total (Overall) | 57 (67.1%) | 28 (32.9%) |
Natural Resources, Construction and Maintenance Occupations
The most common Natural Resources, Construction and Maintenance occupations in Rabbit Hash are , and Construction & Extraction (34 | 40.0%).
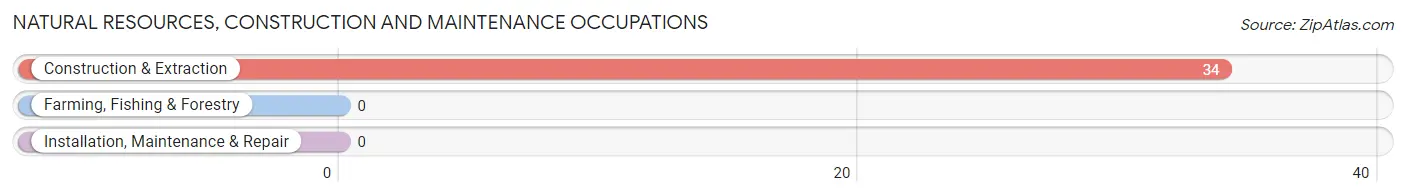
Natural Resources, Construction and Maintenance Occupations by Sex
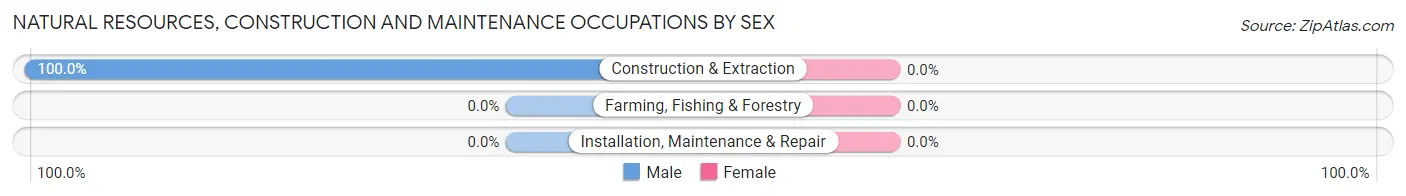
| Occupation | Male | Female |
| Farming, Fishing & Forestry | 0 (0.0%) | 0 (0.0%) |
| Construction & Extraction | 34 (100.0%) | 0 (0.0%) |
| Installation, Maintenance & Repair | 0 (0.0%) | 0 (0.0%) |
| Total (Category) | 34 (100.0%) | 0 (0.0%) |
| Total (Overall) | 57 (67.1%) | 28 (32.9%) |
Production, Transportation and Moving Occupations
The most common Production, Transportation and Moving occupations in Rabbit Hash are , and Material Moving (7 | 8.2%).
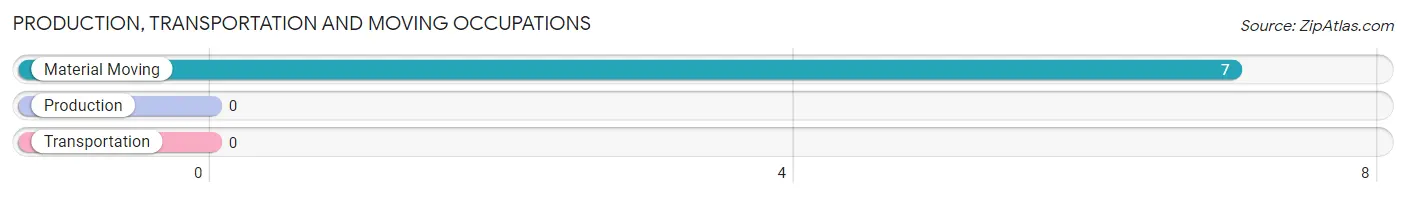
Production, Transportation and Moving Occupations by Sex
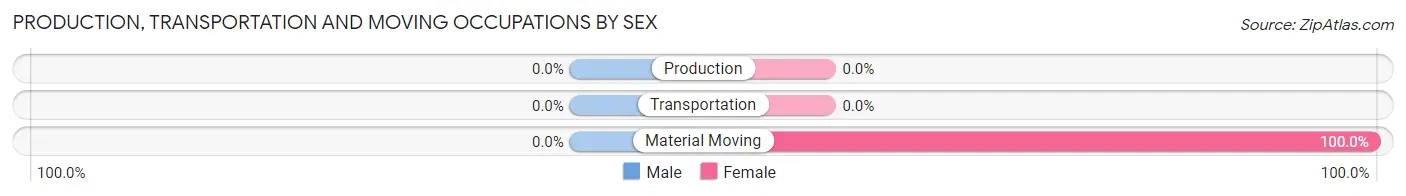
| Occupation | Male | Female |
| Production | 0 (0.0%) | 0 (0.0%) |
| Transportation | 0 (0.0%) | 0 (0.0%) |
| Material Moving | 0 (0.0%) | 7 (100.0%) |
| Total (Category) | 0 (0.0%) | 7 (100.0%) |
| Total (Overall) | 57 (67.1%) | 28 (32.9%) |
Employment Industries by Sex in Rabbit Hash
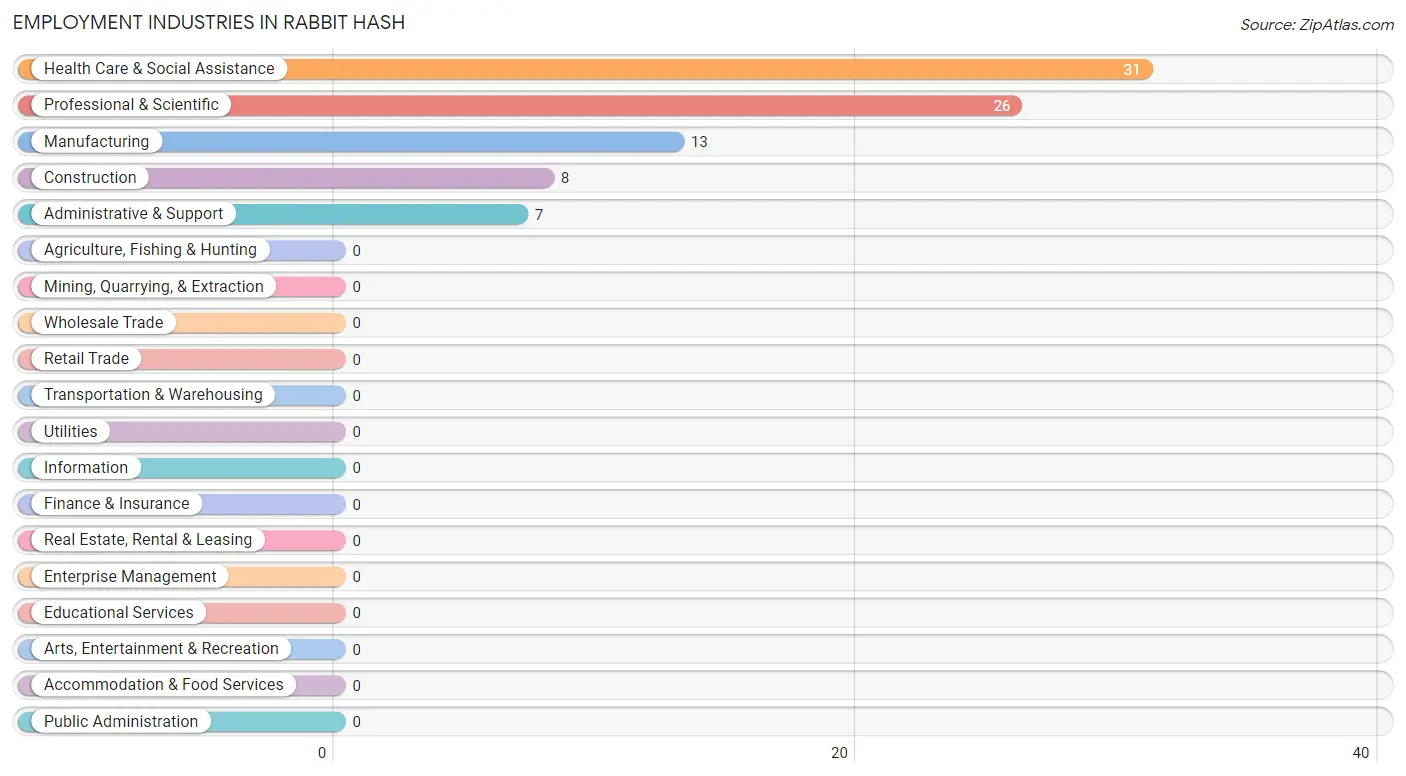
Employment Industries in Rabbit Hash
The major employment industries in Rabbit Hash include Health Care & Social Assistance (31 | 36.5%), Professional & Scientific (26 | 30.6%), Manufacturing (13 | 15.3%), Construction (8 | 9.4%), and Administrative & Support (7 | 8.2%).
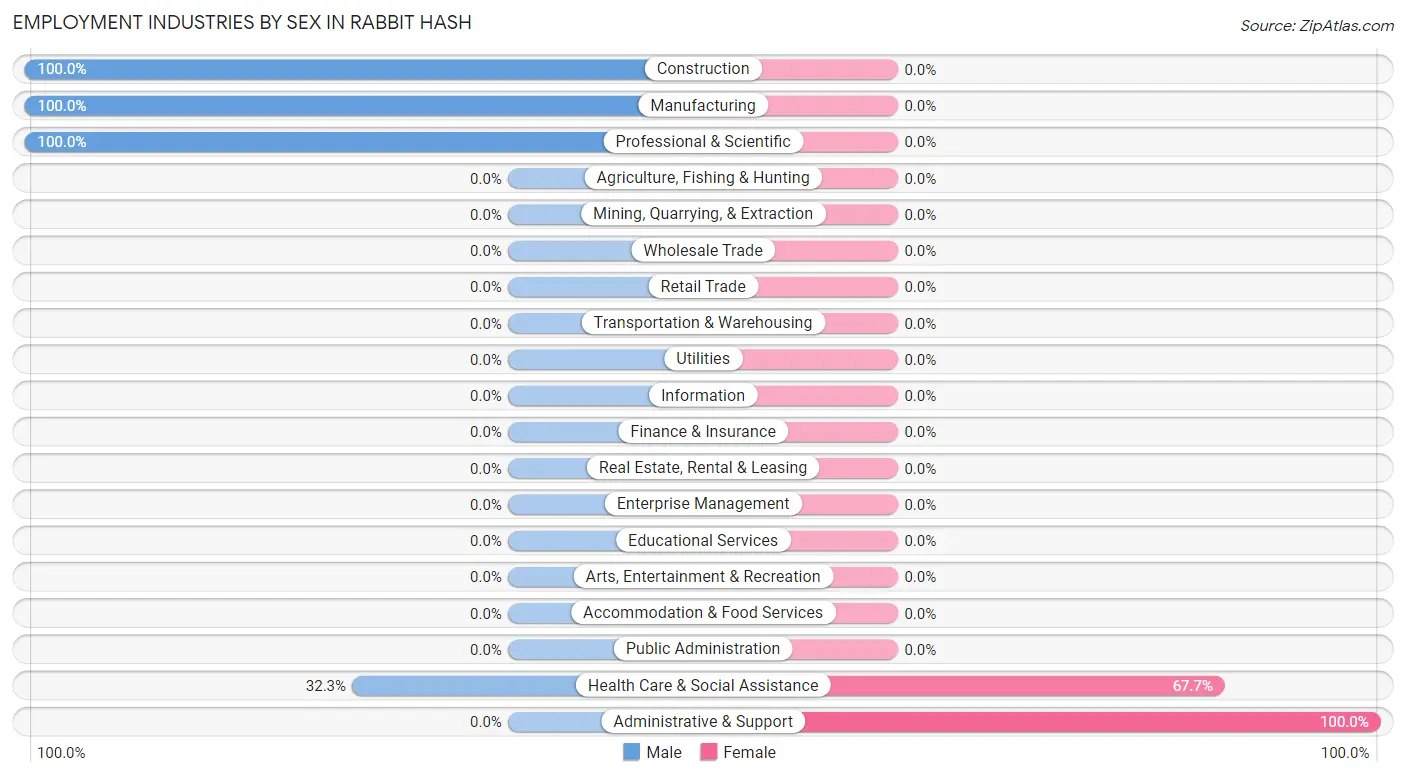
Employment Industries by Sex in Rabbit Hash
The Rabbit Hash industries that see more men than women are Construction (100.0%), Manufacturing (100.0%), and Professional & Scientific (100.0%), whereas the industries that tend to have a higher number of women are Administrative & Support (100.0%), and Health Care & Social Assistance (67.7%).
| Industry | Male | Female |
| Agriculture, Fishing & Hunting | 0 (0.0%) | 0 (0.0%) |
| Mining, Quarrying, & Extraction | 0 (0.0%) | 0 (0.0%) |
| Construction | 8 (100.0%) | 0 (0.0%) |
| Manufacturing | 13 (100.0%) | 0 (0.0%) |
| Wholesale Trade | 0 (0.0%) | 0 (0.0%) |
| Retail Trade | 0 (0.0%) | 0 (0.0%) |
| Transportation & Warehousing | 0 (0.0%) | 0 (0.0%) |
| Utilities | 0 (0.0%) | 0 (0.0%) |
| Information | 0 (0.0%) | 0 (0.0%) |
| Finance & Insurance | 0 (0.0%) | 0 (0.0%) |
| Real Estate, Rental & Leasing | 0 (0.0%) | 0 (0.0%) |
| Professional & Scientific | 26 (100.0%) | 0 (0.0%) |
| Enterprise Management | 0 (0.0%) | 0 (0.0%) |
| Administrative & Support | 0 (0.0%) | 7 (100.0%) |
| Educational Services | 0 (0.0%) | 0 (0.0%) |
| Health Care & Social Assistance | 10 (32.3%) | 21 (67.7%) |
| Arts, Entertainment & Recreation | 0 (0.0%) | 0 (0.0%) |
| Accommodation & Food Services | 0 (0.0%) | 0 (0.0%) |
| Public Administration | 0 (0.0%) | 0 (0.0%) |
| Total | 57 (67.1%) | 28 (32.9%) |
Education in Rabbit Hash
School Enrollment in Rabbit Hash
| School Level | # Students | % Students |
| Nursery / Preschool | 0 | 0.0% |
| Kindergarten | 0 | 0.0% |
| Elementary School | 0 | 0.0% |
| Middle School | 0 | 0.0% |
| High School | 0 | 0.0% |
| College / Undergraduate | 0 | 0.0% |
| Graduate / Professional | 0 | 0.0% |
| Total | 0 | 0.0% |
School Enrollment by Age by Funding Source in Rabbit Hash
| Age Bracket | Public School | Private School |
| 3 to 4 Year Olds | 0 (0.0%) | 0 (0.0%) |
| 5 to 9 Year Old | 0 (0.0%) | 0 (0.0%) |
| 10 to 14 Year Olds | 0 (0.0%) | 0 (0.0%) |
| 15 to 17 Year Olds | 0 (0.0%) | 0 (0.0%) |
| 18 to 19 Year Olds | 0 (0.0%) | 0 (0.0%) |
| 20 to 24 Year Olds | 0 (0.0%) | 0 (0.0%) |
| 25 to 34 Year Olds | 0 (0.0%) | 0 (0.0%) |
| 35 Years and over | 0 (0.0%) | 0 (0.0%) |
| Total | 0 (0.0%) | 0 (0.0%) |
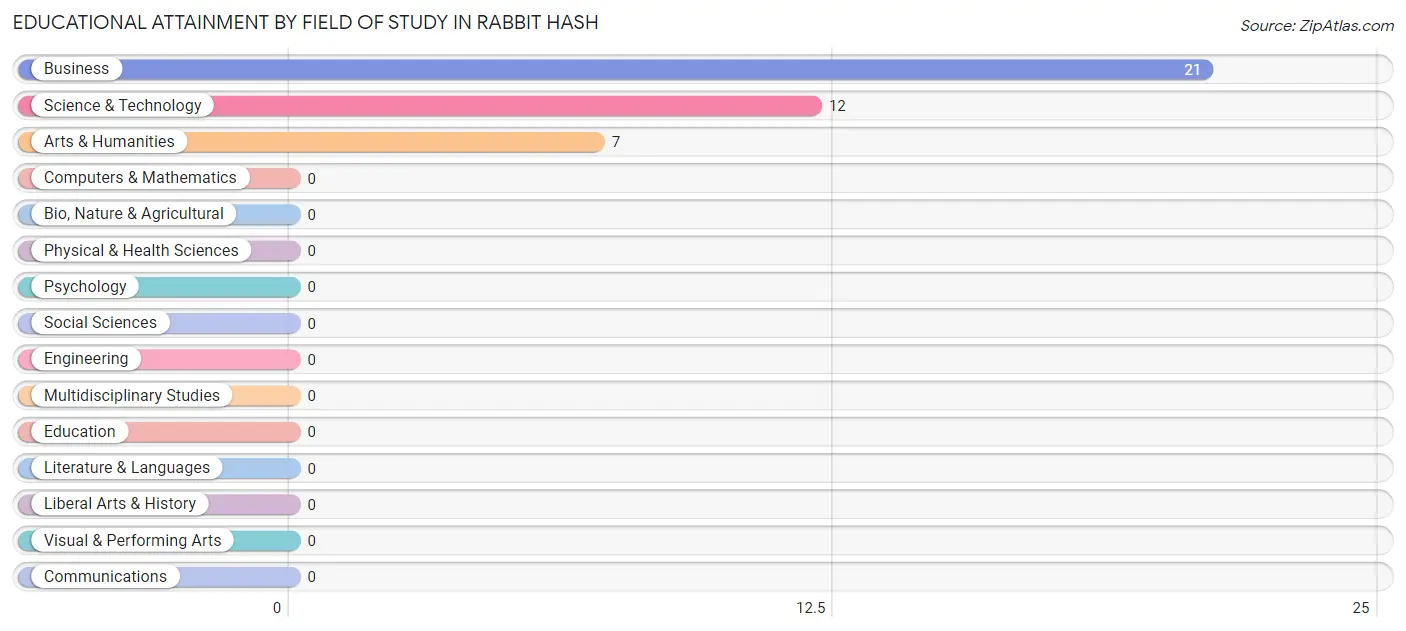
Educational Attainment by Field of Study in Rabbit Hash
Business (21 | 52.5%), science & technology (12 | 30.0%), and arts & humanities (7 | 17.5%) are the most common fields of study among 40 individuals in Rabbit Hash who have obtained a bachelor's degree or higher.
| Field of Study | # Graduates | % Graduates |
| Computers & Mathematics | 0 | 0.0% |
| Bio, Nature & Agricultural | 0 | 0.0% |
| Physical & Health Sciences | 0 | 0.0% |
| Psychology | 0 | 0.0% |
| Social Sciences | 0 | 0.0% |
| Engineering | 0 | 0.0% |
| Multidisciplinary Studies | 0 | 0.0% |
| Science & Technology | 12 | 30.0% |
| Business | 21 | 52.5% |
| Education | 0 | 0.0% |
| Literature & Languages | 0 | 0.0% |
| Liberal Arts & History | 0 | 0.0% |
| Visual & Performing Arts | 0 | 0.0% |
| Communications | 0 | 0.0% |
| Arts & Humanities | 7 | 17.5% |
| Total | 40 | 100.0% |
Transportation & Commute in Rabbit Hash
Vehicle Availability by Sex in Rabbit Hash
The most prevalent vehicle ownership categories in Rabbit Hash are males with 1 vehicle (26, accounting for 53.1%) and females with 1 vehicle (0, making up 92.9%).
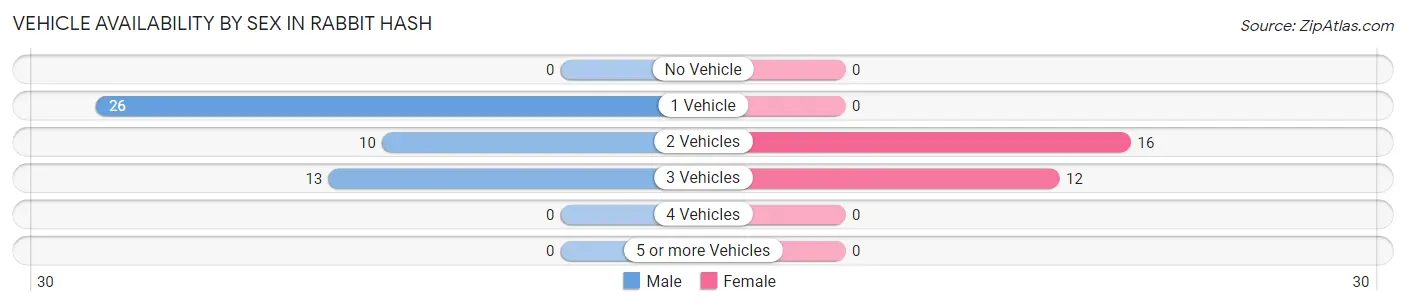
| Vehicles Available | Male | Female |
| No Vehicle | 0 (0.0%) | 0 (0.0%) |
| 1 Vehicle | 26 (53.1%) | 0 (0.0%) |
| 2 Vehicles | 10 (20.4%) | 16 (57.1%) |
| 3 Vehicles | 13 (26.5%) | 12 (42.9%) |
| 4 Vehicles | 0 (0.0%) | 0 (0.0%) |
| 5 or more Vehicles | 0 (0.0%) | 0 (0.0%) |
| Total | 49 (100.0%) | 28 (100.0%) |
Commute Time in Rabbit Hash
The most frequently occuring commute durations in Rabbit Hash are 45 to 59 minutes (26 commuters, 40.6%), 5 to 9 minutes (19 commuters, 29.7%), and 25 to 29 minutes (12 commuters, 18.8%).
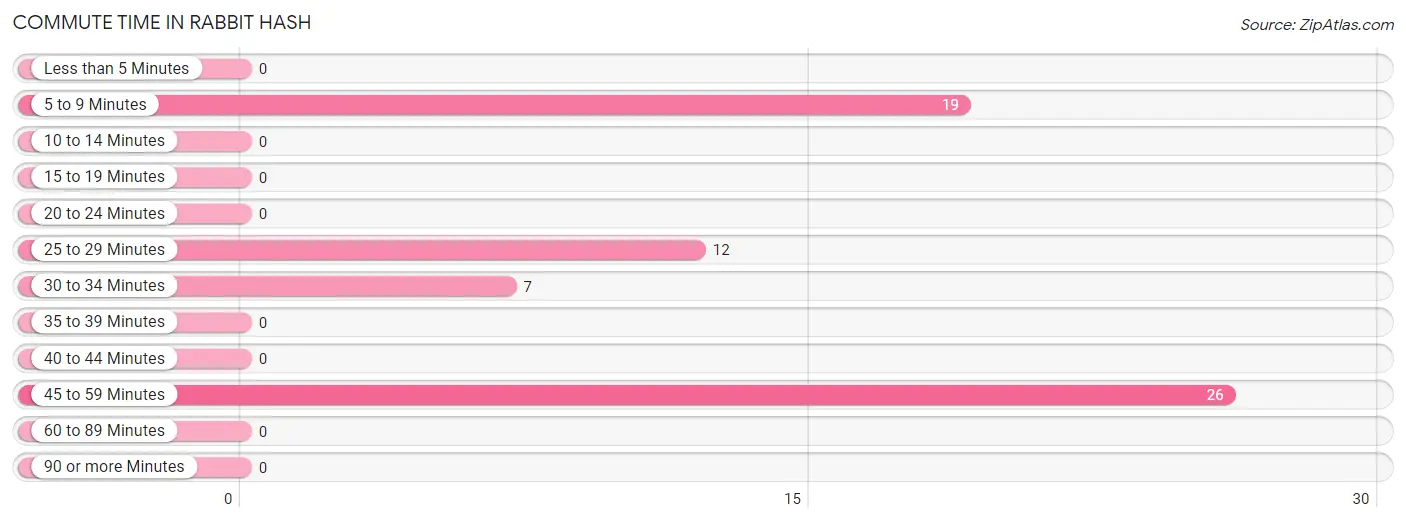
| Commute Time | # Commuters | % Commuters |
| Less than 5 Minutes | 0 | 0.0% |
| 5 to 9 Minutes | 19 | 29.7% |
| 10 to 14 Minutes | 0 | 0.0% |
| 15 to 19 Minutes | 0 | 0.0% |
| 20 to 24 Minutes | 0 | 0.0% |
| 25 to 29 Minutes | 12 | 18.8% |
| 30 to 34 Minutes | 7 | 10.9% |
| 35 to 39 Minutes | 0 | 0.0% |
| 40 to 44 Minutes | 0 | 0.0% |
| 45 to 59 Minutes | 26 | 40.6% |
| 60 to 89 Minutes | 0 | 0.0% |
| 90 or more Minutes | 0 | 0.0% |
Commute Time by Sex in Rabbit Hash
The most common commute times in Rabbit Hash are 45 to 59 minutes (26 commuters, 72.2%) for males and 25 to 29 minutes (12 commuters, 42.9%) for females.
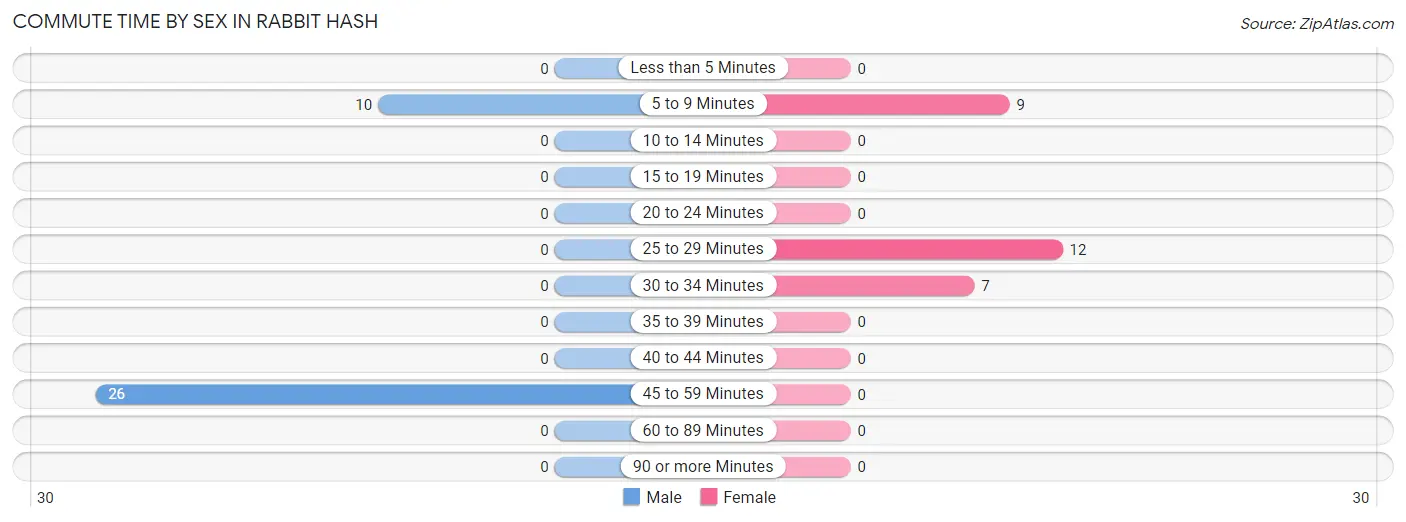
| Commute Time | Male | Female |
| Less than 5 Minutes | 0 (0.0%) | 0 (0.0%) |
| 5 to 9 Minutes | 10 (27.8%) | 9 (32.1%) |
| 10 to 14 Minutes | 0 (0.0%) | 0 (0.0%) |
| 15 to 19 Minutes | 0 (0.0%) | 0 (0.0%) |
| 20 to 24 Minutes | 0 (0.0%) | 0 (0.0%) |
| 25 to 29 Minutes | 0 (0.0%) | 12 (42.9%) |
| 30 to 34 Minutes | 0 (0.0%) | 7 (25.0%) |
| 35 to 39 Minutes | 0 (0.0%) | 0 (0.0%) |
| 40 to 44 Minutes | 0 (0.0%) | 0 (0.0%) |
| 45 to 59 Minutes | 26 (72.2%) | 0 (0.0%) |
| 60 to 89 Minutes | 0 (0.0%) | 0 (0.0%) |
| 90 or more Minutes | 0 (0.0%) | 0 (0.0%) |
Time of Departure to Work by Sex in Rabbit Hash
The most frequent times of departure to work in Rabbit Hash are 7:30 AM to 7:59 AM (26, 72.2%) for males and 6:00 AM to 6:29 AM (19, 67.9%) for females.
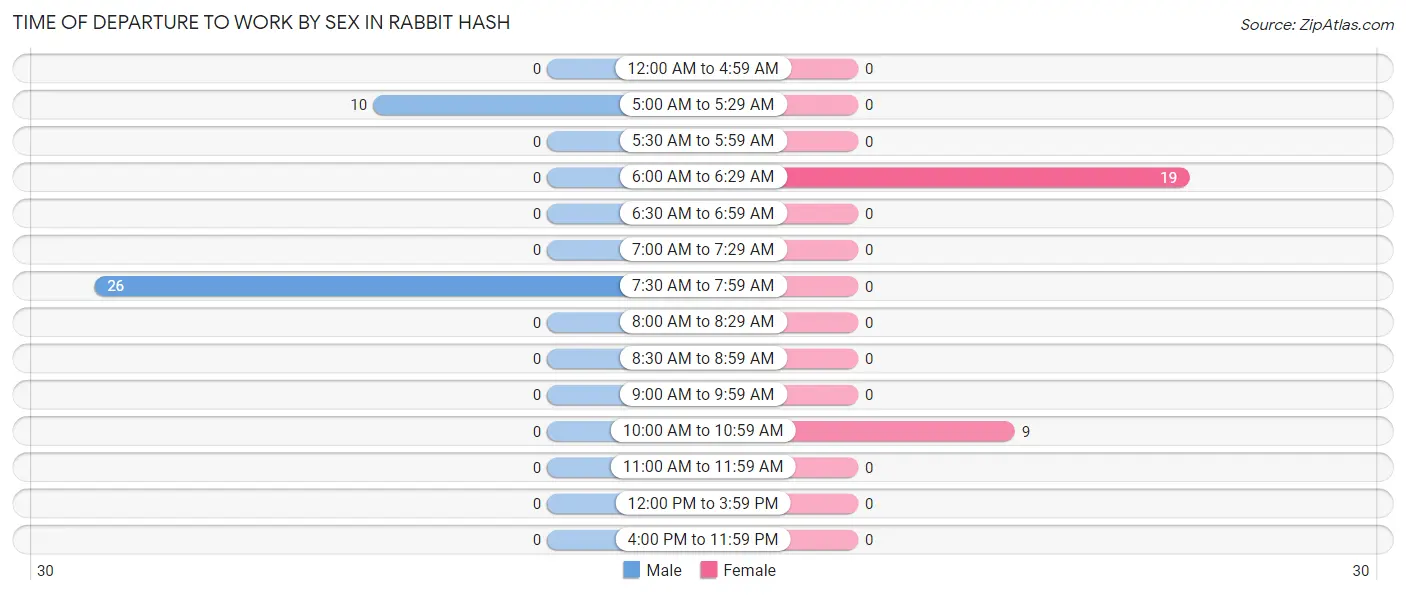
| Time of Departure | Male | Female |
| 12:00 AM to 4:59 AM | 0 (0.0%) | 0 (0.0%) |
| 5:00 AM to 5:29 AM | 10 (27.8%) | 0 (0.0%) |
| 5:30 AM to 5:59 AM | 0 (0.0%) | 0 (0.0%) |
| 6:00 AM to 6:29 AM | 0 (0.0%) | 19 (67.9%) |
| 6:30 AM to 6:59 AM | 0 (0.0%) | 0 (0.0%) |
| 7:00 AM to 7:29 AM | 0 (0.0%) | 0 (0.0%) |
| 7:30 AM to 7:59 AM | 26 (72.2%) | 0 (0.0%) |
| 8:00 AM to 8:29 AM | 0 (0.0%) | 0 (0.0%) |
| 8:30 AM to 8:59 AM | 0 (0.0%) | 0 (0.0%) |
| 9:00 AM to 9:59 AM | 0 (0.0%) | 0 (0.0%) |
| 10:00 AM to 10:59 AM | 0 (0.0%) | 9 (32.1%) |
| 11:00 AM to 11:59 AM | 0 (0.0%) | 0 (0.0%) |
| 12:00 PM to 3:59 PM | 0 (0.0%) | 0 (0.0%) |
| 4:00 PM to 11:59 PM | 0 (0.0%) | 0 (0.0%) |
| Total | 36 (100.0%) | 28 (100.0%) |
Housing Occupancy in Rabbit Hash
Occupancy by Ownership in Rabbit Hash
Of the total 80 dwellings in Rabbit Hash, owner-occupied units account for 80 (100.0%), while renter-occupied units make up 0 (0.0%).
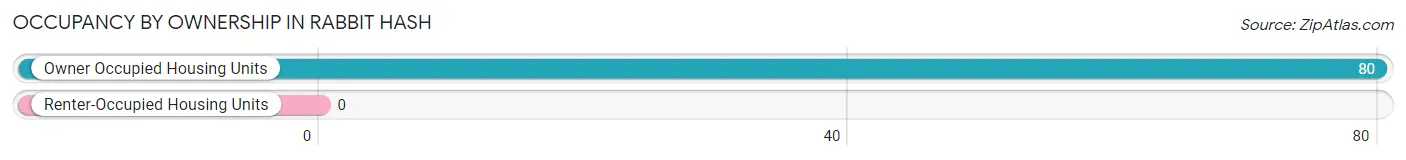
| Occupancy | # Housing Units | % Housing Units |
| Owner Occupied Housing Units | 80 | 100.0% |
| Renter-Occupied Housing Units | 0 | 0.0% |
| Total Occupied Housing Units | 80 | 100.0% |
Occupancy by Household Size in Rabbit Hash
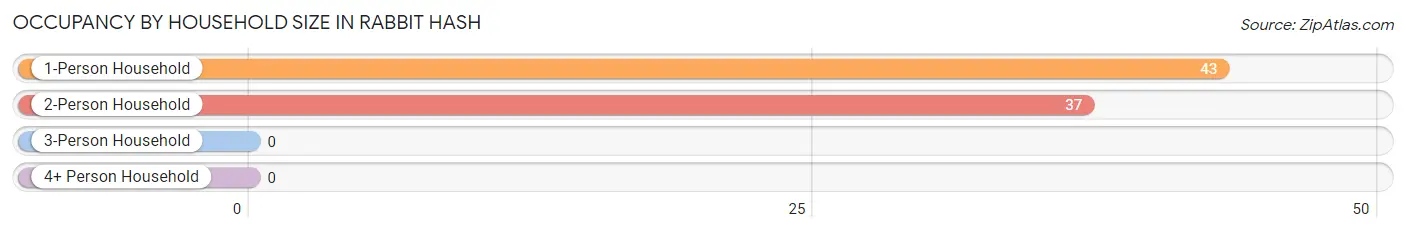
| Household Size | # Housing Units | % Housing Units |
| 1-Person Household | 43 | 53.7% |
| 2-Person Household | 37 | 46.3% |
| 3-Person Household | 0 | 0.0% |
| 4+ Person Household | 0 | 0.0% |
| Total Housing Units | 80 | 100.0% |
Occupancy by Ownership by Household Size in Rabbit Hash
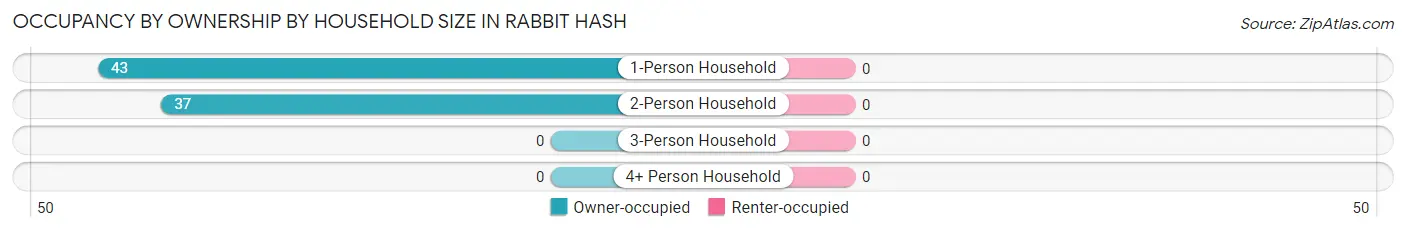
| Household Size | Owner-occupied | Renter-occupied |
| 1-Person Household | 43 (100.0%) | 0 (0.0%) |
| 2-Person Household | 37 (100.0%) | 0 (0.0%) |
| 3-Person Household | 0 (0.0%) | 0 (0.0%) |
| 4+ Person Household | 0 (0.0%) | 0 (0.0%) |
| Total Housing Units | 80 (100.0%) | 0 (0.0%) |
Occupancy by Educational Attainment in Rabbit Hash
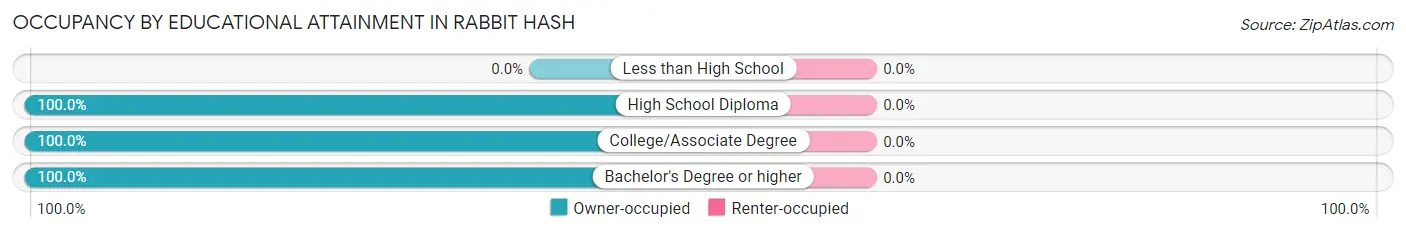
| Household Size | Owner-occupied | Renter-occupied |
| Less than High School | 0 (0.0%) | 0 (0.0%) |
| High School Diploma | 8 (100.0%) | 0 (0.0%) |
| College/Associate Degree | 51 (100.0%) | 0 (0.0%) |
| Bachelor's Degree or higher | 21 (100.0%) | 0 (0.0%) |
Occupancy by Age of Householder in Rabbit Hash
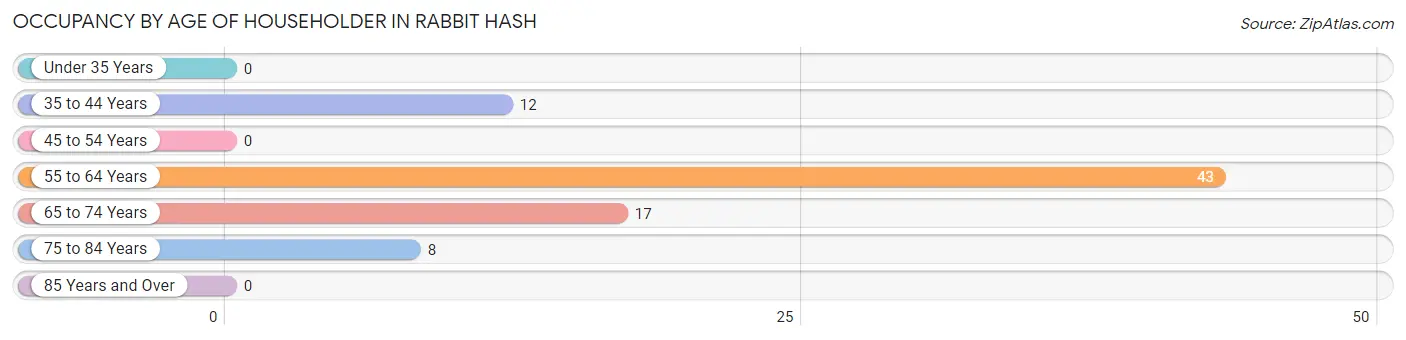
| Age Bracket | # Households | % Households |
| Under 35 Years | 0 | 0.0% |
| 35 to 44 Years | 12 | 15.0% |
| 45 to 54 Years | 0 | 0.0% |
| 55 to 64 Years | 43 | 53.7% |
| 65 to 74 Years | 17 | 21.2% |
| 75 to 84 Years | 8 | 10.0% |
| 85 Years and Over | 0 | 0.0% |
| Total | 80 | 100.0% |
Housing Finances in Rabbit Hash
Median Income by Occupancy in Rabbit Hash
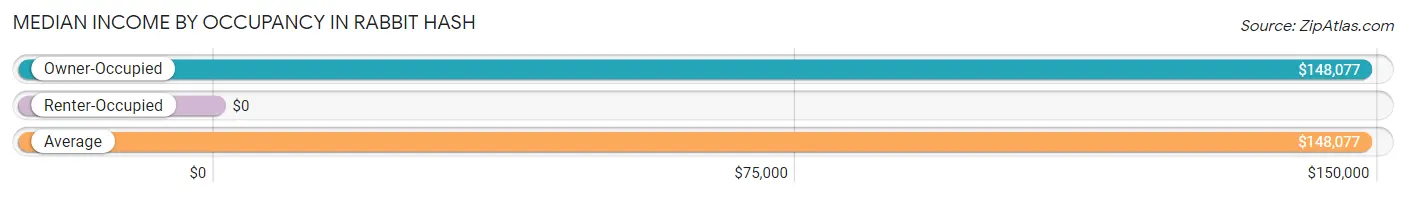
| Occupancy Type | # Households | Median Income |
| Owner-Occupied | 80 (100.0%) | $148,077 |
| Renter-Occupied | 0 (0.0%) | $0 |
| Average | 80 (100.0%) | $148,077 |
Occupancy by Householder Income Bracket in Rabbit Hash
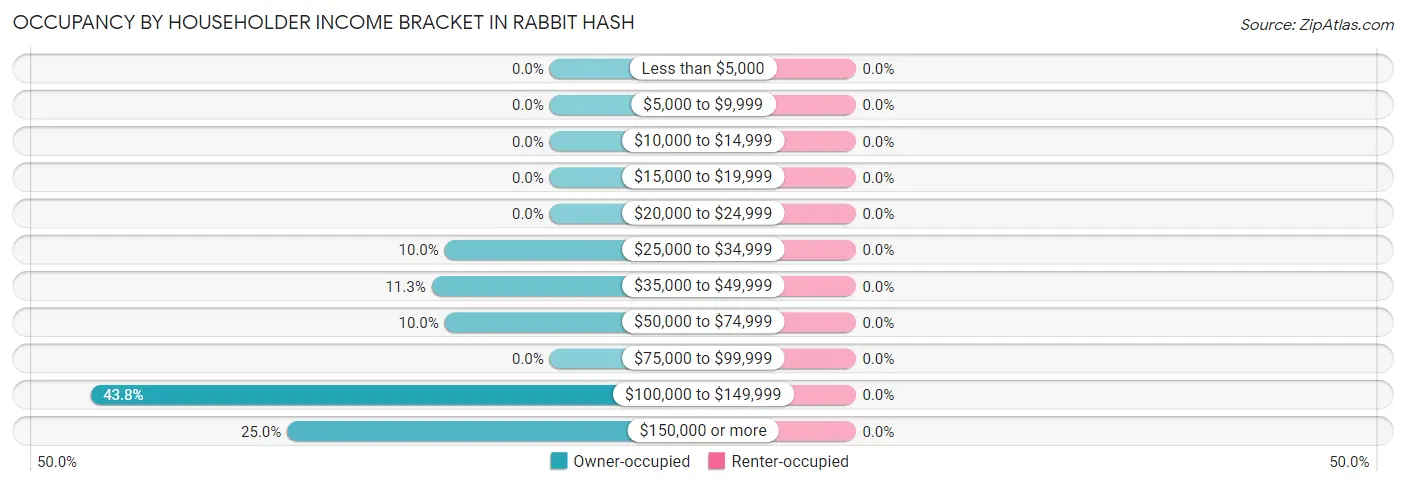
| Income Bracket | Owner-occupied | Renter-occupied |
| Less than $5,000 | 0 (0.0%) | 0 (0.0%) |
| $5,000 to $9,999 | 0 (0.0%) | 0 (0.0%) |
| $10,000 to $14,999 | 0 (0.0%) | 0 (0.0%) |
| $15,000 to $19,999 | 0 (0.0%) | 0 (0.0%) |
| $20,000 to $24,999 | 0 (0.0%) | 0 (0.0%) |
| $25,000 to $34,999 | 8 (10.0%) | 0 (0.0%) |
| $35,000 to $49,999 | 9 (11.3%) | 0 (0.0%) |
| $50,000 to $74,999 | 8 (10.0%) | 0 (0.0%) |
| $75,000 to $99,999 | 0 (0.0%) | 0 (0.0%) |
| $100,000 to $149,999 | 35 (43.8%) | 0 (0.0%) |
| $150,000 or more | 20 (25.0%) | 0 (0.0%) |
| Total | 80 (100.0%) | 0 (0.0%) |
Monthly Housing Cost Tiers in Rabbit Hash
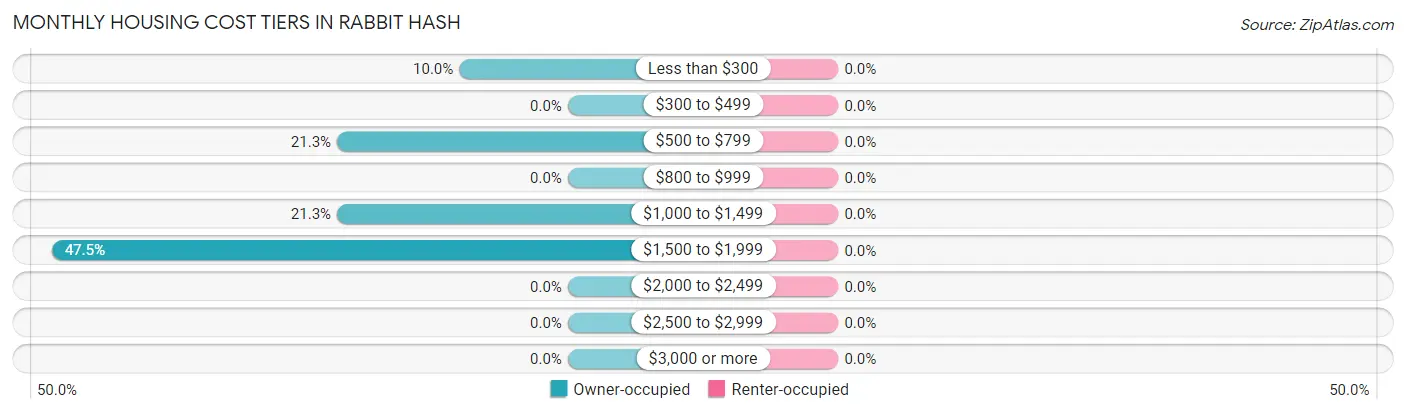
| Monthly Cost | Owner-occupied | Renter-occupied |
| Less than $300 | 8 (10.0%) | 0 (0.0%) |
| $300 to $499 | 0 (0.0%) | 0 (0.0%) |
| $500 to $799 | 17 (21.2%) | 0 (0.0%) |
| $800 to $999 | 0 (0.0%) | 0 (0.0%) |
| $1,000 to $1,499 | 17 (21.2%) | 0 (0.0%) |
| $1,500 to $1,999 | 38 (47.5%) | 0 (0.0%) |
| $2,000 to $2,499 | 0 (0.0%) | 0 (0.0%) |
| $2,500 to $2,999 | 0 (0.0%) | 0 (0.0%) |
| $3,000 or more | 0 (0.0%) | 0 (0.0%) |
| Total | 80 (100.0%) | 0 (0.0%) |
Physical Housing Characteristics in Rabbit Hash
Housing Structures in Rabbit Hash
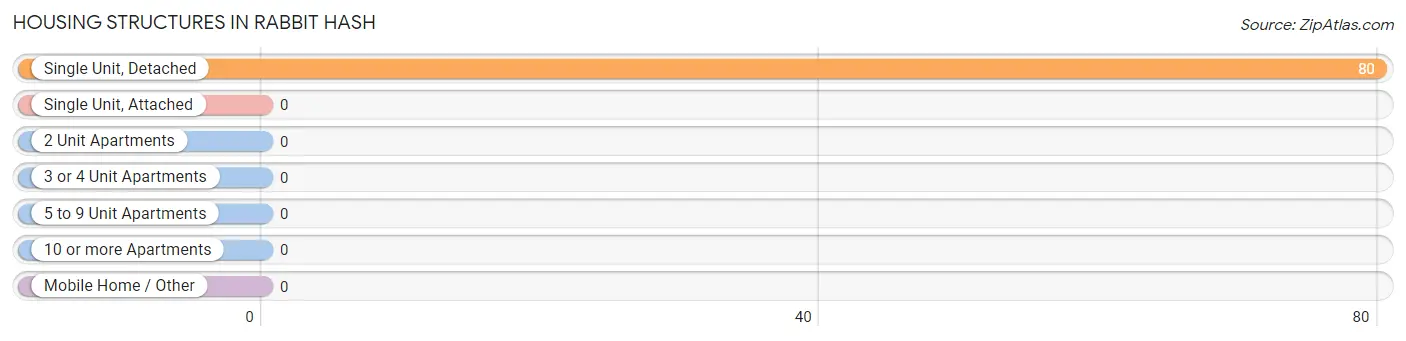
| Structure Type | # Housing Units | % Housing Units |
| Single Unit, Detached | 80 | 100.0% |
| Single Unit, Attached | 0 | 0.0% |
| 2 Unit Apartments | 0 | 0.0% |
| 3 or 4 Unit Apartments | 0 | 0.0% |
| 5 to 9 Unit Apartments | 0 | 0.0% |
| 10 or more Apartments | 0 | 0.0% |
| Mobile Home / Other | 0 | 0.0% |
| Total | 80 | 100.0% |
Housing Structures by Occupancy in Rabbit Hash
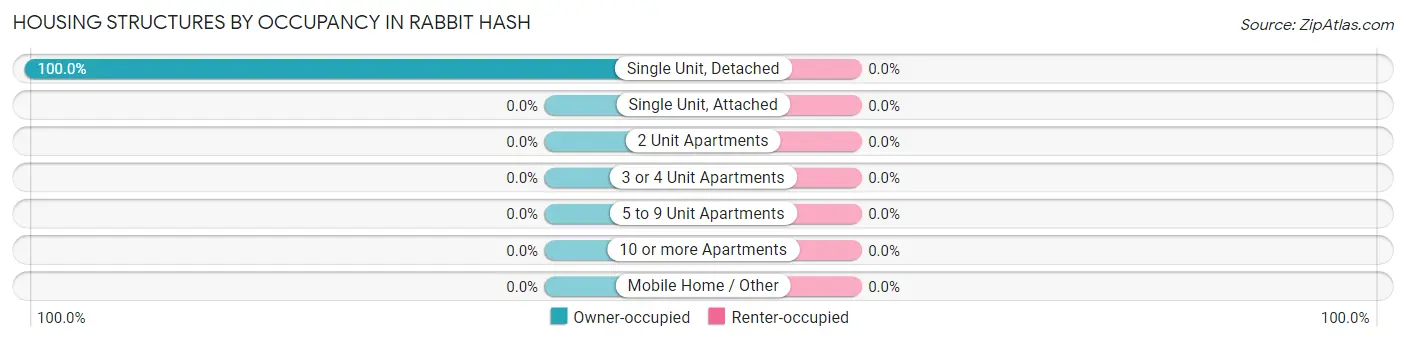
| Structure Type | Owner-occupied | Renter-occupied |
| Single Unit, Detached | 80 (100.0%) | 0 (0.0%) |
| Single Unit, Attached | 0 (0.0%) | 0 (0.0%) |
| 2 Unit Apartments | 0 (0.0%) | 0 (0.0%) |
| 3 or 4 Unit Apartments | 0 (0.0%) | 0 (0.0%) |
| 5 to 9 Unit Apartments | 0 (0.0%) | 0 (0.0%) |
| 10 or more Apartments | 0 (0.0%) | 0 (0.0%) |
| Mobile Home / Other | 0 (0.0%) | 0 (0.0%) |
| Total | 80 (100.0%) | 0 (0.0%) |
Housing Structures by Number of Rooms in Rabbit Hash
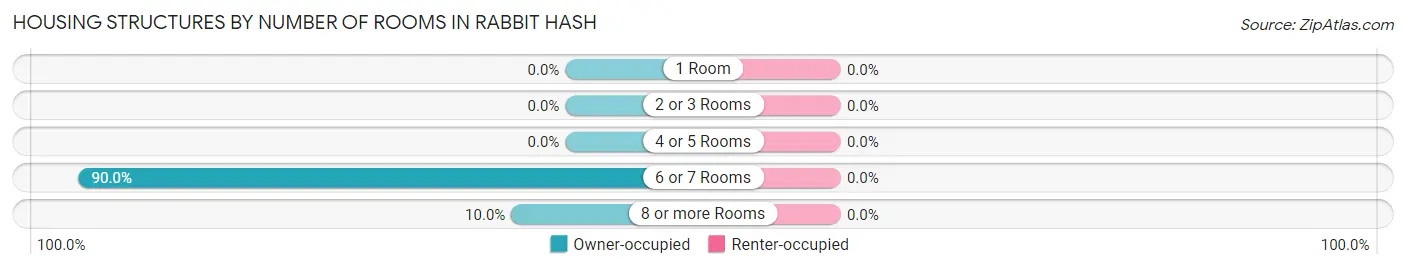
| Number of Rooms | Owner-occupied | Renter-occupied |
| 1 Room | 0 (0.0%) | 0 (0.0%) |
| 2 or 3 Rooms | 0 (0.0%) | 0 (0.0%) |
| 4 or 5 Rooms | 0 (0.0%) | 0 (0.0%) |
| 6 or 7 Rooms | 72 (90.0%) | 0 (0.0%) |
| 8 or more Rooms | 8 (10.0%) | 0 (0.0%) |
| Total | 80 (100.0%) | 0 (0.0%) |
Housing Structure by Heating Type in Rabbit Hash
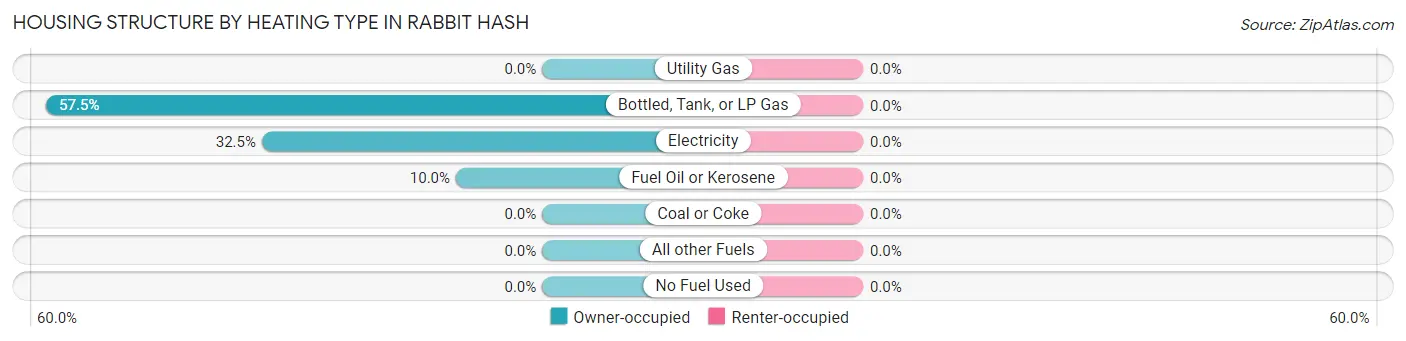
| Heating Type | Owner-occupied | Renter-occupied |
| Utility Gas | 0 (0.0%) | 0 (0.0%) |
| Bottled, Tank, or LP Gas | 46 (57.5%) | 0 (0.0%) |
| Electricity | 26 (32.5%) | 0 (0.0%) |
| Fuel Oil or Kerosene | 8 (10.0%) | 0 (0.0%) |
| Coal or Coke | 0 (0.0%) | 0 (0.0%) |
| All other Fuels | 0 (0.0%) | 0 (0.0%) |
| No Fuel Used | 0 (0.0%) | 0 (0.0%) |
| Total | 80 (100.0%) | 0 (0.0%) |
Household Vehicle Usage in Rabbit Hash
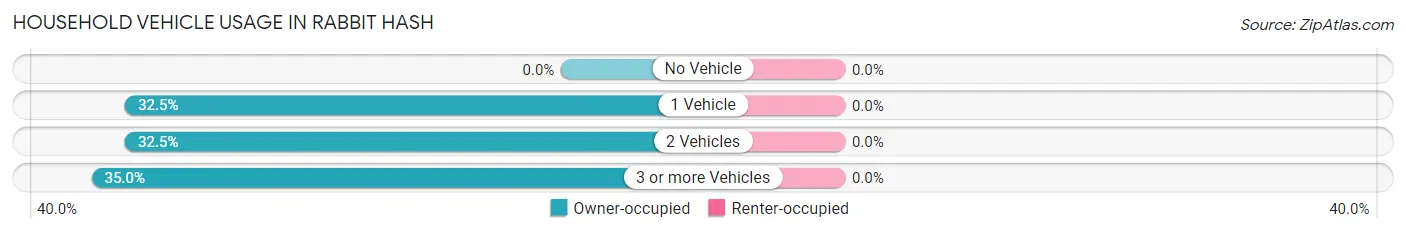
| Vehicles per Household | Owner-occupied | Renter-occupied |
| No Vehicle | 0 (0.0%) | 0 (0.0%) |
| 1 Vehicle | 26 (32.5%) | 0 (0.0%) |
| 2 Vehicles | 26 (32.5%) | 0 (0.0%) |
| 3 or more Vehicles | 28 (35.0%) | 0 (0.0%) |
| Total | 80 (100.0%) | 0 (0.0%) |
Real Estate & Mortgages in Rabbit Hash
Real Estate and Mortgage Overview in Rabbit Hash
| Characteristic | Without Mortgage | With Mortgage |
| Housing Units | 16 | 64 |
| Median Property Value | - | - |
| Median Household Income | - | - |
| Monthly Housing Costs | - | - |
| Real Estate Taxes | - | - |
Property Value by Mortgage Status in Rabbit Hash
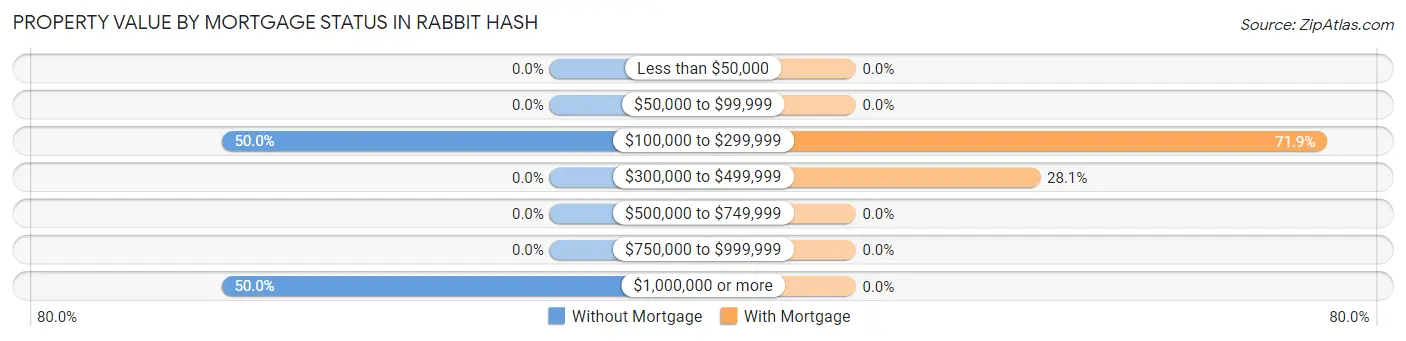
| Property Value | Without Mortgage | With Mortgage |
| Less than $50,000 | 0 (0.0%) | 0 (0.0%) |
| $50,000 to $99,999 | 0 (0.0%) | 0 (0.0%) |
| $100,000 to $299,999 | 8 (50.0%) | 46 (71.9%) |
| $300,000 to $499,999 | 0 (0.0%) | 18 (28.1%) |
| $500,000 to $749,999 | 0 (0.0%) | 0 (0.0%) |
| $750,000 to $999,999 | 0 (0.0%) | 0 (0.0%) |
| $1,000,000 or more | 8 (50.0%) | 0 (0.0%) |
| Total | 16 (100.0%) | 64 (100.0%) |
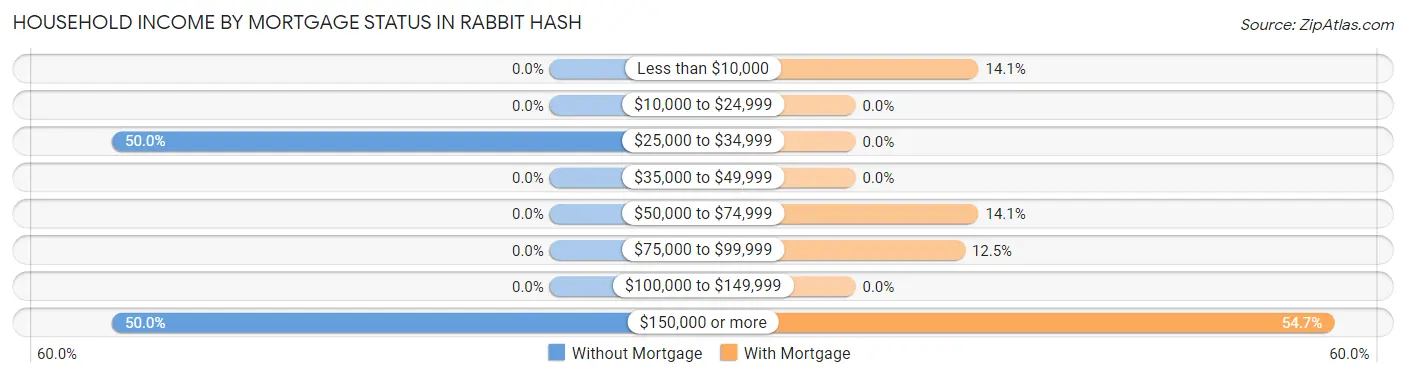
Household Income by Mortgage Status in Rabbit Hash
| Household Income | Without Mortgage | With Mortgage |
| Less than $10,000 | 0 (0.0%) | 9 (14.1%) |
| $10,000 to $24,999 | 0 (0.0%) | 0 (0.0%) |
| $25,000 to $34,999 | 8 (50.0%) | 0 (0.0%) |
| $35,000 to $49,999 | 0 (0.0%) | 0 (0.0%) |
| $50,000 to $74,999 | 0 (0.0%) | 9 (14.1%) |
| $75,000 to $99,999 | 0 (0.0%) | 8 (12.5%) |
| $100,000 to $149,999 | 0 (0.0%) | 0 (0.0%) |
| $150,000 or more | 8 (50.0%) | 35 (54.7%) |
| Total | 16 (100.0%) | 64 (100.0%) |
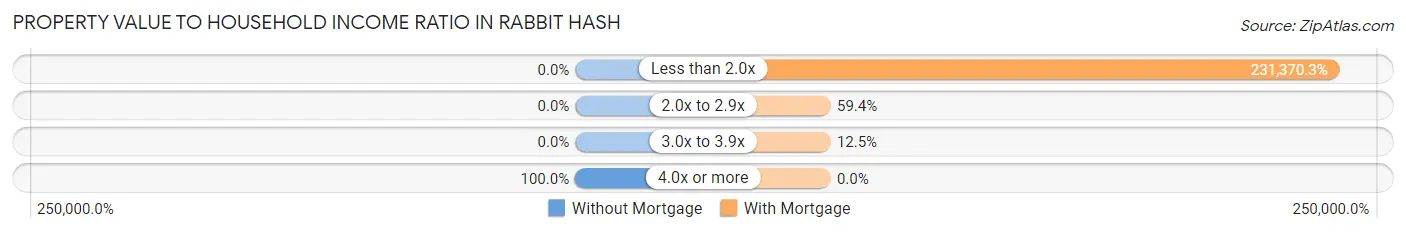
Property Value to Household Income Ratio in Rabbit Hash
| Value-to-Income Ratio | Without Mortgage | With Mortgage |
| Less than 2.0x | 0 (0.0%) | 148,077 (231,370.3%) |
| 2.0x to 2.9x | 0 (0.0%) | 38 (59.4%) |
| 3.0x to 3.9x | 0 (0.0%) | 8 (12.5%) |
| 4.0x or more | 16 (100.0%) | 0 (0.0%) |
| Total | 16 (100.0%) | 64 (100.0%) |
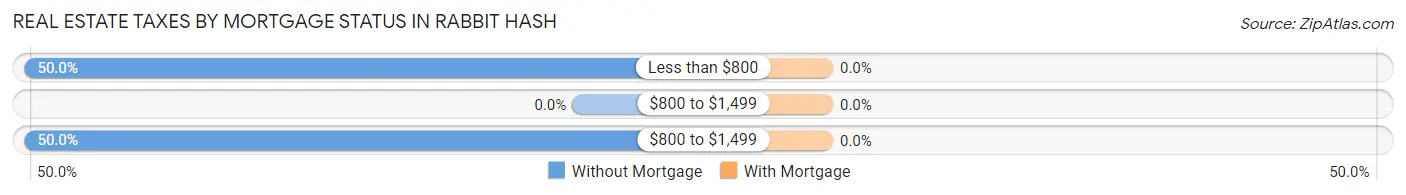
Real Estate Taxes by Mortgage Status in Rabbit Hash
| Property Taxes | Without Mortgage | With Mortgage |
| Less than $800 | 8 (50.0%) | 0 (0.0%) |
| $800 to $1,499 | 0 (0.0%) | 0 (0.0%) |
| $800 to $1,499 | 8 (50.0%) | 0 (0.0%) |
| Total | 16 (100.0%) | 64 (100.0%) |
Health & Disability in Rabbit Hash
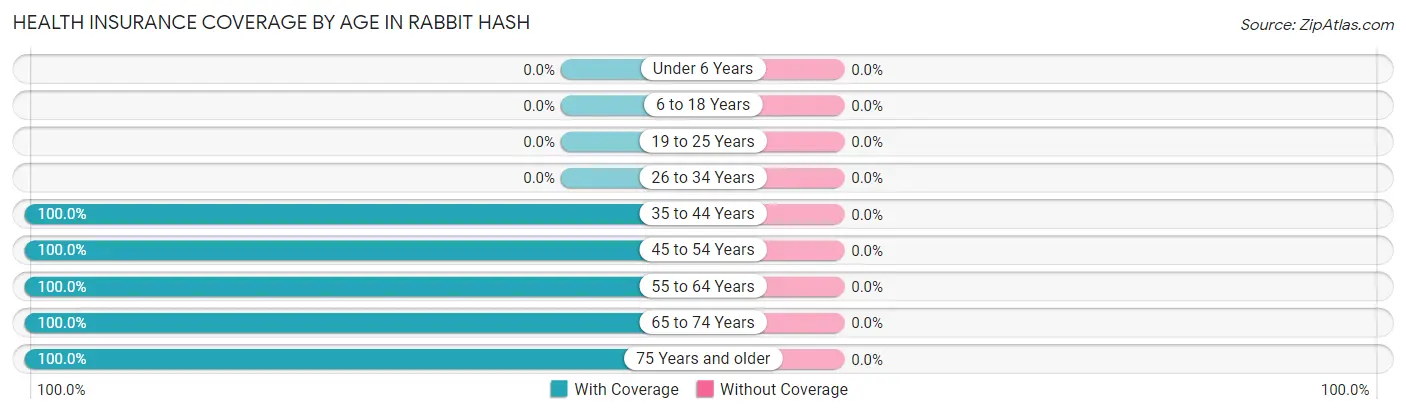
Health Insurance Coverage by Age in Rabbit Hash
| Age Bracket | With Coverage | Without Coverage |
| Under 6 Years | 0 (0.0%) | 0 (0.0%) |
| 6 to 18 Years | 0 (0.0%) | 0 (0.0%) |
| 19 to 25 Years | 0 (0.0%) | 0 (0.0%) |
| 26 to 34 Years | 0 (0.0%) | 0 (0.0%) |
| 35 to 44 Years | 12 (100.0%) | 0 (0.0%) |
| 45 to 54 Years | 13 (100.0%) | 0 (0.0%) |
| 55 to 64 Years | 60 (100.0%) | 0 (0.0%) |
| 65 to 74 Years | 17 (100.0%) | 0 (0.0%) |
| 75 Years and older | 15 (100.0%) | 0 (0.0%) |
| Total | 117 (100.0%) | 0 (0.0%) |
Health Insurance Coverage by Citizenship Status in Rabbit Hash
| Citizenship Status | With Coverage | Without Coverage |
| Native Born | 0 (0.0%) | 0 (0.0%) |
| Foreign Born, Citizen | 0 (0.0%) | 0 (0.0%) |
| Foreign Born, not a Citizen | 0 (0.0%) | 0 (0.0%) |
Health Insurance Coverage by Household Income in Rabbit Hash
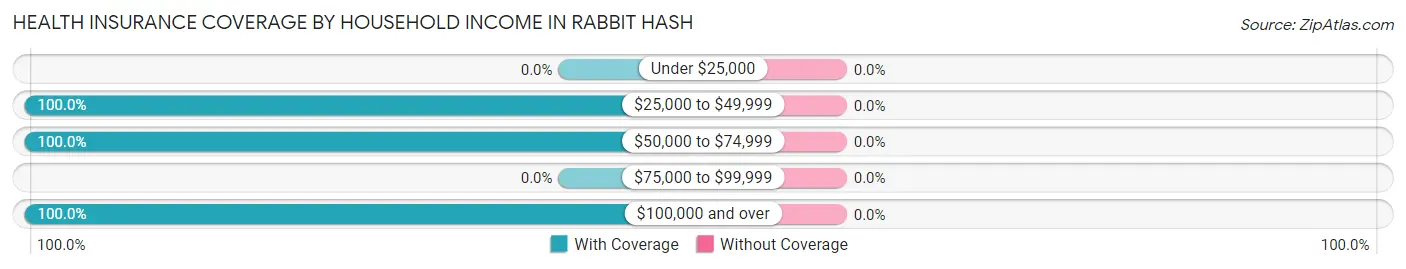
| Household Income | With Coverage | Without Coverage |
| Under $25,000 | 0 (0.0%) | 0 (0.0%) |
| $25,000 to $49,999 | 17 (100.0%) | 0 (0.0%) |
| $50,000 to $74,999 | 15 (100.0%) | 0 (0.0%) |
| $75,000 to $99,999 | 0 (0.0%) | 0 (0.0%) |
| $100,000 and over | 85 (100.0%) | 0 (0.0%) |
Public vs Private Health Insurance Coverage by Age in Rabbit Hash
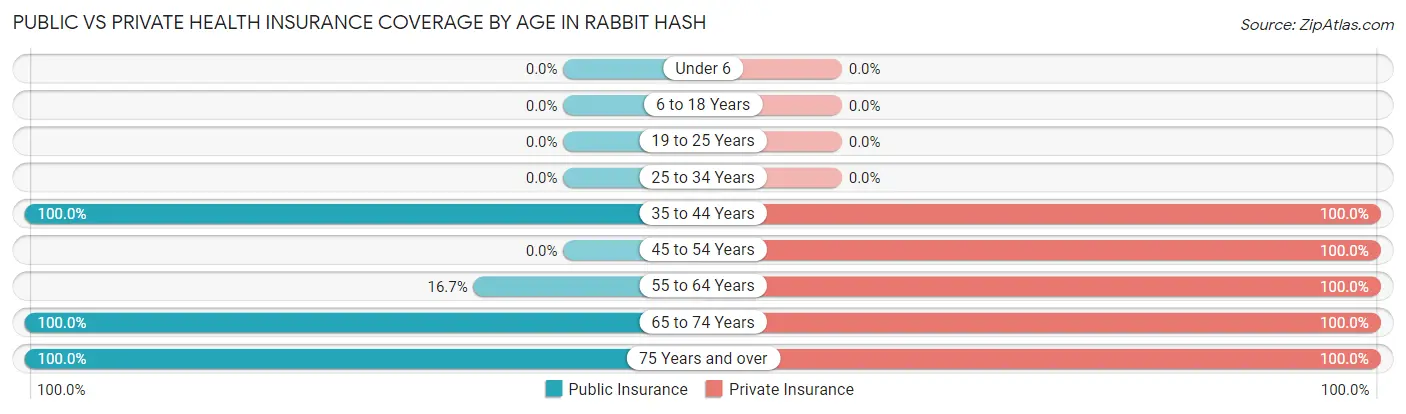
| Age Bracket | Public Insurance | Private Insurance |
| Under 6 | 0 (0.0%) | 0 (0.0%) |
| 6 to 18 Years | 0 (0.0%) | 0 (0.0%) |
| 19 to 25 Years | 0 (0.0%) | 0 (0.0%) |
| 25 to 34 Years | 0 (0.0%) | 0 (0.0%) |
| 35 to 44 Years | 12 (100.0%) | 12 (100.0%) |
| 45 to 54 Years | 0 (0.0%) | 13 (100.0%) |
| 55 to 64 Years | 10 (16.7%) | 60 (100.0%) |
| 65 to 74 Years | 17 (100.0%) | 17 (100.0%) |
| 75 Years and over | 15 (100.0%) | 15 (100.0%) |
| Total | 54 (46.2%) | 117 (100.0%) |
Disability Status by Sex by Age in Rabbit Hash

| Age Bracket | Male | Female |
| Under 5 Years | 0 (0.0%) | 0 (0.0%) |
| 5 to 17 Years | 0 (0.0%) | 0 (0.0%) |
| 18 to 34 Years | 0 (0.0%) | 0 (0.0%) |
| 35 to 64 Years | 21 (36.8%) | 0 (0.0%) |
| 65 to 74 Years | 0 (0.0%) | 0 (0.0%) |
| 75 Years and over | 0 (0.0%) | 0 (0.0%) |
Disability Class by Sex by Age in Rabbit Hash
Disability Class: Hearing Difficulty
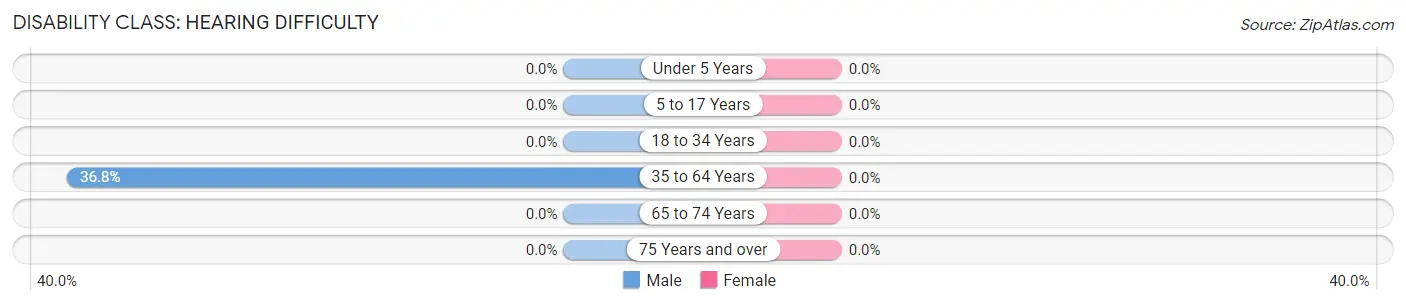
| Age Bracket | Male | Female |
| Under 5 Years | 0 (0.0%) | 0 (0.0%) |
| 5 to 17 Years | 0 (0.0%) | 0 (0.0%) |
| 18 to 34 Years | 0 (0.0%) | 0 (0.0%) |
| 35 to 64 Years | 21 (36.8%) | 0 (0.0%) |
| 65 to 74 Years | 0 (0.0%) | 0 (0.0%) |
| 75 Years and over | 0 (0.0%) | 0 (0.0%) |
Disability Class: Vision Difficulty
| Age Bracket | Male | Female |
| Under 5 Years | 0 (0.0%) | 0 (0.0%) |
| 5 to 17 Years | 0 (0.0%) | 0 (0.0%) |
| 18 to 34 Years | 0 (0.0%) | 0 (0.0%) |
| 35 to 64 Years | 0 (0.0%) | 0 (0.0%) |
| 65 to 74 Years | 0 (0.0%) | 0 (0.0%) |
| 75 Years and over | 0 (0.0%) | 0 (0.0%) |
Disability Class: Cognitive Difficulty
| Age Bracket | Male | Female |
| 5 to 17 Years | 0 (0.0%) | 0 (0.0%) |
| 18 to 34 Years | 0 (0.0%) | 0 (0.0%) |
| 35 to 64 Years | 0 (0.0%) | 0 (0.0%) |
| 65 to 74 Years | 0 (0.0%) | 0 (0.0%) |
| 75 Years and over | 0 (0.0%) | 0 (0.0%) |
Disability Class: Ambulatory Difficulty
| Age Bracket | Male | Female |
| 5 to 17 Years | 0 (0.0%) | 0 (0.0%) |
| 18 to 34 Years | 0 (0.0%) | 0 (0.0%) |
| 35 to 64 Years | 0 (0.0%) | 0 (0.0%) |
| 65 to 74 Years | 0 (0.0%) | 0 (0.0%) |
| 75 Years and over | 0 (0.0%) | 0 (0.0%) |
Disability Class: Self-Care Difficulty

| Age Bracket | Male | Female |
| 5 to 17 Years | 0 (0.0%) | 0 (0.0%) |
| 18 to 34 Years | 0 (0.0%) | 0 (0.0%) |
| 35 to 64 Years | 0 (0.0%) | 0 (0.0%) |
| 65 to 74 Years | 0 (0.0%) | 0 (0.0%) |
| 75 Years and over | 0 (0.0%) | 0 (0.0%) |
Technology Access in Rabbit Hash
Computing Device Access in Rabbit Hash
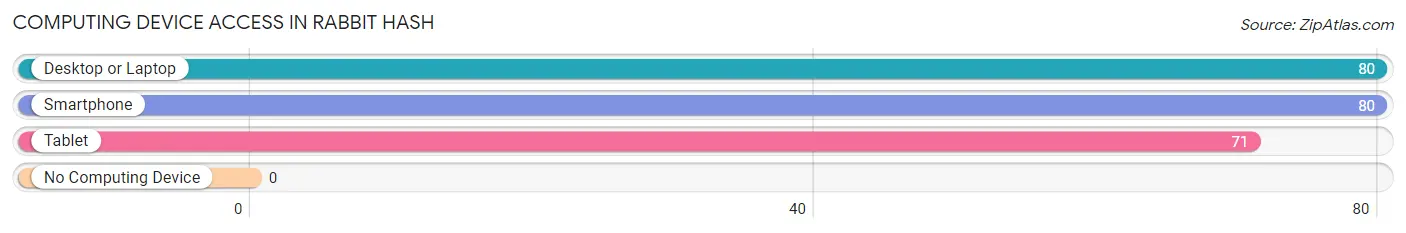
| Device Type | # Households | % Households |
| Desktop or Laptop | 80 | 100.0% |
| Smartphone | 80 | 100.0% |
| Tablet | 71 | 88.7% |
| No Computing Device | 0 | 0.0% |
| Total | 80 | 100.0% |
Internet Access in Rabbit Hash
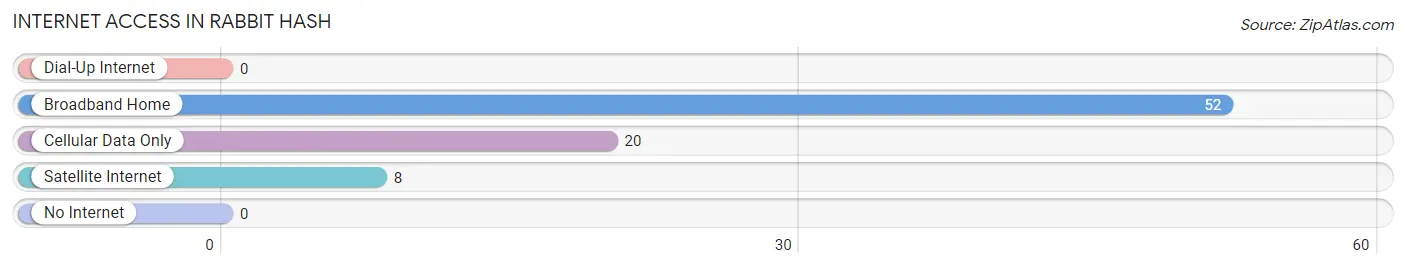
| Internet Type | # Households | % Households |
| Dial-Up Internet | 0 | 0.0% |
| Broadband Home | 52 | 65.0% |
| Cellular Data Only | 20 | 25.0% |
| Satellite Internet | 8 | 10.0% |
| No Internet | 0 | 0.0% |
| Total | 80 | 100.0% |
Rabbit Hash Summary
Rabbit Hash, Kentucky is a small unincorporated community located in Boone County, Kentucky. It is situated on the banks of the Ohio River, just north of the city of Cincinnati. The town is known for its unique history, geography, economy, and demographics.
History
Rabbit Hash was founded in 1831 by a group of settlers from North Carolina. The town was named after the abundance of wild rabbits in the area. The town was originally a trading post and ferry landing, and it quickly became a popular stop for travelers and traders. In the late 1800s, Rabbit Hash was a thriving river port, with a population of over 500 people. The town was home to a variety of businesses, including a general store, a blacksmith shop, a sawmill, and a gristmill.
In the early 1900s, the town began to decline as the river trade shifted to larger cities. By the 1950s, the population had dwindled to just a few dozen people. In the late 1970s, the town was nearly abandoned, but a group of local residents formed the Rabbit Hash Historical Society and began to restore the town. Today, Rabbit Hash is a popular tourist destination, with a population of around 100 people.
Geography
Rabbit Hash is located in Boone County, Kentucky, on the banks of the Ohio River. The town is situated at the intersection of Rabbit Hash Road and Lower River Road. The town is surrounded by rolling hills and farmland, and the Ohio River provides a scenic backdrop. The town is located approximately 25 miles north of Cincinnati, Ohio.
Economy
Rabbit Hash is a small, rural community with a limited economy. The town is home to a few small businesses, including a general store, a restaurant, and a bed and breakfast. The town also hosts a variety of events throughout the year, including a flea market, a music festival, and a Fourth of July celebration.
Demographics
As of the 2010 census, Rabbit Hash had a population of 98 people. The racial makeup of the town was 97.9% White, 0.9% African American, 0.9% Native American, and 0.2% from other races. The median household income was $37,500, and the median age was 44 years. The town is home to a variety of religious denominations, including Baptist, Methodist, and Catholic.
Conclusion
Rabbit Hash, Kentucky is a small unincorporated community located in Boone County, Kentucky. It is situated on the banks of the Ohio River, just north of the city of Cincinnati. The town is known for its unique history, geography, economy, and demographics. Rabbit Hash is a popular tourist destination, with a population of around 100 people. The town is home to a few small businesses, and it hosts a variety of events throughout the year. As of the 2010 census, Rabbit Hash had a population of 98 people, with a median household income of $37,500. The town is home to a variety of religious denominations, including Baptist, Methodist, and Catholic.
Common Questions
What is Per Capita Income in Rabbit Hash?
Per Capita income in Rabbit Hash is $81,139.
What is the Median Family Income in Rabbit Hash?
Median Family Income in Rabbit Hash is $155,469.
What is the Median Household income in Rabbit Hash?
Median Household Income in Rabbit Hash is $148,077.
What is Inequality or Gini Index in Rabbit Hash?
Inequality or Gini Index in Rabbit Hash is 0.24.
What is the Total Population of Rabbit Hash?
Total Population of Rabbit Hash is 117.
What is the Total Male Population of Rabbit Hash?
Total Male Population of Rabbit Hash is 72.
What is the Total Female Population of Rabbit Hash?
Total Female Population of Rabbit Hash is 45.
What is the Ratio of Males per 100 Females in Rabbit Hash?
There are 160.00 Males per 100 Females in Rabbit Hash.
What is the Ratio of Females per 100 Males in Rabbit Hash?
There are 62.50 Females per 100 Males in Rabbit Hash.
What is the Median Population Age in Rabbit Hash?
Median Population Age in Rabbit Hash is 58.6 Years.
What is the Average Family Size in Rabbit Hash
Average Family Size in Rabbit Hash is 2.0 People.
What is the Average Household Size in Rabbit Hash
Average Household Size in Rabbit Hash is 1.5 People.
How Large is the Labor Force in Rabbit Hash?
There are 85 People in the Labor Forcein in Rabbit Hash.
What is the Percentage of People in the Labor Force in Rabbit Hash?
72.6% of People are in the Labor Force in Rabbit Hash.