Midway, KY Map & Demographics
Midway Map
Midway Overview
$36,550
PER CAPITA INCOME
$102,269
AVG FAMILY INCOME
$63,938
AVG HOUSEHOLD INCOME
34.0%
WAGE / INCOME GAP [ % ]
66.0¢/ $1
WAGE / INCOME GAP [ $ ]
0.44
INEQUALITY / GINI INDEX
1,748
TOTAL POPULATION
777
MALE POPULATION
971
FEMALE POPULATION
80.02
MALES / 100 FEMALES
124.97
FEMALES / 100 MALES
41.7
MEDIAN AGE
3.1
AVG FAMILY SIZE
2.2
AVG HOUSEHOLD SIZE
921
LABOR FORCE [ PEOPLE ]
58.9%
PERCENT IN LABOR FORCE
5.0%
UNEMPLOYMENT RATE
Midway Zip Codes
Income in Midway
Income Overview in Midway
Per Capita Income in Midway is $36,550, while median incomes of families and households are $102,269 and $63,938 respectively.
| Characteristic | Number | Measure |
| Per Capita Income | 1,748 | $36,550 |
| Median Family Income | 345 | $102,269 |
| Mean Family Income | 345 | $111,889 |
| Median Household Income | 657 | $63,938 |
| Mean Household Income | 657 | $88,002 |
| Income Deficit | 345 | $0 |
| Wage / Income Gap (%) | 1,748 | 33.97% |
| Wage / Income Gap ($) | 1,748 | 66.03¢ per $1 |
| Gini / Inequality Index | 1,748 | 0.44 |
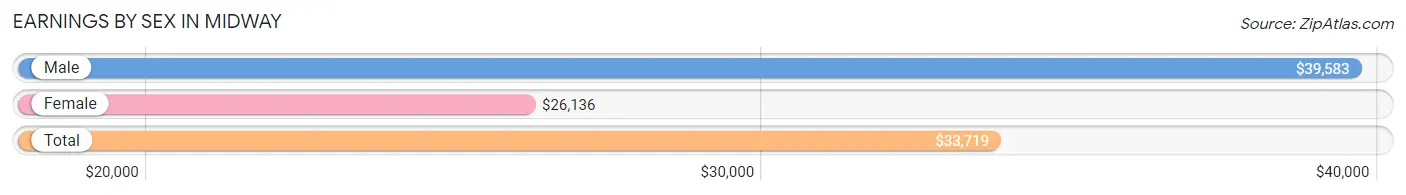
Earnings by Sex in Midway
Average Earnings in Midway are $33,719, $39,583 for men and $26,136 for women, a difference of 34.0%.
| Sex | Number | Average Earnings |
| Male | 517 (45.4%) | $39,583 |
| Female | 622 (54.6%) | $26,136 |
| Total | 1,139 (100.0%) | $33,719 |
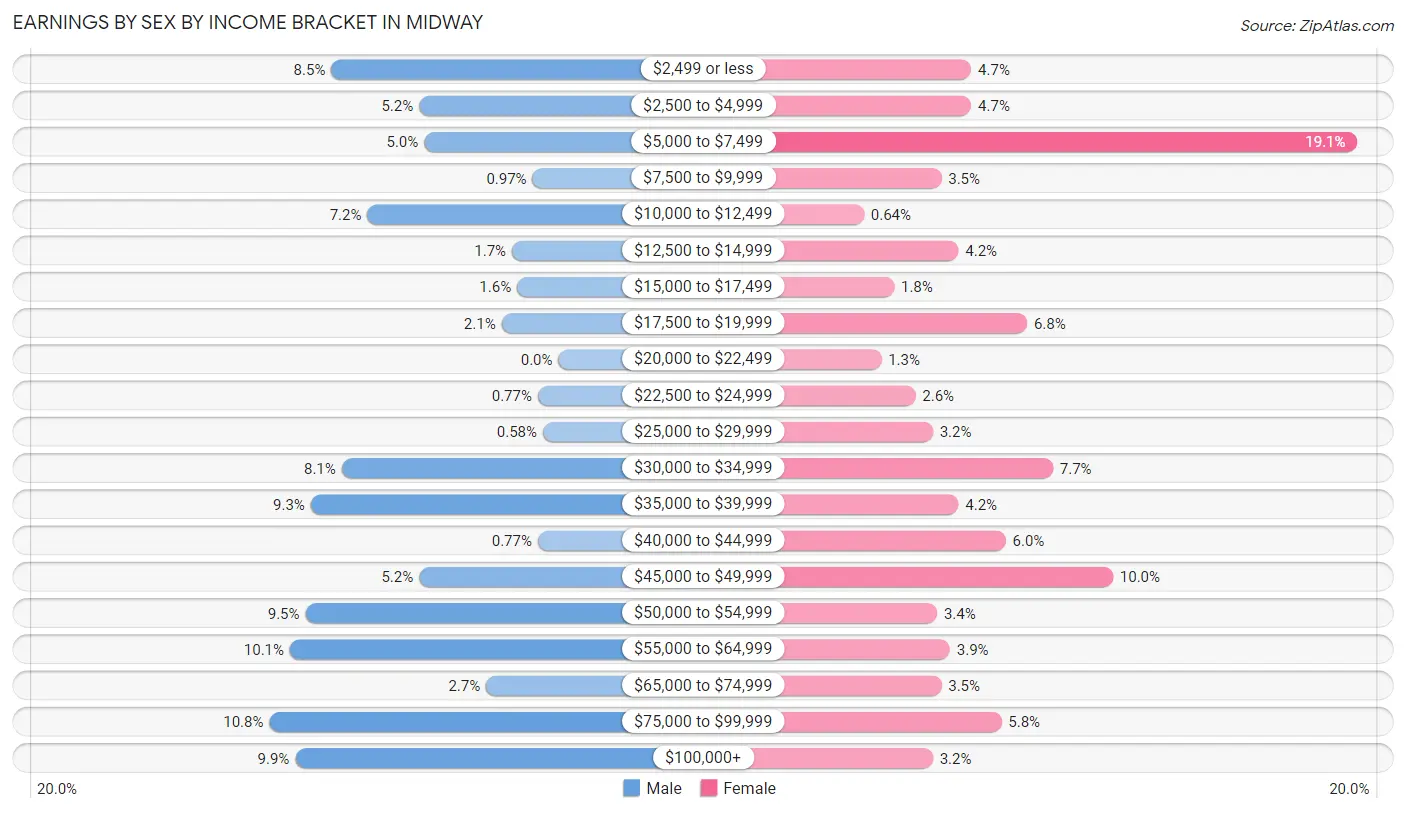
Earnings by Sex by Income Bracket in Midway
The most common earnings brackets in Midway are $75,000 to $99,999 for men (56 | 10.8%) and $5,000 to $7,499 for women (119 | 19.1%).
| Income | Male | Female |
| $2,499 or less | 44 (8.5%) | 29 (4.7%) |
| $2,500 to $4,999 | 27 (5.2%) | 29 (4.7%) |
| $5,000 to $7,499 | 26 (5.0%) | 119 (19.1%) |
| $7,500 to $9,999 | 5 (1.0%) | 22 (3.5%) |
| $10,000 to $12,499 | 37 (7.2%) | 4 (0.6%) |
| $12,500 to $14,999 | 9 (1.7%) | 26 (4.2%) |
| $15,000 to $17,499 | 8 (1.5%) | 11 (1.8%) |
| $17,500 to $19,999 | 11 (2.1%) | 42 (6.8%) |
| $20,000 to $22,499 | 0 (0.0%) | 8 (1.3%) |
| $22,500 to $24,999 | 4 (0.8%) | 16 (2.6%) |
| $25,000 to $29,999 | 3 (0.6%) | 20 (3.2%) |
| $30,000 to $34,999 | 42 (8.1%) | 48 (7.7%) |
| $35,000 to $39,999 | 48 (9.3%) | 26 (4.2%) |
| $40,000 to $44,999 | 4 (0.8%) | 37 (5.9%) |
| $45,000 to $49,999 | 27 (5.2%) | 62 (10.0%) |
| $50,000 to $54,999 | 49 (9.5%) | 21 (3.4%) |
| $55,000 to $64,999 | 52 (10.1%) | 24 (3.9%) |
| $65,000 to $74,999 | 14 (2.7%) | 22 (3.5%) |
| $75,000 to $99,999 | 56 (10.8%) | 36 (5.8%) |
| $100,000+ | 51 (9.9%) | 20 (3.2%) |
| Total | 517 (100.0%) | 622 (100.0%) |
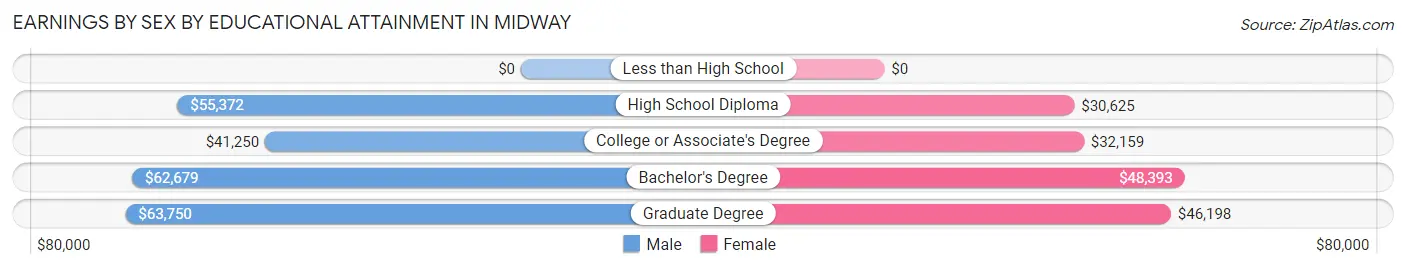
Earnings by Sex by Educational Attainment in Midway
Average earnings in Midway are $53,063 for men and $45,144 for women, a difference of 14.9%. Men with an educational attainment of graduate degree enjoy the highest average annual earnings of $63,750, while those with college or associate's degree education earn the least with $41,250. Women with an educational attainment of bachelor's degree earn the most with the average annual earnings of $48,393, while those with high school diploma education have the smallest earnings of $30,625.
| Educational Attainment | Male Income | Female Income |
| Less than High School | - | - |
| High School Diploma | $55,372 | $30,625 |
| College or Associate's Degree | $41,250 | $32,159 |
| Bachelor's Degree | $62,679 | $48,393 |
| Graduate Degree | $63,750 | $46,198 |
| Total | $53,063 | $45,144 |
Family Income in Midway
Family Income Brackets in Midway
According to the Midway family income data, there are 131 families falling into the $100,000 to $149,999 income range, which is the most common income bracket and makes up 38.0% of all families.
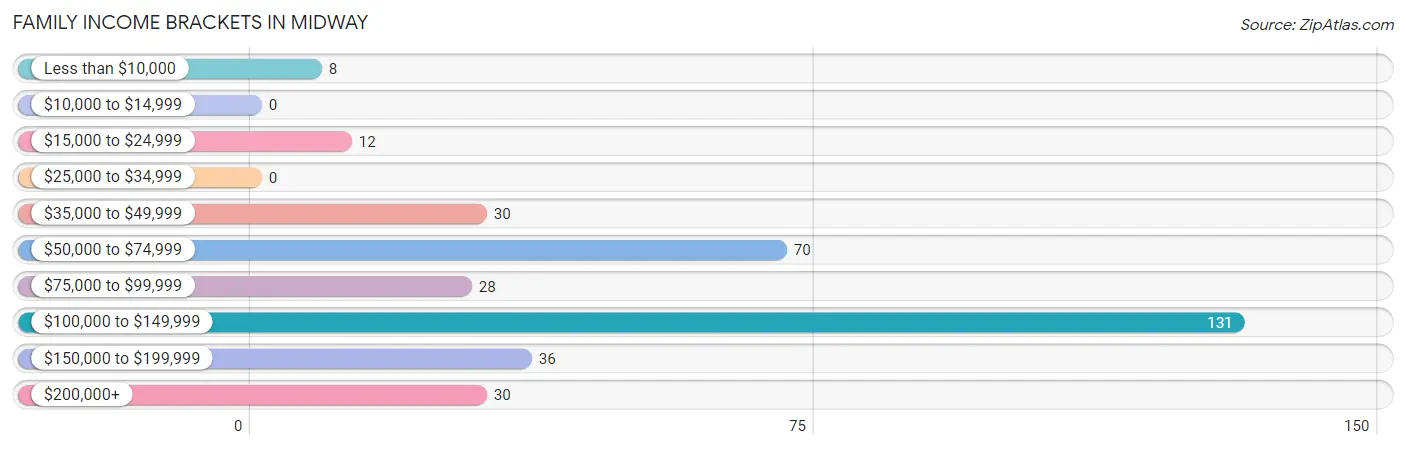
| Income Bracket | # Families | % Families |
| Less than $10,000 | 8 | 2.3% |
| $10,000 to $14,999 | 0 | 0.0% |
| $15,000 to $24,999 | 12 | 3.5% |
| $25,000 to $34,999 | 0 | 0.0% |
| $35,000 to $49,999 | 30 | 8.7% |
| $50,000 to $74,999 | 70 | 20.3% |
| $75,000 to $99,999 | 28 | 8.1% |
| $100,000 to $149,999 | 131 | 38.0% |
| $150,000 to $199,999 | 36 | 10.4% |
| $200,000+ | 30 | 8.7% |
Family Income by Famaliy Size in Midway
3-person families (39 | 11.3%) account for the highest median family income in Midway with $111,964 per family, while 2-person families (197 | 57.1%) have the highest median income of $45,677 per family member.
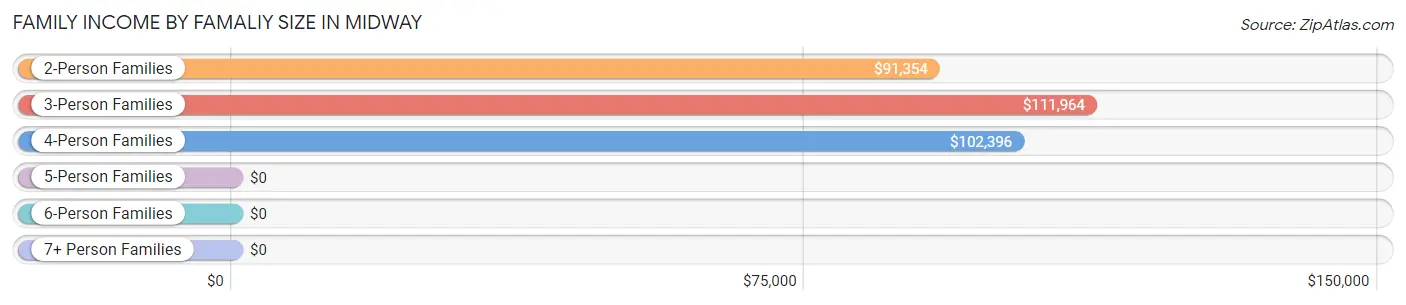
| Income Bracket | # Families | Median Income |
| 2-Person Families | 197 (57.1%) | $91,354 |
| 3-Person Families | 39 (11.3%) | $111,964 |
| 4-Person Families | 88 (25.5%) | $102,396 |
| 5-Person Families | 6 (1.7%) | $0 |
| 6-Person Families | 9 (2.6%) | $0 |
| 7+ Person Families | 6 (1.7%) | $0 |
| Total | 345 (100.0%) | $102,269 |
Family Income by Number of Earners in Midway
The median family income in Midway is $102,269, with families comprising 3+ earners (41) having the highest median family income of $135,625, while families with no earners (44) have the lowest median family income of $61,250, accounting for 11.9% and 12.8% of families, respectively.
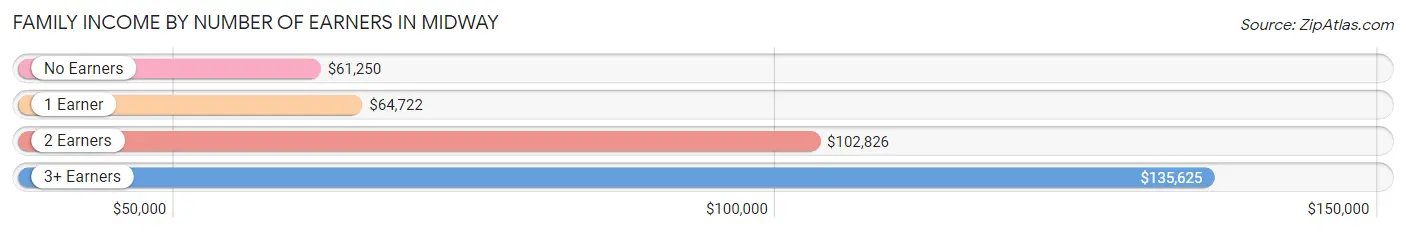
| Number of Earners | # Families | Median Income |
| No Earners | 44 (12.8%) | $61,250 |
| 1 Earner | 66 (19.1%) | $64,722 |
| 2 Earners | 194 (56.2%) | $102,826 |
| 3+ Earners | 41 (11.9%) | $135,625 |
| Total | 345 (100.0%) | $102,269 |
Household Income in Midway
Household Income Brackets in Midway
With 149 households falling in the category, the $100,000 to $149,999 income range is the most frequent in Midway, accounting for 22.7% of all households. In contrast, only 20 households (3.0%) fall into the less than $10,000 income bracket, making it the least populous group.
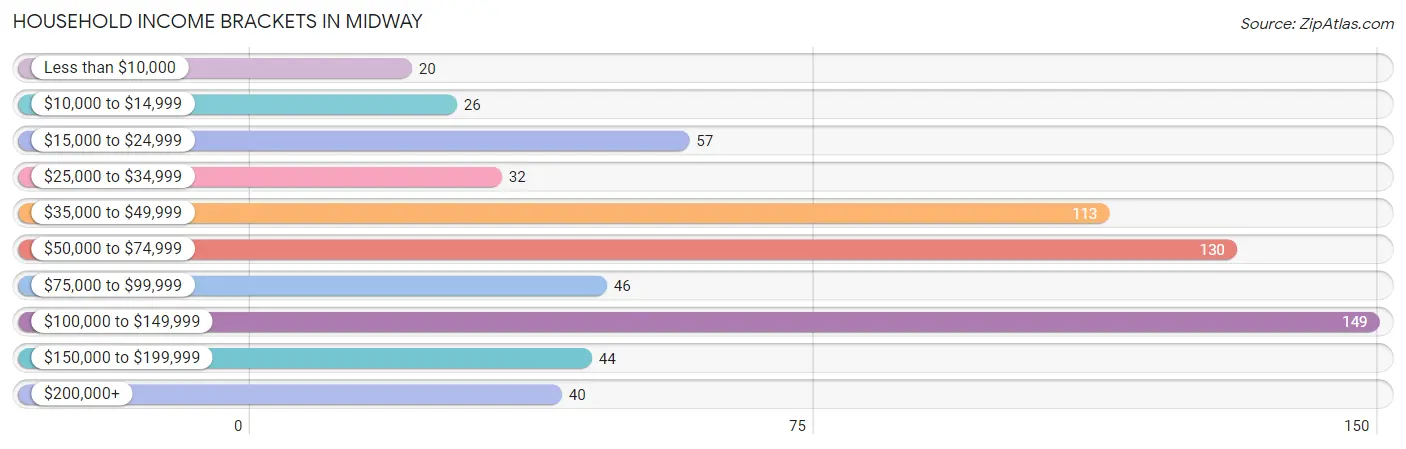
| Income Bracket | # Households | % Households |
| Less than $10,000 | 20 | 3.0% |
| $10,000 to $14,999 | 26 | 4.0% |
| $15,000 to $24,999 | 57 | 8.7% |
| $25,000 to $34,999 | 32 | 4.9% |
| $35,000 to $49,999 | 113 | 17.2% |
| $50,000 to $74,999 | 130 | 19.8% |
| $75,000 to $99,999 | 46 | 7.0% |
| $100,000 to $149,999 | 149 | 22.7% |
| $150,000 to $199,999 | 44 | 6.7% |
| $200,000+ | 40 | 6.1% |
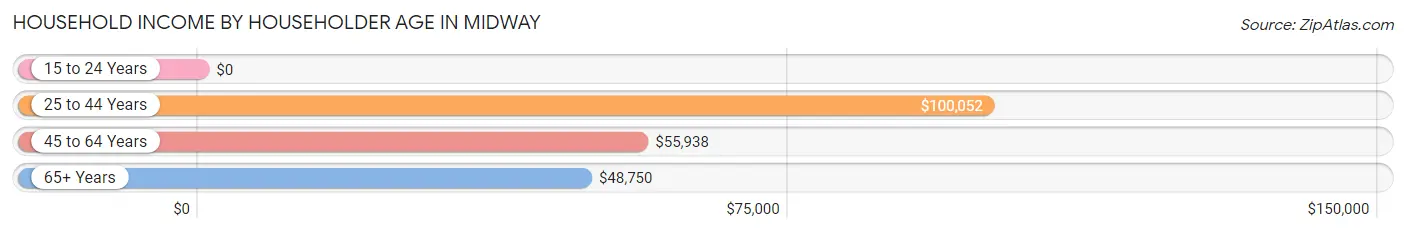
Household Income by Householder Age in Midway
The median household income in Midway is $63,938, with the highest median household income of $100,052 found in the 25 to 44 years age bracket for the primary householder. A total of 183 households (27.9%) fall into this category. Meanwhile, the 15 to 24 years age bracket for the primary householder has the lowest median household income of $0, with 15 households (2.3%) in this group.
| Income Bracket | # Households | Median Income |
| 15 to 24 Years | 15 (2.3%) | $0 |
| 25 to 44 Years | 183 (27.9%) | $100,052 |
| 45 to 64 Years | 271 (41.2%) | $55,938 |
| 65+ Years | 188 (28.6%) | $48,750 |
| Total | 657 (100.0%) | $63,938 |
Poverty in Midway
Income Below Poverty by Sex and Age in Midway
With 12.7% poverty level for males and 5.8% for females among the residents of Midway, 18 to 24 year old males and 75 year old and over females are the most vulnerable to poverty, with 41 males (43.6%) and 12 females (12.8%) in their respective age groups living below the poverty level.
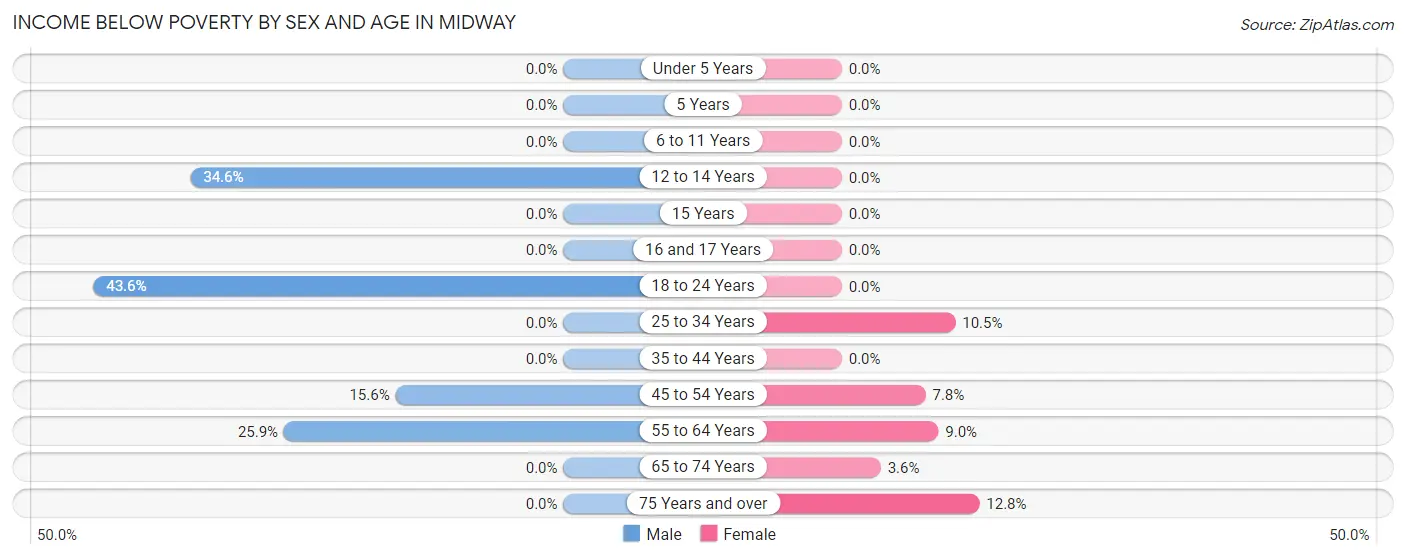
| Age Bracket | Male | Female |
| Under 5 Years | 0 (0.0%) | 0 (0.0%) |
| 5 Years | 0 (0.0%) | 0 (0.0%) |
| 6 to 11 Years | 0 (0.0%) | 0 (0.0%) |
| 12 to 14 Years | 9 (34.6%) | 0 (0.0%) |
| 15 Years | 0 (0.0%) | 0 (0.0%) |
| 16 and 17 Years | 0 (0.0%) | 0 (0.0%) |
| 18 to 24 Years | 41 (43.6%) | 0 (0.0%) |
| 25 to 34 Years | 0 (0.0%) | 8 (10.5%) |
| 35 to 44 Years | 0 (0.0%) | 0 (0.0%) |
| 45 to 54 Years | 12 (15.6%) | 8 (7.8%) |
| 55 to 64 Years | 28 (25.9%) | 12 (9.0%) |
| 65 to 74 Years | 0 (0.0%) | 3 (3.6%) |
| 75 Years and over | 0 (0.0%) | 12 (12.8%) |
| Total | 90 (12.7%) | 43 (5.8%) |
Income Above Poverty by Sex and Age in Midway
According to the poverty statistics in Midway, males aged under 5 years and females aged under 5 years are the age groups that are most secure financially, with 100.0% of males and 100.0% of females in these age groups living above the poverty line.
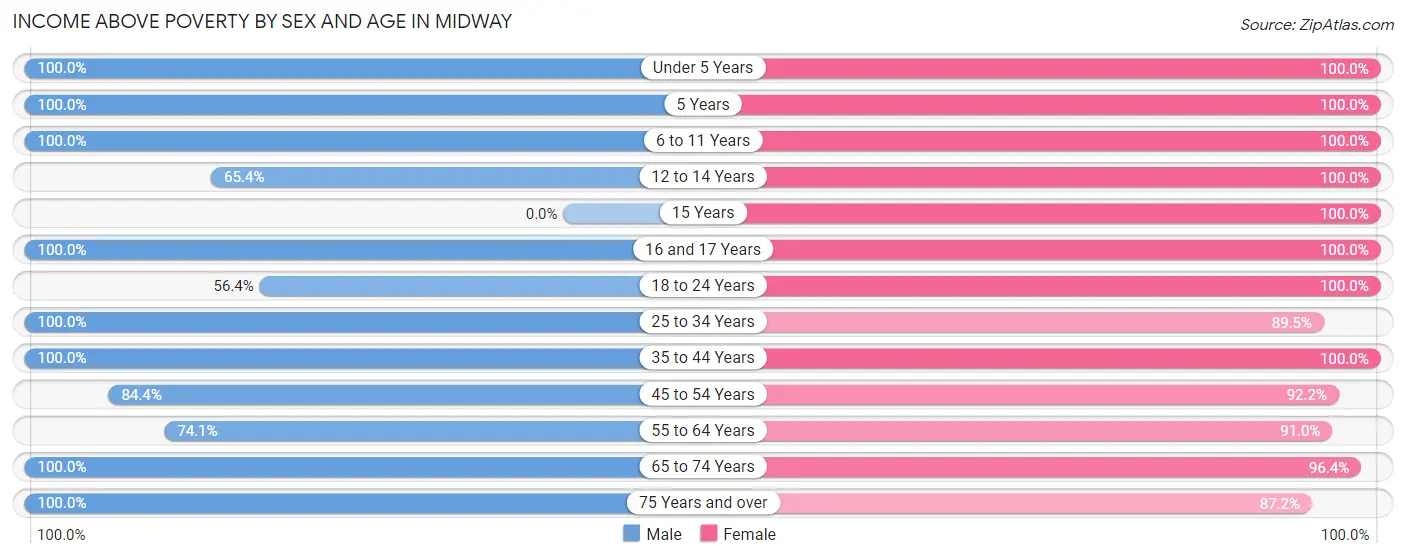
| Age Bracket | Male | Female |
| Under 5 Years | 10 (100.0%) | 26 (100.0%) |
| 5 Years | 10 (100.0%) | 4 (100.0%) |
| 6 to 11 Years | 43 (100.0%) | 56 (100.0%) |
| 12 to 14 Years | 17 (65.4%) | 6 (100.0%) |
| 15 Years | 0 (0.0%) | 4 (100.0%) |
| 16 and 17 Years | 39 (100.0%) | 7 (100.0%) |
| 18 to 24 Years | 53 (56.4%) | 54 (100.0%) |
| 25 to 34 Years | 69 (100.0%) | 68 (89.5%) |
| 35 to 44 Years | 136 (100.0%) | 96 (100.0%) |
| 45 to 54 Years | 65 (84.4%) | 95 (92.2%) |
| 55 to 64 Years | 80 (74.1%) | 122 (91.0%) |
| 65 to 74 Years | 65 (100.0%) | 80 (96.4%) |
| 75 Years and over | 33 (100.0%) | 82 (87.2%) |
| Total | 620 (87.3%) | 700 (94.2%) |
Income Below Poverty Among Married-Couple Families in Midway
The poverty statistics for married-couple families in Midway show that 5.9% or 18 of the total 306 families live below the poverty line. Families with 1 or 2 children have the highest poverty rate of 7.7%, comprising of 8 families. On the other hand, families with 3 or 4 children have the lowest poverty rate of 0.0%, which includes 0 families.
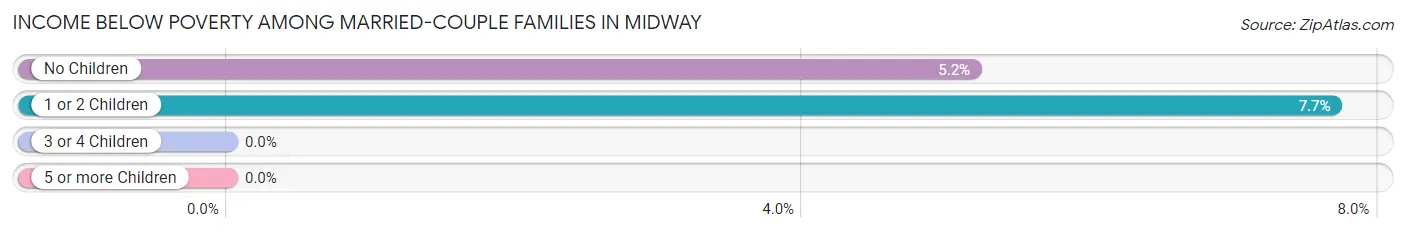
| Children | Above Poverty | Below Poverty |
| No Children | 183 (94.8%) | 10 (5.2%) |
| 1 or 2 Children | 96 (92.3%) | 8 (7.7%) |
| 3 or 4 Children | 9 (100.0%) | 0 (0.0%) |
| 5 or more Children | 0 (0.0%) | 0 (0.0%) |
| Total | 288 (94.1%) | 18 (5.9%) |
Income Below Poverty Among Single-Parent Households in Midway
| Children | Single Father | Single Mother |
| No Children | 0 (0.0%) | 0 (0.0%) |
| 1 or 2 Children | 0 (0.0%) | 0 (0.0%) |
| 3 or 4 Children | 0 (0.0%) | 0 (0.0%) |
| 5 or more Children | 0 (0.0%) | 0 (0.0%) |
| Total | 0 (0.0%) | 0 (0.0%) |
Income Below Poverty Among Married-Couple vs Single-Parent Households in Midway
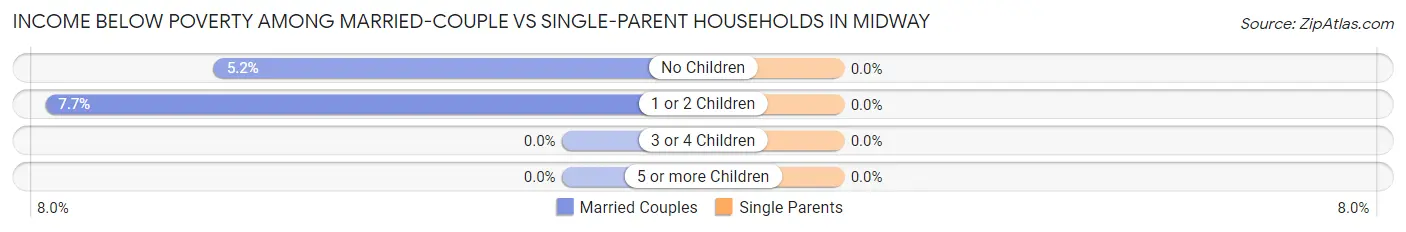
| Children | Married-Couple Families | Single-Parent Households |
| No Children | 10 (5.2%) | 0 (0.0%) |
| 1 or 2 Children | 8 (7.7%) | 0 (0.0%) |
| 3 or 4 Children | 0 (0.0%) | 0 (0.0%) |
| 5 or more Children | 0 (0.0%) | 0 (0.0%) |
| Total | 18 (5.9%) | 0 (0.0%) |
Race in Midway
The most populous races in Midway are White / Caucasian (1,566 | 89.6%), Black / African American (114 | 6.5%), and Two or more Races (56 | 3.2%).

| Race | # Population | % Population |
| Asian | 0 | 0.0% |
| Black / African American | 114 | 6.5% |
| Hawaiian / Pacific | 0 | 0.0% |
| Hispanic or Latino | 40 | 2.3% |
| Native / Alaskan | 7 | 0.4% |
| White / Caucasian | 1,566 | 89.6% |
| Two or more Races | 56 | 3.2% |
| Some other Race | 5 | 0.3% |
| Total | 1,748 | 100.0% |
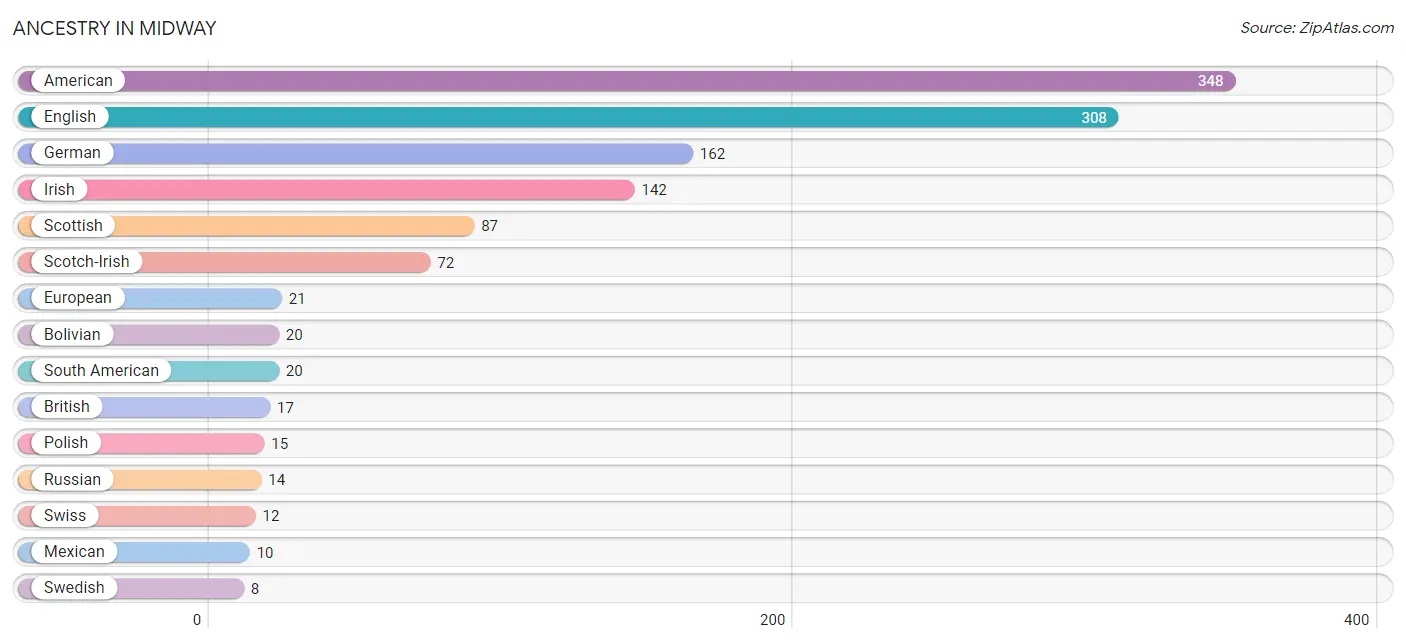
Ancestry in Midway
The most populous ancestries reported in Midway are American (348 | 19.9%), English (308 | 17.6%), German (162 | 9.3%), Irish (142 | 8.1%), and Scottish (87 | 5.0%), together accounting for 59.9% of all Midway residents.
| Ancestry | # Population | % Population |
| American | 348 | 19.9% |
| Austrian | 4 | 0.2% |
| Bolivian | 20 | 1.1% |
| British | 17 | 1.0% |
| Cherokee | 5 | 0.3% |
| Dutch | 5 | 0.3% |
| English | 308 | 17.6% |
| European | 21 | 1.2% |
| French | 2 | 0.1% |
| German | 162 | 9.3% |
| Irish | 142 | 8.1% |
| Lumbee | 1 | 0.1% |
| Mexican | 10 | 0.6% |
| Mongolian | 6 | 0.3% |
| Norwegian | 3 | 0.2% |
| Polish | 15 | 0.9% |
| Puerto Rican | 5 | 0.3% |
| Russian | 14 | 0.8% |
| Scotch-Irish | 72 | 4.1% |
| Scottish | 87 | 5.0% |
| South American | 20 | 1.1% |
| Swedish | 8 | 0.5% |
| Swiss | 12 | 0.7% | View All 23 Rows |
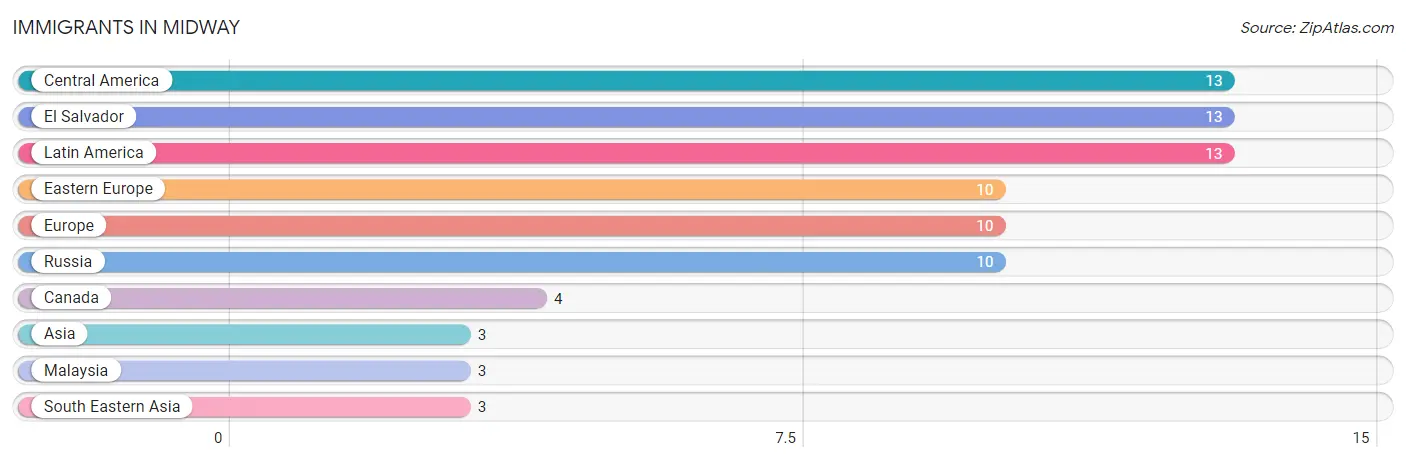
Immigrants in Midway
The most numerous immigrant groups reported in Midway came from Central America (13 | 0.7%), El Salvador (13 | 0.7%), Latin America (13 | 0.7%), Eastern Europe (10 | 0.6%), and Europe (10 | 0.6%), together accounting for 3.4% of all Midway residents.
| Immigration Origin | # Population | % Population |
| Asia | 3 | 0.2% |
| Canada | 4 | 0.2% |
| Central America | 13 | 0.7% |
| Eastern Europe | 10 | 0.6% |
| El Salvador | 13 | 0.7% |
| Europe | 10 | 0.6% |
| Latin America | 13 | 0.7% |
| Malaysia | 3 | 0.2% |
| Russia | 10 | 0.6% |
| South Eastern Asia | 3 | 0.2% | View All 10 Rows |
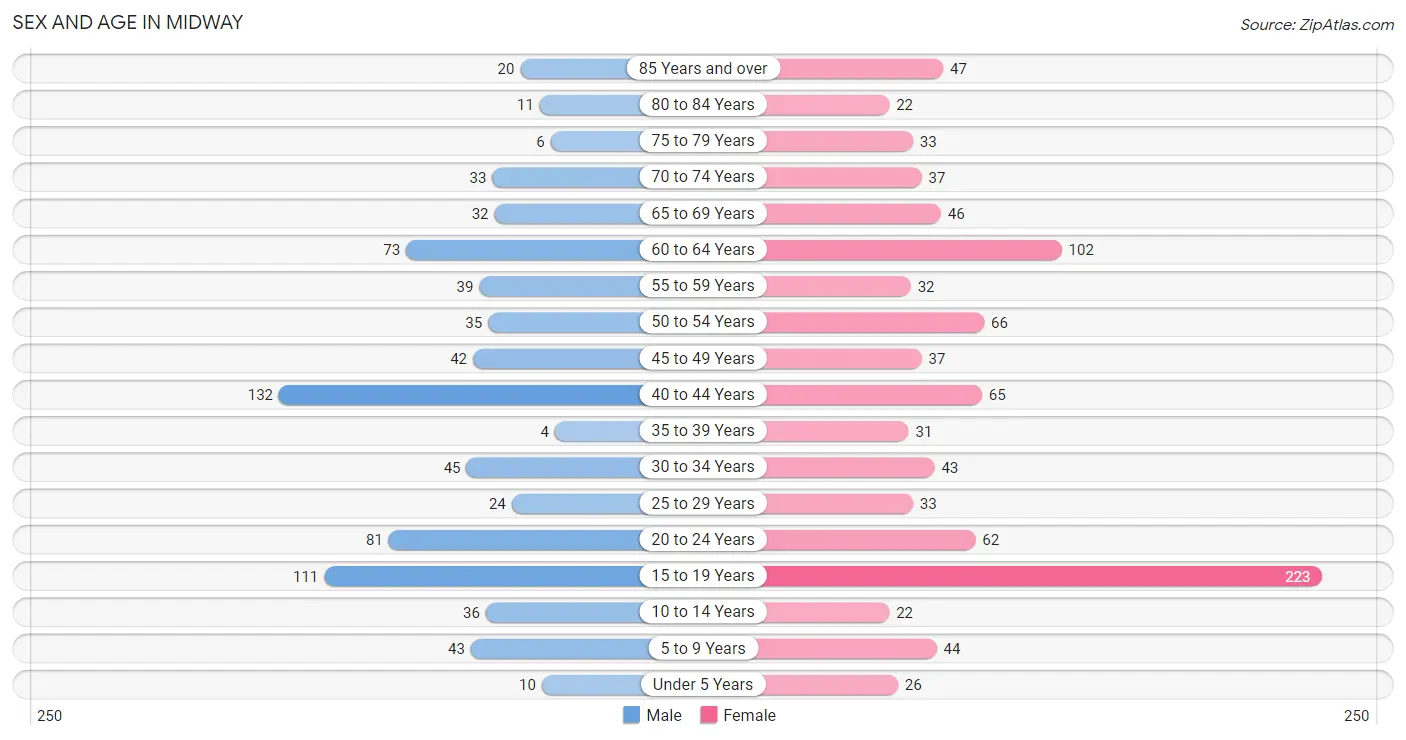
Sex and Age in Midway
Sex and Age in Midway
The most populous age groups in Midway are 40 to 44 Years (132 | 17.0%) for men and 15 to 19 Years (223 | 23.0%) for women.
| Age Bracket | Male | Female |
| Under 5 Years | 10 (1.3%) | 26 (2.7%) |
| 5 to 9 Years | 43 (5.5%) | 44 (4.5%) |
| 10 to 14 Years | 36 (4.6%) | 22 (2.3%) |
| 15 to 19 Years | 111 (14.3%) | 223 (23.0%) |
| 20 to 24 Years | 81 (10.4%) | 62 (6.4%) |
| 25 to 29 Years | 24 (3.1%) | 33 (3.4%) |
| 30 to 34 Years | 45 (5.8%) | 43 (4.4%) |
| 35 to 39 Years | 4 (0.5%) | 31 (3.2%) |
| 40 to 44 Years | 132 (17.0%) | 65 (6.7%) |
| 45 to 49 Years | 42 (5.4%) | 37 (3.8%) |
| 50 to 54 Years | 35 (4.5%) | 66 (6.8%) |
| 55 to 59 Years | 39 (5.0%) | 32 (3.3%) |
| 60 to 64 Years | 73 (9.4%) | 102 (10.5%) |
| 65 to 69 Years | 32 (4.1%) | 46 (4.7%) |
| 70 to 74 Years | 33 (4.3%) | 37 (3.8%) |
| 75 to 79 Years | 6 (0.8%) | 33 (3.4%) |
| 80 to 84 Years | 11 (1.4%) | 22 (2.3%) |
| 85 Years and over | 20 (2.6%) | 47 (4.8%) |
| Total | 777 (100.0%) | 971 (100.0%) |
Families and Households in Midway
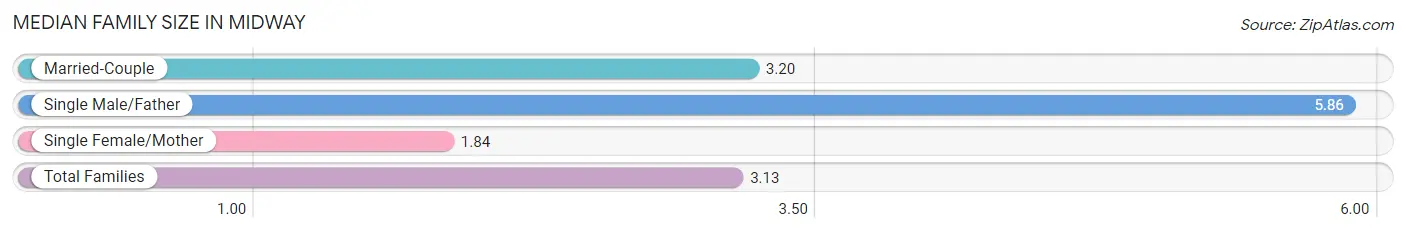
Median Family Size in Midway
The median family size in Midway is 3.13 persons per family, with single male/father families (7 | 2.0%) accounting for the largest median family size of 5.86 persons per family. On the other hand, single female/mother families (32 | 9.3%) represent the smallest median family size with 1.84 persons per family.
| Family Type | # Families | Family Size |
| Married-Couple | 306 (88.7%) | 3.20 |
| Single Male/Father | 7 (2.0%) | 5.86 |
| Single Female/Mother | 32 (9.3%) | 1.84 |
| Total Families | 345 (100.0%) | 3.13 |
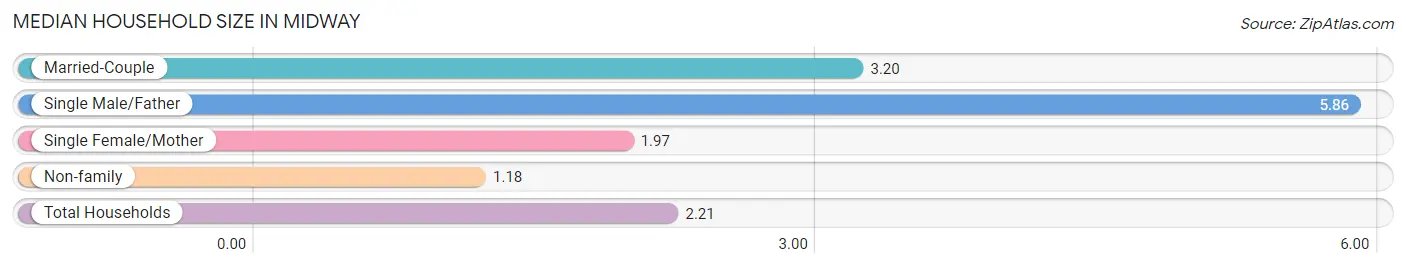
Median Household Size in Midway
The median household size in Midway is 2.21 persons per household, with single male/father households (7 | 1.1%) accounting for the largest median household size of 5.86 persons per household. non-family households (312 | 47.5%) represent the smallest median household size with 1.18 persons per household.
| Household Type | # Households | Household Size |
| Married-Couple | 306 (46.6%) | 3.20 |
| Single Male/Father | 7 (1.1%) | 5.86 |
| Single Female/Mother | 32 (4.9%) | 1.97 |
| Non-family | 312 (47.5%) | 1.18 |
| Total Households | 657 (100.0%) | 2.21 |
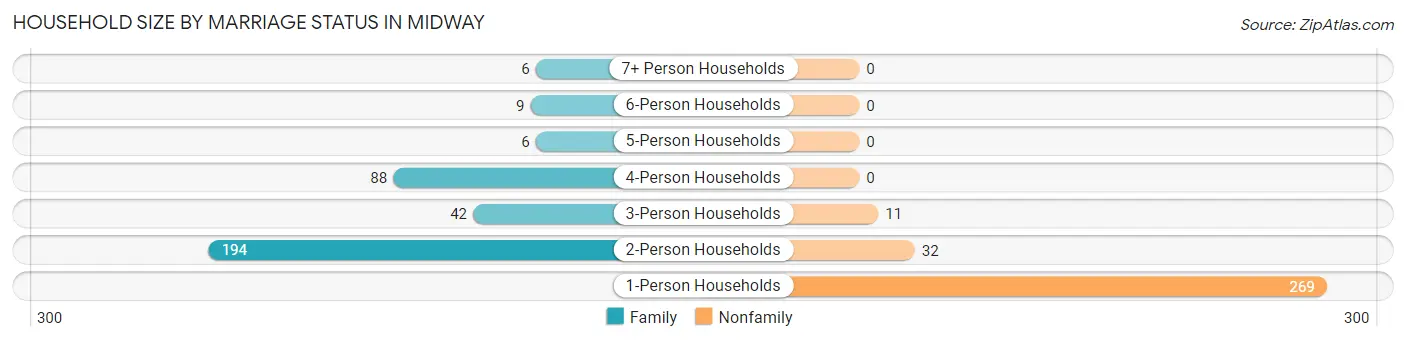
Household Size by Marriage Status in Midway
Out of a total of 657 households in Midway, 345 (52.5%) are family households, while 312 (47.5%) are nonfamily households. The most numerous type of family households are 2-person households, comprising 194, and the most common type of nonfamily households are 1-person households, comprising 269.
| Household Size | Family Households | Nonfamily Households |
| 1-Person Households | - | 269 (40.9%) |
| 2-Person Households | 194 (29.5%) | 32 (4.9%) |
| 3-Person Households | 42 (6.4%) | 11 (1.7%) |
| 4-Person Households | 88 (13.4%) | 0 (0.0%) |
| 5-Person Households | 6 (0.9%) | 0 (0.0%) |
| 6-Person Households | 9 (1.4%) | 0 (0.0%) |
| 7+ Person Households | 6 (0.9%) | 0 (0.0%) |
| Total | 345 (52.5%) | 312 (47.5%) |
Female Fertility in Midway
Fertility by Age in Midway
Average fertility rate in Midway is 6.0 births per 1,000 women. Women in the age bracket of 20 to 34 years have the highest fertility rate with 22.0 births per 1,000 women. Women in the age bracket of 20 to 34 years acount for 100.0% of all women with births.
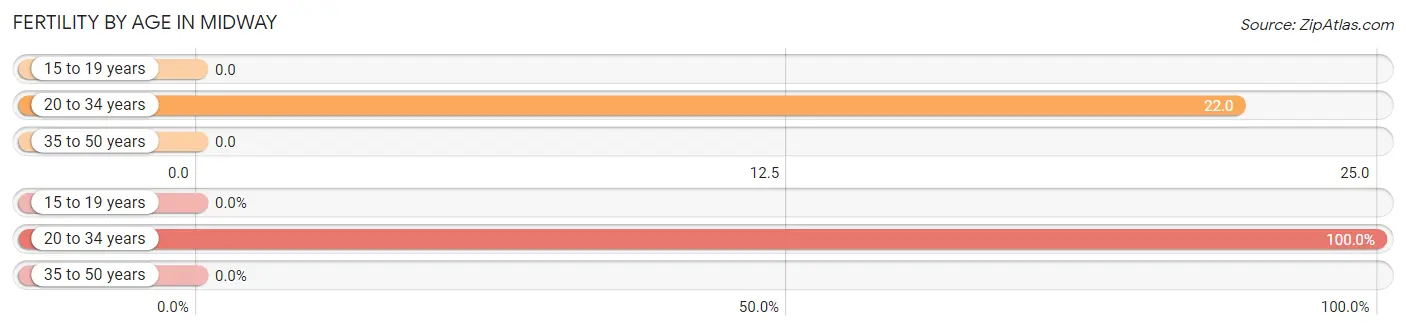
| Age Bracket | Women with Births | Births / 1,000 Women |
| 15 to 19 years | 0 (0.0%) | 0.0 |
| 20 to 34 years | 3 (100.0%) | 22.0 |
| 35 to 50 years | 0 (0.0%) | 0.0 |
| Total | 3 (100.0%) | 6.0 |
Fertility by Age by Marriage Status in Midway
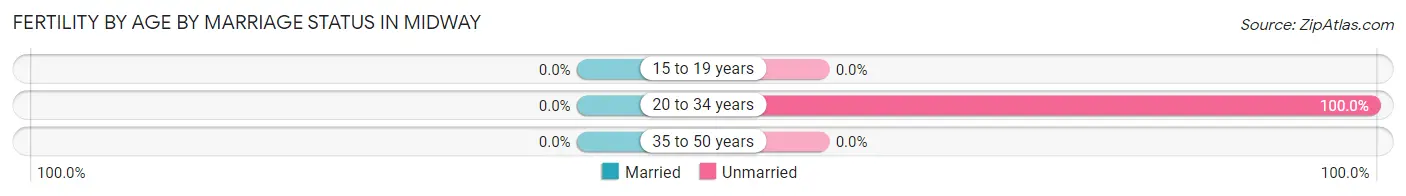
| Age Bracket | Married | Unmarried |
| 15 to 19 years | 0 (0.0%) | 0 (0.0%) |
| 20 to 34 years | 0 (0.0%) | 3 (100.0%) |
| 35 to 50 years | 0 (0.0%) | 0 (0.0%) |
| Total | 0 (0.0%) | 3 (100.0%) |
Fertility by Education in Midway
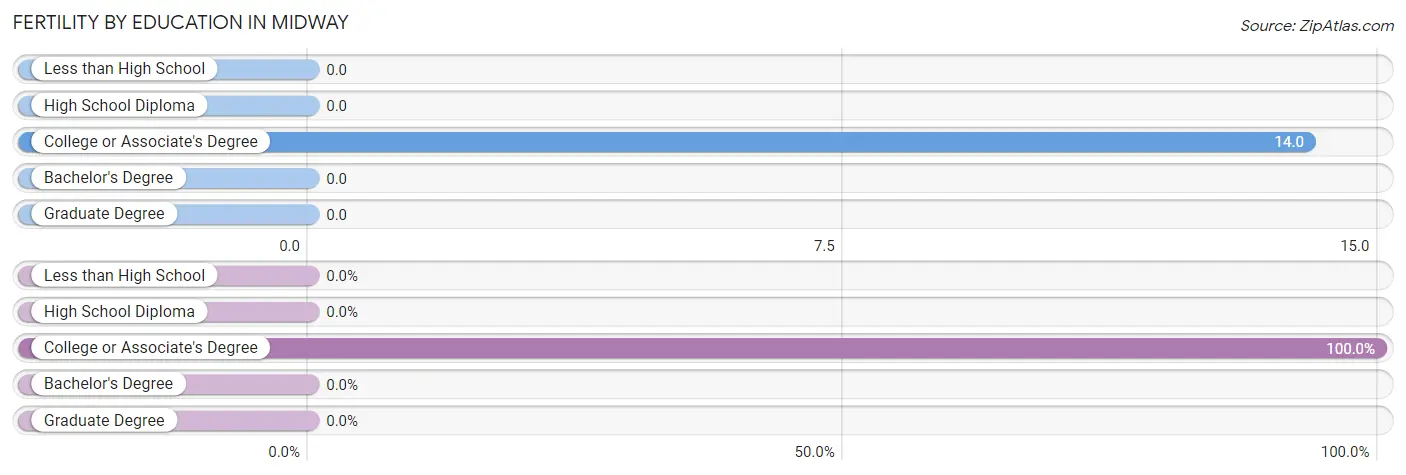
| Educational Attainment | Women with Births | Births / 1,000 Women |
| Less than High School | 0 (0.0%) | 0.0 |
| High School Diploma | 0 (0.0%) | 0.0 |
| College or Associate's Degree | 3 (100.0%) | 14.0 |
| Bachelor's Degree | 0 (0.0%) | 0.0 |
| Graduate Degree | 0 (0.0%) | 0.0 |
| Total | 3 (100.0%) | 6.0 |
Fertility by Education by Marriage Status in Midway
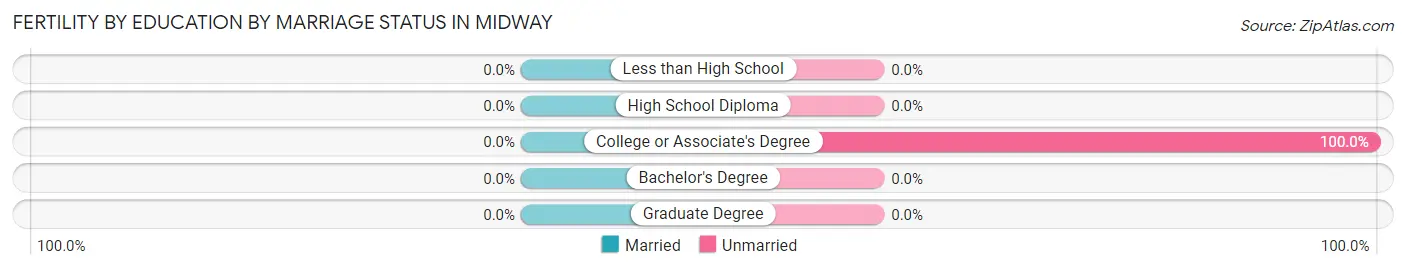
| Educational Attainment | Married | Unmarried |
| Less than High School | 0 (0.0%) | 0 (0.0%) |
| High School Diploma | 0 (0.0%) | 0 (0.0%) |
| College or Associate's Degree | 0 (0.0%) | 3 (100.0%) |
| Bachelor's Degree | 0 (0.0%) | 0 (0.0%) |
| Graduate Degree | 0 (0.0%) | 0 (0.0%) |
| Total | 0 (0.0%) | 3 (100.0%) |
Employment Characteristics in Midway
Employment by Class of Employer in Midway
Among the 868 employed individuals in Midway, private company employees (520 | 59.9%), state government employees (134 | 15.4%), and not-for-profit organizations (68 | 7.8%) make up the most common classes of employment.

| Employer Class | # Employees | % Employees |
| Private Company Employees | 520 | 59.9% |
| Self-Employed (Incorporated) | 22 | 2.5% |
| Self-Employed (Not Incorporated) | 62 | 7.1% |
| Not-for-profit Organizations | 68 | 7.8% |
| Local Government Employees | 62 | 7.1% |
| State Government Employees | 134 | 15.4% |
| Federal Government Employees | 0 | 0.0% |
| Unpaid Family Workers | 0 | 0.0% |
| Total | 868 | 100.0% |
Employment Status by Age in Midway
According to the labor force statistics for Midway, out of the total population over 16 years of age (1,563), 58.9% or 921 individuals are in the labor force, with 5.0% or 46 of them unemployed. The age group with the highest labor force participation rate is 25 to 29 years, with 100.0% or 57 individuals in the labor force. Within the labor force, the 55 to 59 years age range has the highest percentage of unemployed individuals, with 42.9% or 15 of them being unemployed.
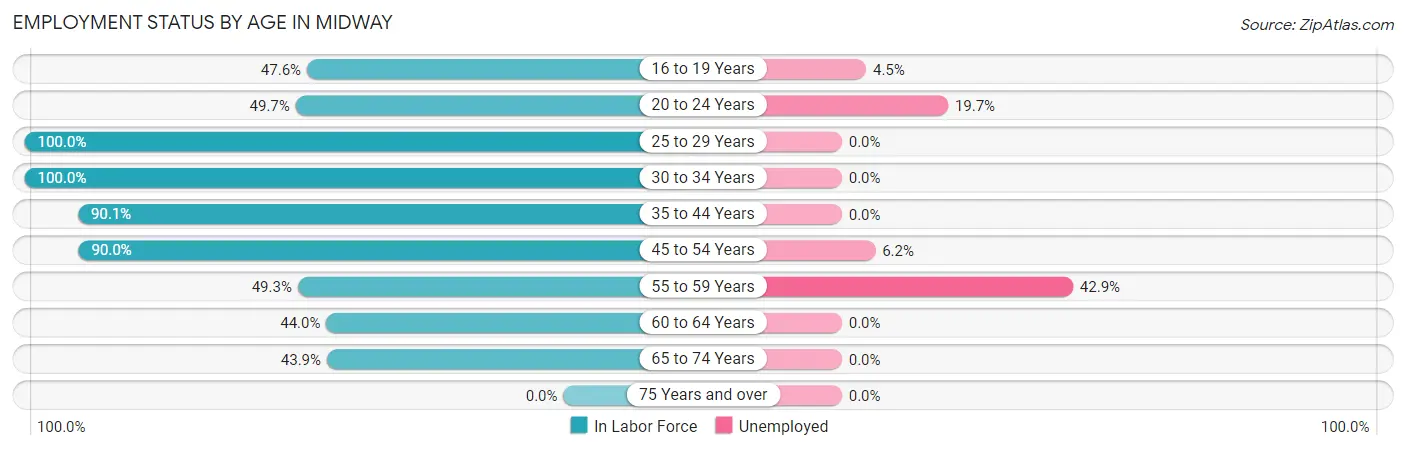
| Age Bracket | In Labor Force | Unemployed |
| 16 to 19 Years | 157 (47.6%) | 7 (4.5%) |
| 20 to 24 Years | 71 (49.7%) | 14 (19.7%) |
| 25 to 29 Years | 57 (100.0%) | 0 (0.0%) |
| 30 to 34 Years | 88 (100.0%) | 0 (0.0%) |
| 35 to 44 Years | 209 (90.1%) | 0 (0.0%) |
| 45 to 54 Years | 162 (90.0%) | 10 (6.2%) |
| 55 to 59 Years | 35 (49.3%) | 15 (42.9%) |
| 60 to 64 Years | 77 (44.0%) | 0 (0.0%) |
| 65 to 74 Years | 65 (43.9%) | 0 (0.0%) |
| 75 Years and over | 0 (0.0%) | 0 (0.0%) |
| Total | 921 (58.9%) | 46 (5.0%) |
Employment Status by Educational Attainment in Midway
According to labor force statistics for Midway, 78.2% of individuals (628) out of the total population between 25 and 64 years of age (803) are in the labor force, with 4.0% or 25 of them being unemployed. The group with the highest labor force participation rate are those with the educational attainment of less than high school, with 100.0% or 19 individuals in the labor force. Within the labor force, individuals with college / associate degree education have the highest percentage of unemployment, with 5.2% or 7 of them being unemployed.
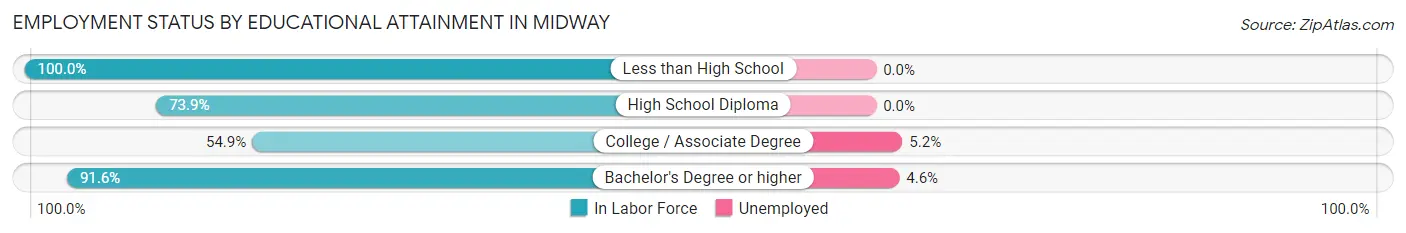
| Educational Attainment | In Labor Force | Unemployed |
| Less than High School | 19 (100.0%) | 0 (0.0%) |
| High School Diploma | 82 (73.9%) | 0 (0.0%) |
| College / Associate Degree | 134 (54.9%) | 13 (5.2%) |
| Bachelor's Degree or higher | 393 (91.6%) | 20 (4.6%) |
| Total | 628 (78.2%) | 32 (4.0%) |
Employment Occupations by Sex in Midway
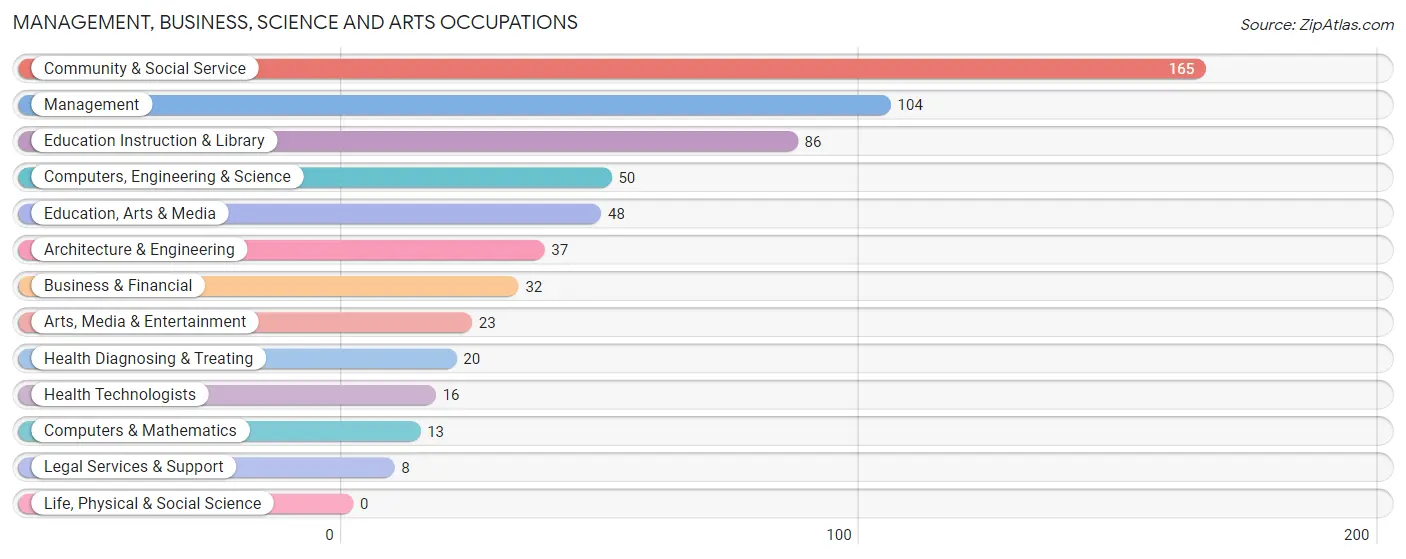
Management, Business, Science and Arts Occupations
The most common Management, Business, Science and Arts occupations in Midway are Community & Social Service (165 | 18.9%), Management (104 | 11.9%), Education Instruction & Library (86 | 9.8%), Computers, Engineering & Science (50 | 5.7%), and Education, Arts & Media (48 | 5.5%).
Management, Business, Science and Arts Occupations by Sex
Within the Management, Business, Science and Arts occupations in Midway, the most male-oriented occupations are Legal Services & Support (100.0%), Architecture & Engineering (91.9%), and Computers, Engineering & Science (74.0%), while the most female-oriented occupations are Education Instruction & Library (84.9%), Computers & Mathematics (76.9%), and Health Technologists (75.0%).
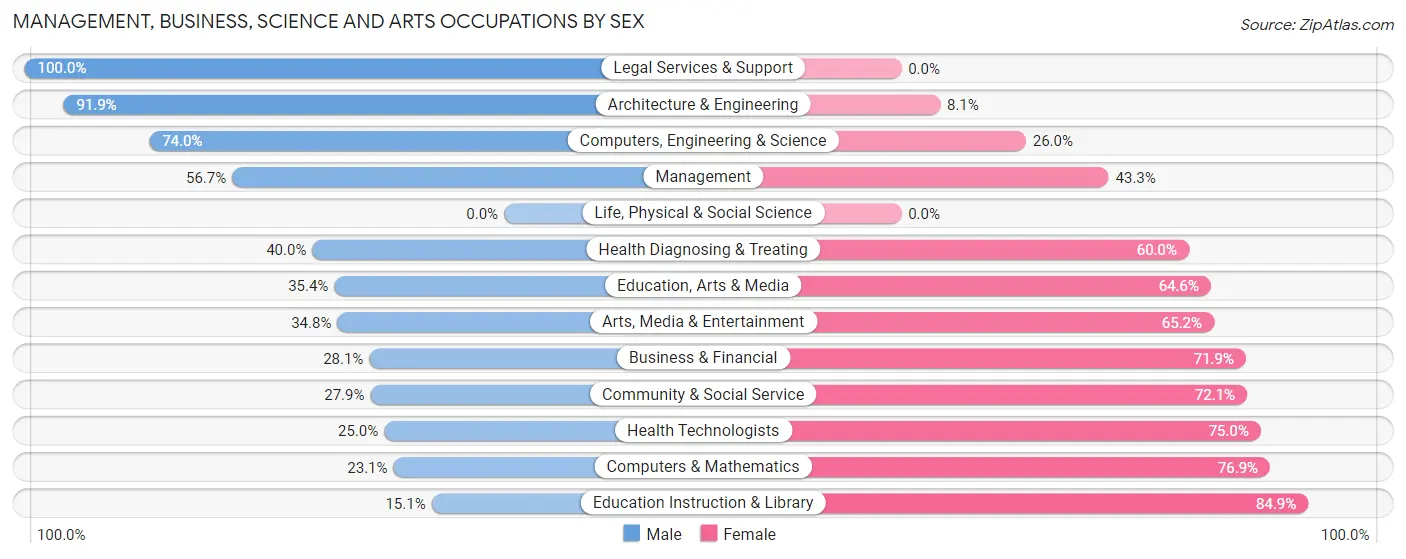
| Occupation | Male | Female |
| Management | 59 (56.7%) | 45 (43.3%) |
| Business & Financial | 9 (28.1%) | 23 (71.9%) |
| Computers, Engineering & Science | 37 (74.0%) | 13 (26.0%) |
| Computers & Mathematics | 3 (23.1%) | 10 (76.9%) |
| Architecture & Engineering | 34 (91.9%) | 3 (8.1%) |
| Life, Physical & Social Science | 0 (0.0%) | 0 (0.0%) |
| Community & Social Service | 46 (27.9%) | 119 (72.1%) |
| Education, Arts & Media | 17 (35.4%) | 31 (64.6%) |
| Legal Services & Support | 8 (100.0%) | 0 (0.0%) |
| Education Instruction & Library | 13 (15.1%) | 73 (84.9%) |
| Arts, Media & Entertainment | 8 (34.8%) | 15 (65.2%) |
| Health Diagnosing & Treating | 8 (40.0%) | 12 (60.0%) |
| Health Technologists | 4 (25.0%) | 12 (75.0%) |
| Total (Category) | 159 (42.9%) | 212 (57.1%) |
| Total (Overall) | 431 (49.3%) | 444 (50.7%) |
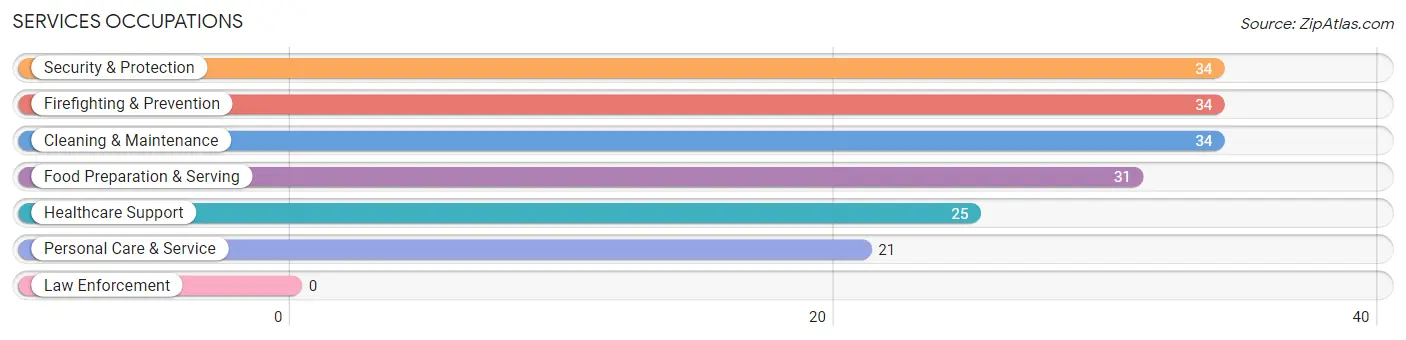
Services Occupations
The most common Services occupations in Midway are Security & Protection (34 | 3.9%), Firefighting & Prevention (34 | 3.9%), Cleaning & Maintenance (34 | 3.9%), Food Preparation & Serving (31 | 3.5%), and Healthcare Support (25 | 2.9%).
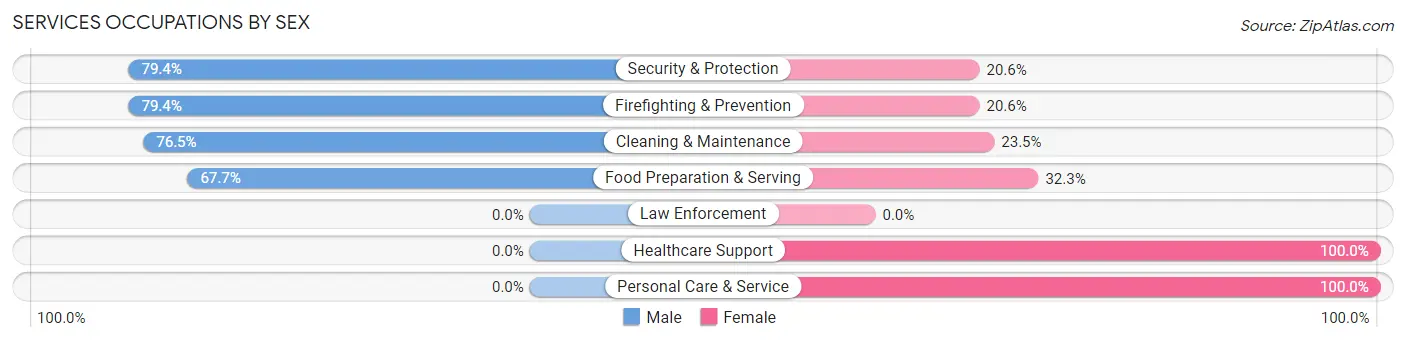
Services Occupations by Sex
Within the Services occupations in Midway, the most male-oriented occupations are Security & Protection (79.4%), Firefighting & Prevention (79.4%), and Cleaning & Maintenance (76.5%), while the most female-oriented occupations are Healthcare Support (100.0%), Personal Care & Service (100.0%), and Food Preparation & Serving (32.3%).
| Occupation | Male | Female |
| Healthcare Support | 0 (0.0%) | 25 (100.0%) |
| Security & Protection | 27 (79.4%) | 7 (20.6%) |
| Firefighting & Prevention | 27 (79.4%) | 7 (20.6%) |
| Law Enforcement | 0 (0.0%) | 0 (0.0%) |
| Food Preparation & Serving | 21 (67.7%) | 10 (32.3%) |
| Cleaning & Maintenance | 26 (76.5%) | 8 (23.5%) |
| Personal Care & Service | 0 (0.0%) | 21 (100.0%) |
| Total (Category) | 74 (51.0%) | 71 (49.0%) |
| Total (Overall) | 431 (49.3%) | 444 (50.7%) |
Sales and Office Occupations
The most common Sales and Office occupations in Midway are Office & Administration (129 | 14.7%), and Sales & Related (86 | 9.8%).

Sales and Office Occupations by Sex

| Occupation | Male | Female |
| Sales & Related | 41 (47.7%) | 45 (52.3%) |
| Office & Administration | 78 (60.5%) | 51 (39.5%) |
| Total (Category) | 119 (55.3%) | 96 (44.7%) |
| Total (Overall) | 431 (49.3%) | 444 (50.7%) |
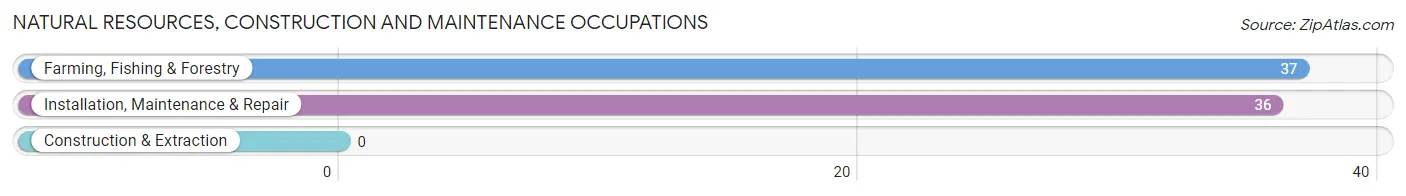
Natural Resources, Construction and Maintenance Occupations
The most common Natural Resources, Construction and Maintenance occupations in Midway are Farming, Fishing & Forestry (37 | 4.2%), and Installation, Maintenance & Repair (36 | 4.1%).
Natural Resources, Construction and Maintenance Occupations by Sex

| Occupation | Male | Female |
| Farming, Fishing & Forestry | 0 (0.0%) | 37 (100.0%) |
| Construction & Extraction | 0 (0.0%) | 0 (0.0%) |
| Installation, Maintenance & Repair | 33 (91.7%) | 3 (8.3%) |
| Total (Category) | 33 (45.2%) | 40 (54.8%) |
| Total (Overall) | 431 (49.3%) | 444 (50.7%) |
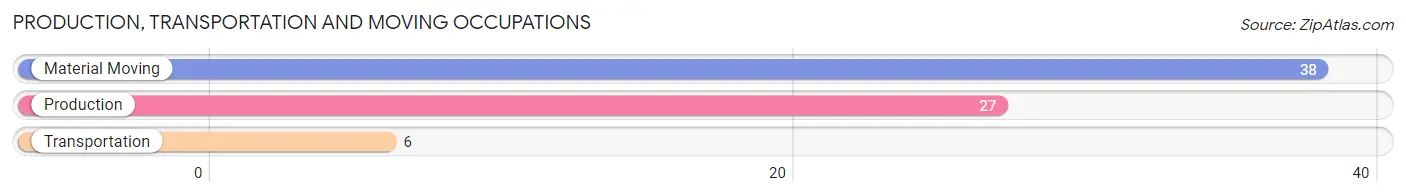
Production, Transportation and Moving Occupations
The most common Production, Transportation and Moving occupations in Midway are Material Moving (38 | 4.3%), Production (27 | 3.1%), and Transportation (6 | 0.7%).
Production, Transportation and Moving Occupations by Sex
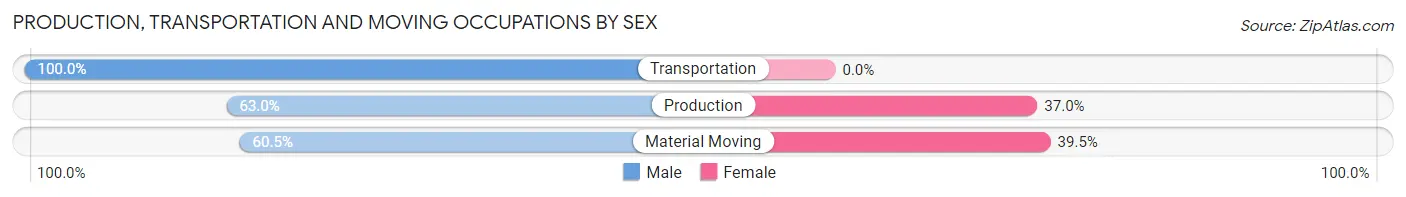
| Occupation | Male | Female |
| Production | 17 (63.0%) | 10 (37.0%) |
| Transportation | 6 (100.0%) | 0 (0.0%) |
| Material Moving | 23 (60.5%) | 15 (39.5%) |
| Total (Category) | 46 (64.8%) | 25 (35.2%) |
| Total (Overall) | 431 (49.3%) | 444 (50.7%) |
Employment Industries by Sex in Midway
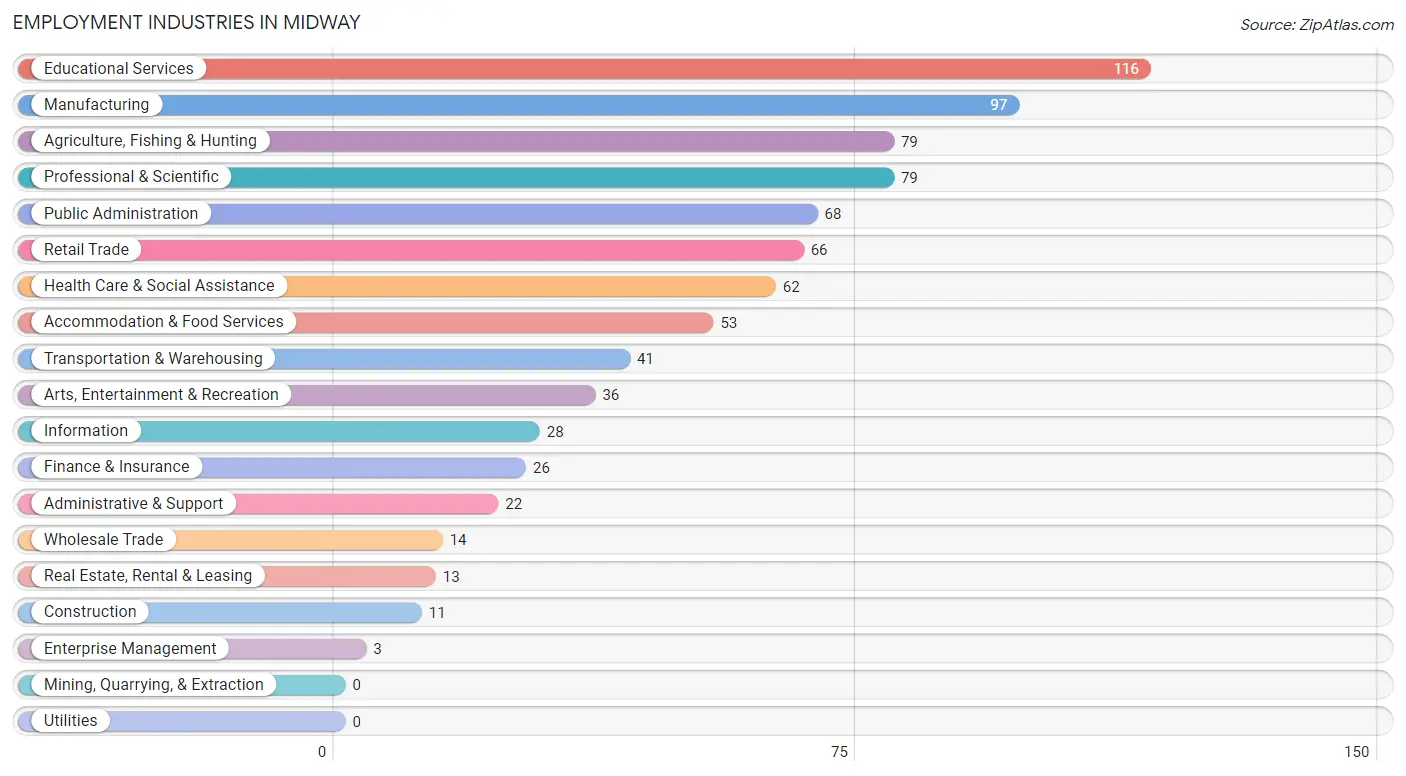
Employment Industries in Midway
The major employment industries in Midway include Educational Services (116 | 13.3%), Manufacturing (97 | 11.1%), Agriculture, Fishing & Hunting (79 | 9.0%), Professional & Scientific (79 | 9.0%), and Public Administration (68 | 7.8%).
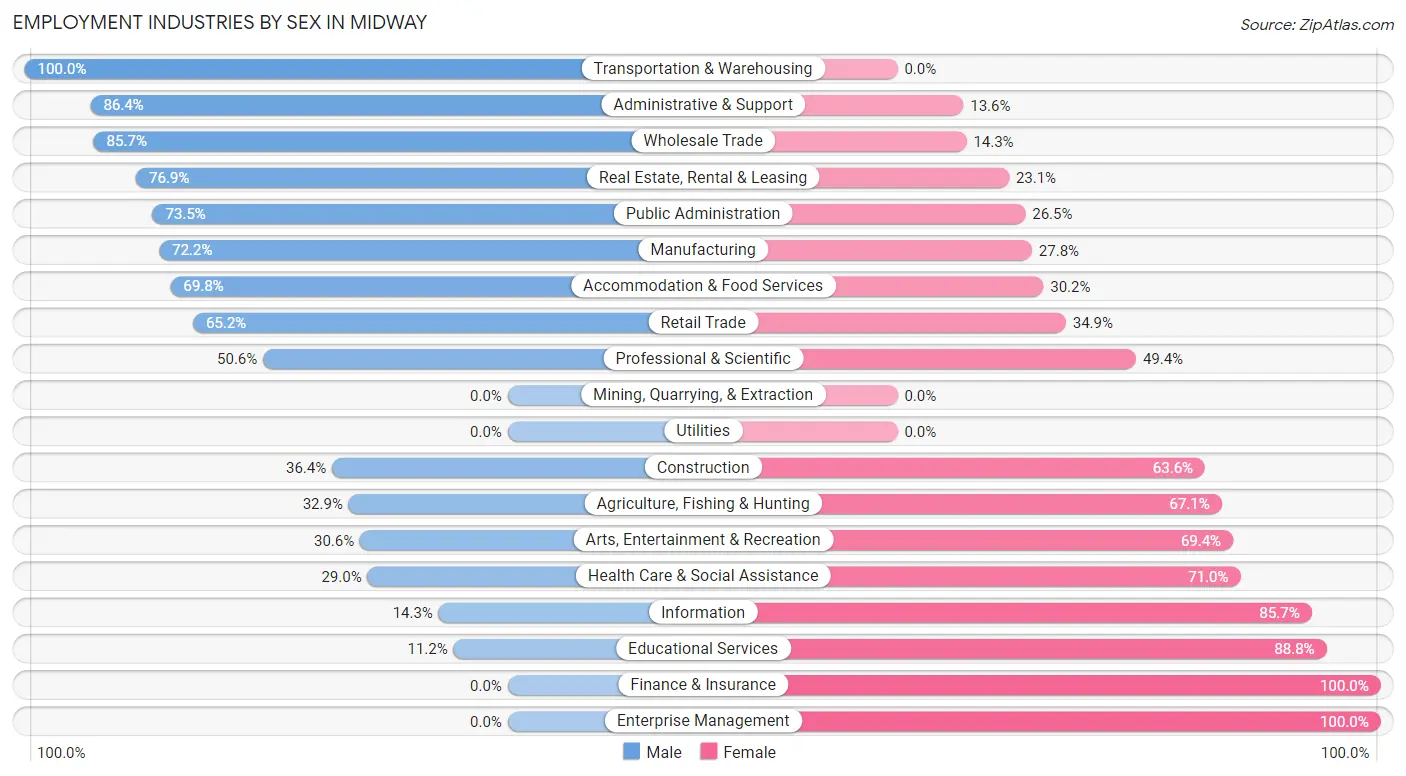
Employment Industries by Sex in Midway
The Midway industries that see more men than women are Transportation & Warehousing (100.0%), Administrative & Support (86.4%), and Wholesale Trade (85.7%), whereas the industries that tend to have a higher number of women are Finance & Insurance (100.0%), Enterprise Management (100.0%), and Educational Services (88.8%).
| Industry | Male | Female |
| Agriculture, Fishing & Hunting | 26 (32.9%) | 53 (67.1%) |
| Mining, Quarrying, & Extraction | 0 (0.0%) | 0 (0.0%) |
| Construction | 4 (36.4%) | 7 (63.6%) |
| Manufacturing | 70 (72.2%) | 27 (27.8%) |
| Wholesale Trade | 12 (85.7%) | 2 (14.3%) |
| Retail Trade | 43 (65.1%) | 23 (34.8%) |
| Transportation & Warehousing | 41 (100.0%) | 0 (0.0%) |
| Utilities | 0 (0.0%) | 0 (0.0%) |
| Information | 4 (14.3%) | 24 (85.7%) |
| Finance & Insurance | 0 (0.0%) | 26 (100.0%) |
| Real Estate, Rental & Leasing | 10 (76.9%) | 3 (23.1%) |
| Professional & Scientific | 40 (50.6%) | 39 (49.4%) |
| Enterprise Management | 0 (0.0%) | 3 (100.0%) |
| Administrative & Support | 19 (86.4%) | 3 (13.6%) |
| Educational Services | 13 (11.2%) | 103 (88.8%) |
| Health Care & Social Assistance | 18 (29.0%) | 44 (71.0%) |
| Arts, Entertainment & Recreation | 11 (30.6%) | 25 (69.4%) |
| Accommodation & Food Services | 37 (69.8%) | 16 (30.2%) |
| Public Administration | 50 (73.5%) | 18 (26.5%) |
| Total | 431 (49.3%) | 444 (50.7%) |
Education in Midway
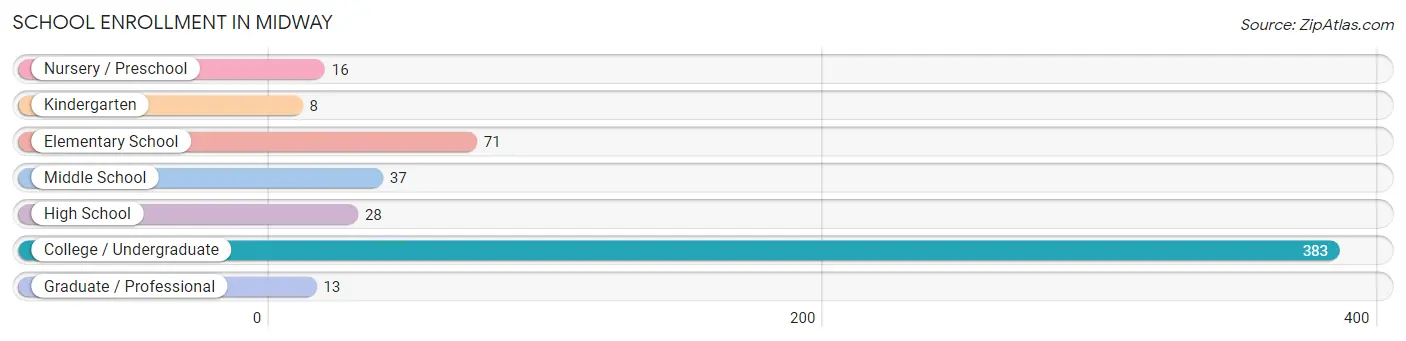
School Enrollment in Midway
The most common levels of schooling among the 556 students in Midway are college / undergraduate (383 | 68.9%), elementary school (71 | 12.8%), and middle school (37 | 6.7%).
| School Level | # Students | % Students |
| Nursery / Preschool | 16 | 2.9% |
| Kindergarten | 8 | 1.4% |
| Elementary School | 71 | 12.8% |
| Middle School | 37 | 6.7% |
| High School | 28 | 5.0% |
| College / Undergraduate | 383 | 68.9% |
| Graduate / Professional | 13 | 2.3% |
| Total | 556 | 100.0% |
School Enrollment by Age by Funding Source in Midway
Out of a total of 556 students who are enrolled in schools in Midway, 343 (61.7%) attend a private institution, while the remaining 213 (38.3%) are enrolled in public schools. The age group of 25 to 34 year olds has the highest likelihood of being enrolled in private schools, with 4 (100.0% in the age bracket) enrolled. Conversely, the age group of 5 to 9 year old has the lowest likelihood of being enrolled in a private school, with 61 (73.5% in the age bracket) attending a public institution.
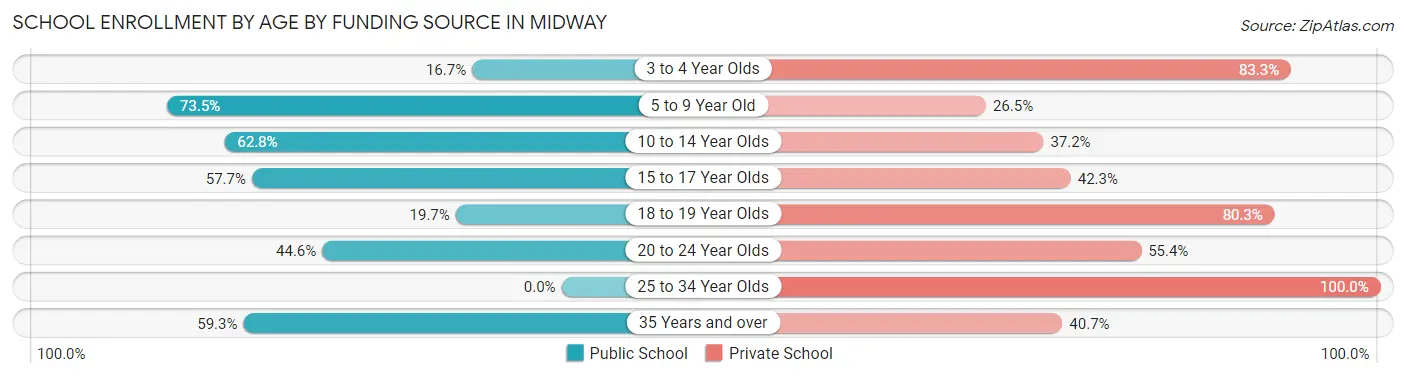
| Age Bracket | Public School | Private School |
| 3 to 4 Year Olds | 1 (16.7%) | 5 (83.3%) |
| 5 to 9 Year Old | 61 (73.5%) | 22 (26.5%) |
| 10 to 14 Year Olds | 27 (62.8%) | 16 (37.2%) |
| 15 to 17 Year Olds | 15 (57.7%) | 11 (42.3%) |
| 18 to 19 Year Olds | 56 (19.7%) | 228 (80.3%) |
| 20 to 24 Year Olds | 37 (44.6%) | 46 (55.4%) |
| 25 to 34 Year Olds | 0 (0.0%) | 4 (100.0%) |
| 35 Years and over | 16 (59.3%) | 11 (40.7%) |
| Total | 213 (38.3%) | 343 (61.7%) |
Educational Attainment by Field of Study in Midway
Education (82 | 14.5%), bio, nature & agricultural (81 | 14.3%), business (73 | 12.9%), science & technology (58 | 10.2%), and arts & humanities (50 | 8.8%) are the most common fields of study among 567 individuals in Midway who have obtained a bachelor's degree or higher.
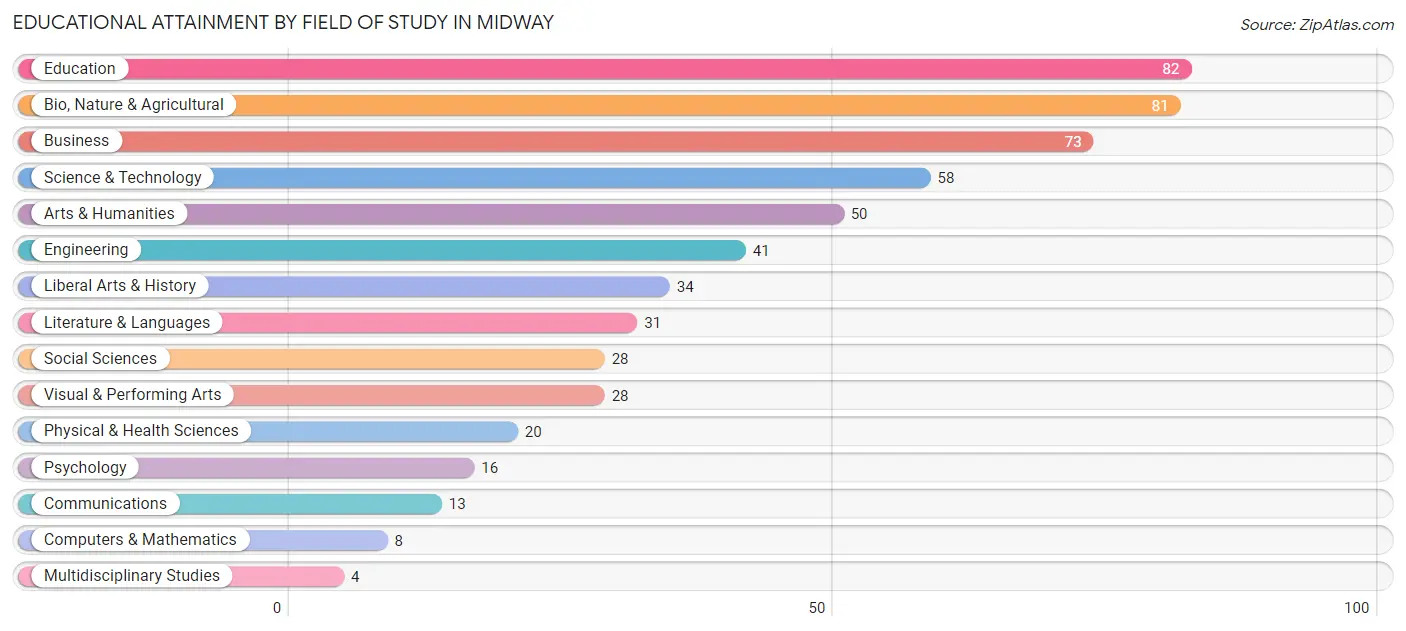
| Field of Study | # Graduates | % Graduates |
| Computers & Mathematics | 8 | 1.4% |
| Bio, Nature & Agricultural | 81 | 14.3% |
| Physical & Health Sciences | 20 | 3.5% |
| Psychology | 16 | 2.8% |
| Social Sciences | 28 | 4.9% |
| Engineering | 41 | 7.2% |
| Multidisciplinary Studies | 4 | 0.7% |
| Science & Technology | 58 | 10.2% |
| Business | 73 | 12.9% |
| Education | 82 | 14.5% |
| Literature & Languages | 31 | 5.5% |
| Liberal Arts & History | 34 | 6.0% |
| Visual & Performing Arts | 28 | 4.9% |
| Communications | 13 | 2.3% |
| Arts & Humanities | 50 | 8.8% |
| Total | 567 | 100.0% |
Transportation & Commute in Midway
Vehicle Availability by Sex in Midway
The most prevalent vehicle ownership categories in Midway are males with 3 vehicles (154, accounting for 37.1%) and females with 3 vehicles (102, making up 44.4%).
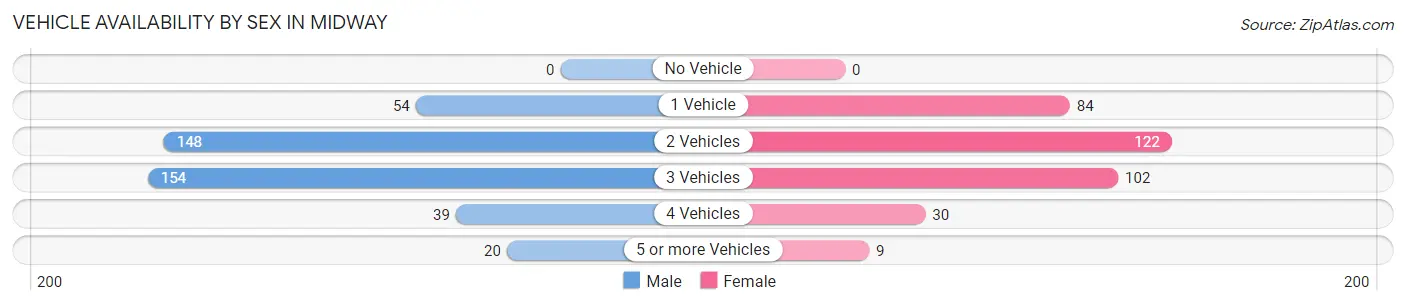
| Vehicles Available | Male | Female |
| No Vehicle | 0 (0.0%) | 0 (0.0%) |
| 1 Vehicle | 54 (13.0%) | 84 (24.2%) |
| 2 Vehicles | 148 (35.7%) | 122 (35.2%) |
| 3 Vehicles | 154 (37.1%) | 102 (29.4%) |
| 4 Vehicles | 39 (9.4%) | 30 (8.6%) |
| 5 or more Vehicles | 20 (4.8%) | 9 (2.6%) |
| Total | 415 (100.0%) | 347 (100.0%) |
Commute Time in Midway
The most frequently occuring commute durations in Midway are 20 to 24 minutes (121 commuters, 16.1%), 5 to 9 minutes (114 commuters, 15.2%), and 30 to 34 minutes (85 commuters, 11.3%).
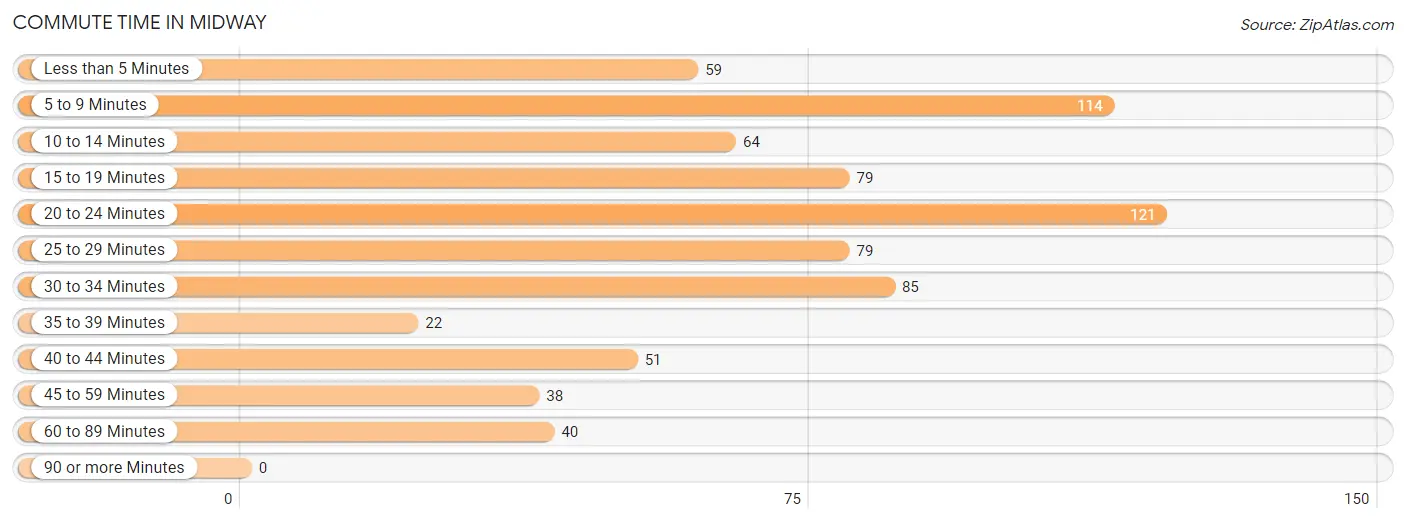
| Commute Time | # Commuters | % Commuters |
| Less than 5 Minutes | 59 | 7.9% |
| 5 to 9 Minutes | 114 | 15.2% |
| 10 to 14 Minutes | 64 | 8.5% |
| 15 to 19 Minutes | 79 | 10.5% |
| 20 to 24 Minutes | 121 | 16.1% |
| 25 to 29 Minutes | 79 | 10.5% |
| 30 to 34 Minutes | 85 | 11.3% |
| 35 to 39 Minutes | 22 | 2.9% |
| 40 to 44 Minutes | 51 | 6.8% |
| 45 to 59 Minutes | 38 | 5.1% |
| 60 to 89 Minutes | 40 | 5.3% |
| 90 or more Minutes | 0 | 0.0% |
Commute Time by Sex in Midway
The most common commute times in Midway are 5 to 9 minutes (70 commuters, 19.3%) for males and 20 to 24 minutes (56 commuters, 14.4%) for females.
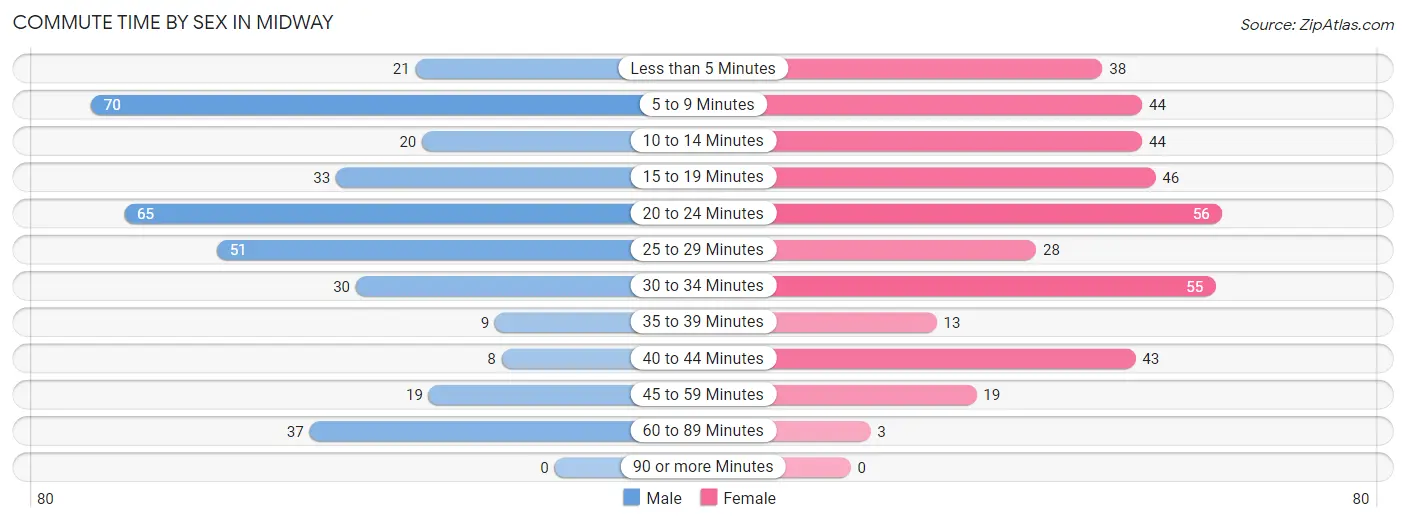
| Commute Time | Male | Female |
| Less than 5 Minutes | 21 (5.8%) | 38 (9.8%) |
| 5 to 9 Minutes | 70 (19.3%) | 44 (11.3%) |
| 10 to 14 Minutes | 20 (5.5%) | 44 (11.3%) |
| 15 to 19 Minutes | 33 (9.1%) | 46 (11.8%) |
| 20 to 24 Minutes | 65 (17.9%) | 56 (14.4%) |
| 25 to 29 Minutes | 51 (14.1%) | 28 (7.2%) |
| 30 to 34 Minutes | 30 (8.3%) | 55 (14.1%) |
| 35 to 39 Minutes | 9 (2.5%) | 13 (3.3%) |
| 40 to 44 Minutes | 8 (2.2%) | 43 (11.1%) |
| 45 to 59 Minutes | 19 (5.2%) | 19 (4.9%) |
| 60 to 89 Minutes | 37 (10.2%) | 3 (0.8%) |
| 90 or more Minutes | 0 (0.0%) | 0 (0.0%) |
Time of Departure to Work by Sex in Midway
The most frequent times of departure to work in Midway are 9:00 AM to 9:59 AM (94, 25.9%) for males and 12:00 PM to 3:59 PM (79, 20.3%) for females.
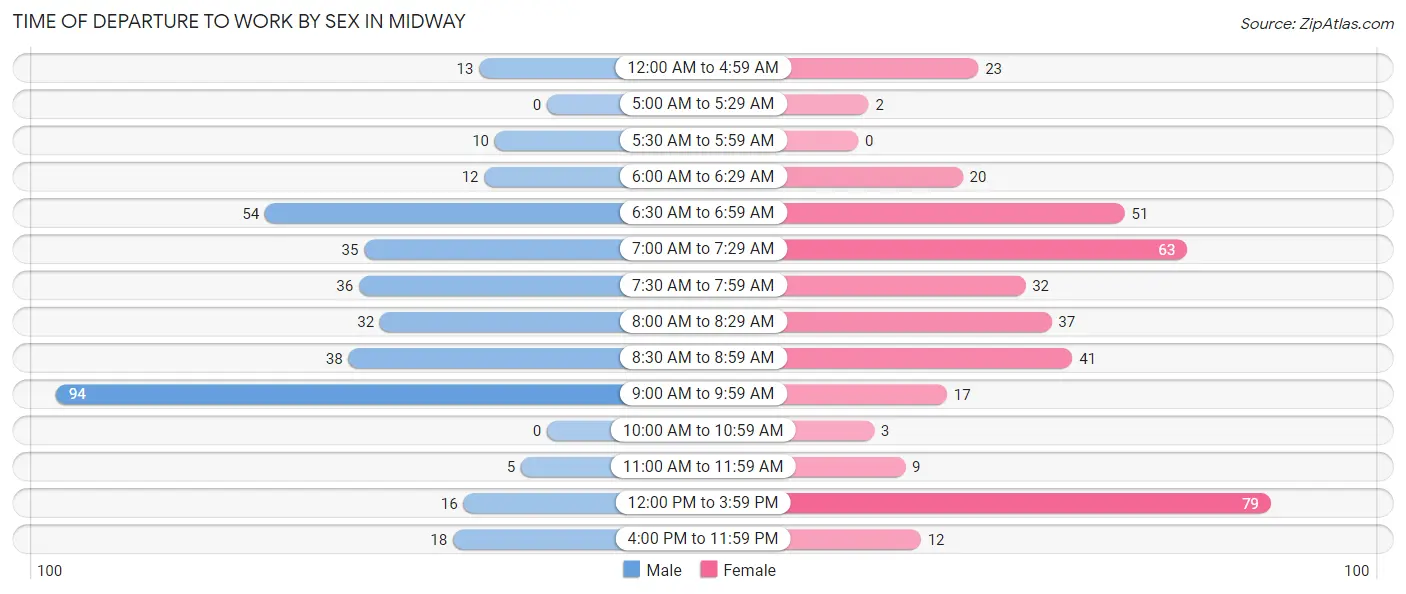
| Time of Departure | Male | Female |
| 12:00 AM to 4:59 AM | 13 (3.6%) | 23 (5.9%) |
| 5:00 AM to 5:29 AM | 0 (0.0%) | 2 (0.5%) |
| 5:30 AM to 5:59 AM | 10 (2.8%) | 0 (0.0%) |
| 6:00 AM to 6:29 AM | 12 (3.3%) | 20 (5.1%) |
| 6:30 AM to 6:59 AM | 54 (14.9%) | 51 (13.1%) |
| 7:00 AM to 7:29 AM | 35 (9.6%) | 63 (16.2%) |
| 7:30 AM to 7:59 AM | 36 (9.9%) | 32 (8.2%) |
| 8:00 AM to 8:29 AM | 32 (8.8%) | 37 (9.5%) |
| 8:30 AM to 8:59 AM | 38 (10.5%) | 41 (10.5%) |
| 9:00 AM to 9:59 AM | 94 (25.9%) | 17 (4.4%) |
| 10:00 AM to 10:59 AM | 0 (0.0%) | 3 (0.8%) |
| 11:00 AM to 11:59 AM | 5 (1.4%) | 9 (2.3%) |
| 12:00 PM to 3:59 PM | 16 (4.4%) | 79 (20.3%) |
| 4:00 PM to 11:59 PM | 18 (5.0%) | 12 (3.1%) |
| Total | 363 (100.0%) | 389 (100.0%) |
Housing Occupancy in Midway
Occupancy by Ownership in Midway
Of the total 657 dwellings in Midway, owner-occupied units account for 452 (68.8%), while renter-occupied units make up 205 (31.2%).
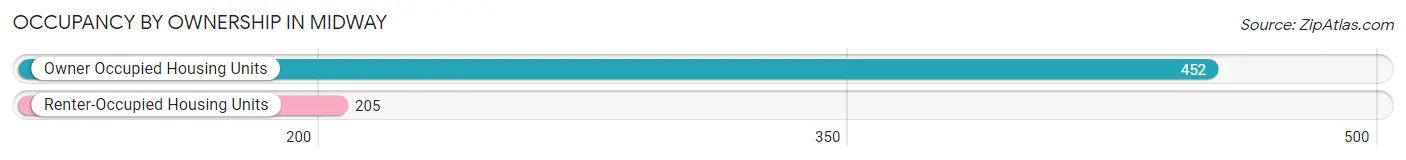
| Occupancy | # Housing Units | % Housing Units |
| Owner Occupied Housing Units | 452 | 68.8% |
| Renter-Occupied Housing Units | 205 | 31.2% |
| Total Occupied Housing Units | 657 | 100.0% |
Occupancy by Household Size in Midway
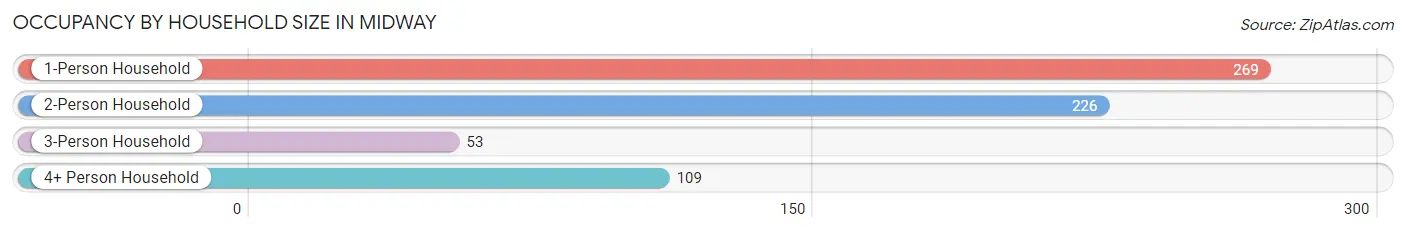
| Household Size | # Housing Units | % Housing Units |
| 1-Person Household | 269 | 40.9% |
| 2-Person Household | 226 | 34.4% |
| 3-Person Household | 53 | 8.1% |
| 4+ Person Household | 109 | 16.6% |
| Total Housing Units | 657 | 100.0% |
Occupancy by Ownership by Household Size in Midway
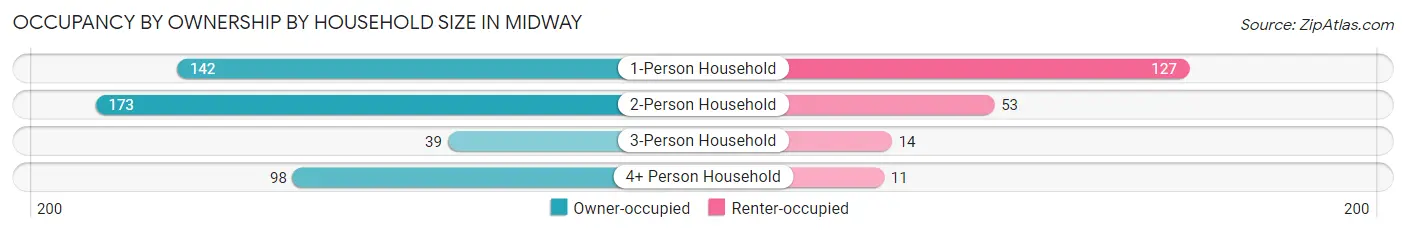
| Household Size | Owner-occupied | Renter-occupied |
| 1-Person Household | 142 (52.8%) | 127 (47.2%) |
| 2-Person Household | 173 (76.5%) | 53 (23.4%) |
| 3-Person Household | 39 (73.6%) | 14 (26.4%) |
| 4+ Person Household | 98 (89.9%) | 11 (10.1%) |
| Total Housing Units | 452 (68.8%) | 205 (31.2%) |
Occupancy by Educational Attainment in Midway
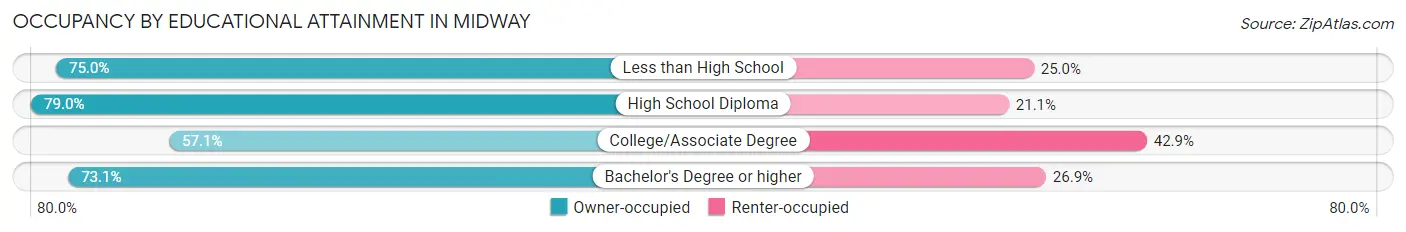
| Household Size | Owner-occupied | Renter-occupied |
| Less than High School | 9 (75.0%) | 3 (25.0%) |
| High School Diploma | 90 (78.9%) | 24 (21.0%) |
| College/Associate Degree | 125 (57.1%) | 94 (42.9%) |
| Bachelor's Degree or higher | 228 (73.1%) | 84 (26.9%) |
Occupancy by Age of Householder in Midway
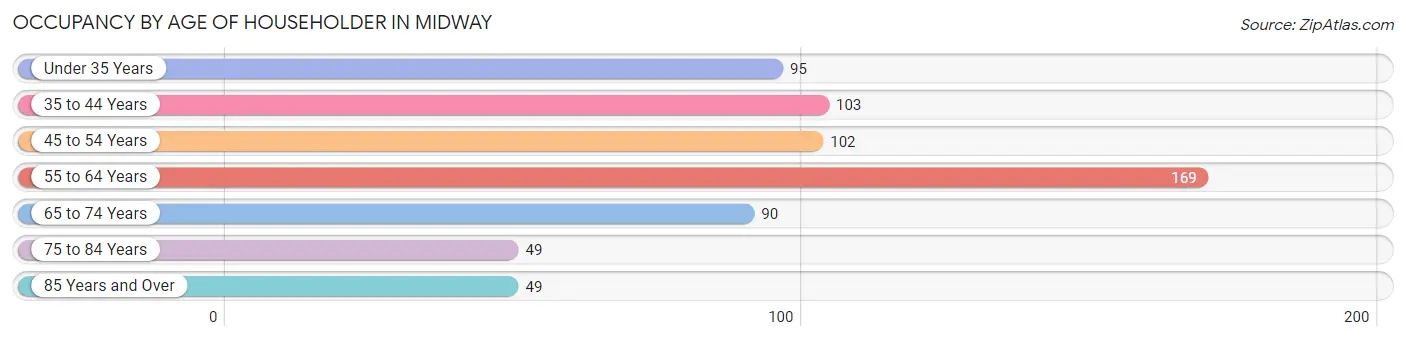
| Age Bracket | # Households | % Households |
| Under 35 Years | 95 | 14.5% |
| 35 to 44 Years | 103 | 15.7% |
| 45 to 54 Years | 102 | 15.5% |
| 55 to 64 Years | 169 | 25.7% |
| 65 to 74 Years | 90 | 13.7% |
| 75 to 84 Years | 49 | 7.5% |
| 85 Years and Over | 49 | 7.5% |
| Total | 657 | 100.0% |
Housing Finances in Midway
Median Income by Occupancy in Midway
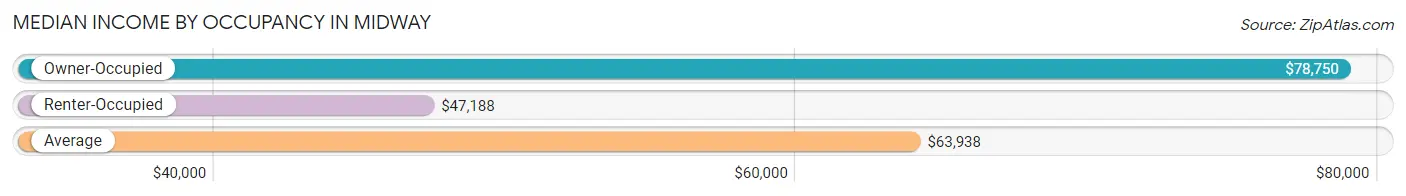
| Occupancy Type | # Households | Median Income |
| Owner-Occupied | 452 (68.8%) | $78,750 |
| Renter-Occupied | 205 (31.2%) | $47,188 |
| Average | 657 (100.0%) | $63,938 |
Occupancy by Householder Income Bracket in Midway
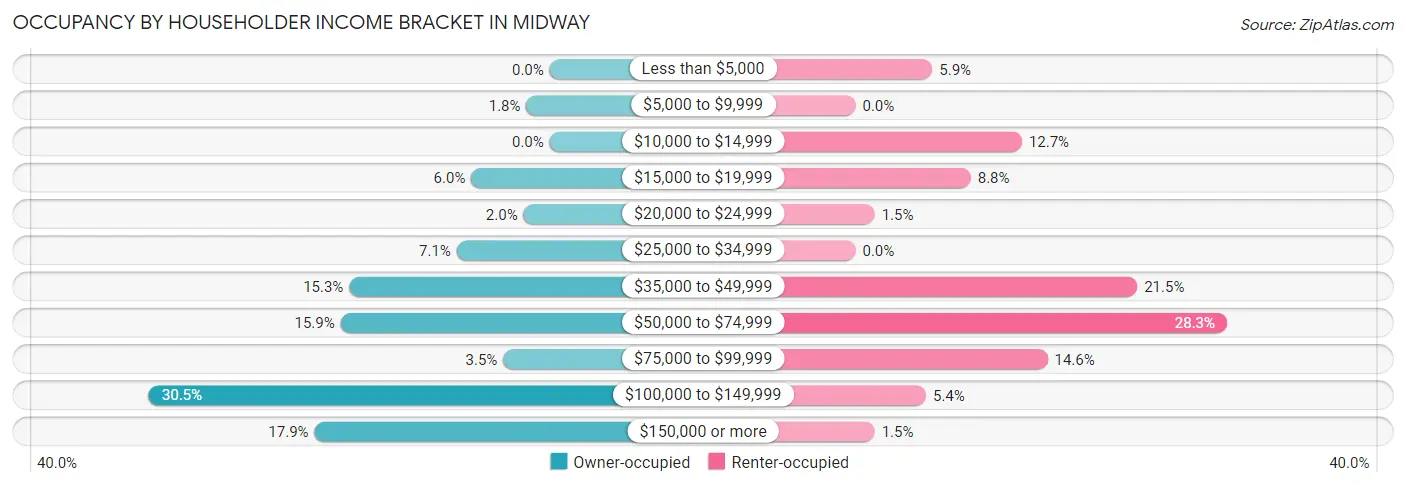
| Income Bracket | Owner-occupied | Renter-occupied |
| Less than $5,000 | 0 (0.0%) | 12 (5.9%) |
| $5,000 to $9,999 | 8 (1.8%) | 0 (0.0%) |
| $10,000 to $14,999 | 0 (0.0%) | 26 (12.7%) |
| $15,000 to $19,999 | 27 (6.0%) | 18 (8.8%) |
| $20,000 to $24,999 | 9 (2.0%) | 3 (1.5%) |
| $25,000 to $34,999 | 32 (7.1%) | 0 (0.0%) |
| $35,000 to $49,999 | 69 (15.3%) | 44 (21.5%) |
| $50,000 to $74,999 | 72 (15.9%) | 58 (28.3%) |
| $75,000 to $99,999 | 16 (3.5%) | 30 (14.6%) |
| $100,000 to $149,999 | 138 (30.5%) | 11 (5.4%) |
| $150,000 or more | 81 (17.9%) | 3 (1.5%) |
| Total | 452 (100.0%) | 205 (100.0%) |
Monthly Housing Cost Tiers in Midway
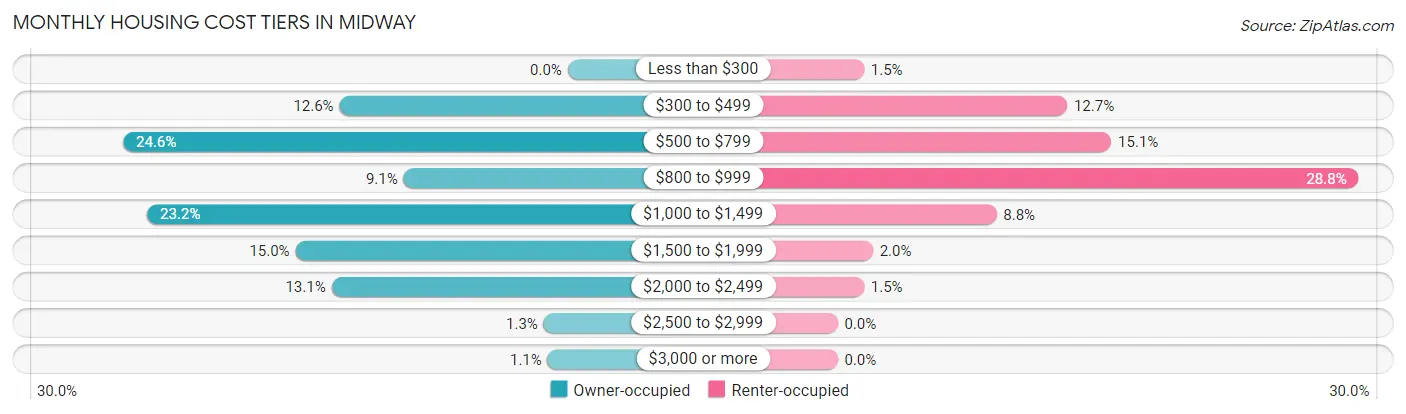
| Monthly Cost | Owner-occupied | Renter-occupied |
| Less than $300 | 0 (0.0%) | 3 (1.5%) |
| $300 to $499 | 57 (12.6%) | 26 (12.7%) |
| $500 to $799 | 111 (24.6%) | 31 (15.1%) |
| $800 to $999 | 41 (9.1%) | 59 (28.8%) |
| $1,000 to $1,499 | 105 (23.2%) | 18 (8.8%) |
| $1,500 to $1,999 | 68 (15.0%) | 4 (1.9%) |
| $2,000 to $2,499 | 59 (13.1%) | 3 (1.5%) |
| $2,500 to $2,999 | 6 (1.3%) | 0 (0.0%) |
| $3,000 or more | 5 (1.1%) | 0 (0.0%) |
| Total | 452 (100.0%) | 205 (100.0%) |
Physical Housing Characteristics in Midway
Housing Structures in Midway
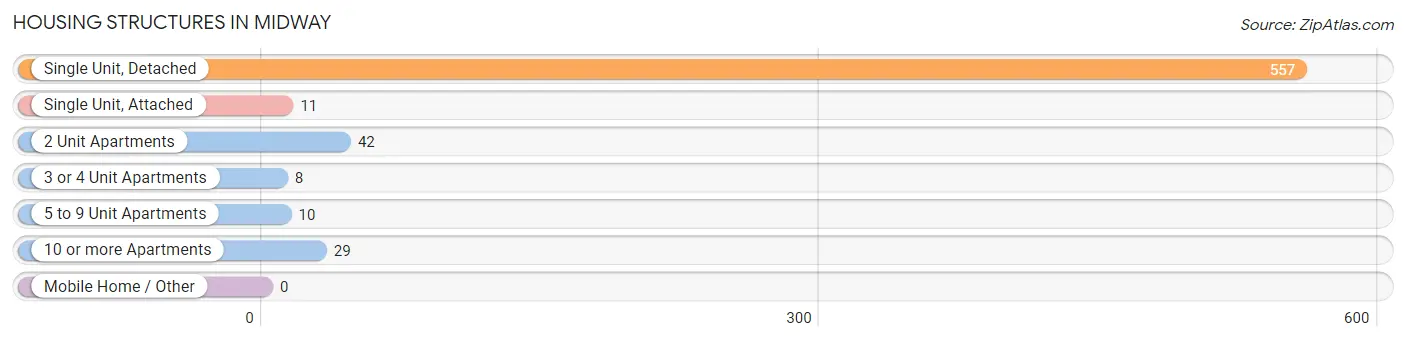
| Structure Type | # Housing Units | % Housing Units |
| Single Unit, Detached | 557 | 84.8% |
| Single Unit, Attached | 11 | 1.7% |
| 2 Unit Apartments | 42 | 6.4% |
| 3 or 4 Unit Apartments | 8 | 1.2% |
| 5 to 9 Unit Apartments | 10 | 1.5% |
| 10 or more Apartments | 29 | 4.4% |
| Mobile Home / Other | 0 | 0.0% |
| Total | 657 | 100.0% |
Housing Structures by Occupancy in Midway
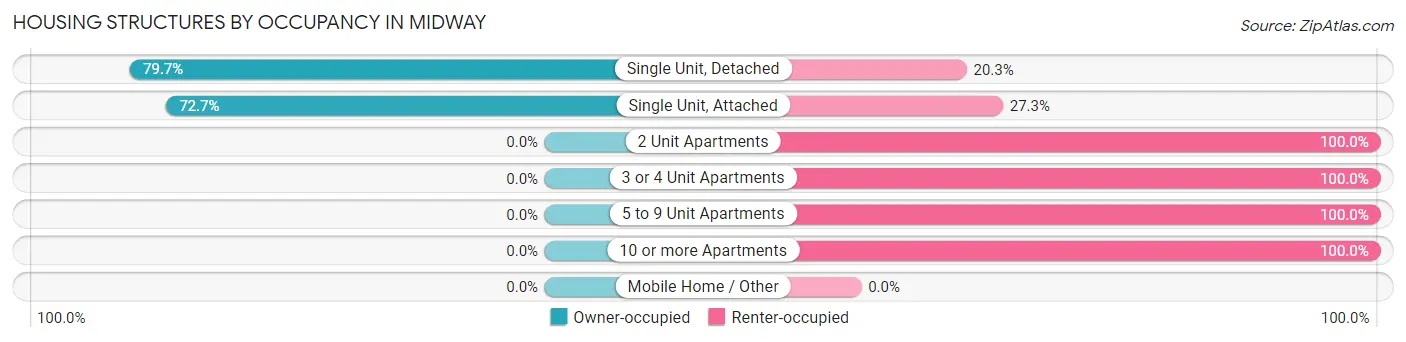
| Structure Type | Owner-occupied | Renter-occupied |
| Single Unit, Detached | 444 (79.7%) | 113 (20.3%) |
| Single Unit, Attached | 8 (72.7%) | 3 (27.3%) |
| 2 Unit Apartments | 0 (0.0%) | 42 (100.0%) |
| 3 or 4 Unit Apartments | 0 (0.0%) | 8 (100.0%) |
| 5 to 9 Unit Apartments | 0 (0.0%) | 10 (100.0%) |
| 10 or more Apartments | 0 (0.0%) | 29 (100.0%) |
| Mobile Home / Other | 0 (0.0%) | 0 (0.0%) |
| Total | 452 (68.8%) | 205 (31.2%) |
Housing Structures by Number of Rooms in Midway
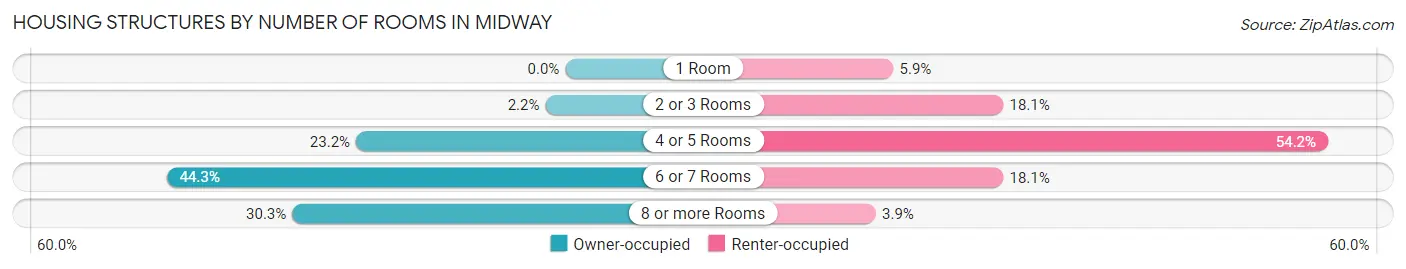
| Number of Rooms | Owner-occupied | Renter-occupied |
| 1 Room | 0 (0.0%) | 12 (5.9%) |
| 2 or 3 Rooms | 10 (2.2%) | 37 (18.0%) |
| 4 or 5 Rooms | 105 (23.2%) | 111 (54.1%) |
| 6 or 7 Rooms | 200 (44.3%) | 37 (18.0%) |
| 8 or more Rooms | 137 (30.3%) | 8 (3.9%) |
| Total | 452 (100.0%) | 205 (100.0%) |
Housing Structure by Heating Type in Midway
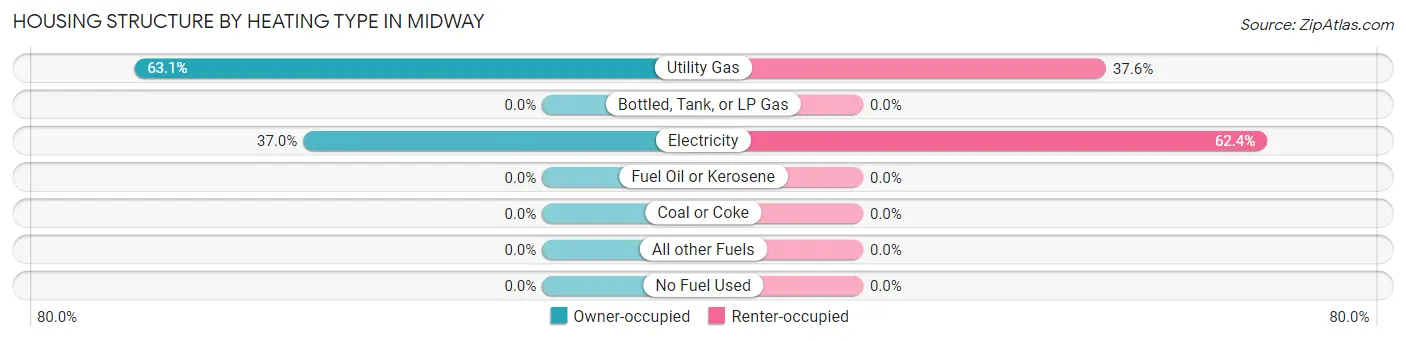
| Heating Type | Owner-occupied | Renter-occupied |
| Utility Gas | 285 (63.0%) | 77 (37.6%) |
| Bottled, Tank, or LP Gas | 0 (0.0%) | 0 (0.0%) |
| Electricity | 167 (36.9%) | 128 (62.4%) |
| Fuel Oil or Kerosene | 0 (0.0%) | 0 (0.0%) |
| Coal or Coke | 0 (0.0%) | 0 (0.0%) |
| All other Fuels | 0 (0.0%) | 0 (0.0%) |
| No Fuel Used | 0 (0.0%) | 0 (0.0%) |
| Total | 452 (100.0%) | 205 (100.0%) |
Household Vehicle Usage in Midway
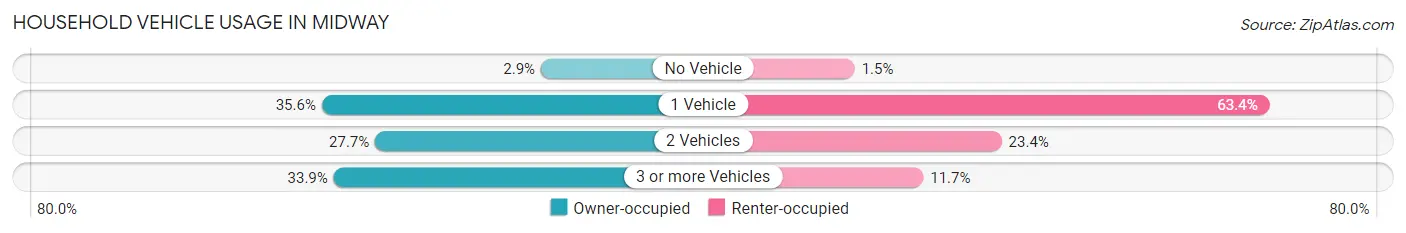
| Vehicles per Household | Owner-occupied | Renter-occupied |
| No Vehicle | 13 (2.9%) | 3 (1.5%) |
| 1 Vehicle | 161 (35.6%) | 130 (63.4%) |
| 2 Vehicles | 125 (27.7%) | 48 (23.4%) |
| 3 or more Vehicles | 153 (33.9%) | 24 (11.7%) |
| Total | 452 (100.0%) | 205 (100.0%) |
Real Estate & Mortgages in Midway
Real Estate and Mortgage Overview in Midway
| Characteristic | Without Mortgage | With Mortgage |
| Housing Units | 155 | 297 |
| Median Property Value | $248,400 | $230,300 |
| Median Household Income | $44,464 | $54 |
| Monthly Housing Costs | $549 | $5 |
| Real Estate Taxes | $1,736 | $0 |
Property Value by Mortgage Status in Midway
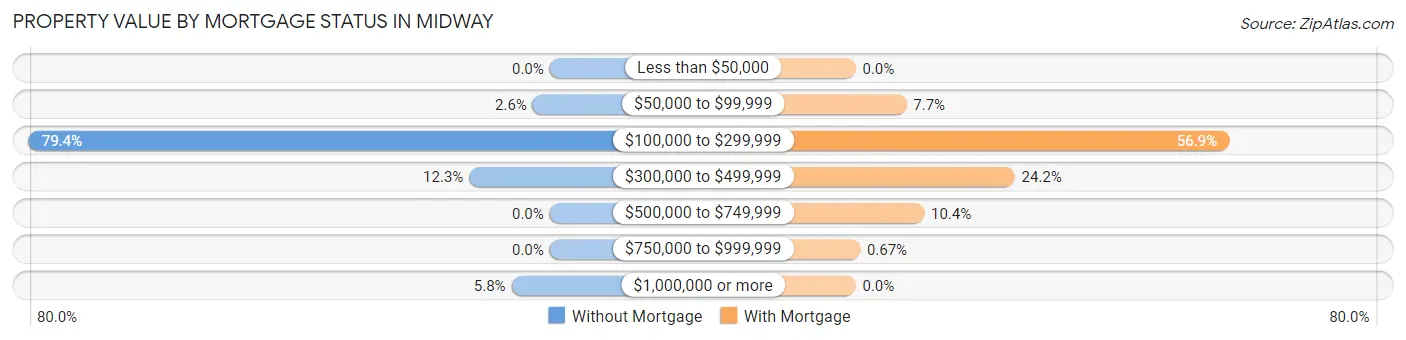
| Property Value | Without Mortgage | With Mortgage |
| Less than $50,000 | 0 (0.0%) | 0 (0.0%) |
| $50,000 to $99,999 | 4 (2.6%) | 23 (7.7%) |
| $100,000 to $299,999 | 123 (79.3%) | 169 (56.9%) |
| $300,000 to $499,999 | 19 (12.3%) | 72 (24.2%) |
| $500,000 to $749,999 | 0 (0.0%) | 31 (10.4%) |
| $750,000 to $999,999 | 0 (0.0%) | 2 (0.7%) |
| $1,000,000 or more | 9 (5.8%) | 0 (0.0%) |
| Total | 155 (100.0%) | 297 (100.0%) |
Household Income by Mortgage Status in Midway
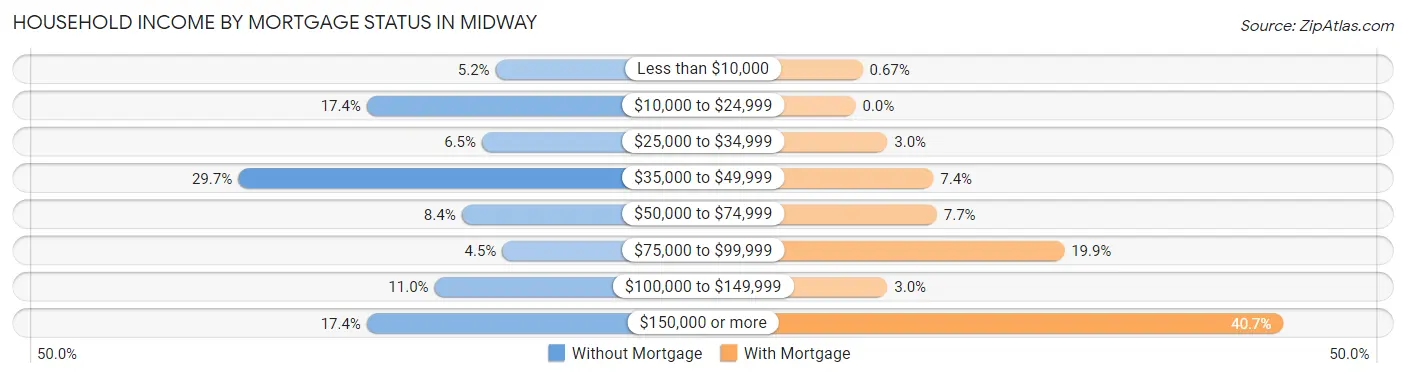
| Household Income | Without Mortgage | With Mortgage |
| Less than $10,000 | 8 (5.2%) | 2 (0.7%) |
| $10,000 to $24,999 | 27 (17.4%) | 0 (0.0%) |
| $25,000 to $34,999 | 10 (6.5%) | 9 (3.0%) |
| $35,000 to $49,999 | 46 (29.7%) | 22 (7.4%) |
| $50,000 to $74,999 | 13 (8.4%) | 23 (7.7%) |
| $75,000 to $99,999 | 7 (4.5%) | 59 (19.9%) |
| $100,000 to $149,999 | 17 (11.0%) | 9 (3.0%) |
| $150,000 or more | 27 (17.4%) | 121 (40.7%) |
| Total | 155 (100.0%) | 297 (100.0%) |
Property Value to Household Income Ratio in Midway
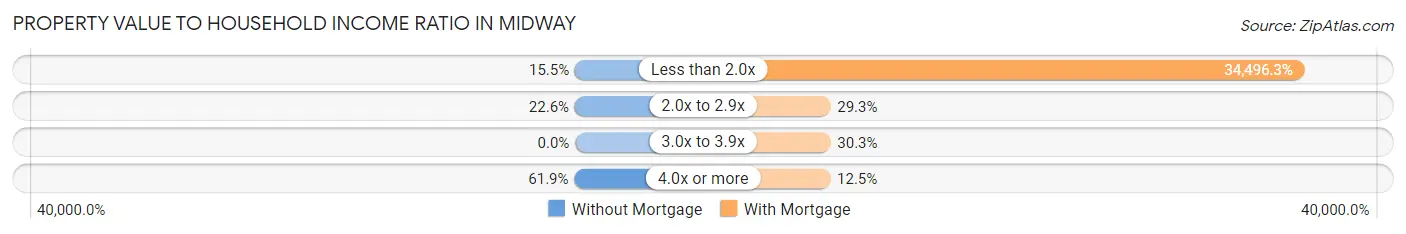
| Value-to-Income Ratio | Without Mortgage | With Mortgage |
| Less than 2.0x | 24 (15.5%) | 102,454 (34,496.3%) |
| 2.0x to 2.9x | 35 (22.6%) | 87 (29.3%) |
| 3.0x to 3.9x | 0 (0.0%) | 90 (30.3%) |
| 4.0x or more | 96 (61.9%) | 37 (12.5%) |
| Total | 155 (100.0%) | 297 (100.0%) |
Real Estate Taxes by Mortgage Status in Midway
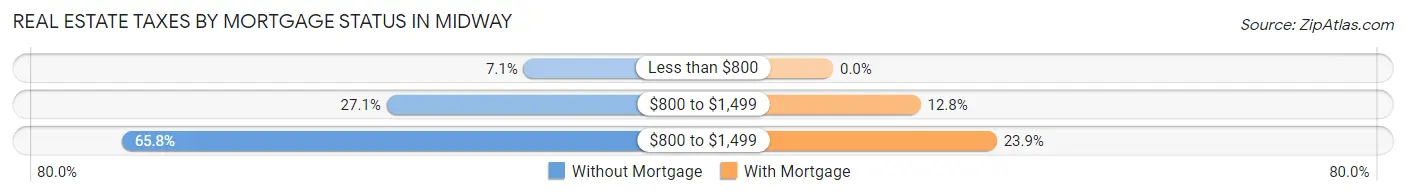
| Property Taxes | Without Mortgage | With Mortgage |
| Less than $800 | 11 (7.1%) | 0 (0.0%) |
| $800 to $1,499 | 42 (27.1%) | 38 (12.8%) |
| $800 to $1,499 | 102 (65.8%) | 71 (23.9%) |
| Total | 155 (100.0%) | 297 (100.0%) |
Health & Disability in Midway
Health Insurance Coverage by Age in Midway
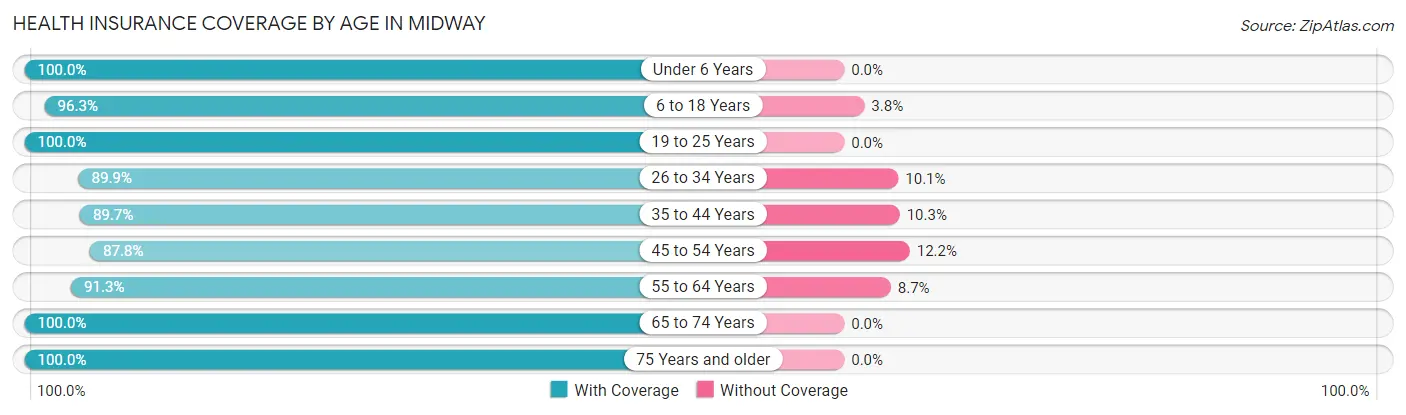
| Age Bracket | With Coverage | Without Coverage |
| Under 6 Years | 50 (100.0%) | 0 (0.0%) |
| 6 to 18 Years | 282 (96.3%) | 11 (3.7%) |
| 19 to 25 Years | 331 (100.0%) | 0 (0.0%) |
| 26 to 34 Years | 116 (89.9%) | 13 (10.1%) |
| 35 to 44 Years | 208 (89.7%) | 24 (10.3%) |
| 45 to 54 Years | 158 (87.8%) | 22 (12.2%) |
| 55 to 64 Years | 221 (91.3%) | 21 (8.7%) |
| 65 to 74 Years | 148 (100.0%) | 0 (0.0%) |
| 75 Years and older | 127 (100.0%) | 0 (0.0%) |
| Total | 1,641 (94.8%) | 91 (5.2%) |
Health Insurance Coverage by Citizenship Status in Midway
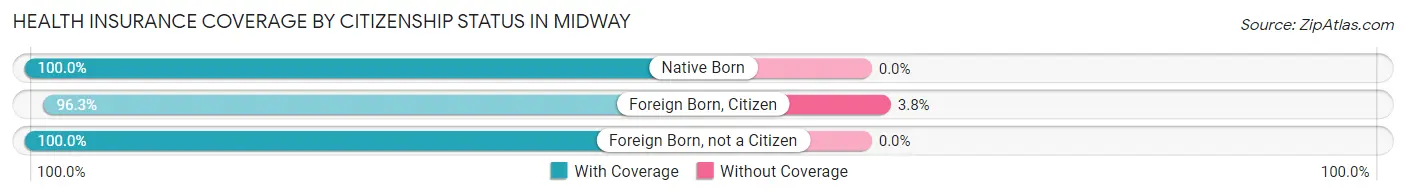
| Citizenship Status | With Coverage | Without Coverage |
| Native Born | 50 (100.0%) | 0 (0.0%) |
| Foreign Born, Citizen | 282 (96.3%) | 11 (3.7%) |
| Foreign Born, not a Citizen | 331 (100.0%) | 0 (0.0%) |
Health Insurance Coverage by Household Income in Midway
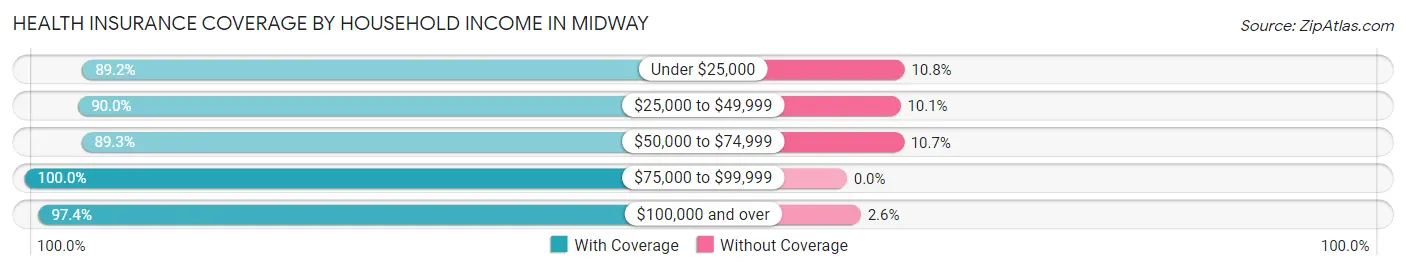
| Household Income | With Coverage | Without Coverage |
| Under $25,000 | 157 (89.2%) | 19 (10.8%) |
| $25,000 to $49,999 | 197 (89.9%) | 22 (10.1%) |
| $50,000 to $74,999 | 218 (89.3%) | 26 (10.7%) |
| $75,000 to $99,999 | 86 (100.0%) | 0 (0.0%) |
| $100,000 and over | 709 (97.4%) | 19 (2.6%) |
Public vs Private Health Insurance Coverage by Age in Midway
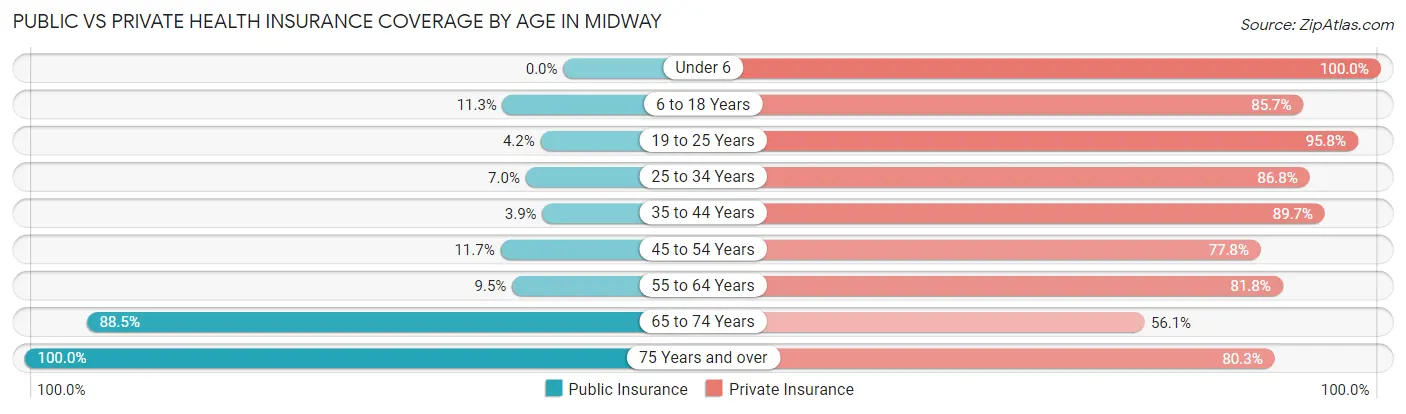
| Age Bracket | Public Insurance | Private Insurance |
| Under 6 | 0 (0.0%) | 50 (100.0%) |
| 6 to 18 Years | 33 (11.3%) | 251 (85.7%) |
| 19 to 25 Years | 14 (4.2%) | 317 (95.8%) |
| 25 to 34 Years | 9 (7.0%) | 112 (86.8%) |
| 35 to 44 Years | 9 (3.9%) | 208 (89.7%) |
| 45 to 54 Years | 21 (11.7%) | 140 (77.8%) |
| 55 to 64 Years | 23 (9.5%) | 198 (81.8%) |
| 65 to 74 Years | 131 (88.5%) | 83 (56.1%) |
| 75 Years and over | 127 (100.0%) | 102 (80.3%) |
| Total | 367 (21.2%) | 1,461 (84.4%) |
Disability Status by Sex by Age in Midway
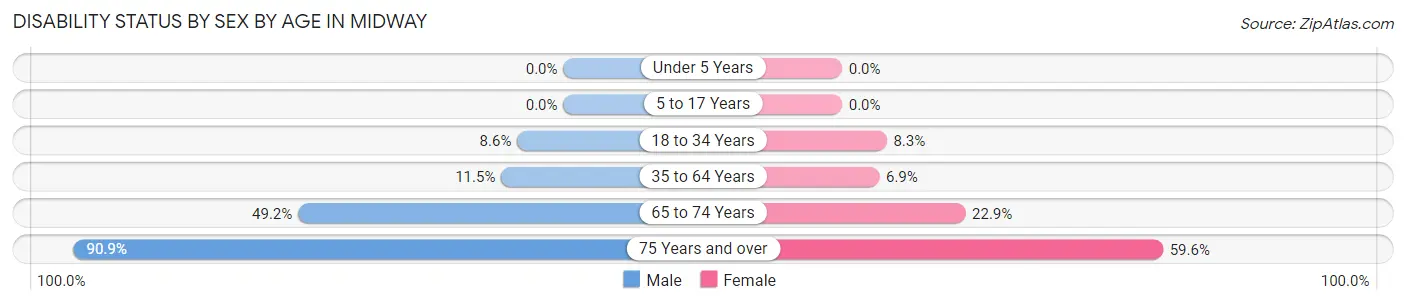
| Age Bracket | Male | Female |
| Under 5 Years | 0 (0.0%) | 0 (0.0%) |
| 5 to 17 Years | 0 (0.0%) | 0 (0.0%) |
| 18 to 34 Years | 19 (8.6%) | 29 (8.3%) |
| 35 to 64 Years | 37 (11.5%) | 23 (6.9%) |
| 65 to 74 Years | 32 (49.2%) | 19 (22.9%) |
| 75 Years and over | 30 (90.9%) | 56 (59.6%) |
Disability Class by Sex by Age in Midway
Disability Class: Hearing Difficulty
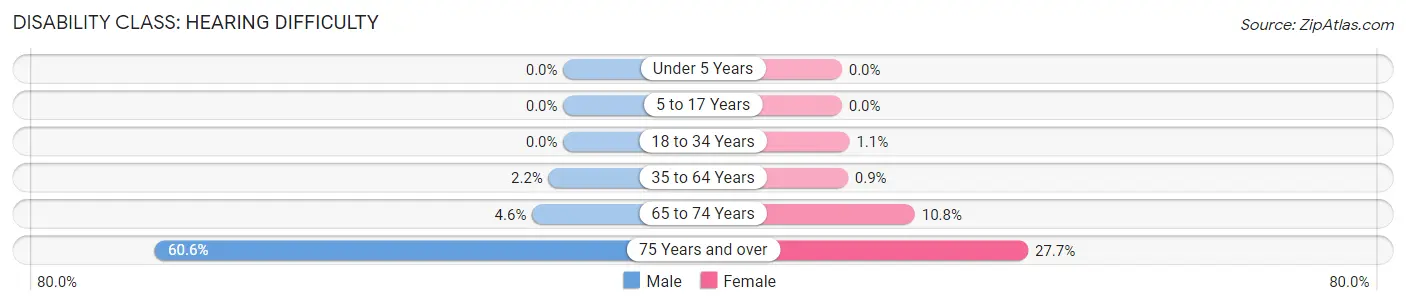
| Age Bracket | Male | Female |
| Under 5 Years | 0 (0.0%) | 0 (0.0%) |
| 5 to 17 Years | 0 (0.0%) | 0 (0.0%) |
| 18 to 34 Years | 0 (0.0%) | 4 (1.1%) |
| 35 to 64 Years | 7 (2.2%) | 3 (0.9%) |
| 65 to 74 Years | 3 (4.6%) | 9 (10.8%) |
| 75 Years and over | 20 (60.6%) | 26 (27.7%) |
Disability Class: Vision Difficulty
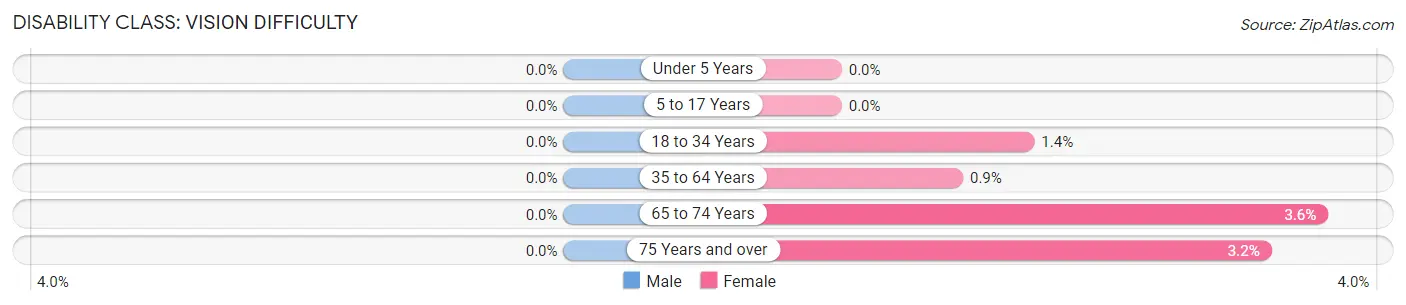
| Age Bracket | Male | Female |
| Under 5 Years | 0 (0.0%) | 0 (0.0%) |
| 5 to 17 Years | 0 (0.0%) | 0 (0.0%) |
| 18 to 34 Years | 0 (0.0%) | 5 (1.4%) |
| 35 to 64 Years | 0 (0.0%) | 3 (0.9%) |
| 65 to 74 Years | 0 (0.0%) | 3 (3.6%) |
| 75 Years and over | 0 (0.0%) | 3 (3.2%) |
Disability Class: Cognitive Difficulty
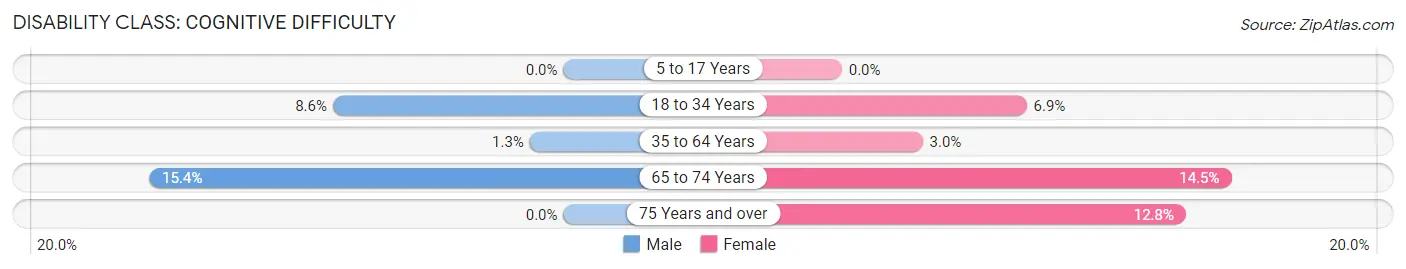
| Age Bracket | Male | Female |
| 5 to 17 Years | 0 (0.0%) | 0 (0.0%) |
| 18 to 34 Years | 19 (8.6%) | 24 (6.9%) |
| 35 to 64 Years | 4 (1.3%) | 10 (3.0%) |
| 65 to 74 Years | 10 (15.4%) | 12 (14.5%) |
| 75 Years and over | 0 (0.0%) | 12 (12.8%) |
Disability Class: Ambulatory Difficulty
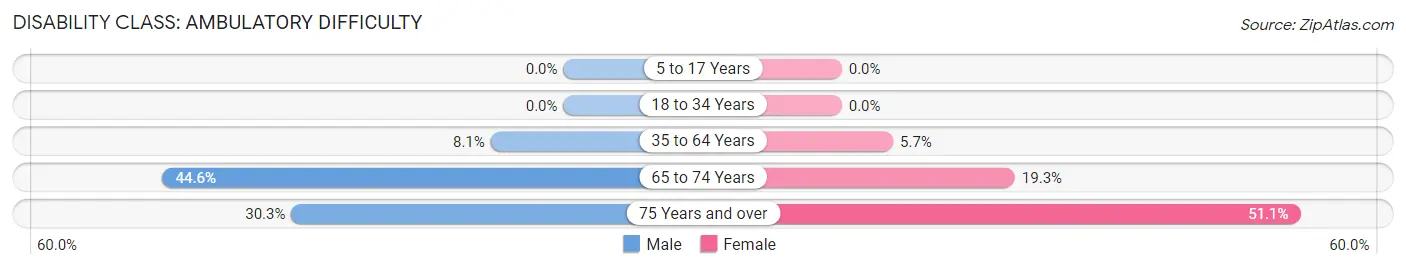
| Age Bracket | Male | Female |
| 5 to 17 Years | 0 (0.0%) | 0 (0.0%) |
| 18 to 34 Years | 0 (0.0%) | 0 (0.0%) |
| 35 to 64 Years | 26 (8.1%) | 19 (5.7%) |
| 65 to 74 Years | 29 (44.6%) | 16 (19.3%) |
| 75 Years and over | 10 (30.3%) | 48 (51.1%) |
Disability Class: Self-Care Difficulty
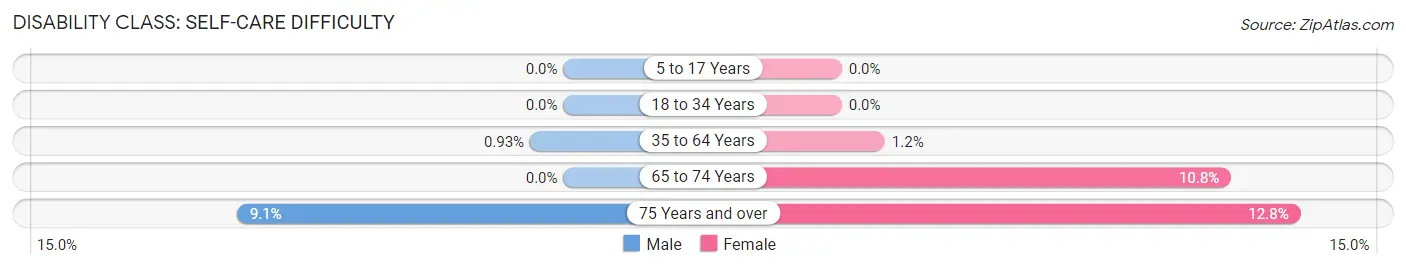
| Age Bracket | Male | Female |
| 5 to 17 Years | 0 (0.0%) | 0 (0.0%) |
| 18 to 34 Years | 0 (0.0%) | 0 (0.0%) |
| 35 to 64 Years | 3 (0.9%) | 4 (1.2%) |
| 65 to 74 Years | 0 (0.0%) | 9 (10.8%) |
| 75 Years and over | 3 (9.1%) | 12 (12.8%) |
Technology Access in Midway
Computing Device Access in Midway
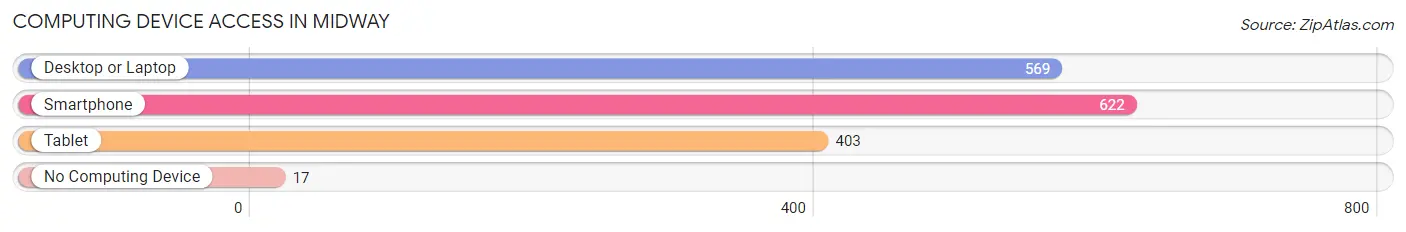
| Device Type | # Households | % Households |
| Desktop or Laptop | 569 | 86.6% |
| Smartphone | 622 | 94.7% |
| Tablet | 403 | 61.3% |
| No Computing Device | 17 | 2.6% |
| Total | 657 | 100.0% |
Internet Access in Midway

| Internet Type | # Households | % Households |
| Dial-Up Internet | 0 | 0.0% |
| Broadband Home | 506 | 77.0% |
| Cellular Data Only | 78 | 11.9% |
| Satellite Internet | 64 | 9.7% |
| No Internet | 47 | 7.1% |
| Total | 657 | 100.0% |
Midway Summary
Midway, Kentucky is a small city located in Woodford County, Kentucky. It is situated in the heart of the Bluegrass Region, and is home to a population of approximately 1,800 people. The city is known for its historic downtown area, which is home to a variety of shops, restaurants, and other businesses.
History
Midway was founded in 1790 by a group of settlers from Virginia. The city was originally known as “The Crossroads” due to its location at the intersection of two major roads. In 1836, the city was officially incorporated and renamed Midway, in reference to its location between Lexington and Frankfort.
In the late 19th century, Midway experienced a period of growth and prosperity. The city was home to a variety of businesses, including a flour mill, a sawmill, a distillery, and a brickyard. The city also had a thriving horse racing industry, and was home to the famous Midway Race Course.
In the early 20th century, Midway experienced a period of decline. The city’s economy was heavily impacted by the Great Depression, and many of its businesses closed. In the 1950s, the city began to experience a period of revitalization, and many of its historic buildings were restored.
Geography
Midway is located in the heart of the Bluegrass Region of Kentucky. The city is situated in the center of Woodford County, and is bordered by the cities of Versailles, Lawrenceburg, and Frankfort. The city is located at the intersection of two major roads, US-60 and US-62.
The city is situated on a rolling landscape, and is surrounded by farmland and wooded areas. The city is located near the Kentucky River, and is home to a variety of parks and recreational areas.
Economy
Midway’s economy is largely based on agriculture and tourism. The city is home to a variety of farms, and is a popular destination for horse racing enthusiasts. The city is also home to a variety of businesses, including restaurants, shops, and other services.
Demographics
As of the 2010 census, Midway had a population of 1,841 people. The city is predominantly white, with approximately 95% of the population identifying as such. The city also has a small African American population, accounting for approximately 2% of the population. The median household income in Midway is $41,000, and the median home value is $150,000.
Common Questions
What is Per Capita Income in Midway?
Per Capita income in Midway is $36,550.
What is the Median Family Income in Midway?
Median Family Income in Midway is $102,269.
What is the Median Household income in Midway?
Median Household Income in Midway is $63,938.
What is Income or Wage Gap in Midway?
Income or Wage Gap in Midway is 34.0%.
Women in Midway earn 66.0 cents for every dollar earned by a man.
What is Inequality or Gini Index in Midway?
Inequality or Gini Index in Midway is 0.44.
What is the Total Population of Midway?
Total Population of Midway is 1,748.
What is the Total Male Population of Midway?
Total Male Population of Midway is 777.
What is the Total Female Population of Midway?
Total Female Population of Midway is 971.
What is the Ratio of Males per 100 Females in Midway?
There are 80.02 Males per 100 Females in Midway.
What is the Ratio of Females per 100 Males in Midway?
There are 124.97 Females per 100 Males in Midway.
What is the Median Population Age in Midway?
Median Population Age in Midway is 41.7 Years.
What is the Average Family Size in Midway
Average Family Size in Midway is 3.1 People.
What is the Average Household Size in Midway
Average Household Size in Midway is 2.2 People.
How Large is the Labor Force in Midway?
There are 921 People in the Labor Forcein in Midway.
What is the Percentage of People in the Labor Force in Midway?
58.9% of People are in the Labor Force in Midway.
What is the Unemployment Rate in Midway?
Unemployment Rate in Midway is 5.0%.