Rochester, KY Map & Demographics
Rochester Map
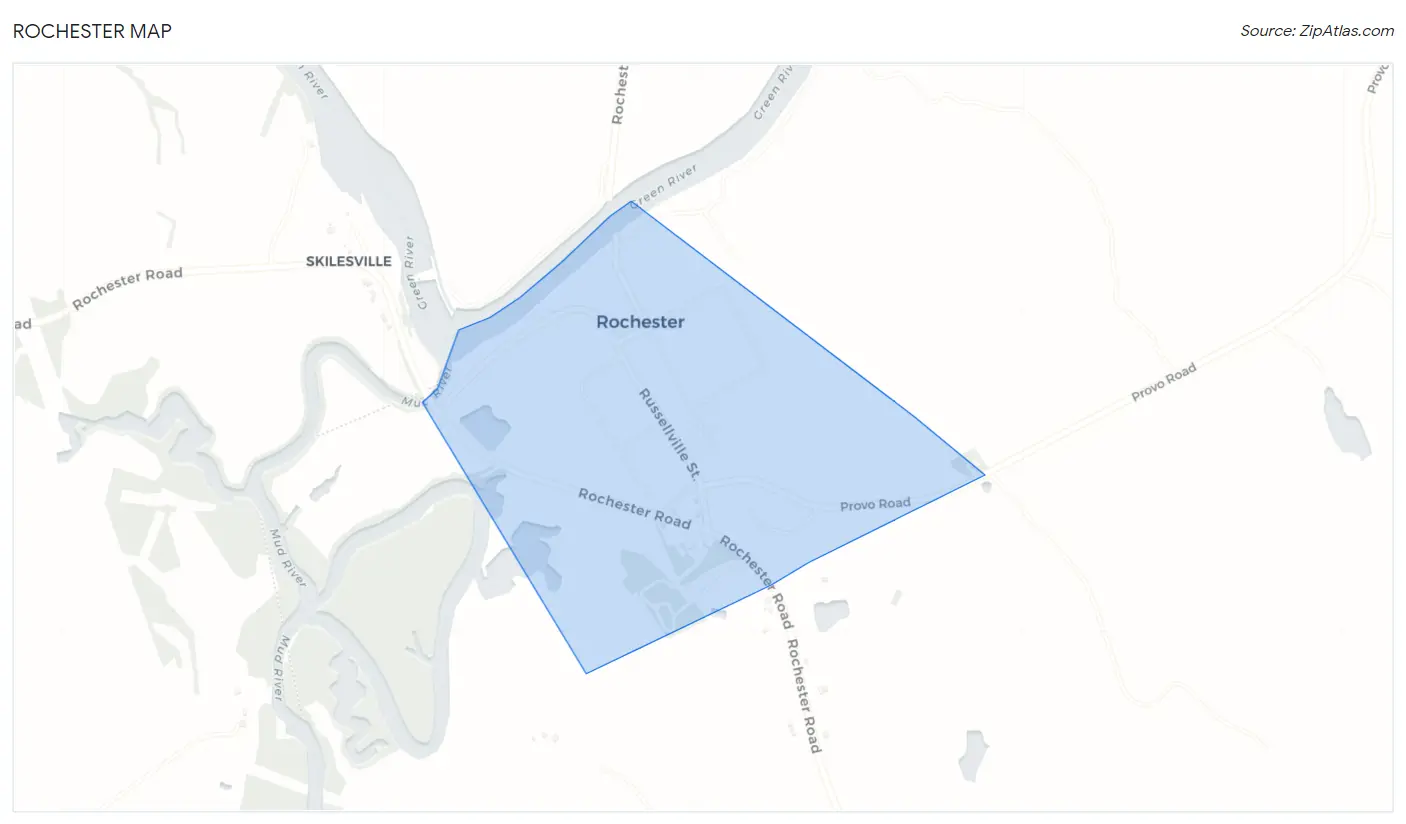
Rochester Overview
$33,637
PER CAPITA INCOME
$128,750
AVG FAMILY INCOME
0.32
INEQUALITY / GINI INDEX
180
TOTAL POPULATION
91
MALE POPULATION
89
FEMALE POPULATION
102.25
MALES / 100 FEMALES
97.80
FEMALES / 100 MALES
42.6
MEDIAN AGE
3.1
AVG FAMILY SIZE
2.7
AVG HOUSEHOLD SIZE
92
LABOR FORCE [ PEOPLE ]
57.9%
PERCENT IN LABOR FORCE
Rochester Zip Codes
Rochester Area Codes
Income in Rochester
Income Overview in Rochester
| Characteristic | Number | Measure |
| Per Capita Income | 180 | $33,637 |
| Median Family Income | 46 | $128,750 |
| Mean Family Income | 46 | $97,154 |
| Median Household Income | 67 | $0 |
| Mean Household Income | 67 | $79,730 |
| Income Deficit | 46 | $0 |
| Wage / Income Gap (%) | 180 | 0.00% |
| Wage / Income Gap ($) | 180 | 100.00¢ per $1 |
| Gini / Inequality Index | 180 | 0.32 |
Earnings by Sex in Rochester
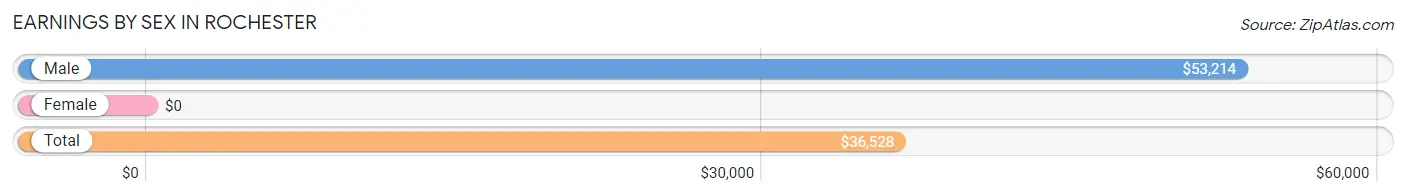
| Sex | Number | Average Earnings |
| Male | 52 (50.5%) | $53,214 |
| Female | 51 (49.5%) | $0 |
| Total | 103 (100.0%) | $36,528 |
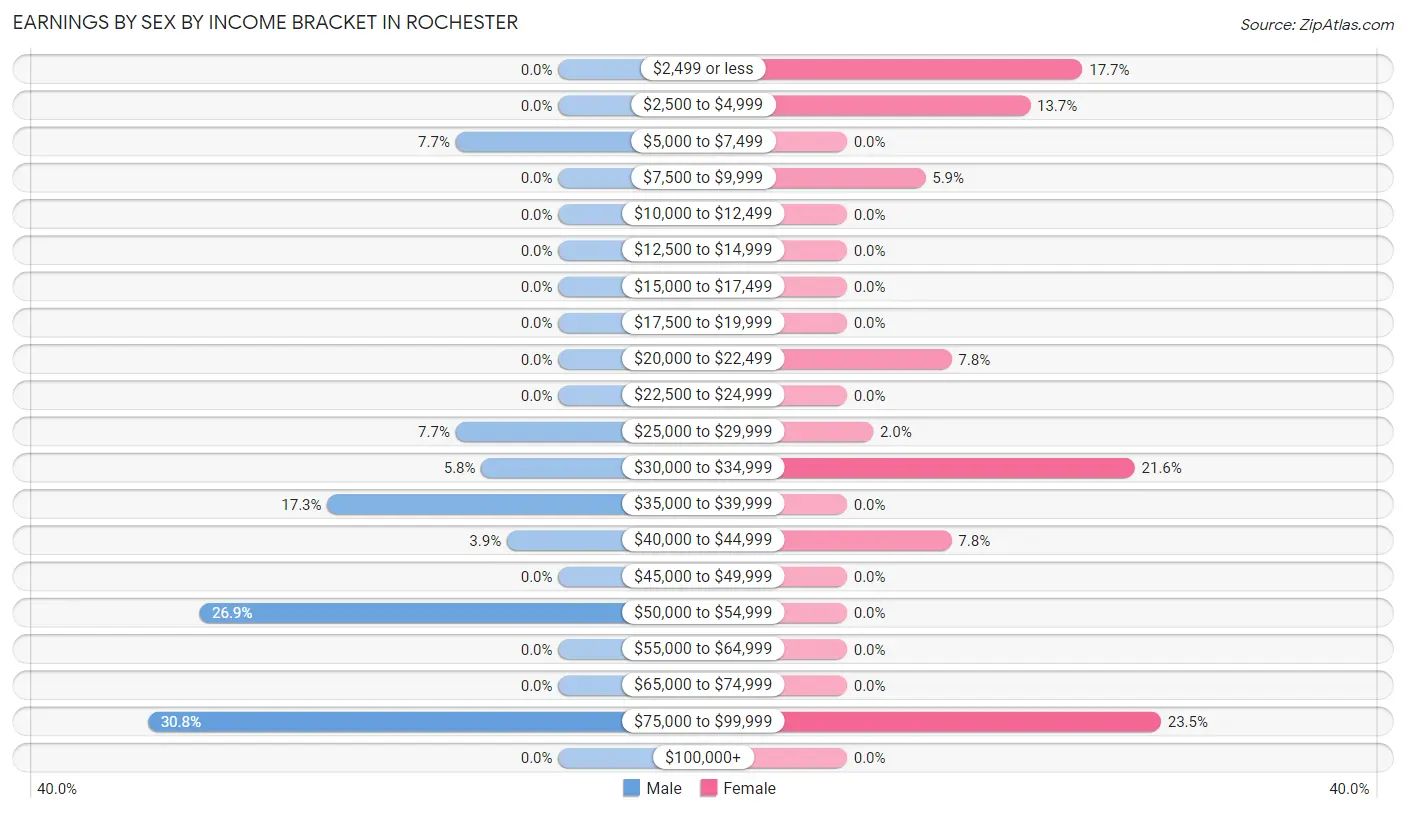
Earnings by Sex by Income Bracket in Rochester
The most common earnings brackets in Rochester are $75,000 to $99,999 for men (16 | 30.8%) and $75,000 to $99,999 for women (12 | 23.5%).
| Income | Male | Female |
| $2,499 or less | 0 (0.0%) | 9 (17.6%) |
| $2,500 to $4,999 | 0 (0.0%) | 7 (13.7%) |
| $5,000 to $7,499 | 4 (7.7%) | 0 (0.0%) |
| $7,500 to $9,999 | 0 (0.0%) | 3 (5.9%) |
| $10,000 to $12,499 | 0 (0.0%) | 0 (0.0%) |
| $12,500 to $14,999 | 0 (0.0%) | 0 (0.0%) |
| $15,000 to $17,499 | 0 (0.0%) | 0 (0.0%) |
| $17,500 to $19,999 | 0 (0.0%) | 0 (0.0%) |
| $20,000 to $22,499 | 0 (0.0%) | 4 (7.8%) |
| $22,500 to $24,999 | 0 (0.0%) | 0 (0.0%) |
| $25,000 to $29,999 | 4 (7.7%) | 1 (2.0%) |
| $30,000 to $34,999 | 3 (5.8%) | 11 (21.6%) |
| $35,000 to $39,999 | 9 (17.3%) | 0 (0.0%) |
| $40,000 to $44,999 | 2 (3.8%) | 4 (7.8%) |
| $45,000 to $49,999 | 0 (0.0%) | 0 (0.0%) |
| $50,000 to $54,999 | 14 (26.9%) | 0 (0.0%) |
| $55,000 to $64,999 | 0 (0.0%) | 0 (0.0%) |
| $65,000 to $74,999 | 0 (0.0%) | 0 (0.0%) |
| $75,000 to $99,999 | 16 (30.8%) | 12 (23.5%) |
| $100,000+ | 0 (0.0%) | 0 (0.0%) |
| Total | 52 (100.0%) | 51 (100.0%) |
Earnings by Sex by Educational Attainment in Rochester
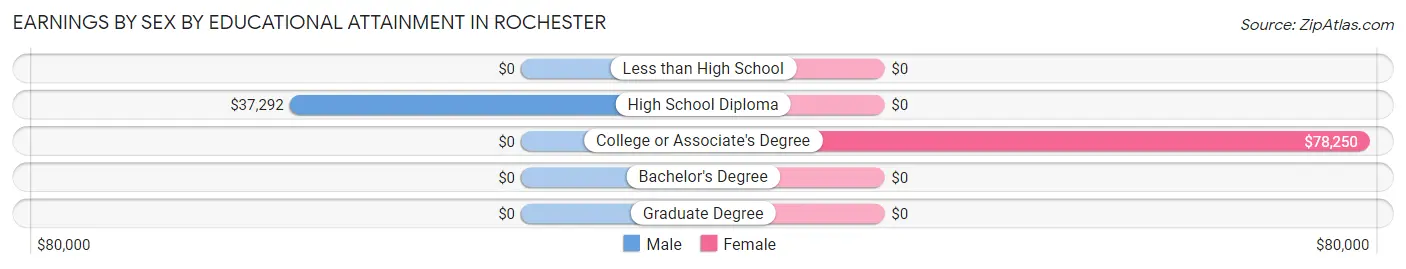
| Educational Attainment | Male Income | Female Income |
| Less than High School | - | - |
| High School Diploma | $37,292 | $0 |
| College or Associate's Degree | - | - |
| Bachelor's Degree | - | - |
| Graduate Degree | - | - |
| Total | $53,214 | $0 |
Family Income in Rochester
Family Income Brackets in Rochester
According to the Rochester family income data, there are 31 families falling into the $100,000 to $149,999 income range, which is the most common income bracket and makes up 67.4% of all families.
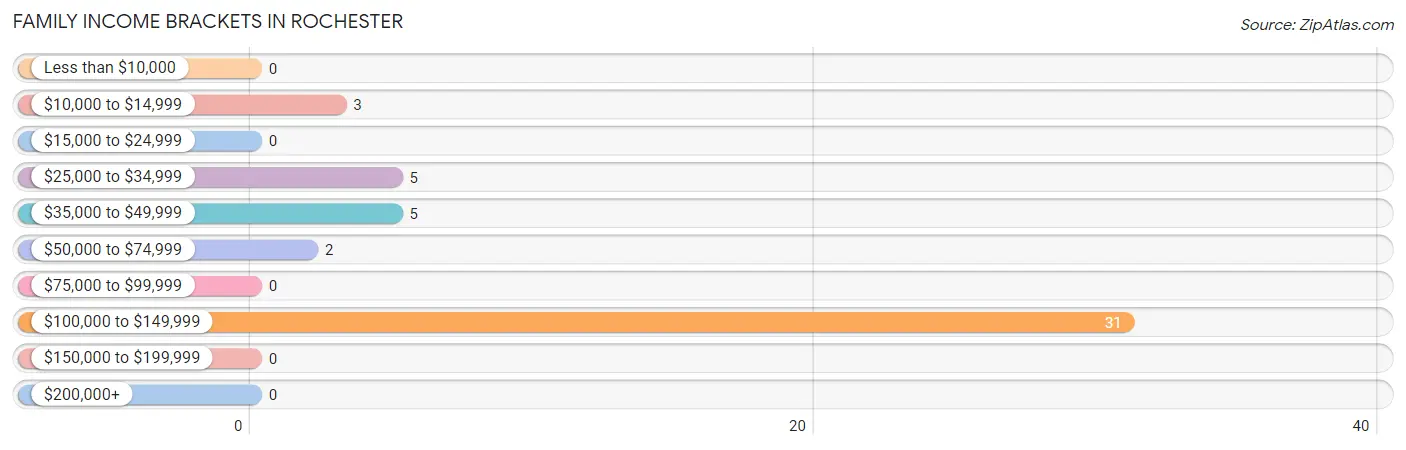
| Income Bracket | # Families | % Families |
| Less than $10,000 | 0 | 0.0% |
| $10,000 to $14,999 | 3 | 6.5% |
| $15,000 to $24,999 | 0 | 0.0% |
| $25,000 to $34,999 | 5 | 10.9% |
| $35,000 to $49,999 | 5 | 10.9% |
| $50,000 to $74,999 | 2 | 4.3% |
| $75,000 to $99,999 | 0 | 0.0% |
| $100,000 to $149,999 | 31 | 67.4% |
| $150,000 to $199,999 | 0 | 0.0% |
| $200,000+ | 0 | 0.0% |
Family Income by Famaliy Size in Rochester
2-person families (30 | 65.2%) account for the highest median family income in Rochester with $130,417 per family, while 2-person families (30 | 65.2%) have the highest median income of $65,208 per family member.
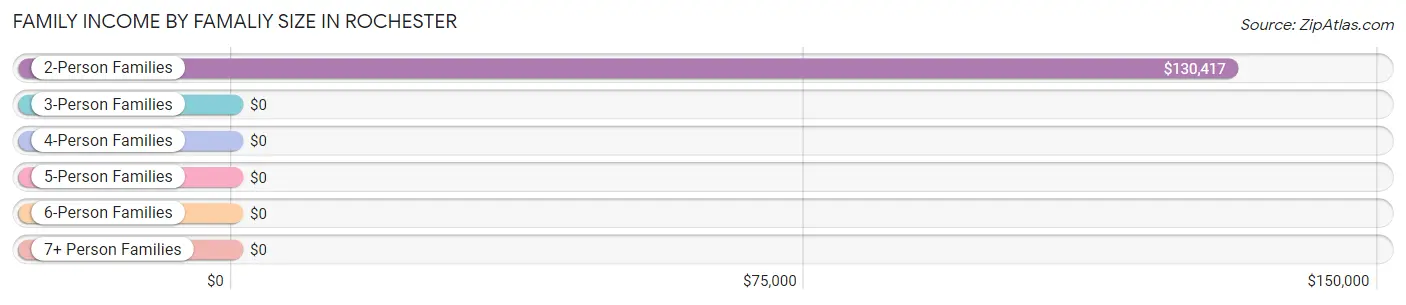
| Income Bracket | # Families | Median Income |
| 2-Person Families | 30 (65.2%) | $130,417 |
| 3-Person Families | 7 (15.2%) | $0 |
| 4-Person Families | 2 (4.3%) | $0 |
| 5-Person Families | 2 (4.3%) | $0 |
| 6-Person Families | 5 (10.9%) | $0 |
| 7+ Person Families | 0 (0.0%) | $0 |
| Total | 46 (100.0%) | $128,750 |
Family Income by Number of Earners in Rochester
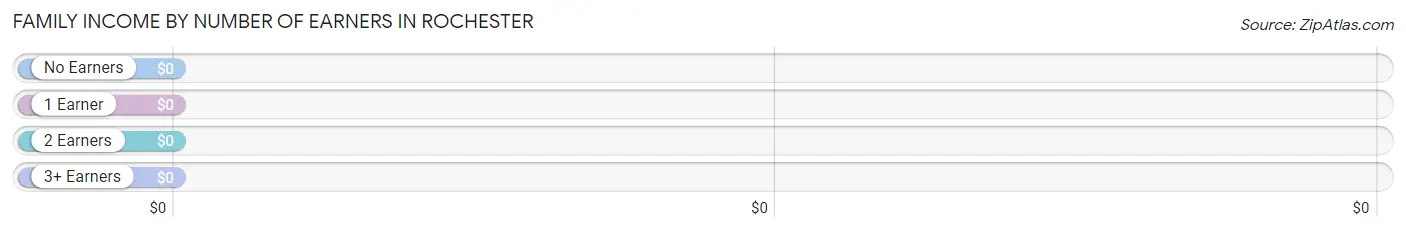
| Number of Earners | # Families | Median Income |
| No Earners | 7 (15.2%) | $0 |
| 1 Earner | 20 (43.5%) | $0 |
| 2 Earners | 12 (26.1%) | $0 |
| 3+ Earners | 7 (15.2%) | $0 |
| Total | 46 (100.0%) | $128,750 |
Household Income in Rochester
Household Income Brackets in Rochester
With 31 households falling in the category, the $100,000 to $149,999 income range is the most frequent in Rochester, accounting for 46.3% of all households.
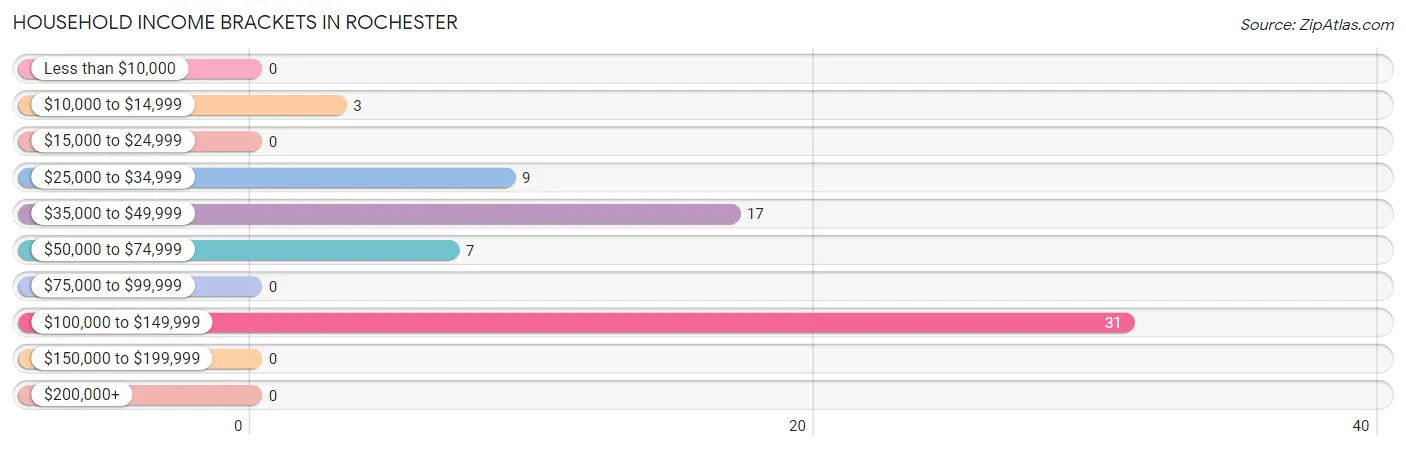
| Income Bracket | # Households | % Households |
| Less than $10,000 | 0 | 0.0% |
| $10,000 to $14,999 | 3 | 4.5% |
| $15,000 to $24,999 | 0 | 0.0% |
| $25,000 to $34,999 | 9 | 13.4% |
| $35,000 to $49,999 | 17 | 25.4% |
| $50,000 to $74,999 | 7 | 10.4% |
| $75,000 to $99,999 | 0 | 0.0% |
| $100,000 to $149,999 | 31 | 46.3% |
| $150,000 to $199,999 | 0 | 0.0% |
| $200,000+ | 0 | 0.0% |
Household Income by Householder Age in Rochester
The median household income in Rochester is $0, with the highest median household income of $107,188 found in the 65+ years age bracket for the primary householder. A total of 17 households (25.4%) fall into this category.
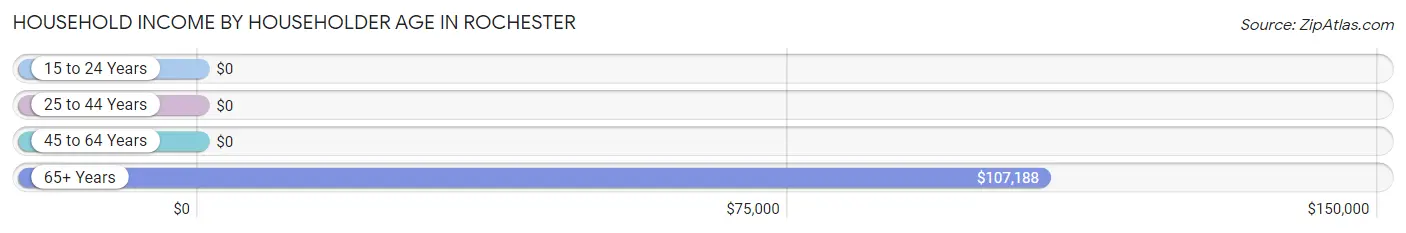
| Income Bracket | # Households | Median Income |
| 15 to 24 Years | 0 (0.0%) | $0 |
| 25 to 44 Years | 21 (31.3%) | $0 |
| 45 to 64 Years | 29 (43.3%) | $0 |
| 65+ Years | 17 (25.4%) | $107,188 |
| Total | 67 (100.0%) | $0 |
Poverty in Rochester
Income Below Poverty by Sex and Age in Rochester
With 5.5% poverty level for males and 23.0% for females among the residents of Rochester, 45 to 54 year old males and 25 to 34 year old females are the most vulnerable to poverty, with 5 males (33.3%) and 9 females (100.0%) in their respective age groups living below the poverty level.
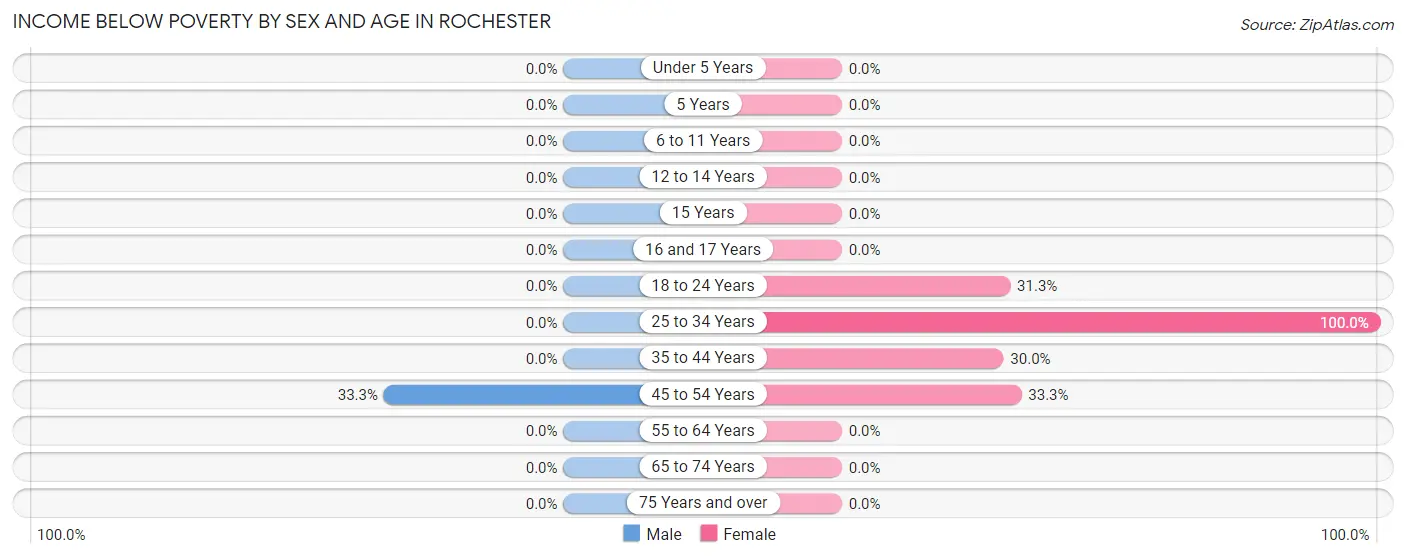
| Age Bracket | Male | Female |
| Under 5 Years | 0 (0.0%) | 0 (0.0%) |
| 5 Years | 0 (0.0%) | 0 (0.0%) |
| 6 to 11 Years | 0 (0.0%) | 0 (0.0%) |
| 12 to 14 Years | 0 (0.0%) | 0 (0.0%) |
| 15 Years | 0 (0.0%) | 0 (0.0%) |
| 16 and 17 Years | 0 (0.0%) | 0 (0.0%) |
| 18 to 24 Years | 0 (0.0%) | 5 (31.2%) |
| 25 to 34 Years | 0 (0.0%) | 9 (100.0%) |
| 35 to 44 Years | 0 (0.0%) | 3 (30.0%) |
| 45 to 54 Years | 5 (33.3%) | 3 (33.3%) |
| 55 to 64 Years | 0 (0.0%) | 0 (0.0%) |
| 65 to 74 Years | 0 (0.0%) | 0 (0.0%) |
| 75 Years and over | 0 (0.0%) | 0 (0.0%) |
| Total | 5 (5.5%) | 20 (23.0%) |
Income Above Poverty by Sex and Age in Rochester
According to the poverty statistics in Rochester, males aged under 5 years and females aged under 5 years are the age groups that are most secure financially, with 100.0% of males and 100.0% of females in these age groups living above the poverty line.
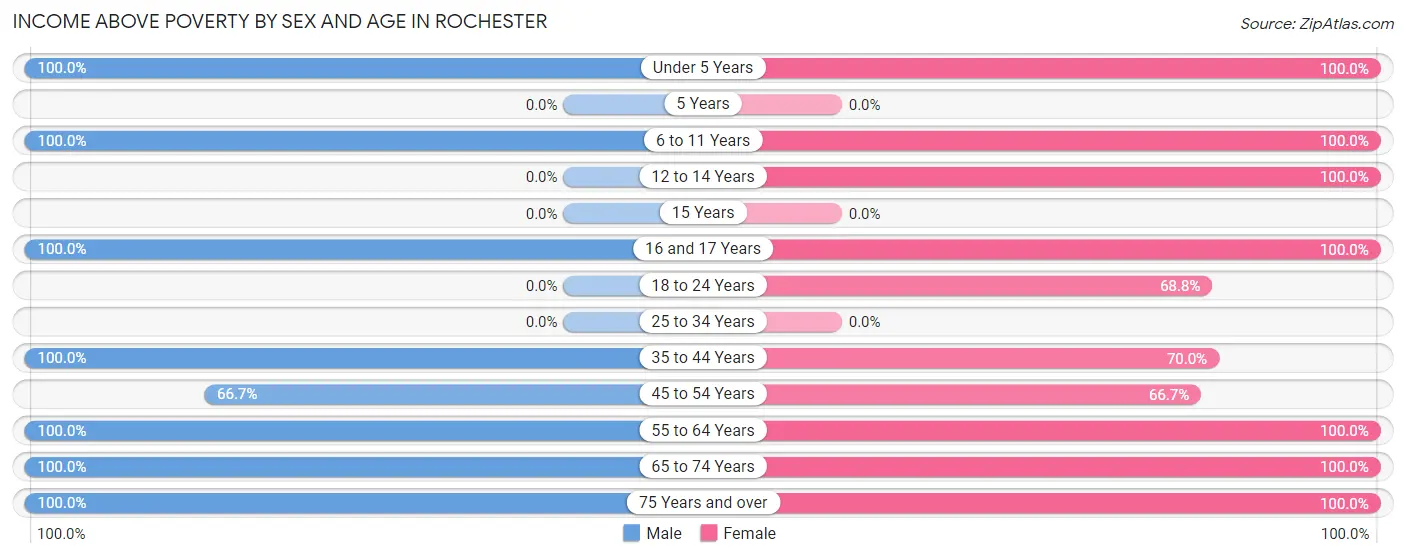
| Age Bracket | Male | Female |
| Under 5 Years | 4 (100.0%) | 1 (100.0%) |
| 5 Years | 0 (0.0%) | 0 (0.0%) |
| 6 to 11 Years | 7 (100.0%) | 1 (100.0%) |
| 12 to 14 Years | 0 (0.0%) | 6 (100.0%) |
| 15 Years | 0 (0.0%) | 0 (0.0%) |
| 16 and 17 Years | 3 (100.0%) | 4 (100.0%) |
| 18 to 24 Years | 0 (0.0%) | 11 (68.8%) |
| 25 to 34 Years | 0 (0.0%) | 0 (0.0%) |
| 35 to 44 Years | 38 (100.0%) | 7 (70.0%) |
| 45 to 54 Years | 10 (66.7%) | 6 (66.7%) |
| 55 to 64 Years | 12 (100.0%) | 14 (100.0%) |
| 65 to 74 Years | 8 (100.0%) | 8 (100.0%) |
| 75 Years and over | 4 (100.0%) | 9 (100.0%) |
| Total | 86 (94.5%) | 67 (77.0%) |
Income Below Poverty Among Married-Couple Families in Rochester
The poverty statistics for married-couple families in Rochester show that 9.7% or 3 of the total 31 families live below the poverty line. Families with no children have the highest poverty rate of 12.5%, comprising of 3 families. On the other hand, families with 3 or 4 children have the lowest poverty rate of 0.0%, which includes 0 families.
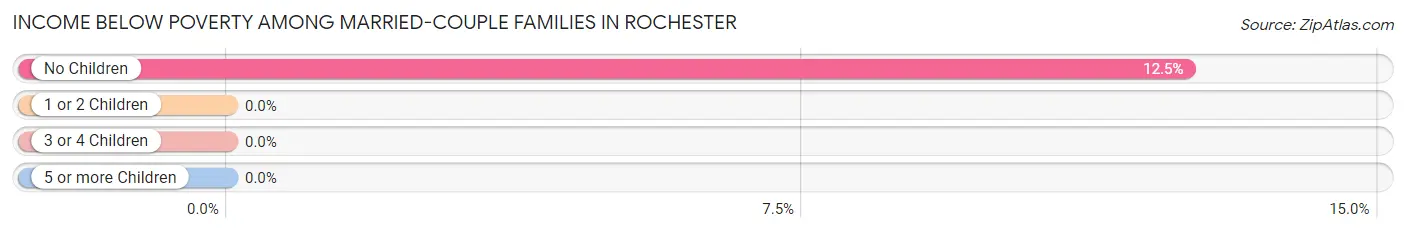
| Children | Above Poverty | Below Poverty |
| No Children | 21 (87.5%) | 3 (12.5%) |
| 1 or 2 Children | 0 (0.0%) | 0 (0.0%) |
| 3 or 4 Children | 7 (100.0%) | 0 (0.0%) |
| 5 or more Children | 0 (0.0%) | 0 (0.0%) |
| Total | 28 (90.3%) | 3 (9.7%) |
Income Below Poverty Among Single-Parent Households in Rochester
| Children | Single Father | Single Mother |
| No Children | 0 (0.0%) | 0 (0.0%) |
| 1 or 2 Children | 0 (0.0%) | 0 (0.0%) |
| 3 or 4 Children | 0 (0.0%) | 0 (0.0%) |
| 5 or more Children | 0 (0.0%) | 0 (0.0%) |
| Total | 0 (0.0%) | 0 (0.0%) |
Income Below Poverty Among Married-Couple vs Single-Parent Households in Rochester
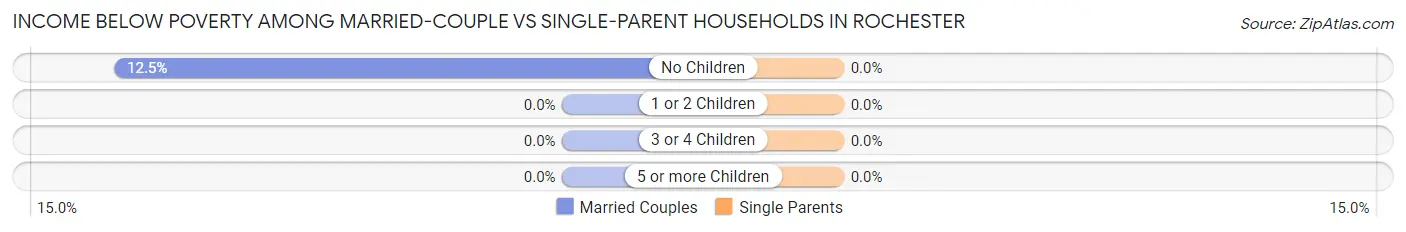
| Children | Married-Couple Families | Single-Parent Households |
| No Children | 3 (12.5%) | 0 (0.0%) |
| 1 or 2 Children | 0 (0.0%) | 0 (0.0%) |
| 3 or 4 Children | 0 (0.0%) | 0 (0.0%) |
| 5 or more Children | 0 (0.0%) | 0 (0.0%) |
| Total | 3 (9.7%) | 0 (0.0%) |
Race in Rochester
The most populous races in Rochester are White / Caucasian (171 | 95.0%), and Native / Alaskan (9 | 5.0%).
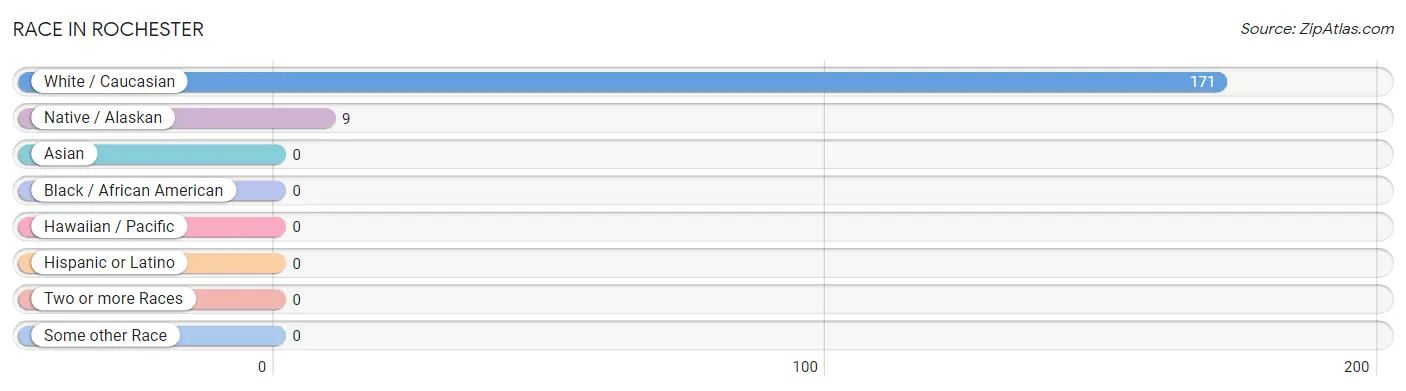
| Race | # Population | % Population |
| Asian | 0 | 0.0% |
| Black / African American | 0 | 0.0% |
| Hawaiian / Pacific | 0 | 0.0% |
| Hispanic or Latino | 0 | 0.0% |
| Native / Alaskan | 9 | 5.0% |
| White / Caucasian | 171 | 95.0% |
| Two or more Races | 0 | 0.0% |
| Some other Race | 0 | 0.0% |
| Total | 180 | 100.0% |
Ancestry in Rochester
The most populous ancestries reported in Rochester are American (28 | 15.6%), English (22 | 12.2%), Irish (20 | 11.1%), German (17 | 9.4%), and Cherokee (9 | 5.0%), together accounting for 53.3% of all Rochester residents.
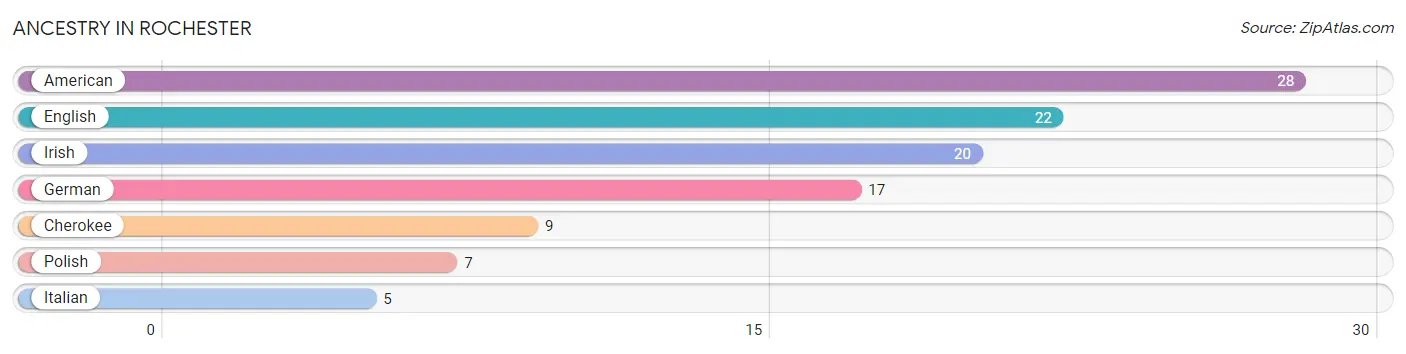
| Ancestry | # Population | % Population |
| American | 28 | 15.6% |
| Cherokee | 9 | 5.0% |
| English | 22 | 12.2% |
| German | 17 | 9.4% |
| Irish | 20 | 11.1% |
| Italian | 5 | 2.8% |
| Polish | 7 | 3.9% | View All 7 Rows |
Immigrants in Rochester

| Immigration Origin | # Population | % Population | View All 0 Rows |
Sex and Age in Rochester
Sex and Age in Rochester
The most populous age groups in Rochester are 35 to 39 Years (20 | 22.0%) for men and 20 to 24 Years (16 | 18.0%) for women.
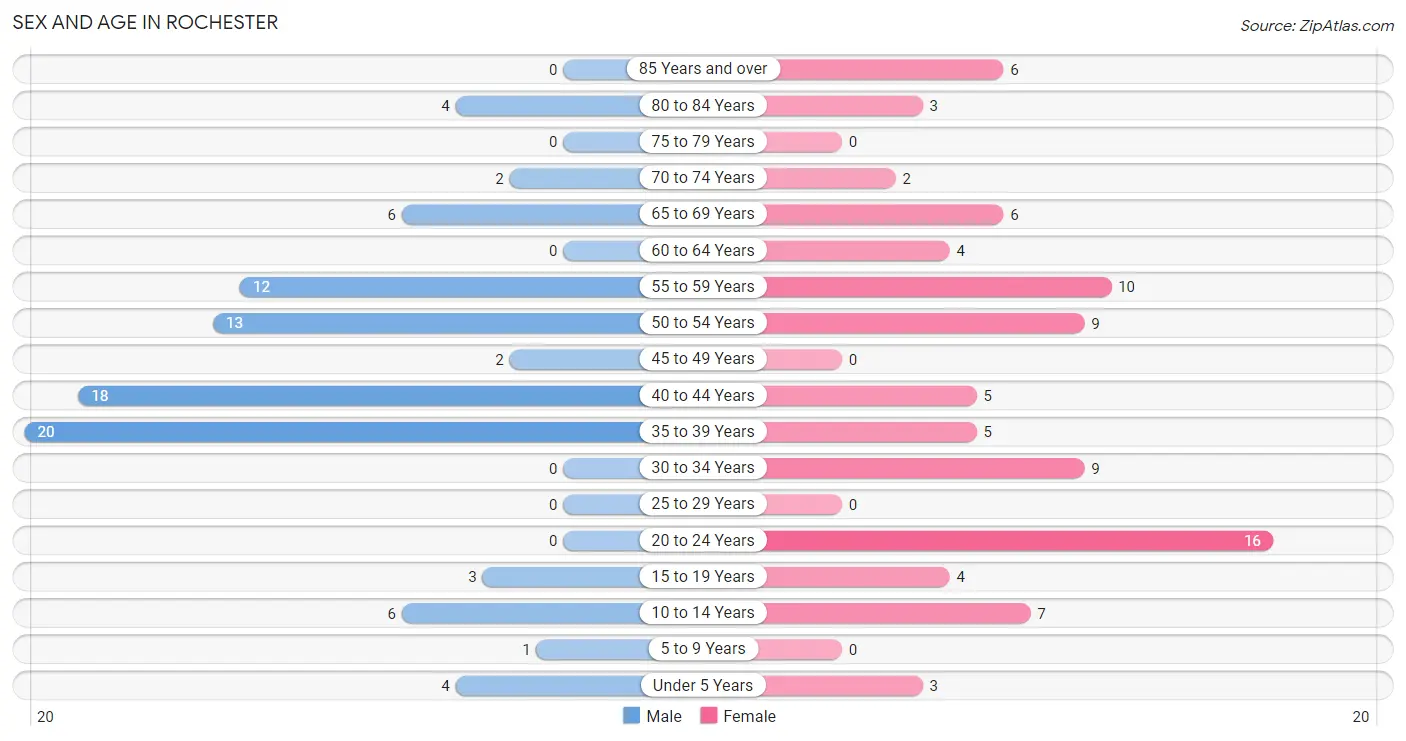
| Age Bracket | Male | Female |
| Under 5 Years | 4 (4.4%) | 3 (3.4%) |
| 5 to 9 Years | 1 (1.1%) | 0 (0.0%) |
| 10 to 14 Years | 6 (6.6%) | 7 (7.9%) |
| 15 to 19 Years | 3 (3.3%) | 4 (4.5%) |
| 20 to 24 Years | 0 (0.0%) | 16 (18.0%) |
| 25 to 29 Years | 0 (0.0%) | 0 (0.0%) |
| 30 to 34 Years | 0 (0.0%) | 9 (10.1%) |
| 35 to 39 Years | 20 (22.0%) | 5 (5.6%) |
| 40 to 44 Years | 18 (19.8%) | 5 (5.6%) |
| 45 to 49 Years | 2 (2.2%) | 0 (0.0%) |
| 50 to 54 Years | 13 (14.3%) | 9 (10.1%) |
| 55 to 59 Years | 12 (13.2%) | 10 (11.2%) |
| 60 to 64 Years | 0 (0.0%) | 4 (4.5%) |
| 65 to 69 Years | 6 (6.6%) | 6 (6.7%) |
| 70 to 74 Years | 2 (2.2%) | 2 (2.2%) |
| 75 to 79 Years | 0 (0.0%) | 0 (0.0%) |
| 80 to 84 Years | 4 (4.4%) | 3 (3.4%) |
| 85 Years and over | 0 (0.0%) | 6 (6.7%) |
| Total | 91 (100.0%) | 89 (100.0%) |
Families and Households in Rochester
Median Family Size in Rochester
The median family size in Rochester is 3.13 persons per family, with single female/mother families (9 | 19.6%) accounting for the largest median family size of 3.44 persons per family. On the other hand, single male/father families (6 | 13.0%) represent the smallest median family size with 2.17 persons per family.
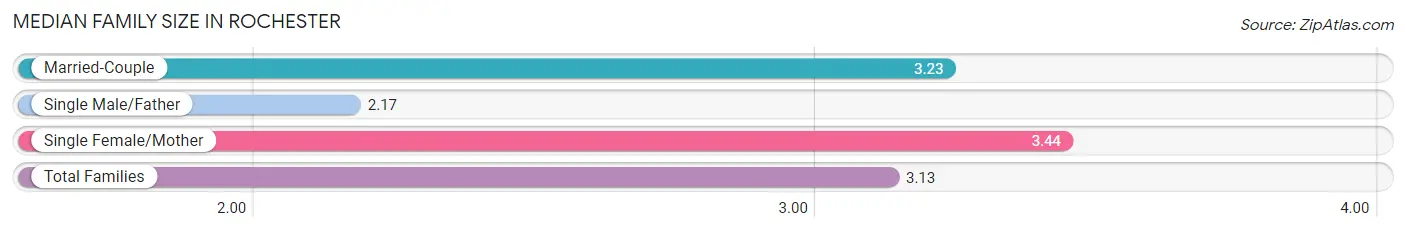
| Family Type | # Families | Family Size |
| Married-Couple | 31 (67.4%) | 3.23 |
| Single Male/Father | 6 (13.0%) | 2.17 |
| Single Female/Mother | 9 (19.6%) | 3.44 |
| Total Families | 46 (100.0%) | 3.13 |
Median Household Size in Rochester
The median household size in Rochester is 2.69 persons per household, with single female/mother households (9 | 13.4%) accounting for the largest median household size of 3.44 persons per household. non-family households (21 | 31.3%) represent the smallest median household size with 1.48 persons per household.
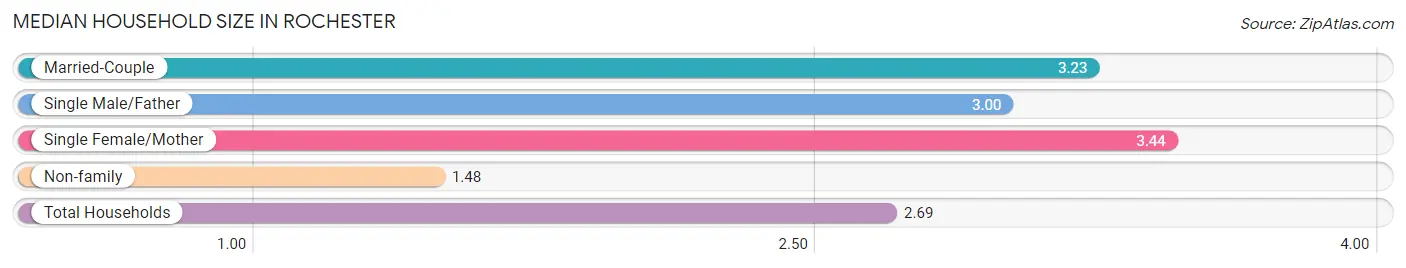
| Household Type | # Households | Household Size |
| Married-Couple | 31 (46.3%) | 3.23 |
| Single Male/Father | 6 (9.0%) | 3.00 |
| Single Female/Mother | 9 (13.4%) | 3.44 |
| Non-family | 21 (31.3%) | 1.48 |
| Total Households | 67 (100.0%) | 2.69 |
Household Size by Marriage Status in Rochester
Out of a total of 67 households in Rochester, 46 (68.7%) are family households, while 21 (31.3%) are nonfamily households. The most numerous type of family households are 2-person households, comprising 26, and the most common type of nonfamily households are 2-person households, comprising 14.
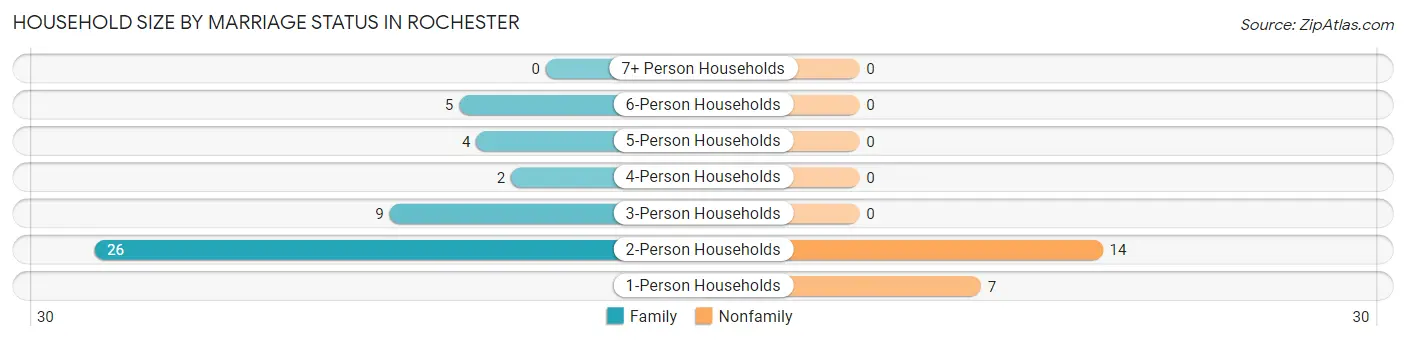
| Household Size | Family Households | Nonfamily Households |
| 1-Person Households | - | 7 (10.4%) |
| 2-Person Households | 26 (38.8%) | 14 (20.9%) |
| 3-Person Households | 9 (13.4%) | 0 (0.0%) |
| 4-Person Households | 2 (3.0%) | 0 (0.0%) |
| 5-Person Households | 4 (6.0%) | 0 (0.0%) |
| 6-Person Households | 5 (7.5%) | 0 (0.0%) |
| 7+ Person Households | 0 (0.0%) | 0 (0.0%) |
| Total | 46 (68.7%) | 21 (31.3%) |
Female Fertility in Rochester
Fertility by Age in Rochester
| Age Bracket | Women with Births | Births / 1,000 Women |
| 15 to 19 years | 0 (0.0%) | 0.0 |
| 20 to 34 years | 0 (0.0%) | 0.0 |
| 35 to 50 years | 0 (0.0%) | 0.0 |
| Total | 0 (0.0%) | 0.0 |
Fertility by Age by Marriage Status in Rochester
| Age Bracket | Married | Unmarried |
| 15 to 19 years | 0 (0.0%) | 0 (0.0%) |
| 20 to 34 years | 0 (0.0%) | 0 (0.0%) |
| 35 to 50 years | 0 (0.0%) | 0 (0.0%) |
| Total | 0 (0.0%) | 0 (0.0%) |
Fertility by Education in Rochester
| Educational Attainment | Women with Births | Births / 1,000 Women |
| Less than High School | 0 (0.0%) | 0.0 |
| High School Diploma | 0 (0.0%) | 0.0 |
| College or Associate's Degree | 0 (0.0%) | 0.0 |
| Bachelor's Degree | 0 (0.0%) | 0.0 |
| Graduate Degree | 0 (0.0%) | 0.0 |
| Total | 0 (0.0%) | 0.0 |
Fertility by Education by Marriage Status in Rochester
| Educational Attainment | Married | Unmarried |
| Less than High School | 0 (0.0%) | 0 (0.0%) |
| High School Diploma | 0 (0.0%) | 0 (0.0%) |
| College or Associate's Degree | 0 (0.0%) | 0 (0.0%) |
| Bachelor's Degree | 0 (0.0%) | 0 (0.0%) |
| Graduate Degree | 0 (0.0%) | 0 (0.0%) |
| Total | 0 (0.0%) | 0 (0.0%) |
Employment Characteristics in Rochester
Employment by Class of Employer in Rochester
Among the 89 employed individuals in Rochester, private company employees (76 | 85.4%), state government employees (9 | 10.1%), and not-for-profit organizations (4 | 4.5%) make up the most common classes of employment.
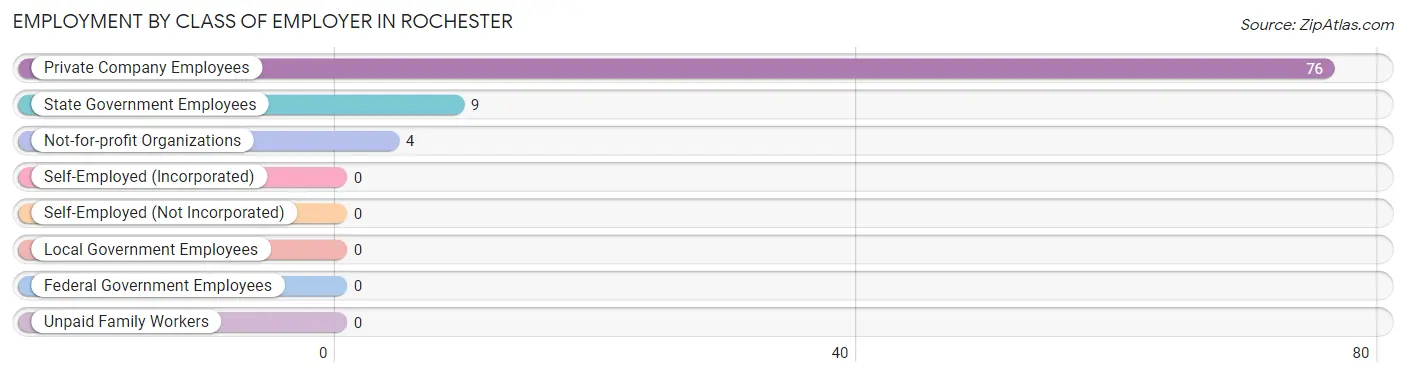
| Employer Class | # Employees | % Employees |
| Private Company Employees | 76 | 85.4% |
| Self-Employed (Incorporated) | 0 | 0.0% |
| Self-Employed (Not Incorporated) | 0 | 0.0% |
| Not-for-profit Organizations | 4 | 4.5% |
| Local Government Employees | 0 | 0.0% |
| State Government Employees | 9 | 10.1% |
| Federal Government Employees | 0 | 0.0% |
| Unpaid Family Workers | 0 | 0.0% |
| Total | 89 | 100.0% |
Employment Status by Age in Rochester
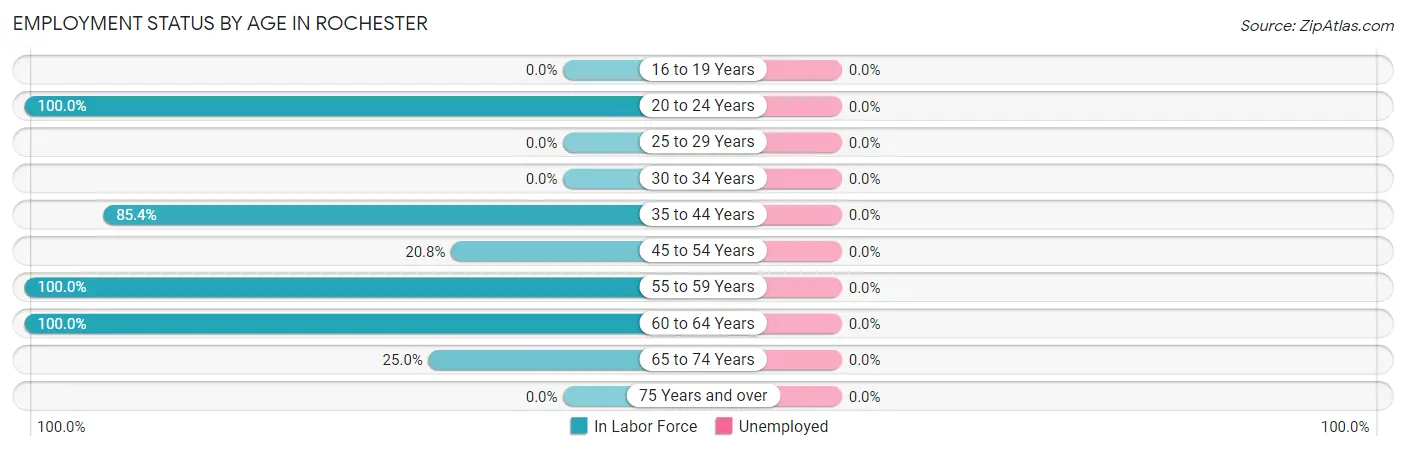
| Age Bracket | In Labor Force | Unemployed |
| 16 to 19 Years | 0 (0.0%) | 0 (0.0%) |
| 20 to 24 Years | 16 (100.0%) | 0 (0.0%) |
| 25 to 29 Years | 0 (0.0%) | 0 (0.0%) |
| 30 to 34 Years | 0 (0.0%) | 0 (0.0%) |
| 35 to 44 Years | 41 (85.4%) | 0 (0.0%) |
| 45 to 54 Years | 5 (20.8%) | 0 (0.0%) |
| 55 to 59 Years | 22 (100.0%) | 0 (0.0%) |
| 60 to 64 Years | 4 (100.0%) | 0 (0.0%) |
| 65 to 74 Years | 4 (25.0%) | 0 (0.0%) |
| 75 Years and over | 0 (0.0%) | 0 (0.0%) |
| Total | 92 (57.9%) | 0 (0.0%) |
Employment Status by Educational Attainment in Rochester
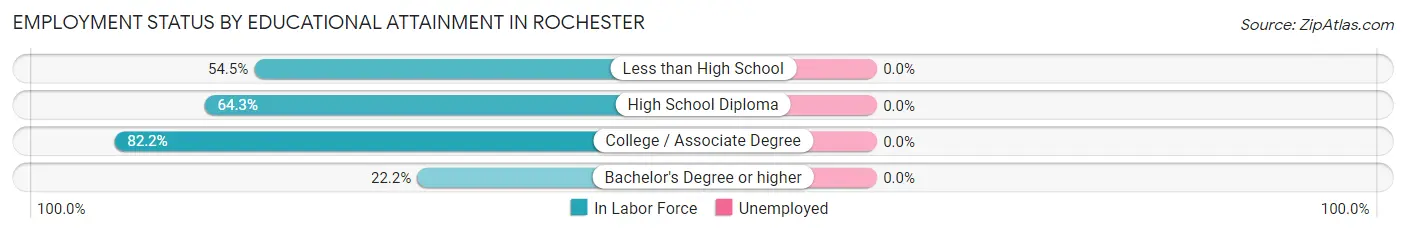
| Educational Attainment | In Labor Force | Unemployed |
| Less than High School | 6 (54.5%) | 0 (0.0%) |
| High School Diploma | 27 (64.3%) | 0 (0.0%) |
| College / Associate Degree | 37 (82.2%) | 0 (0.0%) |
| Bachelor's Degree or higher | 2 (22.2%) | 0 (0.0%) |
| Total | 72 (67.3%) | 0 (0.0%) |
Employment Occupations by Sex in Rochester
Management, Business, Science and Arts Occupations
The most common Management, Business, Science and Arts occupations in Rochester are Management (14 | 15.2%), Health Diagnosing & Treating (12 | 13.0%), Computers, Engineering & Science (9 | 9.8%), Architecture & Engineering (9 | 9.8%), and Community & Social Service (9 | 9.8%).
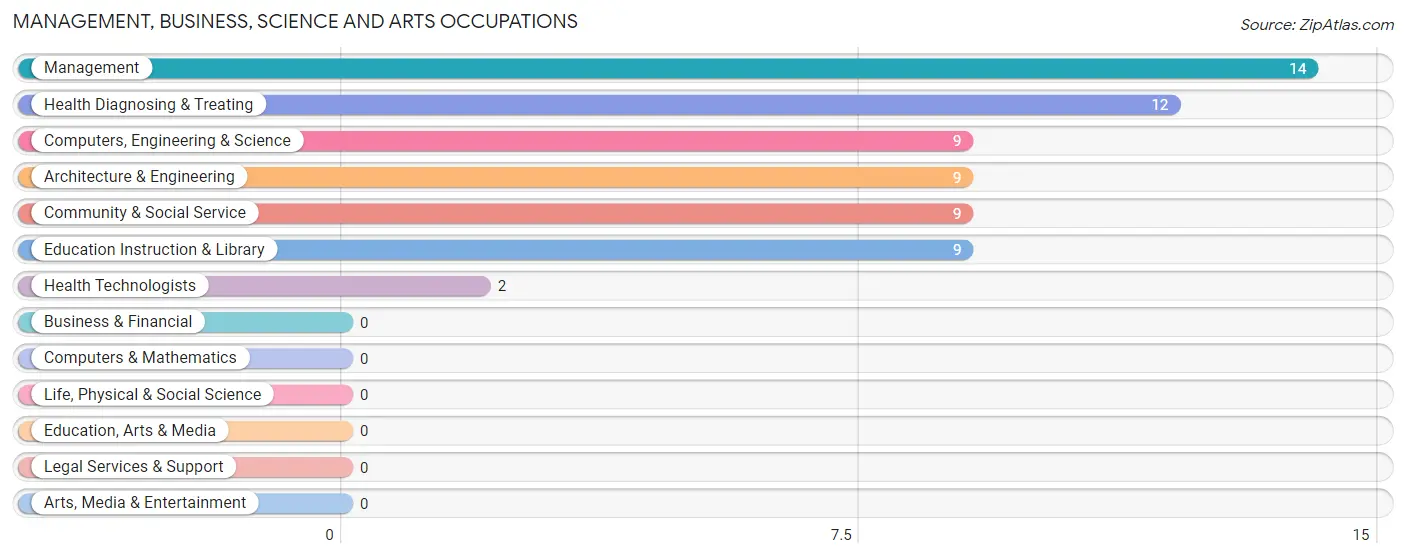
Management, Business, Science and Arts Occupations by Sex
Within the Management, Business, Science and Arts occupations in Rochester, the most male-oriented occupations are Management (100.0%), Computers, Engineering & Science (100.0%), and Architecture & Engineering (100.0%), while the most female-oriented occupations are Health Diagnosing & Treating (100.0%), and Health Technologists (100.0%).
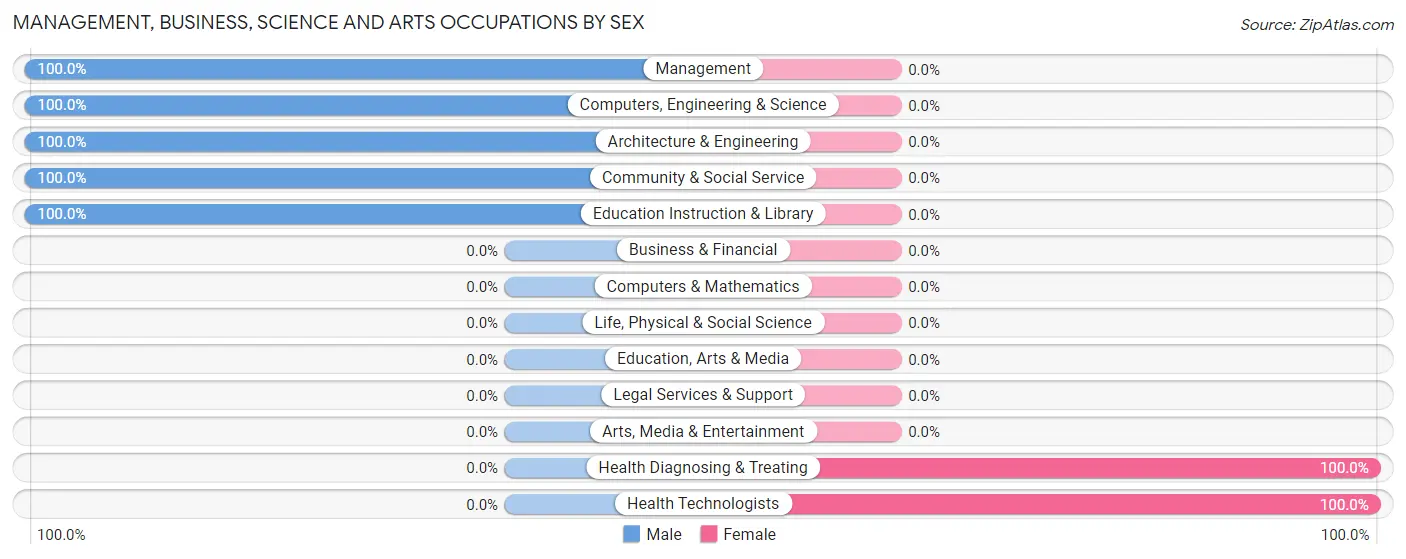
| Occupation | Male | Female |
| Management | 14 (100.0%) | 0 (0.0%) |
| Business & Financial | 0 (0.0%) | 0 (0.0%) |
| Computers, Engineering & Science | 9 (100.0%) | 0 (0.0%) |
| Computers & Mathematics | 0 (0.0%) | 0 (0.0%) |
| Architecture & Engineering | 9 (100.0%) | 0 (0.0%) |
| Life, Physical & Social Science | 0 (0.0%) | 0 (0.0%) |
| Community & Social Service | 9 (100.0%) | 0 (0.0%) |
| Education, Arts & Media | 0 (0.0%) | 0 (0.0%) |
| Legal Services & Support | 0 (0.0%) | 0 (0.0%) |
| Education Instruction & Library | 9 (100.0%) | 0 (0.0%) |
| Arts, Media & Entertainment | 0 (0.0%) | 0 (0.0%) |
| Health Diagnosing & Treating | 0 (0.0%) | 12 (100.0%) |
| Health Technologists | 0 (0.0%) | 2 (100.0%) |
| Total (Category) | 32 (72.7%) | 12 (27.3%) |
| Total (Overall) | 52 (56.5%) | 40 (43.5%) |
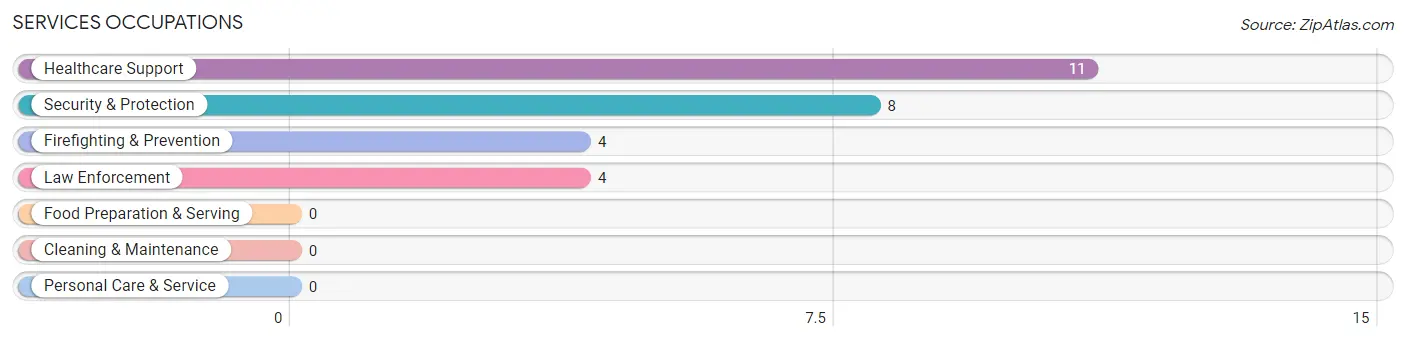
Services Occupations
The most common Services occupations in Rochester are Healthcare Support (11 | 12.0%), Security & Protection (8 | 8.7%), Firefighting & Prevention (4 | 4.3%), and Law Enforcement (4 | 4.3%).
Services Occupations by Sex
Within the Services occupations in Rochester, the most male-oriented occupations are Firefighting & Prevention (100.0%), and Security & Protection (50.0%), while the most female-oriented occupations are Healthcare Support (100.0%), Law Enforcement (100.0%), and Security & Protection (50.0%).
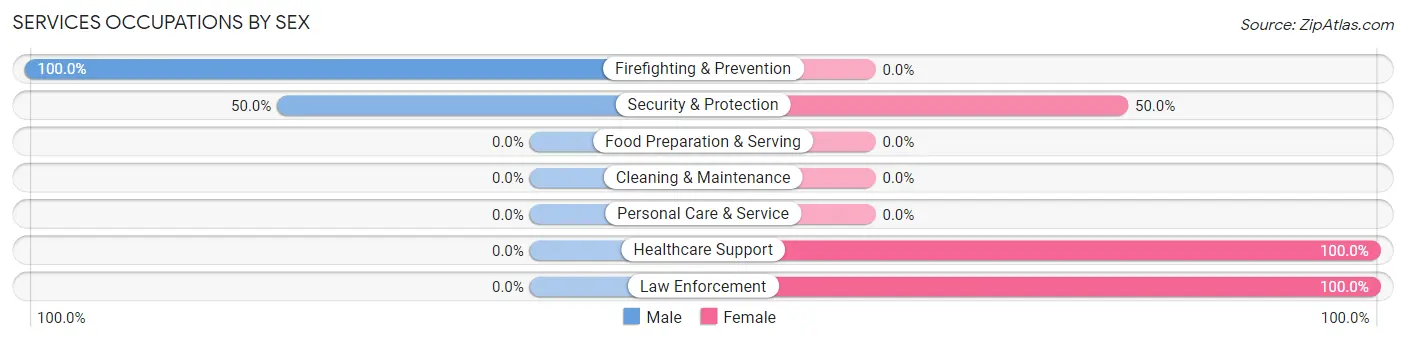
| Occupation | Male | Female |
| Healthcare Support | 0 (0.0%) | 11 (100.0%) |
| Security & Protection | 4 (50.0%) | 4 (50.0%) |
| Firefighting & Prevention | 4 (100.0%) | 0 (0.0%) |
| Law Enforcement | 0 (0.0%) | 4 (100.0%) |
| Food Preparation & Serving | 0 (0.0%) | 0 (0.0%) |
| Cleaning & Maintenance | 0 (0.0%) | 0 (0.0%) |
| Personal Care & Service | 0 (0.0%) | 0 (0.0%) |
| Total (Category) | 4 (21.0%) | 15 (78.9%) |
| Total (Overall) | 52 (56.5%) | 40 (43.5%) |
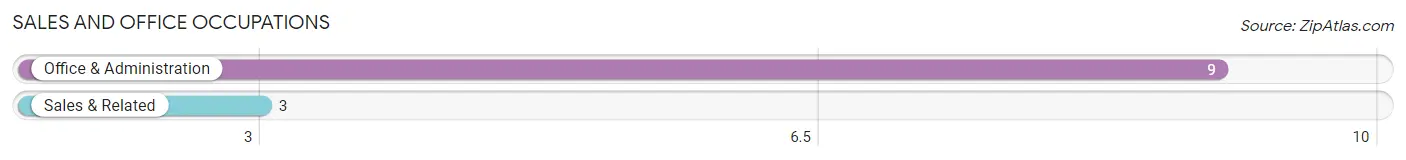
Sales and Office Occupations
The most common Sales and Office occupations in Rochester are Office & Administration (9 | 9.8%), and Sales & Related (3 | 3.3%).
Sales and Office Occupations by Sex
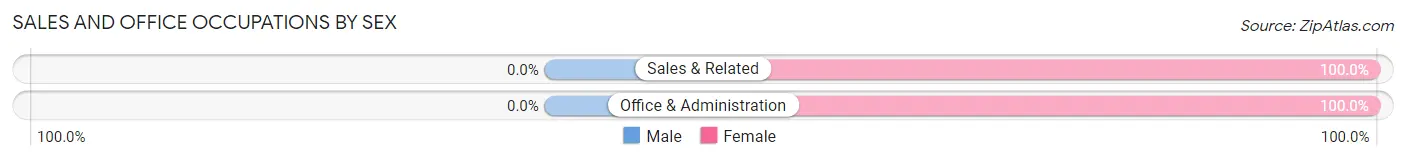
| Occupation | Male | Female |
| Sales & Related | 0 (0.0%) | 3 (100.0%) |
| Office & Administration | 0 (0.0%) | 9 (100.0%) |
| Total (Category) | 0 (0.0%) | 12 (100.0%) |
| Total (Overall) | 52 (56.5%) | 40 (43.5%) |
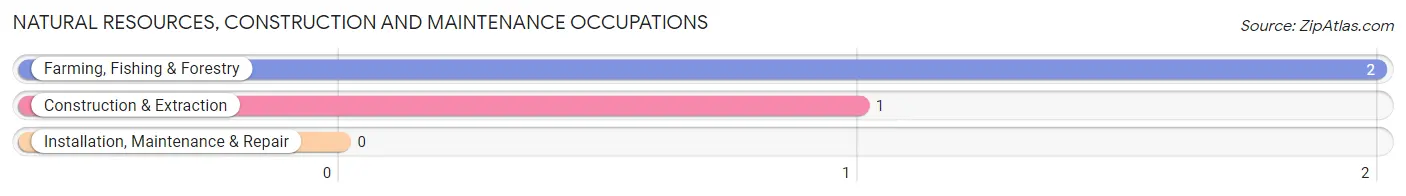
Natural Resources, Construction and Maintenance Occupations
The most common Natural Resources, Construction and Maintenance occupations in Rochester are Farming, Fishing & Forestry (2 | 2.2%), and Construction & Extraction (1 | 1.1%).
Natural Resources, Construction and Maintenance Occupations by Sex
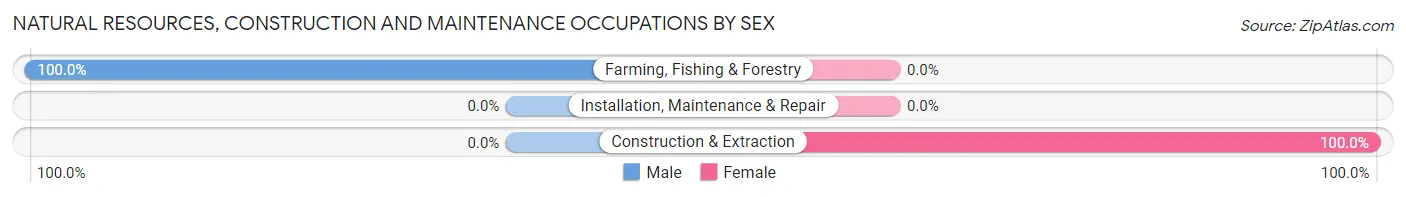
| Occupation | Male | Female |
| Farming, Fishing & Forestry | 2 (100.0%) | 0 (0.0%) |
| Construction & Extraction | 0 (0.0%) | 1 (100.0%) |
| Installation, Maintenance & Repair | 0 (0.0%) | 0 (0.0%) |
| Total (Category) | 2 (66.7%) | 1 (33.3%) |
| Total (Overall) | 52 (56.5%) | 40 (43.5%) |
Production, Transportation and Moving Occupations
The most common Production, Transportation and Moving occupations in Rochester are Material Moving (9 | 9.8%), Production (3 | 3.3%), and Transportation (2 | 2.2%).
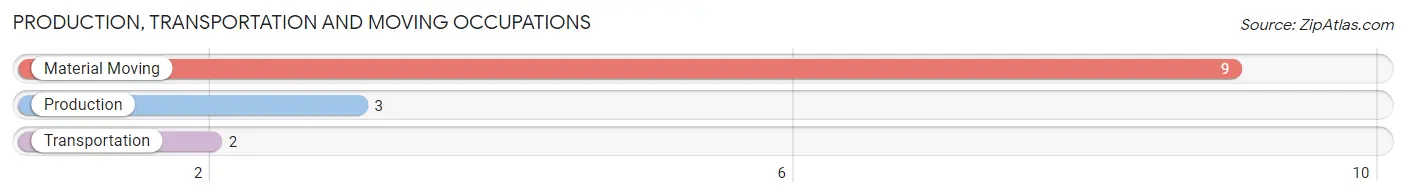
Production, Transportation and Moving Occupations by Sex
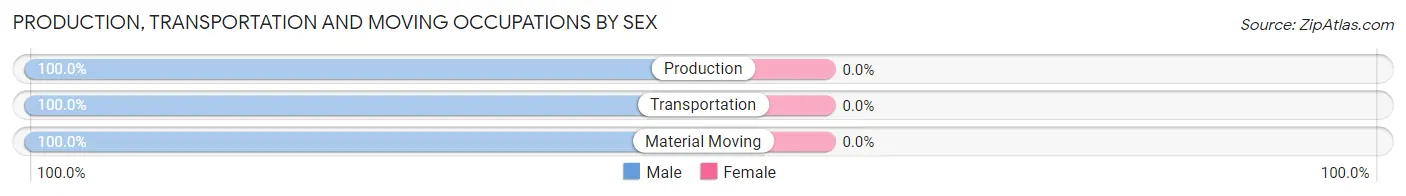
| Occupation | Male | Female |
| Production | 3 (100.0%) | 0 (0.0%) |
| Transportation | 2 (100.0%) | 0 (0.0%) |
| Material Moving | 9 (100.0%) | 0 (0.0%) |
| Total (Category) | 14 (100.0%) | 0 (0.0%) |
| Total (Overall) | 52 (56.5%) | 40 (43.5%) |
Employment Industries by Sex in Rochester
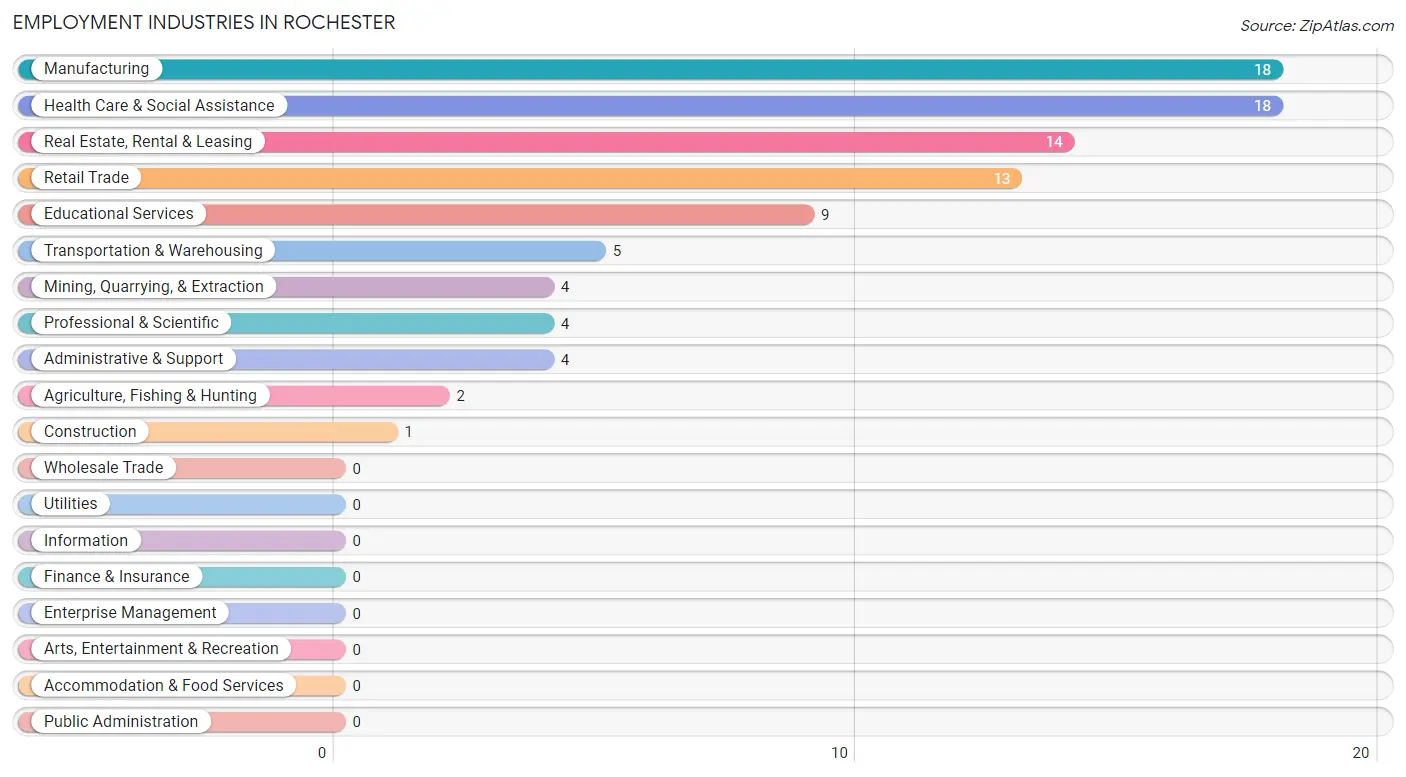
Employment Industries in Rochester
The major employment industries in Rochester include Manufacturing (18 | 19.6%), Health Care & Social Assistance (18 | 19.6%), Real Estate, Rental & Leasing (14 | 15.2%), Retail Trade (13 | 14.1%), and Educational Services (9 | 9.8%).
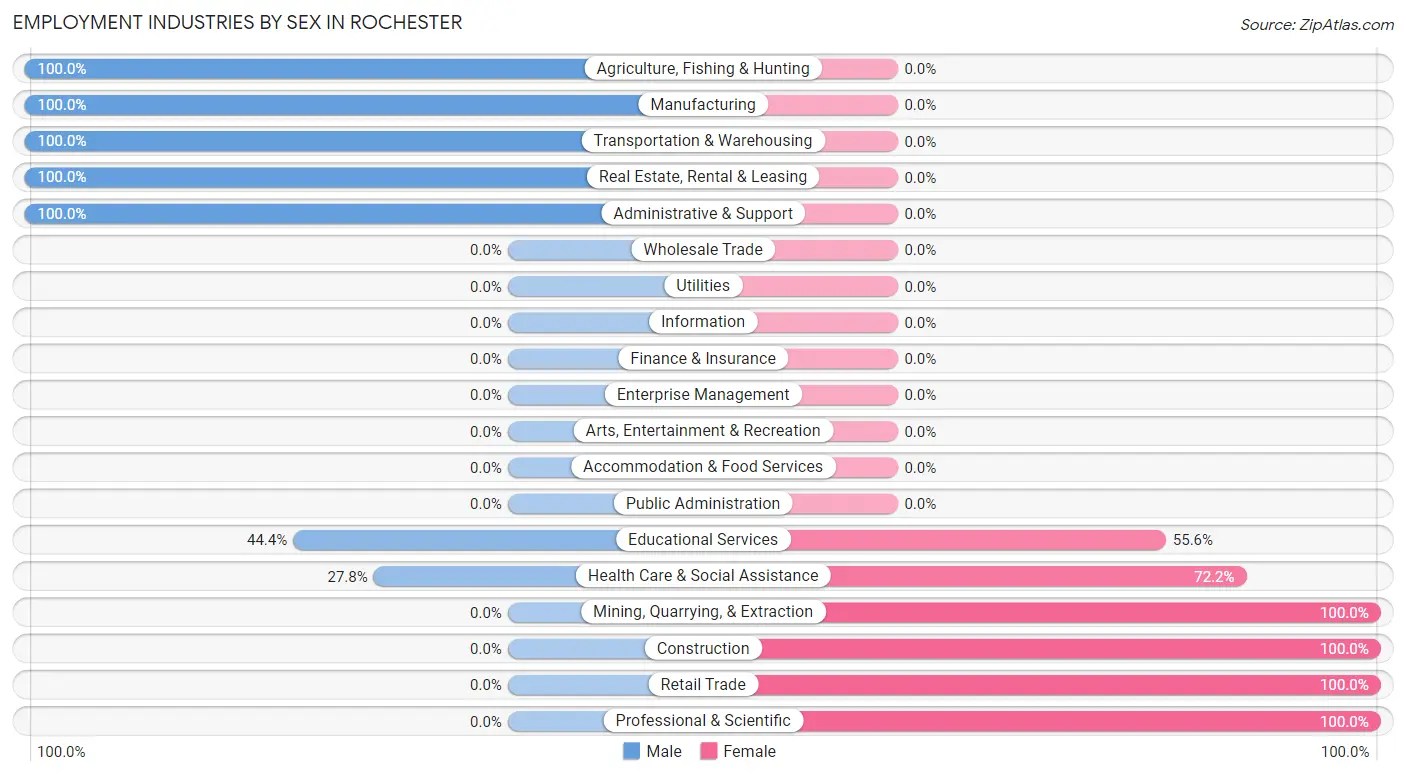
Employment Industries by Sex in Rochester
The Rochester industries that see more men than women are Agriculture, Fishing & Hunting (100.0%), Manufacturing (100.0%), and Transportation & Warehousing (100.0%), whereas the industries that tend to have a higher number of women are Mining, Quarrying, & Extraction (100.0%), Construction (100.0%), and Retail Trade (100.0%).
| Industry | Male | Female |
| Agriculture, Fishing & Hunting | 2 (100.0%) | 0 (0.0%) |
| Mining, Quarrying, & Extraction | 0 (0.0%) | 4 (100.0%) |
| Construction | 0 (0.0%) | 1 (100.0%) |
| Manufacturing | 18 (100.0%) | 0 (0.0%) |
| Wholesale Trade | 0 (0.0%) | 0 (0.0%) |
| Retail Trade | 0 (0.0%) | 13 (100.0%) |
| Transportation & Warehousing | 5 (100.0%) | 0 (0.0%) |
| Utilities | 0 (0.0%) | 0 (0.0%) |
| Information | 0 (0.0%) | 0 (0.0%) |
| Finance & Insurance | 0 (0.0%) | 0 (0.0%) |
| Real Estate, Rental & Leasing | 14 (100.0%) | 0 (0.0%) |
| Professional & Scientific | 0 (0.0%) | 4 (100.0%) |
| Enterprise Management | 0 (0.0%) | 0 (0.0%) |
| Administrative & Support | 4 (100.0%) | 0 (0.0%) |
| Educational Services | 4 (44.4%) | 5 (55.6%) |
| Health Care & Social Assistance | 5 (27.8%) | 13 (72.2%) |
| Arts, Entertainment & Recreation | 0 (0.0%) | 0 (0.0%) |
| Accommodation & Food Services | 0 (0.0%) | 0 (0.0%) |
| Public Administration | 0 (0.0%) | 0 (0.0%) |
| Total | 52 (56.5%) | 40 (43.5%) |
Education in Rochester
School Enrollment in Rochester
The most common levels of schooling among the 29 students in Rochester are high school (9 | 31.0%), elementary school (7 | 24.1%), and middle school (5 | 17.2%).
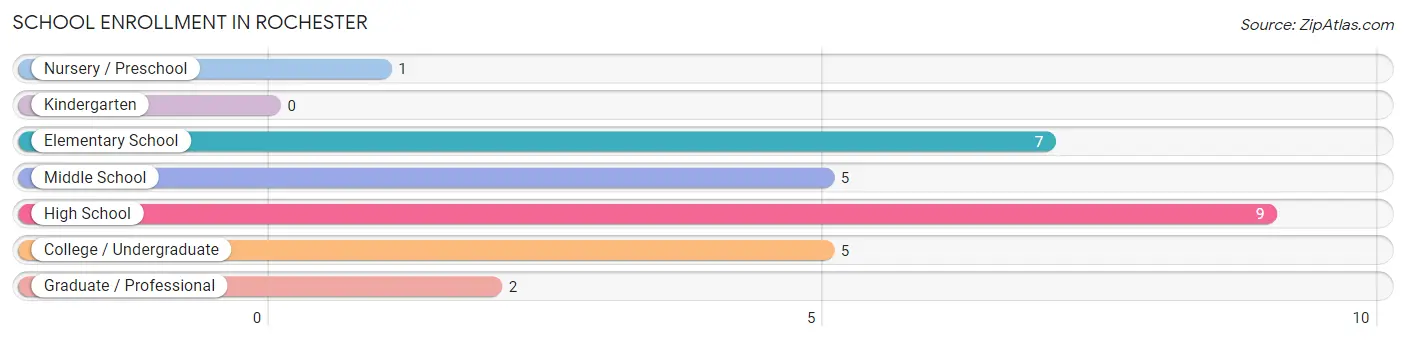
| School Level | # Students | % Students |
| Nursery / Preschool | 1 | 3.5% |
| Kindergarten | 0 | 0.0% |
| Elementary School | 7 | 24.1% |
| Middle School | 5 | 17.2% |
| High School | 9 | 31.0% |
| College / Undergraduate | 5 | 17.2% |
| Graduate / Professional | 2 | 6.9% |
| Total | 29 | 100.0% |
School Enrollment by Age by Funding Source in Rochester
Out of a total of 29 students who are enrolled in schools in Rochester, 5 (17.2%) attend a private institution, while the remaining 24 (82.8%) are enrolled in public schools. The age group of 20 to 24 year olds has the highest likelihood of being enrolled in private schools, with 5 (100.0% in the age bracket) enrolled. Conversely, the age group of 3 to 4 year olds has the lowest likelihood of being enrolled in a private school, with 1 (100.0% in the age bracket) attending a public institution.
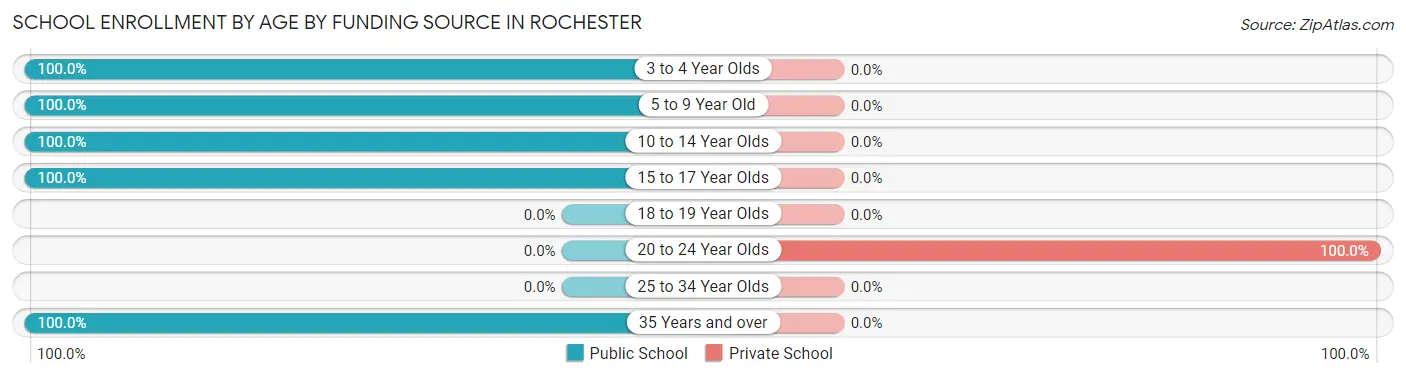
| Age Bracket | Public School | Private School |
| 3 to 4 Year Olds | 1 (100.0%) | 0 (0.0%) |
| 5 to 9 Year Old | 1 (100.0%) | 0 (0.0%) |
| 10 to 14 Year Olds | 13 (100.0%) | 0 (0.0%) |
| 15 to 17 Year Olds | 7 (100.0%) | 0 (0.0%) |
| 18 to 19 Year Olds | 0 (0.0%) | 0 (0.0%) |
| 20 to 24 Year Olds | 0 (0.0%) | 5 (100.0%) |
| 25 to 34 Year Olds | 0 (0.0%) | 0 (0.0%) |
| 35 Years and over | 2 (100.0%) | 0 (0.0%) |
| Total | 24 (82.8%) | 5 (17.2%) |
Educational Attainment by Field of Study in Rochester
Business (9 | 42.9%), bio, nature & agricultural (8 | 38.1%), science & technology (2 | 9.5%), and education (2 | 9.5%) are the most common fields of study among 21 individuals in Rochester who have obtained a bachelor's degree or higher.
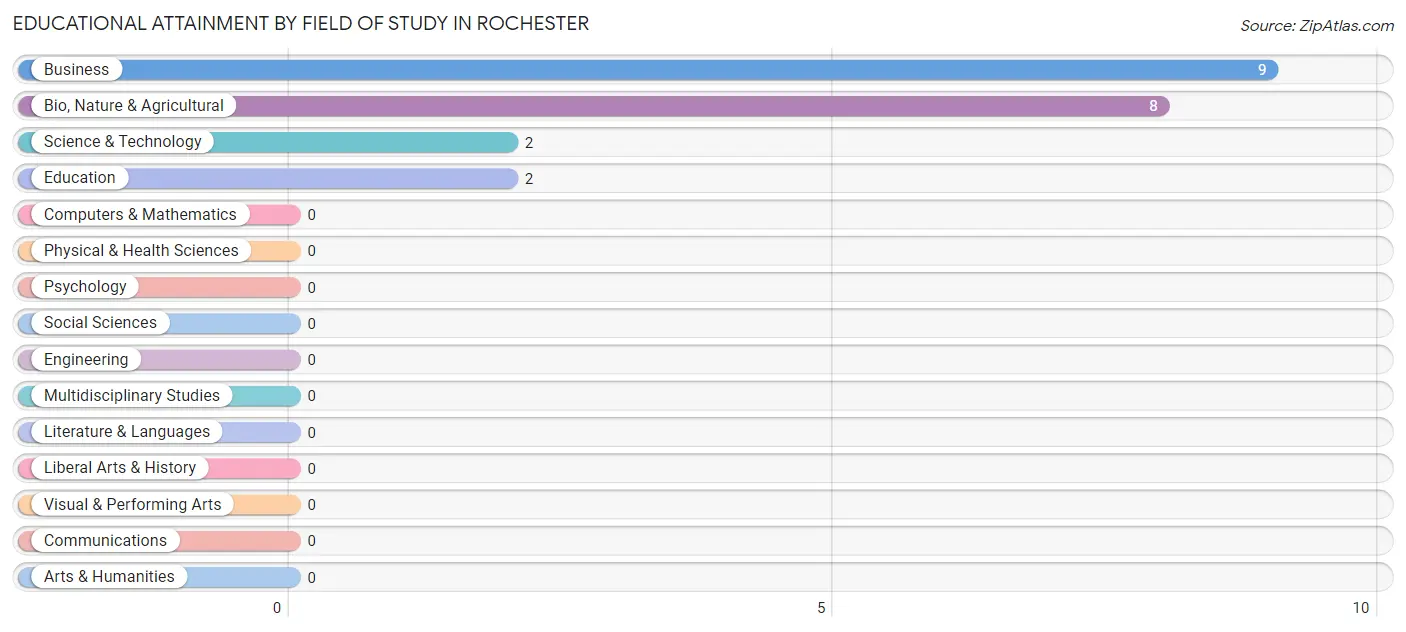
| Field of Study | # Graduates | % Graduates |
| Computers & Mathematics | 0 | 0.0% |
| Bio, Nature & Agricultural | 8 | 38.1% |
| Physical & Health Sciences | 0 | 0.0% |
| Psychology | 0 | 0.0% |
| Social Sciences | 0 | 0.0% |
| Engineering | 0 | 0.0% |
| Multidisciplinary Studies | 0 | 0.0% |
| Science & Technology | 2 | 9.5% |
| Business | 9 | 42.9% |
| Education | 2 | 9.5% |
| Literature & Languages | 0 | 0.0% |
| Liberal Arts & History | 0 | 0.0% |
| Visual & Performing Arts | 0 | 0.0% |
| Communications | 0 | 0.0% |
| Arts & Humanities | 0 | 0.0% |
| Total | 21 | 100.0% |
Transportation & Commute in Rochester
Vehicle Availability by Sex in Rochester
The most prevalent vehicle ownership categories in Rochester are males with 2 vehicles (27, accounting for 55.1%) and females with 2 vehicles (5, making up 67.5%).
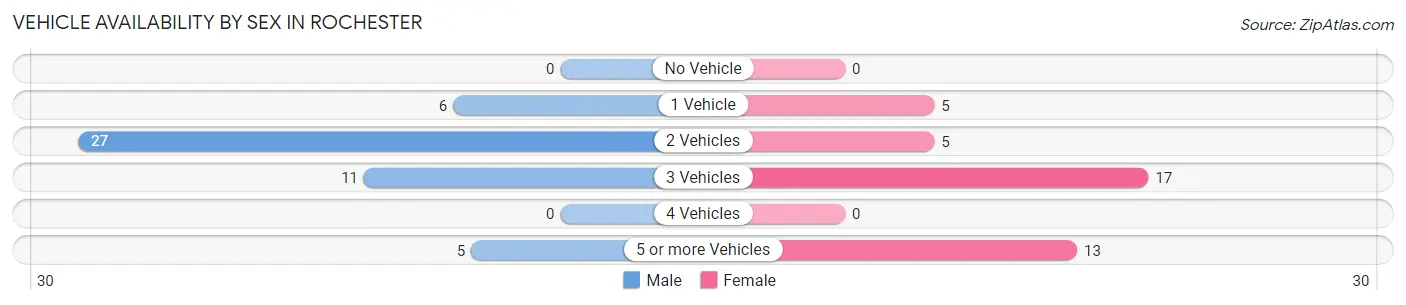
| Vehicles Available | Male | Female |
| No Vehicle | 0 (0.0%) | 0 (0.0%) |
| 1 Vehicle | 6 (12.2%) | 5 (12.5%) |
| 2 Vehicles | 27 (55.1%) | 5 (12.5%) |
| 3 Vehicles | 11 (22.5%) | 17 (42.5%) |
| 4 Vehicles | 0 (0.0%) | 0 (0.0%) |
| 5 or more Vehicles | 5 (10.2%) | 13 (32.5%) |
| Total | 49 (100.0%) | 40 (100.0%) |
Commute Time in Rochester
The most frequently occuring commute durations in Rochester are 45 to 59 minutes (20 commuters, 22.5%), 30 to 34 minutes (16 commuters, 18.0%), and 90 or more minutes (16 commuters, 18.0%).
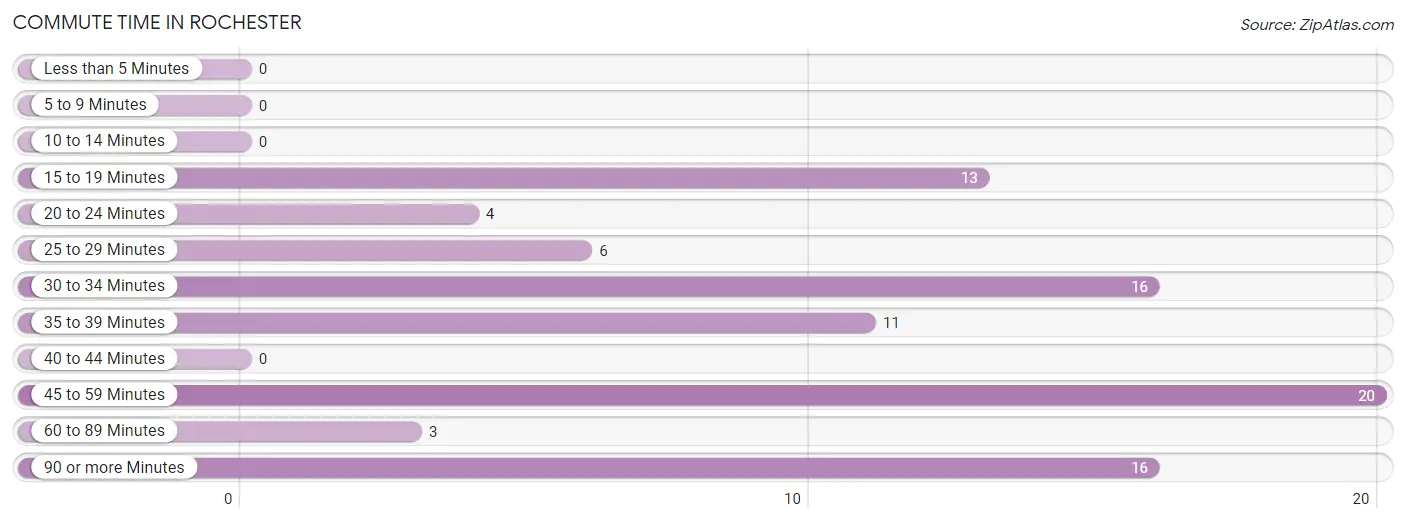
| Commute Time | # Commuters | % Commuters |
| Less than 5 Minutes | 0 | 0.0% |
| 5 to 9 Minutes | 0 | 0.0% |
| 10 to 14 Minutes | 0 | 0.0% |
| 15 to 19 Minutes | 13 | 14.6% |
| 20 to 24 Minutes | 4 | 4.5% |
| 25 to 29 Minutes | 6 | 6.7% |
| 30 to 34 Minutes | 16 | 18.0% |
| 35 to 39 Minutes | 11 | 12.4% |
| 40 to 44 Minutes | 0 | 0.0% |
| 45 to 59 Minutes | 20 | 22.5% |
| 60 to 89 Minutes | 3 | 3.4% |
| 90 or more Minutes | 16 | 18.0% |
Commute Time by Sex in Rochester
The most common commute times in Rochester are 90 or more minutes (16 commuters, 32.7%) for males and 45 to 59 minutes (16 commuters, 40.0%) for females.
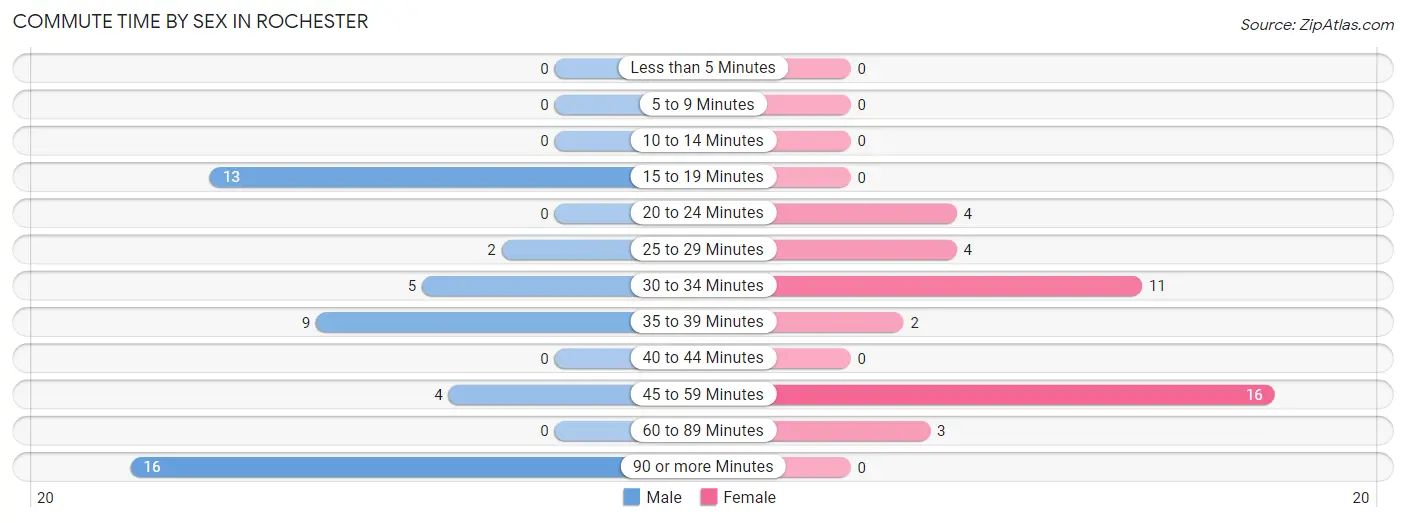
| Commute Time | Male | Female |
| Less than 5 Minutes | 0 (0.0%) | 0 (0.0%) |
| 5 to 9 Minutes | 0 (0.0%) | 0 (0.0%) |
| 10 to 14 Minutes | 0 (0.0%) | 0 (0.0%) |
| 15 to 19 Minutes | 13 (26.5%) | 0 (0.0%) |
| 20 to 24 Minutes | 0 (0.0%) | 4 (10.0%) |
| 25 to 29 Minutes | 2 (4.1%) | 4 (10.0%) |
| 30 to 34 Minutes | 5 (10.2%) | 11 (27.5%) |
| 35 to 39 Minutes | 9 (18.4%) | 2 (5.0%) |
| 40 to 44 Minutes | 0 (0.0%) | 0 (0.0%) |
| 45 to 59 Minutes | 4 (8.2%) | 16 (40.0%) |
| 60 to 89 Minutes | 0 (0.0%) | 3 (7.5%) |
| 90 or more Minutes | 16 (32.7%) | 0 (0.0%) |
Time of Departure to Work by Sex in Rochester
The most frequent times of departure to work in Rochester are 5:30 AM to 5:59 AM (23, 46.9%) for males and 8:00 AM to 8:29 AM (10, 25.0%) for females.
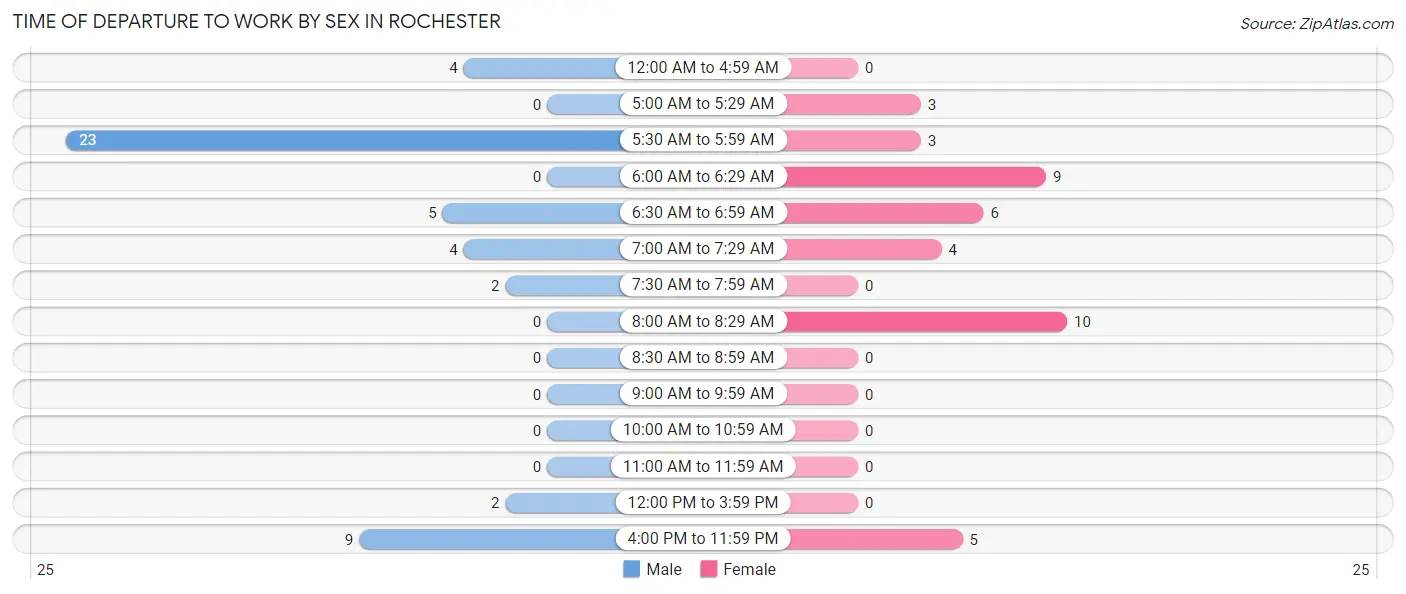
| Time of Departure | Male | Female |
| 12:00 AM to 4:59 AM | 4 (8.2%) | 0 (0.0%) |
| 5:00 AM to 5:29 AM | 0 (0.0%) | 3 (7.5%) |
| 5:30 AM to 5:59 AM | 23 (46.9%) | 3 (7.5%) |
| 6:00 AM to 6:29 AM | 0 (0.0%) | 9 (22.5%) |
| 6:30 AM to 6:59 AM | 5 (10.2%) | 6 (15.0%) |
| 7:00 AM to 7:29 AM | 4 (8.2%) | 4 (10.0%) |
| 7:30 AM to 7:59 AM | 2 (4.1%) | 0 (0.0%) |
| 8:00 AM to 8:29 AM | 0 (0.0%) | 10 (25.0%) |
| 8:30 AM to 8:59 AM | 0 (0.0%) | 0 (0.0%) |
| 9:00 AM to 9:59 AM | 0 (0.0%) | 0 (0.0%) |
| 10:00 AM to 10:59 AM | 0 (0.0%) | 0 (0.0%) |
| 11:00 AM to 11:59 AM | 0 (0.0%) | 0 (0.0%) |
| 12:00 PM to 3:59 PM | 2 (4.1%) | 0 (0.0%) |
| 4:00 PM to 11:59 PM | 9 (18.4%) | 5 (12.5%) |
| Total | 49 (100.0%) | 40 (100.0%) |
Housing Occupancy in Rochester
Occupancy by Ownership in Rochester
Of the total 67 dwellings in Rochester, owner-occupied units account for 60 (89.5%), while renter-occupied units make up 7 (10.4%).
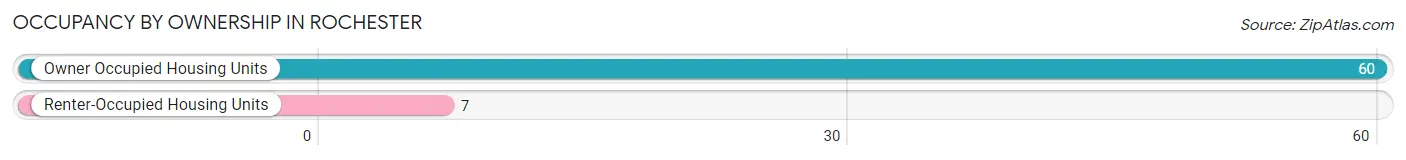
| Occupancy | # Housing Units | % Housing Units |
| Owner Occupied Housing Units | 60 | 89.5% |
| Renter-Occupied Housing Units | 7 | 10.4% |
| Total Occupied Housing Units | 67 | 100.0% |
Occupancy by Household Size in Rochester
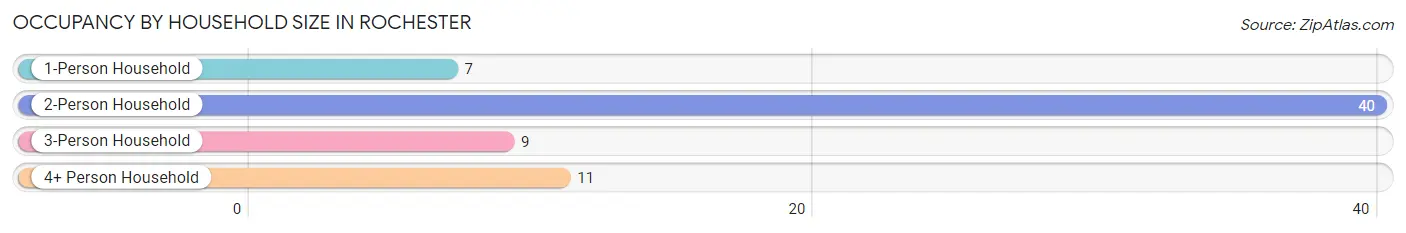
| Household Size | # Housing Units | % Housing Units |
| 1-Person Household | 7 | 10.4% |
| 2-Person Household | 40 | 59.7% |
| 3-Person Household | 9 | 13.4% |
| 4+ Person Household | 11 | 16.4% |
| Total Housing Units | 67 | 100.0% |
Occupancy by Ownership by Household Size in Rochester
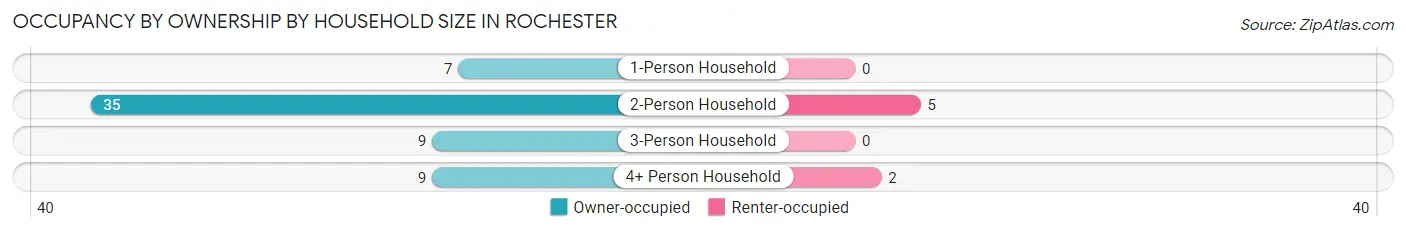
| Household Size | Owner-occupied | Renter-occupied |
| 1-Person Household | 7 (100.0%) | 0 (0.0%) |
| 2-Person Household | 35 (87.5%) | 5 (12.5%) |
| 3-Person Household | 9 (100.0%) | 0 (0.0%) |
| 4+ Person Household | 9 (81.8%) | 2 (18.2%) |
| Total Housing Units | 60 (89.5%) | 7 (10.4%) |
Occupancy by Educational Attainment in Rochester
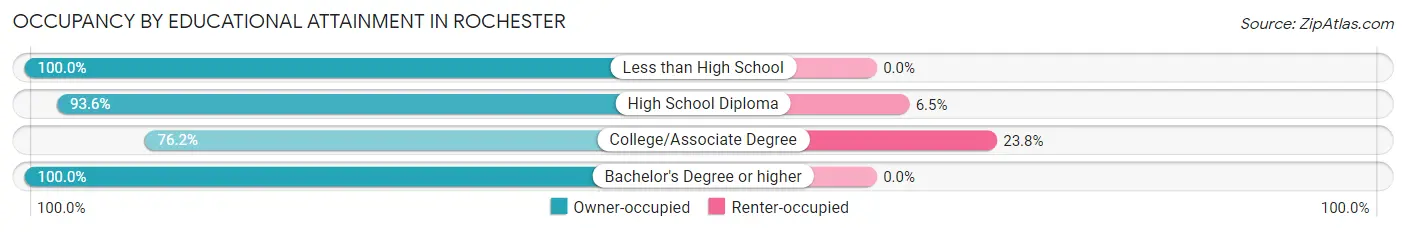
| Household Size | Owner-occupied | Renter-occupied |
| Less than High School | 9 (100.0%) | 0 (0.0%) |
| High School Diploma | 29 (93.5%) | 2 (6.5%) |
| College/Associate Degree | 16 (76.2%) | 5 (23.8%) |
| Bachelor's Degree or higher | 6 (100.0%) | 0 (0.0%) |
Occupancy by Age of Householder in Rochester
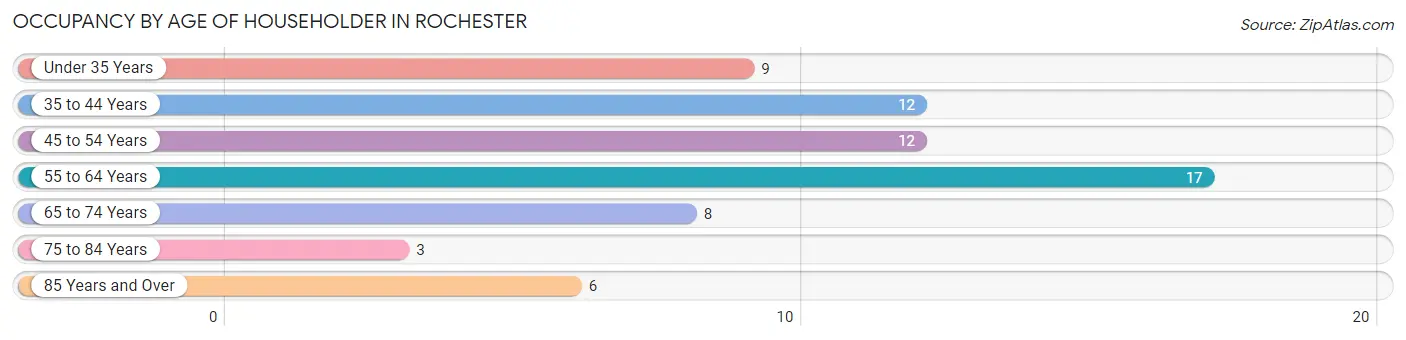
| Age Bracket | # Households | % Households |
| Under 35 Years | 9 | 13.4% |
| 35 to 44 Years | 12 | 17.9% |
| 45 to 54 Years | 12 | 17.9% |
| 55 to 64 Years | 17 | 25.4% |
| 65 to 74 Years | 8 | 11.9% |
| 75 to 84 Years | 3 | 4.5% |
| 85 Years and Over | 6 | 9.0% |
| Total | 67 | 100.0% |
Housing Finances in Rochester
Median Income by Occupancy in Rochester
| Occupancy Type | # Households | Median Income |
| Owner-Occupied | 60 (89.5%) | $0 |
| Renter-Occupied | 7 (10.4%) | $0 |
| Average | 67 (100.0%) | $0 |
Occupancy by Householder Income Bracket in Rochester
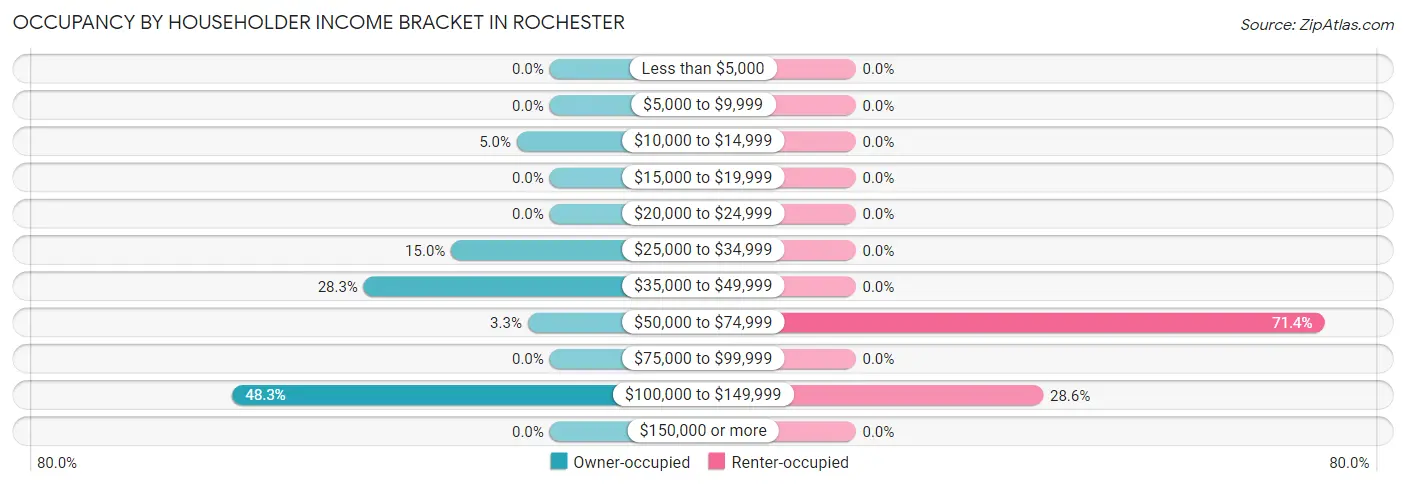
| Income Bracket | Owner-occupied | Renter-occupied |
| Less than $5,000 | 0 (0.0%) | 0 (0.0%) |
| $5,000 to $9,999 | 0 (0.0%) | 0 (0.0%) |
| $10,000 to $14,999 | 3 (5.0%) | 0 (0.0%) |
| $15,000 to $19,999 | 0 (0.0%) | 0 (0.0%) |
| $20,000 to $24,999 | 0 (0.0%) | 0 (0.0%) |
| $25,000 to $34,999 | 9 (15.0%) | 0 (0.0%) |
| $35,000 to $49,999 | 17 (28.3%) | 0 (0.0%) |
| $50,000 to $74,999 | 2 (3.3%) | 5 (71.4%) |
| $75,000 to $99,999 | 0 (0.0%) | 0 (0.0%) |
| $100,000 to $149,999 | 29 (48.3%) | 2 (28.6%) |
| $150,000 or more | 0 (0.0%) | 0 (0.0%) |
| Total | 60 (100.0%) | 7 (100.0%) |
Monthly Housing Cost Tiers in Rochester
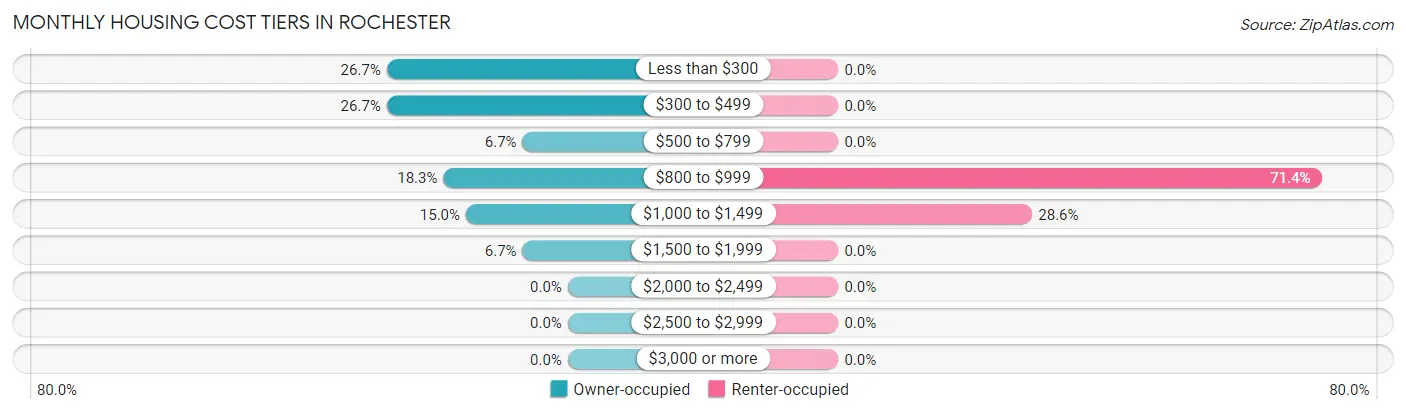
| Monthly Cost | Owner-occupied | Renter-occupied |
| Less than $300 | 16 (26.7%) | 0 (0.0%) |
| $300 to $499 | 16 (26.7%) | 0 (0.0%) |
| $500 to $799 | 4 (6.7%) | 0 (0.0%) |
| $800 to $999 | 11 (18.3%) | 5 (71.4%) |
| $1,000 to $1,499 | 9 (15.0%) | 2 (28.6%) |
| $1,500 to $1,999 | 4 (6.7%) | 0 (0.0%) |
| $2,000 to $2,499 | 0 (0.0%) | 0 (0.0%) |
| $2,500 to $2,999 | 0 (0.0%) | 0 (0.0%) |
| $3,000 or more | 0 (0.0%) | 0 (0.0%) |
| Total | 60 (100.0%) | 7 (100.0%) |
Physical Housing Characteristics in Rochester
Housing Structures in Rochester
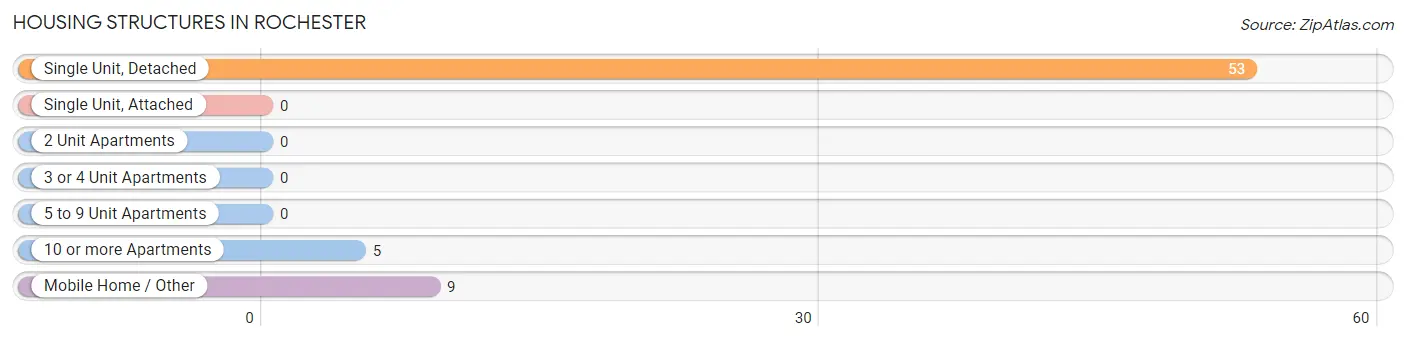
| Structure Type | # Housing Units | % Housing Units |
| Single Unit, Detached | 53 | 79.1% |
| Single Unit, Attached | 0 | 0.0% |
| 2 Unit Apartments | 0 | 0.0% |
| 3 or 4 Unit Apartments | 0 | 0.0% |
| 5 to 9 Unit Apartments | 0 | 0.0% |
| 10 or more Apartments | 5 | 7.5% |
| Mobile Home / Other | 9 | 13.4% |
| Total | 67 | 100.0% |
Housing Structures by Occupancy in Rochester
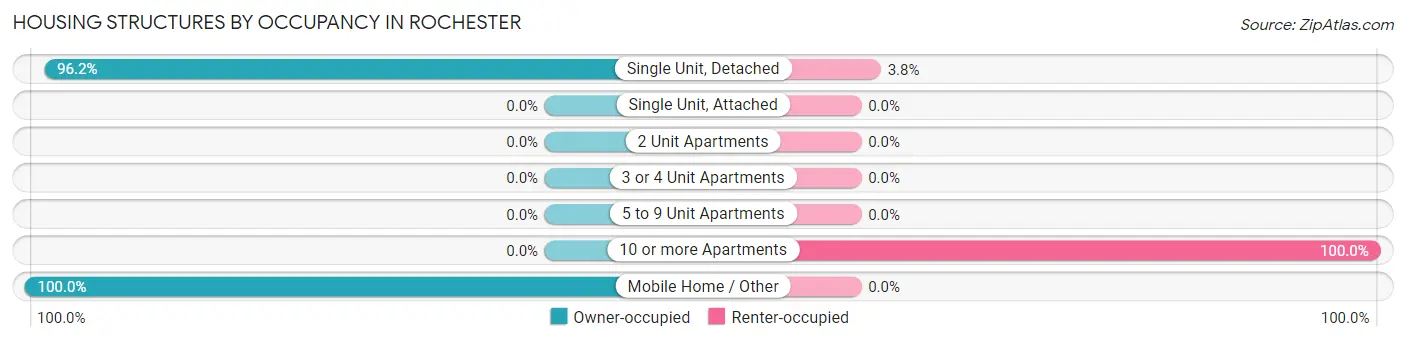
| Structure Type | Owner-occupied | Renter-occupied |
| Single Unit, Detached | 51 (96.2%) | 2 (3.8%) |
| Single Unit, Attached | 0 (0.0%) | 0 (0.0%) |
| 2 Unit Apartments | 0 (0.0%) | 0 (0.0%) |
| 3 or 4 Unit Apartments | 0 (0.0%) | 0 (0.0%) |
| 5 to 9 Unit Apartments | 0 (0.0%) | 0 (0.0%) |
| 10 or more Apartments | 0 (0.0%) | 5 (100.0%) |
| Mobile Home / Other | 9 (100.0%) | 0 (0.0%) |
| Total | 60 (89.5%) | 7 (10.4%) |
Housing Structures by Number of Rooms in Rochester
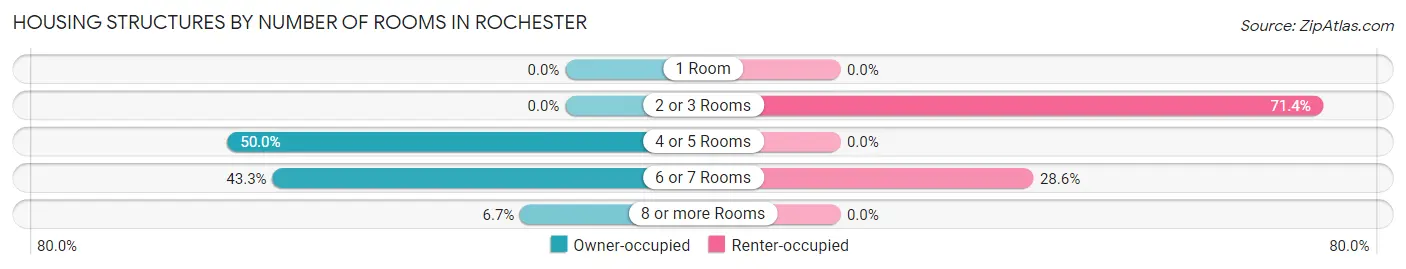
| Number of Rooms | Owner-occupied | Renter-occupied |
| 1 Room | 0 (0.0%) | 0 (0.0%) |
| 2 or 3 Rooms | 0 (0.0%) | 5 (71.4%) |
| 4 or 5 Rooms | 30 (50.0%) | 0 (0.0%) |
| 6 or 7 Rooms | 26 (43.3%) | 2 (28.6%) |
| 8 or more Rooms | 4 (6.7%) | 0 (0.0%) |
| Total | 60 (100.0%) | 7 (100.0%) |
Housing Structure by Heating Type in Rochester
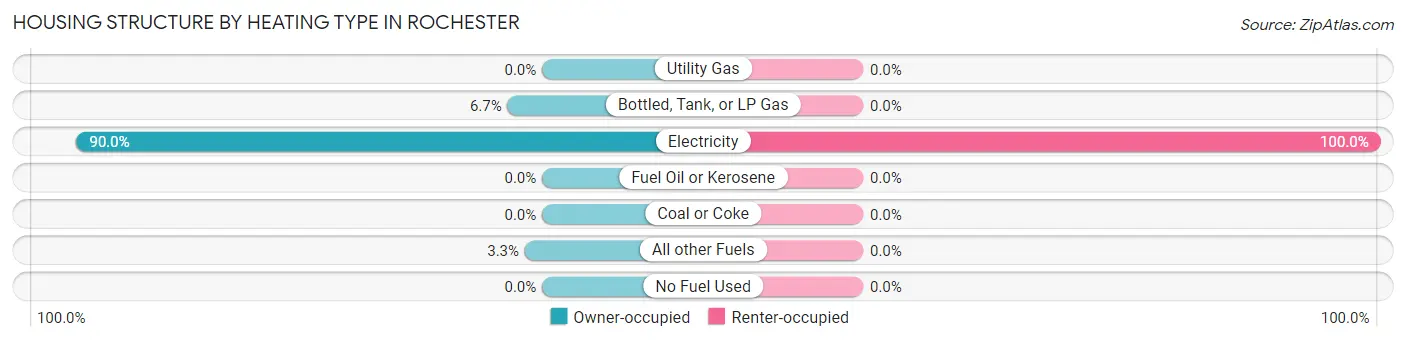
| Heating Type | Owner-occupied | Renter-occupied |
| Utility Gas | 0 (0.0%) | 0 (0.0%) |
| Bottled, Tank, or LP Gas | 4 (6.7%) | 0 (0.0%) |
| Electricity | 54 (90.0%) | 7 (100.0%) |
| Fuel Oil or Kerosene | 0 (0.0%) | 0 (0.0%) |
| Coal or Coke | 0 (0.0%) | 0 (0.0%) |
| All other Fuels | 2 (3.3%) | 0 (0.0%) |
| No Fuel Used | 0 (0.0%) | 0 (0.0%) |
| Total | 60 (100.0%) | 7 (100.0%) |
Household Vehicle Usage in Rochester
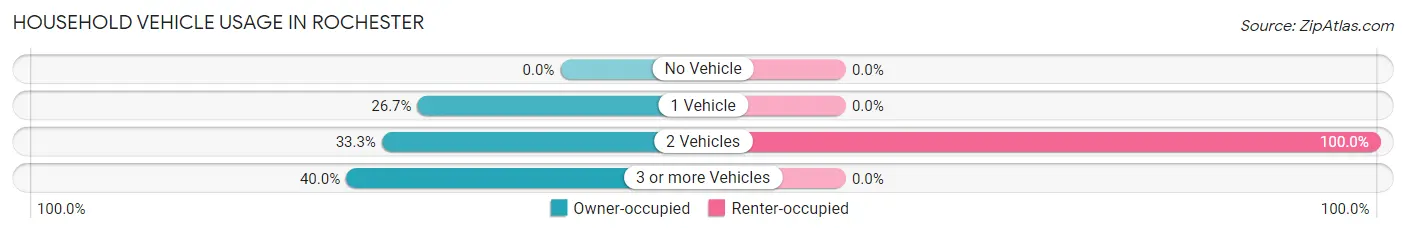
| Vehicles per Household | Owner-occupied | Renter-occupied |
| No Vehicle | 0 (0.0%) | 0 (0.0%) |
| 1 Vehicle | 16 (26.7%) | 0 (0.0%) |
| 2 Vehicles | 20 (33.3%) | 7 (100.0%) |
| 3 or more Vehicles | 24 (40.0%) | 0 (0.0%) |
| Total | 60 (100.0%) | 7 (100.0%) |
Real Estate & Mortgages in Rochester
Real Estate and Mortgage Overview in Rochester
| Characteristic | Without Mortgage | With Mortgage |
| Housing Units | 34 | 26 |
| Median Property Value | - | - |
| Median Household Income | - | - |
| Monthly Housing Costs | $306 | $0 |
| Real Estate Taxes | $260 | $0 |
Property Value by Mortgage Status in Rochester
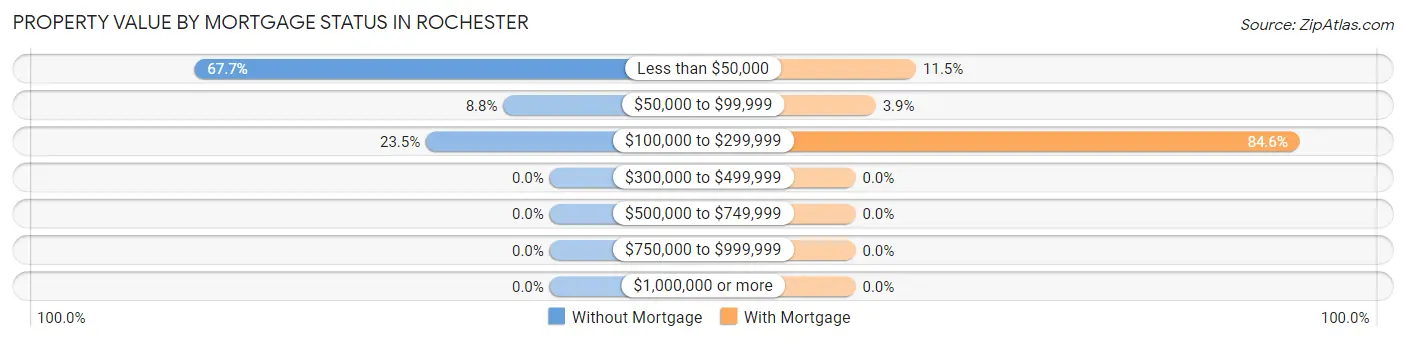
| Property Value | Without Mortgage | With Mortgage |
| Less than $50,000 | 23 (67.6%) | 3 (11.5%) |
| $50,000 to $99,999 | 3 (8.8%) | 1 (3.8%) |
| $100,000 to $299,999 | 8 (23.5%) | 22 (84.6%) |
| $300,000 to $499,999 | 0 (0.0%) | 0 (0.0%) |
| $500,000 to $749,999 | 0 (0.0%) | 0 (0.0%) |
| $750,000 to $999,999 | 0 (0.0%) | 0 (0.0%) |
| $1,000,000 or more | 0 (0.0%) | 0 (0.0%) |
| Total | 34 (100.0%) | 26 (100.0%) |
Household Income by Mortgage Status in Rochester
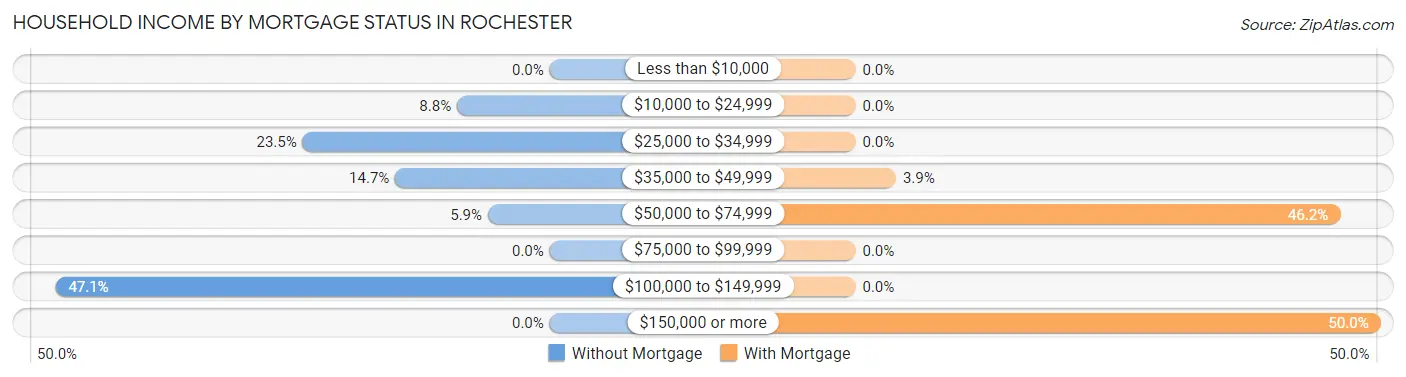
| Household Income | Without Mortgage | With Mortgage |
| Less than $10,000 | 0 (0.0%) | 0 (0.0%) |
| $10,000 to $24,999 | 3 (8.8%) | 0 (0.0%) |
| $25,000 to $34,999 | 8 (23.5%) | 0 (0.0%) |
| $35,000 to $49,999 | 5 (14.7%) | 1 (3.8%) |
| $50,000 to $74,999 | 2 (5.9%) | 12 (46.2%) |
| $75,000 to $99,999 | 0 (0.0%) | 0 (0.0%) |
| $100,000 to $149,999 | 16 (47.1%) | 0 (0.0%) |
| $150,000 or more | 0 (0.0%) | 13 (50.0%) |
| Total | 34 (100.0%) | 26 (100.0%) |
Property Value to Household Income Ratio in Rochester
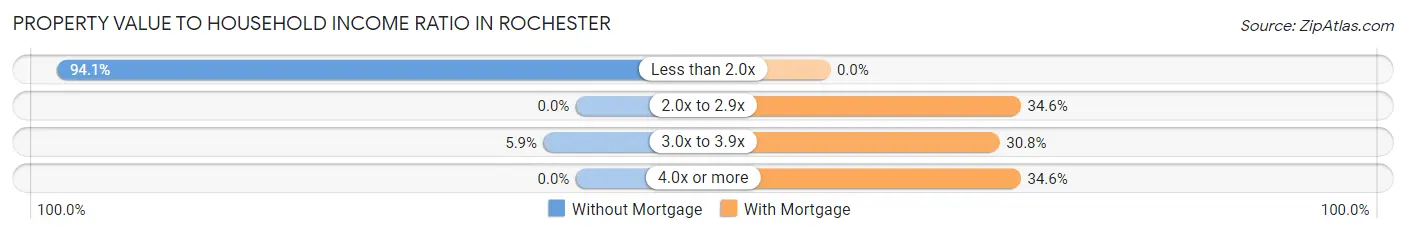
| Value-to-Income Ratio | Without Mortgage | With Mortgage |
| Less than 2.0x | 32 (94.1%) | 0 (0.0%) |
| 2.0x to 2.9x | 0 (0.0%) | 9 (34.6%) |
| 3.0x to 3.9x | 2 (5.9%) | 8 (30.8%) |
| 4.0x or more | 0 (0.0%) | 9 (34.6%) |
| Total | 34 (100.0%) | 26 (100.0%) |
Real Estate Taxes by Mortgage Status in Rochester
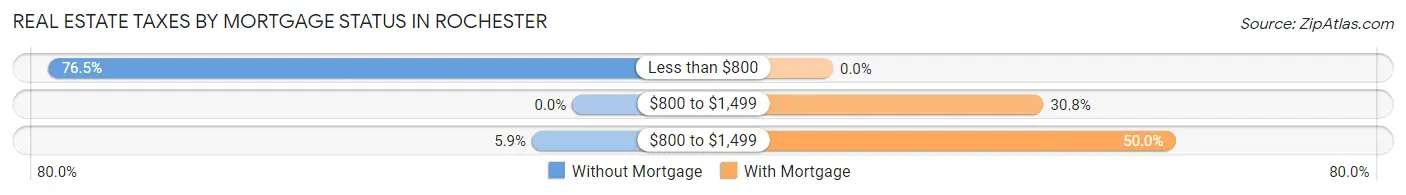
| Property Taxes | Without Mortgage | With Mortgage |
| Less than $800 | 26 (76.5%) | 0 (0.0%) |
| $800 to $1,499 | 0 (0.0%) | 8 (30.8%) |
| $800 to $1,499 | 2 (5.9%) | 13 (50.0%) |
| Total | 34 (100.0%) | 26 (100.0%) |
Health & Disability in Rochester
Health Insurance Coverage by Age in Rochester
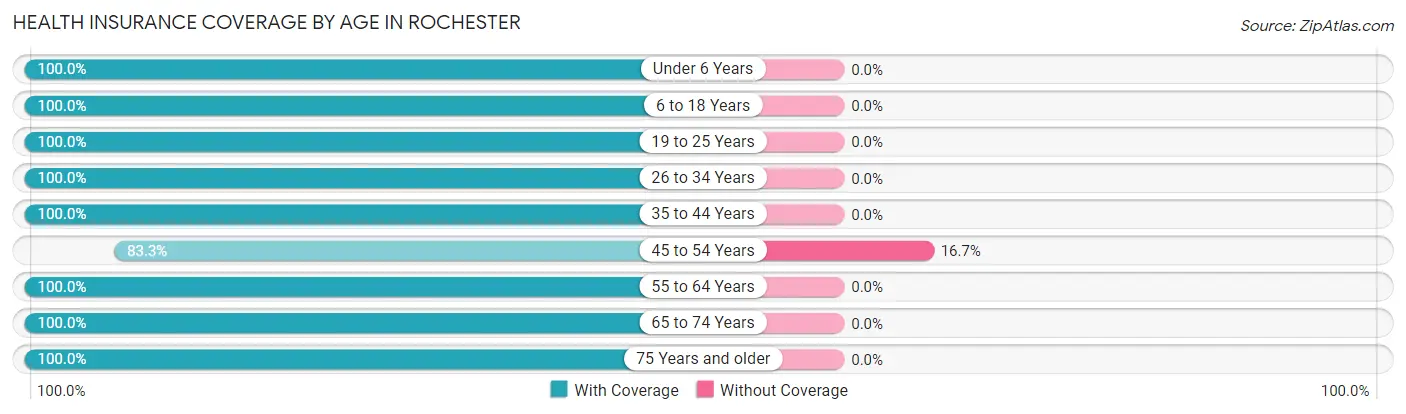
| Age Bracket | With Coverage | Without Coverage |
| Under 6 Years | 7 (100.0%) | 0 (0.0%) |
| 6 to 18 Years | 21 (100.0%) | 0 (0.0%) |
| 19 to 25 Years | 16 (100.0%) | 0 (0.0%) |
| 26 to 34 Years | 9 (100.0%) | 0 (0.0%) |
| 35 to 44 Years | 48 (100.0%) | 0 (0.0%) |
| 45 to 54 Years | 20 (83.3%) | 4 (16.7%) |
| 55 to 64 Years | 26 (100.0%) | 0 (0.0%) |
| 65 to 74 Years | 16 (100.0%) | 0 (0.0%) |
| 75 Years and older | 13 (100.0%) | 0 (0.0%) |
| Total | 176 (97.8%) | 4 (2.2%) |
Health Insurance Coverage by Citizenship Status in Rochester
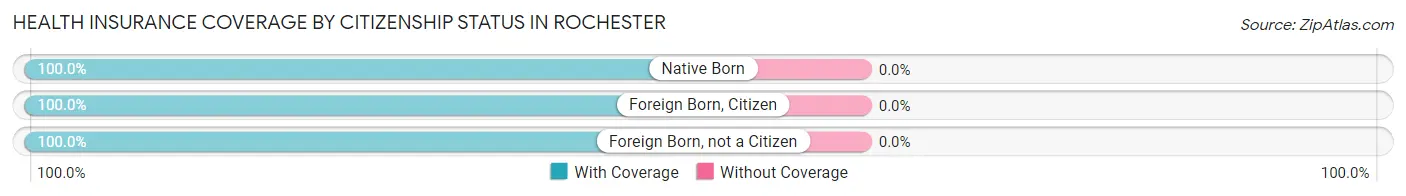
| Citizenship Status | With Coverage | Without Coverage |
| Native Born | 7 (100.0%) | 0 (0.0%) |
| Foreign Born, Citizen | 21 (100.0%) | 0 (0.0%) |
| Foreign Born, not a Citizen | 16 (100.0%) | 0 (0.0%) |
Health Insurance Coverage by Household Income in Rochester
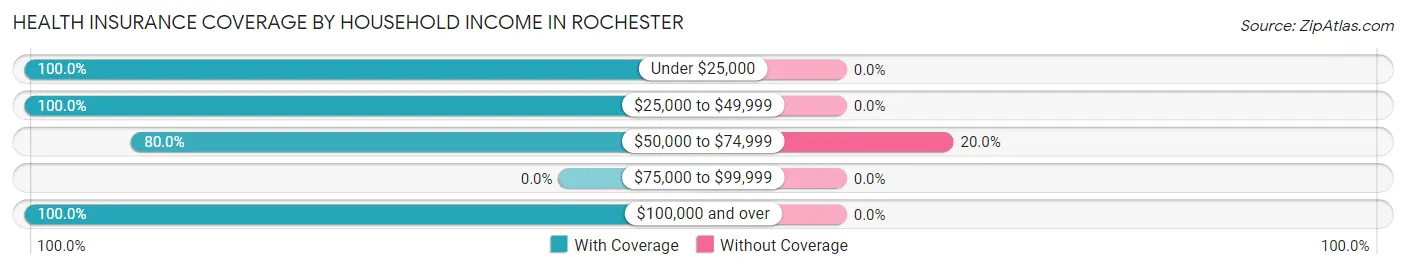
| Household Income | With Coverage | Without Coverage |
| Under $25,000 | 13 (100.0%) | 0 (0.0%) |
| $25,000 to $49,999 | 49 (100.0%) | 0 (0.0%) |
| $50,000 to $74,999 | 16 (80.0%) | 4 (20.0%) |
| $75,000 to $99,999 | 0 (0.0%) | 0 (0.0%) |
| $100,000 and over | 98 (100.0%) | 0 (0.0%) |
Public vs Private Health Insurance Coverage by Age in Rochester
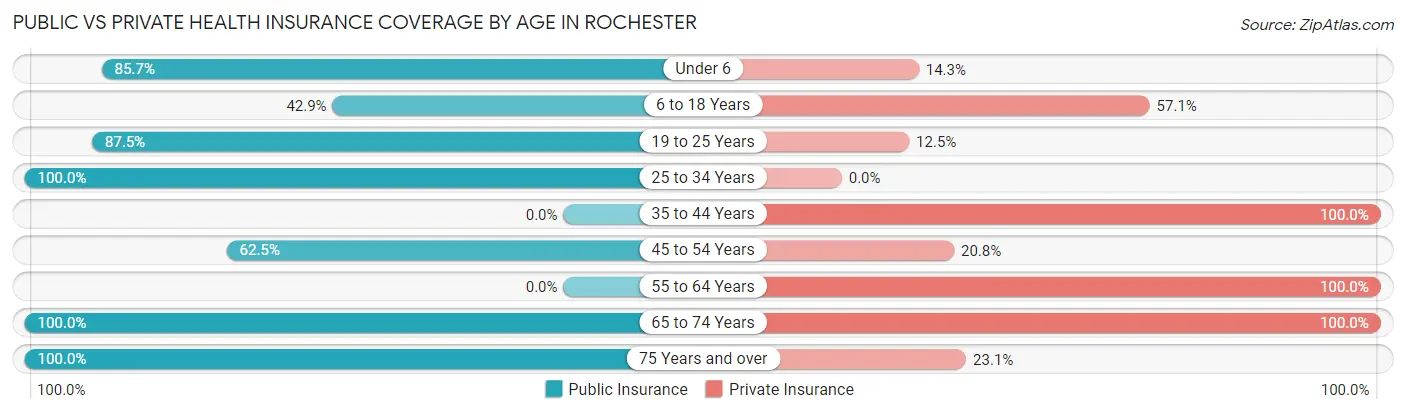
| Age Bracket | Public Insurance | Private Insurance |
| Under 6 | 6 (85.7%) | 1 (14.3%) |
| 6 to 18 Years | 9 (42.9%) | 12 (57.1%) |
| 19 to 25 Years | 14 (87.5%) | 2 (12.5%) |
| 25 to 34 Years | 9 (100.0%) | 0 (0.0%) |
| 35 to 44 Years | 0 (0.0%) | 48 (100.0%) |
| 45 to 54 Years | 15 (62.5%) | 5 (20.8%) |
| 55 to 64 Years | 0 (0.0%) | 26 (100.0%) |
| 65 to 74 Years | 16 (100.0%) | 16 (100.0%) |
| 75 Years and over | 13 (100.0%) | 3 (23.1%) |
| Total | 82 (45.6%) | 113 (62.8%) |
Disability Status by Sex by Age in Rochester
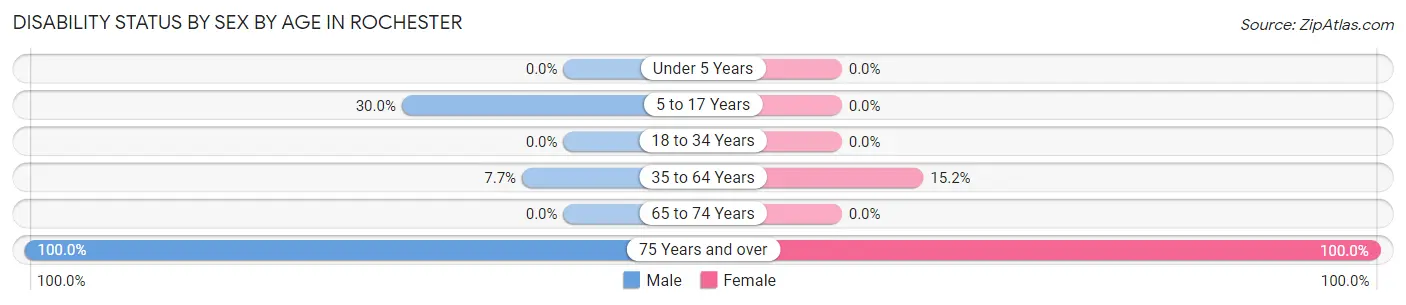
| Age Bracket | Male | Female |
| Under 5 Years | 0 (0.0%) | 0 (0.0%) |
| 5 to 17 Years | 3 (30.0%) | 0 (0.0%) |
| 18 to 34 Years | 0 (0.0%) | 0 (0.0%) |
| 35 to 64 Years | 5 (7.7%) | 5 (15.1%) |
| 65 to 74 Years | 0 (0.0%) | 0 (0.0%) |
| 75 Years and over | 4 (100.0%) | 9 (100.0%) |
Disability Class by Sex by Age in Rochester
Disability Class: Hearing Difficulty
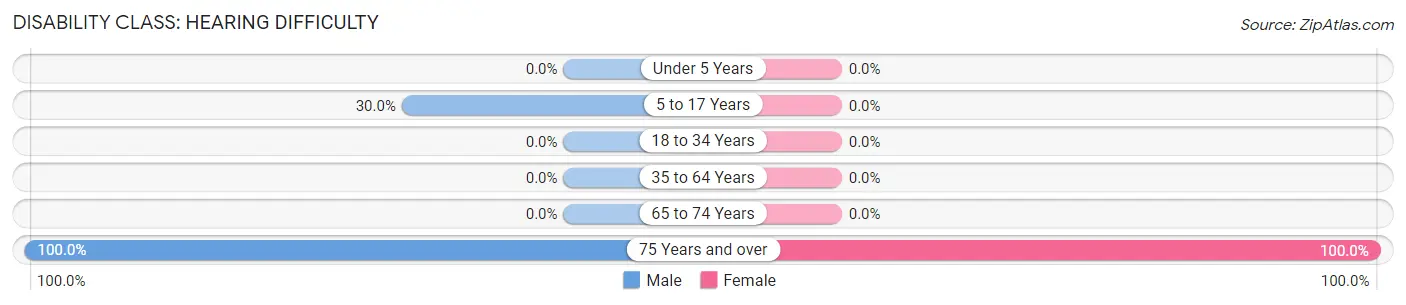
| Age Bracket | Male | Female |
| Under 5 Years | 0 (0.0%) | 0 (0.0%) |
| 5 to 17 Years | 3 (30.0%) | 0 (0.0%) |
| 18 to 34 Years | 0 (0.0%) | 0 (0.0%) |
| 35 to 64 Years | 0 (0.0%) | 0 (0.0%) |
| 65 to 74 Years | 0 (0.0%) | 0 (0.0%) |
| 75 Years and over | 4 (100.0%) | 9 (100.0%) |
Disability Class: Vision Difficulty
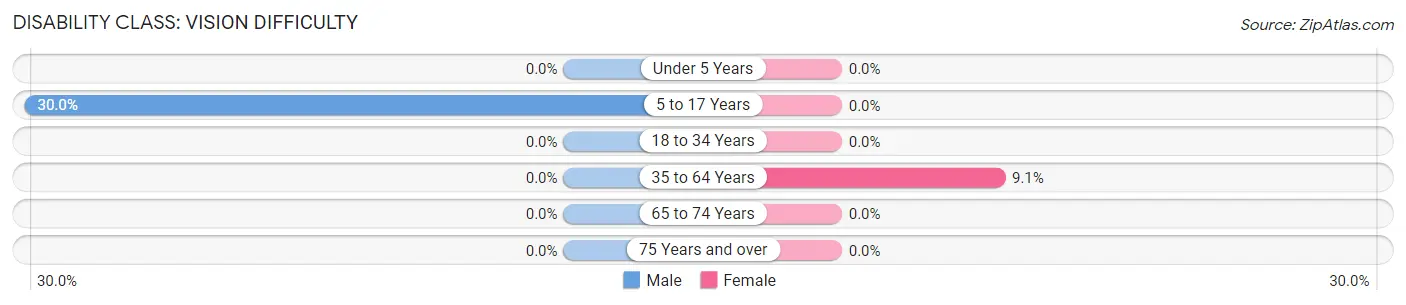
| Age Bracket | Male | Female |
| Under 5 Years | 0 (0.0%) | 0 (0.0%) |
| 5 to 17 Years | 3 (30.0%) | 0 (0.0%) |
| 18 to 34 Years | 0 (0.0%) | 0 (0.0%) |
| 35 to 64 Years | 0 (0.0%) | 3 (9.1%) |
| 65 to 74 Years | 0 (0.0%) | 0 (0.0%) |
| 75 Years and over | 0 (0.0%) | 0 (0.0%) |
Disability Class: Cognitive Difficulty
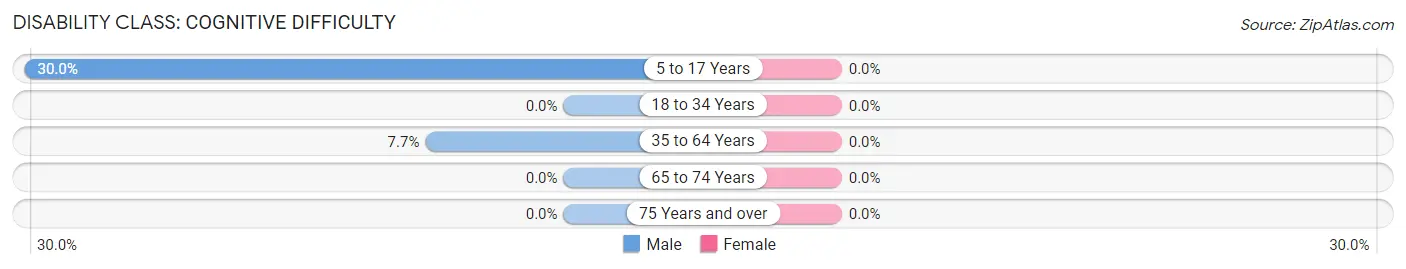
| Age Bracket | Male | Female |
| 5 to 17 Years | 3 (30.0%) | 0 (0.0%) |
| 18 to 34 Years | 0 (0.0%) | 0 (0.0%) |
| 35 to 64 Years | 5 (7.7%) | 0 (0.0%) |
| 65 to 74 Years | 0 (0.0%) | 0 (0.0%) |
| 75 Years and over | 0 (0.0%) | 0 (0.0%) |
Disability Class: Ambulatory Difficulty
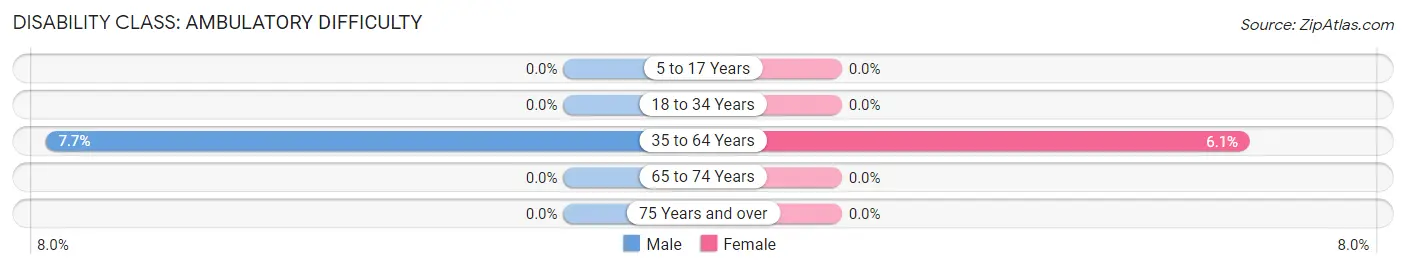
| Age Bracket | Male | Female |
| 5 to 17 Years | 0 (0.0%) | 0 (0.0%) |
| 18 to 34 Years | 0 (0.0%) | 0 (0.0%) |
| 35 to 64 Years | 5 (7.7%) | 2 (6.1%) |
| 65 to 74 Years | 0 (0.0%) | 0 (0.0%) |
| 75 Years and over | 0 (0.0%) | 0 (0.0%) |
Disability Class: Self-Care Difficulty
| Age Bracket | Male | Female |
| 5 to 17 Years | 0 (0.0%) | 0 (0.0%) |
| 18 to 34 Years | 0 (0.0%) | 0 (0.0%) |
| 35 to 64 Years | 0 (0.0%) | 0 (0.0%) |
| 65 to 74 Years | 0 (0.0%) | 0 (0.0%) |
| 75 Years and over | 0 (0.0%) | 0 (0.0%) |
Technology Access in Rochester
Computing Device Access in Rochester
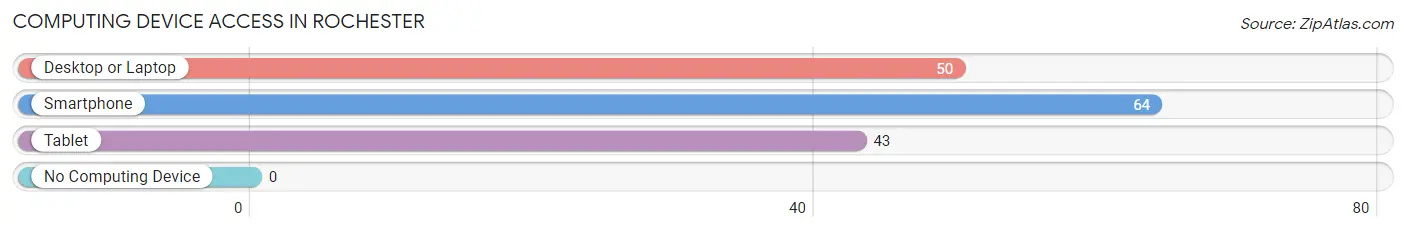
| Device Type | # Households | % Households |
| Desktop or Laptop | 50 | 74.6% |
| Smartphone | 64 | 95.5% |
| Tablet | 43 | 64.2% |
| No Computing Device | 0 | 0.0% |
| Total | 67 | 100.0% |
Internet Access in Rochester
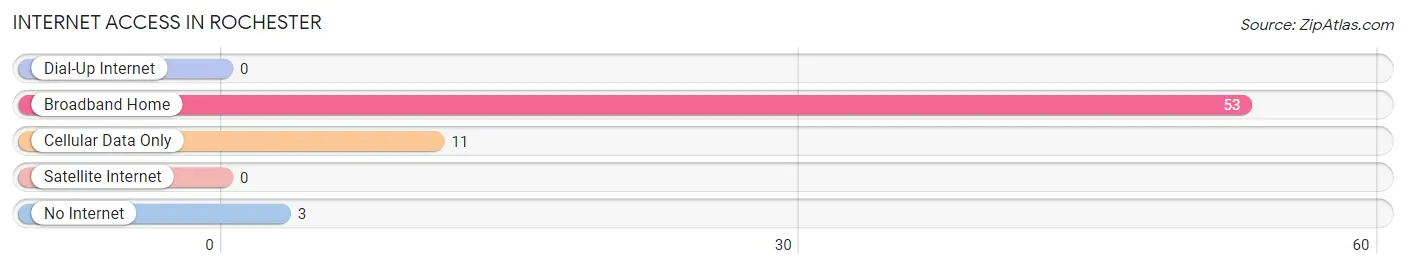
| Internet Type | # Households | % Households |
| Dial-Up Internet | 0 | 0.0% |
| Broadband Home | 53 | 79.1% |
| Cellular Data Only | 11 | 16.4% |
| Satellite Internet | 0 | 0.0% |
| No Internet | 3 | 4.5% |
| Total | 67 | 100.0% |
Rochester Summary
Rochester is a small town located in the state of Kentucky, in the United States. It is situated in the western part of the state, in the county of Butler. The town has a population of around 1,000 people, and is located in the heart of the rural countryside.
History
Rochester was first settled in the early 1800s by a group of settlers from the nearby town of Morgantown. The town was originally known as “Rochester Station”, and was named after the nearby Rochester Creek. The town was officially incorporated in 1883, and was named after the creek.
The town was a small farming community for many years, and was home to a number of small businesses. In the early 1900s, the town began to grow and develop, and by the mid-1900s, it had become a thriving community.
Geography
Rochester is located in the western part of Kentucky, in the county of Butler. The town is situated in a rural area, and is surrounded by rolling hills and farmland. The town is located near the Ohio River, and is about 30 miles from the state capital of Frankfort.
The climate in Rochester is generally mild, with hot summers and cold winters. The average temperature in the summer is around 80 degrees Fahrenheit, and the average temperature in the winter is around 40 degrees Fahrenheit.
Economy
Rochester’s economy is largely based on agriculture and tourism. The town is home to a number of small businesses, including restaurants, shops, and other services. The town is also home to a number of farms, which produce a variety of crops, including corn, soybeans, and wheat.
The town is also home to a number of tourist attractions, including the Rochester Museum, which houses a variety of artifacts from the town’s history. The town is also home to a number of parks and recreational areas, which attract visitors from all over the state.
Demographics
As of the 2010 census, the population of Rochester was 1,000 people. The town is predominantly white, with around 95% of the population being white. The remaining 5% of the population is made up of African Americans, Hispanics, and other ethnicities.
The median household income in Rochester is around $35,000, and the median home value is around $90,000. The town has a low unemployment rate, and the majority of the population is employed in the agricultural and tourism industries.
Rochester is a small town with a rich history and a vibrant economy. The town is home to a number of small businesses, farms, and tourist attractions, and is a great place to live and work. The town is also home to a diverse population, and is a great place to visit and explore.
Common Questions
What is Per Capita Income in Rochester?
Per Capita income in Rochester is $33,637.
What is the Median Family Income in Rochester?
Median Family Income in Rochester is $128,750.
What is Inequality or Gini Index in Rochester?
Inequality or Gini Index in Rochester is 0.32.
What is the Total Population of Rochester?
Total Population of Rochester is 180.
What is the Total Male Population of Rochester?
Total Male Population of Rochester is 91.
What is the Total Female Population of Rochester?
Total Female Population of Rochester is 89.
What is the Ratio of Males per 100 Females in Rochester?
There are 102.25 Males per 100 Females in Rochester.
What is the Ratio of Females per 100 Males in Rochester?
There are 97.80 Females per 100 Males in Rochester.
What is the Median Population Age in Rochester?
Median Population Age in Rochester is 42.6 Years.
What is the Average Family Size in Rochester
Average Family Size in Rochester is 3.1 People.
What is the Average Household Size in Rochester
Average Household Size in Rochester is 2.7 People.
How Large is the Labor Force in Rochester?
There are 92 People in the Labor Forcein in Rochester.
What is the Percentage of People in the Labor Force in Rochester?
57.9% of People are in the Labor Force in Rochester.