Stearns, KY Map & Demographics
Stearns Map
Stearns Overview
$18,049
PER CAPITA INCOME
0.43
INEQUALITY / GINI INDEX
1,224
TOTAL POPULATION
621
MALE POPULATION
603
FEMALE POPULATION
102.99
MALES / 100 FEMALES
97.10
FEMALES / 100 MALES
48.0
MEDIAN AGE
3.0
AVG FAMILY SIZE
2.9
AVG HOUSEHOLD SIZE
379
LABOR FORCE [ PEOPLE ]
40.5%
PERCENT IN LABOR FORCE
2.6%
UNEMPLOYMENT RATE
Stearns Zip Codes
Stearns Area Codes
Income in Stearns
Income Overview in Stearns
| Characteristic | Number | Measure |
| Per Capita Income | 1,224 | $18,049 |
| Median Family Income | 345 | $0 |
| Mean Family Income | 345 | $39,641 |
| Median Household Income | 421 | $0 |
| Mean Household Income | 421 | $43,923 |
| Income Deficit | 345 | $0 |
| Wage / Income Gap (%) | 1,224 | 0.00% |
| Wage / Income Gap ($) | 1,224 | 100.00¢ per $1 |
| Gini / Inequality Index | 1,224 | 0.43 |
Earnings by Sex in Stearns
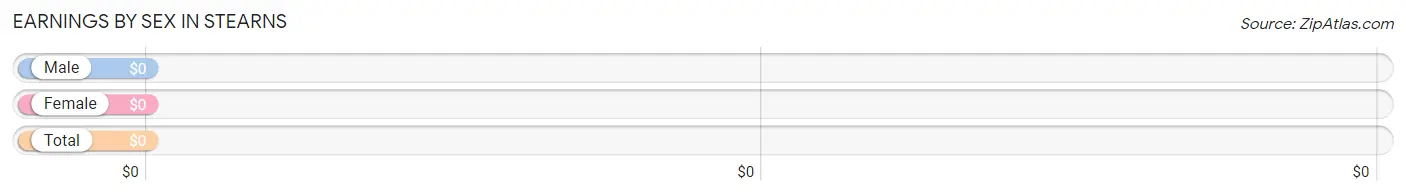
| Sex | Number | Average Earnings |
| Male | 223 (49.3%) | $0 |
| Female | 229 (50.7%) | $0 |
| Total | 452 (100.0%) | $0 |
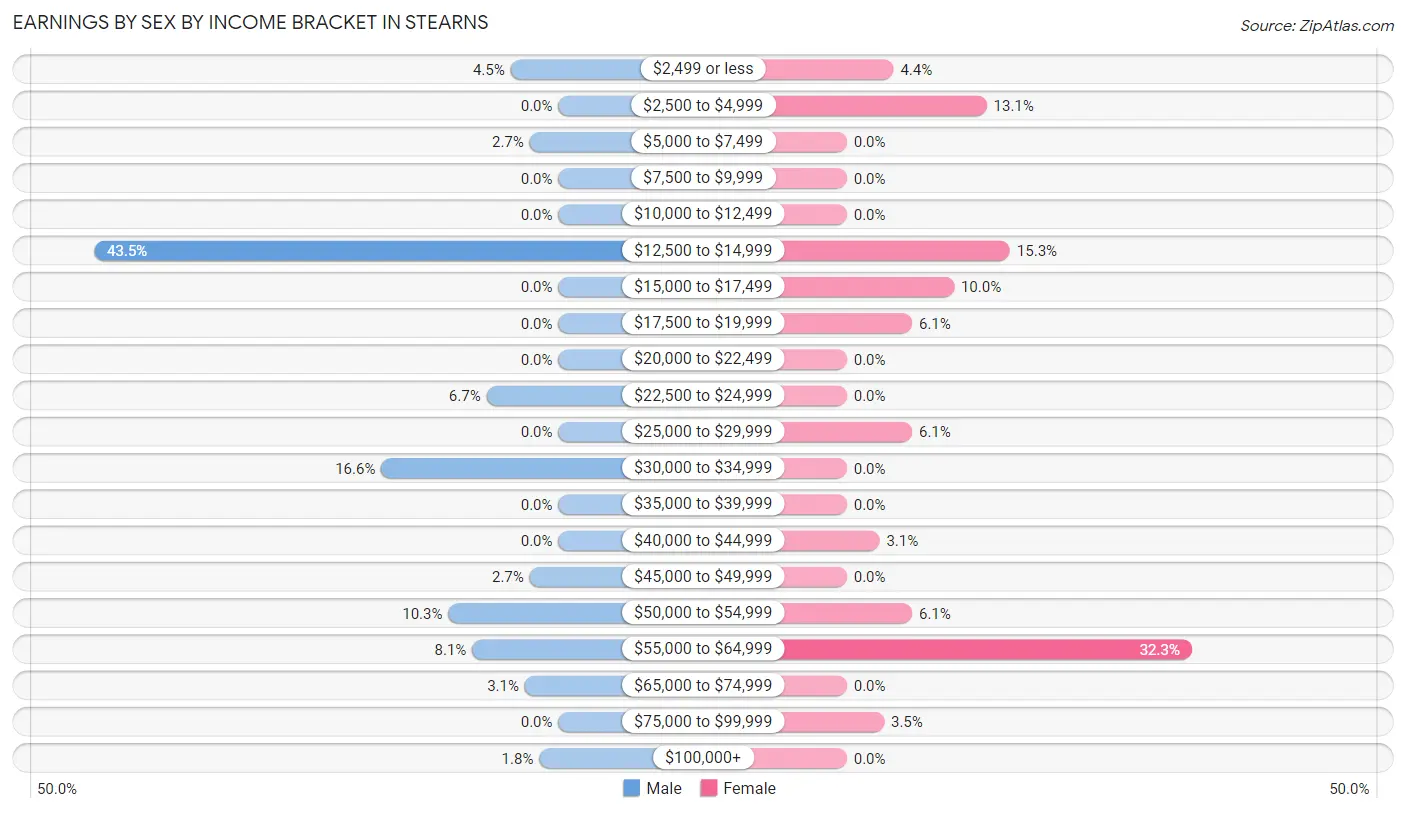
Earnings by Sex by Income Bracket in Stearns
The most common earnings brackets in Stearns are $12,500 to $14,999 for men (97 | 43.5%) and $55,000 to $64,999 for women (74 | 32.3%).
| Income | Male | Female |
| $2,499 or less | 10 (4.5%) | 10 (4.4%) |
| $2,500 to $4,999 | 0 (0.0%) | 30 (13.1%) |
| $5,000 to $7,499 | 6 (2.7%) | 0 (0.0%) |
| $7,500 to $9,999 | 0 (0.0%) | 0 (0.0%) |
| $10,000 to $12,499 | 0 (0.0%) | 0 (0.0%) |
| $12,500 to $14,999 | 97 (43.5%) | 35 (15.3%) |
| $15,000 to $17,499 | 0 (0.0%) | 23 (10.0%) |
| $17,500 to $19,999 | 0 (0.0%) | 14 (6.1%) |
| $20,000 to $22,499 | 0 (0.0%) | 0 (0.0%) |
| $22,500 to $24,999 | 15 (6.7%) | 0 (0.0%) |
| $25,000 to $29,999 | 0 (0.0%) | 14 (6.1%) |
| $30,000 to $34,999 | 37 (16.6%) | 0 (0.0%) |
| $35,000 to $39,999 | 0 (0.0%) | 0 (0.0%) |
| $40,000 to $44,999 | 0 (0.0%) | 7 (3.1%) |
| $45,000 to $49,999 | 6 (2.7%) | 0 (0.0%) |
| $50,000 to $54,999 | 23 (10.3%) | 14 (6.1%) |
| $55,000 to $64,999 | 18 (8.1%) | 74 (32.3%) |
| $65,000 to $74,999 | 7 (3.1%) | 0 (0.0%) |
| $75,000 to $99,999 | 0 (0.0%) | 8 (3.5%) |
| $100,000+ | 4 (1.8%) | 0 (0.0%) |
| Total | 223 (100.0%) | 229 (100.0%) |
Earnings by Sex by Educational Attainment in Stearns
| Educational Attainment | Male Income | Female Income |
| Less than High School | - | - |
| High School Diploma | - | - |
| College or Associate's Degree | - | - |
| Bachelor's Degree | - | - |
| Graduate Degree | - | - |
| Total | - | - |
Family Income in Stearns
Family Income Brackets in Stearns
According to the Stearns family income data, there are 127 families falling into the $50,000 to $74,999 income range, which is the most common income bracket and makes up 36.8% of all families.
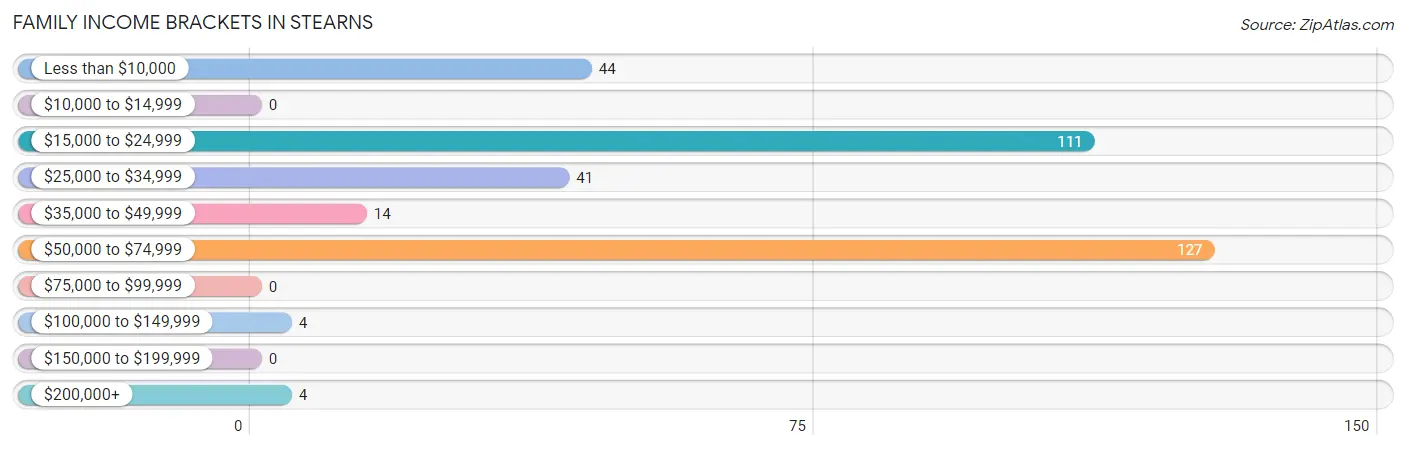
| Income Bracket | # Families | % Families |
| Less than $10,000 | 44 | 12.8% |
| $10,000 to $14,999 | 0 | 0.0% |
| $15,000 to $24,999 | 111 | 32.2% |
| $25,000 to $34,999 | 41 | 11.9% |
| $35,000 to $49,999 | 14 | 4.1% |
| $50,000 to $74,999 | 127 | 36.8% |
| $75,000 to $99,999 | 0 | 0.0% |
| $100,000 to $149,999 | 4 | 1.2% |
| $150,000 to $199,999 | 0 | 0.0% |
| $200,000+ | 4 | 1.2% |
Family Income by Famaliy Size in Stearns
3-person families (69 | 20.0%) account for the highest median family income in Stearns with $40,089 per family, while 3-person families (69 | 20.0%) have the highest median income of $13,363 per family member.
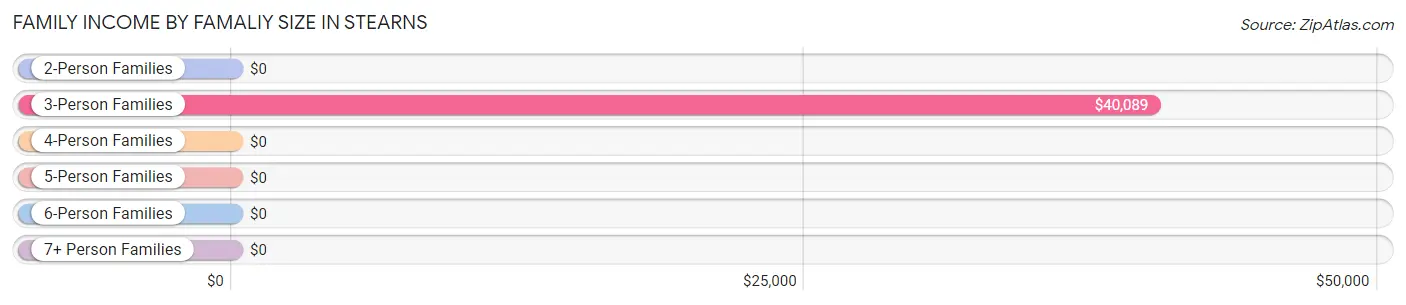
| Income Bracket | # Families | Median Income |
| 2-Person Families | 181 (52.5%) | $0 |
| 3-Person Families | 69 (20.0%) | $40,089 |
| 4-Person Families | 70 (20.3%) | $0 |
| 5-Person Families | 8 (2.3%) | $0 |
| 6-Person Families | 17 (4.9%) | $0 |
| 7+ Person Families | 0 (0.0%) | $0 |
| Total | 345 (100.0%) | $0 |
Family Income by Number of Earners in Stearns
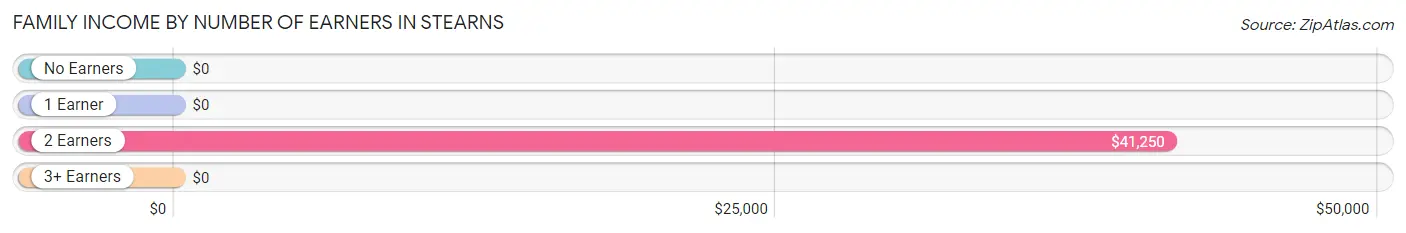
| Number of Earners | # Families | Median Income |
| No Earners | 172 (49.9%) | $0 |
| 1 Earner | 66 (19.1%) | $0 |
| 2 Earners | 96 (27.8%) | $41,250 |
| 3+ Earners | 11 (3.2%) | $0 |
| Total | 345 (100.0%) | $0 |
Household Income in Stearns
Household Income Brackets in Stearns
With 134 households falling in the category, the $15,000 to $24,999 income range is the most frequent in Stearns, accounting for 31.8% of all households.
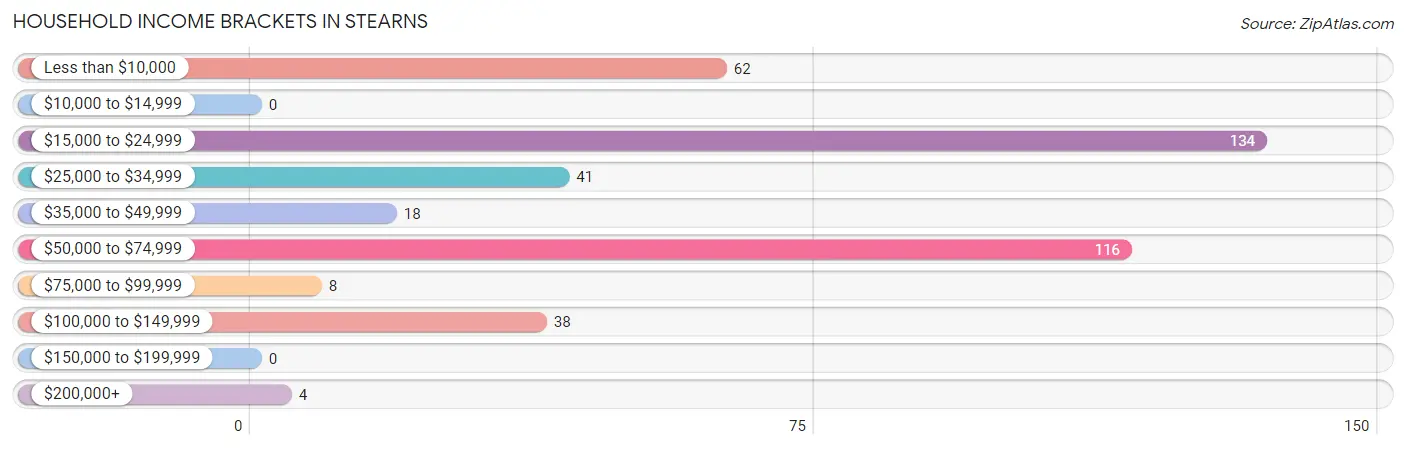
| Income Bracket | # Households | % Households |
| Less than $10,000 | 62 | 14.7% |
| $10,000 to $14,999 | 0 | 0.0% |
| $15,000 to $24,999 | 134 | 31.8% |
| $25,000 to $34,999 | 41 | 9.7% |
| $35,000 to $49,999 | 18 | 4.3% |
| $50,000 to $74,999 | 116 | 27.6% |
| $75,000 to $99,999 | 8 | 1.9% |
| $100,000 to $149,999 | 38 | 9.0% |
| $150,000 to $199,999 | 0 | 0.0% |
| $200,000+ | 4 | 1.0% |
Household Income by Householder Age in Stearns
The median household income in Stearns is $0, with the highest median household income of $41,250 found in the 25 to 44 years age bracket for the primary householder. A total of 96 households (22.8%) fall into this category.
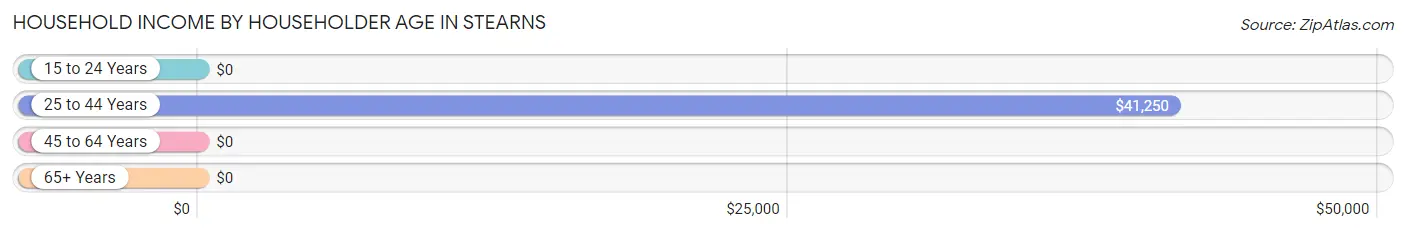
| Income Bracket | # Households | Median Income |
| 15 to 24 Years | 0 (0.0%) | $0 |
| 25 to 44 Years | 96 (22.8%) | $41,250 |
| 45 to 64 Years | 207 (49.2%) | $0 |
| 65+ Years | 118 (28.0%) | $0 |
| Total | 421 (100.0%) | $0 |
Poverty in Stearns
Income Below Poverty by Sex and Age in Stearns
With 46.0% poverty level for males and 37.3% for females among the residents of Stearns, 5 year old males and 15 year old females are the most vulnerable to poverty, with 22 males (100.0%) and 27 females (100.0%) in their respective age groups living below the poverty level.
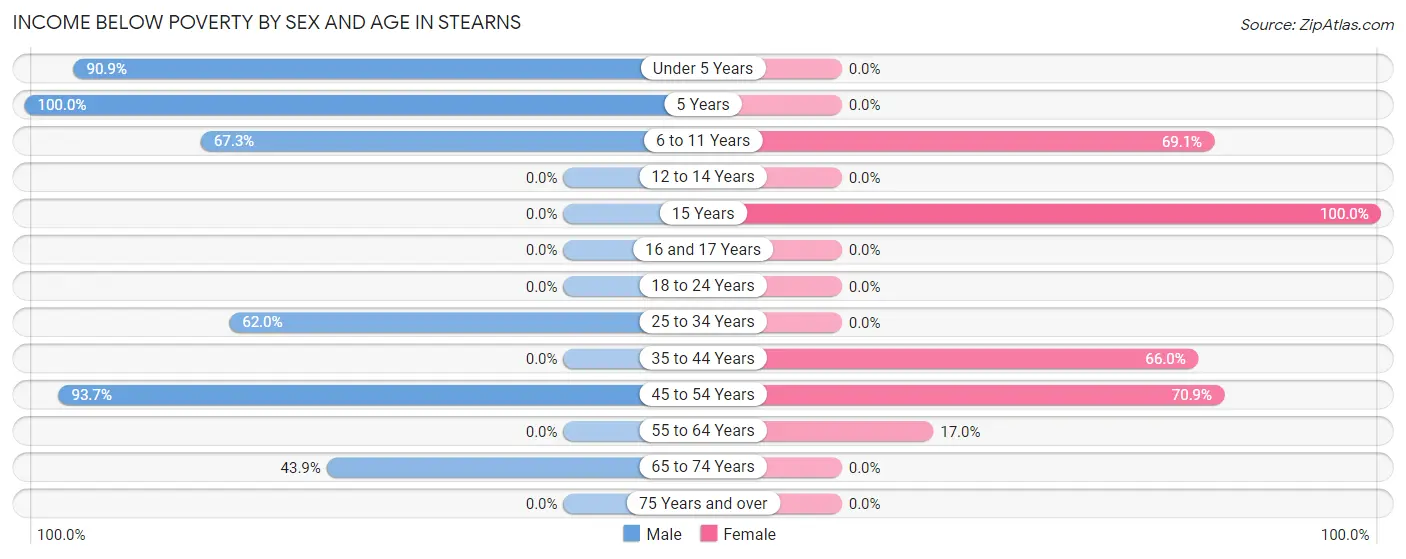
| Age Bracket | Male | Female |
| Under 5 Years | 30 (90.9%) | 0 (0.0%) |
| 5 Years | 22 (100.0%) | 0 (0.0%) |
| 6 to 11 Years | 37 (67.3%) | 67 (69.1%) |
| 12 to 14 Years | 0 (0.0%) | 0 (0.0%) |
| 15 Years | 0 (0.0%) | 27 (100.0%) |
| 16 and 17 Years | 0 (0.0%) | 0 (0.0%) |
| 18 to 24 Years | 0 (0.0%) | 0 (0.0%) |
| 25 to 34 Years | 62 (62.0%) | 0 (0.0%) |
| 35 to 44 Years | 0 (0.0%) | 35 (66.0%) |
| 45 to 54 Years | 104 (93.7%) | 78 (70.9%) |
| 55 to 64 Years | 0 (0.0%) | 18 (17.0%) |
| 65 to 74 Years | 29 (43.9%) | 0 (0.0%) |
| 75 Years and over | 0 (0.0%) | 0 (0.0%) |
| Total | 284 (46.0%) | 225 (37.3%) |
Income Above Poverty by Sex and Age in Stearns
According to the poverty statistics in Stearns, males aged 12 to 14 years and females aged 12 to 14 years are the age groups that are most secure financially, with 100.0% of males and 100.0% of females in these age groups living above the poverty line.
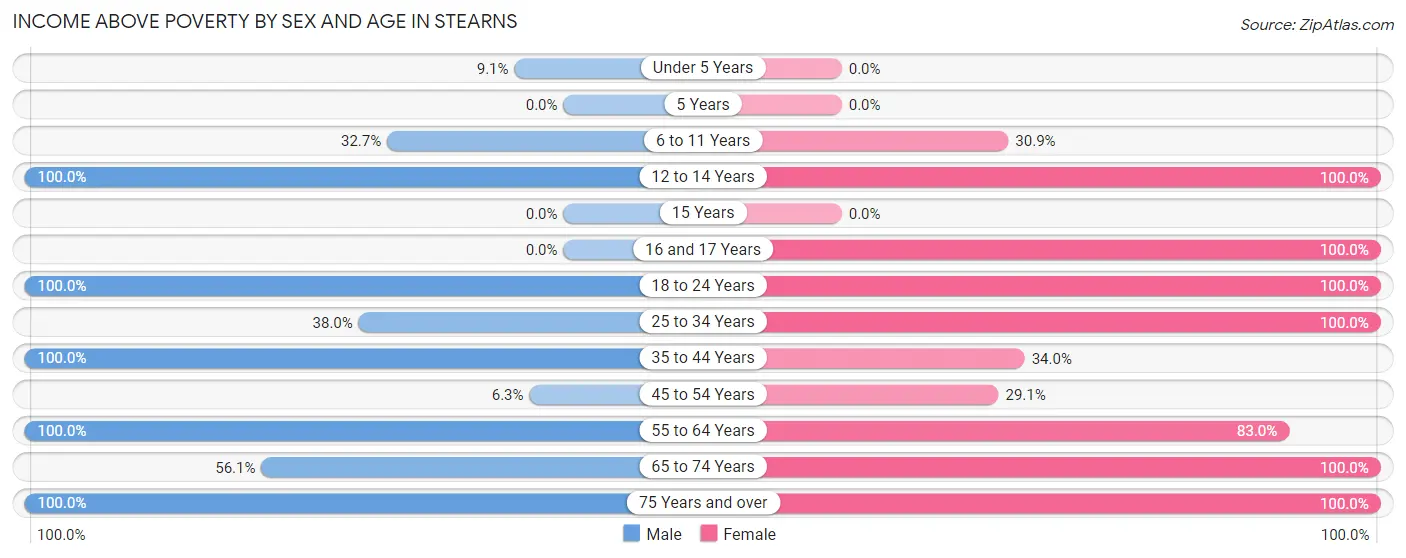
| Age Bracket | Male | Female |
| Under 5 Years | 3 (9.1%) | 0 (0.0%) |
| 5 Years | 0 (0.0%) | 0 (0.0%) |
| 6 to 11 Years | 18 (32.7%) | 30 (30.9%) |
| 12 to 14 Years | 31 (100.0%) | 20 (100.0%) |
| 15 Years | 0 (0.0%) | 0 (0.0%) |
| 16 and 17 Years | 0 (0.0%) | 6 (100.0%) |
| 18 to 24 Years | 22 (100.0%) | 14 (100.0%) |
| 25 to 34 Years | 38 (38.0%) | 88 (100.0%) |
| 35 to 44 Years | 4 (100.0%) | 18 (34.0%) |
| 45 to 54 Years | 7 (6.3%) | 32 (29.1%) |
| 55 to 64 Years | 102 (100.0%) | 88 (83.0%) |
| 65 to 74 Years | 37 (56.1%) | 30 (100.0%) |
| 75 Years and over | 72 (100.0%) | 52 (100.0%) |
| Total | 334 (54.0%) | 378 (62.7%) |
Income Below Poverty Among Married-Couple Families in Stearns
The poverty statistics for married-couple families in Stearns show that 40.3% or 119 of the total 295 families live below the poverty line. Families with 1 or 2 children have the highest poverty rate of 80.6%, comprising of 75 families. On the other hand, families with 3 or 4 children have the lowest poverty rate of 0.0%, which includes 0 families.
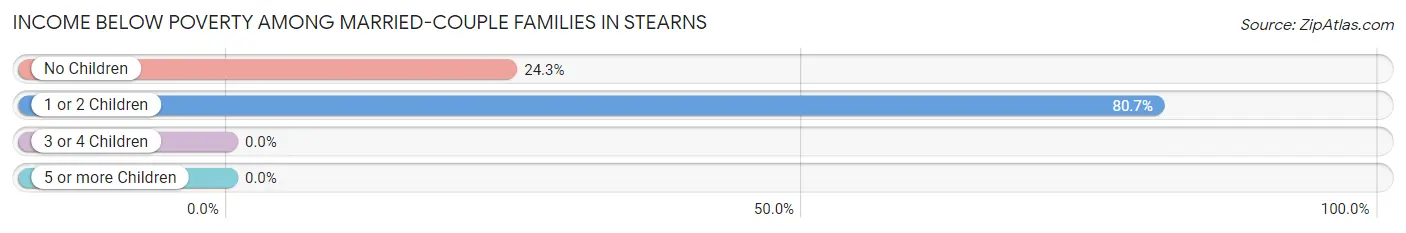
| Children | Above Poverty | Below Poverty |
| No Children | 137 (75.7%) | 44 (24.3%) |
| 1 or 2 Children | 18 (19.4%) | 75 (80.6%) |
| 3 or 4 Children | 21 (100.0%) | 0 (0.0%) |
| 5 or more Children | 0 (0.0%) | 0 (0.0%) |
| Total | 176 (59.7%) | 119 (40.3%) |
Income Below Poverty Among Single-Parent Households in Stearns
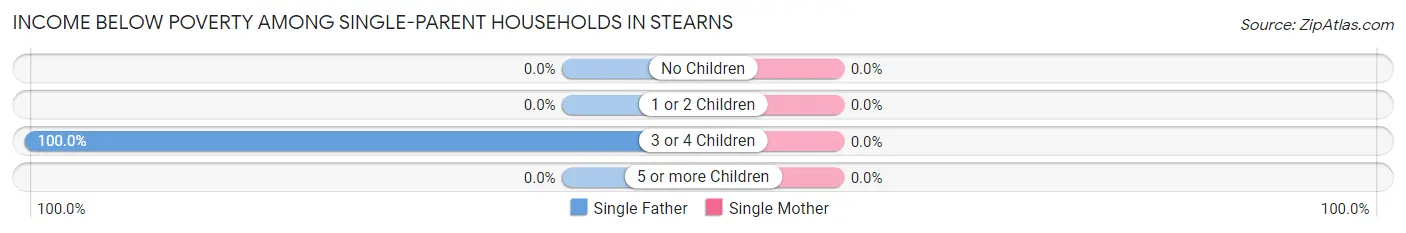
| Children | Single Father | Single Mother |
| No Children | 0 (0.0%) | 0 (0.0%) |
| 1 or 2 Children | 0 (0.0%) | 0 (0.0%) |
| 3 or 4 Children | 29 (100.0%) | 0 (0.0%) |
| 5 or more Children | 0 (0.0%) | 0 (0.0%) |
| Total | 29 (100.0%) | 0 (0.0%) |
Income Below Poverty Among Married-Couple vs Single-Parent Households in Stearns
The poverty data for Stearns shows that 119 of the married-couple family households (40.3%) and 29 of the single-parent households (58.0%) are living below the poverty level. Within the married-couple family households, those with 1 or 2 children have the highest poverty rate, with 75 households (80.6%) falling below the poverty line. Among the single-parent households, those with 3 or 4 children have the highest poverty rate, with 29 household (100.0%) living below poverty.
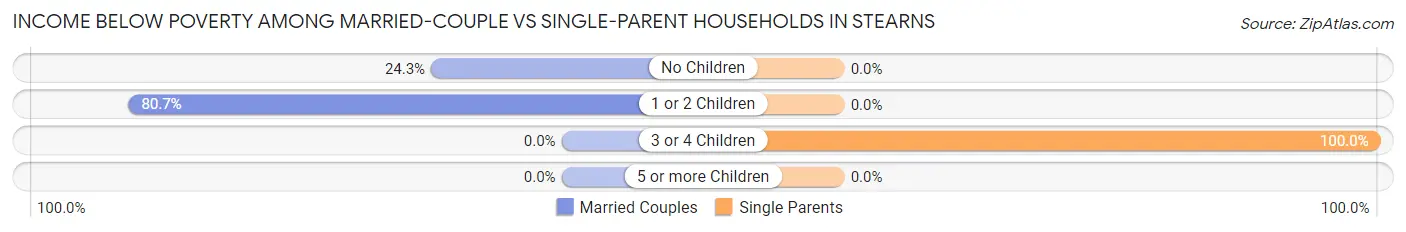
| Children | Married-Couple Families | Single-Parent Households |
| No Children | 44 (24.3%) | 0 (0.0%) |
| 1 or 2 Children | 75 (80.6%) | 0 (0.0%) |
| 3 or 4 Children | 0 (0.0%) | 29 (100.0%) |
| 5 or more Children | 0 (0.0%) | 0 (0.0%) |
| Total | 119 (40.3%) | 29 (58.0%) |
Race in Stearns
The most populous races in Stearns are White / Caucasian (1,208 | 98.7%), and Two or more Races (16 | 1.3%).
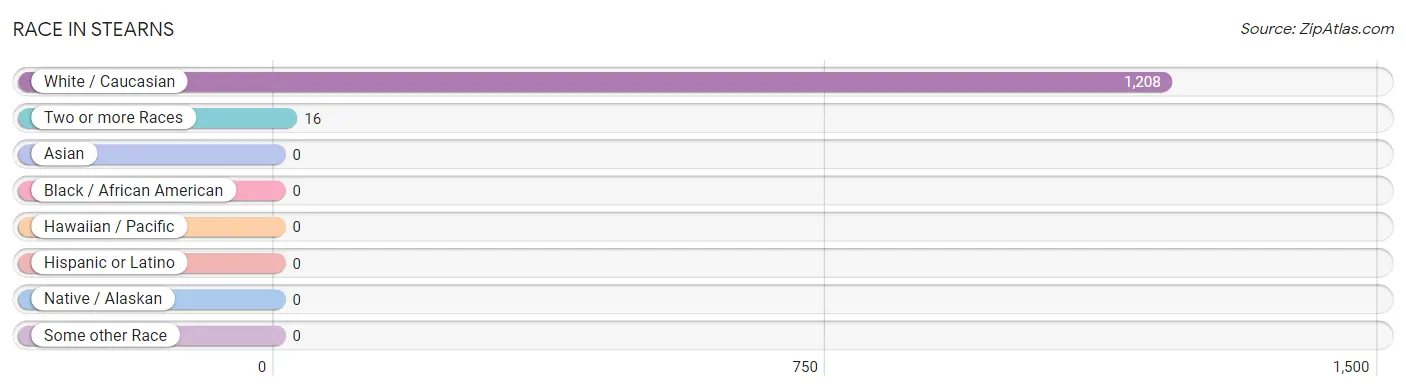
| Race | # Population | % Population |
| Asian | 0 | 0.0% |
| Black / African American | 0 | 0.0% |
| Hawaiian / Pacific | 0 | 0.0% |
| Hispanic or Latino | 0 | 0.0% |
| Native / Alaskan | 0 | 0.0% |
| White / Caucasian | 1,208 | 98.7% |
| Two or more Races | 16 | 1.3% |
| Some other Race | 0 | 0.0% |
| Total | 1,224 | 100.0% |
Ancestry in Stearns
The most populous ancestries reported in Stearns are American (145 | 11.8%), Scottish (81 | 6.6%), Scotch-Irish (75 | 6.1%), English (74 | 6.0%), and Norwegian (71 | 5.8%), together accounting for 36.4% of all Stearns residents.
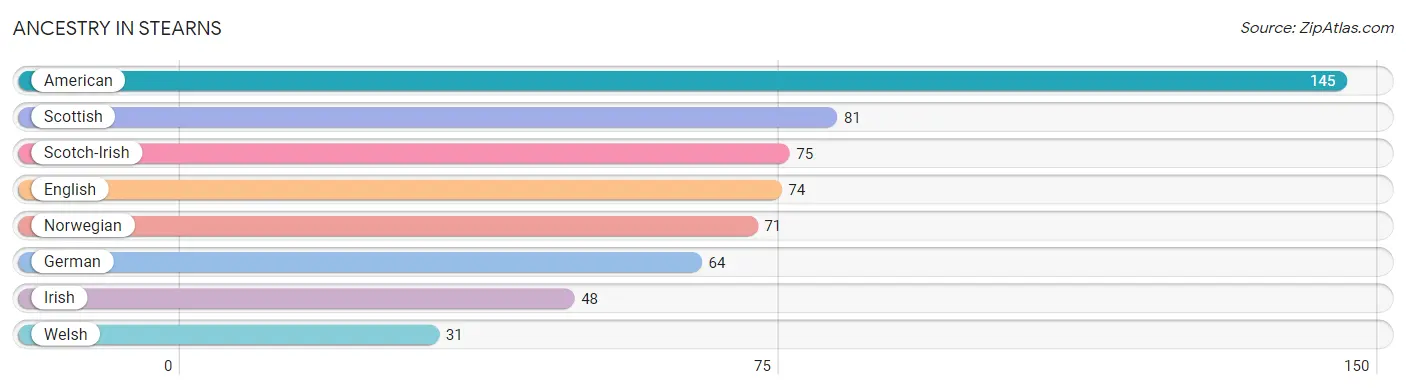
| Ancestry | # Population | % Population |
| American | 145 | 11.8% |
| English | 74 | 6.0% |
| German | 64 | 5.2% |
| Irish | 48 | 3.9% |
| Norwegian | 71 | 5.8% |
| Scotch-Irish | 75 | 6.1% |
| Scottish | 81 | 6.6% |
| Welsh | 31 | 2.5% | View All 8 Rows |
Immigrants in Stearns

| Immigration Origin | # Population | % Population | View All 0 Rows |
Sex and Age in Stearns
Sex and Age in Stearns
The most populous age groups in Stearns are 80 to 84 Years (72 | 11.6%) for men and 5 to 9 Years (83 | 13.8%) for women.
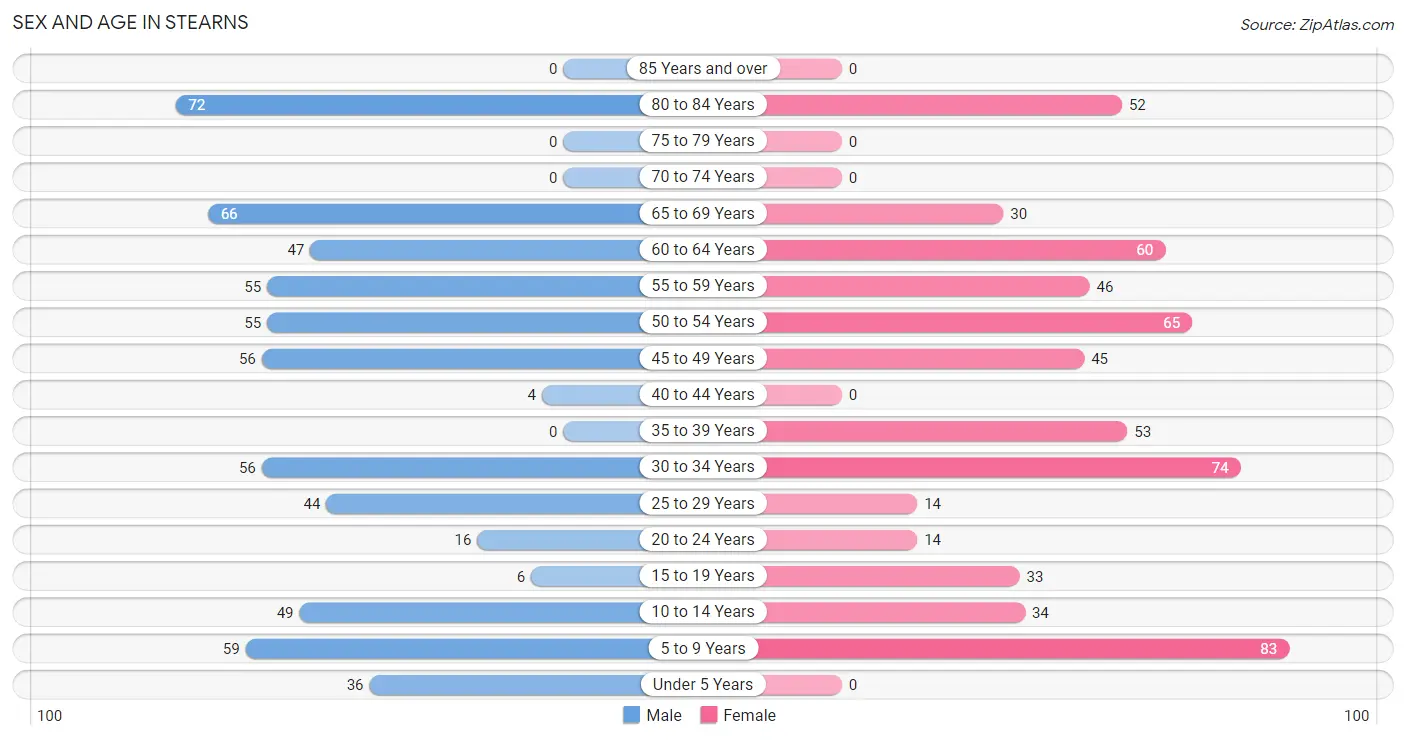
| Age Bracket | Male | Female |
| Under 5 Years | 36 (5.8%) | 0 (0.0%) |
| 5 to 9 Years | 59 (9.5%) | 83 (13.8%) |
| 10 to 14 Years | 49 (7.9%) | 34 (5.6%) |
| 15 to 19 Years | 6 (1.0%) | 33 (5.5%) |
| 20 to 24 Years | 16 (2.6%) | 14 (2.3%) |
| 25 to 29 Years | 44 (7.1%) | 14 (2.3%) |
| 30 to 34 Years | 56 (9.0%) | 74 (12.3%) |
| 35 to 39 Years | 0 (0.0%) | 53 (8.8%) |
| 40 to 44 Years | 4 (0.6%) | 0 (0.0%) |
| 45 to 49 Years | 56 (9.0%) | 45 (7.5%) |
| 50 to 54 Years | 55 (8.9%) | 65 (10.8%) |
| 55 to 59 Years | 55 (8.9%) | 46 (7.6%) |
| 60 to 64 Years | 47 (7.6%) | 60 (10.0%) |
| 65 to 69 Years | 66 (10.6%) | 30 (5.0%) |
| 70 to 74 Years | 0 (0.0%) | 0 (0.0%) |
| 75 to 79 Years | 0 (0.0%) | 0 (0.0%) |
| 80 to 84 Years | 72 (11.6%) | 52 (8.6%) |
| 85 Years and over | 0 (0.0%) | 0 (0.0%) |
| Total | 621 (100.0%) | 603 (100.0%) |
Families and Households in Stearns
Median Family Size in Stearns
The median family size in Stearns is 3.04 persons per family, with single female/mother families (21 | 6.1%) accounting for the largest median family size of 3.67 persons per family. On the other hand, married-couple families (295 | 85.5%) represent the smallest median family size with 2.94 persons per family.
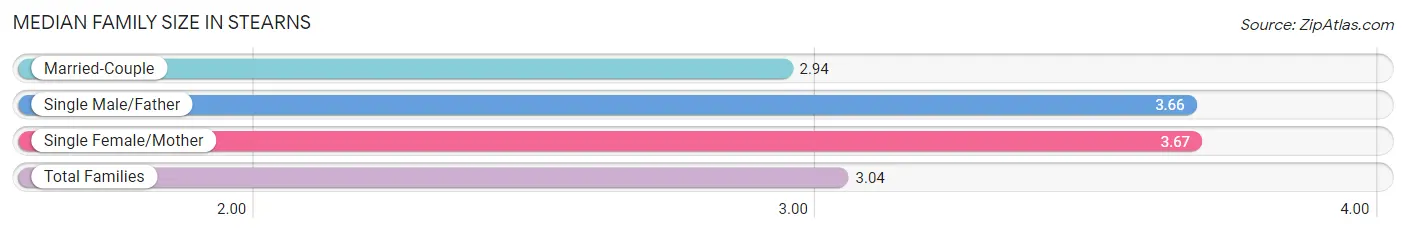
| Family Type | # Families | Family Size |
| Married-Couple | 295 (85.5%) | 2.94 |
| Single Male/Father | 29 (8.4%) | 3.66 |
| Single Female/Mother | 21 (6.1%) | 3.67 |
| Total Families | 345 (100.0%) | 3.04 |
Median Household Size in Stearns
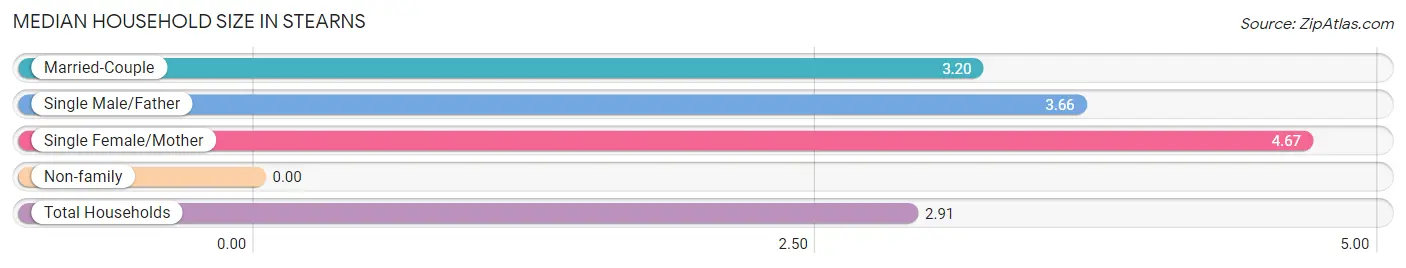
| Household Type | # Households | Household Size |
| Married-Couple | 295 (70.1%) | 3.20 |
| Single Male/Father | 29 (6.9%) | 3.66 |
| Single Female/Mother | 21 (5.0%) | 4.67 |
| Non-family | 76 (18.0%) | - |
| Total Households | 421 (100.0%) | 2.91 |
Household Size by Marriage Status in Stearns
Out of a total of 421 households in Stearns, 345 (82.0%) are family households, while 76 (18.0%) are nonfamily households. The most numerous type of family households are 2-person households, comprising 147, and the most common type of nonfamily households are 1-person households, comprising 76.
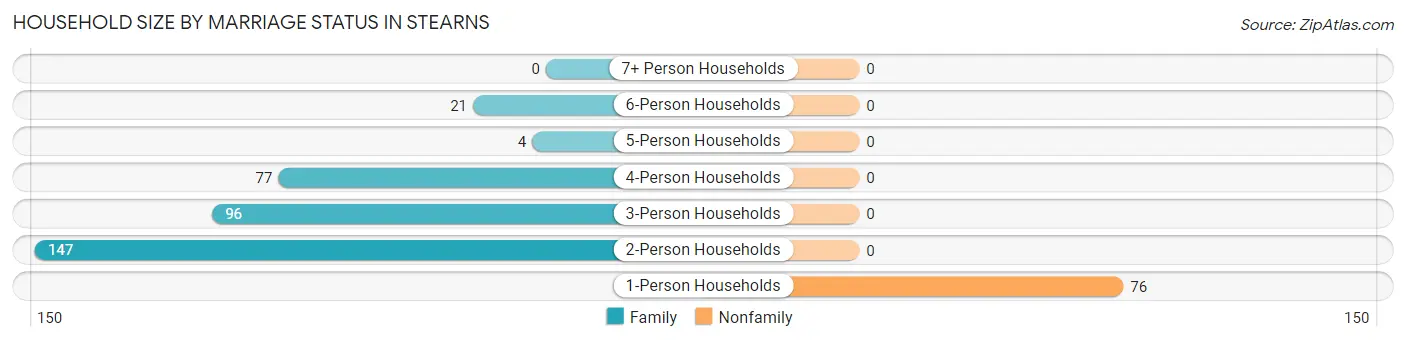
| Household Size | Family Households | Nonfamily Households |
| 1-Person Households | - | 76 (18.0%) |
| 2-Person Households | 147 (34.9%) | 0 (0.0%) |
| 3-Person Households | 96 (22.8%) | 0 (0.0%) |
| 4-Person Households | 77 (18.3%) | 0 (0.0%) |
| 5-Person Households | 4 (0.9%) | 0 (0.0%) |
| 6-Person Households | 21 (5.0%) | 0 (0.0%) |
| 7+ Person Households | 0 (0.0%) | 0 (0.0%) |
| Total | 345 (82.0%) | 76 (18.0%) |
Female Fertility in Stearns
Fertility by Age in Stearns
| Age Bracket | Women with Births | Births / 1,000 Women |
| 15 to 19 years | 0 (0.0%) | 0.0 |
| 20 to 34 years | 0 (0.0%) | 0.0 |
| 35 to 50 years | 0 (0.0%) | 0.0 |
| Total | 0 (0.0%) | 0.0 |
Fertility by Age by Marriage Status in Stearns
| Age Bracket | Married | Unmarried |
| 15 to 19 years | 0 (0.0%) | 0 (0.0%) |
| 20 to 34 years | 0 (0.0%) | 0 (0.0%) |
| 35 to 50 years | 0 (0.0%) | 0 (0.0%) |
| Total | 0 (0.0%) | 0 (0.0%) |
Fertility by Education in Stearns
| Educational Attainment | Women with Births | Births / 1,000 Women |
| Less than High School | 0 (0.0%) | 0.0 |
| High School Diploma | 0 (0.0%) | 0.0 |
| College or Associate's Degree | 0 (0.0%) | 0.0 |
| Bachelor's Degree | 0 (0.0%) | 0.0 |
| Graduate Degree | 0 (0.0%) | 0.0 |
| Total | 0 (0.0%) | 0.0 |
Fertility by Education by Marriage Status in Stearns
| Educational Attainment | Married | Unmarried |
| Less than High School | 0 (0.0%) | 0 (0.0%) |
| High School Diploma | 0 (0.0%) | 0 (0.0%) |
| College or Associate's Degree | 0 (0.0%) | 0 (0.0%) |
| Bachelor's Degree | 0 (0.0%) | 0 (0.0%) |
| Graduate Degree | 0 (0.0%) | 0 (0.0%) |
| Total | 0 (0.0%) | 0 (0.0%) |
Employment Characteristics in Stearns
Employment by Class of Employer in Stearns
Among the 369 employed individuals in Stearns, private company employees (209 | 56.6%), self-employed (not incorporated) (67 | 18.2%), and local government employees (41 | 11.1%) make up the most common classes of employment.
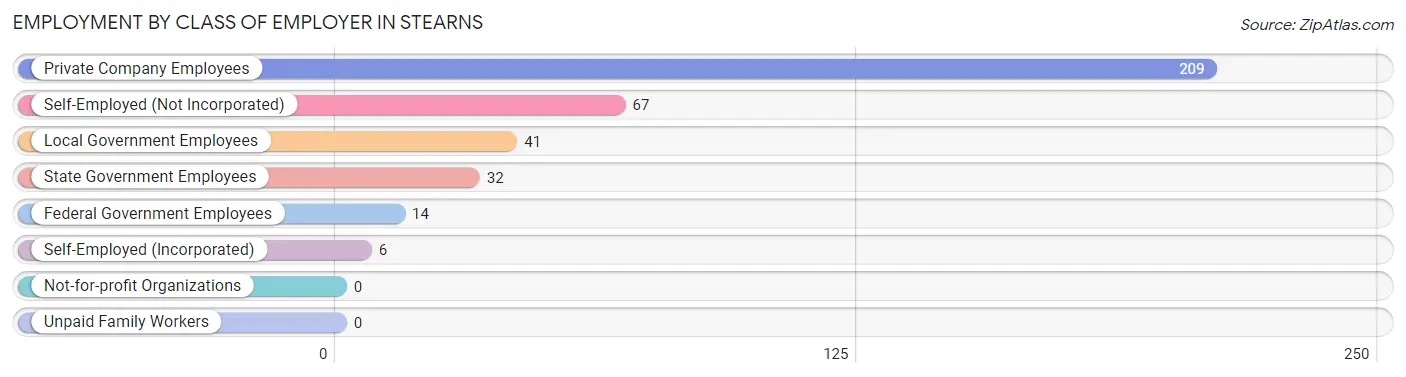
| Employer Class | # Employees | % Employees |
| Private Company Employees | 209 | 56.6% |
| Self-Employed (Incorporated) | 6 | 1.6% |
| Self-Employed (Not Incorporated) | 67 | 18.2% |
| Not-for-profit Organizations | 0 | 0.0% |
| Local Government Employees | 41 | 11.1% |
| State Government Employees | 32 | 8.7% |
| Federal Government Employees | 14 | 3.8% |
| Unpaid Family Workers | 0 | 0.0% |
| Total | 369 | 100.0% |
Employment Status by Age in Stearns
According to the labor force statistics for Stearns, out of the total population over 16 years of age (936), 40.5% or 379 individuals are in the labor force, with 2.6% or 10 of them unemployed. The age group with the highest labor force participation rate is 20 to 24 years, with 100.0% or 30 individuals in the labor force. Within the labor force, the 20 to 24 years age range has the highest percentage of unemployed individuals, with 33.3% or 10 of them being unemployed.
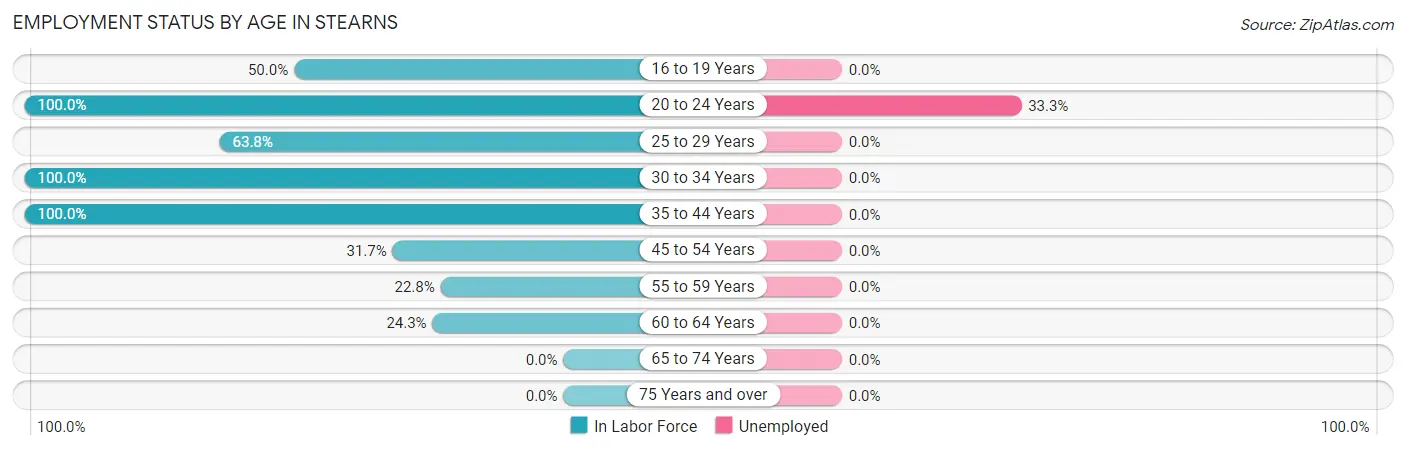
| Age Bracket | In Labor Force | Unemployed |
| 16 to 19 Years | 6 (50.0%) | 0 (0.0%) |
| 20 to 24 Years | 30 (100.0%) | 10 (33.3%) |
| 25 to 29 Years | 37 (63.8%) | 0 (0.0%) |
| 30 to 34 Years | 130 (100.0%) | 0 (0.0%) |
| 35 to 44 Years | 57 (100.0%) | 0 (0.0%) |
| 45 to 54 Years | 70 (31.7%) | 0 (0.0%) |
| 55 to 59 Years | 23 (22.8%) | 0 (0.0%) |
| 60 to 64 Years | 26 (24.3%) | 0 (0.0%) |
| 65 to 74 Years | 0 (0.0%) | 0 (0.0%) |
| 75 Years and over | 0 (0.0%) | 0 (0.0%) |
| Total | 379 (40.5%) | 10 (2.6%) |
Employment Status by Educational Attainment in Stearns
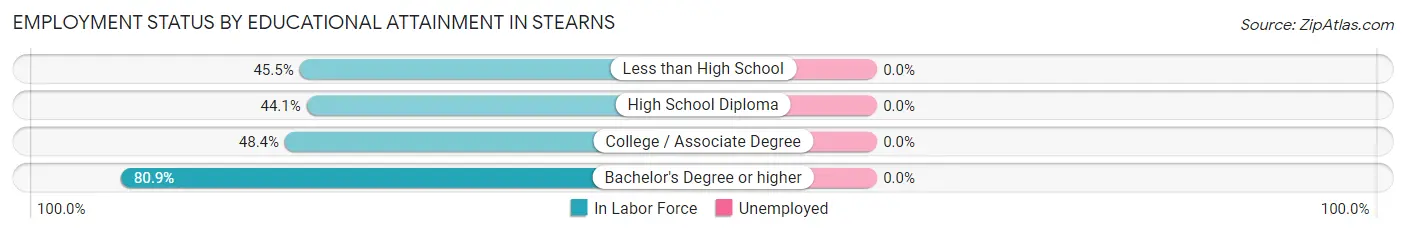
| Educational Attainment | In Labor Force | Unemployed |
| Less than High School | 56 (45.5%) | 0 (0.0%) |
| High School Diploma | 105 (44.1%) | 0 (0.0%) |
| College / Associate Degree | 106 (48.4%) | 0 (0.0%) |
| Bachelor's Degree or higher | 76 (80.9%) | 0 (0.0%) |
| Total | 343 (50.9%) | 0 (0.0%) |
Employment Occupations by Sex in Stearns
Management, Business, Science and Arts Occupations
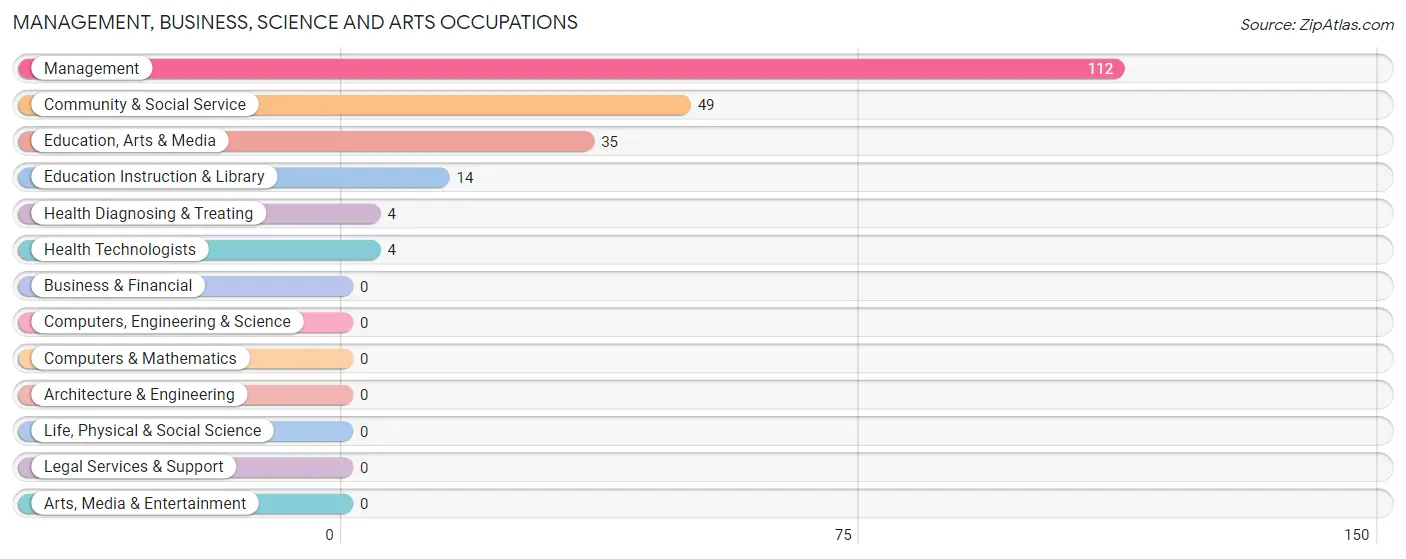
The most common Management, Business, Science and Arts occupations in Stearns are Management (112 | 30.3%), Community & Social Service (49 | 13.3%), Education, Arts & Media (35 | 9.5%), Education Instruction & Library (14 | 3.8%), and Health Diagnosing & Treating (4 | 1.1%).
Management, Business, Science and Arts Occupations by Sex
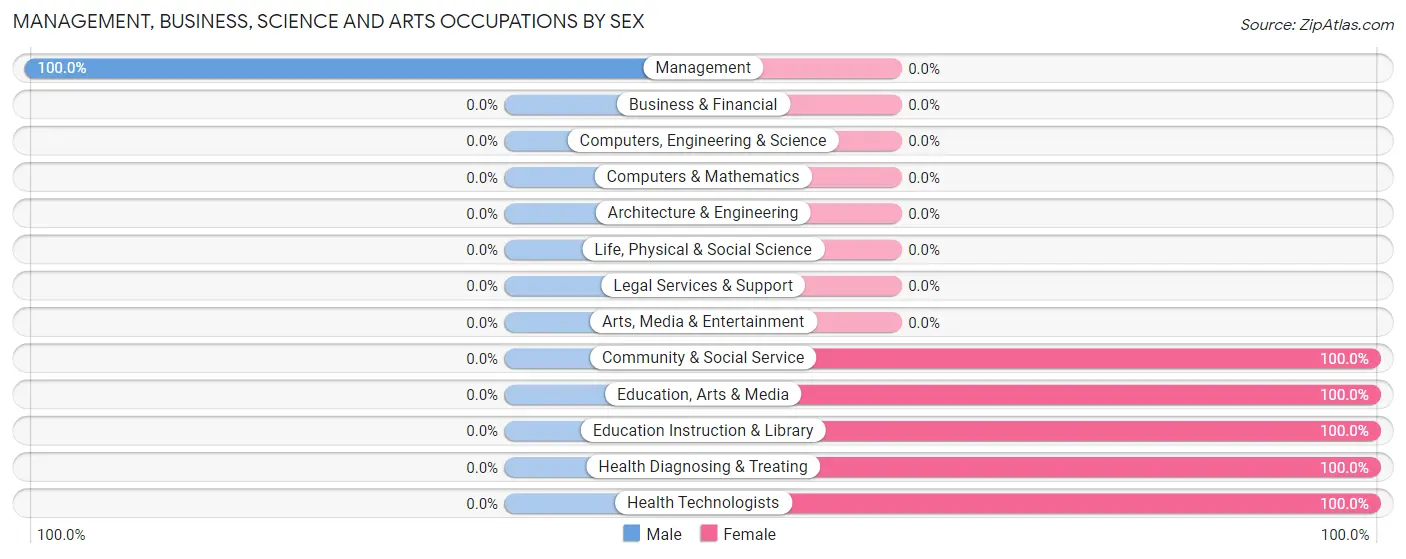
| Occupation | Male | Female |
| Management | 112 (100.0%) | 0 (0.0%) |
| Business & Financial | 0 (0.0%) | 0 (0.0%) |
| Computers, Engineering & Science | 0 (0.0%) | 0 (0.0%) |
| Computers & Mathematics | 0 (0.0%) | 0 (0.0%) |
| Architecture & Engineering | 0 (0.0%) | 0 (0.0%) |
| Life, Physical & Social Science | 0 (0.0%) | 0 (0.0%) |
| Community & Social Service | 0 (0.0%) | 49 (100.0%) |
| Education, Arts & Media | 0 (0.0%) | 35 (100.0%) |
| Legal Services & Support | 0 (0.0%) | 0 (0.0%) |
| Education Instruction & Library | 0 (0.0%) | 14 (100.0%) |
| Arts, Media & Entertainment | 0 (0.0%) | 0 (0.0%) |
| Health Diagnosing & Treating | 0 (0.0%) | 4 (100.0%) |
| Health Technologists | 0 (0.0%) | 4 (100.0%) |
| Total (Category) | 112 (67.9%) | 53 (32.1%) |
| Total (Overall) | 170 (46.1%) | 199 (53.9%) |
Services Occupations
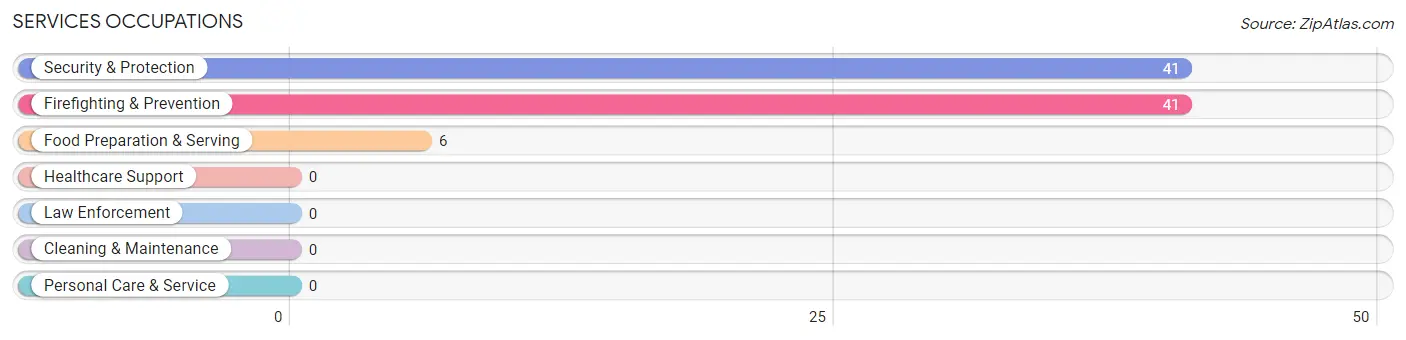
The most common Services occupations in Stearns are Security & Protection (41 | 11.1%), Firefighting & Prevention (41 | 11.1%), and Food Preparation & Serving (6 | 1.6%).
Services Occupations by Sex
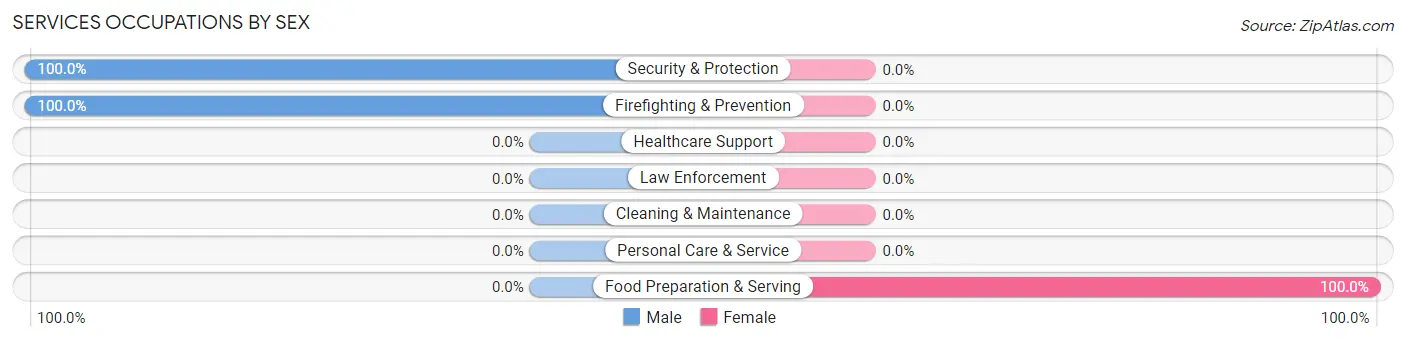
| Occupation | Male | Female |
| Healthcare Support | 0 (0.0%) | 0 (0.0%) |
| Security & Protection | 41 (100.0%) | 0 (0.0%) |
| Firefighting & Prevention | 41 (100.0%) | 0 (0.0%) |
| Law Enforcement | 0 (0.0%) | 0 (0.0%) |
| Food Preparation & Serving | 0 (0.0%) | 6 (100.0%) |
| Cleaning & Maintenance | 0 (0.0%) | 0 (0.0%) |
| Personal Care & Service | 0 (0.0%) | 0 (0.0%) |
| Total (Category) | 41 (87.2%) | 6 (12.8%) |
| Total (Overall) | 170 (46.1%) | 199 (53.9%) |
Sales and Office Occupations
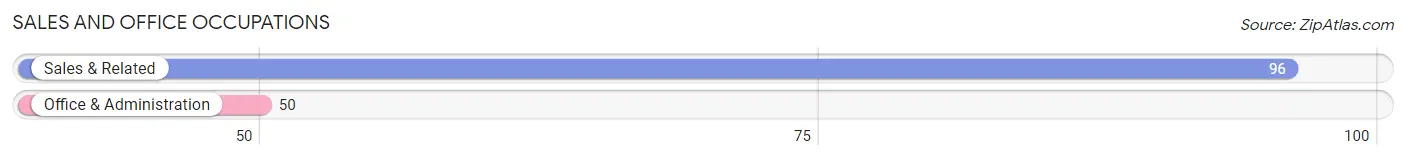
The most common Sales and Office occupations in Stearns are Sales & Related (96 | 26.0%), and Office & Administration (50 | 13.6%).
Sales and Office Occupations by Sex
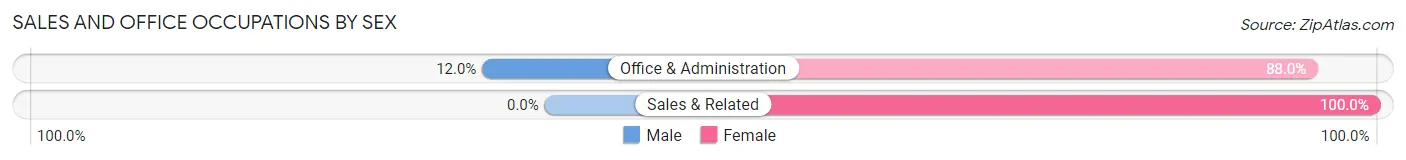
| Occupation | Male | Female |
| Sales & Related | 0 (0.0%) | 96 (100.0%) |
| Office & Administration | 6 (12.0%) | 44 (88.0%) |
| Total (Category) | 6 (4.1%) | 140 (95.9%) |
| Total (Overall) | 170 (46.1%) | 199 (53.9%) |
Natural Resources, Construction and Maintenance Occupations
The most common Natural Resources, Construction and Maintenance occupations in Stearns are , and Installation, Maintenance & Repair (7 | 1.9%).
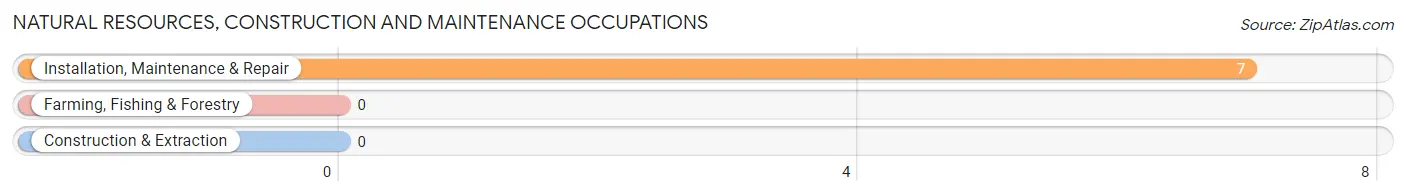
Natural Resources, Construction and Maintenance Occupations by Sex
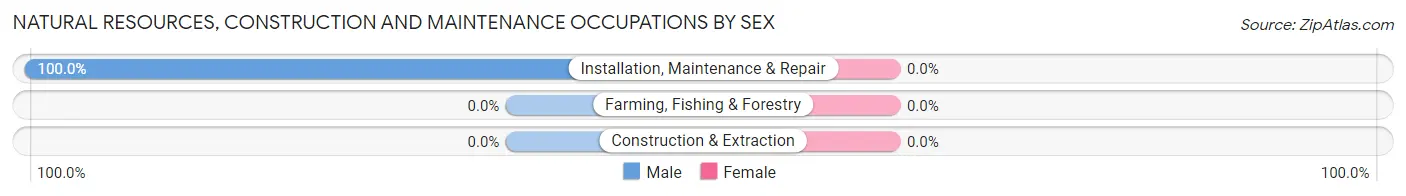
| Occupation | Male | Female |
| Farming, Fishing & Forestry | 0 (0.0%) | 0 (0.0%) |
| Construction & Extraction | 0 (0.0%) | 0 (0.0%) |
| Installation, Maintenance & Repair | 7 (100.0%) | 0 (0.0%) |
| Total (Category) | 7 (100.0%) | 0 (0.0%) |
| Total (Overall) | 170 (46.1%) | 199 (53.9%) |
Production, Transportation and Moving Occupations
The most common Production, Transportation and Moving occupations in Stearns are , and Transportation (4 | 1.1%).
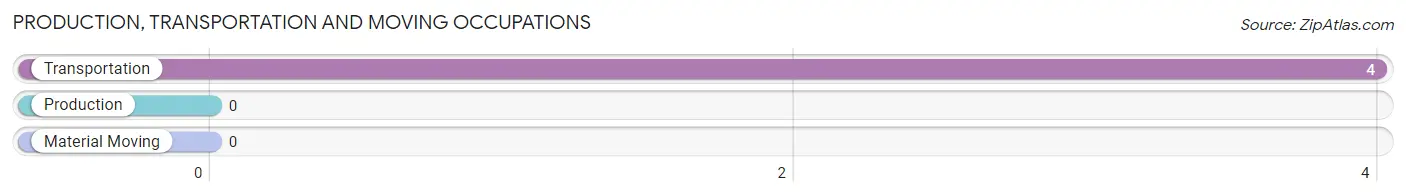
Production, Transportation and Moving Occupations by Sex
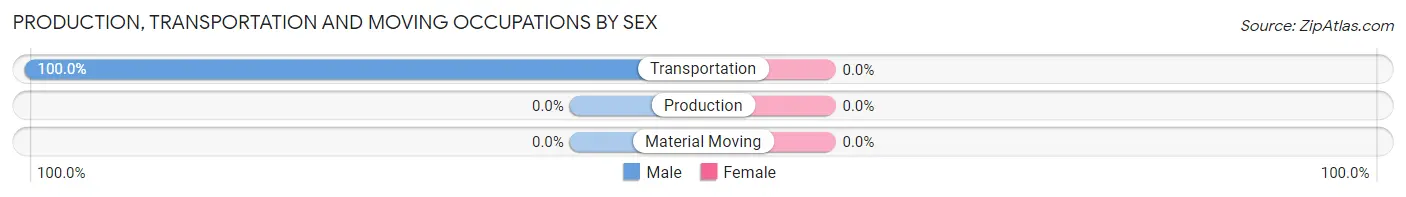
| Occupation | Male | Female |
| Production | 0 (0.0%) | 0 (0.0%) |
| Transportation | 4 (100.0%) | 0 (0.0%) |
| Material Moving | 0 (0.0%) | 0 (0.0%) |
| Total (Category) | 4 (100.0%) | 0 (0.0%) |
| Total (Overall) | 170 (46.1%) | 199 (53.9%) |
Employment Industries by Sex in Stearns
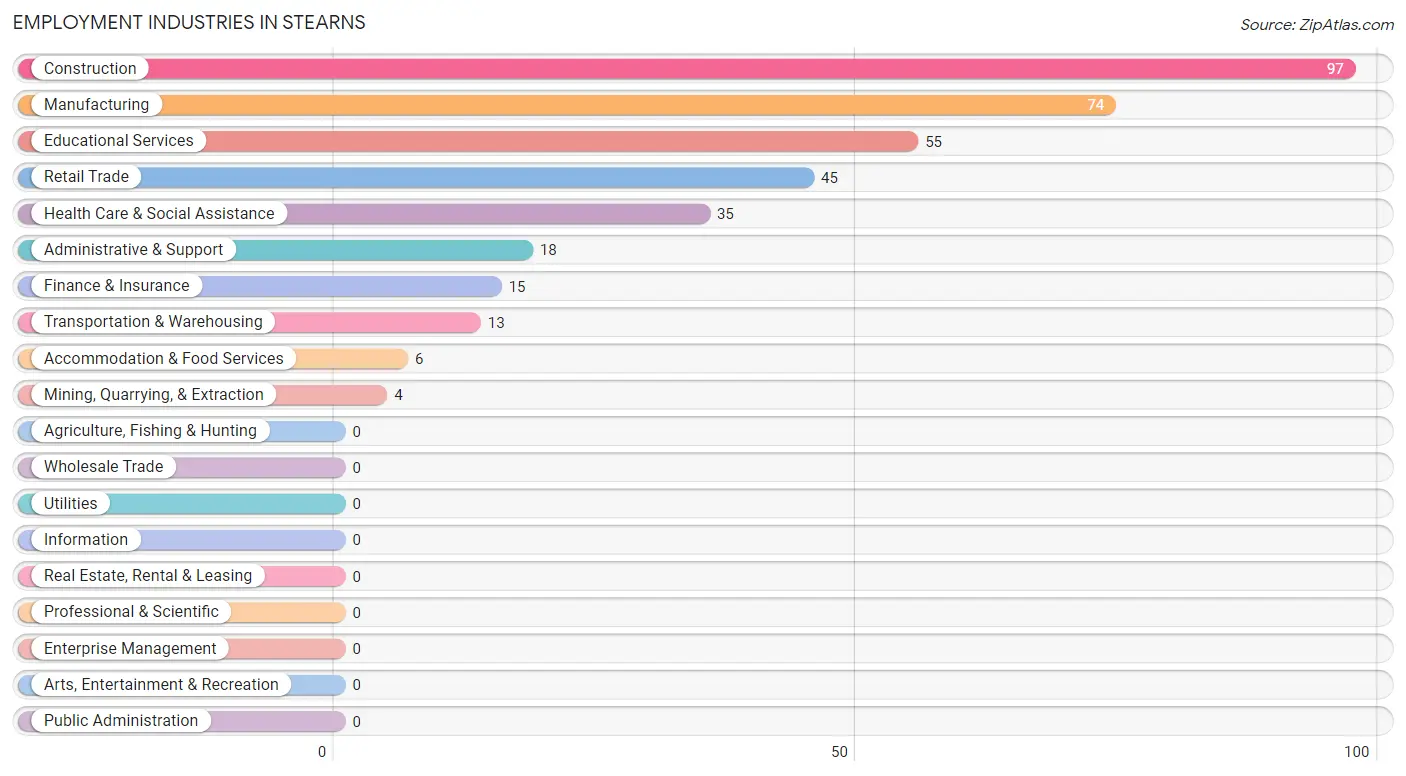
Employment Industries in Stearns
The major employment industries in Stearns include Construction (97 | 26.3%), Manufacturing (74 | 20.1%), Educational Services (55 | 14.9%), Retail Trade (45 | 12.2%), and Health Care & Social Assistance (35 | 9.5%).
Employment Industries by Sex in Stearns
The Stearns industries that see more men than women are Mining, Quarrying, & Extraction (100.0%), Finance & Insurance (100.0%), and Construction (76.3%), whereas the industries that tend to have a higher number of women are Manufacturing (100.0%), Administrative & Support (100.0%), and Health Care & Social Assistance (100.0%).
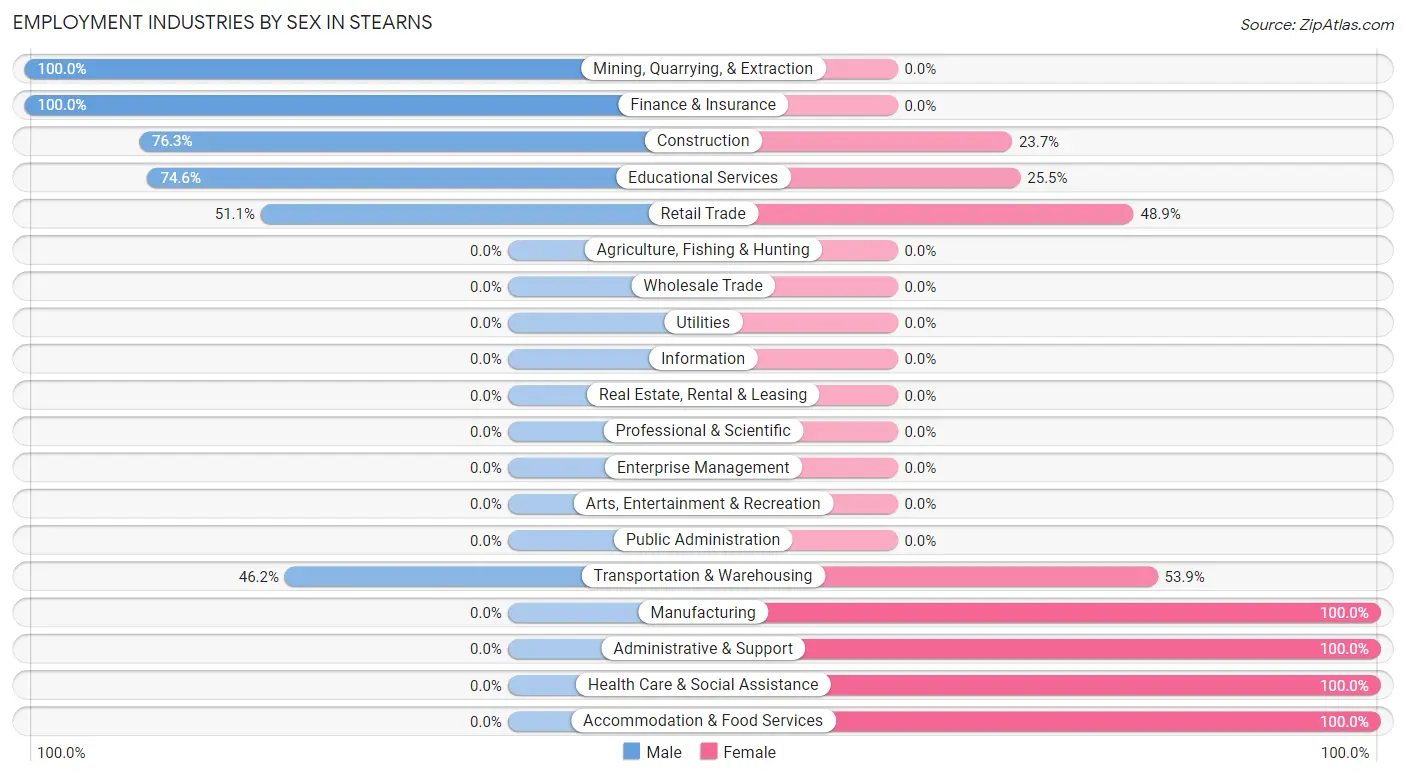
| Industry | Male | Female |
| Agriculture, Fishing & Hunting | 0 (0.0%) | 0 (0.0%) |
| Mining, Quarrying, & Extraction | 4 (100.0%) | 0 (0.0%) |
| Construction | 74 (76.3%) | 23 (23.7%) |
| Manufacturing | 0 (0.0%) | 74 (100.0%) |
| Wholesale Trade | 0 (0.0%) | 0 (0.0%) |
| Retail Trade | 23 (51.1%) | 22 (48.9%) |
| Transportation & Warehousing | 6 (46.2%) | 7 (53.8%) |
| Utilities | 0 (0.0%) | 0 (0.0%) |
| Information | 0 (0.0%) | 0 (0.0%) |
| Finance & Insurance | 15 (100.0%) | 0 (0.0%) |
| Real Estate, Rental & Leasing | 0 (0.0%) | 0 (0.0%) |
| Professional & Scientific | 0 (0.0%) | 0 (0.0%) |
| Enterprise Management | 0 (0.0%) | 0 (0.0%) |
| Administrative & Support | 0 (0.0%) | 18 (100.0%) |
| Educational Services | 41 (74.6%) | 14 (25.5%) |
| Health Care & Social Assistance | 0 (0.0%) | 35 (100.0%) |
| Arts, Entertainment & Recreation | 0 (0.0%) | 0 (0.0%) |
| Accommodation & Food Services | 0 (0.0%) | 6 (100.0%) |
| Public Administration | 0 (0.0%) | 0 (0.0%) |
| Total | 170 (46.1%) | 199 (53.9%) |
Education in Stearns
School Enrollment in Stearns
The most common levels of schooling among the 304 students in Stearns are elementary school (120 | 39.5%), high school (58 | 19.1%), and middle school (50 | 16.5%).
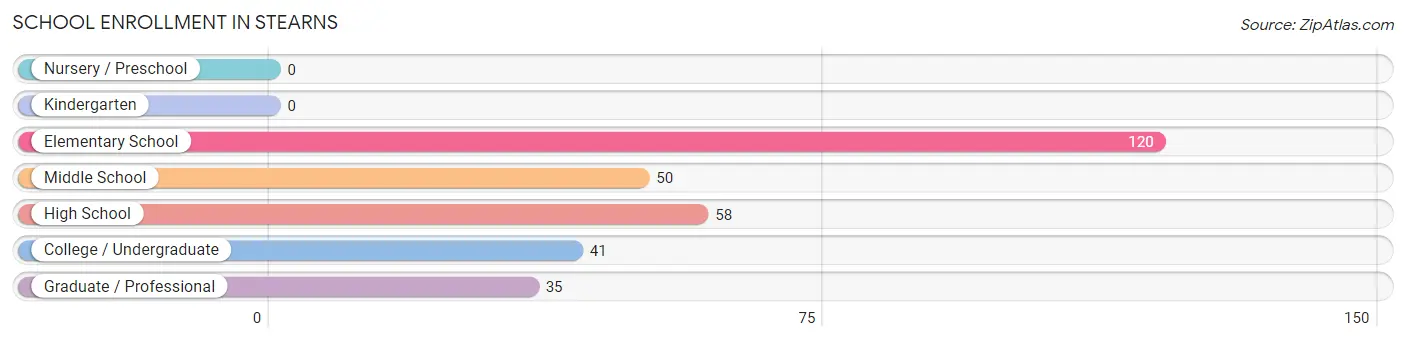
| School Level | # Students | % Students |
| Nursery / Preschool | 0 | 0.0% |
| Kindergarten | 0 | 0.0% |
| Elementary School | 120 | 39.5% |
| Middle School | 50 | 16.5% |
| High School | 58 | 19.1% |
| College / Undergraduate | 41 | 13.5% |
| Graduate / Professional | 35 | 11.5% |
| Total | 304 | 100.0% |
School Enrollment by Age by Funding Source in Stearns
Out of a total of 304 students who are enrolled in schools in Stearns, 7 (2.3%) attend a private institution, while the remaining 297 (97.7%) are enrolled in public schools. The age group of 10 to 14 year olds has the highest likelihood of being enrolled in private schools, with 7 (10.1% in the age bracket) enrolled. Conversely, the age group of 5 to 9 year old has the lowest likelihood of being enrolled in a private school, with 120 (100.0% in the age bracket) attending a public institution.
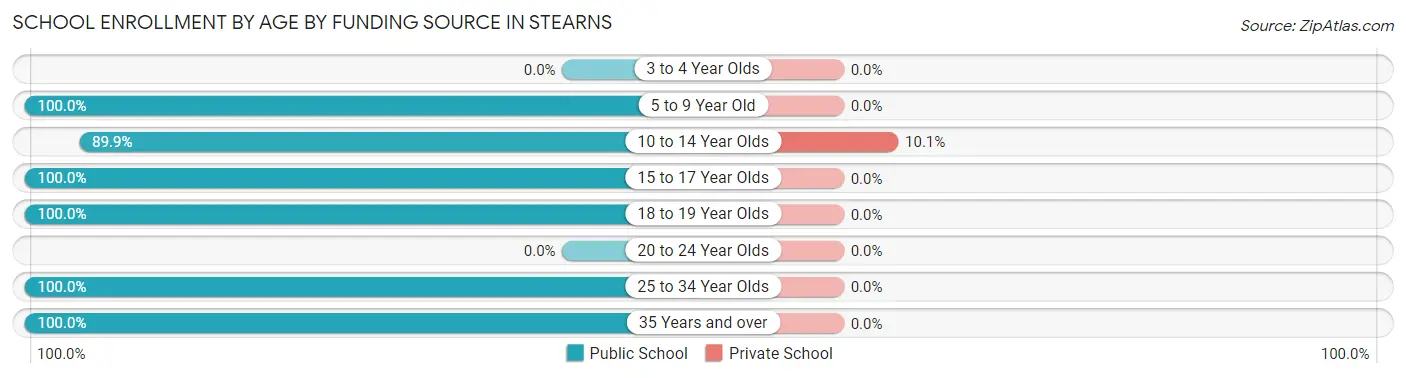
| Age Bracket | Public School | Private School |
| 3 to 4 Year Olds | 0 (0.0%) | 0 (0.0%) |
| 5 to 9 Year Old | 120 (100.0%) | 0 (0.0%) |
| 10 to 14 Year Olds | 62 (89.9%) | 7 (10.1%) |
| 15 to 17 Year Olds | 33 (100.0%) | 0 (0.0%) |
| 18 to 19 Year Olds | 6 (100.0%) | 0 (0.0%) |
| 20 to 24 Year Olds | 0 (0.0%) | 0 (0.0%) |
| 25 to 34 Year Olds | 41 (100.0%) | 0 (0.0%) |
| 35 Years and over | 35 (100.0%) | 0 (0.0%) |
| Total | 297 (97.7%) | 7 (2.3%) |
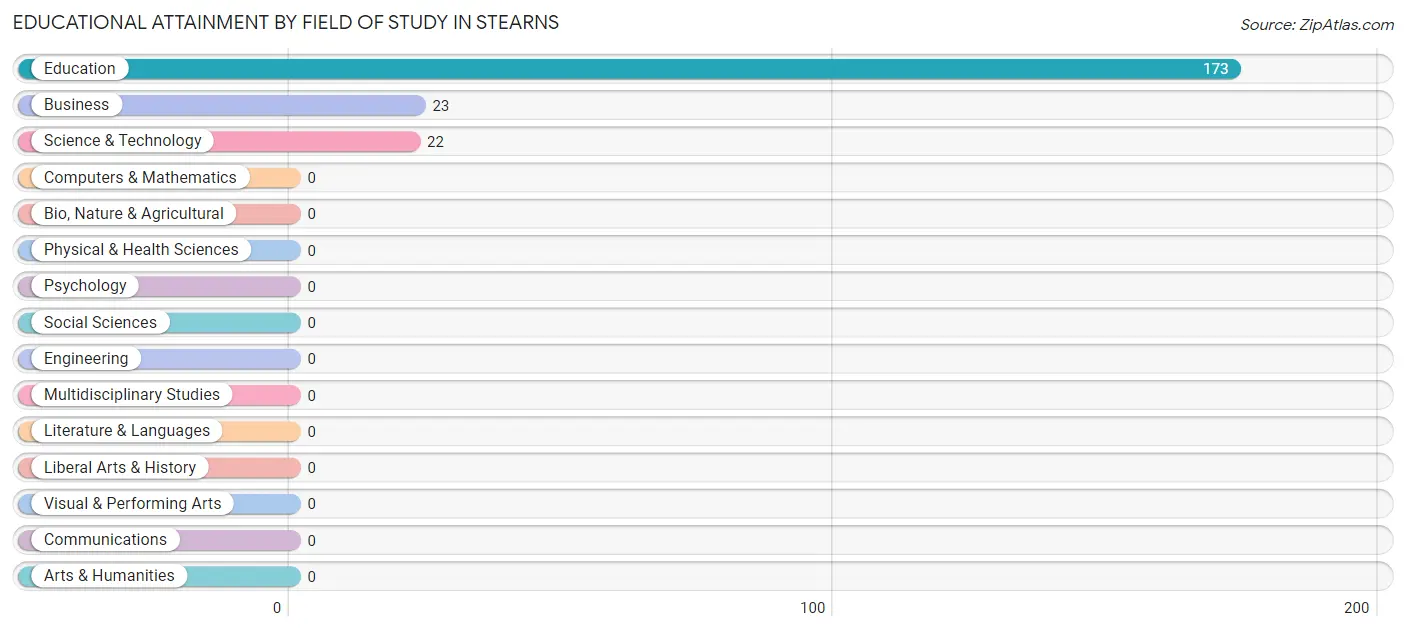
Educational Attainment by Field of Study in Stearns
Education (173 | 79.4%), business (23 | 10.5%), and science & technology (22 | 10.1%) are the most common fields of study among 218 individuals in Stearns who have obtained a bachelor's degree or higher.
| Field of Study | # Graduates | % Graduates |
| Computers & Mathematics | 0 | 0.0% |
| Bio, Nature & Agricultural | 0 | 0.0% |
| Physical & Health Sciences | 0 | 0.0% |
| Psychology | 0 | 0.0% |
| Social Sciences | 0 | 0.0% |
| Engineering | 0 | 0.0% |
| Multidisciplinary Studies | 0 | 0.0% |
| Science & Technology | 22 | 10.1% |
| Business | 23 | 10.5% |
| Education | 173 | 79.4% |
| Literature & Languages | 0 | 0.0% |
| Liberal Arts & History | 0 | 0.0% |
| Visual & Performing Arts | 0 | 0.0% |
| Communications | 0 | 0.0% |
| Arts & Humanities | 0 | 0.0% |
| Total | 218 | 100.0% |
Transportation & Commute in Stearns
Vehicle Availability by Sex in Stearns
The most prevalent vehicle ownership categories in Stearns are males with 2 vehicles (107, accounting for 62.9%) and females with 2 vehicles (20, making up 53.8%).
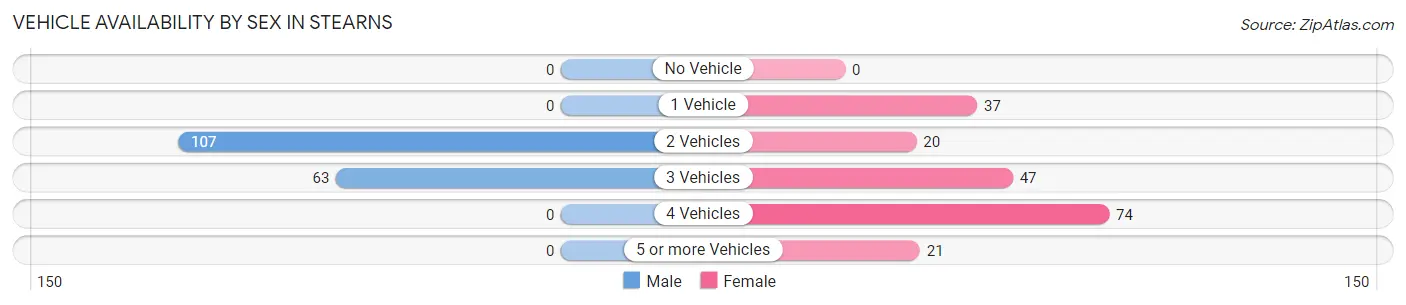
| Vehicles Available | Male | Female |
| No Vehicle | 0 (0.0%) | 0 (0.0%) |
| 1 Vehicle | 0 (0.0%) | 37 (18.6%) |
| 2 Vehicles | 107 (62.9%) | 20 (10.1%) |
| 3 Vehicles | 63 (37.1%) | 47 (23.6%) |
| 4 Vehicles | 0 (0.0%) | 74 (37.2%) |
| 5 or more Vehicles | 0 (0.0%) | 21 (10.5%) |
| Total | 170 (100.0%) | 199 (100.0%) |
Commute Time in Stearns
The most frequently occuring commute durations in Stearns are 40 to 44 minutes (97 commuters, 31.0%), 20 to 24 minutes (59 commuters, 18.9%), and 45 to 59 minutes (46 commuters, 14.7%).
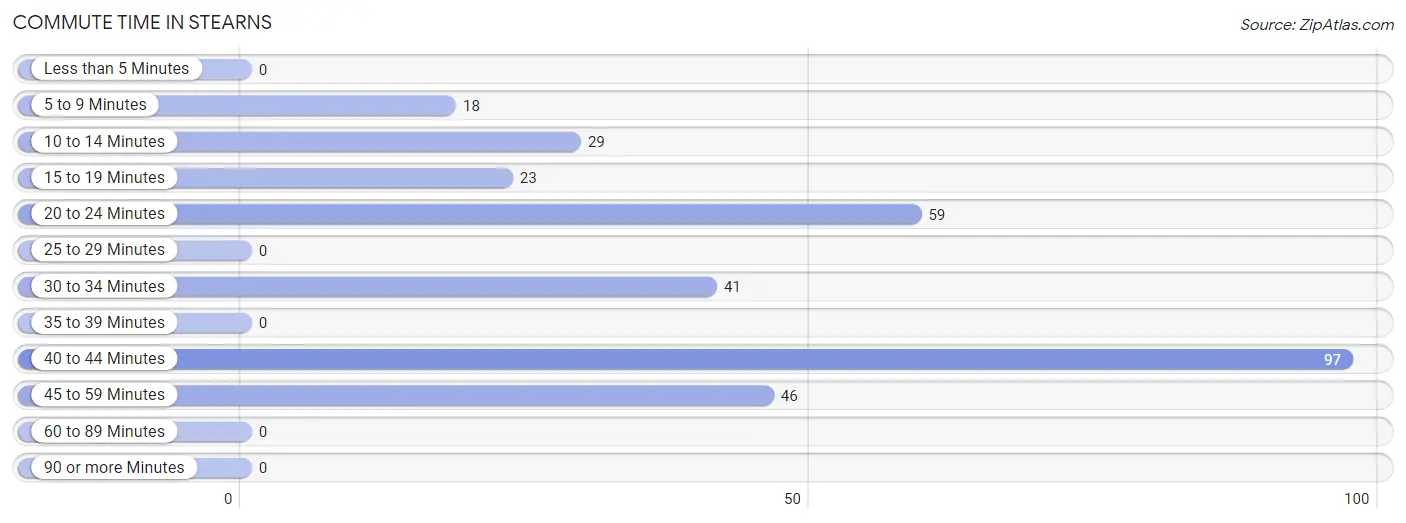
| Commute Time | # Commuters | % Commuters |
| Less than 5 Minutes | 0 | 0.0% |
| 5 to 9 Minutes | 18 | 5.8% |
| 10 to 14 Minutes | 29 | 9.3% |
| 15 to 19 Minutes | 23 | 7.3% |
| 20 to 24 Minutes | 59 | 18.9% |
| 25 to 29 Minutes | 0 | 0.0% |
| 30 to 34 Minutes | 41 | 13.1% |
| 35 to 39 Minutes | 0 | 0.0% |
| 40 to 44 Minutes | 97 | 31.0% |
| 45 to 59 Minutes | 46 | 14.7% |
| 60 to 89 Minutes | 0 | 0.0% |
| 90 or more Minutes | 0 | 0.0% |
Commute Time by Sex in Stearns
The most common commute times in Stearns are 30 to 34 minutes (41 commuters, 36.0%) for males and 40 to 44 minutes (97 commuters, 48.7%) for females.
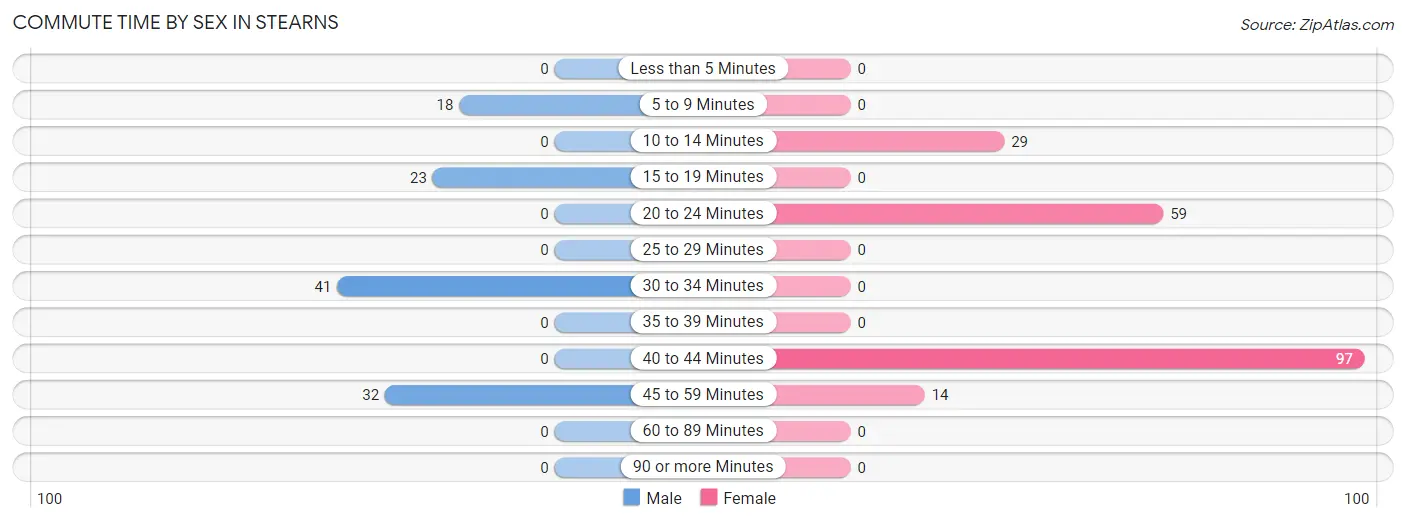
| Commute Time | Male | Female |
| Less than 5 Minutes | 0 (0.0%) | 0 (0.0%) |
| 5 to 9 Minutes | 18 (15.8%) | 0 (0.0%) |
| 10 to 14 Minutes | 0 (0.0%) | 29 (14.6%) |
| 15 to 19 Minutes | 23 (20.2%) | 0 (0.0%) |
| 20 to 24 Minutes | 0 (0.0%) | 59 (29.6%) |
| 25 to 29 Minutes | 0 (0.0%) | 0 (0.0%) |
| 30 to 34 Minutes | 41 (36.0%) | 0 (0.0%) |
| 35 to 39 Minutes | 0 (0.0%) | 0 (0.0%) |
| 40 to 44 Minutes | 0 (0.0%) | 97 (48.7%) |
| 45 to 59 Minutes | 32 (28.1%) | 14 (7.0%) |
| 60 to 89 Minutes | 0 (0.0%) | 0 (0.0%) |
| 90 or more Minutes | 0 (0.0%) | 0 (0.0%) |
Time of Departure to Work by Sex in Stearns
The most frequent times of departure to work in Stearns are 8:00 AM to 8:29 AM (41, 36.0%) for males and 12:00 AM to 4:59 AM (74, 37.2%) for females.
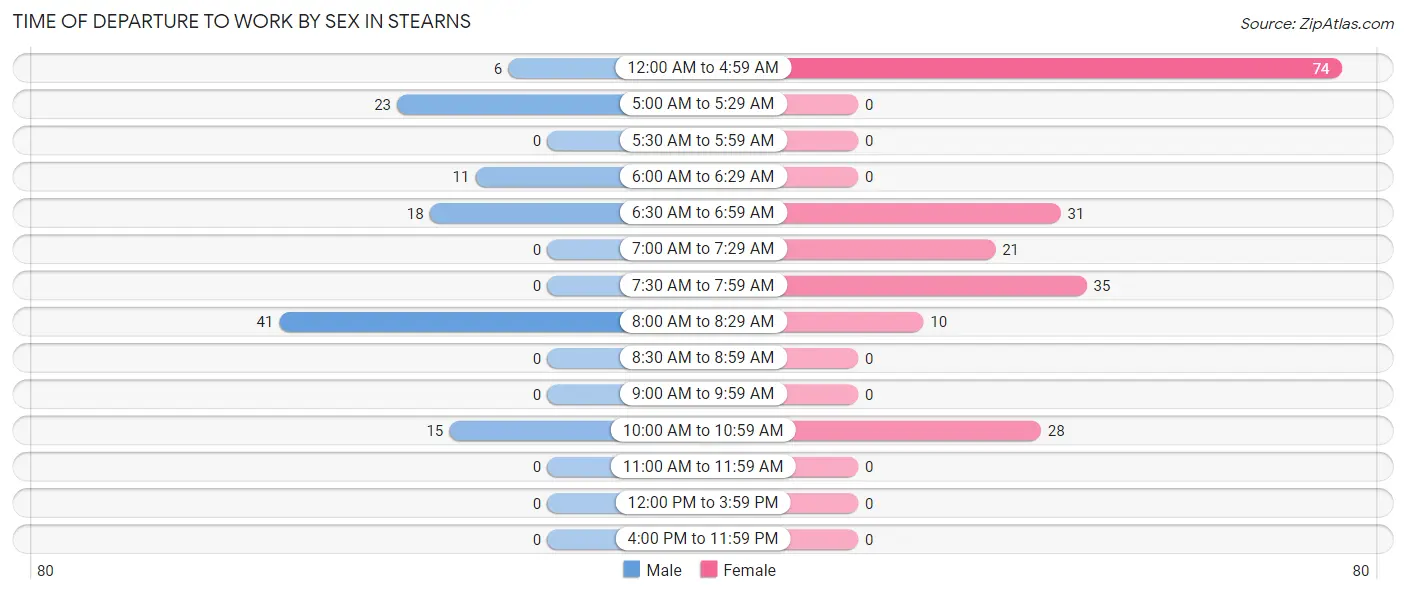
| Time of Departure | Male | Female |
| 12:00 AM to 4:59 AM | 6 (5.3%) | 74 (37.2%) |
| 5:00 AM to 5:29 AM | 23 (20.2%) | 0 (0.0%) |
| 5:30 AM to 5:59 AM | 0 (0.0%) | 0 (0.0%) |
| 6:00 AM to 6:29 AM | 11 (9.7%) | 0 (0.0%) |
| 6:30 AM to 6:59 AM | 18 (15.8%) | 31 (15.6%) |
| 7:00 AM to 7:29 AM | 0 (0.0%) | 21 (10.5%) |
| 7:30 AM to 7:59 AM | 0 (0.0%) | 35 (17.6%) |
| 8:00 AM to 8:29 AM | 41 (36.0%) | 10 (5.0%) |
| 8:30 AM to 8:59 AM | 0 (0.0%) | 0 (0.0%) |
| 9:00 AM to 9:59 AM | 0 (0.0%) | 0 (0.0%) |
| 10:00 AM to 10:59 AM | 15 (13.2%) | 28 (14.1%) |
| 11:00 AM to 11:59 AM | 0 (0.0%) | 0 (0.0%) |
| 12:00 PM to 3:59 PM | 0 (0.0%) | 0 (0.0%) |
| 4:00 PM to 11:59 PM | 0 (0.0%) | 0 (0.0%) |
| Total | 114 (100.0%) | 199 (100.0%) |
Housing Occupancy in Stearns
Occupancy by Ownership in Stearns
Of the total 421 dwellings in Stearns, owner-occupied units account for 362 (86.0%), while renter-occupied units make up 59 (14.0%).
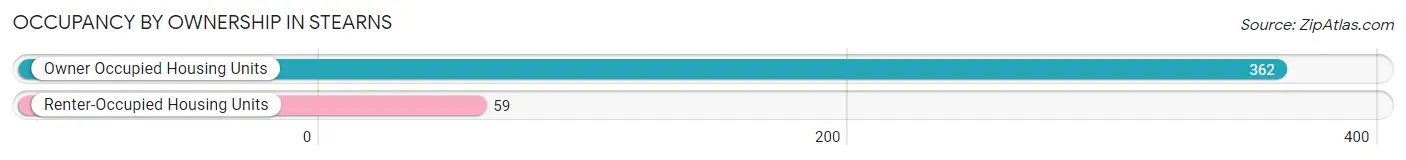
| Occupancy | # Housing Units | % Housing Units |
| Owner Occupied Housing Units | 362 | 86.0% |
| Renter-Occupied Housing Units | 59 | 14.0% |
| Total Occupied Housing Units | 421 | 100.0% |
Occupancy by Household Size in Stearns
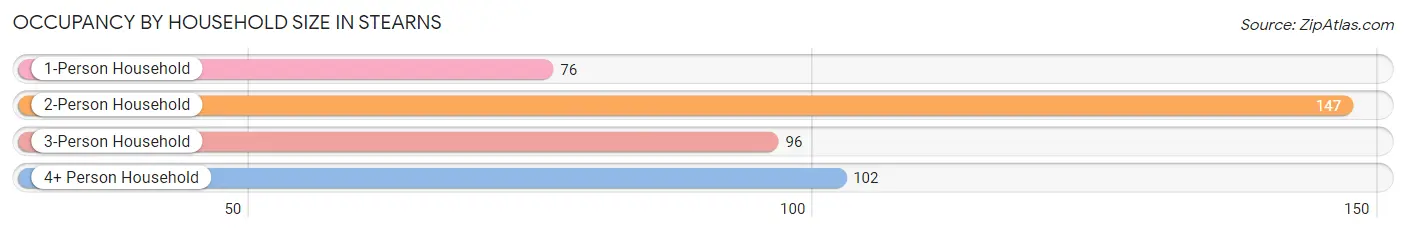
| Household Size | # Housing Units | % Housing Units |
| 1-Person Household | 76 | 18.0% |
| 2-Person Household | 147 | 34.9% |
| 3-Person Household | 96 | 22.8% |
| 4+ Person Household | 102 | 24.2% |
| Total Housing Units | 421 | 100.0% |
Occupancy by Ownership by Household Size in Stearns
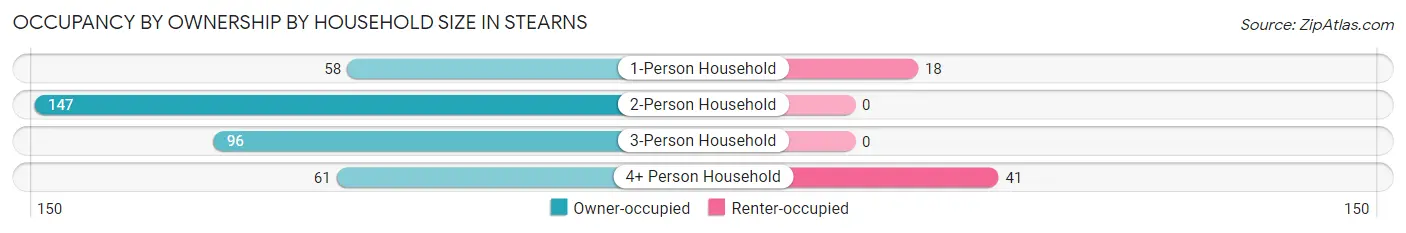
| Household Size | Owner-occupied | Renter-occupied |
| 1-Person Household | 58 (76.3%) | 18 (23.7%) |
| 2-Person Household | 147 (100.0%) | 0 (0.0%) |
| 3-Person Household | 96 (100.0%) | 0 (0.0%) |
| 4+ Person Household | 61 (59.8%) | 41 (40.2%) |
| Total Housing Units | 362 (86.0%) | 59 (14.0%) |
Occupancy by Educational Attainment in Stearns
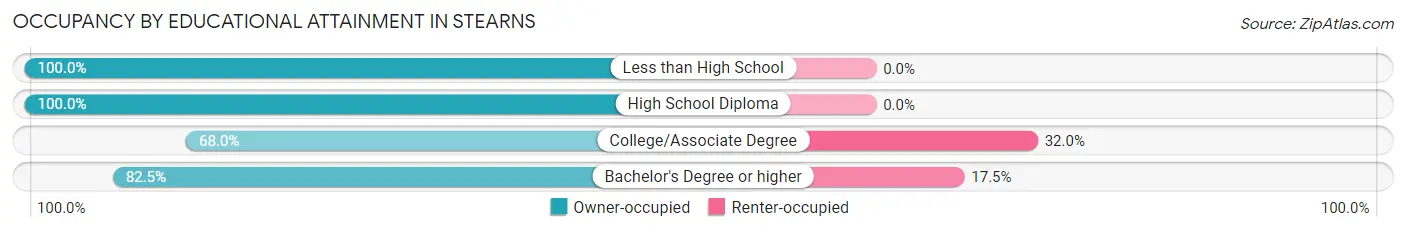
| Household Size | Owner-occupied | Renter-occupied |
| Less than High School | 38 (100.0%) | 0 (0.0%) |
| High School Diploma | 152 (100.0%) | 0 (0.0%) |
| College/Associate Degree | 87 (68.0%) | 41 (32.0%) |
| Bachelor's Degree or higher | 85 (82.5%) | 18 (17.5%) |
Occupancy by Age of Householder in Stearns
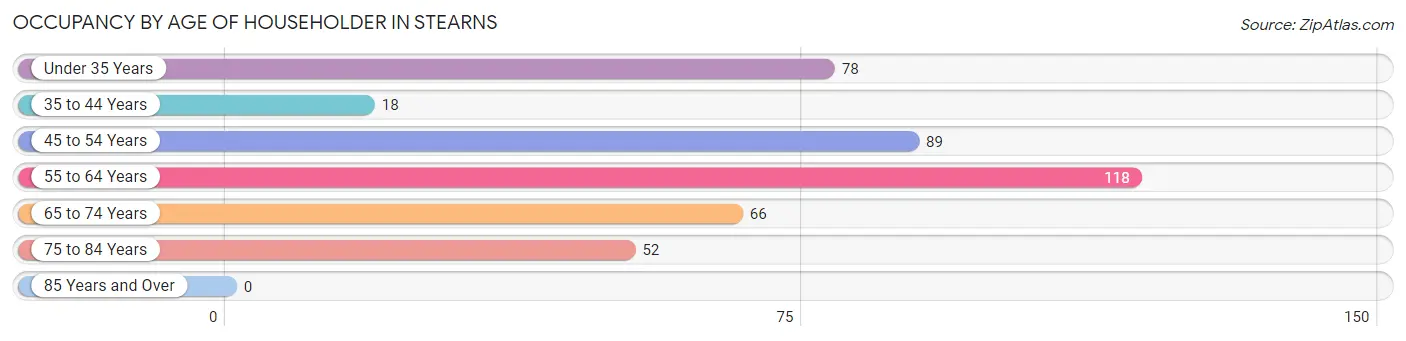
| Age Bracket | # Households | % Households |
| Under 35 Years | 78 | 18.5% |
| 35 to 44 Years | 18 | 4.3% |
| 45 to 54 Years | 89 | 21.1% |
| 55 to 64 Years | 118 | 28.0% |
| 65 to 74 Years | 66 | 15.7% |
| 75 to 84 Years | 52 | 12.3% |
| 85 Years and Over | 0 | 0.0% |
| Total | 421 | 100.0% |
Housing Finances in Stearns
Median Income by Occupancy in Stearns
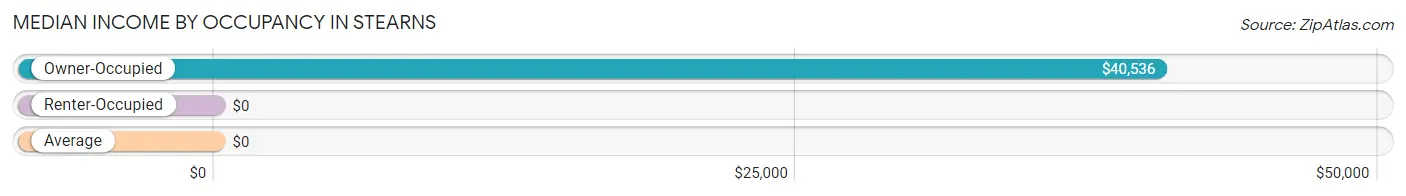
| Occupancy Type | # Households | Median Income |
| Owner-Occupied | 362 (86.0%) | $40,536 |
| Renter-Occupied | 59 (14.0%) | $0 |
| Average | 421 (100.0%) | $0 |
Occupancy by Householder Income Bracket in Stearns
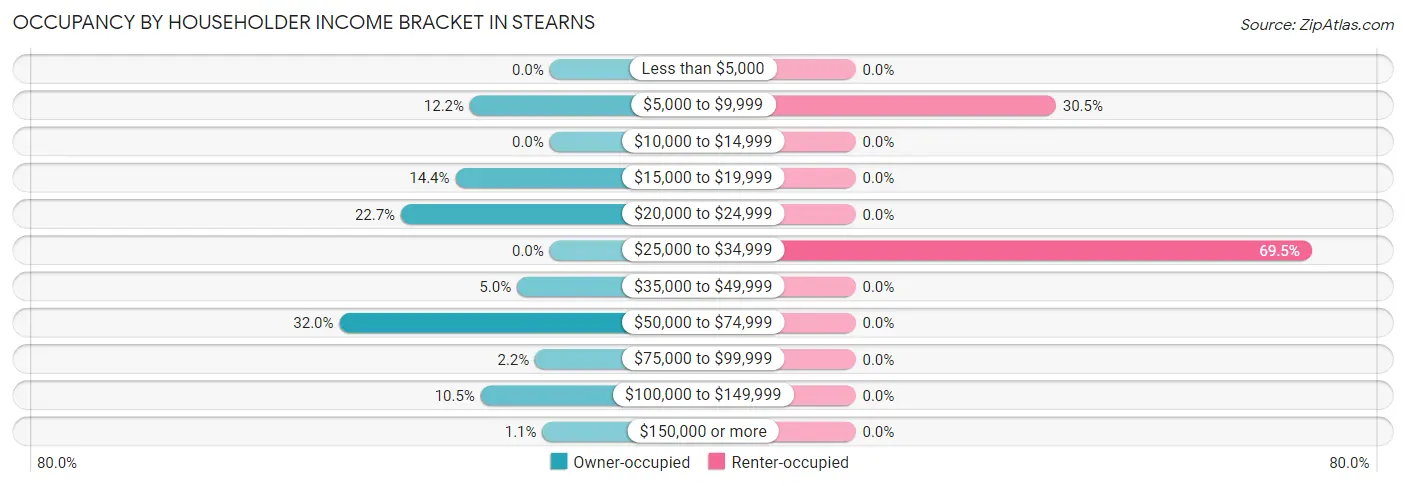
| Income Bracket | Owner-occupied | Renter-occupied |
| Less than $5,000 | 0 (0.0%) | 0 (0.0%) |
| $5,000 to $9,999 | 44 (12.1%) | 18 (30.5%) |
| $10,000 to $14,999 | 0 (0.0%) | 0 (0.0%) |
| $15,000 to $19,999 | 52 (14.4%) | 0 (0.0%) |
| $20,000 to $24,999 | 82 (22.7%) | 0 (0.0%) |
| $25,000 to $34,999 | 0 (0.0%) | 41 (69.5%) |
| $35,000 to $49,999 | 18 (5.0%) | 0 (0.0%) |
| $50,000 to $74,999 | 116 (32.0%) | 0 (0.0%) |
| $75,000 to $99,999 | 8 (2.2%) | 0 (0.0%) |
| $100,000 to $149,999 | 38 (10.5%) | 0 (0.0%) |
| $150,000 or more | 4 (1.1%) | 0 (0.0%) |
| Total | 362 (100.0%) | 59 (100.0%) |
Monthly Housing Cost Tiers in Stearns
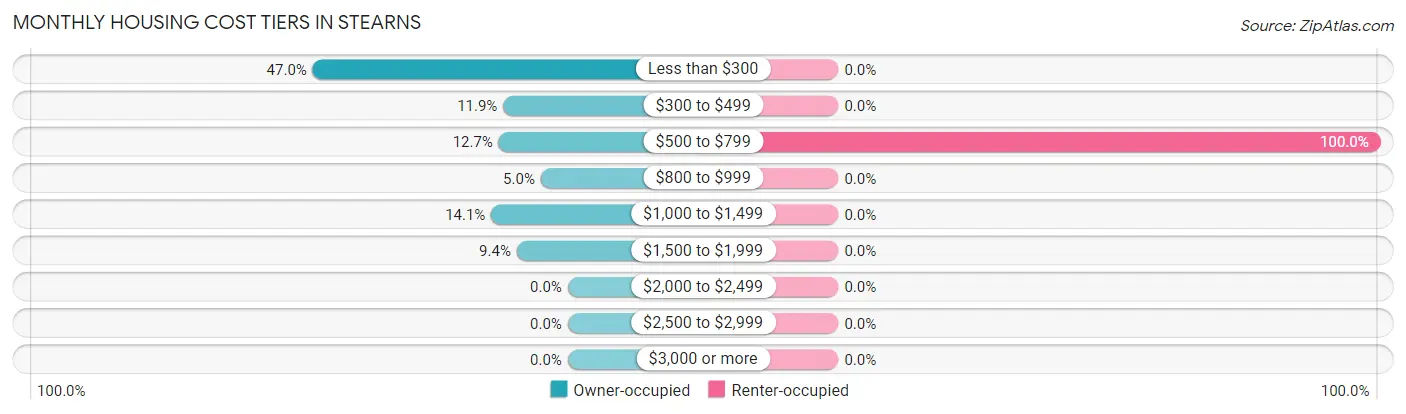
| Monthly Cost | Owner-occupied | Renter-occupied |
| Less than $300 | 170 (47.0%) | 0 (0.0%) |
| $300 to $499 | 43 (11.9%) | 0 (0.0%) |
| $500 to $799 | 46 (12.7%) | 59 (100.0%) |
| $800 to $999 | 18 (5.0%) | 0 (0.0%) |
| $1,000 to $1,499 | 51 (14.1%) | 0 (0.0%) |
| $1,500 to $1,999 | 34 (9.4%) | 0 (0.0%) |
| $2,000 to $2,499 | 0 (0.0%) | 0 (0.0%) |
| $2,500 to $2,999 | 0 (0.0%) | 0 (0.0%) |
| $3,000 or more | 0 (0.0%) | 0 (0.0%) |
| Total | 362 (100.0%) | 59 (100.0%) |
Physical Housing Characteristics in Stearns
Housing Structures in Stearns
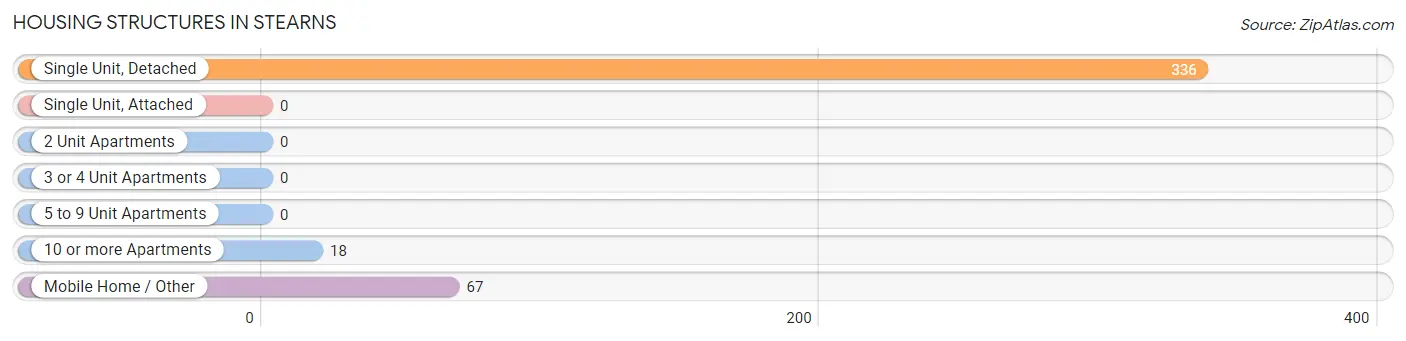
| Structure Type | # Housing Units | % Housing Units |
| Single Unit, Detached | 336 | 79.8% |
| Single Unit, Attached | 0 | 0.0% |
| 2 Unit Apartments | 0 | 0.0% |
| 3 or 4 Unit Apartments | 0 | 0.0% |
| 5 to 9 Unit Apartments | 0 | 0.0% |
| 10 or more Apartments | 18 | 4.3% |
| Mobile Home / Other | 67 | 15.9% |
| Total | 421 | 100.0% |
Housing Structures by Occupancy in Stearns
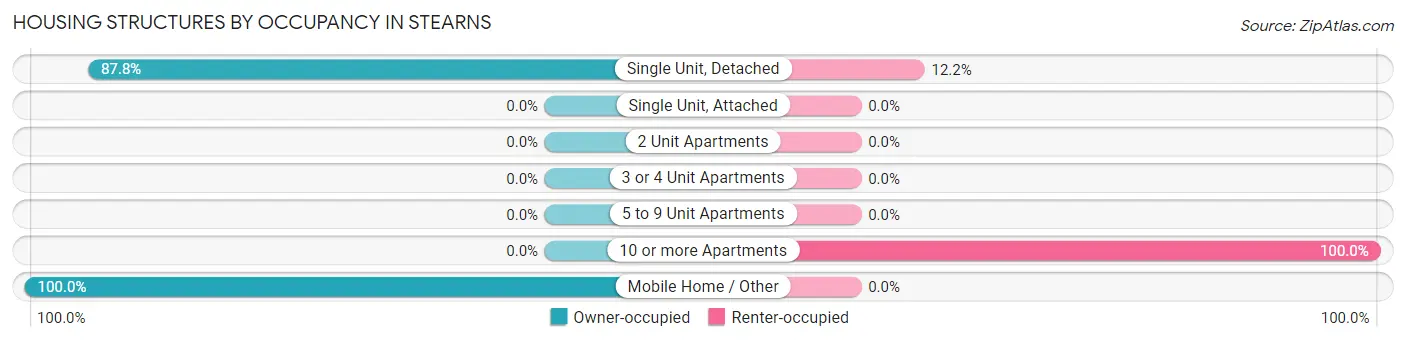
| Structure Type | Owner-occupied | Renter-occupied |
| Single Unit, Detached | 295 (87.8%) | 41 (12.2%) |
| Single Unit, Attached | 0 (0.0%) | 0 (0.0%) |
| 2 Unit Apartments | 0 (0.0%) | 0 (0.0%) |
| 3 or 4 Unit Apartments | 0 (0.0%) | 0 (0.0%) |
| 5 to 9 Unit Apartments | 0 (0.0%) | 0 (0.0%) |
| 10 or more Apartments | 0 (0.0%) | 18 (100.0%) |
| Mobile Home / Other | 67 (100.0%) | 0 (0.0%) |
| Total | 362 (86.0%) | 59 (14.0%) |
Housing Structures by Number of Rooms in Stearns
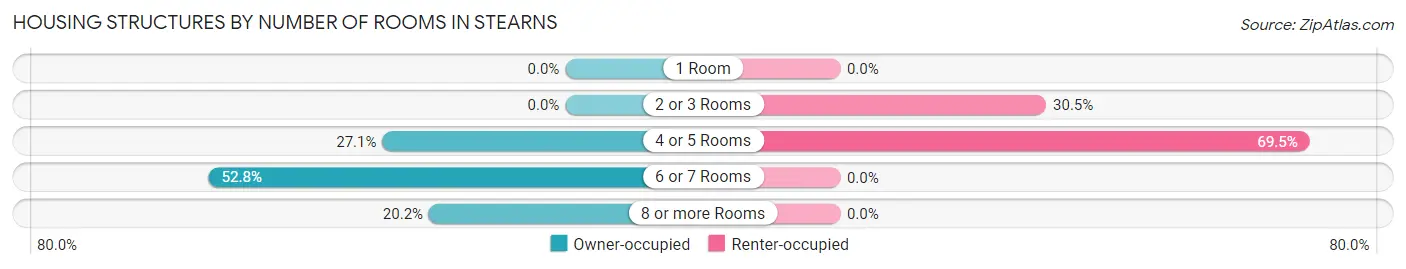
| Number of Rooms | Owner-occupied | Renter-occupied |
| 1 Room | 0 (0.0%) | 0 (0.0%) |
| 2 or 3 Rooms | 0 (0.0%) | 18 (30.5%) |
| 4 or 5 Rooms | 98 (27.1%) | 41 (69.5%) |
| 6 or 7 Rooms | 191 (52.8%) | 0 (0.0%) |
| 8 or more Rooms | 73 (20.2%) | 0 (0.0%) |
| Total | 362 (100.0%) | 59 (100.0%) |
Housing Structure by Heating Type in Stearns
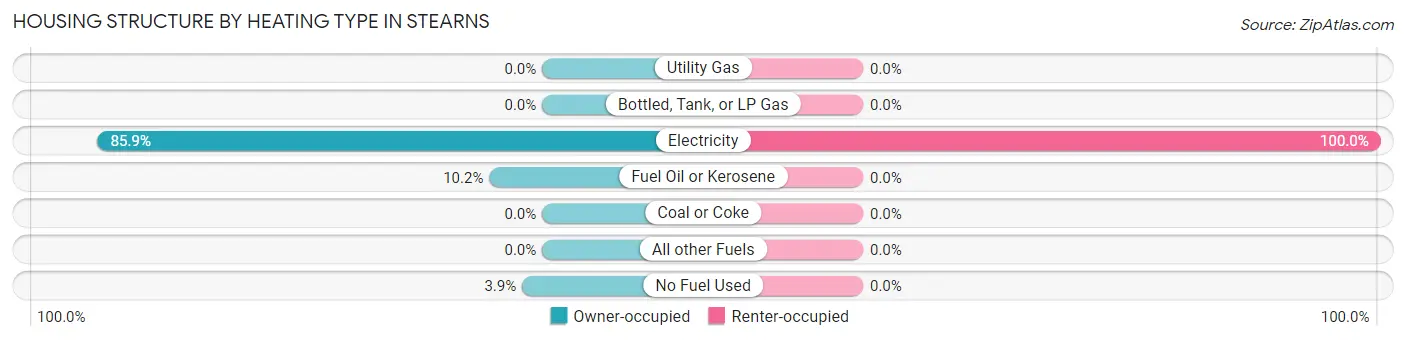
| Heating Type | Owner-occupied | Renter-occupied |
| Utility Gas | 0 (0.0%) | 0 (0.0%) |
| Bottled, Tank, or LP Gas | 0 (0.0%) | 0 (0.0%) |
| Electricity | 311 (85.9%) | 59 (100.0%) |
| Fuel Oil or Kerosene | 37 (10.2%) | 0 (0.0%) |
| Coal or Coke | 0 (0.0%) | 0 (0.0%) |
| All other Fuels | 0 (0.0%) | 0 (0.0%) |
| No Fuel Used | 14 (3.9%) | 0 (0.0%) |
| Total | 362 (100.0%) | 59 (100.0%) |
Household Vehicle Usage in Stearns
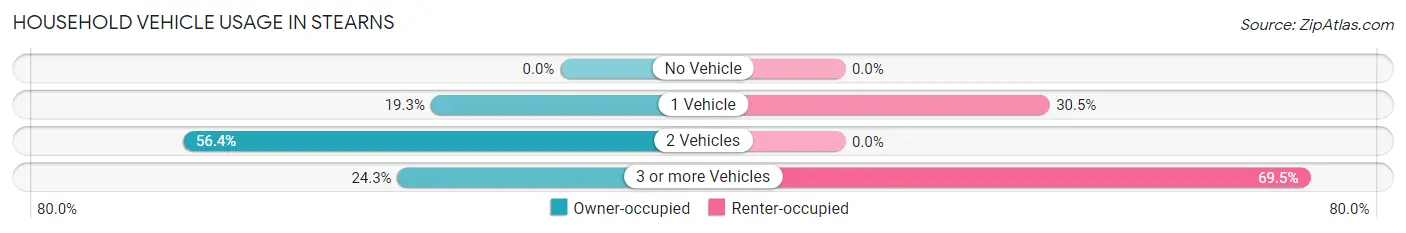
| Vehicles per Household | Owner-occupied | Renter-occupied |
| No Vehicle | 0 (0.0%) | 0 (0.0%) |
| 1 Vehicle | 70 (19.3%) | 18 (30.5%) |
| 2 Vehicles | 204 (56.4%) | 0 (0.0%) |
| 3 or more Vehicles | 88 (24.3%) | 41 (69.5%) |
| Total | 362 (100.0%) | 59 (100.0%) |
Real Estate & Mortgages in Stearns
Real Estate and Mortgage Overview in Stearns
| Characteristic | Without Mortgage | With Mortgage |
| Housing Units | 259 | 103 |
| Median Property Value | $45,900 | $157,200 |
| Median Household Income | $23,521 | $4 |
| Monthly Housing Costs | $280 | $0 |
| Real Estate Taxes | $526 | $0 |
Property Value by Mortgage Status in Stearns
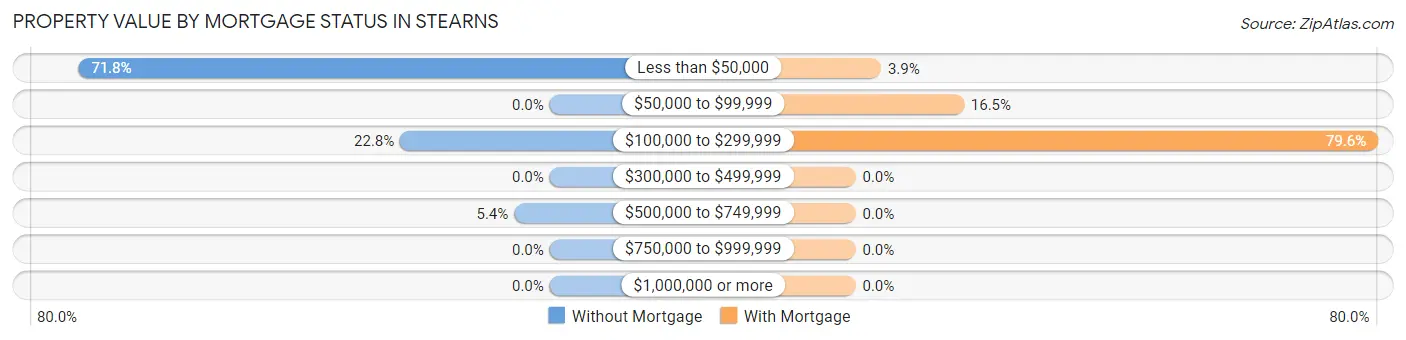
| Property Value | Without Mortgage | With Mortgage |
| Less than $50,000 | 186 (71.8%) | 4 (3.9%) |
| $50,000 to $99,999 | 0 (0.0%) | 17 (16.5%) |
| $100,000 to $299,999 | 59 (22.8%) | 82 (79.6%) |
| $300,000 to $499,999 | 0 (0.0%) | 0 (0.0%) |
| $500,000 to $749,999 | 14 (5.4%) | 0 (0.0%) |
| $750,000 to $999,999 | 0 (0.0%) | 0 (0.0%) |
| $1,000,000 or more | 0 (0.0%) | 0 (0.0%) |
| Total | 259 (100.0%) | 103 (100.0%) |
Household Income by Mortgage Status in Stearns
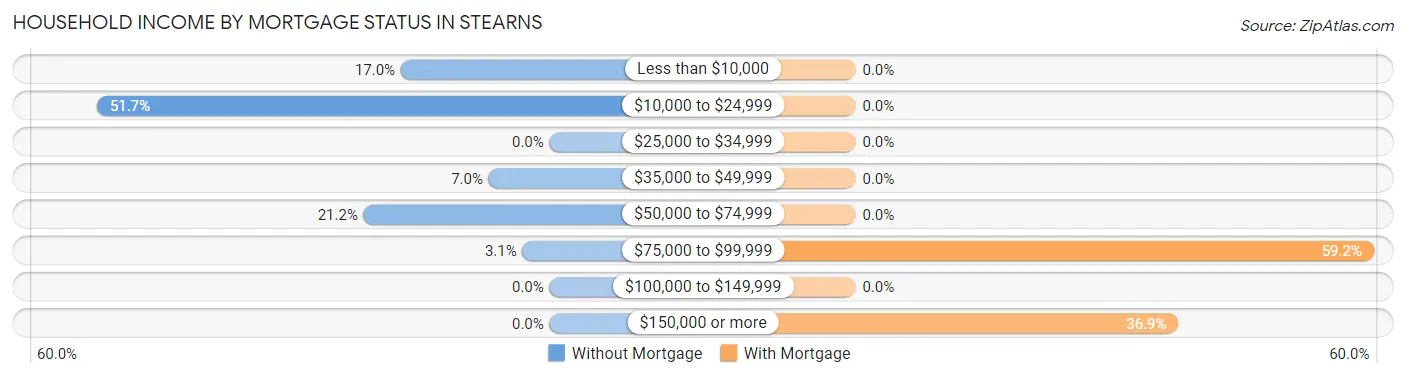
| Household Income | Without Mortgage | With Mortgage |
| Less than $10,000 | 44 (17.0%) | 0 (0.0%) |
| $10,000 to $24,999 | 134 (51.7%) | 0 (0.0%) |
| $25,000 to $34,999 | 0 (0.0%) | 0 (0.0%) |
| $35,000 to $49,999 | 18 (7.0%) | 0 (0.0%) |
| $50,000 to $74,999 | 55 (21.2%) | 0 (0.0%) |
| $75,000 to $99,999 | 8 (3.1%) | 61 (59.2%) |
| $100,000 to $149,999 | 0 (0.0%) | 0 (0.0%) |
| $150,000 or more | 0 (0.0%) | 38 (36.9%) |
| Total | 259 (100.0%) | 103 (100.0%) |
Property Value to Household Income Ratio in Stearns
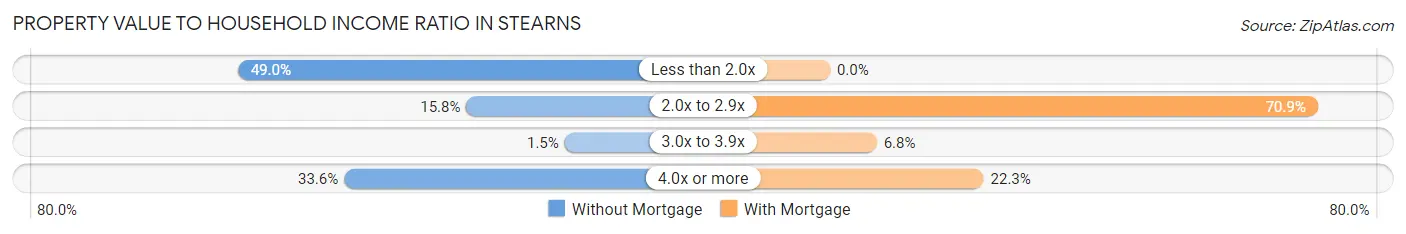
| Value-to-Income Ratio | Without Mortgage | With Mortgage |
| Less than 2.0x | 127 (49.0%) | 0 (0.0%) |
| 2.0x to 2.9x | 41 (15.8%) | 73 (70.9%) |
| 3.0x to 3.9x | 4 (1.5%) | 7 (6.8%) |
| 4.0x or more | 87 (33.6%) | 23 (22.3%) |
| Total | 259 (100.0%) | 103 (100.0%) |
Real Estate Taxes by Mortgage Status in Stearns
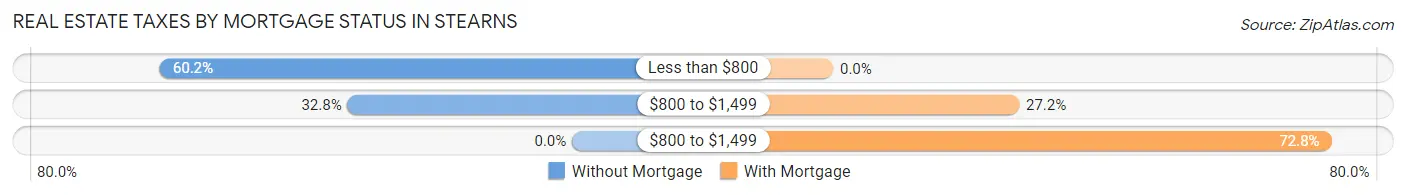
| Property Taxes | Without Mortgage | With Mortgage |
| Less than $800 | 156 (60.2%) | 0 (0.0%) |
| $800 to $1,499 | 85 (32.8%) | 28 (27.2%) |
| $800 to $1,499 | 0 (0.0%) | 75 (72.8%) |
| Total | 259 (100.0%) | 103 (100.0%) |
Health & Disability in Stearns
Health Insurance Coverage by Age in Stearns
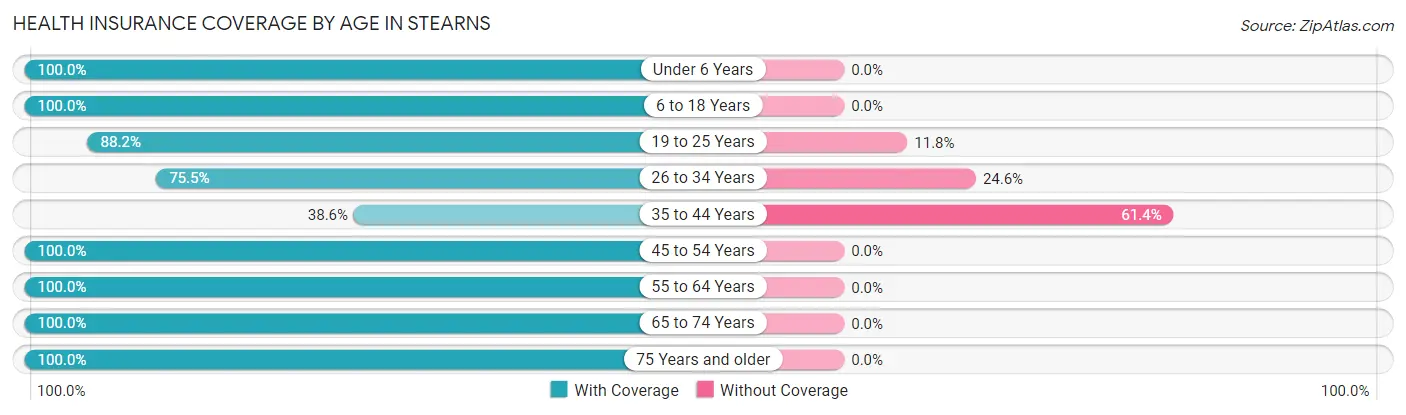
| Age Bracket | With Coverage | Without Coverage |
| Under 6 Years | 58 (100.0%) | 0 (0.0%) |
| 6 to 18 Years | 242 (100.0%) | 0 (0.0%) |
| 19 to 25 Years | 45 (88.2%) | 6 (11.8%) |
| 26 to 34 Years | 126 (75.4%) | 41 (24.5%) |
| 35 to 44 Years | 22 (38.6%) | 35 (61.4%) |
| 45 to 54 Years | 221 (100.0%) | 0 (0.0%) |
| 55 to 64 Years | 208 (100.0%) | 0 (0.0%) |
| 65 to 74 Years | 96 (100.0%) | 0 (0.0%) |
| 75 Years and older | 124 (100.0%) | 0 (0.0%) |
| Total | 1,142 (93.3%) | 82 (6.7%) |
Health Insurance Coverage by Citizenship Status in Stearns
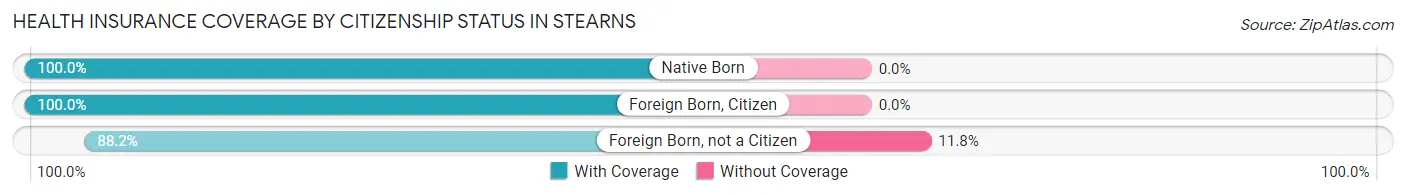
| Citizenship Status | With Coverage | Without Coverage |
| Native Born | 58 (100.0%) | 0 (0.0%) |
| Foreign Born, Citizen | 242 (100.0%) | 0 (0.0%) |
| Foreign Born, not a Citizen | 45 (88.2%) | 6 (11.8%) |
Health Insurance Coverage by Household Income in Stearns
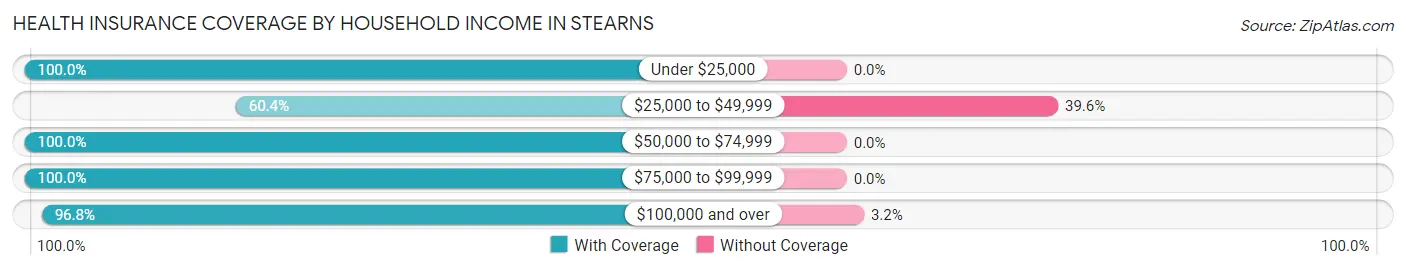
| Household Income | With Coverage | Without Coverage |
| Under $25,000 | 486 (100.0%) | 0 (0.0%) |
| $25,000 to $49,999 | 116 (60.4%) | 76 (39.6%) |
| $50,000 to $74,999 | 351 (100.0%) | 0 (0.0%) |
| $75,000 to $99,999 | 8 (100.0%) | 0 (0.0%) |
| $100,000 and over | 181 (96.8%) | 6 (3.2%) |
Public vs Private Health Insurance Coverage by Age in Stearns
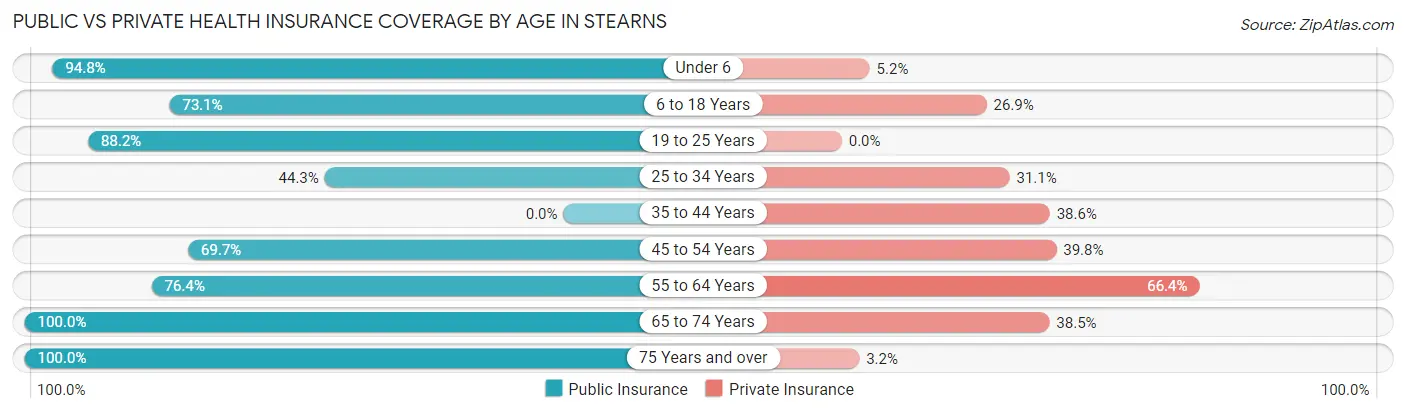
| Age Bracket | Public Insurance | Private Insurance |
| Under 6 | 55 (94.8%) | 3 (5.2%) |
| 6 to 18 Years | 177 (73.1%) | 65 (26.9%) |
| 19 to 25 Years | 45 (88.2%) | 0 (0.0%) |
| 25 to 34 Years | 74 (44.3%) | 52 (31.1%) |
| 35 to 44 Years | 0 (0.0%) | 22 (38.6%) |
| 45 to 54 Years | 154 (69.7%) | 88 (39.8%) |
| 55 to 64 Years | 159 (76.4%) | 138 (66.3%) |
| 65 to 74 Years | 96 (100.0%) | 37 (38.5%) |
| 75 Years and over | 124 (100.0%) | 4 (3.2%) |
| Total | 884 (72.2%) | 409 (33.4%) |
Disability Status by Sex by Age in Stearns
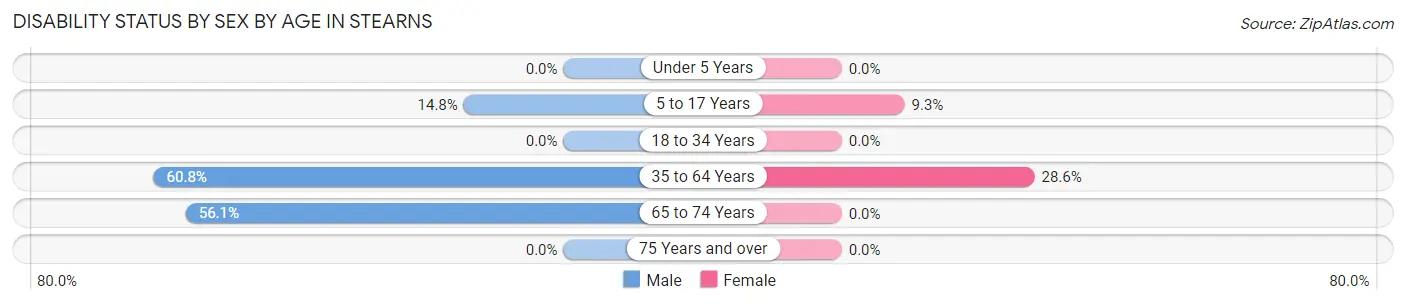
| Age Bracket | Male | Female |
| Under 5 Years | 0 (0.0%) | 0 (0.0%) |
| 5 to 17 Years | 16 (14.8%) | 14 (9.3%) |
| 18 to 34 Years | 0 (0.0%) | 0 (0.0%) |
| 35 to 64 Years | 132 (60.8%) | 77 (28.6%) |
| 65 to 74 Years | 37 (56.1%) | 0 (0.0%) |
| 75 Years and over | 0 (0.0%) | 0 (0.0%) |
Disability Class by Sex by Age in Stearns
Disability Class: Hearing Difficulty
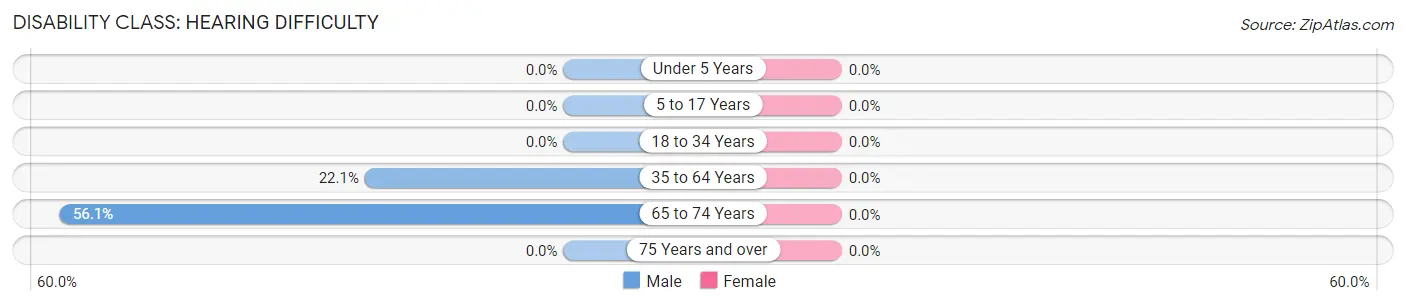
| Age Bracket | Male | Female |
| Under 5 Years | 0 (0.0%) | 0 (0.0%) |
| 5 to 17 Years | 0 (0.0%) | 0 (0.0%) |
| 18 to 34 Years | 0 (0.0%) | 0 (0.0%) |
| 35 to 64 Years | 48 (22.1%) | 0 (0.0%) |
| 65 to 74 Years | 37 (56.1%) | 0 (0.0%) |
| 75 Years and over | 0 (0.0%) | 0 (0.0%) |
Disability Class: Vision Difficulty
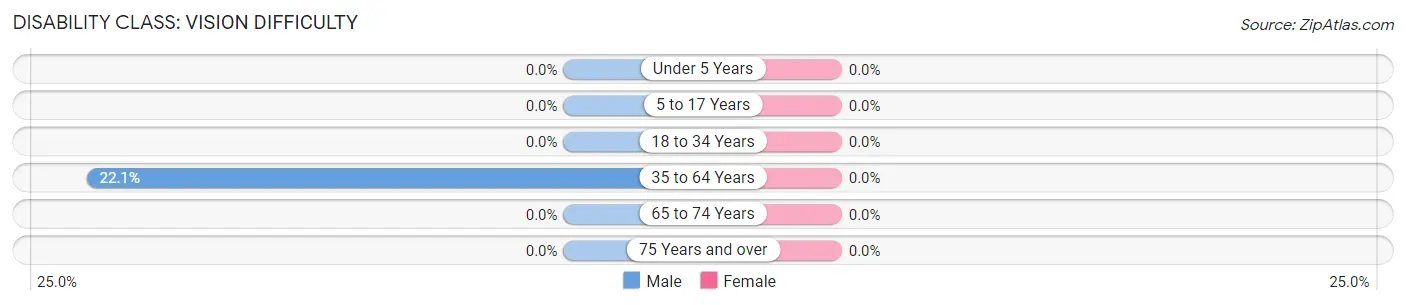
| Age Bracket | Male | Female |
| Under 5 Years | 0 (0.0%) | 0 (0.0%) |
| 5 to 17 Years | 0 (0.0%) | 0 (0.0%) |
| 18 to 34 Years | 0 (0.0%) | 0 (0.0%) |
| 35 to 64 Years | 48 (22.1%) | 0 (0.0%) |
| 65 to 74 Years | 0 (0.0%) | 0 (0.0%) |
| 75 Years and over | 0 (0.0%) | 0 (0.0%) |
Disability Class: Cognitive Difficulty
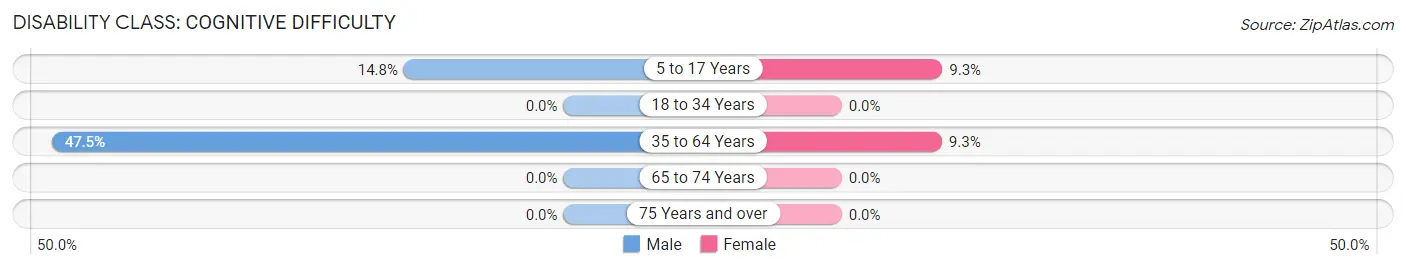
| Age Bracket | Male | Female |
| 5 to 17 Years | 16 (14.8%) | 14 (9.3%) |
| 18 to 34 Years | 0 (0.0%) | 0 (0.0%) |
| 35 to 64 Years | 103 (47.5%) | 25 (9.3%) |
| 65 to 74 Years | 0 (0.0%) | 0 (0.0%) |
| 75 Years and over | 0 (0.0%) | 0 (0.0%) |
Disability Class: Ambulatory Difficulty
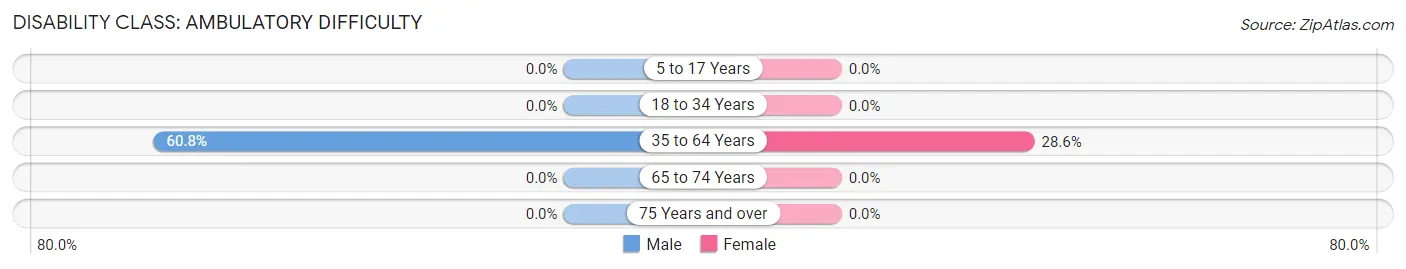
| Age Bracket | Male | Female |
| 5 to 17 Years | 0 (0.0%) | 0 (0.0%) |
| 18 to 34 Years | 0 (0.0%) | 0 (0.0%) |
| 35 to 64 Years | 132 (60.8%) | 77 (28.6%) |
| 65 to 74 Years | 0 (0.0%) | 0 (0.0%) |
| 75 Years and over | 0 (0.0%) | 0 (0.0%) |
Disability Class: Self-Care Difficulty
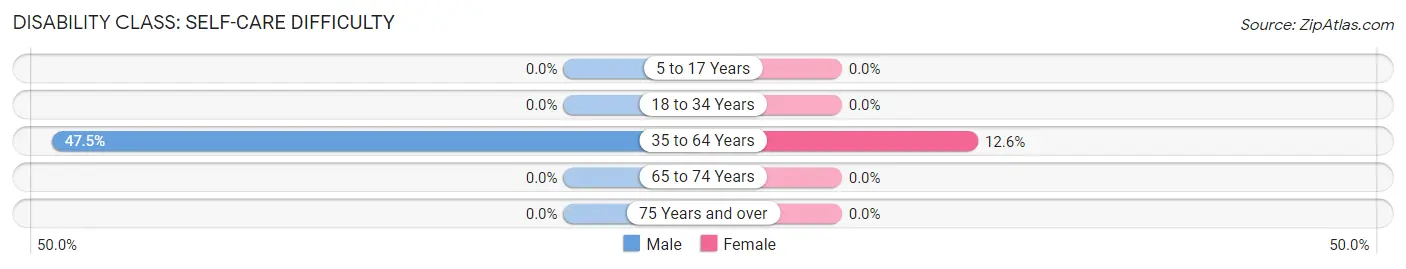
| Age Bracket | Male | Female |
| 5 to 17 Years | 0 (0.0%) | 0 (0.0%) |
| 18 to 34 Years | 0 (0.0%) | 0 (0.0%) |
| 35 to 64 Years | 103 (47.5%) | 34 (12.6%) |
| 65 to 74 Years | 0 (0.0%) | 0 (0.0%) |
| 75 Years and over | 0 (0.0%) | 0 (0.0%) |
Technology Access in Stearns
Computing Device Access in Stearns
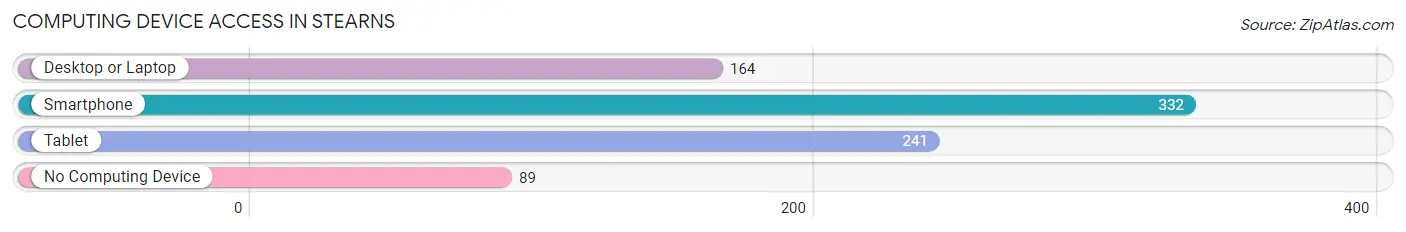
| Device Type | # Households | % Households |
| Desktop or Laptop | 164 | 39.0% |
| Smartphone | 332 | 78.9% |
| Tablet | 241 | 57.2% |
| No Computing Device | 89 | 21.1% |
| Total | 421 | 100.0% |
Internet Access in Stearns
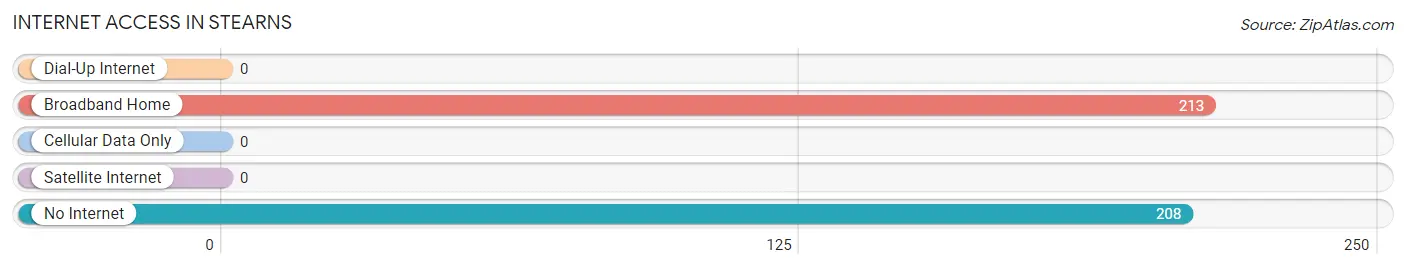
| Internet Type | # Households | % Households |
| Dial-Up Internet | 0 | 0.0% |
| Broadband Home | 213 | 50.6% |
| Cellular Data Only | 0 | 0.0% |
| Satellite Internet | 0 | 0.0% |
| No Internet | 208 | 49.4% |
| Total | 421 | 100.0% |
Stearns Summary
Stearns is a small town located in the southeastern corner of Kentucky, in the heart of the Appalachian Mountains. It is situated in McCreary County, which is the second least populous county in the state. The town was founded in 1891 and was named after the Stearns Coal and Lumber Company, which was the first major industry in the area. The town has a population of approximately 1,000 people and is the county seat of McCreary County.
Geography
Stearns is located in the Appalachian Mountains, which are the oldest mountain range in North America. The town is situated in a valley between two mountain ridges, the Cumberland Plateau and the Pine Mountain Range. The town is surrounded by the Daniel Boone National Forest, which is a popular destination for outdoor recreation. The town is located at an elevation of 1,000 feet and has a humid subtropical climate. The average temperature in the summer is around 80 degrees Fahrenheit and the average temperature in the winter is around 40 degrees Fahrenheit.
Economy
The economy of Stearns is largely based on tourism and outdoor recreation. The town is home to the Big South Fork National River and Recreation Area, which is a popular destination for camping, hiking, fishing, and other outdoor activities. The town is also home to the Stearns Coal and Lumber Company, which is the largest employer in the area. The company produces coal, lumber, and other products for the local and regional markets. The town is also home to several small businesses, including restaurants, retail stores, and service providers.
Demographics
As of the 2010 census, the population of Stearns was 1,039. The racial makeup of the town was 97.2% White, 0.9% African American, 0.2% Native American, 0.2% Asian, 0.1% Pacific Islander, 0.6% from other races, and 0.8% from two or more races. The median household income in Stearns was $25,000, and the median family income was $30,000. The per capita income in Stearns was $14,000.
History
Stearns was founded in 1891 by the Stearns Coal and Lumber Company. The company was the first major industry in the area and was responsible for the growth of the town. The company built a railroad line to connect the town to the outside world and the town quickly grew. The town was incorporated in 1902 and the population grew to over 1,000 people by the 1920s. The town was a major coal mining center in the early 20th century and was home to several coal mines. The town was also home to several lumber mills and other industries. The town experienced a decline in the late 20th century as the coal industry declined and the lumber industry moved away. The town has since become a popular destination for outdoor recreation and tourism.
Common Questions
What is Per Capita Income in Stearns?
Per Capita income in Stearns is $18,049.
What is Inequality or Gini Index in Stearns?
Inequality or Gini Index in Stearns is 0.43.
What is the Total Population of Stearns?
Total Population of Stearns is 1,224.
What is the Total Male Population of Stearns?
Total Male Population of Stearns is 621.
What is the Total Female Population of Stearns?
Total Female Population of Stearns is 603.
What is the Ratio of Males per 100 Females in Stearns?
There are 102.99 Males per 100 Females in Stearns.
What is the Ratio of Females per 100 Males in Stearns?
There are 97.10 Females per 100 Males in Stearns.
What is the Median Population Age in Stearns?
Median Population Age in Stearns is 48.0 Years.
What is the Average Family Size in Stearns
Average Family Size in Stearns is 3.0 People.
What is the Average Household Size in Stearns
Average Household Size in Stearns is 2.9 People.
How Large is the Labor Force in Stearns?
There are 379 People in the Labor Forcein in Stearns.
What is the Percentage of People in the Labor Force in Stearns?
40.5% of People are in the Labor Force in Stearns.
What is the Unemployment Rate in Stearns?
Unemployment Rate in Stearns is 2.6%.