Zip Codes with the Highest Percentage of Population Employed in Security & Protection in Berea, KY
RELATED REPORTS & OPTIONS
Security & Protection
Berea
Compare Zip Codes
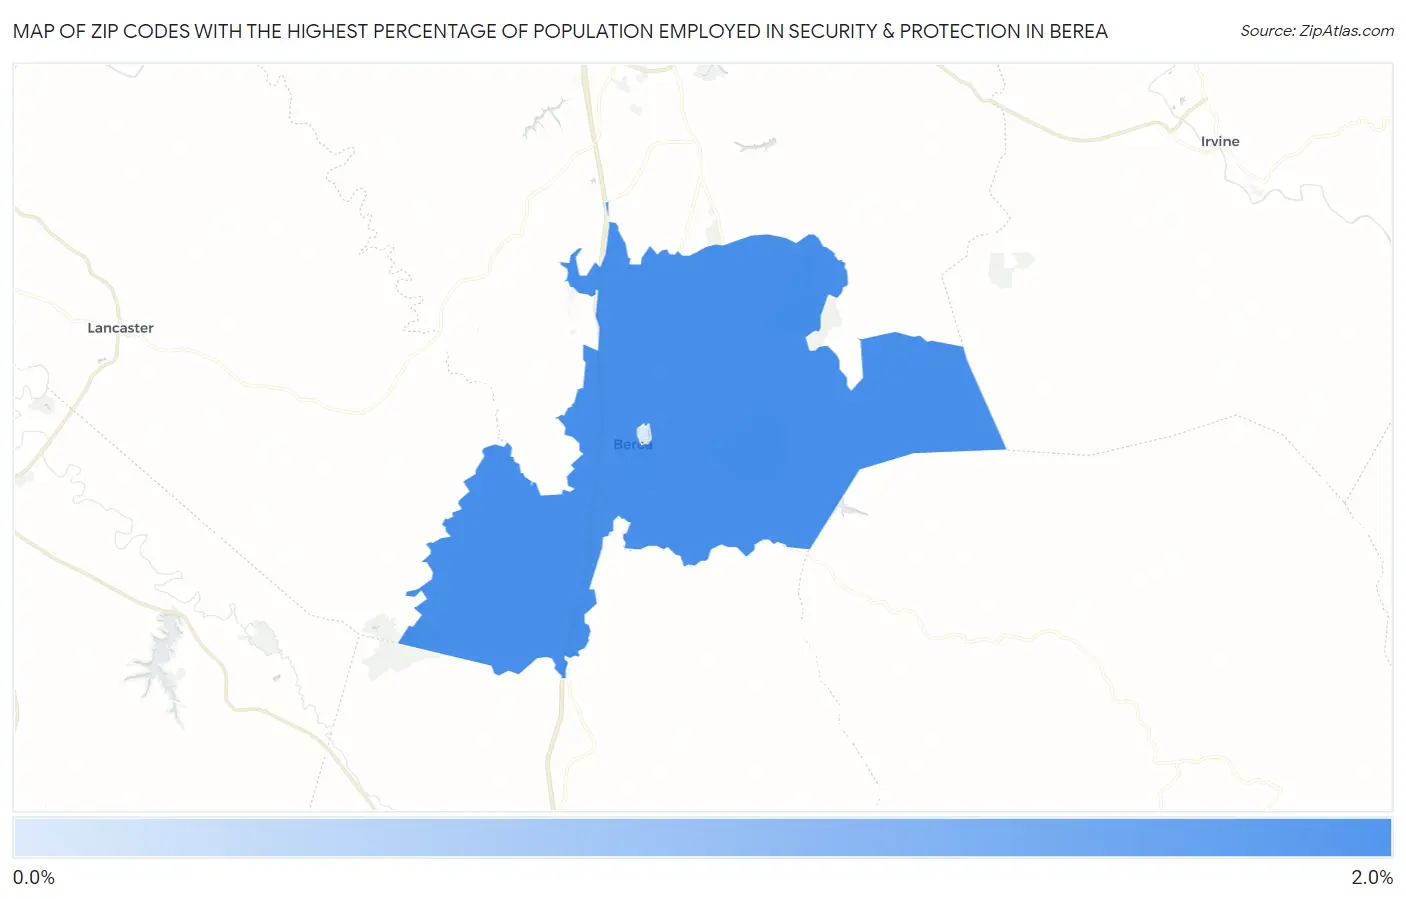
Map of Zip Codes with the Highest Percentage of Population Employed in Security & Protection in Berea
0.80%
1.7%
Zip Codes with the Highest Percentage of Population Employed in Security & Protection in Berea, KY
| Zip Code | % Employed | vs State | vs National | |
| 1. | 40403 | 1.7% | 2.0%(-0.282)#281 | 2.1%(-0.419)#14,454 |
| 2. | 40404 | 0.80% | 2.0%(-1.21)#395 | 2.1%(-1.35)#21,395 |
1
Common Questions
What are the Top Zip Codes with the Highest Percentage of Population Employed in Security & Protection in Berea, KY?
Top Zip Codes with the Highest Percentage of Population Employed in Security & Protection in Berea, KY are:
What zip code has the Highest Percentage of Population Employed in Security & Protection in Berea, KY?
40403 has the Highest Percentage of Population Employed in Security & Protection in Berea, KY with 1.7%.
What is the Percentage of Population Employed in Security & Protection in Berea, KY?
Percentage of Population Employed in Security & Protection in Berea is 1.1%.
What is the Percentage of Population Employed in Security & Protection in Kentucky?
Percentage of Population Employed in Security & Protection in Kentucky is 2.0%.
What is the Percentage of Population Employed in Security & Protection in the United States?
Percentage of Population Employed in Security & Protection in the United States is 2.1%.