Hardyville, KY Map & Demographics
Hardyville Map
Hardyville Overview
$24,781
PER CAPITA INCOME
0.45
INEQUALITY / GINI INDEX
255
TOTAL POPULATION
91
MALE POPULATION
164
FEMALE POPULATION
55.49
MALES / 100 FEMALES
180.22
FEMALES / 100 MALES
26.9
MEDIAN AGE
4.7
AVG FAMILY SIZE
2.0
AVG HOUSEHOLD SIZE
74
LABOR FORCE [ PEOPLE ]
46.8%
PERCENT IN LABOR FORCE
Hardyville Zip Codes
Hardyville Area Codes
Income in Hardyville
Income Overview in Hardyville
| Characteristic | Number | Measure |
| Per Capita Income | 255 | $24,781 |
| Median Family Income | 35 | $0 |
| Mean Family Income | 35 | $87,611 |
| Median Household Income | 126 | $0 |
| Mean Household Income | 126 | $47,888 |
| Income Deficit | 35 | $0 |
| Wage / Income Gap (%) | 255 | 0.00% |
| Wage / Income Gap ($) | 255 | 100.00¢ per $1 |
| Gini / Inequality Index | 255 | 0.45 |
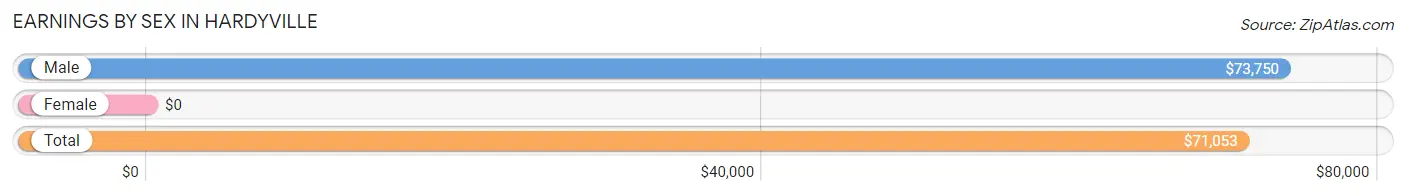
Earnings by Sex in Hardyville
| Sex | Number | Average Earnings |
| Male | 52 (70.3%) | $73,750 |
| Female | 22 (29.7%) | $0 |
| Total | 74 (100.0%) | $71,053 |
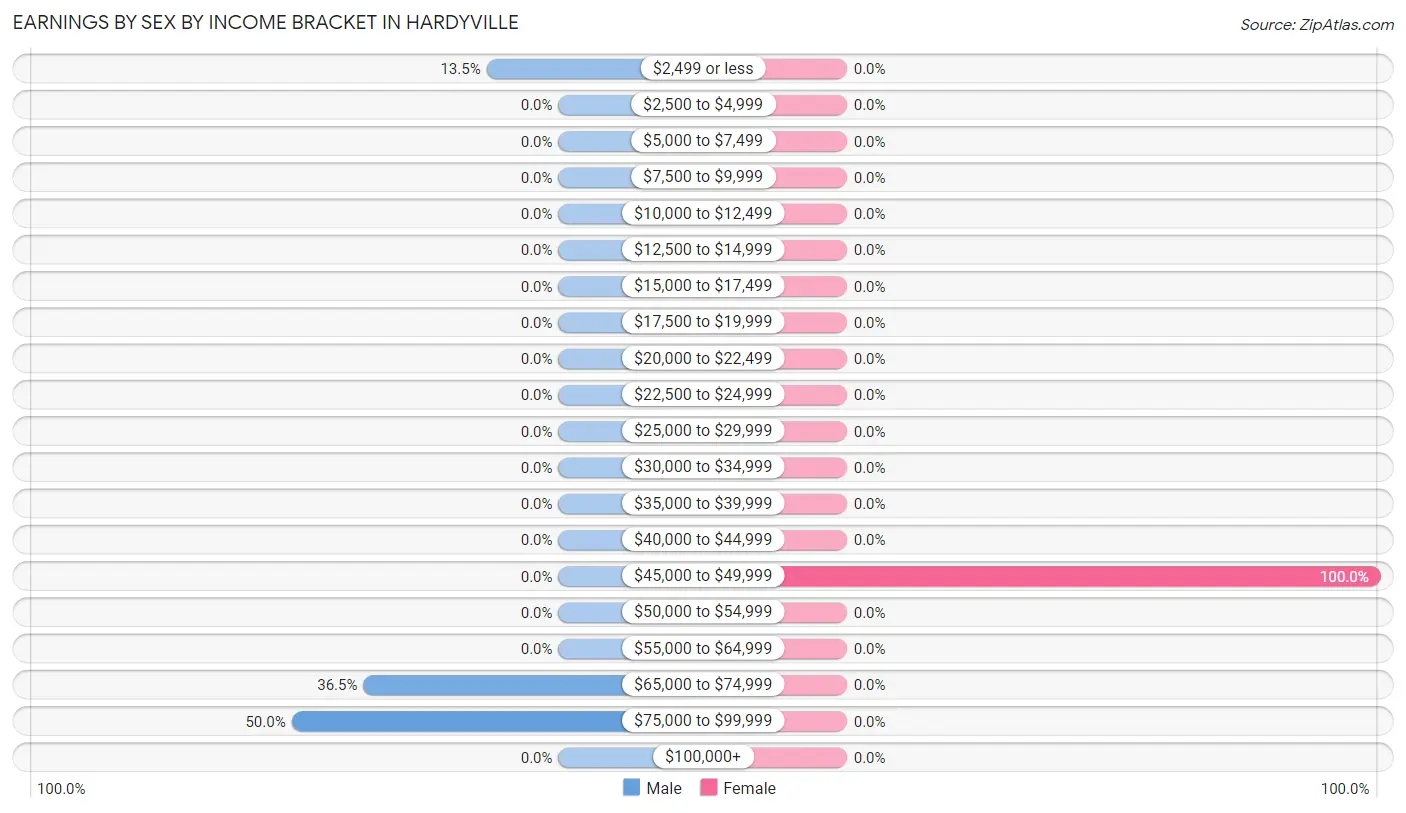
Earnings by Sex by Income Bracket in Hardyville
The most common earnings brackets in Hardyville are $75,000 to $99,999 for men (26 | 50.0%) and $45,000 to $49,999 for women (22 | 100.0%).
| Income | Male | Female |
| $2,499 or less | 7 (13.5%) | 0 (0.0%) |
| $2,500 to $4,999 | 0 (0.0%) | 0 (0.0%) |
| $5,000 to $7,499 | 0 (0.0%) | 0 (0.0%) |
| $7,500 to $9,999 | 0 (0.0%) | 0 (0.0%) |
| $10,000 to $12,499 | 0 (0.0%) | 0 (0.0%) |
| $12,500 to $14,999 | 0 (0.0%) | 0 (0.0%) |
| $15,000 to $17,499 | 0 (0.0%) | 0 (0.0%) |
| $17,500 to $19,999 | 0 (0.0%) | 0 (0.0%) |
| $20,000 to $22,499 | 0 (0.0%) | 0 (0.0%) |
| $22,500 to $24,999 | 0 (0.0%) | 0 (0.0%) |
| $25,000 to $29,999 | 0 (0.0%) | 0 (0.0%) |
| $30,000 to $34,999 | 0 (0.0%) | 0 (0.0%) |
| $35,000 to $39,999 | 0 (0.0%) | 0 (0.0%) |
| $40,000 to $44,999 | 0 (0.0%) | 0 (0.0%) |
| $45,000 to $49,999 | 0 (0.0%) | 22 (100.0%) |
| $50,000 to $54,999 | 0 (0.0%) | 0 (0.0%) |
| $55,000 to $64,999 | 0 (0.0%) | 0 (0.0%) |
| $65,000 to $74,999 | 19 (36.5%) | 0 (0.0%) |
| $75,000 to $99,999 | 26 (50.0%) | 0 (0.0%) |
| $100,000+ | 0 (0.0%) | 0 (0.0%) |
| Total | 52 (100.0%) | 22 (100.0%) |
Earnings by Sex by Educational Attainment in Hardyville
| Educational Attainment | Male Income | Female Income |
| Less than High School | - | - |
| High School Diploma | - | - |
| College or Associate's Degree | - | - |
| Bachelor's Degree | - | - |
| Graduate Degree | - | - |
| Total | - | - |
Family Income in Hardyville
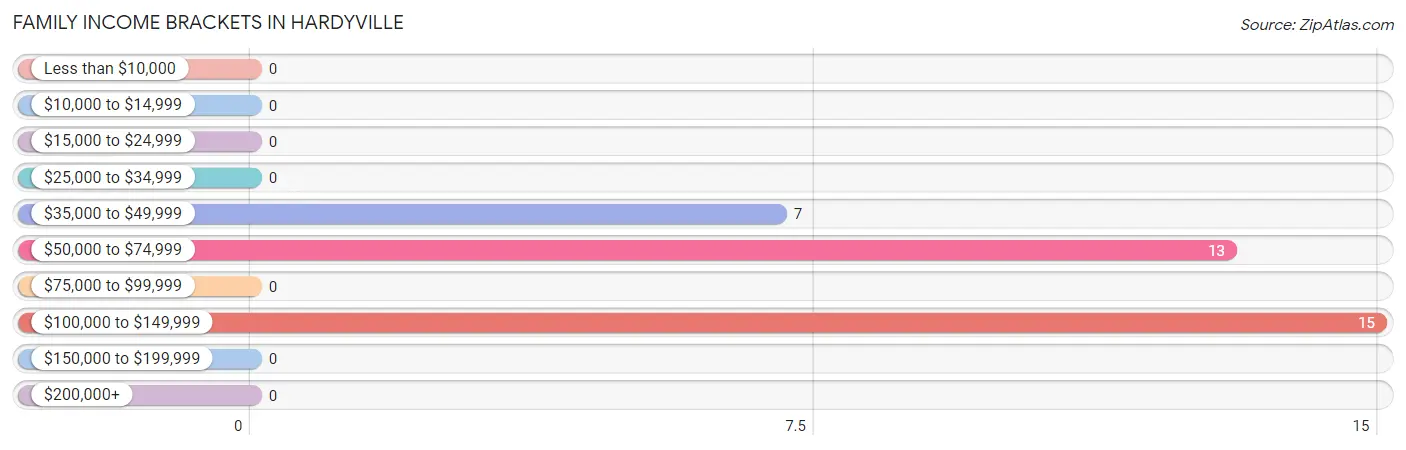
Family Income Brackets in Hardyville
According to the Hardyville family income data, there are 15 families falling into the $100,000 to $149,999 income range, which is the most common income bracket and makes up 42.9% of all families.
| Income Bracket | # Families | % Families |
| Less than $10,000 | 0 | 0.0% |
| $10,000 to $14,999 | 0 | 0.0% |
| $15,000 to $24,999 | 0 | 0.0% |
| $25,000 to $34,999 | 0 | 0.0% |
| $35,000 to $49,999 | 7 | 20.0% |
| $50,000 to $74,999 | 13 | 37.1% |
| $75,000 to $99,999 | 0 | 0.0% |
| $100,000 to $149,999 | 15 | 42.9% |
| $150,000 to $199,999 | 0 | 0.0% |
| $200,000+ | 0 | 0.0% |
Family Income by Famaliy Size in Hardyville
| Income Bracket | # Families | Median Income |
| 2-Person Families | 13 (37.1%) | $0 |
| 3-Person Families | 7 (20.0%) | $0 |
| 4-Person Families | 0 (0.0%) | $0 |
| 5-Person Families | 0 (0.0%) | $0 |
| 6-Person Families | 15 (42.9%) | $0 |
| 7+ Person Families | 0 (0.0%) | $0 |
| Total | 35 (100.0%) | $0 |
Family Income by Number of Earners in Hardyville
| Number of Earners | # Families | Median Income |
| No Earners | 13 (37.1%) | $0 |
| 1 Earner | 7 (20.0%) | $0 |
| 2 Earners | 15 (42.9%) | $0 |
| 3+ Earners | 0 (0.0%) | $0 |
| Total | 35 (100.0%) | $0 |
Household Income in Hardyville
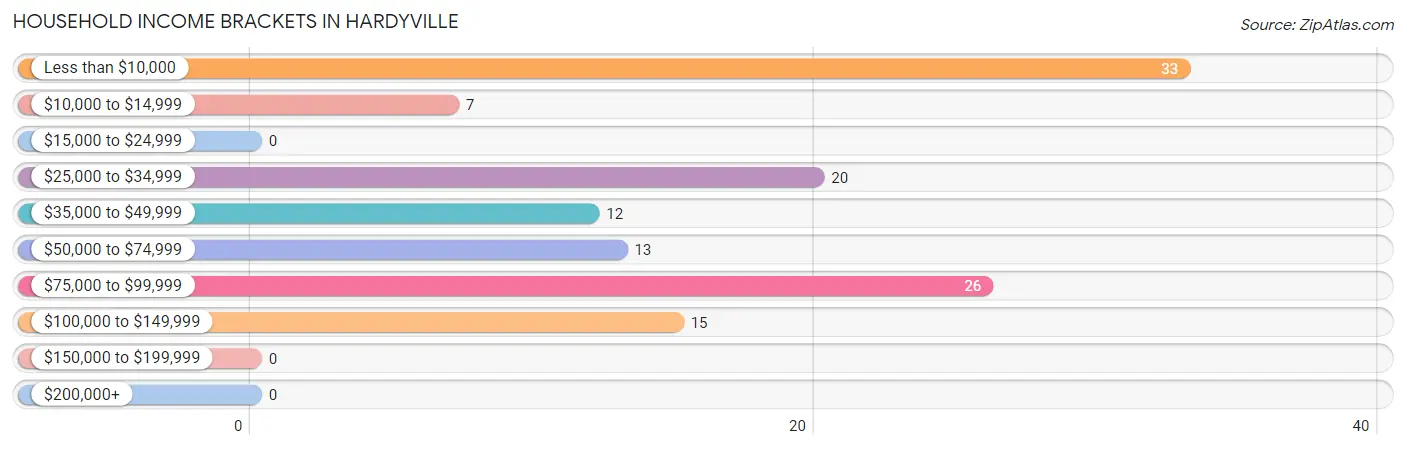
Household Income Brackets in Hardyville
With 33 households falling in the category, the less than $10,000 income range is the most frequent in Hardyville, accounting for 26.2% of all households.
| Income Bracket | # Households | % Households |
| Less than $10,000 | 33 | 26.2% |
| $10,000 to $14,999 | 7 | 5.6% |
| $15,000 to $24,999 | 0 | 0.0% |
| $25,000 to $34,999 | 20 | 15.9% |
| $35,000 to $49,999 | 12 | 9.5% |
| $50,000 to $74,999 | 13 | 10.3% |
| $75,000 to $99,999 | 26 | 20.6% |
| $100,000 to $149,999 | 15 | 11.9% |
| $150,000 to $199,999 | 0 | 0.0% |
| $200,000+ | 0 | 0.0% |
Household Income by Householder Age in Hardyville
The median household income in Hardyville is $0, with the highest median household income of $26,125 found in the 65+ years age bracket for the primary householder. A total of 32 households (25.4%) fall into this category. Meanwhile, the 15 to 24 years age bracket for the primary householder has the lowest median household income of $0, with 7 households (5.6%) in this group.
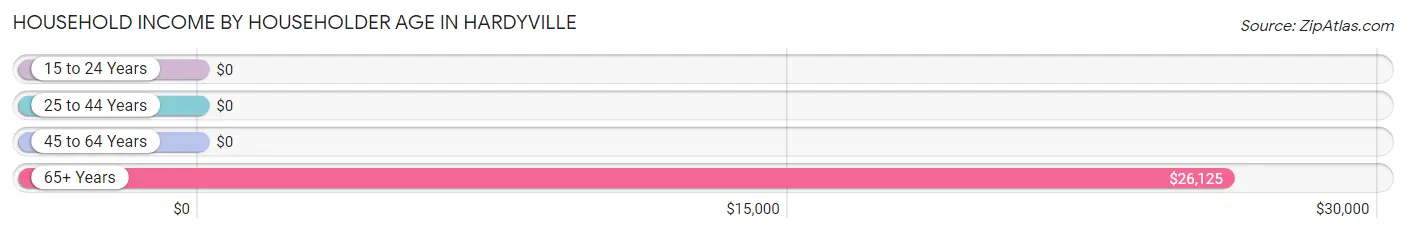
| Income Bracket | # Households | Median Income |
| 15 to 24 Years | 7 (5.6%) | $0 |
| 25 to 44 Years | 74 (58.7%) | $0 |
| 45 to 64 Years | 13 (10.3%) | $0 |
| 65+ Years | 32 (25.4%) | $26,125 |
| Total | 126 (100.0%) | $0 |
Poverty in Hardyville
Income Below Poverty by Sex and Age in Hardyville
With 36.3% poverty level for males and 4.3% for females among the residents of Hardyville, 18 to 24 year old males and 75 year old and over females are the most vulnerable to poverty, with 7 males (100.0%) and 7 females (100.0%) in their respective age groups living below the poverty level.
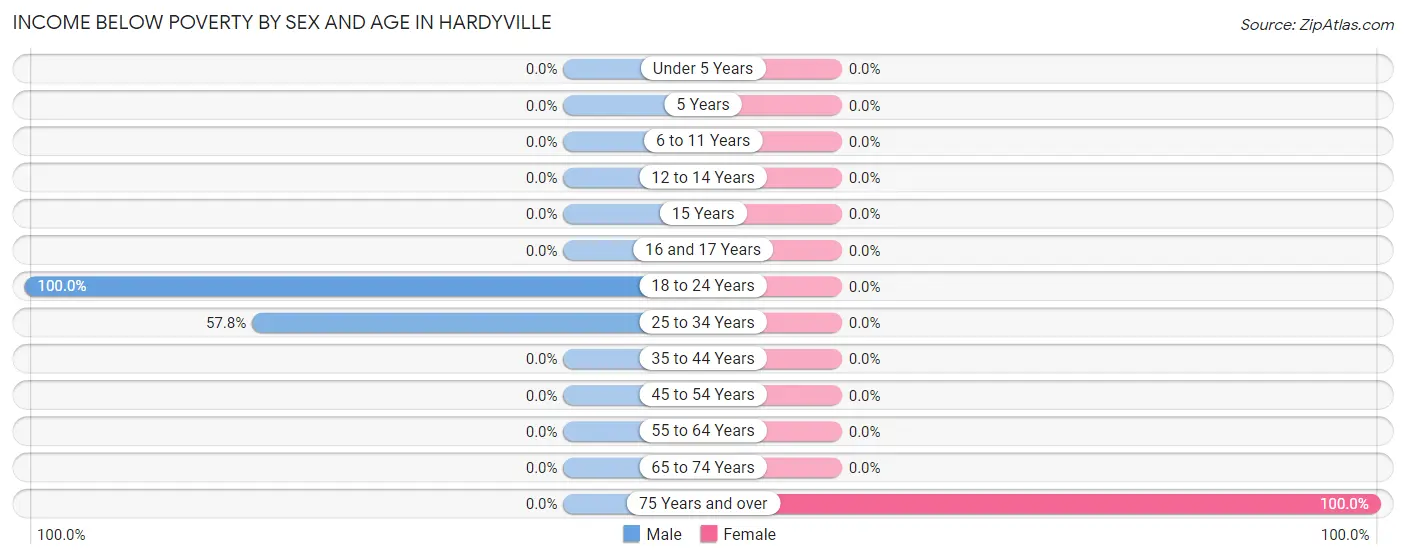
| Age Bracket | Male | Female |
| Under 5 Years | 0 (0.0%) | 0 (0.0%) |
| 5 Years | 0 (0.0%) | 0 (0.0%) |
| 6 to 11 Years | 0 (0.0%) | 0 (0.0%) |
| 12 to 14 Years | 0 (0.0%) | 0 (0.0%) |
| 15 Years | 0 (0.0%) | 0 (0.0%) |
| 16 and 17 Years | 0 (0.0%) | 0 (0.0%) |
| 18 to 24 Years | 7 (100.0%) | 0 (0.0%) |
| 25 to 34 Years | 26 (57.8%) | 0 (0.0%) |
| 35 to 44 Years | 0 (0.0%) | 0 (0.0%) |
| 45 to 54 Years | 0 (0.0%) | 0 (0.0%) |
| 55 to 64 Years | 0 (0.0%) | 0 (0.0%) |
| 65 to 74 Years | 0 (0.0%) | 0 (0.0%) |
| 75 Years and over | 0 (0.0%) | 7 (100.0%) |
| Total | 33 (36.3%) | 7 (4.3%) |
Income Above Poverty by Sex and Age in Hardyville
According to the poverty statistics in Hardyville, males aged 35 to 44 years and females aged under 5 years are the age groups that are most secure financially, with 100.0% of males and 100.0% of females in these age groups living above the poverty line.
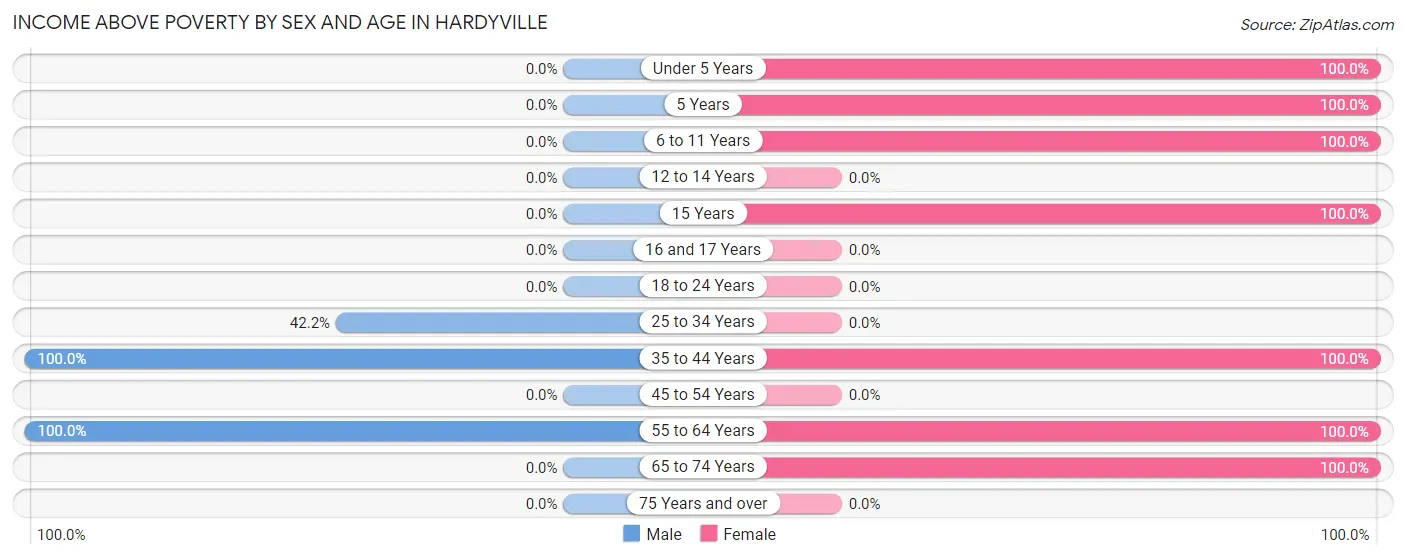
| Age Bracket | Male | Female |
| Under 5 Years | 0 (0.0%) | 52 (100.0%) |
| 5 Years | 0 (0.0%) | 7 (100.0%) |
| 6 to 11 Years | 0 (0.0%) | 23 (100.0%) |
| 12 to 14 Years | 0 (0.0%) | 0 (0.0%) |
| 15 Years | 0 (0.0%) | 15 (100.0%) |
| 16 and 17 Years | 0 (0.0%) | 0 (0.0%) |
| 18 to 24 Years | 0 (0.0%) | 0 (0.0%) |
| 25 to 34 Years | 19 (42.2%) | 0 (0.0%) |
| 35 to 44 Years | 26 (100.0%) | 22 (100.0%) |
| 45 to 54 Years | 0 (0.0%) | 0 (0.0%) |
| 55 to 64 Years | 13 (100.0%) | 13 (100.0%) |
| 65 to 74 Years | 0 (0.0%) | 25 (100.0%) |
| 75 Years and over | 0 (0.0%) | 0 (0.0%) |
| Total | 58 (63.7%) | 157 (95.7%) |
Income Below Poverty Among Married-Couple Families in Hardyville
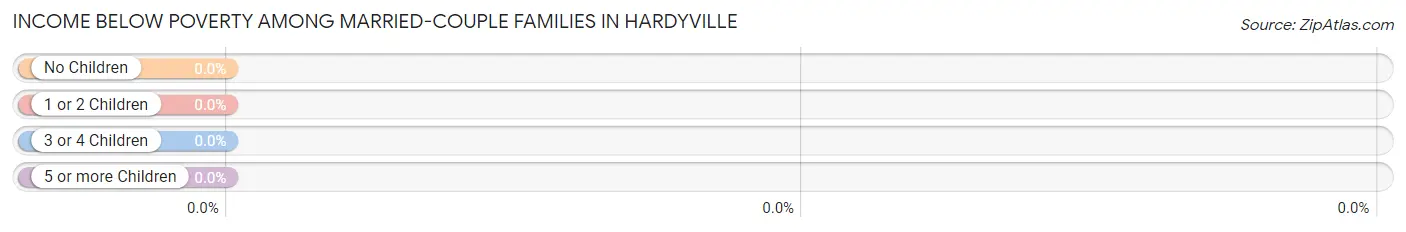
| Children | Above Poverty | Below Poverty |
| No Children | 13 (100.0%) | 0 (0.0%) |
| 1 or 2 Children | 0 (0.0%) | 0 (0.0%) |
| 3 or 4 Children | 15 (100.0%) | 0 (0.0%) |
| 5 or more Children | 0 (0.0%) | 0 (0.0%) |
| Total | 28 (100.0%) | 0 (0.0%) |
Income Below Poverty Among Single-Parent Households in Hardyville
| Children | Single Father | Single Mother |
| No Children | 0 (0.0%) | 0 (0.0%) |
| 1 or 2 Children | 0 (0.0%) | 0 (0.0%) |
| 3 or 4 Children | 0 (0.0%) | 0 (0.0%) |
| 5 or more Children | 0 (0.0%) | 0 (0.0%) |
| Total | 0 (0.0%) | 0 (0.0%) |
Income Below Poverty Among Married-Couple vs Single-Parent Households in Hardyville
| Children | Married-Couple Families | Single-Parent Households |
| No Children | 0 (0.0%) | 0 (0.0%) |
| 1 or 2 Children | 0 (0.0%) | 0 (0.0%) |
| 3 or 4 Children | 0 (0.0%) | 0 (0.0%) |
| 5 or more Children | 0 (0.0%) | 0 (0.0%) |
| Total | 0 (0.0%) | 0 (0.0%) |
Race in Hardyville
The most populous races in Hardyville are , and White / Caucasian (255 | 100.0%).
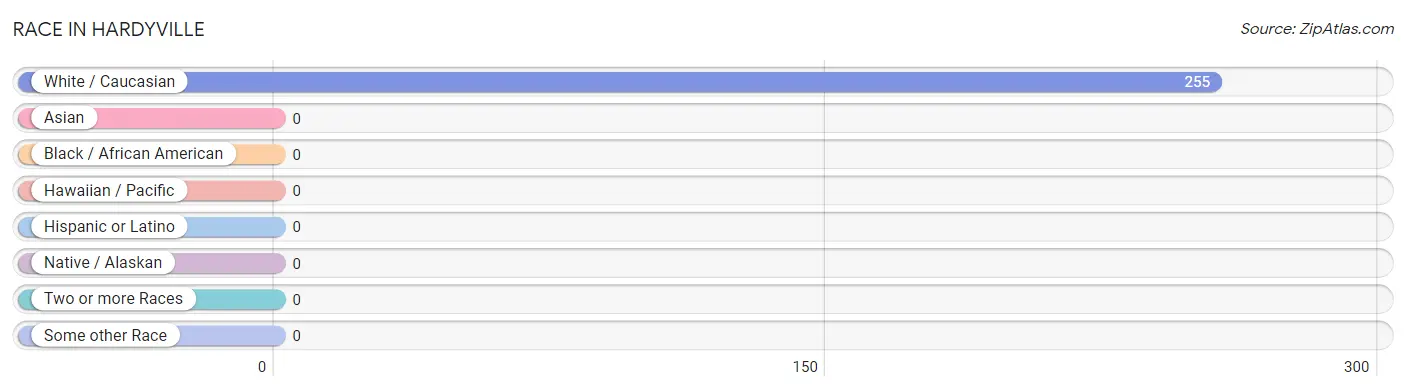
| Race | # Population | % Population |
| Asian | 0 | 0.0% |
| Black / African American | 0 | 0.0% |
| Hawaiian / Pacific | 0 | 0.0% |
| Hispanic or Latino | 0 | 0.0% |
| Native / Alaskan | 0 | 0.0% |
| White / Caucasian | 255 | 100.0% |
| Two or more Races | 0 | 0.0% |
| Some other Race | 0 | 0.0% |
| Total | 255 | 100.0% |
Ancestry in Hardyville
The most populous ancestries reported in Hardyville are English (61 | 23.9%), Irish (26 | 10.2%), Scottish (13 | 5.1%), German (7 | 2.8%), and European (5 | 2.0%), together accounting for 43.9% of all Hardyville residents.
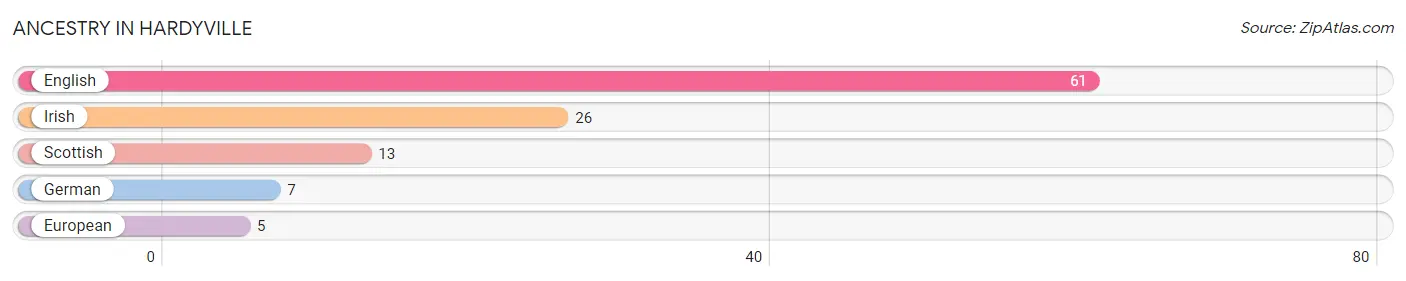
| Ancestry | # Population | % Population |
| English | 61 | 23.9% |
| European | 5 | 2.0% |
| German | 7 | 2.8% |
| Irish | 26 | 10.2% |
| Scottish | 13 | 5.1% | View All 5 Rows |
Immigrants in Hardyville

| Immigration Origin | # Population | % Population | View All 0 Rows |
Sex and Age in Hardyville
Sex and Age in Hardyville
The most populous age groups in Hardyville are 25 to 29 Years (26 | 28.6%) for men and Under 5 Years (52 | 31.7%) for women.
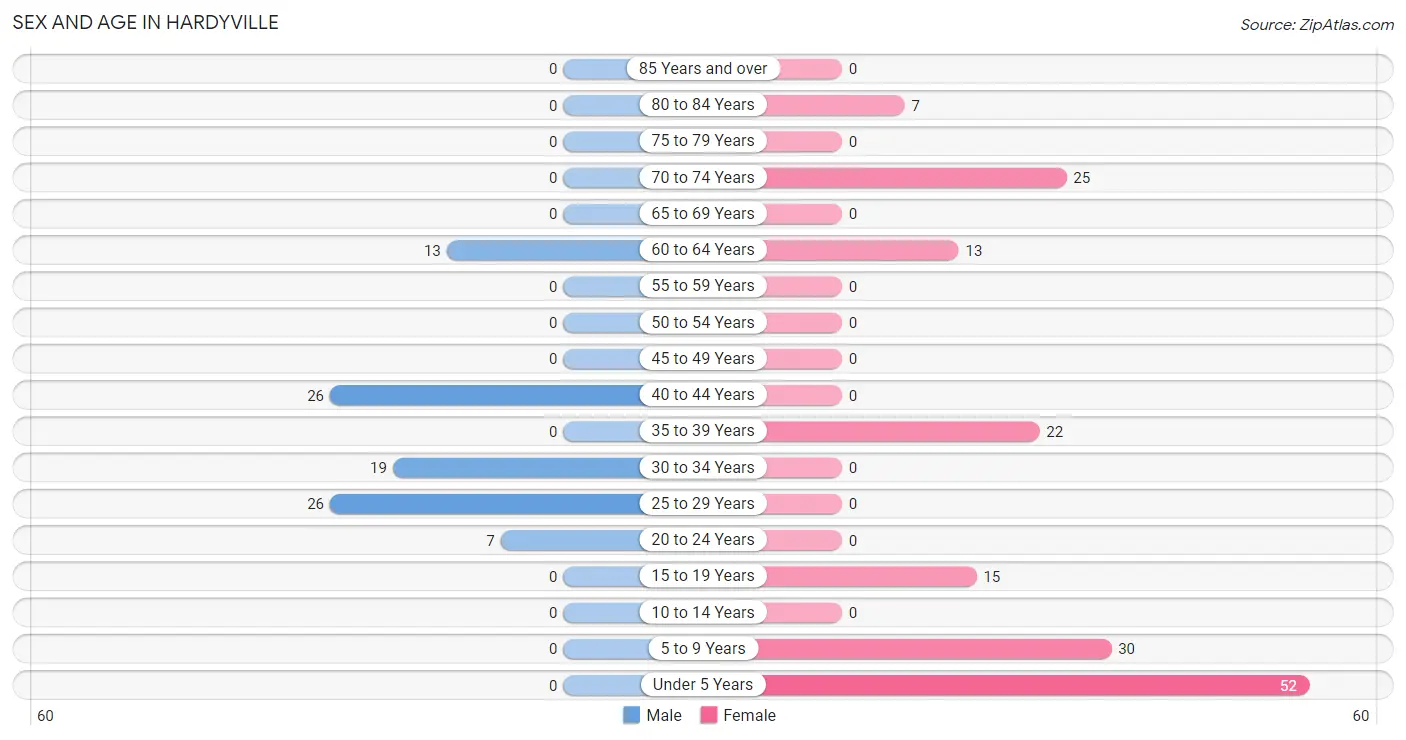
| Age Bracket | Male | Female |
| Under 5 Years | 0 (0.0%) | 52 (31.7%) |
| 5 to 9 Years | 0 (0.0%) | 30 (18.3%) |
| 10 to 14 Years | 0 (0.0%) | 0 (0.0%) |
| 15 to 19 Years | 0 (0.0%) | 15 (9.1%) |
| 20 to 24 Years | 7 (7.7%) | 0 (0.0%) |
| 25 to 29 Years | 26 (28.6%) | 0 (0.0%) |
| 30 to 34 Years | 19 (20.9%) | 0 (0.0%) |
| 35 to 39 Years | 0 (0.0%) | 22 (13.4%) |
| 40 to 44 Years | 26 (28.6%) | 0 (0.0%) |
| 45 to 49 Years | 0 (0.0%) | 0 (0.0%) |
| 50 to 54 Years | 0 (0.0%) | 0 (0.0%) |
| 55 to 59 Years | 0 (0.0%) | 0 (0.0%) |
| 60 to 64 Years | 13 (14.3%) | 13 (7.9%) |
| 65 to 69 Years | 0 (0.0%) | 0 (0.0%) |
| 70 to 74 Years | 0 (0.0%) | 25 (15.2%) |
| 75 to 79 Years | 0 (0.0%) | 0 (0.0%) |
| 80 to 84 Years | 0 (0.0%) | 7 (4.3%) |
| 85 Years and over | 0 (0.0%) | 0 (0.0%) |
| Total | 91 (100.0%) | 164 (100.0%) |
Families and Households in Hardyville
Median Family Size in Hardyville
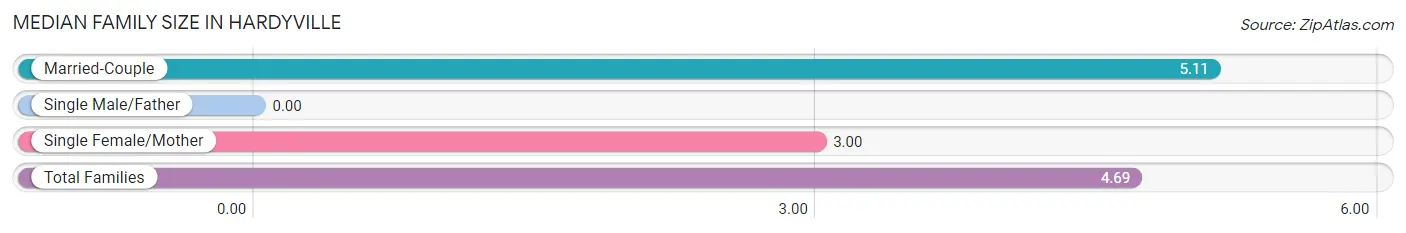
| Family Type | # Families | Family Size |
| Married-Couple | 28 (80.0%) | 5.11 |
| Single Male/Father | 0 (0.0%) | - |
| Single Female/Mother | 7 (20.0%) | 3.00 |
| Total Families | 35 (100.0%) | 4.69 |
Median Household Size in Hardyville
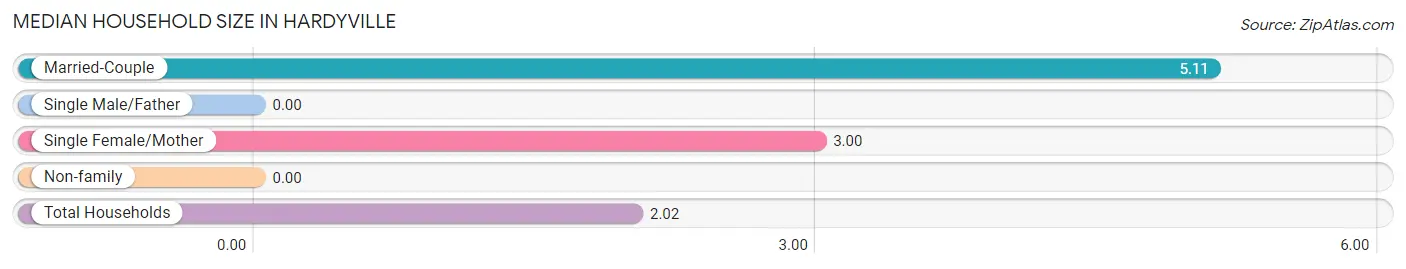
| Household Type | # Households | Household Size |
| Married-Couple | 28 (22.2%) | 5.11 |
| Single Male/Father | 0 (0.0%) | - |
| Single Female/Mother | 7 (5.6%) | 3.00 |
| Non-family | 91 (72.2%) | - |
| Total Households | 126 (100.0%) | 2.02 |
Household Size by Marriage Status in Hardyville
Out of a total of 126 households in Hardyville, 35 (27.8%) are family households, while 91 (72.2%) are nonfamily households. The most numerous type of family households are 6-person households, comprising 15, and the most common type of nonfamily households are 1-person households, comprising 91.
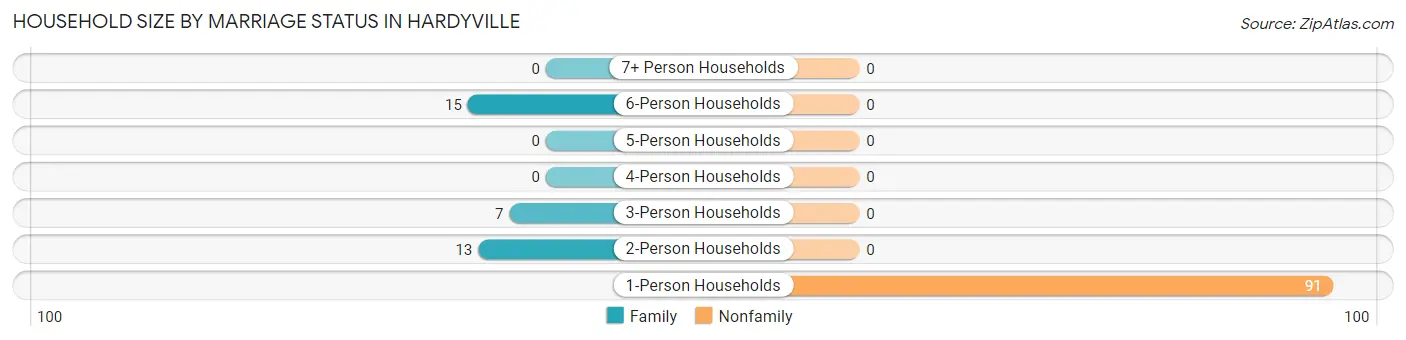
| Household Size | Family Households | Nonfamily Households |
| 1-Person Households | - | 91 (72.2%) |
| 2-Person Households | 13 (10.3%) | 0 (0.0%) |
| 3-Person Households | 7 (5.6%) | 0 (0.0%) |
| 4-Person Households | 0 (0.0%) | 0 (0.0%) |
| 5-Person Households | 0 (0.0%) | 0 (0.0%) |
| 6-Person Households | 15 (11.9%) | 0 (0.0%) |
| 7+ Person Households | 0 (0.0%) | 0 (0.0%) |
| Total | 35 (27.8%) | 91 (72.2%) |
Female Fertility in Hardyville
Fertility by Age in Hardyville
| Age Bracket | Women with Births | Births / 1,000 Women |
| 15 to 19 years | 0 (0.0%) | 0.0 |
| 20 to 34 years | 0 (0.0%) | 0.0 |
| 35 to 50 years | 0 (0.0%) | 0.0 |
| Total | 0 (0.0%) | 0.0 |
Fertility by Age by Marriage Status in Hardyville
| Age Bracket | Married | Unmarried |
| 15 to 19 years | 0 (0.0%) | 0 (0.0%) |
| 20 to 34 years | 0 (0.0%) | 0 (0.0%) |
| 35 to 50 years | 0 (0.0%) | 0 (0.0%) |
| Total | 0 (0.0%) | 0 (0.0%) |
Fertility by Education in Hardyville
| Educational Attainment | Women with Births | Births / 1,000 Women |
| Less than High School | 0 (0.0%) | 0.0 |
| High School Diploma | 0 (0.0%) | 0.0 |
| College or Associate's Degree | 0 (0.0%) | 0.0 |
| Bachelor's Degree | 0 (0.0%) | 0.0 |
| Graduate Degree | 0 (0.0%) | 0.0 |
| Total | 0 (0.0%) | 0.0 |
Fertility by Education by Marriage Status in Hardyville
| Educational Attainment | Married | Unmarried |
| Less than High School | 0 (0.0%) | 0 (0.0%) |
| High School Diploma | 0 (0.0%) | 0 (0.0%) |
| College or Associate's Degree | 0 (0.0%) | 0 (0.0%) |
| Bachelor's Degree | 0 (0.0%) | 0 (0.0%) |
| Graduate Degree | 0 (0.0%) | 0 (0.0%) |
| Total | 0 (0.0%) | 0 (0.0%) |
Employment Characteristics in Hardyville
Employment by Class of Employer in Hardyville
Among the 74 employed individuals in Hardyville, private company employees (52 | 70.3%), and local government employees (22 | 29.7%) make up the most common classes of employment.
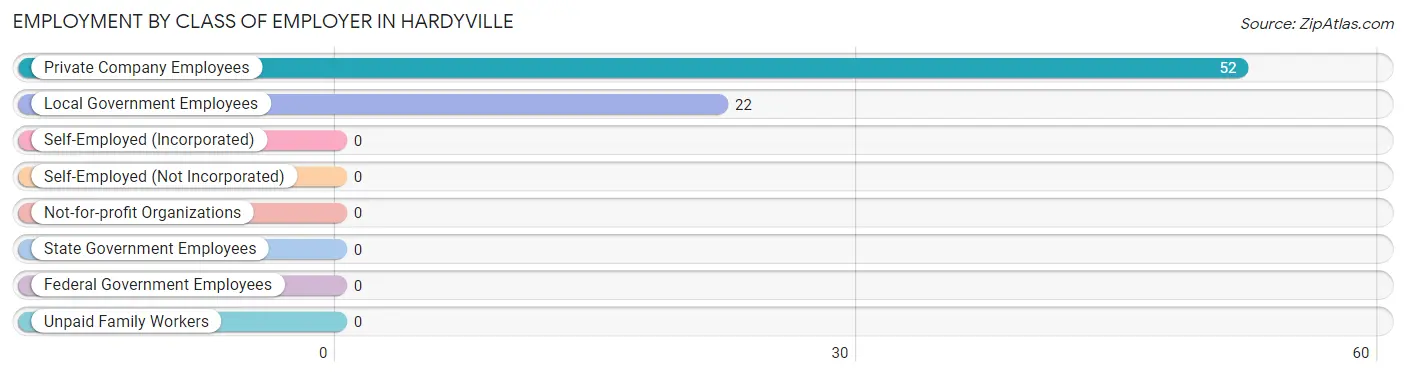
| Employer Class | # Employees | % Employees |
| Private Company Employees | 52 | 70.3% |
| Self-Employed (Incorporated) | 0 | 0.0% |
| Self-Employed (Not Incorporated) | 0 | 0.0% |
| Not-for-profit Organizations | 0 | 0.0% |
| Local Government Employees | 22 | 29.7% |
| State Government Employees | 0 | 0.0% |
| Federal Government Employees | 0 | 0.0% |
| Unpaid Family Workers | 0 | 0.0% |
| Total | 74 | 100.0% |
Employment Status by Age in Hardyville
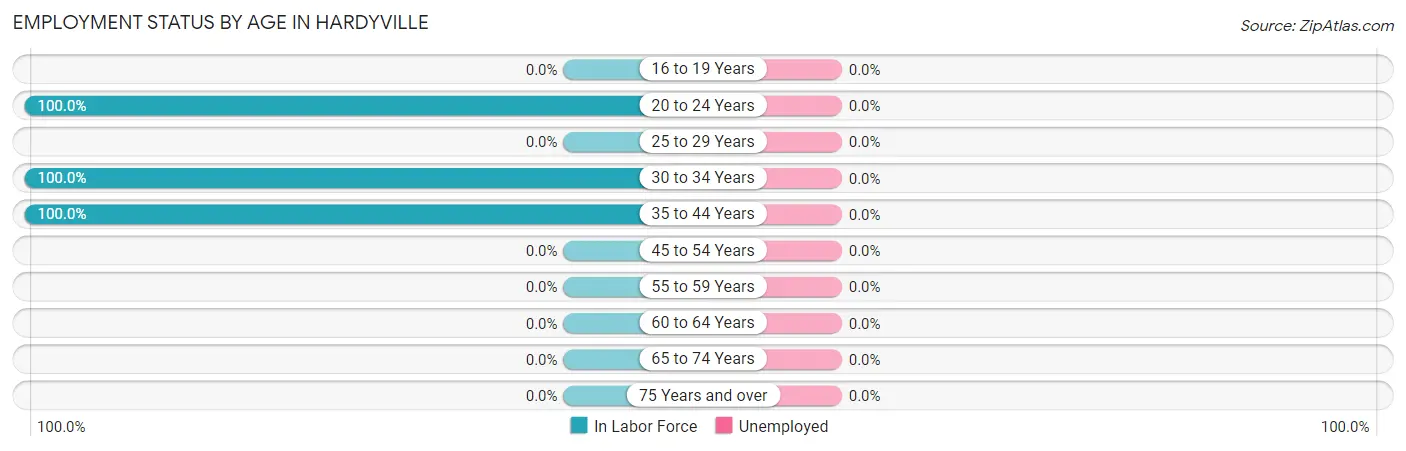
| Age Bracket | In Labor Force | Unemployed |
| 16 to 19 Years | 0 (0.0%) | 0 (0.0%) |
| 20 to 24 Years | 7 (100.0%) | 0 (0.0%) |
| 25 to 29 Years | 0 (0.0%) | 0 (0.0%) |
| 30 to 34 Years | 19 (100.0%) | 0 (0.0%) |
| 35 to 44 Years | 48 (100.0%) | 0 (0.0%) |
| 45 to 54 Years | 0 (0.0%) | 0 (0.0%) |
| 55 to 59 Years | 0 (0.0%) | 0 (0.0%) |
| 60 to 64 Years | 0 (0.0%) | 0 (0.0%) |
| 65 to 74 Years | 0 (0.0%) | 0 (0.0%) |
| 75 Years and over | 0 (0.0%) | 0 (0.0%) |
| Total | 74 (46.8%) | 0 (0.0%) |
Employment Status by Educational Attainment in Hardyville
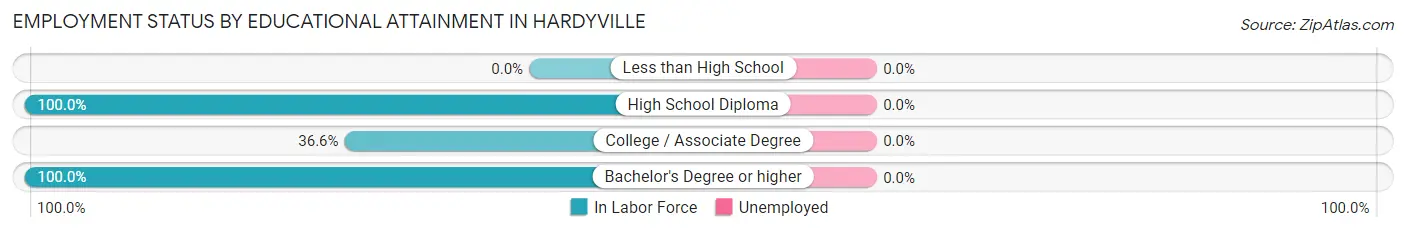
| Educational Attainment | In Labor Force | Unemployed |
| Less than High School | 0 (0.0%) | 0 (0.0%) |
| High School Diploma | 19 (100.0%) | 0 (0.0%) |
| College / Associate Degree | 15 (36.6%) | 0 (0.0%) |
| Bachelor's Degree or higher | 33 (100.0%) | 0 (0.0%) |
| Total | 67 (56.3%) | 0 (0.0%) |
Employment Occupations by Sex in Hardyville
Management, Business, Science and Arts Occupations
The most common Management, Business, Science and Arts occupations in Hardyville are Management (19 | 25.7%), Business & Financial (15 | 20.3%), Community & Social Service (7 | 9.5%), and Education Instruction & Library (7 | 9.5%).
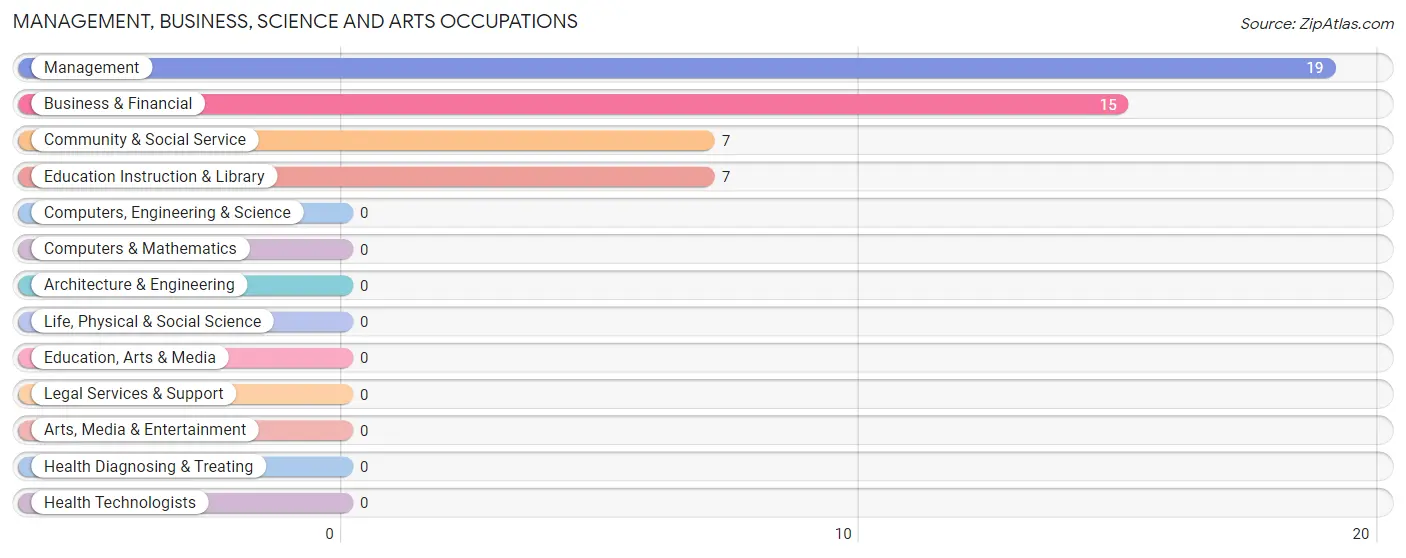
Management, Business, Science and Arts Occupations by Sex
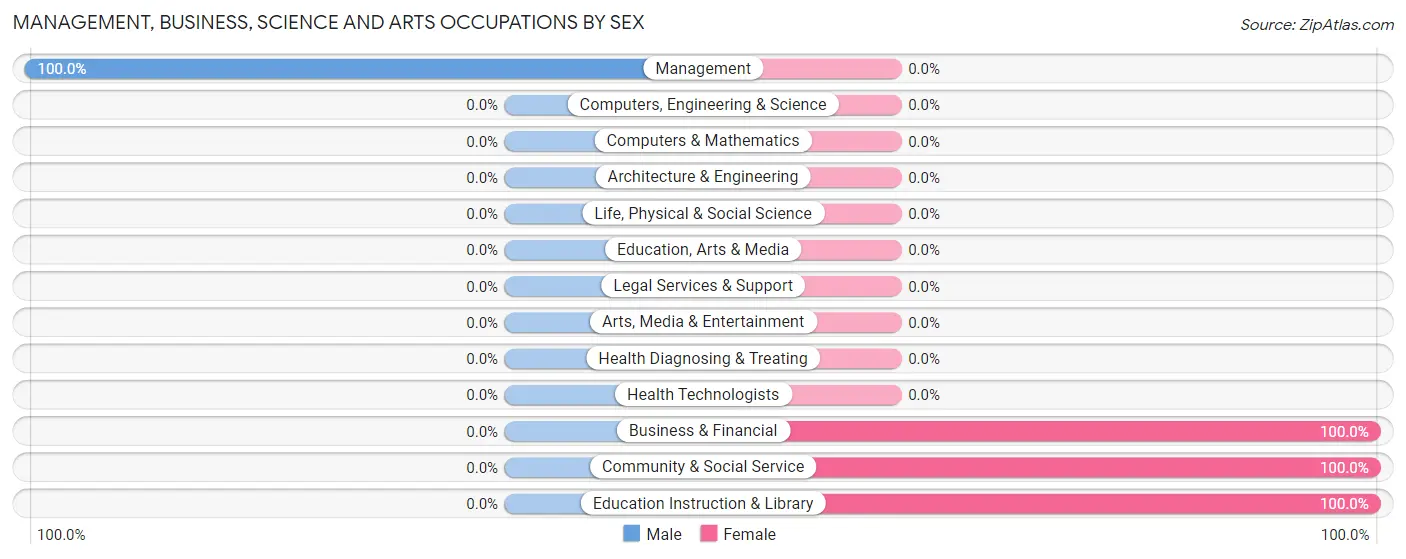
| Occupation | Male | Female |
| Management | 19 (100.0%) | 0 (0.0%) |
| Business & Financial | 0 (0.0%) | 15 (100.0%) |
| Computers, Engineering & Science | 0 (0.0%) | 0 (0.0%) |
| Computers & Mathematics | 0 (0.0%) | 0 (0.0%) |
| Architecture & Engineering | 0 (0.0%) | 0 (0.0%) |
| Life, Physical & Social Science | 0 (0.0%) | 0 (0.0%) |
| Community & Social Service | 0 (0.0%) | 7 (100.0%) |
| Education, Arts & Media | 0 (0.0%) | 0 (0.0%) |
| Legal Services & Support | 0 (0.0%) | 0 (0.0%) |
| Education Instruction & Library | 0 (0.0%) | 7 (100.0%) |
| Arts, Media & Entertainment | 0 (0.0%) | 0 (0.0%) |
| Health Diagnosing & Treating | 0 (0.0%) | 0 (0.0%) |
| Health Technologists | 0 (0.0%) | 0 (0.0%) |
| Total (Category) | 19 (46.3%) | 22 (53.7%) |
| Total (Overall) | 52 (70.3%) | 22 (29.7%) |
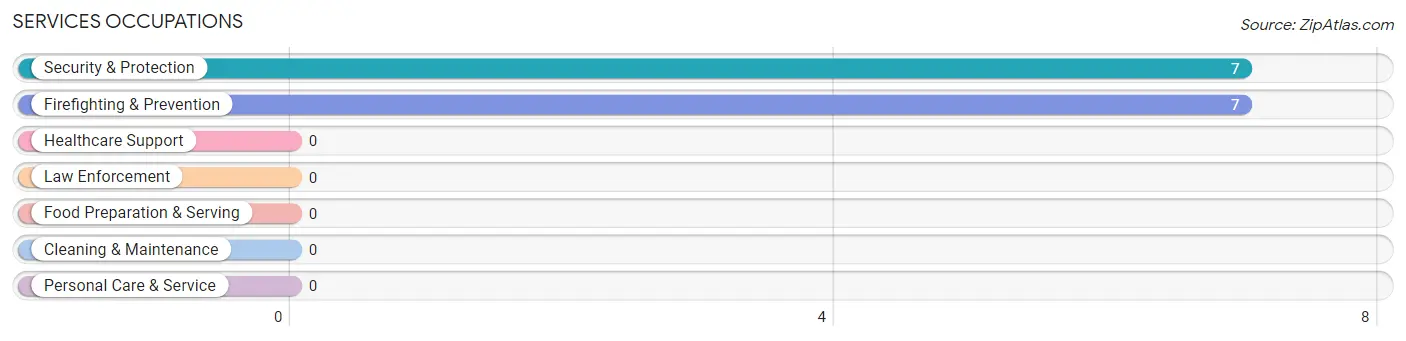
Services Occupations
The most common Services occupations in Hardyville are Security & Protection (7 | 9.5%), and Firefighting & Prevention (7 | 9.5%).
Services Occupations by Sex
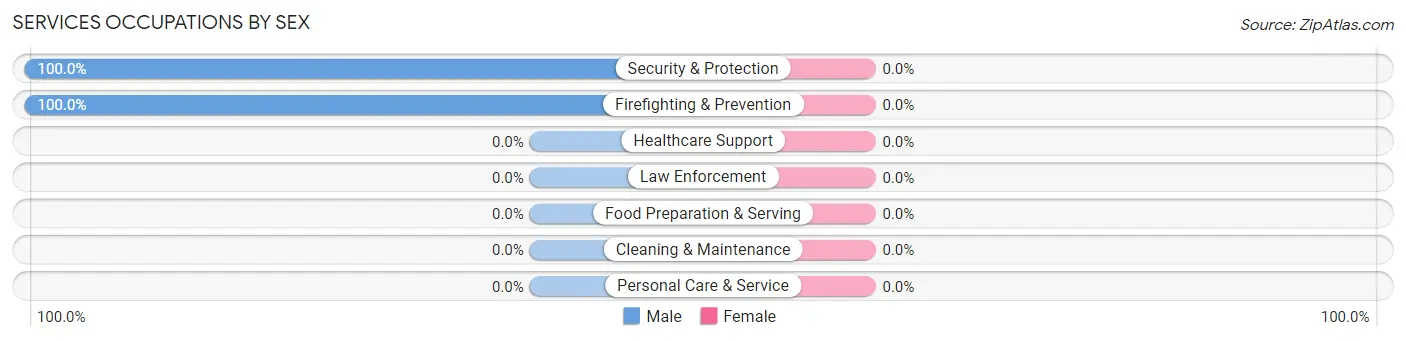
| Occupation | Male | Female |
| Healthcare Support | 0 (0.0%) | 0 (0.0%) |
| Security & Protection | 7 (100.0%) | 0 (0.0%) |
| Firefighting & Prevention | 7 (100.0%) | 0 (0.0%) |
| Law Enforcement | 0 (0.0%) | 0 (0.0%) |
| Food Preparation & Serving | 0 (0.0%) | 0 (0.0%) |
| Cleaning & Maintenance | 0 (0.0%) | 0 (0.0%) |
| Personal Care & Service | 0 (0.0%) | 0 (0.0%) |
| Total (Category) | 7 (100.0%) | 0 (0.0%) |
| Total (Overall) | 52 (70.3%) | 22 (29.7%) |
Sales and Office Occupations
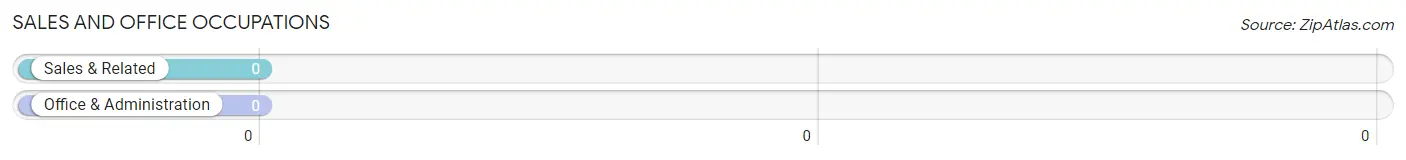
Sales and Office Occupations by Sex
| Occupation | Male | Female |
| Sales & Related | 0 (0.0%) | 0 (0.0%) |
| Office & Administration | 0 (0.0%) | 0 (0.0%) |
| Total (Category) | 0 (0.0%) | 0 (0.0%) |
| Total (Overall) | 52 (70.3%) | 22 (29.7%) |
Natural Resources, Construction and Maintenance Occupations
The most common Natural Resources, Construction and Maintenance occupations in Hardyville are , and Installation, Maintenance & Repair (26 | 35.1%).
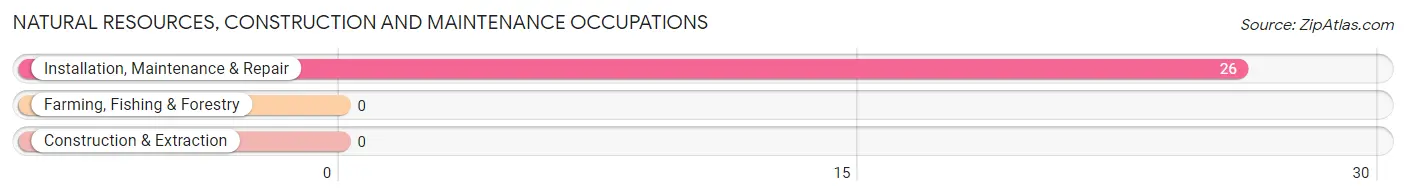
Natural Resources, Construction and Maintenance Occupations by Sex
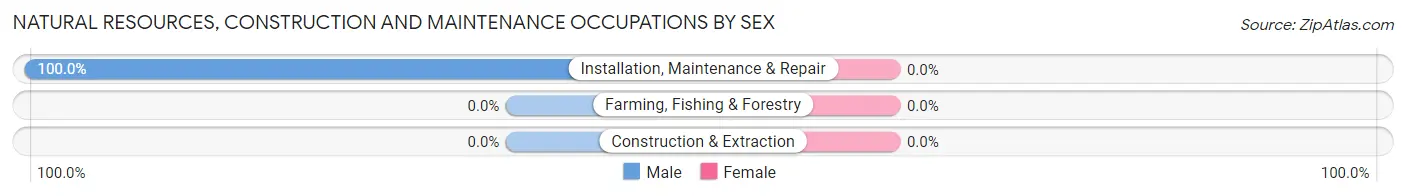
| Occupation | Male | Female |
| Farming, Fishing & Forestry | 0 (0.0%) | 0 (0.0%) |
| Construction & Extraction | 0 (0.0%) | 0 (0.0%) |
| Installation, Maintenance & Repair | 26 (100.0%) | 0 (0.0%) |
| Total (Category) | 26 (100.0%) | 0 (0.0%) |
| Total (Overall) | 52 (70.3%) | 22 (29.7%) |
Production, Transportation and Moving Occupations
Production, Transportation and Moving Occupations by Sex
| Occupation | Male | Female |
| Production | 0 (0.0%) | 0 (0.0%) |
| Transportation | 0 (0.0%) | 0 (0.0%) |
| Material Moving | 0 (0.0%) | 0 (0.0%) |
| Total (Category) | 0 (0.0%) | 0 (0.0%) |
| Total (Overall) | 52 (70.3%) | 22 (29.7%) |
Employment Industries by Sex in Hardyville
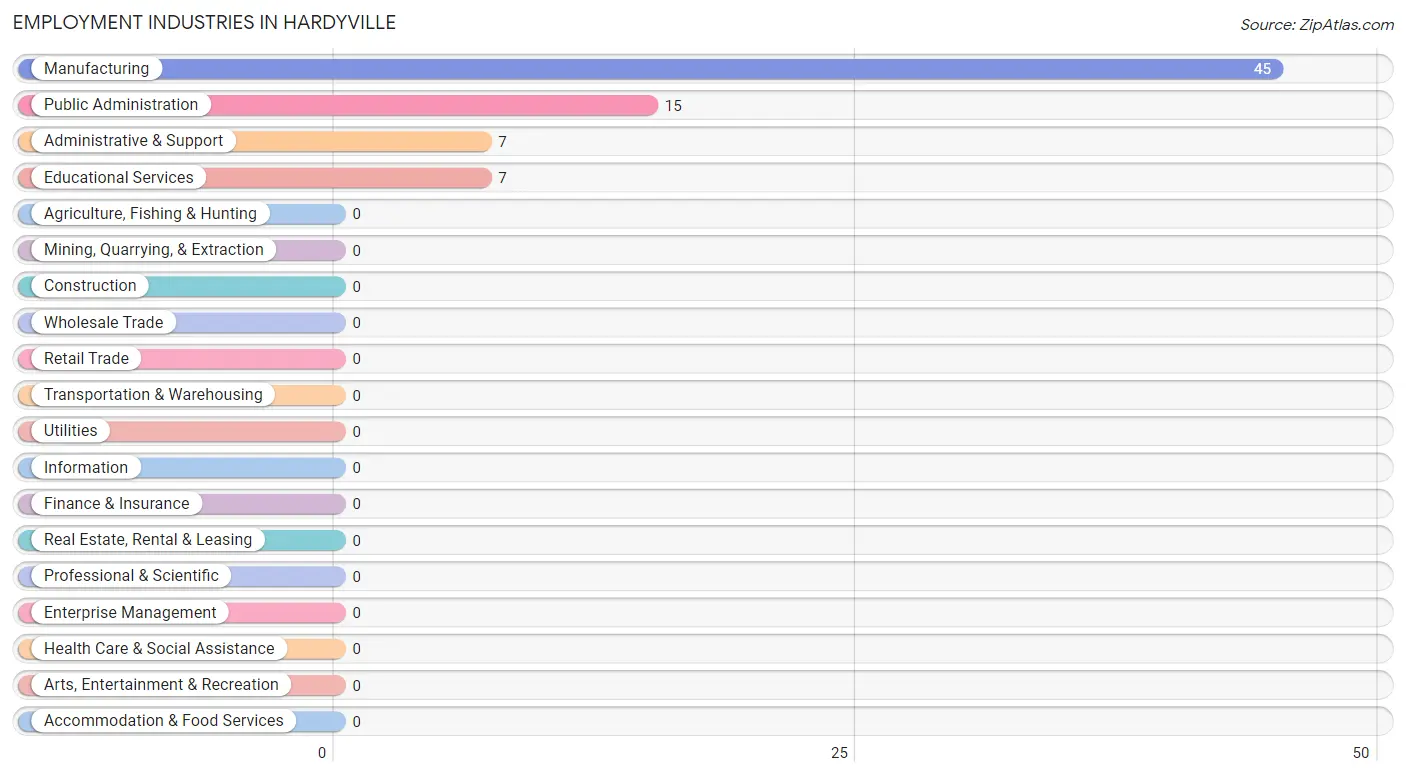
Employment Industries in Hardyville
The major employment industries in Hardyville include Manufacturing (45 | 60.8%), Public Administration (15 | 20.3%), Administrative & Support (7 | 9.5%), and Educational Services (7 | 9.5%).
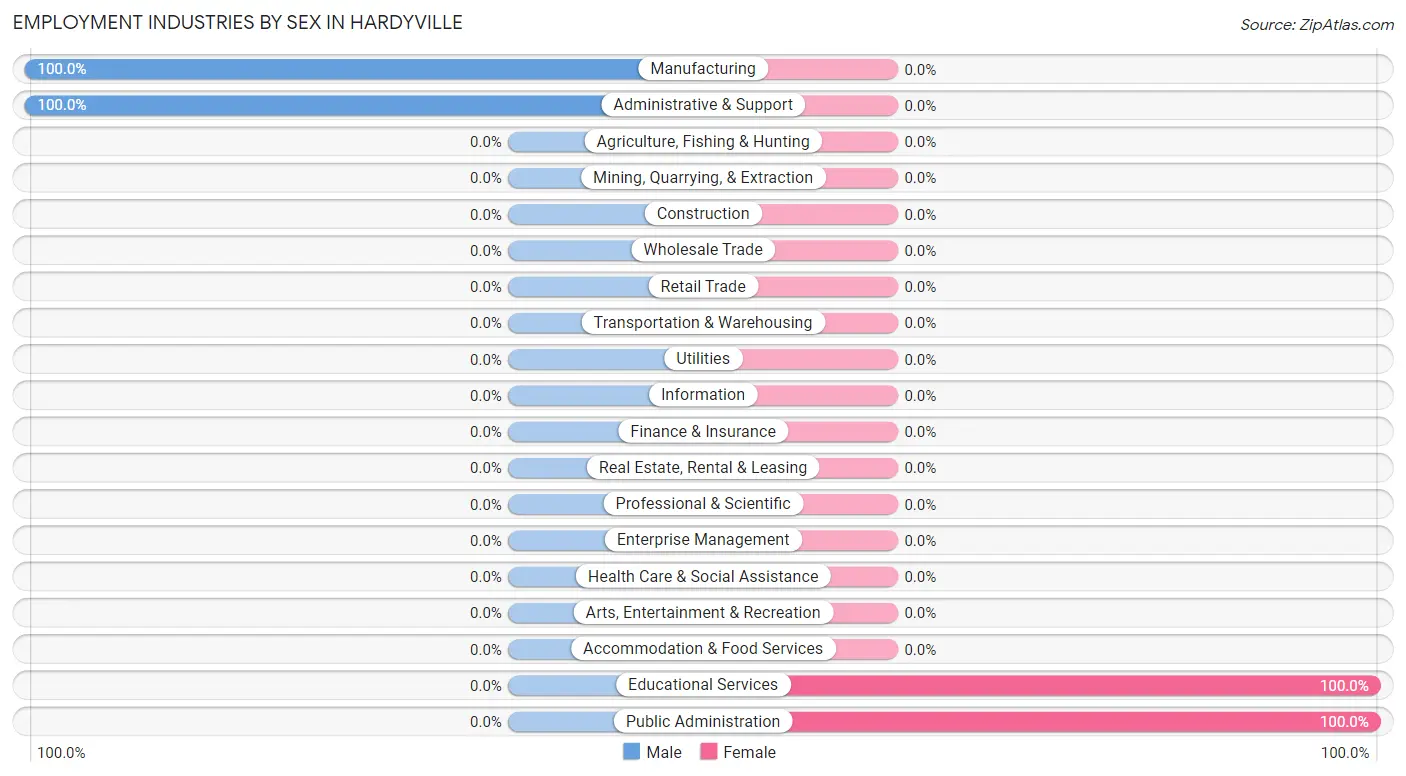
Employment Industries by Sex in Hardyville
The Hardyville industries that see more men than women are Manufacturing (100.0%), and Administrative & Support (100.0%), whereas the industries that tend to have a higher number of women are Educational Services (100.0%), and Public Administration (100.0%).
| Industry | Male | Female |
| Agriculture, Fishing & Hunting | 0 (0.0%) | 0 (0.0%) |
| Mining, Quarrying, & Extraction | 0 (0.0%) | 0 (0.0%) |
| Construction | 0 (0.0%) | 0 (0.0%) |
| Manufacturing | 45 (100.0%) | 0 (0.0%) |
| Wholesale Trade | 0 (0.0%) | 0 (0.0%) |
| Retail Trade | 0 (0.0%) | 0 (0.0%) |
| Transportation & Warehousing | 0 (0.0%) | 0 (0.0%) |
| Utilities | 0 (0.0%) | 0 (0.0%) |
| Information | 0 (0.0%) | 0 (0.0%) |
| Finance & Insurance | 0 (0.0%) | 0 (0.0%) |
| Real Estate, Rental & Leasing | 0 (0.0%) | 0 (0.0%) |
| Professional & Scientific | 0 (0.0%) | 0 (0.0%) |
| Enterprise Management | 0 (0.0%) | 0 (0.0%) |
| Administrative & Support | 7 (100.0%) | 0 (0.0%) |
| Educational Services | 0 (0.0%) | 7 (100.0%) |
| Health Care & Social Assistance | 0 (0.0%) | 0 (0.0%) |
| Arts, Entertainment & Recreation | 0 (0.0%) | 0 (0.0%) |
| Accommodation & Food Services | 0 (0.0%) | 0 (0.0%) |
| Public Administration | 0 (0.0%) | 15 (100.0%) |
| Total | 52 (70.3%) | 22 (29.7%) |
Education in Hardyville
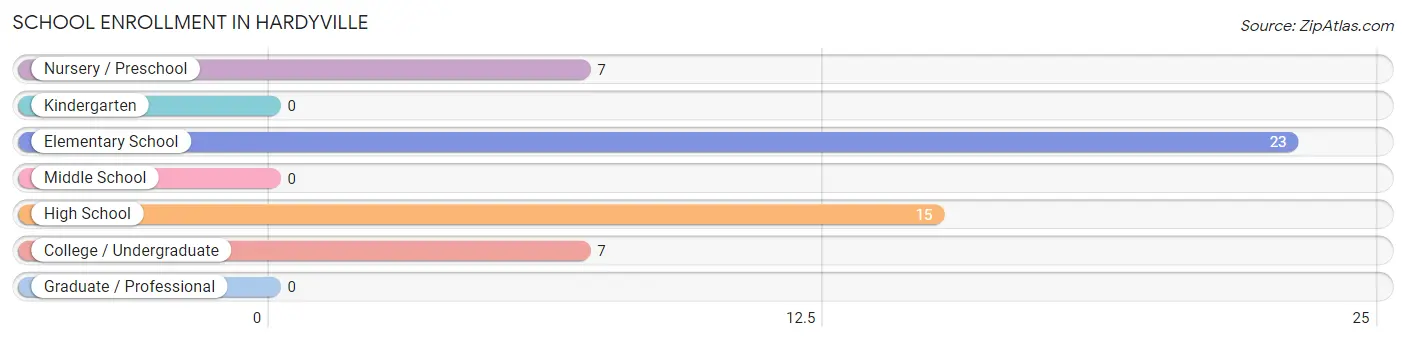
School Enrollment in Hardyville
The most common levels of schooling among the 52 students in Hardyville are elementary school (23 | 44.2%), high school (15 | 28.8%), and nursery / preschool (7 | 13.5%).
| School Level | # Students | % Students |
| Nursery / Preschool | 7 | 13.5% |
| Kindergarten | 0 | 0.0% |
| Elementary School | 23 | 44.2% |
| Middle School | 0 | 0.0% |
| High School | 15 | 28.8% |
| College / Undergraduate | 7 | 13.5% |
| Graduate / Professional | 0 | 0.0% |
| Total | 52 | 100.0% |
School Enrollment by Age by Funding Source in Hardyville
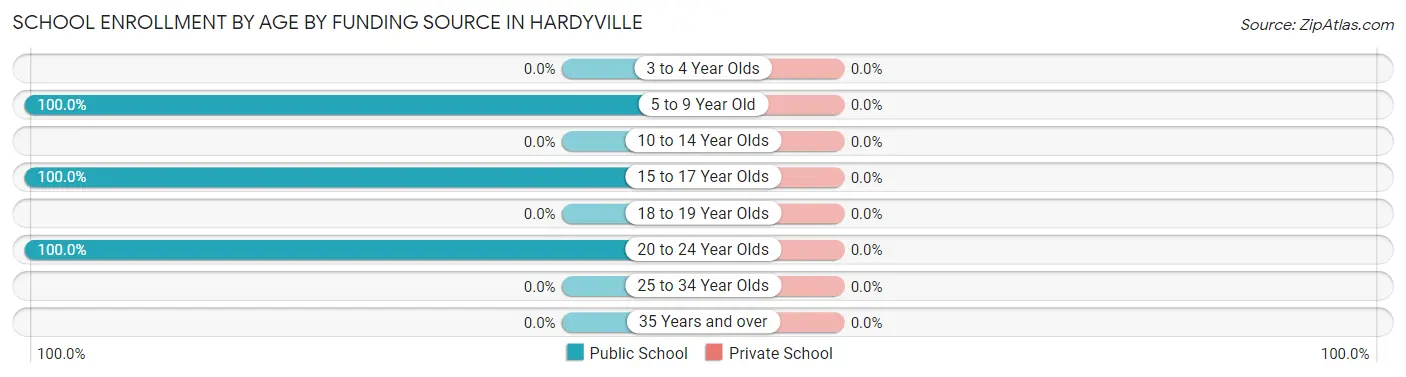
| Age Bracket | Public School | Private School |
| 3 to 4 Year Olds | 0 (0.0%) | 0 (0.0%) |
| 5 to 9 Year Old | 30 (100.0%) | 0 (0.0%) |
| 10 to 14 Year Olds | 0 (0.0%) | 0 (0.0%) |
| 15 to 17 Year Olds | 15 (100.0%) | 0 (0.0%) |
| 18 to 19 Year Olds | 0 (0.0%) | 0 (0.0%) |
| 20 to 24 Year Olds | 7 (100.0%) | 0 (0.0%) |
| 25 to 34 Year Olds | 0 (0.0%) | 0 (0.0%) |
| 35 Years and over | 0 (0.0%) | 0 (0.0%) |
| Total | 52 (100.0%) | 0 (0.0%) |
Educational Attainment by Field of Study in Hardyville
Business (26 | 78.8%), and visual & performing arts (7 | 21.2%) are the most common fields of study among 33 individuals in Hardyville who have obtained a bachelor's degree or higher.
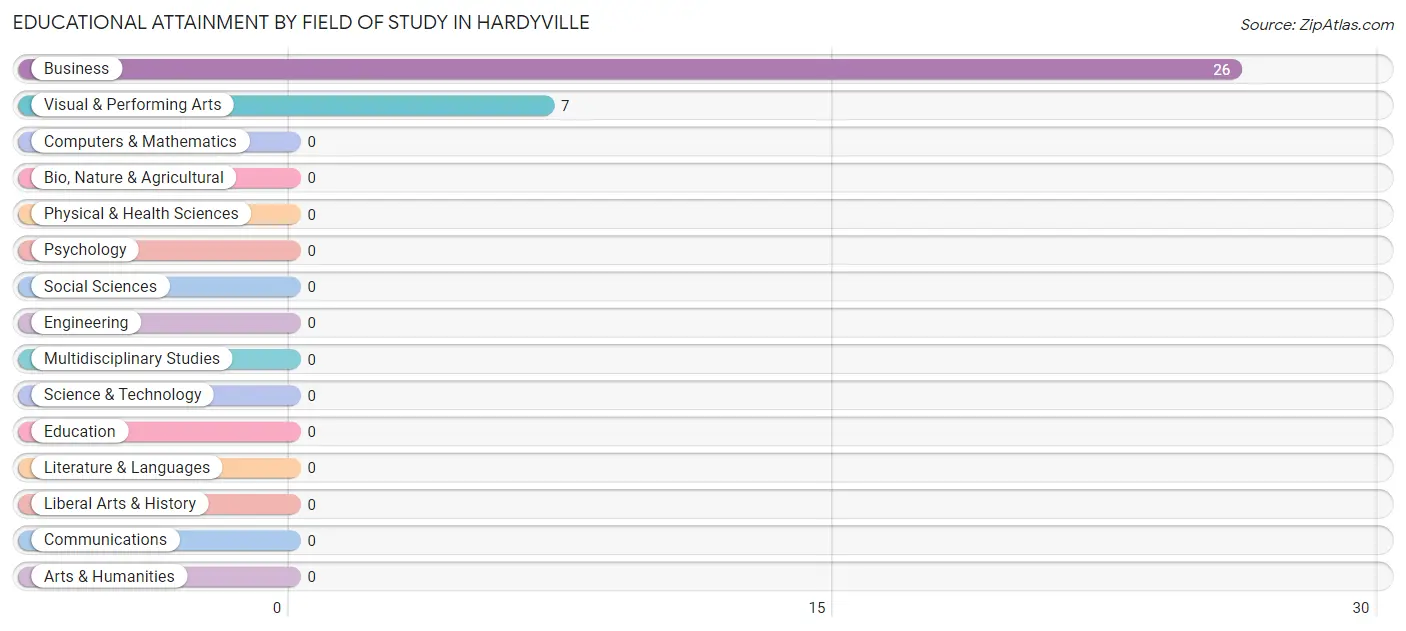
| Field of Study | # Graduates | % Graduates |
| Computers & Mathematics | 0 | 0.0% |
| Bio, Nature & Agricultural | 0 | 0.0% |
| Physical & Health Sciences | 0 | 0.0% |
| Psychology | 0 | 0.0% |
| Social Sciences | 0 | 0.0% |
| Engineering | 0 | 0.0% |
| Multidisciplinary Studies | 0 | 0.0% |
| Science & Technology | 0 | 0.0% |
| Business | 26 | 78.8% |
| Education | 0 | 0.0% |
| Literature & Languages | 0 | 0.0% |
| Liberal Arts & History | 0 | 0.0% |
| Visual & Performing Arts | 7 | 21.2% |
| Communications | 0 | 0.0% |
| Arts & Humanities | 0 | 0.0% |
| Total | 33 | 100.0% |
Transportation & Commute in Hardyville
Vehicle Availability by Sex in Hardyville
The most prevalent vehicle ownership categories in Hardyville are males with 1 vehicle (26, accounting for 50.0%) and females with 1 vehicle (7, making up 118.2%).
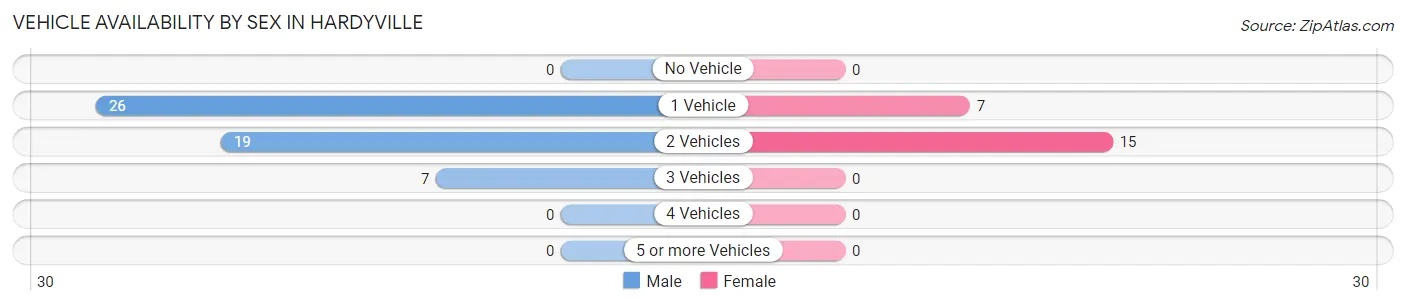
| Vehicles Available | Male | Female |
| No Vehicle | 0 (0.0%) | 0 (0.0%) |
| 1 Vehicle | 26 (50.0%) | 7 (31.8%) |
| 2 Vehicles | 19 (36.5%) | 15 (68.2%) |
| 3 Vehicles | 7 (13.5%) | 0 (0.0%) |
| 4 Vehicles | 0 (0.0%) | 0 (0.0%) |
| 5 or more Vehicles | 0 (0.0%) | 0 (0.0%) |
| Total | 52 (100.0%) | 22 (100.0%) |
Commute Time in Hardyville
The most frequently occuring commute durations in Hardyville are 45 to 59 minutes (34 commuters, 46.0%), 15 to 19 minutes (26 commuters, 35.1%), and less than 5 minutes (7 commuters, 9.5%).
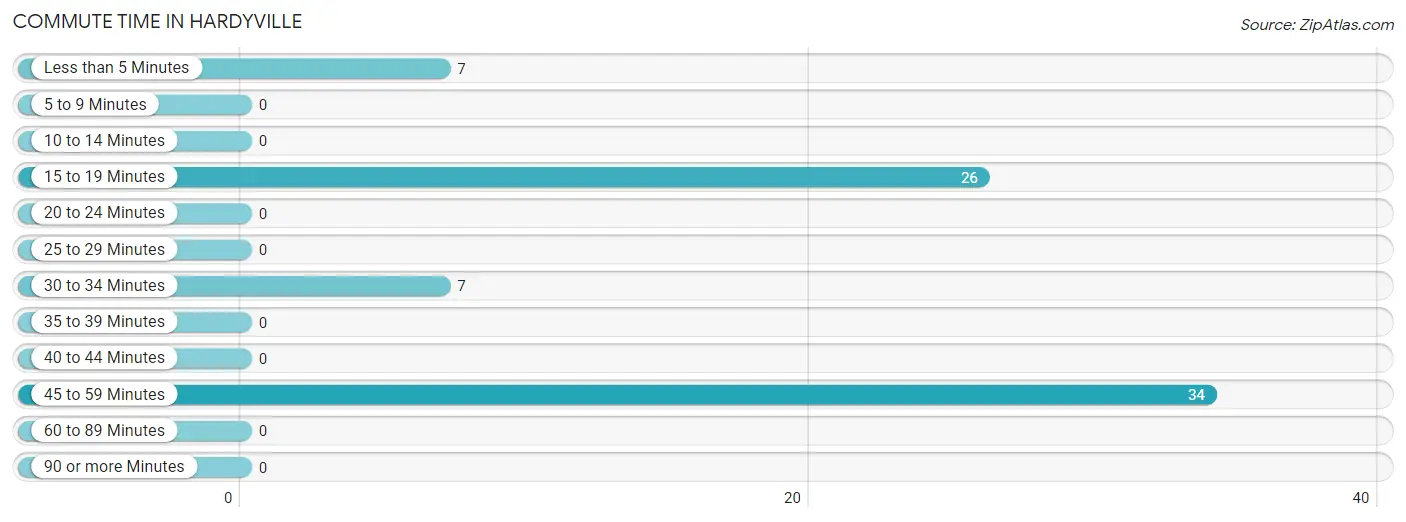
| Commute Time | # Commuters | % Commuters |
| Less than 5 Minutes | 7 | 9.5% |
| 5 to 9 Minutes | 0 | 0.0% |
| 10 to 14 Minutes | 0 | 0.0% |
| 15 to 19 Minutes | 26 | 35.1% |
| 20 to 24 Minutes | 0 | 0.0% |
| 25 to 29 Minutes | 0 | 0.0% |
| 30 to 34 Minutes | 7 | 9.5% |
| 35 to 39 Minutes | 0 | 0.0% |
| 40 to 44 Minutes | 0 | 0.0% |
| 45 to 59 Minutes | 34 | 46.0% |
| 60 to 89 Minutes | 0 | 0.0% |
| 90 or more Minutes | 0 | 0.0% |
Commute Time by Sex in Hardyville
The most common commute times in Hardyville are 15 to 19 minutes (26 commuters, 50.0%) for males and 45 to 59 minutes (15 commuters, 68.2%) for females.
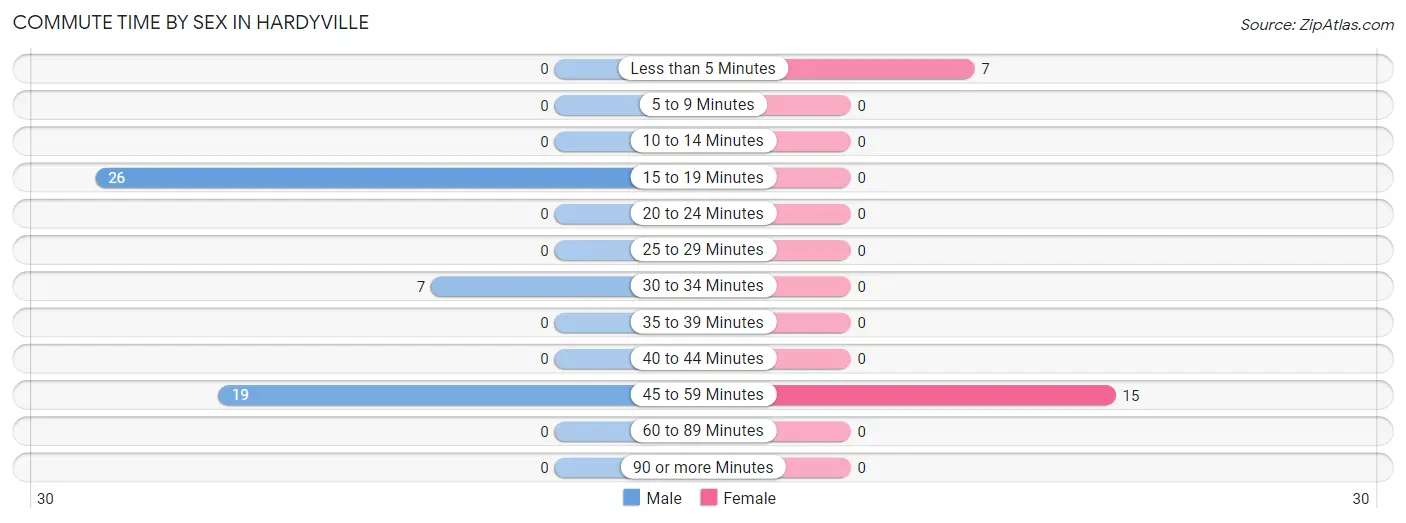
| Commute Time | Male | Female |
| Less than 5 Minutes | 0 (0.0%) | 7 (31.8%) |
| 5 to 9 Minutes | 0 (0.0%) | 0 (0.0%) |
| 10 to 14 Minutes | 0 (0.0%) | 0 (0.0%) |
| 15 to 19 Minutes | 26 (50.0%) | 0 (0.0%) |
| 20 to 24 Minutes | 0 (0.0%) | 0 (0.0%) |
| 25 to 29 Minutes | 0 (0.0%) | 0 (0.0%) |
| 30 to 34 Minutes | 7 (13.5%) | 0 (0.0%) |
| 35 to 39 Minutes | 0 (0.0%) | 0 (0.0%) |
| 40 to 44 Minutes | 0 (0.0%) | 0 (0.0%) |
| 45 to 59 Minutes | 19 (36.5%) | 15 (68.2%) |
| 60 to 89 Minutes | 0 (0.0%) | 0 (0.0%) |
| 90 or more Minutes | 0 (0.0%) | 0 (0.0%) |
Time of Departure to Work by Sex in Hardyville
The most frequent times of departure to work in Hardyville are 6:00 AM to 6:29 AM (45, 86.5%) for males and 6:30 AM to 6:59 AM (15, 68.2%) for females.
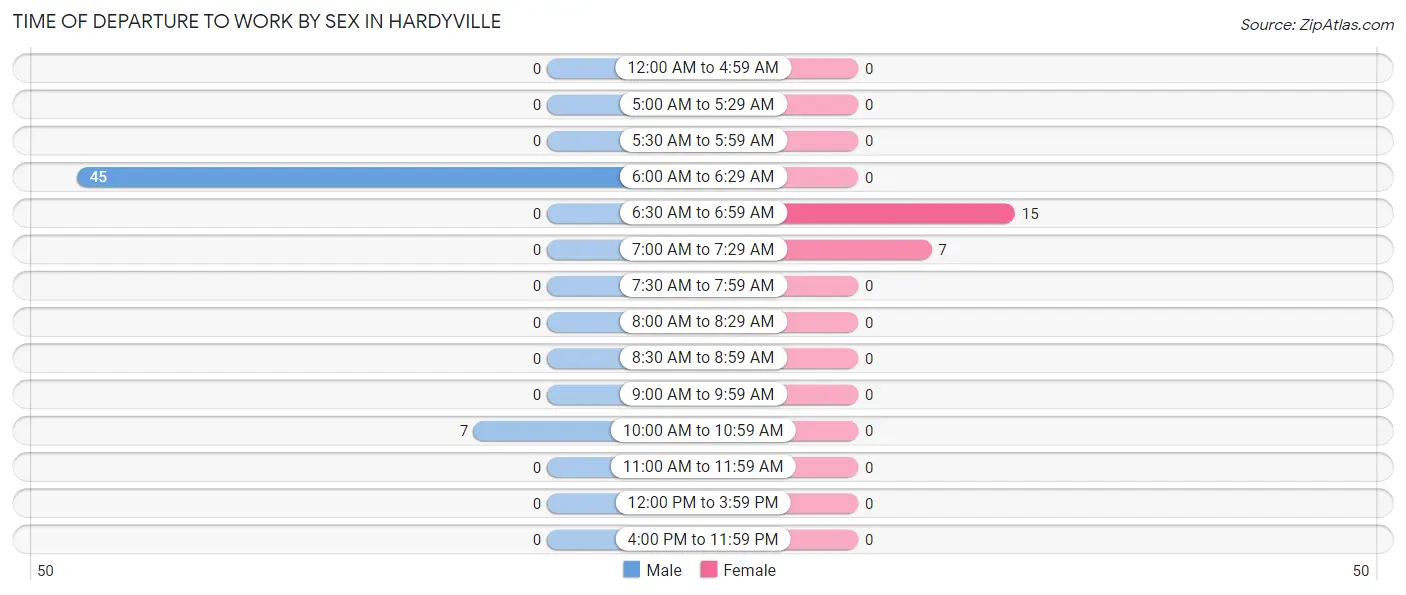
| Time of Departure | Male | Female |
| 12:00 AM to 4:59 AM | 0 (0.0%) | 0 (0.0%) |
| 5:00 AM to 5:29 AM | 0 (0.0%) | 0 (0.0%) |
| 5:30 AM to 5:59 AM | 0 (0.0%) | 0 (0.0%) |
| 6:00 AM to 6:29 AM | 45 (86.5%) | 0 (0.0%) |
| 6:30 AM to 6:59 AM | 0 (0.0%) | 15 (68.2%) |
| 7:00 AM to 7:29 AM | 0 (0.0%) | 7 (31.8%) |
| 7:30 AM to 7:59 AM | 0 (0.0%) | 0 (0.0%) |
| 8:00 AM to 8:29 AM | 0 (0.0%) | 0 (0.0%) |
| 8:30 AM to 8:59 AM | 0 (0.0%) | 0 (0.0%) |
| 9:00 AM to 9:59 AM | 0 (0.0%) | 0 (0.0%) |
| 10:00 AM to 10:59 AM | 7 (13.5%) | 0 (0.0%) |
| 11:00 AM to 11:59 AM | 0 (0.0%) | 0 (0.0%) |
| 12:00 PM to 3:59 PM | 0 (0.0%) | 0 (0.0%) |
| 4:00 PM to 11:59 PM | 0 (0.0%) | 0 (0.0%) |
| Total | 52 (100.0%) | 22 (100.0%) |
Housing Occupancy in Hardyville
Occupancy by Ownership in Hardyville
Of the total 126 dwellings in Hardyville, owner-occupied units account for 119 (94.4%), while renter-occupied units make up 7 (5.6%).
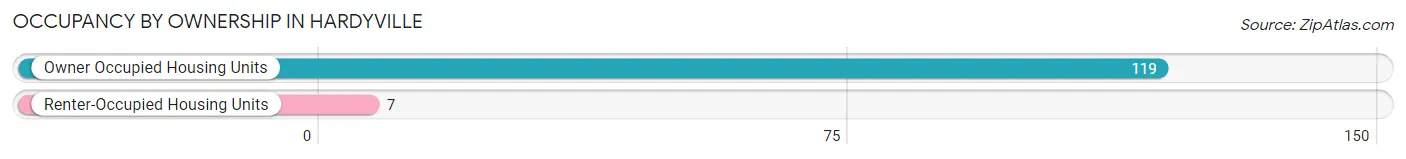
| Occupancy | # Housing Units | % Housing Units |
| Owner Occupied Housing Units | 119 | 94.4% |
| Renter-Occupied Housing Units | 7 | 5.6% |
| Total Occupied Housing Units | 126 | 100.0% |
Occupancy by Household Size in Hardyville
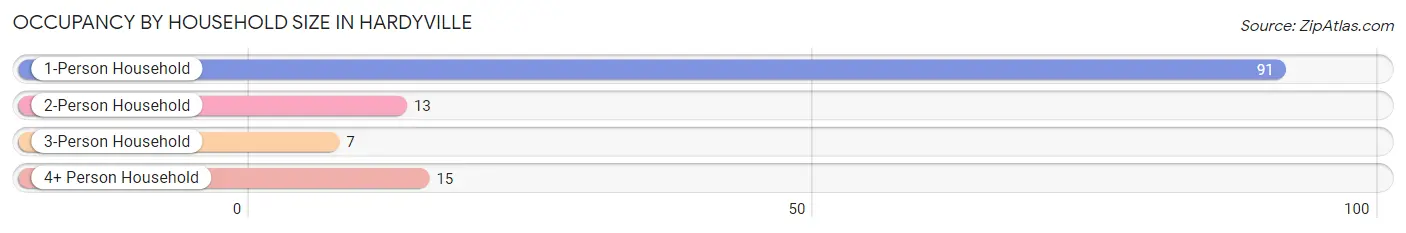
| Household Size | # Housing Units | % Housing Units |
| 1-Person Household | 91 | 72.2% |
| 2-Person Household | 13 | 10.3% |
| 3-Person Household | 7 | 5.6% |
| 4+ Person Household | 15 | 11.9% |
| Total Housing Units | 126 | 100.0% |
Occupancy by Ownership by Household Size in Hardyville
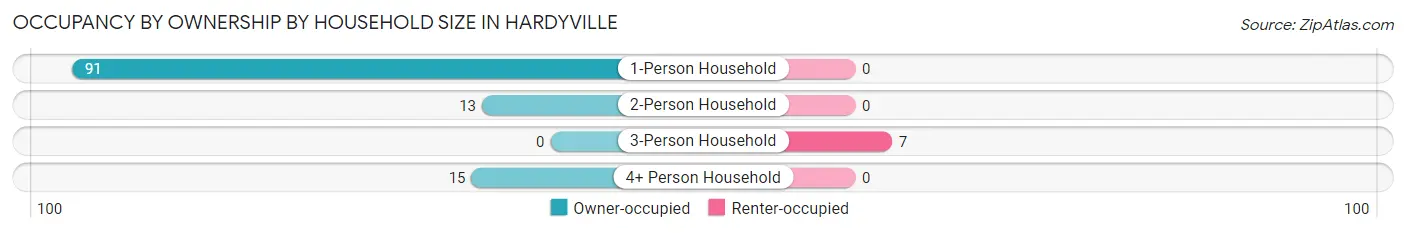
| Household Size | Owner-occupied | Renter-occupied |
| 1-Person Household | 91 (100.0%) | 0 (0.0%) |
| 2-Person Household | 13 (100.0%) | 0 (0.0%) |
| 3-Person Household | 0 (0.0%) | 7 (100.0%) |
| 4+ Person Household | 15 (100.0%) | 0 (0.0%) |
| Total Housing Units | 119 (94.4%) | 7 (5.6%) |
Occupancy by Educational Attainment in Hardyville
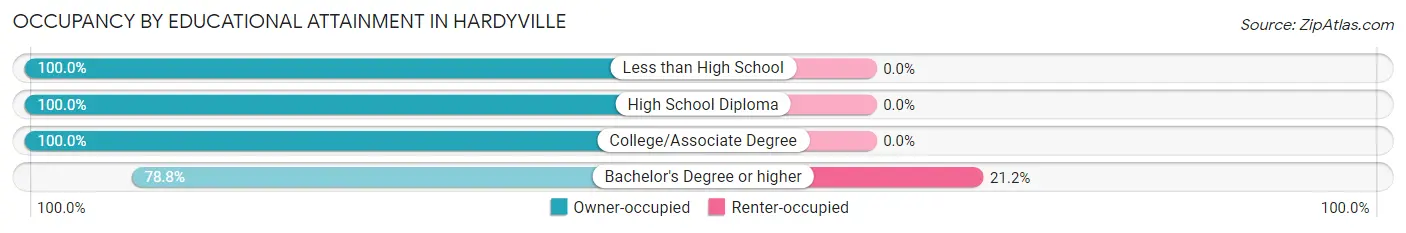
| Household Size | Owner-occupied | Renter-occupied |
| Less than High School | 26 (100.0%) | 0 (0.0%) |
| High School Diploma | 32 (100.0%) | 0 (0.0%) |
| College/Associate Degree | 35 (100.0%) | 0 (0.0%) |
| Bachelor's Degree or higher | 26 (78.8%) | 7 (21.2%) |
Occupancy by Age of Householder in Hardyville
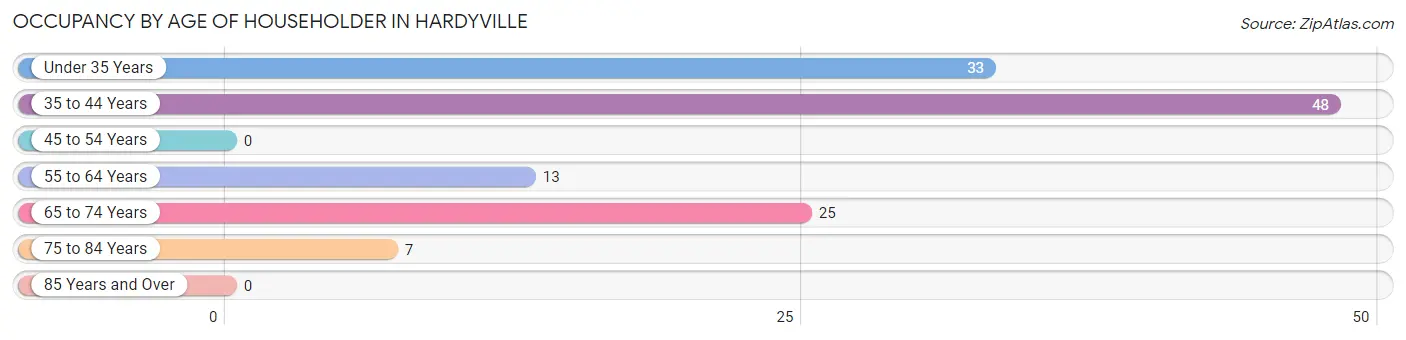
| Age Bracket | # Households | % Households |
| Under 35 Years | 33 | 26.2% |
| 35 to 44 Years | 48 | 38.1% |
| 45 to 54 Years | 0 | 0.0% |
| 55 to 64 Years | 13 | 10.3% |
| 65 to 74 Years | 25 | 19.8% |
| 75 to 84 Years | 7 | 5.6% |
| 85 Years and Over | 0 | 0.0% |
| Total | 126 | 100.0% |
Housing Finances in Hardyville
Median Income by Occupancy in Hardyville
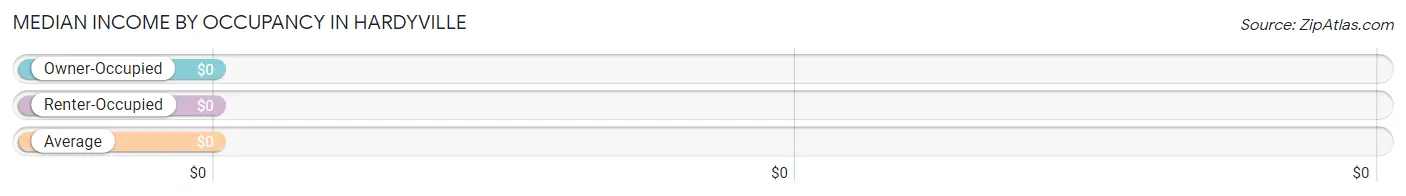
| Occupancy Type | # Households | Median Income |
| Owner-Occupied | 119 (94.4%) | $0 |
| Renter-Occupied | 7 (5.6%) | $0 |
| Average | 126 (100.0%) | $0 |
Occupancy by Householder Income Bracket in Hardyville
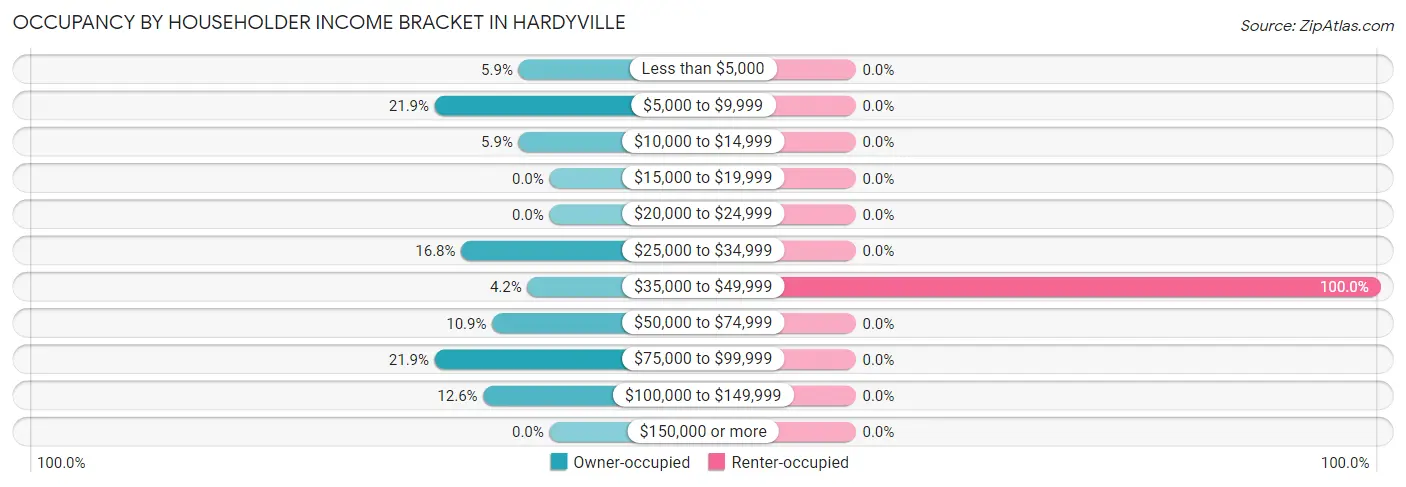
| Income Bracket | Owner-occupied | Renter-occupied |
| Less than $5,000 | 7 (5.9%) | 0 (0.0%) |
| $5,000 to $9,999 | 26 (21.8%) | 0 (0.0%) |
| $10,000 to $14,999 | 7 (5.9%) | 0 (0.0%) |
| $15,000 to $19,999 | 0 (0.0%) | 0 (0.0%) |
| $20,000 to $24,999 | 0 (0.0%) | 0 (0.0%) |
| $25,000 to $34,999 | 20 (16.8%) | 0 (0.0%) |
| $35,000 to $49,999 | 5 (4.2%) | 7 (100.0%) |
| $50,000 to $74,999 | 13 (10.9%) | 0 (0.0%) |
| $75,000 to $99,999 | 26 (21.8%) | 0 (0.0%) |
| $100,000 to $149,999 | 15 (12.6%) | 0 (0.0%) |
| $150,000 or more | 0 (0.0%) | 0 (0.0%) |
| Total | 119 (100.0%) | 7 (100.0%) |
Monthly Housing Cost Tiers in Hardyville
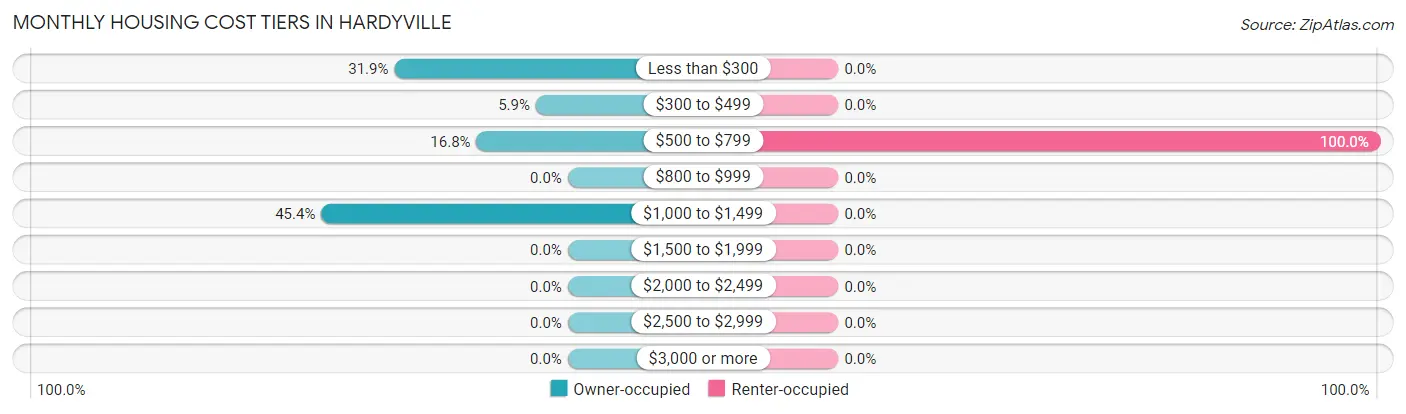
| Monthly Cost | Owner-occupied | Renter-occupied |
| Less than $300 | 38 (31.9%) | 0 (0.0%) |
| $300 to $499 | 7 (5.9%) | 0 (0.0%) |
| $500 to $799 | 20 (16.8%) | 7 (100.0%) |
| $800 to $999 | 0 (0.0%) | 0 (0.0%) |
| $1,000 to $1,499 | 54 (45.4%) | 0 (0.0%) |
| $1,500 to $1,999 | 0 (0.0%) | 0 (0.0%) |
| $2,000 to $2,499 | 0 (0.0%) | 0 (0.0%) |
| $2,500 to $2,999 | 0 (0.0%) | 0 (0.0%) |
| $3,000 or more | 0 (0.0%) | 0 (0.0%) |
| Total | 119 (100.0%) | 7 (100.0%) |
Physical Housing Characteristics in Hardyville
Housing Structures in Hardyville
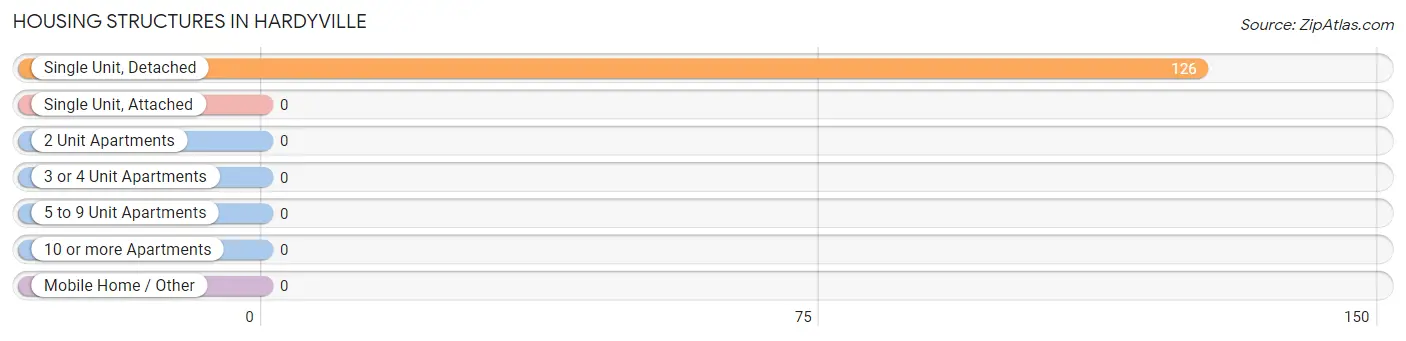
| Structure Type | # Housing Units | % Housing Units |
| Single Unit, Detached | 126 | 100.0% |
| Single Unit, Attached | 0 | 0.0% |
| 2 Unit Apartments | 0 | 0.0% |
| 3 or 4 Unit Apartments | 0 | 0.0% |
| 5 to 9 Unit Apartments | 0 | 0.0% |
| 10 or more Apartments | 0 | 0.0% |
| Mobile Home / Other | 0 | 0.0% |
| Total | 126 | 100.0% |
Housing Structures by Occupancy in Hardyville
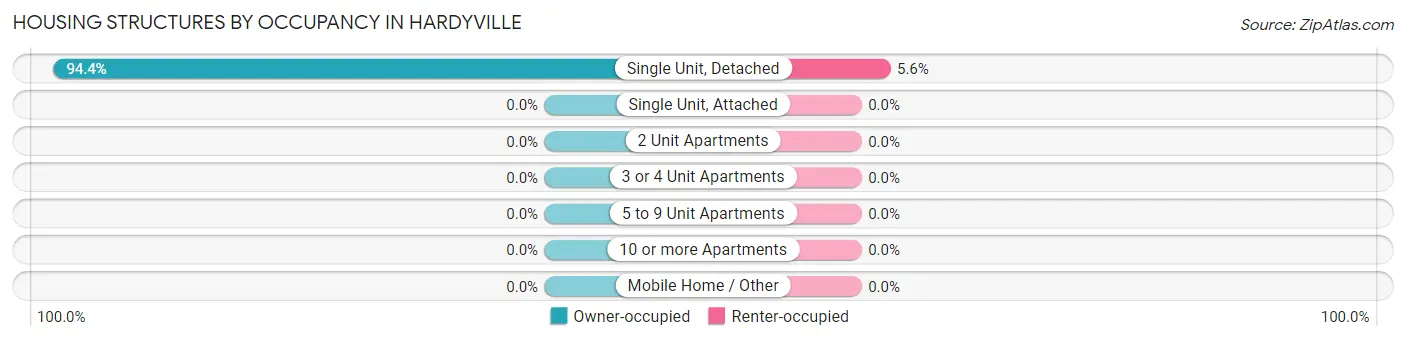
| Structure Type | Owner-occupied | Renter-occupied |
| Single Unit, Detached | 119 (94.4%) | 7 (5.6%) |
| Single Unit, Attached | 0 (0.0%) | 0 (0.0%) |
| 2 Unit Apartments | 0 (0.0%) | 0 (0.0%) |
| 3 or 4 Unit Apartments | 0 (0.0%) | 0 (0.0%) |
| 5 to 9 Unit Apartments | 0 (0.0%) | 0 (0.0%) |
| 10 or more Apartments | 0 (0.0%) | 0 (0.0%) |
| Mobile Home / Other | 0 (0.0%) | 0 (0.0%) |
| Total | 119 (94.4%) | 7 (5.6%) |
Housing Structures by Number of Rooms in Hardyville
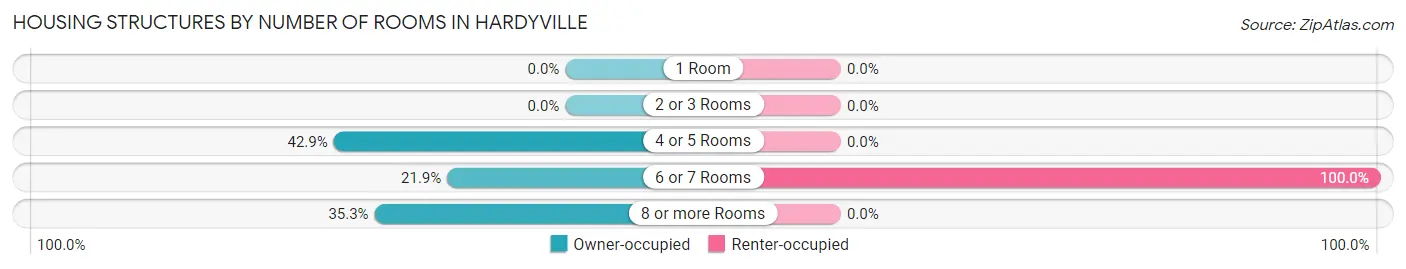
| Number of Rooms | Owner-occupied | Renter-occupied |
| 1 Room | 0 (0.0%) | 0 (0.0%) |
| 2 or 3 Rooms | 0 (0.0%) | 0 (0.0%) |
| 4 or 5 Rooms | 51 (42.9%) | 0 (0.0%) |
| 6 or 7 Rooms | 26 (21.8%) | 7 (100.0%) |
| 8 or more Rooms | 42 (35.3%) | 0 (0.0%) |
| Total | 119 (100.0%) | 7 (100.0%) |
Housing Structure by Heating Type in Hardyville
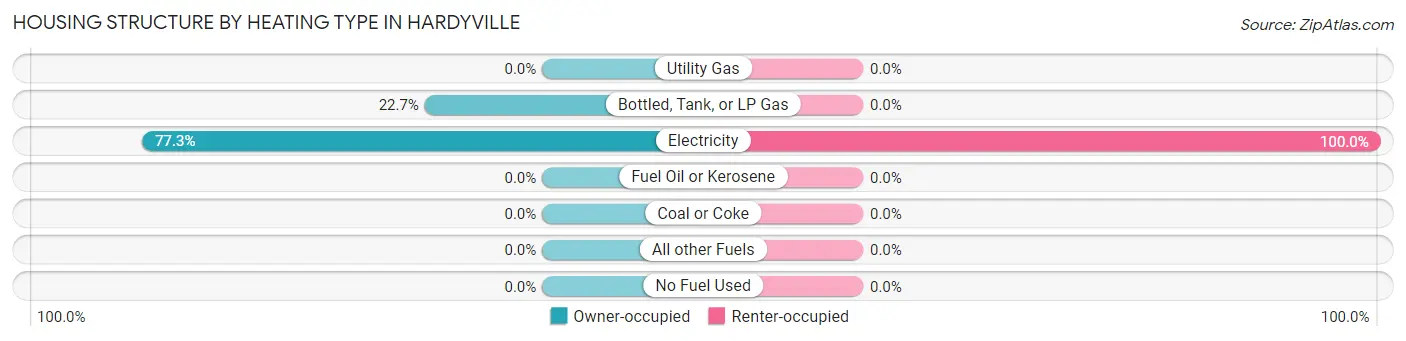
| Heating Type | Owner-occupied | Renter-occupied |
| Utility Gas | 0 (0.0%) | 0 (0.0%) |
| Bottled, Tank, or LP Gas | 27 (22.7%) | 0 (0.0%) |
| Electricity | 92 (77.3%) | 7 (100.0%) |
| Fuel Oil or Kerosene | 0 (0.0%) | 0 (0.0%) |
| Coal or Coke | 0 (0.0%) | 0 (0.0%) |
| All other Fuels | 0 (0.0%) | 0 (0.0%) |
| No Fuel Used | 0 (0.0%) | 0 (0.0%) |
| Total | 119 (100.0%) | 7 (100.0%) |
Household Vehicle Usage in Hardyville
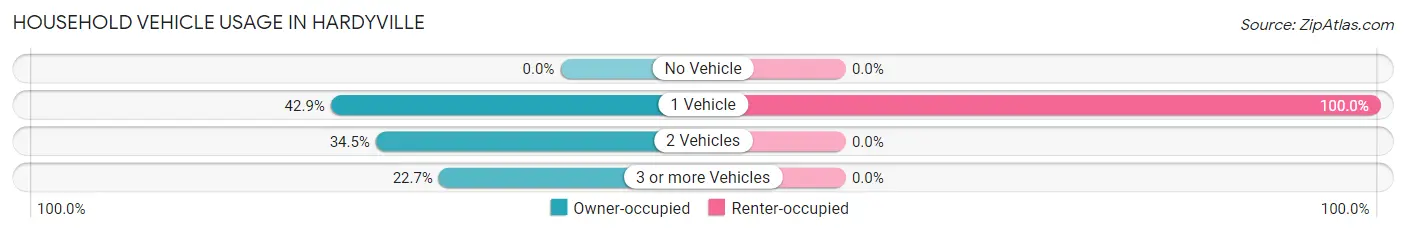
| Vehicles per Household | Owner-occupied | Renter-occupied |
| No Vehicle | 0 (0.0%) | 0 (0.0%) |
| 1 Vehicle | 51 (42.9%) | 7 (100.0%) |
| 2 Vehicles | 41 (34.4%) | 0 (0.0%) |
| 3 or more Vehicles | 27 (22.7%) | 0 (0.0%) |
| Total | 119 (100.0%) | 7 (100.0%) |
Real Estate & Mortgages in Hardyville
Real Estate and Mortgage Overview in Hardyville
| Characteristic | Without Mortgage | With Mortgage |
| Housing Units | 65 | 54 |
| Median Property Value | $87,900 | $141,500 |
| Median Household Income | - | - |
| Monthly Housing Costs | - | - |
| Real Estate Taxes | $238 | $0 |
Property Value by Mortgage Status in Hardyville
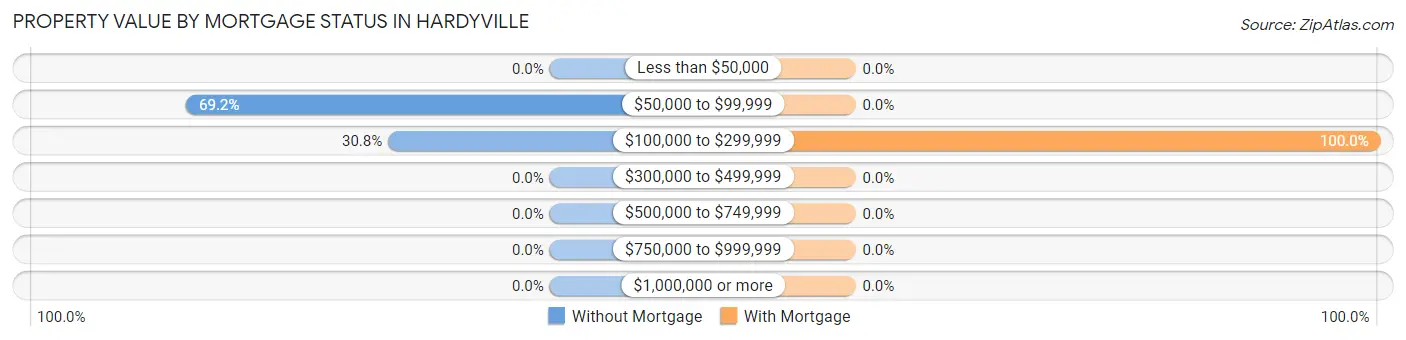
| Property Value | Without Mortgage | With Mortgage |
| Less than $50,000 | 0 (0.0%) | 0 (0.0%) |
| $50,000 to $99,999 | 45 (69.2%) | 0 (0.0%) |
| $100,000 to $299,999 | 20 (30.8%) | 54 (100.0%) |
| $300,000 to $499,999 | 0 (0.0%) | 0 (0.0%) |
| $500,000 to $749,999 | 0 (0.0%) | 0 (0.0%) |
| $750,000 to $999,999 | 0 (0.0%) | 0 (0.0%) |
| $1,000,000 or more | 0 (0.0%) | 0 (0.0%) |
| Total | 65 (100.0%) | 54 (100.0%) |
Household Income by Mortgage Status in Hardyville
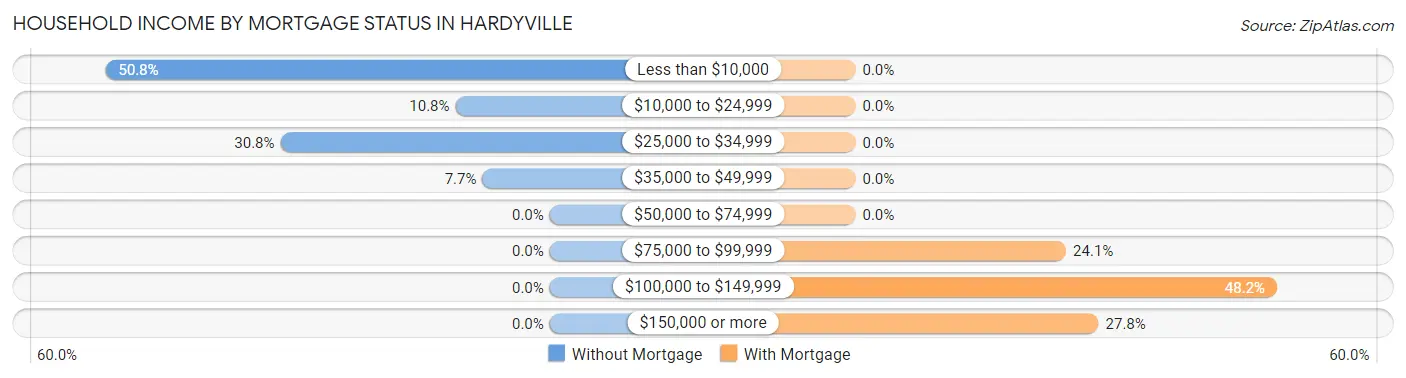
| Household Income | Without Mortgage | With Mortgage |
| Less than $10,000 | 33 (50.8%) | 0 (0.0%) |
| $10,000 to $24,999 | 7 (10.8%) | 0 (0.0%) |
| $25,000 to $34,999 | 20 (30.8%) | 0 (0.0%) |
| $35,000 to $49,999 | 5 (7.7%) | 0 (0.0%) |
| $50,000 to $74,999 | 0 (0.0%) | 0 (0.0%) |
| $75,000 to $99,999 | 0 (0.0%) | 13 (24.1%) |
| $100,000 to $149,999 | 0 (0.0%) | 26 (48.1%) |
| $150,000 or more | 0 (0.0%) | 15 (27.8%) |
| Total | 65 (100.0%) | 54 (100.0%) |
Property Value to Household Income Ratio in Hardyville
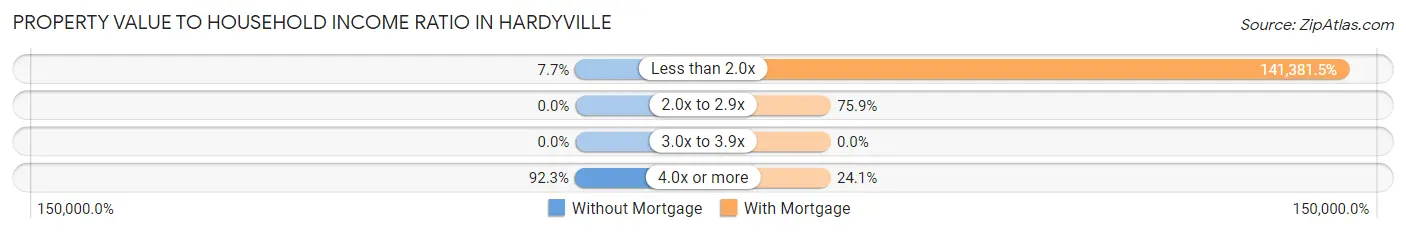
| Value-to-Income Ratio | Without Mortgage | With Mortgage |
| Less than 2.0x | 5 (7.7%) | 76,346 (141,381.5%) |
| 2.0x to 2.9x | 0 (0.0%) | 41 (75.9%) |
| 3.0x to 3.9x | 0 (0.0%) | 0 (0.0%) |
| 4.0x or more | 60 (92.3%) | 13 (24.1%) |
| Total | 65 (100.0%) | 54 (100.0%) |
Real Estate Taxes by Mortgage Status in Hardyville
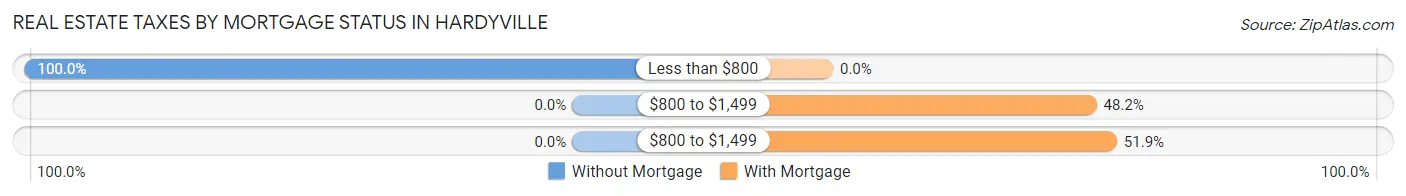
| Property Taxes | Without Mortgage | With Mortgage |
| Less than $800 | 65 (100.0%) | 0 (0.0%) |
| $800 to $1,499 | 0 (0.0%) | 26 (48.1%) |
| $800 to $1,499 | 0 (0.0%) | 28 (51.8%) |
| Total | 65 (100.0%) | 54 (100.0%) |
Health & Disability in Hardyville
Health Insurance Coverage by Age in Hardyville
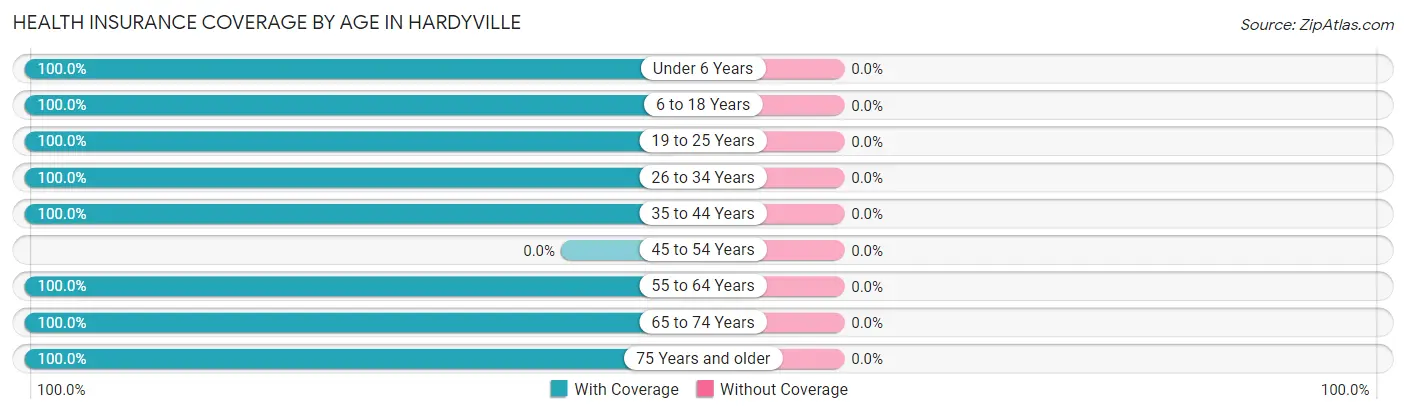
| Age Bracket | With Coverage | Without Coverage |
| Under 6 Years | 59 (100.0%) | 0 (0.0%) |
| 6 to 18 Years | 38 (100.0%) | 0 (0.0%) |
| 19 to 25 Years | 7 (100.0%) | 0 (0.0%) |
| 26 to 34 Years | 45 (100.0%) | 0 (0.0%) |
| 35 to 44 Years | 48 (100.0%) | 0 (0.0%) |
| 45 to 54 Years | 0 (0.0%) | 0 (0.0%) |
| 55 to 64 Years | 26 (100.0%) | 0 (0.0%) |
| 65 to 74 Years | 25 (100.0%) | 0 (0.0%) |
| 75 Years and older | 7 (100.0%) | 0 (0.0%) |
| Total | 255 (100.0%) | 0 (0.0%) |
Health Insurance Coverage by Citizenship Status in Hardyville
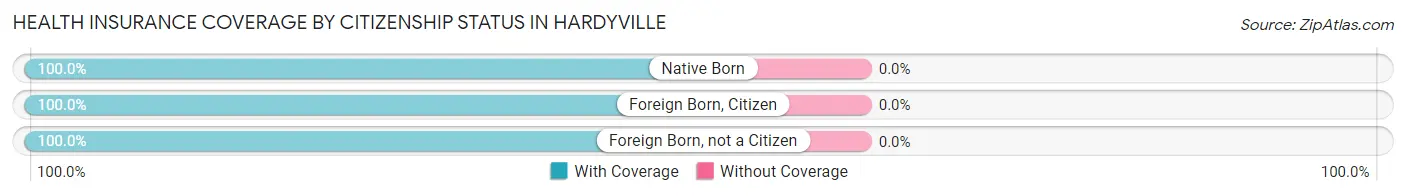
| Citizenship Status | With Coverage | Without Coverage |
| Native Born | 59 (100.0%) | 0 (0.0%) |
| Foreign Born, Citizen | 38 (100.0%) | 0 (0.0%) |
| Foreign Born, not a Citizen | 7 (100.0%) | 0 (0.0%) |
Health Insurance Coverage by Household Income in Hardyville
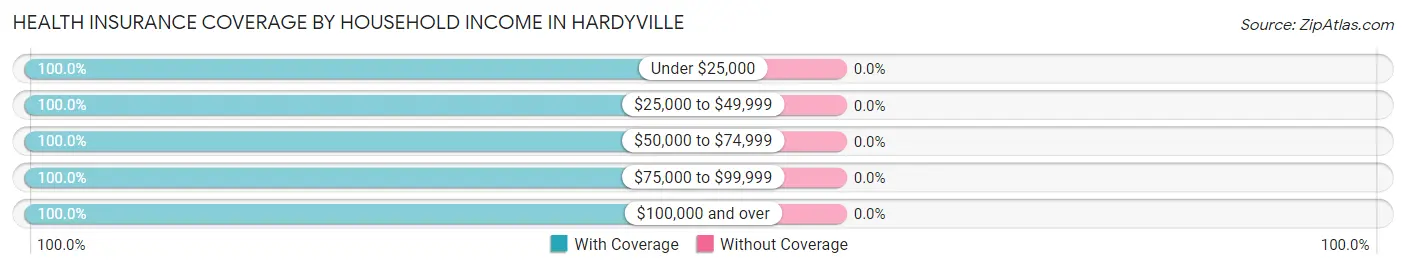
| Household Income | With Coverage | Without Coverage |
| Under $25,000 | 40 (100.0%) | 0 (0.0%) |
| $25,000 to $49,999 | 46 (100.0%) | 0 (0.0%) |
| $50,000 to $74,999 | 26 (100.0%) | 0 (0.0%) |
| $75,000 to $99,999 | 26 (100.0%) | 0 (0.0%) |
| $100,000 and over | 117 (100.0%) | 0 (0.0%) |
Public vs Private Health Insurance Coverage by Age in Hardyville
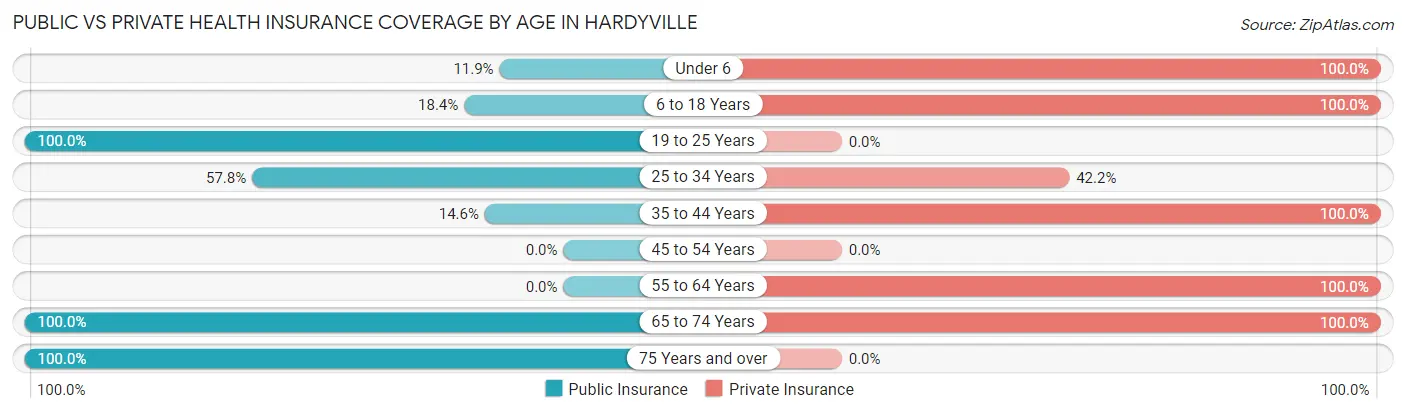
| Age Bracket | Public Insurance | Private Insurance |
| Under 6 | 7 (11.9%) | 59 (100.0%) |
| 6 to 18 Years | 7 (18.4%) | 38 (100.0%) |
| 19 to 25 Years | 7 (100.0%) | 0 (0.0%) |
| 25 to 34 Years | 26 (57.8%) | 19 (42.2%) |
| 35 to 44 Years | 7 (14.6%) | 48 (100.0%) |
| 45 to 54 Years | 0 (0.0%) | 0 (0.0%) |
| 55 to 64 Years | 0 (0.0%) | 26 (100.0%) |
| 65 to 74 Years | 25 (100.0%) | 25 (100.0%) |
| 75 Years and over | 7 (100.0%) | 0 (0.0%) |
| Total | 86 (33.7%) | 215 (84.3%) |
Disability Status by Sex by Age in Hardyville
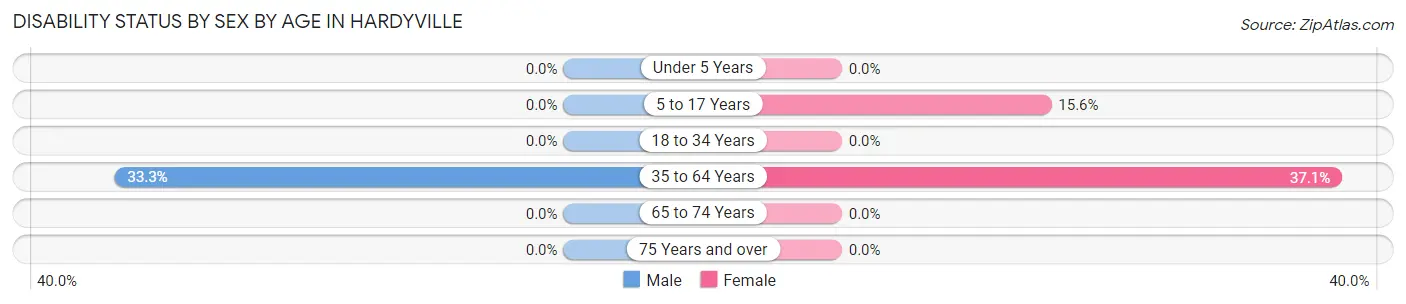
| Age Bracket | Male | Female |
| Under 5 Years | 0 (0.0%) | 0 (0.0%) |
| 5 to 17 Years | 0 (0.0%) | 7 (15.6%) |
| 18 to 34 Years | 0 (0.0%) | 0 (0.0%) |
| 35 to 64 Years | 13 (33.3%) | 13 (37.1%) |
| 65 to 74 Years | 0 (0.0%) | 0 (0.0%) |
| 75 Years and over | 0 (0.0%) | 0 (0.0%) |
Disability Class by Sex by Age in Hardyville
Disability Class: Hearing Difficulty
| Age Bracket | Male | Female |
| Under 5 Years | 0 (0.0%) | 0 (0.0%) |
| 5 to 17 Years | 0 (0.0%) | 0 (0.0%) |
| 18 to 34 Years | 0 (0.0%) | 0 (0.0%) |
| 35 to 64 Years | 0 (0.0%) | 0 (0.0%) |
| 65 to 74 Years | 0 (0.0%) | 0 (0.0%) |
| 75 Years and over | 0 (0.0%) | 0 (0.0%) |
Disability Class: Vision Difficulty
| Age Bracket | Male | Female |
| Under 5 Years | 0 (0.0%) | 0 (0.0%) |
| 5 to 17 Years | 0 (0.0%) | 0 (0.0%) |
| 18 to 34 Years | 0 (0.0%) | 0 (0.0%) |
| 35 to 64 Years | 0 (0.0%) | 0 (0.0%) |
| 65 to 74 Years | 0 (0.0%) | 0 (0.0%) |
| 75 Years and over | 0 (0.0%) | 0 (0.0%) |
Disability Class: Cognitive Difficulty
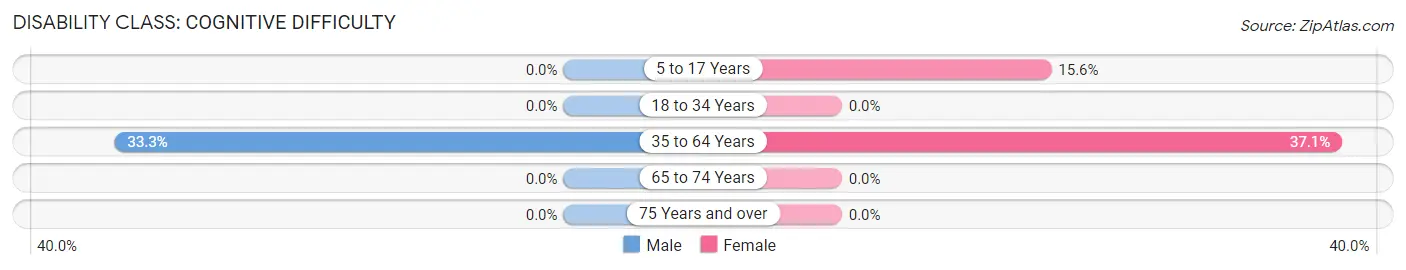
| Age Bracket | Male | Female |
| 5 to 17 Years | 0 (0.0%) | 7 (15.6%) |
| 18 to 34 Years | 0 (0.0%) | 0 (0.0%) |
| 35 to 64 Years | 13 (33.3%) | 13 (37.1%) |
| 65 to 74 Years | 0 (0.0%) | 0 (0.0%) |
| 75 Years and over | 0 (0.0%) | 0 (0.0%) |
Disability Class: Ambulatory Difficulty
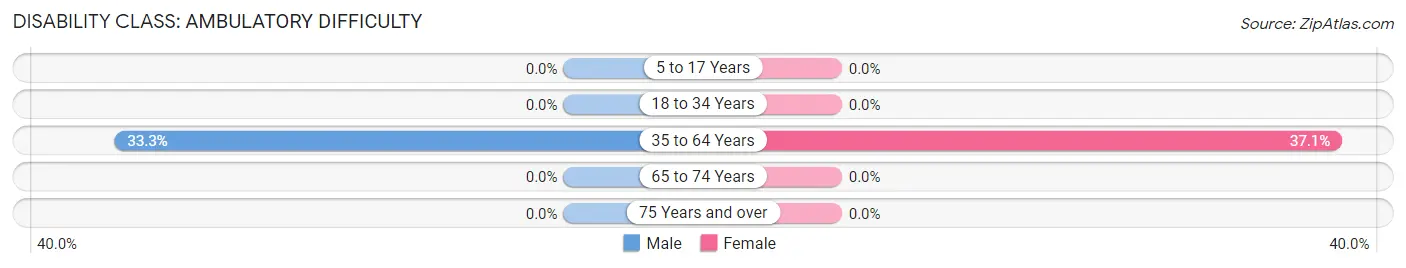
| Age Bracket | Male | Female |
| 5 to 17 Years | 0 (0.0%) | 0 (0.0%) |
| 18 to 34 Years | 0 (0.0%) | 0 (0.0%) |
| 35 to 64 Years | 13 (33.3%) | 13 (37.1%) |
| 65 to 74 Years | 0 (0.0%) | 0 (0.0%) |
| 75 Years and over | 0 (0.0%) | 0 (0.0%) |
Disability Class: Self-Care Difficulty
| Age Bracket | Male | Female |
| 5 to 17 Years | 0 (0.0%) | 0 (0.0%) |
| 18 to 34 Years | 0 (0.0%) | 0 (0.0%) |
| 35 to 64 Years | 0 (0.0%) | 0 (0.0%) |
| 65 to 74 Years | 0 (0.0%) | 0 (0.0%) |
| 75 Years and over | 0 (0.0%) | 0 (0.0%) |
Technology Access in Hardyville
Computing Device Access in Hardyville
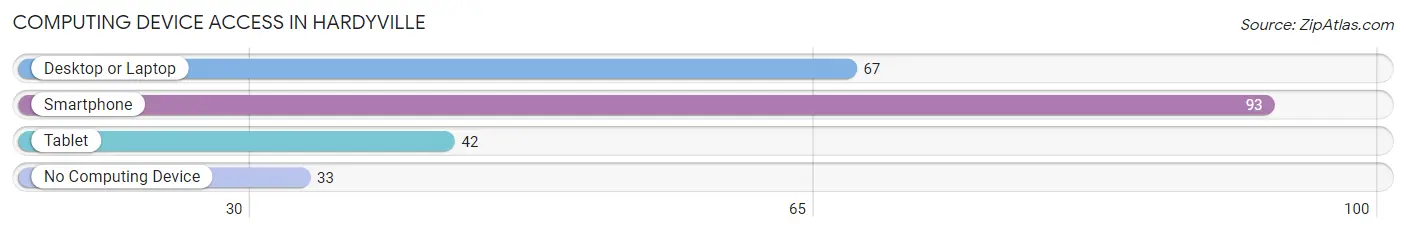
| Device Type | # Households | % Households |
| Desktop or Laptop | 67 | 53.2% |
| Smartphone | 93 | 73.8% |
| Tablet | 42 | 33.3% |
| No Computing Device | 33 | 26.2% |
| Total | 126 | 100.0% |
Internet Access in Hardyville
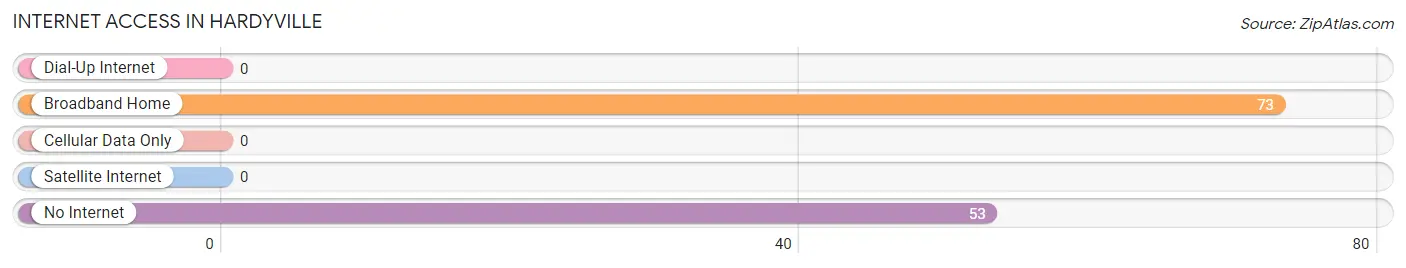
| Internet Type | # Households | % Households |
| Dial-Up Internet | 0 | 0.0% |
| Broadband Home | 73 | 57.9% |
| Cellular Data Only | 0 | 0.0% |
| Satellite Internet | 0 | 0.0% |
| No Internet | 53 | 42.1% |
| Total | 126 | 100.0% |
Hardyville Summary
Hardyville is a small unincorporated community located in Hart County, Kentucky. It is situated along the Green River, approximately 10 miles south of Munfordville. The population of Hardyville was estimated to be around 500 in 2000.
History
Hardyville was founded in 1820 by William Hardy, a Revolutionary War veteran. He purchased the land from the federal government and established a ferry service across the Green River. The town was named after him.
In 1832, the Louisville and Nashville Railroad was built through the area, connecting Hardyville to the rest of the state. This allowed for the growth of the town, as it became a popular stop for travelers.
In the late 19th century, Hardyville was a thriving community with a population of over 1,000. It had several stores, a post office, a school, a hotel, and a newspaper.
Geography
Hardyville is located in Hart County, Kentucky, along the Green River. It is situated approximately 10 miles south of Munfordville and about 40 miles north of Bowling Green. The town is surrounded by rolling hills and farmland.
The climate in Hardyville is humid subtropical, with hot summers and mild winters. The average annual temperature is around 60 degrees Fahrenheit.
Economy
The economy of Hardyville is largely based on agriculture. The town is home to several farms, which produce corn, soybeans, and other crops. There are also several small businesses in the area, including a gas station, a grocery store, and a hardware store.
The town is also home to a few manufacturing companies, including a furniture factory and a plastics factory.
Demographics
As of the 2000 census, the population of Hardyville was estimated to be around 500. The racial makeup of the town was 97.2% White, 0.8% African American, 0.2% Native American, 0.2% Asian, and 1.6% from other races.
The median household income in Hardyville was $25,000, and the median family income was $30,000. The per capita income was $14,000.
Conclusion
Hardyville is a small unincorporated community located in Hart County, Kentucky. It was founded in 1820 by William Hardy and has since grown into a thriving community with a population of around 500. The economy of Hardyville is largely based on agriculture, with several farms producing corn, soybeans, and other crops. The town is also home to a few manufacturing companies. The racial makeup of the town is predominantly White, with a small percentage of African American, Native American, and Asian residents.
Common Questions
What is Per Capita Income in Hardyville?
Per Capita income in Hardyville is $24,781.
What is Inequality or Gini Index in Hardyville?
Inequality or Gini Index in Hardyville is 0.45.
What is the Total Population of Hardyville?
Total Population of Hardyville is 255.
What is the Total Male Population of Hardyville?
Total Male Population of Hardyville is 91.
What is the Total Female Population of Hardyville?
Total Female Population of Hardyville is 164.
What is the Ratio of Males per 100 Females in Hardyville?
There are 55.49 Males per 100 Females in Hardyville.
What is the Ratio of Females per 100 Males in Hardyville?
There are 180.22 Females per 100 Males in Hardyville.
What is the Median Population Age in Hardyville?
Median Population Age in Hardyville is 26.9 Years.
What is the Average Family Size in Hardyville
Average Family Size in Hardyville is 4.7 People.
What is the Average Household Size in Hardyville
Average Household Size in Hardyville is 2.0 People.
How Large is the Labor Force in Hardyville?
There are 74 People in the Labor Forcein in Hardyville.
What is the Percentage of People in the Labor Force in Hardyville?
46.8% of People are in the Labor Force in Hardyville.