Stamping Ground, KY Map & Demographics
Stamping Ground Map
Stamping Ground Overview
$29,017
PER CAPITA INCOME
$73,750
AVG FAMILY INCOME
$60,606
AVG HOUSEHOLD INCOME
60.6%
WAGE / INCOME GAP [ % ]
39.4¢/ $1
WAGE / INCOME GAP [ $ ]
0.37
INEQUALITY / GINI INDEX
908
TOTAL POPULATION
431
MALE POPULATION
477
FEMALE POPULATION
90.36
MALES / 100 FEMALES
110.67
FEMALES / 100 MALES
36.0
MEDIAN AGE
3.1
AVG FAMILY SIZE
2.7
AVG HOUSEHOLD SIZE
464
LABOR FORCE [ PEOPLE ]
61.6%
PERCENT IN LABOR FORCE
Stamping Ground Zip Codes
Stamping Ground Area Codes
Income in Stamping Ground
Income Overview in Stamping Ground
Per Capita Income in Stamping Ground is $29,017, while median incomes of families and households are $73,750 and $60,606 respectively.
| Characteristic | Number | Measure |
| Per Capita Income | 908 | $29,017 |
| Median Family Income | 246 | $73,750 |
| Mean Family Income | 246 | $80,057 |
| Median Household Income | 340 | $60,606 |
| Mean Household Income | 340 | $69,482 |
| Income Deficit | 246 | $0 |
| Wage / Income Gap (%) | 908 | 60.55% |
| Wage / Income Gap ($) | 908 | 39.45¢ per $1 |
| Gini / Inequality Index | 908 | 0.37 |
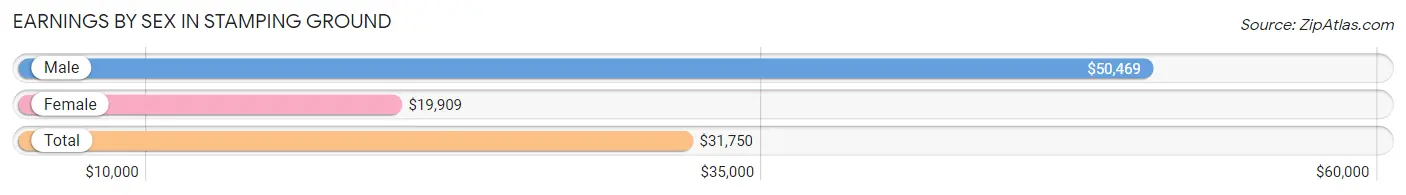
Earnings by Sex in Stamping Ground
Average Earnings in Stamping Ground are $31,750, $50,469 for men and $19,909 for women, a difference of 60.6%.
| Sex | Number | Average Earnings |
| Male | 245 (48.3%) | $50,469 |
| Female | 262 (51.7%) | $19,909 |
| Total | 507 (100.0%) | $31,750 |
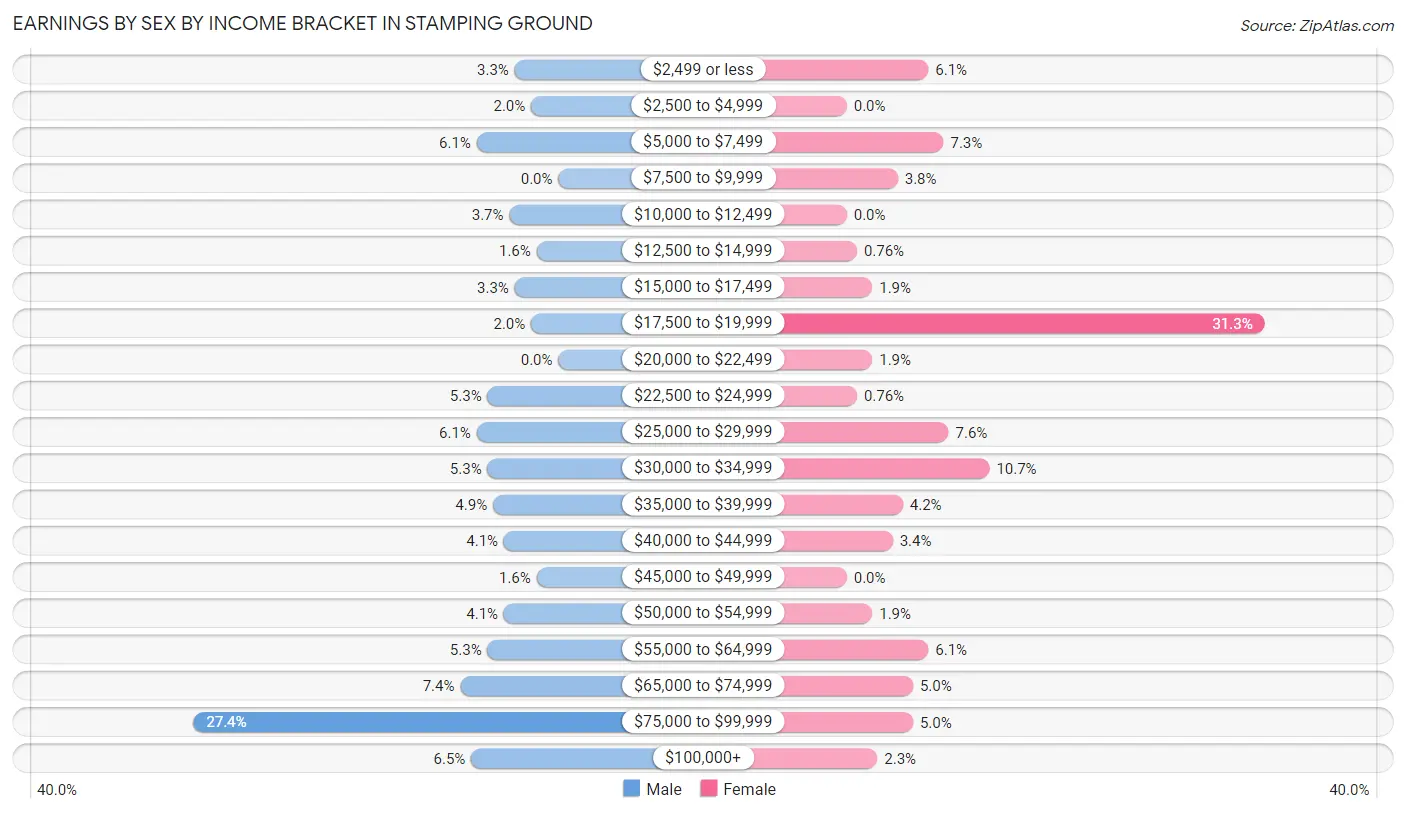
Earnings by Sex by Income Bracket in Stamping Ground
The most common earnings brackets in Stamping Ground are $75,000 to $99,999 for men (67 | 27.4%) and $17,500 to $19,999 for women (82 | 31.3%).
| Income | Male | Female |
| $2,499 or less | 8 (3.3%) | 16 (6.1%) |
| $2,500 to $4,999 | 5 (2.0%) | 0 (0.0%) |
| $5,000 to $7,499 | 15 (6.1%) | 19 (7.2%) |
| $7,500 to $9,999 | 0 (0.0%) | 10 (3.8%) |
| $10,000 to $12,499 | 9 (3.7%) | 0 (0.0%) |
| $12,500 to $14,999 | 4 (1.6%) | 2 (0.8%) |
| $15,000 to $17,499 | 8 (3.3%) | 5 (1.9%) |
| $17,500 to $19,999 | 5 (2.0%) | 82 (31.3%) |
| $20,000 to $22,499 | 0 (0.0%) | 5 (1.9%) |
| $22,500 to $24,999 | 13 (5.3%) | 2 (0.8%) |
| $25,000 to $29,999 | 15 (6.1%) | 20 (7.6%) |
| $30,000 to $34,999 | 13 (5.3%) | 28 (10.7%) |
| $35,000 to $39,999 | 12 (4.9%) | 11 (4.2%) |
| $40,000 to $44,999 | 10 (4.1%) | 9 (3.4%) |
| $45,000 to $49,999 | 4 (1.6%) | 0 (0.0%) |
| $50,000 to $54,999 | 10 (4.1%) | 5 (1.9%) |
| $55,000 to $64,999 | 13 (5.3%) | 16 (6.1%) |
| $65,000 to $74,999 | 18 (7.3%) | 13 (5.0%) |
| $75,000 to $99,999 | 67 (27.4%) | 13 (5.0%) |
| $100,000+ | 16 (6.5%) | 6 (2.3%) |
| Total | 245 (100.0%) | 262 (100.0%) |
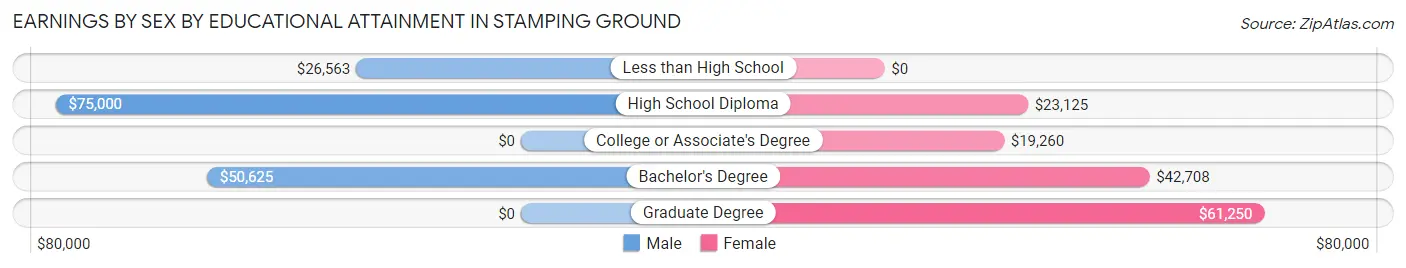
Earnings by Sex by Educational Attainment in Stamping Ground
Average earnings in Stamping Ground are $64,063 for men and $19,878 for women, a difference of 69.0%. Men with an educational attainment of high school diploma enjoy the highest average annual earnings of $75,000, while those with less than high school education earn the least with $26,563. Women with an educational attainment of graduate degree earn the most with the average annual earnings of $61,250, while those with college or associate's degree education have the smallest earnings of $19,260.
| Educational Attainment | Male Income | Female Income |
| Less than High School | $26,563 | $0 |
| High School Diploma | $75,000 | $23,125 |
| College or Associate's Degree | - | - |
| Bachelor's Degree | $50,625 | $42,708 |
| Graduate Degree | - | - |
| Total | $64,063 | $19,878 |
Family Income in Stamping Ground
Family Income Brackets in Stamping Ground
According to the Stamping Ground family income data, there are 64 families falling into the $100,000 to $149,999 income range, which is the most common income bracket and makes up 26.0% of all families. Conversely, the $150,000 to $199,999 income bracket is the least frequent group with only 2 families (0.8%) belonging to this category.
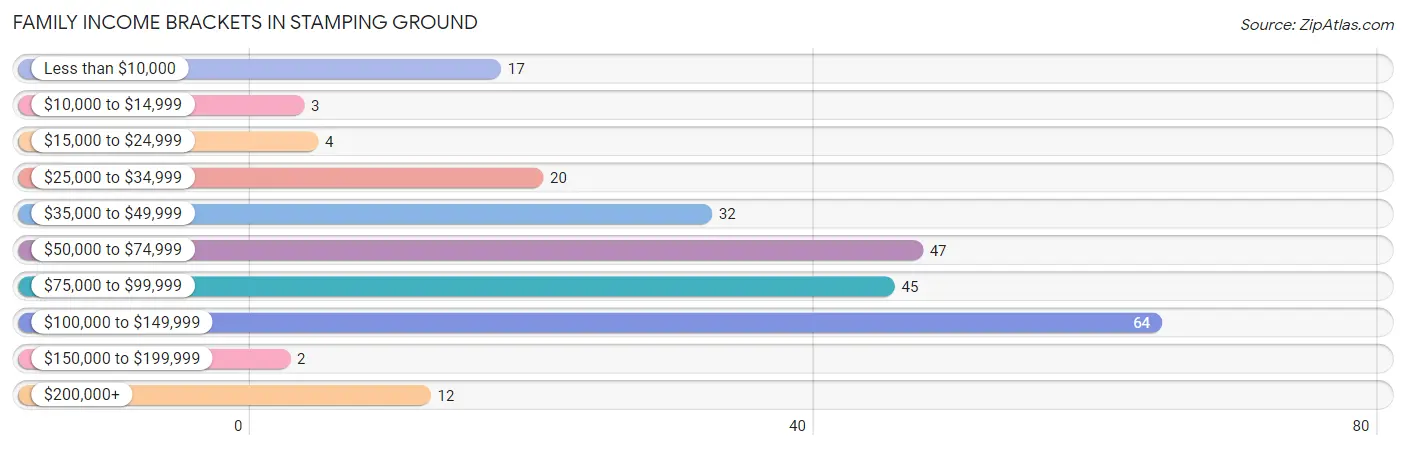
| Income Bracket | # Families | % Families |
| Less than $10,000 | 17 | 6.9% |
| $10,000 to $14,999 | 3 | 1.2% |
| $15,000 to $24,999 | 4 | 1.6% |
| $25,000 to $34,999 | 20 | 8.1% |
| $35,000 to $49,999 | 32 | 13.0% |
| $50,000 to $74,999 | 47 | 19.1% |
| $75,000 to $99,999 | 45 | 18.3% |
| $100,000 to $149,999 | 64 | 26.0% |
| $150,000 to $199,999 | 2 | 0.8% |
| $200,000+ | 12 | 4.9% |
Family Income by Famaliy Size in Stamping Ground
5-person families (14 | 5.7%) account for the highest median family income in Stamping Ground with $135,000 per family, while 2-person families (110 | 44.7%) have the highest median income of $41,875 per family member.
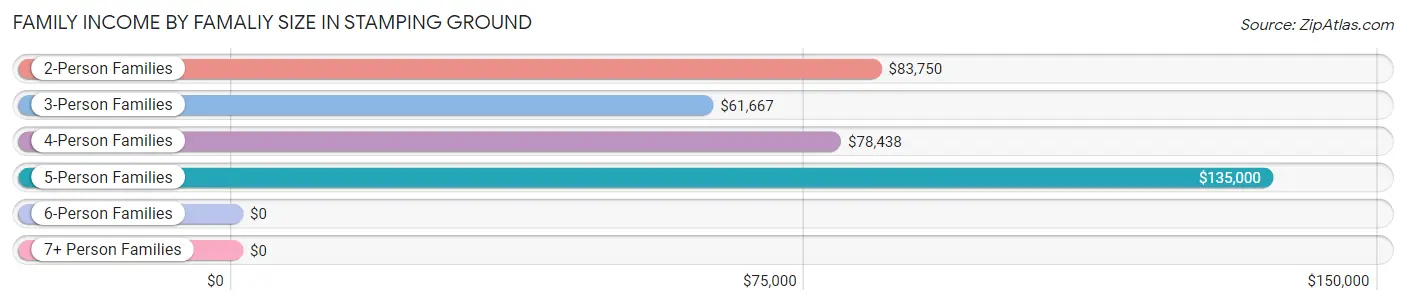
| Income Bracket | # Families | Median Income |
| 2-Person Families | 110 (44.7%) | $83,750 |
| 3-Person Families | 82 (33.3%) | $61,667 |
| 4-Person Families | 37 (15.0%) | $78,438 |
| 5-Person Families | 14 (5.7%) | $135,000 |
| 6-Person Families | 0 (0.0%) | $0 |
| 7+ Person Families | 3 (1.2%) | $0 |
| Total | 246 (100.0%) | $73,750 |
Family Income by Number of Earners in Stamping Ground
The median family income in Stamping Ground is $73,750, with families comprising 3+ earners (36) having the highest median family income of $124,167, while families with no earners (22) have the lowest median family income of $60,000, accounting for 14.6% and 8.9% of families, respectively.
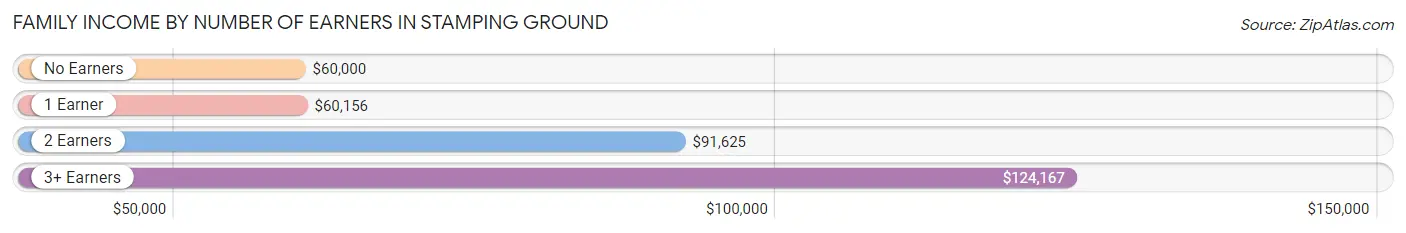
| Number of Earners | # Families | Median Income |
| No Earners | 22 (8.9%) | $60,000 |
| 1 Earner | 109 (44.3%) | $60,156 |
| 2 Earners | 79 (32.1%) | $91,625 |
| 3+ Earners | 36 (14.6%) | $124,167 |
| Total | 246 (100.0%) | $73,750 |
Household Income in Stamping Ground
Household Income Brackets in Stamping Ground
With 80 households falling in the category, the $50,000 to $74,999 income range is the most frequent in Stamping Ground, accounting for 23.5% of all households. In contrast, only 2 households (0.6%) fall into the $150,000 to $199,999 income bracket, making it the least populous group.
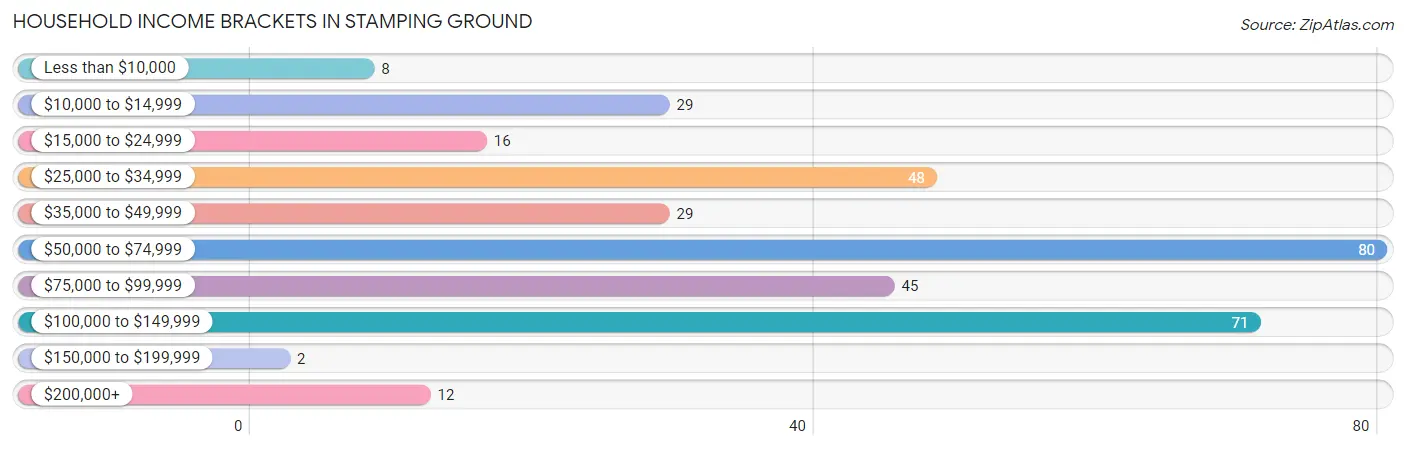
| Income Bracket | # Households | % Households |
| Less than $10,000 | 8 | 2.4% |
| $10,000 to $14,999 | 29 | 8.5% |
| $15,000 to $24,999 | 16 | 4.7% |
| $25,000 to $34,999 | 48 | 14.1% |
| $35,000 to $49,999 | 29 | 8.5% |
| $50,000 to $74,999 | 80 | 23.5% |
| $75,000 to $99,999 | 45 | 13.2% |
| $100,000 to $149,999 | 71 | 20.9% |
| $150,000 to $199,999 | 2 | 0.6% |
| $200,000+ | 12 | 3.5% |
Household Income by Householder Age in Stamping Ground
The median household income in Stamping Ground is $60,606, with the highest median household income of $71,071 found in the 25 to 44 years age bracket for the primary householder. A total of 136 households (40.0%) fall into this category. Meanwhile, the 15 to 24 years age bracket for the primary householder has the lowest median household income of $0, with 8 households (2.4%) in this group.
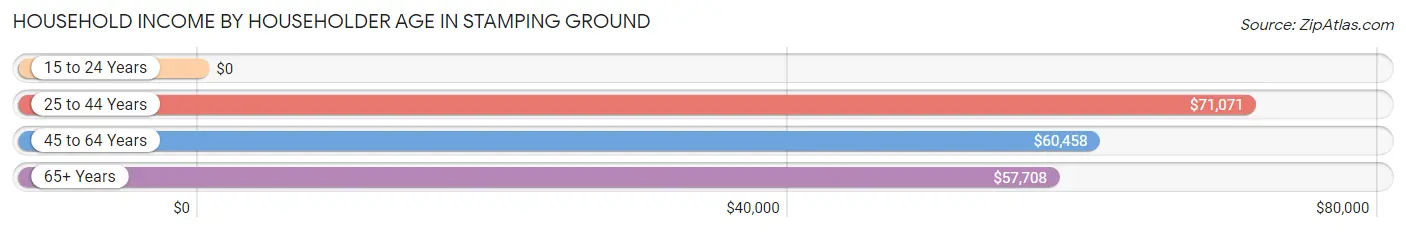
| Income Bracket | # Households | Median Income |
| 15 to 24 Years | 8 (2.4%) | $0 |
| 25 to 44 Years | 136 (40.0%) | $71,071 |
| 45 to 64 Years | 123 (36.2%) | $60,458 |
| 65+ Years | 73 (21.5%) | $57,708 |
| Total | 340 (100.0%) | $60,606 |
Poverty in Stamping Ground
Income Below Poverty by Sex and Age in Stamping Ground
With 8.4% poverty level for males and 10.4% for females among the residents of Stamping Ground, 6 to 11 year old males and 18 to 24 year old females are the most vulnerable to poverty, with 11 males (45.8%) and 8 females (50.0%) in their respective age groups living below the poverty level.
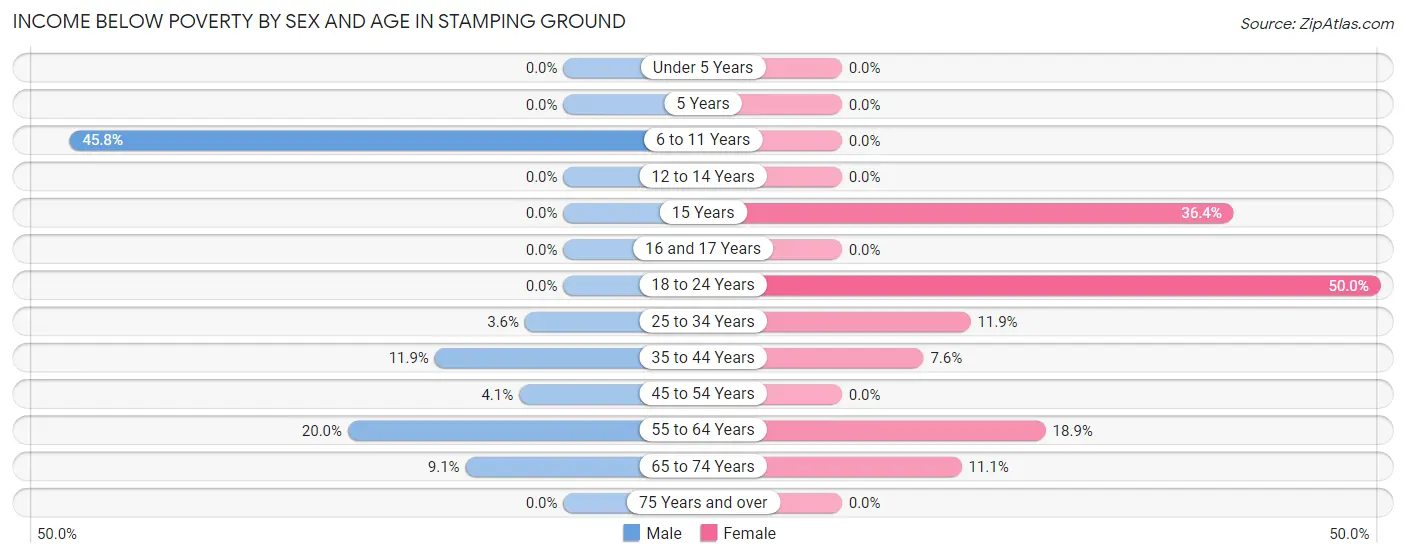
| Age Bracket | Male | Female |
| Under 5 Years | 0 (0.0%) | 0 (0.0%) |
| 5 Years | 0 (0.0%) | 0 (0.0%) |
| 6 to 11 Years | 11 (45.8%) | 0 (0.0%) |
| 12 to 14 Years | 0 (0.0%) | 0 (0.0%) |
| 15 Years | 0 (0.0%) | 4 (36.4%) |
| 16 and 17 Years | 0 (0.0%) | 0 (0.0%) |
| 18 to 24 Years | 0 (0.0%) | 8 (50.0%) |
| 25 to 34 Years | 3 (3.6%) | 16 (11.9%) |
| 35 to 44 Years | 8 (11.9%) | 5 (7.6%) |
| 45 to 54 Years | 3 (4.1%) | 0 (0.0%) |
| 55 to 64 Years | 9 (20.0%) | 14 (18.9%) |
| 65 to 74 Years | 2 (9.1%) | 2 (11.1%) |
| 75 Years and over | 0 (0.0%) | 0 (0.0%) |
| Total | 36 (8.4%) | 49 (10.4%) |
Income Above Poverty by Sex and Age in Stamping Ground
According to the poverty statistics in Stamping Ground, males aged under 5 years and females aged under 5 years are the age groups that are most secure financially, with 100.0% of males and 100.0% of females in these age groups living above the poverty line.
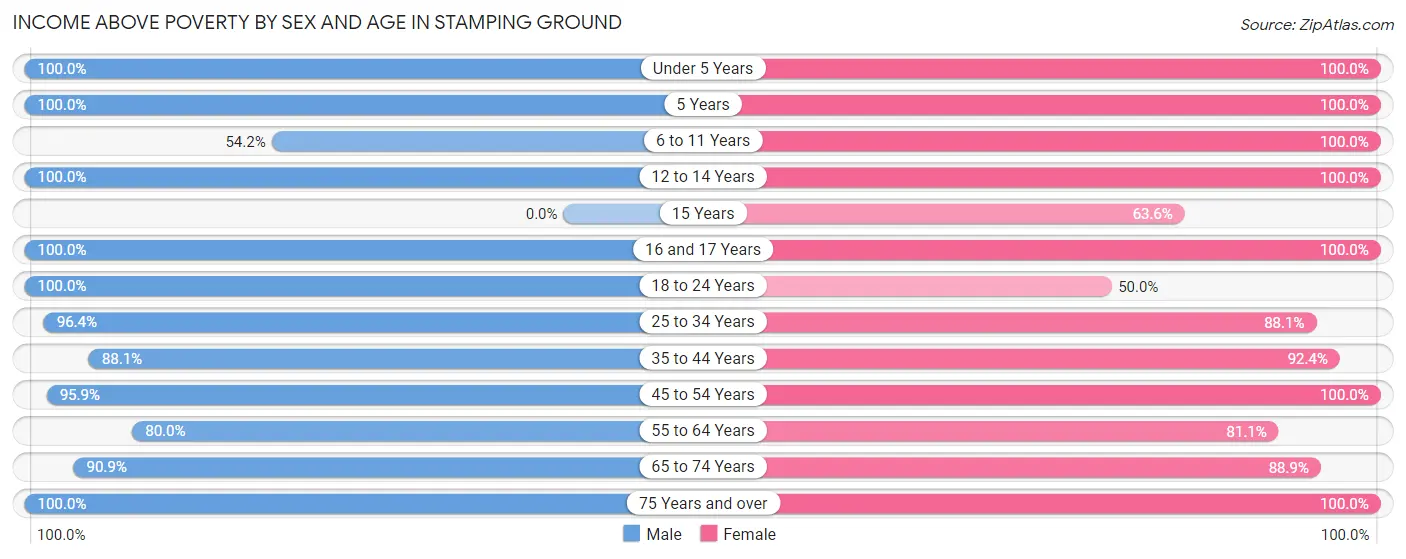
| Age Bracket | Male | Female |
| Under 5 Years | 32 (100.0%) | 13 (100.0%) |
| 5 Years | 8 (100.0%) | 6 (100.0%) |
| 6 to 11 Years | 13 (54.2%) | 25 (100.0%) |
| 12 to 14 Years | 10 (100.0%) | 18 (100.0%) |
| 15 Years | 0 (0.0%) | 7 (63.6%) |
| 16 and 17 Years | 20 (100.0%) | 11 (100.0%) |
| 18 to 24 Years | 32 (100.0%) | 8 (50.0%) |
| 25 to 34 Years | 81 (96.4%) | 118 (88.1%) |
| 35 to 44 Years | 59 (88.1%) | 61 (92.4%) |
| 45 to 54 Years | 70 (95.9%) | 38 (100.0%) |
| 55 to 64 Years | 36 (80.0%) | 60 (81.1%) |
| 65 to 74 Years | 20 (90.9%) | 16 (88.9%) |
| 75 Years and over | 11 (100.0%) | 42 (100.0%) |
| Total | 392 (91.6%) | 423 (89.6%) |
Income Below Poverty Among Married-Couple Families in Stamping Ground
The poverty statistics for married-couple families in Stamping Ground show that 3.7% or 6 of the total 163 families live below the poverty line. Families with no children have the highest poverty rate of 5.5%, comprising of 6 families. On the other hand, families with 1 or 2 children have the lowest poverty rate of 0.0%, which includes 0 families.
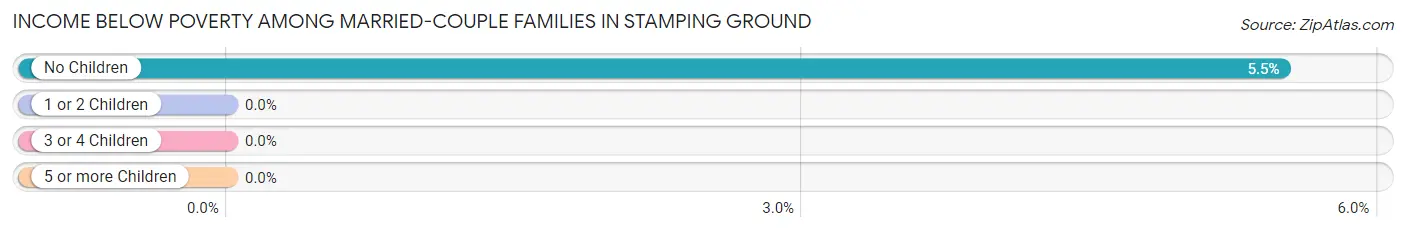
| Children | Above Poverty | Below Poverty |
| No Children | 103 (94.5%) | 6 (5.5%) |
| 1 or 2 Children | 46 (100.0%) | 0 (0.0%) |
| 3 or 4 Children | 5 (100.0%) | 0 (0.0%) |
| 5 or more Children | 3 (100.0%) | 0 (0.0%) |
| Total | 157 (96.3%) | 6 (3.7%) |
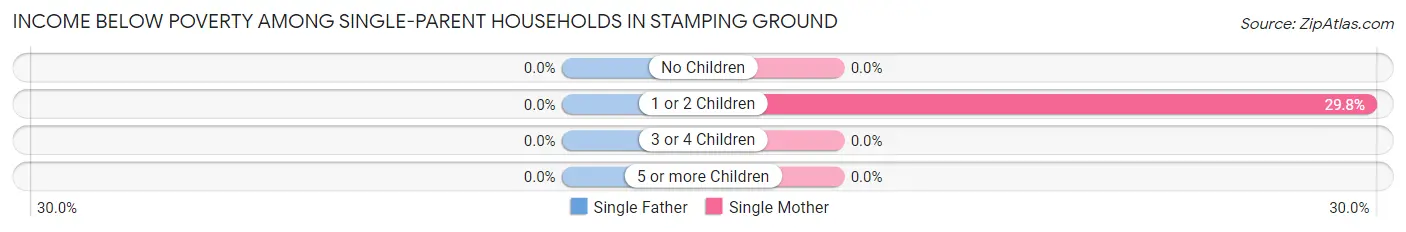
Income Below Poverty Among Single-Parent Households in Stamping Ground
| Children | Single Father | Single Mother |
| No Children | 0 (0.0%) | 0 (0.0%) |
| 1 or 2 Children | 0 (0.0%) | 14 (29.8%) |
| 3 or 4 Children | 0 (0.0%) | 0 (0.0%) |
| 5 or more Children | 0 (0.0%) | 0 (0.0%) |
| Total | 0 (0.0%) | 14 (19.2%) |
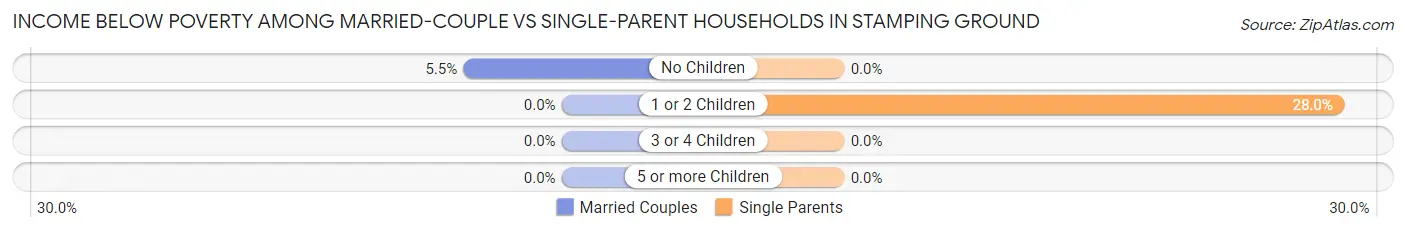
Income Below Poverty Among Married-Couple vs Single-Parent Households in Stamping Ground
The poverty data for Stamping Ground shows that 6 of the married-couple family households (3.7%) and 14 of the single-parent households (16.9%) are living below the poverty level. Within the married-couple family households, those with no children have the highest poverty rate, with 6 households (5.5%) falling below the poverty line. Among the single-parent households, those with 1 or 2 children have the highest poverty rate, with 14 household (28.0%) living below poverty.
| Children | Married-Couple Families | Single-Parent Households |
| No Children | 6 (5.5%) | 0 (0.0%) |
| 1 or 2 Children | 0 (0.0%) | 14 (28.0%) |
| 3 or 4 Children | 0 (0.0%) | 0 (0.0%) |
| 5 or more Children | 0 (0.0%) | 0 (0.0%) |
| Total | 6 (3.7%) | 14 (16.9%) |
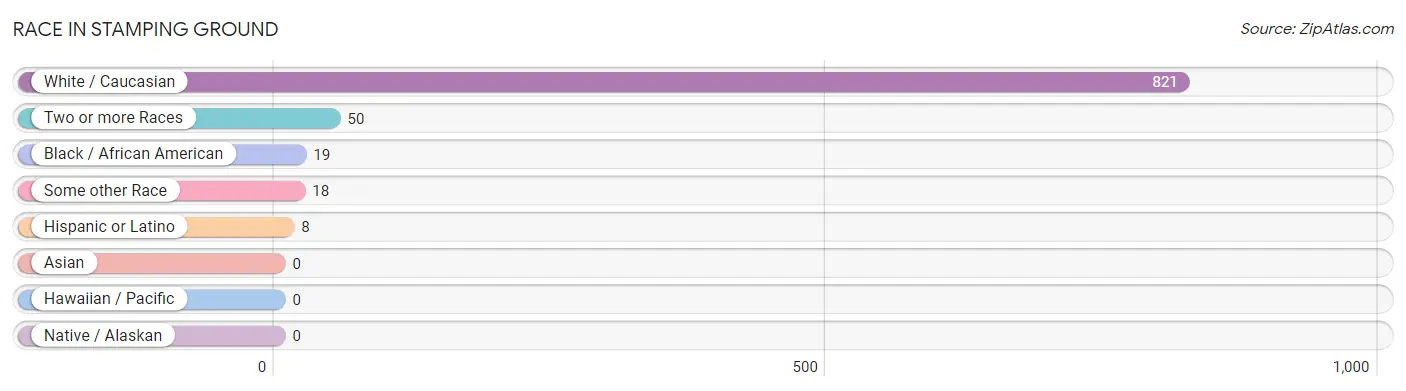
Race in Stamping Ground
The most populous races in Stamping Ground are White / Caucasian (821 | 90.4%), Two or more Races (50 | 5.5%), and Black / African American (19 | 2.1%).
| Race | # Population | % Population |
| Asian | 0 | 0.0% |
| Black / African American | 19 | 2.1% |
| Hawaiian / Pacific | 0 | 0.0% |
| Hispanic or Latino | 8 | 0.9% |
| Native / Alaskan | 0 | 0.0% |
| White / Caucasian | 821 | 90.4% |
| Two or more Races | 50 | 5.5% |
| Some other Race | 18 | 2.0% |
| Total | 908 | 100.0% |
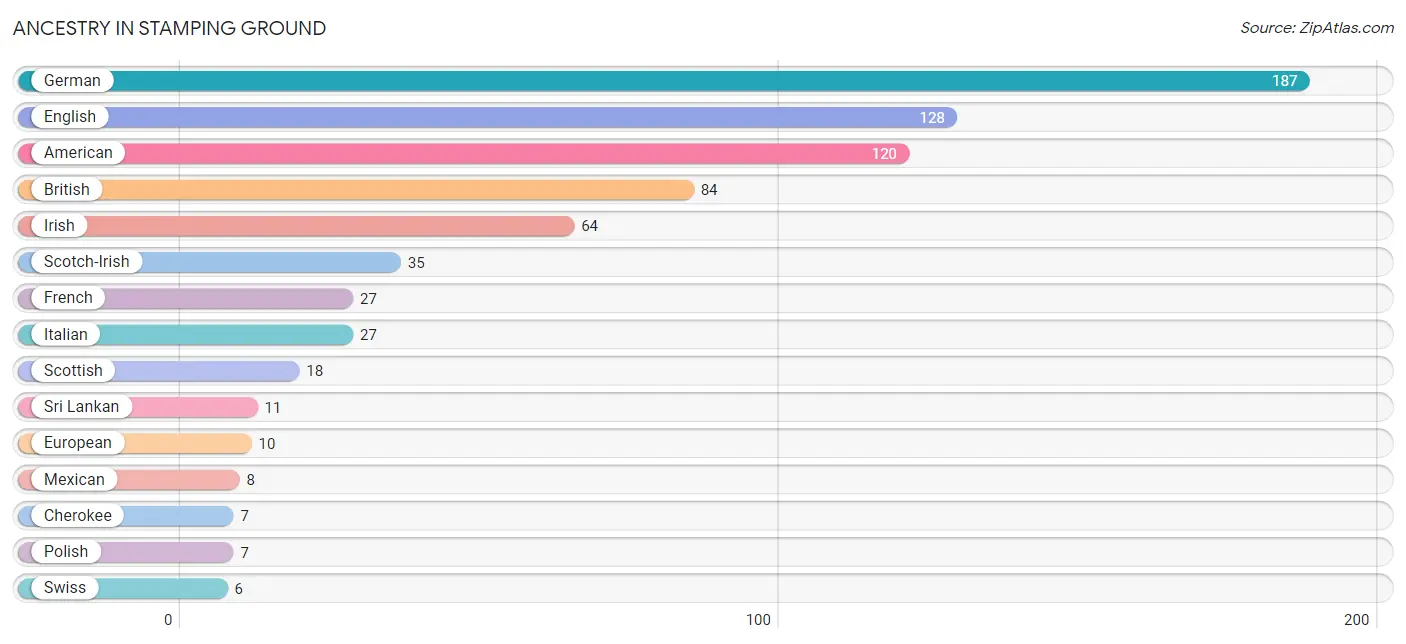
Ancestry in Stamping Ground
The most populous ancestries reported in Stamping Ground are German (187 | 20.6%), English (128 | 14.1%), American (120 | 13.2%), British (84 | 9.2%), and Irish (64 | 7.0%), together accounting for 64.2% of all Stamping Ground residents.
| Ancestry | # Population | % Population |
| American | 120 | 13.2% |
| British | 84 | 9.2% |
| Cherokee | 7 | 0.8% |
| Dutch | 2 | 0.2% |
| English | 128 | 14.1% |
| European | 10 | 1.1% |
| French | 27 | 3.0% |
| German | 187 | 20.6% |
| Greek | 1 | 0.1% |
| Irish | 64 | 7.0% |
| Italian | 27 | 3.0% |
| Mexican | 8 | 0.9% |
| Norwegian | 2 | 0.2% |
| Polish | 7 | 0.8% |
| Scotch-Irish | 35 | 3.8% |
| Scottish | 18 | 2.0% |
| Sri Lankan | 11 | 1.2% |
| Swiss | 6 | 0.7% | View All 18 Rows |
Immigrants in Stamping Ground
The most numerous immigrant groups reported in Stamping Ground came from Central America (7 | 0.8%), Latin America (7 | 0.8%), and Mexico (7 | 0.8%), together accounting for 2.3% of all Stamping Ground residents.
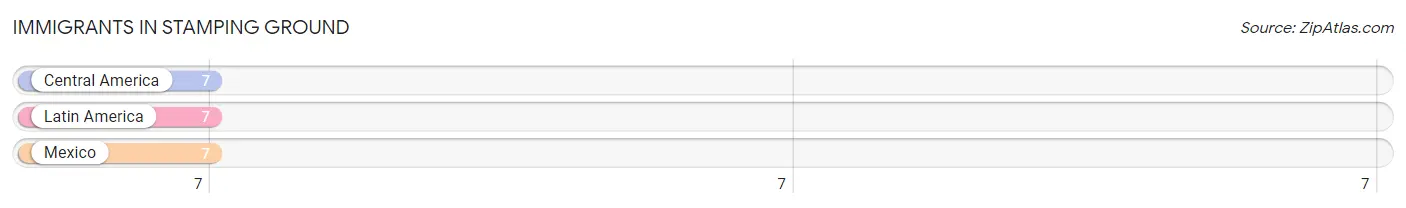
| Immigration Origin | # Population | % Population |
| Central America | 7 | 0.8% |
| Latin America | 7 | 0.8% |
| Mexico | 7 | 0.8% | View All 3 Rows |
Sex and Age in Stamping Ground
Sex and Age in Stamping Ground
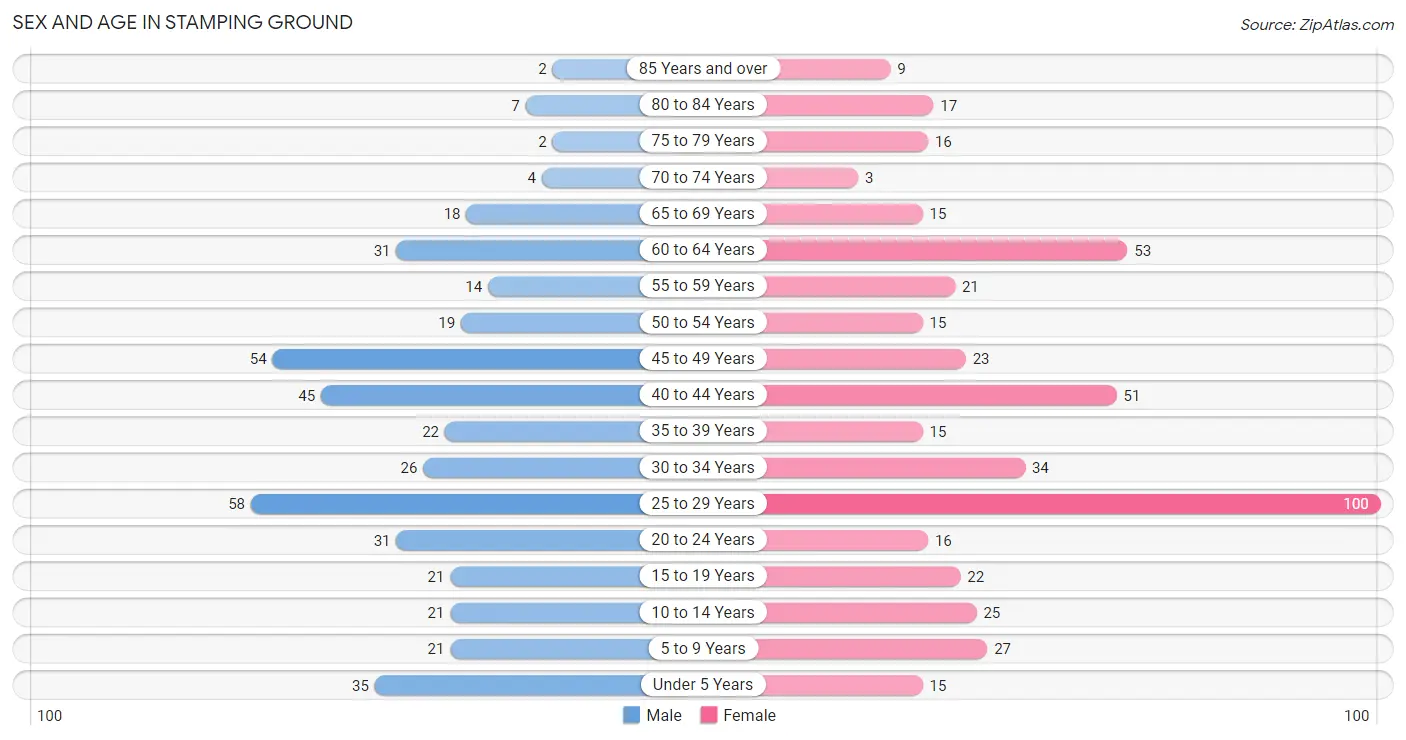
The most populous age groups in Stamping Ground are 25 to 29 Years (58 | 13.5%) for men and 25 to 29 Years (100 | 21.0%) for women.
| Age Bracket | Male | Female |
| Under 5 Years | 35 (8.1%) | 15 (3.1%) |
| 5 to 9 Years | 21 (4.9%) | 27 (5.7%) |
| 10 to 14 Years | 21 (4.9%) | 25 (5.2%) |
| 15 to 19 Years | 21 (4.9%) | 22 (4.6%) |
| 20 to 24 Years | 31 (7.2%) | 16 (3.4%) |
| 25 to 29 Years | 58 (13.5%) | 100 (21.0%) |
| 30 to 34 Years | 26 (6.0%) | 34 (7.1%) |
| 35 to 39 Years | 22 (5.1%) | 15 (3.1%) |
| 40 to 44 Years | 45 (10.4%) | 51 (10.7%) |
| 45 to 49 Years | 54 (12.5%) | 23 (4.8%) |
| 50 to 54 Years | 19 (4.4%) | 15 (3.1%) |
| 55 to 59 Years | 14 (3.3%) | 21 (4.4%) |
| 60 to 64 Years | 31 (7.2%) | 53 (11.1%) |
| 65 to 69 Years | 18 (4.2%) | 15 (3.1%) |
| 70 to 74 Years | 4 (0.9%) | 3 (0.6%) |
| 75 to 79 Years | 2 (0.5%) | 16 (3.4%) |
| 80 to 84 Years | 7 (1.6%) | 17 (3.6%) |
| 85 Years and over | 2 (0.5%) | 9 (1.9%) |
| Total | 431 (100.0%) | 477 (100.0%) |
Families and Households in Stamping Ground
Median Family Size in Stamping Ground
The median family size in Stamping Ground is 3.08 persons per family, with single male/father families (10 | 4.1%) accounting for the largest median family size of 3.2 persons per family. On the other hand, single female/mother families (73 | 29.7%) represent the smallest median family size with 2.82 persons per family.
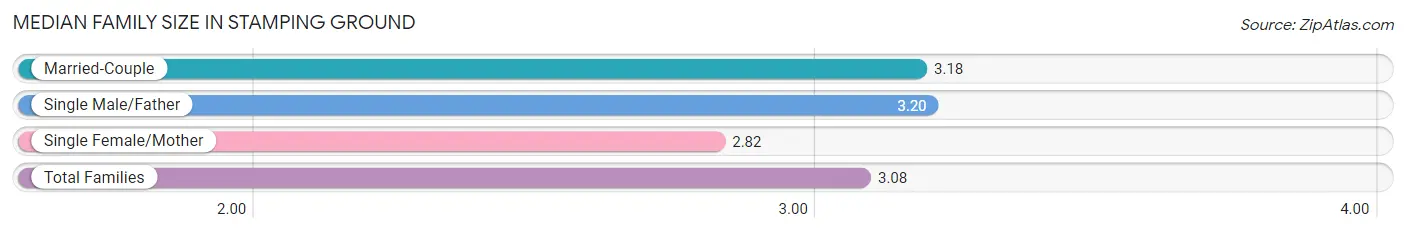
| Family Type | # Families | Family Size |
| Married-Couple | 163 (66.3%) | 3.18 |
| Single Male/Father | 10 (4.1%) | 3.20 |
| Single Female/Mother | 73 (29.7%) | 2.82 |
| Total Families | 246 (100.0%) | 3.08 |
Median Household Size in Stamping Ground
The median household size in Stamping Ground is 2.67 persons per household, with single male/father households (10 | 2.9%) accounting for the largest median household size of 3.9 persons per household. non-family households (94 | 27.7%) represent the smallest median household size with 1.24 persons per household.
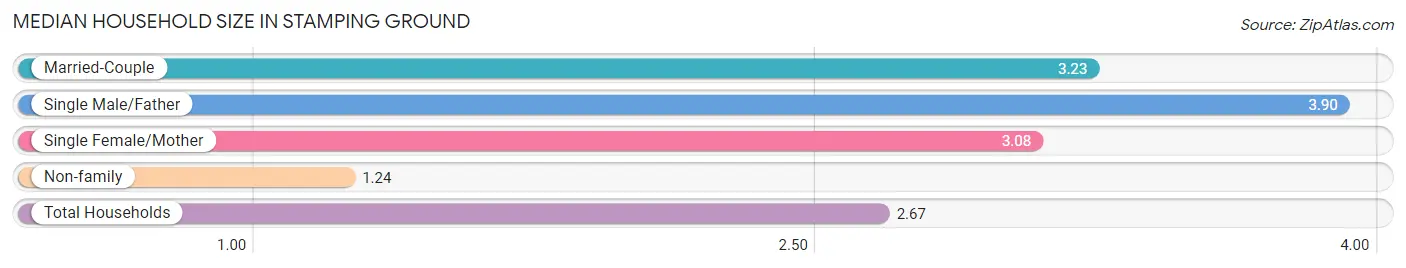
| Household Type | # Households | Household Size |
| Married-Couple | 163 (47.9%) | 3.23 |
| Single Male/Father | 10 (2.9%) | 3.90 |
| Single Female/Mother | 73 (21.5%) | 3.08 |
| Non-family | 94 (27.7%) | 1.24 |
| Total Households | 340 (100.0%) | 2.67 |
Household Size by Marriage Status in Stamping Ground
Out of a total of 340 households in Stamping Ground, 246 (72.4%) are family households, while 94 (27.7%) are nonfamily households. The most numerous type of family households are 2-person households, comprising 94, and the most common type of nonfamily households are 1-person households, comprising 84.
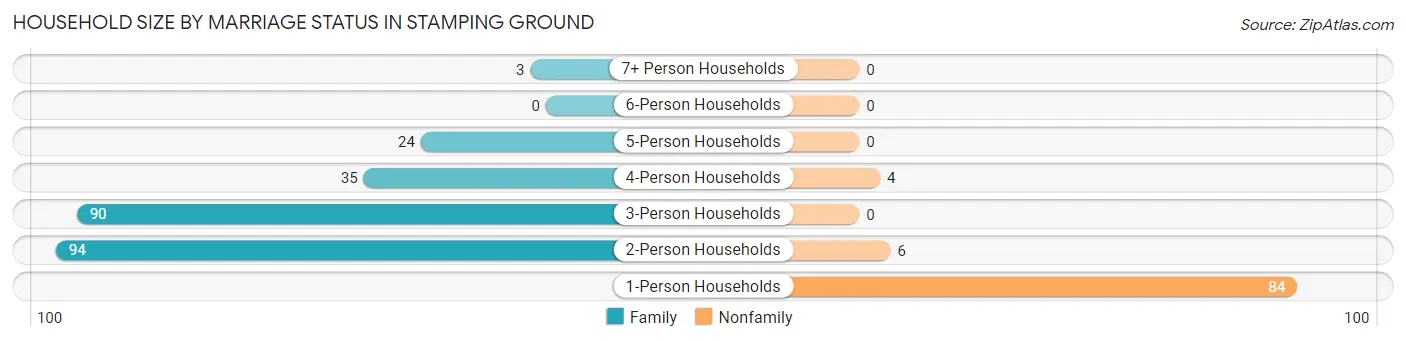
| Household Size | Family Households | Nonfamily Households |
| 1-Person Households | - | 84 (24.7%) |
| 2-Person Households | 94 (27.7%) | 6 (1.8%) |
| 3-Person Households | 90 (26.5%) | 0 (0.0%) |
| 4-Person Households | 35 (10.3%) | 4 (1.2%) |
| 5-Person Households | 24 (7.1%) | 0 (0.0%) |
| 6-Person Households | 0 (0.0%) | 0 (0.0%) |
| 7+ Person Households | 3 (0.9%) | 0 (0.0%) |
| Total | 246 (72.4%) | 94 (27.7%) |
Female Fertility in Stamping Ground
Fertility by Age in Stamping Ground
Average fertility rate in Stamping Ground is 61.0 births per 1,000 women. Women in the age bracket of 20 to 34 years have the highest fertility rate with 107.0 births per 1,000 women. Women in the age bracket of 20 to 34 years acount for 100.0% of all women with births.
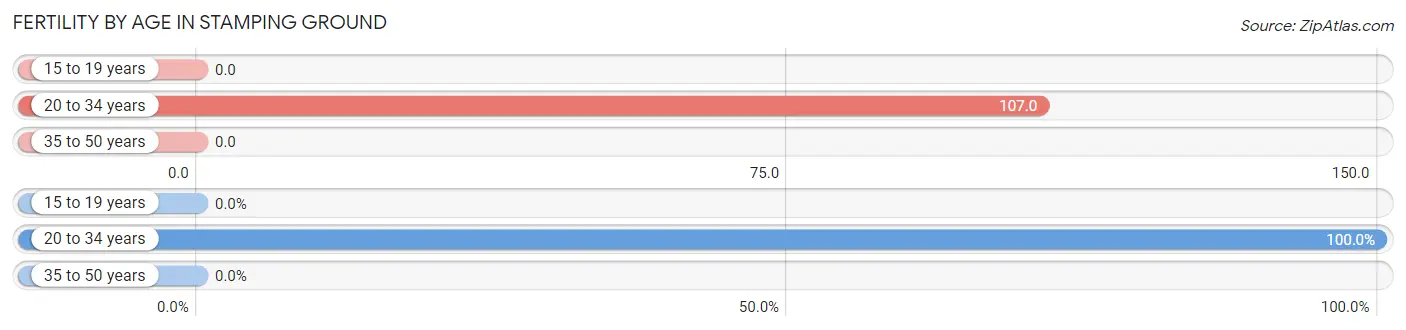
| Age Bracket | Women with Births | Births / 1,000 Women |
| 15 to 19 years | 0 (0.0%) | 0.0 |
| 20 to 34 years | 16 (100.0%) | 107.0 |
| 35 to 50 years | 0 (0.0%) | 0.0 |
| Total | 16 (100.0%) | 61.0 |
Fertility by Age by Marriage Status in Stamping Ground
18.8% of women with births (16) in Stamping Ground are married. The highest percentage of unmarried women with births falls into 20 to 34 years age bracket with 81.2% of them unmarried at the time of birth, while the lowest percentage of unmarried women with births belong to 20 to 34 years age bracket with 81.2% of them unmarried.
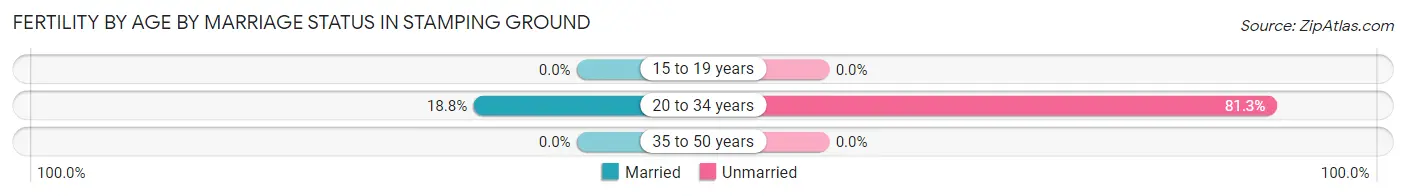
| Age Bracket | Married | Unmarried |
| 15 to 19 years | 0 (0.0%) | 0 (0.0%) |
| 20 to 34 years | 3 (18.8%) | 13 (81.2%) |
| 35 to 50 years | 0 (0.0%) | 0 (0.0%) |
| Total | 3 (18.8%) | 13 (81.2%) |
Fertility by Education in Stamping Ground
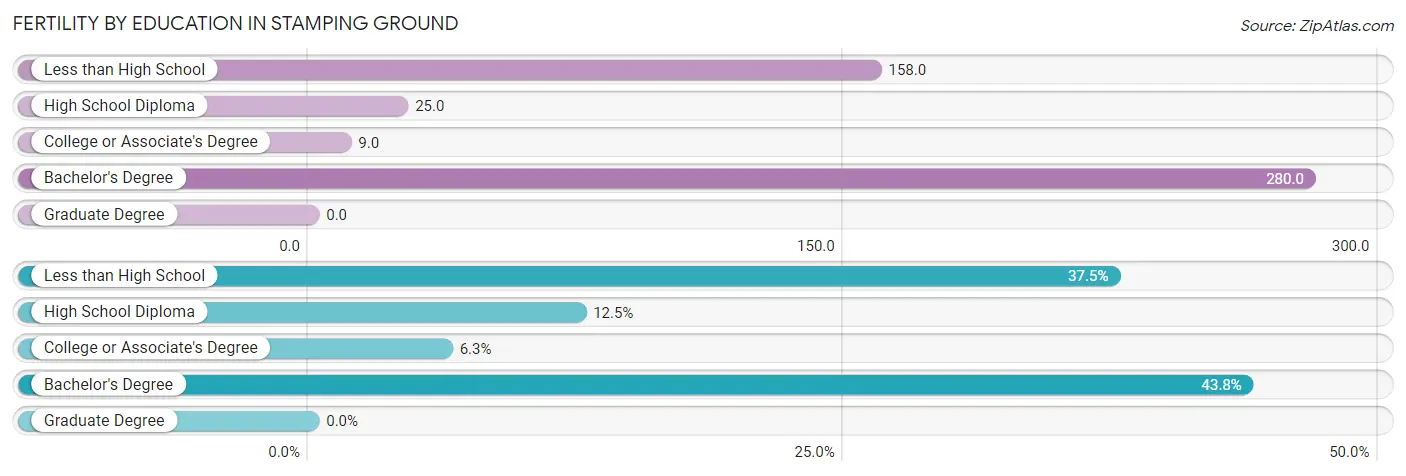
| Educational Attainment | Women with Births | Births / 1,000 Women |
| Less than High School | 6 (37.5%) | 158.0 |
| High School Diploma | 2 (12.5%) | 25.0 |
| College or Associate's Degree | 1 (6.2%) | 9.0 |
| Bachelor's Degree | 7 (43.8%) | 280.0 |
| Graduate Degree | 0 (0.0%) | 0.0 |
| Total | 16 (100.0%) | 61.0 |
Fertility by Education by Marriage Status in Stamping Ground
81.2% of women with births in Stamping Ground are unmarried. Women with the educational attainment of high school diploma are most likely to be married with 100.0% of them married at childbirth, while women with the educational attainment of less than high school are least likely to be married with 100.0% of them unmarried at childbirth.
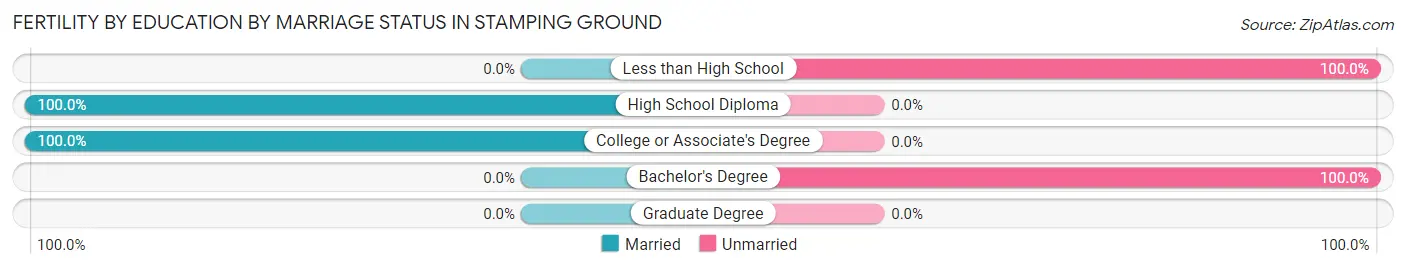
| Educational Attainment | Married | Unmarried |
| Less than High School | 0 (0.0%) | 6 (100.0%) |
| High School Diploma | 2 (100.0%) | 0 (0.0%) |
| College or Associate's Degree | 1 (100.0%) | 0 (0.0%) |
| Bachelor's Degree | 0 (0.0%) | 7 (100.0%) |
| Graduate Degree | 0 (0.0%) | 0 (0.0%) |
| Total | 3 (18.8%) | 13 (81.2%) |
Employment Characteristics in Stamping Ground
Employment by Class of Employer in Stamping Ground
Among the 462 employed individuals in Stamping Ground, private company employees (331 | 71.7%), local government employees (59 | 12.8%), and state government employees (40 | 8.7%) make up the most common classes of employment.
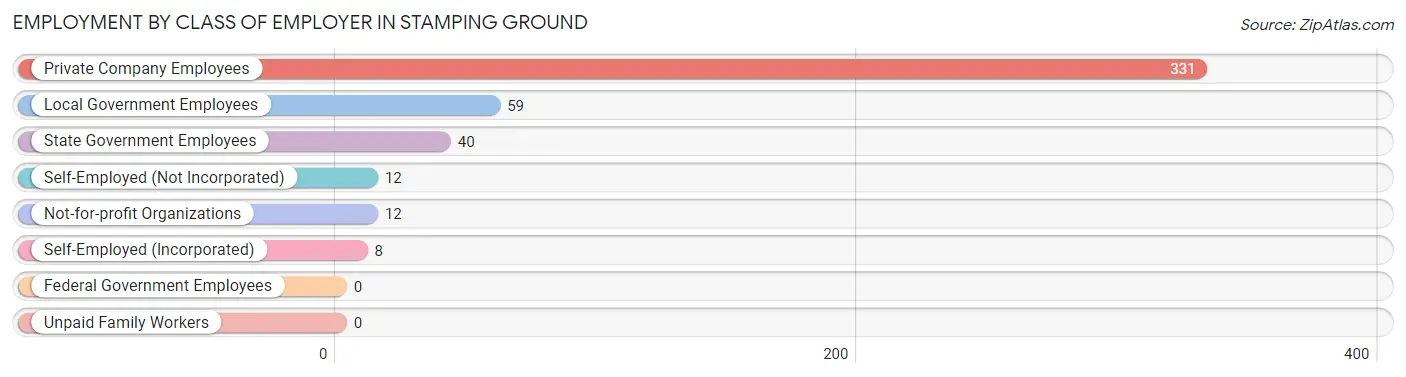
| Employer Class | # Employees | % Employees |
| Private Company Employees | 331 | 71.7% |
| Self-Employed (Incorporated) | 8 | 1.7% |
| Self-Employed (Not Incorporated) | 12 | 2.6% |
| Not-for-profit Organizations | 12 | 2.6% |
| Local Government Employees | 59 | 12.8% |
| State Government Employees | 40 | 8.7% |
| Federal Government Employees | 0 | 0.0% |
| Unpaid Family Workers | 0 | 0.0% |
| Total | 462 | 100.0% |
Employment Status by Age in Stamping Ground
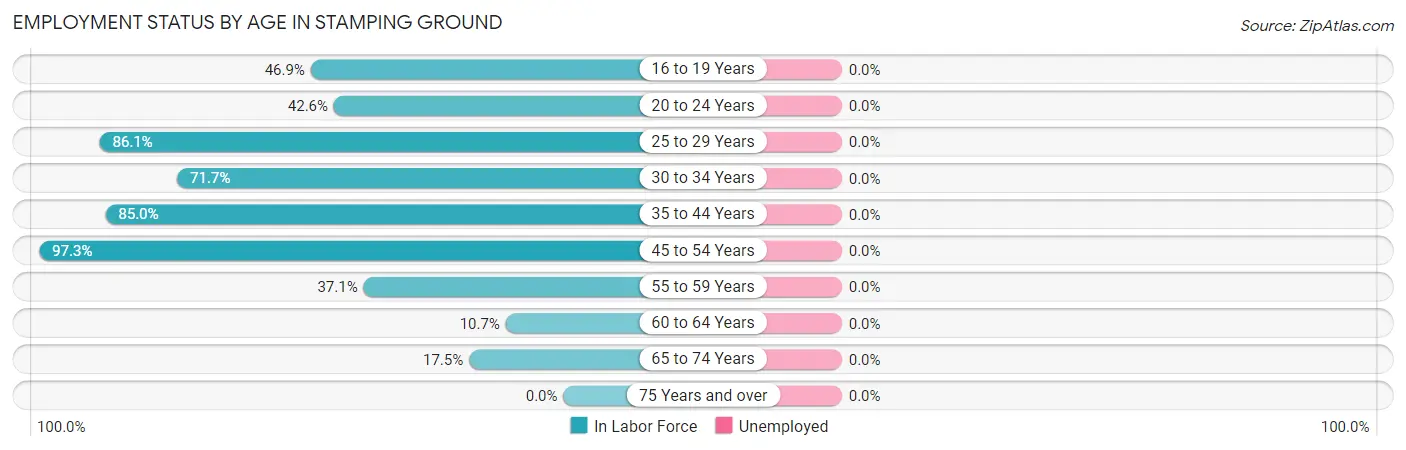
| Age Bracket | In Labor Force | Unemployed |
| 16 to 19 Years | 15 (46.9%) | 0 (0.0%) |
| 20 to 24 Years | 20 (42.6%) | 0 (0.0%) |
| 25 to 29 Years | 136 (86.1%) | 0 (0.0%) |
| 30 to 34 Years | 43 (71.7%) | 0 (0.0%) |
| 35 to 44 Years | 113 (85.0%) | 0 (0.0%) |
| 45 to 54 Years | 108 (97.3%) | 0 (0.0%) |
| 55 to 59 Years | 13 (37.1%) | 0 (0.0%) |
| 60 to 64 Years | 9 (10.7%) | 0 (0.0%) |
| 65 to 74 Years | 7 (17.5%) | 0 (0.0%) |
| 75 Years and over | 0 (0.0%) | 0 (0.0%) |
| Total | 464 (61.6%) | 0 (0.0%) |
Employment Status by Educational Attainment in Stamping Ground
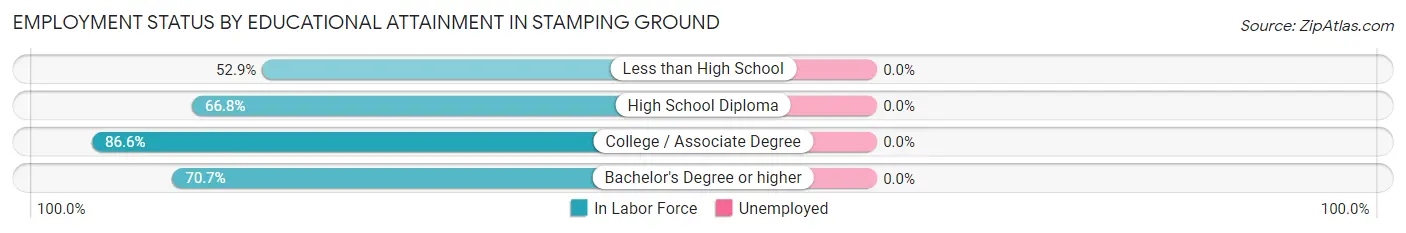
| Educational Attainment | In Labor Force | Unemployed |
| Less than High School | 36 (52.9%) | 0 (0.0%) |
| High School Diploma | 153 (66.8%) | 0 (0.0%) |
| College / Associate Degree | 175 (86.6%) | 0 (0.0%) |
| Bachelor's Degree or higher | 58 (70.7%) | 0 (0.0%) |
| Total | 422 (72.6%) | 0 (0.0%) |
Employment Occupations by Sex in Stamping Ground
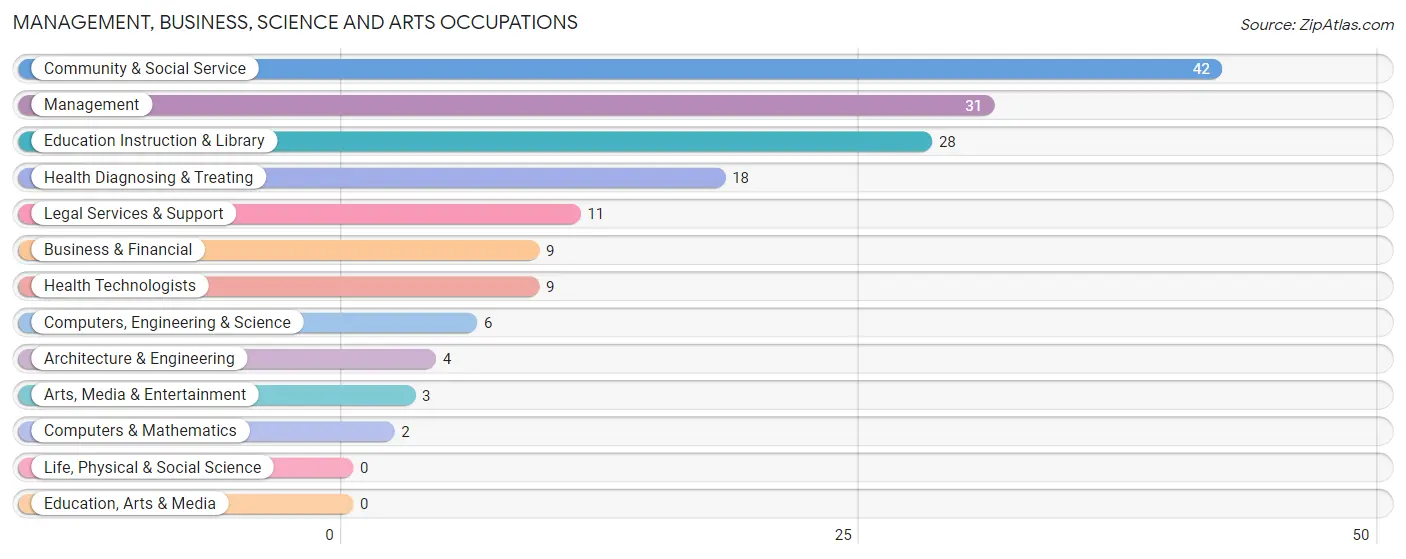
Management, Business, Science and Arts Occupations
The most common Management, Business, Science and Arts occupations in Stamping Ground are Community & Social Service (42 | 9.0%), Management (31 | 6.7%), Education Instruction & Library (28 | 6.0%), Health Diagnosing & Treating (18 | 3.9%), and Legal Services & Support (11 | 2.4%).
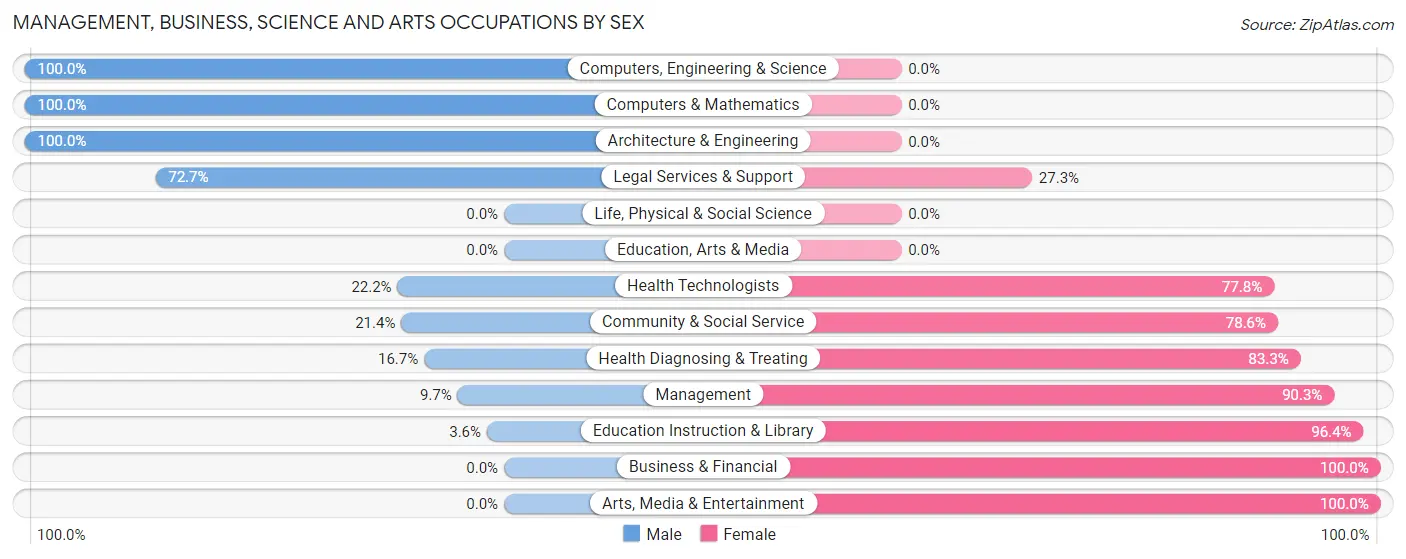
Management, Business, Science and Arts Occupations by Sex
Within the Management, Business, Science and Arts occupations in Stamping Ground, the most male-oriented occupations are Computers, Engineering & Science (100.0%), Computers & Mathematics (100.0%), and Architecture & Engineering (100.0%), while the most female-oriented occupations are Business & Financial (100.0%), Arts, Media & Entertainment (100.0%), and Education Instruction & Library (96.4%).
| Occupation | Male | Female |
| Management | 3 (9.7%) | 28 (90.3%) |
| Business & Financial | 0 (0.0%) | 9 (100.0%) |
| Computers, Engineering & Science | 6 (100.0%) | 0 (0.0%) |
| Computers & Mathematics | 2 (100.0%) | 0 (0.0%) |
| Architecture & Engineering | 4 (100.0%) | 0 (0.0%) |
| Life, Physical & Social Science | 0 (0.0%) | 0 (0.0%) |
| Community & Social Service | 9 (21.4%) | 33 (78.6%) |
| Education, Arts & Media | 0 (0.0%) | 0 (0.0%) |
| Legal Services & Support | 8 (72.7%) | 3 (27.3%) |
| Education Instruction & Library | 1 (3.6%) | 27 (96.4%) |
| Arts, Media & Entertainment | 0 (0.0%) | 3 (100.0%) |
| Health Diagnosing & Treating | 3 (16.7%) | 15 (83.3%) |
| Health Technologists | 2 (22.2%) | 7 (77.8%) |
| Total (Category) | 21 (19.8%) | 85 (80.2%) |
| Total (Overall) | 226 (48.7%) | 238 (51.3%) |
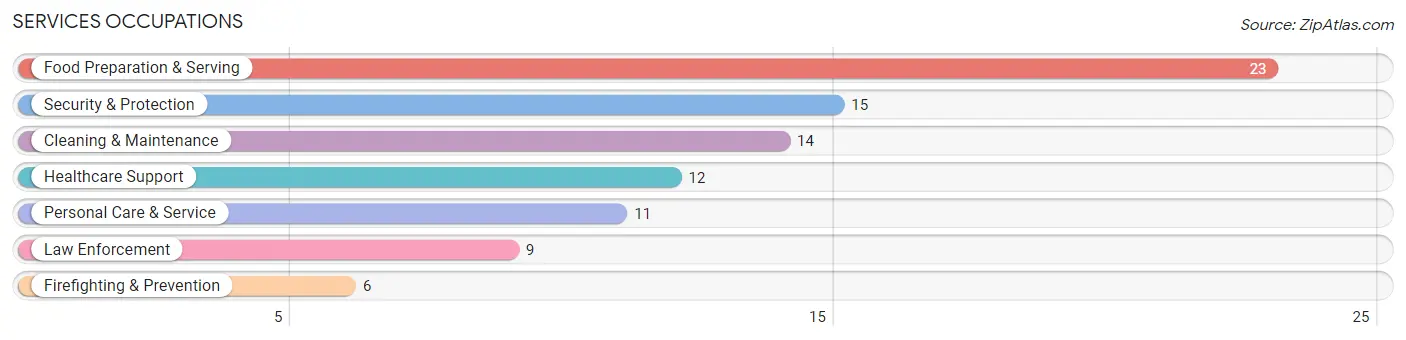
Services Occupations
The most common Services occupations in Stamping Ground are Food Preparation & Serving (23 | 5.0%), Security & Protection (15 | 3.2%), Cleaning & Maintenance (14 | 3.0%), Healthcare Support (12 | 2.6%), and Personal Care & Service (11 | 2.4%).
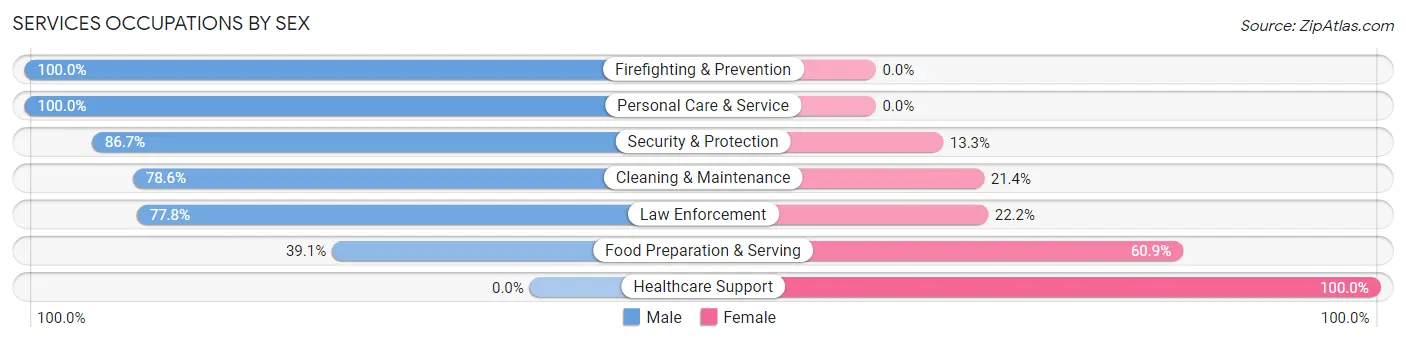
Services Occupations by Sex
Within the Services occupations in Stamping Ground, the most male-oriented occupations are Firefighting & Prevention (100.0%), Personal Care & Service (100.0%), and Security & Protection (86.7%), while the most female-oriented occupations are Healthcare Support (100.0%), Food Preparation & Serving (60.9%), and Law Enforcement (22.2%).
| Occupation | Male | Female |
| Healthcare Support | 0 (0.0%) | 12 (100.0%) |
| Security & Protection | 13 (86.7%) | 2 (13.3%) |
| Firefighting & Prevention | 6 (100.0%) | 0 (0.0%) |
| Law Enforcement | 7 (77.8%) | 2 (22.2%) |
| Food Preparation & Serving | 9 (39.1%) | 14 (60.9%) |
| Cleaning & Maintenance | 11 (78.6%) | 3 (21.4%) |
| Personal Care & Service | 11 (100.0%) | 0 (0.0%) |
| Total (Category) | 44 (58.7%) | 31 (41.3%) |
| Total (Overall) | 226 (48.7%) | 238 (51.3%) |
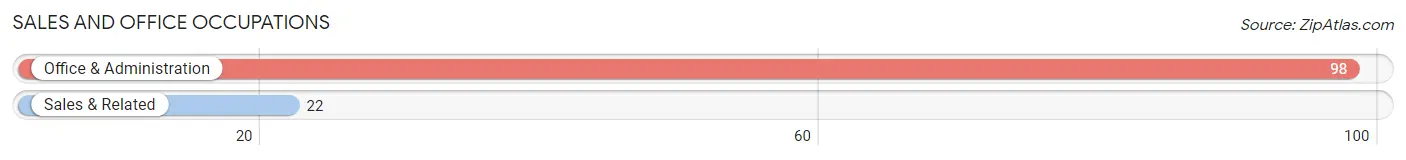
Sales and Office Occupations
The most common Sales and Office occupations in Stamping Ground are Office & Administration (98 | 21.1%), and Sales & Related (22 | 4.7%).
Sales and Office Occupations by Sex
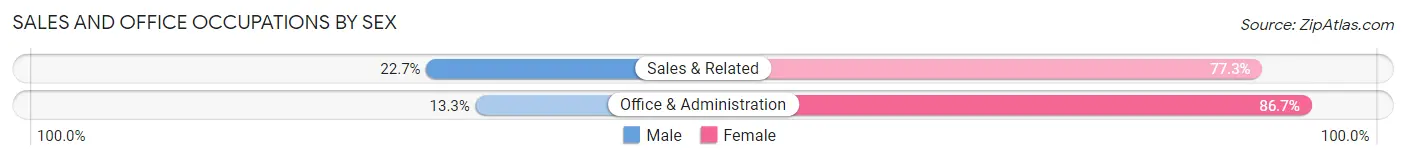
| Occupation | Male | Female |
| Sales & Related | 5 (22.7%) | 17 (77.3%) |
| Office & Administration | 13 (13.3%) | 85 (86.7%) |
| Total (Category) | 18 (15.0%) | 102 (85.0%) |
| Total (Overall) | 226 (48.7%) | 238 (51.3%) |
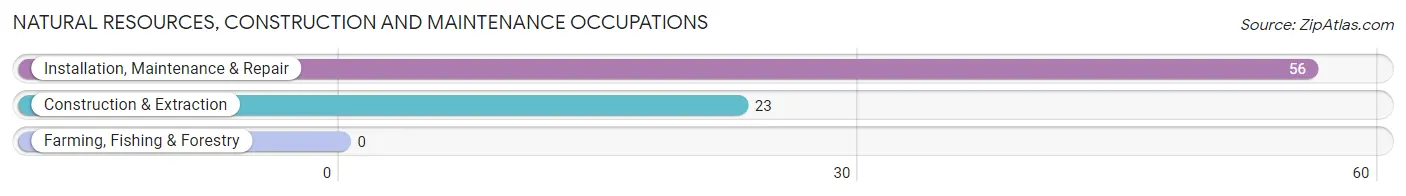
Natural Resources, Construction and Maintenance Occupations
The most common Natural Resources, Construction and Maintenance occupations in Stamping Ground are Installation, Maintenance & Repair (56 | 12.1%), and Construction & Extraction (23 | 5.0%).
Natural Resources, Construction and Maintenance Occupations by Sex
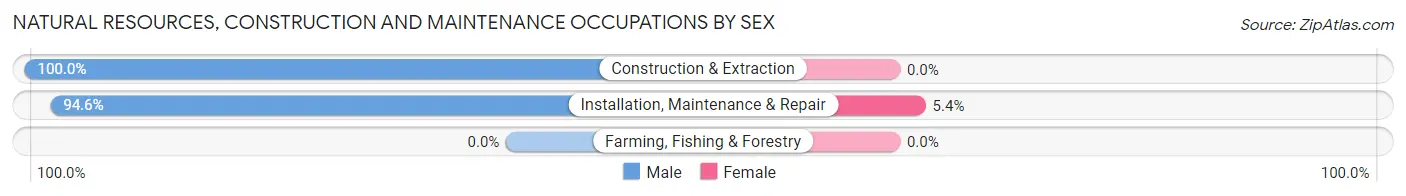
| Occupation | Male | Female |
| Farming, Fishing & Forestry | 0 (0.0%) | 0 (0.0%) |
| Construction & Extraction | 23 (100.0%) | 0 (0.0%) |
| Installation, Maintenance & Repair | 53 (94.6%) | 3 (5.4%) |
| Total (Category) | 76 (96.2%) | 3 (3.8%) |
| Total (Overall) | 226 (48.7%) | 238 (51.3%) |
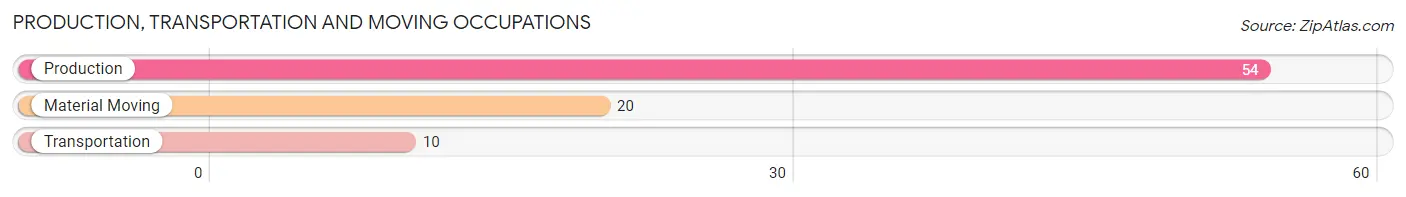
Production, Transportation and Moving Occupations
The most common Production, Transportation and Moving occupations in Stamping Ground are Production (54 | 11.6%), Material Moving (20 | 4.3%), and Transportation (10 | 2.2%).
Production, Transportation and Moving Occupations by Sex
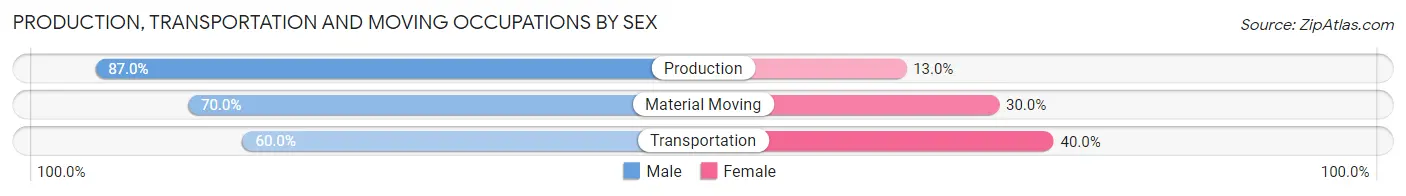
| Occupation | Male | Female |
| Production | 47 (87.0%) | 7 (13.0%) |
| Transportation | 6 (60.0%) | 4 (40.0%) |
| Material Moving | 14 (70.0%) | 6 (30.0%) |
| Total (Category) | 67 (79.8%) | 17 (20.2%) |
| Total (Overall) | 226 (48.7%) | 238 (51.3%) |
Employment Industries by Sex in Stamping Ground
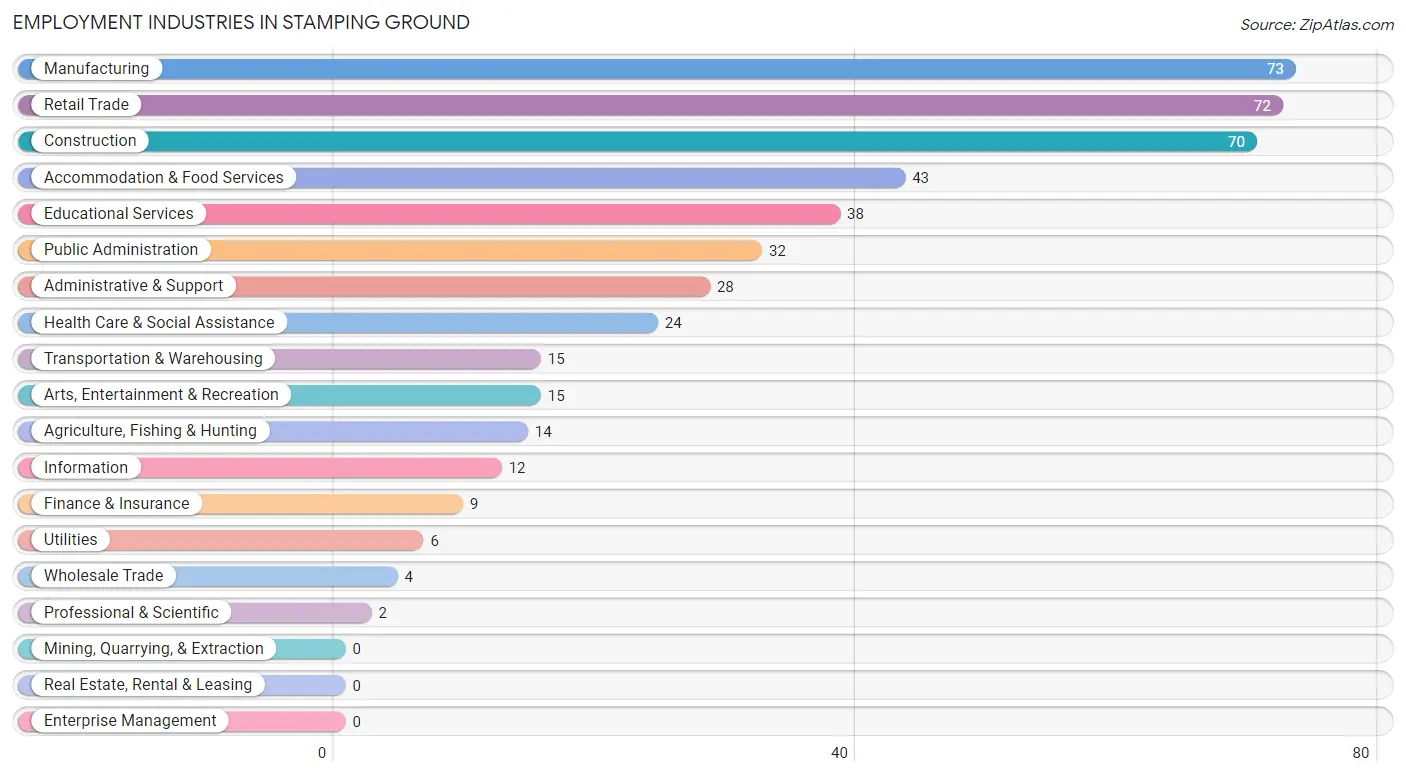
Employment Industries in Stamping Ground
The major employment industries in Stamping Ground include Manufacturing (73 | 15.7%), Retail Trade (72 | 15.5%), Construction (70 | 15.1%), Accommodation & Food Services (43 | 9.3%), and Educational Services (38 | 8.2%).
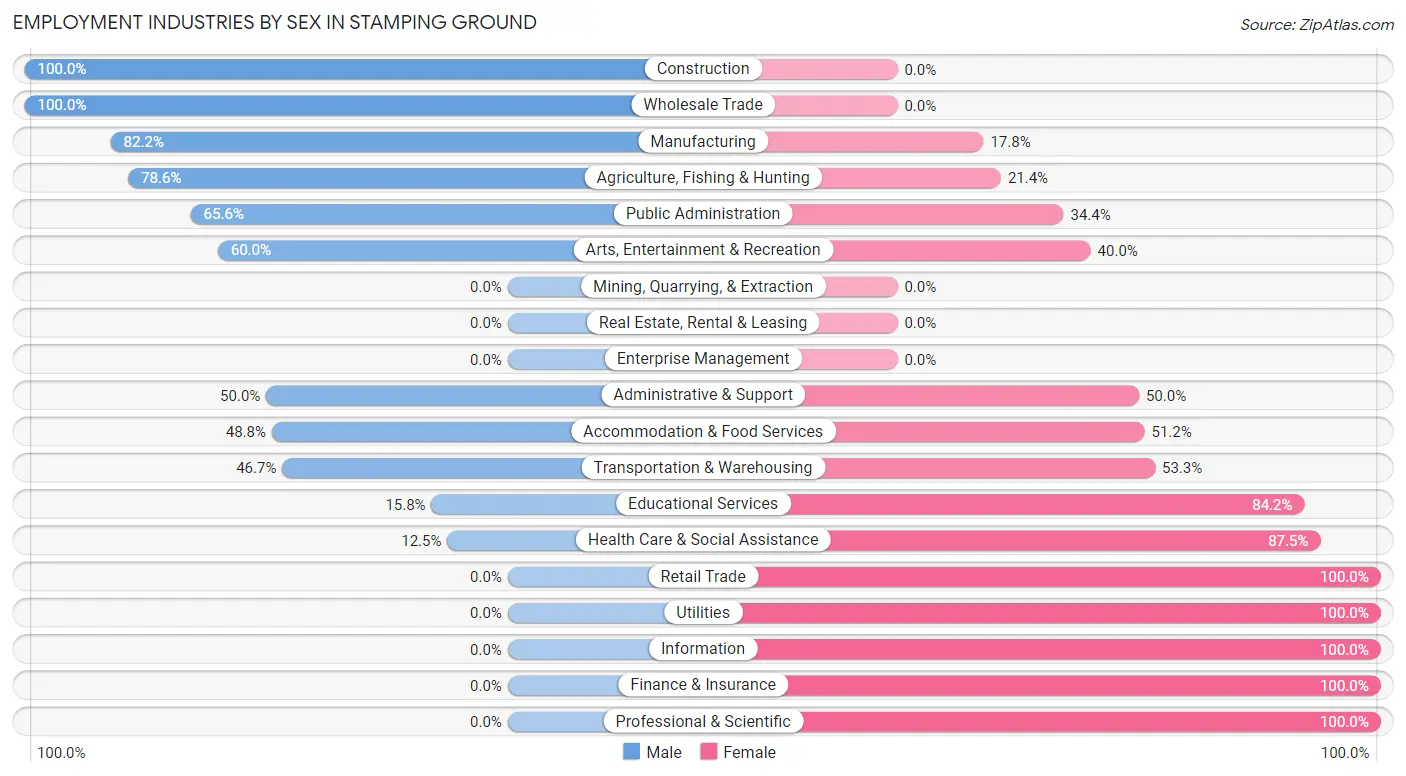
Employment Industries by Sex in Stamping Ground
The Stamping Ground industries that see more men than women are Construction (100.0%), Wholesale Trade (100.0%), and Manufacturing (82.2%), whereas the industries that tend to have a higher number of women are Retail Trade (100.0%), Utilities (100.0%), and Information (100.0%).
| Industry | Male | Female |
| Agriculture, Fishing & Hunting | 11 (78.6%) | 3 (21.4%) |
| Mining, Quarrying, & Extraction | 0 (0.0%) | 0 (0.0%) |
| Construction | 70 (100.0%) | 0 (0.0%) |
| Manufacturing | 60 (82.2%) | 13 (17.8%) |
| Wholesale Trade | 4 (100.0%) | 0 (0.0%) |
| Retail Trade | 0 (0.0%) | 72 (100.0%) |
| Transportation & Warehousing | 7 (46.7%) | 8 (53.3%) |
| Utilities | 0 (0.0%) | 6 (100.0%) |
| Information | 0 (0.0%) | 12 (100.0%) |
| Finance & Insurance | 0 (0.0%) | 9 (100.0%) |
| Real Estate, Rental & Leasing | 0 (0.0%) | 0 (0.0%) |
| Professional & Scientific | 0 (0.0%) | 2 (100.0%) |
| Enterprise Management | 0 (0.0%) | 0 (0.0%) |
| Administrative & Support | 14 (50.0%) | 14 (50.0%) |
| Educational Services | 6 (15.8%) | 32 (84.2%) |
| Health Care & Social Assistance | 3 (12.5%) | 21 (87.5%) |
| Arts, Entertainment & Recreation | 9 (60.0%) | 6 (40.0%) |
| Accommodation & Food Services | 21 (48.8%) | 22 (51.2%) |
| Public Administration | 21 (65.6%) | 11 (34.4%) |
| Total | 226 (48.7%) | 238 (51.3%) |
Education in Stamping Ground
School Enrollment in Stamping Ground
The most common levels of schooling among the 172 students in Stamping Ground are high school (42 | 24.4%), middle school (37 | 21.5%), and elementary school (35 | 20.3%).
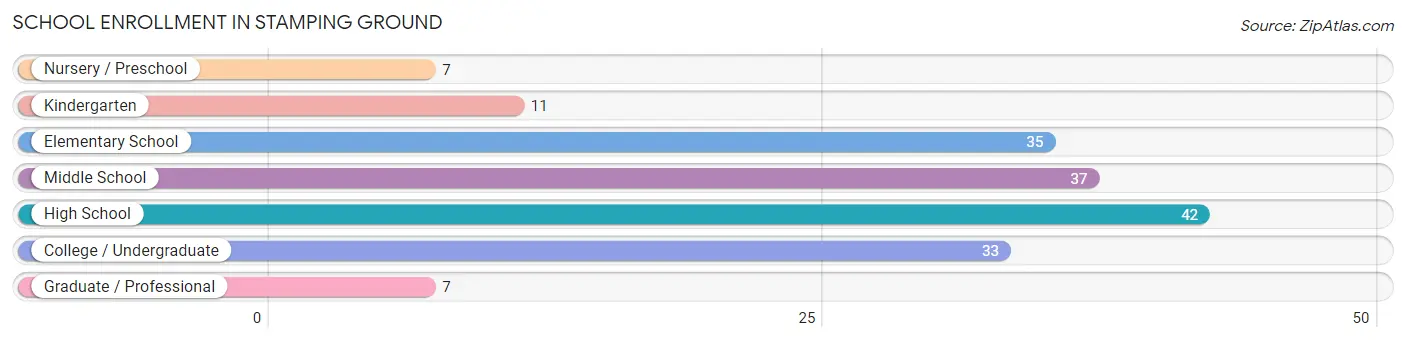
| School Level | # Students | % Students |
| Nursery / Preschool | 7 | 4.1% |
| Kindergarten | 11 | 6.4% |
| Elementary School | 35 | 20.3% |
| Middle School | 37 | 21.5% |
| High School | 42 | 24.4% |
| College / Undergraduate | 33 | 19.2% |
| Graduate / Professional | 7 | 4.1% |
| Total | 172 | 100.0% |
School Enrollment by Age by Funding Source in Stamping Ground
Out of a total of 172 students who are enrolled in schools in Stamping Ground, 14 (8.1%) attend a private institution, while the remaining 158 (91.9%) are enrolled in public schools. The age group of 3 to 4 year olds has the highest likelihood of being enrolled in private schools, with 2 (100.0% in the age bracket) enrolled. Conversely, the age group of 10 to 14 year olds has the lowest likelihood of being enrolled in a private school, with 40 (100.0% in the age bracket) attending a public institution.
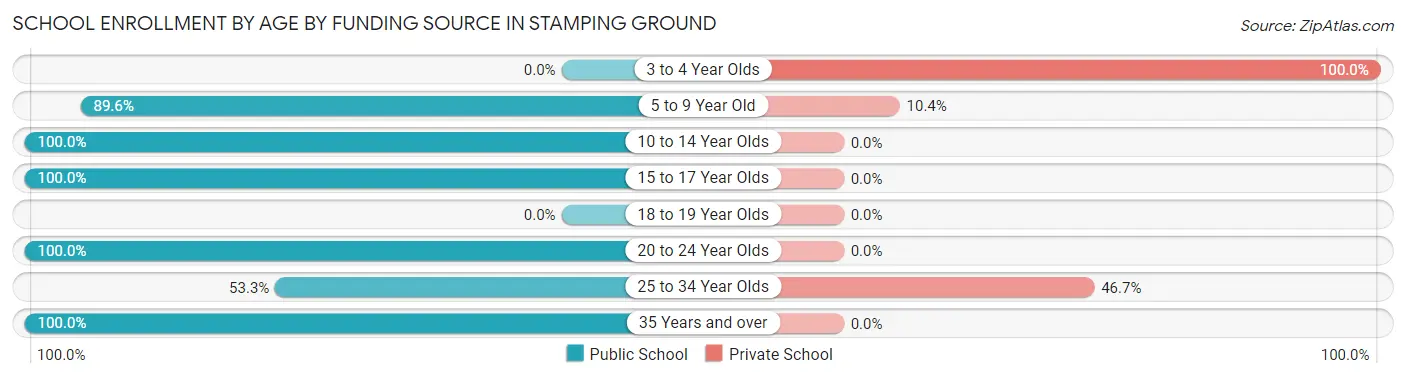
| Age Bracket | Public School | Private School |
| 3 to 4 Year Olds | 0 (0.0%) | 2 (100.0%) |
| 5 to 9 Year Old | 43 (89.6%) | 5 (10.4%) |
| 10 to 14 Year Olds | 40 (100.0%) | 0 (0.0%) |
| 15 to 17 Year Olds | 42 (100.0%) | 0 (0.0%) |
| 18 to 19 Year Olds | 0 (0.0%) | 0 (0.0%) |
| 20 to 24 Year Olds | 13 (100.0%) | 0 (0.0%) |
| 25 to 34 Year Olds | 8 (53.3%) | 7 (46.7%) |
| 35 Years and over | 12 (100.0%) | 0 (0.0%) |
| Total | 158 (91.9%) | 14 (8.1%) |
Educational Attainment by Field of Study in Stamping Ground
Science & technology (27 | 22.3%), communications (24 | 19.8%), social sciences (14 | 11.6%), education (13 | 10.7%), and bio, nature & agricultural (12 | 9.9%) are the most common fields of study among 121 individuals in Stamping Ground who have obtained a bachelor's degree or higher.
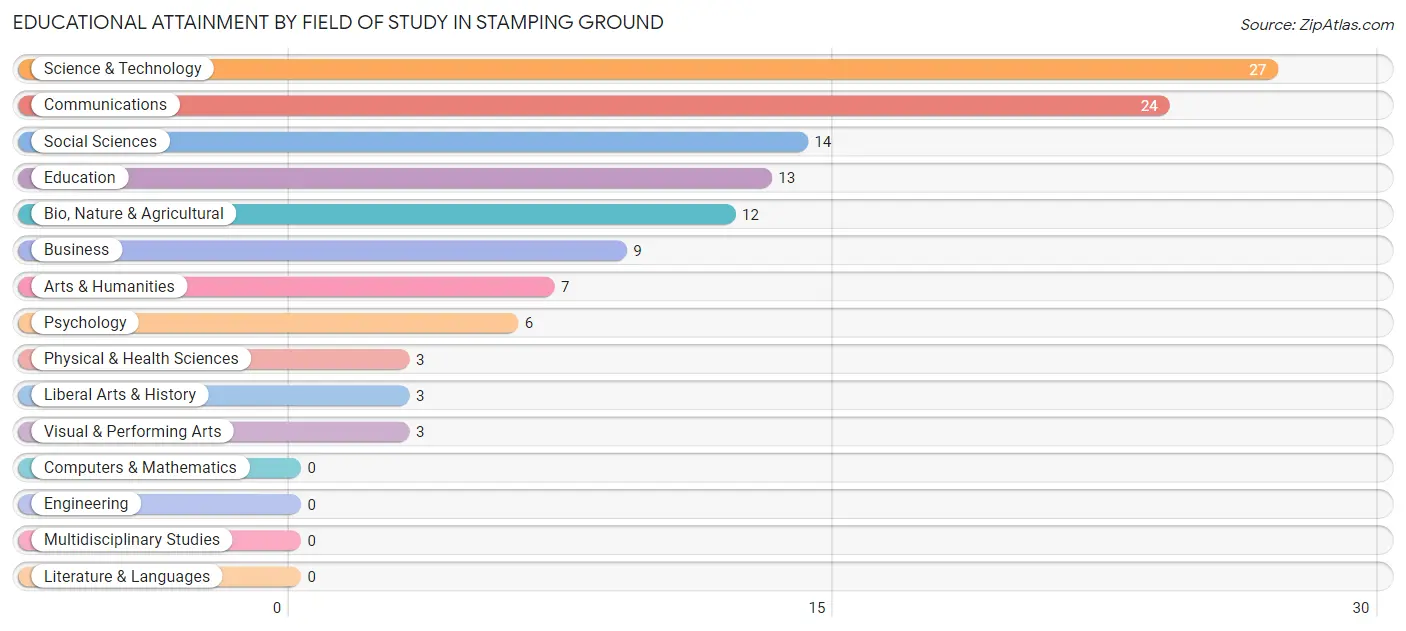
| Field of Study | # Graduates | % Graduates |
| Computers & Mathematics | 0 | 0.0% |
| Bio, Nature & Agricultural | 12 | 9.9% |
| Physical & Health Sciences | 3 | 2.5% |
| Psychology | 6 | 5.0% |
| Social Sciences | 14 | 11.6% |
| Engineering | 0 | 0.0% |
| Multidisciplinary Studies | 0 | 0.0% |
| Science & Technology | 27 | 22.3% |
| Business | 9 | 7.4% |
| Education | 13 | 10.7% |
| Literature & Languages | 0 | 0.0% |
| Liberal Arts & History | 3 | 2.5% |
| Visual & Performing Arts | 3 | 2.5% |
| Communications | 24 | 19.8% |
| Arts & Humanities | 7 | 5.8% |
| Total | 121 | 100.0% |
Transportation & Commute in Stamping Ground
Vehicle Availability by Sex in Stamping Ground
The most prevalent vehicle ownership categories in Stamping Ground are males with 2 vehicles (99, accounting for 44.0%) and females with 2 vehicles (39, making up 41.8%).
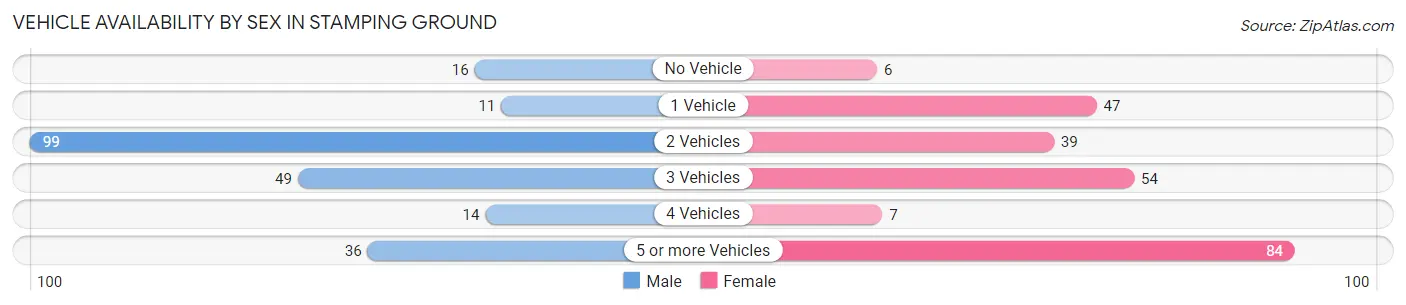
| Vehicles Available | Male | Female |
| No Vehicle | 16 (7.1%) | 6 (2.5%) |
| 1 Vehicle | 11 (4.9%) | 47 (19.8%) |
| 2 Vehicles | 99 (44.0%) | 39 (16.5%) |
| 3 Vehicles | 49 (21.8%) | 54 (22.8%) |
| 4 Vehicles | 14 (6.2%) | 7 (2.9%) |
| 5 or more Vehicles | 36 (16.0%) | 84 (35.4%) |
| Total | 225 (100.0%) | 237 (100.0%) |
Commute Time in Stamping Ground
The most frequently occuring commute durations in Stamping Ground are 20 to 24 minutes (172 commuters, 38.6%), 10 to 14 minutes (63 commuters, 14.1%), and 30 to 34 minutes (53 commuters, 11.9%).
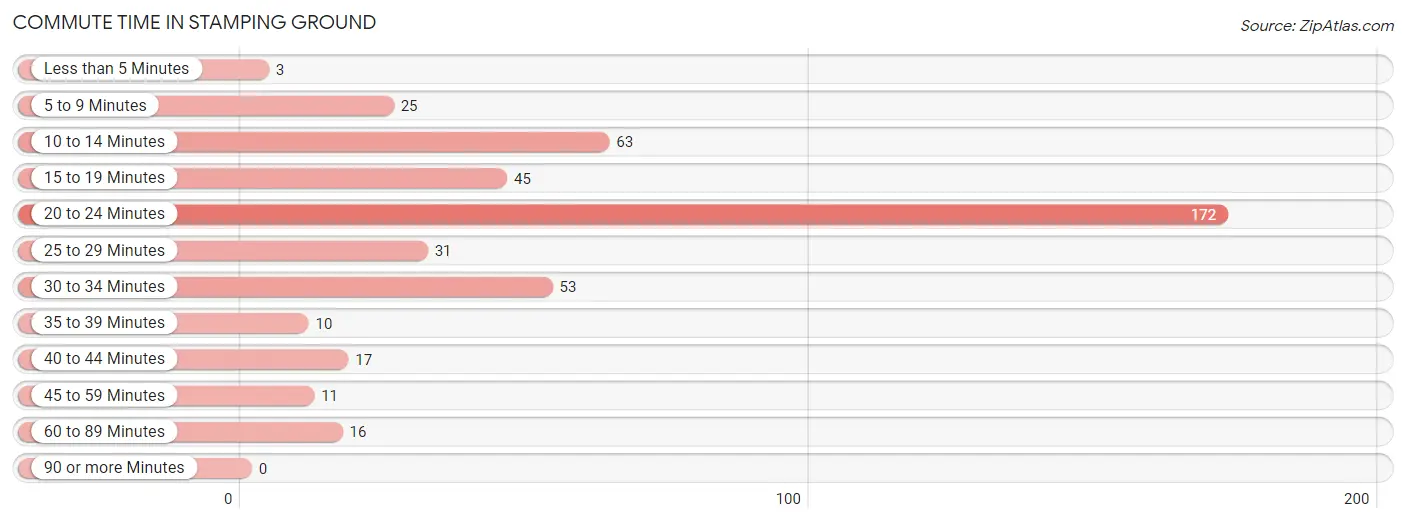
| Commute Time | # Commuters | % Commuters |
| Less than 5 Minutes | 3 | 0.7% |
| 5 to 9 Minutes | 25 | 5.6% |
| 10 to 14 Minutes | 63 | 14.1% |
| 15 to 19 Minutes | 45 | 10.1% |
| 20 to 24 Minutes | 172 | 38.6% |
| 25 to 29 Minutes | 31 | 7.0% |
| 30 to 34 Minutes | 53 | 11.9% |
| 35 to 39 Minutes | 10 | 2.2% |
| 40 to 44 Minutes | 17 | 3.8% |
| 45 to 59 Minutes | 11 | 2.5% |
| 60 to 89 Minutes | 16 | 3.6% |
| 90 or more Minutes | 0 | 0.0% |
Commute Time by Sex in Stamping Ground
The most common commute times in Stamping Ground are 20 to 24 minutes (74 commuters, 33.2%) for males and 20 to 24 minutes (98 commuters, 44.0%) for females.
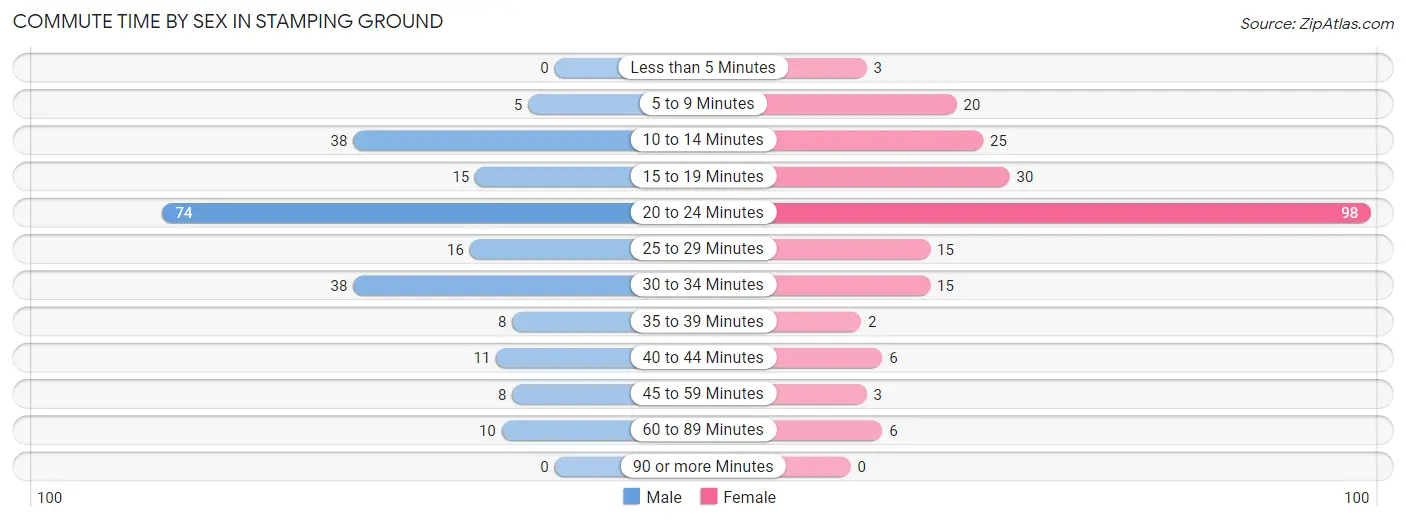
| Commute Time | Male | Female |
| Less than 5 Minutes | 0 (0.0%) | 3 (1.3%) |
| 5 to 9 Minutes | 5 (2.2%) | 20 (9.0%) |
| 10 to 14 Minutes | 38 (17.0%) | 25 (11.2%) |
| 15 to 19 Minutes | 15 (6.7%) | 30 (13.5%) |
| 20 to 24 Minutes | 74 (33.2%) | 98 (44.0%) |
| 25 to 29 Minutes | 16 (7.2%) | 15 (6.7%) |
| 30 to 34 Minutes | 38 (17.0%) | 15 (6.7%) |
| 35 to 39 Minutes | 8 (3.6%) | 2 (0.9%) |
| 40 to 44 Minutes | 11 (4.9%) | 6 (2.7%) |
| 45 to 59 Minutes | 8 (3.6%) | 3 (1.3%) |
| 60 to 89 Minutes | 10 (4.5%) | 6 (2.7%) |
| 90 or more Minutes | 0 (0.0%) | 0 (0.0%) |
Time of Departure to Work by Sex in Stamping Ground
The most frequent times of departure to work in Stamping Ground are 7:00 AM to 7:29 AM (94, 42.1%) for males and 6:30 AM to 6:59 AM (79, 35.4%) for females.
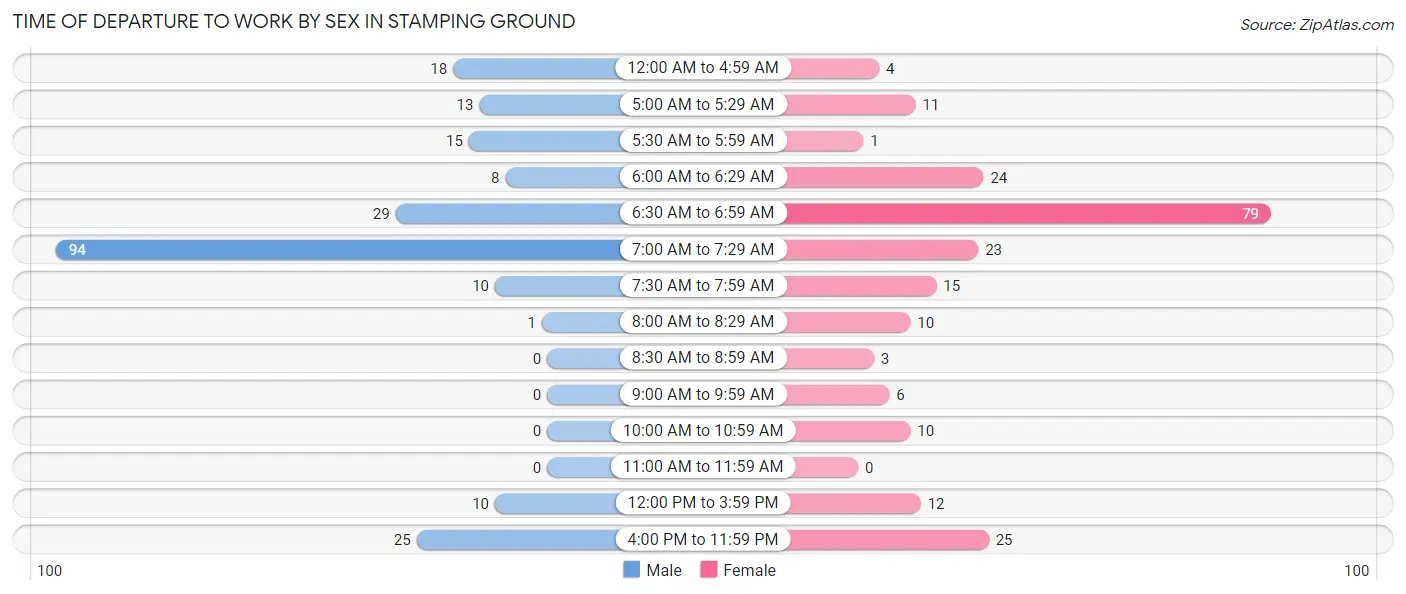
| Time of Departure | Male | Female |
| 12:00 AM to 4:59 AM | 18 (8.1%) | 4 (1.8%) |
| 5:00 AM to 5:29 AM | 13 (5.8%) | 11 (4.9%) |
| 5:30 AM to 5:59 AM | 15 (6.7%) | 1 (0.4%) |
| 6:00 AM to 6:29 AM | 8 (3.6%) | 24 (10.8%) |
| 6:30 AM to 6:59 AM | 29 (13.0%) | 79 (35.4%) |
| 7:00 AM to 7:29 AM | 94 (42.1%) | 23 (10.3%) |
| 7:30 AM to 7:59 AM | 10 (4.5%) | 15 (6.7%) |
| 8:00 AM to 8:29 AM | 1 (0.4%) | 10 (4.5%) |
| 8:30 AM to 8:59 AM | 0 (0.0%) | 3 (1.3%) |
| 9:00 AM to 9:59 AM | 0 (0.0%) | 6 (2.7%) |
| 10:00 AM to 10:59 AM | 0 (0.0%) | 10 (4.5%) |
| 11:00 AM to 11:59 AM | 0 (0.0%) | 0 (0.0%) |
| 12:00 PM to 3:59 PM | 10 (4.5%) | 12 (5.4%) |
| 4:00 PM to 11:59 PM | 25 (11.2%) | 25 (11.2%) |
| Total | 223 (100.0%) | 223 (100.0%) |
Housing Occupancy in Stamping Ground
Occupancy by Ownership in Stamping Ground
Of the total 340 dwellings in Stamping Ground, owner-occupied units account for 209 (61.5%), while renter-occupied units make up 131 (38.5%).
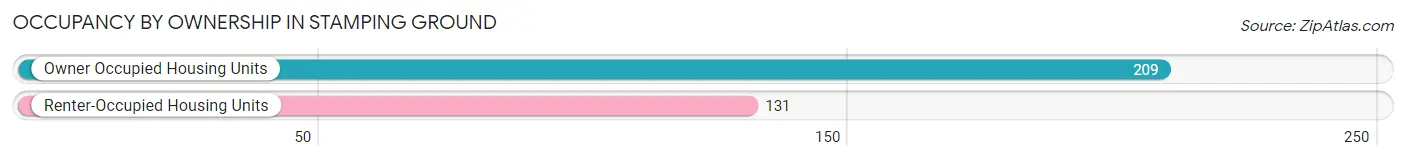
| Occupancy | # Housing Units | % Housing Units |
| Owner Occupied Housing Units | 209 | 61.5% |
| Renter-Occupied Housing Units | 131 | 38.5% |
| Total Occupied Housing Units | 340 | 100.0% |
Occupancy by Household Size in Stamping Ground
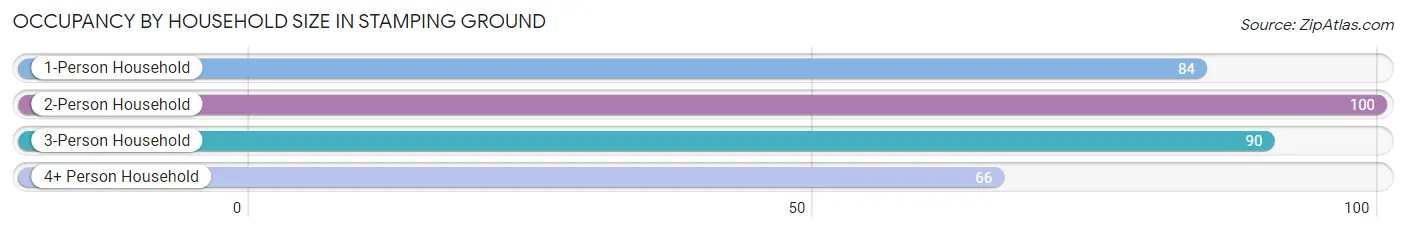
| Household Size | # Housing Units | % Housing Units |
| 1-Person Household | 84 | 24.7% |
| 2-Person Household | 100 | 29.4% |
| 3-Person Household | 90 | 26.5% |
| 4+ Person Household | 66 | 19.4% |
| Total Housing Units | 340 | 100.0% |
Occupancy by Ownership by Household Size in Stamping Ground
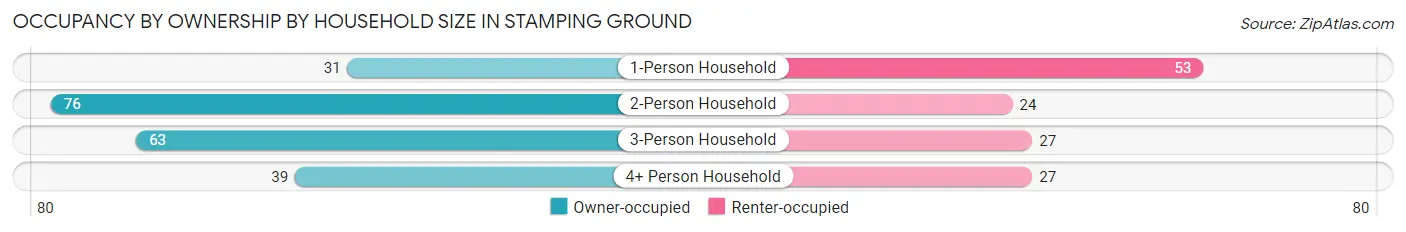
| Household Size | Owner-occupied | Renter-occupied |
| 1-Person Household | 31 (36.9%) | 53 (63.1%) |
| 2-Person Household | 76 (76.0%) | 24 (24.0%) |
| 3-Person Household | 63 (70.0%) | 27 (30.0%) |
| 4+ Person Household | 39 (59.1%) | 27 (40.9%) |
| Total Housing Units | 209 (61.5%) | 131 (38.5%) |
Occupancy by Educational Attainment in Stamping Ground
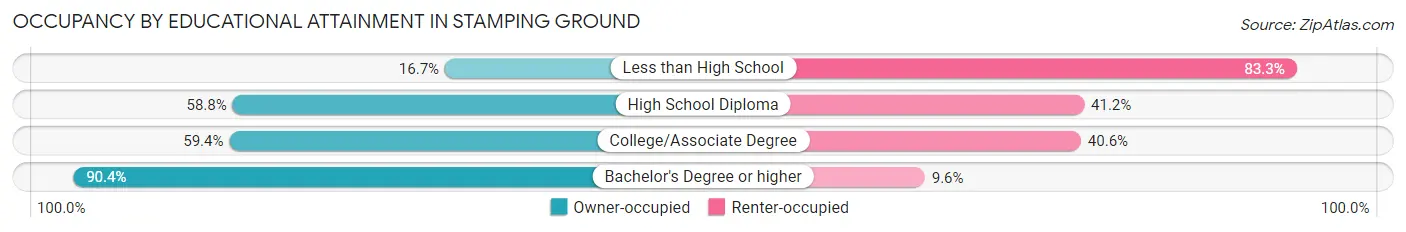
| Household Size | Owner-occupied | Renter-occupied |
| Less than High School | 7 (16.7%) | 35 (83.3%) |
| High School Diploma | 67 (58.8%) | 47 (41.2%) |
| College/Associate Degree | 60 (59.4%) | 41 (40.6%) |
| Bachelor's Degree or higher | 75 (90.4%) | 8 (9.6%) |
Occupancy by Age of Householder in Stamping Ground
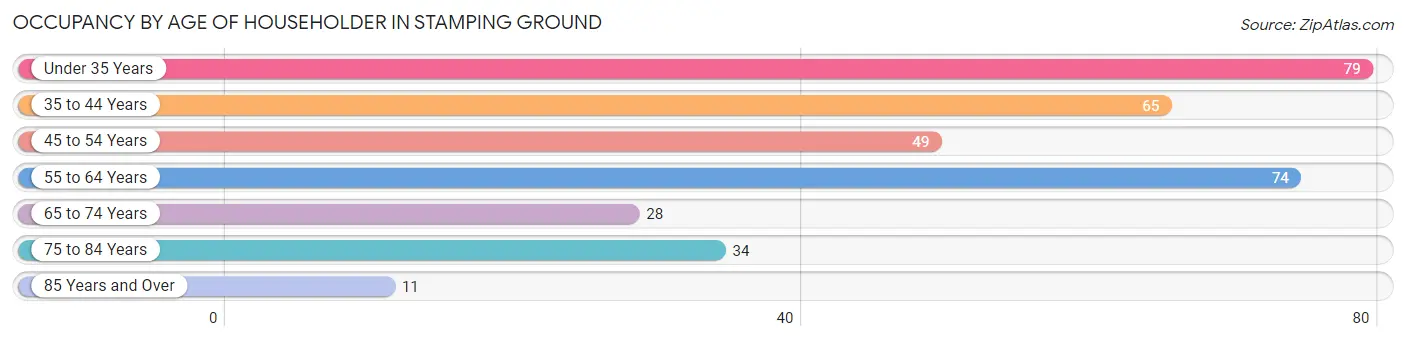
| Age Bracket | # Households | % Households |
| Under 35 Years | 79 | 23.2% |
| 35 to 44 Years | 65 | 19.1% |
| 45 to 54 Years | 49 | 14.4% |
| 55 to 64 Years | 74 | 21.8% |
| 65 to 74 Years | 28 | 8.2% |
| 75 to 84 Years | 34 | 10.0% |
| 85 Years and Over | 11 | 3.2% |
| Total | 340 | 100.0% |
Housing Finances in Stamping Ground
Median Income by Occupancy in Stamping Ground
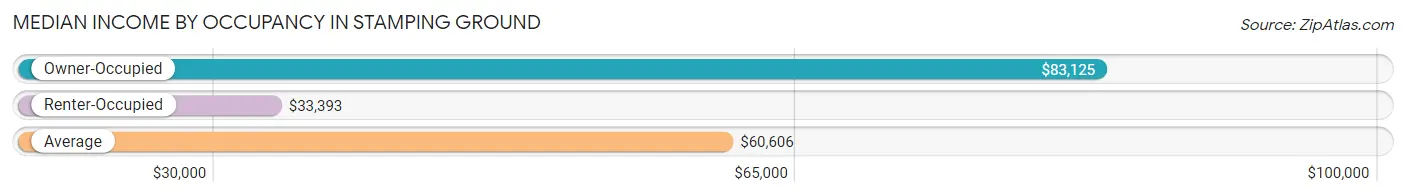
| Occupancy Type | # Households | Median Income |
| Owner-Occupied | 209 (61.5%) | $83,125 |
| Renter-Occupied | 131 (38.5%) | $33,393 |
| Average | 340 (100.0%) | $60,606 |
Occupancy by Householder Income Bracket in Stamping Ground
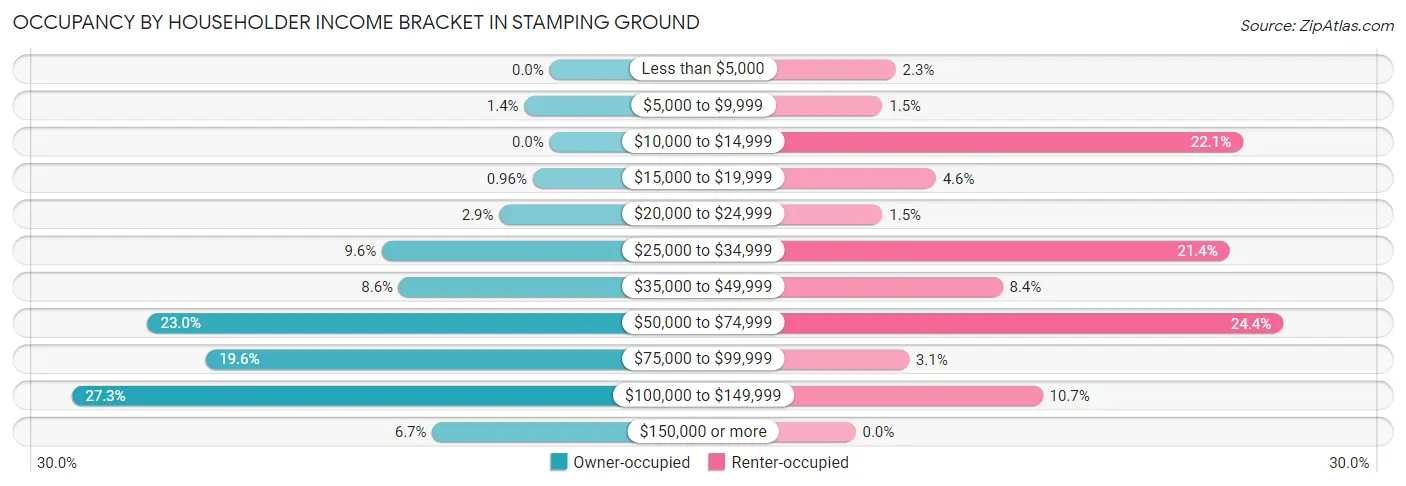
| Income Bracket | Owner-occupied | Renter-occupied |
| Less than $5,000 | 0 (0.0%) | 3 (2.3%) |
| $5,000 to $9,999 | 3 (1.4%) | 2 (1.5%) |
| $10,000 to $14,999 | 0 (0.0%) | 29 (22.1%) |
| $15,000 to $19,999 | 2 (1.0%) | 6 (4.6%) |
| $20,000 to $24,999 | 6 (2.9%) | 2 (1.5%) |
| $25,000 to $34,999 | 20 (9.6%) | 28 (21.4%) |
| $35,000 to $49,999 | 18 (8.6%) | 11 (8.4%) |
| $50,000 to $74,999 | 48 (23.0%) | 32 (24.4%) |
| $75,000 to $99,999 | 41 (19.6%) | 4 (3.0%) |
| $100,000 to $149,999 | 57 (27.3%) | 14 (10.7%) |
| $150,000 or more | 14 (6.7%) | 0 (0.0%) |
| Total | 209 (100.0%) | 131 (100.0%) |
Monthly Housing Cost Tiers in Stamping Ground
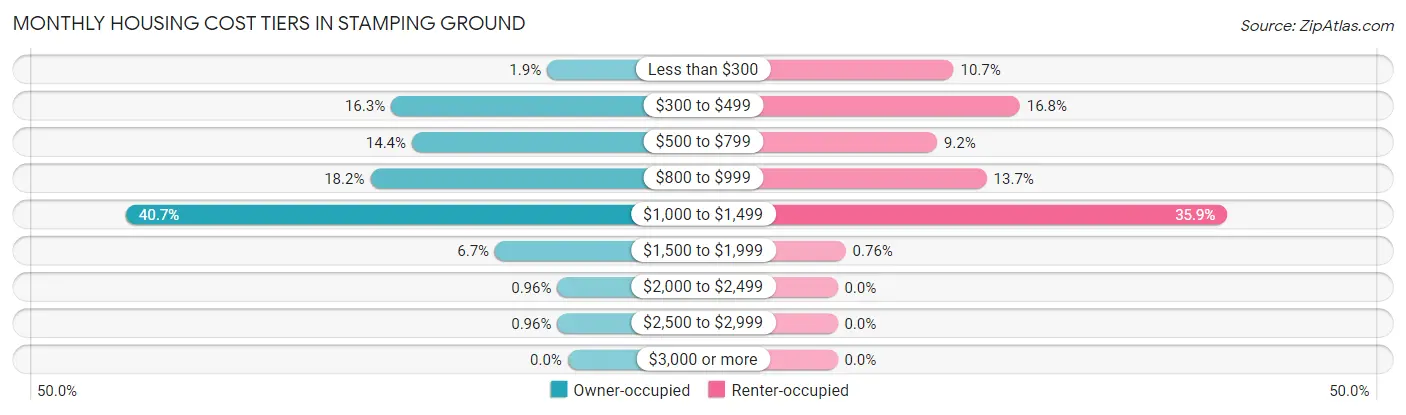
| Monthly Cost | Owner-occupied | Renter-occupied |
| Less than $300 | 4 (1.9%) | 14 (10.7%) |
| $300 to $499 | 34 (16.3%) | 22 (16.8%) |
| $500 to $799 | 30 (14.3%) | 12 (9.2%) |
| $800 to $999 | 38 (18.2%) | 18 (13.7%) |
| $1,000 to $1,499 | 85 (40.7%) | 47 (35.9%) |
| $1,500 to $1,999 | 14 (6.7%) | 1 (0.8%) |
| $2,000 to $2,499 | 2 (1.0%) | 0 (0.0%) |
| $2,500 to $2,999 | 2 (1.0%) | 0 (0.0%) |
| $3,000 or more | 0 (0.0%) | 0 (0.0%) |
| Total | 209 (100.0%) | 131 (100.0%) |
Physical Housing Characteristics in Stamping Ground
Housing Structures in Stamping Ground
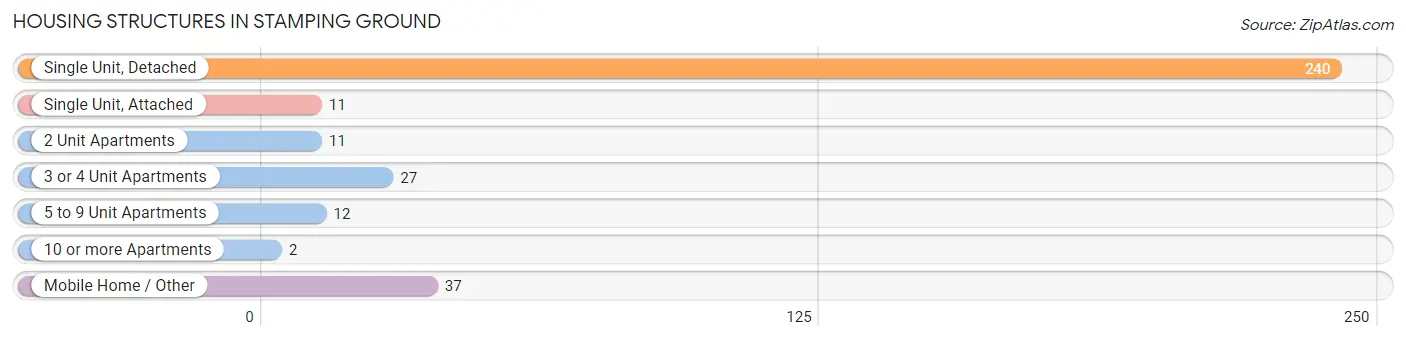
| Structure Type | # Housing Units | % Housing Units |
| Single Unit, Detached | 240 | 70.6% |
| Single Unit, Attached | 11 | 3.2% |
| 2 Unit Apartments | 11 | 3.2% |
| 3 or 4 Unit Apartments | 27 | 7.9% |
| 5 to 9 Unit Apartments | 12 | 3.5% |
| 10 or more Apartments | 2 | 0.6% |
| Mobile Home / Other | 37 | 10.9% |
| Total | 340 | 100.0% |
Housing Structures by Occupancy in Stamping Ground
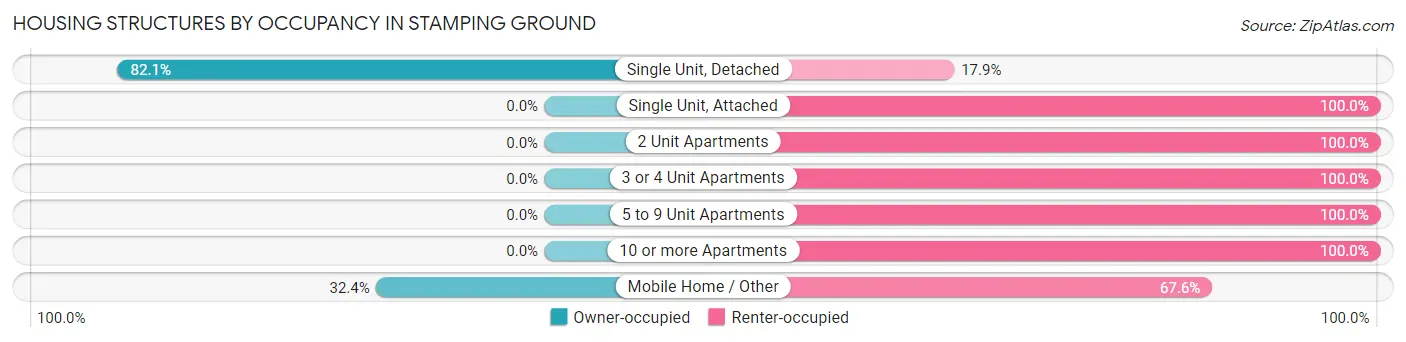
| Structure Type | Owner-occupied | Renter-occupied |
| Single Unit, Detached | 197 (82.1%) | 43 (17.9%) |
| Single Unit, Attached | 0 (0.0%) | 11 (100.0%) |
| 2 Unit Apartments | 0 (0.0%) | 11 (100.0%) |
| 3 or 4 Unit Apartments | 0 (0.0%) | 27 (100.0%) |
| 5 to 9 Unit Apartments | 0 (0.0%) | 12 (100.0%) |
| 10 or more Apartments | 0 (0.0%) | 2 (100.0%) |
| Mobile Home / Other | 12 (32.4%) | 25 (67.6%) |
| Total | 209 (61.5%) | 131 (38.5%) |
Housing Structures by Number of Rooms in Stamping Ground
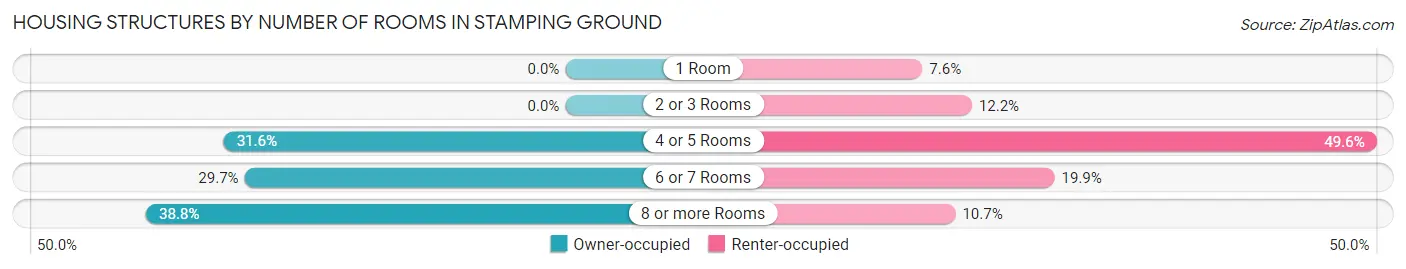
| Number of Rooms | Owner-occupied | Renter-occupied |
| 1 Room | 0 (0.0%) | 10 (7.6%) |
| 2 or 3 Rooms | 0 (0.0%) | 16 (12.2%) |
| 4 or 5 Rooms | 66 (31.6%) | 65 (49.6%) |
| 6 or 7 Rooms | 62 (29.7%) | 26 (19.9%) |
| 8 or more Rooms | 81 (38.8%) | 14 (10.7%) |
| Total | 209 (100.0%) | 131 (100.0%) |
Housing Structure by Heating Type in Stamping Ground
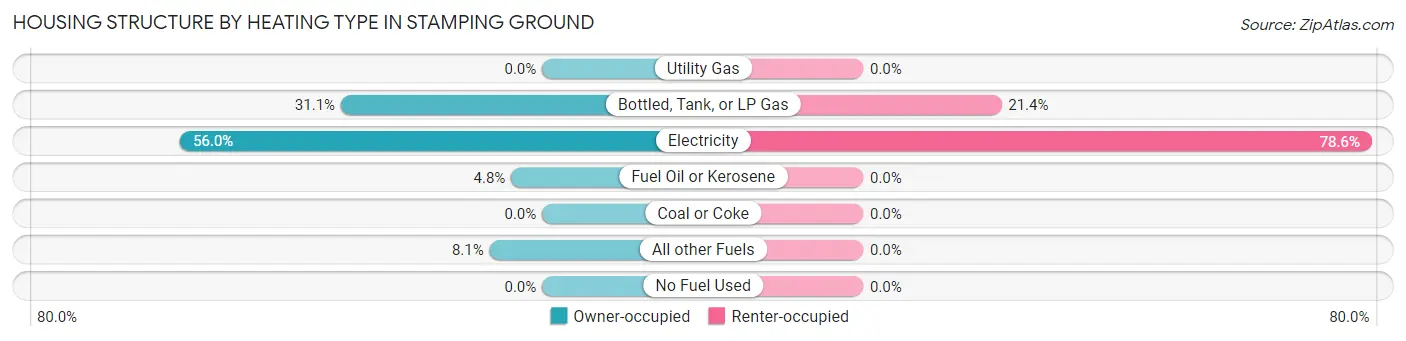
| Heating Type | Owner-occupied | Renter-occupied |
| Utility Gas | 0 (0.0%) | 0 (0.0%) |
| Bottled, Tank, or LP Gas | 65 (31.1%) | 28 (21.4%) |
| Electricity | 117 (56.0%) | 103 (78.6%) |
| Fuel Oil or Kerosene | 10 (4.8%) | 0 (0.0%) |
| Coal or Coke | 0 (0.0%) | 0 (0.0%) |
| All other Fuels | 17 (8.1%) | 0 (0.0%) |
| No Fuel Used | 0 (0.0%) | 0 (0.0%) |
| Total | 209 (100.0%) | 131 (100.0%) |
Household Vehicle Usage in Stamping Ground
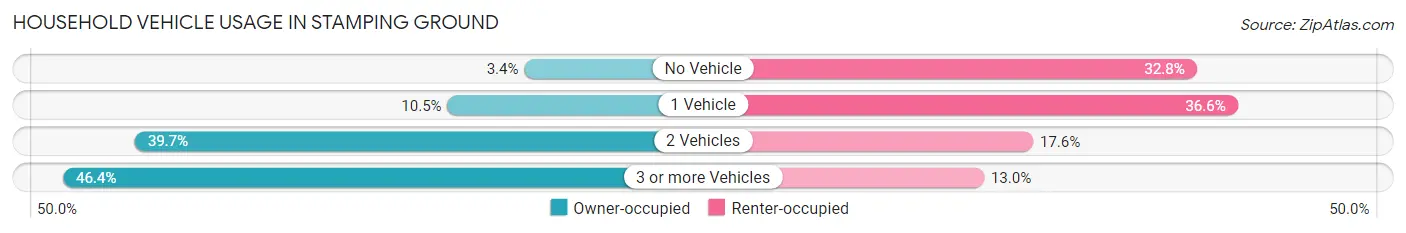
| Vehicles per Household | Owner-occupied | Renter-occupied |
| No Vehicle | 7 (3.4%) | 43 (32.8%) |
| 1 Vehicle | 22 (10.5%) | 48 (36.6%) |
| 2 Vehicles | 83 (39.7%) | 23 (17.6%) |
| 3 or more Vehicles | 97 (46.4%) | 17 (13.0%) |
| Total | 209 (100.0%) | 131 (100.0%) |
Real Estate & Mortgages in Stamping Ground
Real Estate and Mortgage Overview in Stamping Ground
| Characteristic | Without Mortgage | With Mortgage |
| Housing Units | 54 | 155 |
| Median Property Value | $143,100 | $156,700 |
| Median Household Income | $48,750 | $14 |
| Monthly Housing Costs | $458 | $0 |
| Real Estate Taxes | $894 | $0 |
Property Value by Mortgage Status in Stamping Ground
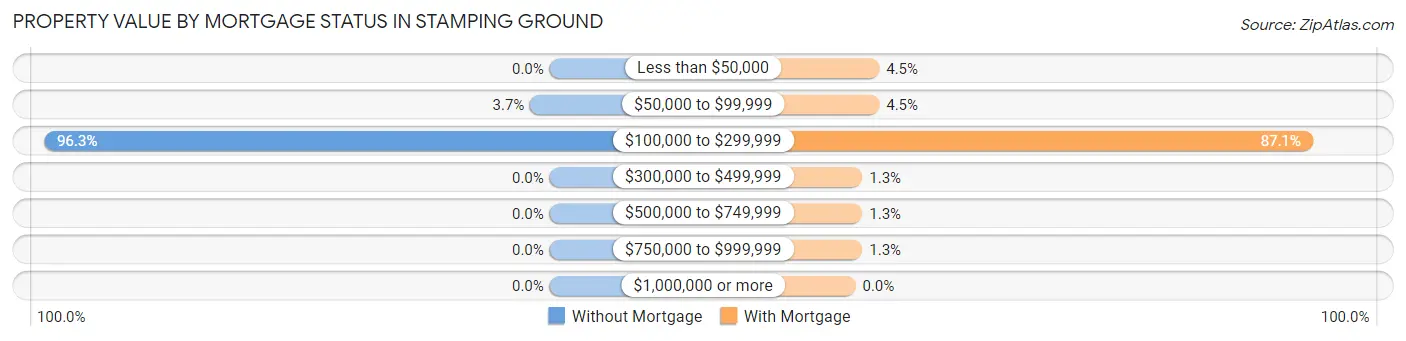
| Property Value | Without Mortgage | With Mortgage |
| Less than $50,000 | 0 (0.0%) | 7 (4.5%) |
| $50,000 to $99,999 | 2 (3.7%) | 7 (4.5%) |
| $100,000 to $299,999 | 52 (96.3%) | 135 (87.1%) |
| $300,000 to $499,999 | 0 (0.0%) | 2 (1.3%) |
| $500,000 to $749,999 | 0 (0.0%) | 2 (1.3%) |
| $750,000 to $999,999 | 0 (0.0%) | 2 (1.3%) |
| $1,000,000 or more | 0 (0.0%) | 0 (0.0%) |
| Total | 54 (100.0%) | 155 (100.0%) |
Household Income by Mortgage Status in Stamping Ground
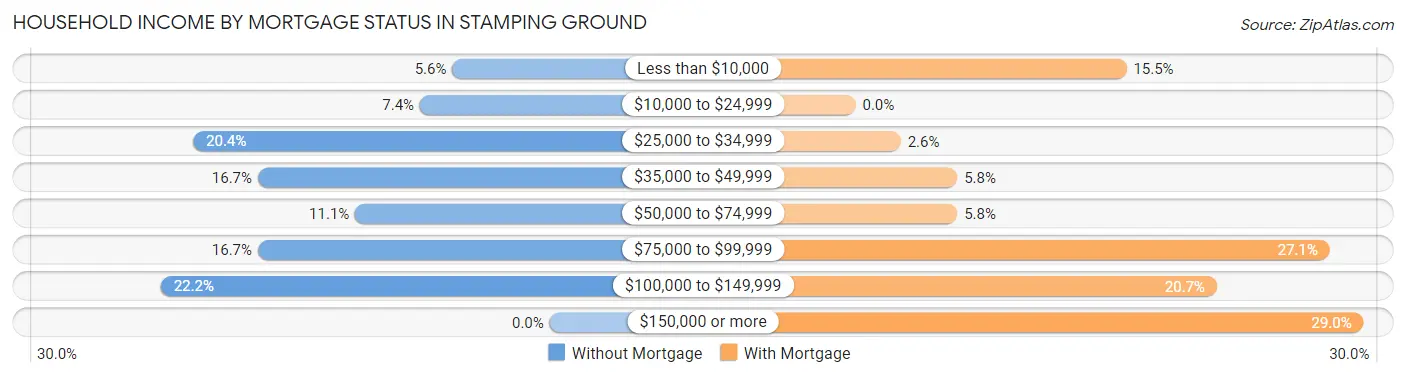
| Household Income | Without Mortgage | With Mortgage |
| Less than $10,000 | 3 (5.6%) | 24 (15.5%) |
| $10,000 to $24,999 | 4 (7.4%) | 0 (0.0%) |
| $25,000 to $34,999 | 11 (20.4%) | 4 (2.6%) |
| $35,000 to $49,999 | 9 (16.7%) | 9 (5.8%) |
| $50,000 to $74,999 | 6 (11.1%) | 9 (5.8%) |
| $75,000 to $99,999 | 9 (16.7%) | 42 (27.1%) |
| $100,000 to $149,999 | 12 (22.2%) | 32 (20.6%) |
| $150,000 or more | 0 (0.0%) | 45 (29.0%) |
| Total | 54 (100.0%) | 155 (100.0%) |
Property Value to Household Income Ratio in Stamping Ground
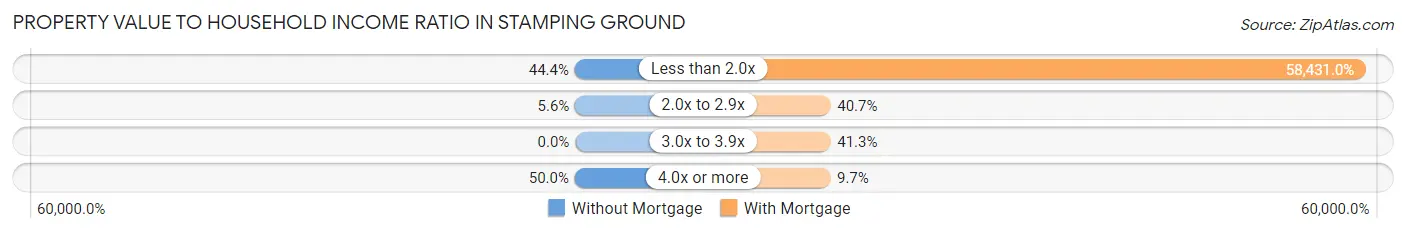
| Value-to-Income Ratio | Without Mortgage | With Mortgage |
| Less than 2.0x | 24 (44.4%) | 90,568 (58,431.0%) |
| 2.0x to 2.9x | 3 (5.6%) | 63 (40.6%) |
| 3.0x to 3.9x | 0 (0.0%) | 64 (41.3%) |
| 4.0x or more | 27 (50.0%) | 15 (9.7%) |
| Total | 54 (100.0%) | 155 (100.0%) |
Real Estate Taxes by Mortgage Status in Stamping Ground
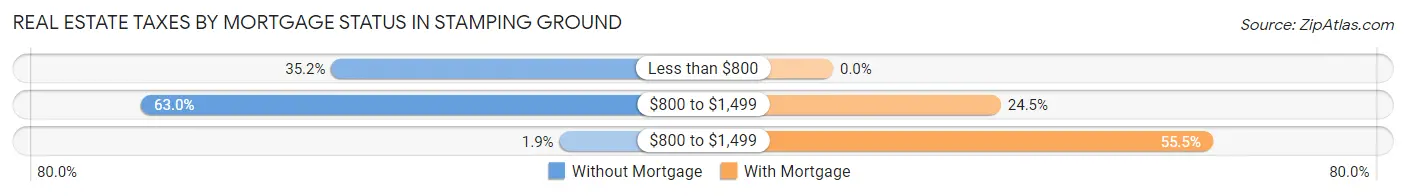
| Property Taxes | Without Mortgage | With Mortgage |
| Less than $800 | 19 (35.2%) | 0 (0.0%) |
| $800 to $1,499 | 34 (63.0%) | 38 (24.5%) |
| $800 to $1,499 | 1 (1.8%) | 86 (55.5%) |
| Total | 54 (100.0%) | 155 (100.0%) |
Health & Disability in Stamping Ground
Health Insurance Coverage by Age in Stamping Ground
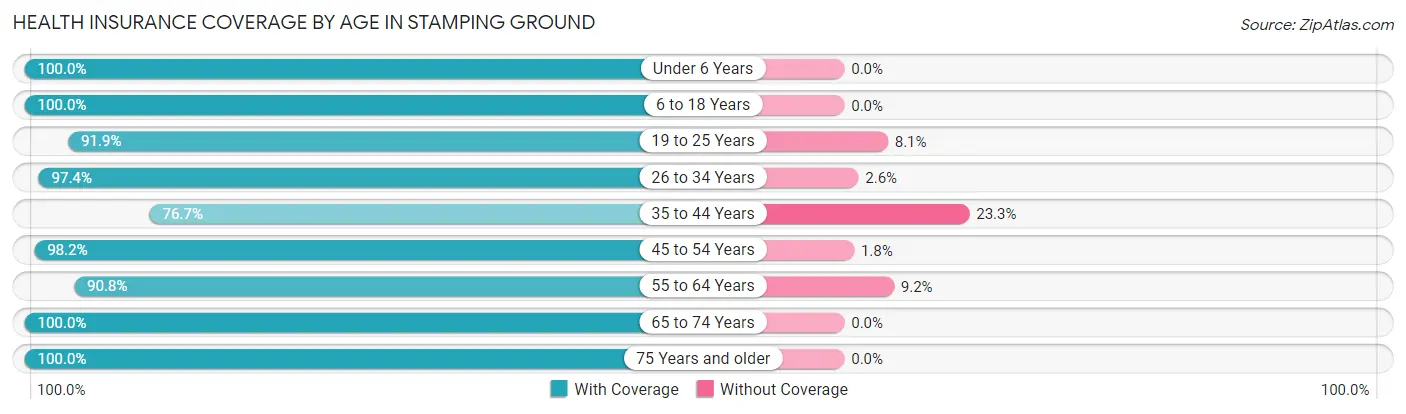
| Age Bracket | With Coverage | Without Coverage |
| Under 6 Years | 64 (100.0%) | 0 (0.0%) |
| 6 to 18 Years | 123 (100.0%) | 0 (0.0%) |
| 19 to 25 Years | 68 (91.9%) | 6 (8.1%) |
| 26 to 34 Years | 186 (97.4%) | 5 (2.6%) |
| 35 to 44 Years | 102 (76.7%) | 31 (23.3%) |
| 45 to 54 Years | 109 (98.2%) | 2 (1.8%) |
| 55 to 64 Years | 108 (90.8%) | 11 (9.2%) |
| 65 to 74 Years | 40 (100.0%) | 0 (0.0%) |
| 75 Years and older | 53 (100.0%) | 0 (0.0%) |
| Total | 853 (93.9%) | 55 (6.1%) |
Health Insurance Coverage by Citizenship Status in Stamping Ground
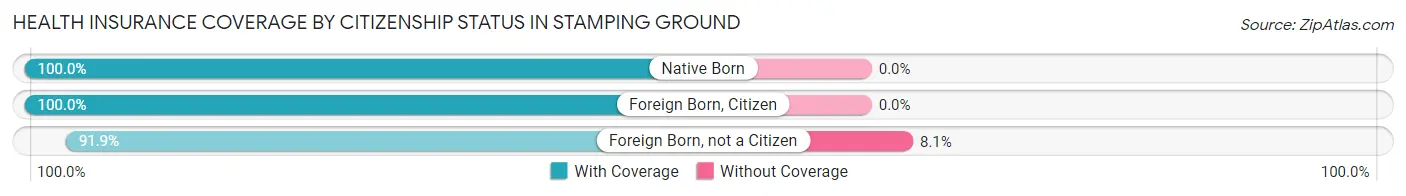
| Citizenship Status | With Coverage | Without Coverage |
| Native Born | 64 (100.0%) | 0 (0.0%) |
| Foreign Born, Citizen | 123 (100.0%) | 0 (0.0%) |
| Foreign Born, not a Citizen | 68 (91.9%) | 6 (8.1%) |
Health Insurance Coverage by Household Income in Stamping Ground
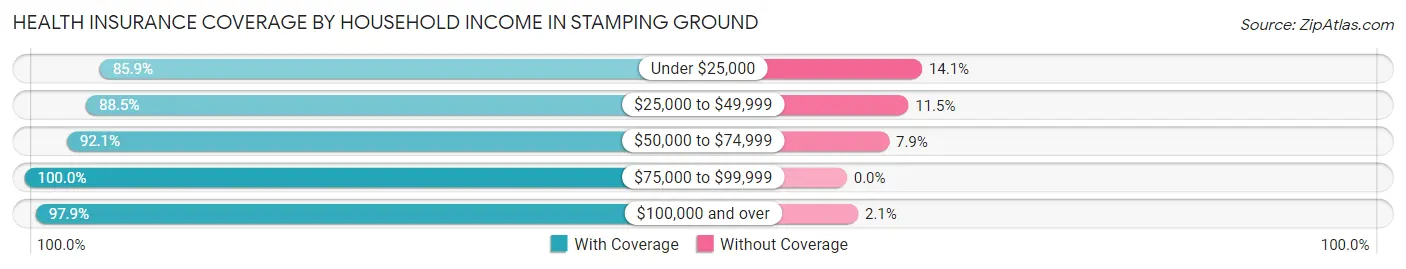
| Household Income | With Coverage | Without Coverage |
| Under $25,000 | 61 (85.9%) | 10 (14.1%) |
| $25,000 to $49,999 | 146 (88.5%) | 19 (11.5%) |
| $50,000 to $74,999 | 233 (92.1%) | 20 (7.9%) |
| $75,000 to $99,999 | 135 (100.0%) | 0 (0.0%) |
| $100,000 and over | 278 (97.9%) | 6 (2.1%) |
Public vs Private Health Insurance Coverage by Age in Stamping Ground
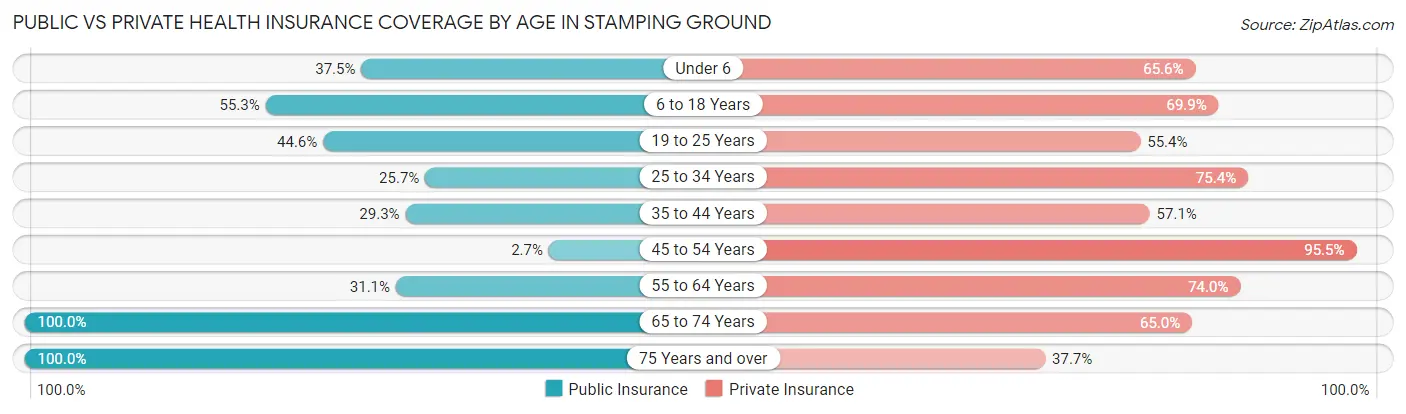
| Age Bracket | Public Insurance | Private Insurance |
| Under 6 | 24 (37.5%) | 42 (65.6%) |
| 6 to 18 Years | 68 (55.3%) | 86 (69.9%) |
| 19 to 25 Years | 33 (44.6%) | 41 (55.4%) |
| 25 to 34 Years | 49 (25.7%) | 144 (75.4%) |
| 35 to 44 Years | 39 (29.3%) | 76 (57.1%) |
| 45 to 54 Years | 3 (2.7%) | 106 (95.5%) |
| 55 to 64 Years | 37 (31.1%) | 88 (74.0%) |
| 65 to 74 Years | 40 (100.0%) | 26 (65.0%) |
| 75 Years and over | 53 (100.0%) | 20 (37.7%) |
| Total | 346 (38.1%) | 629 (69.3%) |
Disability Status by Sex by Age in Stamping Ground
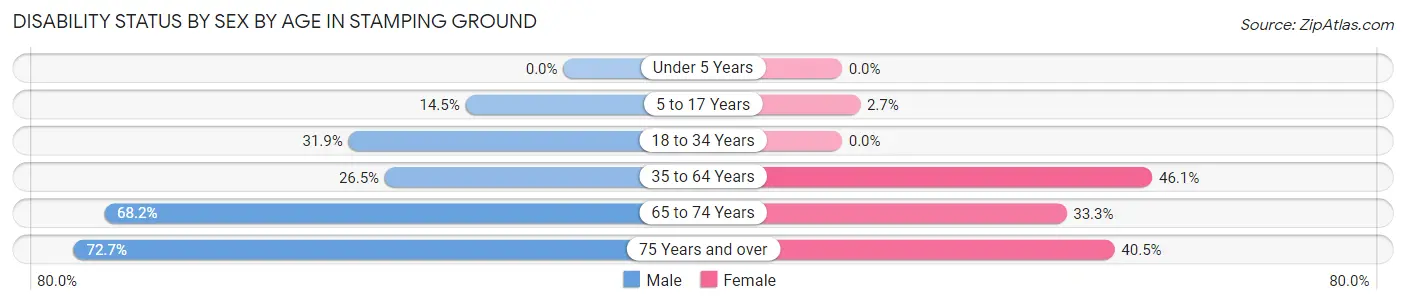
| Age Bracket | Male | Female |
| Under 5 Years | 0 (0.0%) | 0 (0.0%) |
| 5 to 17 Years | 9 (14.5%) | 2 (2.7%) |
| 18 to 34 Years | 37 (31.9%) | 0 (0.0%) |
| 35 to 64 Years | 49 (26.5%) | 82 (46.1%) |
| 65 to 74 Years | 15 (68.2%) | 6 (33.3%) |
| 75 Years and over | 8 (72.7%) | 17 (40.5%) |
Disability Class by Sex by Age in Stamping Ground
Disability Class: Hearing Difficulty
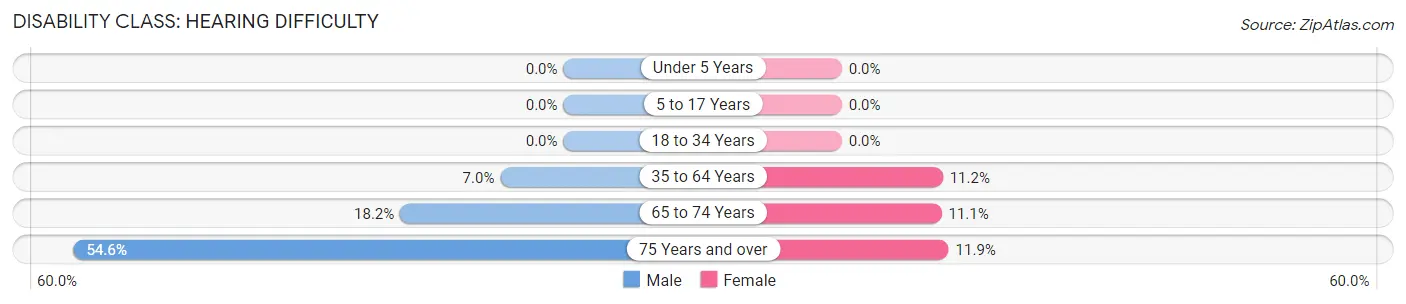
| Age Bracket | Male | Female |
| Under 5 Years | 0 (0.0%) | 0 (0.0%) |
| 5 to 17 Years | 0 (0.0%) | 0 (0.0%) |
| 18 to 34 Years | 0 (0.0%) | 0 (0.0%) |
| 35 to 64 Years | 13 (7.0%) | 20 (11.2%) |
| 65 to 74 Years | 4 (18.2%) | 2 (11.1%) |
| 75 Years and over | 6 (54.5%) | 5 (11.9%) |
Disability Class: Vision Difficulty
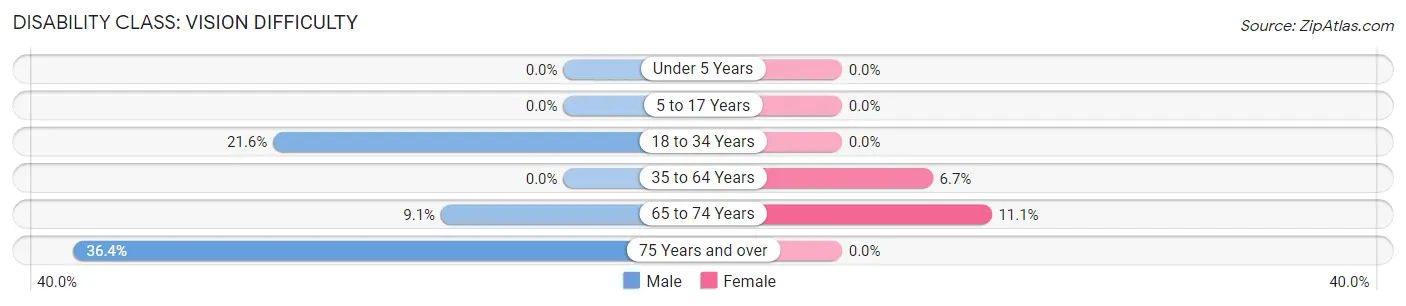
| Age Bracket | Male | Female |
| Under 5 Years | 0 (0.0%) | 0 (0.0%) |
| 5 to 17 Years | 0 (0.0%) | 0 (0.0%) |
| 18 to 34 Years | 25 (21.5%) | 0 (0.0%) |
| 35 to 64 Years | 0 (0.0%) | 12 (6.7%) |
| 65 to 74 Years | 2 (9.1%) | 2 (11.1%) |
| 75 Years and over | 4 (36.4%) | 0 (0.0%) |
Disability Class: Cognitive Difficulty
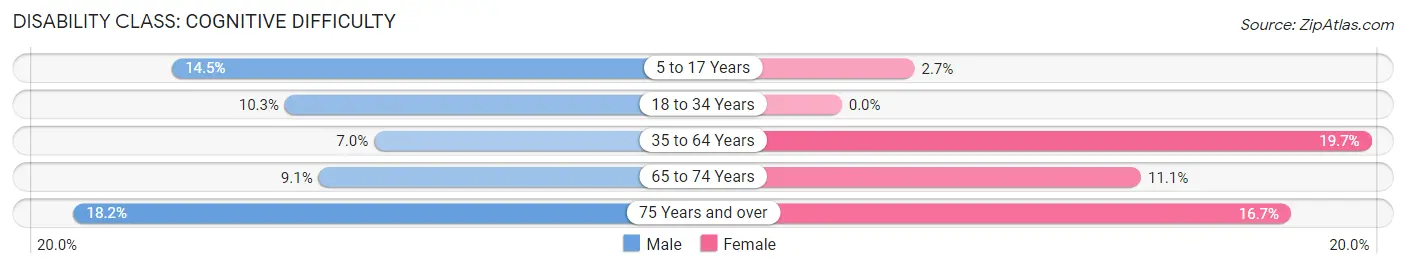
| Age Bracket | Male | Female |
| 5 to 17 Years | 9 (14.5%) | 2 (2.7%) |
| 18 to 34 Years | 12 (10.3%) | 0 (0.0%) |
| 35 to 64 Years | 13 (7.0%) | 35 (19.7%) |
| 65 to 74 Years | 2 (9.1%) | 2 (11.1%) |
| 75 Years and over | 2 (18.2%) | 7 (16.7%) |
Disability Class: Ambulatory Difficulty
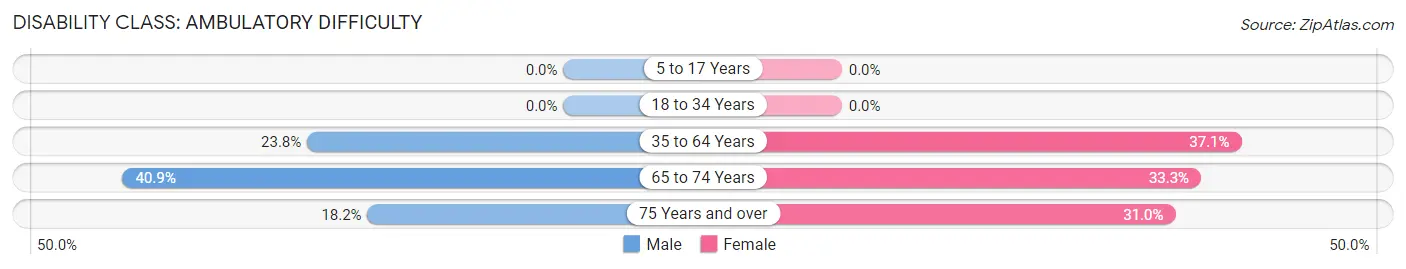
| Age Bracket | Male | Female |
| 5 to 17 Years | 0 (0.0%) | 0 (0.0%) |
| 18 to 34 Years | 0 (0.0%) | 0 (0.0%) |
| 35 to 64 Years | 44 (23.8%) | 66 (37.1%) |
| 65 to 74 Years | 9 (40.9%) | 6 (33.3%) |
| 75 Years and over | 2 (18.2%) | 13 (30.9%) |
Disability Class: Self-Care Difficulty
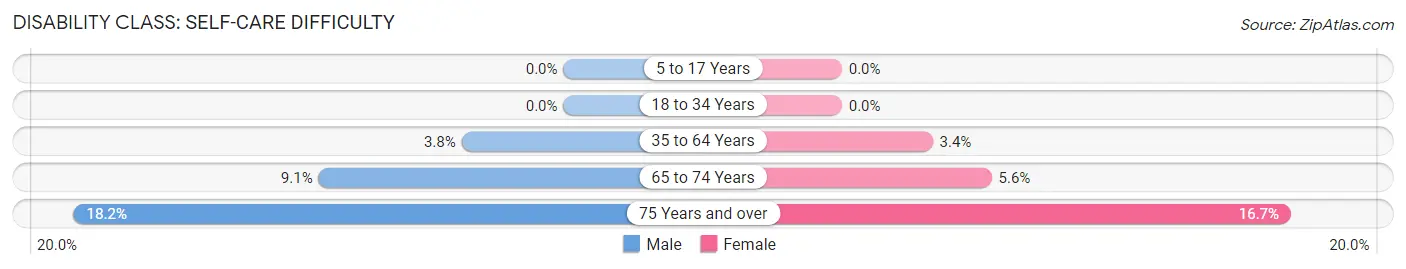
| Age Bracket | Male | Female |
| 5 to 17 Years | 0 (0.0%) | 0 (0.0%) |
| 18 to 34 Years | 0 (0.0%) | 0 (0.0%) |
| 35 to 64 Years | 7 (3.8%) | 6 (3.4%) |
| 65 to 74 Years | 2 (9.1%) | 1 (5.6%) |
| 75 Years and over | 2 (18.2%) | 7 (16.7%) |
Technology Access in Stamping Ground
Computing Device Access in Stamping Ground
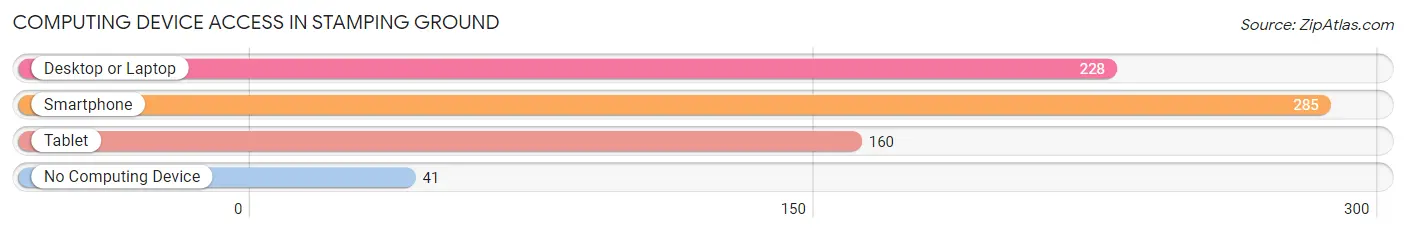
| Device Type | # Households | % Households |
| Desktop or Laptop | 228 | 67.1% |
| Smartphone | 285 | 83.8% |
| Tablet | 160 | 47.1% |
| No Computing Device | 41 | 12.1% |
| Total | 340 | 100.0% |
Internet Access in Stamping Ground
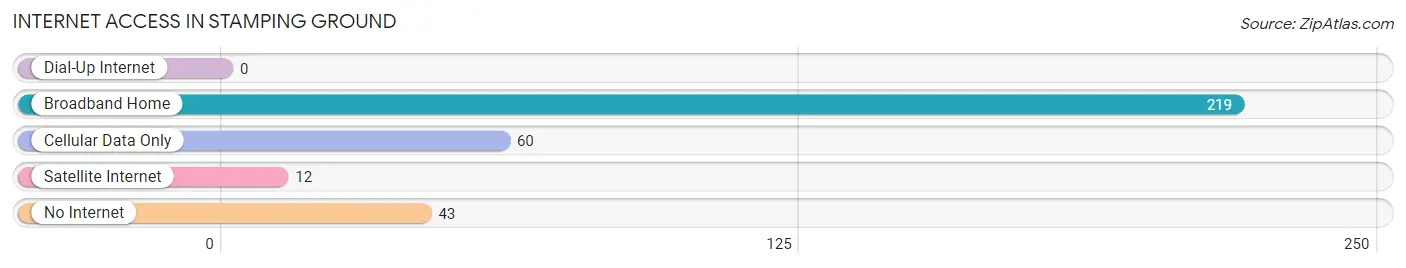
| Internet Type | # Households | % Households |
| Dial-Up Internet | 0 | 0.0% |
| Broadband Home | 219 | 64.4% |
| Cellular Data Only | 60 | 17.6% |
| Satellite Internet | 12 | 3.5% |
| No Internet | 43 | 12.7% |
| Total | 340 | 100.0% |
Stamping Ground Summary
Stamping Ground is a small city located in Scott County, Kentucky. It is situated in the heart of the Bluegrass Region, and is part of the Lexington-Fayette Metropolitan Statistical Area. The city has a population of 1,845 as of the 2010 census, and is the county seat of Scott County.
History
Stamping Ground was founded in 1790 by William McAfee, who named the town after the nearby Stamping Ground Creek. The creek was named for the Native American practice of stamping the ground to drive away snakes. The town was incorporated in 1837, and was the county seat of Scott County from 1851 to 1872.
Geography
Stamping Ground is located at 38°17'N 84°37'W (38.2833, -84.6167). It is situated in the Bluegrass Region of Kentucky, and is part of the Lexington-Fayette Metropolitan Statistical Area. The city has a total area of 1.2 square miles, all of which is land.
Economy
The economy of Stamping Ground is largely based on agriculture and tourism. The city is home to several farms, as well as a number of small businesses. The city is also home to the Stamping Ground Country Club, which offers golf, tennis, and swimming.
Demographics
As of the 2010 census, Stamping Ground had a population of 1,845. The racial makeup of the city was 95.3% White, 1.2% African American, 0.2% Native American, 0.7% Asian, 0.1% Pacific Islander, 0.7% from other races, and 1.9% from two or more races. Hispanic or Latino of any race were 1.7% of the population.
The median income for a household in Stamping Ground was $45,938, and the median income for a family was $51,250. The per capita income for the city was $20,945. About 8.2% of families and 10.2% of the population were below the poverty line, including 14.2% of those under age 18 and 8.3% of those age 65 or over.
Common Questions
What is Per Capita Income in Stamping Ground?
Per Capita income in Stamping Ground is $29,017.
What is the Median Family Income in Stamping Ground?
Median Family Income in Stamping Ground is $73,750.
What is the Median Household income in Stamping Ground?
Median Household Income in Stamping Ground is $60,606.
What is Income or Wage Gap in Stamping Ground?
Income or Wage Gap in Stamping Ground is 60.6%.
Women in Stamping Ground earn 39.4 cents for every dollar earned by a man.
What is Inequality or Gini Index in Stamping Ground?
Inequality or Gini Index in Stamping Ground is 0.37.
What is the Total Population of Stamping Ground?
Total Population of Stamping Ground is 908.
What is the Total Male Population of Stamping Ground?
Total Male Population of Stamping Ground is 431.
What is the Total Female Population of Stamping Ground?
Total Female Population of Stamping Ground is 477.
What is the Ratio of Males per 100 Females in Stamping Ground?
There are 90.36 Males per 100 Females in Stamping Ground.
What is the Ratio of Females per 100 Males in Stamping Ground?
There are 110.67 Females per 100 Males in Stamping Ground.
What is the Median Population Age in Stamping Ground?
Median Population Age in Stamping Ground is 36.0 Years.
What is the Average Family Size in Stamping Ground
Average Family Size in Stamping Ground is 3.1 People.
What is the Average Household Size in Stamping Ground
Average Household Size in Stamping Ground is 2.7 People.
How Large is the Labor Force in Stamping Ground?
There are 464 People in the Labor Forcein in Stamping Ground.
What is the Percentage of People in the Labor Force in Stamping Ground?
61.6% of People are in the Labor Force in Stamping Ground.