Idaho Falls, ID Map & Demographics
Idaho Falls Map
Idaho Falls Overview
$32,548
PER CAPITA INCOME
$80,164
AVG FAMILY INCOME
$66,463
AVG HOUSEHOLD INCOME
35.3%
WAGE / INCOME GAP [ % ]
64.7¢/ $1
WAGE / INCOME GAP [ $ ]
$8,739
FAMILY INCOME DEFICIT
0.44
INEQUALITY / GINI INDEX
65,685
TOTAL POPULATION
32,666
MALE POPULATION
33,019
FEMALE POPULATION
98.93
MALES / 100 FEMALES
101.08
FEMALES / 100 MALES
33.9
MEDIAN AGE
3.4
AVG FAMILY SIZE
2.7
AVG HOUSEHOLD SIZE
32,015
LABOR FORCE [ PEOPLE ]
64.9%
PERCENT IN LABOR FORCE
4.8%
UNEMPLOYMENT RATE
Idaho Falls Area Codes
Income in Idaho Falls
Income Overview in Idaho Falls
Per Capita Income in Idaho Falls is $32,548, while median incomes of families and households are $80,164 and $66,463 respectively.
| Characteristic | Number | Measure |
| Per Capita Income | 65,685 | $32,548 |
| Median Family Income | 15,344 | $80,164 |
| Mean Family Income | 15,344 | $102,947 |
| Median Household Income | 23,924 | $66,463 |
| Mean Household Income | 23,924 | $87,582 |
| Income Deficit | 15,344 | $8,739 |
| Wage / Income Gap (%) | 65,685 | 35.32% |
| Wage / Income Gap ($) | 65,685 | 64.68¢ per $1 |
| Gini / Inequality Index | 65,685 | 0.44 |
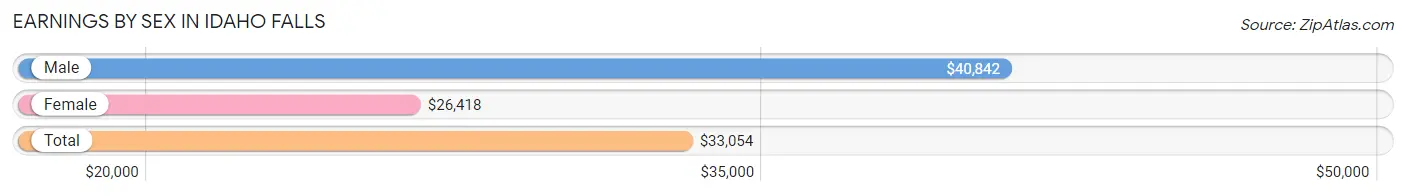
Earnings by Sex in Idaho Falls
Average Earnings in Idaho Falls are $33,054, $40,842 for men and $26,418 for women, a difference of 35.3%.
| Sex | Number | Average Earnings |
| Male | 18,437 (54.1%) | $40,842 |
| Female | 15,638 (45.9%) | $26,418 |
| Total | 34,075 (100.0%) | $33,054 |
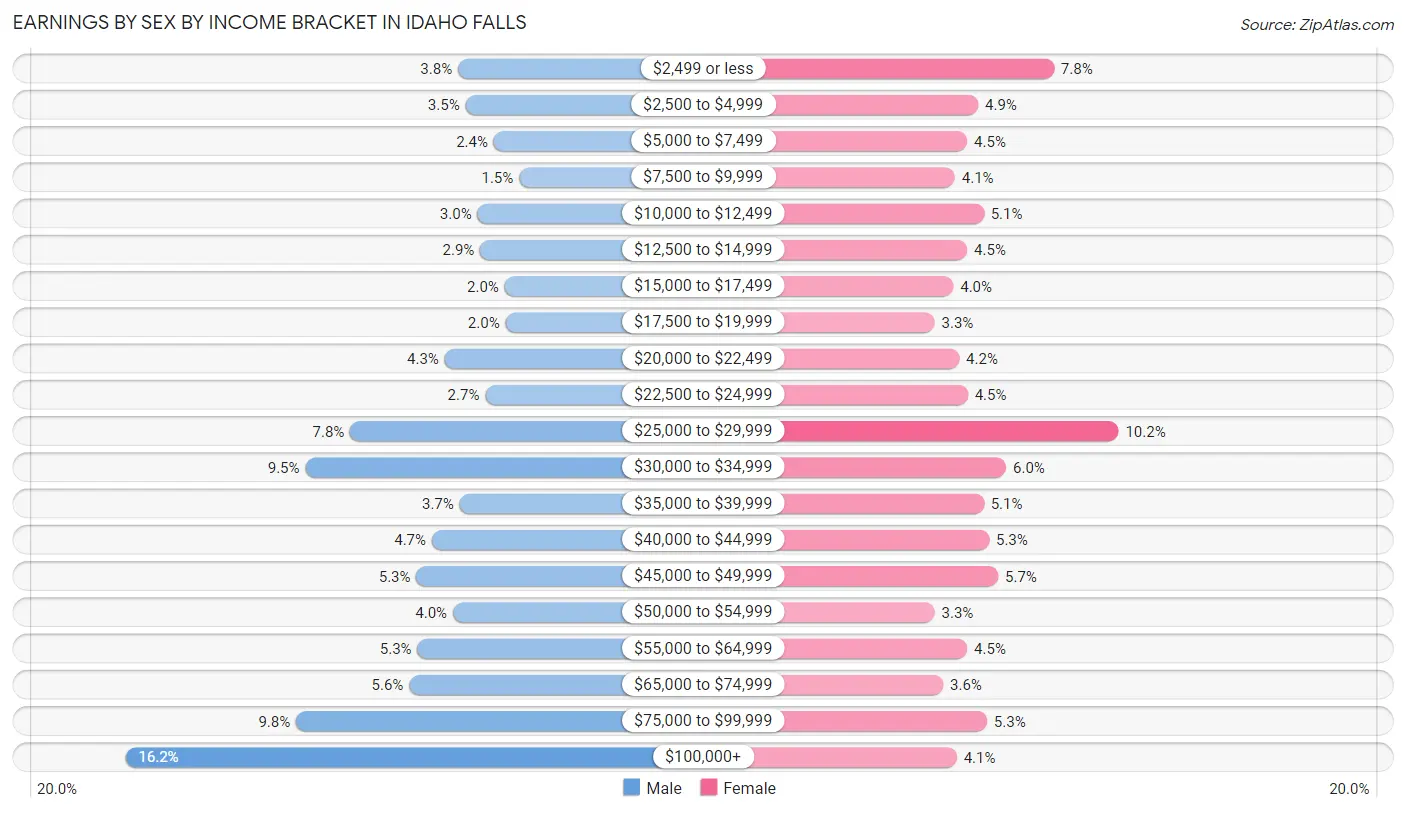
Earnings by Sex by Income Bracket in Idaho Falls
The most common earnings brackets in Idaho Falls are $100,000+ for men (2,991 | 16.2%) and $25,000 to $29,999 for women (1,592 | 10.2%).
| Income | Male | Female |
| $2,499 or less | 694 (3.8%) | 1,214 (7.8%) |
| $2,500 to $4,999 | 641 (3.5%) | 769 (4.9%) |
| $5,000 to $7,499 | 446 (2.4%) | 706 (4.5%) |
| $7,500 to $9,999 | 271 (1.5%) | 634 (4.1%) |
| $10,000 to $12,499 | 559 (3.0%) | 803 (5.1%) |
| $12,500 to $14,999 | 541 (2.9%) | 705 (4.5%) |
| $15,000 to $17,499 | 371 (2.0%) | 624 (4.0%) |
| $17,500 to $19,999 | 365 (2.0%) | 515 (3.3%) |
| $20,000 to $22,499 | 785 (4.3%) | 659 (4.2%) |
| $22,500 to $24,999 | 505 (2.7%) | 708 (4.5%) |
| $25,000 to $29,999 | 1,439 (7.8%) | 1,592 (10.2%) |
| $30,000 to $34,999 | 1,747 (9.5%) | 934 (6.0%) |
| $35,000 to $39,999 | 682 (3.7%) | 803 (5.1%) |
| $40,000 to $44,999 | 874 (4.7%) | 834 (5.3%) |
| $45,000 to $49,999 | 980 (5.3%) | 887 (5.7%) |
| $50,000 to $54,999 | 729 (4.0%) | 515 (3.3%) |
| $55,000 to $64,999 | 973 (5.3%) | 706 (4.5%) |
| $65,000 to $74,999 | 1,031 (5.6%) | 565 (3.6%) |
| $75,000 to $99,999 | 1,813 (9.8%) | 821 (5.2%) |
| $100,000+ | 2,991 (16.2%) | 644 (4.1%) |
| Total | 18,437 (100.0%) | 15,638 (100.0%) |
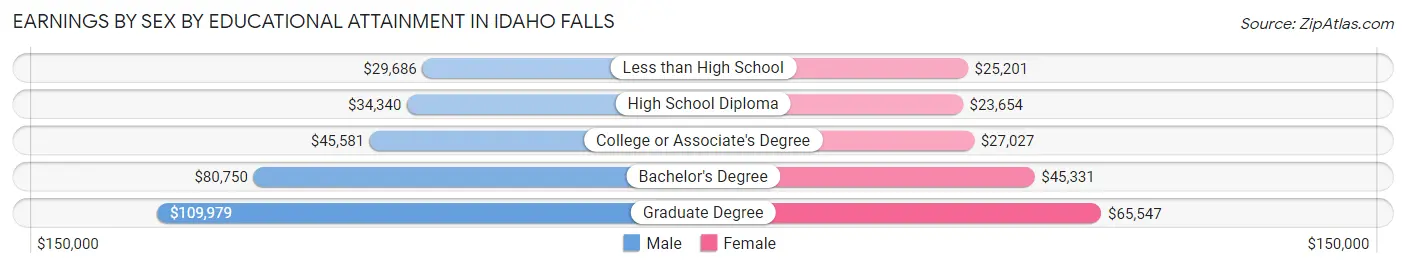
Earnings by Sex by Educational Attainment in Idaho Falls
Average earnings in Idaho Falls are $47,923 for men and $29,628 for women, a difference of 38.2%. Men with an educational attainment of graduate degree enjoy the highest average annual earnings of $109,979, while those with less than high school education earn the least with $29,686. Women with an educational attainment of graduate degree earn the most with the average annual earnings of $65,547, while those with high school diploma education have the smallest earnings of $23,654.
| Educational Attainment | Male Income | Female Income |
| Less than High School | $29,686 | $25,201 |
| High School Diploma | $34,340 | $23,654 |
| College or Associate's Degree | $45,581 | $27,027 |
| Bachelor's Degree | $80,750 | $45,331 |
| Graduate Degree | $109,979 | $65,547 |
| Total | $47,923 | $29,628 |
Family Income in Idaho Falls
Family Income Brackets in Idaho Falls
According to the Idaho Falls family income data, there are 3,038 families falling into the $50,000 to $74,999 income range, which is the most common income bracket and makes up 19.8% of all families. Conversely, the less than $10,000 income bracket is the least frequent group with only 184 families (1.2%) belonging to this category.
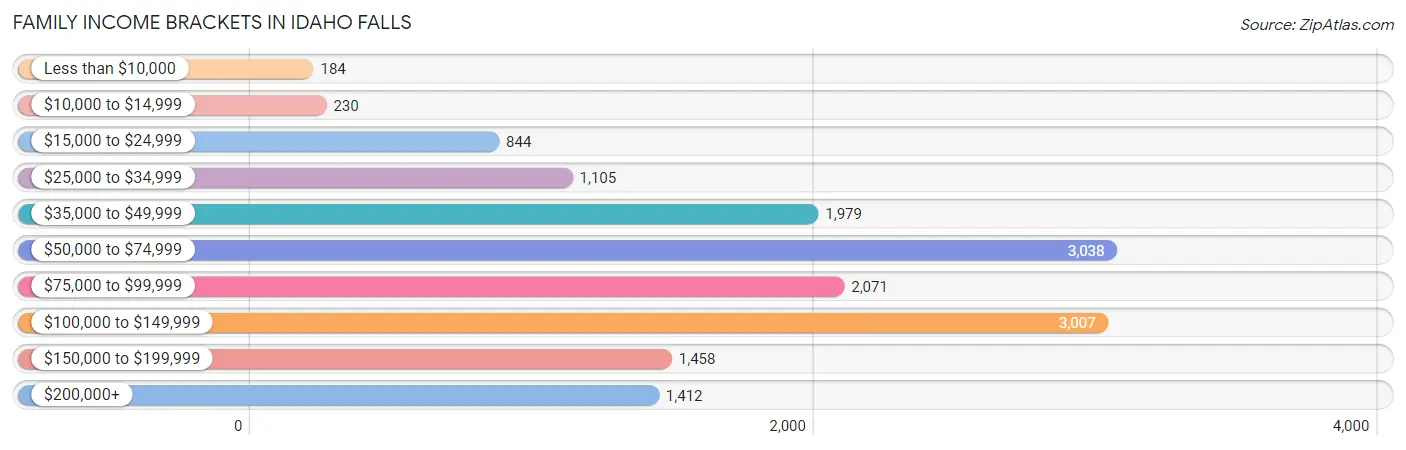
| Income Bracket | # Families | % Families |
| Less than $10,000 | 184 | 1.2% |
| $10,000 to $14,999 | 230 | 1.5% |
| $15,000 to $24,999 | 844 | 5.5% |
| $25,000 to $34,999 | 1,105 | 7.2% |
| $35,000 to $49,999 | 1,979 | 12.9% |
| $50,000 to $74,999 | 3,038 | 19.8% |
| $75,000 to $99,999 | 2,071 | 13.5% |
| $100,000 to $149,999 | 3,007 | 19.6% |
| $150,000 to $199,999 | 1,458 | 9.5% |
| $200,000+ | 1,412 | 9.2% |
Family Income by Famaliy Size in Idaho Falls
7+ person families (382 | 2.5%) account for the highest median family income in Idaho Falls with $113,305 per family, while 2-person families (6,555 | 42.7%) have the highest median income of $34,775 per family member.
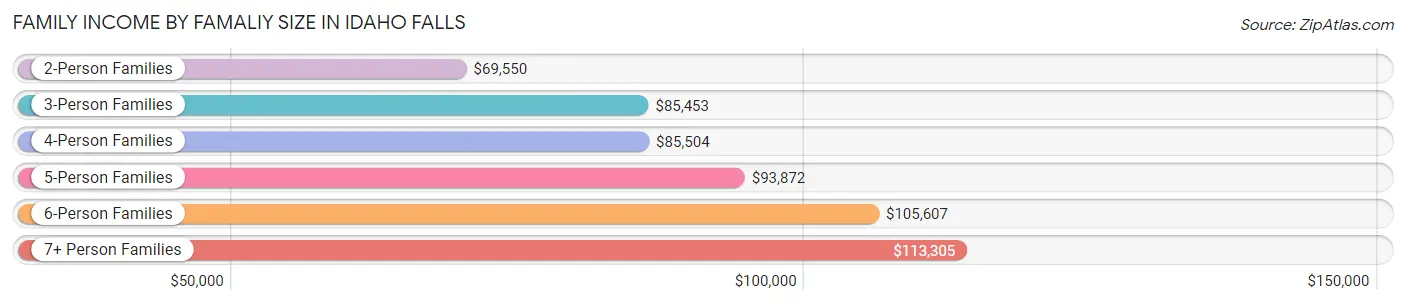
| Income Bracket | # Families | Median Income |
| 2-Person Families | 6,555 (42.7%) | $69,550 |
| 3-Person Families | 3,450 (22.5%) | $85,453 |
| 4-Person Families | 2,431 (15.8%) | $85,504 |
| 5-Person Families | 1,771 (11.5%) | $93,872 |
| 6-Person Families | 755 (4.9%) | $105,607 |
| 7+ Person Families | 382 (2.5%) | $113,305 |
| Total | 15,344 (100.0%) | $80,164 |
Family Income by Number of Earners in Idaho Falls
The median family income in Idaho Falls is $80,164, with families comprising 3+ earners (1,739) having the highest median family income of $125,037, while families with 1 earner (4,859) have the lowest median family income of $51,432, accounting for 11.3% and 31.7% of families, respectively.
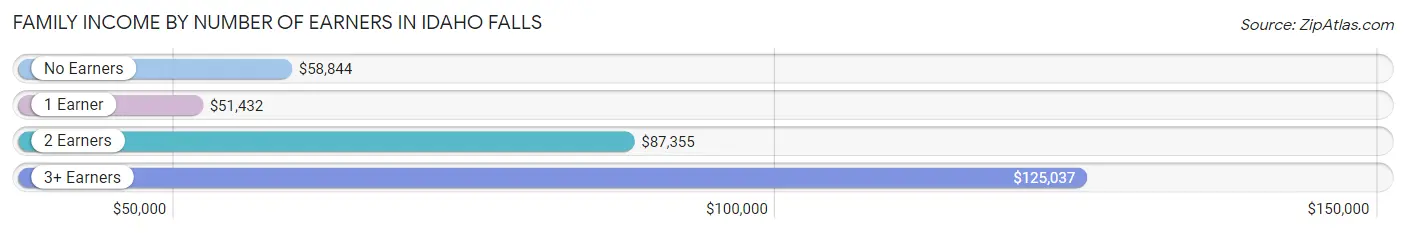
| Number of Earners | # Families | Median Income |
| No Earners | 2,049 (13.4%) | $58,844 |
| 1 Earner | 4,859 (31.7%) | $51,432 |
| 2 Earners | 6,697 (43.6%) | $87,355 |
| 3+ Earners | 1,739 (11.3%) | $125,037 |
| Total | 15,344 (100.0%) | $80,164 |
Household Income in Idaho Falls
Household Income Brackets in Idaho Falls
With 4,880 households falling in the category, the $50,000 to $74,999 income range is the most frequent in Idaho Falls, accounting for 20.4% of all households. In contrast, only 789 households (3.3%) fall into the $10,000 to $14,999 income bracket, making it the least populous group.
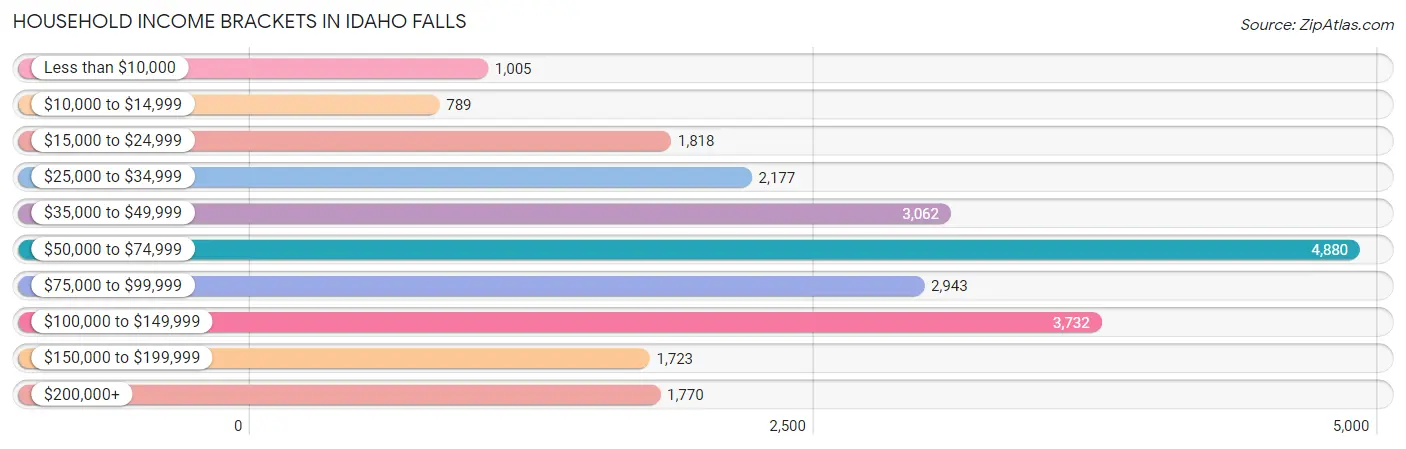
| Income Bracket | # Households | % Households |
| Less than $10,000 | 1,005 | 4.2% |
| $10,000 to $14,999 | 789 | 3.3% |
| $15,000 to $24,999 | 1,818 | 7.6% |
| $25,000 to $34,999 | 2,177 | 9.1% |
| $35,000 to $49,999 | 3,062 | 12.8% |
| $50,000 to $74,999 | 4,880 | 20.4% |
| $75,000 to $99,999 | 2,943 | 12.3% |
| $100,000 to $149,999 | 3,732 | 15.6% |
| $150,000 to $199,999 | 1,723 | 7.2% |
| $200,000+ | 1,770 | 7.4% |
Household Income by Householder Age in Idaho Falls
The median household income in Idaho Falls is $66,463, with the highest median household income of $81,442 found in the 45 to 64 years age bracket for the primary householder. A total of 7,577 households (31.7%) fall into this category. Meanwhile, the 15 to 24 years age bracket for the primary householder has the lowest median household income of $43,444, with 1,652 households (6.9%) in this group.
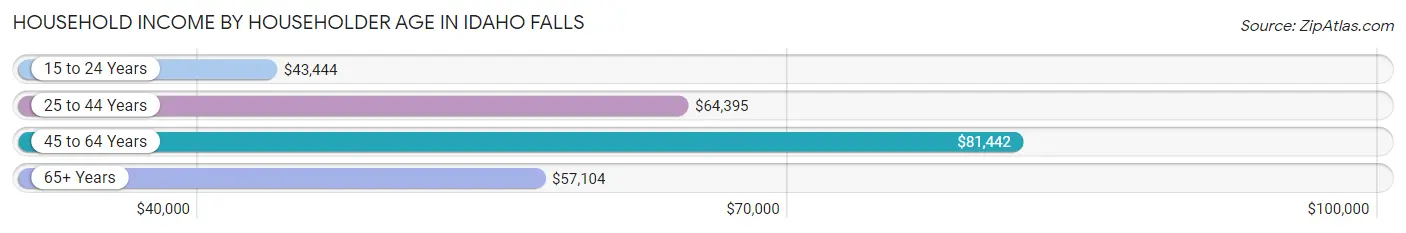
| Income Bracket | # Households | Median Income |
| 15 to 24 Years | 1,652 (6.9%) | $43,444 |
| 25 to 44 Years | 8,697 (36.3%) | $64,395 |
| 45 to 64 Years | 7,577 (31.7%) | $81,442 |
| 65+ Years | 5,998 (25.1%) | $57,104 |
| Total | 23,924 (100.0%) | $66,463 |
Poverty in Idaho Falls
Income Below Poverty by Sex and Age in Idaho Falls
With 9.1% poverty level for males and 13.8% for females among the residents of Idaho Falls, under 5 year old males and 18 to 24 year old females are the most vulnerable to poverty, with 387 males (17.7%) and 871 females (27.2%) in their respective age groups living below the poverty level.
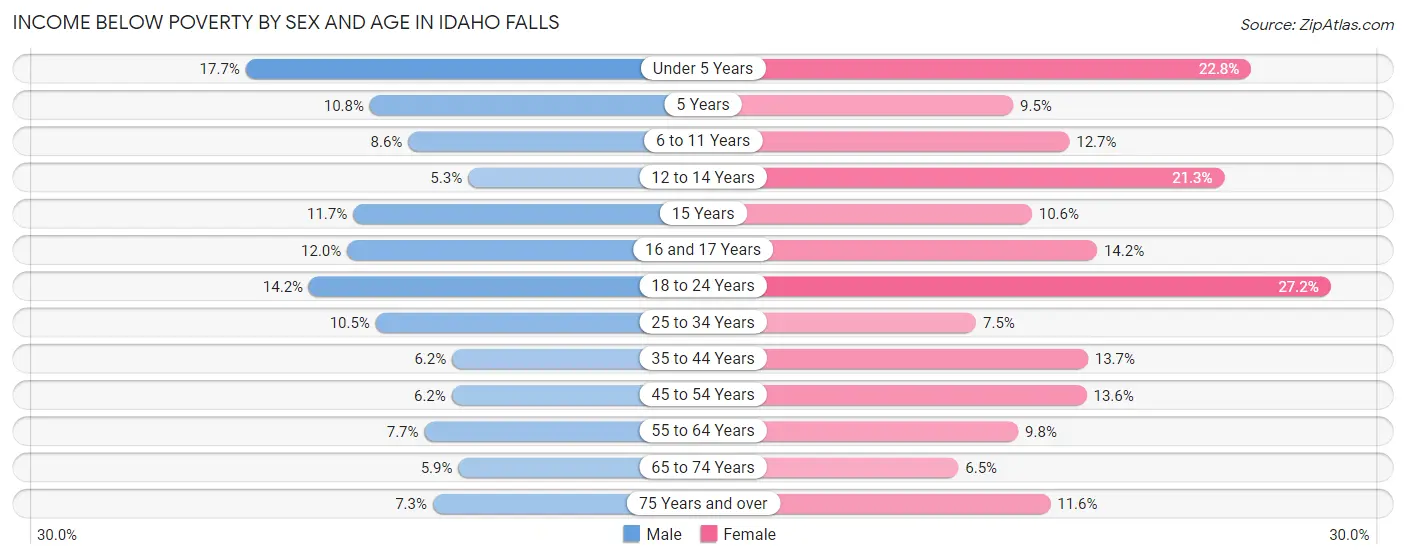
| Age Bracket | Male | Female |
| Under 5 Years | 387 (17.7%) | 512 (22.8%) |
| 5 Years | 54 (10.8%) | 58 (9.5%) |
| 6 to 11 Years | 267 (8.6%) | 397 (12.7%) |
| 12 to 14 Years | 93 (5.3%) | 317 (21.3%) |
| 15 Years | 63 (11.7%) | 64 (10.6%) |
| 16 and 17 Years | 123 (12.0%) | 101 (14.2%) |
| 18 to 24 Years | 408 (14.2%) | 871 (27.2%) |
| 25 to 34 Years | 500 (10.4%) | 345 (7.5%) |
| 35 to 44 Years | 273 (6.2%) | 597 (13.7%) |
| 45 to 54 Years | 207 (6.2%) | 430 (13.6%) |
| 55 to 64 Years | 287 (7.7%) | 330 (9.8%) |
| 65 to 74 Years | 130 (5.9%) | 168 (6.5%) |
| 75 Years and over | 120 (7.3%) | 274 (11.6%) |
| Total | 2,912 (9.1%) | 4,464 (13.8%) |
Income Above Poverty by Sex and Age in Idaho Falls
According to the poverty statistics in Idaho Falls, males aged 12 to 14 years and females aged 65 to 74 years are the age groups that are most secure financially, with 94.7% of males and 93.5% of females in these age groups living above the poverty line.
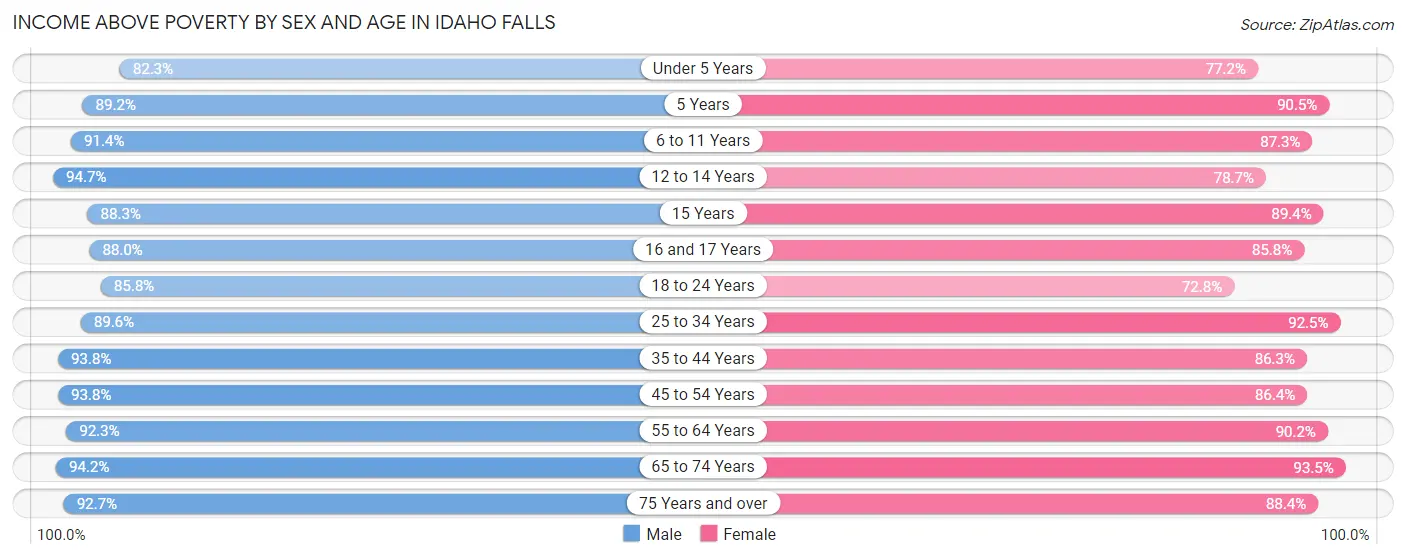
| Age Bracket | Male | Female |
| Under 5 Years | 1,801 (82.3%) | 1,735 (77.2%) |
| 5 Years | 447 (89.2%) | 550 (90.5%) |
| 6 to 11 Years | 2,824 (91.4%) | 2,737 (87.3%) |
| 12 to 14 Years | 1,658 (94.7%) | 1,171 (78.7%) |
| 15 Years | 475 (88.3%) | 541 (89.4%) |
| 16 and 17 Years | 899 (88.0%) | 610 (85.8%) |
| 18 to 24 Years | 2,471 (85.8%) | 2,330 (72.8%) |
| 25 to 34 Years | 4,285 (89.5%) | 4,270 (92.5%) |
| 35 to 44 Years | 4,132 (93.8%) | 3,761 (86.3%) |
| 45 to 54 Years | 3,119 (93.8%) | 2,725 (86.4%) |
| 55 to 64 Years | 3,419 (92.3%) | 3,031 (90.2%) |
| 65 to 74 Years | 2,092 (94.2%) | 2,421 (93.5%) |
| 75 Years and over | 1,531 (92.7%) | 2,086 (88.4%) |
| Total | 29,153 (90.9%) | 27,968 (86.2%) |
Income Below Poverty Among Married-Couple Families in Idaho Falls
The poverty statistics for married-couple families in Idaho Falls show that 3.8% or 447 of the total 11,619 families live below the poverty line. Families with 3 or 4 children have the highest poverty rate of 6.6%, comprising of 121 families. On the other hand, families with no children have the lowest poverty rate of 2.3%, which includes 133 families.
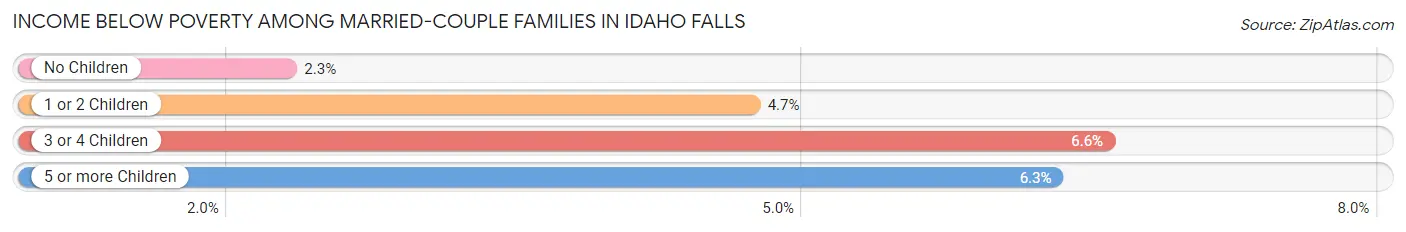
| Children | Above Poverty | Below Poverty |
| No Children | 5,635 (97.7%) | 133 (2.3%) |
| 1 or 2 Children | 3,625 (95.3%) | 180 (4.7%) |
| 3 or 4 Children | 1,719 (93.4%) | 121 (6.6%) |
| 5 or more Children | 193 (93.7%) | 13 (6.3%) |
| Total | 11,172 (96.2%) | 447 (3.8%) |
Income Below Poverty Among Single-Parent Households in Idaho Falls
According to the poverty data in Idaho Falls, 12.4% or 128 single-father households and 22.9% or 615 single-mother households are living below the poverty line. Among single-father households, those with 1 or 2 children have the highest poverty rate, with 94 households (15.5%) experiencing poverty. Likewise, among single-mother households, those with 5 or more children have the highest poverty rate, with 31 households (100.0%) falling below the poverty line.
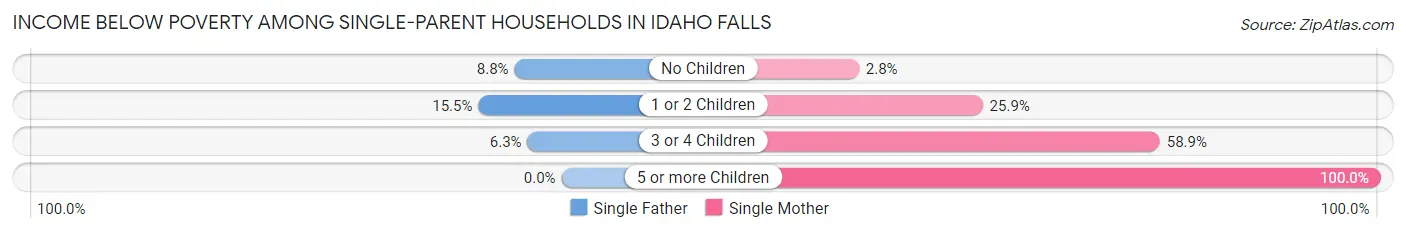
| Children | Single Father | Single Mother |
| No Children | 25 (8.8%) | 28 (2.8%) |
| 1 or 2 Children | 94 (15.5%) | 334 (25.9%) |
| 3 or 4 Children | 9 (6.3%) | 222 (58.9%) |
| 5 or more Children | 0 (0.0%) | 31 (100.0%) |
| Total | 128 (12.4%) | 615 (22.9%) |
Income Below Poverty Among Married-Couple vs Single-Parent Households in Idaho Falls
The poverty data for Idaho Falls shows that 447 of the married-couple family households (3.8%) and 743 of the single-parent households (20.0%) are living below the poverty level. Within the married-couple family households, those with 3 or 4 children have the highest poverty rate, with 121 households (6.6%) falling below the poverty line. Among the single-parent households, those with 5 or more children have the highest poverty rate, with 31 household (100.0%) living below poverty.
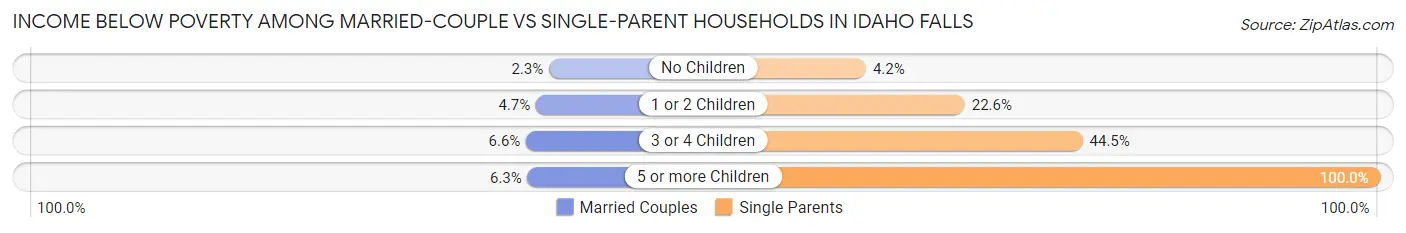
| Children | Married-Couple Families | Single-Parent Households |
| No Children | 133 (2.3%) | 53 (4.2%) |
| 1 or 2 Children | 180 (4.7%) | 428 (22.6%) |
| 3 or 4 Children | 121 (6.6%) | 231 (44.5%) |
| 5 or more Children | 13 (6.3%) | 31 (100.0%) |
| Total | 447 (3.8%) | 743 (20.0%) |
Race in Idaho Falls
The most populous races in Idaho Falls are White / Caucasian (55,603 | 84.7%), Hispanic or Latino (10,931 | 16.6%), and Some other Race (4,264 | 6.5%).
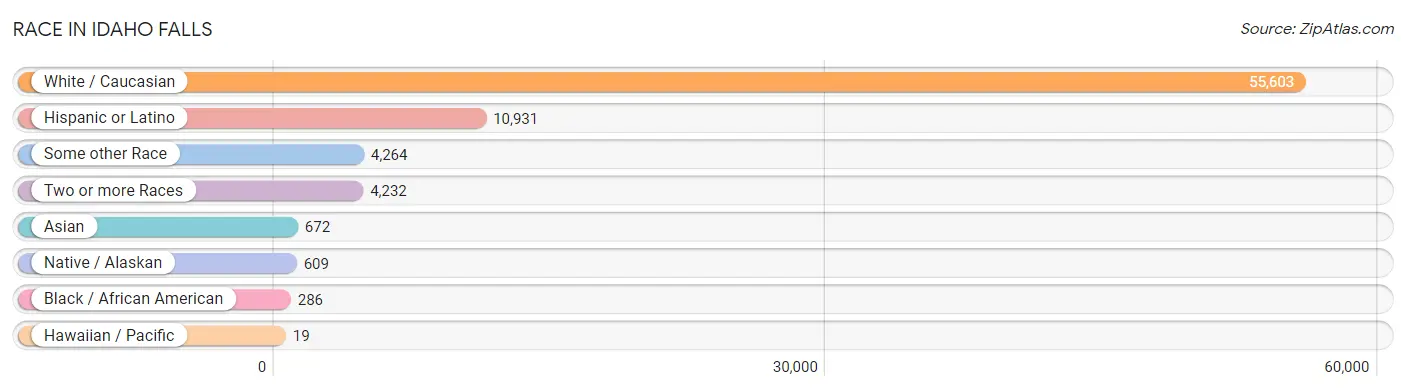
| Race | # Population | % Population |
| Asian | 672 | 1.0% |
| Black / African American | 286 | 0.4% |
| Hawaiian / Pacific | 19 | 0.0% |
| Hispanic or Latino | 10,931 | 16.6% |
| Native / Alaskan | 609 | 0.9% |
| White / Caucasian | 55,603 | 84.7% |
| Two or more Races | 4,232 | 6.4% |
| Some other Race | 4,264 | 6.5% |
| Total | 65,685 | 100.0% |
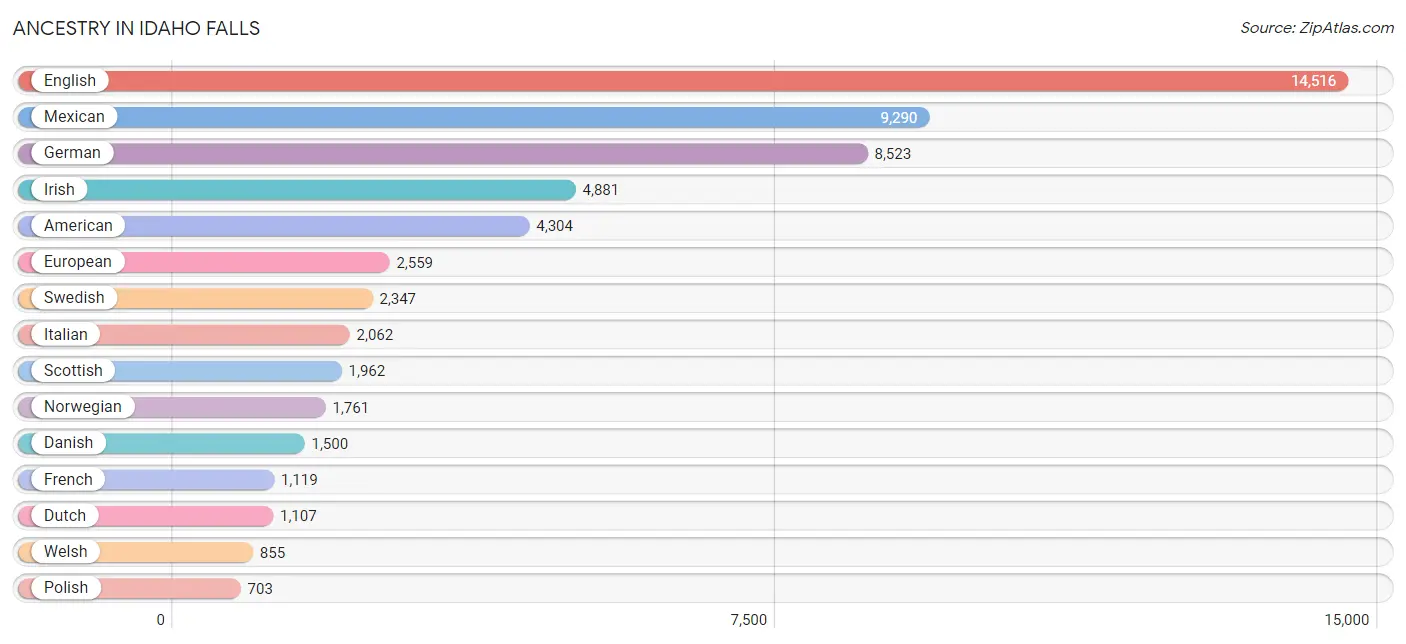
Ancestry in Idaho Falls
The most populous ancestries reported in Idaho Falls are English (14,516 | 22.1%), Mexican (9,290 | 14.1%), German (8,523 | 13.0%), Irish (4,881 | 7.4%), and American (4,304 | 6.6%), together accounting for 63.2% of all Idaho Falls residents.
| Ancestry | # Population | % Population |
| African | 4 | 0.0% |
| Albanian | 24 | 0.0% |
| Aleut | 5 | 0.0% |
| American | 4,304 | 6.6% |
| Apache | 55 | 0.1% |
| Arab | 110 | 0.2% |
| Arapaho | 11 | 0.0% |
| Armenian | 29 | 0.0% |
| Austrian | 84 | 0.1% |
| Basque | 52 | 0.1% |
| Belgian | 34 | 0.1% |
| Bhutanese | 381 | 0.6% |
| Blackfeet | 128 | 0.2% |
| Brazilian | 9 | 0.0% |
| British | 592 | 0.9% |
| Bulgarian | 5 | 0.0% |
| Burmese | 109 | 0.2% |
| Canadian | 160 | 0.2% |
| Celtic | 13 | 0.0% |
| Central American | 489 | 0.7% |
| Central American Indian | 166 | 0.3% |
| Cherokee | 126 | 0.2% |
| Cheyenne | 11 | 0.0% |
| Chippewa | 13 | 0.0% |
| Choctaw | 96 | 0.2% |
| Colville | 10 | 0.0% |
| Comanche | 96 | 0.2% |
| Cree | 21 | 0.0% |
| Croatian | 60 | 0.1% |
| Cuban | 71 | 0.1% |
| Czech | 147 | 0.2% |
| Czechoslovakian | 112 | 0.2% |
| Danish | 1,500 | 2.3% |
| Dominican | 50 | 0.1% |
| Dutch | 1,107 | 1.7% |
| Eastern European | 49 | 0.1% |
| Ecuadorian | 6 | 0.0% |
| Egyptian | 16 | 0.0% |
| English | 14,516 | 22.1% |
| European | 2,559 | 3.9% |
| Fijian | 20 | 0.0% |
| Finnish | 163 | 0.3% |
| French | 1,119 | 1.7% |
| French Canadian | 334 | 0.5% |
| German | 8,523 | 13.0% |
| Ghanaian | 86 | 0.1% |
| Greek | 99 | 0.2% |
| Guatemalan | 352 | 0.5% |
| Haitian | 26 | 0.0% |
| Honduran | 33 | 0.1% |
| Hopi | 6 | 0.0% |
| Hungarian | 185 | 0.3% |
| Icelander | 16 | 0.0% |
| Indian (Asian) | 339 | 0.5% |
| Irish | 4,881 | 7.4% |
| Italian | 2,062 | 3.1% |
| Korean | 446 | 0.7% |
| Latvian | 11 | 0.0% |
| Lebanese | 78 | 0.1% |
| Lithuanian | 20 | 0.0% |
| Lumbee | 9 | 0.0% |
| Mexican | 9,290 | 14.1% |
| Mexican American Indian | 88 | 0.1% |
| Moroccan | 8 | 0.0% |
| Native Hawaiian | 86 | 0.1% |
| Navajo | 75 | 0.1% |
| New Zealander | 49 | 0.1% |
| Nicaraguan | 63 | 0.1% |
| Nigerian | 5 | 0.0% |
| Northern European | 87 | 0.1% |
| Norwegian | 1,761 | 2.7% |
| Paiute | 33 | 0.1% |
| Pakistani | 34 | 0.1% |
| Peruvian | 69 | 0.1% |
| Polish | 703 | 1.1% |
| Portuguese | 269 | 0.4% |
| Potawatomi | 7 | 0.0% |
| Puerto Rican | 109 | 0.2% |
| Puget Sound Salish | 17 | 0.0% |
| Romanian | 62 | 0.1% |
| Russian | 177 | 0.3% |
| Salvadoran | 41 | 0.1% |
| Scandinavian | 664 | 1.0% |
| Scotch-Irish | 686 | 1.0% |
| Scottish | 1,962 | 3.0% |
| Serbian | 15 | 0.0% |
| Shoshone | 12 | 0.0% |
| Sierra Leonean | 12 | 0.0% |
| Sioux | 7 | 0.0% |
| Slovak | 22 | 0.0% |
| South American | 124 | 0.2% |
| Spaniard | 166 | 0.3% |
| Spanish | 206 | 0.3% |
| Sri Lankan | 15 | 0.0% |
| Subsaharan African | 107 | 0.2% |
| Swedish | 2,347 | 3.6% |
| Swiss | 445 | 0.7% |
| Thai | 14 | 0.0% |
| Tongan | 54 | 0.1% |
| Ukrainian | 25 | 0.0% |
| Venezuelan | 49 | 0.1% |
| Welsh | 855 | 1.3% |
| Yakama | 26 | 0.0% |
| Yugoslavian | 29 | 0.0% | View All 104 Rows |
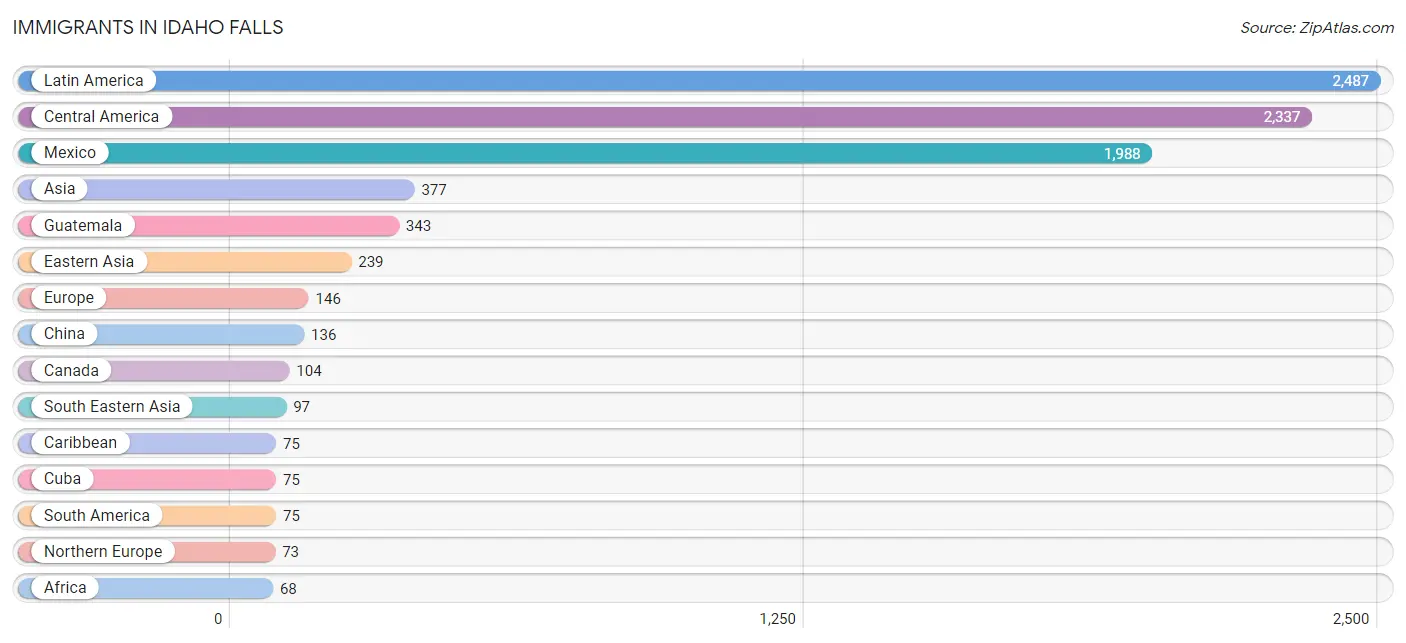
Immigrants in Idaho Falls
The most numerous immigrant groups reported in Idaho Falls came from Latin America (2,487 | 3.8%), Central America (2,337 | 3.6%), Mexico (1,988 | 3.0%), Asia (377 | 0.6%), and Guatemala (343 | 0.5%), together accounting for 11.5% of all Idaho Falls residents.
| Immigration Origin | # Population | % Population |
| Africa | 68 | 0.1% |
| Asia | 377 | 0.6% |
| Brazil | 9 | 0.0% |
| Canada | 104 | 0.2% |
| Caribbean | 75 | 0.1% |
| Central America | 2,337 | 3.6% |
| China | 136 | 0.2% |
| Cuba | 75 | 0.1% |
| Czechoslovakia | 19 | 0.0% |
| Eastern Asia | 239 | 0.4% |
| Eastern Europe | 25 | 0.0% |
| Ecuador | 6 | 0.0% |
| Egypt | 16 | 0.0% |
| El Salvador | 6 | 0.0% |
| England | 34 | 0.1% |
| Europe | 146 | 0.2% |
| Germany | 37 | 0.1% |
| Ghana | 14 | 0.0% |
| Guatemala | 343 | 0.5% |
| India | 14 | 0.0% |
| Japan | 38 | 0.1% |
| Korea | 65 | 0.1% |
| Latin America | 2,487 | 3.8% |
| Mexico | 1,988 | 3.0% |
| Nepal | 27 | 0.0% |
| Northern Africa | 24 | 0.0% |
| Northern Europe | 73 | 0.1% |
| Norway | 12 | 0.0% |
| Oceania | 13 | 0.0% |
| Peru | 11 | 0.0% |
| Philippines | 55 | 0.1% |
| Russia | 6 | 0.0% |
| Scotland | 11 | 0.0% |
| Sierra Leone | 12 | 0.0% |
| South Africa | 18 | 0.0% |
| South America | 75 | 0.1% |
| South Central Asia | 41 | 0.1% |
| South Eastern Asia | 97 | 0.2% |
| Southern Europe | 11 | 0.0% |
| Spain | 11 | 0.0% |
| Sweden | 6 | 0.0% |
| Thailand | 27 | 0.0% |
| Venezuela | 49 | 0.1% |
| Vietnam | 15 | 0.0% |
| Western Africa | 26 | 0.0% |
| Western Europe | 37 | 0.1% | View All 46 Rows |
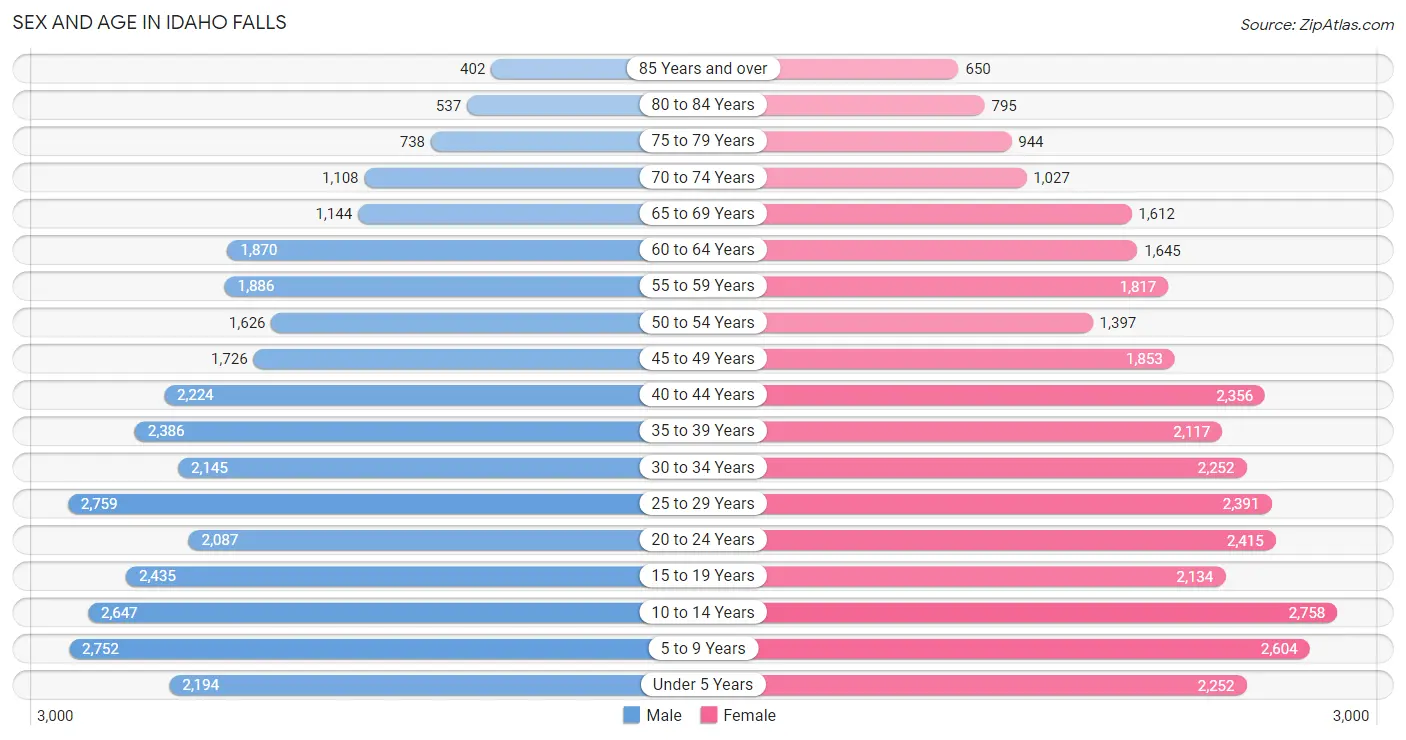
Sex and Age in Idaho Falls
Sex and Age in Idaho Falls
The most populous age groups in Idaho Falls are 25 to 29 Years (2,759 | 8.5%) for men and 10 to 14 Years (2,758 | 8.4%) for women.
| Age Bracket | Male | Female |
| Under 5 Years | 2,194 (6.7%) | 2,252 (6.8%) |
| 5 to 9 Years | 2,752 (8.4%) | 2,604 (7.9%) |
| 10 to 14 Years | 2,647 (8.1%) | 2,758 (8.4%) |
| 15 to 19 Years | 2,435 (7.4%) | 2,134 (6.5%) |
| 20 to 24 Years | 2,087 (6.4%) | 2,415 (7.3%) |
| 25 to 29 Years | 2,759 (8.5%) | 2,391 (7.2%) |
| 30 to 34 Years | 2,145 (6.6%) | 2,252 (6.8%) |
| 35 to 39 Years | 2,386 (7.3%) | 2,117 (6.4%) |
| 40 to 44 Years | 2,224 (6.8%) | 2,356 (7.1%) |
| 45 to 49 Years | 1,726 (5.3%) | 1,853 (5.6%) |
| 50 to 54 Years | 1,626 (5.0%) | 1,397 (4.2%) |
| 55 to 59 Years | 1,886 (5.8%) | 1,817 (5.5%) |
| 60 to 64 Years | 1,870 (5.7%) | 1,645 (5.0%) |
| 65 to 69 Years | 1,144 (3.5%) | 1,612 (4.9%) |
| 70 to 74 Years | 1,108 (3.4%) | 1,027 (3.1%) |
| 75 to 79 Years | 738 (2.3%) | 944 (2.9%) |
| 80 to 84 Years | 537 (1.6%) | 795 (2.4%) |
| 85 Years and over | 402 (1.2%) | 650 (2.0%) |
| Total | 32,666 (100.0%) | 33,019 (100.0%) |
Families and Households in Idaho Falls
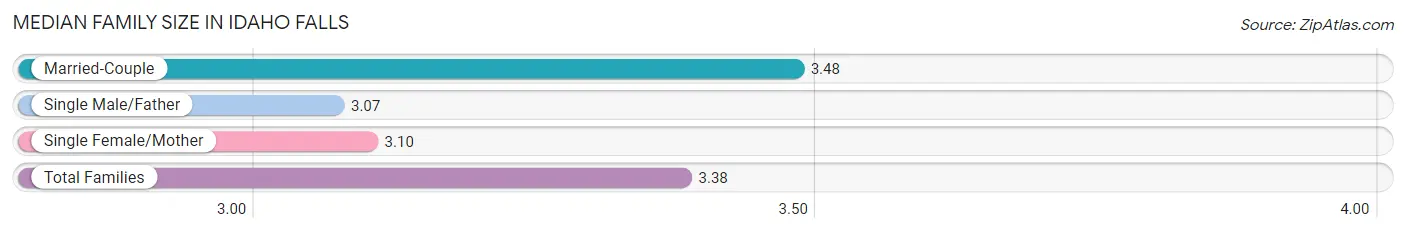
Median Family Size in Idaho Falls
The median family size in Idaho Falls is 3.38 persons per family, with married-couple families (11,619 | 75.7%) accounting for the largest median family size of 3.48 persons per family. On the other hand, single male/father families (1,034 | 6.7%) represent the smallest median family size with 3.07 persons per family.
| Family Type | # Families | Family Size |
| Married-Couple | 11,619 (75.7%) | 3.48 |
| Single Male/Father | 1,034 (6.7%) | 3.07 |
| Single Female/Mother | 2,691 (17.5%) | 3.10 |
| Total Families | 15,344 (100.0%) | 3.38 |
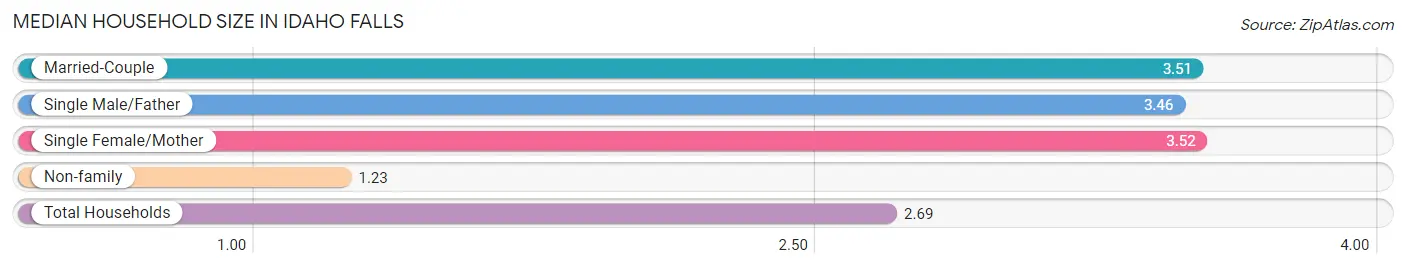
Median Household Size in Idaho Falls
The median household size in Idaho Falls is 2.69 persons per household, with single female/mother households (2,691 | 11.3%) accounting for the largest median household size of 3.52 persons per household. non-family households (8,580 | 35.9%) represent the smallest median household size with 1.23 persons per household.
| Household Type | # Households | Household Size |
| Married-Couple | 11,619 (48.6%) | 3.51 |
| Single Male/Father | 1,034 (4.3%) | 3.46 |
| Single Female/Mother | 2,691 (11.3%) | 3.52 |
| Non-family | 8,580 (35.9%) | 1.23 |
| Total Households | 23,924 (100.0%) | 2.69 |
Household Size by Marriage Status in Idaho Falls
Out of a total of 23,924 households in Idaho Falls, 15,344 (64.1%) are family households, while 8,580 (35.9%) are nonfamily households. The most numerous type of family households are 2-person households, comprising 5,884, and the most common type of nonfamily households are 1-person households, comprising 6,914.
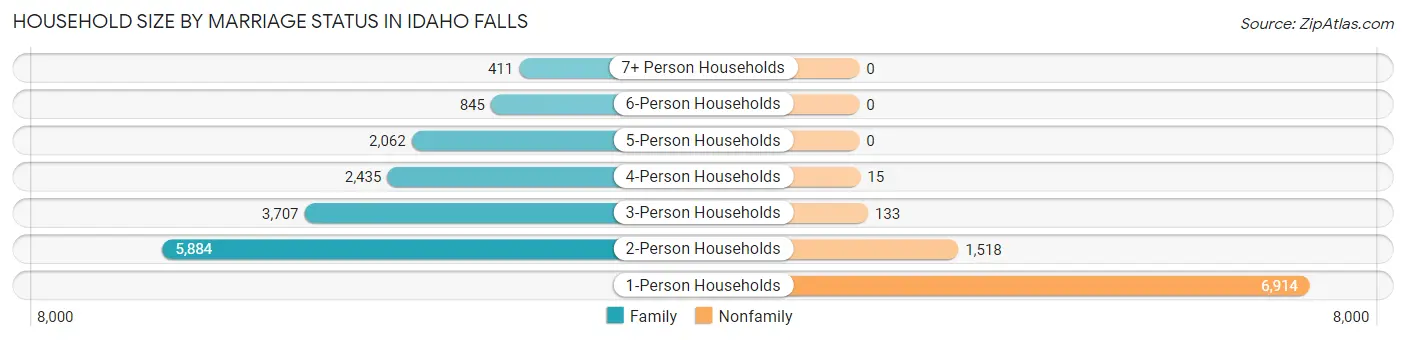
| Household Size | Family Households | Nonfamily Households |
| 1-Person Households | - | 6,914 (28.9%) |
| 2-Person Households | 5,884 (24.6%) | 1,518 (6.4%) |
| 3-Person Households | 3,707 (15.5%) | 133 (0.6%) |
| 4-Person Households | 2,435 (10.2%) | 15 (0.1%) |
| 5-Person Households | 2,062 (8.6%) | 0 (0.0%) |
| 6-Person Households | 845 (3.5%) | 0 (0.0%) |
| 7+ Person Households | 411 (1.7%) | 0 (0.0%) |
| Total | 15,344 (64.1%) | 8,580 (35.9%) |
Female Fertility in Idaho Falls
Fertility by Age in Idaho Falls
Average fertility rate in Idaho Falls is 70.0 births per 1,000 women. Women in the age bracket of 20 to 34 years have the highest fertility rate with 137.0 births per 1,000 women. Women in the age bracket of 20 to 34 years acount for 87.7% of all women with births.
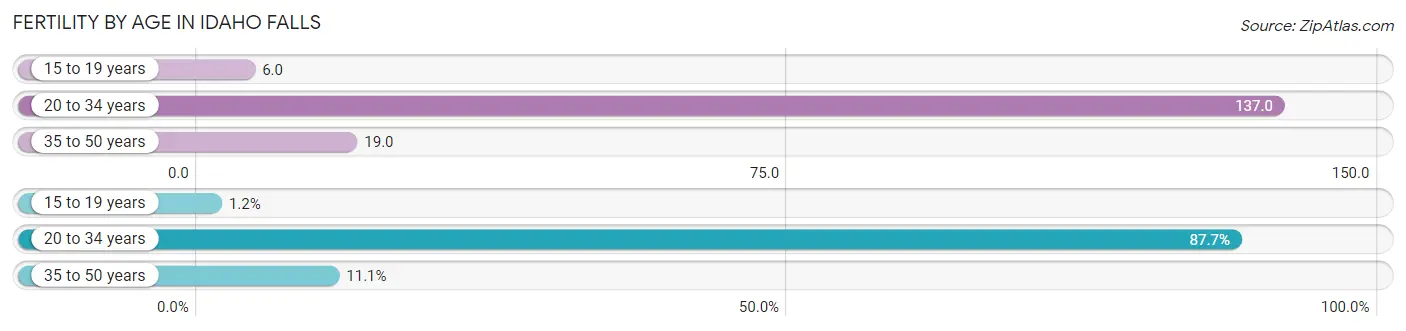
| Age Bracket | Women with Births | Births / 1,000 Women |
| 15 to 19 years | 13 (1.2%) | 6.0 |
| 20 to 34 years | 968 (87.7%) | 137.0 |
| 35 to 50 years | 123 (11.1%) | 19.0 |
| Total | 1,104 (100.0%) | 70.0 |
Fertility by Age by Marriage Status in Idaho Falls
83.0% of women with births (1,104) in Idaho Falls are married. The highest percentage of unmarried women with births falls into 15 to 19 years age bracket with 100.0% of them unmarried at the time of birth, while the lowest percentage of unmarried women with births belong to 35 to 50 years age bracket with 0.0% of them unmarried.
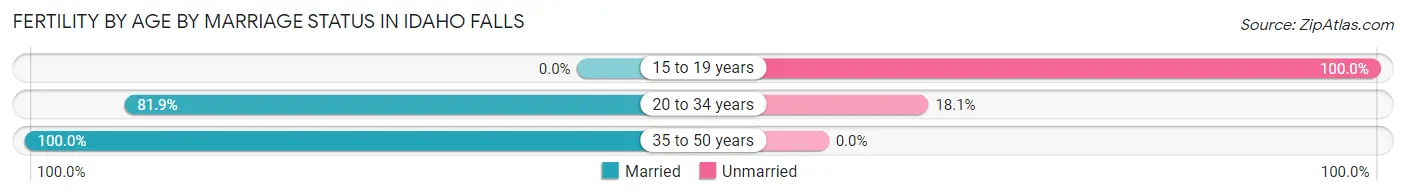
| Age Bracket | Married | Unmarried |
| 15 to 19 years | 0 (0.0%) | 13 (100.0%) |
| 20 to 34 years | 793 (81.9%) | 175 (18.1%) |
| 35 to 50 years | 123 (100.0%) | 0 (0.0%) |
| Total | 916 (83.0%) | 188 (17.0%) |
Fertility by Education in Idaho Falls
Average fertility rate in Idaho Falls is 70.0 births per 1,000 women. Women with the education attainment of bachelor's degree have the highest fertility rate of 113.0 births per 1,000 women, while women with the education attainment of less than high school have the lowest fertility at 5.0 births per 1,000 women. Women with the education attainment of college or associate's degree represent 39.3% of all women with births.
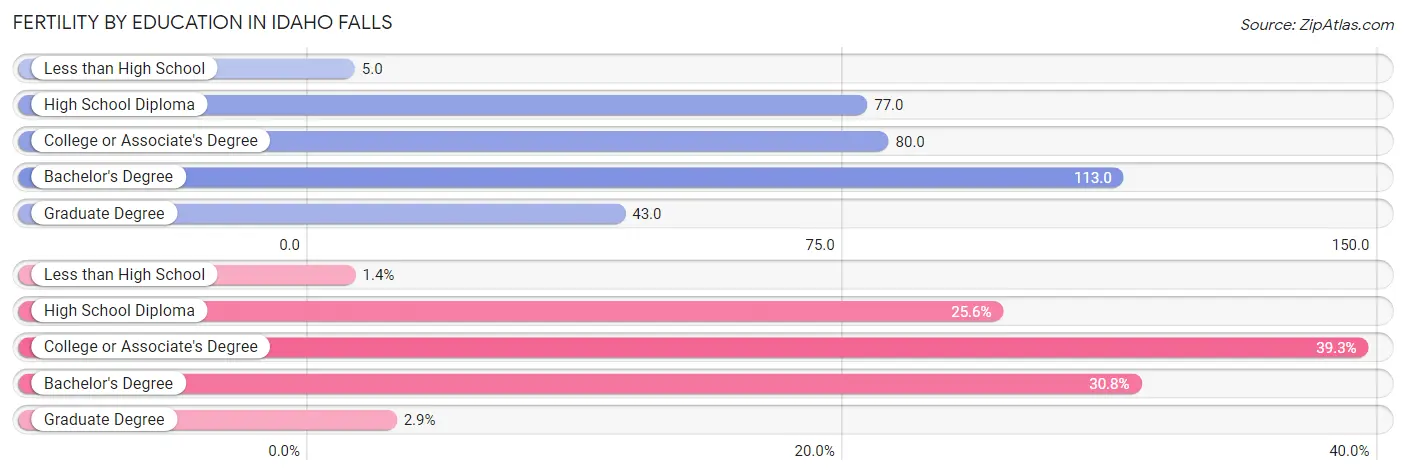
| Educational Attainment | Women with Births | Births / 1,000 Women |
| Less than High School | 15 (1.4%) | 5.0 |
| High School Diploma | 283 (25.6%) | 77.0 |
| College or Associate's Degree | 434 (39.3%) | 80.0 |
| Bachelor's Degree | 340 (30.8%) | 113.0 |
| Graduate Degree | 32 (2.9%) | 43.0 |
| Total | 1,104 (100.0%) | 70.0 |
Fertility by Education by Marriage Status in Idaho Falls
17.0% of women with births in Idaho Falls are unmarried. Women with the educational attainment of less than high school are most likely to be married with 100.0% of them married at childbirth, while women with the educational attainment of high school diploma are least likely to be married with 45.6% of them unmarried at childbirth.
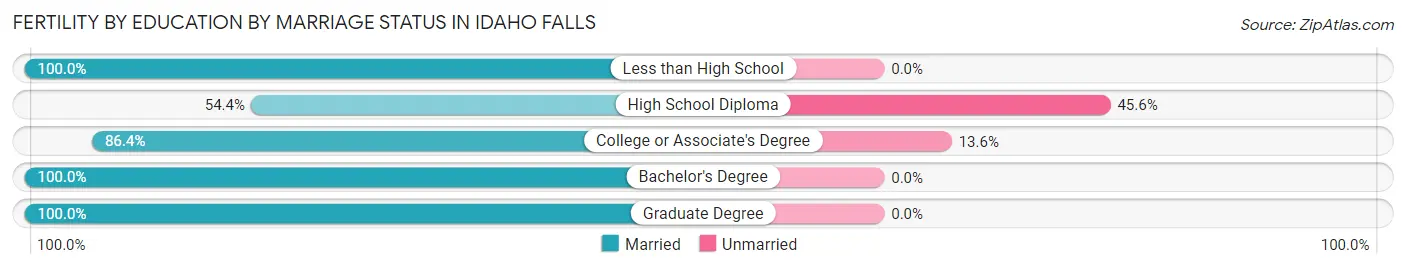
| Educational Attainment | Married | Unmarried |
| Less than High School | 15 (100.0%) | 0 (0.0%) |
| High School Diploma | 154 (54.4%) | 129 (45.6%) |
| College or Associate's Degree | 375 (86.4%) | 59 (13.6%) |
| Bachelor's Degree | 340 (100.0%) | 0 (0.0%) |
| Graduate Degree | 32 (100.0%) | 0 (0.0%) |
| Total | 916 (83.0%) | 188 (17.0%) |
Employment Characteristics in Idaho Falls
Employment by Class of Employer in Idaho Falls
Among the 29,912 employed individuals in Idaho Falls, private company employees (20,716 | 69.3%), federal government employees (1,827 | 6.1%), and local government employees (1,747 | 5.8%) make up the most common classes of employment.
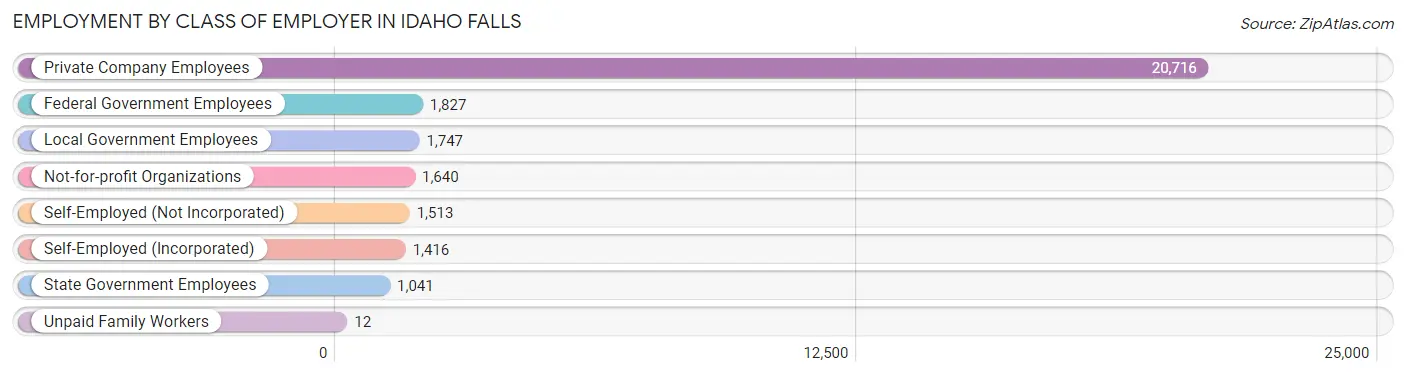
| Employer Class | # Employees | % Employees |
| Private Company Employees | 20,716 | 69.3% |
| Self-Employed (Incorporated) | 1,416 | 4.7% |
| Self-Employed (Not Incorporated) | 1,513 | 5.1% |
| Not-for-profit Organizations | 1,640 | 5.5% |
| Local Government Employees | 1,747 | 5.8% |
| State Government Employees | 1,041 | 3.5% |
| Federal Government Employees | 1,827 | 6.1% |
| Unpaid Family Workers | 12 | 0.0% |
| Total | 29,912 | 100.0% |
Employment Status by Age in Idaho Falls
According to the labor force statistics for Idaho Falls, out of the total population over 16 years of age (49,329), 64.9% or 32,015 individuals are in the labor force, with 4.8% or 1,537 of them unemployed. The age group with the highest labor force participation rate is 20 to 24 years, with 83.7% or 3,768 individuals in the labor force. Within the labor force, the 16 to 19 years age range has the highest percentage of unemployed individuals, with 10.8% or 217 of them being unemployed.
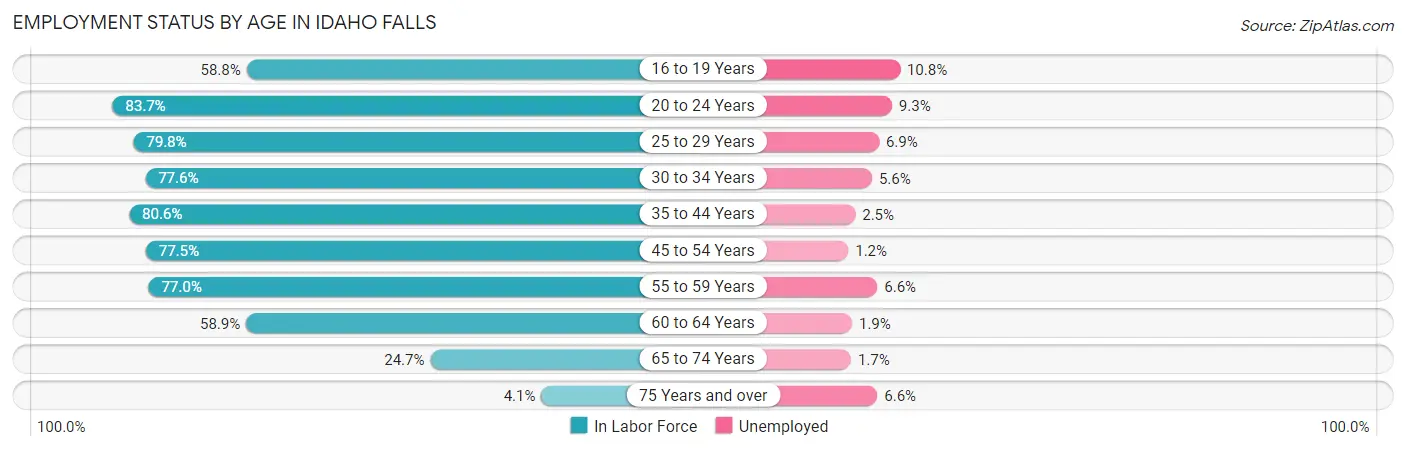
| Age Bracket | In Labor Force | Unemployed |
| 16 to 19 Years | 2,011 (58.8%) | 217 (10.8%) |
| 20 to 24 Years | 3,768 (83.7%) | 350 (9.3%) |
| 25 to 29 Years | 4,110 (79.8%) | 284 (6.9%) |
| 30 to 34 Years | 3,412 (77.6%) | 191 (5.6%) |
| 35 to 44 Years | 7,321 (80.6%) | 183 (2.5%) |
| 45 to 54 Years | 5,117 (77.5%) | 61 (1.2%) |
| 55 to 59 Years | 2,851 (77.0%) | 188 (6.6%) |
| 60 to 64 Years | 2,070 (58.9%) | 39 (1.9%) |
| 65 to 74 Years | 1,208 (24.7%) | 21 (1.7%) |
| 75 Years and over | 167 (4.1%) | 11 (6.6%) |
| Total | 32,015 (64.9%) | 1,537 (4.8%) |
Employment Status by Educational Attainment in Idaho Falls
According to labor force statistics for Idaho Falls, 76.7% of individuals (24,889) out of the total population between 25 and 64 years of age (32,450) are in the labor force, with 3.8% or 946 of them being unemployed. The group with the highest labor force participation rate are those with the educational attainment of bachelor's degree or higher, with 84.1% or 7,752 individuals in the labor force. Within the labor force, individuals with high school diploma education have the highest percentage of unemployment, with 4.9% or 303 of them being unemployed.
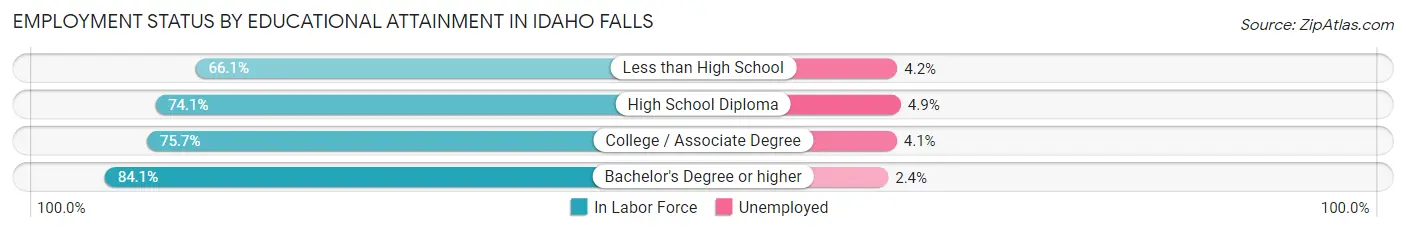
| Educational Attainment | In Labor Force | Unemployed |
| Less than High School | 2,237 (66.1%) | 142 (4.2%) |
| High School Diploma | 6,191 (74.1%) | 409 (4.9%) |
| College / Associate Degree | 8,699 (75.7%) | 471 (4.1%) |
| Bachelor's Degree or higher | 7,752 (84.1%) | 221 (2.4%) |
| Total | 24,889 (76.7%) | 1,233 (3.8%) |
Employment Occupations by Sex in Idaho Falls
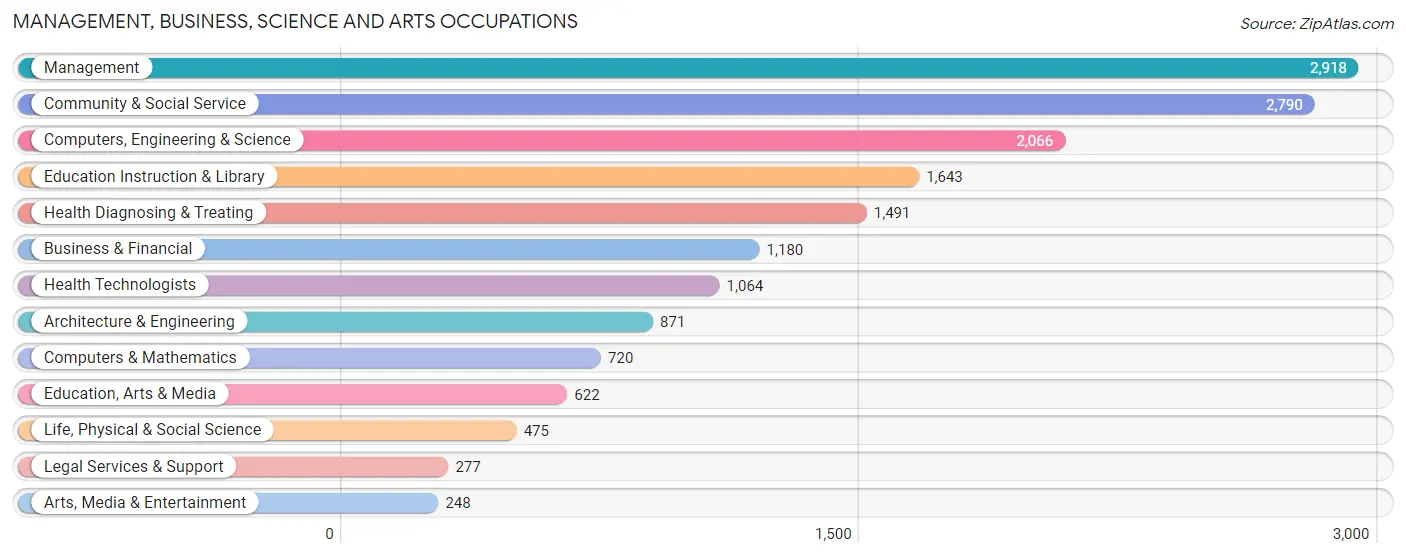
Management, Business, Science and Arts Occupations
The most common Management, Business, Science and Arts occupations in Idaho Falls are Management (2,918 | 9.6%), Community & Social Service (2,790 | 9.2%), Computers, Engineering & Science (2,066 | 6.8%), Education Instruction & Library (1,643 | 5.4%), and Health Diagnosing & Treating (1,491 | 4.9%).
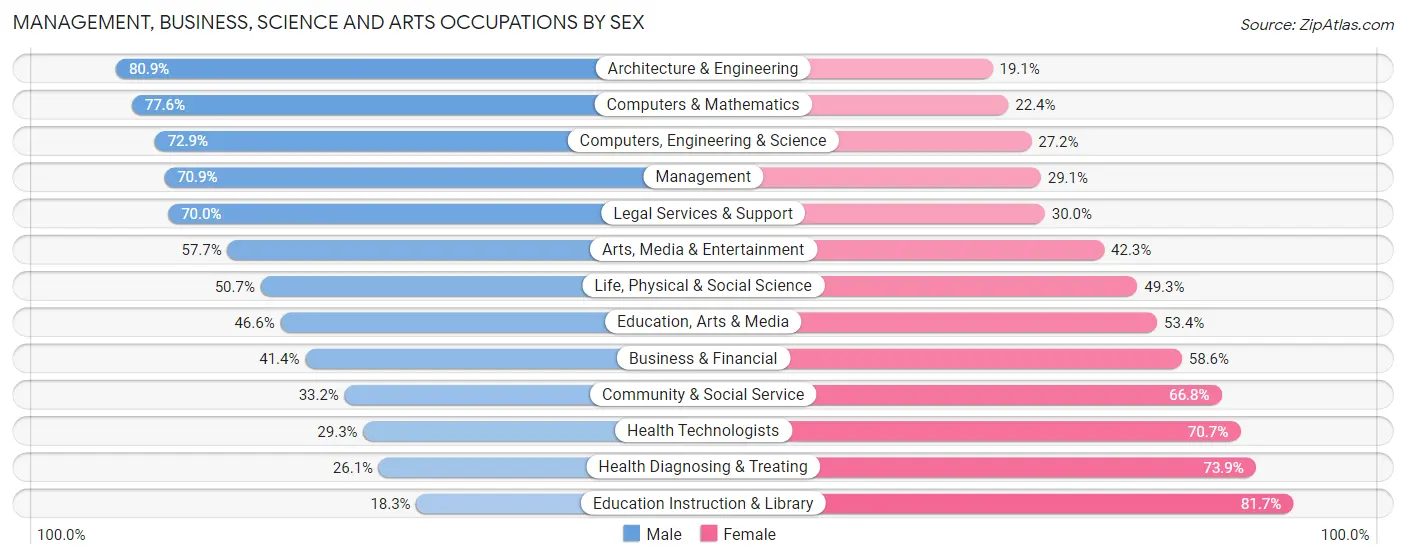
Management, Business, Science and Arts Occupations by Sex
Within the Management, Business, Science and Arts occupations in Idaho Falls, the most male-oriented occupations are Architecture & Engineering (80.9%), Computers & Mathematics (77.6%), and Computers, Engineering & Science (72.9%), while the most female-oriented occupations are Education Instruction & Library (81.7%), Health Diagnosing & Treating (73.9%), and Health Technologists (70.7%).
| Occupation | Male | Female |
| Management | 2,068 (70.9%) | 850 (29.1%) |
| Business & Financial | 489 (41.4%) | 691 (58.6%) |
| Computers, Engineering & Science | 1,505 (72.9%) | 561 (27.2%) |
| Computers & Mathematics | 559 (77.6%) | 161 (22.4%) |
| Architecture & Engineering | 705 (80.9%) | 166 (19.1%) |
| Life, Physical & Social Science | 241 (50.7%) | 234 (49.3%) |
| Community & Social Service | 927 (33.2%) | 1,863 (66.8%) |
| Education, Arts & Media | 290 (46.6%) | 332 (53.4%) |
| Legal Services & Support | 194 (70.0%) | 83 (30.0%) |
| Education Instruction & Library | 300 (18.3%) | 1,343 (81.7%) |
| Arts, Media & Entertainment | 143 (57.7%) | 105 (42.3%) |
| Health Diagnosing & Treating | 389 (26.1%) | 1,102 (73.9%) |
| Health Technologists | 312 (29.3%) | 752 (70.7%) |
| Total (Category) | 5,378 (51.5%) | 5,067 (48.5%) |
| Total (Overall) | 16,261 (53.6%) | 14,056 (46.4%) |
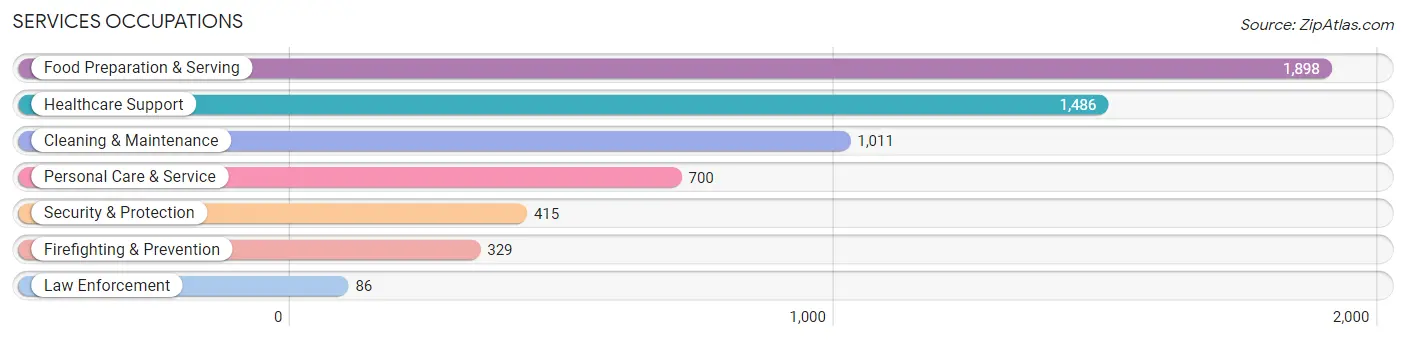
Services Occupations
The most common Services occupations in Idaho Falls are Food Preparation & Serving (1,898 | 6.3%), Healthcare Support (1,486 | 4.9%), Cleaning & Maintenance (1,011 | 3.3%), Personal Care & Service (700 | 2.3%), and Security & Protection (415 | 1.4%).
Services Occupations by Sex
Within the Services occupations in Idaho Falls, the most male-oriented occupations are Law Enforcement (100.0%), Security & Protection (87.2%), and Firefighting & Prevention (83.9%), while the most female-oriented occupations are Personal Care & Service (88.3%), Healthcare Support (74.8%), and Food Preparation & Serving (53.8%).

| Occupation | Male | Female |
| Healthcare Support | 374 (25.2%) | 1,112 (74.8%) |
| Security & Protection | 362 (87.2%) | 53 (12.8%) |
| Firefighting & Prevention | 276 (83.9%) | 53 (16.1%) |
| Law Enforcement | 86 (100.0%) | 0 (0.0%) |
| Food Preparation & Serving | 877 (46.2%) | 1,021 (53.8%) |
| Cleaning & Maintenance | 574 (56.8%) | 437 (43.2%) |
| Personal Care & Service | 82 (11.7%) | 618 (88.3%) |
| Total (Category) | 2,269 (41.2%) | 3,241 (58.8%) |
| Total (Overall) | 16,261 (53.6%) | 14,056 (46.4%) |
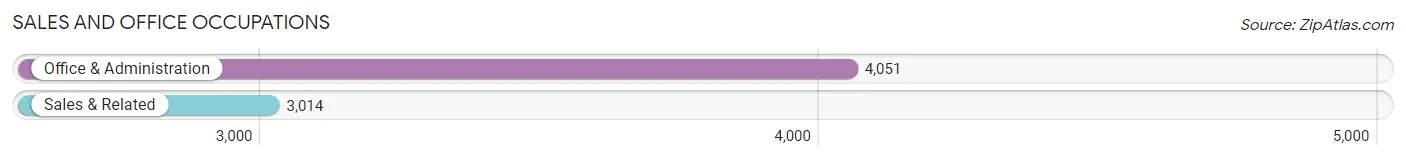
Sales and Office Occupations
The most common Sales and Office occupations in Idaho Falls are Office & Administration (4,051 | 13.4%), and Sales & Related (3,014 | 9.9%).
Sales and Office Occupations by Sex
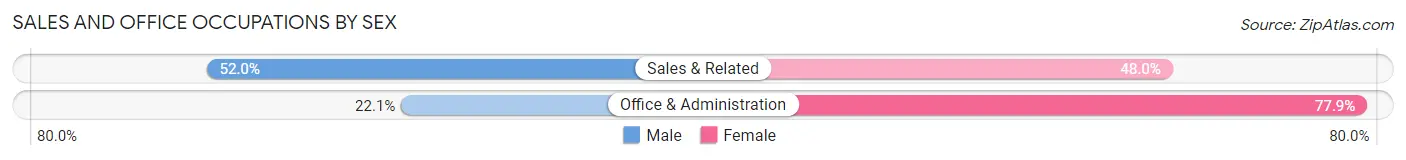
| Occupation | Male | Female |
| Sales & Related | 1,567 (52.0%) | 1,447 (48.0%) |
| Office & Administration | 894 (22.1%) | 3,157 (77.9%) |
| Total (Category) | 2,461 (34.8%) | 4,604 (65.2%) |
| Total (Overall) | 16,261 (53.6%) | 14,056 (46.4%) |
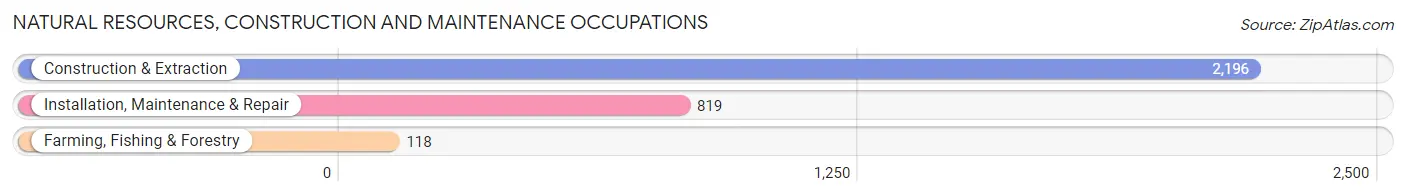
Natural Resources, Construction and Maintenance Occupations
The most common Natural Resources, Construction and Maintenance occupations in Idaho Falls are Construction & Extraction (2,196 | 7.2%), Installation, Maintenance & Repair (819 | 2.7%), and Farming, Fishing & Forestry (118 | 0.4%).
Natural Resources, Construction and Maintenance Occupations by Sex
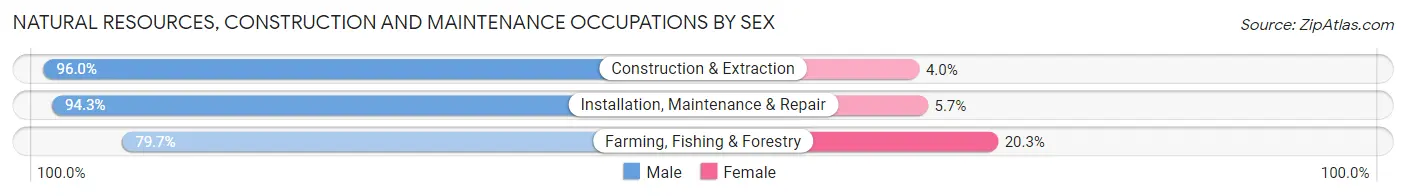
| Occupation | Male | Female |
| Farming, Fishing & Forestry | 94 (79.7%) | 24 (20.3%) |
| Construction & Extraction | 2,109 (96.0%) | 87 (4.0%) |
| Installation, Maintenance & Repair | 772 (94.3%) | 47 (5.7%) |
| Total (Category) | 2,975 (95.0%) | 158 (5.0%) |
| Total (Overall) | 16,261 (53.6%) | 14,056 (46.4%) |
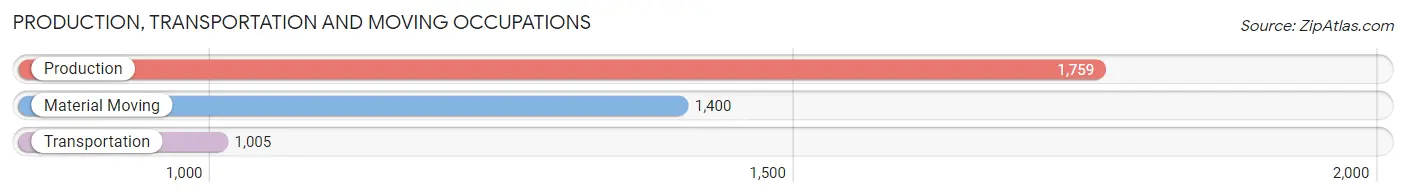
Production, Transportation and Moving Occupations
The most common Production, Transportation and Moving occupations in Idaho Falls are Production (1,759 | 5.8%), Material Moving (1,400 | 4.6%), and Transportation (1,005 | 3.3%).
Production, Transportation and Moving Occupations by Sex
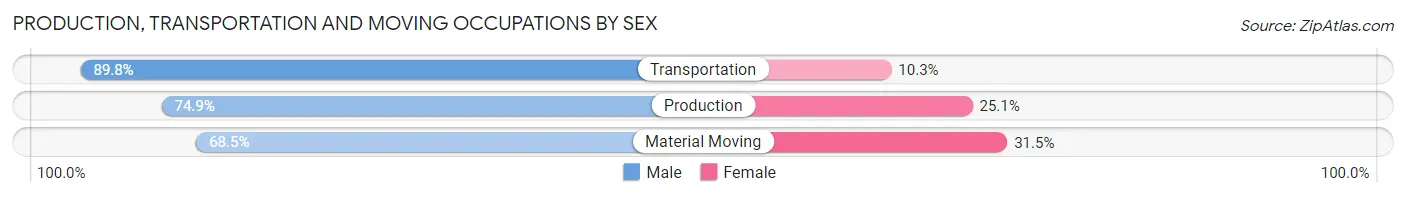
| Occupation | Male | Female |
| Production | 1,317 (74.9%) | 442 (25.1%) |
| Transportation | 902 (89.7%) | 103 (10.2%) |
| Material Moving | 959 (68.5%) | 441 (31.5%) |
| Total (Category) | 3,178 (76.3%) | 986 (23.7%) |
| Total (Overall) | 16,261 (53.6%) | 14,056 (46.4%) |
Employment Industries by Sex in Idaho Falls
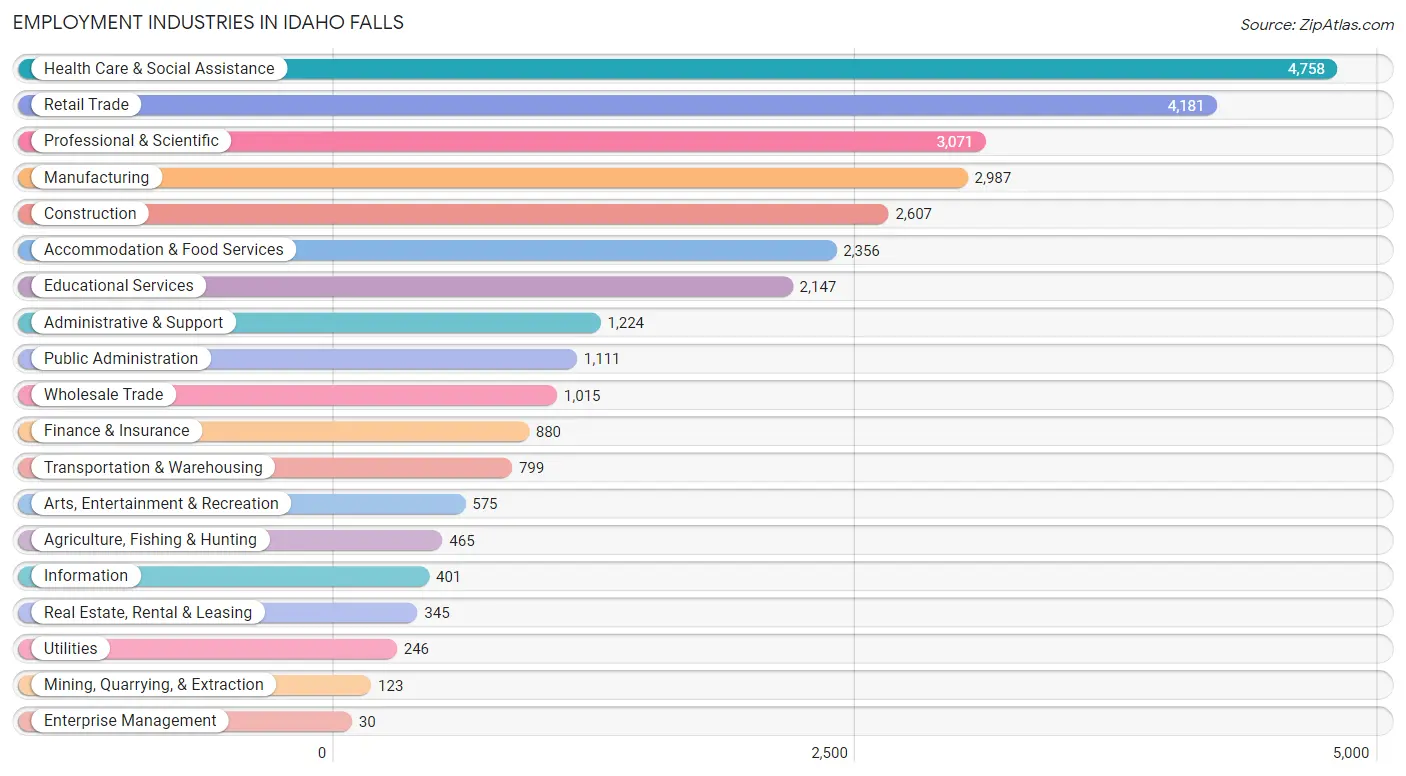
Employment Industries in Idaho Falls
The major employment industries in Idaho Falls include Health Care & Social Assistance (4,758 | 15.7%), Retail Trade (4,181 | 13.8%), Professional & Scientific (3,071 | 10.1%), Manufacturing (2,987 | 9.9%), and Construction (2,607 | 8.6%).
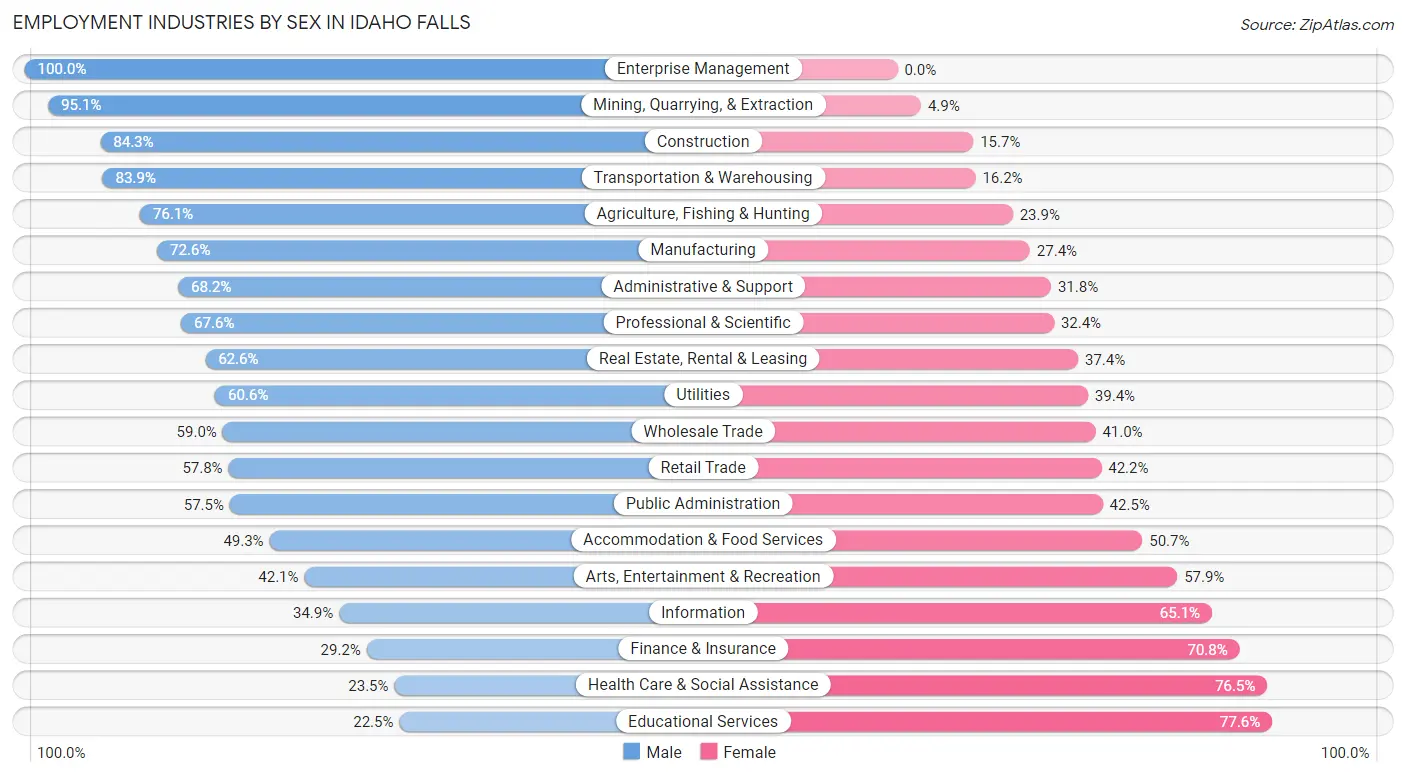
Employment Industries by Sex in Idaho Falls
The Idaho Falls industries that see more men than women are Enterprise Management (100.0%), Mining, Quarrying, & Extraction (95.1%), and Construction (84.3%), whereas the industries that tend to have a higher number of women are Educational Services (77.5%), Health Care & Social Assistance (76.5%), and Finance & Insurance (70.8%).
| Industry | Male | Female |
| Agriculture, Fishing & Hunting | 354 (76.1%) | 111 (23.9%) |
| Mining, Quarrying, & Extraction | 117 (95.1%) | 6 (4.9%) |
| Construction | 2,198 (84.3%) | 409 (15.7%) |
| Manufacturing | 2,168 (72.6%) | 819 (27.4%) |
| Wholesale Trade | 599 (59.0%) | 416 (41.0%) |
| Retail Trade | 2,417 (57.8%) | 1,764 (42.2%) |
| Transportation & Warehousing | 670 (83.9%) | 129 (16.2%) |
| Utilities | 149 (60.6%) | 97 (39.4%) |
| Information | 140 (34.9%) | 261 (65.1%) |
| Finance & Insurance | 257 (29.2%) | 623 (70.8%) |
| Real Estate, Rental & Leasing | 216 (62.6%) | 129 (37.4%) |
| Professional & Scientific | 2,076 (67.6%) | 995 (32.4%) |
| Enterprise Management | 30 (100.0%) | 0 (0.0%) |
| Administrative & Support | 835 (68.2%) | 389 (31.8%) |
| Educational Services | 482 (22.5%) | 1,665 (77.5%) |
| Health Care & Social Assistance | 1,116 (23.5%) | 3,642 (76.5%) |
| Arts, Entertainment & Recreation | 242 (42.1%) | 333 (57.9%) |
| Accommodation & Food Services | 1,162 (49.3%) | 1,194 (50.7%) |
| Public Administration | 639 (57.5%) | 472 (42.5%) |
| Total | 16,261 (53.6%) | 14,056 (46.4%) |
Education in Idaho Falls
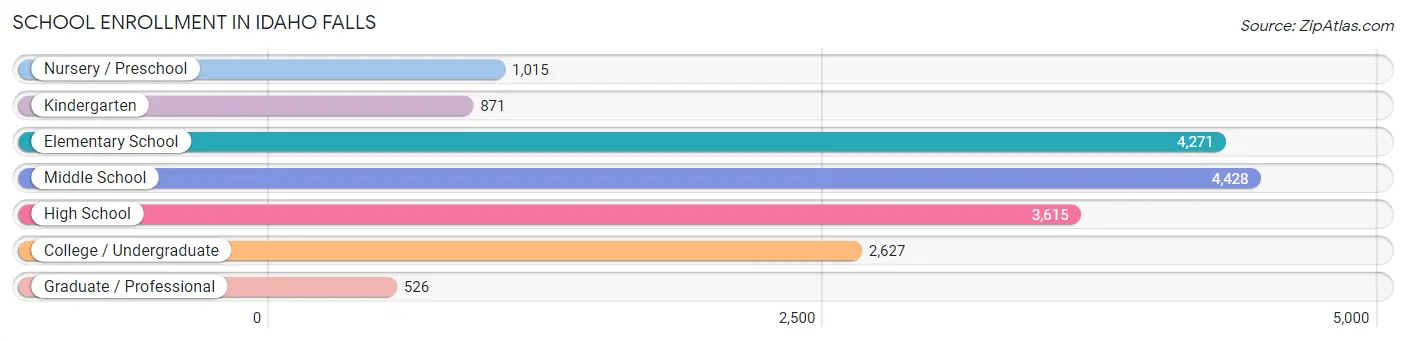
School Enrollment in Idaho Falls
The most common levels of schooling among the 17,353 students in Idaho Falls are middle school (4,428 | 25.5%), elementary school (4,271 | 24.6%), and high school (3,615 | 20.8%).
| School Level | # Students | % Students |
| Nursery / Preschool | 1,015 | 5.9% |
| Kindergarten | 871 | 5.0% |
| Elementary School | 4,271 | 24.6% |
| Middle School | 4,428 | 25.5% |
| High School | 3,615 | 20.8% |
| College / Undergraduate | 2,627 | 15.1% |
| Graduate / Professional | 526 | 3.0% |
| Total | 17,353 | 100.0% |
School Enrollment by Age by Funding Source in Idaho Falls
Out of a total of 17,353 students who are enrolled in schools in Idaho Falls, 2,933 (16.9%) attend a private institution, while the remaining 14,420 (83.1%) are enrolled in public schools. The age group of 3 to 4 year olds has the highest likelihood of being enrolled in private schools, with 282 (48.8% in the age bracket) enrolled. Conversely, the age group of 15 to 17 year olds has the lowest likelihood of being enrolled in a private school, with 2,318 (92.1% in the age bracket) attending a public institution.
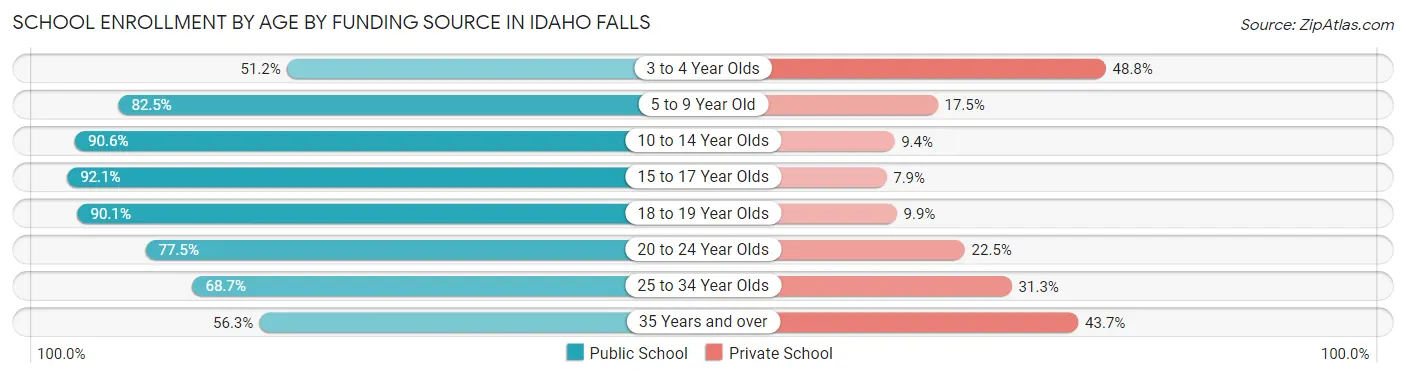
| Age Bracket | Public School | Private School |
| 3 to 4 Year Olds | 296 (51.2%) | 282 (48.8%) |
| 5 to 9 Year Old | 4,202 (82.5%) | 891 (17.5%) |
| 10 to 14 Year Olds | 4,867 (90.6%) | 506 (9.4%) |
| 15 to 17 Year Olds | 2,318 (92.1%) | 200 (7.9%) |
| 18 to 19 Year Olds | 731 (90.1%) | 80 (9.9%) |
| 20 to 24 Year Olds | 715 (77.5%) | 208 (22.5%) |
| 25 to 34 Year Olds | 707 (68.7%) | 322 (31.3%) |
| 35 Years and over | 579 (56.3%) | 449 (43.7%) |
| Total | 14,420 (83.1%) | 2,933 (16.9%) |
Educational Attainment by Field of Study in Idaho Falls
Education (1,956 | 14.7%), engineering (1,908 | 14.3%), science & technology (1,881 | 14.1%), business (1,864 | 14.0%), and bio, nature & agricultural (929 | 7.0%) are the most common fields of study among 13,299 individuals in Idaho Falls who have obtained a bachelor's degree or higher.
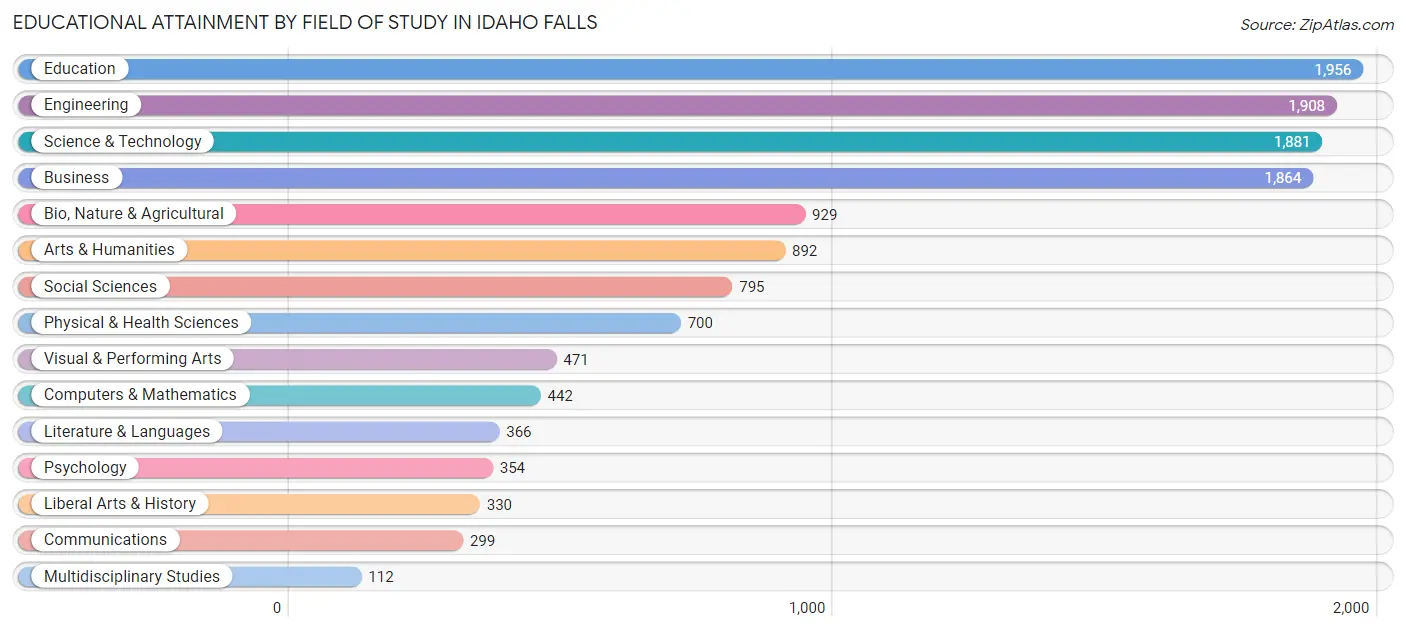
| Field of Study | # Graduates | % Graduates |
| Computers & Mathematics | 442 | 3.3% |
| Bio, Nature & Agricultural | 929 | 7.0% |
| Physical & Health Sciences | 700 | 5.3% |
| Psychology | 354 | 2.7% |
| Social Sciences | 795 | 6.0% |
| Engineering | 1,908 | 14.3% |
| Multidisciplinary Studies | 112 | 0.8% |
| Science & Technology | 1,881 | 14.1% |
| Business | 1,864 | 14.0% |
| Education | 1,956 | 14.7% |
| Literature & Languages | 366 | 2.8% |
| Liberal Arts & History | 330 | 2.5% |
| Visual & Performing Arts | 471 | 3.5% |
| Communications | 299 | 2.2% |
| Arts & Humanities | 892 | 6.7% |
| Total | 13,299 | 100.0% |
Transportation & Commute in Idaho Falls
Vehicle Availability by Sex in Idaho Falls
The most prevalent vehicle ownership categories in Idaho Falls are males with 2 vehicles (6,803, accounting for 42.5%) and females with 2 vehicles (5,075, making up 49.1%).
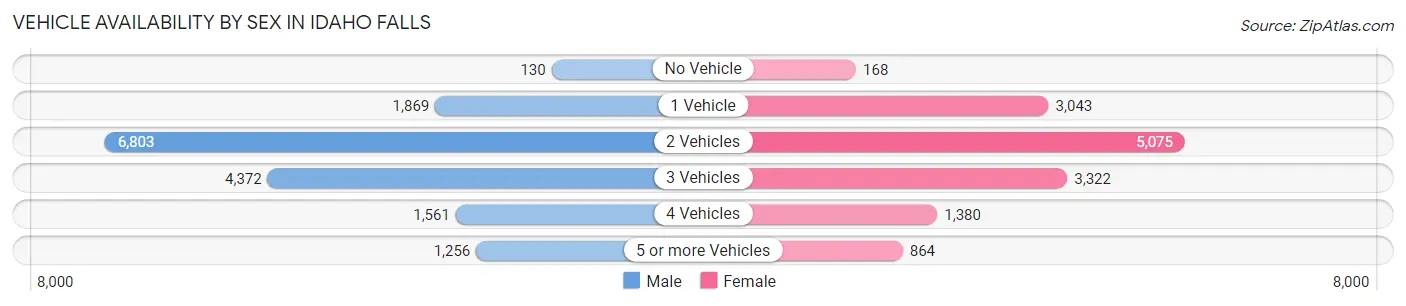
| Vehicles Available | Male | Female |
| No Vehicle | 130 (0.8%) | 168 (1.2%) |
| 1 Vehicle | 1,869 (11.7%) | 3,043 (22.0%) |
| 2 Vehicles | 6,803 (42.5%) | 5,075 (36.6%) |
| 3 Vehicles | 4,372 (27.3%) | 3,322 (24.0%) |
| 4 Vehicles | 1,561 (9.8%) | 1,380 (10.0%) |
| 5 or more Vehicles | 1,256 (7.9%) | 864 (6.2%) |
| Total | 15,991 (100.0%) | 13,852 (100.0%) |
Commute Time in Idaho Falls
The most frequently occuring commute durations in Idaho Falls are 10 to 14 minutes (6,872 commuters, 25.0%), 15 to 19 minutes (5,930 commuters, 21.6%), and 5 to 9 minutes (5,886 commuters, 21.4%).
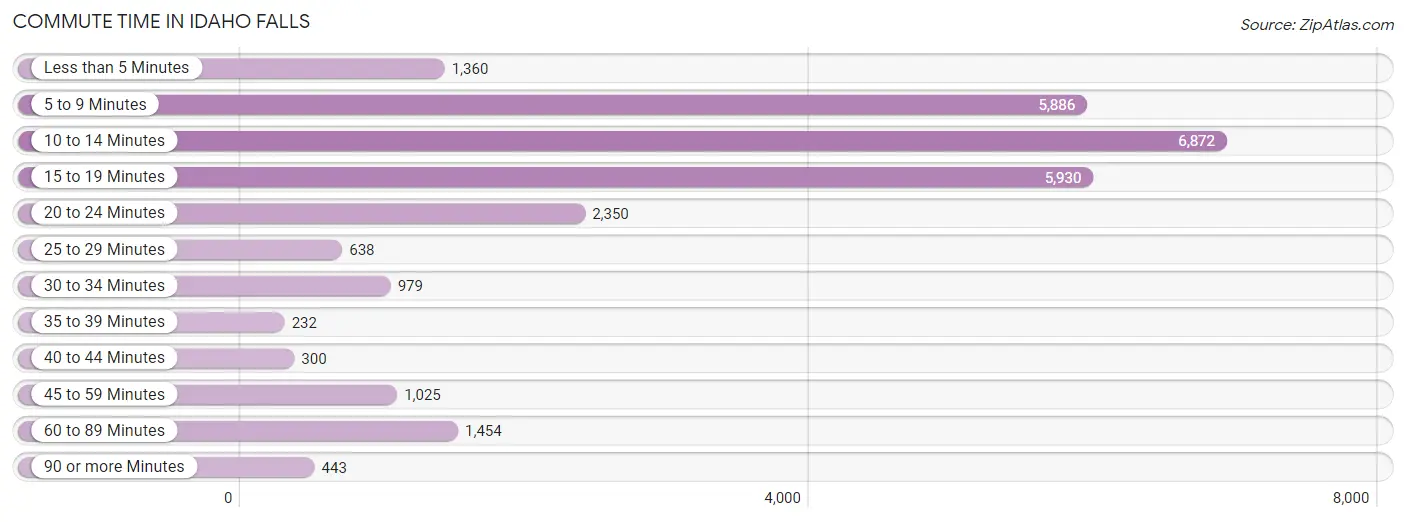
| Commute Time | # Commuters | % Commuters |
| Less than 5 Minutes | 1,360 | 5.0% |
| 5 to 9 Minutes | 5,886 | 21.4% |
| 10 to 14 Minutes | 6,872 | 25.0% |
| 15 to 19 Minutes | 5,930 | 21.6% |
| 20 to 24 Minutes | 2,350 | 8.6% |
| 25 to 29 Minutes | 638 | 2.3% |
| 30 to 34 Minutes | 979 | 3.6% |
| 35 to 39 Minutes | 232 | 0.8% |
| 40 to 44 Minutes | 300 | 1.1% |
| 45 to 59 Minutes | 1,025 | 3.7% |
| 60 to 89 Minutes | 1,454 | 5.3% |
| 90 or more Minutes | 443 | 1.6% |
Commute Time by Sex in Idaho Falls
The most common commute times in Idaho Falls are 10 to 14 minutes (3,411 commuters, 22.8%) for males and 10 to 14 minutes (3,461 commuters, 27.6%) for females.
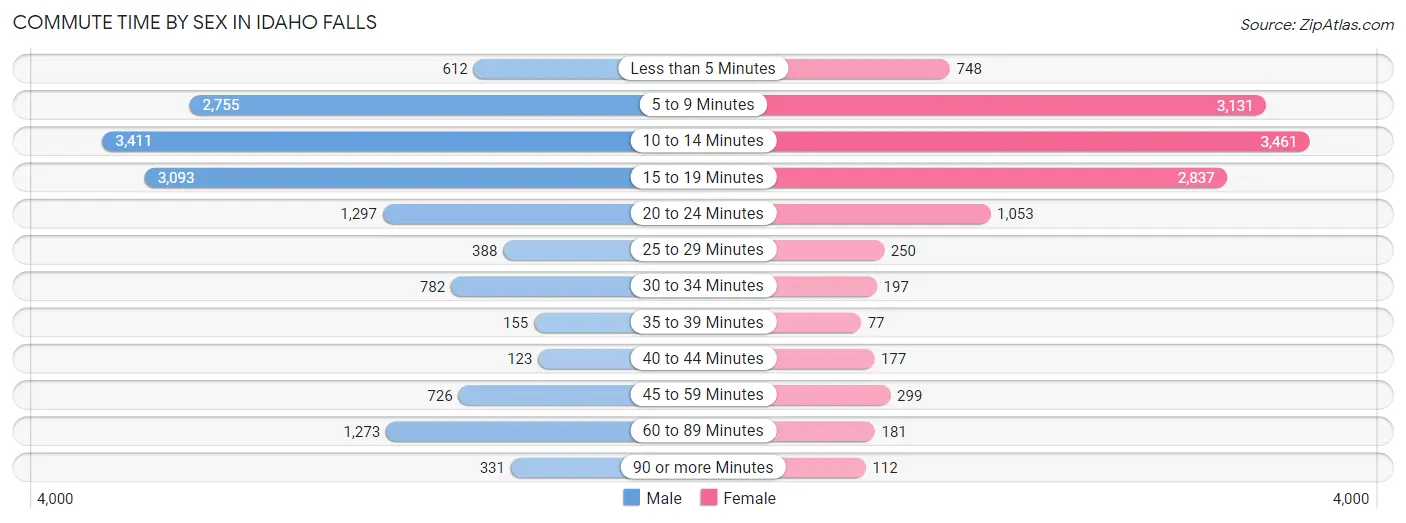
| Commute Time | Male | Female |
| Less than 5 Minutes | 612 (4.1%) | 748 (6.0%) |
| 5 to 9 Minutes | 2,755 (18.4%) | 3,131 (25.0%) |
| 10 to 14 Minutes | 3,411 (22.8%) | 3,461 (27.6%) |
| 15 to 19 Minutes | 3,093 (20.7%) | 2,837 (22.7%) |
| 20 to 24 Minutes | 1,297 (8.7%) | 1,053 (8.4%) |
| 25 to 29 Minutes | 388 (2.6%) | 250 (2.0%) |
| 30 to 34 Minutes | 782 (5.2%) | 197 (1.6%) |
| 35 to 39 Minutes | 155 (1.0%) | 77 (0.6%) |
| 40 to 44 Minutes | 123 (0.8%) | 177 (1.4%) |
| 45 to 59 Minutes | 726 (4.9%) | 299 (2.4%) |
| 60 to 89 Minutes | 1,273 (8.5%) | 181 (1.5%) |
| 90 or more Minutes | 331 (2.2%) | 112 (0.9%) |
Time of Departure to Work by Sex in Idaho Falls
The most frequent times of departure to work in Idaho Falls are 7:30 AM to 7:59 AM (1,956, 13.1%) for males and 7:30 AM to 7:59 AM (2,167, 17.3%) for females.
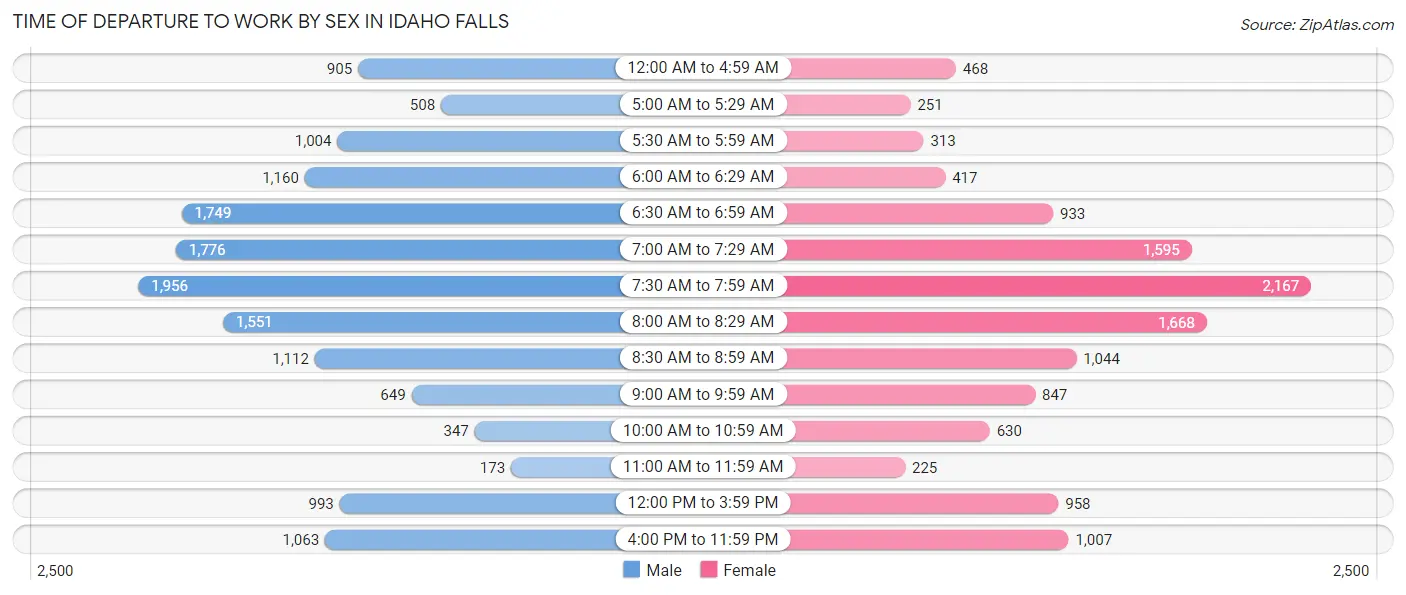
| Time of Departure | Male | Female |
| 12:00 AM to 4:59 AM | 905 (6.1%) | 468 (3.7%) |
| 5:00 AM to 5:29 AM | 508 (3.4%) | 251 (2.0%) |
| 5:30 AM to 5:59 AM | 1,004 (6.7%) | 313 (2.5%) |
| 6:00 AM to 6:29 AM | 1,160 (7.8%) | 417 (3.3%) |
| 6:30 AM to 6:59 AM | 1,749 (11.7%) | 933 (7.4%) |
| 7:00 AM to 7:29 AM | 1,776 (11.9%) | 1,595 (12.7%) |
| 7:30 AM to 7:59 AM | 1,956 (13.1%) | 2,167 (17.3%) |
| 8:00 AM to 8:29 AM | 1,551 (10.4%) | 1,668 (13.3%) |
| 8:30 AM to 8:59 AM | 1,112 (7.4%) | 1,044 (8.3%) |
| 9:00 AM to 9:59 AM | 649 (4.3%) | 847 (6.8%) |
| 10:00 AM to 10:59 AM | 347 (2.3%) | 630 (5.0%) |
| 11:00 AM to 11:59 AM | 173 (1.2%) | 225 (1.8%) |
| 12:00 PM to 3:59 PM | 993 (6.6%) | 958 (7.6%) |
| 4:00 PM to 11:59 PM | 1,063 (7.1%) | 1,007 (8.0%) |
| Total | 14,946 (100.0%) | 12,523 (100.0%) |
Housing Occupancy in Idaho Falls
Occupancy by Ownership in Idaho Falls
Of the total 23,924 dwellings in Idaho Falls, owner-occupied units account for 15,077 (63.0%), while renter-occupied units make up 8,847 (37.0%).
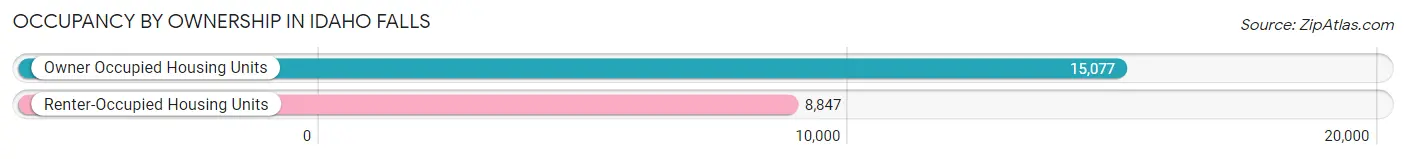
| Occupancy | # Housing Units | % Housing Units |
| Owner Occupied Housing Units | 15,077 | 63.0% |
| Renter-Occupied Housing Units | 8,847 | 37.0% |
| Total Occupied Housing Units | 23,924 | 100.0% |
Occupancy by Household Size in Idaho Falls
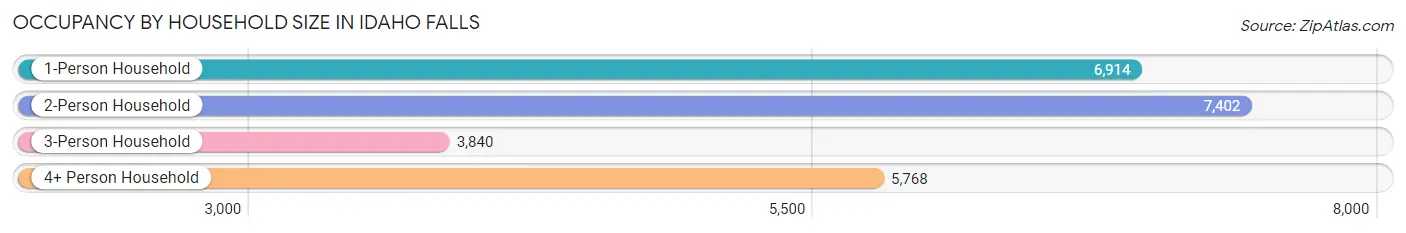
| Household Size | # Housing Units | % Housing Units |
| 1-Person Household | 6,914 | 28.9% |
| 2-Person Household | 7,402 | 30.9% |
| 3-Person Household | 3,840 | 16.1% |
| 4+ Person Household | 5,768 | 24.1% |
| Total Housing Units | 23,924 | 100.0% |
Occupancy by Ownership by Household Size in Idaho Falls
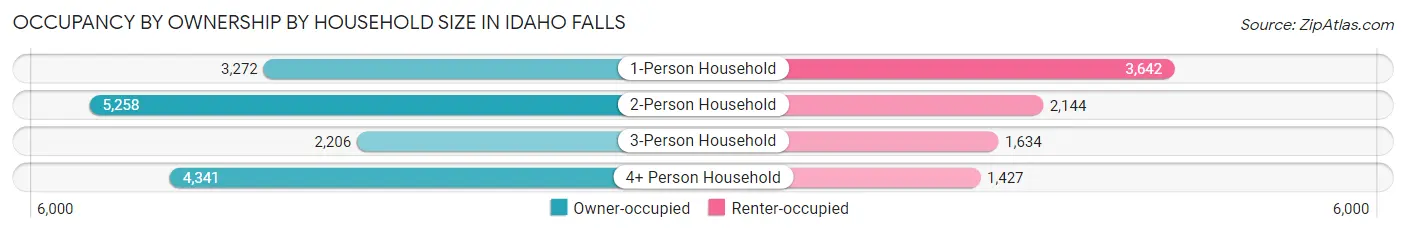
| Household Size | Owner-occupied | Renter-occupied |
| 1-Person Household | 3,272 (47.3%) | 3,642 (52.7%) |
| 2-Person Household | 5,258 (71.0%) | 2,144 (29.0%) |
| 3-Person Household | 2,206 (57.5%) | 1,634 (42.5%) |
| 4+ Person Household | 4,341 (75.3%) | 1,427 (24.7%) |
| Total Housing Units | 15,077 (63.0%) | 8,847 (37.0%) |
Occupancy by Educational Attainment in Idaho Falls
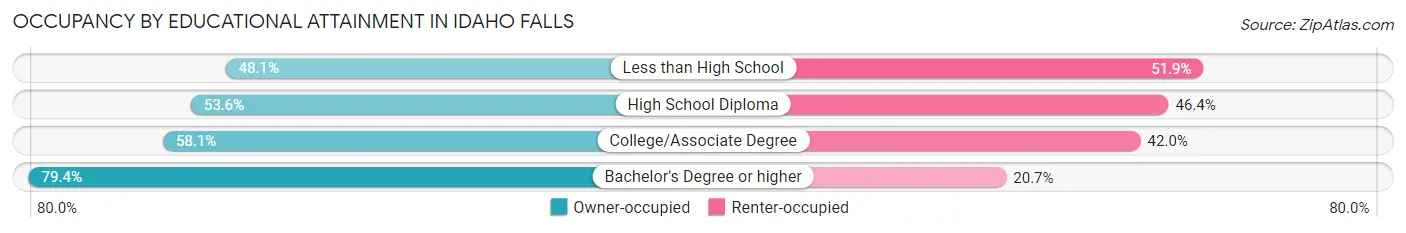
| Household Size | Owner-occupied | Renter-occupied |
| Less than High School | 877 (48.1%) | 946 (51.9%) |
| High School Diploma | 3,240 (53.6%) | 2,801 (46.4%) |
| College/Associate Degree | 4,859 (58.1%) | 3,512 (41.9%) |
| Bachelor's Degree or higher | 6,101 (79.3%) | 1,588 (20.6%) |
Occupancy by Age of Householder in Idaho Falls
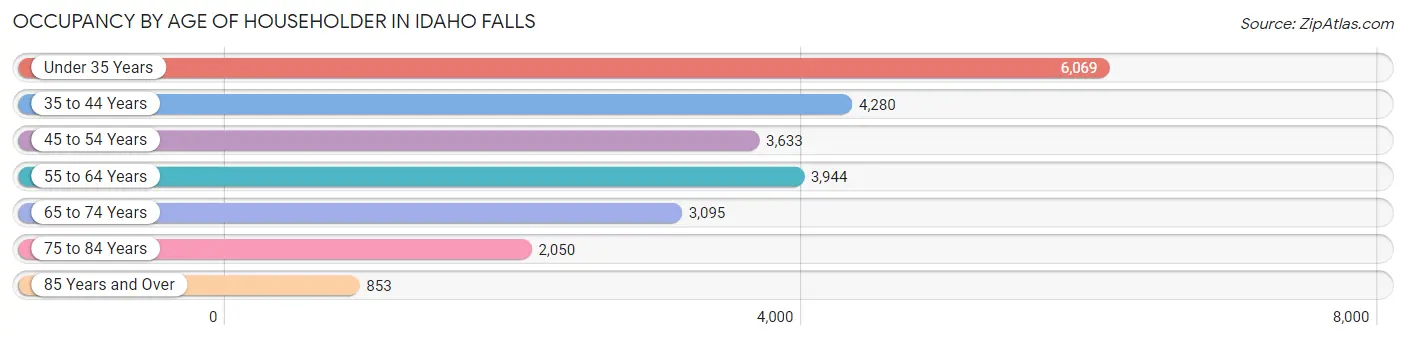
| Age Bracket | # Households | % Households |
| Under 35 Years | 6,069 | 25.4% |
| 35 to 44 Years | 4,280 | 17.9% |
| 45 to 54 Years | 3,633 | 15.2% |
| 55 to 64 Years | 3,944 | 16.5% |
| 65 to 74 Years | 3,095 | 12.9% |
| 75 to 84 Years | 2,050 | 8.6% |
| 85 Years and Over | 853 | 3.6% |
| Total | 23,924 | 100.0% |
Housing Finances in Idaho Falls
Median Income by Occupancy in Idaho Falls
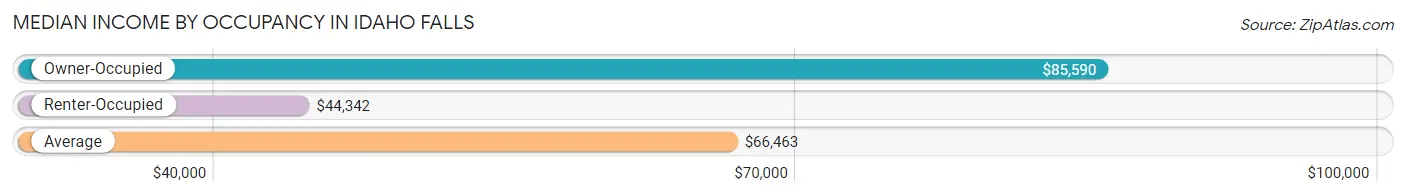
| Occupancy Type | # Households | Median Income |
| Owner-Occupied | 15,077 (63.0%) | $85,590 |
| Renter-Occupied | 8,847 (37.0%) | $44,342 |
| Average | 23,924 (100.0%) | $66,463 |
Occupancy by Householder Income Bracket in Idaho Falls
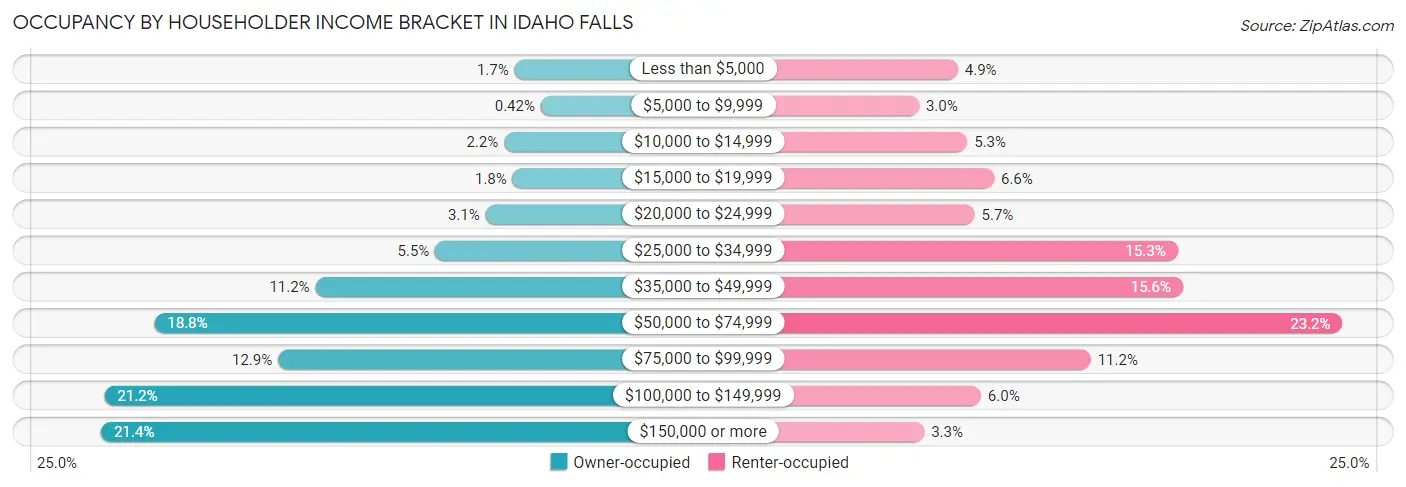
| Income Bracket | Owner-occupied | Renter-occupied |
| Less than $5,000 | 252 (1.7%) | 431 (4.9%) |
| $5,000 to $9,999 | 64 (0.4%) | 267 (3.0%) |
| $10,000 to $14,999 | 327 (2.2%) | 471 (5.3%) |
| $15,000 to $19,999 | 265 (1.8%) | 583 (6.6%) |
| $20,000 to $24,999 | 460 (3.0%) | 502 (5.7%) |
| $25,000 to $34,999 | 822 (5.4%) | 1,356 (15.3%) |
| $35,000 to $49,999 | 1,681 (11.2%) | 1,378 (15.6%) |
| $50,000 to $74,999 | 2,838 (18.8%) | 2,051 (23.2%) |
| $75,000 to $99,999 | 1,950 (12.9%) | 991 (11.2%) |
| $100,000 to $149,999 | 3,197 (21.2%) | 528 (6.0%) |
| $150,000 or more | 3,221 (21.4%) | 289 (3.3%) |
| Total | 15,077 (100.0%) | 8,847 (100.0%) |
Monthly Housing Cost Tiers in Idaho Falls
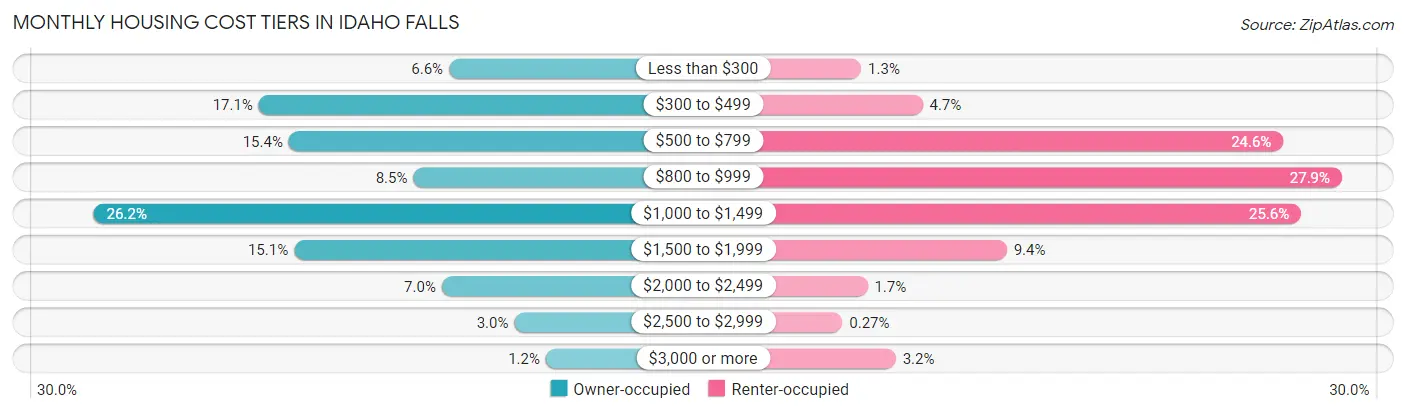
| Monthly Cost | Owner-occupied | Renter-occupied |
| Less than $300 | 989 (6.6%) | 116 (1.3%) |
| $300 to $499 | 2,574 (17.1%) | 416 (4.7%) |
| $500 to $799 | 2,323 (15.4%) | 2,178 (24.6%) |
| $800 to $999 | 1,286 (8.5%) | 2,465 (27.9%) |
| $1,000 to $1,499 | 3,949 (26.2%) | 2,266 (25.6%) |
| $1,500 to $1,999 | 2,279 (15.1%) | 827 (9.3%) |
| $2,000 to $2,499 | 1,049 (7.0%) | 147 (1.7%) |
| $2,500 to $2,999 | 445 (2.9%) | 24 (0.3%) |
| $3,000 or more | 183 (1.2%) | 285 (3.2%) |
| Total | 15,077 (100.0%) | 8,847 (100.0%) |
Physical Housing Characteristics in Idaho Falls
Housing Structures in Idaho Falls
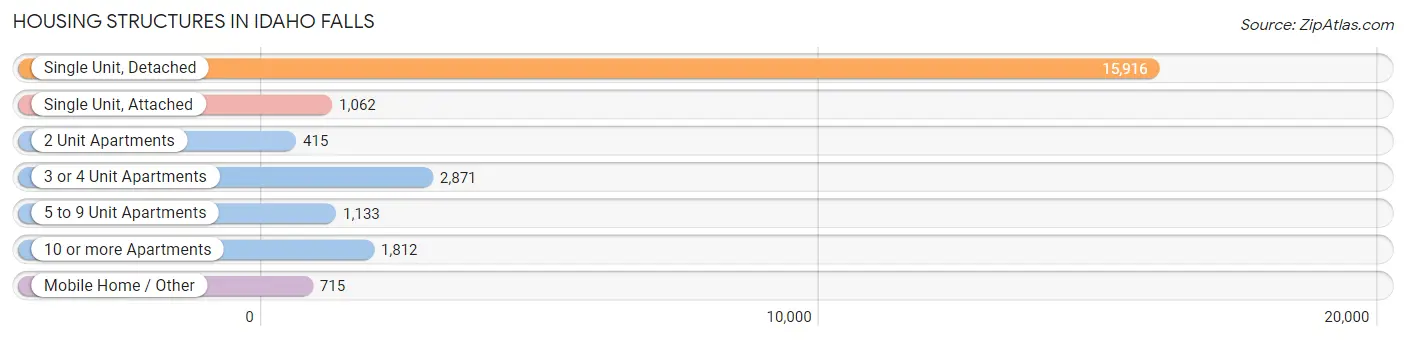
| Structure Type | # Housing Units | % Housing Units |
| Single Unit, Detached | 15,916 | 66.5% |
| Single Unit, Attached | 1,062 | 4.4% |
| 2 Unit Apartments | 415 | 1.7% |
| 3 or 4 Unit Apartments | 2,871 | 12.0% |
| 5 to 9 Unit Apartments | 1,133 | 4.7% |
| 10 or more Apartments | 1,812 | 7.6% |
| Mobile Home / Other | 715 | 3.0% |
| Total | 23,924 | 100.0% |
Housing Structures by Occupancy in Idaho Falls
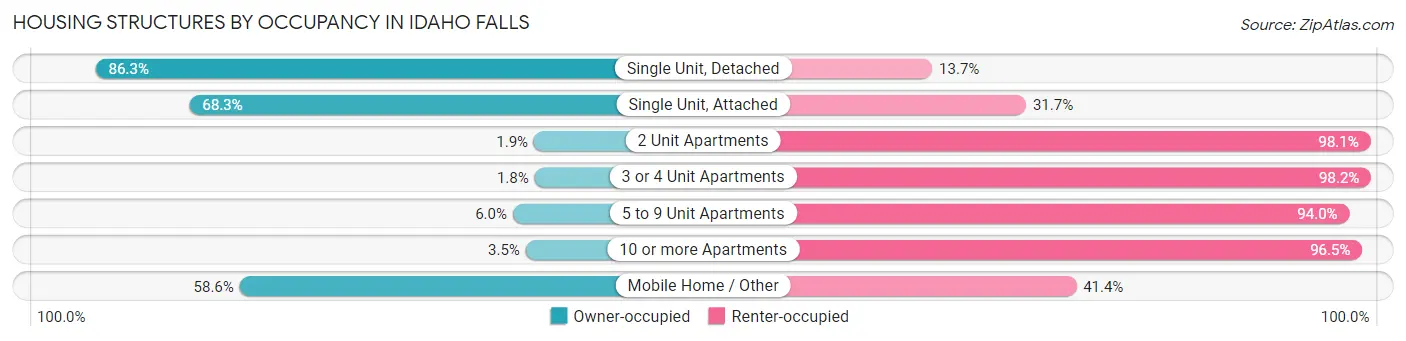
| Structure Type | Owner-occupied | Renter-occupied |
| Single Unit, Detached | 13,741 (86.3%) | 2,175 (13.7%) |
| Single Unit, Attached | 725 (68.3%) | 337 (31.7%) |
| 2 Unit Apartments | 8 (1.9%) | 407 (98.1%) |
| 3 or 4 Unit Apartments | 52 (1.8%) | 2,819 (98.2%) |
| 5 to 9 Unit Apartments | 68 (6.0%) | 1,065 (94.0%) |
| 10 or more Apartments | 64 (3.5%) | 1,748 (96.5%) |
| Mobile Home / Other | 419 (58.6%) | 296 (41.4%) |
| Total | 15,077 (63.0%) | 8,847 (37.0%) |
Housing Structures by Number of Rooms in Idaho Falls
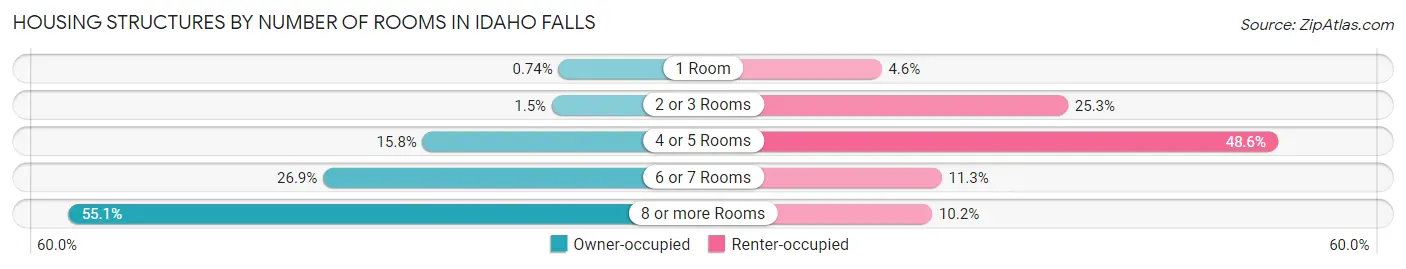
| Number of Rooms | Owner-occupied | Renter-occupied |
| 1 Room | 111 (0.7%) | 408 (4.6%) |
| 2 or 3 Rooms | 223 (1.5%) | 2,238 (25.3%) |
| 4 or 5 Rooms | 2,385 (15.8%) | 4,299 (48.6%) |
| 6 or 7 Rooms | 4,051 (26.9%) | 998 (11.3%) |
| 8 or more Rooms | 8,307 (55.1%) | 904 (10.2%) |
| Total | 15,077 (100.0%) | 8,847 (100.0%) |
Housing Structure by Heating Type in Idaho Falls
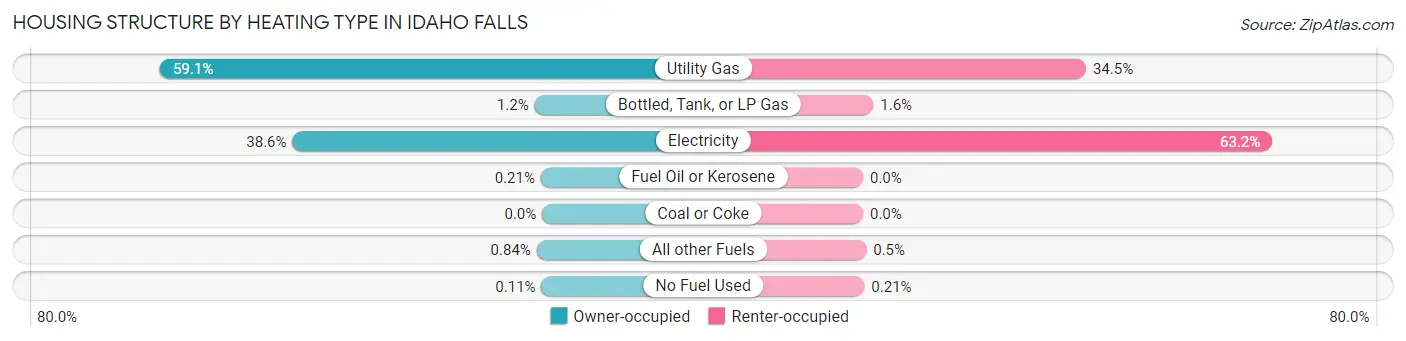
| Heating Type | Owner-occupied | Renter-occupied |
| Utility Gas | 8,906 (59.1%) | 3,049 (34.5%) |
| Bottled, Tank, or LP Gas | 177 (1.2%) | 141 (1.6%) |
| Electricity | 5,821 (38.6%) | 5,594 (63.2%) |
| Fuel Oil or Kerosene | 31 (0.2%) | 0 (0.0%) |
| Coal or Coke | 0 (0.0%) | 0 (0.0%) |
| All other Fuels | 126 (0.8%) | 44 (0.5%) |
| No Fuel Used | 16 (0.1%) | 19 (0.2%) |
| Total | 15,077 (100.0%) | 8,847 (100.0%) |
Household Vehicle Usage in Idaho Falls
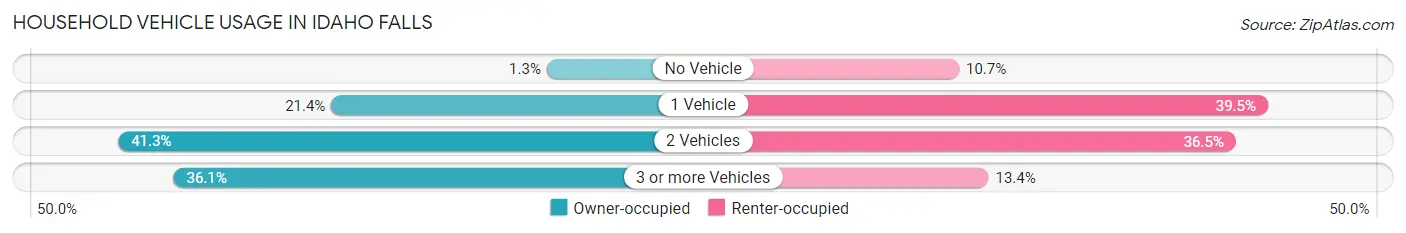
| Vehicles per Household | Owner-occupied | Renter-occupied |
| No Vehicle | 190 (1.3%) | 942 (10.6%) |
| 1 Vehicle | 3,224 (21.4%) | 3,492 (39.5%) |
| 2 Vehicles | 6,221 (41.3%) | 3,227 (36.5%) |
| 3 or more Vehicles | 5,442 (36.1%) | 1,186 (13.4%) |
| Total | 15,077 (100.0%) | 8,847 (100.0%) |
Real Estate & Mortgages in Idaho Falls
Real Estate and Mortgage Overview in Idaho Falls
| Characteristic | Without Mortgage | With Mortgage |
| Housing Units | 5,499 | 9,578 |
| Median Property Value | $258,200 | $271,700 |
| Median Household Income | $71,777 | $2,095 |
| Monthly Housing Costs | $440 | $183 |
| Real Estate Taxes | $1,808 | $179 |
Property Value by Mortgage Status in Idaho Falls
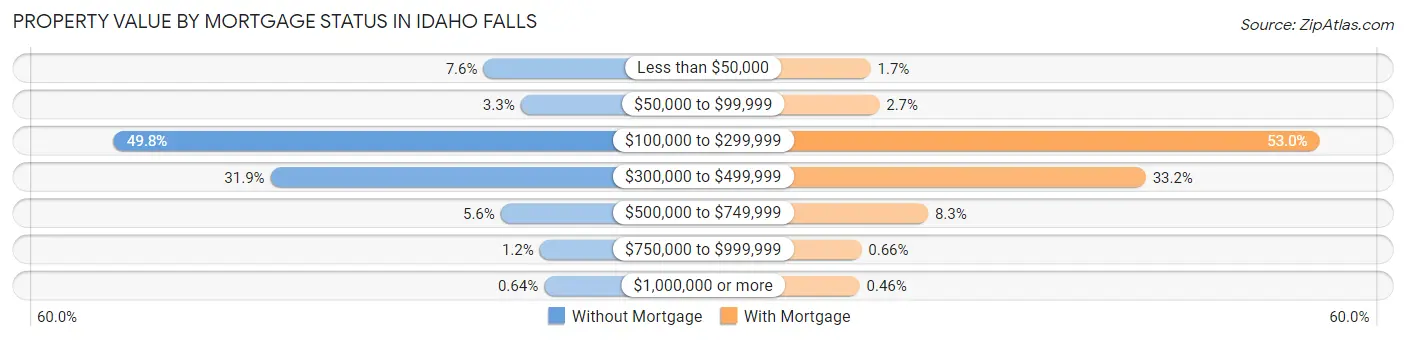
| Property Value | Without Mortgage | With Mortgage |
| Less than $50,000 | 417 (7.6%) | 165 (1.7%) |
| $50,000 to $99,999 | 183 (3.3%) | 260 (2.7%) |
| $100,000 to $299,999 | 2,738 (49.8%) | 5,077 (53.0%) |
| $300,000 to $499,999 | 1,755 (31.9%) | 3,176 (33.2%) |
| $500,000 to $749,999 | 308 (5.6%) | 793 (8.3%) |
| $750,000 to $999,999 | 63 (1.1%) | 63 (0.7%) |
| $1,000,000 or more | 35 (0.6%) | 44 (0.5%) |
| Total | 5,499 (100.0%) | 9,578 (100.0%) |
Household Income by Mortgage Status in Idaho Falls
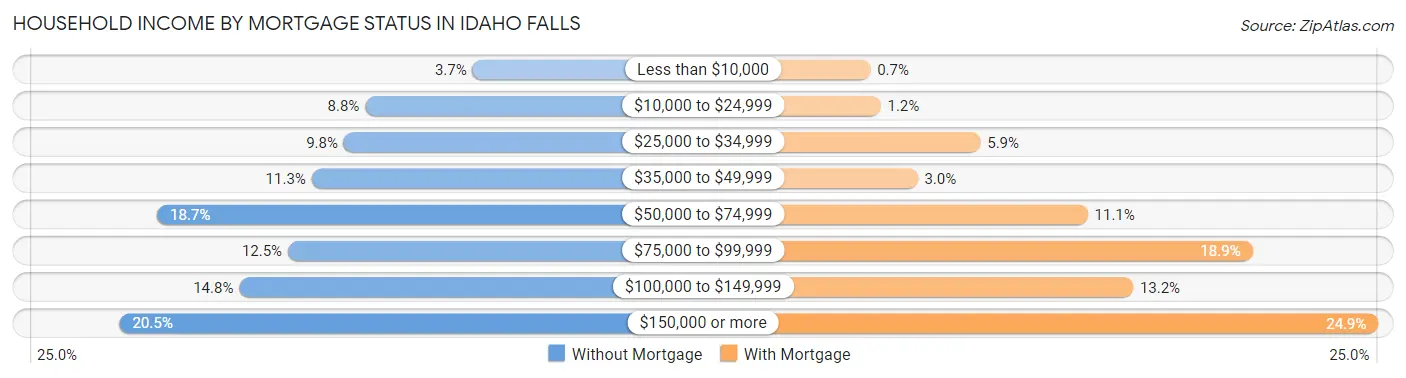
| Household Income | Without Mortgage | With Mortgage |
| Less than $10,000 | 202 (3.7%) | 67 (0.7%) |
| $10,000 to $24,999 | 483 (8.8%) | 114 (1.2%) |
| $25,000 to $34,999 | 539 (9.8%) | 569 (5.9%) |
| $35,000 to $49,999 | 623 (11.3%) | 283 (2.9%) |
| $50,000 to $74,999 | 1,028 (18.7%) | 1,058 (11.1%) |
| $75,000 to $99,999 | 685 (12.5%) | 1,810 (18.9%) |
| $100,000 to $149,999 | 813 (14.8%) | 1,265 (13.2%) |
| $150,000 or more | 1,126 (20.5%) | 2,384 (24.9%) |
| Total | 5,499 (100.0%) | 9,578 (100.0%) |
Property Value to Household Income Ratio in Idaho Falls
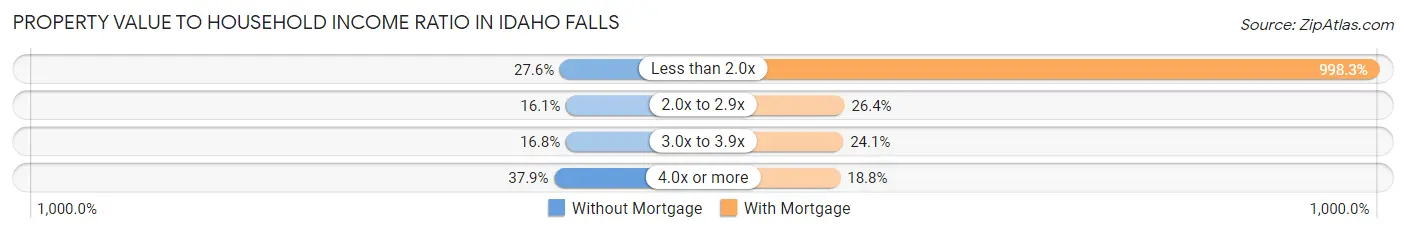
| Value-to-Income Ratio | Without Mortgage | With Mortgage |
| Less than 2.0x | 1,515 (27.6%) | 95,619 (998.3%) |
| 2.0x to 2.9x | 887 (16.1%) | 2,530 (26.4%) |
| 3.0x to 3.9x | 923 (16.8%) | 2,309 (24.1%) |
| 4.0x or more | 2,084 (37.9%) | 1,801 (18.8%) |
| Total | 5,499 (100.0%) | 9,578 (100.0%) |
Real Estate Taxes by Mortgage Status in Idaho Falls
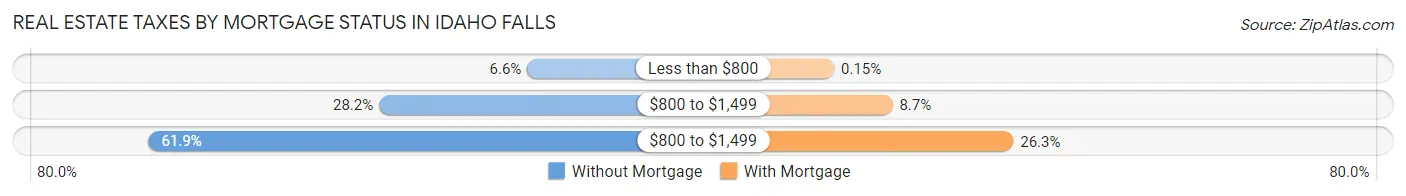
| Property Taxes | Without Mortgage | With Mortgage |
| Less than $800 | 361 (6.6%) | 14 (0.2%) |
| $800 to $1,499 | 1,551 (28.2%) | 831 (8.7%) |
| $800 to $1,499 | 3,404 (61.9%) | 2,523 (26.3%) |
| Total | 5,499 (100.0%) | 9,578 (100.0%) |
Health & Disability in Idaho Falls
Health Insurance Coverage by Age in Idaho Falls
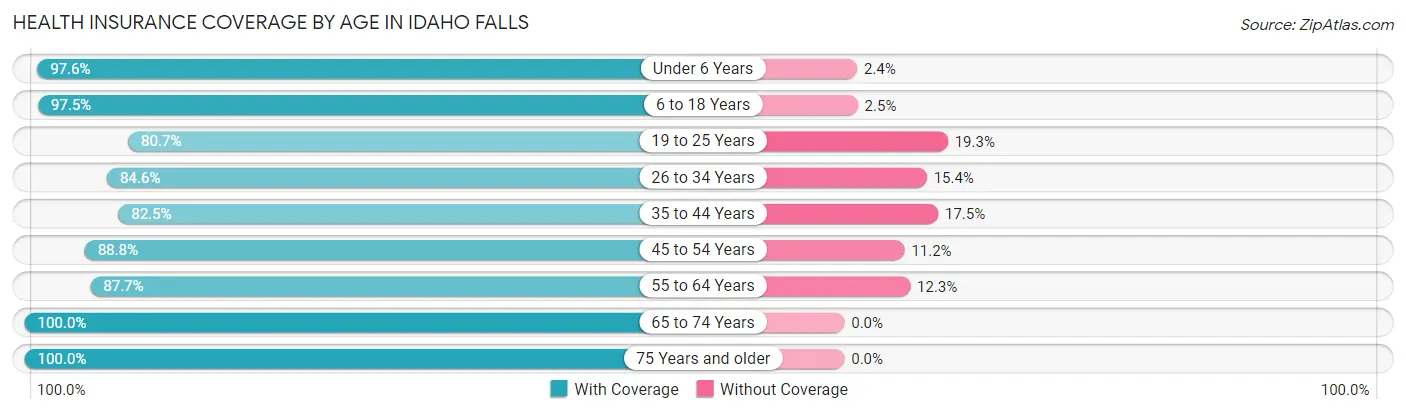
| Age Bracket | With Coverage | Without Coverage |
| Under 6 Years | 5,424 (97.6%) | 131 (2.4%) |
| 6 to 18 Years | 12,881 (97.5%) | 329 (2.5%) |
| 19 to 25 Years | 4,980 (80.7%) | 1,190 (19.3%) |
| 26 to 34 Years | 7,097 (84.6%) | 1,289 (15.4%) |
| 35 to 44 Years | 7,231 (82.5%) | 1,532 (17.5%) |
| 45 to 54 Years | 5,754 (88.8%) | 727 (11.2%) |
| 55 to 64 Years | 6,200 (87.7%) | 867 (12.3%) |
| 65 to 74 Years | 4,811 (100.0%) | 0 (0.0%) |
| 75 Years and older | 4,011 (100.0%) | 0 (0.0%) |
| Total | 58,389 (90.6%) | 6,065 (9.4%) |
Health Insurance Coverage by Citizenship Status in Idaho Falls
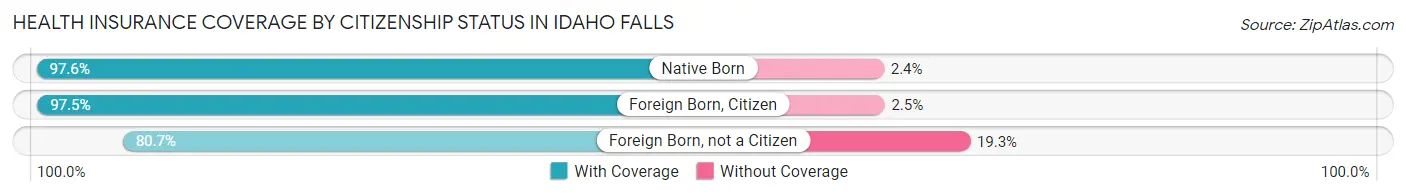
| Citizenship Status | With Coverage | Without Coverage |
| Native Born | 5,424 (97.6%) | 131 (2.4%) |
| Foreign Born, Citizen | 12,881 (97.5%) | 329 (2.5%) |
| Foreign Born, not a Citizen | 4,980 (80.7%) | 1,190 (19.3%) |
Health Insurance Coverage by Household Income in Idaho Falls
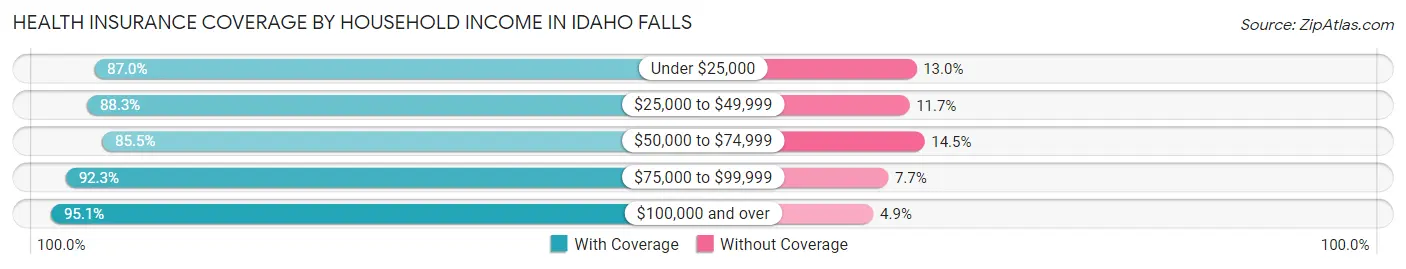
| Household Income | With Coverage | Without Coverage |
| Under $25,000 | 5,136 (87.0%) | 768 (13.0%) |
| $25,000 to $49,999 | 10,942 (88.3%) | 1,449 (11.7%) |
| $50,000 to $74,999 | 11,064 (85.5%) | 1,880 (14.5%) |
| $75,000 to $99,999 | 7,819 (92.3%) | 653 (7.7%) |
| $100,000 and over | 23,299 (95.1%) | 1,211 (4.9%) |
Public vs Private Health Insurance Coverage by Age in Idaho Falls
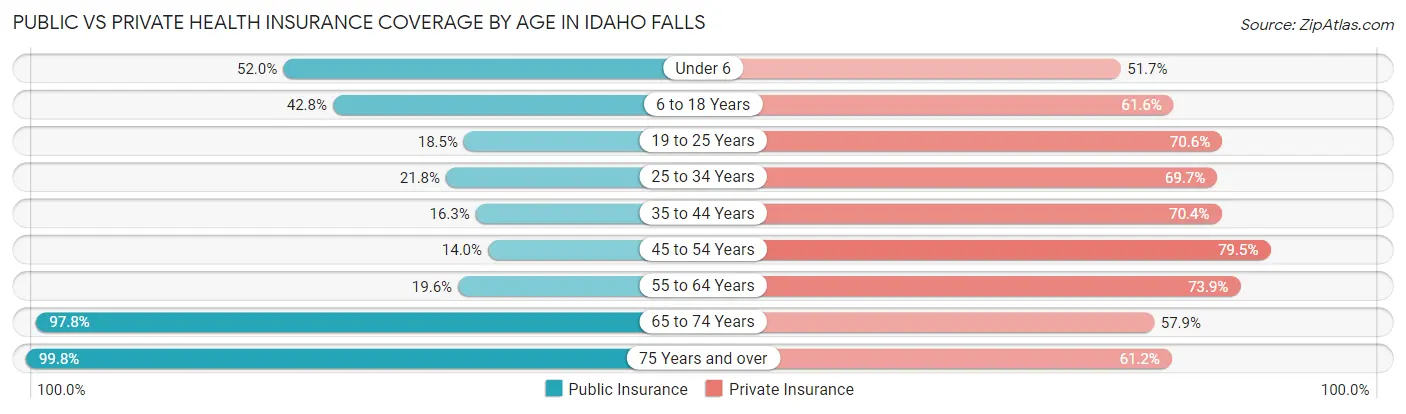
| Age Bracket | Public Insurance | Private Insurance |
| Under 6 | 2,890 (52.0%) | 2,872 (51.7%) |
| 6 to 18 Years | 5,653 (42.8%) | 8,136 (61.6%) |
| 19 to 25 Years | 1,140 (18.5%) | 4,355 (70.6%) |
| 25 to 34 Years | 1,829 (21.8%) | 5,842 (69.7%) |
| 35 to 44 Years | 1,428 (16.3%) | 6,172 (70.4%) |
| 45 to 54 Years | 908 (14.0%) | 5,154 (79.5%) |
| 55 to 64 Years | 1,383 (19.6%) | 5,225 (73.9%) |
| 65 to 74 Years | 4,705 (97.8%) | 2,786 (57.9%) |
| 75 Years and over | 4,001 (99.8%) | 2,456 (61.2%) |
| Total | 23,937 (37.1%) | 42,998 (66.7%) |
Disability Status by Sex by Age in Idaho Falls
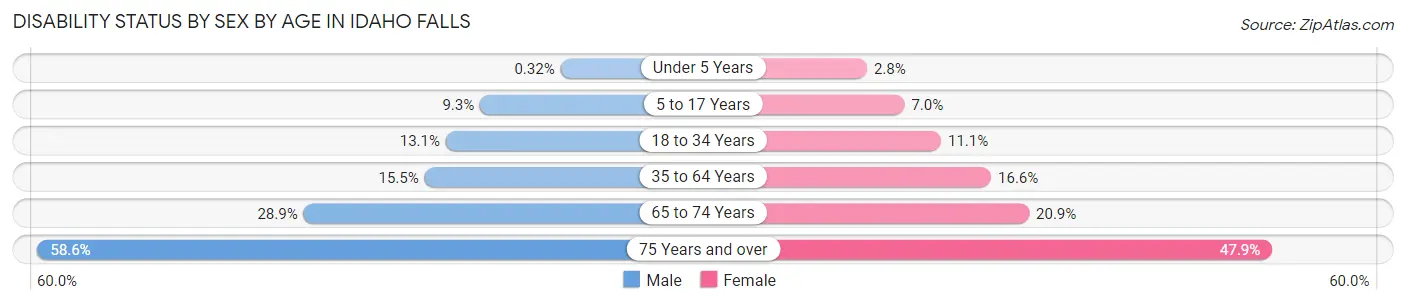
| Age Bracket | Male | Female |
| Under 5 Years | 7 (0.3%) | 63 (2.8%) |
| 5 to 17 Years | 646 (9.3%) | 462 (7.0%) |
| 18 to 34 Years | 982 (13.1%) | 862 (11.1%) |
| 35 to 64 Years | 1,768 (15.5%) | 1,808 (16.6%) |
| 65 to 74 Years | 643 (28.9%) | 540 (20.9%) |
| 75 Years and over | 967 (58.6%) | 1,131 (47.9%) |
Disability Class by Sex by Age in Idaho Falls
Disability Class: Hearing Difficulty
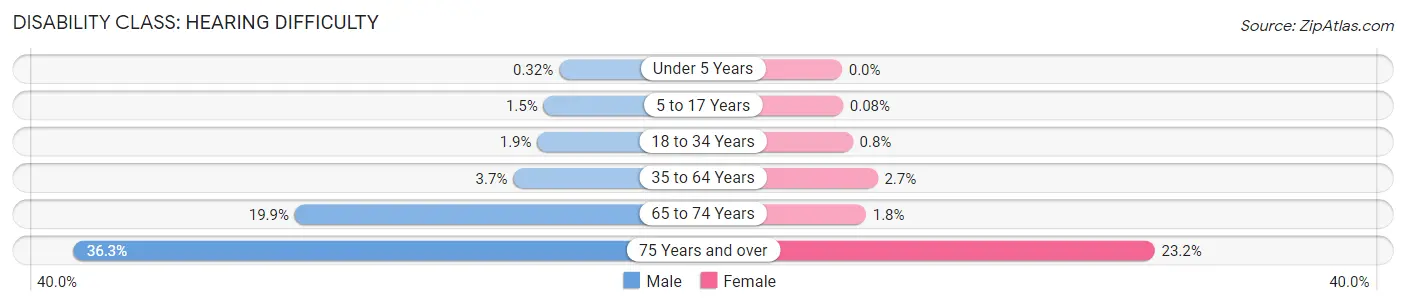
| Age Bracket | Male | Female |
| Under 5 Years | 7 (0.3%) | 0 (0.0%) |
| 5 to 17 Years | 102 (1.5%) | 5 (0.1%) |
| 18 to 34 Years | 145 (1.9%) | 62 (0.8%) |
| 35 to 64 Years | 426 (3.7%) | 288 (2.6%) |
| 65 to 74 Years | 443 (19.9%) | 46 (1.8%) |
| 75 Years and over | 600 (36.3%) | 548 (23.2%) |
Disability Class: Vision Difficulty
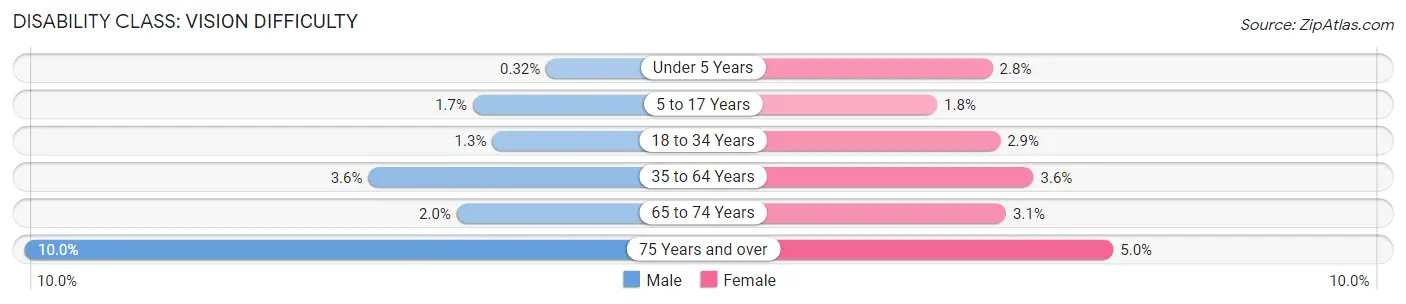
| Age Bracket | Male | Female |
| Under 5 Years | 7 (0.3%) | 63 (2.8%) |
| 5 to 17 Years | 117 (1.7%) | 117 (1.8%) |
| 18 to 34 Years | 99 (1.3%) | 229 (2.9%) |
| 35 to 64 Years | 414 (3.6%) | 387 (3.6%) |
| 65 to 74 Years | 44 (2.0%) | 79 (3.0%) |
| 75 Years and over | 165 (10.0%) | 119 (5.0%) |
Disability Class: Cognitive Difficulty
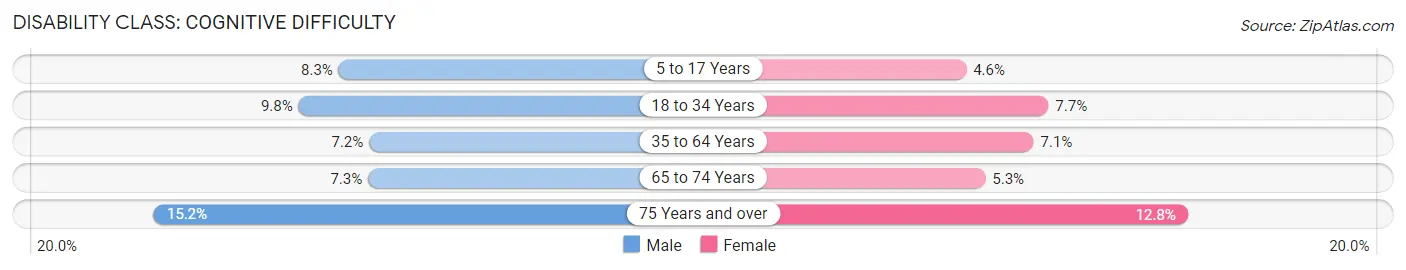
| Age Bracket | Male | Female |
| 5 to 17 Years | 580 (8.3%) | 306 (4.6%) |
| 18 to 34 Years | 737 (9.8%) | 598 (7.7%) |
| 35 to 64 Years | 825 (7.2%) | 774 (7.1%) |
| 65 to 74 Years | 161 (7.2%) | 138 (5.3%) |
| 75 Years and over | 251 (15.2%) | 303 (12.8%) |
Disability Class: Ambulatory Difficulty
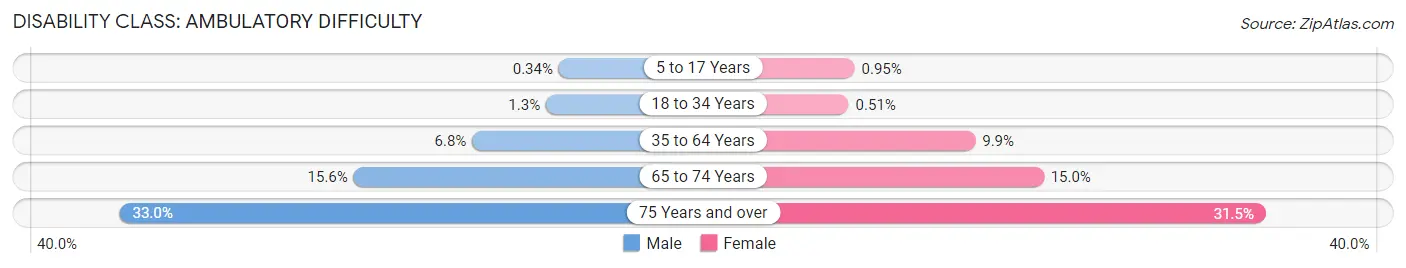
| Age Bracket | Male | Female |
| 5 to 17 Years | 24 (0.3%) | 63 (0.9%) |
| 18 to 34 Years | 97 (1.3%) | 40 (0.5%) |
| 35 to 64 Years | 774 (6.8%) | 1,078 (9.9%) |
| 65 to 74 Years | 346 (15.6%) | 388 (15.0%) |
| 75 Years and over | 544 (33.0%) | 743 (31.5%) |
Disability Class: Self-Care Difficulty
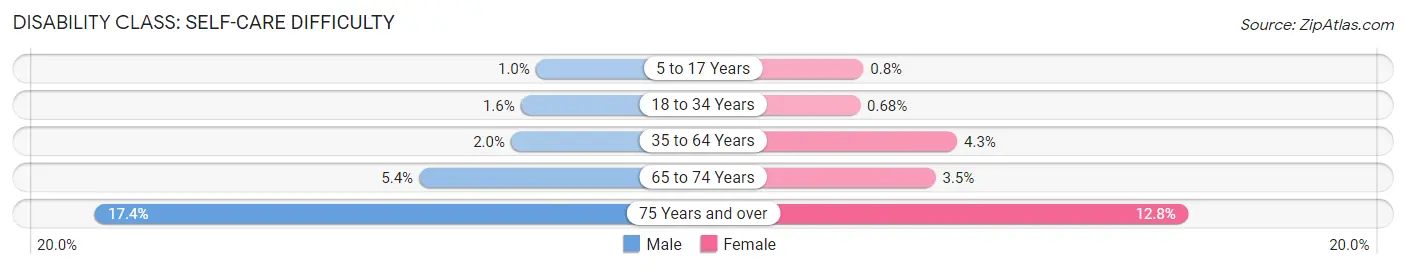
| Age Bracket | Male | Female |
| 5 to 17 Years | 72 (1.0%) | 53 (0.8%) |
| 18 to 34 Years | 119 (1.6%) | 53 (0.7%) |
| 35 to 64 Years | 223 (1.9%) | 465 (4.3%) |
| 65 to 74 Years | 119 (5.4%) | 90 (3.5%) |
| 75 Years and over | 287 (17.4%) | 303 (12.8%) |
Technology Access in Idaho Falls
Computing Device Access in Idaho Falls
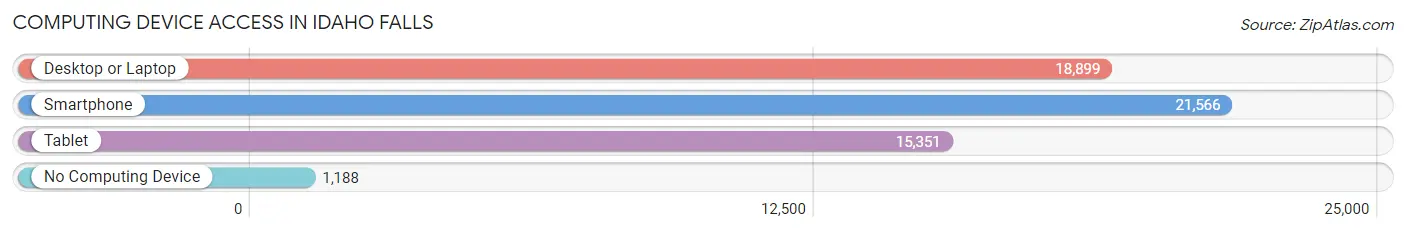
| Device Type | # Households | % Households |
| Desktop or Laptop | 18,899 | 79.0% |
| Smartphone | 21,566 | 90.1% |
| Tablet | 15,351 | 64.2% |
| No Computing Device | 1,188 | 5.0% |
| Total | 23,924 | 100.0% |
Internet Access in Idaho Falls
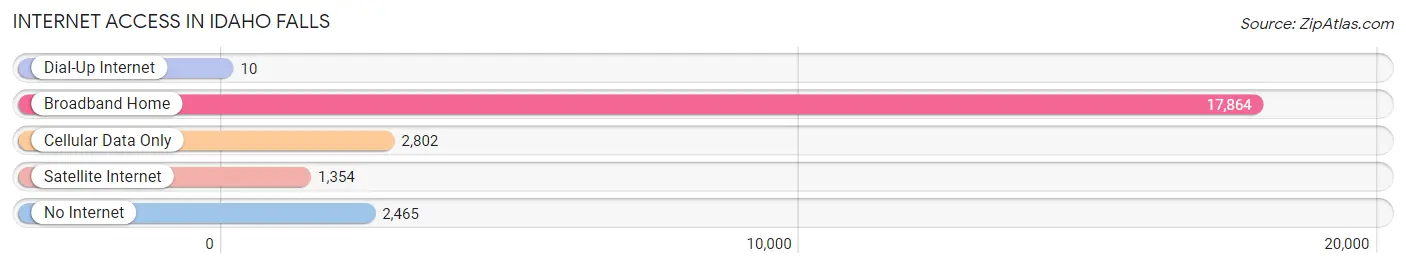
| Internet Type | # Households | % Households |
| Dial-Up Internet | 10 | 0.0% |
| Broadband Home | 17,864 | 74.7% |
| Cellular Data Only | 2,802 | 11.7% |
| Satellite Internet | 1,354 | 5.7% |
| No Internet | 2,465 | 10.3% |
| Total | 23,924 | 100.0% |
Idaho Falls Summary
Idaho Falls is a city located in the southeastern part of the state of Idaho. It is the county seat of Bonneville County and the largest city in the eastern part of the state. The city is situated along the Snake River and is the largest city in the Snake River Plain region. Idaho Falls is the principal city of the Idaho Falls Metropolitan Statistical Area, which includes all of Bonneville County. The population of Idaho Falls was 56,813 at the 2010 census, making it the state's sixth largest city.
History
The area around Idaho Falls was first inhabited by Native American tribes, including the Shoshone, Bannock, and Nez Perce. The first European settlers arrived in the area in the early 1800s, and the city was officially founded in 1864. The city was originally named Eagle Rock, but was later changed to Idaho Falls in 1891.
The city grew rapidly in the early 20th century, and by the 1950s it had become a major industrial center. The city was also home to the Idaho National Laboratory, which was established in 1949 and is now the largest employer in the city.
Geography
Idaho Falls is located in the southeastern part of the state of Idaho, in the Snake River Plain region. The city is situated along the Snake River, and is surrounded by mountains and hills. The city has a total area of 28.2 square miles, of which 28.1 square miles is land and 0.1 square miles is water.
Climate
Idaho Falls has a semi-arid climate, with hot summers and cold winters. The average annual temperature is 44.3°F, with an average high of 68.2°F in July and an average low of 20.2°F in January. The average annual precipitation is 11.2 inches, with an average of 1.7 inches of snowfall per year.
Economy
Idaho Falls is a major economic center in the region, with a diverse economy that includes manufacturing, healthcare, retail, and tourism. The city is home to the Idaho National Laboratory, which is the largest employer in the city. Other major employers include Eastern Idaho Regional Medical Center, Melaleuca, and the Idaho Falls School District.
The city also has a thriving tourism industry, with attractions such as the Idaho Falls Zoo, the Museum of Idaho, and the Idaho Falls River Walk.
Demographics
As of the 2010 census, the population of Idaho Falls was 56,813. The racial makeup of the city was 90.2% White, 0.7% African American, 0.7% Native American, 1.3% Asian, 0.2% Pacific Islander, 4.3% from other races, and 2.4% from two or more races. Hispanic or Latino of any race were 8.2% of the population.
The median income for a household in the city was $41,919, and the median income for a family was $50,919. The per capita income for the city was $21,845. About 11.2% of families and 14.3% of the population were below the poverty line, including 19.2% of those under age 18 and 8.2% of those age 65 or over.
Common Questions
What is Per Capita Income in Idaho Falls?
Per Capita income in Idaho Falls is $32,548.
What is the Median Family Income in Idaho Falls?
Median Family Income in Idaho Falls is $80,164.
What is the Median Household income in Idaho Falls?
Median Household Income in Idaho Falls is $66,463.
What is Income or Wage Gap in Idaho Falls?
Income or Wage Gap in Idaho Falls is 35.3%.
Women in Idaho Falls earn 64.7 cents for every dollar earned by a man.
What is Family Income Deficit in Idaho Falls?
Family Income Deficit in Idaho Falls is $8,739.
Families that are below poverty line in Idaho Falls earn $8,739 less on average than the poverty threshold level.
What is Inequality or Gini Index in Idaho Falls?
Inequality or Gini Index in Idaho Falls is 0.44.
What is the Total Population of Idaho Falls?
Total Population of Idaho Falls is 65,685.
What is the Total Male Population of Idaho Falls?
Total Male Population of Idaho Falls is 32,666.
What is the Total Female Population of Idaho Falls?
Total Female Population of Idaho Falls is 33,019.
What is the Ratio of Males per 100 Females in Idaho Falls?
There are 98.93 Males per 100 Females in Idaho Falls.
What is the Ratio of Females per 100 Males in Idaho Falls?
There are 101.08 Females per 100 Males in Idaho Falls.
What is the Median Population Age in Idaho Falls?
Median Population Age in Idaho Falls is 33.9 Years.
What is the Average Family Size in Idaho Falls
Average Family Size in Idaho Falls is 3.4 People.
What is the Average Household Size in Idaho Falls
Average Household Size in Idaho Falls is 2.7 People.
How Large is the Labor Force in Idaho Falls?
There are 32,015 People in the Labor Forcein in Idaho Falls.
What is the Percentage of People in the Labor Force in Idaho Falls?
64.9% of People are in the Labor Force in Idaho Falls.
What is the Unemployment Rate in Idaho Falls?
Unemployment Rate in Idaho Falls is 4.8%.