Gypsum, CO Map & Demographics
Gypsum Map
Gypsum Overview
$39,207
PER CAPITA INCOME
$102,397
AVG FAMILY INCOME
$99,726
AVG HOUSEHOLD INCOME
44.9%
WAGE / INCOME GAP [ % ]
55.1¢/ $1
WAGE / INCOME GAP [ $ ]
0.43
INEQUALITY / GINI INDEX
8,291
TOTAL POPULATION
4,350
MALE POPULATION
3,941
FEMALE POPULATION
110.38
MALES / 100 FEMALES
90.60
FEMALES / 100 MALES
38.5
MEDIAN AGE
4.0
AVG FAMILY SIZE
3.5
AVG HOUSEHOLD SIZE
4,317
LABOR FORCE [ PEOPLE ]
66.6%
PERCENT IN LABOR FORCE
0.7%
UNEMPLOYMENT RATE
Gypsum Zip Codes
Gypsum Area Codes
Income in Gypsum
Income Overview in Gypsum
Per Capita Income in Gypsum is $39,207, while median incomes of families and households are $102,397 and $99,726 respectively.
| Characteristic | Number | Measure |
| Per Capita Income | 8,291 | $39,207 |
| Median Family Income | 1,828 | $102,397 |
| Mean Family Income | 1,828 | $136,666 |
| Median Household Income | 2,351 | $99,726 |
| Mean Household Income | 2,351 | $131,405 |
| Income Deficit | 1,828 | $0 |
| Wage / Income Gap (%) | 8,291 | 44.86% |
| Wage / Income Gap ($) | 8,291 | 55.14¢ per $1 |
| Gini / Inequality Index | 8,291 | 0.43 |
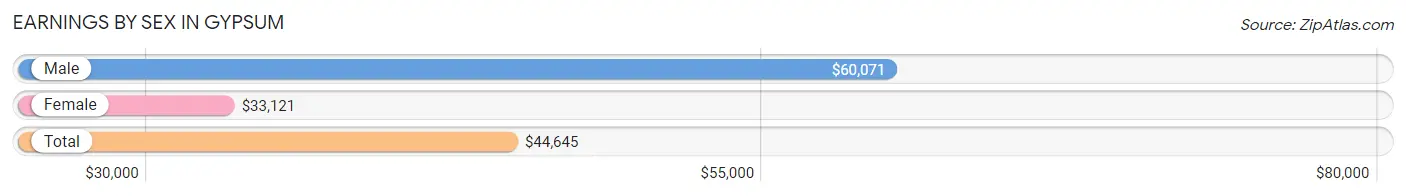
Earnings by Sex in Gypsum
Average Earnings in Gypsum are $44,645, $60,071 for men and $33,121 for women, a difference of 44.9%.
| Sex | Number | Average Earnings |
| Male | 2,538 (58.7%) | $60,071 |
| Female | 1,784 (41.3%) | $33,121 |
| Total | 4,322 (100.0%) | $44,645 |
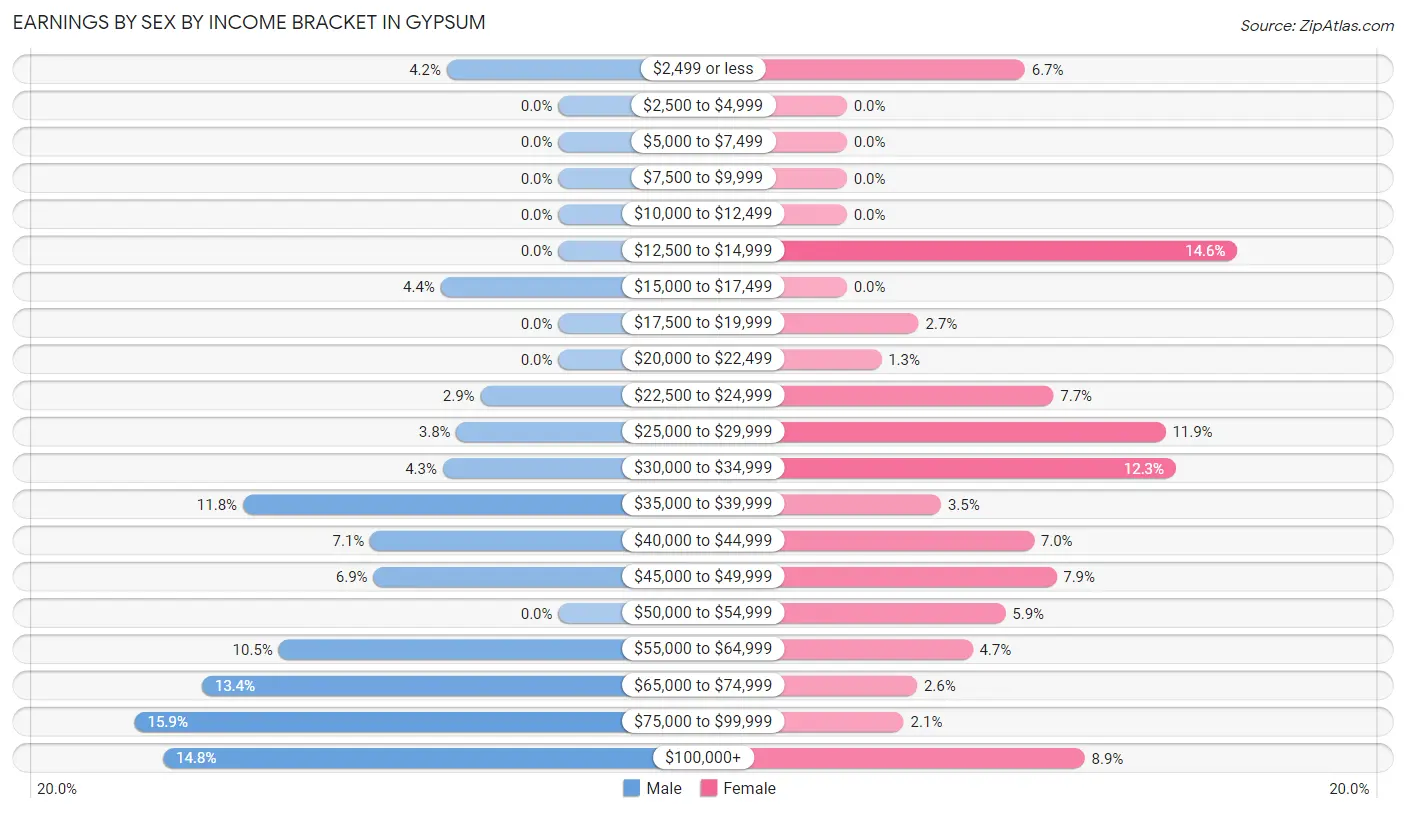
Earnings by Sex by Income Bracket in Gypsum
The most common earnings brackets in Gypsum are $75,000 to $99,999 for men (403 | 15.9%) and $12,500 to $14,999 for women (261 | 14.6%).
| Income | Male | Female |
| $2,499 or less | 106 (4.2%) | 119 (6.7%) |
| $2,500 to $4,999 | 0 (0.0%) | 0 (0.0%) |
| $5,000 to $7,499 | 0 (0.0%) | 0 (0.0%) |
| $7,500 to $9,999 | 0 (0.0%) | 0 (0.0%) |
| $10,000 to $12,499 | 0 (0.0%) | 0 (0.0%) |
| $12,500 to $14,999 | 0 (0.0%) | 261 (14.6%) |
| $15,000 to $17,499 | 112 (4.4%) | 0 (0.0%) |
| $17,500 to $19,999 | 0 (0.0%) | 48 (2.7%) |
| $20,000 to $22,499 | 0 (0.0%) | 23 (1.3%) |
| $22,500 to $24,999 | 74 (2.9%) | 138 (7.7%) |
| $25,000 to $29,999 | 97 (3.8%) | 213 (11.9%) |
| $30,000 to $34,999 | 110 (4.3%) | 220 (12.3%) |
| $35,000 to $39,999 | 300 (11.8%) | 63 (3.5%) |
| $40,000 to $44,999 | 179 (7.0%) | 125 (7.0%) |
| $45,000 to $49,999 | 176 (6.9%) | 140 (7.9%) |
| $50,000 to $54,999 | 0 (0.0%) | 106 (5.9%) |
| $55,000 to $64,999 | 266 (10.5%) | 84 (4.7%) |
| $65,000 to $74,999 | 339 (13.4%) | 47 (2.6%) |
| $75,000 to $99,999 | 403 (15.9%) | 38 (2.1%) |
| $100,000+ | 376 (14.8%) | 159 (8.9%) |
| Total | 2,538 (100.0%) | 1,784 (100.0%) |
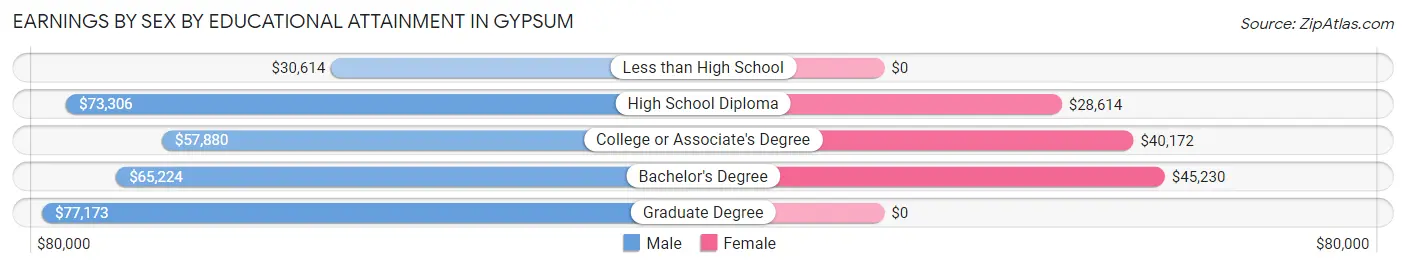
Earnings by Sex by Educational Attainment in Gypsum
Average earnings in Gypsum are $62,857 for men and $34,242 for women, a difference of 45.5%. Men with an educational attainment of graduate degree enjoy the highest average annual earnings of $77,173, while those with less than high school education earn the least with $30,614. Women with an educational attainment of bachelor's degree earn the most with the average annual earnings of $45,230, while those with high school diploma education have the smallest earnings of $28,614.
| Educational Attainment | Male Income | Female Income |
| Less than High School | $30,614 | $0 |
| High School Diploma | $73,306 | $28,614 |
| College or Associate's Degree | $57,880 | $40,172 |
| Bachelor's Degree | $65,224 | $45,230 |
| Graduate Degree | $77,173 | $0 |
| Total | $62,857 | $34,242 |
Family Income in Gypsum
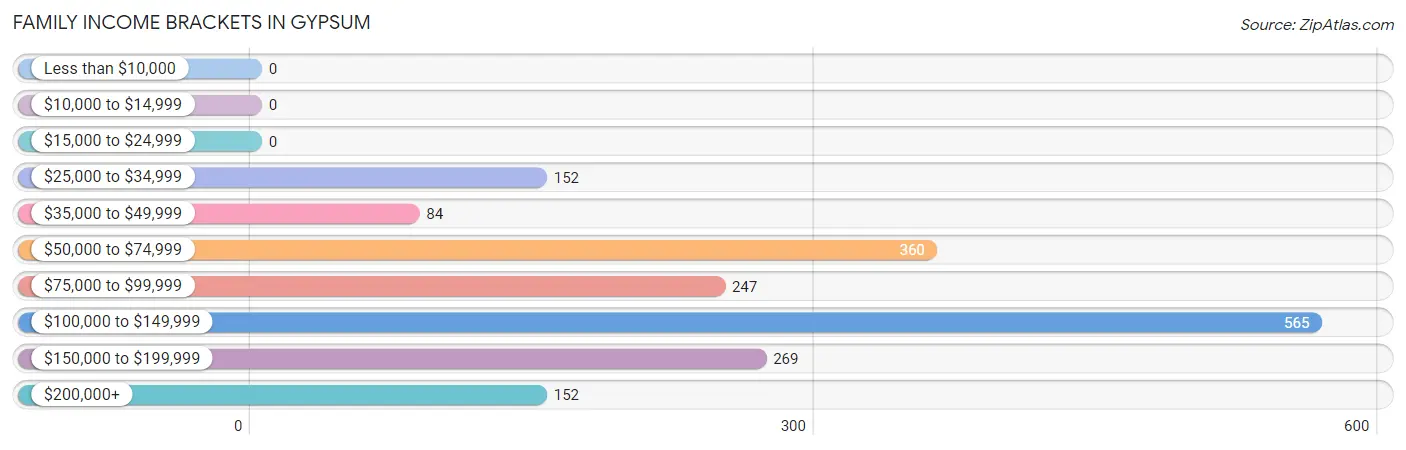
Family Income Brackets in Gypsum
According to the Gypsum family income data, there are 565 families falling into the $100,000 to $149,999 income range, which is the most common income bracket and makes up 30.9% of all families.
| Income Bracket | # Families | % Families |
| Less than $10,000 | 0 | 0.0% |
| $10,000 to $14,999 | 0 | 0.0% |
| $15,000 to $24,999 | 0 | 0.0% |
| $25,000 to $34,999 | 152 | 8.3% |
| $35,000 to $49,999 | 84 | 4.6% |
| $50,000 to $74,999 | 360 | 19.7% |
| $75,000 to $99,999 | 247 | 13.5% |
| $100,000 to $149,999 | 565 | 30.9% |
| $150,000 to $199,999 | 269 | 14.7% |
| $200,000+ | 152 | 8.3% |
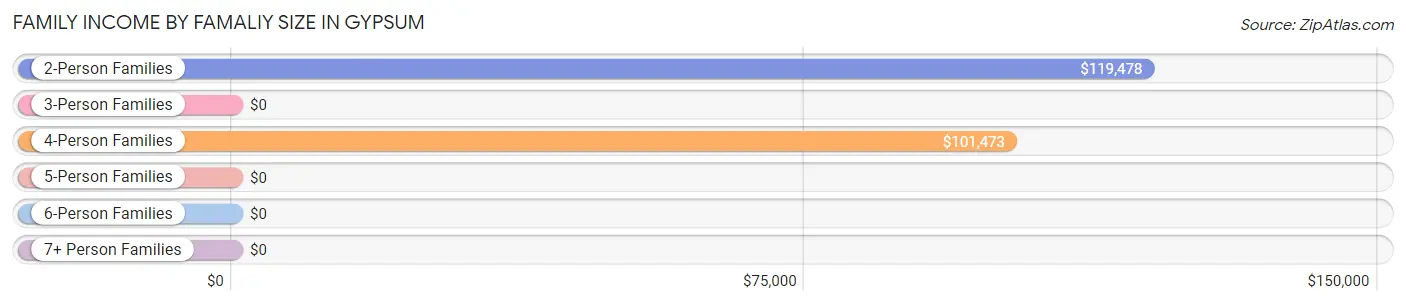
Family Income by Famaliy Size in Gypsum
2-person families (519 | 28.4%) account for the highest median family income in Gypsum with $119,478 per family, while 2-person families (519 | 28.4%) have the highest median income of $59,739 per family member.
| Income Bracket | # Families | Median Income |
| 2-Person Families | 519 (28.4%) | $119,478 |
| 3-Person Families | 491 (26.9%) | $0 |
| 4-Person Families | 510 (27.9%) | $101,473 |
| 5-Person Families | 84 (4.6%) | $0 |
| 6-Person Families | 78 (4.3%) | $0 |
| 7+ Person Families | 146 (8.0%) | $0 |
| Total | 1,828 (100.0%) | $102,397 |
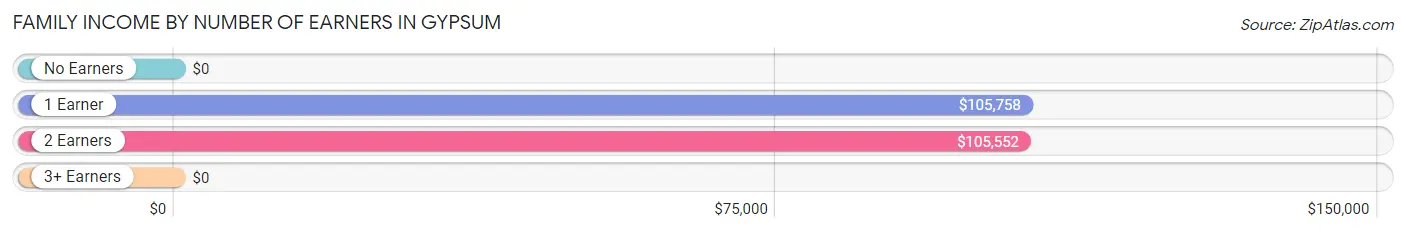
Family Income by Number of Earners in Gypsum
| Number of Earners | # Families | Median Income |
| No Earners | 163 (8.9%) | $0 |
| 1 Earner | 626 (34.3%) | $105,758 |
| 2 Earners | 877 (48.0%) | $105,552 |
| 3+ Earners | 162 (8.9%) | $0 |
| Total | 1,828 (100.0%) | $102,397 |
Household Income in Gypsum
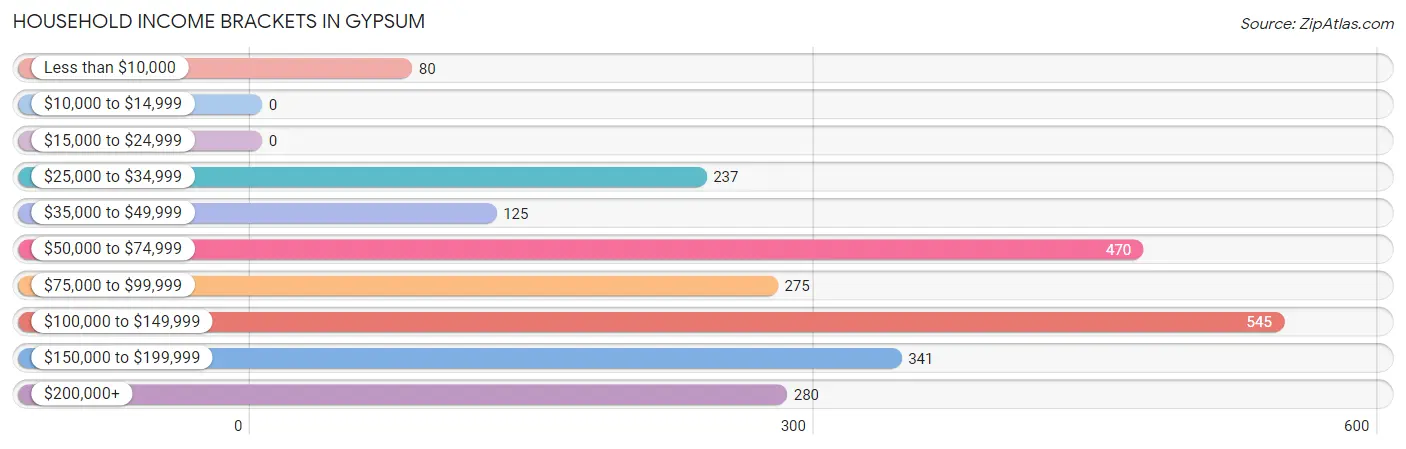
Household Income Brackets in Gypsum
With 545 households falling in the category, the $100,000 to $149,999 income range is the most frequent in Gypsum, accounting for 23.2% of all households.
| Income Bracket | # Households | % Households |
| Less than $10,000 | 80 | 3.4% |
| $10,000 to $14,999 | 0 | 0.0% |
| $15,000 to $24,999 | 0 | 0.0% |
| $25,000 to $34,999 | 237 | 10.1% |
| $35,000 to $49,999 | 125 | 5.3% |
| $50,000 to $74,999 | 470 | 20.0% |
| $75,000 to $99,999 | 275 | 11.7% |
| $100,000 to $149,999 | 545 | 23.2% |
| $150,000 to $199,999 | 341 | 14.5% |
| $200,000+ | 280 | 11.9% |
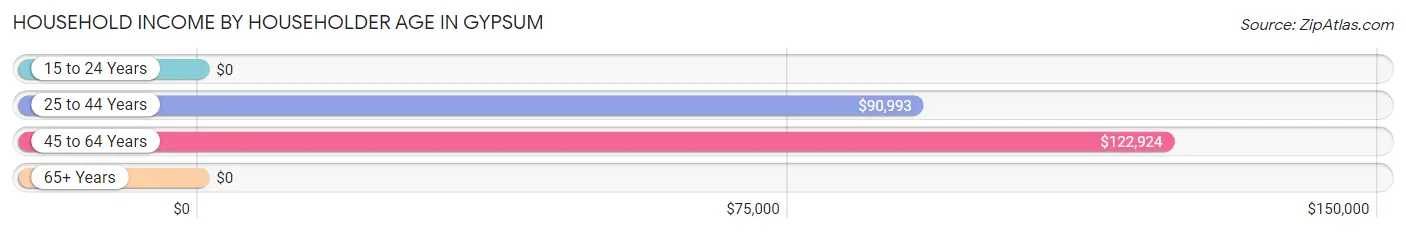
Household Income by Householder Age in Gypsum
The median household income in Gypsum is $99,726, with the highest median household income of $122,924 found in the 45 to 64 years age bracket for the primary householder. A total of 1,114 households (47.4%) fall into this category. Meanwhile, the 15 to 24 years age bracket for the primary householder has the lowest median household income of $0, with 50 households (2.1%) in this group.
| Income Bracket | # Households | Median Income |
| 15 to 24 Years | 50 (2.1%) | $0 |
| 25 to 44 Years | 865 (36.8%) | $90,993 |
| 45 to 64 Years | 1,114 (47.4%) | $122,924 |
| 65+ Years | 322 (13.7%) | $0 |
| Total | 2,351 (100.0%) | $99,726 |
Poverty in Gypsum
Income Below Poverty by Sex and Age in Gypsum
With 2.1% poverty level for males and 10.8% for females among the residents of Gypsum, under 5 year old males and 5 year old females are the most vulnerable to poverty, with 59 males (19.1%) and 69 females (100.0%) in their respective age groups living below the poverty level.
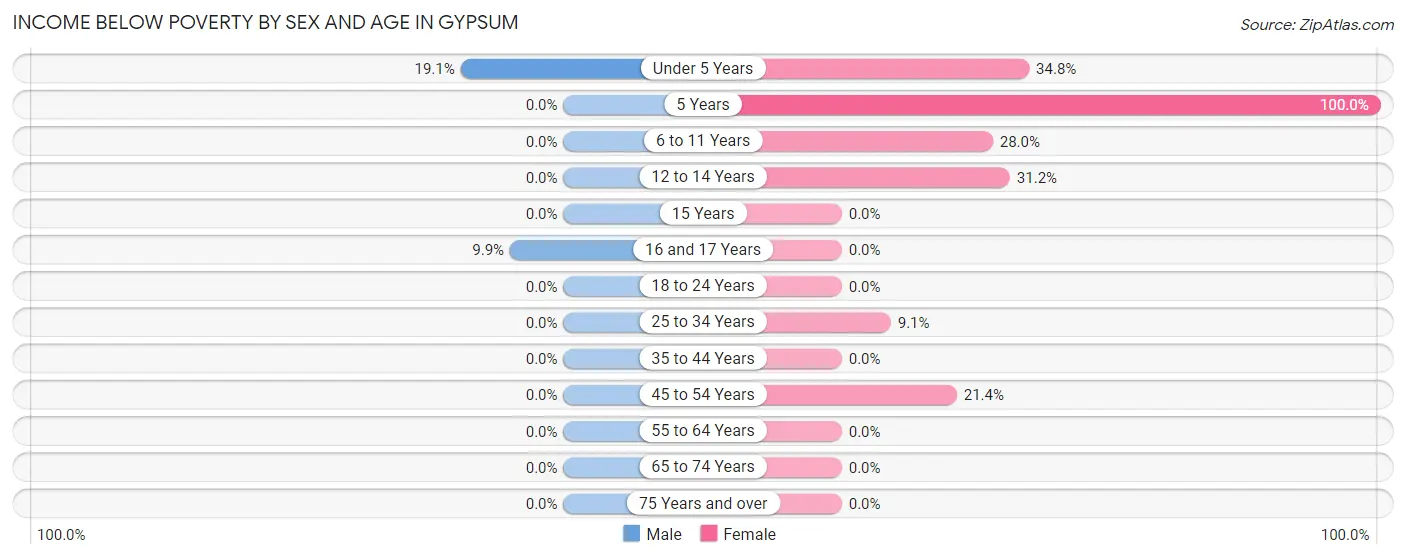
| Age Bracket | Male | Female |
| Under 5 Years | 59 (19.1%) | 64 (34.8%) |
| 5 Years | 0 (0.0%) | 69 (100.0%) |
| 6 to 11 Years | 0 (0.0%) | 44 (28.0%) |
| 12 to 14 Years | 0 (0.0%) | 83 (31.2%) |
| 15 Years | 0 (0.0%) | 0 (0.0%) |
| 16 and 17 Years | 32 (9.9%) | 0 (0.0%) |
| 18 to 24 Years | 0 (0.0%) | 0 (0.0%) |
| 25 to 34 Years | 0 (0.0%) | 31 (9.1%) |
| 35 to 44 Years | 0 (0.0%) | 0 (0.0%) |
| 45 to 54 Years | 0 (0.0%) | 136 (21.3%) |
| 55 to 64 Years | 0 (0.0%) | 0 (0.0%) |
| 65 to 74 Years | 0 (0.0%) | 0 (0.0%) |
| 75 Years and over | 0 (0.0%) | 0 (0.0%) |
| Total | 91 (2.1%) | 427 (10.8%) |
Income Above Poverty by Sex and Age in Gypsum
According to the poverty statistics in Gypsum, males aged 6 to 11 years and females aged 15 years are the age groups that are most secure financially, with 100.0% of males and 100.0% of females in these age groups living above the poverty line.
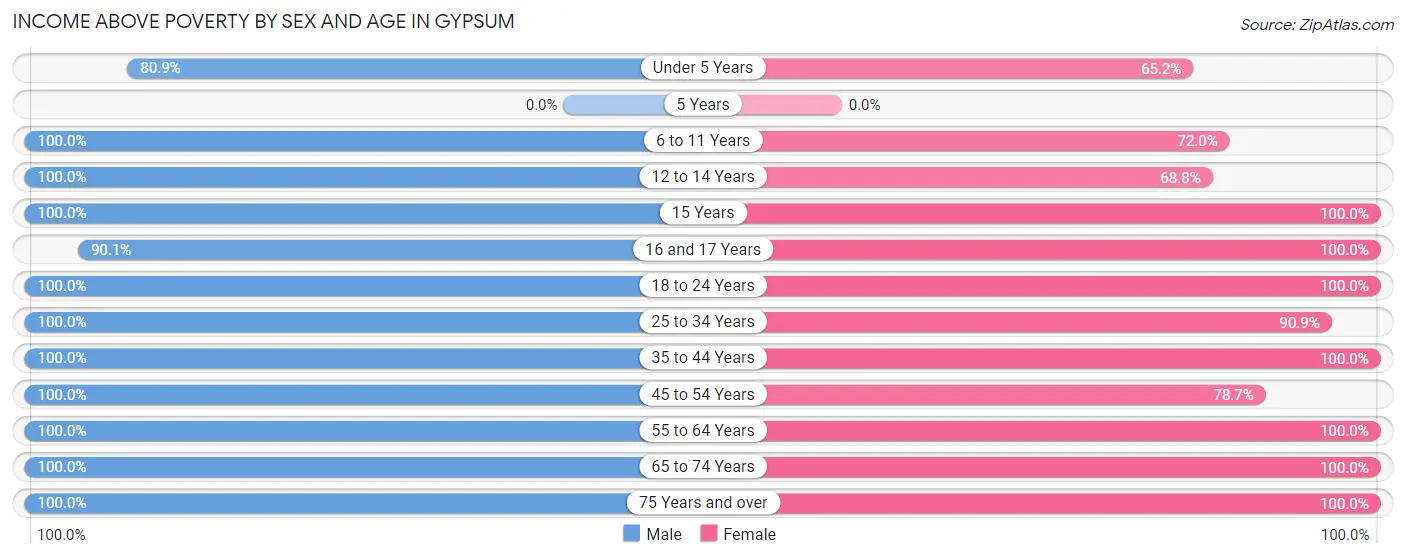
| Age Bracket | Male | Female |
| Under 5 Years | 250 (80.9%) | 120 (65.2%) |
| 5 Years | 0 (0.0%) | 0 (0.0%) |
| 6 to 11 Years | 564 (100.0%) | 113 (72.0%) |
| 12 to 14 Years | 124 (100.0%) | 183 (68.8%) |
| 15 Years | 93 (100.0%) | 43 (100.0%) |
| 16 and 17 Years | 291 (90.1%) | 193 (100.0%) |
| 18 to 24 Years | 218 (100.0%) | 303 (100.0%) |
| 25 to 34 Years | 437 (100.0%) | 310 (90.9%) |
| 35 to 44 Years | 665 (100.0%) | 599 (100.0%) |
| 45 to 54 Years | 635 (100.0%) | 501 (78.6%) |
| 55 to 64 Years | 434 (100.0%) | 310 (100.0%) |
| 65 to 74 Years | 356 (100.0%) | 362 (100.0%) |
| 75 Years and over | 192 (100.0%) | 477 (100.0%) |
| Total | 4,259 (97.9%) | 3,514 (89.2%) |
Income Below Poverty Among Married-Couple Families in Gypsum
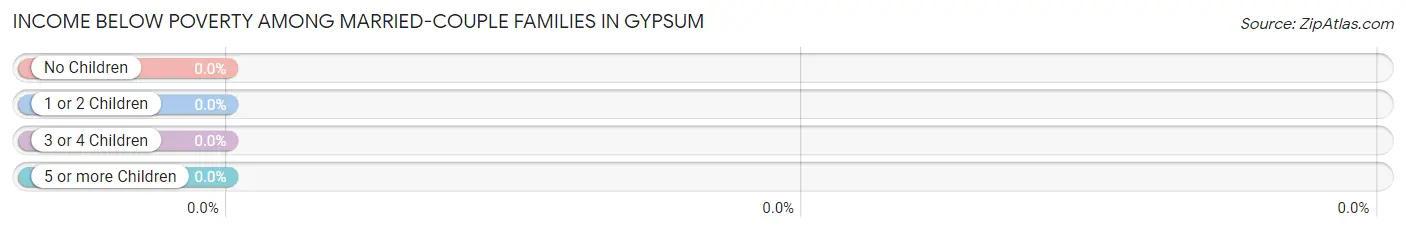
| Children | Above Poverty | Below Poverty |
| No Children | 616 (100.0%) | 0 (0.0%) |
| 1 or 2 Children | 673 (100.0%) | 0 (0.0%) |
| 3 or 4 Children | 253 (100.0%) | 0 (0.0%) |
| 5 or more Children | 0 (0.0%) | 0 (0.0%) |
| Total | 1,542 (100.0%) | 0 (0.0%) |
Income Below Poverty Among Single-Parent Households in Gypsum
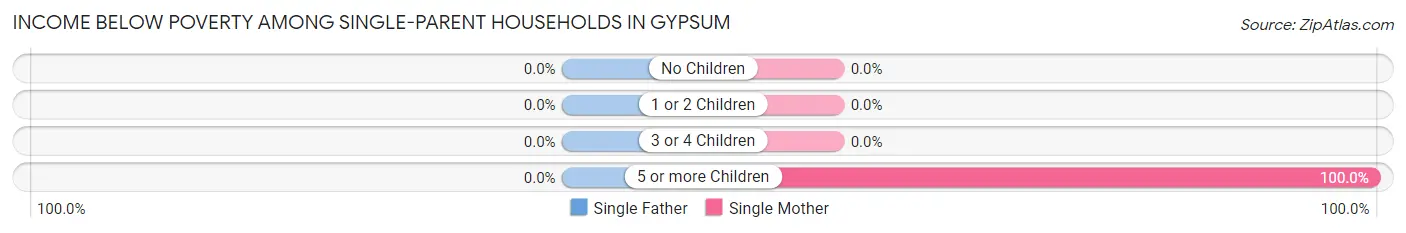
| Children | Single Father | Single Mother |
| No Children | 0 (0.0%) | 0 (0.0%) |
| 1 or 2 Children | 0 (0.0%) | 0 (0.0%) |
| 3 or 4 Children | 0 (0.0%) | 0 (0.0%) |
| 5 or more Children | 0 (0.0%) | 55 (100.0%) |
| Total | 0 (0.0%) | 55 (56.7%) |
Income Below Poverty Among Married-Couple vs Single-Parent Households in Gypsum
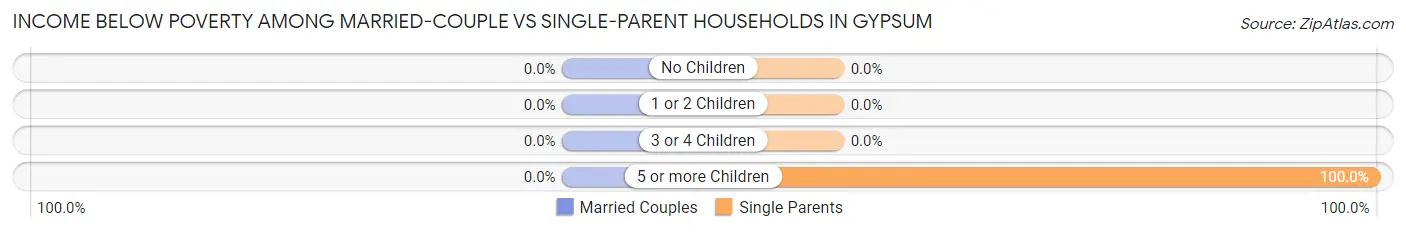
| Children | Married-Couple Families | Single-Parent Households |
| No Children | 0 (0.0%) | 0 (0.0%) |
| 1 or 2 Children | 0 (0.0%) | 0 (0.0%) |
| 3 or 4 Children | 0 (0.0%) | 0 (0.0%) |
| 5 or more Children | 0 (0.0%) | 55 (100.0%) |
| Total | 0 (0.0%) | 55 (19.2%) |
Race in Gypsum
The most populous races in Gypsum are White / Caucasian (5,633 | 67.9%), Hispanic or Latino (4,873 | 58.8%), and Two or more Races (2,176 | 26.3%).
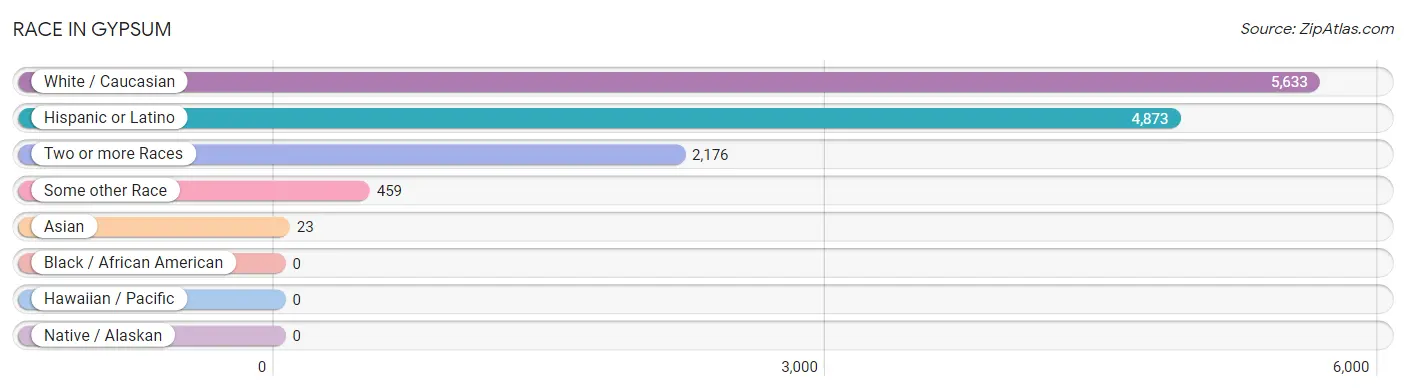
| Race | # Population | % Population |
| Asian | 23 | 0.3% |
| Black / African American | 0 | 0.0% |
| Hawaiian / Pacific | 0 | 0.0% |
| Hispanic or Latino | 4,873 | 58.8% |
| Native / Alaskan | 0 | 0.0% |
| White / Caucasian | 5,633 | 67.9% |
| Two or more Races | 2,176 | 26.3% |
| Some other Race | 459 | 5.5% |
| Total | 8,291 | 100.0% |
Ancestry in Gypsum
The most populous ancestries reported in Gypsum are Mexican (4,363 | 52.6%), Spaniard (426 | 5.1%), German (396 | 4.8%), Scottish (324 | 3.9%), and European (159 | 1.9%), together accounting for 68.4% of all Gypsum residents.
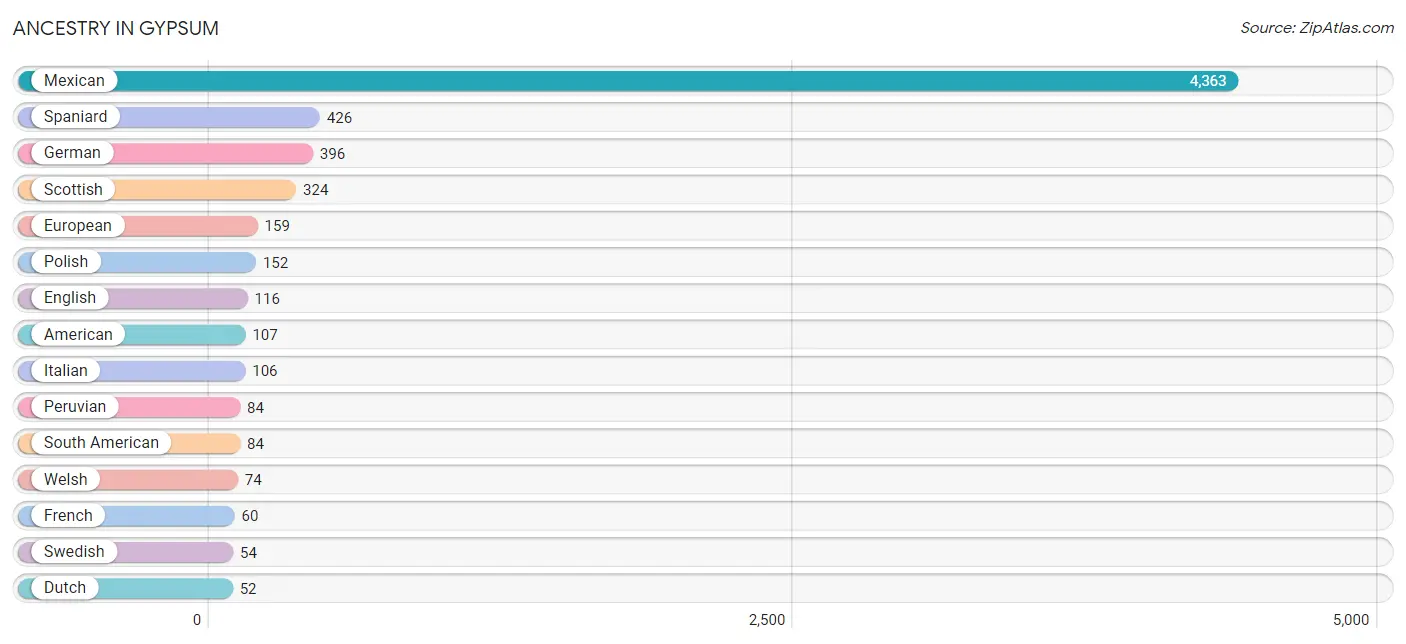
| Ancestry | # Population | % Population |
| American | 107 | 1.3% |
| British | 35 | 0.4% |
| Celtic | 40 | 0.5% |
| Dutch | 52 | 0.6% |
| English | 116 | 1.4% |
| European | 159 | 1.9% |
| French | 60 | 0.7% |
| German | 396 | 4.8% |
| Irish | 35 | 0.4% |
| Italian | 106 | 1.3% |
| Mexican | 4,363 | 52.6% |
| New Zealander | 50 | 0.6% |
| Norwegian | 46 | 0.5% |
| Peruvian | 84 | 1.0% |
| Polish | 152 | 1.8% |
| Russian | 38 | 0.5% |
| Scotch-Irish | 35 | 0.4% |
| Scottish | 324 | 3.9% |
| South American | 84 | 1.0% |
| Spaniard | 426 | 5.1% |
| Swedish | 54 | 0.6% |
| Welsh | 74 | 0.9% | View All 22 Rows |
Immigrants in Gypsum
The most numerous immigrant groups reported in Gypsum came from Latin America (1,836 | 22.1%), Central America (1,800 | 21.7%), Mexico (1,800 | 21.7%), Europe (121 | 1.5%), and Eastern Europe (84 | 1.0%), together accounting for 68.0% of all Gypsum residents.
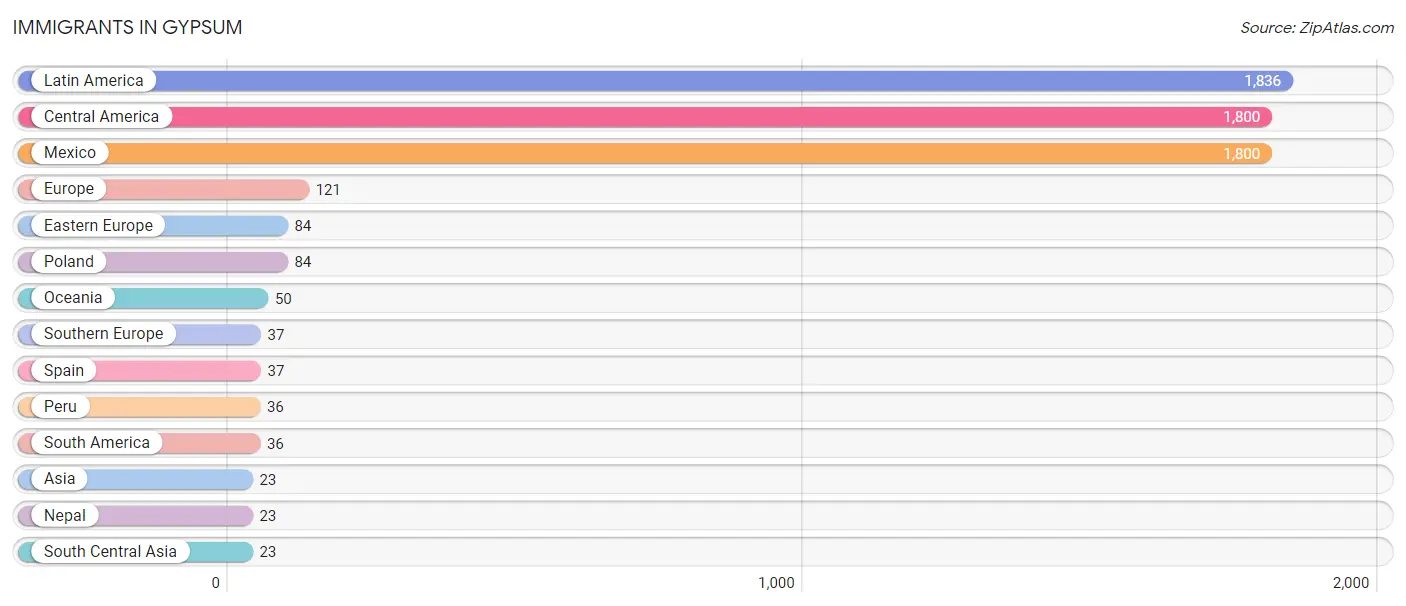
| Immigration Origin | # Population | % Population |
| Asia | 23 | 0.3% |
| Central America | 1,800 | 21.7% |
| Eastern Europe | 84 | 1.0% |
| Europe | 121 | 1.5% |
| Latin America | 1,836 | 22.1% |
| Mexico | 1,800 | 21.7% |
| Nepal | 23 | 0.3% |
| Oceania | 50 | 0.6% |
| Peru | 36 | 0.4% |
| Poland | 84 | 1.0% |
| South America | 36 | 0.4% |
| South Central Asia | 23 | 0.3% |
| Southern Europe | 37 | 0.4% |
| Spain | 37 | 0.4% | View All 14 Rows |
Sex and Age in Gypsum
Sex and Age in Gypsum
The most populous age groups in Gypsum are 15 to 19 Years (634 | 14.6%) for men and 15 to 19 Years (404 | 10.2%) for women.
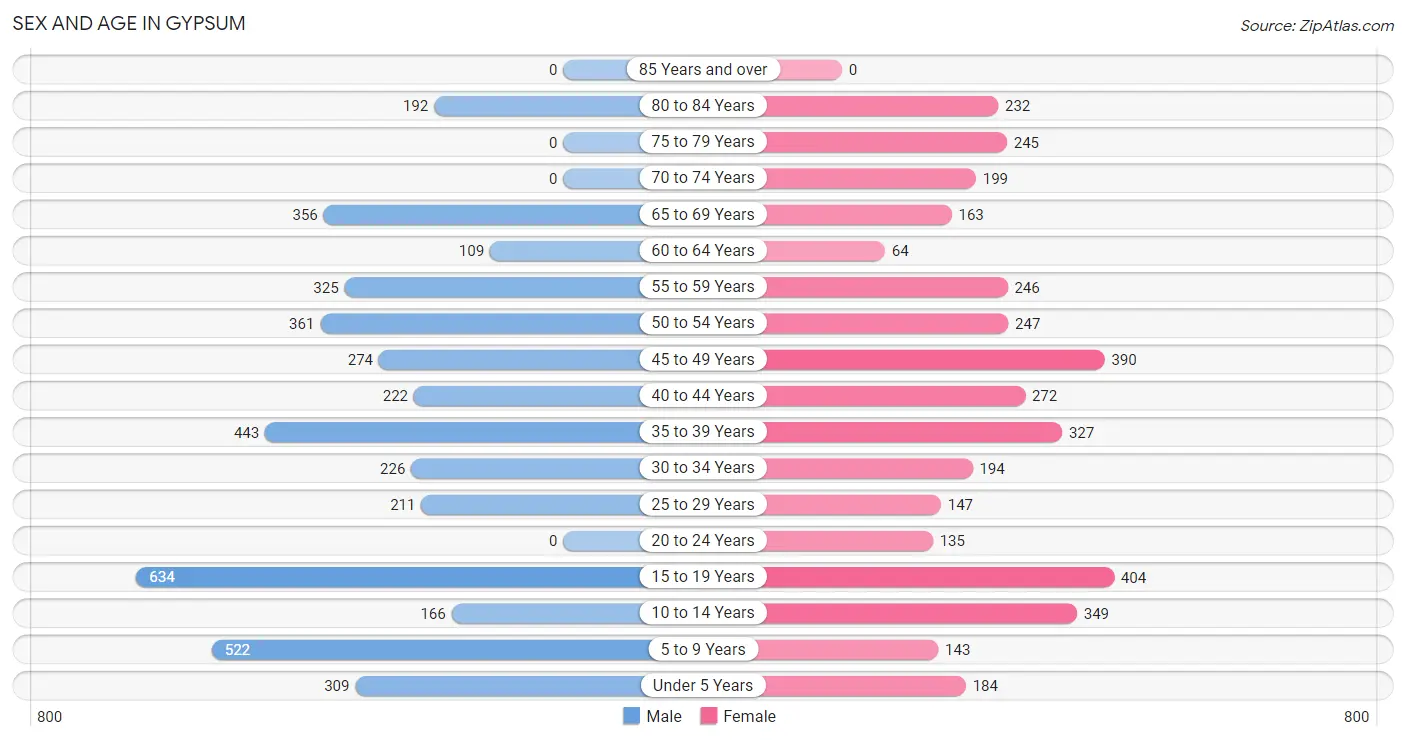
| Age Bracket | Male | Female |
| Under 5 Years | 309 (7.1%) | 184 (4.7%) |
| 5 to 9 Years | 522 (12.0%) | 143 (3.6%) |
| 10 to 14 Years | 166 (3.8%) | 349 (8.9%) |
| 15 to 19 Years | 634 (14.6%) | 404 (10.2%) |
| 20 to 24 Years | 0 (0.0%) | 135 (3.4%) |
| 25 to 29 Years | 211 (4.9%) | 147 (3.7%) |
| 30 to 34 Years | 226 (5.2%) | 194 (4.9%) |
| 35 to 39 Years | 443 (10.2%) | 327 (8.3%) |
| 40 to 44 Years | 222 (5.1%) | 272 (6.9%) |
| 45 to 49 Years | 274 (6.3%) | 390 (9.9%) |
| 50 to 54 Years | 361 (8.3%) | 247 (6.3%) |
| 55 to 59 Years | 325 (7.5%) | 246 (6.2%) |
| 60 to 64 Years | 109 (2.5%) | 64 (1.6%) |
| 65 to 69 Years | 356 (8.2%) | 163 (4.1%) |
| 70 to 74 Years | 0 (0.0%) | 199 (5.1%) |
| 75 to 79 Years | 0 (0.0%) | 245 (6.2%) |
| 80 to 84 Years | 192 (4.4%) | 232 (5.9%) |
| 85 Years and over | 0 (0.0%) | 0 (0.0%) |
| Total | 4,350 (100.0%) | 3,941 (100.0%) |
Families and Households in Gypsum
Median Family Size in Gypsum
The median family size in Gypsum is 3.99 persons per family, with single female/mother families (97 | 5.3%) accounting for the largest median family size of 6 persons per family. On the other hand, married-couple families (1,542 | 84.4%) represent the smallest median family size with 3.86 persons per family.
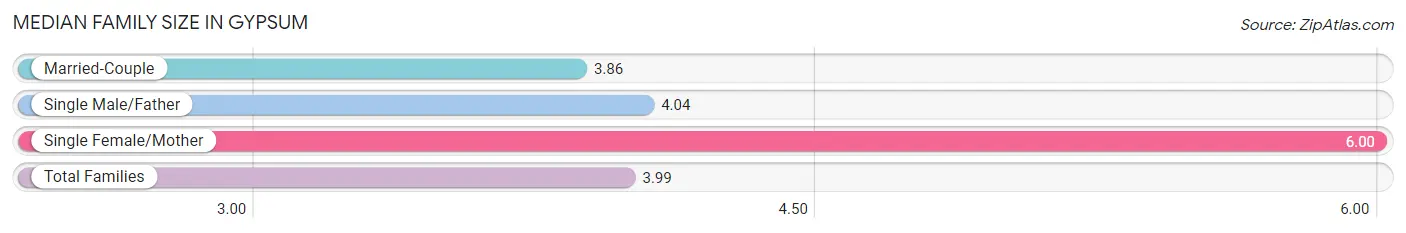
| Family Type | # Families | Family Size |
| Married-Couple | 1,542 (84.4%) | 3.86 |
| Single Male/Father | 189 (10.3%) | 4.04 |
| Single Female/Mother | 97 (5.3%) | 6.00 |
| Total Families | 1,828 (100.0%) | 3.99 |
Median Household Size in Gypsum
The median household size in Gypsum is 3.53 persons per household, with single female/mother households (97 | 4.1%) accounting for the largest median household size of 6 persons per household. non-family households (523 | 22.3%) represent the smallest median household size with 1.58 persons per household.
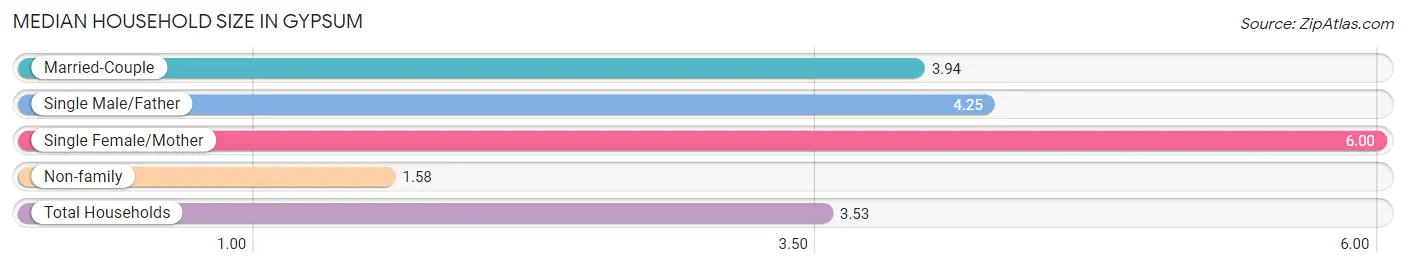
| Household Type | # Households | Household Size |
| Married-Couple | 1,542 (65.6%) | 3.94 |
| Single Male/Father | 189 (8.0%) | 4.25 |
| Single Female/Mother | 97 (4.1%) | 6.00 |
| Non-family | 523 (22.3%) | 1.58 |
| Total Households | 2,351 (100.0%) | 3.53 |
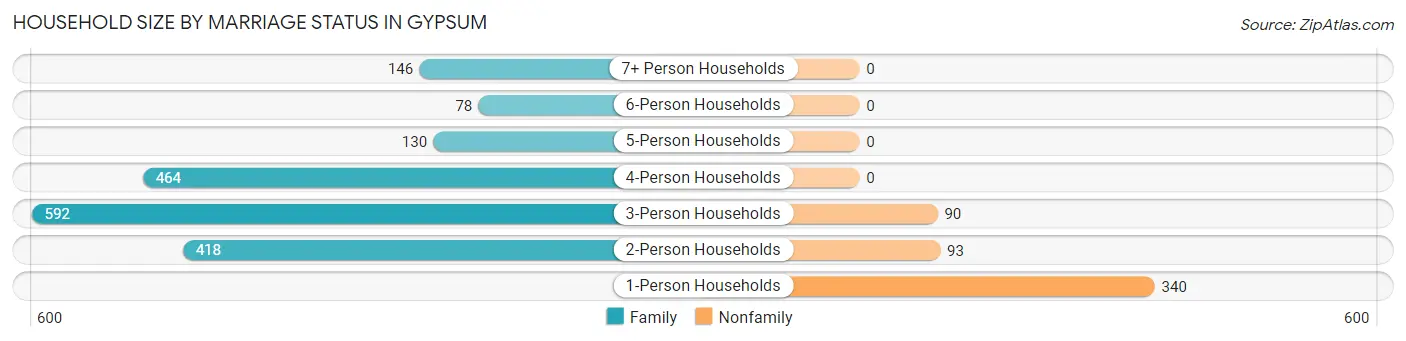
Household Size by Marriage Status in Gypsum
Out of a total of 2,351 households in Gypsum, 1,828 (77.7%) are family households, while 523 (22.3%) are nonfamily households. The most numerous type of family households are 3-person households, comprising 592, and the most common type of nonfamily households are 1-person households, comprising 340.
| Household Size | Family Households | Nonfamily Households |
| 1-Person Households | - | 340 (14.5%) |
| 2-Person Households | 418 (17.8%) | 93 (4.0%) |
| 3-Person Households | 592 (25.2%) | 90 (3.8%) |
| 4-Person Households | 464 (19.7%) | 0 (0.0%) |
| 5-Person Households | 130 (5.5%) | 0 (0.0%) |
| 6-Person Households | 78 (3.3%) | 0 (0.0%) |
| 7+ Person Households | 146 (6.2%) | 0 (0.0%) |
| Total | 1,828 (77.7%) | 523 (22.3%) |
Female Fertility in Gypsum
Fertility by Age in Gypsum
Average fertility rate in Gypsum is 61.0 births per 1,000 women. Women in the age bracket of 20 to 34 years have the highest fertility rate with 153.0 births per 1,000 women. Women in the age bracket of 20 to 34 years acount for 59.8% of all women with births.

| Age Bracket | Women with Births | Births / 1,000 Women |
| 15 to 19 years | 0 (0.0%) | 0.0 |
| 20 to 34 years | 73 (59.8%) | 153.0 |
| 35 to 50 years | 49 (40.2%) | 44.0 |
| Total | 122 (100.0%) | 61.0 |
Fertility by Age by Marriage Status in Gypsum
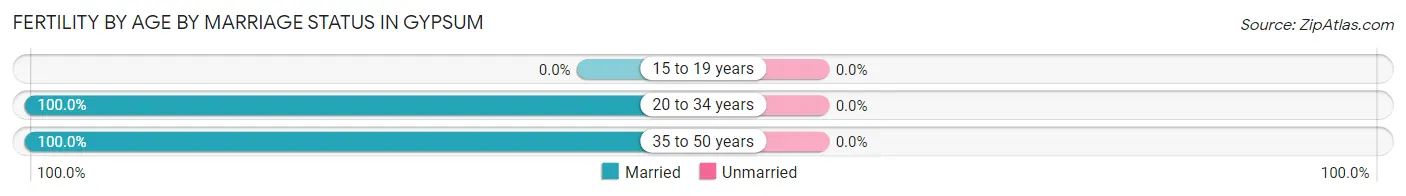
| Age Bracket | Married | Unmarried |
| 15 to 19 years | 0 (0.0%) | 0 (0.0%) |
| 20 to 34 years | 73 (100.0%) | 0 (0.0%) |
| 35 to 50 years | 49 (100.0%) | 0 (0.0%) |
| Total | 122 (100.0%) | 0 (0.0%) |
Fertility by Education in Gypsum
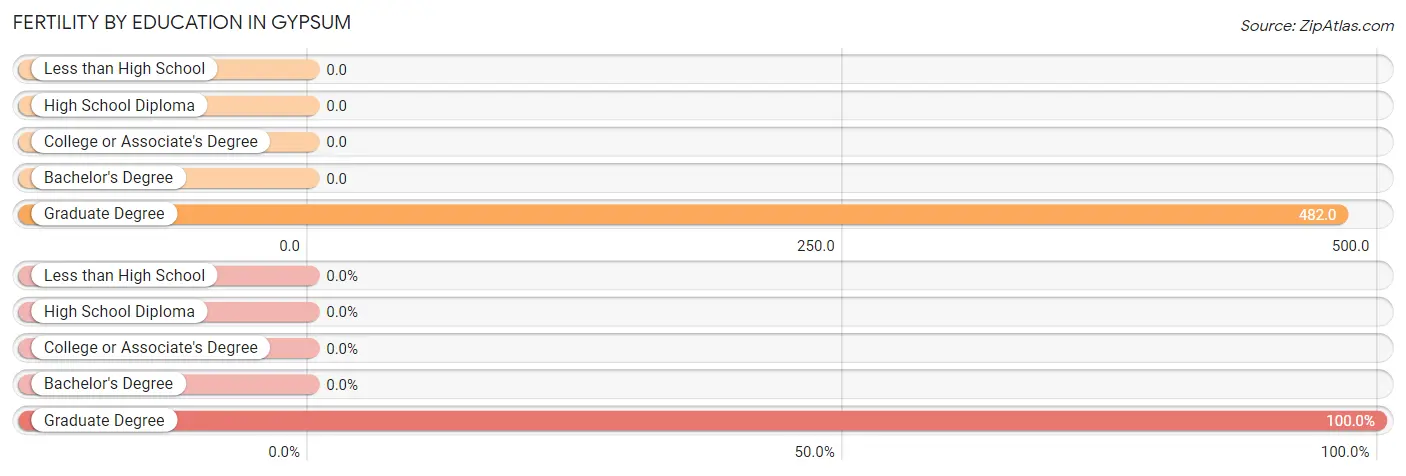
| Educational Attainment | Women with Births | Births / 1,000 Women |
| Less than High School | 0 (0.0%) | 0.0 |
| High School Diploma | 0 (0.0%) | 0.0 |
| College or Associate's Degree | 0 (0.0%) | 0.0 |
| Bachelor's Degree | 0 (0.0%) | 0.0 |
| Graduate Degree | 122 (100.0%) | 482.0 |
| Total | 122 (100.0%) | 61.0 |
Fertility by Education by Marriage Status in Gypsum
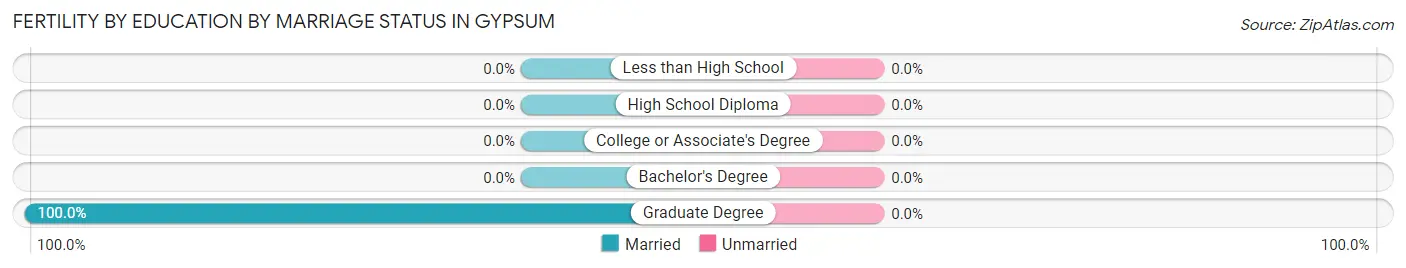
| Educational Attainment | Married | Unmarried |
| Less than High School | 0 (0.0%) | 0 (0.0%) |
| High School Diploma | 0 (0.0%) | 0 (0.0%) |
| College or Associate's Degree | 0 (0.0%) | 0 (0.0%) |
| Bachelor's Degree | 0 (0.0%) | 0 (0.0%) |
| Graduate Degree | 122 (100.0%) | 0 (0.0%) |
| Total | 122 (100.0%) | 0 (0.0%) |
Employment Characteristics in Gypsum
Employment by Class of Employer in Gypsum
Among the 4,227 employed individuals in Gypsum, private company employees (2,419 | 57.2%), self-employed (incorporated) (501 | 11.8%), and not-for-profit organizations (391 | 9.2%) make up the most common classes of employment.
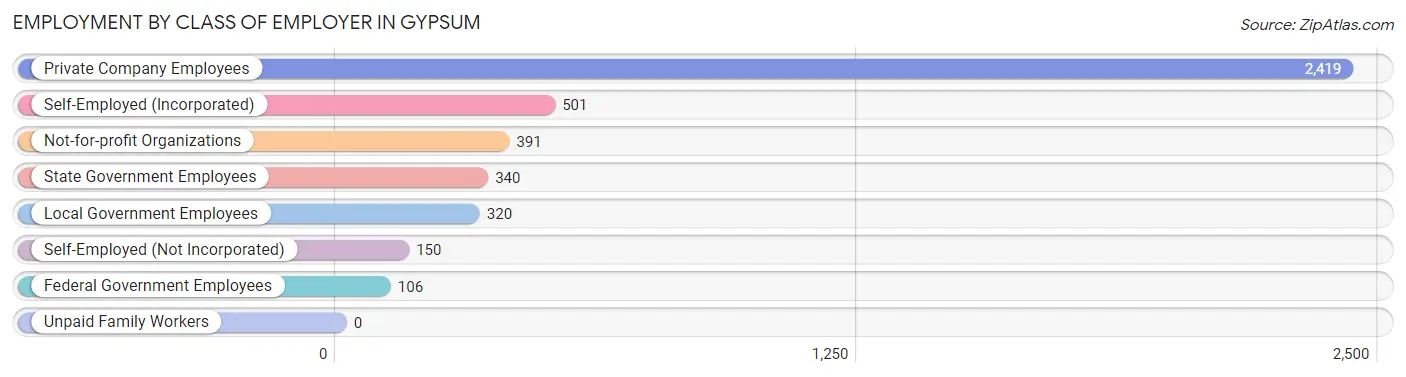
| Employer Class | # Employees | % Employees |
| Private Company Employees | 2,419 | 57.2% |
| Self-Employed (Incorporated) | 501 | 11.8% |
| Self-Employed (Not Incorporated) | 150 | 3.5% |
| Not-for-profit Organizations | 391 | 9.2% |
| Local Government Employees | 320 | 7.6% |
| State Government Employees | 340 | 8.0% |
| Federal Government Employees | 106 | 2.5% |
| Unpaid Family Workers | 0 | 0.0% |
| Total | 4,227 | 100.0% |
Employment Status by Age in Gypsum
According to the labor force statistics for Gypsum, out of the total population over 16 years of age (6,482), 66.6% or 4,317 individuals are in the labor force, with 0.7% or 30 of them unemployed. The age group with the highest labor force participation rate is 20 to 24 years, with 100.0% or 135 individuals in the labor force. Within the labor force, the 16 to 19 years age range has the highest percentage of unemployed individuals, with 7.7% or 32 of them being unemployed.
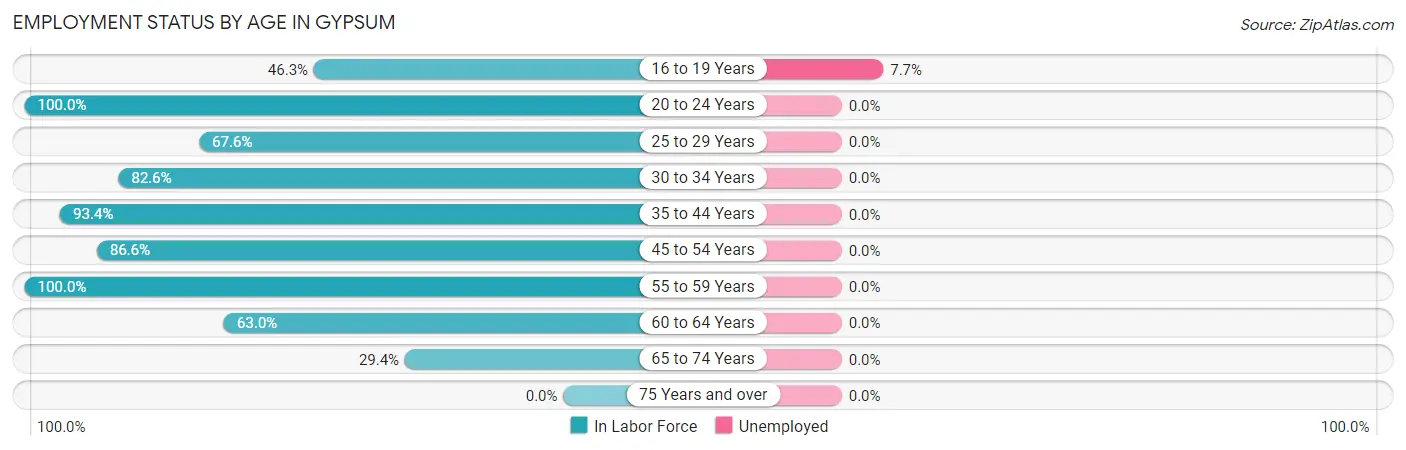
| Age Bracket | In Labor Force | Unemployed |
| 16 to 19 Years | 418 (46.3%) | 32 (7.7%) |
| 20 to 24 Years | 135 (100.0%) | 0 (0.0%) |
| 25 to 29 Years | 242 (67.6%) | 0 (0.0%) |
| 30 to 34 Years | 347 (82.6%) | 0 (0.0%) |
| 35 to 44 Years | 1,181 (93.4%) | 0 (0.0%) |
| 45 to 54 Years | 1,102 (86.6%) | 0 (0.0%) |
| 55 to 59 Years | 571 (100.0%) | 0 (0.0%) |
| 60 to 64 Years | 109 (63.0%) | 0 (0.0%) |
| 65 to 74 Years | 211 (29.4%) | 0 (0.0%) |
| 75 Years and over | 0 (0.0%) | 0 (0.0%) |
| Total | 4,317 (66.6%) | 30 (0.7%) |
Employment Status by Educational Attainment in Gypsum
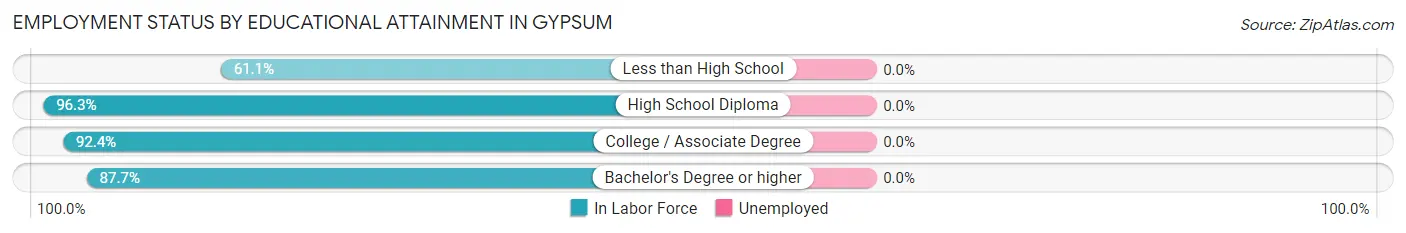
| Educational Attainment | In Labor Force | Unemployed |
| Less than High School | 324 (61.1%) | 0 (0.0%) |
| High School Diploma | 1,181 (96.3%) | 0 (0.0%) |
| College / Associate Degree | 570 (92.4%) | 0 (0.0%) |
| Bachelor's Degree or higher | 1,478 (87.7%) | 0 (0.0%) |
| Total | 3,551 (87.5%) | 0 (0.0%) |
Employment Occupations by Sex in Gypsum
Management, Business, Science and Arts Occupations
The most common Management, Business, Science and Arts occupations in Gypsum are Management (741 | 17.3%), Community & Social Service (628 | 14.7%), Education Instruction & Library (415 | 9.7%), Health Diagnosing & Treating (242 | 5.7%), and Health Technologists (202 | 4.7%).
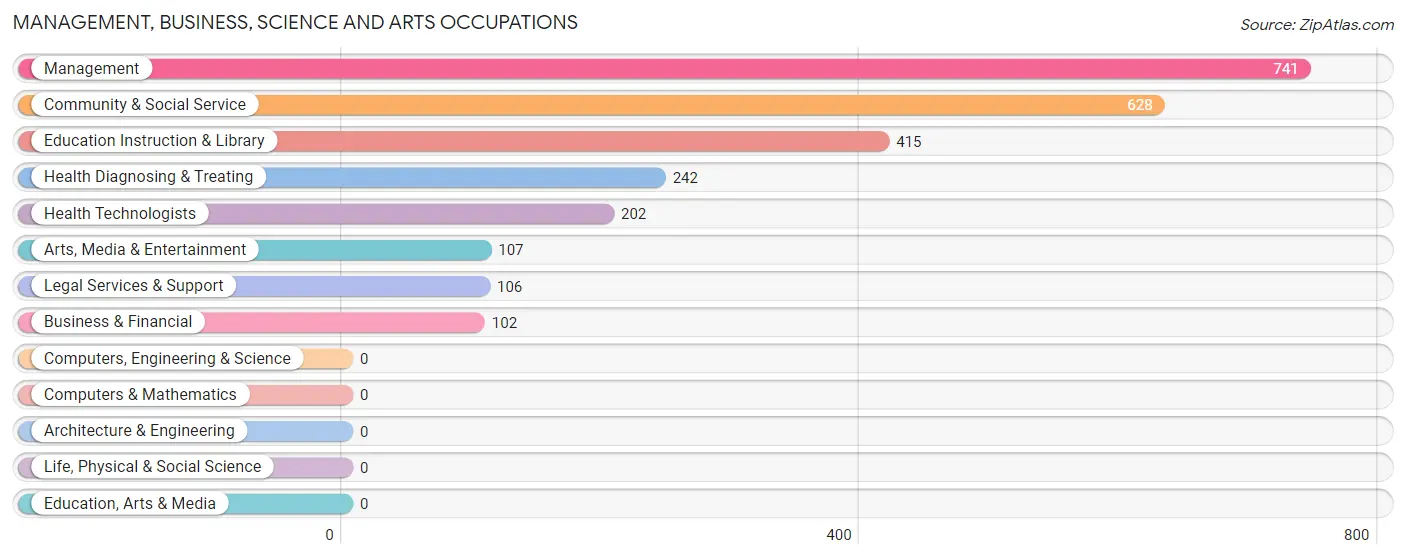
Management, Business, Science and Arts Occupations by Sex
Within the Management, Business, Science and Arts occupations in Gypsum, the most male-oriented occupations are Legal Services & Support (100.0%), Management (85.7%), and Business & Financial (62.7%), while the most female-oriented occupations are Arts, Media & Entertainment (100.0%), Health Diagnosing & Treating (82.6%), and Health Technologists (79.2%).
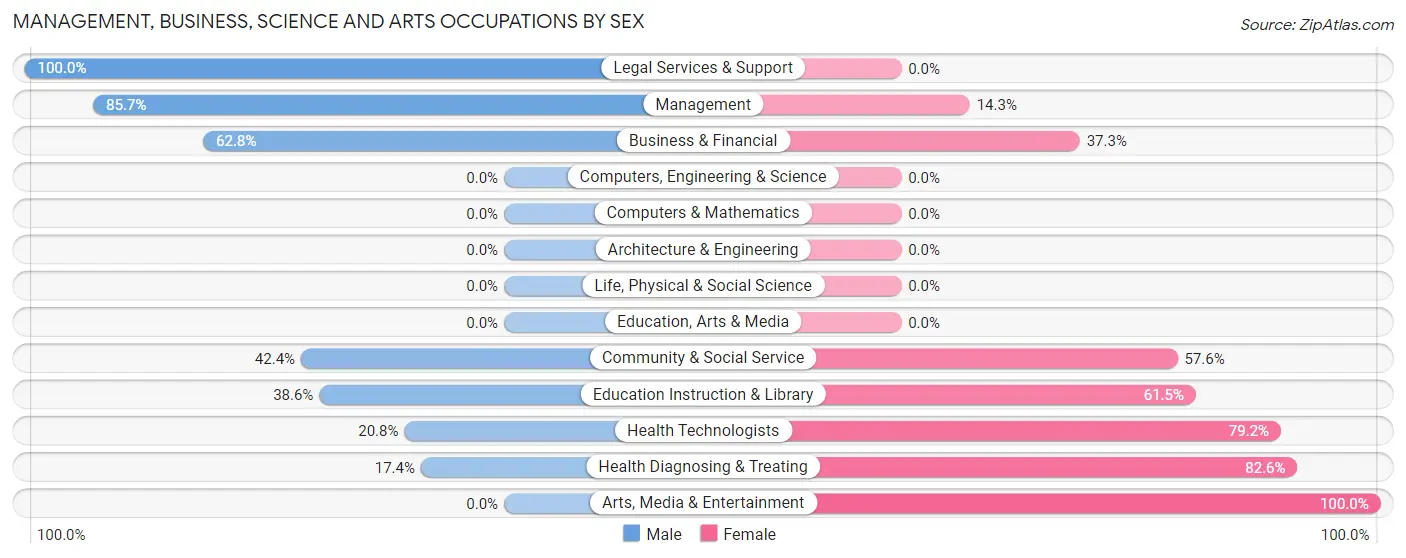
| Occupation | Male | Female |
| Management | 635 (85.7%) | 106 (14.3%) |
| Business & Financial | 64 (62.7%) | 38 (37.2%) |
| Computers, Engineering & Science | 0 (0.0%) | 0 (0.0%) |
| Computers & Mathematics | 0 (0.0%) | 0 (0.0%) |
| Architecture & Engineering | 0 (0.0%) | 0 (0.0%) |
| Life, Physical & Social Science | 0 (0.0%) | 0 (0.0%) |
| Community & Social Service | 266 (42.4%) | 362 (57.6%) |
| Education, Arts & Media | 0 (0.0%) | 0 (0.0%) |
| Legal Services & Support | 106 (100.0%) | 0 (0.0%) |
| Education Instruction & Library | 160 (38.6%) | 255 (61.5%) |
| Arts, Media & Entertainment | 0 (0.0%) | 107 (100.0%) |
| Health Diagnosing & Treating | 42 (17.4%) | 200 (82.6%) |
| Health Technologists | 42 (20.8%) | 160 (79.2%) |
| Total (Category) | 1,007 (58.8%) | 706 (41.2%) |
| Total (Overall) | 2,538 (59.2%) | 1,746 (40.8%) |
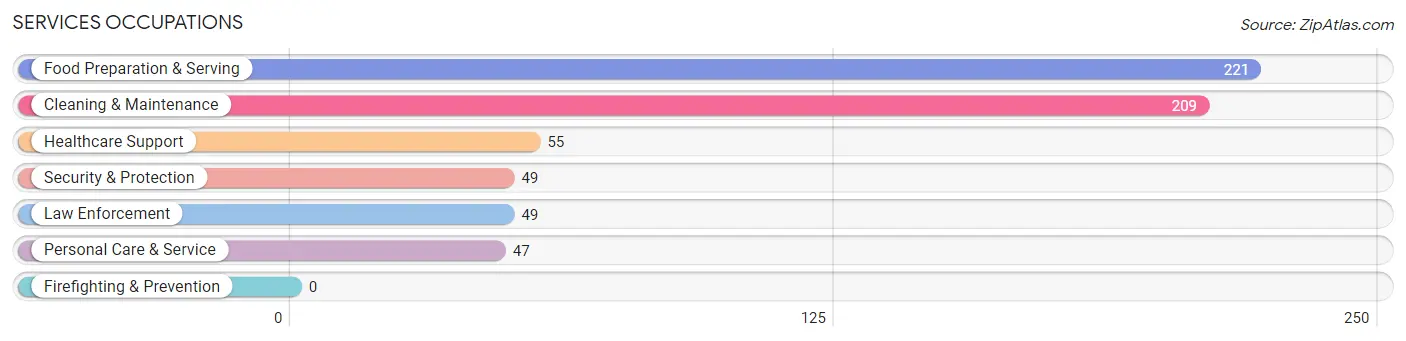
Services Occupations
The most common Services occupations in Gypsum are Food Preparation & Serving (221 | 5.2%), Cleaning & Maintenance (209 | 4.9%), Healthcare Support (55 | 1.3%), Security & Protection (49 | 1.1%), and Law Enforcement (49 | 1.1%).
Services Occupations by Sex
Within the Services occupations in Gypsum, the most male-oriented occupations are Security & Protection (100.0%), Law Enforcement (100.0%), and Food Preparation & Serving (24.0%), while the most female-oriented occupations are Healthcare Support (100.0%), Personal Care & Service (100.0%), and Cleaning & Maintenance (86.1%).
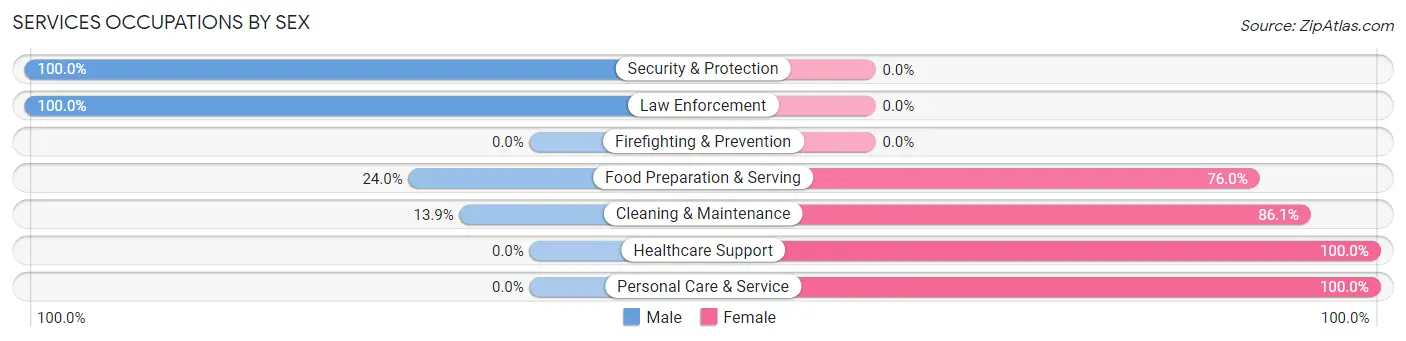
| Occupation | Male | Female |
| Healthcare Support | 0 (0.0%) | 55 (100.0%) |
| Security & Protection | 49 (100.0%) | 0 (0.0%) |
| Firefighting & Prevention | 0 (0.0%) | 0 (0.0%) |
| Law Enforcement | 49 (100.0%) | 0 (0.0%) |
| Food Preparation & Serving | 53 (24.0%) | 168 (76.0%) |
| Cleaning & Maintenance | 29 (13.9%) | 180 (86.1%) |
| Personal Care & Service | 0 (0.0%) | 47 (100.0%) |
| Total (Category) | 131 (22.6%) | 450 (77.4%) |
| Total (Overall) | 2,538 (59.2%) | 1,746 (40.8%) |
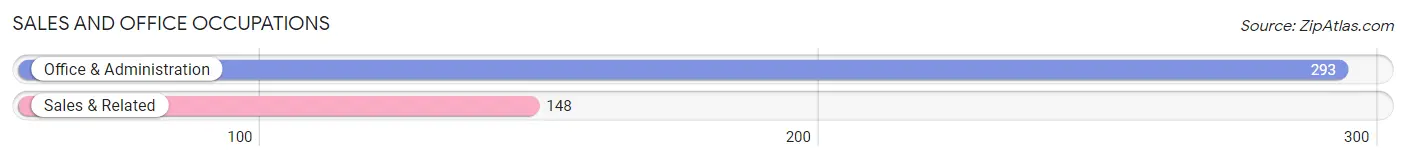
Sales and Office Occupations
The most common Sales and Office occupations in Gypsum are Office & Administration (293 | 6.8%), and Sales & Related (148 | 3.5%).
Sales and Office Occupations by Sex
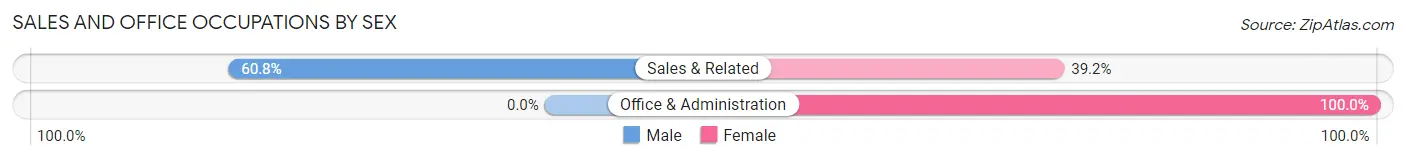
| Occupation | Male | Female |
| Sales & Related | 90 (60.8%) | 58 (39.2%) |
| Office & Administration | 0 (0.0%) | 293 (100.0%) |
| Total (Category) | 90 (20.4%) | 351 (79.6%) |
| Total (Overall) | 2,538 (59.2%) | 1,746 (40.8%) |
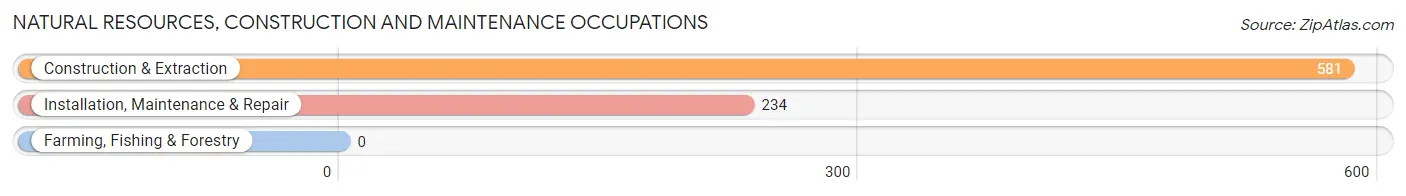
Natural Resources, Construction and Maintenance Occupations
The most common Natural Resources, Construction and Maintenance occupations in Gypsum are Construction & Extraction (581 | 13.6%), and Installation, Maintenance & Repair (234 | 5.5%).
Natural Resources, Construction and Maintenance Occupations by Sex
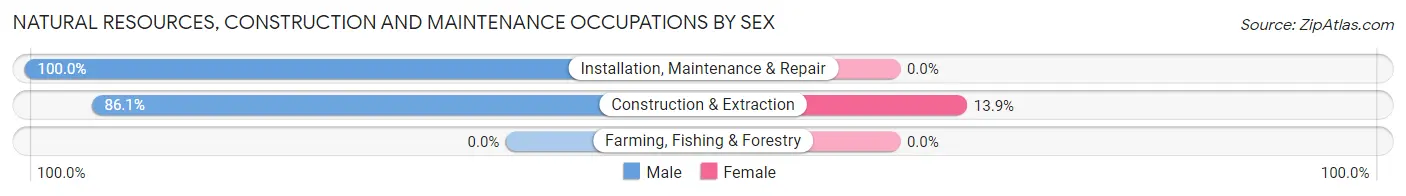
| Occupation | Male | Female |
| Farming, Fishing & Forestry | 0 (0.0%) | 0 (0.0%) |
| Construction & Extraction | 500 (86.1%) | 81 (13.9%) |
| Installation, Maintenance & Repair | 234 (100.0%) | 0 (0.0%) |
| Total (Category) | 734 (90.1%) | 81 (9.9%) |
| Total (Overall) | 2,538 (59.2%) | 1,746 (40.8%) |
Production, Transportation and Moving Occupations
The most common Production, Transportation and Moving occupations in Gypsum are Transportation (331 | 7.7%), Production (308 | 7.2%), and Material Moving (95 | 2.2%).
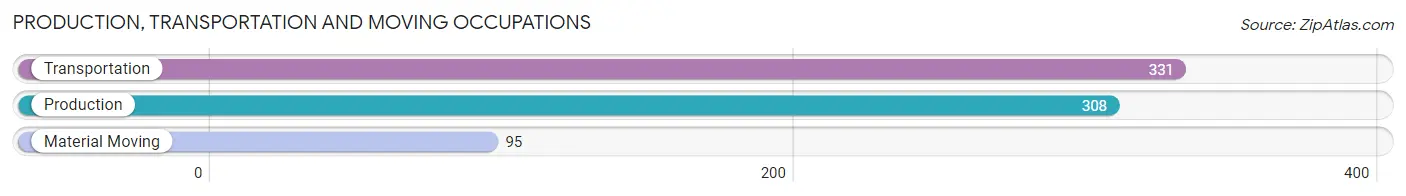
Production, Transportation and Moving Occupations by Sex
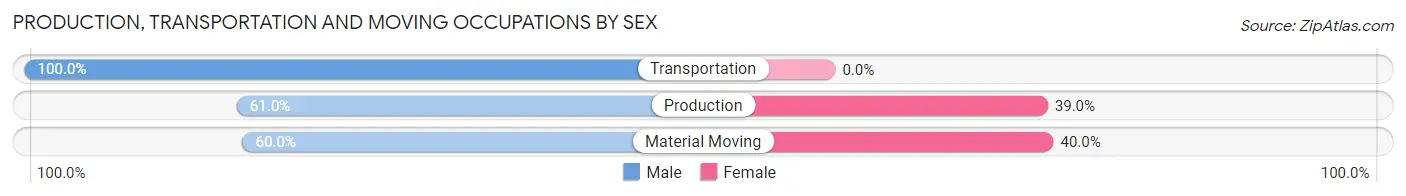
| Occupation | Male | Female |
| Production | 188 (61.0%) | 120 (39.0%) |
| Transportation | 331 (100.0%) | 0 (0.0%) |
| Material Moving | 57 (60.0%) | 38 (40.0%) |
| Total (Category) | 576 (78.5%) | 158 (21.5%) |
| Total (Overall) | 2,538 (59.2%) | 1,746 (40.8%) |
Employment Industries by Sex in Gypsum
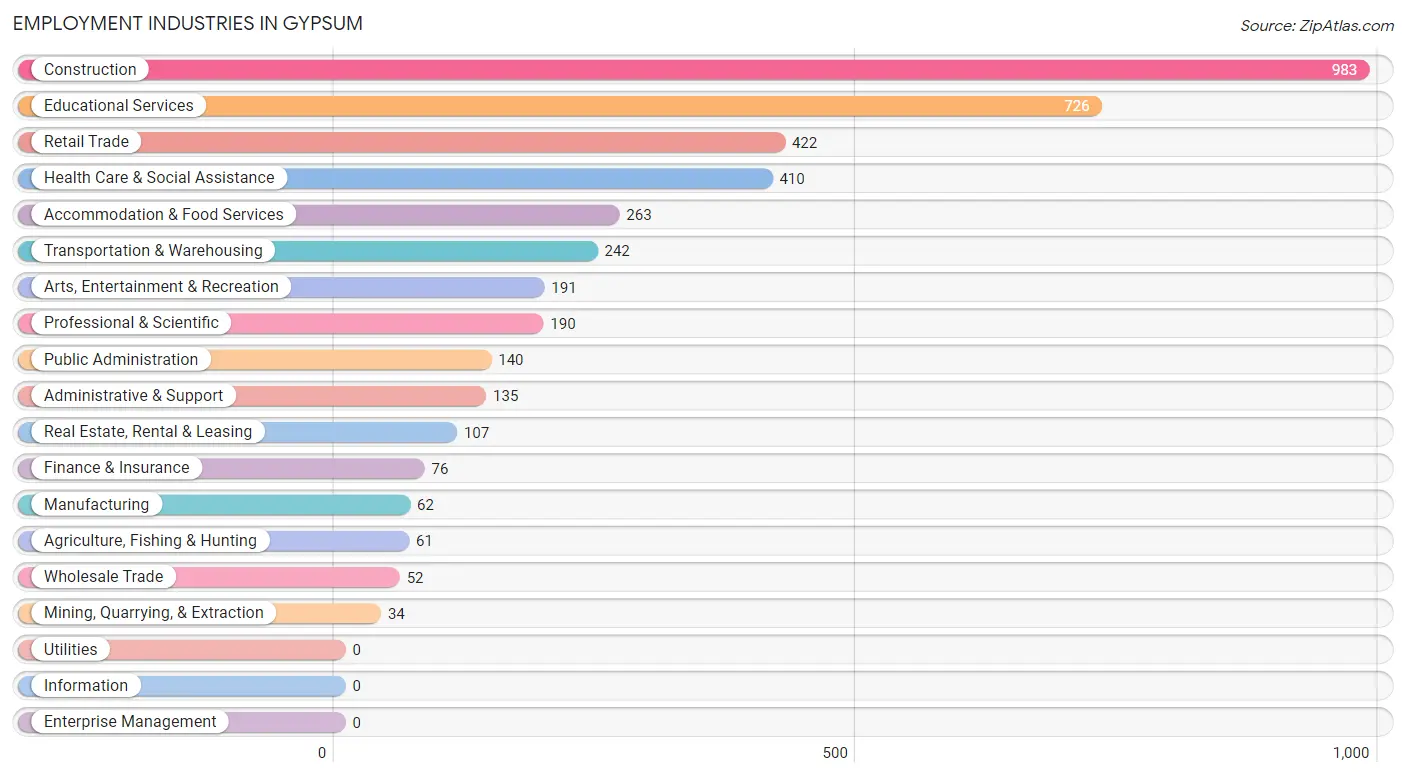
Employment Industries in Gypsum
The major employment industries in Gypsum include Construction (983 | 23.0%), Educational Services (726 | 17.0%), Retail Trade (422 | 9.9%), Health Care & Social Assistance (410 | 9.6%), and Accommodation & Food Services (263 | 6.1%).
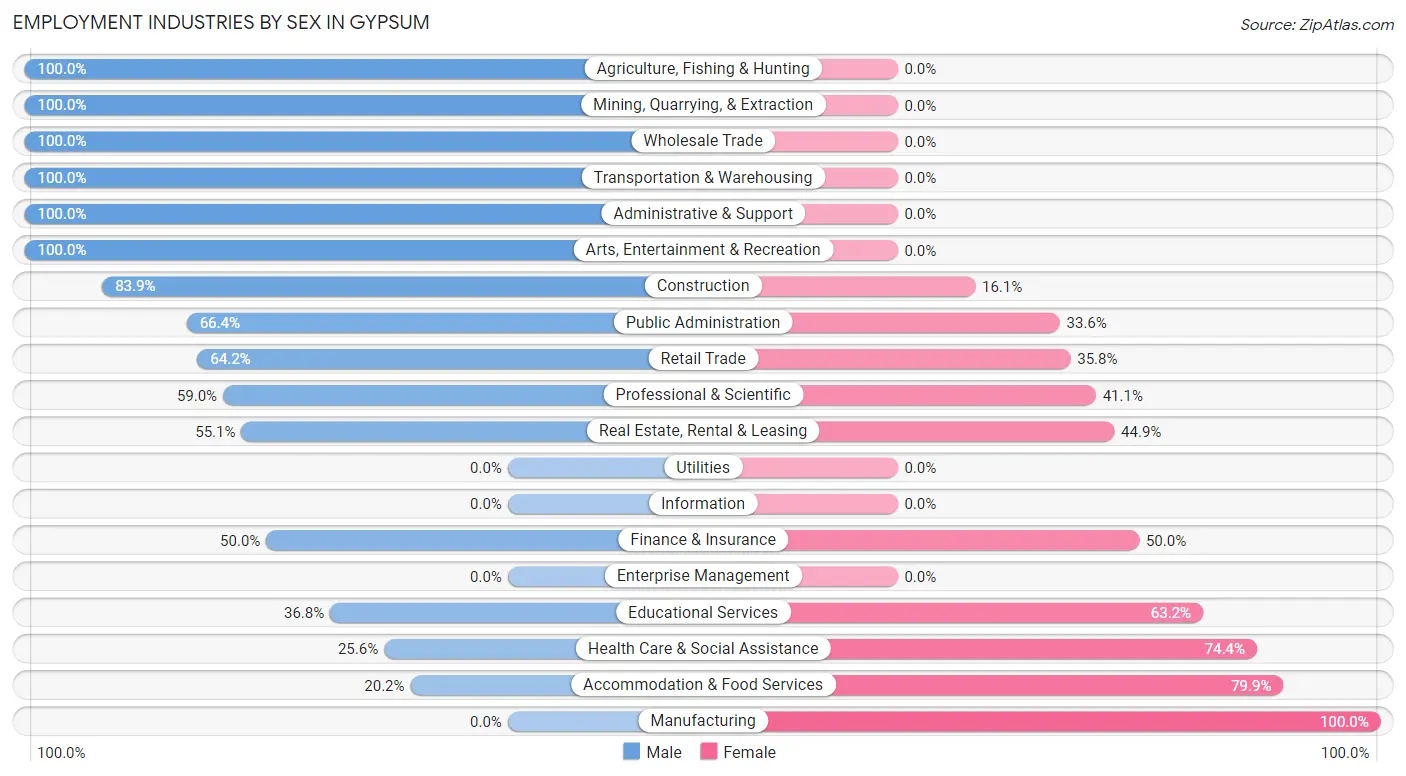
Employment Industries by Sex in Gypsum
The Gypsum industries that see more men than women are Agriculture, Fishing & Hunting (100.0%), Mining, Quarrying, & Extraction (100.0%), and Wholesale Trade (100.0%), whereas the industries that tend to have a higher number of women are Manufacturing (100.0%), Accommodation & Food Services (79.8%), and Health Care & Social Assistance (74.4%).
| Industry | Male | Female |
| Agriculture, Fishing & Hunting | 61 (100.0%) | 0 (0.0%) |
| Mining, Quarrying, & Extraction | 34 (100.0%) | 0 (0.0%) |
| Construction | 825 (83.9%) | 158 (16.1%) |
| Manufacturing | 0 (0.0%) | 62 (100.0%) |
| Wholesale Trade | 52 (100.0%) | 0 (0.0%) |
| Retail Trade | 271 (64.2%) | 151 (35.8%) |
| Transportation & Warehousing | 242 (100.0%) | 0 (0.0%) |
| Utilities | 0 (0.0%) | 0 (0.0%) |
| Information | 0 (0.0%) | 0 (0.0%) |
| Finance & Insurance | 38 (50.0%) | 38 (50.0%) |
| Real Estate, Rental & Leasing | 59 (55.1%) | 48 (44.9%) |
| Professional & Scientific | 112 (59.0%) | 78 (41.0%) |
| Enterprise Management | 0 (0.0%) | 0 (0.0%) |
| Administrative & Support | 135 (100.0%) | 0 (0.0%) |
| Educational Services | 267 (36.8%) | 459 (63.2%) |
| Health Care & Social Assistance | 105 (25.6%) | 305 (74.4%) |
| Arts, Entertainment & Recreation | 191 (100.0%) | 0 (0.0%) |
| Accommodation & Food Services | 53 (20.2%) | 210 (79.8%) |
| Public Administration | 93 (66.4%) | 47 (33.6%) |
| Total | 2,538 (59.2%) | 1,746 (40.8%) |
Education in Gypsum
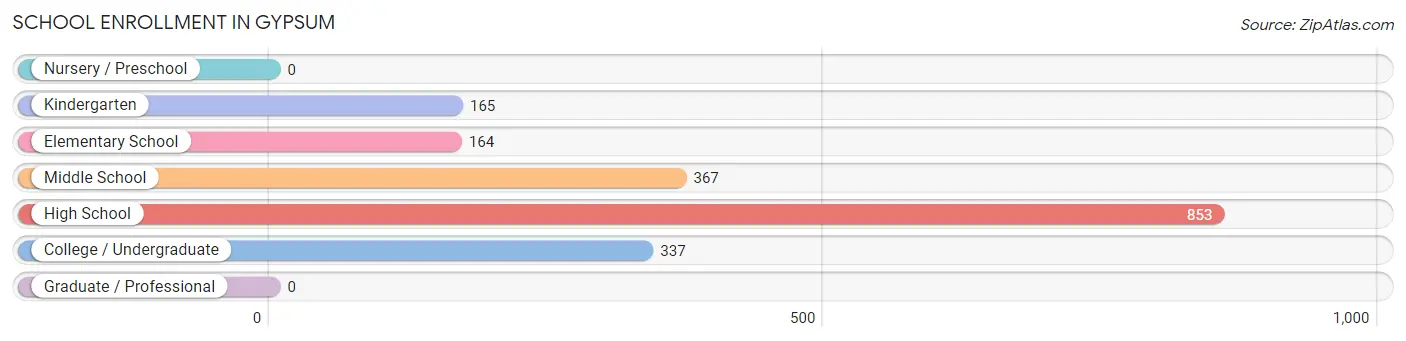
School Enrollment in Gypsum
The most common levels of schooling among the 1,886 students in Gypsum are high school (853 | 45.2%), middle school (367 | 19.5%), and college / undergraduate (337 | 17.9%).
| School Level | # Students | % Students |
| Nursery / Preschool | 0 | 0.0% |
| Kindergarten | 165 | 8.7% |
| Elementary School | 164 | 8.7% |
| Middle School | 367 | 19.5% |
| High School | 853 | 45.2% |
| College / Undergraduate | 337 | 17.9% |
| Graduate / Professional | 0 | 0.0% |
| Total | 1,886 | 100.0% |
School Enrollment by Age by Funding Source in Gypsum
Out of a total of 1,886 students who are enrolled in schools in Gypsum, 123 (6.5%) attend a private institution, while the remaining 1,763 (93.5%) are enrolled in public schools. The age group of 5 to 9 year old has the highest likelihood of being enrolled in private schools, with 80 (24.3% in the age bracket) enrolled. Conversely, the age group of 15 to 17 year olds has the lowest likelihood of being enrolled in a private school, with 652 (100.0% in the age bracket) attending a public institution.
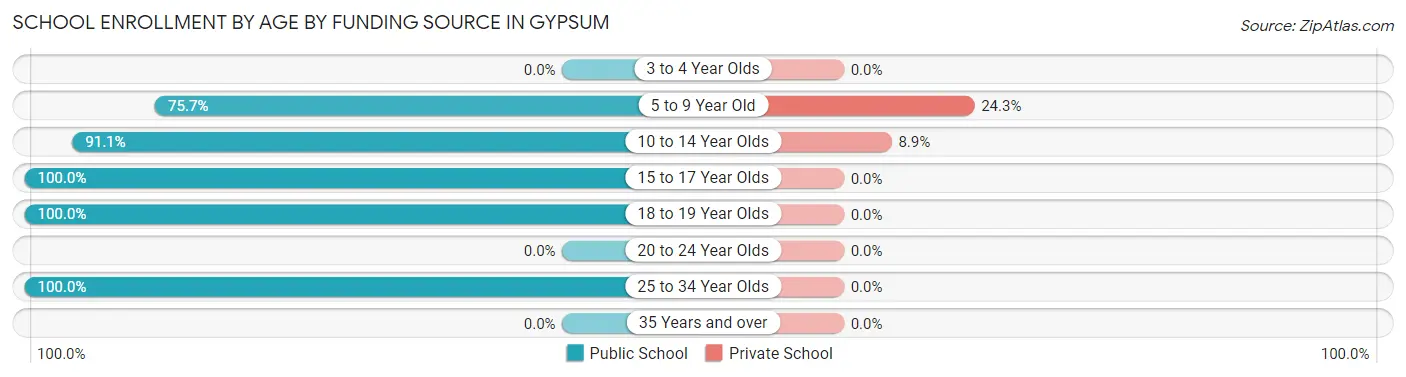
| Age Bracket | Public School | Private School |
| 3 to 4 Year Olds | 0 (0.0%) | 0 (0.0%) |
| 5 to 9 Year Old | 249 (75.7%) | 80 (24.3%) |
| 10 to 14 Year Olds | 430 (91.1%) | 42 (8.9%) |
| 15 to 17 Year Olds | 652 (100.0%) | 0 (0.0%) |
| 18 to 19 Year Olds | 386 (100.0%) | 0 (0.0%) |
| 20 to 24 Year Olds | 0 (0.0%) | 0 (0.0%) |
| 25 to 34 Year Olds | 47 (100.0%) | 0 (0.0%) |
| 35 Years and over | 0 (0.0%) | 0 (0.0%) |
| Total | 1,763 (93.5%) | 123 (6.5%) |
Educational Attainment by Field of Study in Gypsum
Liberal arts & history (321 | 14.5%), social sciences (320 | 14.4%), bio, nature & agricultural (276 | 12.4%), education (248 | 11.2%), and business (227 | 10.2%) are the most common fields of study among 2,218 individuals in Gypsum who have obtained a bachelor's degree or higher.
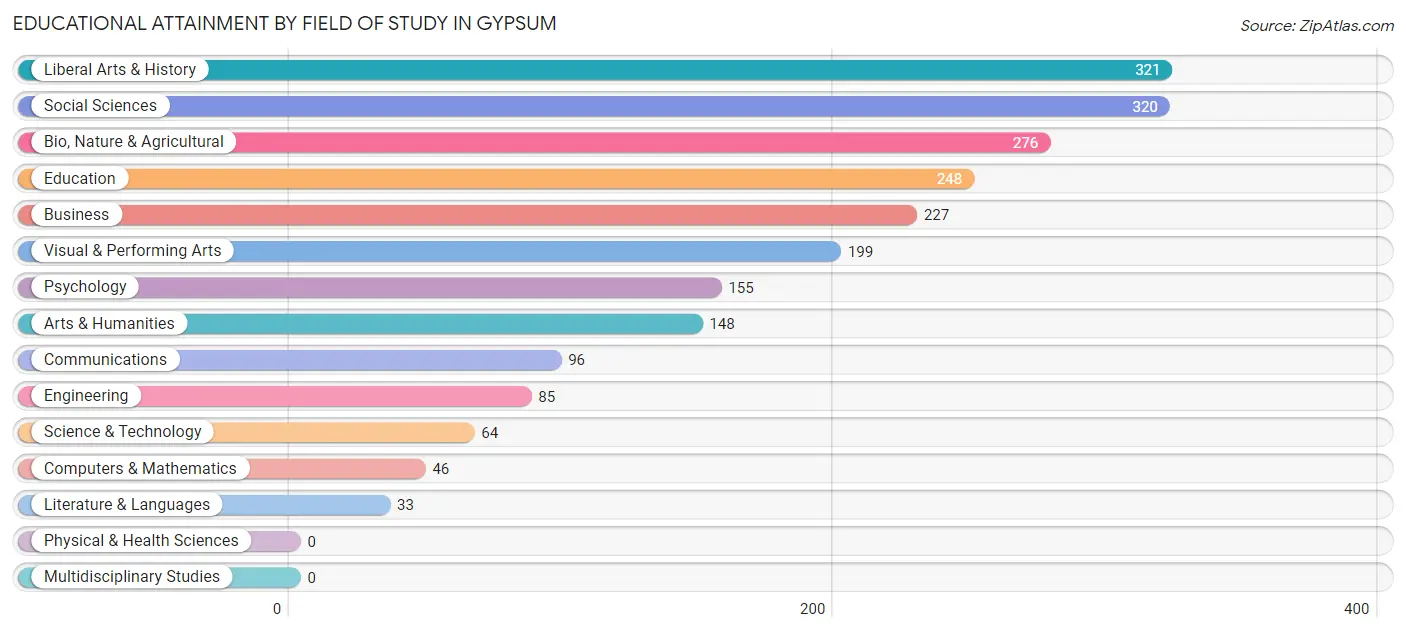
| Field of Study | # Graduates | % Graduates |
| Computers & Mathematics | 46 | 2.1% |
| Bio, Nature & Agricultural | 276 | 12.4% |
| Physical & Health Sciences | 0 | 0.0% |
| Psychology | 155 | 7.0% |
| Social Sciences | 320 | 14.4% |
| Engineering | 85 | 3.8% |
| Multidisciplinary Studies | 0 | 0.0% |
| Science & Technology | 64 | 2.9% |
| Business | 227 | 10.2% |
| Education | 248 | 11.2% |
| Literature & Languages | 33 | 1.5% |
| Liberal Arts & History | 321 | 14.5% |
| Visual & Performing Arts | 199 | 9.0% |
| Communications | 96 | 4.3% |
| Arts & Humanities | 148 | 6.7% |
| Total | 2,218 | 100.0% |
Transportation & Commute in Gypsum
Vehicle Availability by Sex in Gypsum
The most prevalent vehicle ownership categories in Gypsum are males with 2 vehicles (1,046, accounting for 42.2%) and females with 2 vehicles (520, making up 59.9%).
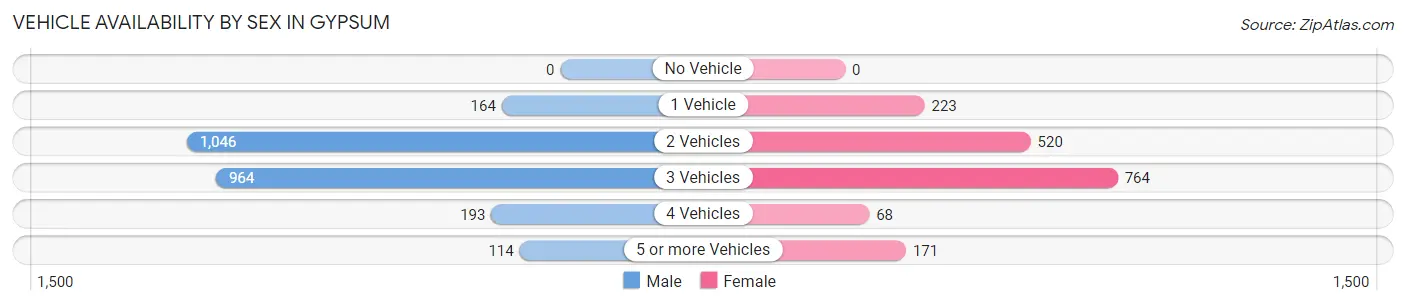
| Vehicles Available | Male | Female |
| No Vehicle | 0 (0.0%) | 0 (0.0%) |
| 1 Vehicle | 164 (6.6%) | 223 (12.8%) |
| 2 Vehicles | 1,046 (42.2%) | 520 (29.8%) |
| 3 Vehicles | 964 (38.9%) | 764 (43.8%) |
| 4 Vehicles | 193 (7.8%) | 68 (3.9%) |
| 5 or more Vehicles | 114 (4.6%) | 171 (9.8%) |
| Total | 2,481 (100.0%) | 1,746 (100.0%) |
Commute Time in Gypsum
The most frequently occuring commute durations in Gypsum are 5 to 9 minutes (1,199 commuters, 30.6%), 30 to 34 minutes (579 commuters, 14.8%), and 15 to 19 minutes (459 commuters, 11.7%).
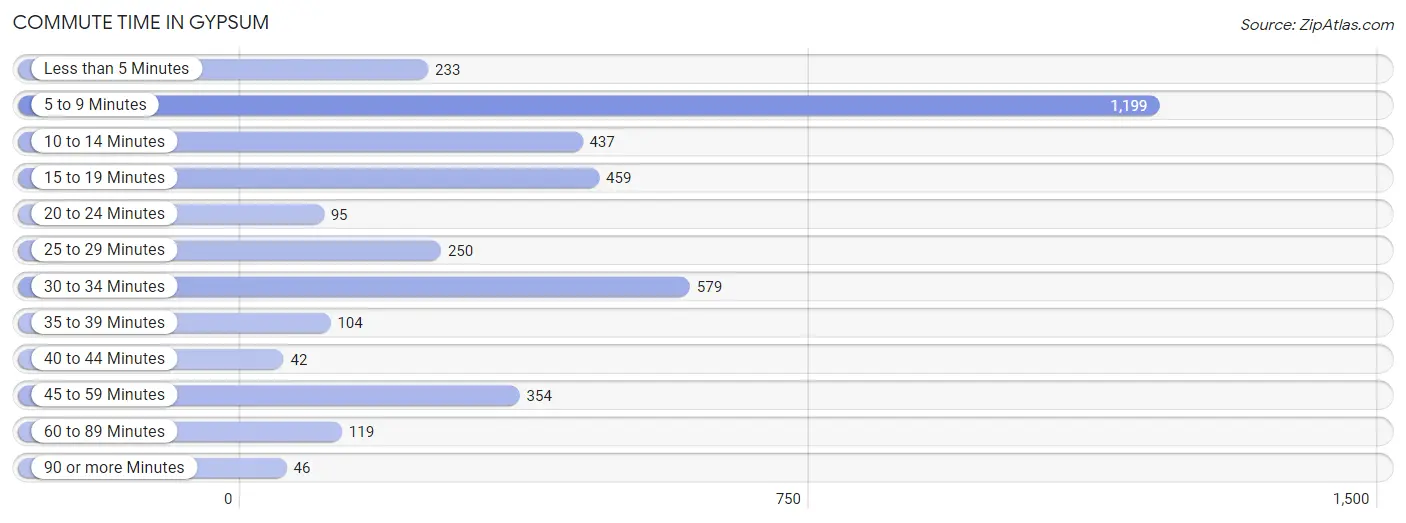
| Commute Time | # Commuters | % Commuters |
| Less than 5 Minutes | 233 | 5.9% |
| 5 to 9 Minutes | 1,199 | 30.6% |
| 10 to 14 Minutes | 437 | 11.2% |
| 15 to 19 Minutes | 459 | 11.7% |
| 20 to 24 Minutes | 95 | 2.4% |
| 25 to 29 Minutes | 250 | 6.4% |
| 30 to 34 Minutes | 579 | 14.8% |
| 35 to 39 Minutes | 104 | 2.7% |
| 40 to 44 Minutes | 42 | 1.1% |
| 45 to 59 Minutes | 354 | 9.0% |
| 60 to 89 Minutes | 119 | 3.0% |
| 90 or more Minutes | 46 | 1.2% |
Commute Time by Sex in Gypsum
The most common commute times in Gypsum are 5 to 9 minutes (665 commuters, 29.3%) for males and 5 to 9 minutes (534 commuters, 32.3%) for females.
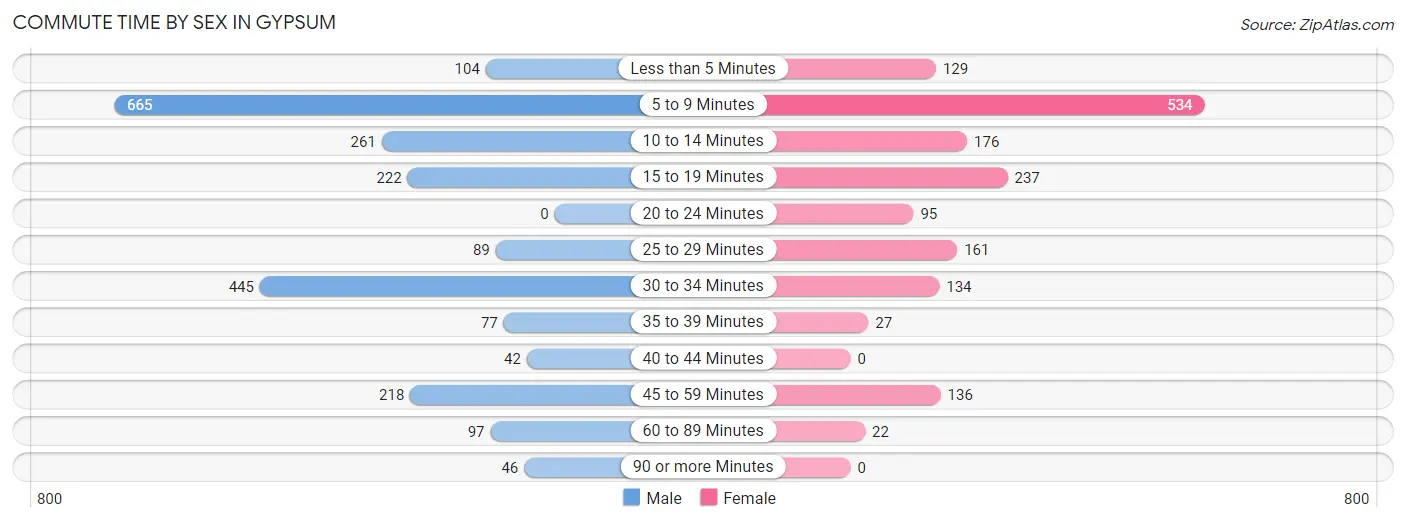
| Commute Time | Male | Female |
| Less than 5 Minutes | 104 (4.6%) | 129 (7.8%) |
| 5 to 9 Minutes | 665 (29.3%) | 534 (32.3%) |
| 10 to 14 Minutes | 261 (11.5%) | 176 (10.7%) |
| 15 to 19 Minutes | 222 (9.8%) | 237 (14.3%) |
| 20 to 24 Minutes | 0 (0.0%) | 95 (5.8%) |
| 25 to 29 Minutes | 89 (3.9%) | 161 (9.8%) |
| 30 to 34 Minutes | 445 (19.6%) | 134 (8.1%) |
| 35 to 39 Minutes | 77 (3.4%) | 27 (1.6%) |
| 40 to 44 Minutes | 42 (1.8%) | 0 (0.0%) |
| 45 to 59 Minutes | 218 (9.6%) | 136 (8.2%) |
| 60 to 89 Minutes | 97 (4.3%) | 22 (1.3%) |
| 90 or more Minutes | 46 (2.0%) | 0 (0.0%) |
Time of Departure to Work by Sex in Gypsum
The most frequent times of departure to work in Gypsum are 7:00 AM to 7:29 AM (505, 22.3%) for males and 7:30 AM to 7:59 AM (673, 40.8%) for females.
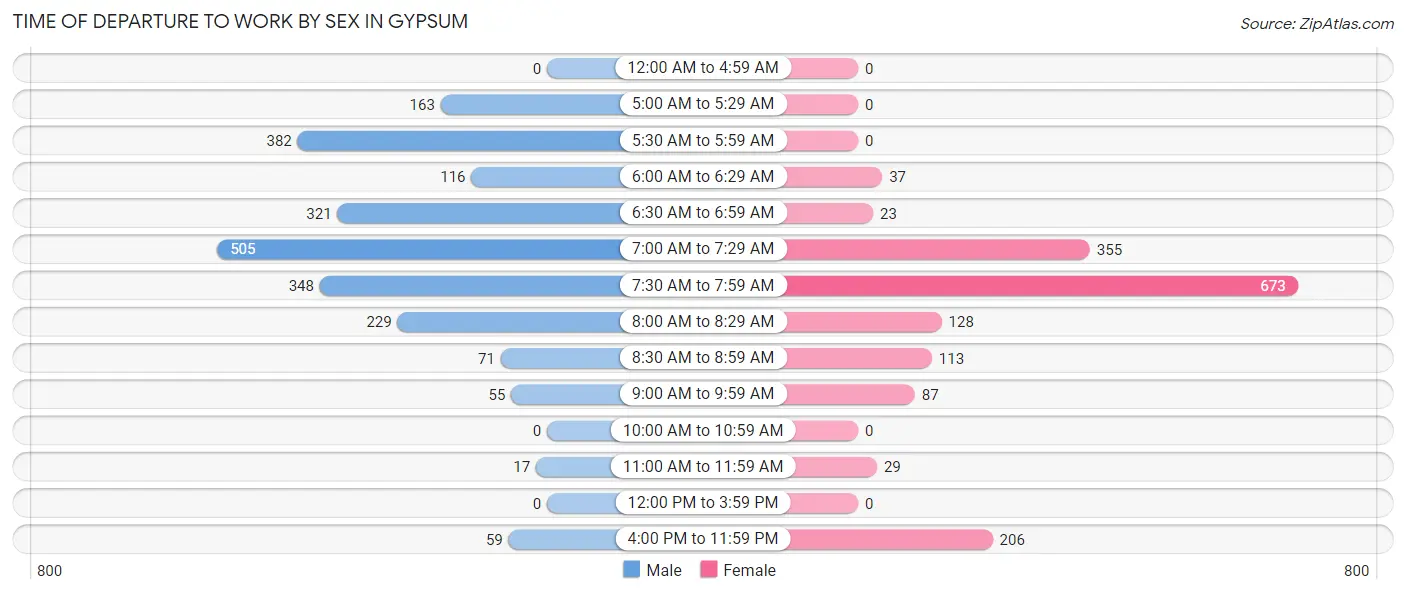
| Time of Departure | Male | Female |
| 12:00 AM to 4:59 AM | 0 (0.0%) | 0 (0.0%) |
| 5:00 AM to 5:29 AM | 163 (7.2%) | 0 (0.0%) |
| 5:30 AM to 5:59 AM | 382 (16.9%) | 0 (0.0%) |
| 6:00 AM to 6:29 AM | 116 (5.1%) | 37 (2.2%) |
| 6:30 AM to 6:59 AM | 321 (14.2%) | 23 (1.4%) |
| 7:00 AM to 7:29 AM | 505 (22.3%) | 355 (21.5%) |
| 7:30 AM to 7:59 AM | 348 (15.4%) | 673 (40.8%) |
| 8:00 AM to 8:29 AM | 229 (10.1%) | 128 (7.7%) |
| 8:30 AM to 8:59 AM | 71 (3.1%) | 113 (6.8%) |
| 9:00 AM to 9:59 AM | 55 (2.4%) | 87 (5.3%) |
| 10:00 AM to 10:59 AM | 0 (0.0%) | 0 (0.0%) |
| 11:00 AM to 11:59 AM | 17 (0.7%) | 29 (1.8%) |
| 12:00 PM to 3:59 PM | 0 (0.0%) | 0 (0.0%) |
| 4:00 PM to 11:59 PM | 59 (2.6%) | 206 (12.5%) |
| Total | 2,266 (100.0%) | 1,651 (100.0%) |
Housing Occupancy in Gypsum
Occupancy by Ownership in Gypsum
Of the total 2,351 dwellings in Gypsum, owner-occupied units account for 1,753 (74.6%), while renter-occupied units make up 598 (25.4%).
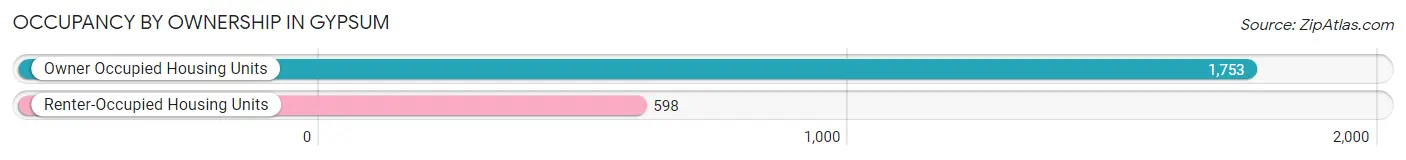
| Occupancy | # Housing Units | % Housing Units |
| Owner Occupied Housing Units | 1,753 | 74.6% |
| Renter-Occupied Housing Units | 598 | 25.4% |
| Total Occupied Housing Units | 2,351 | 100.0% |
Occupancy by Household Size in Gypsum
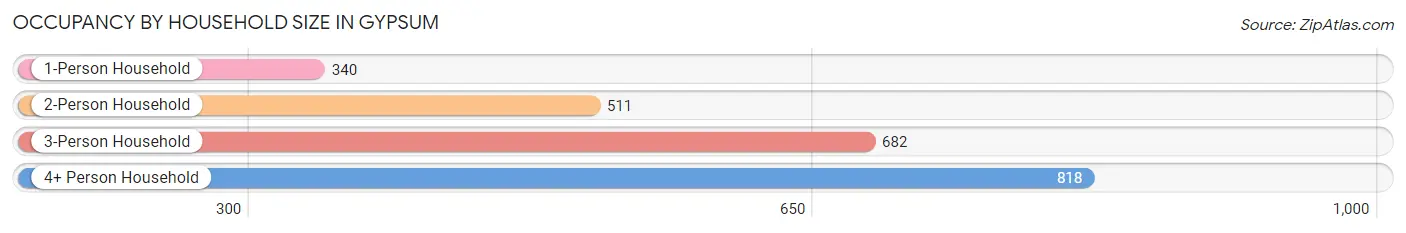
| Household Size | # Housing Units | % Housing Units |
| 1-Person Household | 340 | 14.5% |
| 2-Person Household | 511 | 21.7% |
| 3-Person Household | 682 | 29.0% |
| 4+ Person Household | 818 | 34.8% |
| Total Housing Units | 2,351 | 100.0% |
Occupancy by Ownership by Household Size in Gypsum
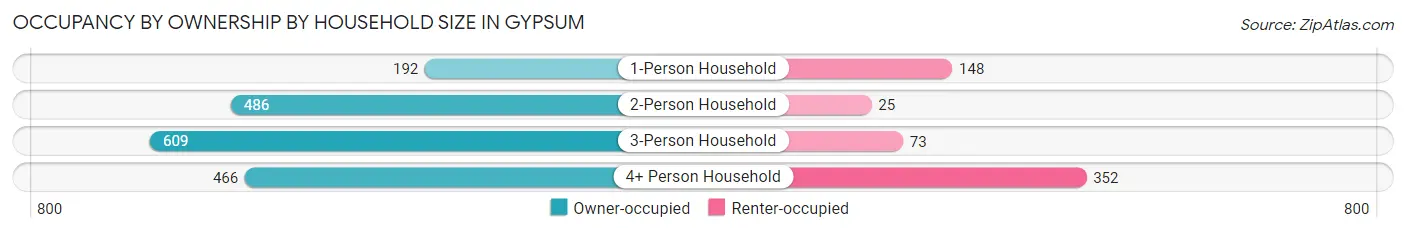
| Household Size | Owner-occupied | Renter-occupied |
| 1-Person Household | 192 (56.5%) | 148 (43.5%) |
| 2-Person Household | 486 (95.1%) | 25 (4.9%) |
| 3-Person Household | 609 (89.3%) | 73 (10.7%) |
| 4+ Person Household | 466 (57.0%) | 352 (43.0%) |
| Total Housing Units | 1,753 (74.6%) | 598 (25.4%) |
Occupancy by Educational Attainment in Gypsum
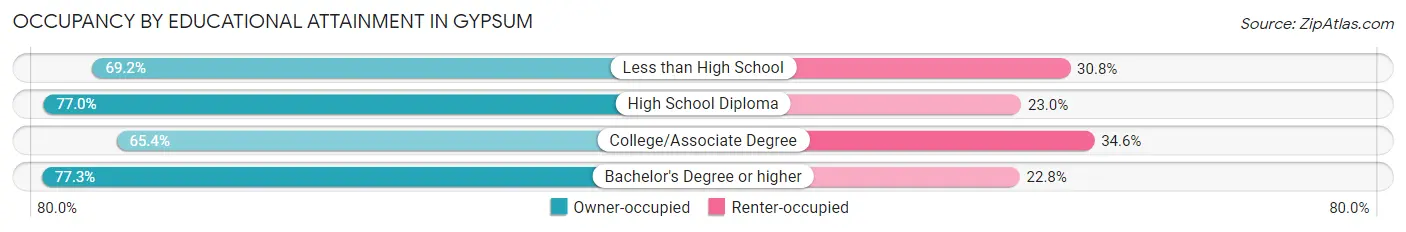
| Household Size | Owner-occupied | Renter-occupied |
| Less than High School | 171 (69.2%) | 76 (30.8%) |
| High School Diploma | 754 (77.0%) | 225 (23.0%) |
| College/Associate Degree | 227 (65.4%) | 120 (34.6%) |
| Bachelor's Degree or higher | 601 (77.2%) | 177 (22.8%) |
Occupancy by Age of Householder in Gypsum
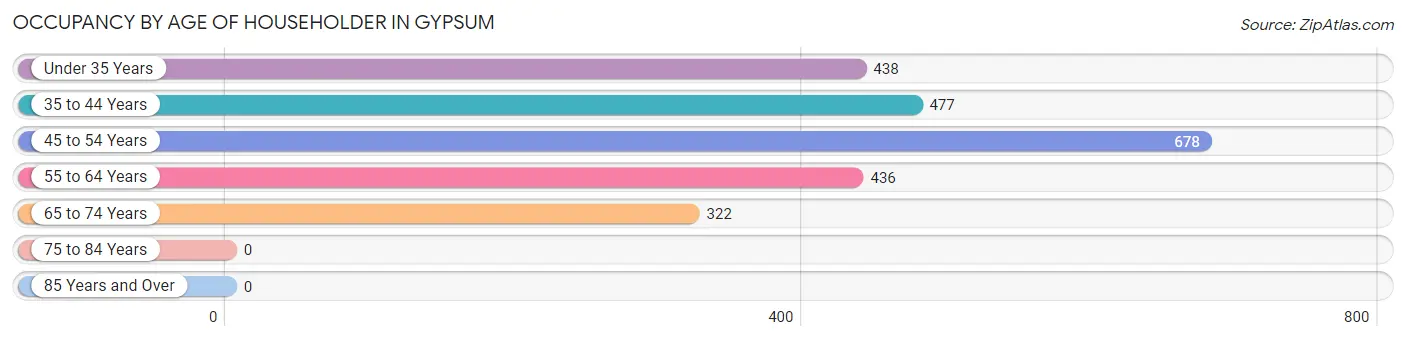
| Age Bracket | # Households | % Households |
| Under 35 Years | 438 | 18.6% |
| 35 to 44 Years | 477 | 20.3% |
| 45 to 54 Years | 678 | 28.8% |
| 55 to 64 Years | 436 | 18.5% |
| 65 to 74 Years | 322 | 13.7% |
| 75 to 84 Years | 0 | 0.0% |
| 85 Years and Over | 0 | 0.0% |
| Total | 2,351 | 100.0% |
Housing Finances in Gypsum
Median Income by Occupancy in Gypsum
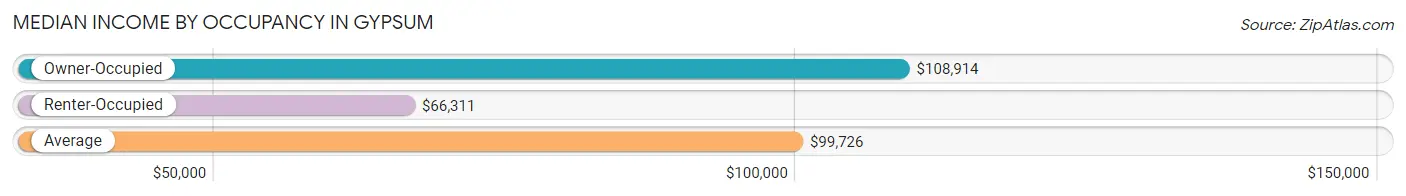
| Occupancy Type | # Households | Median Income |
| Owner-Occupied | 1,753 (74.6%) | $108,914 |
| Renter-Occupied | 598 (25.4%) | $66,311 |
| Average | 2,351 (100.0%) | $99,726 |
Occupancy by Householder Income Bracket in Gypsum
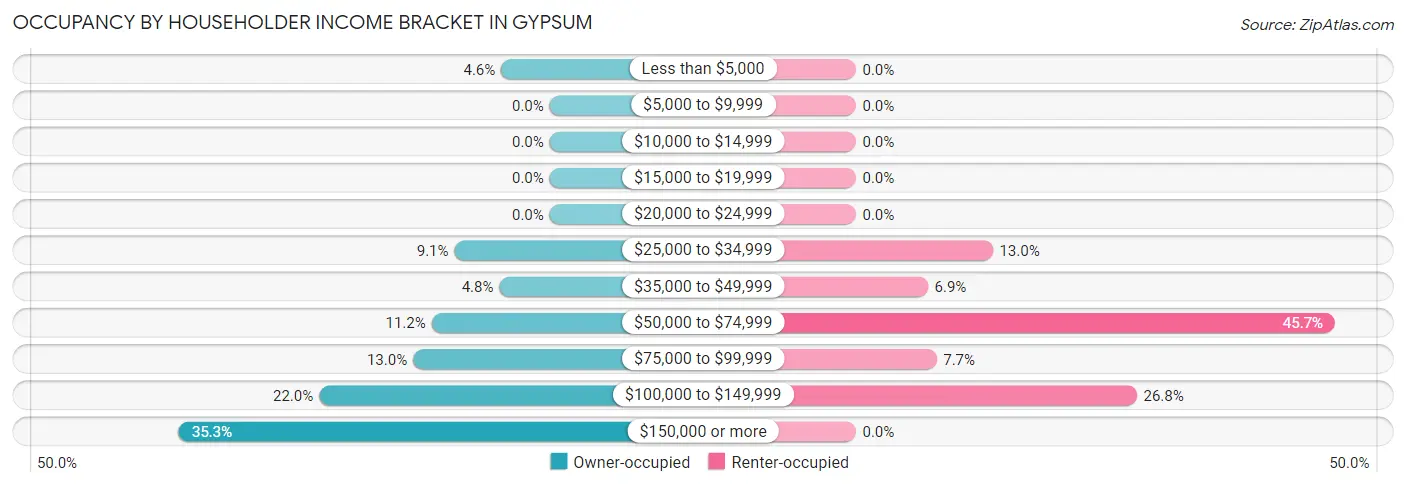
| Income Bracket | Owner-occupied | Renter-occupied |
| Less than $5,000 | 81 (4.6%) | 0 (0.0%) |
| $5,000 to $9,999 | 0 (0.0%) | 0 (0.0%) |
| $10,000 to $14,999 | 0 (0.0%) | 0 (0.0%) |
| $15,000 to $19,999 | 0 (0.0%) | 0 (0.0%) |
| $20,000 to $24,999 | 0 (0.0%) | 0 (0.0%) |
| $25,000 to $34,999 | 159 (9.1%) | 78 (13.0%) |
| $35,000 to $49,999 | 84 (4.8%) | 41 (6.9%) |
| $50,000 to $74,999 | 197 (11.2%) | 273 (45.7%) |
| $75,000 to $99,999 | 228 (13.0%) | 46 (7.7%) |
| $100,000 to $149,999 | 385 (22.0%) | 160 (26.8%) |
| $150,000 or more | 619 (35.3%) | 0 (0.0%) |
| Total | 1,753 (100.0%) | 598 (100.0%) |
Monthly Housing Cost Tiers in Gypsum
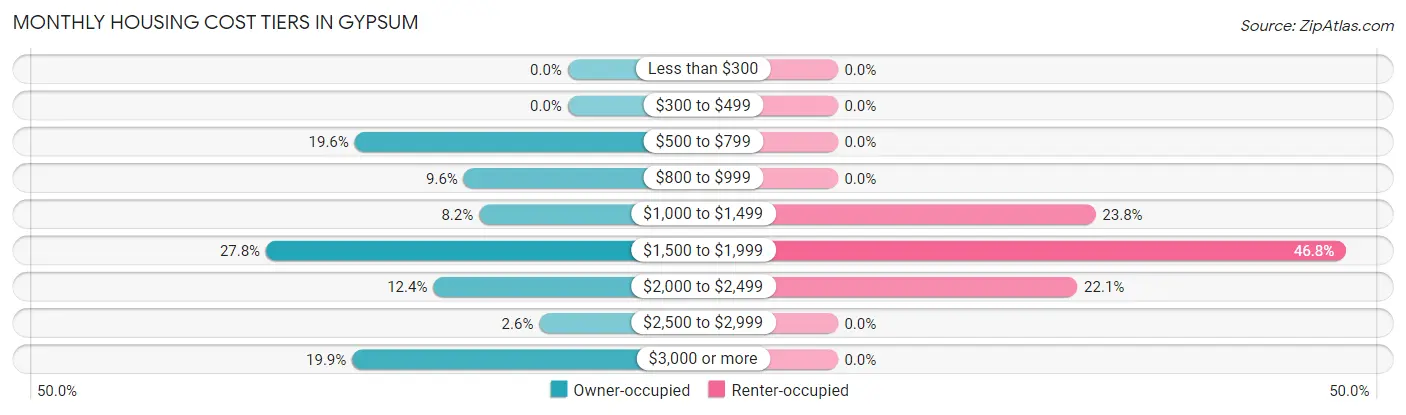
| Monthly Cost | Owner-occupied | Renter-occupied |
| Less than $300 | 0 (0.0%) | 0 (0.0%) |
| $300 to $499 | 0 (0.0%) | 0 (0.0%) |
| $500 to $799 | 344 (19.6%) | 0 (0.0%) |
| $800 to $999 | 168 (9.6%) | 0 (0.0%) |
| $1,000 to $1,499 | 143 (8.2%) | 142 (23.7%) |
| $1,500 to $1,999 | 487 (27.8%) | 280 (46.8%) |
| $2,000 to $2,499 | 217 (12.4%) | 132 (22.1%) |
| $2,500 to $2,999 | 46 (2.6%) | 0 (0.0%) |
| $3,000 or more | 348 (19.9%) | 0 (0.0%) |
| Total | 1,753 (100.0%) | 598 (100.0%) |
Physical Housing Characteristics in Gypsum
Housing Structures in Gypsum
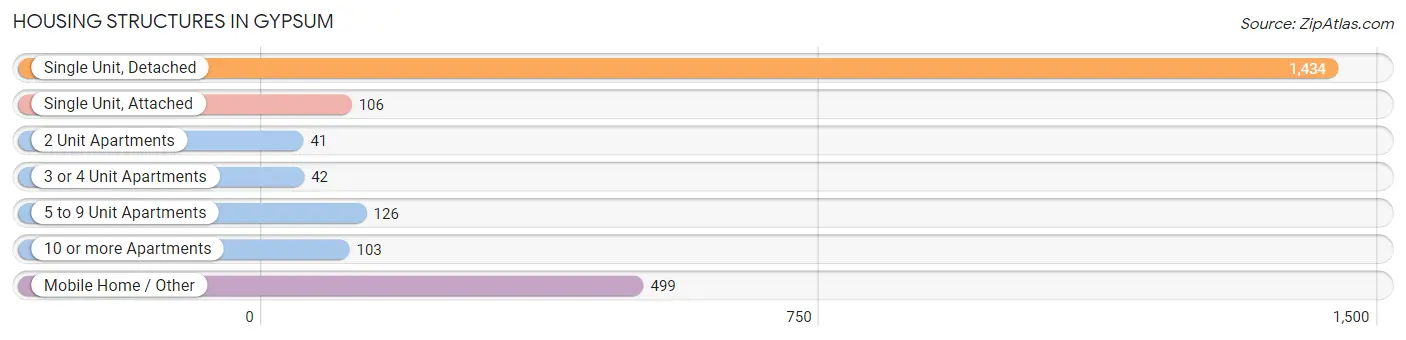
| Structure Type | # Housing Units | % Housing Units |
| Single Unit, Detached | 1,434 | 61.0% |
| Single Unit, Attached | 106 | 4.5% |
| 2 Unit Apartments | 41 | 1.7% |
| 3 or 4 Unit Apartments | 42 | 1.8% |
| 5 to 9 Unit Apartments | 126 | 5.4% |
| 10 or more Apartments | 103 | 4.4% |
| Mobile Home / Other | 499 | 21.2% |
| Total | 2,351 | 100.0% |
Housing Structures by Occupancy in Gypsum
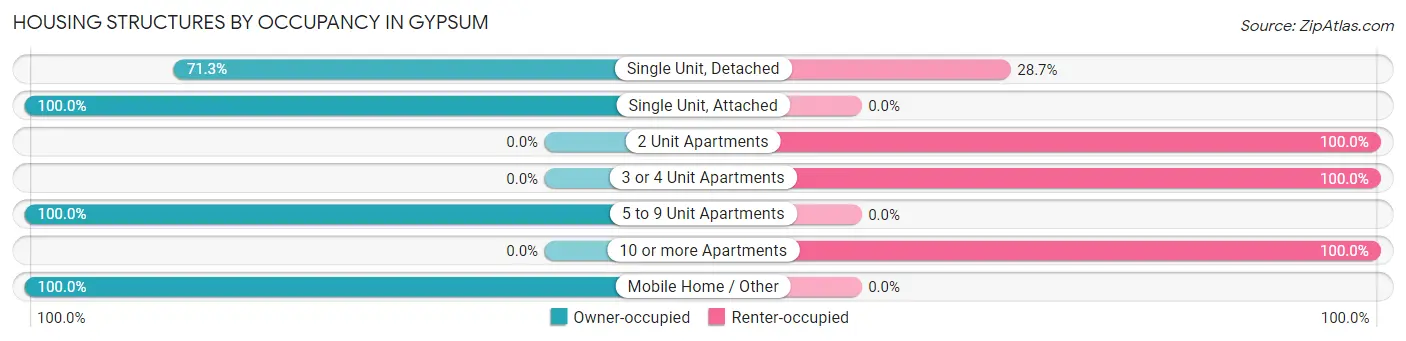
| Structure Type | Owner-occupied | Renter-occupied |
| Single Unit, Detached | 1,022 (71.3%) | 412 (28.7%) |
| Single Unit, Attached | 106 (100.0%) | 0 (0.0%) |
| 2 Unit Apartments | 0 (0.0%) | 41 (100.0%) |
| 3 or 4 Unit Apartments | 0 (0.0%) | 42 (100.0%) |
| 5 to 9 Unit Apartments | 126 (100.0%) | 0 (0.0%) |
| 10 or more Apartments | 0 (0.0%) | 103 (100.0%) |
| Mobile Home / Other | 499 (100.0%) | 0 (0.0%) |
| Total | 1,753 (74.6%) | 598 (25.4%) |
Housing Structures by Number of Rooms in Gypsum
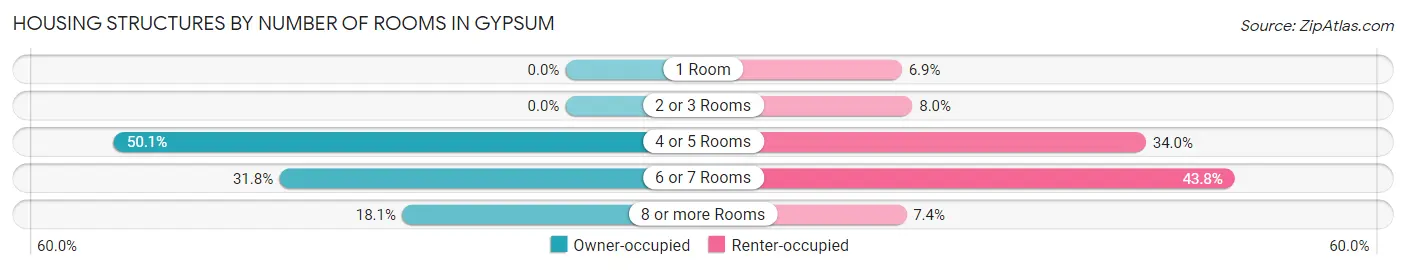
| Number of Rooms | Owner-occupied | Renter-occupied |
| 1 Room | 0 (0.0%) | 41 (6.9%) |
| 2 or 3 Rooms | 0 (0.0%) | 48 (8.0%) |
| 4 or 5 Rooms | 878 (50.1%) | 203 (34.0%) |
| 6 or 7 Rooms | 557 (31.8%) | 262 (43.8%) |
| 8 or more Rooms | 318 (18.1%) | 44 (7.4%) |
| Total | 1,753 (100.0%) | 598 (100.0%) |
Housing Structure by Heating Type in Gypsum
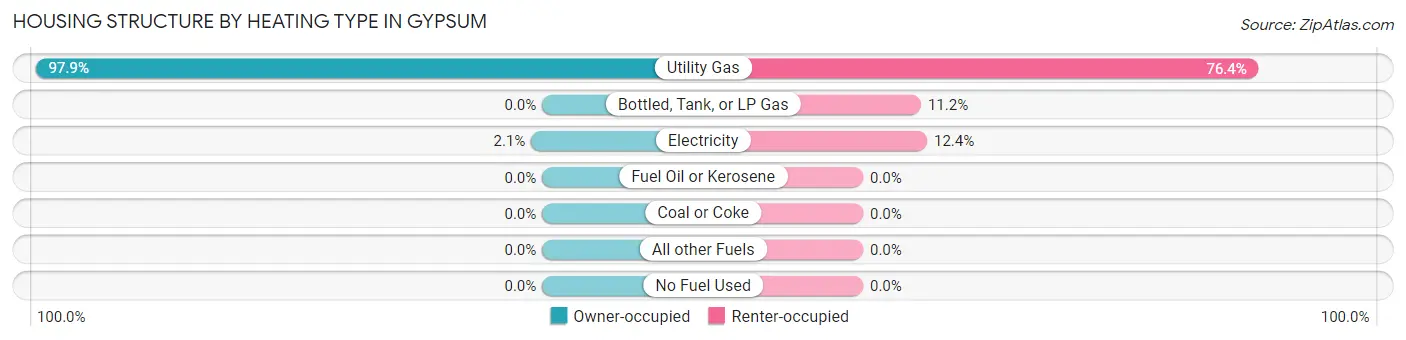
| Heating Type | Owner-occupied | Renter-occupied |
| Utility Gas | 1,716 (97.9%) | 457 (76.4%) |
| Bottled, Tank, or LP Gas | 0 (0.0%) | 67 (11.2%) |
| Electricity | 37 (2.1%) | 74 (12.4%) |
| Fuel Oil or Kerosene | 0 (0.0%) | 0 (0.0%) |
| Coal or Coke | 0 (0.0%) | 0 (0.0%) |
| All other Fuels | 0 (0.0%) | 0 (0.0%) |
| No Fuel Used | 0 (0.0%) | 0 (0.0%) |
| Total | 1,753 (100.0%) | 598 (100.0%) |
Household Vehicle Usage in Gypsum
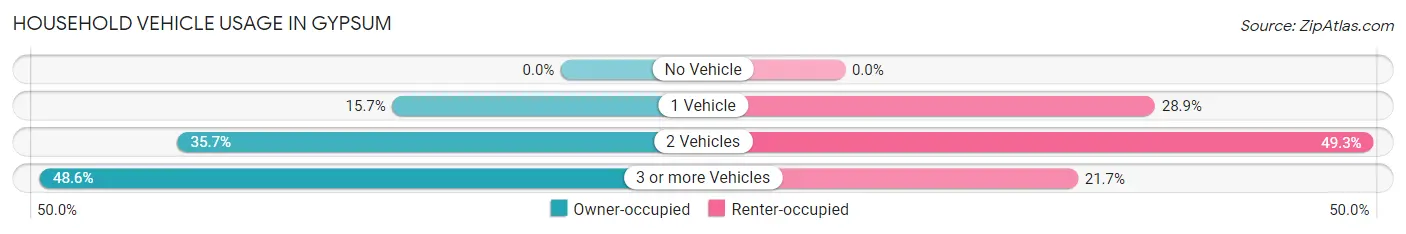
| Vehicles per Household | Owner-occupied | Renter-occupied |
| No Vehicle | 0 (0.0%) | 0 (0.0%) |
| 1 Vehicle | 276 (15.7%) | 173 (28.9%) |
| 2 Vehicles | 626 (35.7%) | 295 (49.3%) |
| 3 or more Vehicles | 851 (48.5%) | 130 (21.7%) |
| Total | 1,753 (100.0%) | 598 (100.0%) |
Real Estate & Mortgages in Gypsum
Real Estate and Mortgage Overview in Gypsum
| Characteristic | Without Mortgage | With Mortgage |
| Housing Units | 434 | 1,319 |
| Median Property Value | - | - |
| Median Household Income | $98,976 | $556 |
| Monthly Housing Costs | $762 | $348 |
| Real Estate Taxes | - | - |
Property Value by Mortgage Status in Gypsum
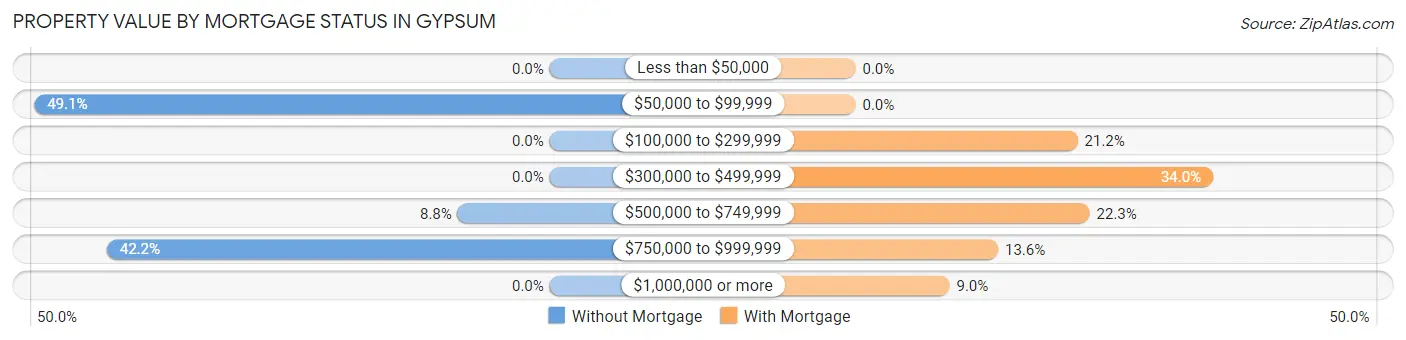
| Property Value | Without Mortgage | With Mortgage |
| Less than $50,000 | 0 (0.0%) | 0 (0.0%) |
| $50,000 to $99,999 | 213 (49.1%) | 0 (0.0%) |
| $100,000 to $299,999 | 0 (0.0%) | 279 (21.1%) |
| $300,000 to $499,999 | 0 (0.0%) | 449 (34.0%) |
| $500,000 to $749,999 | 38 (8.8%) | 294 (22.3%) |
| $750,000 to $999,999 | 183 (42.2%) | 179 (13.6%) |
| $1,000,000 or more | 0 (0.0%) | 118 (8.9%) |
| Total | 434 (100.0%) | 1,319 (100.0%) |
Household Income by Mortgage Status in Gypsum
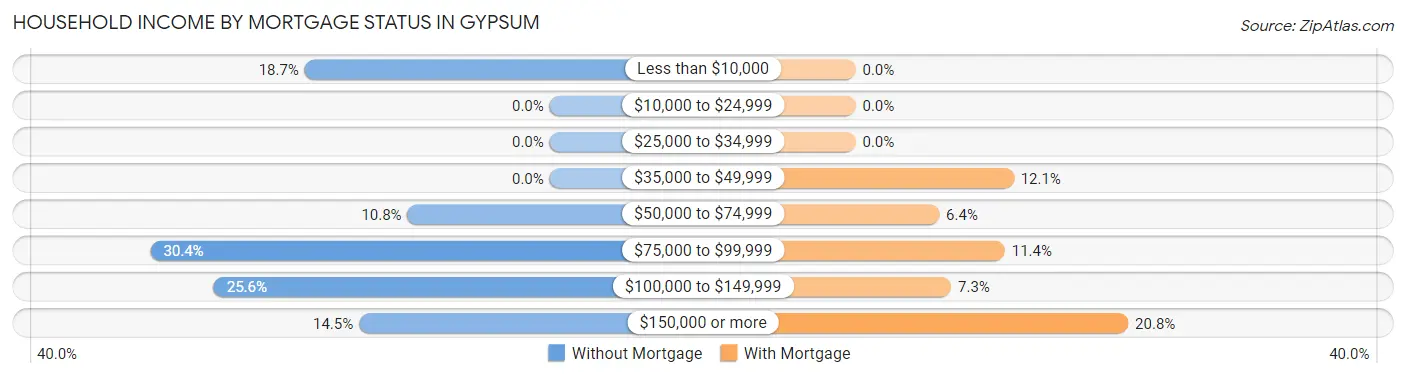
| Household Income | Without Mortgage | With Mortgage |
| Less than $10,000 | 81 (18.7%) | 0 (0.0%) |
| $10,000 to $24,999 | 0 (0.0%) | 0 (0.0%) |
| $25,000 to $34,999 | 0 (0.0%) | 0 (0.0%) |
| $35,000 to $49,999 | 0 (0.0%) | 159 (12.0%) |
| $50,000 to $74,999 | 47 (10.8%) | 84 (6.4%) |
| $75,000 to $99,999 | 132 (30.4%) | 150 (11.4%) |
| $100,000 to $149,999 | 111 (25.6%) | 96 (7.3%) |
| $150,000 or more | 63 (14.5%) | 274 (20.8%) |
| Total | 434 (100.0%) | 1,319 (100.0%) |
Property Value to Household Income Ratio in Gypsum
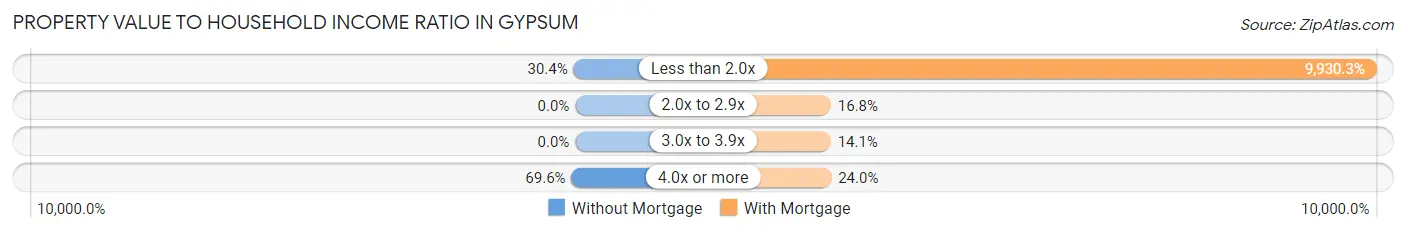
| Value-to-Income Ratio | Without Mortgage | With Mortgage |
| Less than 2.0x | 132 (30.4%) | 130,980 (9,930.2%) |
| 2.0x to 2.9x | 0 (0.0%) | 222 (16.8%) |
| 3.0x to 3.9x | 0 (0.0%) | 186 (14.1%) |
| 4.0x or more | 302 (69.6%) | 317 (24.0%) |
| Total | 434 (100.0%) | 1,319 (100.0%) |
Real Estate Taxes by Mortgage Status in Gypsum
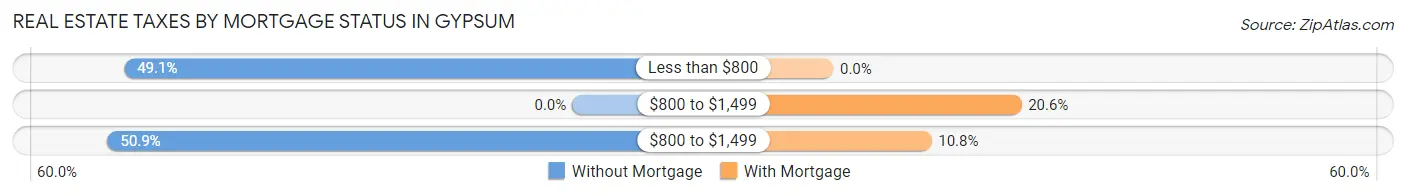
| Property Taxes | Without Mortgage | With Mortgage |
| Less than $800 | 213 (49.1%) | 0 (0.0%) |
| $800 to $1,499 | 0 (0.0%) | 272 (20.6%) |
| $800 to $1,499 | 221 (50.9%) | 142 (10.8%) |
| Total | 434 (100.0%) | 1,319 (100.0%) |
Health & Disability in Gypsum
Health Insurance Coverage by Age in Gypsum
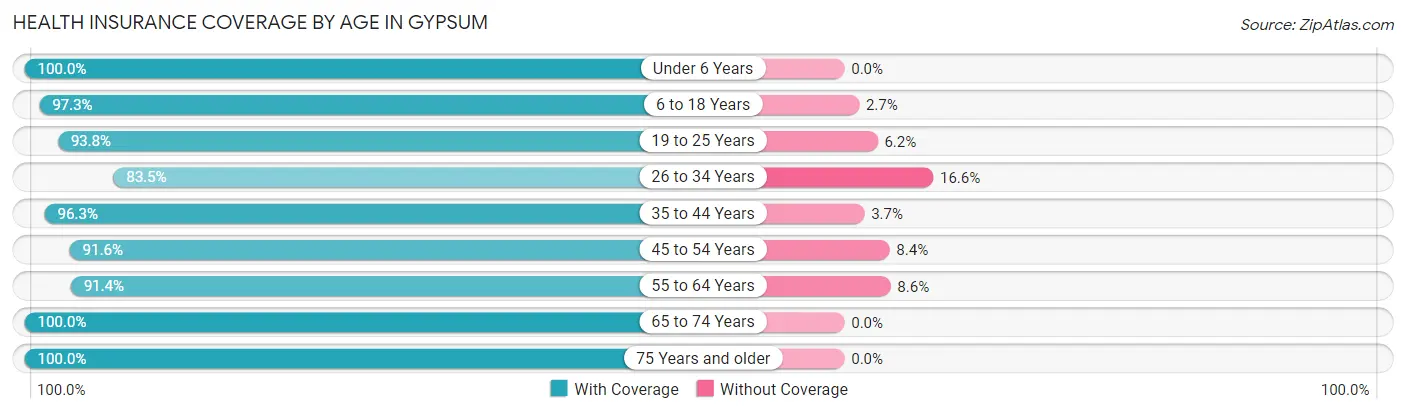
| Age Bracket | With Coverage | Without Coverage |
| Under 6 Years | 562 (100.0%) | 0 (0.0%) |
| 6 to 18 Years | 1,927 (97.3%) | 54 (2.7%) |
| 19 to 25 Years | 334 (93.8%) | 22 (6.2%) |
| 26 to 34 Years | 605 (83.5%) | 120 (16.6%) |
| 35 to 44 Years | 1,217 (96.3%) | 47 (3.7%) |
| 45 to 54 Years | 1,165 (91.6%) | 107 (8.4%) |
| 55 to 64 Years | 680 (91.4%) | 64 (8.6%) |
| 65 to 74 Years | 718 (100.0%) | 0 (0.0%) |
| 75 Years and older | 669 (100.0%) | 0 (0.0%) |
| Total | 7,877 (95.0%) | 414 (5.0%) |
Health Insurance Coverage by Citizenship Status in Gypsum
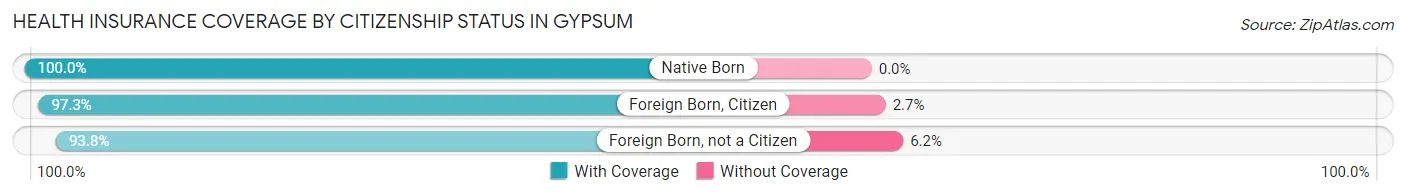
| Citizenship Status | With Coverage | Without Coverage |
| Native Born | 562 (100.0%) | 0 (0.0%) |
| Foreign Born, Citizen | 1,927 (97.3%) | 54 (2.7%) |
| Foreign Born, not a Citizen | 334 (93.8%) | 22 (6.2%) |
Health Insurance Coverage by Household Income in Gypsum
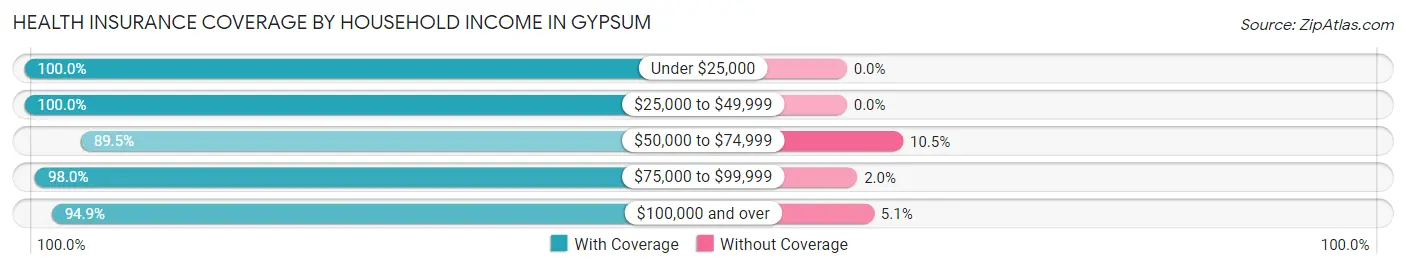
| Household Income | With Coverage | Without Coverage |
| Under $25,000 | 81 (100.0%) | 0 (0.0%) |
| $25,000 to $49,999 | 1,029 (100.0%) | 0 (0.0%) |
| $50,000 to $74,999 | 1,562 (89.5%) | 184 (10.5%) |
| $75,000 to $99,999 | 1,449 (98.0%) | 29 (2.0%) |
| $100,000 and over | 3,756 (94.9%) | 201 (5.1%) |
Public vs Private Health Insurance Coverage by Age in Gypsum
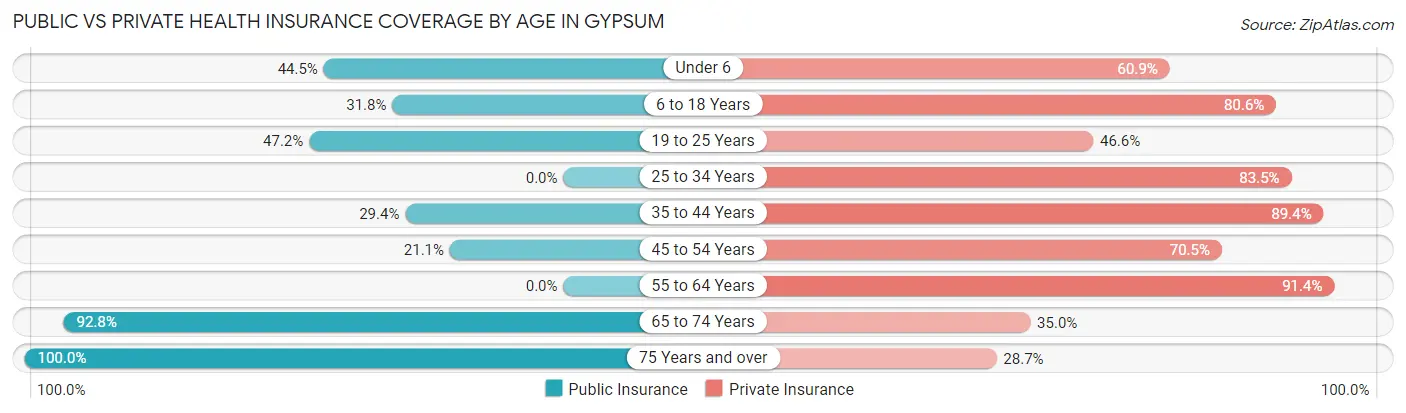
| Age Bracket | Public Insurance | Private Insurance |
| Under 6 | 250 (44.5%) | 342 (60.9%) |
| 6 to 18 Years | 629 (31.8%) | 1,597 (80.6%) |
| 19 to 25 Years | 168 (47.2%) | 166 (46.6%) |
| 25 to 34 Years | 0 (0.0%) | 605 (83.5%) |
| 35 to 44 Years | 371 (29.3%) | 1,130 (89.4%) |
| 45 to 54 Years | 268 (21.1%) | 897 (70.5%) |
| 55 to 64 Years | 0 (0.0%) | 680 (91.4%) |
| 65 to 74 Years | 666 (92.8%) | 251 (35.0%) |
| 75 Years and over | 669 (100.0%) | 192 (28.7%) |
| Total | 3,021 (36.4%) | 5,860 (70.7%) |
Disability Status by Sex by Age in Gypsum
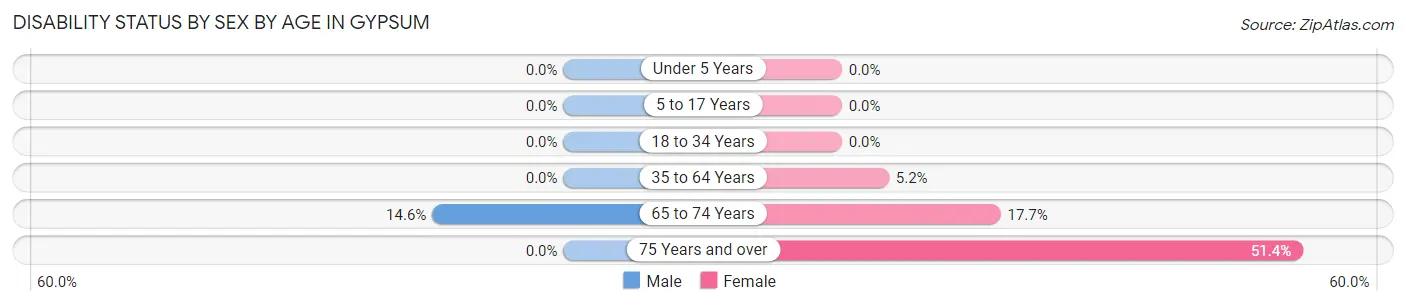
| Age Bracket | Male | Female |
| Under 5 Years | 0 (0.0%) | 0 (0.0%) |
| 5 to 17 Years | 0 (0.0%) | 0 (0.0%) |
| 18 to 34 Years | 0 (0.0%) | 0 (0.0%) |
| 35 to 64 Years | 0 (0.0%) | 81 (5.2%) |
| 65 to 74 Years | 52 (14.6%) | 64 (17.7%) |
| 75 Years and over | 0 (0.0%) | 245 (51.4%) |
Disability Class by Sex by Age in Gypsum
Disability Class: Hearing Difficulty
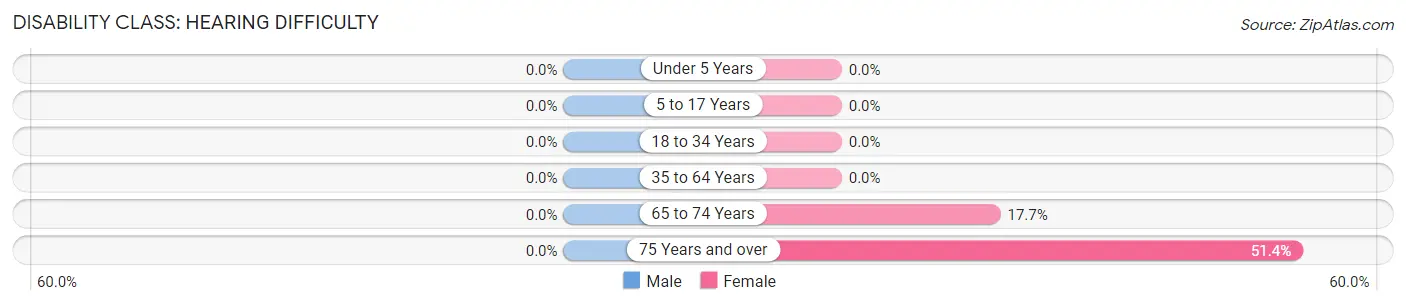
| Age Bracket | Male | Female |
| Under 5 Years | 0 (0.0%) | 0 (0.0%) |
| 5 to 17 Years | 0 (0.0%) | 0 (0.0%) |
| 18 to 34 Years | 0 (0.0%) | 0 (0.0%) |
| 35 to 64 Years | 0 (0.0%) | 0 (0.0%) |
| 65 to 74 Years | 0 (0.0%) | 64 (17.7%) |
| 75 Years and over | 0 (0.0%) | 245 (51.4%) |
Disability Class: Vision Difficulty
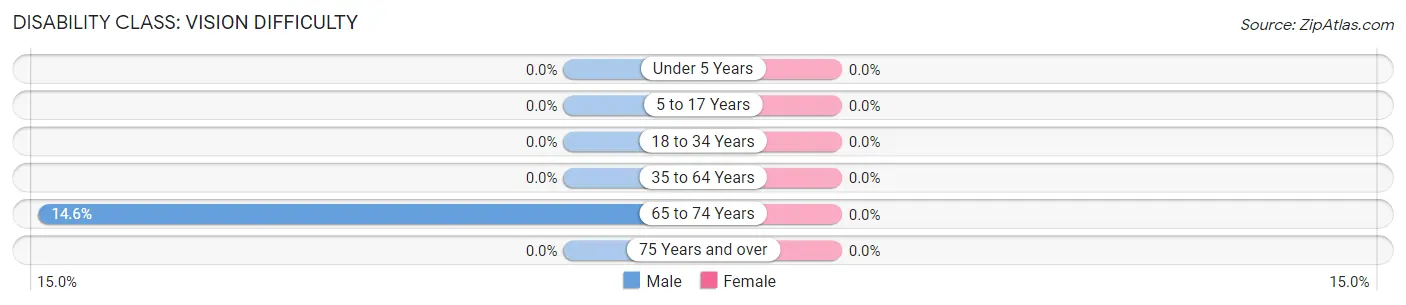
| Age Bracket | Male | Female |
| Under 5 Years | 0 (0.0%) | 0 (0.0%) |
| 5 to 17 Years | 0 (0.0%) | 0 (0.0%) |
| 18 to 34 Years | 0 (0.0%) | 0 (0.0%) |
| 35 to 64 Years | 0 (0.0%) | 0 (0.0%) |
| 65 to 74 Years | 52 (14.6%) | 0 (0.0%) |
| 75 Years and over | 0 (0.0%) | 0 (0.0%) |
Disability Class: Cognitive Difficulty
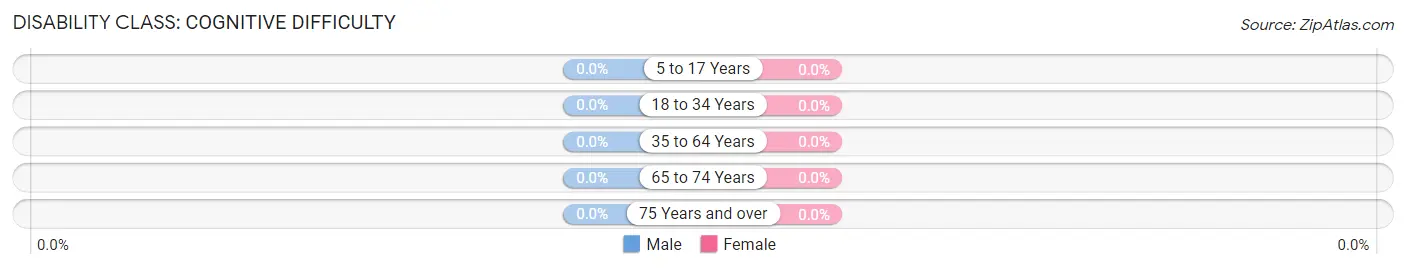
| Age Bracket | Male | Female |
| 5 to 17 Years | 0 (0.0%) | 0 (0.0%) |
| 18 to 34 Years | 0 (0.0%) | 0 (0.0%) |
| 35 to 64 Years | 0 (0.0%) | 0 (0.0%) |
| 65 to 74 Years | 0 (0.0%) | 0 (0.0%) |
| 75 Years and over | 0 (0.0%) | 0 (0.0%) |
Disability Class: Ambulatory Difficulty
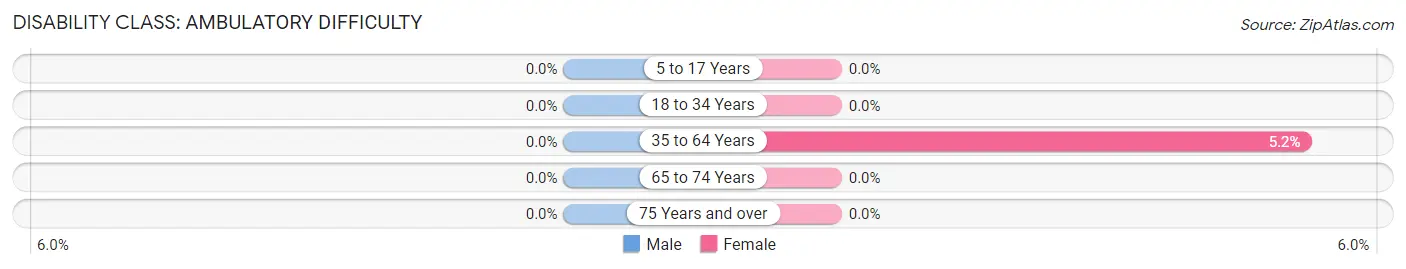
| Age Bracket | Male | Female |
| 5 to 17 Years | 0 (0.0%) | 0 (0.0%) |
| 18 to 34 Years | 0 (0.0%) | 0 (0.0%) |
| 35 to 64 Years | 0 (0.0%) | 81 (5.2%) |
| 65 to 74 Years | 0 (0.0%) | 0 (0.0%) |
| 75 Years and over | 0 (0.0%) | 0 (0.0%) |
Disability Class: Self-Care Difficulty
| Age Bracket | Male | Female |
| 5 to 17 Years | 0 (0.0%) | 0 (0.0%) |
| 18 to 34 Years | 0 (0.0%) | 0 (0.0%) |
| 35 to 64 Years | 0 (0.0%) | 0 (0.0%) |
| 65 to 74 Years | 0 (0.0%) | 0 (0.0%) |
| 75 Years and over | 0 (0.0%) | 0 (0.0%) |
Technology Access in Gypsum
Computing Device Access in Gypsum
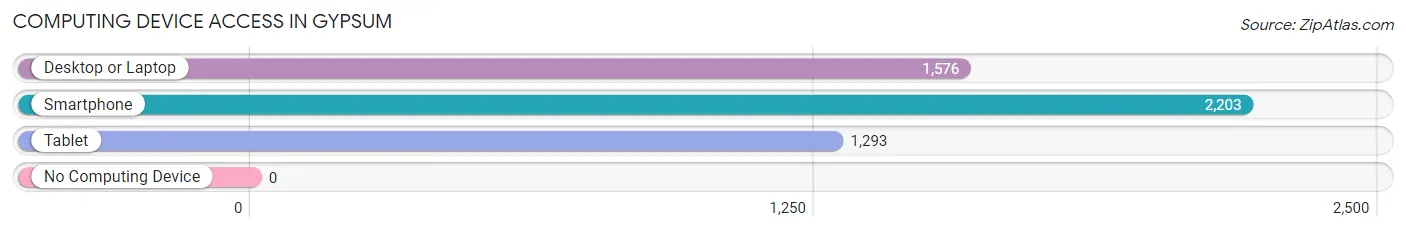
| Device Type | # Households | % Households |
| Desktop or Laptop | 1,576 | 67.0% |
| Smartphone | 2,203 | 93.7% |
| Tablet | 1,293 | 55.0% |
| No Computing Device | 0 | 0.0% |
| Total | 2,351 | 100.0% |
Internet Access in Gypsum
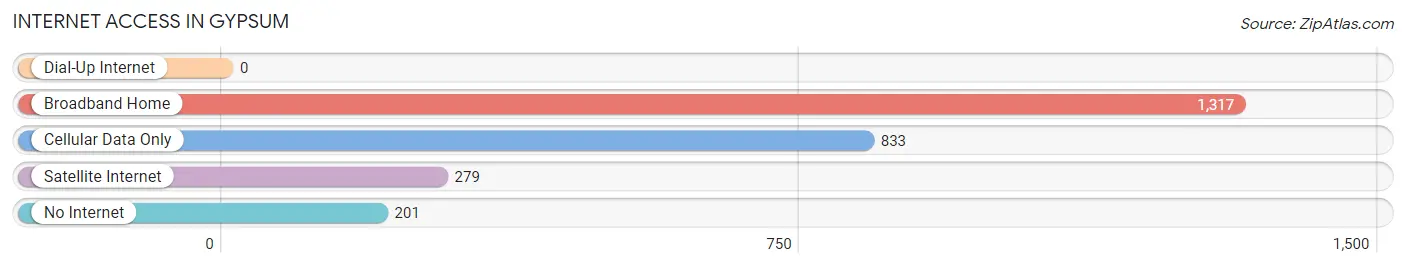
| Internet Type | # Households | % Households |
| Dial-Up Internet | 0 | 0.0% |
| Broadband Home | 1,317 | 56.0% |
| Cellular Data Only | 833 | 35.4% |
| Satellite Internet | 279 | 11.9% |
| No Internet | 201 | 8.6% |
| Total | 2,351 | 100.0% |
Gypsum Summary
Gypsum, Colorado is a small town located in Eagle County, Colorado. It is situated in the heart of the Rocky Mountains, approximately 10 miles east of the town of Eagle and 30 miles west of Vail. The town was founded in 1883 and has a population of approximately 6,500 people.
Geography
Gypsum is located in the heart of the Rocky Mountains, at an elevation of 6,500 feet. The town is situated in a valley surrounded by mountains, with the Eagle River running through the center of town. The town is located in a semi-arid climate, with hot summers and cold winters. The average annual precipitation is approximately 16 inches.
The town is located in Eagle County, which is part of the Colorado River Basin. The county is home to several ski resorts, including Vail, Beaver Creek, and Copper Mountain. The county is also home to the White River National Forest, which is the most visited national forest in the United States.
Economy
The economy of Gypsum is largely based on tourism and agriculture. The town is home to several ski resorts, including Vail, Beaver Creek, and Copper Mountain. These resorts attract thousands of visitors each year, providing a significant boost to the local economy.
Agriculture is also an important part of the local economy. The town is home to several farms, which produce a variety of crops, including hay, wheat, and potatoes. The town is also home to several wineries, which produce a variety of wines.
Demographics
As of the 2010 census, the population of Gypsum was 6,477. The racial makeup of the town was 94.3% White, 0.7% African American, 0.3% Native American, 0.7% Asian, 0.1% Pacific Islander, 1.7% from other races, and 2.0% from two or more races. Hispanic or Latino of any race were 5.3% of the population.
The median income for a household in the town was $50,977, and the median income for a family was $60,977. The per capita income for the town was $25,977. About 8.3% of families and 11.2% of the population were below the poverty line, including 15.2% of those under age 18 and 5.2% of those age 65 or over.
Conclusion
Gypsum, Colorado is a small town located in Eagle County, Colorado. It is situated in the heart of the Rocky Mountains, approximately 10 miles east of the town of Eagle and 30 miles west of Vail. The town was founded in 1883 and has a population of approximately 6,500 people. The economy of Gypsum is largely based on tourism and agriculture, with ski resorts and farms providing a significant boost to the local economy. The town has a diverse population, with a median income of $50,977 and a per capita income of $25,977. Gypsum is a beautiful town with a rich history and a bright future.
Common Questions
What is Per Capita Income in Gypsum?
Per Capita income in Gypsum is $39,207.
What is the Median Family Income in Gypsum?
Median Family Income in Gypsum is $102,397.
What is the Median Household income in Gypsum?
Median Household Income in Gypsum is $99,726.
What is Income or Wage Gap in Gypsum?
Income or Wage Gap in Gypsum is 44.9%.
Women in Gypsum earn 55.1 cents for every dollar earned by a man.
What is Inequality or Gini Index in Gypsum?
Inequality or Gini Index in Gypsum is 0.43.
What is the Total Population of Gypsum?
Total Population of Gypsum is 8,291.
What is the Total Male Population of Gypsum?
Total Male Population of Gypsum is 4,350.
What is the Total Female Population of Gypsum?
Total Female Population of Gypsum is 3,941.
What is the Ratio of Males per 100 Females in Gypsum?
There are 110.38 Males per 100 Females in Gypsum.
What is the Ratio of Females per 100 Males in Gypsum?
There are 90.60 Females per 100 Males in Gypsum.
What is the Median Population Age in Gypsum?
Median Population Age in Gypsum is 38.5 Years.
What is the Average Family Size in Gypsum
Average Family Size in Gypsum is 4.0 People.
What is the Average Household Size in Gypsum
Average Household Size in Gypsum is 3.5 People.
How Large is the Labor Force in Gypsum?
There are 4,317 People in the Labor Forcein in Gypsum.
What is the Percentage of People in the Labor Force in Gypsum?
66.6% of People are in the Labor Force in Gypsum.
What is the Unemployment Rate in Gypsum?
Unemployment Rate in Gypsum is 0.7%.