Area Code 929 Map & Demographics
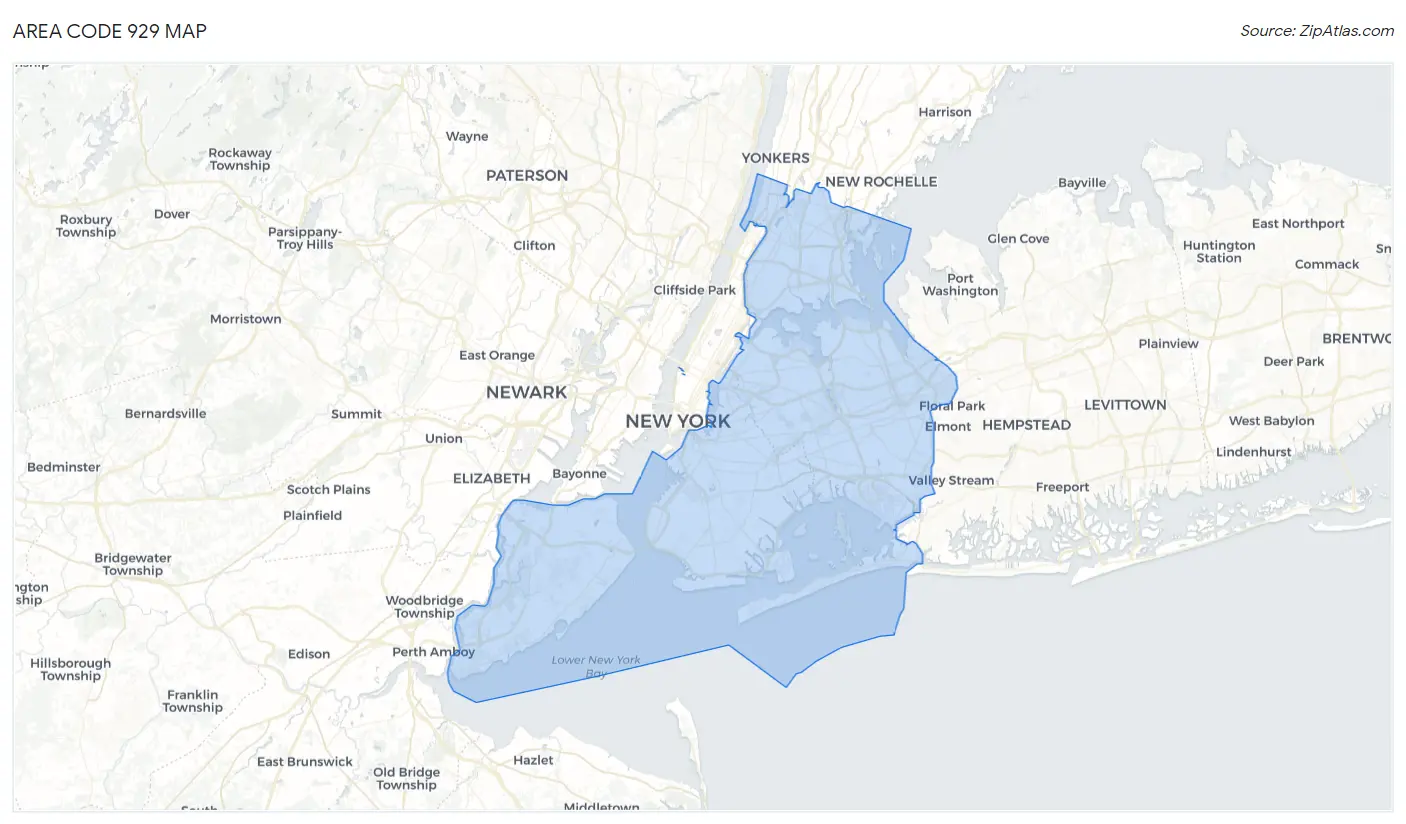
Area Code 929 Map
Area Code 929 Overview
$58,143
PER CAPITA INCOME
$119,648
AVG FAMILY INCOME
$100,959
AVG HOUSEHOLD INCOME
19.5%
WAGE / INCOME GAP [ % ]
80.5¢/ $1
WAGE / INCOME GAP [ $ ]
$10,709
FAMILY INCOME DEFICIT
22.55
INEQUALITY / GINI INDEX
2,159,122
TOTAL POPULATION
1,042,751
MALE POPULATION
1,116,371
FEMALE POPULATION
93.41
MALES / 100 FEMALES
107.06
FEMALES / 100 MALES
39.1
MEDIAN AGE
3.3
AVG FAMILY SIZE
2.7
AVG HOUSEHOLD SIZE
1,140,165
LABOR FORCE [ PEOPLE ]
64.7%
PERCENT IN LABOR FORCE
6.4%
UNEMPLOYMENT RATE
Income in Area Code 929
Income Overview in Area Code 929
Per Capita Income in Area Code 929 is $58,143, while median incomes of families and households are $119,648 and $100,959 respectively.
| Characteristic | Number | Measure |
| Per Capita Income | 2,159,122 | $58,143 |
| Median Family Income | 502,294 | $119,648 |
| Mean Family Income | 502,294 | $8,222,027 |
| Median Household Income | 788,484 | $100,959 |
| Mean Household Income | 788,484 | $6,929,918 |
| Income Deficit | 502,294 | $10,709 |
| Wage / Income Gap (%) | 2,159,122 | 19.48% |
| Wage / Income Gap ($) | 2,159,122 | 80.52¢ per $1 |
| Gini / Inequality Index | 2,159,122 | 22.55 |
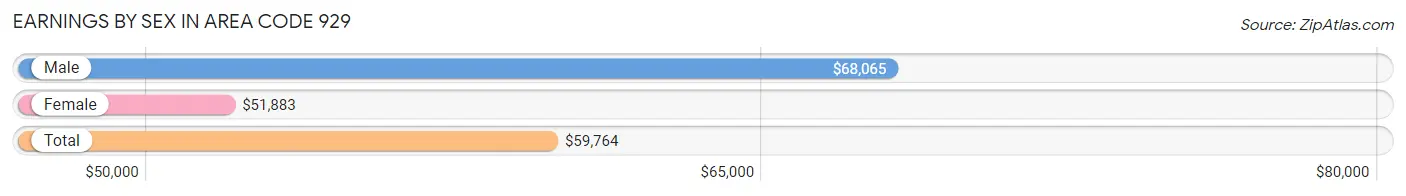
Earnings by Sex in Area Code 929
Average Earnings in Area Code 929 are $59,764, $68,065 for men and $51,883 for women, a difference of 23.8%.
| Sex | Number | Average Earnings |
| Male | 574,375 (50.9%) | $68,065 |
| Female | 554,629 (49.1%) | $51,883 |
| Total | 1,129,004 (100.0%) | $59,764 |
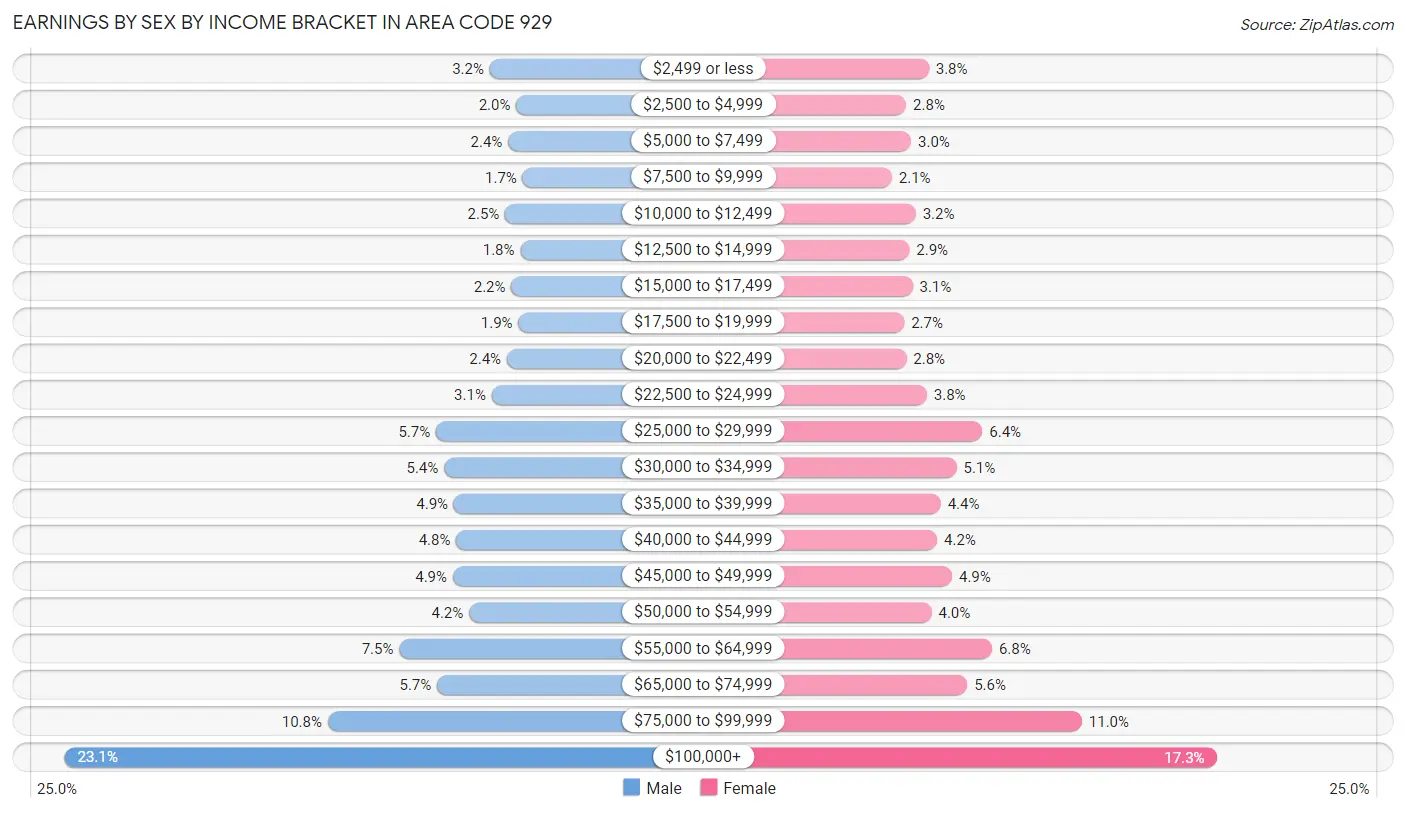
Earnings by Sex by Income Bracket in Area Code 929
The most common earnings brackets in Area Code 929 are $100,000+ for men (132,863 | 23.1%) and $100,000+ for women (96,026 | 17.3%).
| Income | Male | Female |
| $2,499 or less | 18,465 (3.2%) | 21,279 (3.8%) |
| $2,500 to $4,999 | 11,288 (2.0%) | 15,398 (2.8%) |
| $5,000 to $7,499 | 13,483 (2.4%) | 16,718 (3.0%) |
| $7,500 to $9,999 | 9,619 (1.7%) | 11,709 (2.1%) |
| $10,000 to $12,499 | 14,289 (2.5%) | 17,894 (3.2%) |
| $12,500 to $14,999 | 10,250 (1.8%) | 16,234 (2.9%) |
| $15,000 to $17,499 | 12,649 (2.2%) | 17,080 (3.1%) |
| $17,500 to $19,999 | 10,743 (1.9%) | 14,929 (2.7%) |
| $20,000 to $22,499 | 13,837 (2.4%) | 15,498 (2.8%) |
| $22,500 to $24,999 | 17,923 (3.1%) | 20,787 (3.7%) |
| $25,000 to $29,999 | 32,916 (5.7%) | 35,246 (6.4%) |
| $30,000 to $34,999 | 30,713 (5.3%) | 28,525 (5.1%) |
| $35,000 to $39,999 | 28,064 (4.9%) | 24,406 (4.4%) |
| $40,000 to $44,999 | 27,445 (4.8%) | 23,441 (4.2%) |
| $45,000 to $49,999 | 28,378 (4.9%) | 27,357 (4.9%) |
| $50,000 to $54,999 | 24,025 (4.2%) | 22,039 (4.0%) |
| $55,000 to $64,999 | 42,784 (7.4%) | 37,739 (6.8%) |
| $65,000 to $74,999 | 32,624 (5.7%) | 31,256 (5.6%) |
| $75,000 to $99,999 | 62,017 (10.8%) | 61,068 (11.0%) |
| $100,000+ | 132,863 (23.1%) | 96,026 (17.3%) |
| Total | 574,375 (100.0%) | 554,629 (100.0%) |
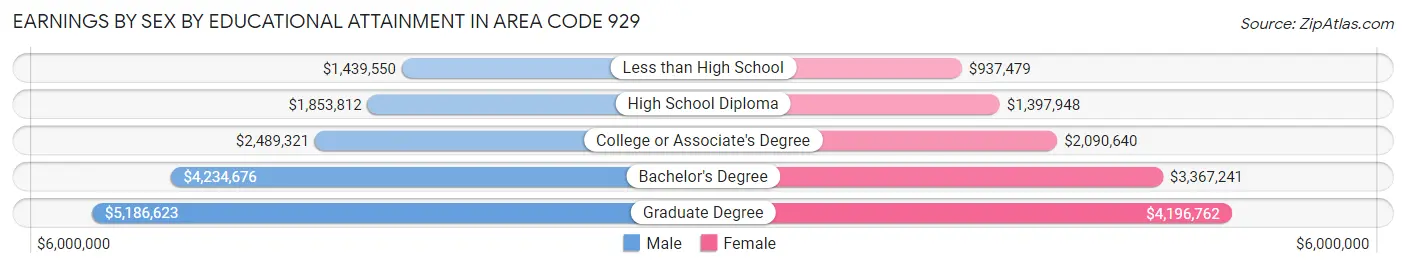
Earnings by Sex by Educational Attainment in Area Code 929
Average earnings in Area Code 929 are $3,538,607 for men and $2,743,459 for women, a difference of 22.5%. Men with an educational attainment of graduate degree enjoy the highest average annual earnings of $5,186,623, while those with less than high school education earn the least with $1,439,550. Women with an educational attainment of graduate degree earn the most with the average annual earnings of $4,196,762, while those with less than high school education have the smallest earnings of $937,479.
| Educational Attainment | Male Income | Female Income |
| Less than High School | $1,439,550 | $937,479 |
| High School Diploma | $1,853,812 | $1,397,948 |
| College or Associate's Degree | $2,489,321 | $2,090,640 |
| Bachelor's Degree | $4,234,676 | $3,367,241 |
| Graduate Degree | $5,186,623 | $4,196,762 |
| Total | $3,538,607 | $2,743,459 |
Family Income in Area Code 929
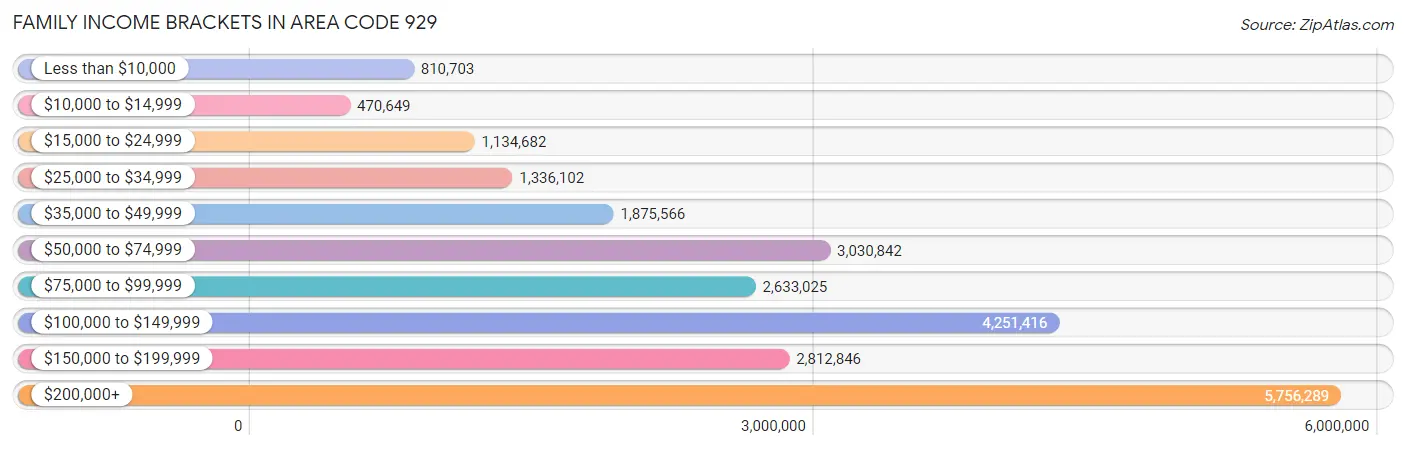
Family Income Brackets in Area Code 929
According to the Area Code 929 family income data, there are 5,756,289 families falling into the $200,000+ income range, which is the most common income bracket and makes up 1,146.0% of all families. Conversely, the $10,000 to $14,999 income bracket is the least frequent group with only 470,649 families (93.7%) belonging to this category.
| Income Bracket | # Families | % Families |
| Less than $10,000 | 810,703 | 161.4% |
| $10,000 to $14,999 | 470,649 | 93.7% |
| $15,000 to $24,999 | 1,134,682 | 225.9% |
| $25,000 to $34,999 | 1,336,102 | 266.0% |
| $35,000 to $49,999 | 1,875,566 | 373.4% |
| $50,000 to $74,999 | 3,030,842 | 603.4% |
| $75,000 to $99,999 | 2,633,025 | 524.2% |
| $100,000 to $149,999 | 4,251,416 | 846.4% |
| $150,000 to $199,999 | 2,812,846 | 560.0% |
| $200,000+ | 5,756,289 | 1,146.0% |
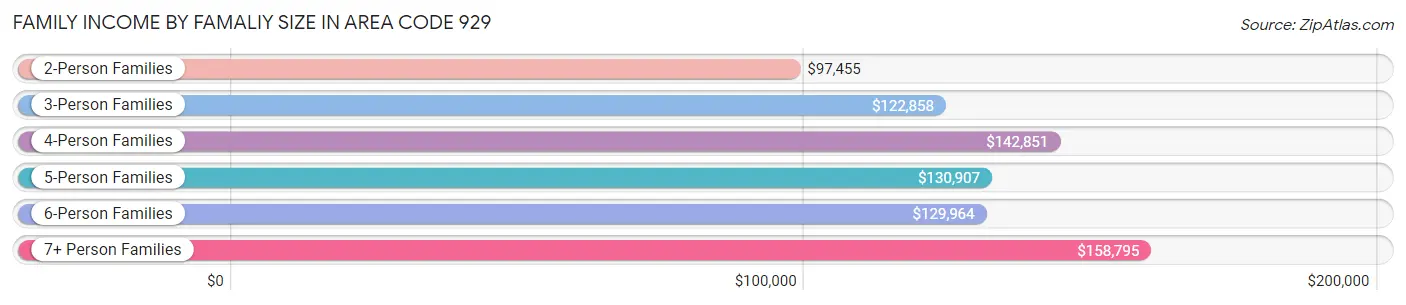
Family Income by Famaliy Size in Area Code 929
7+ person families (13,400 | 2.7%) account for the highest median family income in Area Code 929 with $158,795 per family, while 2-person families (195,616 | 38.9%) have the highest median income of $48,727 per family member.
| Income Bracket | # Families | Median Income |
| 2-Person Families | 195,616 (38.9%) | $97,455 |
| 3-Person Families | 127,939 (25.5%) | $122,858 |
| 4-Person Families | 98,976 (19.7%) | $142,851 |
| 5-Person Families | 47,043 (9.4%) | $130,907 |
| 6-Person Families | 19,320 (3.8%) | $129,964 |
| 7+ Person Families | 13,400 (2.7%) | $158,795 |
| Total | 502,294 (100.0%) | $119,648 |
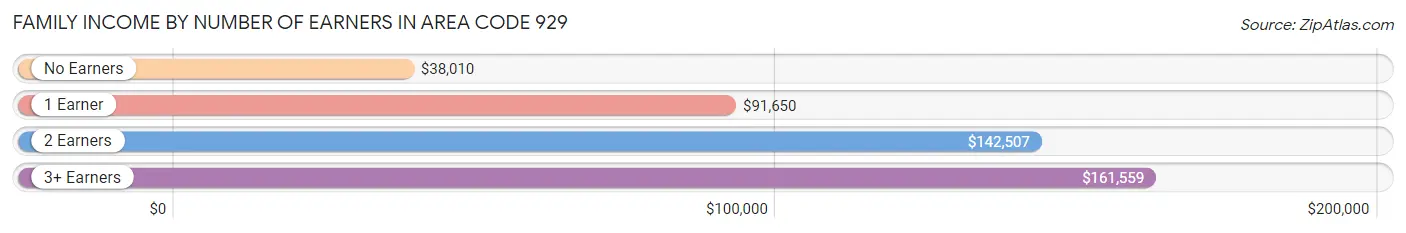
Family Income by Number of Earners in Area Code 929
The median family income in Area Code 929 is $119,648, with families comprising 3+ earners (75,315) having the highest median family income of $161,559, while families with no earners (64,297) have the lowest median family income of $38,010, accounting for 15.0% and 12.8% of families, respectively.
| Number of Earners | # Families | Median Income |
| No Earners | 64,297 (12.8%) | $38,010 |
| 1 Earner | 161,761 (32.2%) | $91,650 |
| 2 Earners | 200,921 (40.0%) | $142,507 |
| 3+ Earners | 75,315 (15.0%) | $161,559 |
| Total | 502,294 (100.0%) | $119,648 |
Household Income in Area Code 929
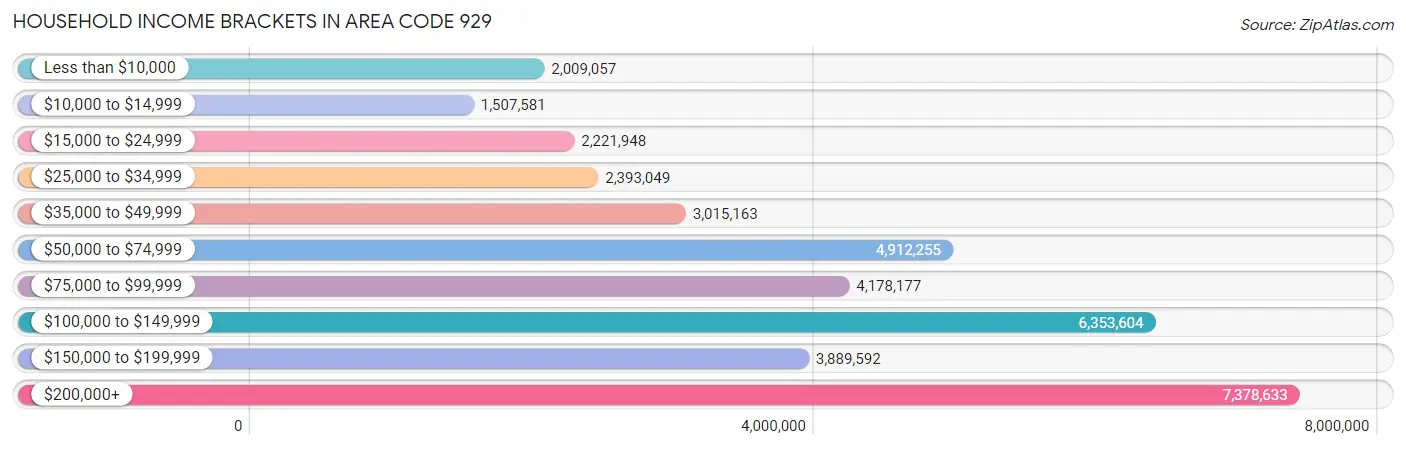
Household Income Brackets in Area Code 929
With 7,378,633 households falling in the category, the $200,000+ income range is the most frequent in Area Code 929, accounting for 935.8% of all households. In contrast, only 1,507,581 households (191.2%) fall into the $10,000 to $14,999 income bracket, making it the least populous group.
| Income Bracket | # Households | % Households |
| Less than $10,000 | 2,009,057 | 254.8% |
| $10,000 to $14,999 | 1,507,581 | 191.2% |
| $15,000 to $24,999 | 2,221,948 | 281.8% |
| $25,000 to $34,999 | 2,393,049 | 303.5% |
| $35,000 to $49,999 | 3,015,163 | 382.4% |
| $50,000 to $74,999 | 4,912,255 | 623.0% |
| $75,000 to $99,999 | 4,178,177 | 529.9% |
| $100,000 to $149,999 | 6,353,604 | 805.8% |
| $150,000 to $199,999 | 3,889,592 | 493.3% |
| $200,000+ | 7,378,633 | 935.8% |
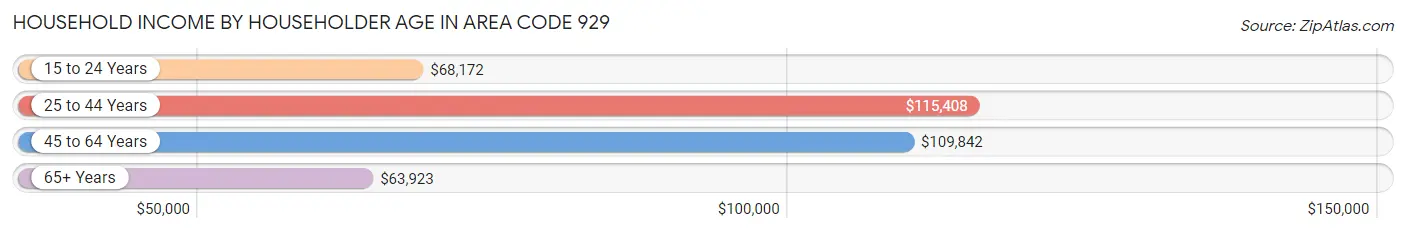
Household Income by Householder Age in Area Code 929
The median household income in Area Code 929 is $100,959, with the highest median household income of $115,408 found in the 25 to 44 years age bracket for the primary householder. A total of 266,375 households (33.8%) fall into this category. Meanwhile, the 65+ years age bracket for the primary householder has the lowest median household income of $63,923, with 200,902 households (25.5%) in this group.
| Income Bracket | # Households | Median Income |
| 15 to 24 Years | 15,686 (2.0%) | $68,172 |
| 25 to 44 Years | 266,375 (33.8%) | $115,408 |
| 45 to 64 Years | 305,521 (38.8%) | $109,842 |
| 65+ Years | 200,902 (25.5%) | $63,923 |
| Total | 788,484 (100.0%) | $100,959 |
Poverty in Area Code 929
Income Below Poverty by Sex and Age in Area Code 929
With 13.0% poverty level for males and 15.4% for females among the residents of Area Code 929, 12 to 14 year old males and 15 year old females are the most vulnerable to poverty, with 7,850 males (20.3%) and 2,134 females (20.9%) in their respective age groups living below the poverty level.
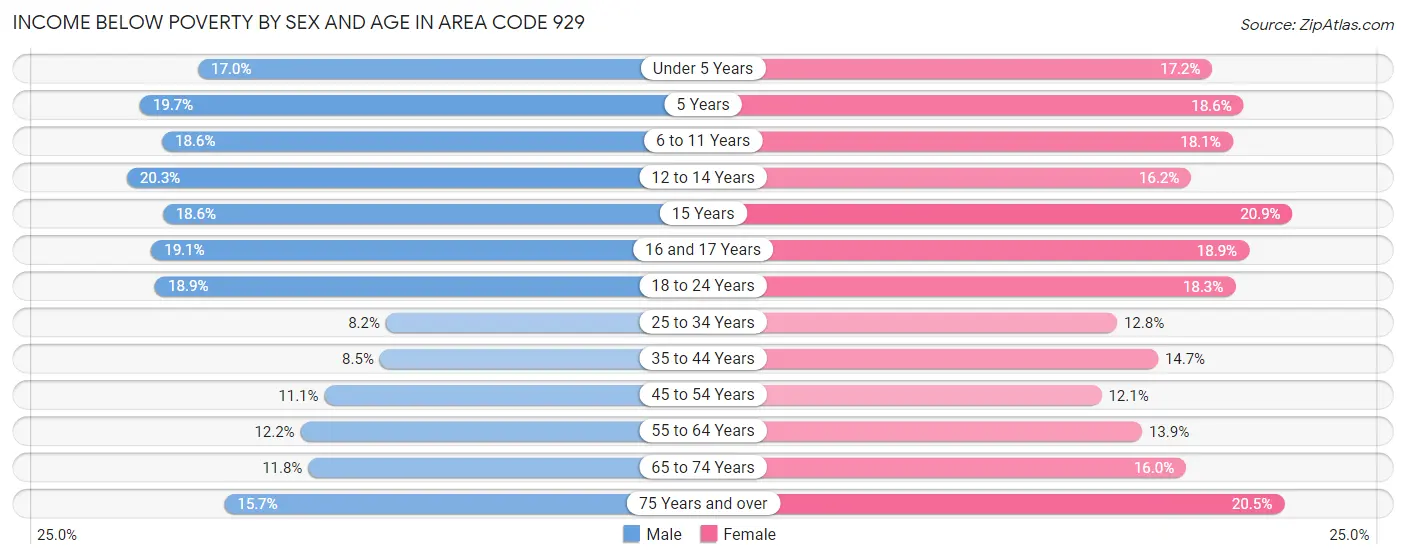
| Age Bracket | Male | Female |
| Under 5 Years | 11,016 (17.0%) | 10,217 (17.2%) |
| 5 Years | 2,329 (19.7%) | 2,098 (18.6%) |
| 6 to 11 Years | 13,842 (18.6%) | 12,546 (18.1%) |
| 12 to 14 Years | 7,850 (20.3%) | 5,919 (16.2%) |
| 15 Years | 2,223 (18.6%) | 2,134 (20.9%) |
| 16 and 17 Years | 4,613 (19.1%) | 4,596 (18.9%) |
| 18 to 24 Years | 15,496 (18.9%) | 15,388 (18.2%) |
| 25 to 34 Years | 13,842 (8.2%) | 22,415 (12.8%) |
| 35 to 44 Years | 12,309 (8.5%) | 22,025 (14.7%) |
| 45 to 54 Years | 15,195 (11.1%) | 17,185 (12.0%) |
| 55 to 64 Years | 15,412 (12.2%) | 20,232 (13.9%) |
| 65 to 74 Years | 10,283 (11.8%) | 17,087 (16.0%) |
| 75 Years and over | 8,522 (15.7%) | 17,501 (20.5%) |
| Total | 132,932 (13.0%) | 169,343 (15.4%) |
Income Above Poverty by Sex and Age in Area Code 929
According to the poverty statistics in Area Code 929, males aged 25 to 34 years and females aged 45 to 54 years are the age groups that are most secure financially, with 91.8% of males and 87.9% of females in these age groups living above the poverty line.
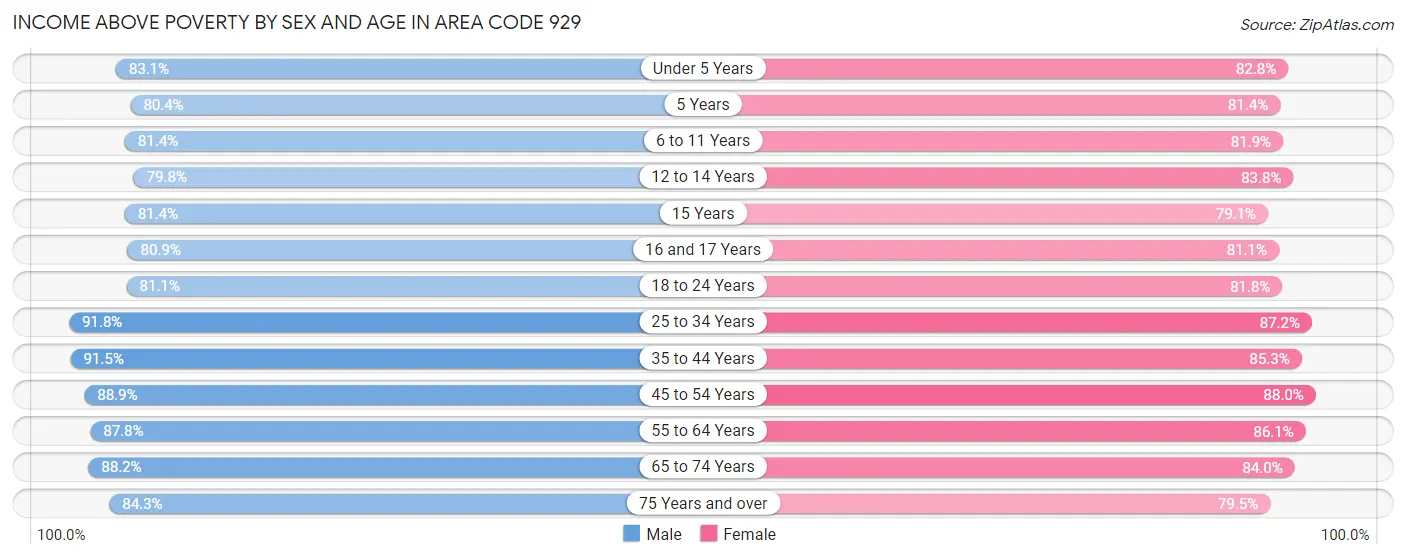
| Age Bracket | Male | Female |
| Under 5 Years | 53,982 (83.1%) | 49,207 (82.8%) |
| 5 Years | 9,521 (80.3%) | 9,158 (81.4%) |
| 6 to 11 Years | 60,488 (81.4%) | 56,651 (81.9%) |
| 12 to 14 Years | 30,919 (79.7%) | 30,597 (83.8%) |
| 15 Years | 9,736 (81.4%) | 8,071 (79.1%) |
| 16 and 17 Years | 19,508 (80.9%) | 19,730 (81.1%) |
| 18 to 24 Years | 66,300 (81.1%) | 68,921 (81.8%) |
| 25 to 34 Years | 154,182 (91.8%) | 153,125 (87.2%) |
| 35 to 44 Years | 132,220 (91.5%) | 128,142 (85.3%) |
| 45 to 54 Years | 121,763 (88.9%) | 125,382 (87.9%) |
| 55 to 64 Years | 110,882 (87.8%) | 125,039 (86.1%) |
| 65 to 74 Years | 76,531 (88.2%) | 89,936 (84.0%) |
| 75 Years and over | 45,642 (84.3%) | 67,769 (79.5%) |
| Total | 891,674 (87.0%) | 931,728 (84.6%) |
Income Below Poverty Among Married-Couple Families in Area Code 929
The poverty statistics for married-couple families in Area Code 929 show that 7.1% or 23,153 of the total 325,184 families live below the poverty line. Families with 5 or more children have the highest poverty rate of 20.0%, comprising of 548 families. On the other hand, families with no children have the lowest poverty rate of 6.0%, which includes 10,913 families.
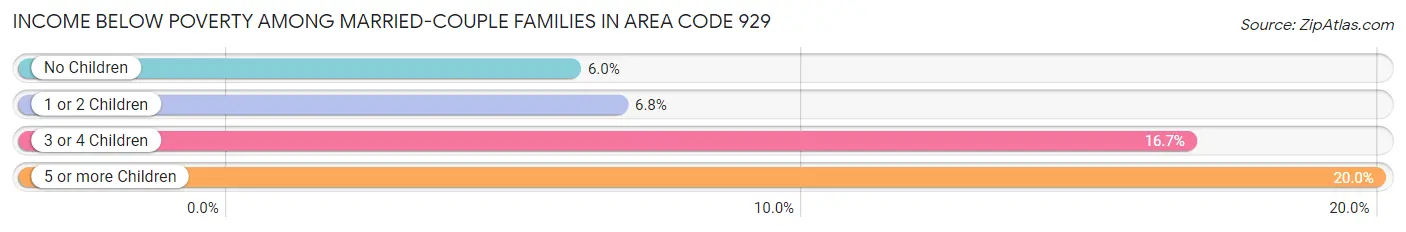
| Children | Above Poverty | Below Poverty |
| No Children | 171,810 (94.0%) | 10,913 (6.0%) |
| 1 or 2 Children | 109,496 (93.2%) | 7,979 (6.8%) |
| 3 or 4 Children | 18,530 (83.3%) | 3,713 (16.7%) |
| 5 or more Children | 2,195 (80.0%) | 548 (20.0%) |
| Total | 302,031 (92.9%) | 23,153 (7.1%) |
Income Below Poverty Among Single-Parent Households in Area Code 929
According to the poverty data in Area Code 929, 10.8% or 4,764 single-father households and 21.0% or 27,922 single-mother households are living below the poverty line. Among single-father households, those with 5 or more children have the highest poverty rate, with 28 households (50.9%) experiencing poverty. Likewise, among single-mother households, those with 5 or more children have the highest poverty rate, with 378 households (63.7%) falling below the poverty line.
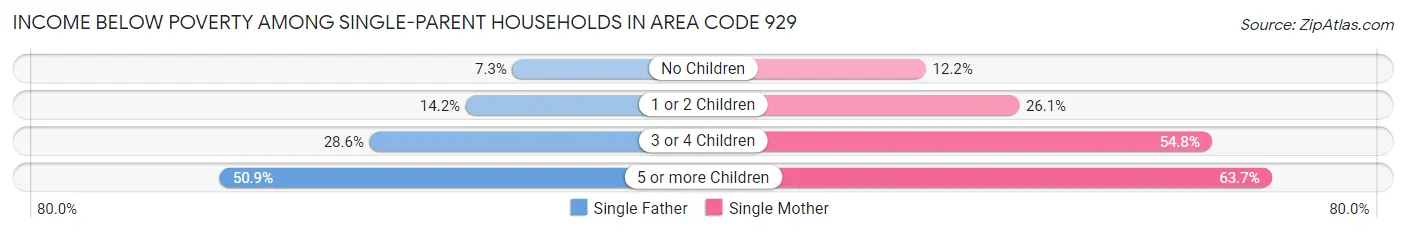
| Children | Single Father | Single Mother |
| No Children | 1,894 (7.3%) | 8,269 (12.2%) |
| 1 or 2 Children | 2,306 (14.2%) | 14,671 (26.1%) |
| 3 or 4 Children | 536 (28.6%) | 4,604 (54.8%) |
| 5 or more Children | 28 (50.9%) | 378 (63.7%) |
| Total | 4,764 (10.8%) | 27,922 (21.0%) |
Income Below Poverty Among Married-Couple vs Single-Parent Households in Area Code 929
The poverty data for Area Code 929 shows that 23,153 of the married-couple family households (7.1%) and 32,686 of the single-parent households (18.5%) are living below the poverty level. Within the married-couple family households, those with 5 or more children have the highest poverty rate, with 548 households (20.0%) falling below the poverty line. Among the single-parent households, those with 5 or more children have the highest poverty rate, with 406 household (62.6%) living below poverty.
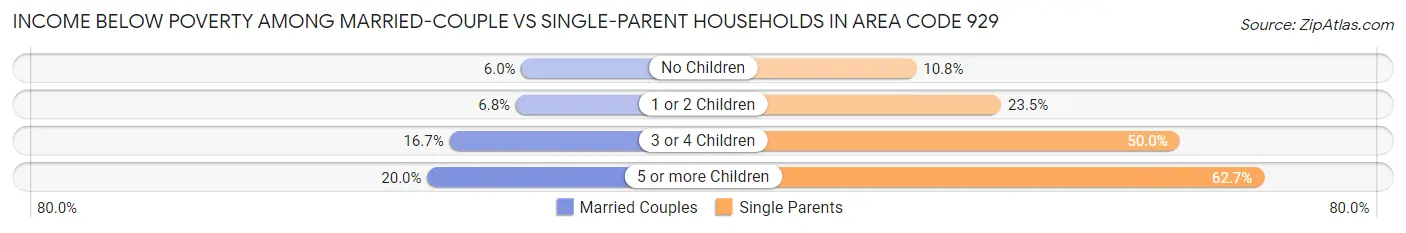
| Children | Married-Couple Families | Single-Parent Households |
| No Children | 10,913 (6.0%) | 10,163 (10.8%) |
| 1 or 2 Children | 7,979 (6.8%) | 16,977 (23.5%) |
| 3 or 4 Children | 3,713 (16.7%) | 5,140 (50.0%) |
| 5 or more Children | 548 (20.0%) | 406 (62.6%) |
| Total | 23,153 (7.1%) | 32,686 (18.5%) |
Race in Area Code 929
The most populous races in Area Code 929 are White / Caucasian (746,481 | 34.6%), Hispanic or Latino (553,974 | 25.7%), and Black / African American (522,637 | 24.2%).
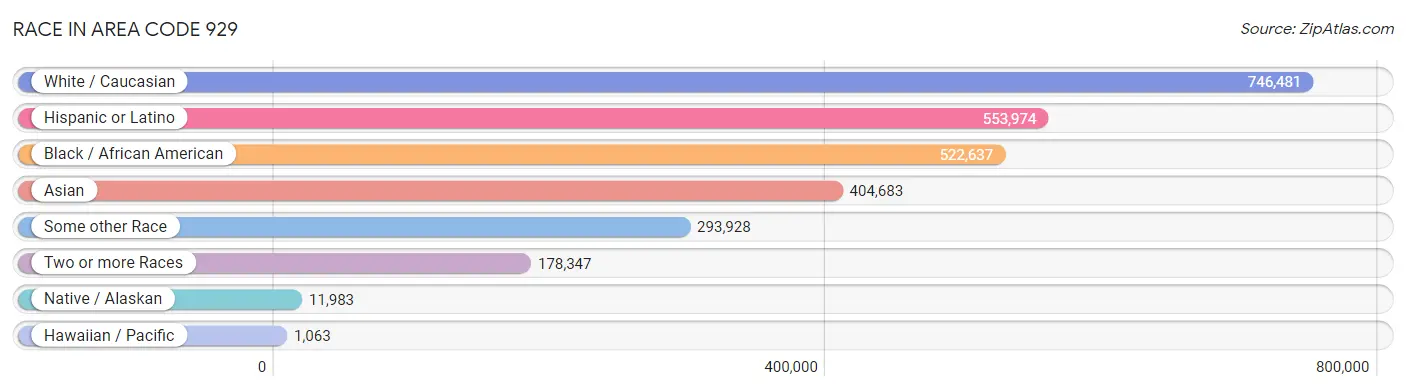
| Race | # Population | % Population |
| Asian | 404,683 | 18.7% |
| Black / African American | 522,637 | 24.2% |
| Hawaiian / Pacific | 1,063 | 0.1% |
| Hispanic or Latino | 553,974 | 25.7% |
| Native / Alaskan | 11,983 | 0.5% |
| White / Caucasian | 746,481 | 34.6% |
| Two or more Races | 178,347 | 8.3% |
| Some other Race | 293,928 | 13.6% |
| Total | 2,159,122 | 100.0% |
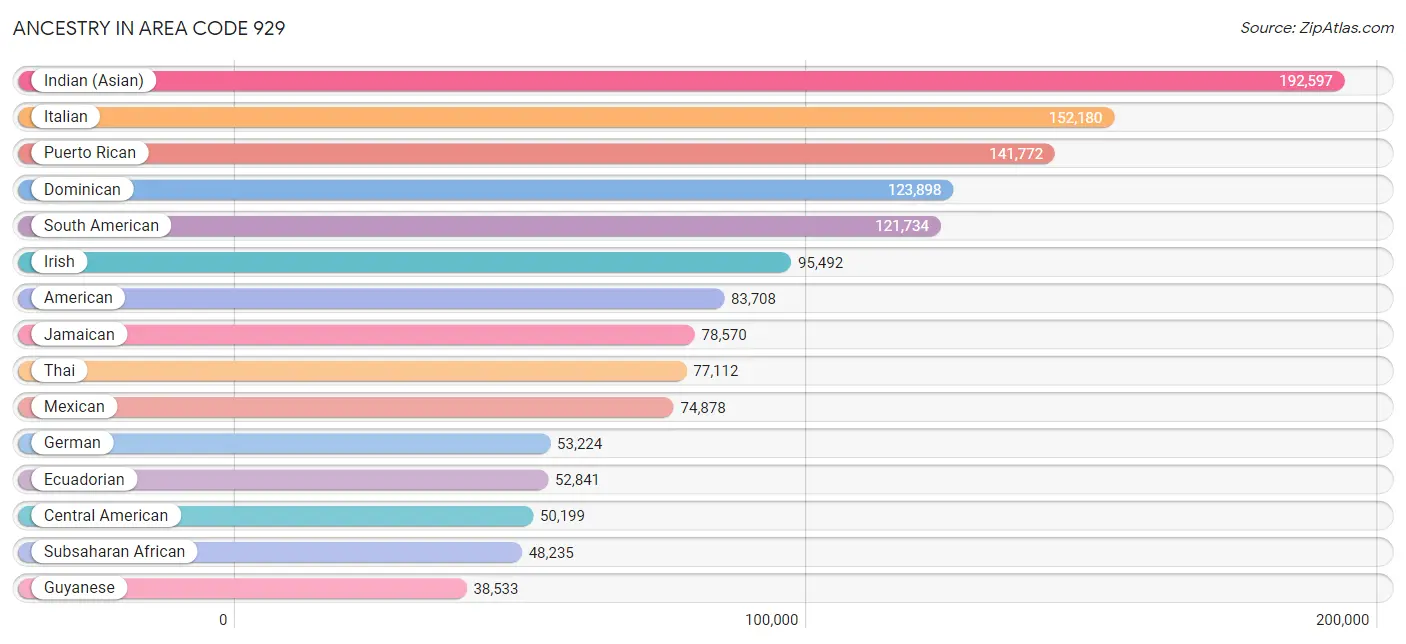
Ancestry in Area Code 929
The most populous ancestries reported in Area Code 929 are Indian (Asian) (192,597 | 8.9%), Italian (152,180 | 7.0%), Puerto Rican (141,772 | 6.6%), Dominican (123,898 | 5.7%), and South American (121,734 | 5.6%), together accounting for 33.9% of all Area Code 929 residents.
| Ancestry | # Population | % Population |
| Afghan | 1,151 | 0.1% |
| African | 21,149 | 1.0% |
| Alaska Native | 16 | 0.0% |
| Albanian | 10,781 | 0.5% |
| American | 83,708 | 3.9% |
| Apache | 42 | 0.0% |
| Arab | 25,859 | 1.2% |
| Argentinean | 4,753 | 0.2% |
| Armenian | 2,668 | 0.1% |
| Assyrian / Chaldean / Syriac | 44 | 0.0% |
| Australian | 1,274 | 0.1% |
| Austrian | 4,880 | 0.2% |
| Bahamian | 486 | 0.0% |
| Bangladeshi | 97 | 0.0% |
| Barbadian | 5,853 | 0.3% |
| Basque | 161 | 0.0% |
| Belgian | 723 | 0.0% |
| Belizean | 1,978 | 0.1% |
| Bermudan | 149 | 0.0% |
| Bhutanese | 7,495 | 0.4% |
| Blackfeet | 994 | 0.1% |
| Bolivian | 1,379 | 0.1% |
| Brazilian | 2,464 | 0.1% |
| British | 5,289 | 0.2% |
| British West Indian | 13,440 | 0.6% |
| Bulgarian | 574 | 0.0% |
| Burmese | 33,053 | 1.5% |
| Cajun | 86 | 0.0% |
| Cambodian | 74 | 0.0% |
| Canadian | 2,098 | 0.1% |
| Cape Verdean | 107 | 0.0% |
| Carpatho Rusyn | 61 | 0.0% |
| Celtic | 113 | 0.0% |
| Central American | 50,199 | 2.3% |
| Central American Indian | 5,877 | 0.3% |
| Cherokee | 1,955 | 0.1% |
| Chickasaw | 102 | 0.0% |
| Chilean | 3,561 | 0.2% |
| Chippewa | 187 | 0.0% |
| Choctaw | 265 | 0.0% |
| Colombian | 37,473 | 1.7% |
| Costa Rican | 1,616 | 0.1% |
| Cree | 1 | 0.0% |
| Creek | 158 | 0.0% |
| Croatian | 1,566 | 0.1% |
| Crow | 13 | 0.0% |
| Cuban | 10,296 | 0.5% |
| Cypriot | 464 | 0.0% |
| Czech | 2,626 | 0.1% |
| Czechoslovakian | 649 | 0.0% |
| Danish | 1,869 | 0.1% |
| Delaware | 65 | 0.0% |
| Dominican | 123,898 | 5.7% |
| Dutch | 4,695 | 0.2% |
| Dutch West Indian | 179 | 0.0% |
| Eastern European | 14,159 | 0.7% |
| Ecuadorian | 52,841 | 2.5% |
| Egyptian | 8,784 | 0.4% |
| English | 35,852 | 1.7% |
| Estonian | 91 | 0.0% |
| Ethiopian | 679 | 0.0% |
| European | 14,107 | 0.6% |
| Fijian | 8 | 0.0% |
| Filipino | 4,563 | 0.2% |
| Finnish | 994 | 0.1% |
| French | 13,262 | 0.6% |
| French American Indian | 99 | 0.0% |
| French Canadian | 2,522 | 0.1% |
| German | 53,224 | 2.5% |
| German Russian | 23 | 0.0% |
| Ghanaian | 8,369 | 0.4% |
| Greek | 13,328 | 0.6% |
| Guamanian / Chamorro | 389 | 0.0% |
| Guatemalan | 12,355 | 0.6% |
| Guyanese | 38,533 | 1.8% |
| Haitian | 35,570 | 1.7% |
| Hmong | 42 | 0.0% |
| Honduran | 10,905 | 0.5% |
| Hungarian | 6,739 | 0.3% |
| Icelander | 115 | 0.0% |
| Indian (Asian) | 192,597 | 8.9% |
| Indonesian | 3,238 | 0.2% |
| Inupiat | 24 | 0.0% |
| Iranian | 2,754 | 0.1% |
| Iraqi | 191 | 0.0% |
| Irish | 95,492 | 4.4% |
| Iroquois | 1,086 | 0.1% |
| Israeli | 5,929 | 0.3% |
| Italian | 152,180 | 7.0% |
| Jamaican | 78,570 | 3.6% |
| Japanese | 1,054 | 0.1% |
| Jordanian | 379 | 0.0% |
| Kenyan | 70 | 0.0% |
| Korean | 34,576 | 1.6% |
| Laotian | 2,733 | 0.1% |
| Latvian | 896 | 0.0% |
| Lebanese | 2,737 | 0.1% |
| Liberian | 1,239 | 0.1% |
| Lithuanian | 2,936 | 0.1% |
| Lumbee | 68 | 0.0% |
| Luxembourger | 43 | 0.0% |
| Macedonian | 1,117 | 0.1% |
| Malaysian | 282 | 0.0% |
| Maltese | 626 | 0.0% |
| Menominee | 20 | 0.0% |
| Mexican | 74,878 | 3.5% |
| Mexican American Indian | 2,765 | 0.1% |
| Mongolian | 1,232 | 0.1% |
| Moroccan | 2,367 | 0.1% |
| Native Hawaiian | 857 | 0.0% |
| Navajo | 117 | 0.0% |
| New Zealander | 97 | 0.0% |
| Nicaraguan | 3,146 | 0.2% |
| Nigerian | 11,281 | 0.5% |
| Northern European | 1,225 | 0.1% |
| Norwegian | 5,081 | 0.2% |
| Okinawan | 835 | 0.0% |
| Pakistani | 3,834 | 0.2% |
| Palestinian | 901 | 0.0% |
| Panamanian | 5,131 | 0.2% |
| Paraguayan | 1,809 | 0.1% |
| Pennsylvania German | 124 | 0.0% |
| Peruvian | 13,396 | 0.6% |
| Pima | 29 | 0.0% |
| Polish | 37,351 | 1.7% |
| Portuguese | 3,286 | 0.2% |
| Potawatomi | 18 | 0.0% |
| Pueblo | 17 | 0.0% |
| Puerto Rican | 141,772 | 6.6% |
| Romanian | 4,896 | 0.2% |
| Russian | 34,727 | 1.6% |
| Salvadoran | 16,956 | 0.8% |
| Samoan | 426 | 0.0% |
| Scandinavian | 918 | 0.0% |
| Scotch-Irish | 2,263 | 0.1% |
| Scottish | 8,039 | 0.4% |
| Seminole | 46 | 0.0% |
| Senegalese | 719 | 0.0% |
| Serbian | 1,139 | 0.1% |
| Sierra Leonean | 249 | 0.0% |
| Sioux | 115 | 0.0% |
| Slavic | 1,230 | 0.1% |
| Slovak | 1,729 | 0.1% |
| Slovene | 233 | 0.0% |
| Somali | 17 | 0.0% |
| South African | 336 | 0.0% |
| South American | 121,734 | 5.6% |
| South American Indian | 1,242 | 0.1% |
| Soviet Union | 325 | 0.0% |
| Spaniard | 6,822 | 0.3% |
| Spanish | 3,012 | 0.1% |
| Spanish American | 115 | 0.0% |
| Spanish American Indian | 342 | 0.0% |
| Sri Lankan | 6,234 | 0.3% |
| Subsaharan African | 48,235 | 2.2% |
| Sudanese | 363 | 0.0% |
| Swedish | 5,135 | 0.2% |
| Swiss | 1,685 | 0.1% |
| Syrian | 2,604 | 0.1% |
| Taiwanese | 63 | 0.0% |
| Thai | 77,112 | 3.6% |
| Tohono O'Odham | 10 | 0.0% |
| Tongan | 318 | 0.0% |
| Trinidadian and Tobagonian | 21,562 | 1.0% |
| Turkish | 4,483 | 0.2% |
| U.S. Virgin Islander | 1,175 | 0.1% |
| Ugandan | 89 | 0.0% |
| Ukrainian | 13,623 | 0.6% |
| Uruguayan | 801 | 0.0% |
| Venezuelan | 4,857 | 0.2% |
| Vietnamese | 34,034 | 1.6% |
| Welsh | 1,945 | 0.1% |
| West Indian | 20,415 | 0.9% |
| Yugoslavian | 1,340 | 0.1% |
| Yuman | 40 | 0.0% |
| Zimbabwean | 8 | 0.0% | View All 176 Rows |
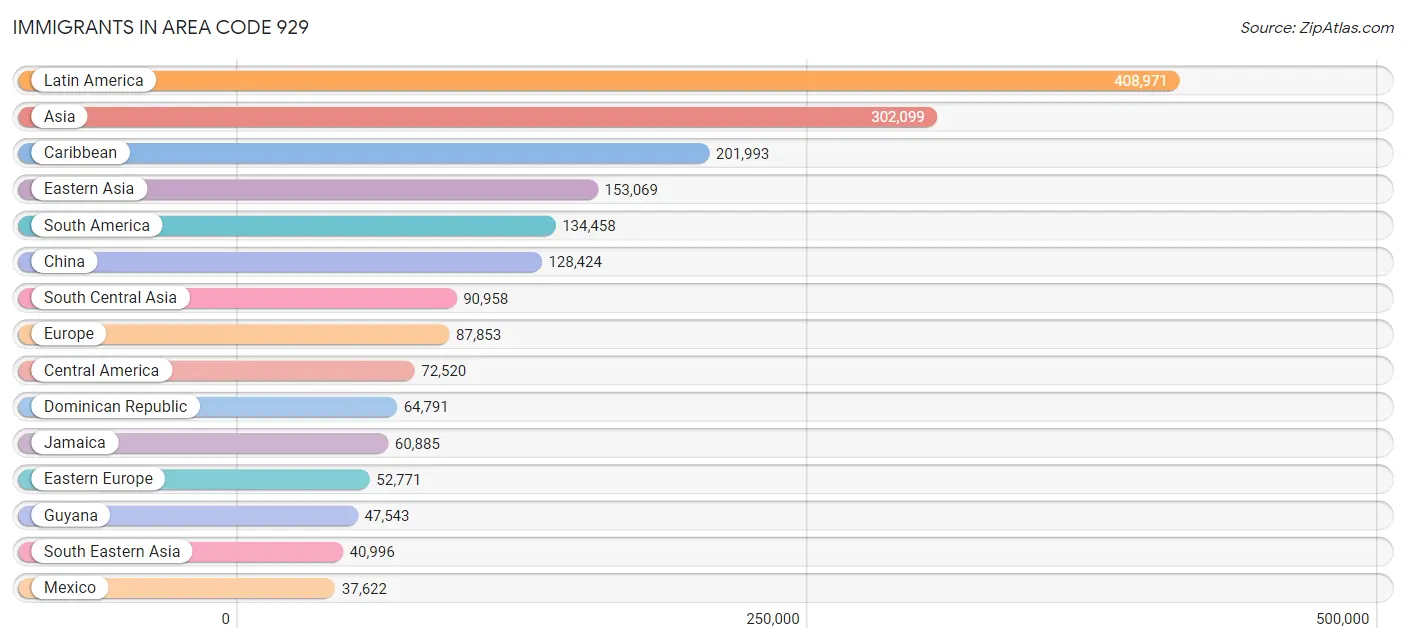
Immigrants in Area Code 929
The most numerous immigrant groups reported in Area Code 929 came from Latin America (408,971 | 18.9%), Asia (302,099 | 14.0%), Caribbean (201,993 | 9.4%), Eastern Asia (153,069 | 7.1%), and South America (134,458 | 6.2%), together accounting for 55.6% of all Area Code 929 residents.
| Immigration Origin | # Population | % Population |
| Afghanistan | 1,097 | 0.1% |
| Africa | 37,473 | 1.7% |
| Albania | 5,082 | 0.2% |
| Argentina | 3,347 | 0.2% |
| Armenia | 354 | 0.0% |
| Asia | 302,099 | 14.0% |
| Australia | 1,787 | 0.1% |
| Austria | 478 | 0.0% |
| Bahamas | 460 | 0.0% |
| Bangladesh | 34,637 | 1.6% |
| Barbados | 5,909 | 0.3% |
| Belarus | 2,342 | 0.1% |
| Belgium | 479 | 0.0% |
| Belize | 2,053 | 0.1% |
| Bolivia | 999 | 0.1% |
| Bosnia and Herzegovina | 533 | 0.0% |
| Brazil | 2,674 | 0.1% |
| Bulgaria | 440 | 0.0% |
| Cambodia | 601 | 0.0% |
| Cameroon | 364 | 0.0% |
| Canada | 5,325 | 0.3% |
| Caribbean | 201,993 | 9.4% |
| Central America | 72,520 | 3.4% |
| Chile | 2,395 | 0.1% |
| China | 128,424 | 5.9% |
| Colombia | 26,594 | 1.2% |
| Congo | 168 | 0.0% |
| Costa Rica | 945 | 0.0% |
| Croatia | 499 | 0.0% |
| Cuba | 2,951 | 0.1% |
| Czechoslovakia | 1,486 | 0.1% |
| Denmark | 465 | 0.0% |
| Dominica | 1,935 | 0.1% |
| Dominican Republic | 64,791 | 3.0% |
| Eastern Africa | 1,703 | 0.1% |
| Eastern Asia | 153,069 | 7.1% |
| Eastern Europe | 52,771 | 2.4% |
| Ecuador | 34,553 | 1.6% |
| Egypt | 6,218 | 0.3% |
| El Salvador | 10,437 | 0.5% |
| England | 3,127 | 0.1% |
| Eritrea | 65 | 0.0% |
| Ethiopia | 450 | 0.0% |
| Europe | 87,853 | 4.1% |
| France | 2,491 | 0.1% |
| Germany | 2,944 | 0.1% |
| Ghana | 9,620 | 0.4% |
| Greece | 3,710 | 0.2% |
| Grenada | 5,023 | 0.2% |
| Guatemala | 8,153 | 0.4% |
| Guyana | 47,543 | 2.2% |
| Haiti | 23,886 | 1.1% |
| Honduras | 7,327 | 0.3% |
| Hong Kong | 9,993 | 0.5% |
| Hungary | 773 | 0.0% |
| India | 27,425 | 1.3% |
| Indonesia | 2,271 | 0.1% |
| Iran | 1,370 | 0.1% |
| Iraq | 79 | 0.0% |
| Ireland | 2,684 | 0.1% |
| Israel | 4,852 | 0.2% |
| Italy | 9,811 | 0.4% |
| Jamaica | 60,885 | 2.8% |
| Japan | 3,677 | 0.2% |
| Jordan | 378 | 0.0% |
| Kazakhstan | 830 | 0.0% |
| Kenya | 206 | 0.0% |
| Korea | 20,938 | 1.0% |
| Kuwait | 109 | 0.0% |
| Laos | 245 | 0.0% |
| Latin America | 408,971 | 18.9% |
| Latvia | 623 | 0.0% |
| Lebanon | 793 | 0.0% |
| Liberia | 898 | 0.0% |
| Lithuania | 172 | 0.0% |
| Malaysia | 3,497 | 0.2% |
| Mexico | 37,622 | 1.7% |
| Micronesia | 42 | 0.0% |
| Middle Africa | 687 | 0.0% |
| Moldova | 1,049 | 0.1% |
| Morocco | 1,084 | 0.1% |
| Nepal | 7,217 | 0.3% |
| Netherlands | 475 | 0.0% |
| Nicaragua | 2,011 | 0.1% |
| Nigeria | 8,684 | 0.4% |
| North Macedonia | 519 | 0.0% |
| Northern Africa | 8,180 | 0.4% |
| Northern Europe | 11,019 | 0.5% |
| Norway | 317 | 0.0% |
| Oceania | 2,108 | 0.1% |
| Pakistan | 10,355 | 0.5% |
| Panama | 3,793 | 0.2% |
| Peru | 9,485 | 0.4% |
| Philippines | 22,854 | 1.1% |
| Poland | 6,277 | 0.3% |
| Portugal | 703 | 0.0% |
| Romania | 2,605 | 0.1% |
| Russia | 12,703 | 0.6% |
| Saudi Arabia | 246 | 0.0% |
| Scotland | 188 | 0.0% |
| Senegal | 1,197 | 0.1% |
| Serbia | 551 | 0.0% |
| Sierra Leone | 410 | 0.0% |
| Singapore | 1,055 | 0.1% |
| South Africa | 957 | 0.0% |
| South America | 134,458 | 6.2% |
| South Central Asia | 90,958 | 4.2% |
| South Eastern Asia | 40,996 | 1.9% |
| Southern Europe | 16,452 | 0.8% |
| Spain | 1,984 | 0.1% |
| Sri Lanka | 2,190 | 0.1% |
| St. Vincent and the Grenadines | 3,229 | 0.2% |
| Sudan | 306 | 0.0% |
| Sweden | 444 | 0.0% |
| Switzerland | 364 | 0.0% |
| Syria | 1,032 | 0.1% |
| Taiwan | 8,503 | 0.4% |
| Thailand | 3,205 | 0.2% |
| Trinidad and Tobago | 23,598 | 1.1% |
| Turkey | 2,735 | 0.1% |
| Uganda | 74 | 0.0% |
| Ukraine | 11,672 | 0.5% |
| Uruguay | 832 | 0.0% |
| Uzbekistan | 4,072 | 0.2% |
| Venezuela | 4,100 | 0.2% |
| Vietnam | 4,496 | 0.2% |
| West Indies | 1,114 | 0.1% |
| Western Africa | 24,333 | 1.1% |
| Western Asia | 16,044 | 0.7% |
| Western Europe | 7,251 | 0.3% |
| Yemen | 2,148 | 0.1% |
| Zaire | 57 | 0.0% |
| Zimbabwe | 69 | 0.0% | View All 133 Rows |
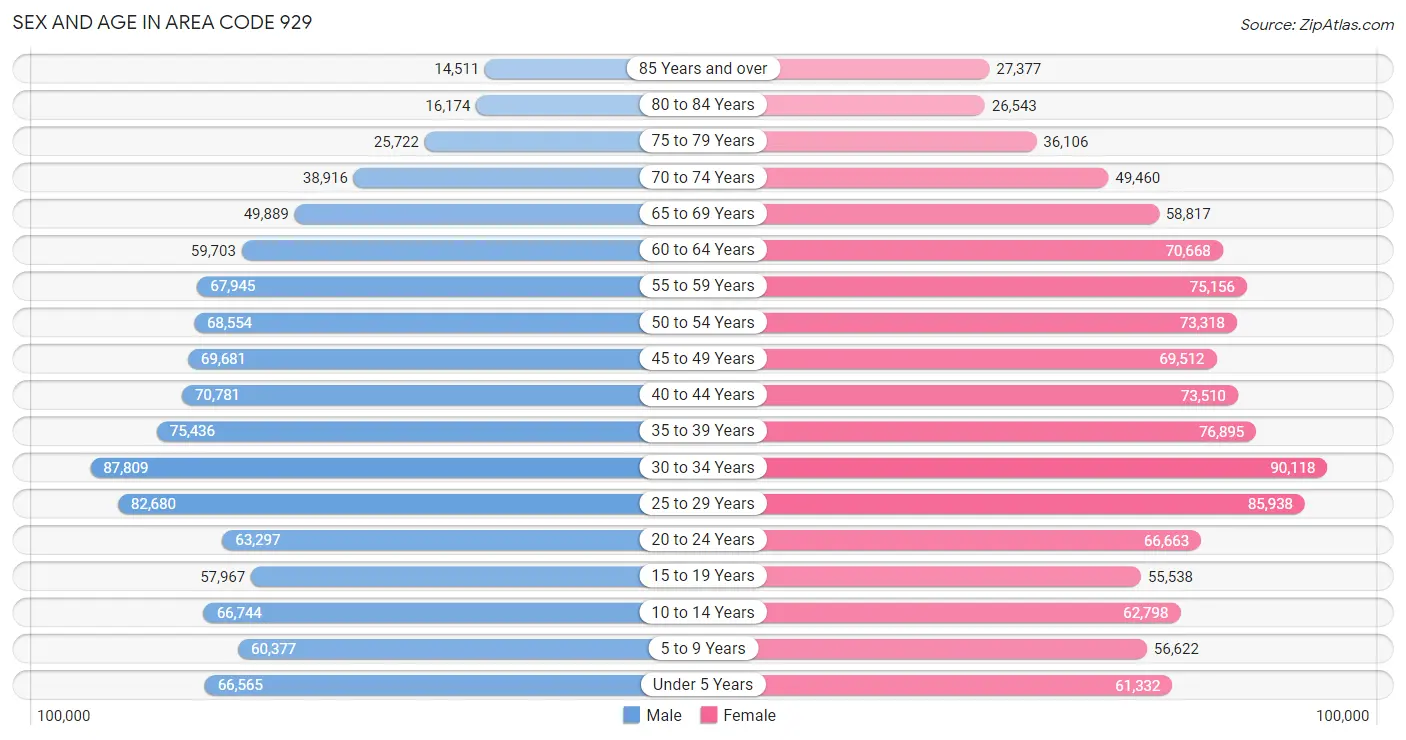
Sex and Age in Area Code 929
Sex and Age in Area Code 929
The most populous age groups in Area Code 929 are 30 to 34 Years (87,809 | 8.4%) for men and 30 to 34 Years (90,118 | 8.1%) for women.
| Age Bracket | Male | Female |
| Under 5 Years | 66,565 (6.4%) | 61,332 (5.5%) |
| 5 to 9 Years | 60,377 (5.8%) | 56,622 (5.1%) |
| 10 to 14 Years | 66,744 (6.4%) | 62,798 (5.6%) |
| 15 to 19 Years | 57,967 (5.6%) | 55,538 (5.0%) |
| 20 to 24 Years | 63,297 (6.1%) | 66,663 (6.0%) |
| 25 to 29 Years | 82,680 (7.9%) | 85,938 (7.7%) |
| 30 to 34 Years | 87,809 (8.4%) | 90,118 (8.1%) |
| 35 to 39 Years | 75,436 (7.2%) | 76,895 (6.9%) |
| 40 to 44 Years | 70,781 (6.8%) | 73,510 (6.6%) |
| 45 to 49 Years | 69,681 (6.7%) | 69,512 (6.2%) |
| 50 to 54 Years | 68,554 (6.6%) | 73,318 (6.6%) |
| 55 to 59 Years | 67,945 (6.5%) | 75,156 (6.7%) |
| 60 to 64 Years | 59,703 (5.7%) | 70,668 (6.3%) |
| 65 to 69 Years | 49,889 (4.8%) | 58,817 (5.3%) |
| 70 to 74 Years | 38,916 (3.7%) | 49,460 (4.4%) |
| 75 to 79 Years | 25,722 (2.5%) | 36,106 (3.2%) |
| 80 to 84 Years | 16,174 (1.5%) | 26,543 (2.4%) |
| 85 Years and over | 14,511 (1.4%) | 27,377 (2.5%) |
| Total | 1,042,751 (100.0%) | 1,116,371 (100.0%) |
Families and Households in Area Code 929
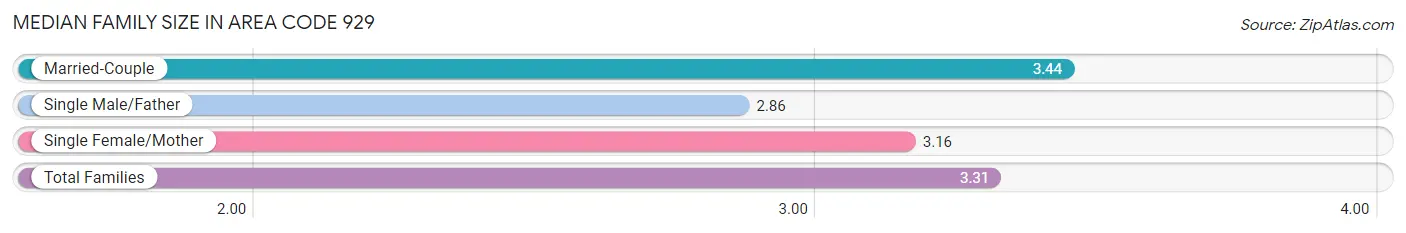
Median Family Size in Area Code 929
The median family size in Area Code 929 is 3.31 persons per family, with married-couple families (325,184 | 64.7%) accounting for the largest median family size of 3.44166 persons per family. On the other hand, single male/father families (44,165 | 8.8%) represent the smallest median family size with 2.86 persons per family.
| Family Type | # Families | Family Size |
| Married-Couple | 325,184 (64.7%) | 3.44 |
| Single Male/Father | 44,165 (8.8%) | 2.86 |
| Single Female/Mother | 132,945 (26.5%) | 3.16 |
| Total Families | 502,294 (100.0%) | 3.31 |
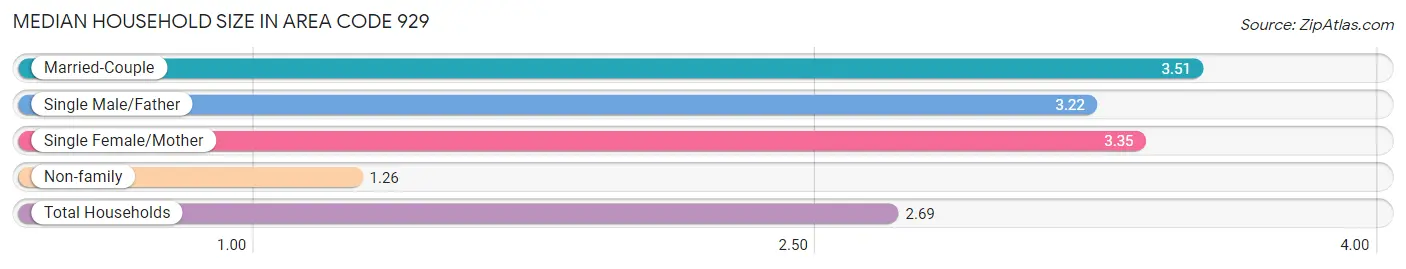
Median Household Size in Area Code 929
The median household size in Area Code 929 is 2.69 persons per household, with married-couple households (325,184 | 41.2%) accounting for the largest median household size of 3.50729 persons per household. non-family households (286,190 | 36.3%) represent the smallest median household size with 1.26 persons per household.
| Household Type | # Households | Household Size |
| Married-Couple | 325,184 (41.2%) | 3.51 |
| Single Male/Father | 44,165 (5.6%) | 3.22 |
| Single Female/Mother | 132,945 (16.9%) | 3.35 |
| Non-family | 286,190 (36.3%) | 1.26 |
| Total Households | 788,484 (100.0%) | 2.69 |
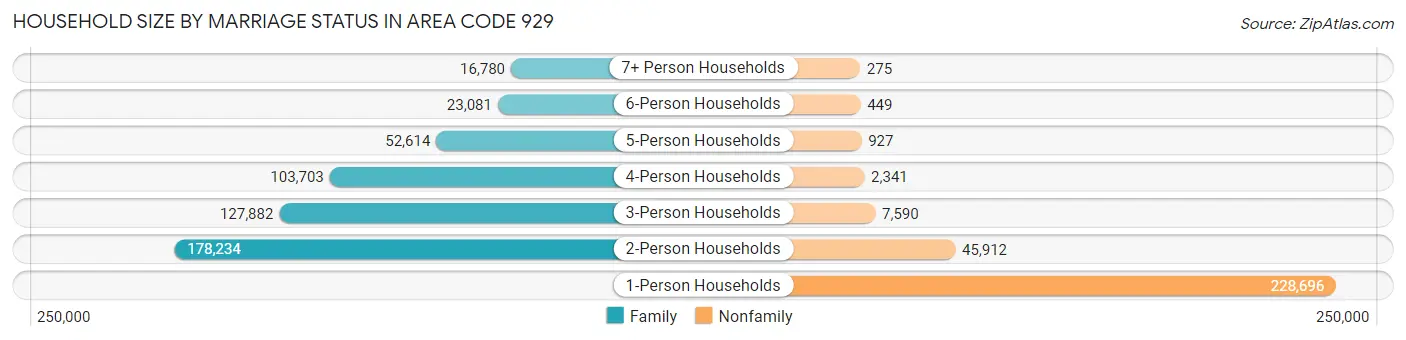
Household Size by Marriage Status in Area Code 929
Out of a total of 788,484 households in Area Code 929, 502,294 (63.7%) are family households, while 286,190 (36.3%) are nonfamily households. The most numerous type of family households are 2-person households, comprising 178,234, and the most common type of nonfamily households are 1-person households, comprising 228,696.
| Household Size | Family Households | Nonfamily Households |
| 1-Person Households | - | 228,696 (29.0%) |
| 2-Person Households | 178,234 (22.6%) | 45,912 (5.8%) |
| 3-Person Households | 127,882 (16.2%) | 7,590 (1.0%) |
| 4-Person Households | 103,703 (13.2%) | 2,341 (0.3%) |
| 5-Person Households | 52,614 (6.7%) | 927 (0.1%) |
| 6-Person Households | 23,081 (2.9%) | 449 (0.1%) |
| 7+ Person Households | 16,780 (2.1%) | 275 (0.0%) |
| Total | 502,294 (63.7%) | 286,190 (36.3%) |
Female Fertility in Area Code 929
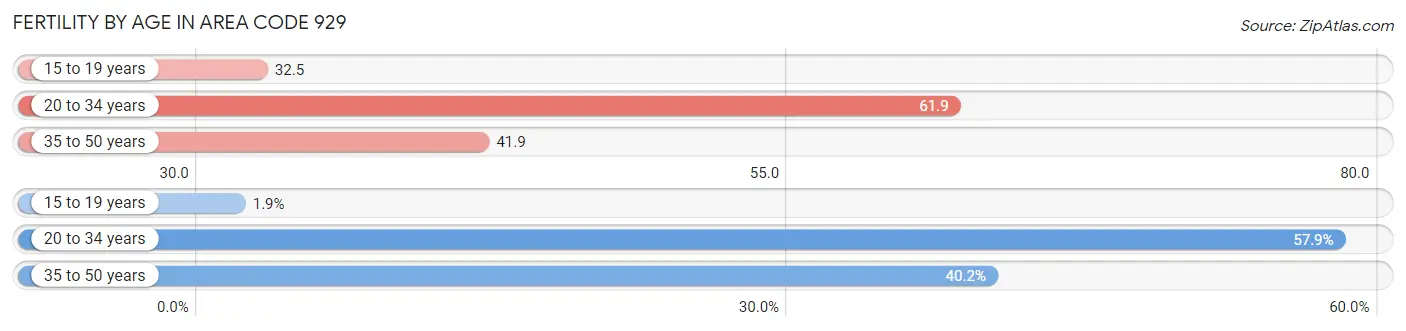
Fertility by Age in Area Code 929
Average fertility rate in Area Code 929 is 46.1 births per 1,000 women. Women in the age bracket of 20 to 34 years have the highest fertility rate with 61.9 births per 1,000 women. Women in the age bracket of 20 to 34 years acount for 57.9% of all women with births.
| Age Bracket | Women with Births | Births / 1,000 Women |
| 15 to 19 years | 450 (1.9%) | 32.5 |
| 20 to 34 years | 13,579 (57.9%) | 61.9 |
| 35 to 50 years | 9,427 (40.2%) | 41.9 |
| Total | 23,456 (100.0%) | 46.1 |
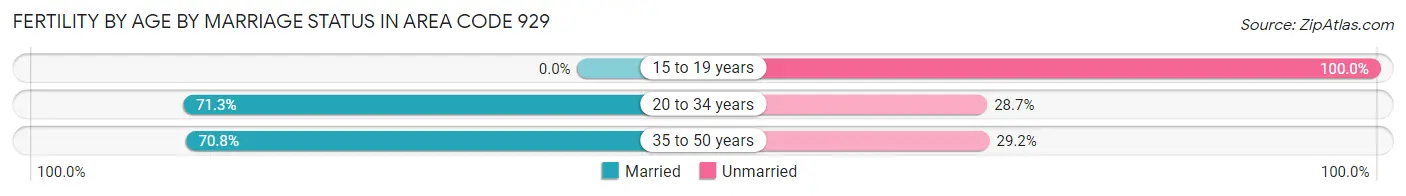
Fertility by Age by Marriage Status in Area Code 929
73.6% of women with births (23,456) in Area Code 929 are married. The highest percentage of unmarried women with births falls into 15 to 19 years age bracket with 100.0% of them unmarried at the time of birth, while the lowest percentage of unmarried women with births belong to 20 to 34 years age bracket with 28.7% of them unmarried.
| Age Bracket | Married | Unmarried |
| 15 to 19 years | 0 (0.0%) | 450 (100.0%) |
| 20 to 34 years | 9,678 (71.3%) | 3,901 (28.7%) |
| 35 to 50 years | 6,678 (70.8%) | 2,749 (29.2%) |
| Total | 17,255 (73.6%) | 6,201 (26.4%) |
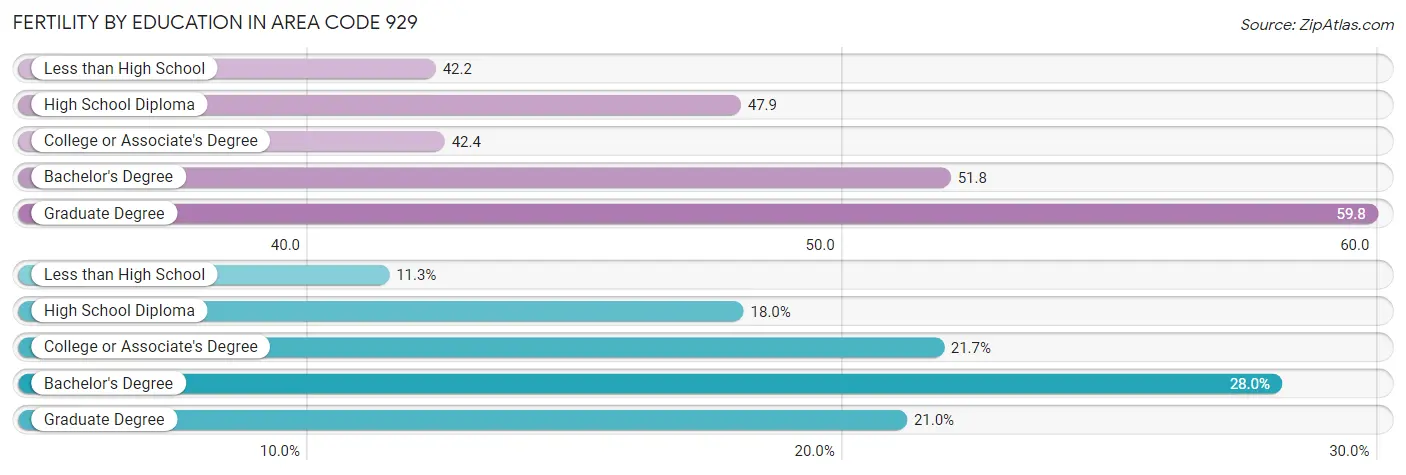
Fertility by Education in Area Code 929
Average fertility rate in Area Code 929 is 46.1 births per 1,000 women. Women with the education attainment of graduate degree have the highest fertility rate of 59.8 births per 1,000 women, while women with the education attainment of less than high school have the lowest fertility at 42.2 births per 1,000 women. Women with the education attainment of bachelor's degree represent 28.0% of all women with births.
| Educational Attainment | Women with Births | Births / 1,000 Women |
| Less than High School | 2,653 (11.3%) | 42.2 |
| High School Diploma | 4,211 (17.9%) | 47.9 |
| College or Associate's Degree | 5,089 (21.7%) | 42.4 |
| Bachelor's Degree | 6,575 (28.0%) | 51.8 |
| Graduate Degree | 4,928 (21.0%) | 59.8 |
| Total | 23,456 (100.0%) | 46.1 |
Fertility by Education by Marriage Status in Area Code 929
26.4% of women with births in Area Code 929 are unmarried. Women with the educational attainment of graduate degree are most likely to be married with 75.5% of them married at childbirth, while women with the educational attainment of less than high school are least likely to be married with 55.7% of them unmarried at childbirth.
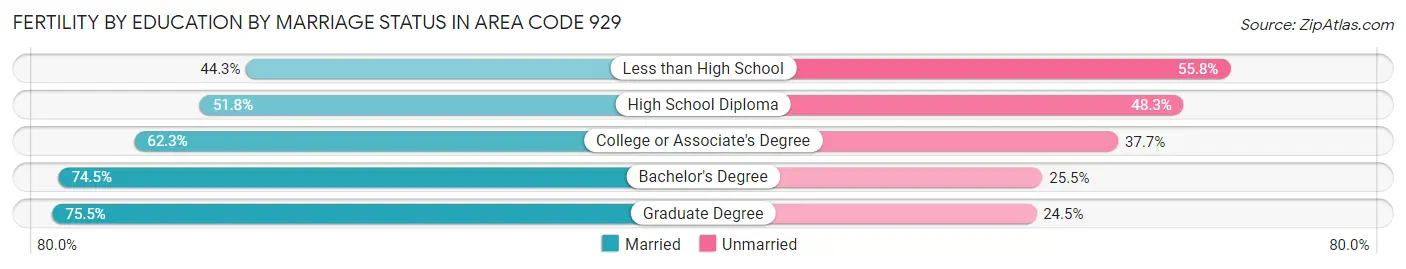
| Educational Attainment | Married | Unmarried |
| Less than High School | 1,174 (44.3%) | 1,479 (55.7%) |
| High School Diploma | 2,179 (51.7%) | 2,032 (48.2%) |
| College or Associate's Degree | 3,171 (62.3%) | 1,918 (37.7%) |
| Bachelor's Degree | 4,900 (74.5%) | 1,675 (25.5%) |
| Graduate Degree | 3,721 (75.5%) | 1,207 (24.5%) |
| Total | 17,255 (73.6%) | 6,201 (26.4%) |
Employment Characteristics in Area Code 929
Employment by Class of Employer in Area Code 929
Among the 1,007,675 employed individuals in Area Code 929, private company employees (656,201 | 65.1%), local government employees (108,286 | 10.7%), and not-for-profit organizations (101,433 | 10.1%) make up the most common classes of employment.
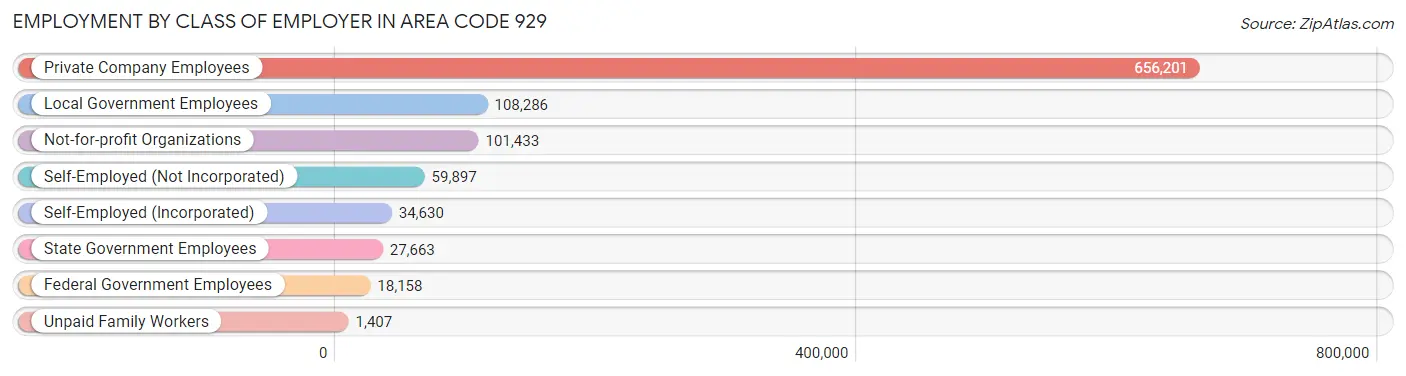
| Employer Class | # Employees | % Employees |
| Private Company Employees | 656,201 | 65.1% |
| Self-Employed (Incorporated) | 34,630 | 3.4% |
| Self-Employed (Not Incorporated) | 59,897 | 5.9% |
| Not-for-profit Organizations | 101,433 | 10.1% |
| Local Government Employees | 108,286 | 10.7% |
| State Government Employees | 27,663 | 2.8% |
| Federal Government Employees | 18,158 | 1.8% |
| Unpaid Family Workers | 1,407 | 0.1% |
| Total | 1,007,675 | 100.0% |
Employment Status by Age in Area Code 929
According to the labor force statistics for Area Code 929, out of the total population over 16 years of age (1,762,461), 64.7% or 1,140,136 individuals are in the labor force, with 6.4% or 72,855 of them unemployed. The age group with the highest labor force participation rate is 35 to 44 years, with 84.6% or 251,061 individuals in the labor force. Within the labor force, the 16 to 19 years age range has the highest percentage of unemployed individuals, with 1,088.0% or 199,224 of them being unemployed.
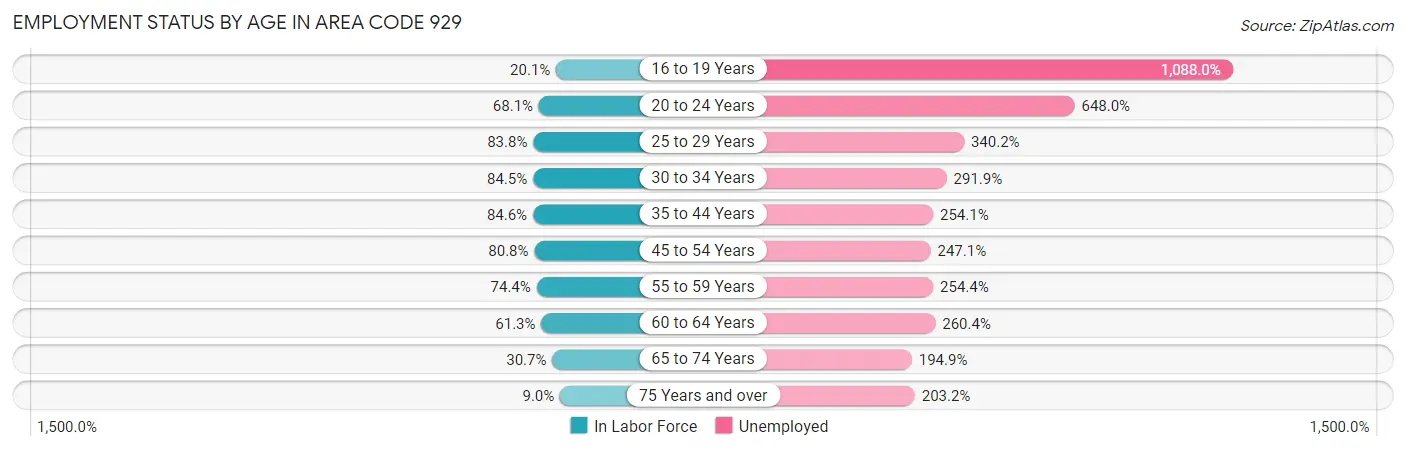
| Age Bracket | In Labor Force | Unemployed |
| 16 to 19 Years | 18,308 (20.1%) | 199,224 (1,088.0%) |
| 20 to 24 Years | 88,511 (68.1%) | 573,584 (648.0%) |
| 25 to 29 Years | 141,344 (83.8%) | 480,825 (340.2%) |
| 30 to 34 Years | 150,270 (84.5%) | 438,659 (291.9%) |
| 35 to 44 Years | 251,060 (84.6%) | 637,946 (254.1%) |
| 45 to 54 Years | 227,077 (80.8%) | 561,095 (247.1%) |
| 55 to 59 Years | 106,485 (74.4%) | 270,888 (254.4%) |
| 60 to 64 Years | 79,863 (61.3%) | 207,968 (260.4%) |
| 65 to 74 Years | 60,582 (30.7%) | 118,076 (194.9%) |
| 75 Years and over | 13,188 (9.0%) | 26,810 (203.2%) |
| Total | 1,140,165 (64.7%) | 72,897 (6.4%) |
Employment Status by Educational Attainment in Area Code 929
According to labor force statistics for Area Code 929, 79.8% of individuals (955,528) out of the total population between 25 and 64 years of age (1,197,704) are in the labor force, with 266.0% or 2,541,704 of them being unemployed. The group with the highest labor force participation rate are those with the educational attainment of bachelor's degree or higher, with 87.6% or 428,840 individuals in the labor force. Within the labor force, individuals with less than high school education have the highest percentage of unemployment, with 392.8% or 395,997 of them being unemployed.
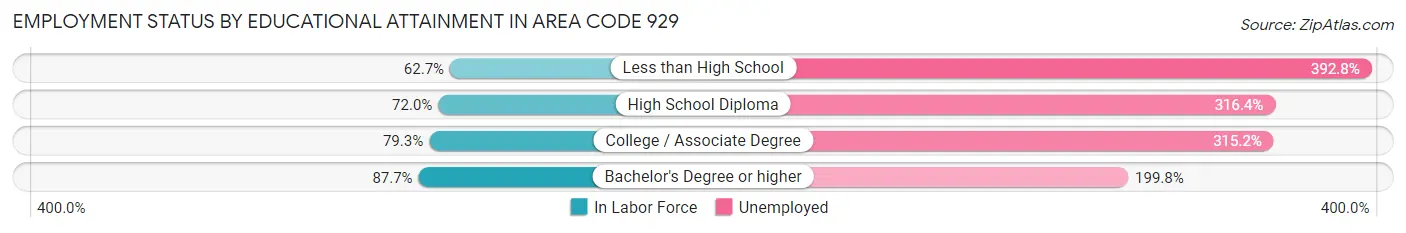
| Educational Attainment | In Labor Force | Unemployed |
| Less than High School | 100,816 (62.7%) | 631,477 (392.8%) |
| High School Diploma | 204,038 (72.0%) | 896,269 (316.4%) |
| College / Associate Degree | 209,740 (79.3%) | 833,408 (315.2%) |
| Bachelor's Degree or higher | 428,819 (87.6%) | 977,549 (199.8%) |
| Total | 955,543 (79.8%) | 3,185,893 (266.0%) |
Employment Occupations by Sex in Area Code 929
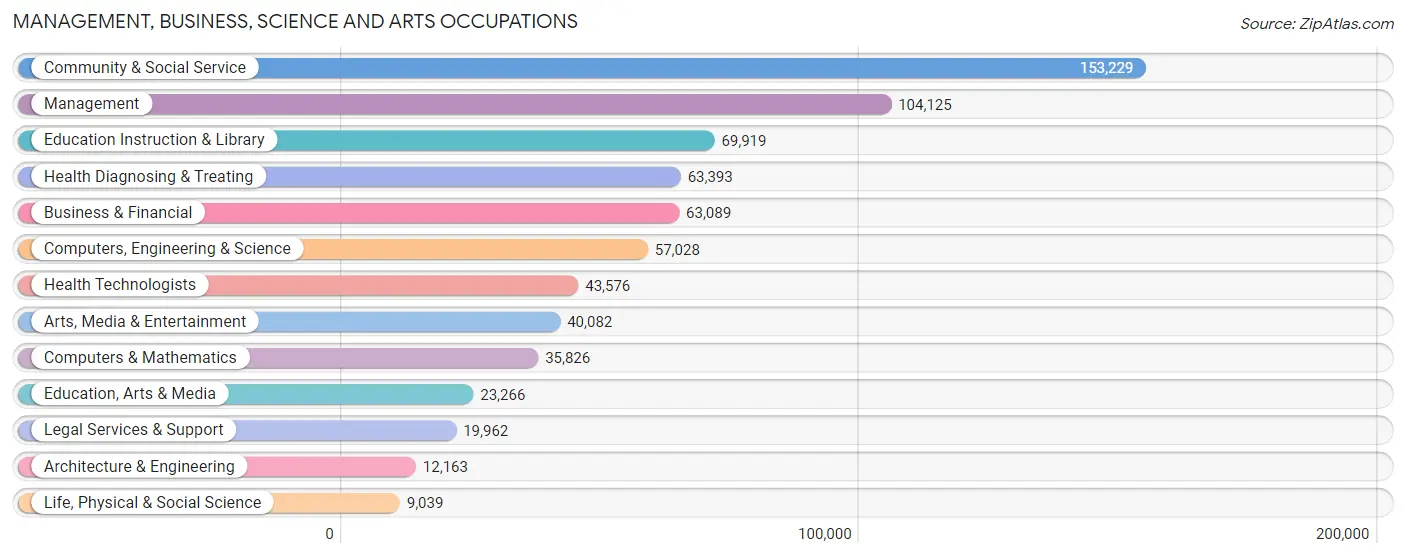
Management, Business, Science and Arts Occupations
The most common Management, Business, Science and Arts occupations in Area Code 929 are Community & Social Service (153,229 | 14.8%), Management (104,125 | 10.1%), Education Instruction & Library (69,919 | 6.8%), Health Diagnosing & Treating (63,393 | 6.1%), and Business & Financial (63,089 | 6.1%).
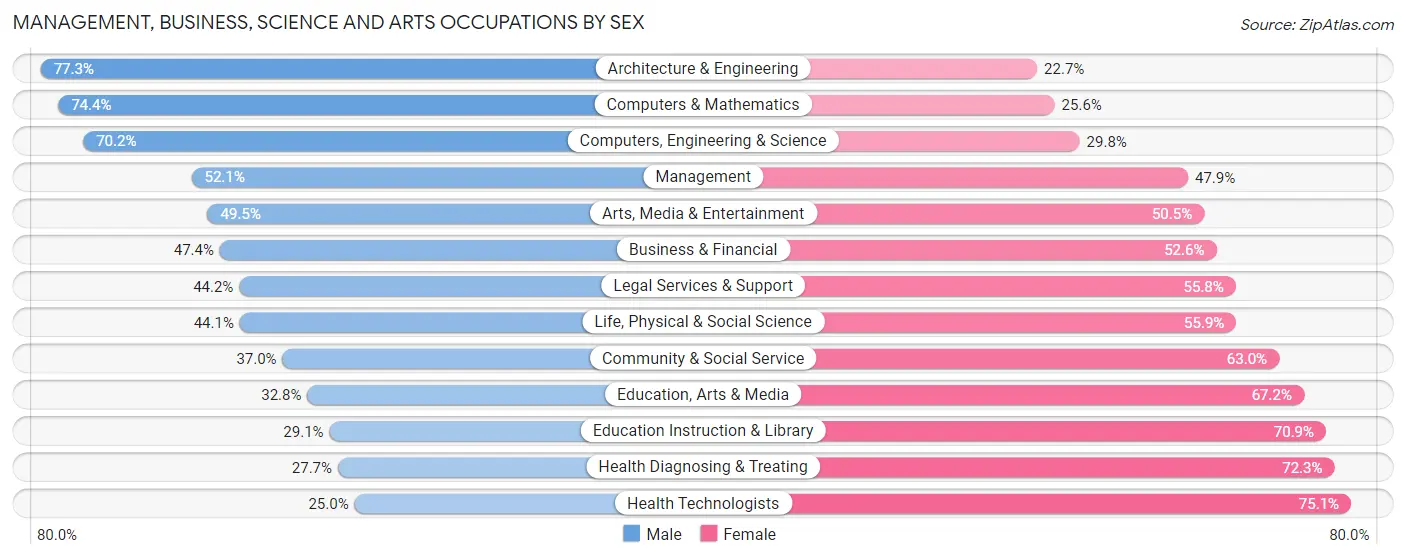
Management, Business, Science and Arts Occupations by Sex
Within the Management, Business, Science and Arts occupations in Area Code 929, the most male-oriented occupations are Architecture & Engineering (77.3%), Computers & Mathematics (74.4%), and Computers, Engineering & Science (70.2%), while the most female-oriented occupations are Health Technologists (75.0%), Health Diagnosing & Treating (72.3%), and Education Instruction & Library (70.9%).
| Occupation | Male | Female |
| Management | 54,284 (52.1%) | 49,841 (47.9%) |
| Business & Financial | 29,926 (47.4%) | 33,163 (52.6%) |
| Computers, Engineering & Science | 40,040 (70.2%) | 16,988 (29.8%) |
| Computers & Mathematics | 26,651 (74.4%) | 9,175 (25.6%) |
| Architecture & Engineering | 9,403 (77.3%) | 2,760 (22.7%) |
| Life, Physical & Social Science | 3,986 (44.1%) | 5,053 (55.9%) |
| Community & Social Service | 56,654 (37.0%) | 96,575 (63.0%) |
| Education, Arts & Media | 7,637 (32.8%) | 15,629 (67.2%) |
| Legal Services & Support | 8,821 (44.2%) | 11,141 (55.8%) |
| Education Instruction & Library | 20,366 (29.1%) | 49,553 (70.9%) |
| Arts, Media & Entertainment | 19,830 (49.5%) | 20,252 (50.5%) |
| Health Diagnosing & Treating | 17,572 (27.7%) | 45,821 (72.3%) |
| Health Technologists | 10,874 (24.9%) | 32,702 (75.0%) |
| Total (Category) | 198,476 (45.0%) | 242,388 (55.0%) |
| Total (Overall) | 528,469 (51.0%) | 507,998 (49.0%) |
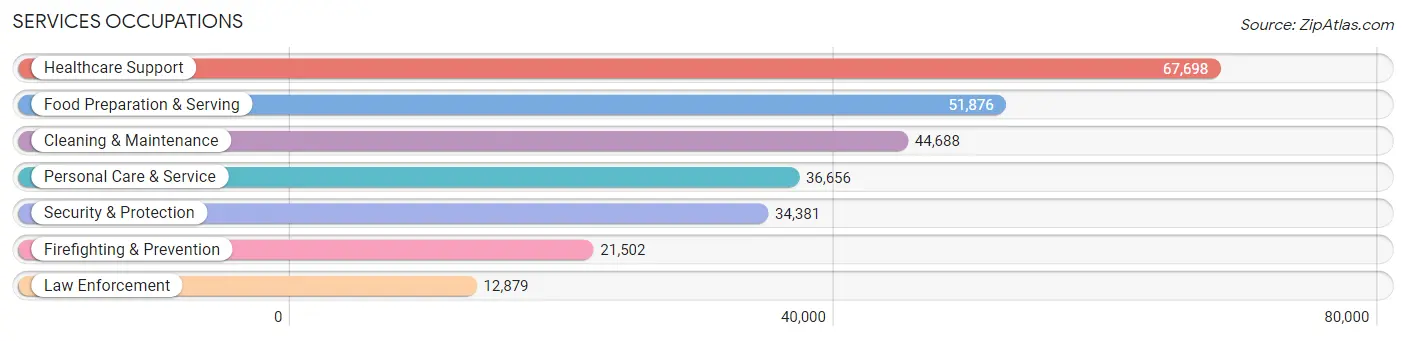
Services Occupations
The most common Services occupations in Area Code 929 are Healthcare Support (67,698 | 6.5%), Food Preparation & Serving (51,876 | 5.0%), Cleaning & Maintenance (44,688 | 4.3%), Personal Care & Service (36,656 | 3.5%), and Security & Protection (34,381 | 3.3%).
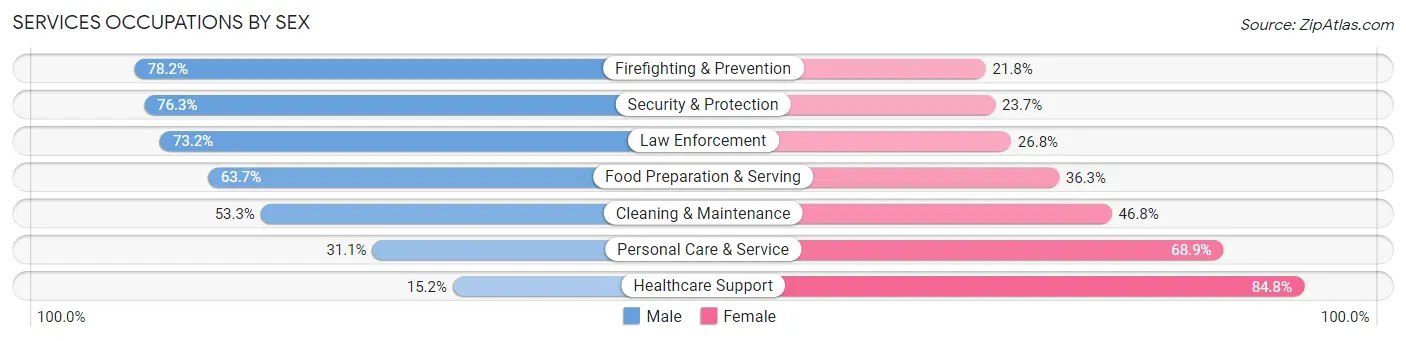
Services Occupations by Sex
Within the Services occupations in Area Code 929, the most male-oriented occupations are Firefighting & Prevention (78.2%), Security & Protection (76.3%), and Law Enforcement (73.2%), while the most female-oriented occupations are Healthcare Support (84.8%), Personal Care & Service (68.9%), and Cleaning & Maintenance (46.8%).
| Occupation | Male | Female |
| Healthcare Support | 10,297 (15.2%) | 57,401 (84.8%) |
| Security & Protection | 26,243 (76.3%) | 8,138 (23.7%) |
| Firefighting & Prevention | 16,817 (78.2%) | 4,685 (21.8%) |
| Law Enforcement | 9,426 (73.2%) | 3,453 (26.8%) |
| Food Preparation & Serving | 33,045 (63.7%) | 18,831 (36.3%) |
| Cleaning & Maintenance | 23,798 (53.2%) | 20,890 (46.8%) |
| Personal Care & Service | 11,409 (31.1%) | 25,247 (68.9%) |
| Total (Category) | 104,792 (44.5%) | 130,507 (55.5%) |
| Total (Overall) | 528,469 (51.0%) | 507,998 (49.0%) |
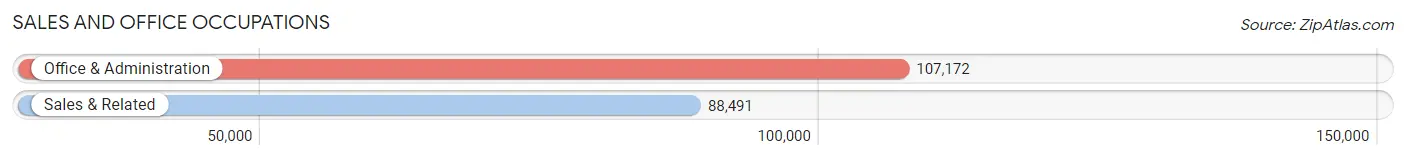
Sales and Office Occupations
The most common Sales and Office occupations in Area Code 929 are Office & Administration (107,172 | 10.3%), and Sales & Related (88,491 | 8.5%).
Sales and Office Occupations by Sex
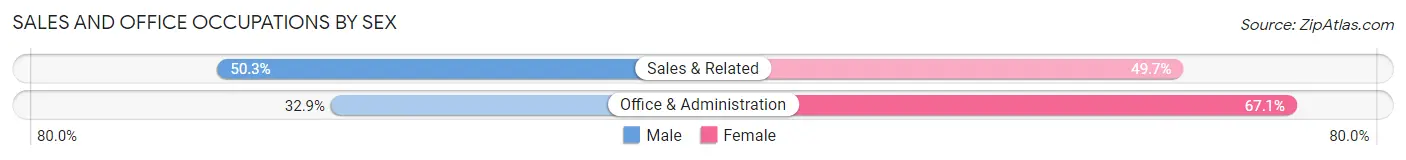
| Occupation | Male | Female |
| Sales & Related | 44,544 (50.3%) | 43,947 (49.7%) |
| Office & Administration | 35,233 (32.9%) | 71,939 (67.1%) |
| Total (Category) | 79,777 (40.8%) | 115,886 (59.2%) |
| Total (Overall) | 528,469 (51.0%) | 507,998 (49.0%) |
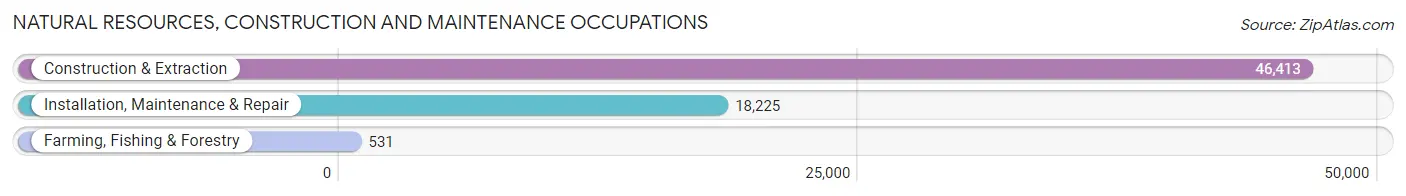
Natural Resources, Construction and Maintenance Occupations
The most common Natural Resources, Construction and Maintenance occupations in Area Code 929 are Construction & Extraction (46,413 | 4.5%), Installation, Maintenance & Repair (18,225 | 1.8%), and Farming, Fishing & Forestry (531 | 0.1%).
Natural Resources, Construction and Maintenance Occupations by Sex
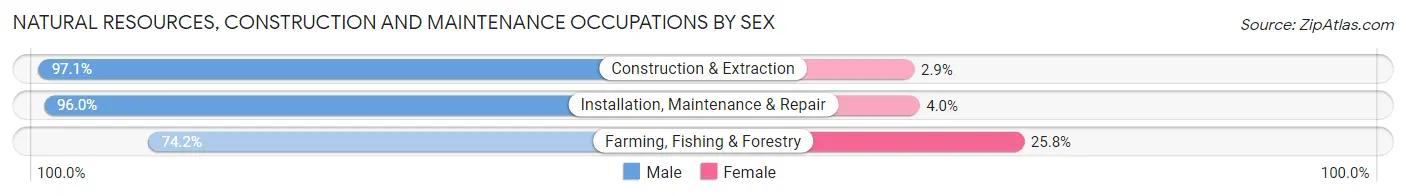
| Occupation | Male | Female |
| Farming, Fishing & Forestry | 394 (74.2%) | 137 (25.8%) |
| Construction & Extraction | 45,049 (97.1%) | 1,364 (2.9%) |
| Installation, Maintenance & Repair | 17,491 (96.0%) | 734 (4.0%) |
| Total (Category) | 62,934 (96.6%) | 2,235 (3.4%) |
| Total (Overall) | 528,469 (51.0%) | 507,998 (49.0%) |
Production, Transportation and Moving Occupations
The most common Production, Transportation and Moving occupations in Area Code 929 are Transportation (54,007 | 5.2%), Production (23,515 | 2.3%), and Material Moving (21,950 | 2.1%).
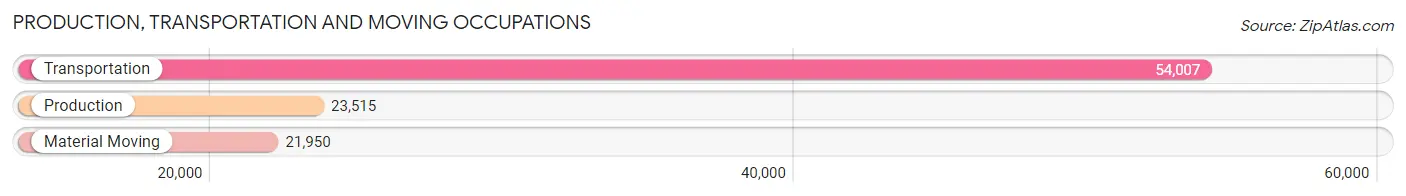
Production, Transportation and Moving Occupations by Sex
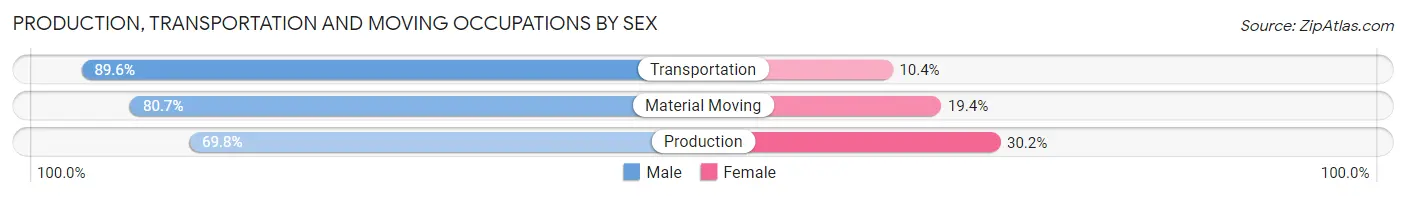
| Occupation | Male | Female |
| Production | 16,419 (69.8%) | 7,096 (30.2%) |
| Transportation | 48,369 (89.6%) | 5,638 (10.4%) |
| Material Moving | 17,702 (80.6%) | 4,248 (19.4%) |
| Total (Category) | 82,490 (82.9%) | 16,982 (17.1%) |
| Total (Overall) | 528,469 (51.0%) | 507,998 (49.0%) |
Employment Industries by Sex in Area Code 929
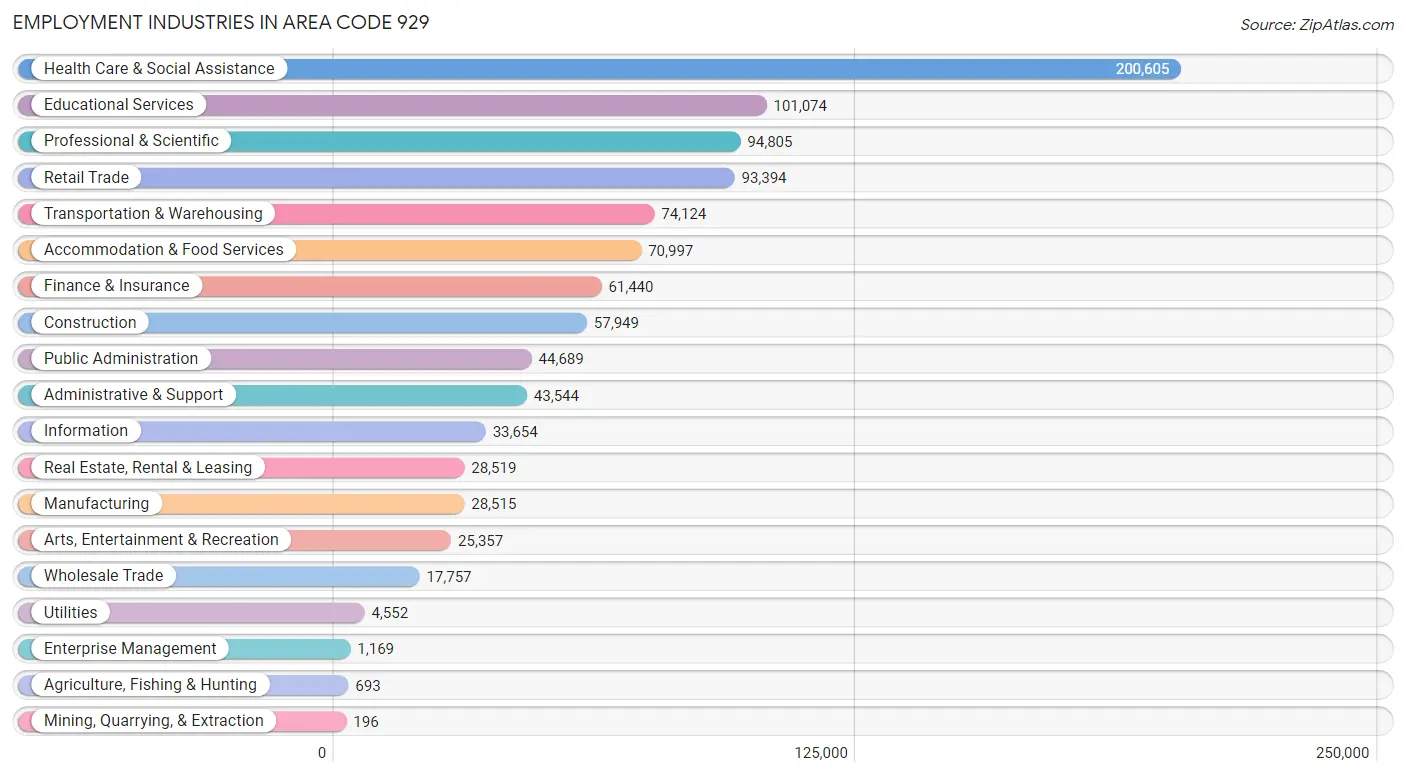
Employment Industries in Area Code 929
The major employment industries in Area Code 929 include Health Care & Social Assistance (200,605 | 19.4%), Educational Services (101,074 | 9.8%), Professional & Scientific (94,805 | 9.1%), Retail Trade (93,394 | 9.0%), and Transportation & Warehousing (74,124 | 7.1%).
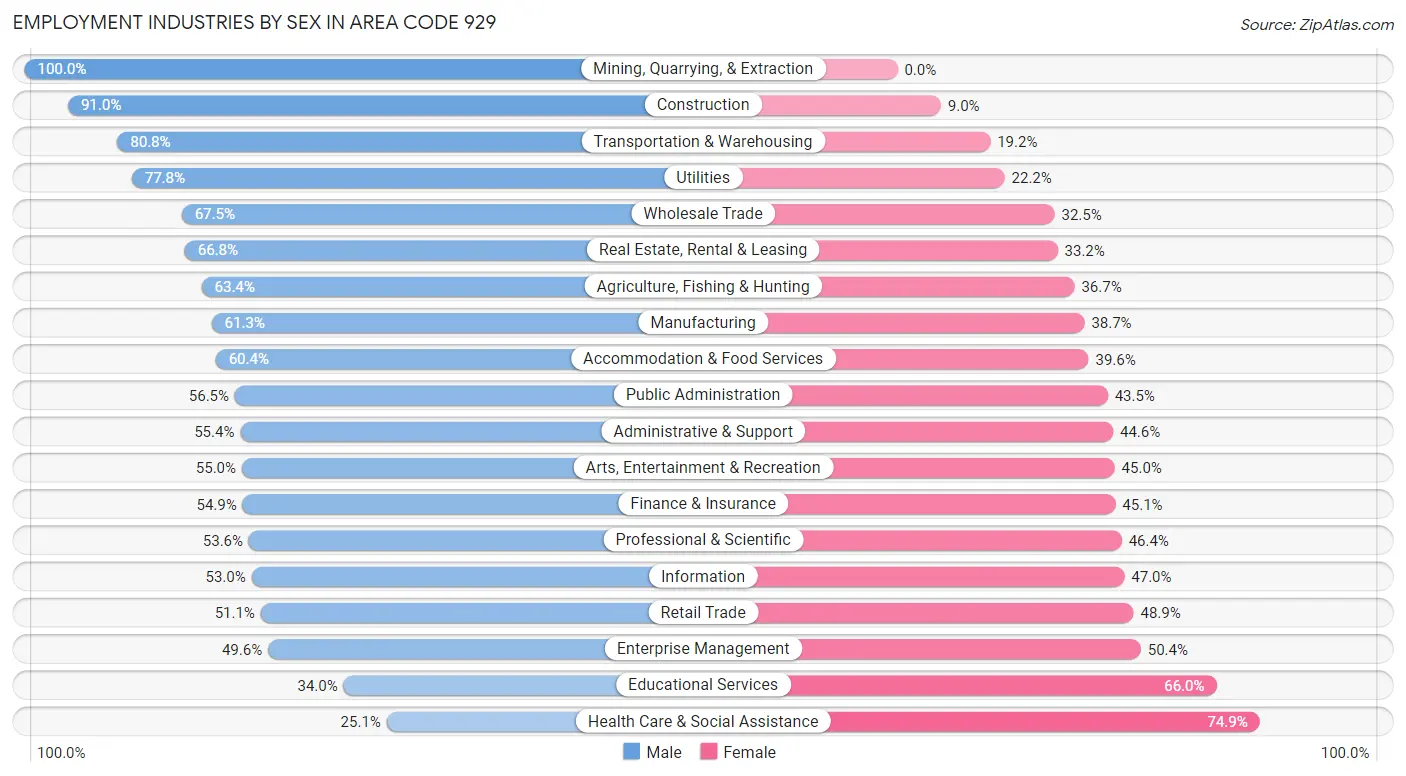
Employment Industries by Sex in Area Code 929
The Area Code 929 industries that see more men than women are Mining, Quarrying, & Extraction (100.0%), Construction (91.0%), and Transportation & Warehousing (80.8%), whereas the industries that tend to have a higher number of women are Health Care & Social Assistance (74.9%), Educational Services (66.0%), and Enterprise Management (50.4%).
| Industry | Male | Female |
| Agriculture, Fishing & Hunting | 439 (63.3%) | 254 (36.6%) |
| Mining, Quarrying, & Extraction | 196 (100.0%) | 0 (0.0%) |
| Construction | 52,737 (91.0%) | 5,212 (9.0%) |
| Manufacturing | 17,476 (61.3%) | 11,039 (38.7%) |
| Wholesale Trade | 11,981 (67.5%) | 5,776 (32.5%) |
| Retail Trade | 47,750 (51.1%) | 45,644 (48.9%) |
| Transportation & Warehousing | 59,883 (80.8%) | 14,241 (19.2%) |
| Utilities | 3,542 (77.8%) | 1,010 (22.2%) |
| Information | 17,842 (53.0%) | 15,812 (47.0%) |
| Finance & Insurance | 33,718 (54.9%) | 27,722 (45.1%) |
| Real Estate, Rental & Leasing | 19,061 (66.8%) | 9,458 (33.2%) |
| Professional & Scientific | 50,795 (53.6%) | 44,010 (46.4%) |
| Enterprise Management | 580 (49.6%) | 589 (50.4%) |
| Administrative & Support | 24,110 (55.4%) | 19,434 (44.6%) |
| Educational Services | 34,351 (34.0%) | 66,723 (66.0%) |
| Health Care & Social Assistance | 50,273 (25.1%) | 150,332 (74.9%) |
| Arts, Entertainment & Recreation | 13,953 (55.0%) | 11,404 (45.0%) |
| Accommodation & Food Services | 42,914 (60.4%) | 28,083 (39.6%) |
| Public Administration | 25,241 (56.5%) | 19,448 (43.5%) |
| Total | 528,469 (51.0%) | 507,998 (49.0%) |
Education in Area Code 929
School Enrollment in Area Code 929
The most common levels of schooling among the 504,246 students in Area Code 929 are college / undergraduate (114,900 | 22.8%), middle school (102,636 | 20.3%), and high school (98,410 | 19.5%).
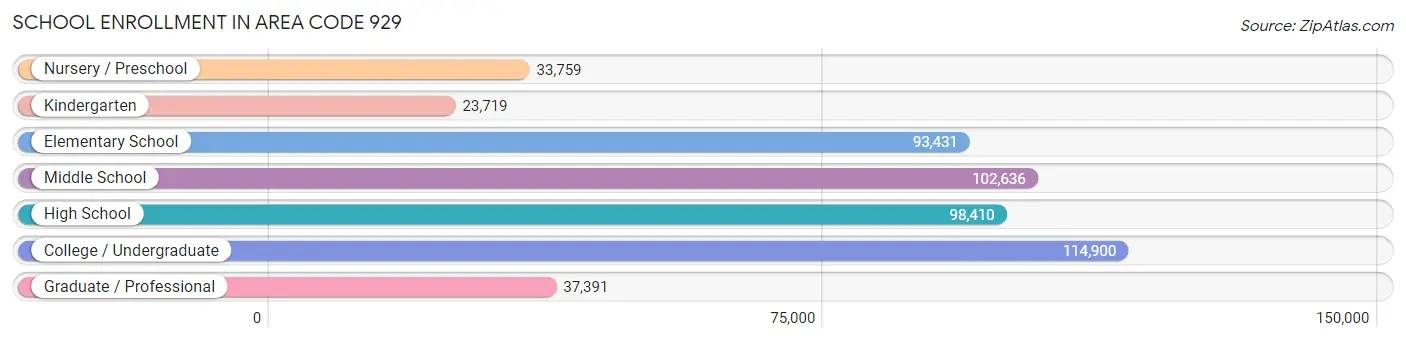
| School Level | # Students | % Students |
| Nursery / Preschool | 33,759 | 6.7% |
| Kindergarten | 23,719 | 4.7% |
| Elementary School | 93,431 | 18.5% |
| Middle School | 102,636 | 20.3% |
| High School | 98,410 | 19.5% |
| College / Undergraduate | 114,900 | 22.8% |
| Graduate / Professional | 37,391 | 7.4% |
| Total | 504,246 | 100.0% |
School Enrollment by Age by Funding Source in Area Code 929
Out of a total of 504,246 students who are enrolled in schools in Area Code 929, 128,170 (25.4%) attend a private institution, while the remaining 376,076 (74.6%) are enrolled in public schools. The age group of 25 to 34 year olds has the highest likelihood of being enrolled in private schools, with 16,738 (42.1% in the age bracket) enrolled. Conversely, the age group of 5 to 9 year old has the lowest likelihood of being enrolled in a private school, with 92,665 (82.6% in the age bracket) attending a public institution.
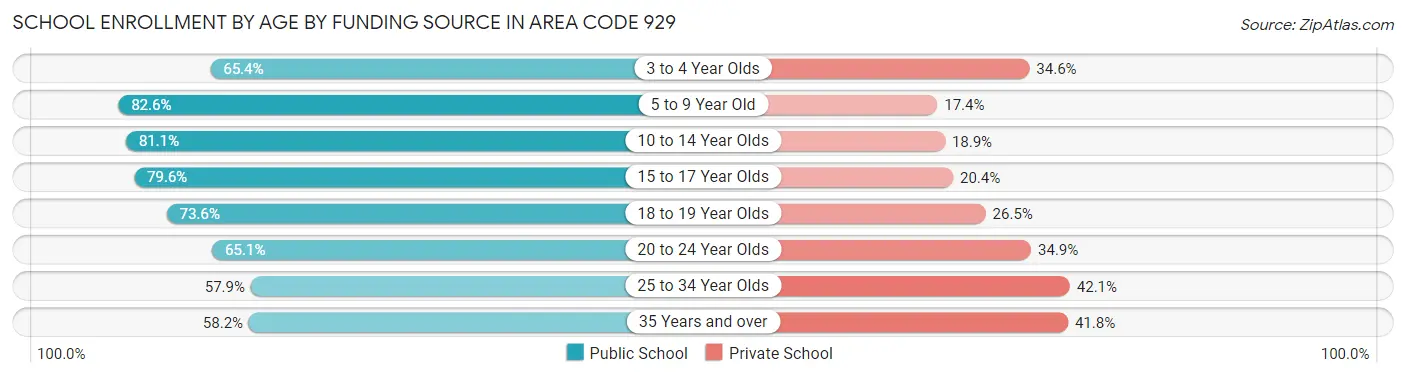
| Age Bracket | Public School | Private School |
| 3 to 4 Year Olds | 21,222 (65.4%) | 11,226 (34.6%) |
| 5 to 9 Year Old | 92,665 (82.6%) | 19,575 (17.4%) |
| 10 to 14 Year Olds | 102,289 (81.1%) | 23,783 (18.9%) |
| 15 to 17 Year Olds | 54,229 (79.6%) | 13,871 (20.4%) |
| 18 to 19 Year Olds | 25,728 (73.6%) | 9,251 (26.5%) |
| 20 to 24 Year Olds | 39,545 (65.1%) | 21,205 (34.9%) |
| 25 to 34 Year Olds | 22,990 (57.9%) | 16,738 (42.1%) |
| 35 Years and over | 17,424 (58.2%) | 12,505 (41.8%) |
| Total | 376,076 (74.6%) | 128,170 (25.4%) |
Educational Attainment by Field of Study in Area Code 929
Business (119,278 | 18.9%), social sciences (73,123 | 11.6%), science & technology (59,392 | 9.4%), education (47,300 | 7.5%), and visual & performing arts (47,077 | 7.5%) are the most common fields of study among 629,995 individuals in Area Code 929 who have obtained a bachelor's degree or higher.
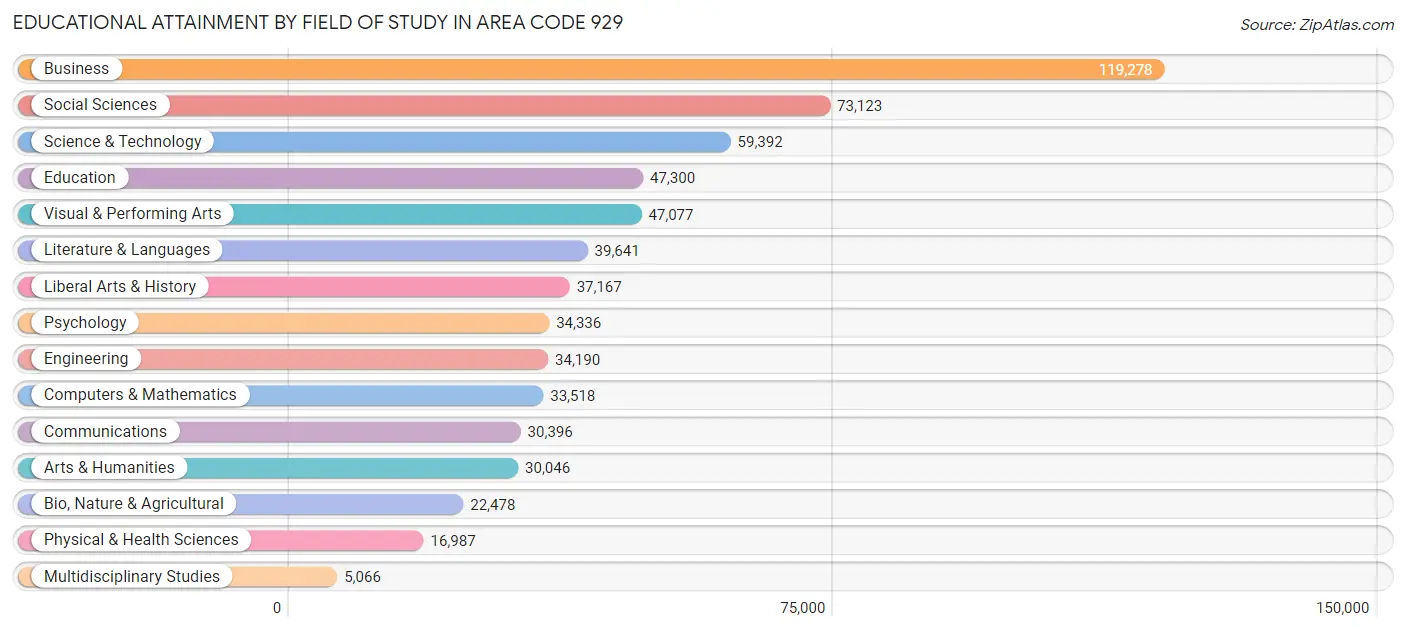
| Field of Study | # Graduates | % Graduates |
| Computers & Mathematics | 33,518 | 5.3% |
| Bio, Nature & Agricultural | 22,478 | 3.6% |
| Physical & Health Sciences | 16,987 | 2.7% |
| Psychology | 34,336 | 5.4% |
| Social Sciences | 73,123 | 11.6% |
| Engineering | 34,190 | 5.4% |
| Multidisciplinary Studies | 5,066 | 0.8% |
| Science & Technology | 59,392 | 9.4% |
| Business | 119,278 | 18.9% |
| Education | 47,300 | 7.5% |
| Literature & Languages | 39,641 | 6.3% |
| Liberal Arts & History | 37,167 | 5.9% |
| Visual & Performing Arts | 47,077 | 7.5% |
| Communications | 30,396 | 4.8% |
| Arts & Humanities | 30,046 | 4.8% |
| Total | 629,995 | 100.0% |
Transportation & Commute in Area Code 929
Vehicle Availability by Sex in Area Code 929
The most prevalent vehicle ownership categories in Area Code 929 are males with 1 vehicle (186,371, accounting for 36.3%) and females with 1 vehicle (170,837, making up 38.1%).
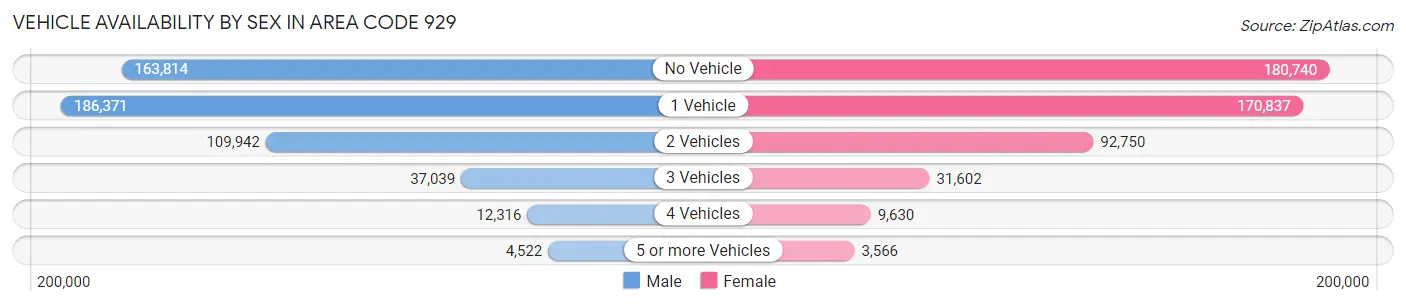
| Vehicles Available | Male | Female |
| No Vehicle | 163,814 (31.9%) | 180,740 (36.9%) |
| 1 Vehicle | 186,371 (36.3%) | 170,837 (34.9%) |
| 2 Vehicles | 109,942 (21.4%) | 92,750 (19.0%) |
| 3 Vehicles | 37,039 (7.2%) | 31,602 (6.5%) |
| 4 Vehicles | 12,316 (2.4%) | 9,630 (2.0%) |
| 5 or more Vehicles | 4,522 (0.9%) | 3,566 (0.7%) |
| Total | 514,004 (100.0%) | 489,125 (100.0%) |
Commute Time in Area Code 929
The most frequently occuring commute durations in Area Code 929 are 60 to 89 minutes (177,420 commuters, 19.8%), 30 to 34 minutes (134,735 commuters, 15.1%), and 45 to 59 minutes (133,896 commuters, 15.0%).
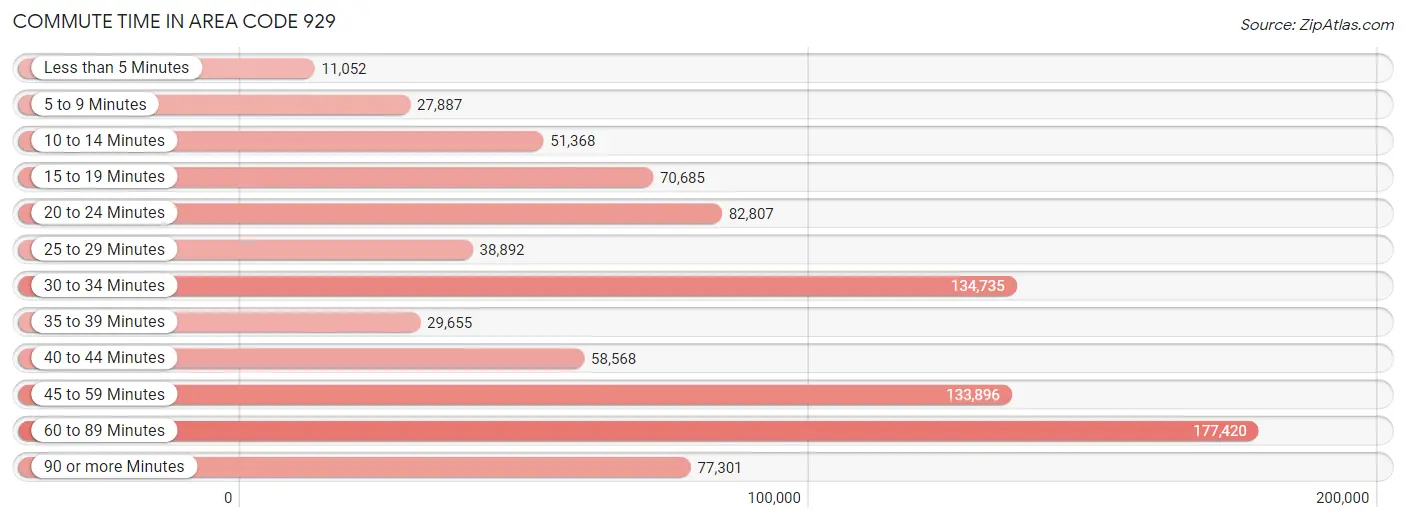
| Commute Time | # Commuters | % Commuters |
| Less than 5 Minutes | 11,052 | 1.2% |
| 5 to 9 Minutes | 27,887 | 3.1% |
| 10 to 14 Minutes | 51,368 | 5.7% |
| 15 to 19 Minutes | 70,685 | 7.9% |
| 20 to 24 Minutes | 82,807 | 9.3% |
| 25 to 29 Minutes | 38,892 | 4.3% |
| 30 to 34 Minutes | 134,735 | 15.1% |
| 35 to 39 Minutes | 29,655 | 3.3% |
| 40 to 44 Minutes | 58,568 | 6.6% |
| 45 to 59 Minutes | 133,896 | 15.0% |
| 60 to 89 Minutes | 177,420 | 19.8% |
| 90 or more Minutes | 77,301 | 8.6% |
Commute Time by Sex in Area Code 929
The most common commute times in Area Code 929 are 60 to 89 minutes (95,144 commuters, 20.6%) for males and 60 to 89 minutes (82,276 commuters, 19.1%) for females.
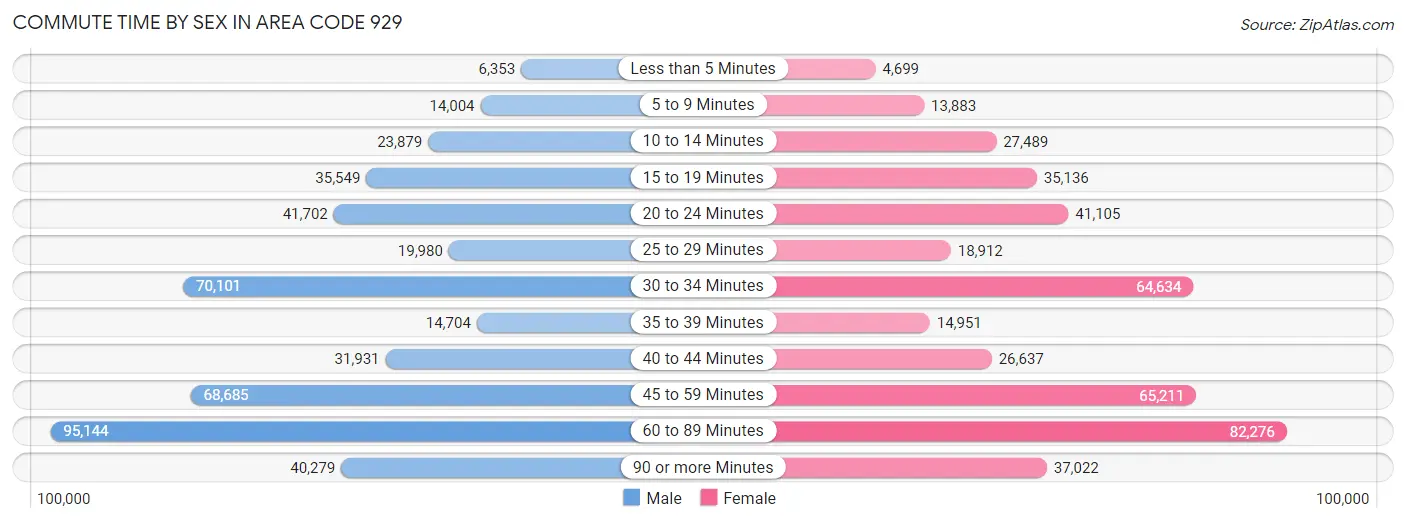
| Commute Time | Male | Female |
| Less than 5 Minutes | 6,353 (1.4%) | 4,699 (1.1%) |
| 5 to 9 Minutes | 14,004 (3.0%) | 13,883 (3.2%) |
| 10 to 14 Minutes | 23,879 (5.2%) | 27,489 (6.4%) |
| 15 to 19 Minutes | 35,549 (7.7%) | 35,136 (8.1%) |
| 20 to 24 Minutes | 41,702 (9.0%) | 41,105 (9.5%) |
| 25 to 29 Minutes | 19,980 (4.3%) | 18,912 (4.4%) |
| 30 to 34 Minutes | 70,101 (15.2%) | 64,634 (15.0%) |
| 35 to 39 Minutes | 14,704 (3.2%) | 14,951 (3.5%) |
| 40 to 44 Minutes | 31,931 (6.9%) | 26,637 (6.2%) |
| 45 to 59 Minutes | 68,685 (14.9%) | 65,211 (15.1%) |
| 60 to 89 Minutes | 95,144 (20.6%) | 82,276 (19.1%) |
| 90 or more Minutes | 40,279 (8.7%) | 37,022 (8.6%) |
Time of Departure to Work by Sex in Area Code 929
The most frequent times of departure to work in Area Code 929 are 7:00 AM to 7:29 AM (68,778, 14.9%) for males and 8:00 AM to 8:29 AM (76,305, 17.7%) for females.
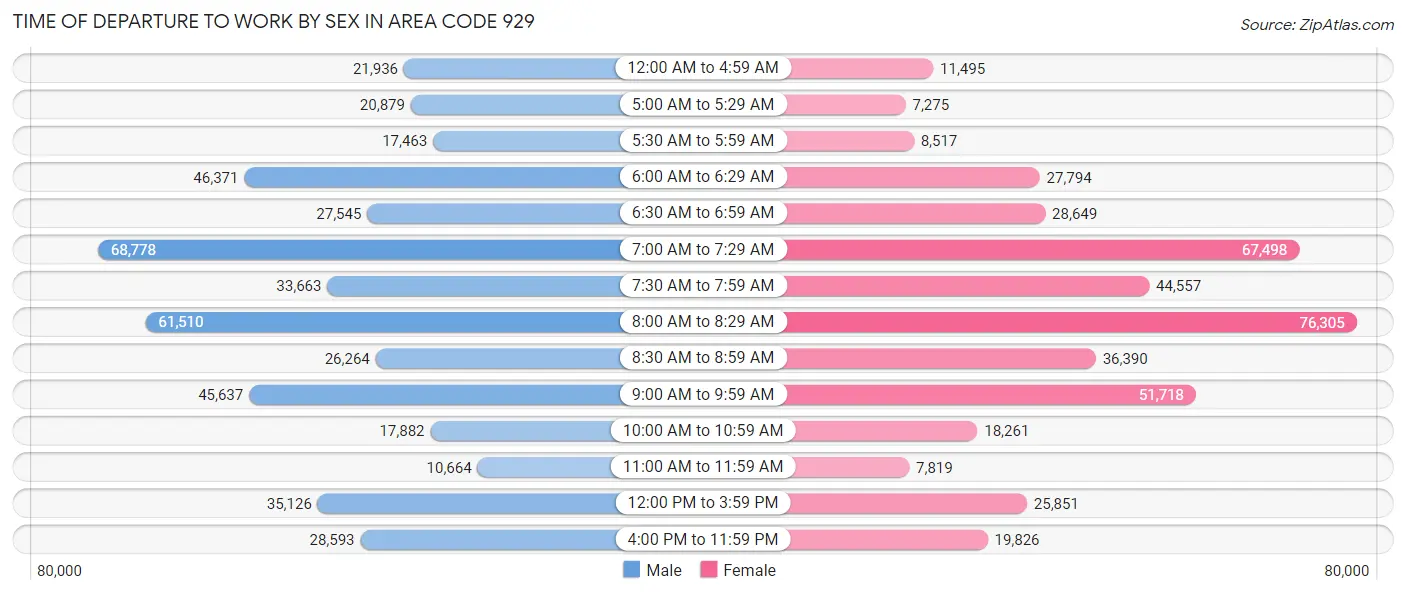
| Time of Departure | Male | Female |
| 12:00 AM to 4:59 AM | 21,936 (4.7%) | 11,495 (2.7%) |
| 5:00 AM to 5:29 AM | 20,879 (4.5%) | 7,275 (1.7%) |
| 5:30 AM to 5:59 AM | 17,463 (3.8%) | 8,517 (2.0%) |
| 6:00 AM to 6:29 AM | 46,371 (10.0%) | 27,794 (6.4%) |
| 6:30 AM to 6:59 AM | 27,545 (6.0%) | 28,649 (6.6%) |
| 7:00 AM to 7:29 AM | 68,778 (14.9%) | 67,498 (15.6%) |
| 7:30 AM to 7:59 AM | 33,663 (7.3%) | 44,557 (10.3%) |
| 8:00 AM to 8:29 AM | 61,510 (13.3%) | 76,305 (17.7%) |
| 8:30 AM to 8:59 AM | 26,264 (5.7%) | 36,390 (8.4%) |
| 9:00 AM to 9:59 AM | 45,637 (9.9%) | 51,718 (12.0%) |
| 10:00 AM to 10:59 AM | 17,882 (3.9%) | 18,261 (4.2%) |
| 11:00 AM to 11:59 AM | 10,664 (2.3%) | 7,819 (1.8%) |
| 12:00 PM to 3:59 PM | 35,126 (7.6%) | 25,851 (6.0%) |
| 4:00 PM to 11:59 PM | 28,593 (6.2%) | 19,826 (4.6%) |
| Total | 462,311 (100.0%) | 431,955 (100.0%) |
Housing Occupancy in Area Code 929
Occupancy by Ownership in Area Code 929
Of the total 788,484 dwellings in Area Code 929, owner-occupied units account for 325,654 (41.3%), while renter-occupied units make up 462,830 (58.7%).
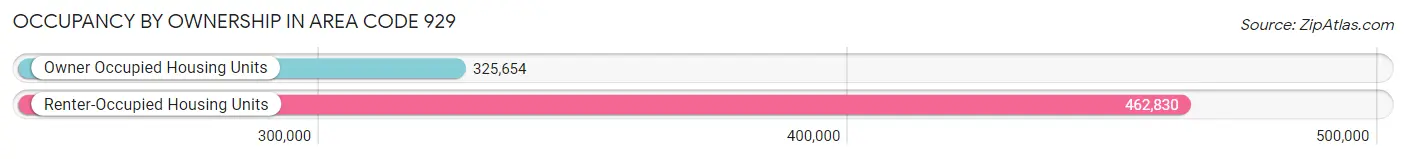
| Occupancy | # Housing Units | % Housing Units |
| Owner Occupied Housing Units | 325,654 | 41.3% |
| Renter-Occupied Housing Units | 462,830 | 58.7% |
| Total Occupied Housing Units | 788,484 | 100.0% |
Occupancy by Household Size in Area Code 929
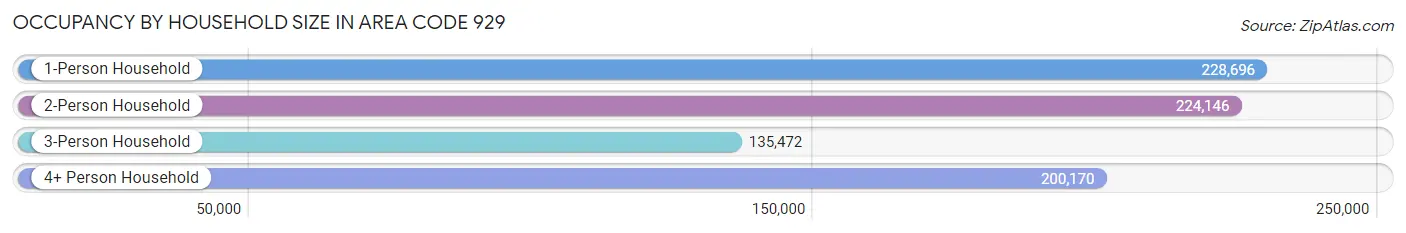
| Household Size | # Housing Units | % Housing Units |
| 1-Person Household | 228,696 | 29.0% |
| 2-Person Household | 224,146 | 28.4% |
| 3-Person Household | 135,472 | 17.2% |
| 4+ Person Household | 200,170 | 25.4% |
| Total Housing Units | 788,484 | 100.0% |
Occupancy by Ownership by Household Size in Area Code 929
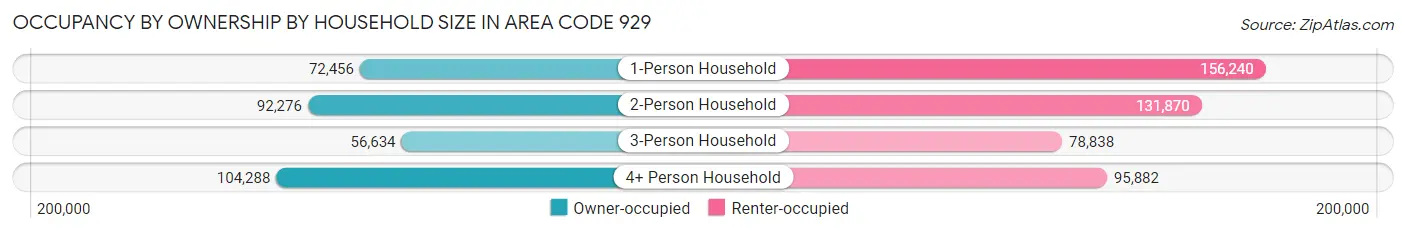
| Household Size | Owner-occupied | Renter-occupied |
| 1-Person Household | 72,456 (31.7%) | 156,240 (68.3%) |
| 2-Person Household | 92,276 (41.2%) | 131,870 (58.8%) |
| 3-Person Household | 56,634 (41.8%) | 78,838 (58.2%) |
| 4+ Person Household | 104,288 (52.1%) | 95,882 (47.9%) |
| Total Housing Units | 325,654 (41.3%) | 462,830 (58.7%) |
Occupancy by Educational Attainment in Area Code 929
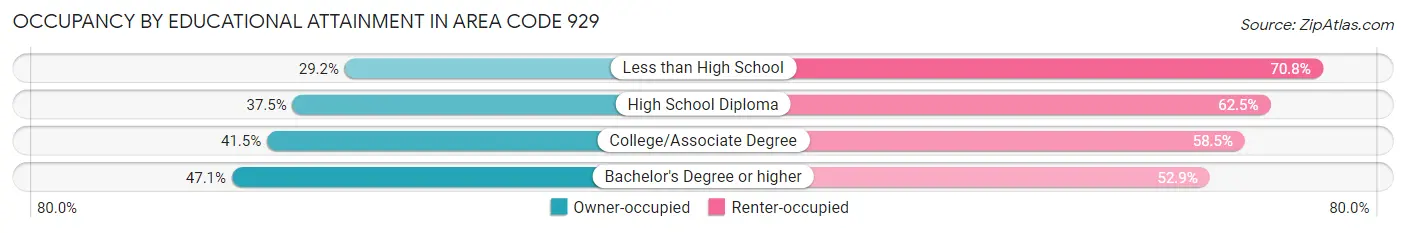
| Household Size | Owner-occupied | Renter-occupied |
| Less than High School | 30,558 (29.2%) | 74,050 (70.8%) |
| High School Diploma | 67,498 (37.5%) | 112,492 (62.5%) |
| College/Associate Degree | 73,451 (41.5%) | 103,377 (58.5%) |
| Bachelor's Degree or higher | 154,147 (47.1%) | 172,911 (52.9%) |
Occupancy by Age of Householder in Area Code 929
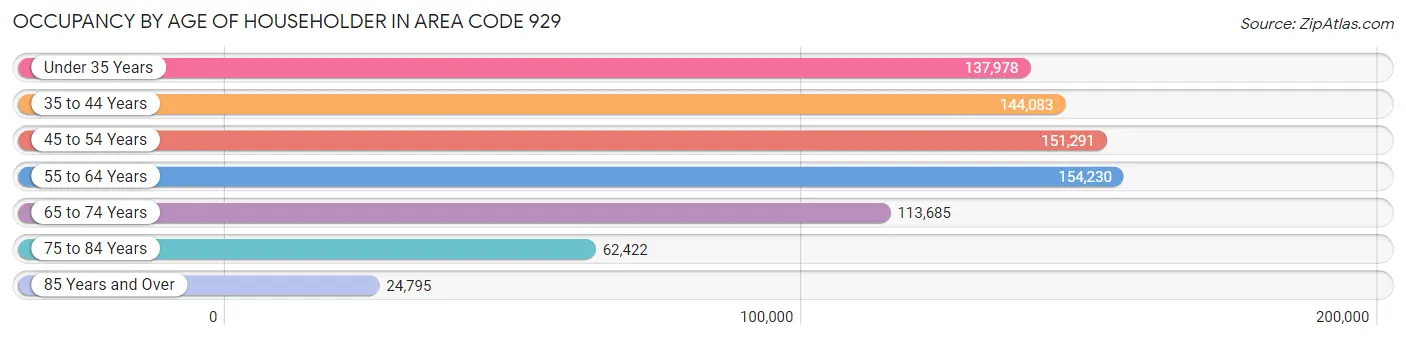
| Age Bracket | # Households | % Households |
| Under 35 Years | 137,978 | 17.5% |
| 35 to 44 Years | 144,083 | 18.3% |
| 45 to 54 Years | 151,291 | 19.2% |
| 55 to 64 Years | 154,230 | 19.6% |
| 65 to 74 Years | 113,685 | 14.4% |
| 75 to 84 Years | 62,422 | 7.9% |
| 85 Years and Over | 24,795 | 3.1% |
| Total | 788,484 | 100.0% |
Housing Finances in Area Code 929
Median Income by Occupancy in Area Code 929
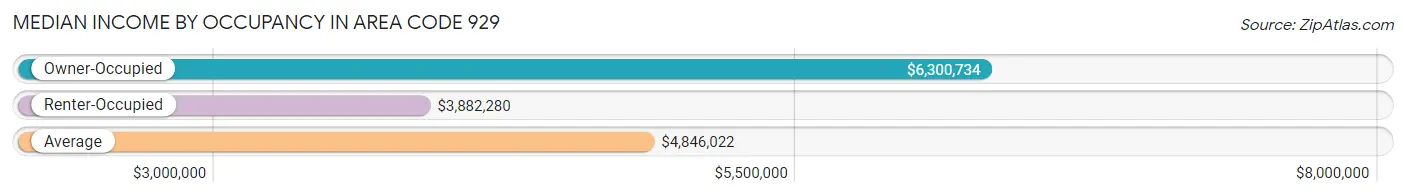
| Occupancy Type | # Households | Median Income |
| Owner-Occupied | 325,654 (41.3%) | $6,300,734 |
| Renter-Occupied | 462,830 (58.7%) | $3,882,280 |
| Average | 788,484 (100.0%) | $4,846,022 |
Occupancy by Householder Income Bracket in Area Code 929
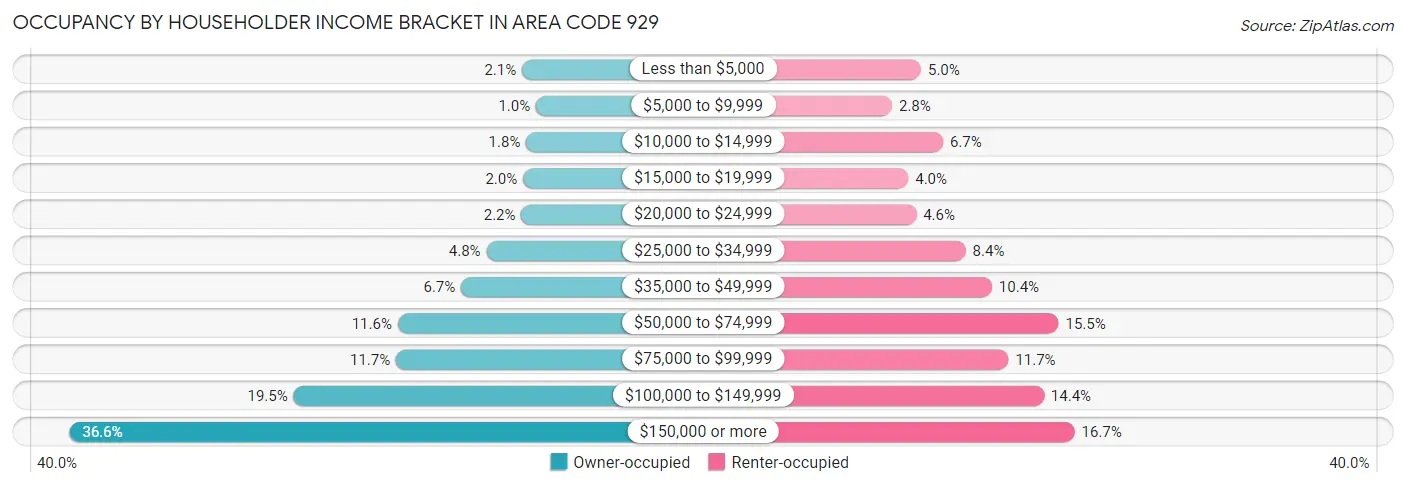
| Income Bracket | Owner-occupied | Renter-occupied |
| Less than $5,000 | 6,846 (2.1%) | 23,099 (5.0%) |
| $5,000 to $9,999 | 3,341 (1.0%) | 12,857 (2.8%) |
| $10,000 to $14,999 | 5,791 (1.8%) | 30,826 (6.7%) |
| $15,000 to $19,999 | 6,567 (2.0%) | 18,585 (4.0%) |
| $20,000 to $24,999 | 7,010 (2.1%) | 21,388 (4.6%) |
| $25,000 to $34,999 | 15,660 (4.8%) | 38,846 (8.4%) |
| $35,000 to $49,999 | 21,955 (6.7%) | 48,071 (10.4%) |
| $50,000 to $74,999 | 37,686 (11.6%) | 71,611 (15.5%) |
| $75,000 to $99,999 | 38,092 (11.7%) | 53,899 (11.7%) |
| $100,000 to $149,999 | 63,539 (19.5%) | 66,411 (14.3%) |
| $150,000 or more | 119,167 (36.6%) | 77,237 (16.7%) |
| Total | 325,654 (100.0%) | 462,830 (100.0%) |
Monthly Housing Cost Tiers in Area Code 929
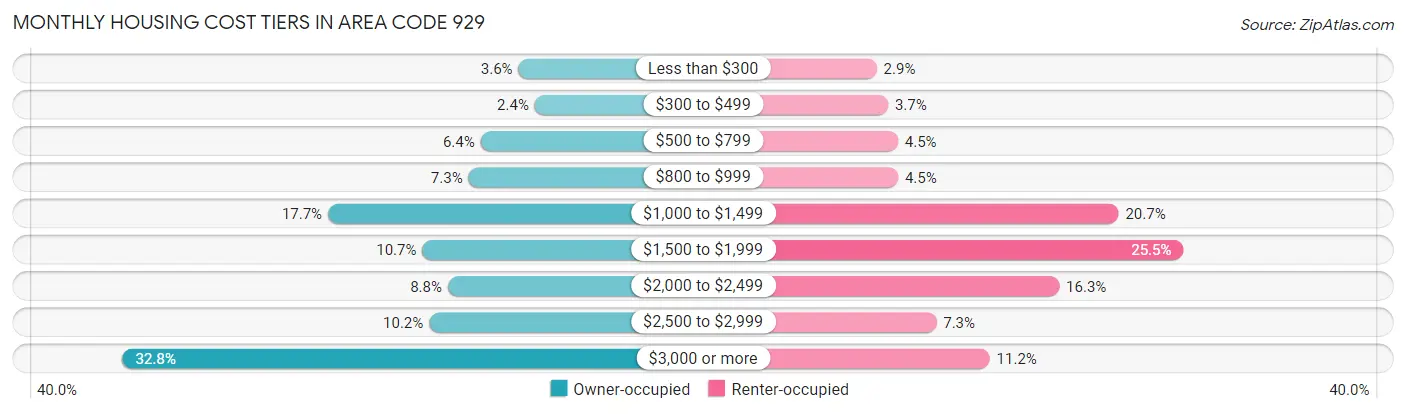
| Monthly Cost | Owner-occupied | Renter-occupied |
| Less than $300 | 11,828 (3.6%) | 13,359 (2.9%) |
| $300 to $499 | 7,908 (2.4%) | 17,225 (3.7%) |
| $500 to $799 | 20,913 (6.4%) | 20,617 (4.4%) |
| $800 to $999 | 23,799 (7.3%) | 20,622 (4.5%) |
| $1,000 to $1,499 | 57,519 (17.7%) | 95,810 (20.7%) |
| $1,500 to $1,999 | 34,885 (10.7%) | 117,874 (25.5%) |
| $2,000 to $2,499 | 28,764 (8.8%) | 75,593 (16.3%) |
| $2,500 to $2,999 | 33,240 (10.2%) | 33,700 (7.3%) |
| $3,000 or more | 106,798 (32.8%) | 51,876 (11.2%) |
| Total | 325,654 (100.0%) | 462,830 (100.0%) |
Physical Housing Characteristics in Area Code 929
Housing Structures in Area Code 929
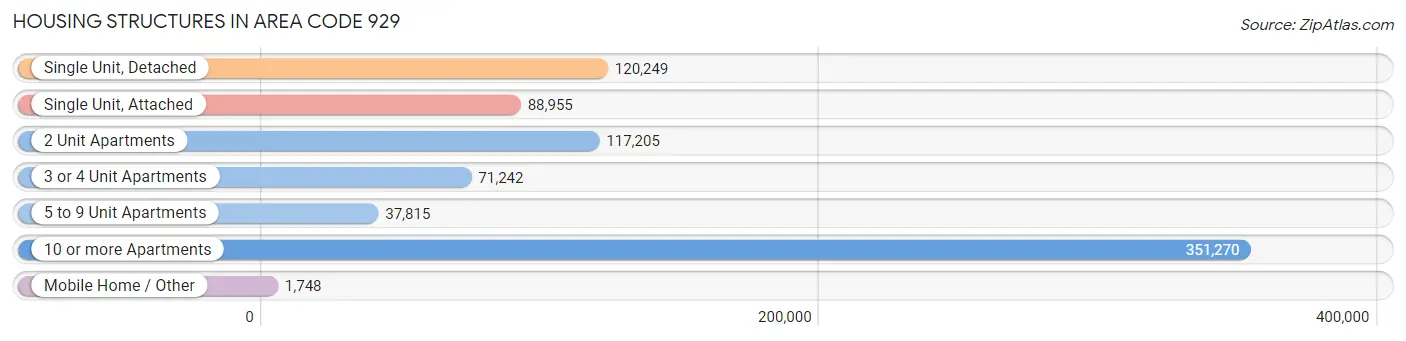
| Structure Type | # Housing Units | % Housing Units |
| Single Unit, Detached | 120,249 | 15.2% |
| Single Unit, Attached | 88,955 | 11.3% |
| 2 Unit Apartments | 117,205 | 14.9% |
| 3 or 4 Unit Apartments | 71,242 | 9.0% |
| 5 to 9 Unit Apartments | 37,815 | 4.8% |
| 10 or more Apartments | 351,270 | 44.6% |
| Mobile Home / Other | 1,748 | 0.2% |
| Total | 788,484 | 100.0% |
Housing Structures by Occupancy in Area Code 929
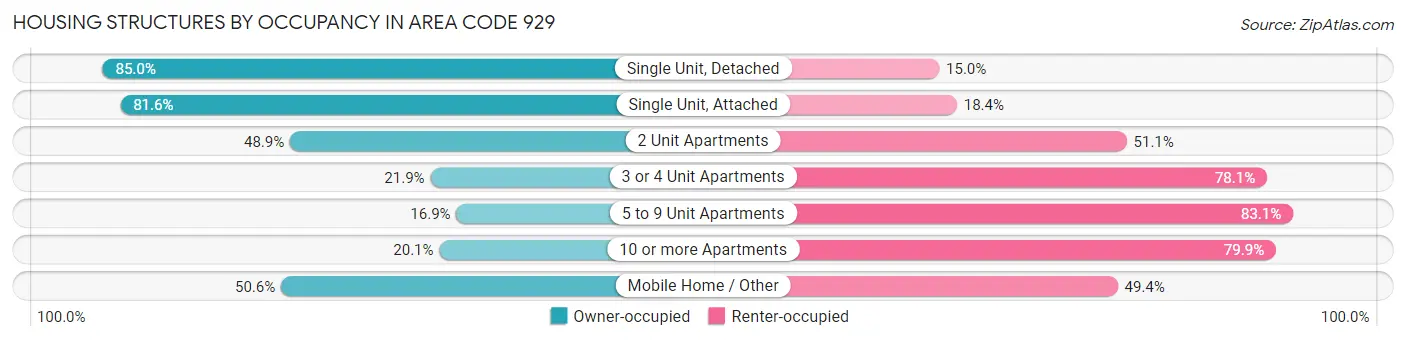
| Structure Type | Owner-occupied | Renter-occupied |
| Single Unit, Detached | 102,202 (85.0%) | 18,047 (15.0%) |
| Single Unit, Attached | 72,577 (81.6%) | 16,378 (18.4%) |
| 2 Unit Apartments | 57,303 (48.9%) | 59,902 (51.1%) |
| 3 or 4 Unit Apartments | 15,579 (21.9%) | 55,663 (78.1%) |
| 5 to 9 Unit Apartments | 6,374 (16.9%) | 31,441 (83.1%) |
| 10 or more Apartments | 70,734 (20.1%) | 280,536 (79.9%) |
| Mobile Home / Other | 885 (50.6%) | 863 (49.4%) |
| Total | 325,654 (41.3%) | 462,830 (58.7%) |
Housing Structures by Number of Rooms in Area Code 929
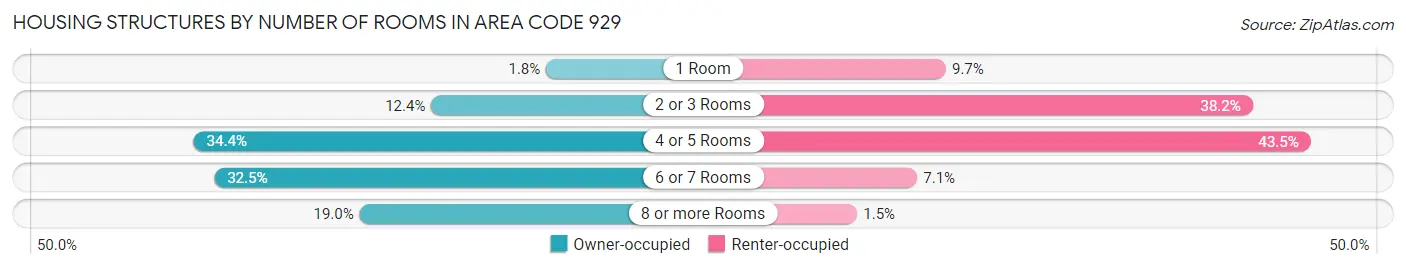
| Number of Rooms | Owner-occupied | Renter-occupied |
| 1 Room | 5,765 (1.8%) | 44,998 (9.7%) |
| 2 or 3 Rooms | 40,340 (12.4%) | 176,621 (38.2%) |
| 4 or 5 Rooms | 111,891 (34.4%) | 201,410 (43.5%) |
| 6 or 7 Rooms | 105,709 (32.5%) | 32,744 (7.1%) |
| 8 or more Rooms | 61,949 (19.0%) | 7,057 (1.5%) |
| Total | 325,654 (100.0%) | 462,830 (100.0%) |
Housing Structure by Heating Type in Area Code 929
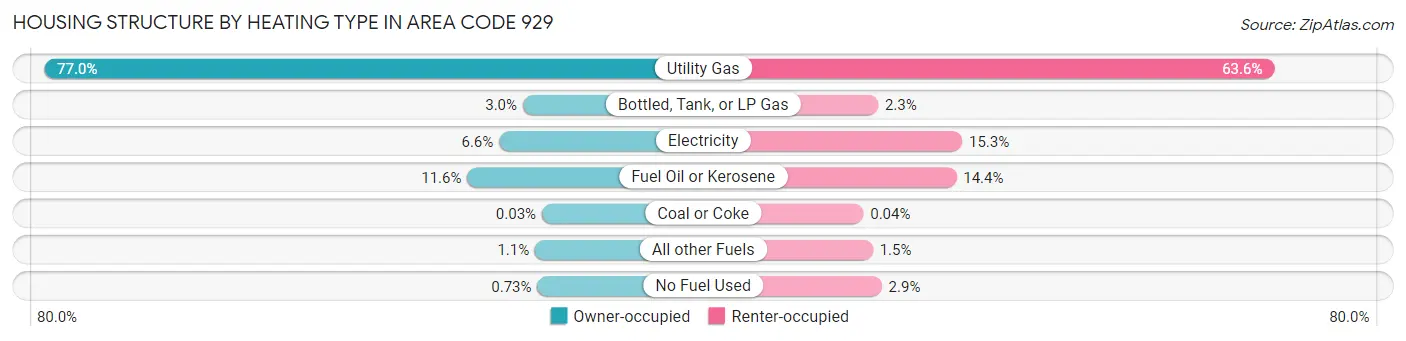
| Heating Type | Owner-occupied | Renter-occupied |
| Utility Gas | 250,693 (77.0%) | 294,157 (63.6%) |
| Bottled, Tank, or LP Gas | 9,676 (3.0%) | 10,713 (2.3%) |
| Electricity | 21,635 (6.6%) | 70,838 (15.3%) |
| Fuel Oil or Kerosene | 37,642 (11.6%) | 66,711 (14.4%) |
| Coal or Coke | 104 (0.0%) | 194 (0.0%) |
| All other Fuels | 3,535 (1.1%) | 6,900 (1.5%) |
| No Fuel Used | 2,369 (0.7%) | 13,317 (2.9%) |
| Total | 325,654 (100.0%) | 462,830 (100.0%) |
Household Vehicle Usage in Area Code 929
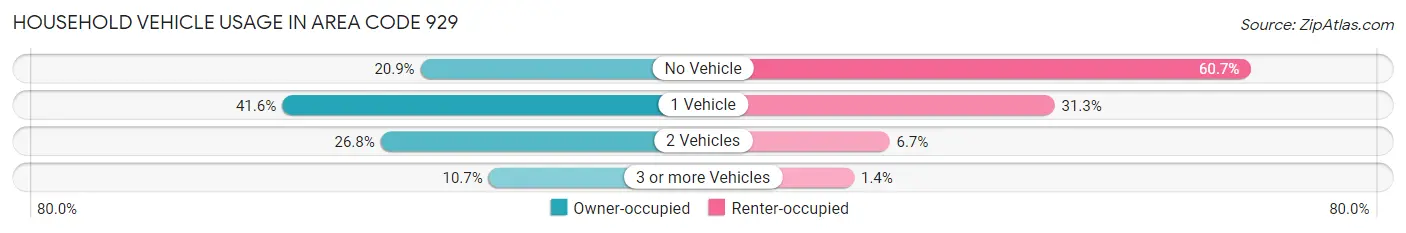
| Vehicles per Household | Owner-occupied | Renter-occupied |
| No Vehicle | 68,010 (20.9%) | 280,804 (60.7%) |
| 1 Vehicle | 135,356 (41.6%) | 144,905 (31.3%) |
| 2 Vehicles | 87,405 (26.8%) | 30,838 (6.7%) |
| 3 or more Vehicles | 34,883 (10.7%) | 6,283 (1.4%) |
| Total | 325,654 (100.0%) | 462,830 (100.0%) |
Real Estate & Mortgages in Area Code 929
Real Estate and Mortgage Overview in Area Code 929
| Characteristic | Without Mortgage | With Mortgage |
| Housing Units | 129,534 | 196,120 |
| Median Property Value | $36,279,303 | $40,396,903 |
| Median Household Income | $4,542,413 | $84,910 |
| Monthly Housing Costs | $54,105 | $102,767 |
| Real Estate Taxes | $302,706 | $16,134 |
Property Value by Mortgage Status in Area Code 929
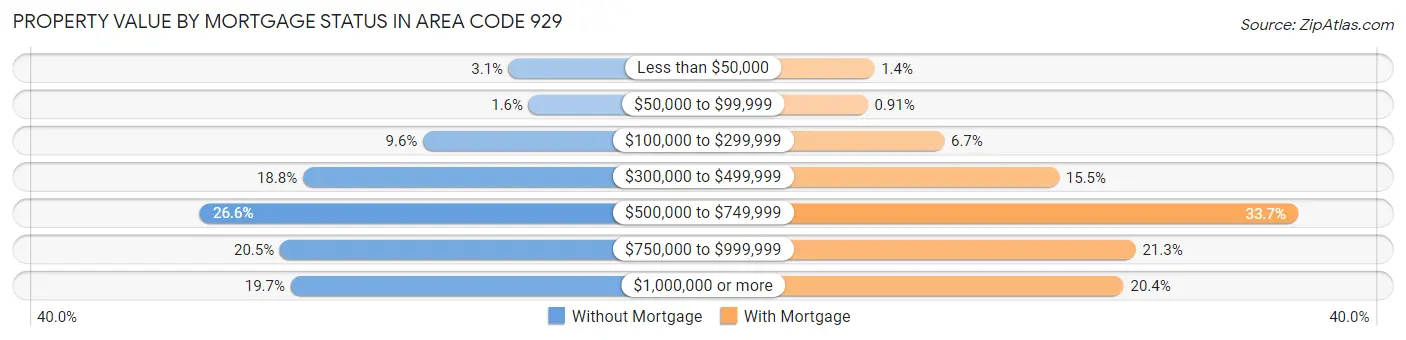
| Property Value | Without Mortgage | With Mortgage |
| Less than $50,000 | 4,021 (3.1%) | 2,776 (1.4%) |
| $50,000 to $99,999 | 2,048 (1.6%) | 1,778 (0.9%) |
| $100,000 to $299,999 | 12,469 (9.6%) | 13,221 (6.7%) |
| $300,000 to $499,999 | 24,343 (18.8%) | 30,385 (15.5%) |
| $500,000 to $749,999 | 34,498 (26.6%) | 66,068 (33.7%) |
| $750,000 to $999,999 | 26,612 (20.5%) | 41,842 (21.3%) |
| $1,000,000 or more | 25,543 (19.7%) | 40,050 (20.4%) |
| Total | 129,534 (100.0%) | 196,120 (100.0%) |
Household Income by Mortgage Status in Area Code 929
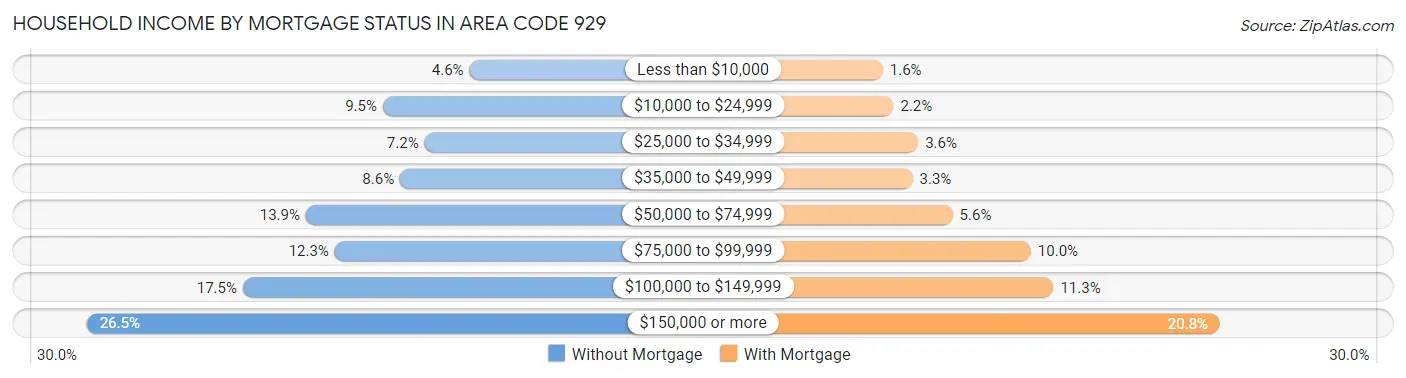
| Household Income | Without Mortgage | With Mortgage |
| Less than $10,000 | 5,928 (4.6%) | 3,065 (1.6%) |
| $10,000 to $24,999 | 12,347 (9.5%) | 4,259 (2.2%) |
| $25,000 to $34,999 | 9,264 (7.1%) | 7,021 (3.6%) |
| $35,000 to $49,999 | 11,072 (8.6%) | 6,396 (3.3%) |
| $50,000 to $74,999 | 18,044 (13.9%) | 10,883 (5.6%) |
| $75,000 to $99,999 | 15,910 (12.3%) | 19,642 (10.0%) |
| $100,000 to $149,999 | 22,712 (17.5%) | 22,182 (11.3%) |
| $150,000 or more | 34,257 (26.5%) | 40,827 (20.8%) |
| Total | 129,534 (100.0%) | 196,120 (100.0%) |
Property Value to Household Income Ratio in Area Code 929
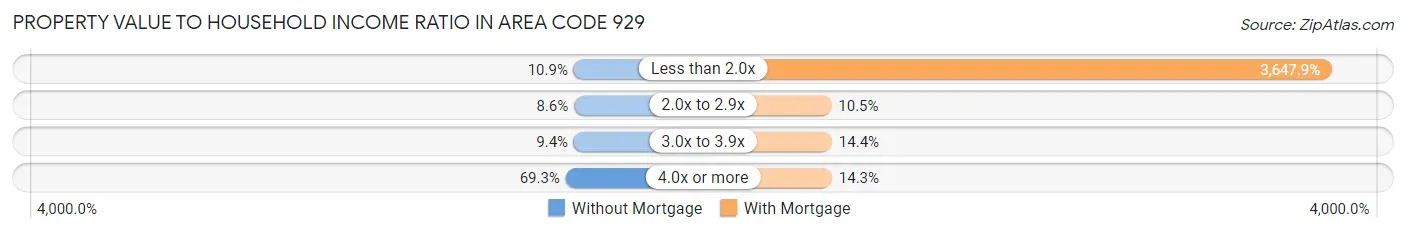
| Value-to-Income Ratio | Without Mortgage | With Mortgage |
| Less than 2.0x | 14,144 (10.9%) | 7,154,259 (3,647.9%) |
| 2.0x to 2.9x | 11,175 (8.6%) | 20,577 (10.5%) |
| 3.0x to 3.9x | 12,178 (9.4%) | 28,228 (14.4%) |
| 4.0x or more | 89,800 (69.3%) | 27,981 (14.3%) |
| Total | 129,534 (100.0%) | 196,120 (100.0%) |
Real Estate Taxes by Mortgage Status in Area Code 929
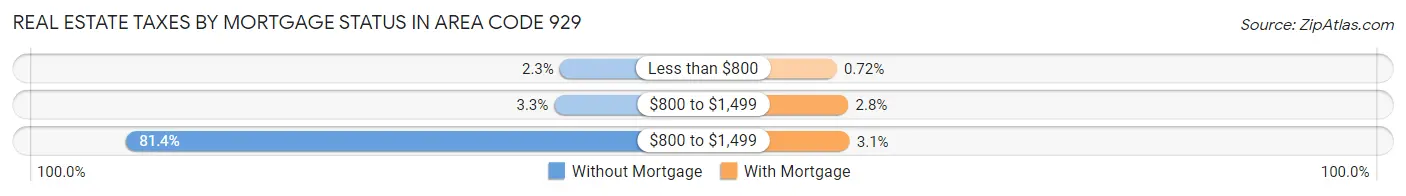
| Property Taxes | Without Mortgage | With Mortgage |
| Less than $800 | 2,959 (2.3%) | 1,415 (0.7%) |
| $800 to $1,499 | 4,253 (3.3%) | 5,576 (2.8%) |
| $800 to $1,499 | 105,449 (81.4%) | 6,015 (3.1%) |
| Total | 129,534 (100.0%) | 196,120 (100.0%) |
Health & Disability in Area Code 929
Health Insurance Coverage by Age in Area Code 929
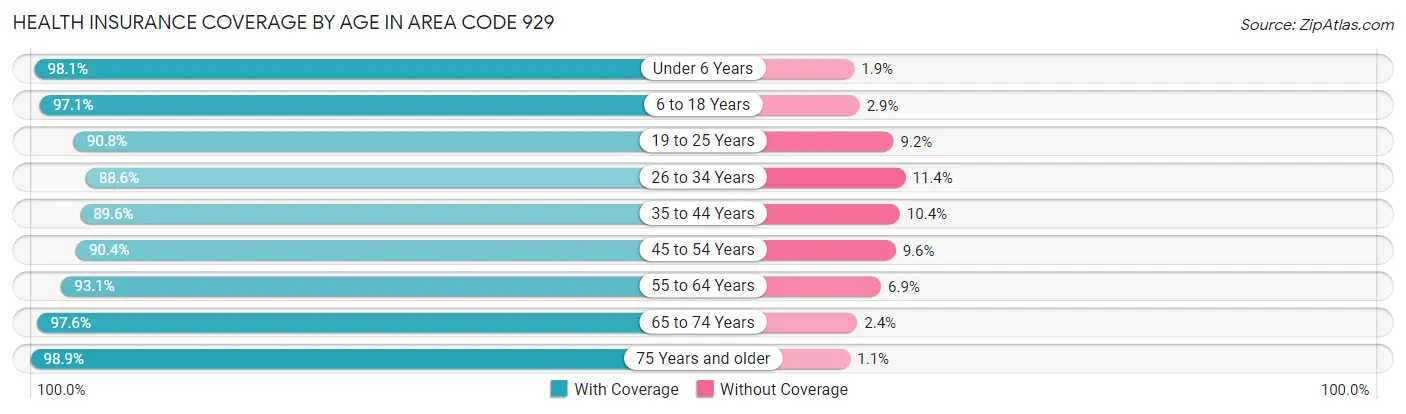
| Age Bracket | With Coverage | Without Coverage |
| Under 6 Years | 148,753 (98.1%) | 2,838 (1.9%) |
| 6 to 18 Years | 305,677 (97.1%) | 9,065 (2.9%) |
| 19 to 25 Years | 166,089 (90.8%) | 16,805 (9.2%) |
| 26 to 34 Years | 276,080 (88.6%) | 35,637 (11.4%) |
| 35 to 44 Years | 264,070 (89.6%) | 30,543 (10.4%) |
| 45 to 54 Years | 252,645 (90.4%) | 26,803 (9.6%) |
| 55 to 64 Years | 252,946 (93.1%) | 18,619 (6.9%) |
| 65 to 74 Years | 189,135 (97.6%) | 4,702 (2.4%) |
| 75 Years and older | 137,853 (98.9%) | 1,581 (1.1%) |
| Total | 1,993,248 (93.1%) | 146,593 (6.9%) |
Health Insurance Coverage by Citizenship Status in Area Code 929
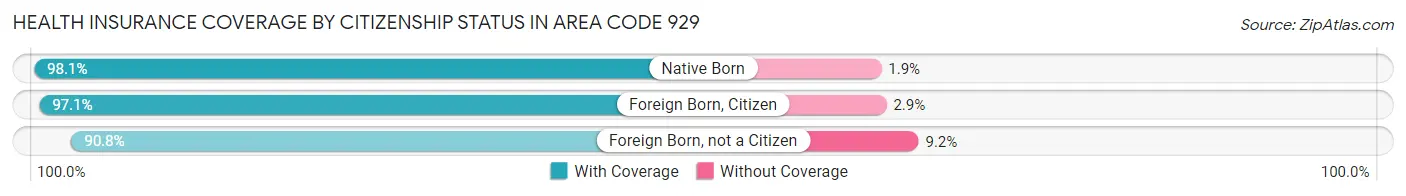
| Citizenship Status | With Coverage | Without Coverage |
| Native Born | 148,753 (98.1%) | 2,838 (1.9%) |
| Foreign Born, Citizen | 305,677 (97.1%) | 9,065 (2.9%) |
| Foreign Born, not a Citizen | 166,089 (90.8%) | 16,805 (9.2%) |
Health Insurance Coverage by Household Income in Area Code 929
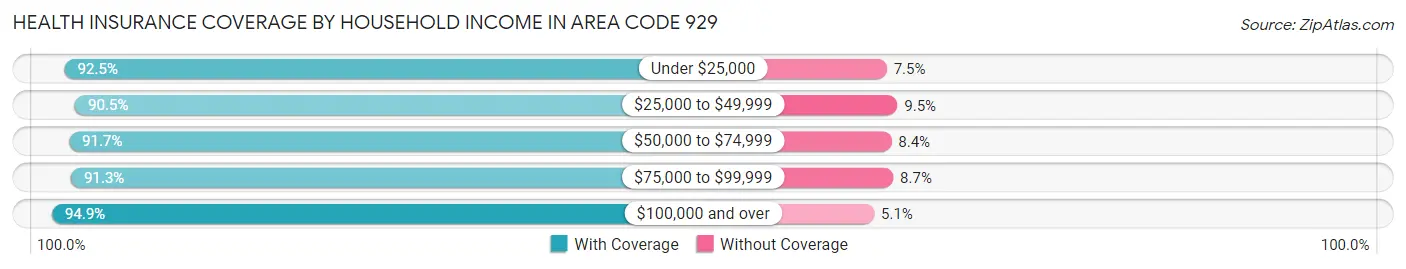
| Household Income | With Coverage | Without Coverage |
| Under $25,000 | 234,268 (92.5%) | 18,950 (7.5%) |
| $25,000 to $49,999 | 264,657 (90.5%) | 27,685 (9.5%) |
| $50,000 to $74,999 | 257,561 (91.6%) | 23,461 (8.4%) |
| $75,000 to $99,999 | 227,270 (91.3%) | 21,622 (8.7%) |
| $100,000 and over | 990,050 (94.9%) | 53,398 (5.1%) |
Public vs Private Health Insurance Coverage by Age in Area Code 929
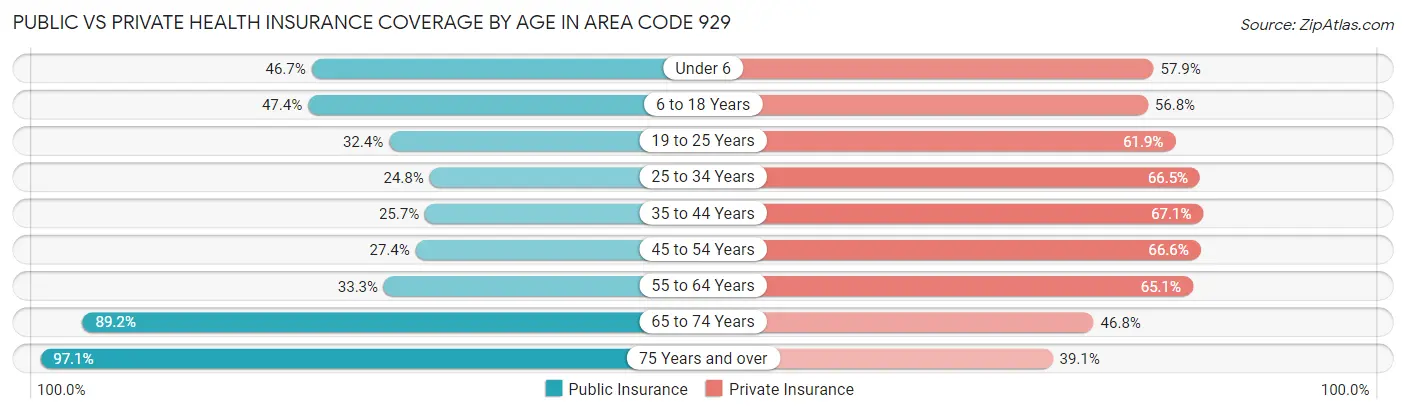
| Age Bracket | Public Insurance | Private Insurance |
| Under 6 | 70,836 (46.7%) | 87,708 (57.9%) |
| 6 to 18 Years | 149,184 (47.4%) | 178,824 (56.8%) |
| 19 to 25 Years | 59,185 (32.4%) | 113,167 (61.9%) |
| 25 to 34 Years | 77,410 (24.8%) | 207,212 (66.5%) |
| 35 to 44 Years | 75,620 (25.7%) | 197,614 (67.1%) |
| 45 to 54 Years | 76,652 (27.4%) | 186,084 (66.6%) |
| 55 to 64 Years | 90,482 (33.3%) | 176,898 (65.1%) |
| 65 to 74 Years | 172,957 (89.2%) | 90,612 (46.8%) |
| 75 Years and over | 135,367 (97.1%) | 54,539 (39.1%) |
| Total | 907,693 (42.4%) | 1,292,658 (60.4%) |
Disability Status by Sex by Age in Area Code 929
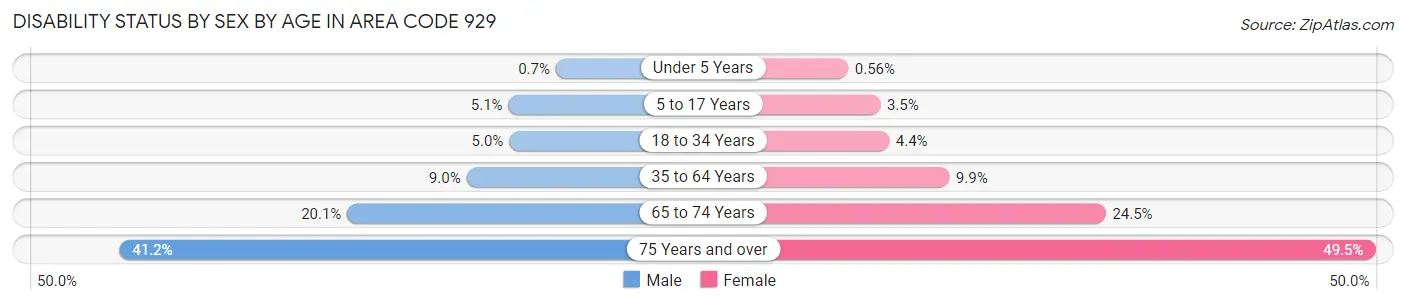
| Age Bracket | Male | Female |
| Under 5 Years | 467 (0.7%) | 341 (0.6%) |
| 5 to 17 Years | 8,324 (5.1%) | 5,449 (3.5%) |
| 18 to 34 Years | 12,709 (5.0%) | 11,502 (4.4%) |
| 35 to 64 Years | 36,646 (9.0%) | 43,538 (9.9%) |
| 65 to 74 Years | 17,412 (20.1%) | 26,192 (24.5%) |
| 75 Years and over | 22,316 (41.2%) | 42,216 (49.5%) |
Disability Class by Sex by Age in Area Code 929
Disability Class: Hearing Difficulty
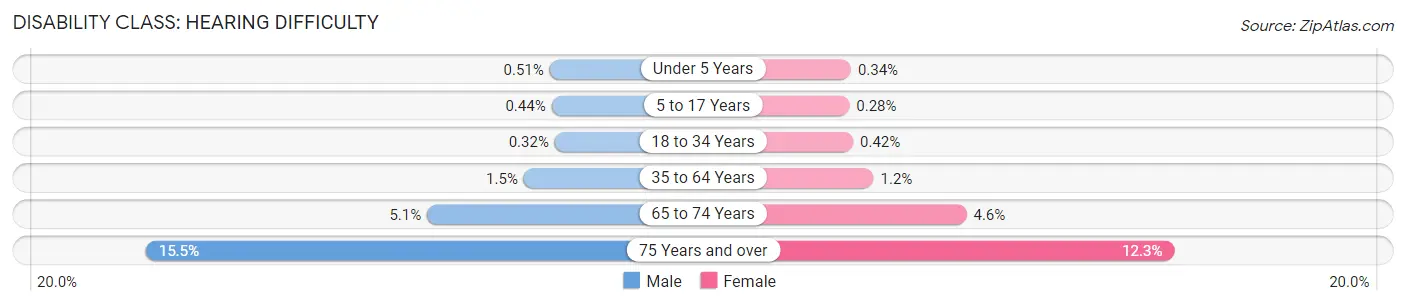
| Age Bracket | Male | Female |
| Under 5 Years | 342 (0.5%) | 208 (0.3%) |
| 5 to 17 Years | 715 (0.4%) | 431 (0.3%) |
| 18 to 34 Years | 814 (0.3%) | 1,118 (0.4%) |
| 35 to 64 Years | 6,008 (1.5%) | 5,174 (1.2%) |
| 65 to 74 Years | 4,393 (5.1%) | 4,956 (4.6%) |
| 75 Years and over | 8,398 (15.5%) | 10,519 (12.3%) |
Disability Class: Vision Difficulty
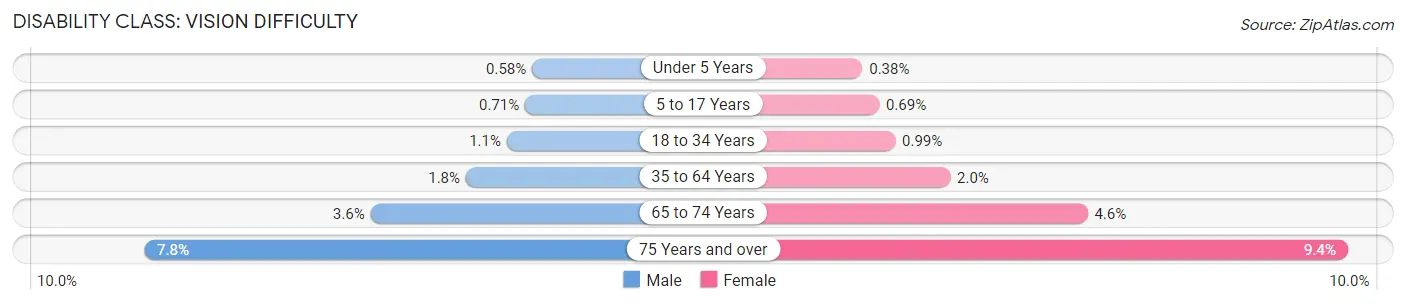
| Age Bracket | Male | Female |
| Under 5 Years | 389 (0.6%) | 234 (0.4%) |
| 5 to 17 Years | 1,163 (0.7%) | 1,059 (0.7%) |
| 18 to 34 Years | 2,659 (1.1%) | 2,607 (1.0%) |
| 35 to 64 Years | 7,371 (1.8%) | 8,805 (2.0%) |
| 65 to 74 Years | 3,107 (3.6%) | 4,875 (4.6%) |
| 75 Years and over | 4,212 (7.8%) | 8,011 (9.4%) |
Disability Class: Cognitive Difficulty
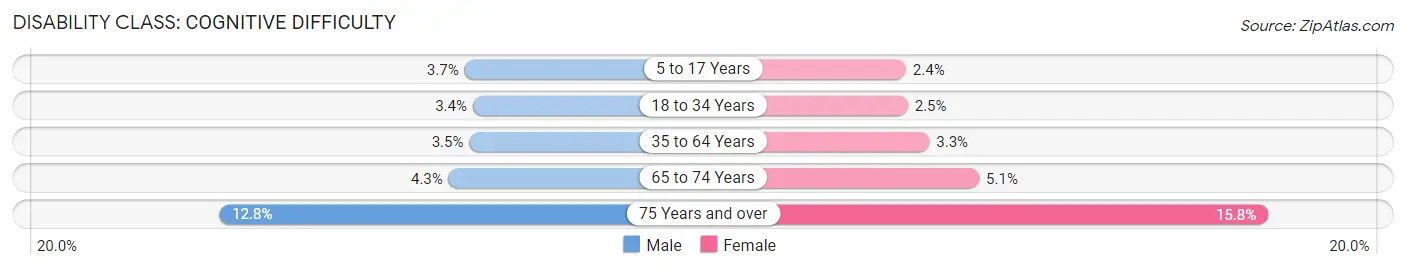
| Age Bracket | Male | Female |
| 5 to 17 Years | 5,982 (3.7%) | 3,664 (2.4%) |
| 18 to 34 Years | 8,475 (3.4%) | 6,450 (2.5%) |
| 35 to 64 Years | 14,236 (3.5%) | 14,232 (3.3%) |
| 65 to 74 Years | 3,702 (4.3%) | 5,456 (5.1%) |
| 75 Years and over | 6,922 (12.8%) | 13,492 (15.8%) |
Disability Class: Ambulatory Difficulty
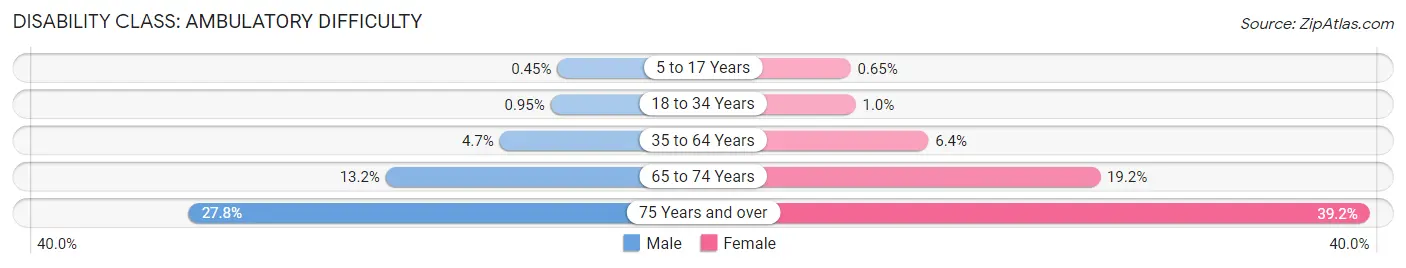
| Age Bracket | Male | Female |
| 5 to 17 Years | 728 (0.4%) | 1,005 (0.6%) |
| 18 to 34 Years | 2,409 (0.9%) | 2,699 (1.0%) |
| 35 to 64 Years | 19,337 (4.7%) | 28,129 (6.4%) |
| 65 to 74 Years | 11,454 (13.2%) | 20,511 (19.2%) |
| 75 Years and over | 15,061 (27.8%) | 33,407 (39.2%) |
Disability Class: Self-Care Difficulty
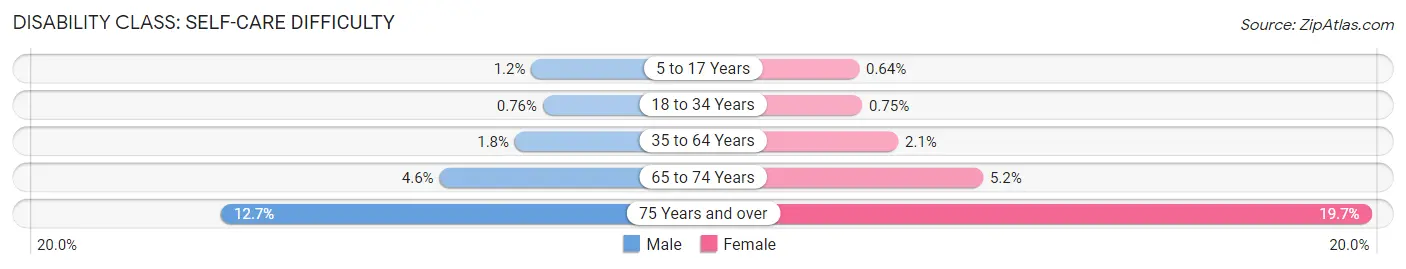
| Age Bracket | Male | Female |
| 5 to 17 Years | 1,947 (1.2%) | 980 (0.6%) |
| 18 to 34 Years | 1,914 (0.8%) | 1,965 (0.7%) |
| 35 to 64 Years | 7,351 (1.8%) | 9,170 (2.1%) |
| 65 to 74 Years | 3,993 (4.6%) | 5,605 (5.2%) |
| 75 Years and over | 6,885 (12.7%) | 16,763 (19.7%) |
Technology Access in Area Code 929
Computing Device Access in Area Code 929
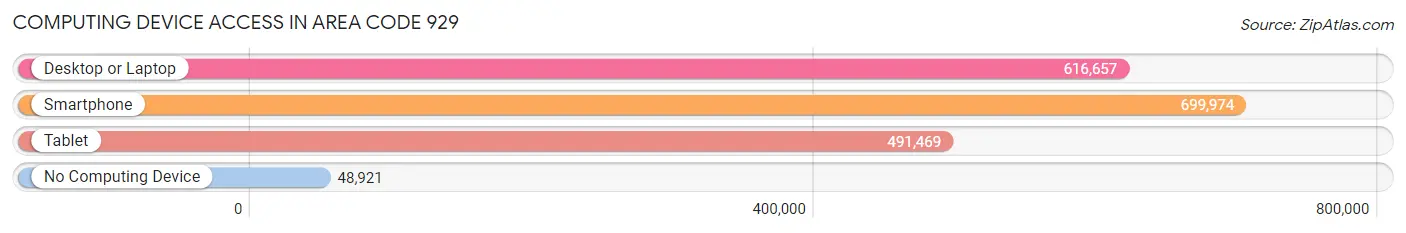
| Device Type | # Households | % Households |
| Desktop or Laptop | 616,657 | 78.2% |
| Smartphone | 699,974 | 88.8% |
| Tablet | 491,469 | 62.3% |
| No Computing Device | 48,921 | 6.2% |
| Total | 788,484 | 100.0% |
Internet Access in Area Code 929
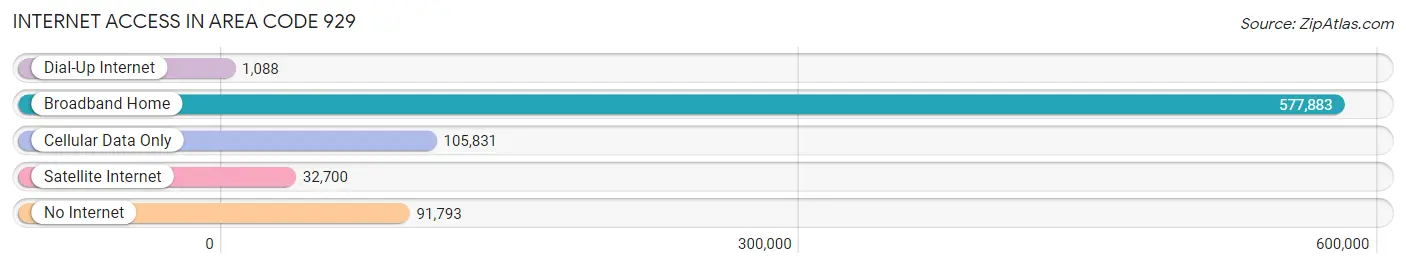
| Internet Type | # Households | % Households |
| Dial-Up Internet | 1,088 | 0.1% |
| Broadband Home | 577,883 | 73.3% |
| Cellular Data Only | 105,831 | 13.4% |
| Satellite Internet | 32,700 | 4.2% |
| No Internet | 91,793 | 11.6% |
| Total | 788,484 | 100.0% |
Area Code 929 Summary
Geography
Area code 929 is a telephone area code in the North American Numbering Plan (NANP) for the five boroughs of New York City. It was created in April 2011 as an overlay to area code 718, which serves the same area.
Social
Area code 929 is a relatively new area code, and as such, it has not yet developed a distinct social identity. However, it is associated with the five boroughs of New York City, which are known for their vibrant and diverse cultures.
Economics
Area code 929 is located in one of the most economically powerful cities in the world. The area is home to many of the world's largest companies, as well as a thriving small business sector.
Demographics
Area code 929 is located in one of the most densely populated areas in the United States. The population of the five boroughs is estimated to be over 8 million people, with a wide range of ethnic and racial backgrounds.
Common Questions
What is Per Capita Income in Area Code 929?
Per Capita income in Area Code 929 is $58,143.
What is the Median Family Income in Area Code 929?
Median Family Income in Area Code 929 is $119,648.
What is the Median Household income in Area Code 929?
Median Household Income in Area Code 929 is $100,959.
What is Income or Wage Gap in Area Code 929?
Income or Wage Gap in Area Code 929 is 19.5%.
Women in Area Code 929 earn 80.5 cents for every dollar earned by a man.
What is Family Income Deficit in Area Code 929?
Family Income Deficit in Area Code 929 is $10,709.
Families that are below poverty line in Area Code 929 earn $10,709 less on average than the poverty threshold level.
What is Inequality or Gini Index in Area Code 929?
Inequality or Gini Index in Area Code 929 is 22.55.
What is the Total Population of Area Code 929?
Total Population of Area Code 929 is 2,159,122.
What is the Total Male Population of Area Code 929?
Total Male Population of Area Code 929 is 1,042,751.
What is the Total Female Population of Area Code 929?
Total Female Population of Area Code 929 is 1,116,371.
What is the Ratio of Males per 100 Females in Area Code 929?
There are 93.41 Males per 100 Females in Area Code 929.
What is the Ratio of Females per 100 Males in Area Code 929?
There are 107.06 Females per 100 Males in Area Code 929.
What is the Median Population Age in Area Code 929?
Median Population Age in Area Code 929 is 39.1 Years.
What is the Average Family Size in Area Code 929
Average Family Size in Area Code 929 is 3.3 People.
What is the Average Household Size in Area Code 929
Average Household Size in Area Code 929 is 2.7 People.
How Large is the Labor Force in Area Code 929?
There are 1,140,165 People in the Labor Forcein in Area Code 929.
What is the Percentage of People in the Labor Force in Area Code 929?
64.7% of People are in the Labor Force in Area Code 929.
What is the Unemployment Rate in Area Code 929?
Unemployment Rate in Area Code 929 is 6.4%.