Area Code 347 Map & Demographics
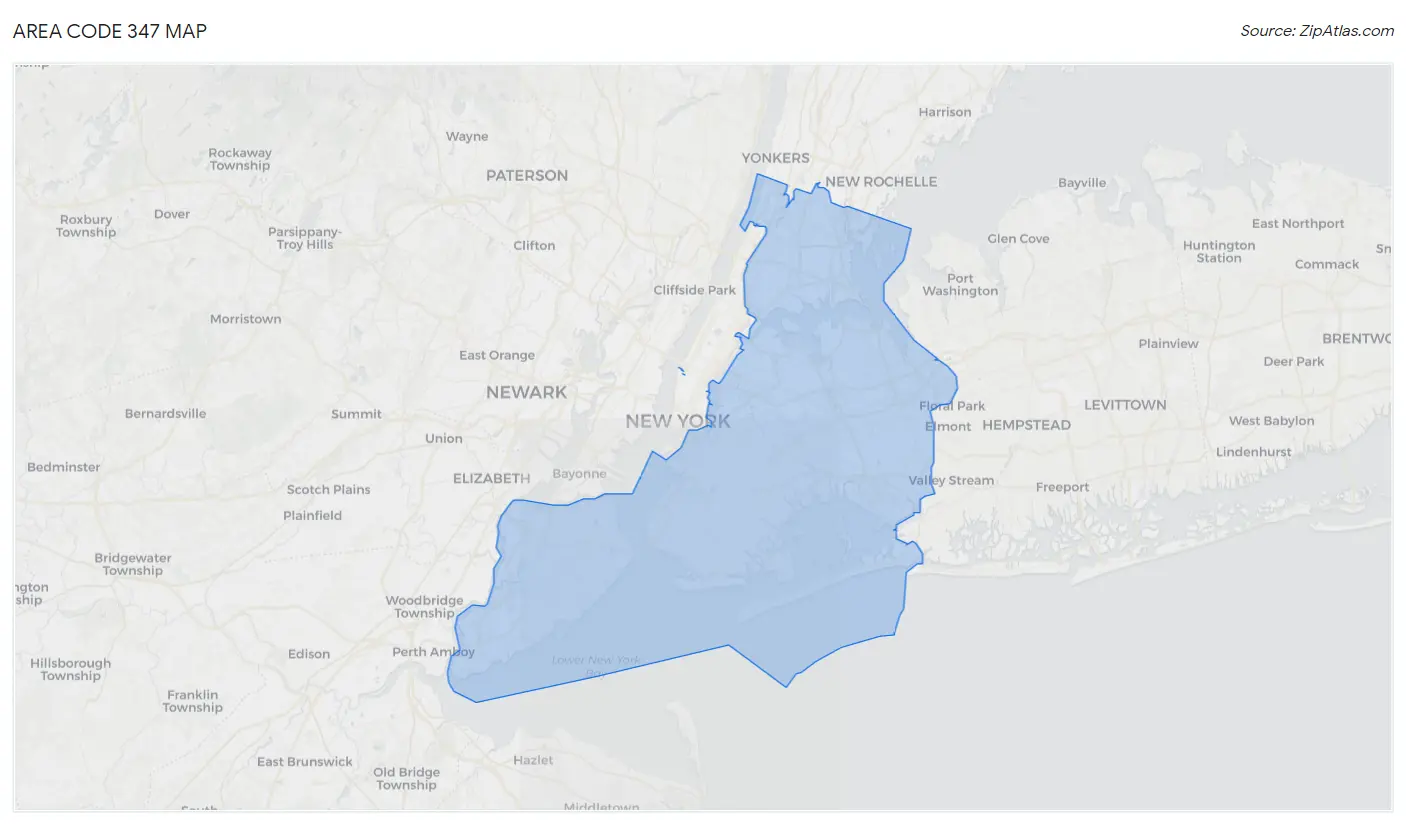
Area Code 347 Map
Area Code 347 Overview
$64,583
PER CAPITA INCOME
$127,055
AVG FAMILY INCOME
$102,101
AVG HOUSEHOLD INCOME
21.2%
WAGE / INCOME GAP [ % ]
78.8¢/ $1
WAGE / INCOME GAP [ $ ]
$10,710
FAMILY INCOME DEFICIT
41.18
INEQUALITY / GINI INDEX
3,974,977
TOTAL POPULATION
1,923,494
MALE POPULATION
2,051,483
FEMALE POPULATION
93.76
MALES / 100 FEMALES
106.65
FEMALES / 100 MALES
38.6
MEDIAN AGE
3.2
AVG FAMILY SIZE
2.6
AVG HOUSEHOLD SIZE
2,159,997
LABOR FORCE [ PEOPLE ]
66.1%
PERCENT IN LABOR FORCE
6.8%
UNEMPLOYMENT RATE
Income in Area Code 347
Income Overview in Area Code 347
Per Capita Income in Area Code 347 is $64,583, while median incomes of families and households are $127,055 and $102,101 respectively.
| Characteristic | Number | Measure |
| Per Capita Income | 3,974,977 | $64,583 |
| Median Family Income | 890,644 | $127,055 |
| Mean Family Income | 890,644 | $15,725,477 |
| Median Household Income | 1,538,541 | $102,101 |
| Mean Household Income | 1,538,541 | $12,676,857 |
| Income Deficit | 890,644 | $10,710 |
| Wage / Income Gap (%) | 3,974,977 | 21.23% |
| Wage / Income Gap ($) | 3,974,977 | 78.77¢ per $1 |
| Gini / Inequality Index | 3,974,977 | 41.18 |
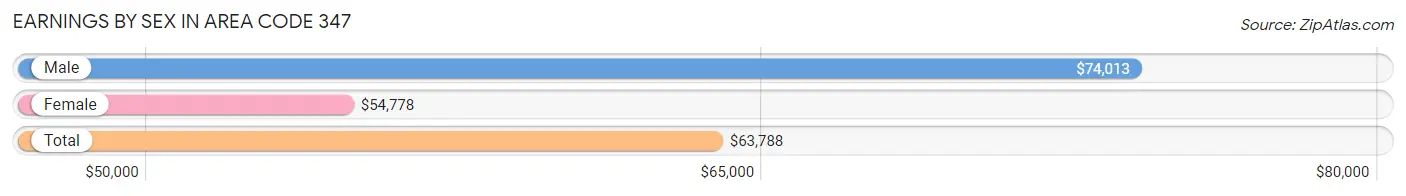
Earnings by Sex in Area Code 347
Average Earnings in Area Code 347 are $63,788, $74,013 for men and $54,778 for women, a difference of 26.0%.
| Sex | Number | Average Earnings |
| Male | 1,099,445 (51.2%) | $74,013 |
| Female | 1,048,313 (48.8%) | $54,778 |
| Total | 2,147,758 (100.0%) | $63,788 |
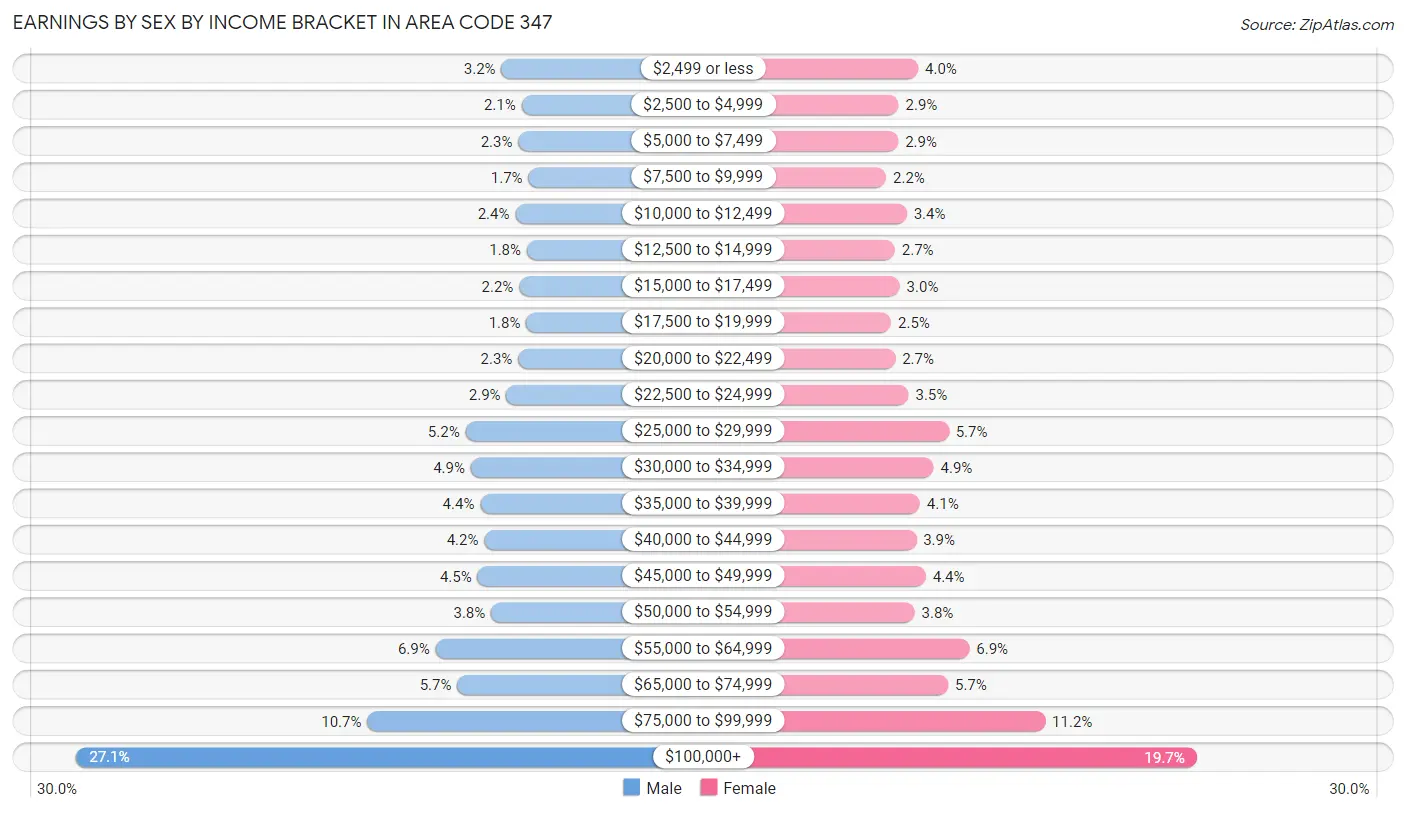
Earnings by Sex by Income Bracket in Area Code 347
The most common earnings brackets in Area Code 347 are $100,000+ for men (297,789 | 27.1%) and $100,000+ for women (206,150 | 19.7%).
| Income | Male | Female |
| $2,499 or less | 35,202 (3.2%) | 41,998 (4.0%) |
| $2,500 to $4,999 | 22,810 (2.1%) | 30,547 (2.9%) |
| $5,000 to $7,499 | 24,740 (2.2%) | 30,334 (2.9%) |
| $7,500 to $9,999 | 18,470 (1.7%) | 23,116 (2.2%) |
| $10,000 to $12,499 | 26,589 (2.4%) | 35,278 (3.4%) |
| $12,500 to $14,999 | 19,510 (1.8%) | 28,266 (2.7%) |
| $15,000 to $17,499 | 24,180 (2.2%) | 31,158 (3.0%) |
| $17,500 to $19,999 | 19,775 (1.8%) | 26,087 (2.5%) |
| $20,000 to $22,499 | 24,835 (2.3%) | 28,521 (2.7%) |
| $22,500 to $24,999 | 32,103 (2.9%) | 36,424 (3.5%) |
| $25,000 to $29,999 | 57,376 (5.2%) | 60,085 (5.7%) |
| $30,000 to $34,999 | 54,116 (4.9%) | 51,186 (4.9%) |
| $35,000 to $39,999 | 48,298 (4.4%) | 43,069 (4.1%) |
| $40,000 to $44,999 | 45,772 (4.2%) | 40,839 (3.9%) |
| $45,000 to $49,999 | 49,933 (4.5%) | 46,569 (4.4%) |
| $50,000 to $54,999 | 41,568 (3.8%) | 39,993 (3.8%) |
| $55,000 to $64,999 | 75,845 (6.9%) | 72,190 (6.9%) |
| $65,000 to $74,999 | 62,472 (5.7%) | 59,611 (5.7%) |
| $75,000 to $99,999 | 118,062 (10.7%) | 116,892 (11.2%) |
| $100,000+ | 297,789 (27.1%) | 206,150 (19.7%) |
| Total | 1,099,445 (100.0%) | 1,048,313 (100.0%) |
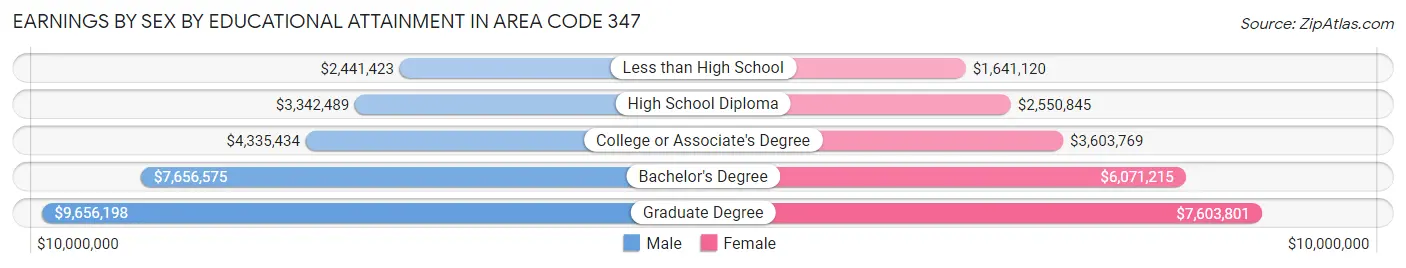
Earnings by Sex by Educational Attainment in Area Code 347
Average earnings in Area Code 347 are $6,764,296 for men and $5,098,024 for women, a difference of 24.6%. Men with an educational attainment of graduate degree enjoy the highest average annual earnings of $9,656,198, while those with less than high school education earn the least with $2,441,423. Women with an educational attainment of graduate degree earn the most with the average annual earnings of $7,603,801, while those with less than high school education have the smallest earnings of $1,641,120.
| Educational Attainment | Male Income | Female Income |
| Less than High School | $2,441,423 | $1,641,120 |
| High School Diploma | $3,342,489 | $2,550,845 |
| College or Associate's Degree | $4,335,434 | $3,603,769 |
| Bachelor's Degree | $7,656,575 | $6,071,215 |
| Graduate Degree | $9,656,198 | $7,603,801 |
| Total | $6,764,296 | $5,098,024 |
Family Income in Area Code 347
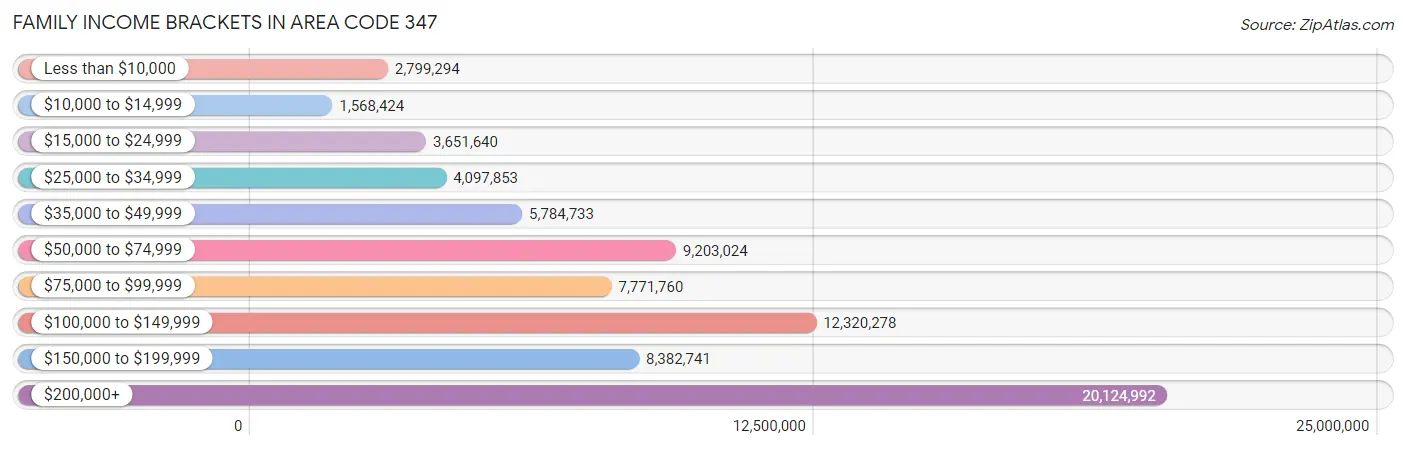
Family Income Brackets in Area Code 347
According to the Area Code 347 family income data, there are 20,124,992 families falling into the $200,000+ income range, which is the most common income bracket and makes up 2,259.6% of all families. Conversely, the $10,000 to $14,999 income bracket is the least frequent group with only 1,568,424 families (176.1%) belonging to this category.
| Income Bracket | # Families | % Families |
| Less than $10,000 | 2,799,294 | 314.3% |
| $10,000 to $14,999 | 1,568,424 | 176.1% |
| $15,000 to $24,999 | 3,651,640 | 410.0% |
| $25,000 to $34,999 | 4,097,853 | 460.1% |
| $35,000 to $49,999 | 5,784,733 | 649.5% |
| $50,000 to $74,999 | 9,203,024 | 1,033.3% |
| $75,000 to $99,999 | 7,771,760 | 872.6% |
| $100,000 to $149,999 | 12,320,278 | 1,383.3% |
| $150,000 to $199,999 | 8,382,741 | 941.2% |
| $200,000+ | 20,124,992 | 2,259.6% |
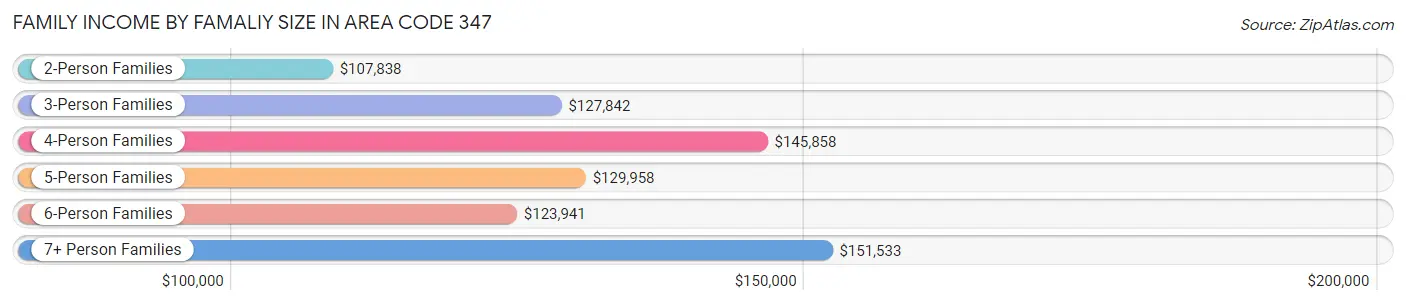
Family Income by Famaliy Size in Area Code 347
7+ person families (21,981 | 2.5%) account for the highest median family income in Area Code 347 with $151,533 per family, while 2-person families (369,371 | 41.5%) have the highest median income of $53,919 per family member.
| Income Bracket | # Families | Median Income |
| 2-Person Families | 369,371 (41.5%) | $107,838 |
| 3-Person Families | 226,902 (25.5%) | $127,842 |
| 4-Person Families | 166,476 (18.7%) | $145,858 |
| 5-Person Families | 74,882 (8.4%) | $129,958 |
| 6-Person Families | 31,032 (3.5%) | $123,941 |
| 7+ Person Families | 21,981 (2.5%) | $151,533 |
| Total | 890,644 (100.0%) | $127,055 |
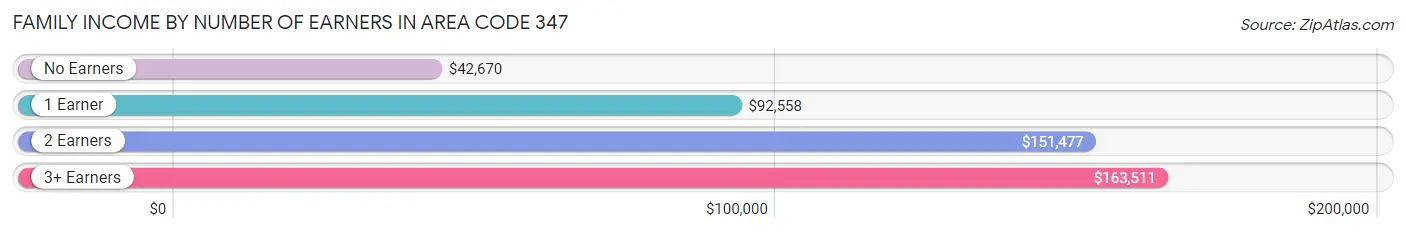
Family Income by Number of Earners in Area Code 347
The median family income in Area Code 347 is $127,055, with families comprising 3+ earners (118,881) having the highest median family income of $163,511, while families with no earners (112,038) have the lowest median family income of $42,670, accounting for 13.4% and 12.6% of families, respectively.
| Number of Earners | # Families | Median Income |
| No Earners | 112,038 (12.6%) | $42,670 |
| 1 Earner | 291,211 (32.7%) | $92,558 |
| 2 Earners | 368,514 (41.4%) | $151,477 |
| 3+ Earners | 118,881 (13.4%) | $163,511 |
| Total | 890,644 (100.0%) | $127,055 |
Household Income in Area Code 347
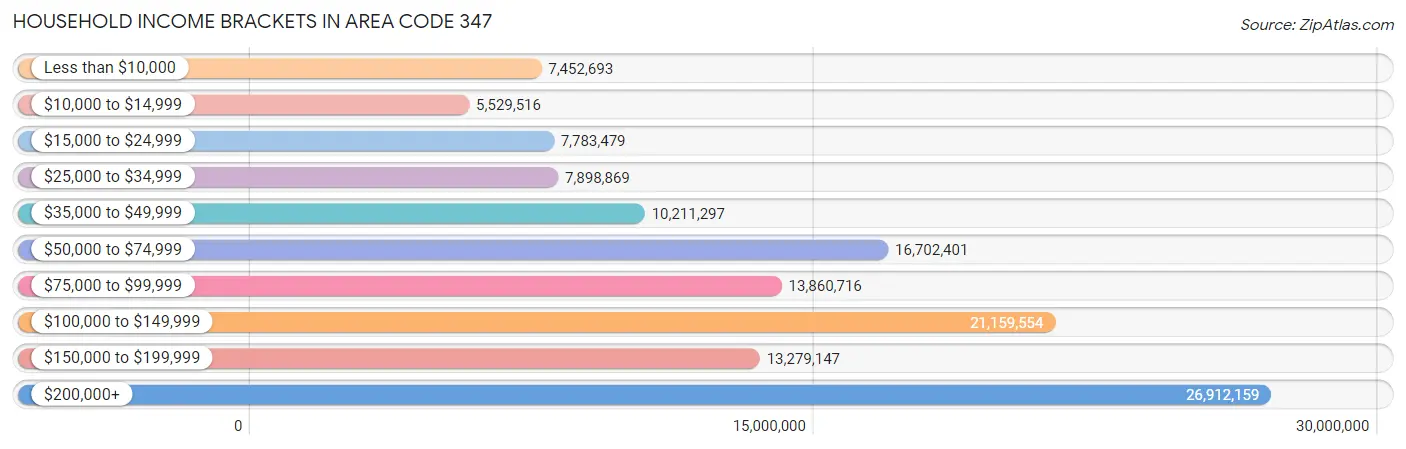
Household Income Brackets in Area Code 347
With 26,912,159 households falling in the category, the $200,000+ income range is the most frequent in Area Code 347, accounting for 1,749.2% of all households. In contrast, only 5,529,516 households (359.4%) fall into the $10,000 to $14,999 income bracket, making it the least populous group.
| Income Bracket | # Households | % Households |
| Less than $10,000 | 7,452,693 | 484.4% |
| $10,000 to $14,999 | 5,529,516 | 359.4% |
| $15,000 to $24,999 | 7,783,479 | 505.9% |
| $25,000 to $34,999 | 7,898,869 | 513.4% |
| $35,000 to $49,999 | 10,211,297 | 663.7% |
| $50,000 to $74,999 | 16,702,401 | 1,085.6% |
| $75,000 to $99,999 | 13,860,716 | 900.9% |
| $100,000 to $149,999 | 21,159,554 | 1,375.3% |
| $150,000 to $199,999 | 13,279,147 | 863.1% |
| $200,000+ | 26,912,159 | 1,749.2% |
Household Income by Householder Age in Area Code 347
The median household income in Area Code 347 is $102,101, with the highest median household income of $118,064 found in the 25 to 44 years age bracket for the primary householder. A total of 568,251 households (36.9%) fall into this category. Meanwhile, the 65+ years age bracket for the primary householder has the lowest median household income of $61,767, with 373,759 households (24.3%) in this group.
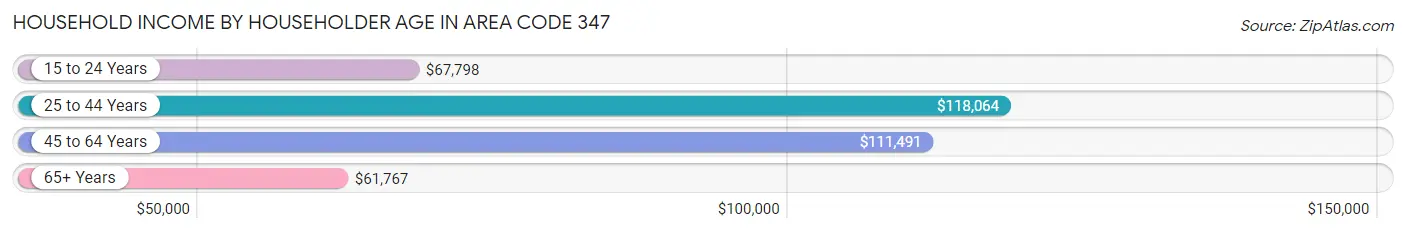
| Income Bracket | # Households | Median Income |
| 15 to 24 Years | 38,985 (2.5%) | $67,798 |
| 25 to 44 Years | 568,251 (36.9%) | $118,064 |
| 45 to 64 Years | 557,546 (36.2%) | $111,491 |
| 65+ Years | 373,759 (24.3%) | $61,767 |
| Total | 1,538,541 (100.0%) | $102,101 |
Poverty in Area Code 347
Income Below Poverty by Sex and Age in Area Code 347
With 14.0% poverty level for males and 16.7% for females among the residents of Area Code 347, 5 year old males and 16 and 17 year old females are the most vulnerable to poverty, with 4,932 males (23.7%) and 9,600 females (22.8%) in their respective age groups living below the poverty level.
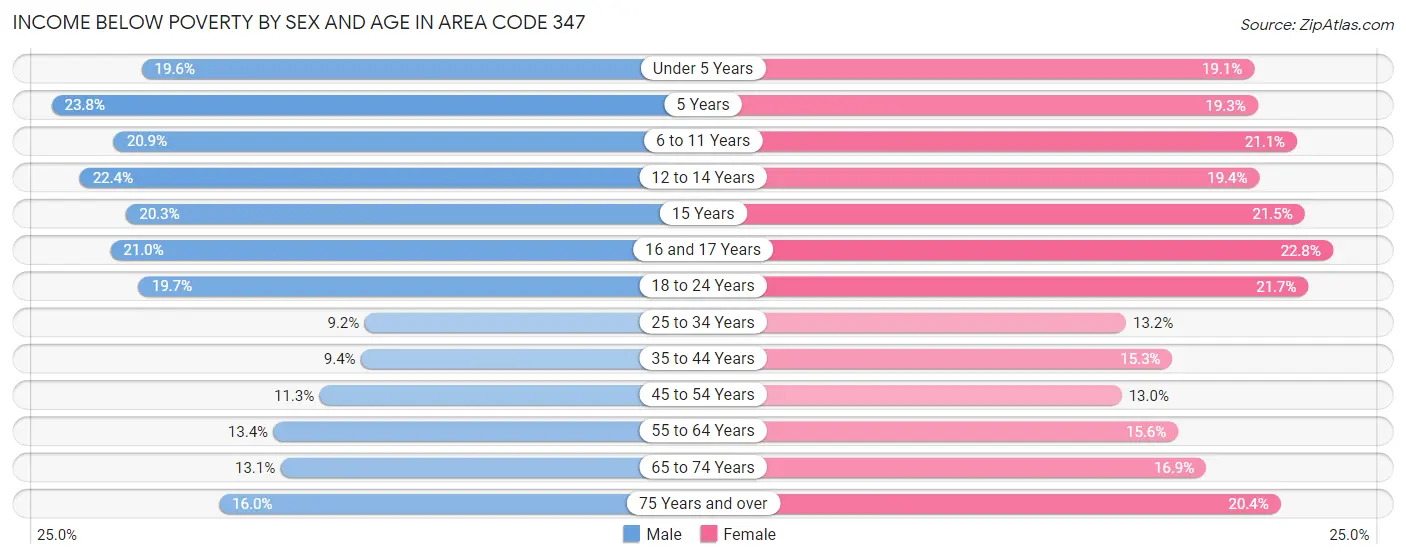
| Age Bracket | Male | Female |
| Under 5 Years | 23,014 (19.6%) | 20,969 (19.1%) |
| 5 Years | 4,932 (23.7%) | 3,892 (19.3%) |
| 6 to 11 Years | 27,094 (20.9%) | 25,702 (21.1%) |
| 12 to 14 Years | 14,891 (22.4%) | 12,858 (19.4%) |
| 15 Years | 4,187 (20.3%) | 4,071 (21.5%) |
| 16 and 17 Years | 8,725 (21.0%) | 9,600 (22.8%) |
| 18 to 24 Years | 29,857 (19.7%) | 33,861 (21.6%) |
| 25 to 34 Years | 31,670 (9.2%) | 46,862 (13.2%) |
| 35 to 44 Years | 25,585 (9.4%) | 42,788 (15.3%) |
| 45 to 54 Years | 27,810 (11.3%) | 32,767 (13.0%) |
| 55 to 64 Years | 30,531 (13.4%) | 39,282 (15.6%) |
| 65 to 74 Years | 20,248 (13.1%) | 32,056 (16.9%) |
| 75 Years and over | 15,506 (16.0%) | 31,435 (20.4%) |
| Total | 264,050 (14.0%) | 336,143 (16.7%) |
Income Above Poverty by Sex and Age in Area Code 347
According to the poverty statistics in Area Code 347, males aged 25 to 34 years and females aged 45 to 54 years are the age groups that are most secure financially, with 90.8% of males and 87.0% of females in these age groups living above the poverty line.
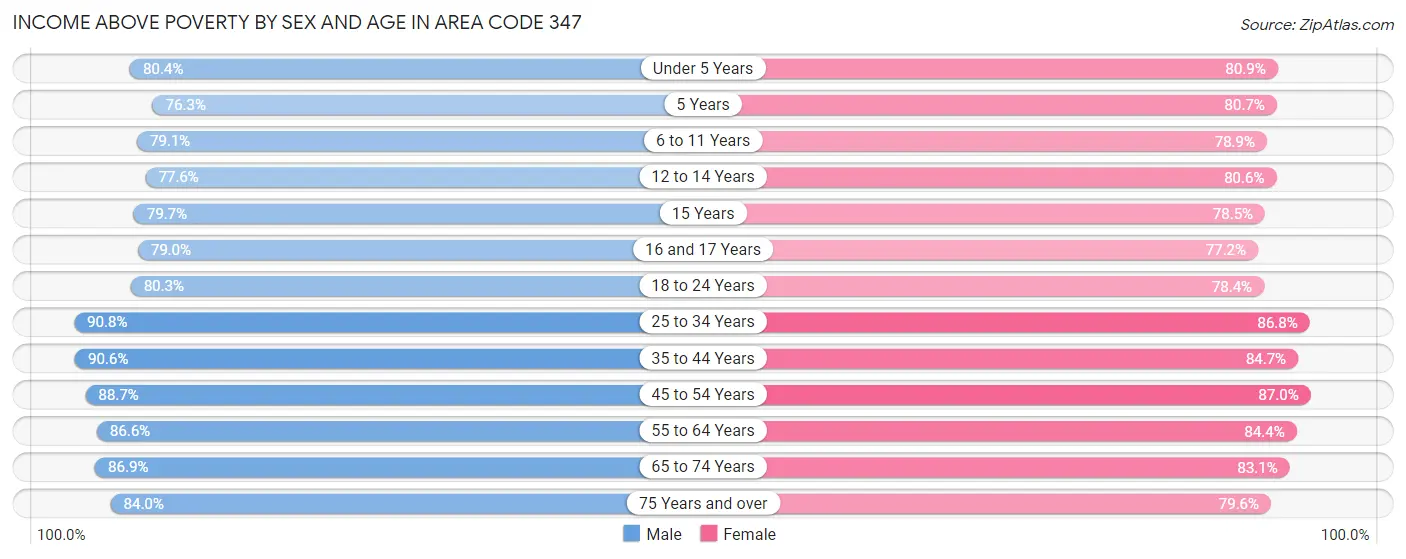
| Age Bracket | Male | Female |
| Under 5 Years | 94,573 (80.4%) | 88,662 (80.9%) |
| 5 Years | 15,834 (76.2%) | 16,285 (80.7%) |
| 6 to 11 Years | 102,788 (79.1%) | 95,965 (78.9%) |
| 12 to 14 Years | 51,464 (77.6%) | 53,530 (80.6%) |
| 15 Years | 16,459 (79.7%) | 14,889 (78.5%) |
| 16 and 17 Years | 32,777 (79.0%) | 32,536 (77.2%) |
| 18 to 24 Years | 121,668 (80.3%) | 122,552 (78.3%) |
| 25 to 34 Years | 312,593 (90.8%) | 308,493 (86.8%) |
| 35 to 44 Years | 247,437 (90.6%) | 236,212 (84.7%) |
| 45 to 54 Years | 218,469 (88.7%) | 219,553 (87.0%) |
| 55 to 64 Years | 196,752 (86.6%) | 212,498 (84.4%) |
| 65 to 74 Years | 134,294 (86.9%) | 157,642 (83.1%) |
| 75 Years and over | 81,588 (84.0%) | 122,943 (79.6%) |
| Total | 1,626,696 (86.0%) | 1,681,760 (83.3%) |
Income Below Poverty Among Married-Couple Families in Area Code 347
The poverty statistics for married-couple families in Area Code 347 show that 7.1% or 40,876 of the total 574,507 families live below the poverty line. Families with 5 or more children have the highest poverty rate of 35.3%, comprising of 1,968 families. On the other hand, families with no children have the lowest poverty rate of 5.8%, which includes 18,963 families.
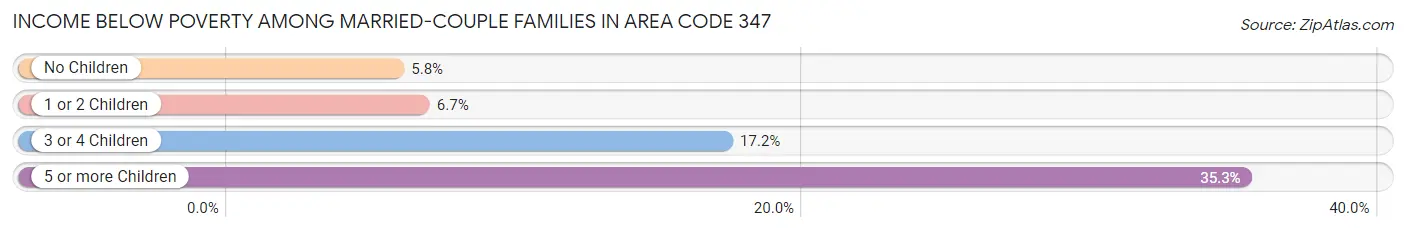
| Children | Above Poverty | Below Poverty |
| No Children | 308,578 (94.2%) | 18,963 (5.8%) |
| 1 or 2 Children | 191,564 (93.3%) | 13,719 (6.7%) |
| 3 or 4 Children | 29,885 (82.8%) | 6,226 (17.2%) |
| 5 or more Children | 3,604 (64.7%) | 1,968 (35.3%) |
| Total | 533,631 (92.9%) | 40,876 (7.1%) |
Income Below Poverty Among Single-Parent Households in Area Code 347
According to the poverty data in Area Code 347, 12.3% or 9,789 single-father households and 23.2% or 54,836 single-mother households are living below the poverty line. Among single-father households, those with 5 or more children have the highest poverty rate, with 124 households (49.0%) experiencing poverty. Likewise, among single-mother households, those with 5 or more children have the highest poverty rate, with 919 households (75.8%) falling below the poverty line.
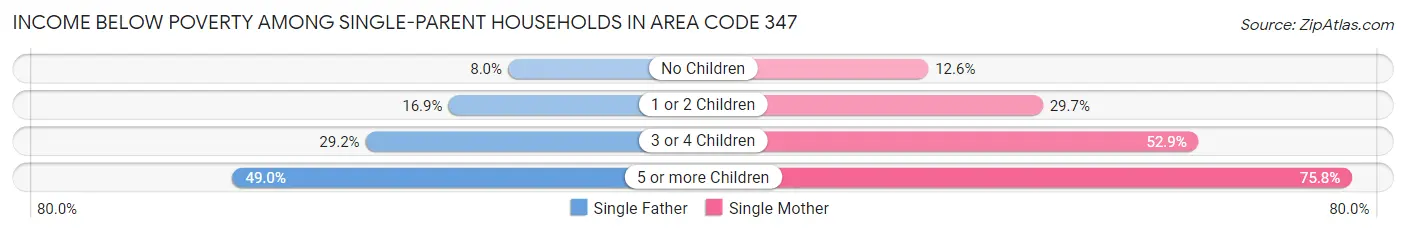
| Children | Single Father | Single Mother |
| No Children | 3,685 (8.0%) | 14,426 (12.6%) |
| 1 or 2 Children | 4,981 (16.9%) | 31,383 (29.7%) |
| 3 or 4 Children | 999 (29.2%) | 8,108 (52.9%) |
| 5 or more Children | 124 (49.0%) | 919 (75.8%) |
| Total | 9,789 (12.3%) | 54,836 (23.2%) |
Income Below Poverty Among Married-Couple vs Single-Parent Households in Area Code 347
The poverty data for Area Code 347 shows that 40,876 of the married-couple family households (7.1%) and 64,625 of the single-parent households (20.4%) are living below the poverty level. Within the married-couple family households, those with 5 or more children have the highest poverty rate, with 1,968 households (35.3%) falling below the poverty line. Among the single-parent households, those with 5 or more children have the highest poverty rate, with 1,043 household (71.2%) living below poverty.
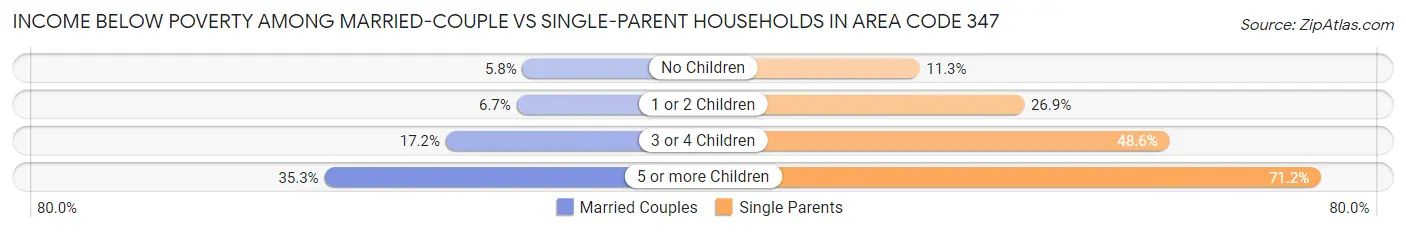
| Children | Married-Couple Families | Single-Parent Households |
| No Children | 18,963 (5.8%) | 18,111 (11.3%) |
| 1 or 2 Children | 13,719 (6.7%) | 36,364 (26.9%) |
| 3 or 4 Children | 6,226 (17.2%) | 9,107 (48.6%) |
| 5 or more Children | 1,968 (35.3%) | 1,043 (71.2%) |
| Total | 40,876 (7.1%) | 64,625 (20.4%) |
Race in Area Code 347
The most populous races in Area Code 347 are White / Caucasian (1,584,755 | 39.9%), Hispanic or Latino (1,156,137 | 29.1%), and Black / African American (788,233 | 19.8%).
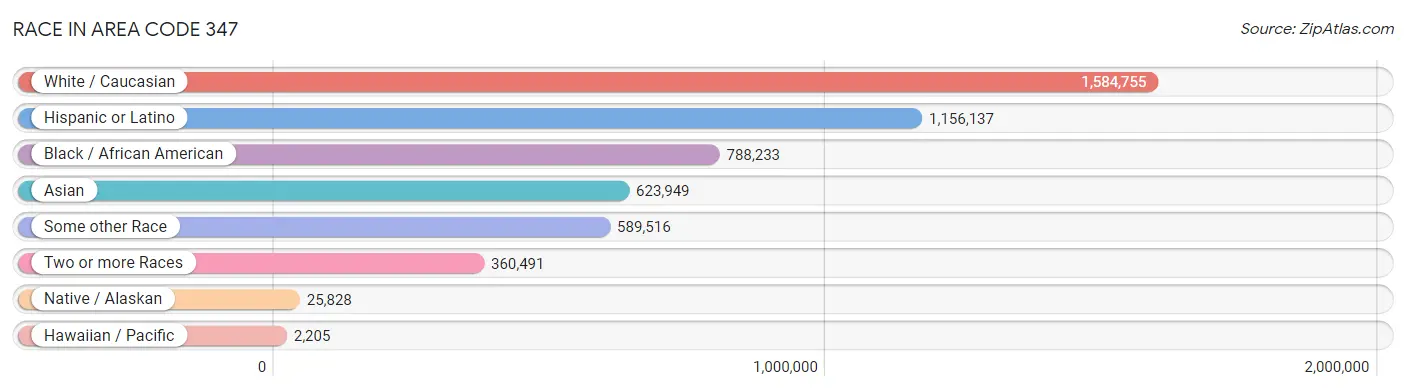
| Race | # Population | % Population |
| Asian | 623,949 | 15.7% |
| Black / African American | 788,233 | 19.8% |
| Hawaiian / Pacific | 2,205 | 0.1% |
| Hispanic or Latino | 1,156,137 | 29.1% |
| Native / Alaskan | 25,828 | 0.6% |
| White / Caucasian | 1,584,755 | 39.9% |
| Two or more Races | 360,491 | 9.1% |
| Some other Race | 589,516 | 14.8% |
| Total | 3,974,977 | 100.0% |
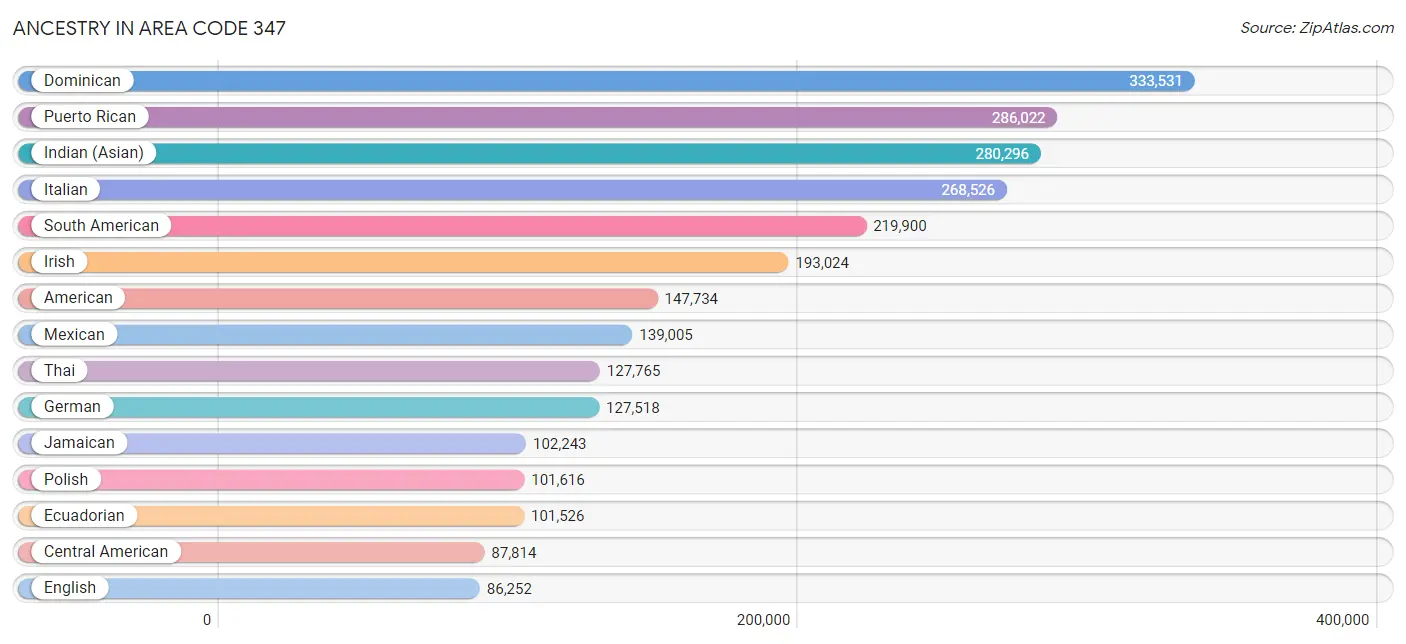
Ancestry in Area Code 347
The most populous ancestries reported in Area Code 347 are Dominican (333,531 | 8.4%), Puerto Rican (286,022 | 7.2%), Indian (Asian) (280,296 | 7.0%), Italian (268,526 | 6.8%), and South American (219,900 | 5.5%), together accounting for 34.9% of all Area Code 347 residents.
| Ancestry | # Population | % Population |
| Afghan | 1,717 | 0.0% |
| African | 39,153 | 1.0% |
| Alaska Native | 256 | 0.0% |
| Albanian | 19,867 | 0.5% |
| Alsatian | 46 | 0.0% |
| American | 147,734 | 3.7% |
| Apache | 300 | 0.0% |
| Arab | 48,183 | 1.2% |
| Argentinean | 9,988 | 0.3% |
| Armenian | 5,463 | 0.1% |
| Assyrian / Chaldean / Syriac | 208 | 0.0% |
| Australian | 3,252 | 0.1% |
| Austrian | 11,645 | 0.3% |
| Bahamian | 727 | 0.0% |
| Bangladeshi | 221 | 0.0% |
| Barbadian | 7,266 | 0.2% |
| Basque | 374 | 0.0% |
| Belgian | 1,479 | 0.0% |
| Belizean | 3,172 | 0.1% |
| Bermudan | 412 | 0.0% |
| Bhutanese | 20,305 | 0.5% |
| Blackfeet | 1,451 | 0.0% |
| Bolivian | 2,461 | 0.1% |
| Brazilian | 6,636 | 0.2% |
| British | 13,726 | 0.4% |
| British West Indian | 16,886 | 0.4% |
| Bulgarian | 2,208 | 0.1% |
| Burmese | 55,217 | 1.4% |
| Cajun | 172 | 0.0% |
| Cambodian | 192 | 0.0% |
| Canadian | 4,727 | 0.1% |
| Cape Verdean | 379 | 0.0% |
| Carpatho Rusyn | 93 | 0.0% |
| Celtic | 197 | 0.0% |
| Central American | 87,814 | 2.2% |
| Central American Indian | 13,802 | 0.4% |
| Cherokee | 3,993 | 0.1% |
| Chickasaw | 125 | 0.0% |
| Chilean | 5,690 | 0.1% |
| Chippewa | 295 | 0.0% |
| Choctaw | 536 | 0.0% |
| Colombian | 63,525 | 1.6% |
| Costa Rican | 2,890 | 0.1% |
| Cree | 21 | 0.0% |
| Creek | 166 | 0.0% |
| Croatian | 4,698 | 0.1% |
| Crow | 13 | 0.0% |
| Cuban | 21,630 | 0.5% |
| Cypriot | 982 | 0.0% |
| Czech | 6,346 | 0.2% |
| Czechoslovakian | 1,582 | 0.0% |
| Danish | 3,970 | 0.1% |
| Delaware | 142 | 0.0% |
| Dominican | 333,531 | 8.4% |
| Dutch | 11,010 | 0.3% |
| Dutch West Indian | 234 | 0.0% |
| Eastern European | 37,685 | 0.9% |
| Ecuadorian | 101,526 | 2.5% |
| Egyptian | 14,146 | 0.4% |
| English | 86,252 | 2.2% |
| Estonian | 320 | 0.0% |
| Ethiopian | 2,009 | 0.1% |
| European | 39,241 | 1.0% |
| Fijian | 24 | 0.0% |
| Filipino | 10,567 | 0.3% |
| Finnish | 2,077 | 0.1% |
| French | 35,873 | 0.9% |
| French American Indian | 99 | 0.0% |
| French Canadian | 5,462 | 0.1% |
| German | 127,518 | 3.2% |
| German Russian | 33 | 0.0% |
| Ghanaian | 13,971 | 0.4% |
| Greek | 29,688 | 0.7% |
| Guamanian / Chamorro | 477 | 0.0% |
| Guatemalan | 21,581 | 0.5% |
| Guyanese | 49,845 | 1.3% |
| Haitian | 44,125 | 1.1% |
| Hmong | 42 | 0.0% |
| Honduran | 21,500 | 0.5% |
| Houma | 4 | 0.0% |
| Hungarian | 25,882 | 0.6% |
| Icelander | 219 | 0.0% |
| Indian (Asian) | 280,296 | 7.0% |
| Indonesian | 3,952 | 0.1% |
| Inupiat | 69 | 0.0% |
| Iranian | 7,208 | 0.2% |
| Iraqi | 907 | 0.0% |
| Irish | 193,024 | 4.9% |
| Iroquois | 1,904 | 0.1% |
| Israeli | 10,188 | 0.3% |
| Italian | 268,526 | 6.8% |
| Jamaican | 102,243 | 2.6% |
| Japanese | 1,660 | 0.0% |
| Jordanian | 1,497 | 0.0% |
| Kenyan | 717 | 0.0% |
| Korean | 56,018 | 1.4% |
| Laotian | 4,201 | 0.1% |
| Latvian | 1,780 | 0.0% |
| Lebanese | 7,022 | 0.2% |
| Liberian | 1,846 | 0.1% |
| Lithuanian | 6,690 | 0.2% |
| Lumbee | 68 | 0.0% |
| Luxembourger | 123 | 0.0% |
| Macedonian | 2,447 | 0.1% |
| Malaysian | 623 | 0.0% |
| Maltese | 1,490 | 0.0% |
| Menominee | 20 | 0.0% |
| Mexican | 139,005 | 3.5% |
| Mexican American Indian | 6,104 | 0.2% |
| Mongolian | 2,270 | 0.1% |
| Moroccan | 4,833 | 0.1% |
| Native Hawaiian | 1,572 | 0.0% |
| Navajo | 165 | 0.0% |
| New Zealander | 474 | 0.0% |
| Nicaraguan | 5,252 | 0.1% |
| Nigerian | 14,830 | 0.4% |
| Northern European | 3,108 | 0.1% |
| Norwegian | 10,407 | 0.3% |
| Okinawan | 1,032 | 0.0% |
| Osage | 62 | 0.0% |
| Pakistani | 6,618 | 0.2% |
| Palestinian | 1,950 | 0.1% |
| Panamanian | 9,074 | 0.2% |
| Paraguayan | 2,508 | 0.1% |
| Pennsylvania German | 204 | 0.0% |
| Peruvian | 22,442 | 0.6% |
| Pima | 29 | 0.0% |
| Polish | 101,616 | 2.6% |
| Portuguese | 7,959 | 0.2% |
| Potawatomi | 42 | 0.0% |
| Pueblo | 110 | 0.0% |
| Puerto Rican | 286,022 | 7.2% |
| Puget Sound Salish | 12 | 0.0% |
| Romanian | 14,068 | 0.4% |
| Russian | 79,114 | 2.0% |
| Salvadoran | 27,246 | 0.7% |
| Samoan | 770 | 0.0% |
| Scandinavian | 2,670 | 0.1% |
| Scotch-Irish | 6,594 | 0.2% |
| Scottish | 19,882 | 0.5% |
| Seminole | 56 | 0.0% |
| Senegalese | 1,394 | 0.0% |
| Serbian | 3,376 | 0.1% |
| Sierra Leonean | 820 | 0.0% |
| Sioux | 300 | 0.0% |
| Slavic | 1,696 | 0.0% |
| Slovak | 4,644 | 0.1% |
| Slovene | 966 | 0.0% |
| Somali | 156 | 0.0% |
| South African | 794 | 0.0% |
| South American | 219,900 | 5.5% |
| South American Indian | 2,909 | 0.1% |
| Soviet Union | 449 | 0.0% |
| Spaniard | 14,525 | 0.4% |
| Spanish | 7,556 | 0.2% |
| Spanish American | 200 | 0.0% |
| Spanish American Indian | 538 | 0.0% |
| Sri Lankan | 10,655 | 0.3% |
| Subsaharan African | 85,792 | 2.2% |
| Sudanese | 435 | 0.0% |
| Swedish | 12,508 | 0.3% |
| Swiss | 3,750 | 0.1% |
| Syrian | 4,564 | 0.1% |
| Taiwanese | 63 | 0.0% |
| Thai | 127,765 | 3.2% |
| Tohono O'Odham | 32 | 0.0% |
| Tongan | 318 | 0.0% |
| Trinidadian and Tobagonian | 27,254 | 0.7% |
| Turkish | 7,765 | 0.2% |
| U.S. Virgin Islander | 1,576 | 0.0% |
| Ugandan | 371 | 0.0% |
| Ukrainian | 25,056 | 0.6% |
| Uruguayan | 1,261 | 0.0% |
| Ute | 9 | 0.0% |
| Venezuelan | 9,201 | 0.2% |
| Vietnamese | 55,909 | 1.4% |
| Welsh | 4,871 | 0.1% |
| West Indian | 26,300 | 0.7% |
| Yugoslavian | 2,263 | 0.1% |
| Yuman | 59 | 0.0% |
| Zimbabwean | 26 | 0.0% | View All 181 Rows |
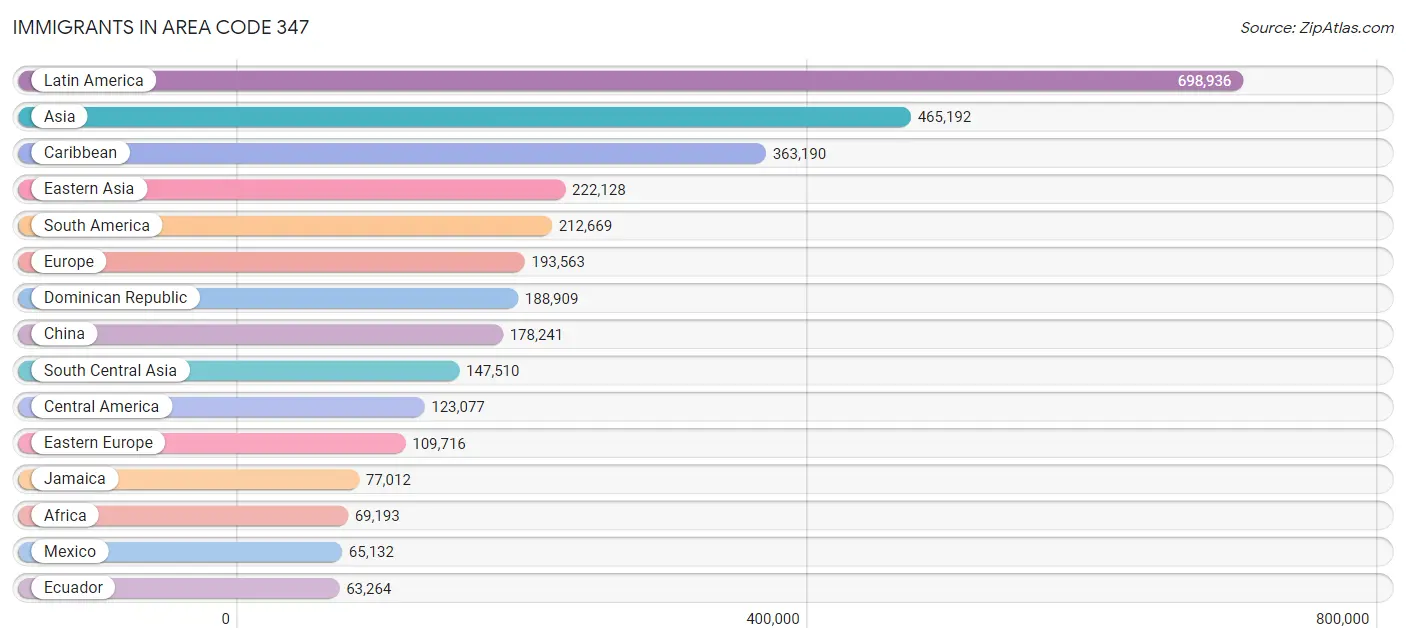
Immigrants in Area Code 347
The most numerous immigrant groups reported in Area Code 347 came from Latin America (698,936 | 17.6%), Asia (465,192 | 11.7%), Caribbean (363,190 | 9.1%), Eastern Asia (222,128 | 5.6%), and South America (212,669 | 5.3%), together accounting for 49.4% of all Area Code 347 residents.
| Immigration Origin | # Population | % Population |
| Afghanistan | 1,476 | 0.0% |
| Africa | 69,193 | 1.7% |
| Albania | 10,012 | 0.3% |
| Argentina | 6,936 | 0.2% |
| Armenia | 715 | 0.0% |
| Asia | 465,192 | 11.7% |
| Australia | 5,424 | 0.1% |
| Austria | 1,287 | 0.0% |
| Bahamas | 615 | 0.0% |
| Bangladesh | 55,150 | 1.4% |
| Barbados | 7,156 | 0.2% |
| Belarus | 3,202 | 0.1% |
| Belgium | 1,162 | 0.0% |
| Belize | 2,685 | 0.1% |
| Bolivia | 1,529 | 0.0% |
| Bosnia and Herzegovina | 884 | 0.0% |
| Brazil | 7,288 | 0.2% |
| Bulgaria | 1,959 | 0.1% |
| Cabo Verde | 17 | 0.0% |
| Cambodia | 977 | 0.0% |
| Cameroon | 531 | 0.0% |
| Canada | 12,881 | 0.3% |
| Caribbean | 363,190 | 9.1% |
| Central America | 123,077 | 3.1% |
| Chile | 4,519 | 0.1% |
| China | 178,241 | 4.5% |
| Colombia | 42,541 | 1.1% |
| Congo | 200 | 0.0% |
| Costa Rica | 1,610 | 0.0% |
| Croatia | 1,568 | 0.0% |
| Cuba | 7,001 | 0.2% |
| Czechoslovakia | 2,702 | 0.1% |
| Denmark | 795 | 0.0% |
| Dominica | 3,161 | 0.1% |
| Dominican Republic | 188,909 | 4.8% |
| Eastern Africa | 4,280 | 0.1% |
| Eastern Asia | 222,128 | 5.6% |
| Eastern Europe | 109,716 | 2.8% |
| Ecuador | 63,264 | 1.6% |
| Egypt | 10,194 | 0.3% |
| El Salvador | 16,863 | 0.4% |
| England | 5,262 | 0.1% |
| Eritrea | 94 | 0.0% |
| Ethiopia | 955 | 0.0% |
| Europe | 193,563 | 4.9% |
| Fiji | 11 | 0.0% |
| France | 8,955 | 0.2% |
| Germany | 8,043 | 0.2% |
| Ghana | 17,543 | 0.4% |
| Greece | 7,724 | 0.2% |
| Grenada | 5,690 | 0.1% |
| Guatemala | 13,161 | 0.3% |
| Guyana | 59,217 | 1.5% |
| Haiti | 28,862 | 0.7% |
| Honduras | 14,584 | 0.4% |
| Hong Kong | 15,298 | 0.4% |
| Hungary | 2,328 | 0.1% |
| India | 46,378 | 1.2% |
| Indonesia | 3,411 | 0.1% |
| Iran | 3,861 | 0.1% |
| Iraq | 325 | 0.0% |
| Ireland | 6,417 | 0.2% |
| Israel | 9,381 | 0.2% |
| Italy | 19,420 | 0.5% |
| Jamaica | 77,012 | 1.9% |
| Japan | 10,725 | 0.3% |
| Jordan | 1,872 | 0.1% |
| Kazakhstan | 1,498 | 0.0% |
| Kenya | 1,047 | 0.0% |
| Korea | 33,069 | 0.8% |
| Kuwait | 384 | 0.0% |
| Laos | 553 | 0.0% |
| Latin America | 698,936 | 17.6% |
| Latvia | 1,009 | 0.0% |
| Lebanon | 1,785 | 0.0% |
| Liberia | 1,369 | 0.0% |
| Lithuania | 531 | 0.0% |
| Malaysia | 4,978 | 0.1% |
| Mexico | 65,132 | 1.6% |
| Micronesia | 42 | 0.0% |
| Middle Africa | 1,143 | 0.0% |
| Moldova | 1,567 | 0.0% |
| Morocco | 2,585 | 0.1% |
| Nepal | 8,999 | 0.2% |
| Netherlands | 1,440 | 0.0% |
| Nicaragua | 3,216 | 0.1% |
| Nigeria | 11,627 | 0.3% |
| North Macedonia | 649 | 0.0% |
| Northern Africa | 14,726 | 0.4% |
| Northern Europe | 25,497 | 0.6% |
| Norway | 643 | 0.0% |
| Oceania | 6,588 | 0.2% |
| Pakistan | 14,705 | 0.4% |
| Panama | 5,647 | 0.1% |
| Peru | 15,283 | 0.4% |
| Philippines | 35,506 | 0.9% |
| Poland | 24,764 | 0.6% |
| Portugal | 1,882 | 0.1% |
| Romania | 7,116 | 0.2% |
| Russia | 22,609 | 0.6% |
| Saudi Arabia | 657 | 0.0% |
| Scotland | 771 | 0.0% |
| Senegal | 1,763 | 0.0% |
| Serbia | 2,039 | 0.1% |
| Sierra Leone | 808 | 0.0% |
| Singapore | 1,666 | 0.0% |
| Somalia | 101 | 0.0% |
| South Africa | 1,950 | 0.1% |
| South America | 212,669 | 5.3% |
| South Central Asia | 147,510 | 3.7% |
| South Eastern Asia | 62,885 | 1.6% |
| Southern Europe | 34,949 | 0.9% |
| Spain | 5,574 | 0.1% |
| Sri Lanka | 2,876 | 0.1% |
| St. Vincent and the Grenadines | 3,617 | 0.1% |
| Sudan | 581 | 0.0% |
| Sweden | 1,351 | 0.0% |
| Switzerland | 1,139 | 0.0% |
| Syria | 1,389 | 0.0% |
| Taiwan | 13,928 | 0.4% |
| Thailand | 5,151 | 0.1% |
| Trinidad and Tobago | 28,514 | 0.7% |
| Turkey | 4,799 | 0.1% |
| Uganda | 290 | 0.0% |
| Ukraine | 17,078 | 0.4% |
| Uruguay | 1,316 | 0.0% |
| Uzbekistan | 9,660 | 0.2% |
| Venezuela | 7,614 | 0.2% |
| Vietnam | 7,036 | 0.2% |
| West Indies | 1,558 | 0.0% |
| Western Africa | 44,029 | 1.1% |
| Western Asia | 30,997 | 0.8% |
| Western Europe | 22,157 | 0.6% |
| Yemen | 3,647 | 0.1% |
| Zaire | 160 | 0.0% |
| Zimbabwe | 260 | 0.0% | View All 136 Rows |
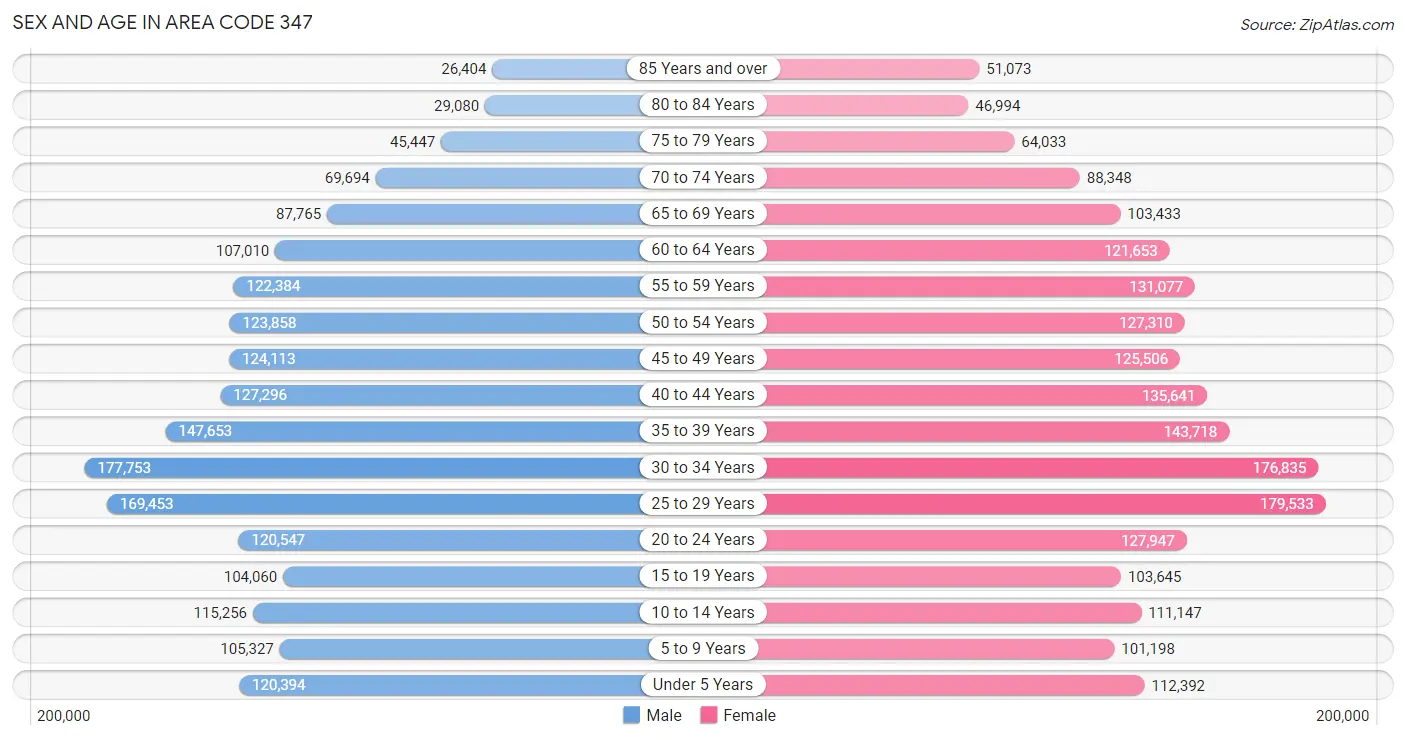
Sex and Age in Area Code 347
Sex and Age in Area Code 347
The most populous age groups in Area Code 347 are 30 to 34 Years (177,753 | 9.2%) for men and 25 to 29 Years (179,533 | 8.7%) for women.
| Age Bracket | Male | Female |
| Under 5 Years | 120,394 (6.3%) | 112,392 (5.5%) |
| 5 to 9 Years | 105,327 (5.5%) | 101,198 (4.9%) |
| 10 to 14 Years | 115,256 (6.0%) | 111,147 (5.4%) |
| 15 to 19 Years | 104,060 (5.4%) | 103,645 (5.1%) |
| 20 to 24 Years | 120,547 (6.3%) | 127,947 (6.2%) |
| 25 to 29 Years | 169,453 (8.8%) | 179,533 (8.7%) |
| 30 to 34 Years | 177,753 (9.2%) | 176,835 (8.6%) |
| 35 to 39 Years | 147,653 (7.7%) | 143,718 (7.0%) |
| 40 to 44 Years | 127,296 (6.6%) | 135,641 (6.6%) |
| 45 to 49 Years | 124,113 (6.5%) | 125,506 (6.1%) |
| 50 to 54 Years | 123,858 (6.4%) | 127,310 (6.2%) |
| 55 to 59 Years | 122,384 (6.4%) | 131,077 (6.4%) |
| 60 to 64 Years | 107,010 (5.6%) | 121,653 (5.9%) |
| 65 to 69 Years | 87,765 (4.6%) | 103,433 (5.0%) |
| 70 to 74 Years | 69,694 (3.6%) | 88,348 (4.3%) |
| 75 to 79 Years | 45,447 (2.4%) | 64,033 (3.1%) |
| 80 to 84 Years | 29,080 (1.5%) | 46,994 (2.3%) |
| 85 Years and over | 26,404 (1.4%) | 51,073 (2.5%) |
| Total | 1,923,494 (100.0%) | 2,051,483 (100.0%) |
Families and Households in Area Code 347
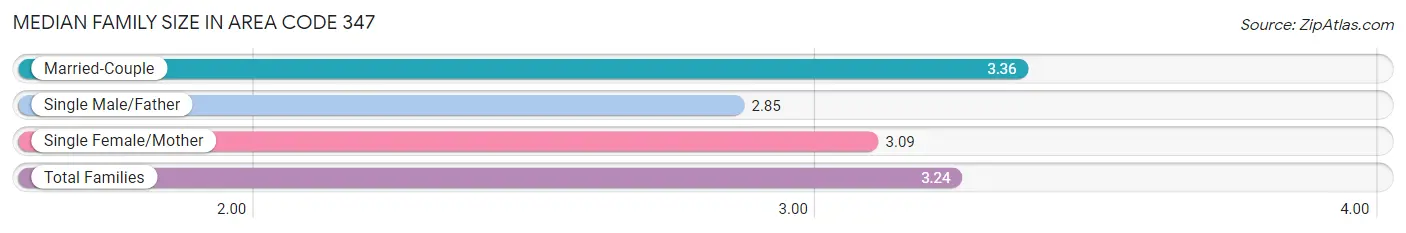
Median Family Size in Area Code 347
The median family size in Area Code 347 is 3.24 persons per family, with married-couple families (574,507 | 64.5%) accounting for the largest median family size of 3.36047 persons per family. On the other hand, single male/father families (79,310 | 8.9%) represent the smallest median family size with 2.85 persons per family.
| Family Type | # Families | Family Size |
| Married-Couple | 574,507 (64.5%) | 3.36 |
| Single Male/Father | 79,310 (8.9%) | 2.85 |
| Single Female/Mother | 236,827 (26.6%) | 3.09 |
| Total Families | 890,644 (100.0%) | 3.24 |
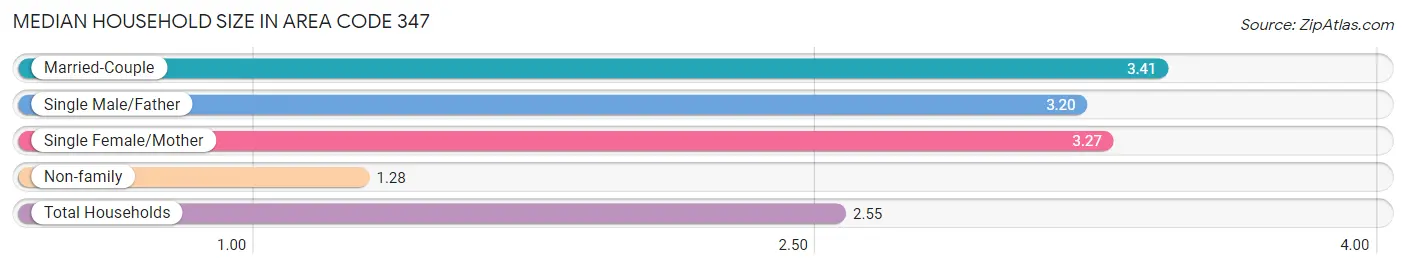
Median Household Size in Area Code 347
The median household size in Area Code 347 is 2.55 persons per household, with married-couple households (574,507 | 37.3%) accounting for the largest median household size of 3.41458 persons per household. non-family households (647,897 | 42.1%) represent the smallest median household size with 1.28 persons per household.
| Household Type | # Households | Household Size |
| Married-Couple | 574,507 (37.3%) | 3.41 |
| Single Male/Father | 79,310 (5.1%) | 3.20 |
| Single Female/Mother | 236,827 (15.4%) | 3.27 |
| Non-family | 647,897 (42.1%) | 1.28 |
| Total Households | 1,538,541 (100.0%) | 2.55 |
Household Size by Marriage Status in Area Code 347
Out of a total of 1,538,541 households in Area Code 347, 890,644 (57.9%) are family households, while 647,897 (42.1%) are nonfamily households. The most numerous type of family households are 2-person households, comprising 339,520, and the most common type of nonfamily households are 1-person households, comprising 510,674.
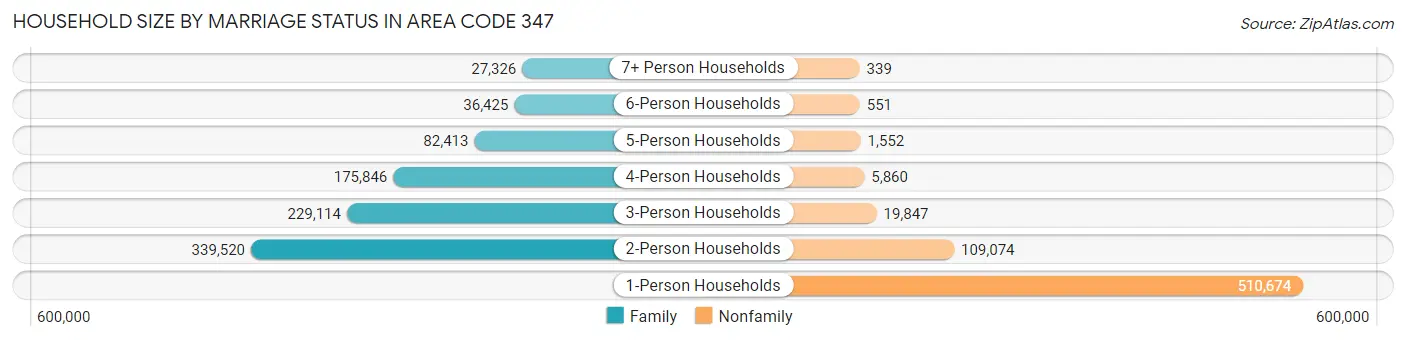
| Household Size | Family Households | Nonfamily Households |
| 1-Person Households | - | 510,674 (33.2%) |
| 2-Person Households | 339,520 (22.1%) | 109,074 (7.1%) |
| 3-Person Households | 229,114 (14.9%) | 19,847 (1.3%) |
| 4-Person Households | 175,846 (11.4%) | 5,860 (0.4%) |
| 5-Person Households | 82,413 (5.4%) | 1,552 (0.1%) |
| 6-Person Households | 36,425 (2.4%) | 551 (0.0%) |
| 7+ Person Households | 27,326 (1.8%) | 339 (0.0%) |
| Total | 890,644 (57.9%) | 647,897 (42.1%) |
Female Fertility in Area Code 347
Fertility by Age in Area Code 347
Average fertility rate in Area Code 347 is 48.0 births per 1,000 women. Women in the age bracket of 20 to 34 years have the highest fertility rate with 58.7 births per 1,000 women. Women in the age bracket of 20 to 34 years acount for 57.4% of all women with births.
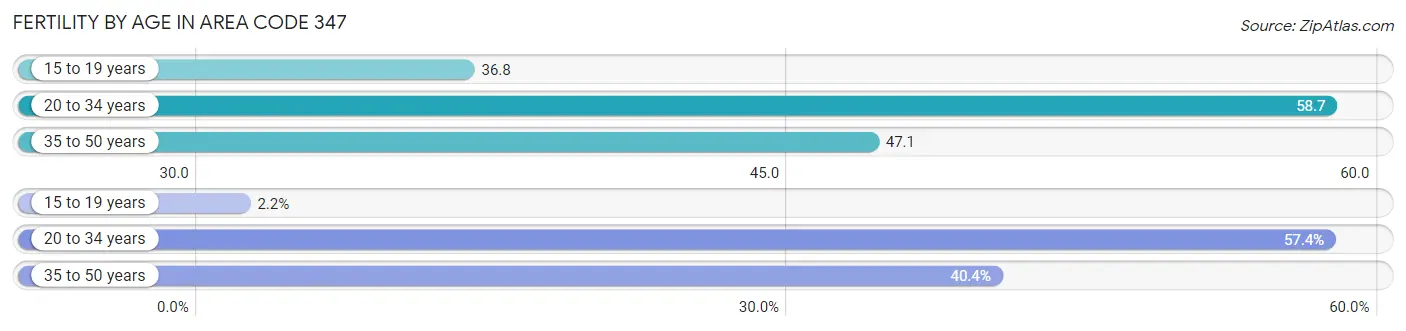
| Age Bracket | Women with Births | Births / 1,000 Women |
| 15 to 19 years | 997 (2.2%) | 36.8 |
| 20 to 34 years | 26,546 (57.4%) | 58.7 |
| 35 to 50 years | 18,698 (40.4%) | 47.1 |
| Total | 46,241 (100.0%) | 48.0 |
Fertility by Age by Marriage Status in Area Code 347
72.9% of women with births (46,241) in Area Code 347 are married. The highest percentage of unmarried women with births falls into 15 to 19 years age bracket with 97.8% of them unmarried at the time of birth, while the lowest percentage of unmarried women with births belong to 35 to 50 years age bracket with 25.4% of them unmarried.
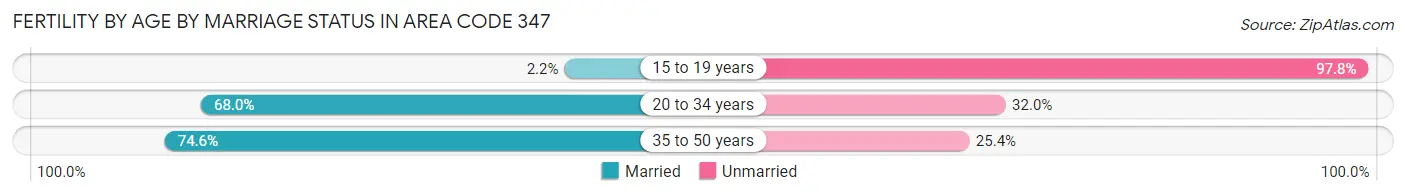
| Age Bracket | Married | Unmarried |
| 15 to 19 years | 22 (2.2%) | 975 (97.8%) |
| 20 to 34 years | 18,057 (68.0%) | 8,489 (32.0%) |
| 35 to 50 years | 13,946 (74.6%) | 4,752 (25.4%) |
| Total | 33,706 (72.9%) | 12,535 (27.1%) |
Fertility by Education in Area Code 347
Average fertility rate in Area Code 347 is 48.0 births per 1,000 women. Women with the education attainment of graduate degree have the highest fertility rate of 63.4 births per 1,000 women, while women with the education attainment of college or associate's degree have the lowest fertility at 43.5 births per 1,000 women. Women with the education attainment of bachelor's degree represent 25.5% of all women with births.
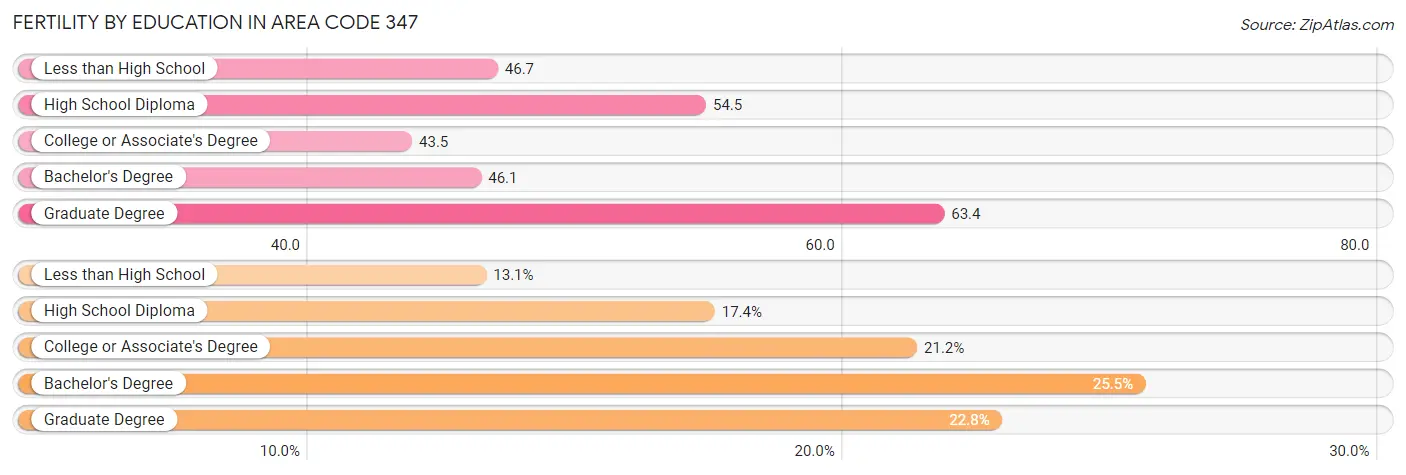
| Educational Attainment | Women with Births | Births / 1,000 Women |
| Less than High School | 6,073 (13.1%) | 46.7 |
| High School Diploma | 8,049 (17.4%) | 54.5 |
| College or Associate's Degree | 9,805 (21.2%) | 43.5 |
| Bachelor's Degree | 11,778 (25.5%) | 46.1 |
| Graduate Degree | 10,536 (22.8%) | 63.4 |
| Total | 46,241 (100.0%) | 48.0 |
Fertility by Education by Marriage Status in Area Code 347
27.1% of women with births in Area Code 347 are unmarried. Women with the educational attainment of graduate degree are most likely to be married with 77.2% of them married at childbirth, while women with the educational attainment of less than high school are least likely to be married with 58.2% of them unmarried at childbirth.
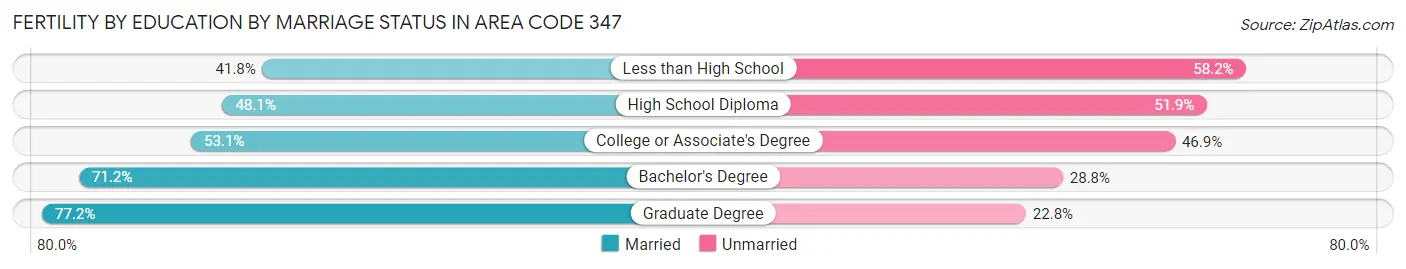
| Educational Attainment | Married | Unmarried |
| Less than High School | 2,538 (41.8%) | 3,535 (58.2%) |
| High School Diploma | 3,871 (48.1%) | 4,178 (51.9%) |
| College or Associate's Degree | 5,210 (53.1%) | 4,595 (46.9%) |
| Bachelor's Degree | 8,387 (71.2%) | 3,391 (28.8%) |
| Graduate Degree | 8,131 (77.2%) | 2,405 (22.8%) |
| Total | 33,706 (72.9%) | 12,535 (27.1%) |
Employment Characteristics in Area Code 347
Employment by Class of Employer in Area Code 347
Among the 1,906,985 employed individuals in Area Code 347, private company employees (1,263,618 | 66.3%), not-for-profit organizations (202,730 | 10.6%), and local government employees (170,996 | 9.0%) make up the most common classes of employment.
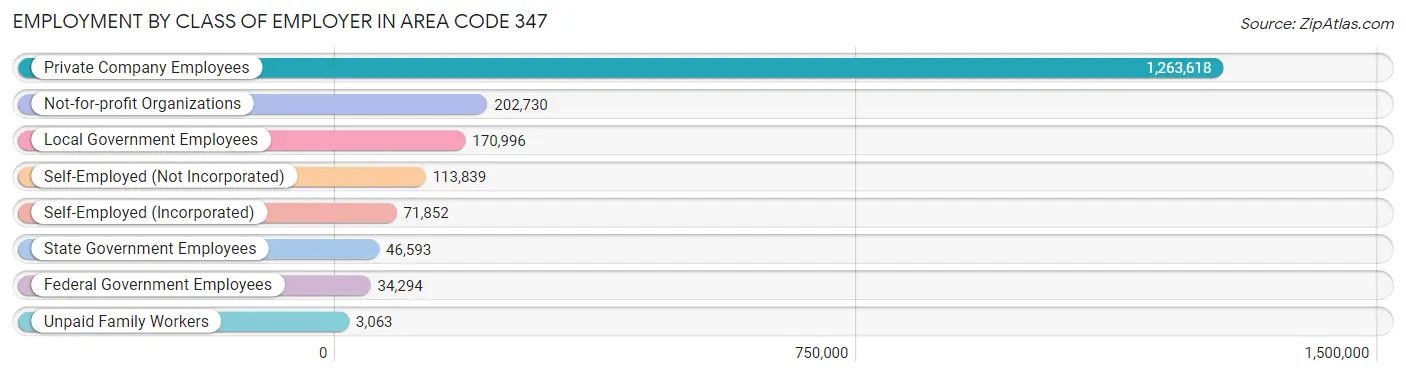
| Employer Class | # Employees | % Employees |
| Private Company Employees | 1,263,618 | 66.3% |
| Self-Employed (Incorporated) | 71,852 | 3.8% |
| Self-Employed (Not Incorporated) | 113,839 | 6.0% |
| Not-for-profit Organizations | 202,730 | 10.6% |
| Local Government Employees | 170,996 | 9.0% |
| State Government Employees | 46,593 | 2.4% |
| Federal Government Employees | 34,294 | 1.8% |
| Unpaid Family Workers | 3,063 | 0.2% |
| Total | 1,906,985 | 100.0% |
Employment Status by Age in Area Code 347
According to the labor force statistics for Area Code 347, out of the total population over 16 years of age (3,269,576), 66.1% or 2,159,882 individuals are in the labor force, with 6.8% or 147,088 of them unemployed. The age group with the highest labor force participation rate is 30 to 34 years, with 85.6% or 303,634 individuals in the labor force. Within the labor force, the 16 to 19 years age range has the highest percentage of unemployed individuals, with 1,967.7% or 721,713 of them being unemployed.
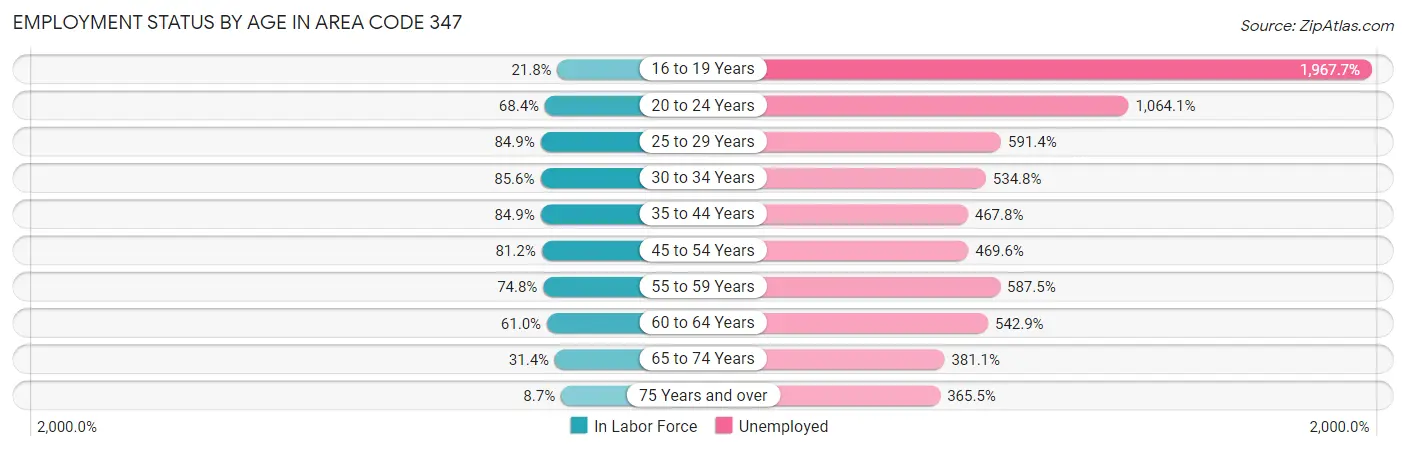
| Age Bracket | In Labor Force | Unemployed |
| 16 to 19 Years | 36,681 (21.8%) | 721,713 (1,967.7%) |
| 20 to 24 Years | 169,931 (68.4%) | 1,808,119 (1,064.1%) |
| 25 to 29 Years | 296,256 (84.9%) | 1,752,046 (591.4%) |
| 30 to 34 Years | 303,648 (85.6%) | 1,623,835 (534.8%) |
| 35 to 44 Years | 470,334 (84.9%) | 2,200,204 (467.8%) |
| 45 to 54 Years | 406,539 (81.2%) | 1,909,107 (469.6%) |
| 55 to 59 Years | 189,672 (74.8%) | 1,114,282 (587.5%) |
| 60 to 64 Years | 139,463 (61.0%) | 757,139 (542.9%) |
| 65 to 74 Years | 109,579 (31.4%) | 417,655 (381.1%) |
| 75 Years and over | 22,988 (8.7%) | 84,025 (365.5%) |
| Total | 2,159,997 (66.1%) | 147,177 (6.8%) |
Employment Status by Educational Attainment in Area Code 347
According to labor force statistics for Area Code 347, 80.7% of individuals (1,808,096) out of the total population between 25 and 64 years of age (2,240,793) are in the labor force, with 510.3% or 9,226,714 of them being unemployed. The group with the highest labor force participation rate are those with the educational attainment of bachelor's degree or higher, with 88.4% or 908,038 individuals in the labor force. Within the labor force, individuals with less than high school education have the highest percentage of unemployment, with 768.3% or 1,351,639 of them being unemployed.
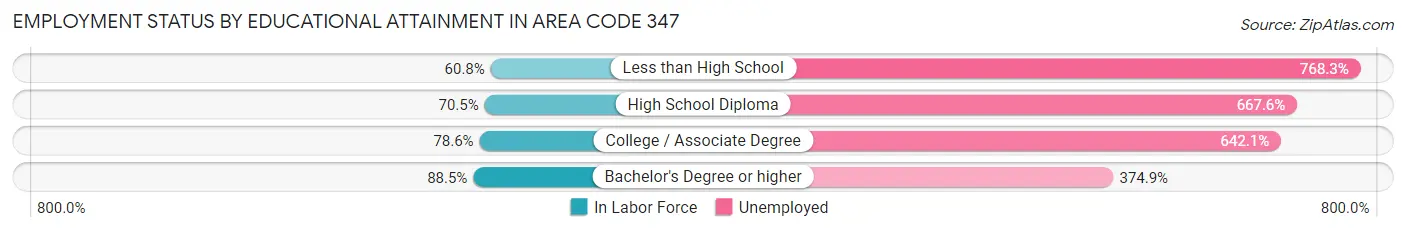
| Educational Attainment | In Labor Force | Unemployed |
| Less than High School | 175,916 (60.8%) | 2,222,000 (768.3%) |
| High School Diploma | 330,435 (70.5%) | 3,129,161 (667.6%) |
| College / Associate Degree | 358,454 (78.6%) | 2,929,601 (642.1%) |
| Bachelor's Degree or higher | 907,996 (88.4%) | 3,848,768 (374.9%) |
| Total | 1,808,188 (80.7%) | 11,434,767 (510.3%) |
Employment Occupations by Sex in Area Code 347
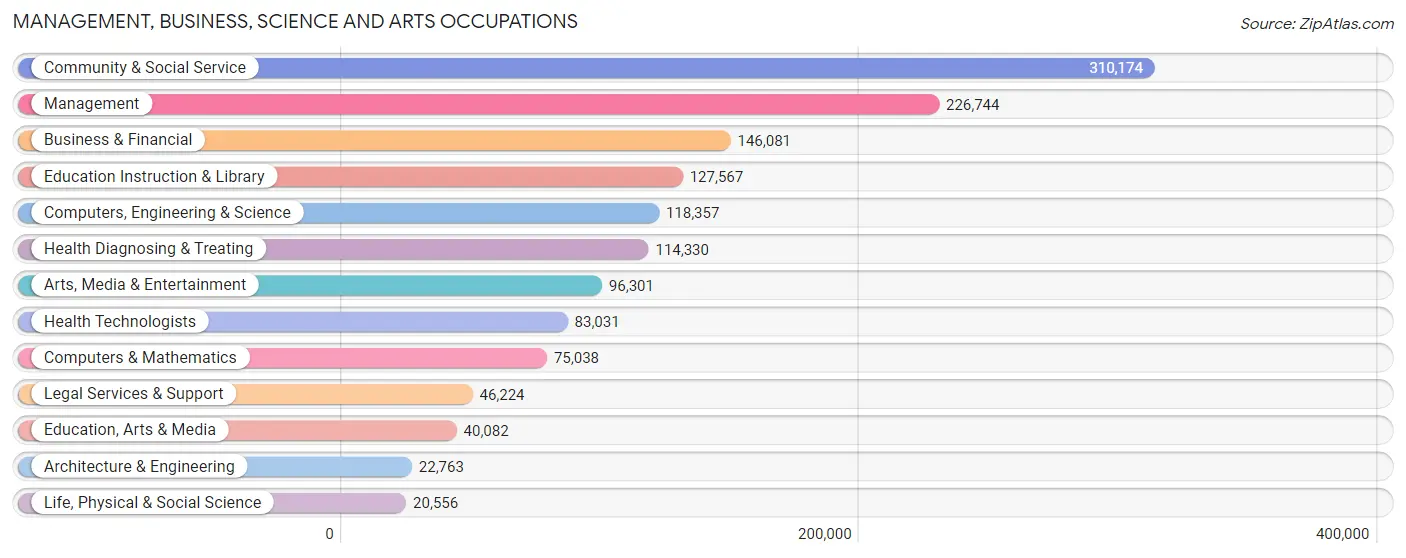
Management, Business, Science and Arts Occupations
The most common Management, Business, Science and Arts occupations in Area Code 347 are Community & Social Service (310,174 | 15.8%), Management (226,744 | 11.6%), Business & Financial (146,081 | 7.5%), Education Instruction & Library (127,567 | 6.5%), and Computers, Engineering & Science (118,357 | 6.0%).
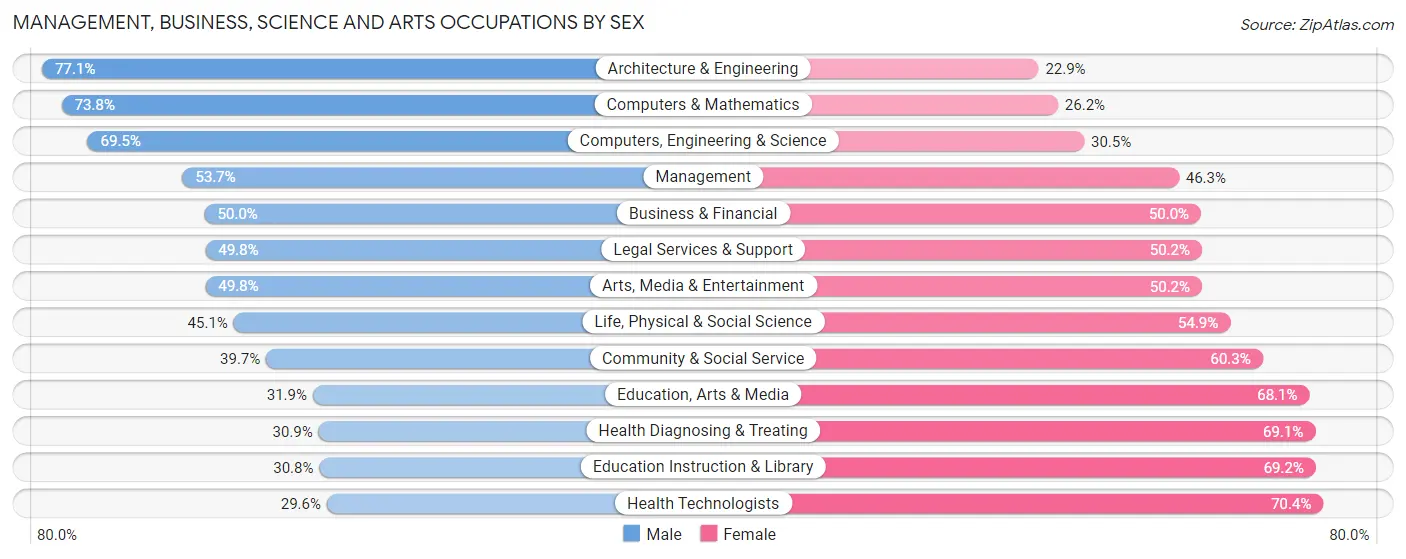
Management, Business, Science and Arts Occupations by Sex
Within the Management, Business, Science and Arts occupations in Area Code 347, the most male-oriented occupations are Architecture & Engineering (77.1%), Computers & Mathematics (73.8%), and Computers, Engineering & Science (69.5%), while the most female-oriented occupations are Health Technologists (70.4%), Education Instruction & Library (69.2%), and Health Diagnosing & Treating (69.1%).
| Occupation | Male | Female |
| Management | 121,702 (53.7%) | 105,042 (46.3%) |
| Business & Financial | 73,005 (50.0%) | 73,076 (50.0%) |
| Computers, Engineering & Science | 82,232 (69.5%) | 36,125 (30.5%) |
| Computers & Mathematics | 55,411 (73.8%) | 19,627 (26.2%) |
| Architecture & Engineering | 17,549 (77.1%) | 5,214 (22.9%) |
| Life, Physical & Social Science | 9,272 (45.1%) | 11,284 (54.9%) |
| Community & Social Service | 123,128 (39.7%) | 187,046 (60.3%) |
| Education, Arts & Media | 12,785 (31.9%) | 27,297 (68.1%) |
| Legal Services & Support | 23,036 (49.8%) | 23,188 (50.2%) |
| Education Instruction & Library | 39,318 (30.8%) | 88,249 (69.2%) |
| Arts, Media & Entertainment | 47,989 (49.8%) | 48,312 (50.2%) |
| Health Diagnosing & Treating | 35,378 (30.9%) | 78,952 (69.1%) |
| Health Technologists | 24,551 (29.6%) | 58,480 (70.4%) |
| Total (Category) | 435,445 (47.5%) | 480,241 (52.4%) |
| Total (Overall) | 1,003,864 (51.2%) | 955,140 (48.8%) |
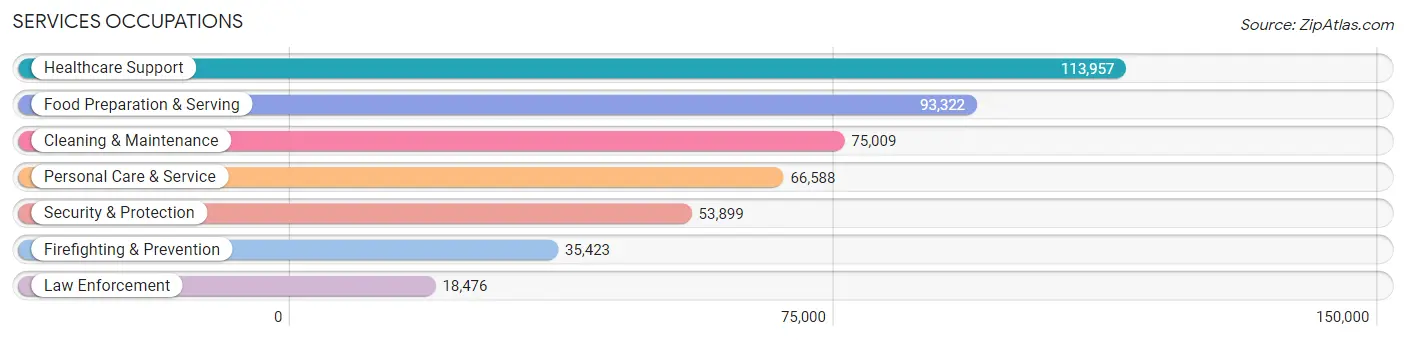
Services Occupations
The most common Services occupations in Area Code 347 are Healthcare Support (113,957 | 5.8%), Food Preparation & Serving (93,322 | 4.8%), Cleaning & Maintenance (75,009 | 3.8%), Personal Care & Service (66,588 | 3.4%), and Security & Protection (53,899 | 2.8%).
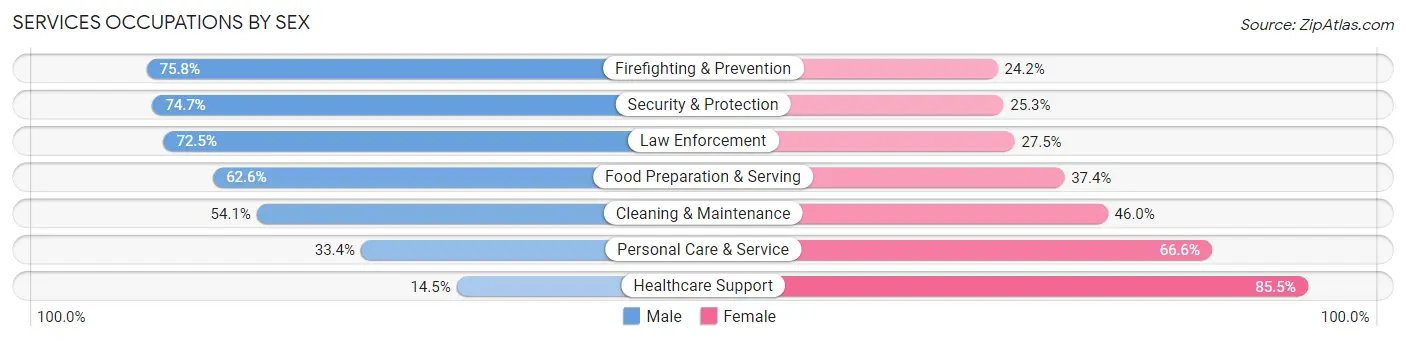
Services Occupations by Sex
Within the Services occupations in Area Code 347, the most male-oriented occupations are Firefighting & Prevention (75.8%), Security & Protection (74.7%), and Law Enforcement (72.5%), while the most female-oriented occupations are Healthcare Support (85.5%), Personal Care & Service (66.6%), and Cleaning & Maintenance (46.0%).
| Occupation | Male | Female |
| Healthcare Support | 16,506 (14.5%) | 97,451 (85.5%) |
| Security & Protection | 40,255 (74.7%) | 13,644 (25.3%) |
| Firefighting & Prevention | 26,861 (75.8%) | 8,562 (24.2%) |
| Law Enforcement | 13,394 (72.5%) | 5,082 (27.5%) |
| Food Preparation & Serving | 58,457 (62.6%) | 34,865 (37.4%) |
| Cleaning & Maintenance | 40,546 (54.0%) | 34,463 (46.0%) |
| Personal Care & Service | 22,260 (33.4%) | 44,328 (66.6%) |
| Total (Category) | 178,024 (44.2%) | 224,751 (55.8%) |
| Total (Overall) | 1,003,864 (51.2%) | 955,140 (48.8%) |
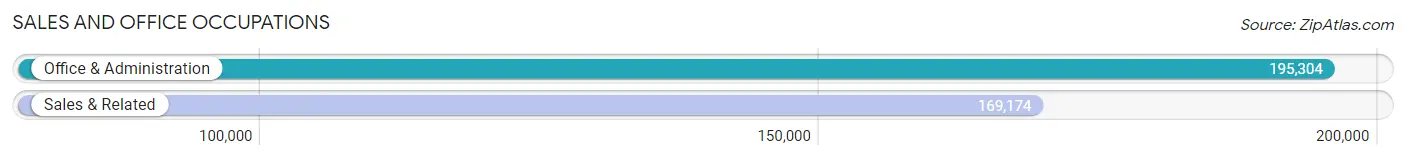
Sales and Office Occupations
The most common Sales and Office occupations in Area Code 347 are Office & Administration (195,304 | 10.0%), and Sales & Related (169,174 | 8.6%).
Sales and Office Occupations by Sex
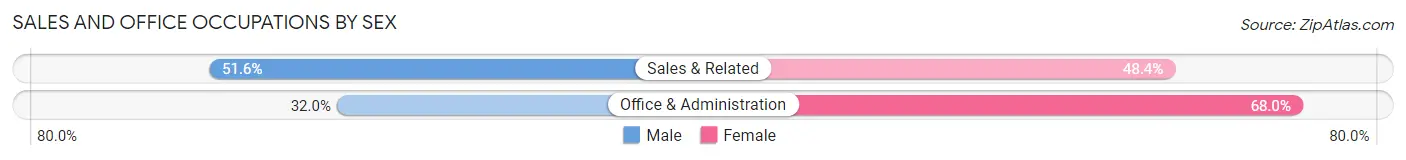
| Occupation | Male | Female |
| Sales & Related | 87,306 (51.6%) | 81,868 (48.4%) |
| Office & Administration | 62,452 (32.0%) | 132,852 (68.0%) |
| Total (Category) | 149,758 (41.1%) | 214,720 (58.9%) |
| Total (Overall) | 1,003,864 (51.2%) | 955,140 (48.8%) |
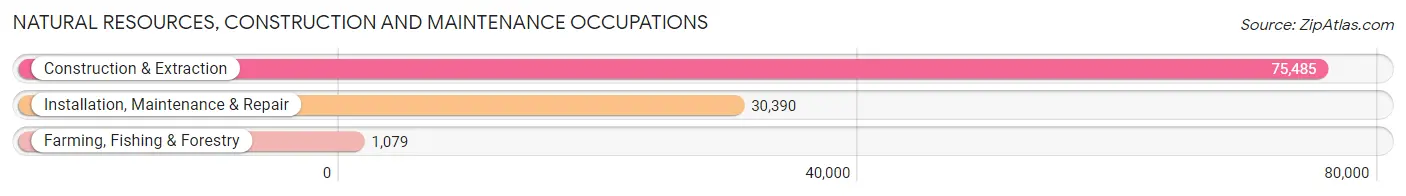
Natural Resources, Construction and Maintenance Occupations
The most common Natural Resources, Construction and Maintenance occupations in Area Code 347 are Construction & Extraction (75,485 | 3.8%), Installation, Maintenance & Repair (30,390 | 1.5%), and Farming, Fishing & Forestry (1,079 | 0.1%).
Natural Resources, Construction and Maintenance Occupations by Sex
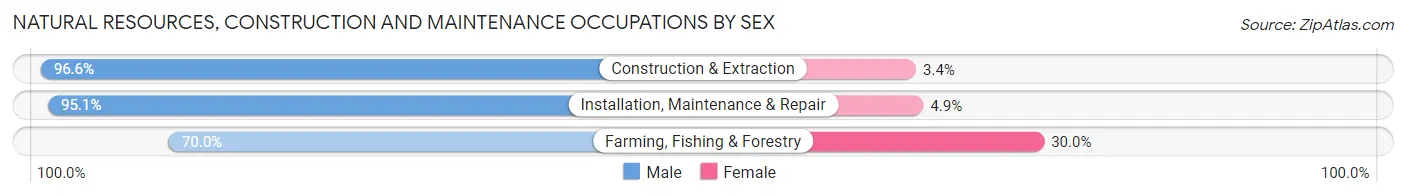
| Occupation | Male | Female |
| Farming, Fishing & Forestry | 755 (70.0%) | 324 (30.0%) |
| Construction & Extraction | 72,940 (96.6%) | 2,545 (3.4%) |
| Installation, Maintenance & Repair | 28,905 (95.1%) | 1,485 (4.9%) |
| Total (Category) | 102,600 (95.9%) | 4,354 (4.1%) |
| Total (Overall) | 1,003,864 (51.2%) | 955,140 (48.8%) |
Production, Transportation and Moving Occupations
The most common Production, Transportation and Moving occupations in Area Code 347 are Transportation (88,204 | 4.5%), Production (42,115 | 2.1%), and Material Moving (38,792 | 2.0%).
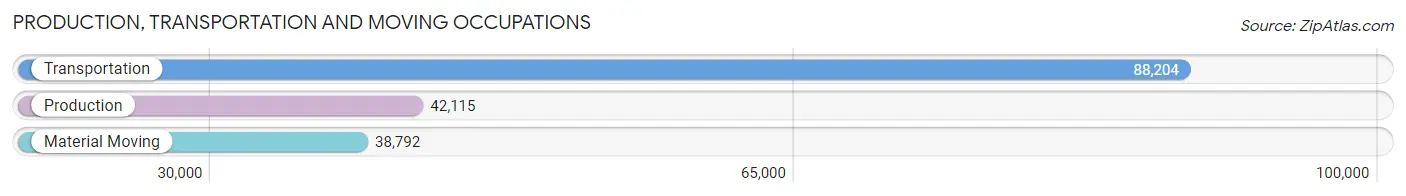
Production, Transportation and Moving Occupations by Sex
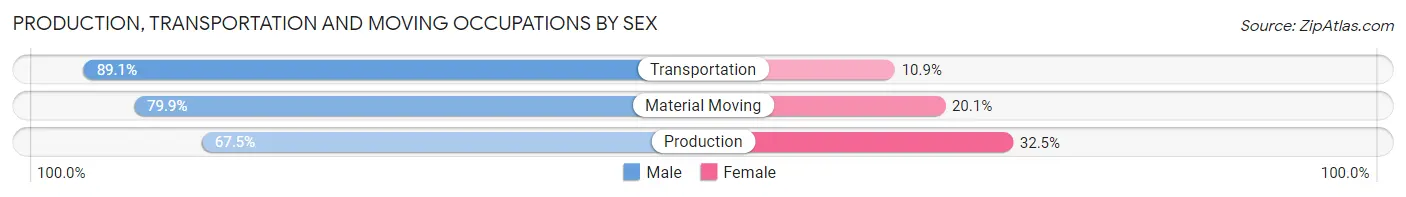
| Occupation | Male | Female |
| Production | 28,414 (67.5%) | 13,701 (32.5%) |
| Transportation | 78,622 (89.1%) | 9,582 (10.9%) |
| Material Moving | 31,001 (79.9%) | 7,791 (20.1%) |
| Total (Category) | 138,037 (81.6%) | 31,074 (18.4%) |
| Total (Overall) | 1,003,864 (51.2%) | 955,140 (48.8%) |
Employment Industries by Sex in Area Code 347
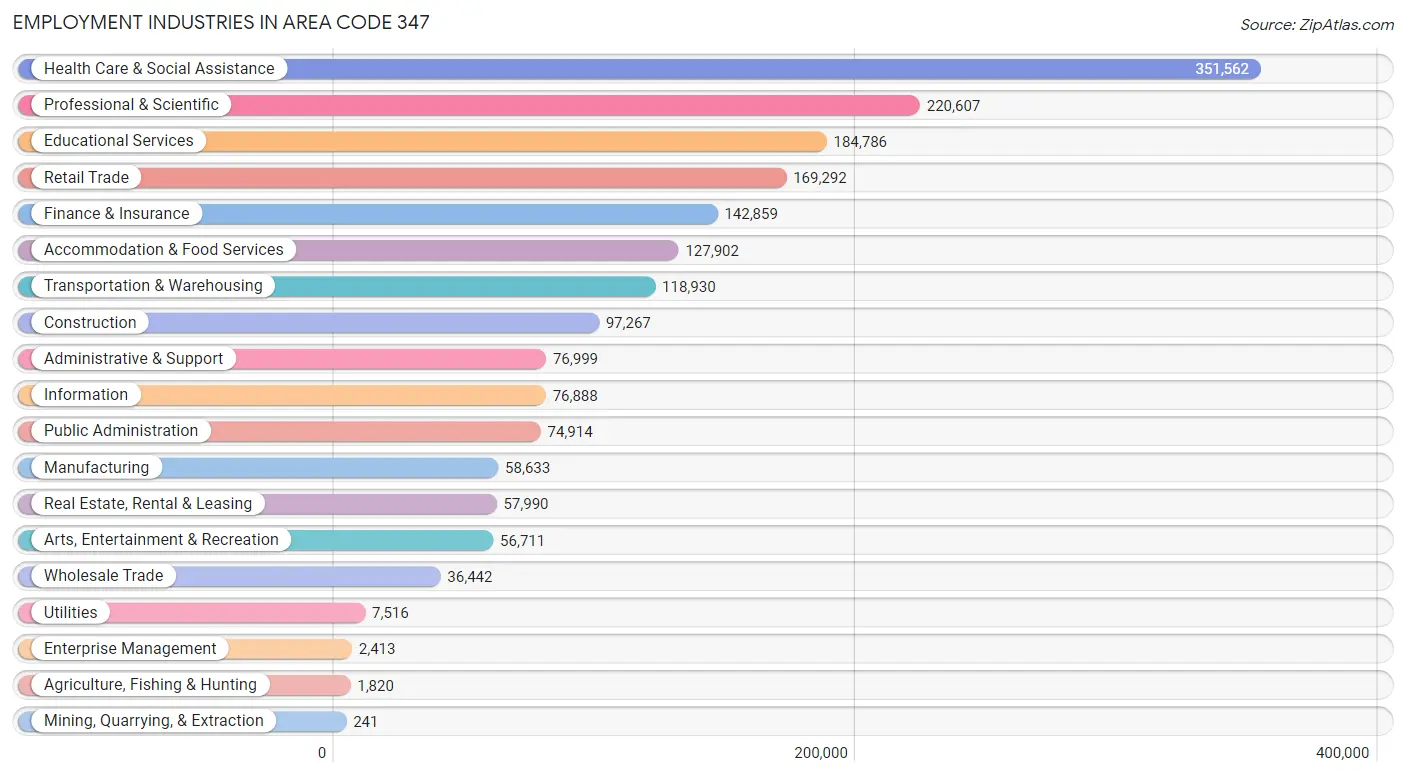
Employment Industries in Area Code 347
The major employment industries in Area Code 347 include Health Care & Social Assistance (351,562 | 17.9%), Professional & Scientific (220,607 | 11.3%), Educational Services (184,786 | 9.4%), Retail Trade (169,292 | 8.6%), and Finance & Insurance (142,859 | 7.3%).
Employment Industries by Sex in Area Code 347
The Area Code 347 industries that see more men than women are Mining, Quarrying, & Extraction (100.0%), Construction (89.5%), and Transportation & Warehousing (79.9%), whereas the industries that tend to have a higher number of women are Health Care & Social Assistance (74.2%), Educational Services (65.0%), and Enterprise Management (52.5%).
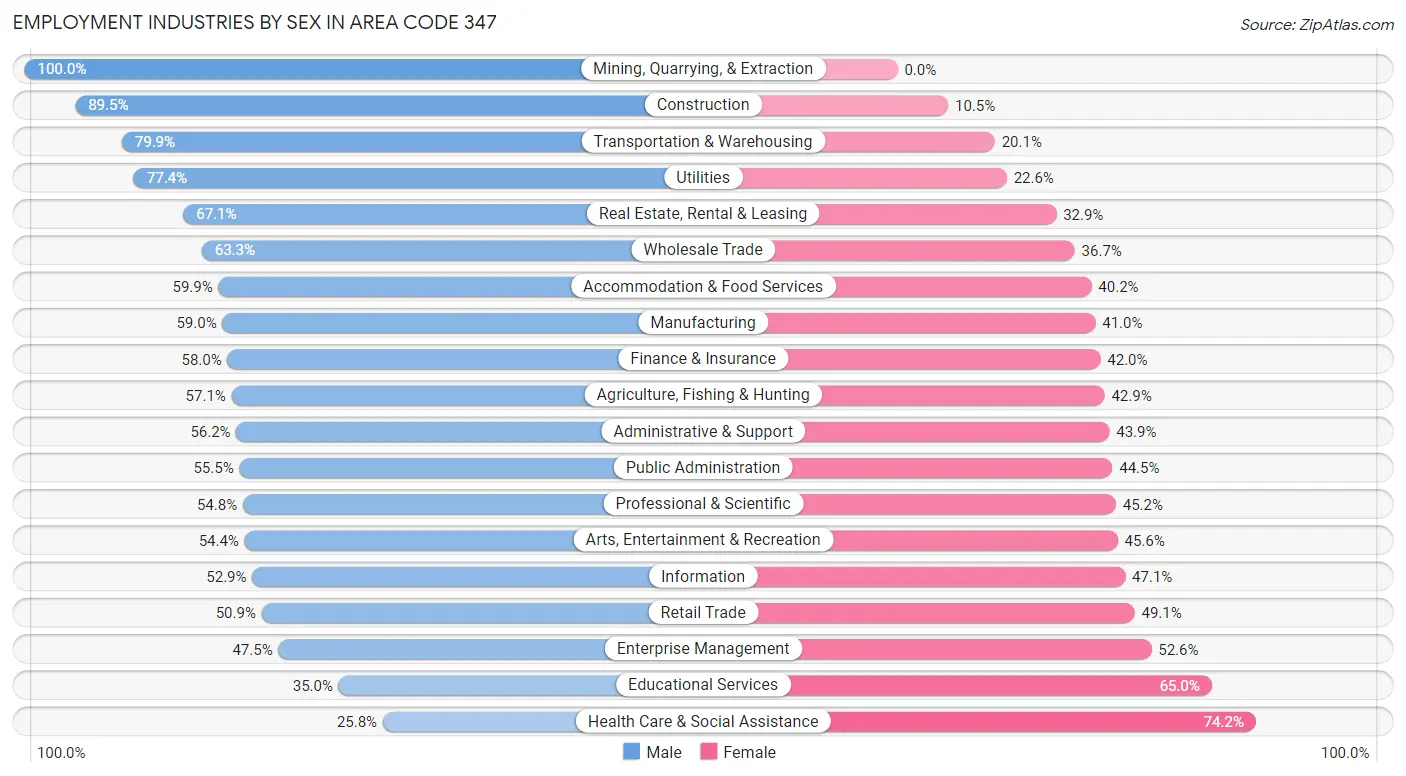
| Industry | Male | Female |
| Agriculture, Fishing & Hunting | 1,040 (57.1%) | 780 (42.9%) |
| Mining, Quarrying, & Extraction | 241 (100.0%) | 0 (0.0%) |
| Construction | 87,067 (89.5%) | 10,200 (10.5%) |
| Manufacturing | 34,614 (59.0%) | 24,019 (41.0%) |
| Wholesale Trade | 23,072 (63.3%) | 13,370 (36.7%) |
| Retail Trade | 86,204 (50.9%) | 83,088 (49.1%) |
| Transportation & Warehousing | 94,973 (79.9%) | 23,957 (20.1%) |
| Utilities | 5,816 (77.4%) | 1,700 (22.6%) |
| Information | 40,645 (52.9%) | 36,243 (47.1%) |
| Finance & Insurance | 82,856 (58.0%) | 60,003 (42.0%) |
| Real Estate, Rental & Leasing | 38,933 (67.1%) | 19,057 (32.9%) |
| Professional & Scientific | 120,893 (54.8%) | 99,714 (45.2%) |
| Enterprise Management | 1,145 (47.4%) | 1,268 (52.5%) |
| Administrative & Support | 43,238 (56.1%) | 33,761 (43.9%) |
| Educational Services | 64,598 (35.0%) | 120,188 (65.0%) |
| Health Care & Social Assistance | 90,822 (25.8%) | 260,740 (74.2%) |
| Arts, Entertainment & Recreation | 30,872 (54.4%) | 25,839 (45.6%) |
| Accommodation & Food Services | 76,546 (59.9%) | 51,356 (40.2%) |
| Public Administration | 41,595 (55.5%) | 33,319 (44.5%) |
| Total | 1,003,864 (51.2%) | 955,140 (48.8%) |
Education in Area Code 347
School Enrollment in Area Code 347
The most common levels of schooling among the 905,605 students in Area Code 347 are college / undergraduate (210,200 | 23.2%), middle school (178,410 | 19.7%), and high school (172,211 | 19.0%).
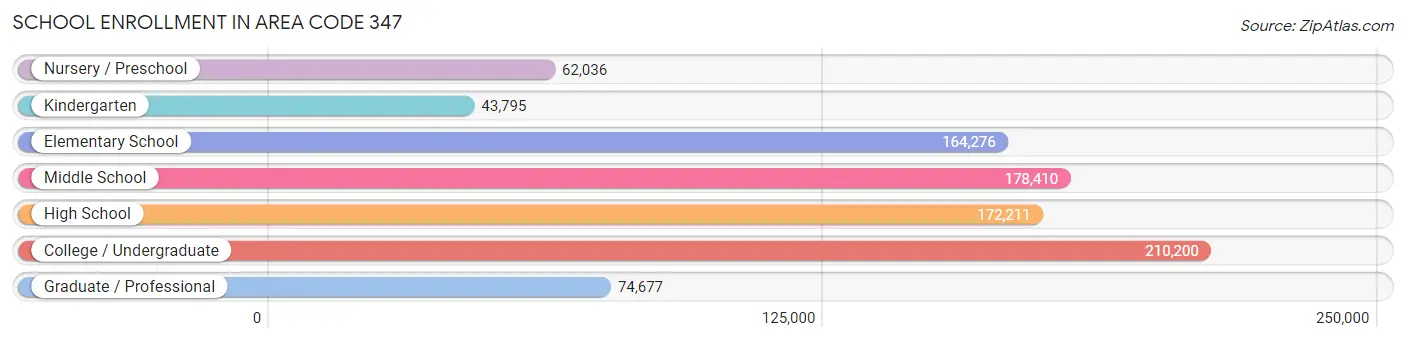
| School Level | # Students | % Students |
| Nursery / Preschool | 62,036 | 6.9% |
| Kindergarten | 43,795 | 4.8% |
| Elementary School | 164,276 | 18.1% |
| Middle School | 178,410 | 19.7% |
| High School | 172,211 | 19.0% |
| College / Undergraduate | 210,200 | 23.2% |
| Graduate / Professional | 74,677 | 8.3% |
| Total | 905,605 | 100.0% |
School Enrollment by Age by Funding Source in Area Code 347
Out of a total of 905,605 students who are enrolled in schools in Area Code 347, 260,713 (28.8%) attend a private institution, while the remaining 644,892 (71.2%) are enrolled in public schools. The age group of 25 to 34 year olds has the highest likelihood of being enrolled in private schools, with 34,808 (45.7% in the age bracket) enrolled. Conversely, the age group of 5 to 9 year old has the lowest likelihood of being enrolled in a private school, with 160,236 (80.7% in the age bracket) attending a public institution.
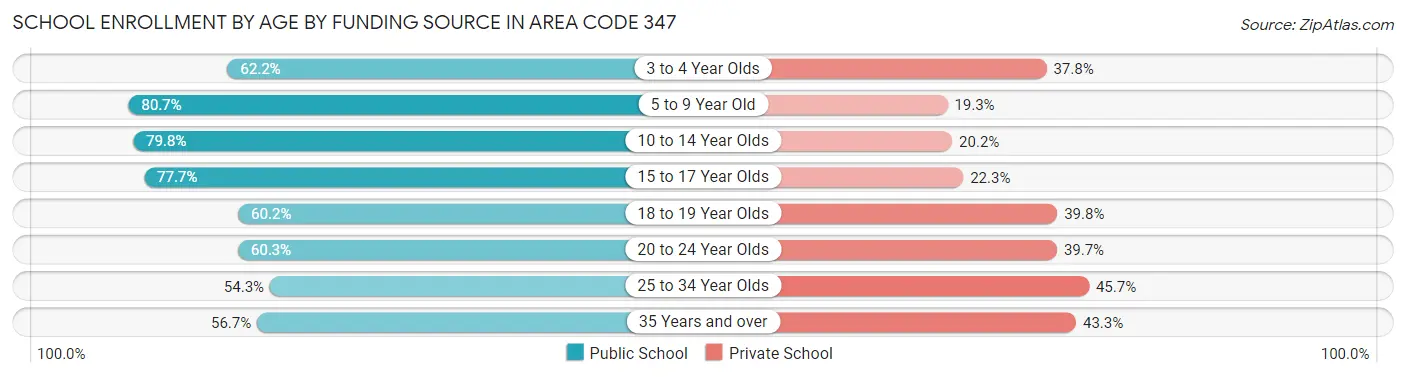
| Age Bracket | Public School | Private School |
| 3 to 4 Year Olds | 37,712 (62.2%) | 22,895 (37.8%) |
| 5 to 9 Year Old | 160,236 (80.7%) | 38,400 (19.3%) |
| 10 to 14 Year Olds | 175,788 (79.8%) | 44,530 (20.2%) |
| 15 to 17 Year Olds | 92,660 (77.7%) | 26,542 (22.3%) |
| 18 to 19 Year Olds | 41,336 (60.2%) | 27,309 (39.8%) |
| 20 to 24 Year Olds | 66,388 (60.3%) | 43,756 (39.7%) |
| 25 to 34 Year Olds | 41,370 (54.3%) | 34,808 (45.7%) |
| 35 Years and over | 29,417 (56.7%) | 22,458 (43.3%) |
| Total | 644,892 (71.2%) | 260,713 (28.8%) |
Educational Attainment by Field of Study in Area Code 347
Business (247,620 | 18.6%), social sciences (170,094 | 12.8%), visual & performing arts (116,889 | 8.8%), science & technology (107,682 | 8.1%), and literature & languages (87,311 | 6.6%) are the most common fields of study among 1,330,023 individuals in Area Code 347 who have obtained a bachelor's degree or higher.
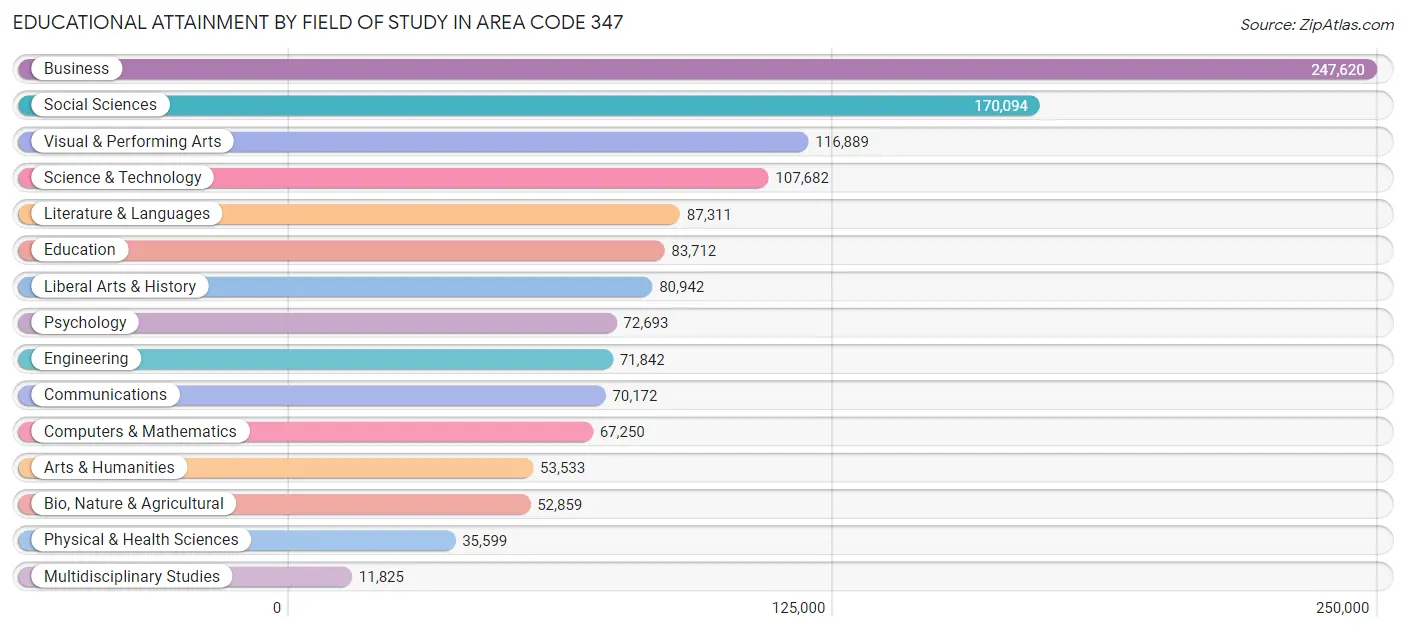
| Field of Study | # Graduates | % Graduates |
| Computers & Mathematics | 67,250 | 5.1% |
| Bio, Nature & Agricultural | 52,859 | 4.0% |
| Physical & Health Sciences | 35,599 | 2.7% |
| Psychology | 72,693 | 5.5% |
| Social Sciences | 170,094 | 12.8% |
| Engineering | 71,842 | 5.4% |
| Multidisciplinary Studies | 11,825 | 0.9% |
| Science & Technology | 107,682 | 8.1% |
| Business | 247,620 | 18.6% |
| Education | 83,712 | 6.3% |
| Literature & Languages | 87,311 | 6.6% |
| Liberal Arts & History | 80,942 | 6.1% |
| Visual & Performing Arts | 116,889 | 8.8% |
| Communications | 70,172 | 5.3% |
| Arts & Humanities | 53,533 | 4.0% |
| Total | 1,330,023 | 100.0% |
Transportation & Commute in Area Code 347
Vehicle Availability by Sex in Area Code 347
The most prevalent vehicle ownership categories in Area Code 347 are males with no vehicle (398,271, accounting for 40.8%) and females with no vehicle (415,982, making up 43.5%).
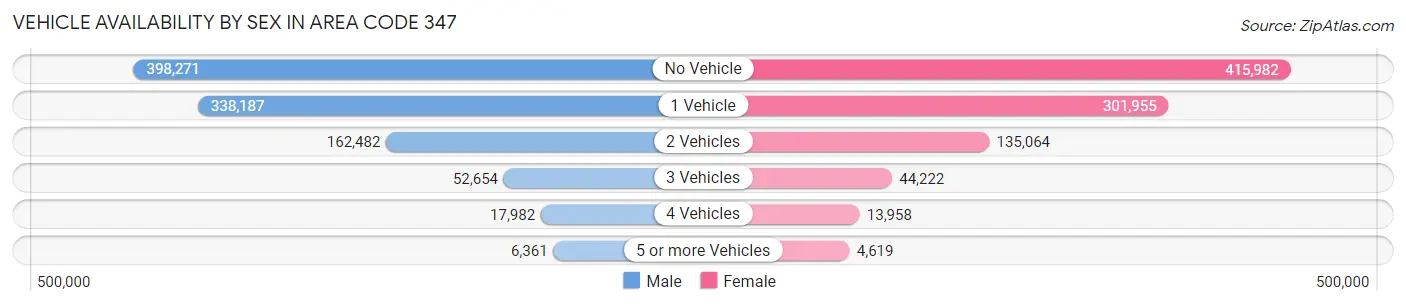
| Vehicles Available | Male | Female |
| No Vehicle | 398,271 (40.8%) | 415,982 (45.4%) |
| 1 Vehicle | 338,187 (34.6%) | 301,955 (33.0%) |
| 2 Vehicles | 162,482 (16.7%) | 135,064 (14.7%) |
| 3 Vehicles | 52,654 (5.4%) | 44,222 (4.8%) |
| 4 Vehicles | 17,982 (1.8%) | 13,958 (1.5%) |
| 5 or more Vehicles | 6,361 (0.6%) | 4,619 (0.5%) |
| Total | 975,937 (100.0%) | 915,800 (100.0%) |
Commute Time in Area Code 347
The most frequently occuring commute durations in Area Code 347 are 60 to 89 minutes (292,699 commuters, 17.7%), 30 to 34 minutes (264,442 commuters, 16.0%), and 45 to 59 minutes (247,391 commuters, 15.0%).
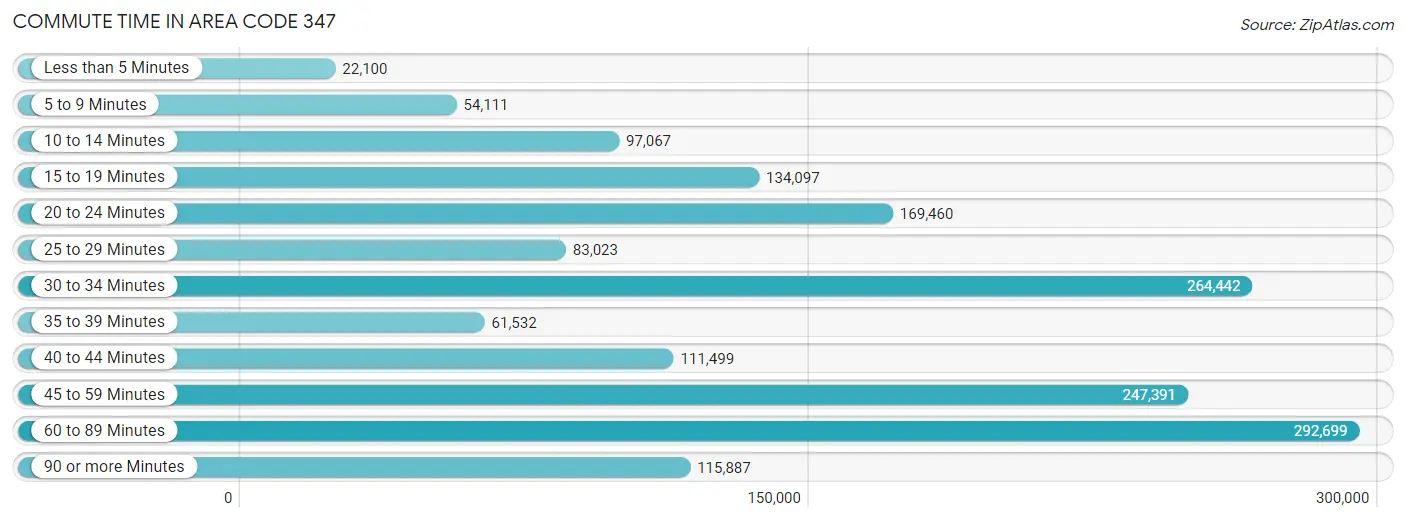
| Commute Time | # Commuters | % Commuters |
| Less than 5 Minutes | 22,100 | 1.3% |
| 5 to 9 Minutes | 54,111 | 3.3% |
| 10 to 14 Minutes | 97,067 | 5.9% |
| 15 to 19 Minutes | 134,097 | 8.1% |
| 20 to 24 Minutes | 169,460 | 10.2% |
| 25 to 29 Minutes | 83,023 | 5.0% |
| 30 to 34 Minutes | 264,442 | 16.0% |
| 35 to 39 Minutes | 61,532 | 3.7% |
| 40 to 44 Minutes | 111,499 | 6.7% |
| 45 to 59 Minutes | 247,391 | 15.0% |
| 60 to 89 Minutes | 292,699 | 17.7% |
| 90 or more Minutes | 115,887 | 7.0% |
Commute Time by Sex in Area Code 347
The most common commute times in Area Code 347 are 60 to 89 minutes (155,805 commuters, 18.2%) for males and 60 to 89 minutes (136,894 commuters, 17.2%) for females.
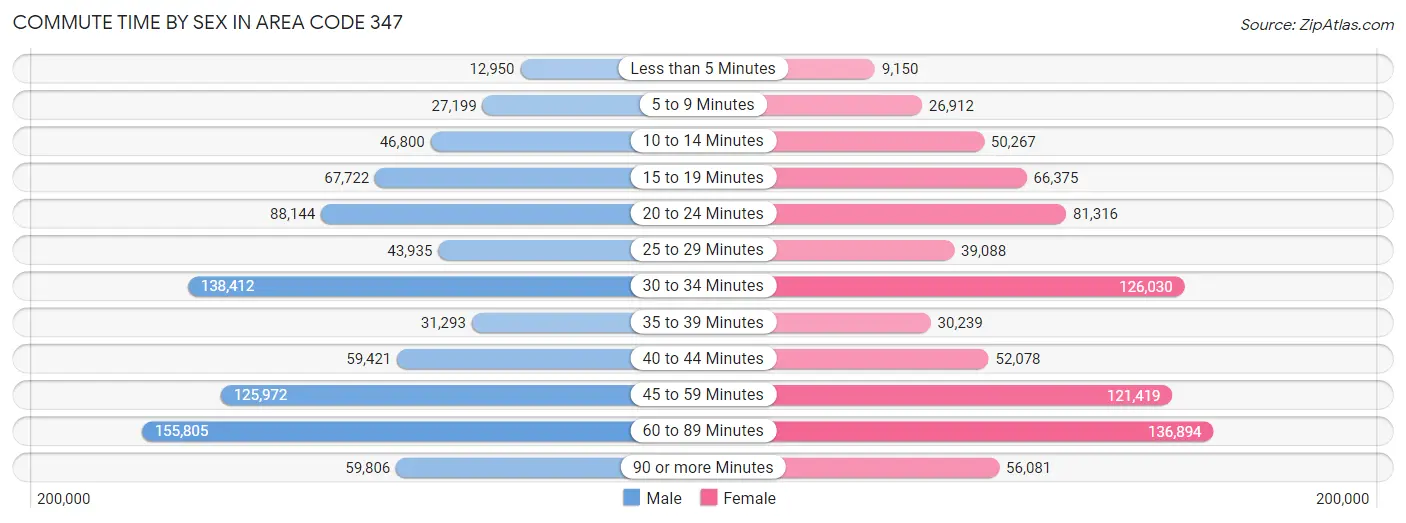
| Commute Time | Male | Female |
| Less than 5 Minutes | 12,950 (1.5%) | 9,150 (1.1%) |
| 5 to 9 Minutes | 27,199 (3.2%) | 26,912 (3.4%) |
| 10 to 14 Minutes | 46,800 (5.5%) | 50,267 (6.3%) |
| 15 to 19 Minutes | 67,722 (7.9%) | 66,375 (8.3%) |
| 20 to 24 Minutes | 88,144 (10.3%) | 81,316 (10.2%) |
| 25 to 29 Minutes | 43,935 (5.1%) | 39,088 (4.9%) |
| 30 to 34 Minutes | 138,412 (16.1%) | 126,030 (15.8%) |
| 35 to 39 Minutes | 31,293 (3.6%) | 30,239 (3.8%) |
| 40 to 44 Minutes | 59,421 (6.9%) | 52,078 (6.5%) |
| 45 to 59 Minutes | 125,972 (14.7%) | 121,419 (15.3%) |
| 60 to 89 Minutes | 155,805 (18.2%) | 136,894 (17.2%) |
| 90 or more Minutes | 59,806 (7.0%) | 56,081 (7.0%) |
Time of Departure to Work by Sex in Area Code 347
The most frequent times of departure to work in Area Code 347 are 8:00 AM to 8:29 AM (124,327, 14.5%) for males and 8:00 AM to 8:29 AM (142,110, 17.9%) for females.
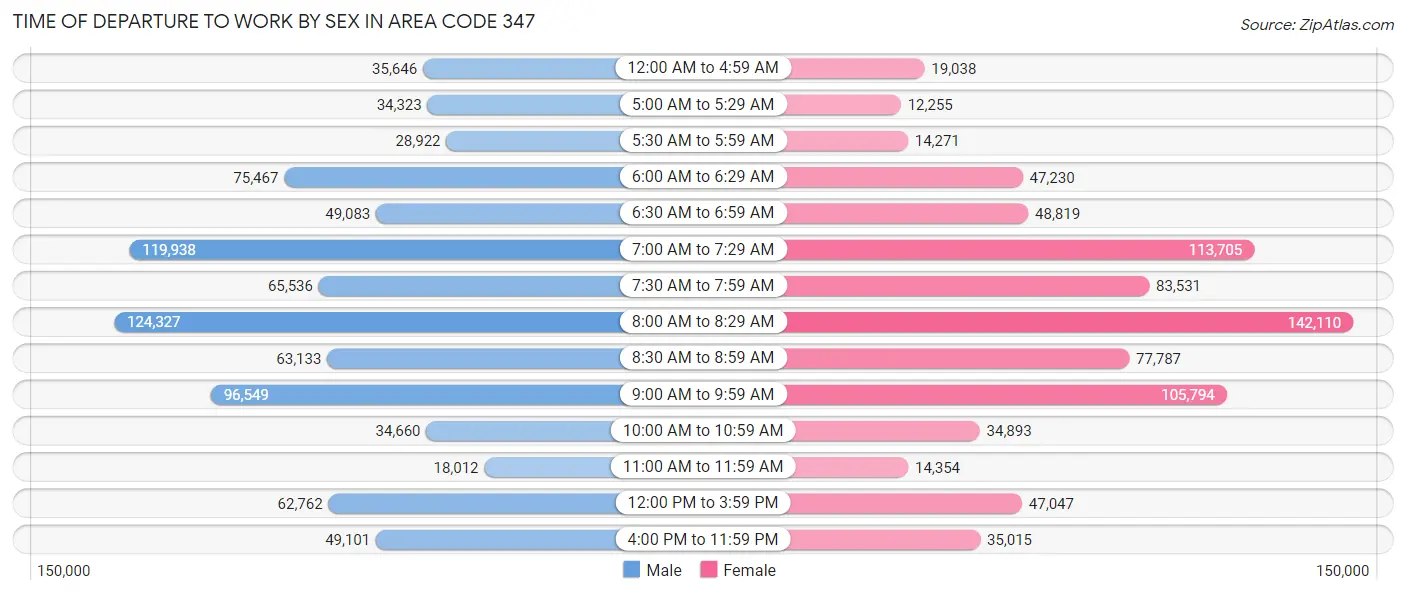
| Time of Departure | Male | Female |
| 12:00 AM to 4:59 AM | 35,646 (4.2%) | 19,038 (2.4%) |
| 5:00 AM to 5:29 AM | 34,323 (4.0%) | 12,255 (1.5%) |
| 5:30 AM to 5:59 AM | 28,922 (3.4%) | 14,271 (1.8%) |
| 6:00 AM to 6:29 AM | 75,467 (8.8%) | 47,230 (5.9%) |
| 6:30 AM to 6:59 AM | 49,083 (5.7%) | 48,819 (6.1%) |
| 7:00 AM to 7:29 AM | 119,938 (14.0%) | 113,705 (14.3%) |
| 7:30 AM to 7:59 AM | 65,536 (7.6%) | 83,531 (10.5%) |
| 8:00 AM to 8:29 AM | 124,327 (14.5%) | 142,110 (17.9%) |
| 8:30 AM to 8:59 AM | 63,133 (7.4%) | 77,787 (9.8%) |
| 9:00 AM to 9:59 AM | 96,549 (11.3%) | 105,794 (13.3%) |
| 10:00 AM to 10:59 AM | 34,660 (4.0%) | 34,893 (4.4%) |
| 11:00 AM to 11:59 AM | 18,012 (2.1%) | 14,354 (1.8%) |
| 12:00 PM to 3:59 PM | 62,762 (7.3%) | 47,047 (5.9%) |
| 4:00 PM to 11:59 PM | 49,101 (5.7%) | 35,015 (4.4%) |
| Total | 857,459 (100.0%) | 795,849 (100.0%) |
Housing Occupancy in Area Code 347
Occupancy by Ownership in Area Code 347
Of the total 1,538,541 dwellings in Area Code 347, owner-occupied units account for 547,664 (35.6%), while renter-occupied units make up 990,877 (64.4%).
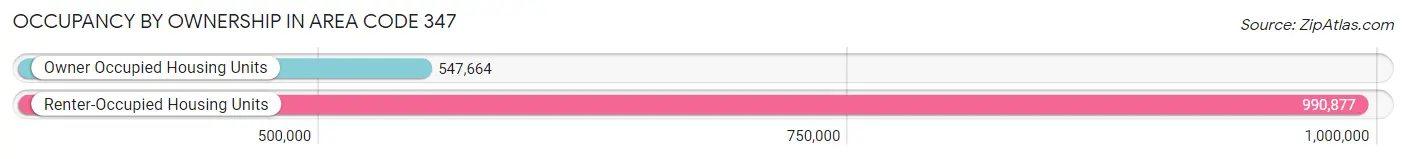
| Occupancy | # Housing Units | % Housing Units |
| Owner Occupied Housing Units | 547,664 | 35.6% |
| Renter-Occupied Housing Units | 990,877 | 64.4% |
| Total Occupied Housing Units | 1,538,541 | 100.0% |
Occupancy by Household Size in Area Code 347
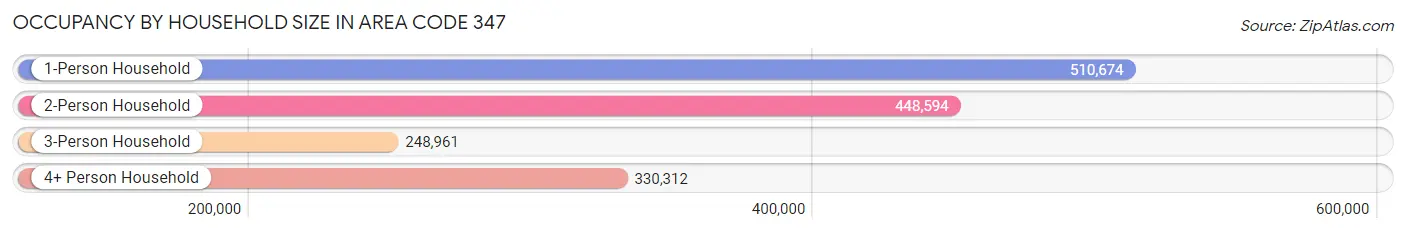
| Household Size | # Housing Units | % Housing Units |
| 1-Person Household | 510,674 | 33.2% |
| 2-Person Household | 448,594 | 29.2% |
| 3-Person Household | 248,961 | 16.2% |
| 4+ Person Household | 330,312 | 21.5% |
| Total Housing Units | 1,538,541 | 100.0% |
Occupancy by Ownership by Household Size in Area Code 347
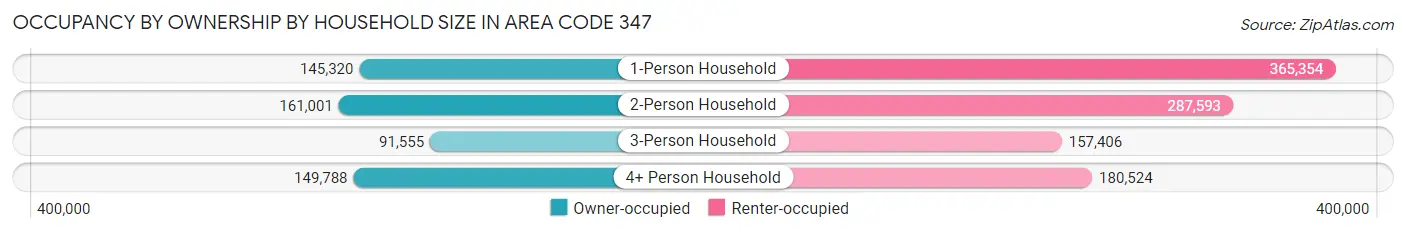
| Household Size | Owner-occupied | Renter-occupied |
| 1-Person Household | 145,320 (28.5%) | 365,354 (71.5%) |
| 2-Person Household | 161,001 (35.9%) | 287,593 (64.1%) |
| 3-Person Household | 91,555 (36.8%) | 157,406 (63.2%) |
| 4+ Person Household | 149,788 (45.4%) | 180,524 (54.6%) |
| Total Housing Units | 547,664 (35.6%) | 990,877 (64.4%) |
Occupancy by Educational Attainment in Area Code 347
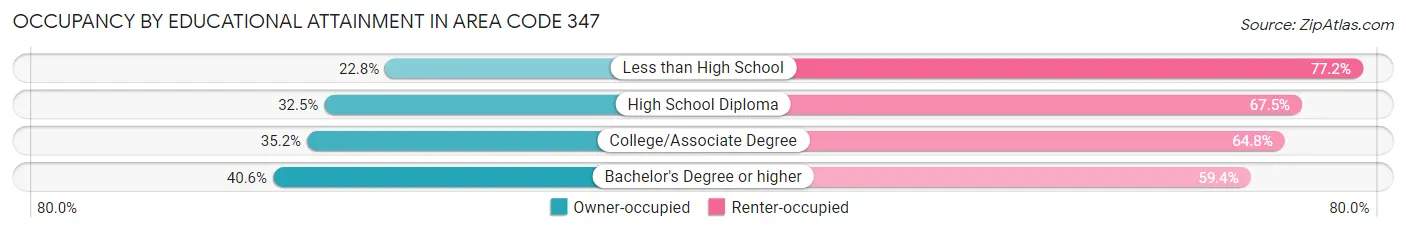
| Household Size | Owner-occupied | Renter-occupied |
| Less than High School | 46,233 (22.8%) | 156,259 (77.2%) |
| High School Diploma | 97,466 (32.5%) | 202,611 (67.5%) |
| College/Associate Degree | 109,661 (35.2%) | 201,741 (64.8%) |
| Bachelor's Degree or higher | 294,304 (40.6%) | 430,266 (59.4%) |
Occupancy by Age of Householder in Area Code 347
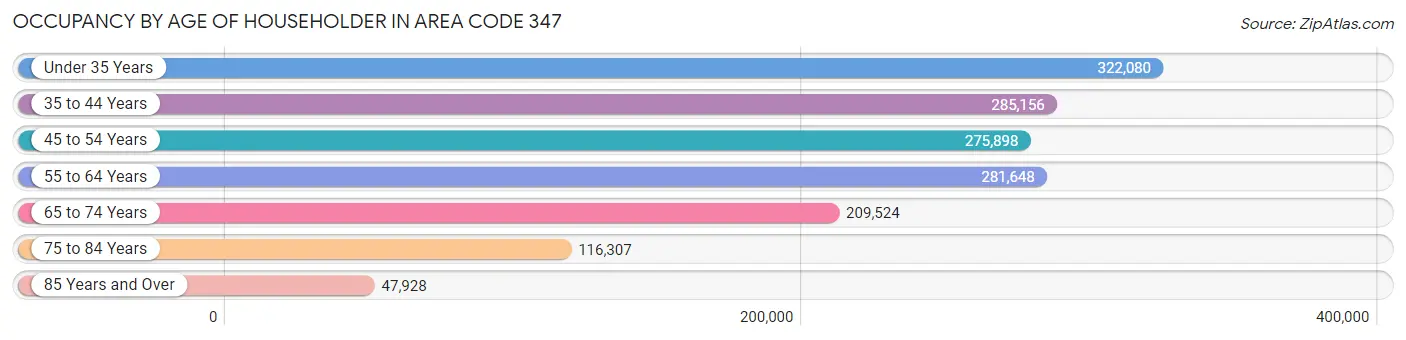
| Age Bracket | # Households | % Households |
| Under 35 Years | 322,080 | 20.9% |
| 35 to 44 Years | 285,156 | 18.5% |
| 45 to 54 Years | 275,898 | 17.9% |
| 55 to 64 Years | 281,648 | 18.3% |
| 65 to 74 Years | 209,524 | 13.6% |
| 75 to 84 Years | 116,307 | 7.6% |
| 85 Years and Over | 47,928 | 3.1% |
| Total | 1,538,541 | 100.0% |
Housing Finances in Area Code 347
Median Income by Occupancy in Area Code 347
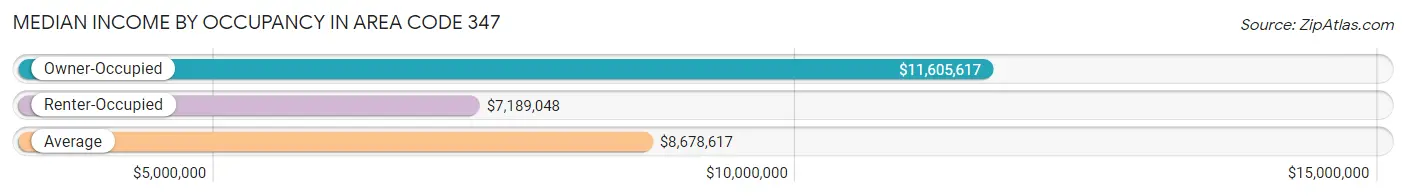
| Occupancy Type | # Households | Median Income |
| Owner-Occupied | 547,664 (35.6%) | $11,605,617 |
| Renter-Occupied | 990,877 (64.4%) | $7,189,048 |
| Average | 1,538,541 (100.0%) | $8,678,617 |
Occupancy by Householder Income Bracket in Area Code 347
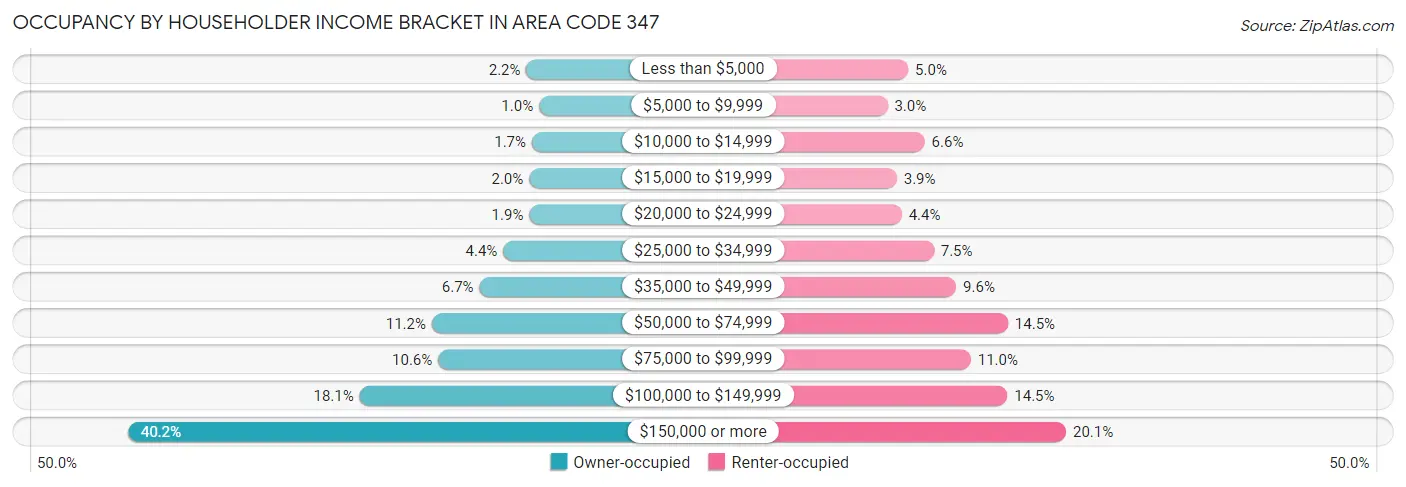
| Income Bracket | Owner-occupied | Renter-occupied |
| Less than $5,000 | 12,098 (2.2%) | 49,681 (5.0%) |
| $5,000 to $9,999 | 5,543 (1.0%) | 30,081 (3.0%) |
| $10,000 to $14,999 | 9,250 (1.7%) | 65,192 (6.6%) |
| $15,000 to $19,999 | 10,653 (1.9%) | 38,963 (3.9%) |
| $20,000 to $24,999 | 10,638 (1.9%) | 43,617 (4.4%) |
| $25,000 to $34,999 | 24,231 (4.4%) | 73,830 (7.4%) |
| $35,000 to $49,999 | 36,585 (6.7%) | 94,948 (9.6%) |
| $50,000 to $74,999 | 61,425 (11.2%) | 143,772 (14.5%) |
| $75,000 to $99,999 | 58,159 (10.6%) | 108,818 (11.0%) |
| $100,000 to $149,999 | 99,109 (18.1%) | 143,289 (14.5%) |
| $150,000 or more | 219,973 (40.2%) | 198,686 (20.1%) |
| Total | 547,664 (100.0%) | 990,877 (100.0%) |
Monthly Housing Cost Tiers in Area Code 347
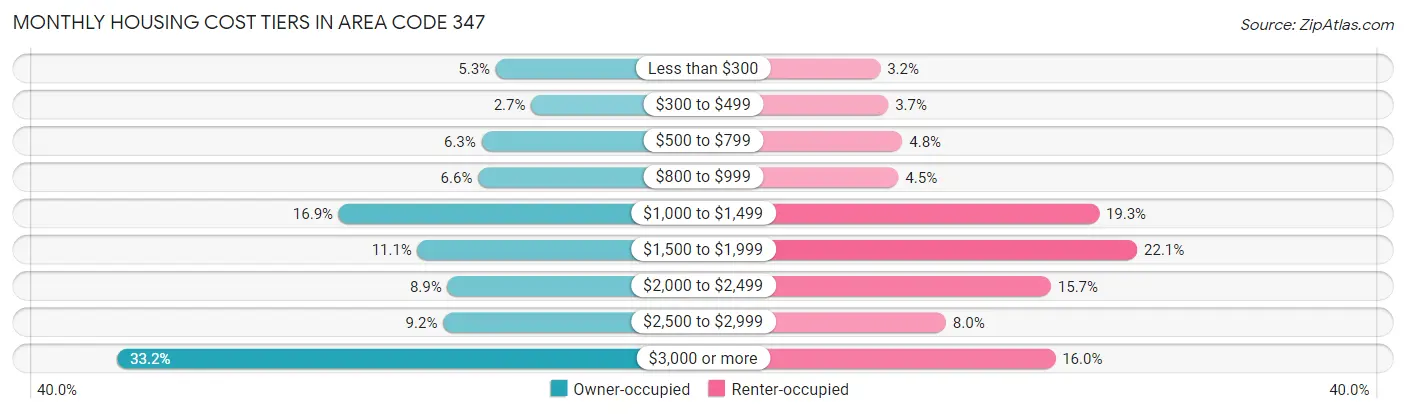
| Monthly Cost | Owner-occupied | Renter-occupied |
| Less than $300 | 28,998 (5.3%) | 31,253 (3.2%) |
| $300 to $499 | 14,662 (2.7%) | 37,030 (3.7%) |
| $500 to $799 | 34,730 (6.3%) | 47,379 (4.8%) |
| $800 to $999 | 36,103 (6.6%) | 44,460 (4.5%) |
| $1,000 to $1,499 | 92,265 (16.9%) | 190,883 (19.3%) |
| $1,500 to $1,999 | 60,491 (11.1%) | 218,733 (22.1%) |
| $2,000 to $2,499 | 48,471 (8.8%) | 155,757 (15.7%) |
| $2,500 to $2,999 | 50,237 (9.2%) | 79,141 (8.0%) |
| $3,000 or more | 181,707 (33.2%) | 158,939 (16.0%) |
| Total | 547,664 (100.0%) | 990,877 (100.0%) |
Physical Housing Characteristics in Area Code 347
Housing Structures in Area Code 347
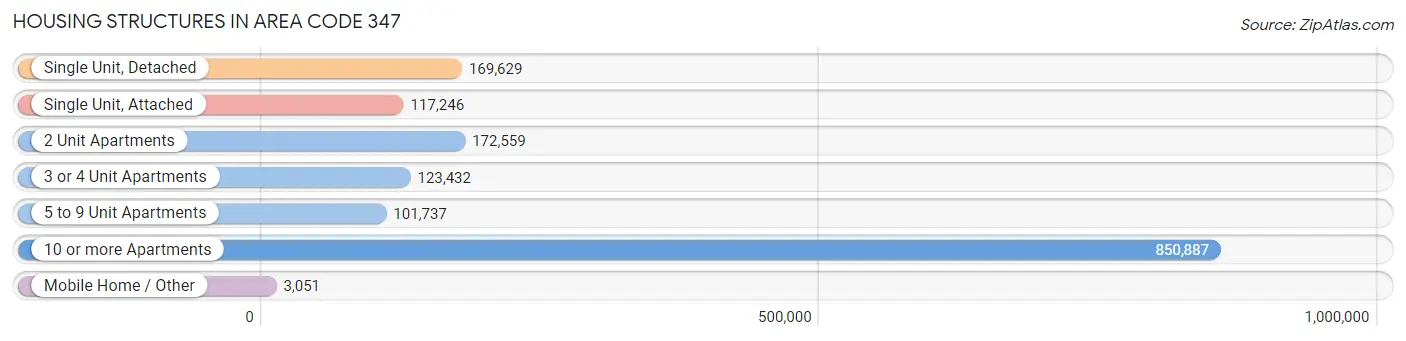
| Structure Type | # Housing Units | % Housing Units |
| Single Unit, Detached | 169,629 | 11.0% |
| Single Unit, Attached | 117,246 | 7.6% |
| 2 Unit Apartments | 172,559 | 11.2% |
| 3 or 4 Unit Apartments | 123,432 | 8.0% |
| 5 to 9 Unit Apartments | 101,737 | 6.6% |
| 10 or more Apartments | 850,887 | 55.3% |
| Mobile Home / Other | 3,051 | 0.2% |
| Total | 1,538,541 | 100.0% |
Housing Structures by Occupancy in Area Code 347
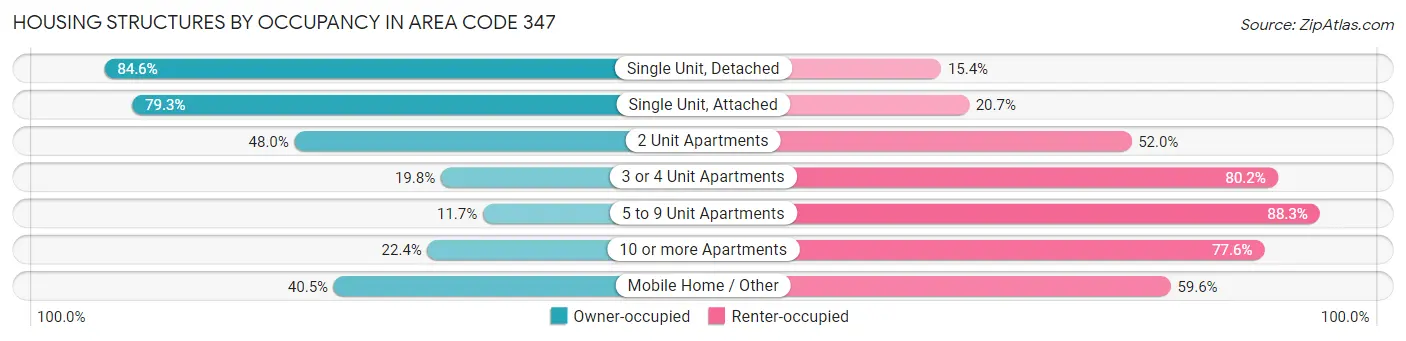
| Structure Type | Owner-occupied | Renter-occupied |
| Single Unit, Detached | 143,575 (84.6%) | 26,054 (15.4%) |
| Single Unit, Attached | 92,969 (79.3%) | 24,277 (20.7%) |
| 2 Unit Apartments | 82,839 (48.0%) | 89,720 (52.0%) |
| 3 or 4 Unit Apartments | 24,474 (19.8%) | 98,958 (80.2%) |
| 5 to 9 Unit Apartments | 11,936 (11.7%) | 89,801 (88.3%) |
| 10 or more Apartments | 190,637 (22.4%) | 660,250 (77.6%) |
| Mobile Home / Other | 1,234 (40.5%) | 1,817 (59.6%) |
| Total | 547,664 (35.6%) | 990,877 (64.4%) |
Housing Structures by Number of Rooms in Area Code 347
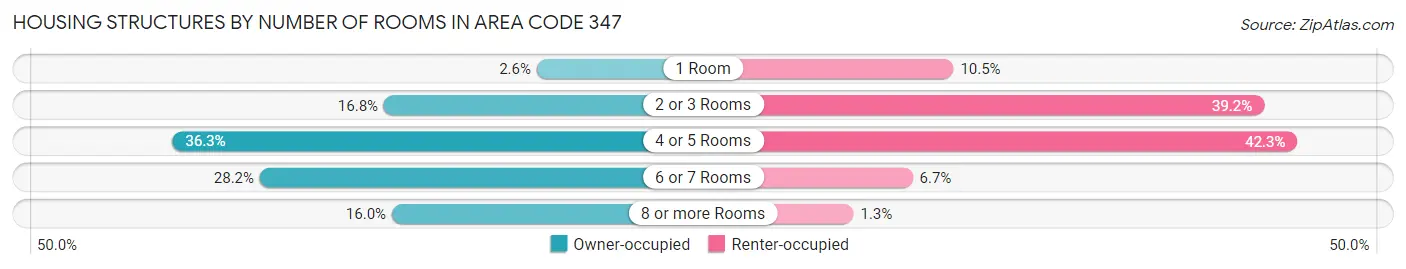
| Number of Rooms | Owner-occupied | Renter-occupied |
| 1 Room | 14,387 (2.6%) | 104,020 (10.5%) |
| 2 or 3 Rooms | 91,859 (16.8%) | 388,654 (39.2%) |
| 4 or 5 Rooms | 198,970 (36.3%) | 419,101 (42.3%) |
| 6 or 7 Rooms | 154,660 (28.2%) | 66,568 (6.7%) |
| 8 or more Rooms | 87,788 (16.0%) | 12,534 (1.3%) |
| Total | 547,664 (100.0%) | 990,877 (100.0%) |
Housing Structure by Heating Type in Area Code 347
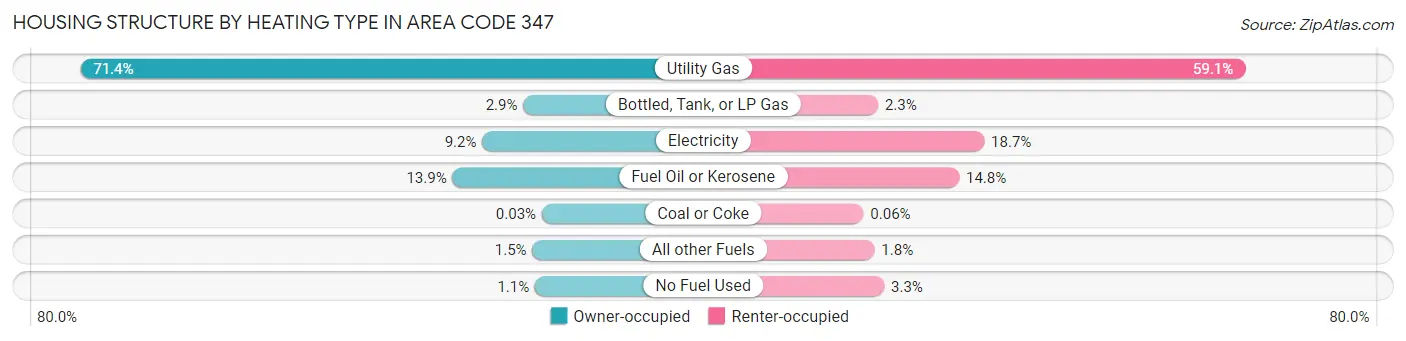
| Heating Type | Owner-occupied | Renter-occupied |
| Utility Gas | 390,957 (71.4%) | 585,112 (59.1%) |
| Bottled, Tank, or LP Gas | 15,928 (2.9%) | 22,895 (2.3%) |
| Electricity | 50,601 (9.2%) | 185,512 (18.7%) |
| Fuel Oil or Kerosene | 75,849 (13.9%) | 147,062 (14.8%) |
| Coal or Coke | 183 (0.0%) | 546 (0.1%) |
| All other Fuels | 8,157 (1.5%) | 17,447 (1.8%) |
| No Fuel Used | 5,989 (1.1%) | 32,303 (3.3%) |
| Total | 547,664 (100.0%) | 990,877 (100.0%) |
Household Vehicle Usage in Area Code 347
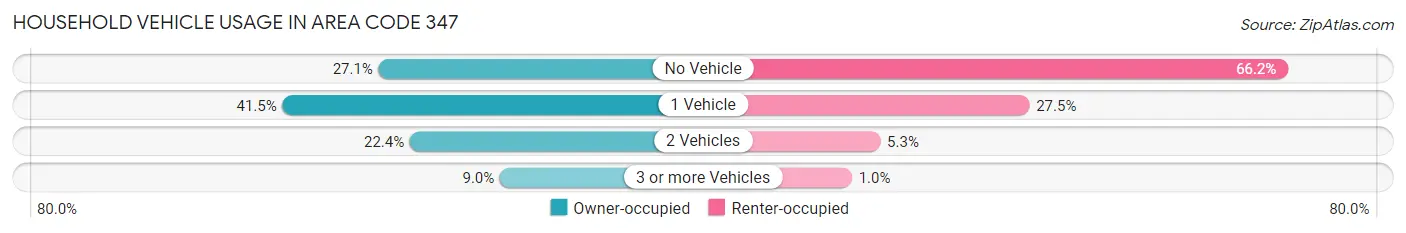
| Vehicles per Household | Owner-occupied | Renter-occupied |
| No Vehicle | 148,491 (27.1%) | 655,927 (66.2%) |
| 1 Vehicle | 227,113 (41.5%) | 272,761 (27.5%) |
| 2 Vehicles | 122,859 (22.4%) | 52,142 (5.3%) |
| 3 or more Vehicles | 49,201 (9.0%) | 10,047 (1.0%) |
| Total | 547,664 (100.0%) | 990,877 (100.0%) |
Real Estate & Mortgages in Area Code 347
Real Estate and Mortgage Overview in Area Code 347
| Characteristic | Without Mortgage | With Mortgage |
| Housing Units | 233,541 | 314,123 |
| Median Property Value | $65,234,505 | $74,508,903 |
| Median Household Income | $8,188,326 | $149,406 |
| Monthly Housing Costs | $94,136 | $169,284 |
| Real Estate Taxes | $541,325 | $33,940 |
Property Value by Mortgage Status in Area Code 347
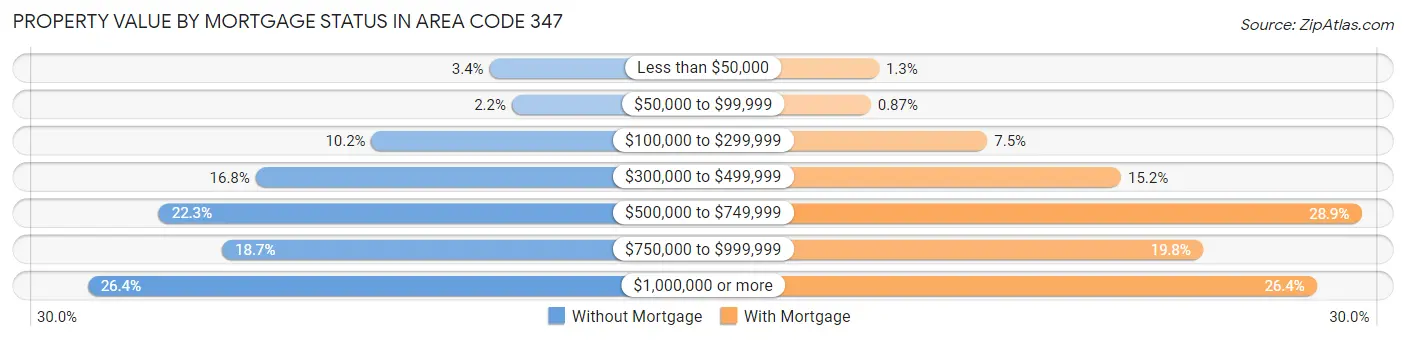
| Property Value | Without Mortgage | With Mortgage |
| Less than $50,000 | 8,028 (3.4%) | 4,197 (1.3%) |
| $50,000 to $99,999 | 5,044 (2.2%) | 2,748 (0.9%) |
| $100,000 to $299,999 | 23,767 (10.2%) | 23,660 (7.5%) |
| $300,000 to $499,999 | 39,238 (16.8%) | 47,653 (15.2%) |
| $500,000 to $749,999 | 52,150 (22.3%) | 90,788 (28.9%) |
| $750,000 to $999,999 | 43,694 (18.7%) | 62,317 (19.8%) |
| $1,000,000 or more | 61,620 (26.4%) | 82,760 (26.4%) |
| Total | 233,541 (100.0%) | 314,123 (100.0%) |
Household Income by Mortgage Status in Area Code 347
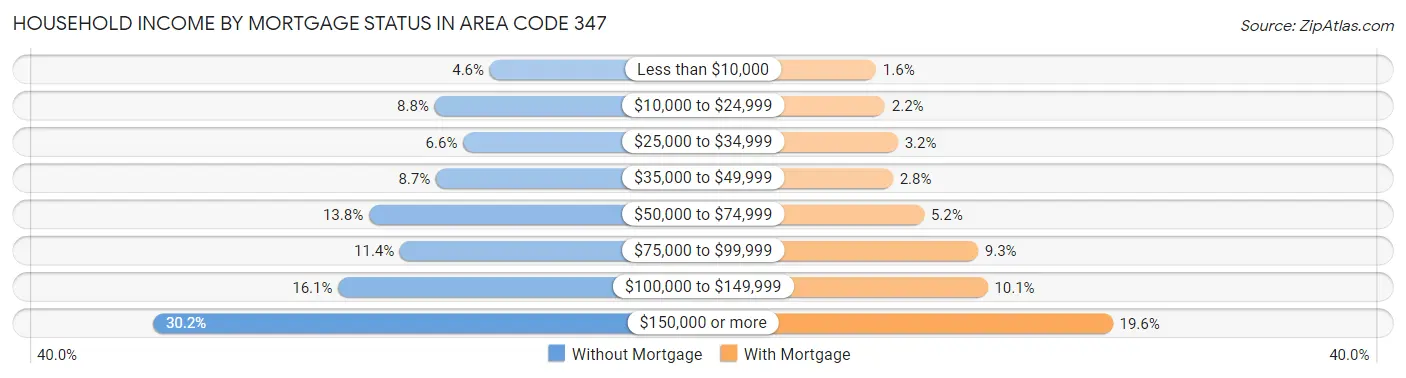
| Household Income | Without Mortgage | With Mortgage |
| Less than $10,000 | 10,626 (4.5%) | 4,880 (1.5%) |
| $10,000 to $24,999 | 20,443 (8.7%) | 7,015 (2.2%) |
| $25,000 to $34,999 | 15,356 (6.6%) | 10,098 (3.2%) |
| $35,000 to $49,999 | 20,212 (8.6%) | 8,875 (2.8%) |
| $50,000 to $74,999 | 32,137 (13.8%) | 16,373 (5.2%) |
| $75,000 to $99,999 | 26,600 (11.4%) | 29,288 (9.3%) |
| $100,000 to $149,999 | 37,600 (16.1%) | 31,559 (10.1%) |
| $150,000 or more | 70,567 (30.2%) | 61,509 (19.6%) |
| Total | 233,541 (100.0%) | 314,123 (100.0%) |
Property Value to Household Income Ratio in Area Code 347
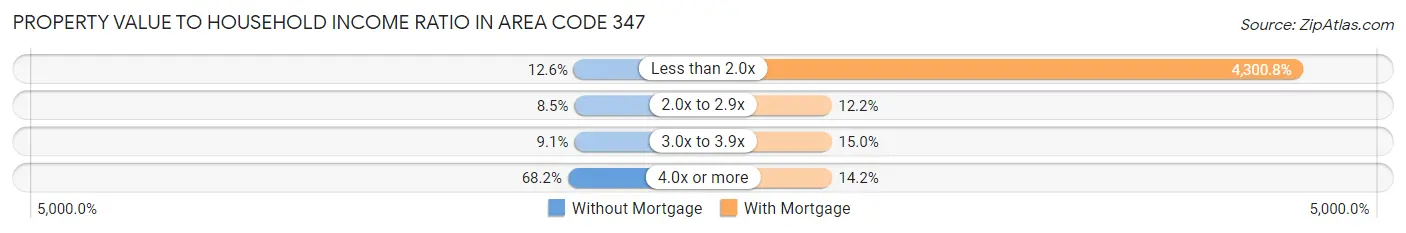
| Value-to-Income Ratio | Without Mortgage | With Mortgage |
| Less than 2.0x | 29,507 (12.6%) | 13,509,838 (4,300.8%) |
| 2.0x to 2.9x | 19,840 (8.5%) | 38,446 (12.2%) |
| 3.0x to 3.9x | 21,166 (9.1%) | 47,143 (15.0%) |
| 4.0x or more | 159,342 (68.2%) | 44,626 (14.2%) |
| Total | 233,541 (100.0%) | 314,123 (100.0%) |
Real Estate Taxes by Mortgage Status in Area Code 347
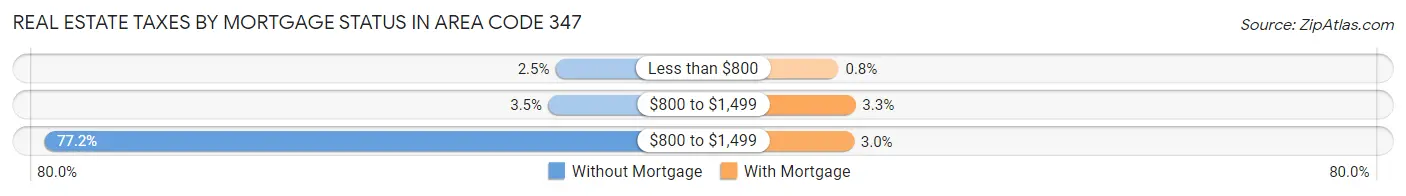
| Property Taxes | Without Mortgage | With Mortgage |
| Less than $800 | 5,731 (2.5%) | 2,528 (0.8%) |
| $800 to $1,499 | 8,258 (3.5%) | 10,286 (3.3%) |
| $800 to $1,499 | 180,232 (77.2%) | 9,541 (3.0%) |
| Total | 233,541 (100.0%) | 314,123 (100.0%) |
Health & Disability in Area Code 347
Health Insurance Coverage by Age in Area Code 347
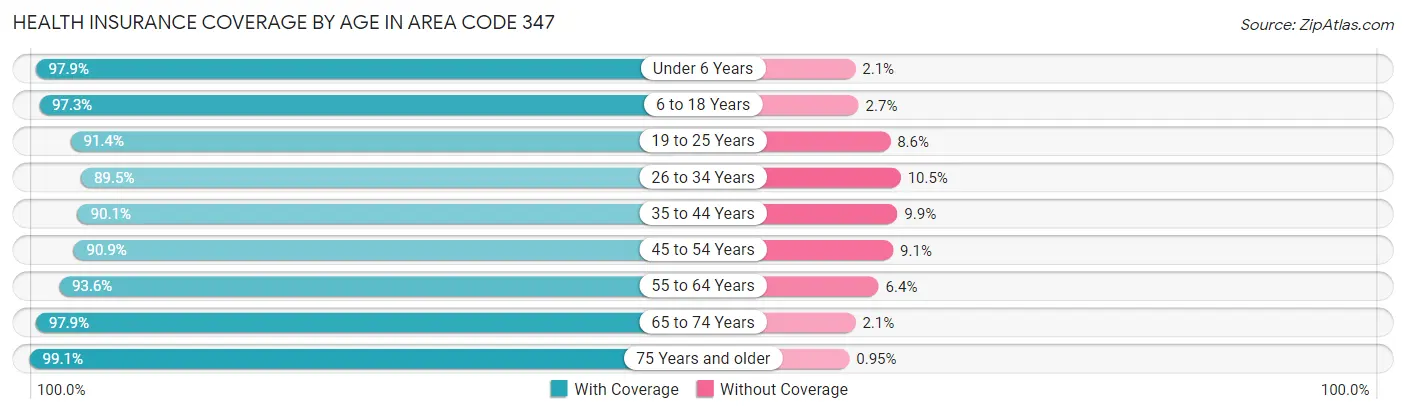
| Age Bracket | With Coverage | Without Coverage |
| Under 6 Years | 268,811 (97.9%) | 5,652 (2.1%) |
| 6 to 18 Years | 541,279 (97.3%) | 14,914 (2.7%) |
| 19 to 25 Years | 328,026 (91.4%) | 30,705 (8.6%) |
| 26 to 34 Years | 564,908 (89.5%) | 66,407 (10.5%) |
| 35 to 44 Years | 497,170 (90.1%) | 54,629 (9.9%) |
| 45 to 54 Years | 453,047 (90.9%) | 45,436 (9.1%) |
| 55 to 64 Years | 448,360 (93.6%) | 30,694 (6.4%) |
| 65 to 74 Years | 337,037 (97.9%) | 7,203 (2.1%) |
| 75 Years and older | 249,071 (99.1%) | 2,401 (0.9%) |
| Total | 3,687,709 (93.5%) | 258,041 (6.5%) |
Health Insurance Coverage by Citizenship Status in Area Code 347
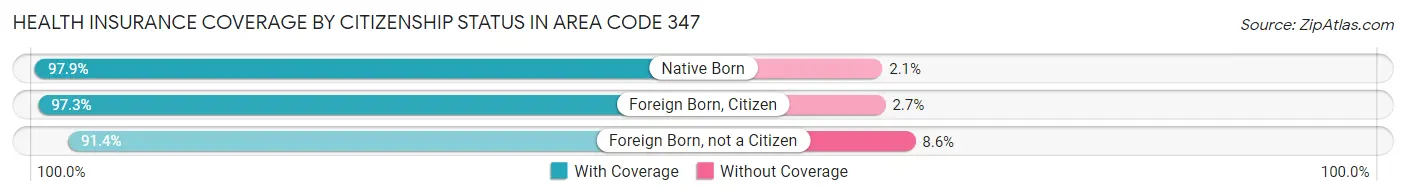
| Citizenship Status | With Coverage | Without Coverage |
| Native Born | 268,811 (97.9%) | 5,652 (2.1%) |
| Foreign Born, Citizen | 541,279 (97.3%) | 14,914 (2.7%) |
| Foreign Born, not a Citizen | 328,026 (91.4%) | 30,705 (8.6%) |
Health Insurance Coverage by Household Income in Area Code 347
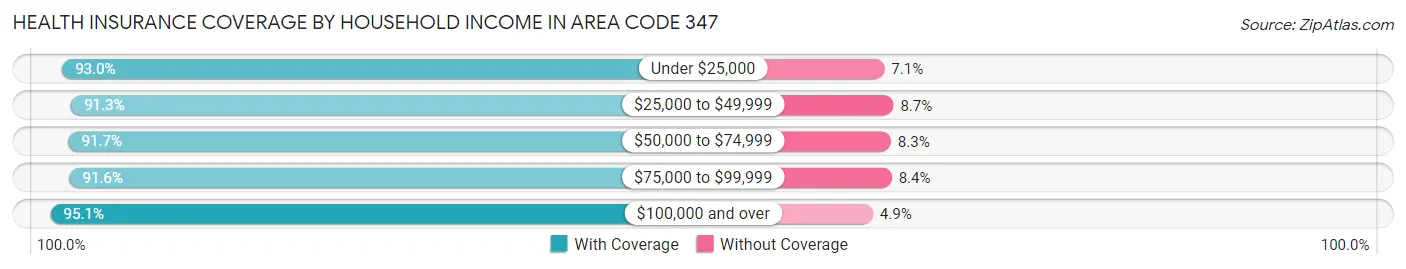
| Household Income | With Coverage | Without Coverage |
| Under $25,000 | 468,958 (92.9%) | 35,554 (7.0%) |
| $25,000 to $49,999 | 481,849 (91.3%) | 46,119 (8.7%) |
| $50,000 to $74,999 | 468,921 (91.7%) | 42,226 (8.3%) |
| $75,000 to $99,999 | 395,288 (91.6%) | 36,338 (8.4%) |
| $100,000 and over | 1,813,990 (95.1%) | 93,283 (4.9%) |
Public vs Private Health Insurance Coverage by Age in Area Code 347
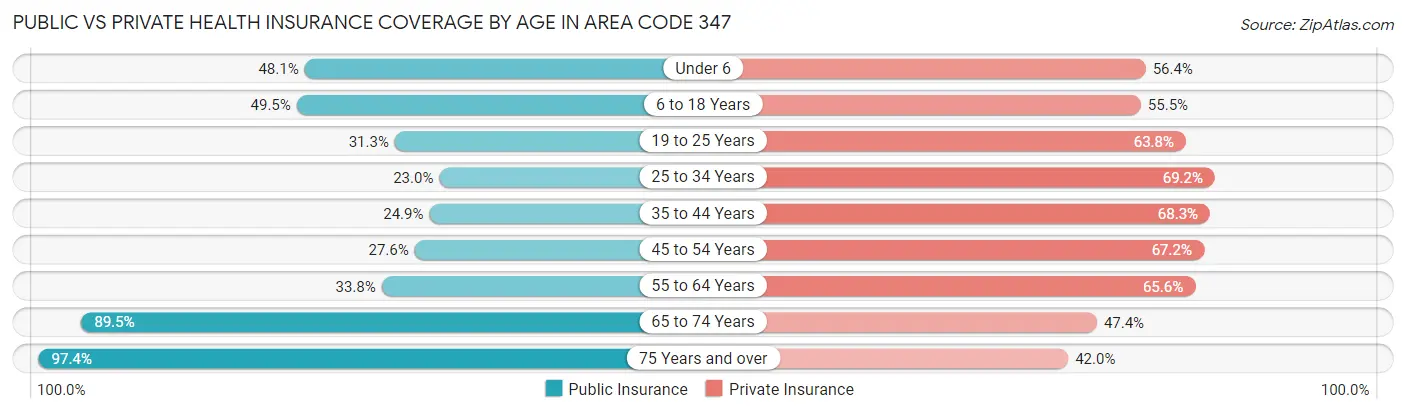
| Age Bracket | Public Insurance | Private Insurance |
| Under 6 | 131,889 (48.0%) | 154,821 (56.4%) |
| 6 to 18 Years | 275,385 (49.5%) | 308,820 (55.5%) |
| 19 to 25 Years | 112,281 (31.3%) | 229,030 (63.8%) |
| 25 to 34 Years | 145,465 (23.0%) | 437,034 (69.2%) |
| 35 to 44 Years | 137,329 (24.9%) | 376,970 (68.3%) |
| 45 to 54 Years | 137,692 (27.6%) | 334,869 (67.2%) |
| 55 to 64 Years | 161,671 (33.8%) | 314,002 (65.5%) |
| 65 to 74 Years | 307,992 (89.5%) | 163,039 (47.4%) |
| 75 Years and over | 244,916 (97.4%) | 105,688 (42.0%) |
| Total | 1,654,620 (41.9%) | 2,424,273 (61.4%) |
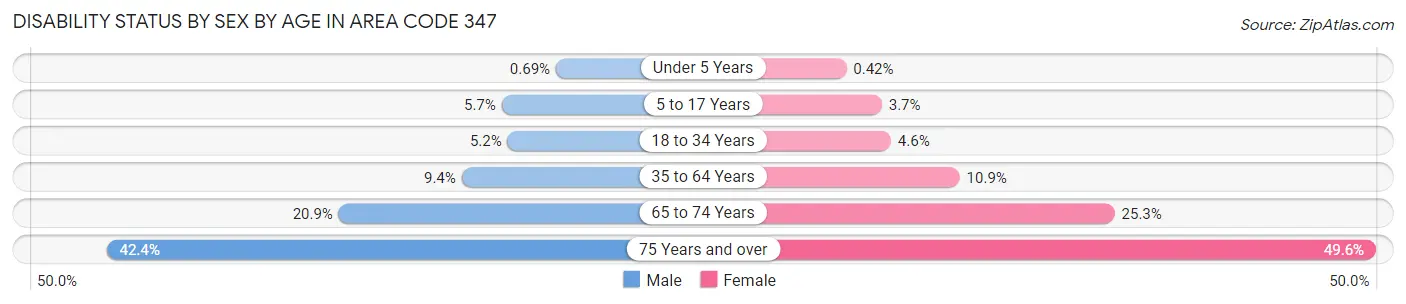
Disability Status by Sex by Age in Area Code 347
| Age Bracket | Male | Female |
| Under 5 Years | 826 (0.7%) | 473 (0.4%) |
| 5 to 17 Years | 16,192 (5.7%) | 10,150 (3.7%) |
| 18 to 34 Years | 26,201 (5.2%) | 23,974 (4.6%) |
| 35 to 64 Years | 70,430 (9.4%) | 85,697 (10.9%) |
| 65 to 74 Years | 32,219 (20.8%) | 48,027 (25.3%) |
| 75 Years and over | 41,156 (42.4%) | 76,526 (49.6%) |
Disability Class by Sex by Age in Area Code 347
Disability Class: Hearing Difficulty
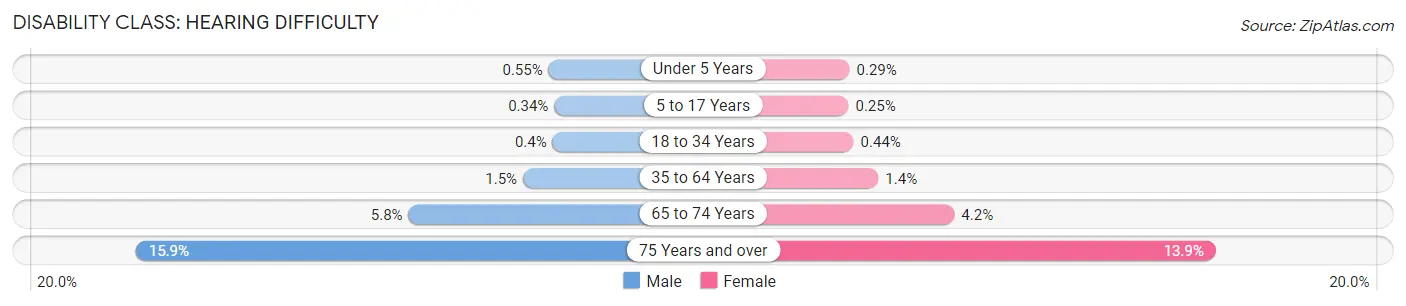
| Age Bracket | Male | Female |
| Under 5 Years | 661 (0.5%) | 323 (0.3%) |
| 5 to 17 Years | 970 (0.3%) | 690 (0.3%) |
| 18 to 34 Years | 2,042 (0.4%) | 2,325 (0.4%) |
| 35 to 64 Years | 11,171 (1.5%) | 10,632 (1.4%) |
| 65 to 74 Years | 8,885 (5.8%) | 7,929 (4.2%) |
| 75 Years and over | 15,405 (15.9%) | 21,429 (13.9%) |
Disability Class: Vision Difficulty
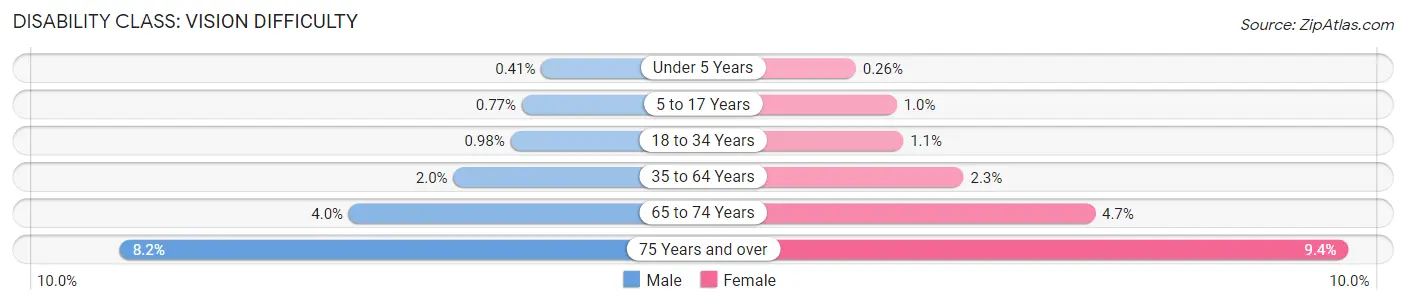
| Age Bracket | Male | Female |
| Under 5 Years | 489 (0.4%) | 290 (0.3%) |
| 5 to 17 Years | 2,181 (0.8%) | 2,795 (1.0%) |
| 18 to 34 Years | 4,961 (1.0%) | 5,971 (1.1%) |
| 35 to 64 Years | 15,201 (2.0%) | 17,696 (2.3%) |
| 65 to 74 Years | 6,145 (4.0%) | 8,914 (4.7%) |
| 75 Years and over | 7,995 (8.2%) | 14,517 (9.4%) |
Disability Class: Cognitive Difficulty
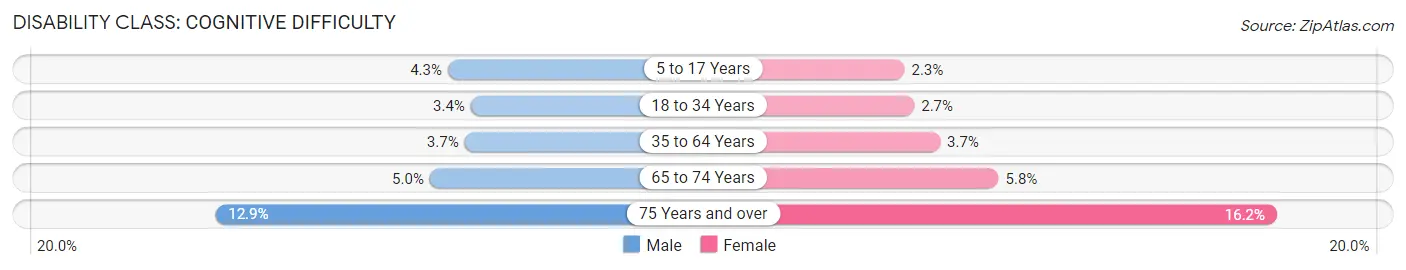
| Age Bracket | Male | Female |
| 5 to 17 Years | 12,142 (4.3%) | 6,372 (2.3%) |
| 18 to 34 Years | 17,378 (3.4%) | 14,151 (2.7%) |
| 35 to 64 Years | 27,402 (3.7%) | 28,622 (3.6%) |
| 65 to 74 Years | 7,659 (5.0%) | 11,047 (5.8%) |
| 75 Years and over | 12,542 (12.9%) | 24,932 (16.2%) |
Disability Class: Ambulatory Difficulty
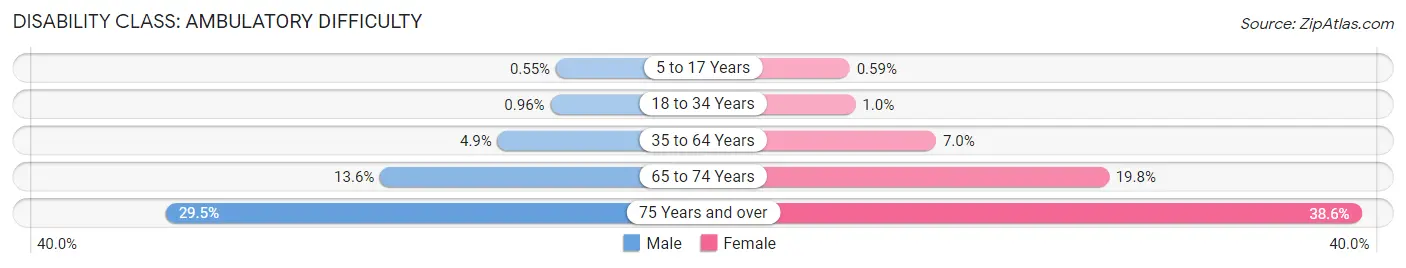
| Age Bracket | Male | Female |
| 5 to 17 Years | 1,568 (0.5%) | 1,602 (0.6%) |
| 18 to 34 Years | 4,863 (1.0%) | 5,328 (1.0%) |
| 35 to 64 Years | 36,404 (4.9%) | 54,762 (7.0%) |
| 65 to 74 Years | 21,011 (13.6%) | 37,596 (19.8%) |
| 75 Years and over | 28,659 (29.5%) | 59,553 (38.6%) |
Disability Class: Self-Care Difficulty
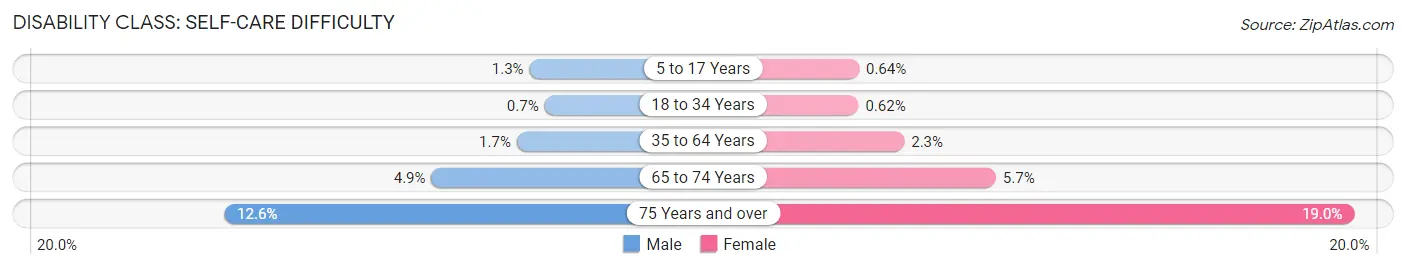
| Age Bracket | Male | Female |
| 5 to 17 Years | 3,555 (1.3%) | 1,758 (0.6%) |
| 18 to 34 Years | 3,548 (0.7%) | 3,271 (0.6%) |
| 35 to 64 Years | 12,945 (1.7%) | 18,165 (2.3%) |
| 65 to 74 Years | 7,572 (4.9%) | 10,851 (5.7%) |
| 75 Years and over | 12,225 (12.6%) | 29,359 (19.0%) |
Technology Access in Area Code 347
Computing Device Access in Area Code 347
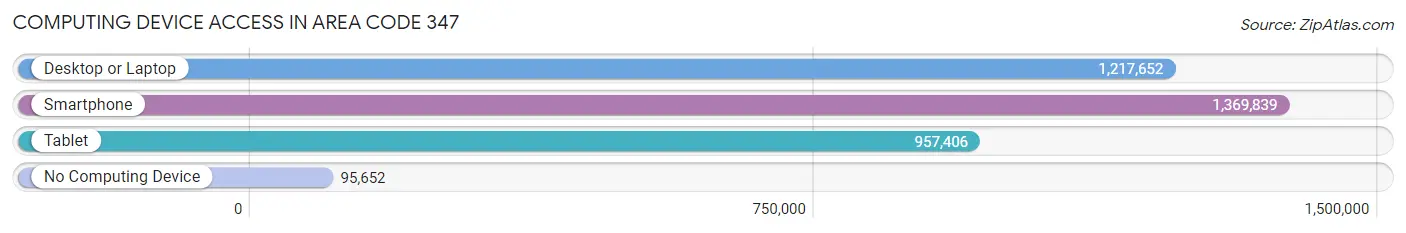
| Device Type | # Households | % Households |
| Desktop or Laptop | 1,217,652 | 79.1% |
| Smartphone | 1,369,839 | 89.0% |
| Tablet | 957,406 | 62.2% |
| No Computing Device | 95,652 | 6.2% |
| Total | 1,538,541 | 100.0% |
Internet Access in Area Code 347
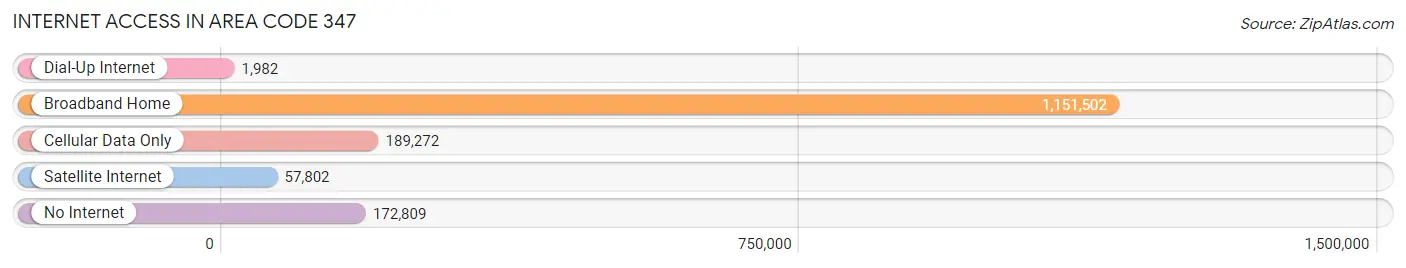
| Internet Type | # Households | % Households |
| Dial-Up Internet | 1,982 | 0.1% |
| Broadband Home | 1,151,502 | 74.8% |
| Cellular Data Only | 189,272 | 12.3% |
| Satellite Internet | 57,802 | 3.8% |
| No Internet | 172,809 | 11.2% |
| Total | 1,538,541 | 100.0% |
Area Code 347 Summary
Geography
Area code 347 is a telephone area code in the North American Numbering Plan (NANP) for the boroughs of Brooklyn, Queens, and the Bronx in New York City. It was created in 2000 as an overlay to area codes 718, 646, and 917.
Social
Area code 347 is a popular area code in New York City, as it is associated with the city's vibrant culture and diverse population. It is home to many different ethnicities, cultures, and lifestyles, making it a great place to live and work.
Economics
Area code 347 is a major economic hub in New York City, with many businesses and industries located in the area. It is home to a variety of industries, including finance, technology, media, and entertainment. The area is also home to many start-ups and small businesses, making it a great place to start a business.
Demographics
Area code 347 is home to a diverse population, with a variety of ethnicities, cultures, and lifestyles. The population is largely made up of young professionals, students, and immigrants. The area is also home to a large number of families, making it a great place to raise a family.
Common Questions
What is Per Capita Income in Area Code 347?
Per Capita income in Area Code 347 is $64,583.
What is the Median Family Income in Area Code 347?
Median Family Income in Area Code 347 is $127,055.
What is the Median Household income in Area Code 347?
Median Household Income in Area Code 347 is $102,101.
What is Income or Wage Gap in Area Code 347?
Income or Wage Gap in Area Code 347 is 21.2%.
Women in Area Code 347 earn 78.8 cents for every dollar earned by a man.
What is Family Income Deficit in Area Code 347?
Family Income Deficit in Area Code 347 is $10,710.
Families that are below poverty line in Area Code 347 earn $10,710 less on average than the poverty threshold level.
What is Inequality or Gini Index in Area Code 347?
Inequality or Gini Index in Area Code 347 is 41.18.
What is the Total Population of Area Code 347?
Total Population of Area Code 347 is 3,974,977.
What is the Total Male Population of Area Code 347?
Total Male Population of Area Code 347 is 1,923,494.
What is the Total Female Population of Area Code 347?
Total Female Population of Area Code 347 is 2,051,483.
What is the Ratio of Males per 100 Females in Area Code 347?
There are 93.76 Males per 100 Females in Area Code 347.
What is the Ratio of Females per 100 Males in Area Code 347?
There are 106.65 Females per 100 Males in Area Code 347.
What is the Median Population Age in Area Code 347?
Median Population Age in Area Code 347 is 38.6 Years.
What is the Average Family Size in Area Code 347
Average Family Size in Area Code 347 is 3.2 People.
What is the Average Household Size in Area Code 347
Average Household Size in Area Code 347 is 2.6 People.
How Large is the Labor Force in Area Code 347?
There are 2,159,997 People in the Labor Forcein in Area Code 347.
What is the Percentage of People in the Labor Force in Area Code 347?
66.1% of People are in the Labor Force in Area Code 347.
What is the Unemployment Rate in Area Code 347?
Unemployment Rate in Area Code 347 is 6.8%.