Area Code 646 Map & Demographics
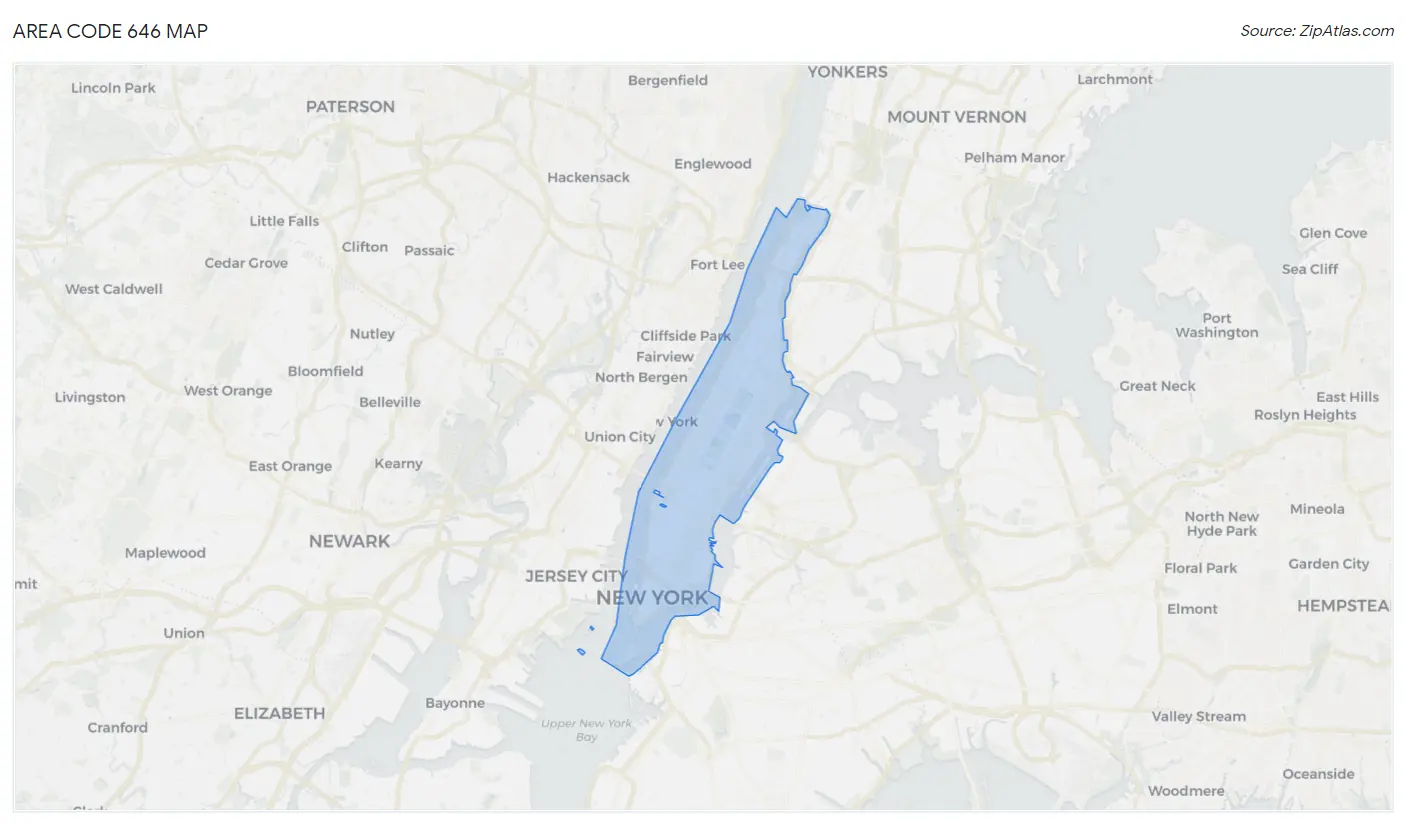
Area Code 646 Map
Area Code 646 Overview
$109,745
PER CAPITA INCOME
$159,202
AVG FAMILY INCOME
$121,031
AVG HOUSEHOLD INCOME
26.6%
WAGE / INCOME GAP [ % ]
73.4¢/ $1
WAGE / INCOME GAP [ $ ]
$10,978
FAMILY INCOME DEFICIT
22.00
INEQUALITY / GINI INDEX
1,744,020
TOTAL POPULATION
828,349
MALE POPULATION
915,671
FEMALE POPULATION
90.46
MALES / 100 FEMALES
110.54
FEMALES / 100 MALES
38.8
MEDIAN AGE
3.0
AVG FAMILY SIZE
2.1
AVG HOUSEHOLD SIZE
1,026,788
LABOR FORCE [ PEOPLE ]
69.0%
PERCENT IN LABOR FORCE
7.1%
UNEMPLOYMENT RATE
Income in Area Code 646
Income Overview in Area Code 646
Per Capita Income in Area Code 646 is $109,745, while median incomes of families and households are $159,202 and $121,031 respectively.
| Characteristic | Number | Measure |
| Per Capita Income | 1,744,020 | $109,745 |
| Median Family Income | 349,531 | $159,202 |
| Mean Family Income | 349,531 | $10,406,961 |
| Median Household Income | 783,618 | $121,031 |
| Mean Household Income | 783,618 | $9,290,700 |
| Income Deficit | 349,531 | $10,978 |
| Wage / Income Gap (%) | 1,744,020 | 26.64% |
| Wage / Income Gap ($) | 1,744,020 | 73.36¢ per $1 |
| Gini / Inequality Index | 1,744,020 | 22.00 |
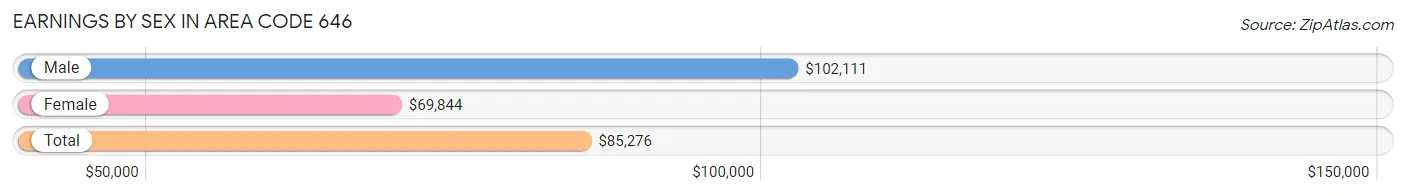
Earnings by Sex in Area Code 646
Average Earnings in Area Code 646 are $85,276, $102,111 for men and $69,844 for women, a difference of 31.6%.
| Sex | Number | Average Earnings |
| Male | 502,688 (49.6%) | $102,111 |
| Female | 509,714 (50.3%) | $69,844 |
| Total | 1,012,402 (100.0%) | $85,276 |
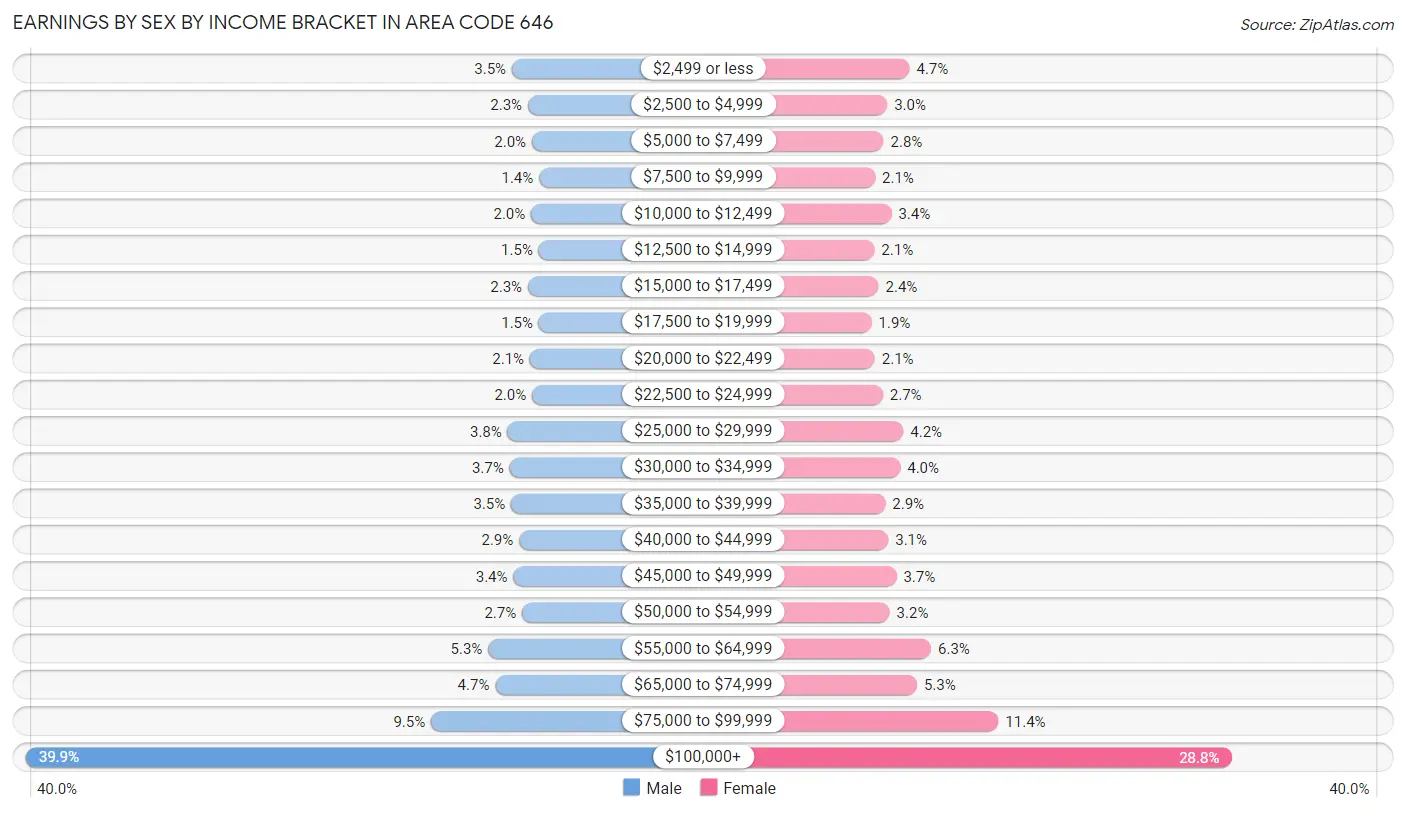
Earnings by Sex by Income Bracket in Area Code 646
The most common earnings brackets in Area Code 646 are $100,000+ for men (200,615 | 39.9%) and $100,000+ for women (146,826 | 28.8%).
| Income | Male | Female |
| $2,499 or less | 17,478 (3.5%) | 23,949 (4.7%) |
| $2,500 to $4,999 | 11,465 (2.3%) | 15,427 (3.0%) |
| $5,000 to $7,499 | 9,975 (2.0%) | 14,088 (2.8%) |
| $7,500 to $9,999 | 7,247 (1.4%) | 10,790 (2.1%) |
| $10,000 to $12,499 | 10,266 (2.0%) | 17,085 (3.4%) |
| $12,500 to $14,999 | 7,406 (1.5%) | 10,527 (2.1%) |
| $15,000 to $17,499 | 11,466 (2.3%) | 12,154 (2.4%) |
| $17,500 to $19,999 | 7,325 (1.5%) | 9,485 (1.9%) |
| $20,000 to $22,499 | 10,723 (2.1%) | 10,712 (2.1%) |
| $22,500 to $24,999 | 9,881 (2.0%) | 13,738 (2.7%) |
| $25,000 to $29,999 | 19,098 (3.8%) | 21,625 (4.2%) |
| $30,000 to $34,999 | 18,381 (3.7%) | 20,445 (4.0%) |
| $35,000 to $39,999 | 17,794 (3.5%) | 14,751 (2.9%) |
| $40,000 to $44,999 | 14,767 (2.9%) | 15,863 (3.1%) |
| $45,000 to $49,999 | 16,927 (3.4%) | 18,947 (3.7%) |
| $50,000 to $54,999 | 13,689 (2.7%) | 16,343 (3.2%) |
| $55,000 to $64,999 | 26,430 (5.3%) | 32,238 (6.3%) |
| $65,000 to $74,999 | 23,784 (4.7%) | 26,818 (5.3%) |
| $75,000 to $99,999 | 47,971 (9.5%) | 57,903 (11.4%) |
| $100,000+ | 200,615 (39.9%) | 146,826 (28.8%) |
| Total | 502,688 (100.0%) | 509,714 (100.0%) |
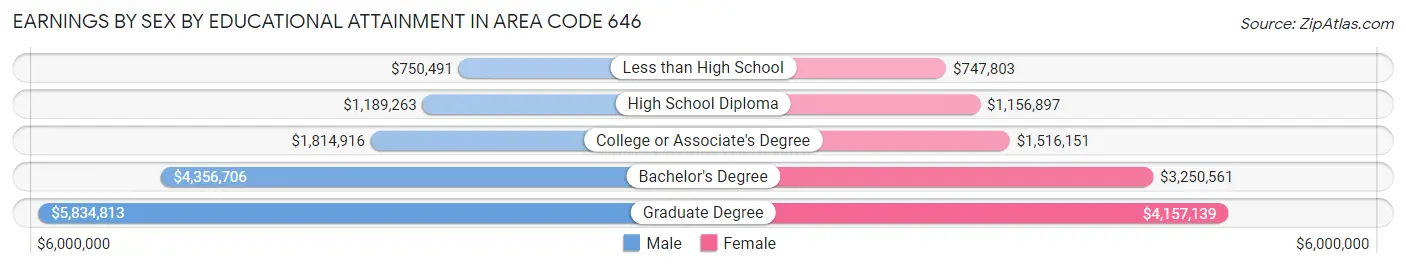
Earnings by Sex by Educational Attainment in Area Code 646
Average earnings in Area Code 646 are $4,601,887 for men and $3,196,299 for women, a difference of 30.5%. Men with an educational attainment of graduate degree enjoy the highest average annual earnings of $5,834,813, while those with less than high school education earn the least with $750,491. Women with an educational attainment of graduate degree earn the most with the average annual earnings of $4,157,139, while those with less than high school education have the smallest earnings of $747,803.
| Educational Attainment | Male Income | Female Income |
| Less than High School | $750,491 | $747,803 |
| High School Diploma | $1,189,263 | $1,156,897 |
| College or Associate's Degree | $1,814,916 | $1,516,151 |
| Bachelor's Degree | $4,356,706 | $3,250,561 |
| Graduate Degree | $5,834,813 | $4,157,139 |
| Total | $4,601,887 | $3,196,299 |
Family Income in Area Code 646
Family Income Brackets in Area Code 646
According to the Area Code 646 family income data, there are 5,980,825 families falling into the $200,000+ income range, which is the most common income bracket and makes up 1,711.1% of all families. Conversely, the $10,000 to $14,999 income bracket is the least frequent group with only 367,707 families (105.2%) belonging to this category.
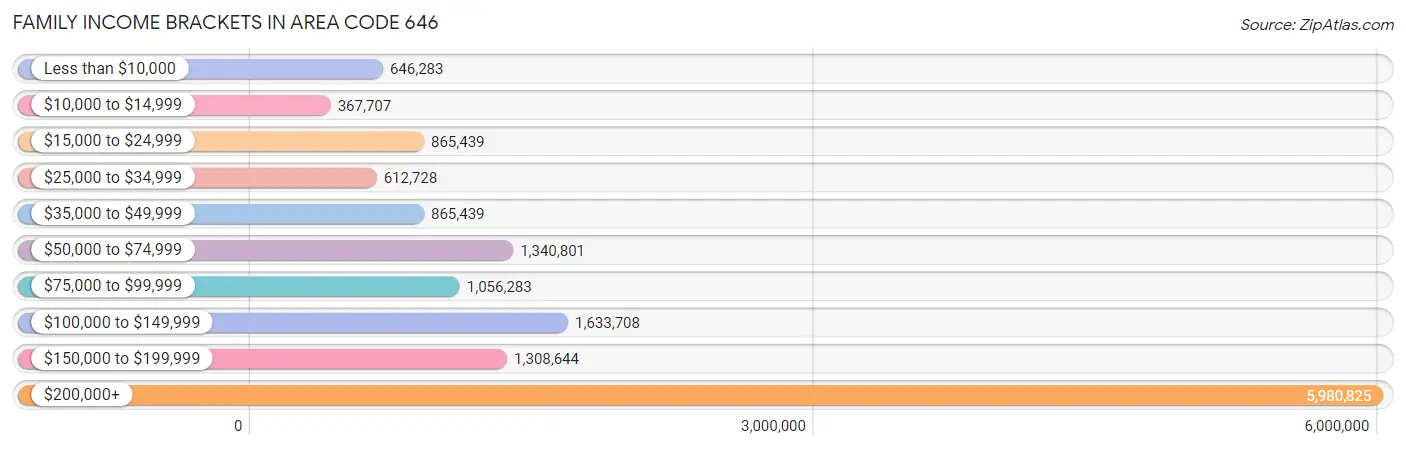
| Income Bracket | # Families | % Families |
| Less than $10,000 | 646,283 | 184.9% |
| $10,000 to $14,999 | 367,707 | 105.2% |
| $15,000 to $24,999 | 865,439 | 247.6% |
| $25,000 to $34,999 | 612,728 | 175.3% |
| $35,000 to $49,999 | 865,439 | 247.6% |
| $50,000 to $74,999 | 1,340,801 | 383.6% |
| $75,000 to $99,999 | 1,056,283 | 302.2% |
| $100,000 to $149,999 | 1,633,708 | 467.4% |
| $150,000 to $199,999 | 1,308,644 | 374.4% |
| $200,000+ | 5,980,825 | 1,711.1% |
Family Income by Famaliy Size in Area Code 646
4-person families (55,137 | 15.8%) account for the highest median family income in Area Code 646 with $170,727 per family, while 2-person families (174,671 | 50.0%) have the highest median income of $71,519 per family member.
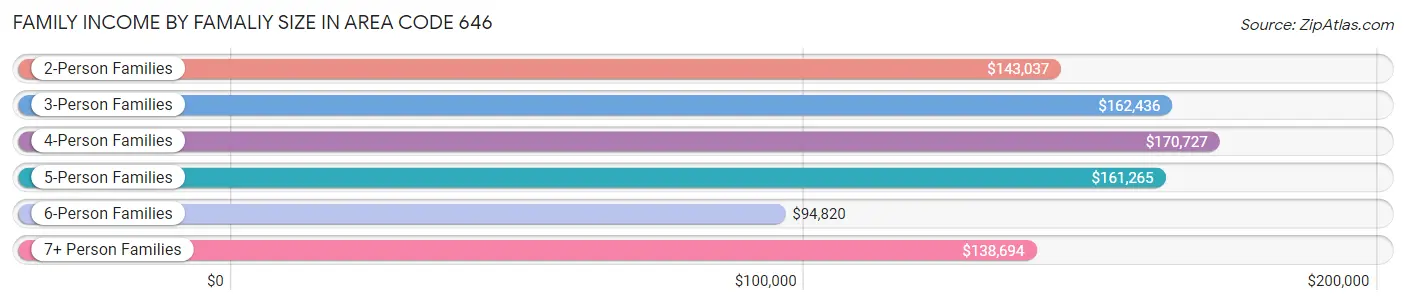
| Income Bracket | # Families | Median Income |
| 2-Person Families | 174,671 (50.0%) | $143,037 |
| 3-Person Families | 88,375 (25.3%) | $162,436 |
| 4-Person Families | 55,137 (15.8%) | $170,727 |
| 5-Person Families | 20,049 (5.7%) | $161,265 |
| 6-Person Families | 7,170 (2.1%) | $94,820 |
| 7+ Person Families | 4,129 (1.2%) | $138,694 |
| Total | 349,531 (100.0%) | $159,202 |
Family Income by Number of Earners in Area Code 646
The median family income in Area Code 646 is $159,202, with families comprising 2 earners (157,149) having the highest median family income of $196,802, while families with no earners (48,221) have the lowest median family income of $50,312, accounting for 45.0% and 13.8% of families, respectively.
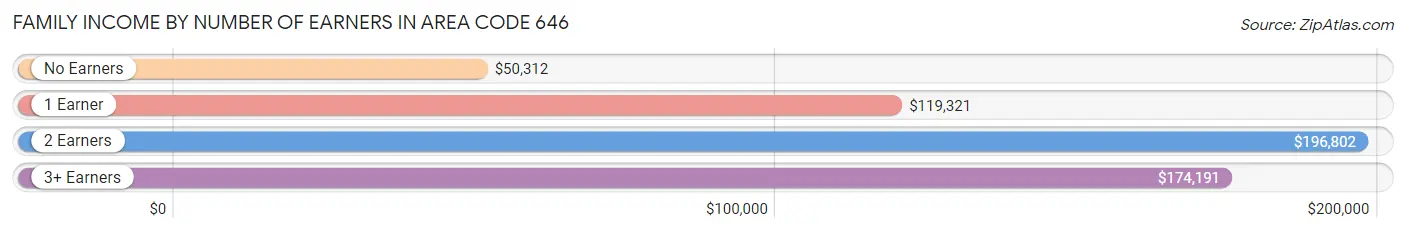
| Number of Earners | # Families | Median Income |
| No Earners | 48,221 (13.8%) | $50,312 |
| 1 Earner | 119,886 (34.3%) | $119,321 |
| 2 Earners | 157,149 (45.0%) | $196,802 |
| 3+ Earners | 24,275 (7.0%) | $174,191 |
| Total | 349,531 (100.0%) | $159,202 |
Household Income in Area Code 646
Household Income Brackets in Area Code 646
With 9,787,389 households falling in the category, the $200,000+ income range is the most frequent in Area Code 646, accounting for 1,249.0% of all households. In contrast, only 1,559,400 households (199.0%) fall into the $10,000 to $14,999 income bracket, making it the least populous group.
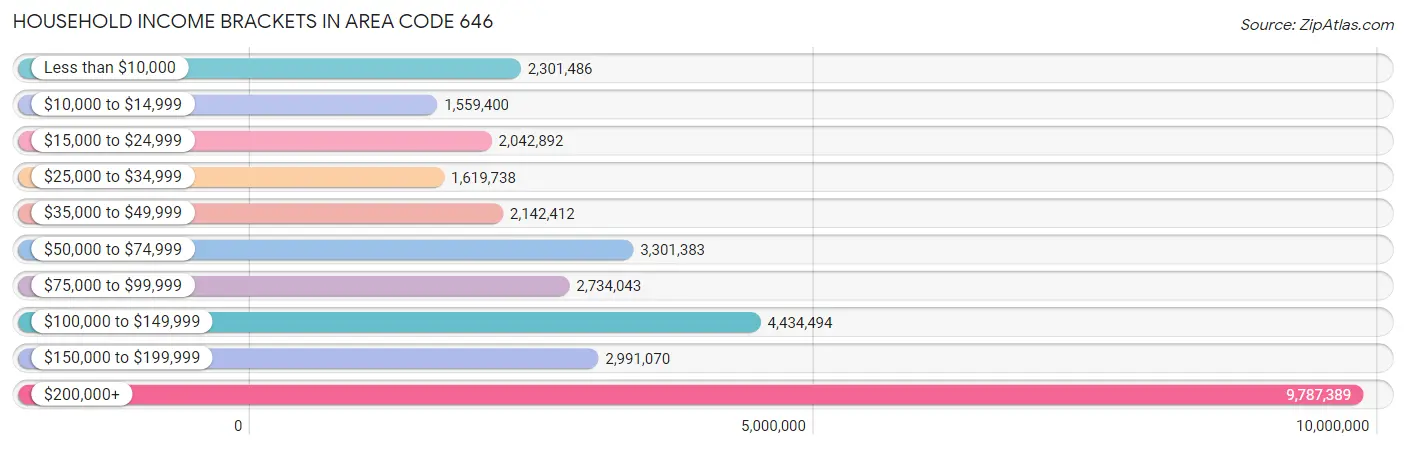
| Income Bracket | # Households | % Households |
| Less than $10,000 | 2,301,486 | 293.7% |
| $10,000 to $14,999 | 1,559,400 | 199.0% |
| $15,000 to $24,999 | 2,042,892 | 260.7% |
| $25,000 to $34,999 | 1,619,738 | 206.7% |
| $35,000 to $49,999 | 2,142,412 | 273.4% |
| $50,000 to $74,999 | 3,301,383 | 421.3% |
| $75,000 to $99,999 | 2,734,043 | 348.9% |
| $100,000 to $149,999 | 4,434,494 | 565.9% |
| $150,000 to $199,999 | 2,991,070 | 381.7% |
| $200,000+ | 9,787,389 | 1,249.0% |
Household Income by Householder Age in Area Code 646
The median household income in Area Code 646 is $121,031, with the highest median household income of $142,528 found in the 25 to 44 years age bracket for the primary householder. A total of 312,554 households (39.9%) fall into this category. Meanwhile, the 65+ years age bracket for the primary householder has the lowest median household income of $66,720, with 191,380 households (24.4%) in this group.
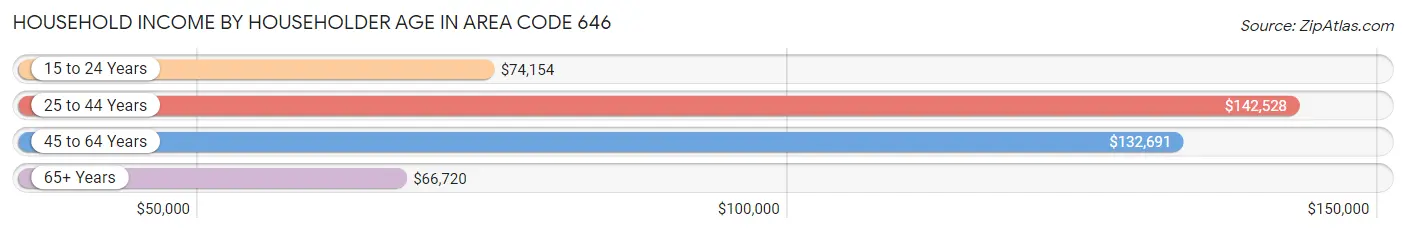
| Income Bracket | # Households | Median Income |
| 15 to 24 Years | 25,449 (3.3%) | $74,154 |
| 25 to 44 Years | 312,554 (39.9%) | $142,528 |
| 45 to 64 Years | 254,235 (32.4%) | $132,691 |
| 65+ Years | 191,380 (24.4%) | $66,720 |
| Total | 783,618 (100.0%) | $121,031 |
Poverty in Area Code 646
Income Below Poverty by Sex and Age in Area Code 646
With 16.3% poverty level for males and 19.1% for females among the residents of Area Code 646, 12 to 14 year old males and 18 to 24 year old females are the most vulnerable to poverty, with 6,666 males (28.7%) and 19,419 females (30.2%) in their respective age groups living below the poverty level.
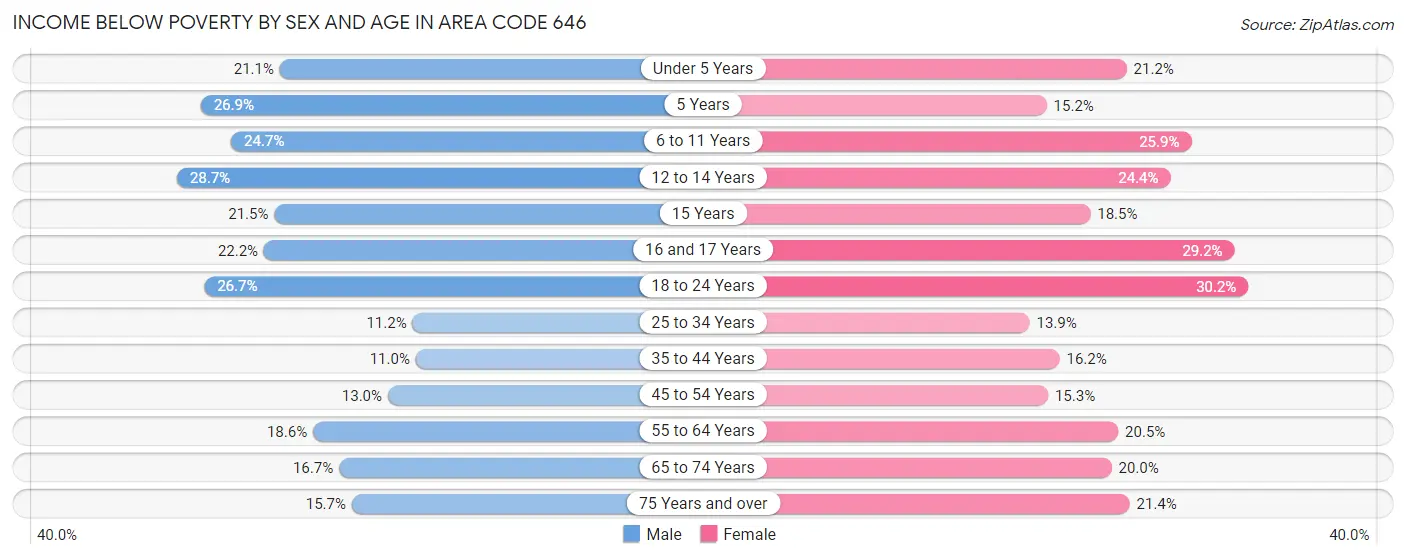
| Age Bracket | Male | Female |
| Under 5 Years | 9,084 (21.0%) | 9,432 (21.1%) |
| 5 Years | 1,957 (26.9%) | 1,025 (15.2%) |
| 6 to 11 Years | 11,237 (24.7%) | 11,314 (25.9%) |
| 12 to 14 Years | 6,666 (28.7%) | 5,684 (24.4%) |
| 15 Years | 1,478 (21.5%) | 1,459 (18.4%) |
| 16 and 17 Years | 2,999 (22.2%) | 3,949 (29.1%) |
| 18 to 24 Years | 15,764 (26.7%) | 19,419 (30.2%) |
| 25 to 34 Years | 19,309 (11.2%) | 26,108 (13.9%) |
| 35 to 44 Years | 13,935 (11.0%) | 20,899 (16.2%) |
| 45 to 54 Years | 13,925 (13.0%) | 16,227 (15.3%) |
| 55 to 64 Years | 17,705 (18.6%) | 20,714 (20.5%) |
| 65 to 74 Years | 10,779 (16.7%) | 17,437 (20.0%) |
| 75 Years and over | 6,952 (15.7%) | 15,599 (21.4%) |
| Total | 131,790 (16.3%) | 169,266 (19.1%) |
Income Above Poverty by Sex and Age in Area Code 646
According to the poverty statistics in Area Code 646, males aged 35 to 44 years and females aged 25 to 34 years are the age groups that are most secure financially, with 89.0% of males and 86.1% of females in these age groups living above the poverty line.
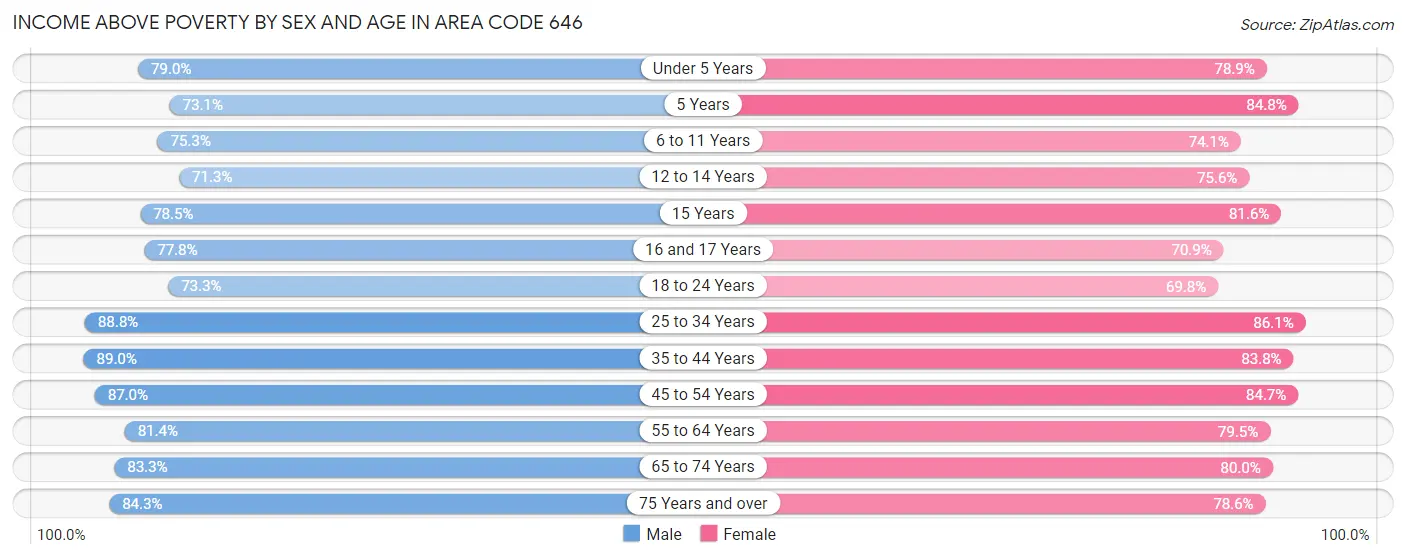
| Age Bracket | Male | Female |
| Under 5 Years | 34,065 (78.9%) | 35,173 (78.8%) |
| 5 Years | 5,312 (73.1%) | 5,714 (84.8%) |
| 6 to 11 Years | 34,309 (75.3%) | 32,308 (74.1%) |
| 12 to 14 Years | 16,571 (71.3%) | 17,623 (75.6%) |
| 15 Years | 5,409 (78.5%) | 6,448 (81.6%) |
| 16 and 17 Years | 10,489 (77.8%) | 9,596 (70.9%) |
| 18 to 24 Years | 43,368 (73.3%) | 44,948 (69.8%) |
| 25 to 34 Years | 153,149 (88.8%) | 161,201 (86.1%) |
| 35 to 44 Years | 113,198 (89.0%) | 108,364 (83.8%) |
| 45 to 54 Years | 92,976 (87.0%) | 89,741 (84.7%) |
| 55 to 64 Years | 77,548 (81.4%) | 80,249 (79.5%) |
| 65 to 74 Years | 53,924 (83.3%) | 69,604 (80.0%) |
| 75 Years and over | 37,296 (84.3%) | 57,412 (78.6%) |
| Total | 677,614 (83.7%) | 718,381 (80.9%) |
Income Below Poverty Among Married-Couple Families in Area Code 646
The poverty statistics for married-couple families in Area Code 646 show that 5.8% or 12,616 of the total 215,883 families live below the poverty line. Families with 5 or more children have the highest poverty rate of 28.6%, comprising of 186 families. On the other hand, families with 1 or 2 children have the lowest poverty rate of 4.0%, which includes 3,005 families.
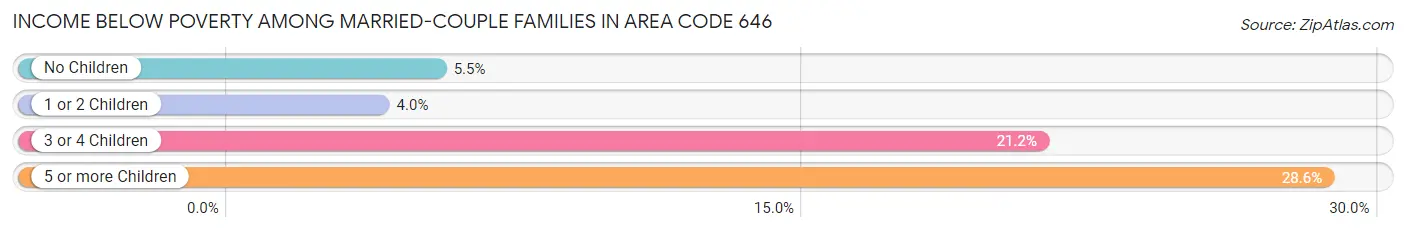
| Children | Above Poverty | Below Poverty |
| No Children | 120,699 (94.6%) | 6,951 (5.4%) |
| 1 or 2 Children | 72,894 (96.0%) | 3,005 (4.0%) |
| 3 or 4 Children | 9,210 (78.8%) | 2,474 (21.2%) |
| 5 or more Children | 464 (71.4%) | 186 (28.6%) |
| Total | 203,267 (94.2%) | 12,616 (5.8%) |
Income Below Poverty Among Single-Parent Households in Area Code 646
According to the poverty data in Area Code 646, 19.7% or 5,845 single-father households and 29.4% or 30,548 single-mother households are living below the poverty line. Among single-father households, those with 5 or more children have the highest poverty rate, with 96 households (75.6%) experiencing poverty. Likewise, among single-mother households, those with 5 or more children have the highest poverty rate, with 406 households (89.0%) falling below the poverty line.
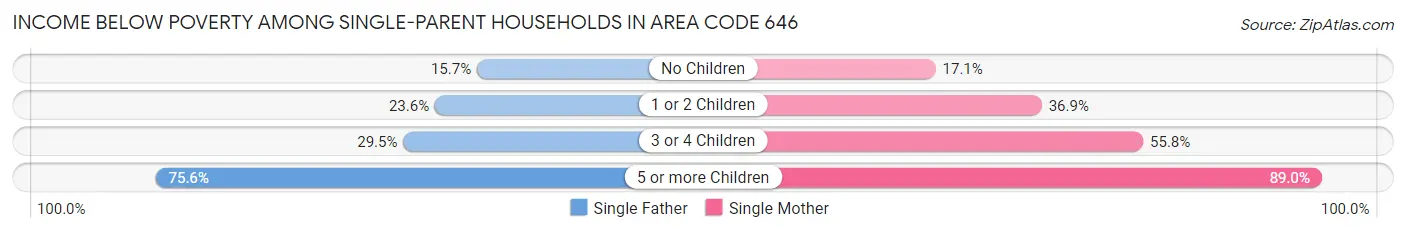
| Children | Single Father | Single Mother |
| No Children | 2,608 (15.7%) | 8,092 (17.1%) |
| 1 or 2 Children | 2,800 (23.6%) | 18,168 (36.9%) |
| 3 or 4 Children | 341 (29.5%) | 3,882 (55.8%) |
| 5 or more Children | 96 (75.6%) | 406 (89.0%) |
| Total | 5,845 (19.7%) | 30,548 (29.4%) |
Income Below Poverty Among Married-Couple vs Single-Parent Households in Area Code 646
The poverty data for Area Code 646 shows that 12,616 of the married-couple family households (5.8%) and 36,393 of the single-parent households (27.2%) are living below the poverty level. Within the married-couple family households, those with 5 or more children have the highest poverty rate, with 186 households (28.6%) falling below the poverty line. Among the single-parent households, those with 5 or more children have the highest poverty rate, with 502 household (86.1%) living below poverty.
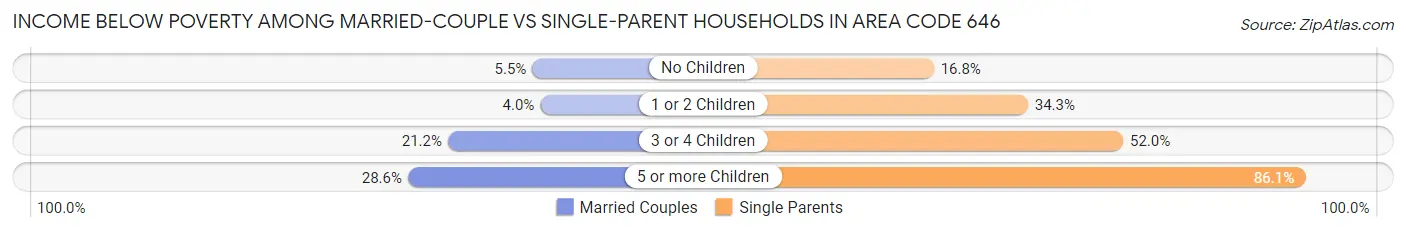
| Children | Married-Couple Families | Single-Parent Households |
| No Children | 6,951 (5.4%) | 10,700 (16.8%) |
| 1 or 2 Children | 3,005 (4.0%) | 20,968 (34.3%) |
| 3 or 4 Children | 2,474 (21.2%) | 4,223 (52.0%) |
| 5 or more Children | 186 (28.6%) | 502 (86.1%) |
| Total | 12,616 (5.8%) | 36,393 (27.2%) |
Race in Area Code 646
The most populous races in Area Code 646 are White / Caucasian (813,023 | 46.6%), Hispanic or Latino (537,447 | 30.8%), and Black / African American (316,357 | 18.1%).
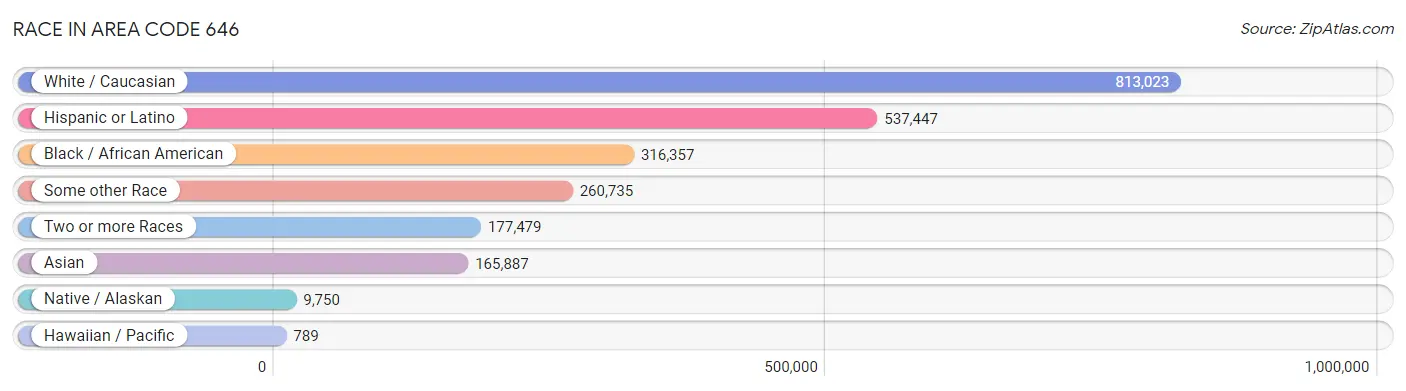
| Race | # Population | % Population |
| Asian | 165,887 | 9.5% |
| Black / African American | 316,357 | 18.1% |
| Hawaiian / Pacific | 789 | 0.1% |
| Hispanic or Latino | 537,447 | 30.8% |
| Native / Alaskan | 9,750 | 0.6% |
| White / Caucasian | 813,023 | 46.6% |
| Two or more Races | 177,479 | 10.2% |
| Some other Race | 260,735 | 14.9% |
| Total | 1,744,020 | 100.0% |
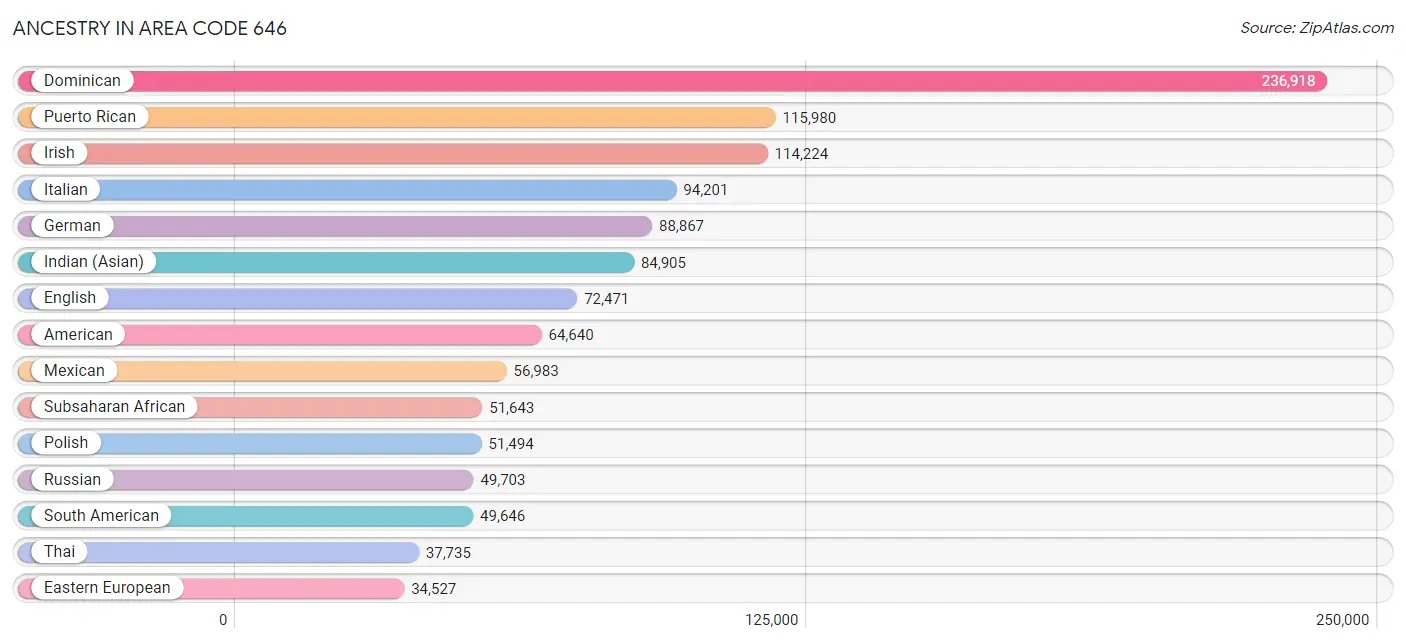
Ancestry in Area Code 646
The most populous ancestries reported in Area Code 646 are Dominican (236,918 | 13.6%), Puerto Rican (115,980 | 6.7%), Irish (114,224 | 6.6%), Italian (94,201 | 5.4%), and German (88,867 | 5.1%), together accounting for 37.3% of all Area Code 646 residents.
| Ancestry | # Population | % Population |
| Afghan | 304 | 0.0% |
| African | 24,772 | 1.4% |
| Alaska Native | 64 | 0.0% |
| Albanian | 2,299 | 0.1% |
| Aleut | 2 | 0.0% |
| Alsatian | 181 | 0.0% |
| American | 64,640 | 3.7% |
| Apache | 197 | 0.0% |
| Arab | 17,222 | 1.0% |
| Argentinean | 4,958 | 0.3% |
| Armenian | 2,539 | 0.2% |
| Assyrian / Chaldean / Syriac | 111 | 0.0% |
| Australian | 2,990 | 0.2% |
| Austrian | 8,051 | 0.5% |
| Bahamian | 295 | 0.0% |
| Barbadian | 1,934 | 0.1% |
| Basque | 160 | 0.0% |
| Belgian | 1,480 | 0.1% |
| Belizean | 1,125 | 0.1% |
| Bermudan | 164 | 0.0% |
| Bhutanese | 15,652 | 0.9% |
| Blackfeet | 643 | 0.0% |
| Bolivian | 901 | 0.1% |
| Brazilian | 3,957 | 0.2% |
| British | 12,211 | 0.7% |
| British West Indian | 3,201 | 0.2% |
| Bulgarian | 1,162 | 0.1% |
| Burmese | 20,442 | 1.2% |
| Cajun | 181 | 0.0% |
| Cambodian | 84 | 0.0% |
| Canadian | 3,978 | 0.2% |
| Cape Verdean | 237 | 0.0% |
| Carpatho Rusyn | 28 | 0.0% |
| Celtic | 118 | 0.0% |
| Central American | 26,071 | 1.5% |
| Central American Indian | 8,663 | 0.5% |
| Cherokee | 2,727 | 0.2% |
| Chickasaw | 73 | 0.0% |
| Chilean | 1,661 | 0.1% |
| Chippewa | 152 | 0.0% |
| Choctaw | 187 | 0.0% |
| Colombian | 9,779 | 0.6% |
| Colville | 18 | 0.0% |
| Costa Rican | 982 | 0.1% |
| Cree | 212 | 0.0% |
| Creek | 53 | 0.0% |
| Croatian | 2,492 | 0.1% |
| Cuban | 12,562 | 0.7% |
| Cypriot | 66 | 0.0% |
| Czech | 3,781 | 0.2% |
| Czechoslovakian | 759 | 0.0% |
| Danish | 3,297 | 0.2% |
| Delaware | 130 | 0.0% |
| Dominican | 236,918 | 13.6% |
| Dutch | 9,344 | 0.5% |
| Dutch West Indian | 133 | 0.0% |
| Eastern European | 34,527 | 2.0% |
| Ecuadorian | 21,654 | 1.2% |
| Egyptian | 2,718 | 0.2% |
| English | 72,471 | 4.2% |
| Estonian | 298 | 0.0% |
| Ethiopian | 1,758 | 0.1% |
| European | 27,634 | 1.6% |
| Filipino | 5,562 | 0.3% |
| Finnish | 1,525 | 0.1% |
| French | 28,083 | 1.6% |
| French American Indian | 43 | 0.0% |
| French Canadian | 3,487 | 0.2% |
| German | 88,867 | 5.1% |
| German Russian | 41 | 0.0% |
| Ghanaian | 6,704 | 0.4% |
| Greek | 11,630 | 0.7% |
| Guamanian / Chamorro | 208 | 0.0% |
| Guatemalan | 3,636 | 0.2% |
| Guyanese | 3,661 | 0.2% |
| Haitian | 8,125 | 0.5% |
| Hmong | 24 | 0.0% |
| Honduran | 8,472 | 0.5% |
| Hungarian | 10,973 | 0.6% |
| Icelander | 234 | 0.0% |
| Indian (Asian) | 84,905 | 4.9% |
| Indonesian | 272 | 0.0% |
| Iranian | 5,436 | 0.3% |
| Iraqi | 953 | 0.1% |
| Irish | 114,224 | 6.6% |
| Iroquois | 797 | 0.1% |
| Israeli | 5,364 | 0.3% |
| Italian | 94,201 | 5.4% |
| Jamaican | 12,429 | 0.7% |
| Japanese | 209 | 0.0% |
| Jordanian | 191 | 0.0% |
| Kenyan | 532 | 0.0% |
| Korean | 14,252 | 0.8% |
| Laotian | 603 | 0.0% |
| Latvian | 1,252 | 0.1% |
| Lebanese | 4,505 | 0.3% |
| Liberian | 622 | 0.0% |
| Lithuanian | 4,403 | 0.3% |
| Lumbee | 18 | 0.0% |
| Luxembourger | 117 | 0.0% |
| Macedonian | 1,592 | 0.1% |
| Malaysian | 132 | 0.0% |
| Maltese | 768 | 0.0% |
| Menominee | 11 | 0.0% |
| Mexican | 56,983 | 3.3% |
| Mexican American Indian | 1,764 | 0.1% |
| Mongolian | 1,049 | 0.1% |
| Moroccan | 1,669 | 0.1% |
| Native Hawaiian | 1,025 | 0.1% |
| Navajo | 40 | 0.0% |
| New Zealander | 217 | 0.0% |
| Nicaraguan | 1,999 | 0.1% |
| Nigerian | 3,032 | 0.2% |
| Northern European | 2,815 | 0.2% |
| Norwegian | 8,134 | 0.5% |
| Okinawan | 364 | 0.0% |
| Osage | 44 | 0.0% |
| Pakistani | 1,827 | 0.1% |
| Palestinian | 773 | 0.0% |
| Panamanian | 3,563 | 0.2% |
| Paraguayan | 275 | 0.0% |
| Pennsylvania German | 121 | 0.0% |
| Peruvian | 6,035 | 0.4% |
| Polish | 51,494 | 2.9% |
| Portuguese | 4,201 | 0.2% |
| Potawatomi | 20 | 0.0% |
| Pueblo | 110 | 0.0% |
| Puerto Rican | 115,980 | 6.7% |
| Romanian | 7,252 | 0.4% |
| Russian | 49,703 | 2.9% |
| Salvadoran | 7,242 | 0.4% |
| Samoan | 226 | 0.0% |
| Scandinavian | 2,676 | 0.2% |
| Scotch-Irish | 6,203 | 0.4% |
| Scottish | 17,464 | 1.0% |
| Senegalese | 2,457 | 0.1% |
| Serbian | 1,616 | 0.1% |
| Sierra Leonean | 310 | 0.0% |
| Sioux | 234 | 0.0% |
| Slavic | 749 | 0.0% |
| Slovak | 1,969 | 0.1% |
| Slovene | 369 | 0.0% |
| Somali | 595 | 0.0% |
| South African | 1,144 | 0.1% |
| South American | 49,646 | 2.9% |
| South American Indian | 991 | 0.1% |
| Soviet Union | 61 | 0.0% |
| Spaniard | 9,175 | 0.5% |
| Spanish | 4,045 | 0.2% |
| Spanish American | 91 | 0.0% |
| Spanish American Indian | 284 | 0.0% |
| Sri Lankan | 4,204 | 0.2% |
| Subsaharan African | 51,643 | 3.0% |
| Sudanese | 148 | 0.0% |
| Swedish | 8,847 | 0.5% |
| Swiss | 3,792 | 0.2% |
| Syrian | 1,595 | 0.1% |
| Taiwanese | 48 | 0.0% |
| Thai | 37,735 | 2.2% |
| Tohono O'Odham | 22 | 0.0% |
| Tongan | 47 | 0.0% |
| Trinidadian and Tobagonian | 3,927 | 0.2% |
| Turkish | 4,210 | 0.2% |
| U.S. Virgin Islander | 852 | 0.1% |
| Ugandan | 372 | 0.0% |
| Ukrainian | 10,300 | 0.6% |
| Uruguayan | 805 | 0.1% |
| Ute | 25 | 0.0% |
| Venezuelan | 3,261 | 0.2% |
| Vietnamese | 1,689 | 0.1% |
| Welsh | 4,503 | 0.3% |
| West Indian | 8,283 | 0.5% |
| Yugoslavian | 545 | 0.0% |
| Zimbabwean | 30 | 0.0% | View All 174 Rows |
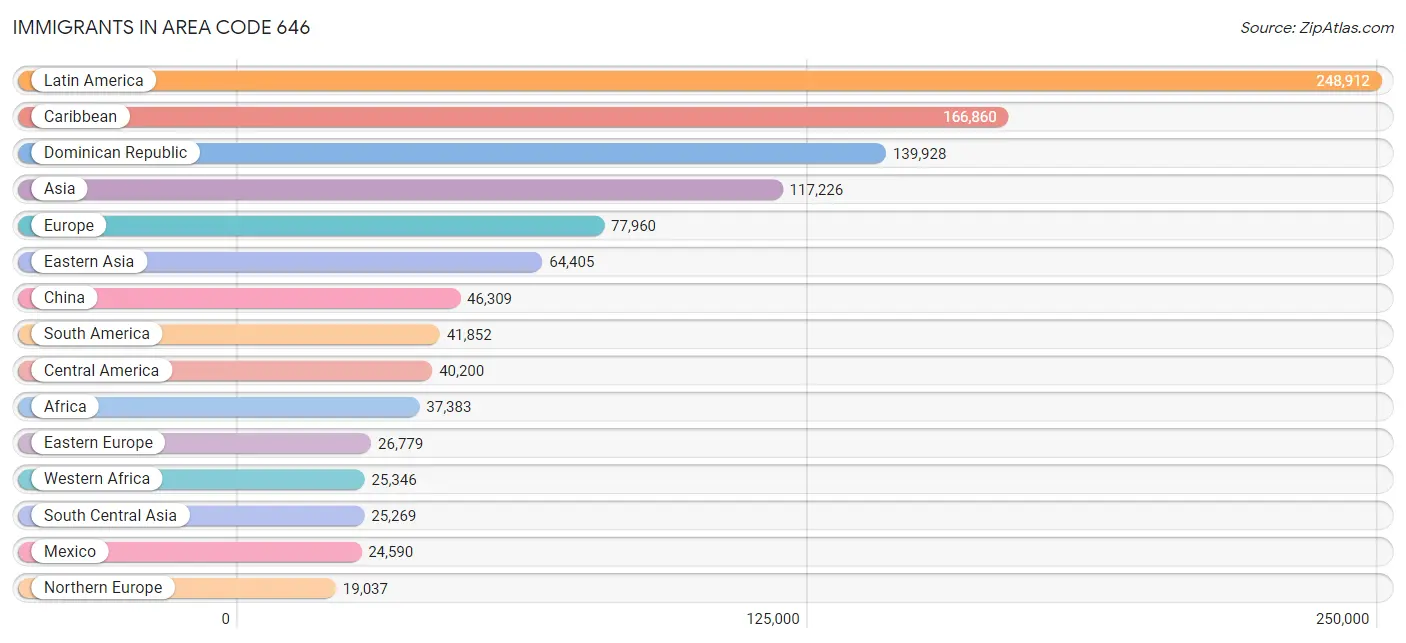
Immigrants in Area Code 646
The most numerous immigrant groups reported in Area Code 646 came from Latin America (248,912 | 14.3%), Caribbean (166,860 | 9.6%), Dominican Republic (139,928 | 8.0%), Asia (117,226 | 6.7%), and Europe (77,960 | 4.5%), together accounting for 43.0% of all Area Code 646 residents.
| Immigration Origin | # Population | % Population |
| Afghanistan | 105 | 0.0% |
| Africa | 37,383 | 2.1% |
| Albania | 1,163 | 0.1% |
| Argentina | 3,728 | 0.2% |
| Armenia | 309 | 0.0% |
| Asia | 117,226 | 6.7% |
| Australia | 5,617 | 0.3% |
| Austria | 678 | 0.0% |
| Bahamas | 238 | 0.0% |
| Bangladesh | 2,079 | 0.1% |
| Barbados | 1,039 | 0.1% |
| Belarus | 641 | 0.0% |
| Belgium | 1,074 | 0.1% |
| Belize | 819 | 0.1% |
| Bolivia | 424 | 0.0% |
| Bosnia and Herzegovina | 481 | 0.0% |
| Brazil | 5,287 | 0.3% |
| Bulgaria | 1,064 | 0.1% |
| Cabo Verde | 101 | 0.0% |
| Cambodia | 168 | 0.0% |
| Cameroon | 254 | 0.0% |
| Canada | 11,794 | 0.7% |
| Caribbean | 166,860 | 9.6% |
| Central America | 40,200 | 2.3% |
| Chile | 1,244 | 0.1% |
| China | 46,309 | 2.7% |
| Colombia | 6,420 | 0.4% |
| Congo | 115 | 0.0% |
| Costa Rica | 516 | 0.0% |
| Croatia | 921 | 0.1% |
| Cuba | 4,141 | 0.2% |
| Czechoslovakia | 846 | 0.1% |
| Denmark | 450 | 0.0% |
| Dominica | 1,303 | 0.1% |
| Dominican Republic | 139,928 | 8.0% |
| Eastern Africa | 3,810 | 0.2% |
| Eastern Asia | 64,405 | 3.7% |
| Eastern Europe | 26,779 | 1.5% |
| Ecuador | 14,224 | 0.8% |
| Egypt | 1,556 | 0.1% |
| El Salvador | 3,824 | 0.2% |
| England | 3,061 | 0.2% |
| Eritrea | 130 | 0.0% |
| Ethiopia | 1,190 | 0.1% |
| Europe | 77,960 | 4.5% |
| France | 9,183 | 0.5% |
| Germany | 5,186 | 0.3% |
| Ghana | 9,495 | 0.5% |
| Greece | 2,402 | 0.1% |
| Grenada | 557 | 0.0% |
| Guatemala | 1,753 | 0.1% |
| Guyana | 3,275 | 0.2% |
| Haiti | 5,033 | 0.3% |
| Honduras | 5,600 | 0.3% |
| Hong Kong | 4,189 | 0.2% |
| Hungary | 967 | 0.1% |
| India | 15,574 | 0.9% |
| Indonesia | 653 | 0.0% |
| Iran | 2,935 | 0.2% |
| Iraq | 242 | 0.0% |
| Ireland | 3,056 | 0.2% |
| Israel | 5,337 | 0.3% |
| Italy | 5,572 | 0.3% |
| Jamaica | 6,822 | 0.4% |
| Japan | 8,484 | 0.5% |
| Jordan | 339 | 0.0% |
| Kazakhstan | 415 | 0.0% |
| Kenya | 791 | 0.1% |
| Korea | 9,587 | 0.5% |
| Kuwait | 291 | 0.0% |
| Laos | 36 | 0.0% |
| Latin America | 248,912 | 14.3% |
| Latvia | 231 | 0.0% |
| Lebanon | 907 | 0.1% |
| Liberia | 432 | 0.0% |
| Lithuania | 238 | 0.0% |
| Malaysia | 2,100 | 0.1% |
| Mexico | 24,590 | 1.4% |
| Middle Africa | 678 | 0.0% |
| Moldova | 293 | 0.0% |
| Morocco | 840 | 0.1% |
| Nepal | 448 | 0.0% |
| Netherlands | 1,252 | 0.1% |
| Nicaragua | 997 | 0.1% |
| Nigeria | 2,462 | 0.1% |
| North Macedonia | 556 | 0.0% |
| Northern Africa | 3,299 | 0.2% |
| Northern Europe | 19,037 | 1.1% |
| Norway | 632 | 0.0% |
| Oceania | 6,310 | 0.4% |
| Pakistan | 2,475 | 0.1% |
| Panama | 2,075 | 0.1% |
| Peru | 3,568 | 0.2% |
| Philippines | 6,919 | 0.4% |
| Poland | 3,662 | 0.2% |
| Portugal | 564 | 0.0% |
| Romania | 2,888 | 0.2% |
| Russia | 6,799 | 0.4% |
| Saudi Arabia | 438 | 0.0% |
| Scotland | 968 | 0.1% |
| Senegal | 2,807 | 0.2% |
| Serbia | 712 | 0.0% |
| Sierra Leone | 575 | 0.0% |
| Singapore | 1,384 | 0.1% |
| Somalia | 209 | 0.0% |
| South Africa | 1,773 | 0.1% |
| South America | 41,852 | 2.4% |
| South Central Asia | 25,269 | 1.5% |
| South Eastern Asia | 14,368 | 0.8% |
| Southern Europe | 12,872 | 0.7% |
| Spain | 4,168 | 0.2% |
| Sri Lanka | 292 | 0.0% |
| St. Vincent and the Grenadines | 415 | 0.0% |
| Sudan | 206 | 0.0% |
| Sweden | 1,057 | 0.1% |
| Switzerland | 1,421 | 0.1% |
| Syria | 351 | 0.0% |
| Taiwan | 4,446 | 0.3% |
| Thailand | 1,211 | 0.1% |
| Trinidad and Tobago | 3,996 | 0.2% |
| Turkey | 2,406 | 0.1% |
| Uganda | 295 | 0.0% |
| Ukraine | 3,178 | 0.2% |
| Uruguay | 297 | 0.0% |
| Uzbekistan | 593 | 0.0% |
| Venezuela | 2,923 | 0.2% |
| Vietnam | 1,614 | 0.1% |
| West Indies | 707 | 0.0% |
| Western Africa | 25,346 | 1.5% |
| Western Asia | 12,681 | 0.7% |
| Western Europe | 18,879 | 1.1% |
| Yemen | 960 | 0.1% |
| Zaire | 225 | 0.0% |
| Zimbabwe | 143 | 0.0% | View All 134 Rows |
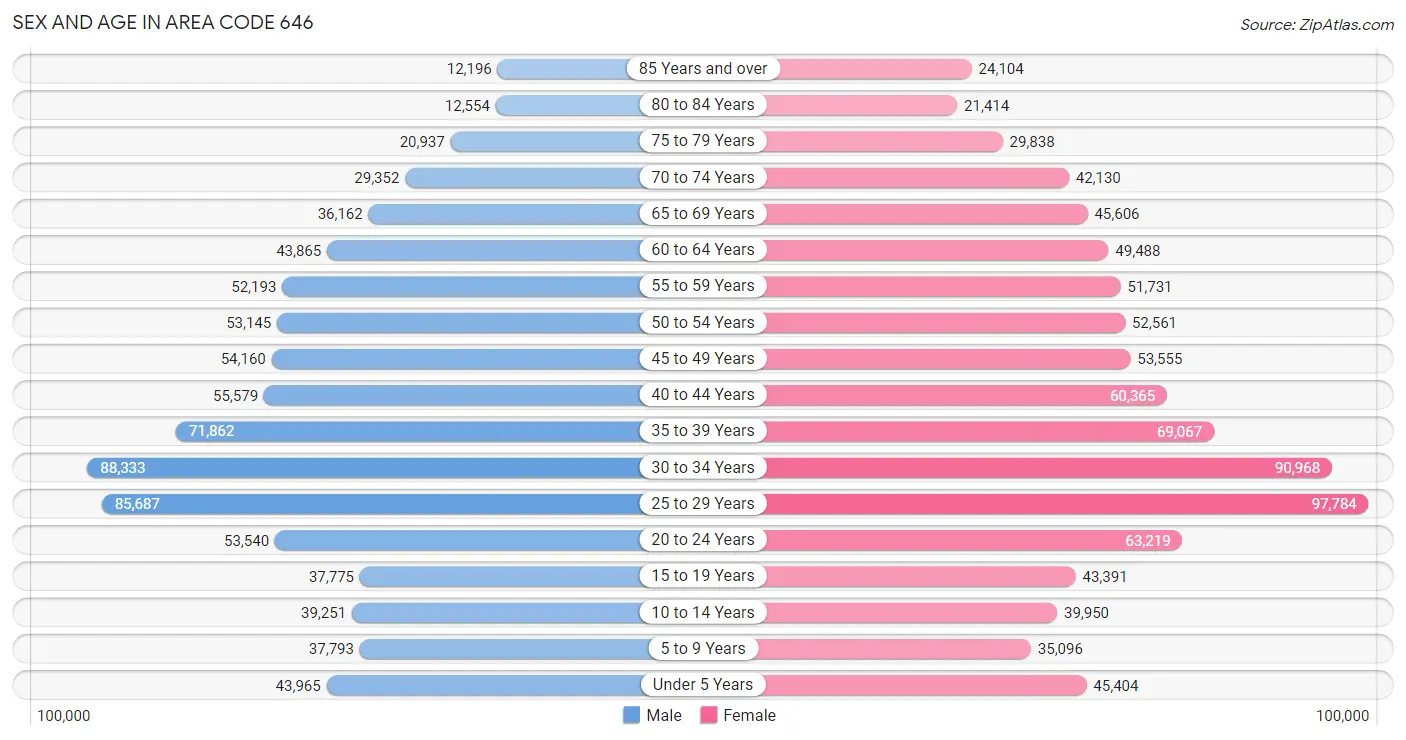
Sex and Age in Area Code 646
Sex and Age in Area Code 646
The most populous age groups in Area Code 646 are 30 to 34 Years (88,333 | 10.7%) for men and 25 to 29 Years (97,784 | 10.7%) for women.
| Age Bracket | Male | Female |
| Under 5 Years | 43,965 (5.3%) | 45,404 (5.0%) |
| 5 to 9 Years | 37,793 (4.6%) | 35,096 (3.8%) |
| 10 to 14 Years | 39,251 (4.7%) | 39,950 (4.4%) |
| 15 to 19 Years | 37,775 (4.6%) | 43,391 (4.7%) |
| 20 to 24 Years | 53,540 (6.5%) | 63,219 (6.9%) |
| 25 to 29 Years | 85,687 (10.3%) | 97,784 (10.7%) |
| 30 to 34 Years | 88,333 (10.7%) | 90,968 (9.9%) |
| 35 to 39 Years | 71,862 (8.7%) | 69,067 (7.5%) |
| 40 to 44 Years | 55,579 (6.7%) | 60,365 (6.6%) |
| 45 to 49 Years | 54,160 (6.5%) | 53,555 (5.9%) |
| 50 to 54 Years | 53,145 (6.4%) | 52,561 (5.7%) |
| 55 to 59 Years | 52,193 (6.3%) | 51,731 (5.7%) |
| 60 to 64 Years | 43,865 (5.3%) | 49,488 (5.4%) |
| 65 to 69 Years | 36,162 (4.4%) | 45,606 (5.0%) |
| 70 to 74 Years | 29,352 (3.5%) | 42,130 (4.6%) |
| 75 to 79 Years | 20,937 (2.5%) | 29,838 (3.3%) |
| 80 to 84 Years | 12,554 (1.5%) | 21,414 (2.3%) |
| 85 Years and over | 12,196 (1.5%) | 24,104 (2.6%) |
| Total | 828,349 (100.0%) | 915,671 (100.0%) |
Families and Households in Area Code 646
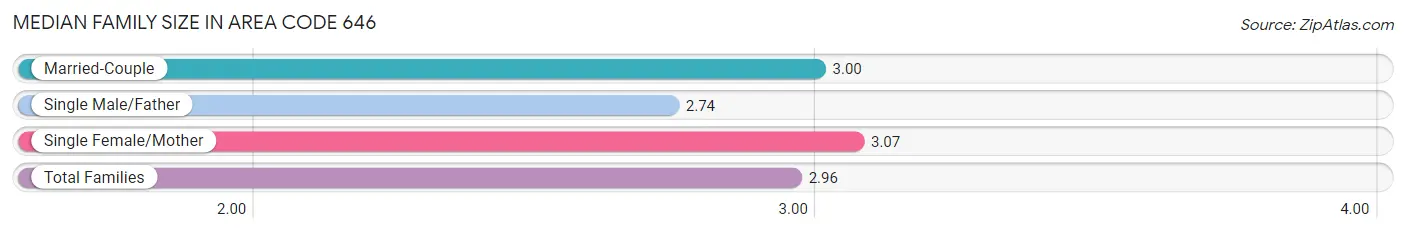
Median Family Size in Area Code 646
The median family size in Area Code 646 is 2.96 persons per family, with single female/mother families (103,911 | 29.7%) accounting for the largest median family size of 3.0675 persons per family. On the other hand, single male/father families (29,737 | 8.5%) represent the smallest median family size with 2.74 persons per family.
| Family Type | # Families | Family Size |
| Married-Couple | 215,883 (61.8%) | 3.00 |
| Single Male/Father | 29,737 (8.5%) | 2.74 |
| Single Female/Mother | 103,911 (29.7%) | 3.07 |
| Total Families | 349,531 (100.0%) | 2.96 |
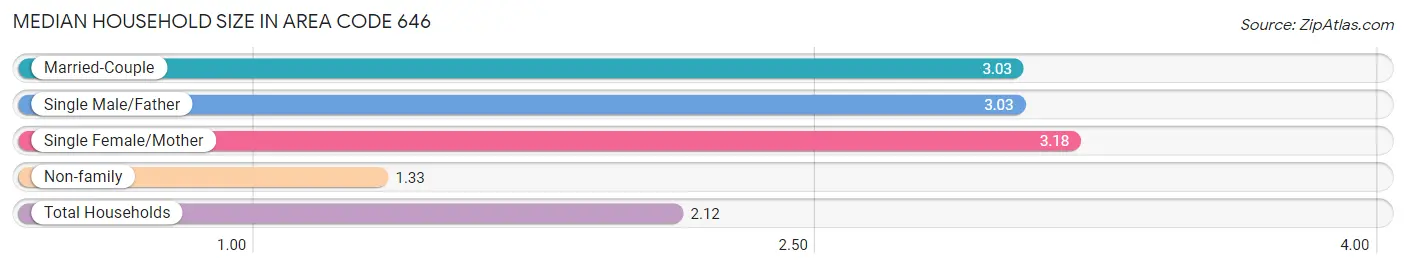
Median Household Size in Area Code 646
The median household size in Area Code 646 is 2.12 persons per household, with single female/mother households (103,911 | 13.3%) accounting for the largest median household size of 3.182 persons per household. non-family households (434,087 | 55.4%) represent the smallest median household size with 1.33 persons per household.
| Household Type | # Households | Household Size |
| Married-Couple | 215,883 (27.6%) | 3.03 |
| Single Male/Father | 29,737 (3.8%) | 3.03 |
| Single Female/Mother | 103,911 (13.3%) | 3.18 |
| Non-family | 434,087 (55.4%) | 1.33 |
| Total Households | 783,618 (100.0%) | 2.12 |
Household Size by Marriage Status in Area Code 646
Out of a total of 783,618 households in Area Code 646, 349,531 (44.6%) are family households, while 434,087 (55.4%) are nonfamily households. The most numerous type of family households are 2-person households, comprising 164,192, and the most common type of nonfamily households are 1-person households, comprising 346,592.
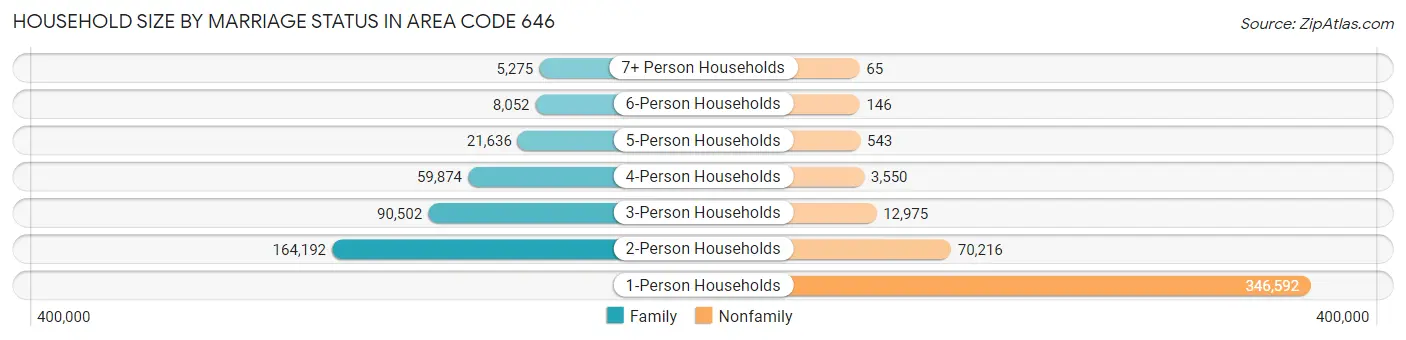
| Household Size | Family Households | Nonfamily Households |
| 1-Person Households | - | 346,592 (44.2%) |
| 2-Person Households | 164,192 (20.9%) | 70,216 (9.0%) |
| 3-Person Households | 90,502 (11.6%) | 12,975 (1.7%) |
| 4-Person Households | 59,874 (7.6%) | 3,550 (0.4%) |
| 5-Person Households | 21,636 (2.8%) | 543 (0.1%) |
| 6-Person Households | 8,052 (1.0%) | 146 (0.0%) |
| 7+ Person Households | 5,275 (0.7%) | 65 (0.0%) |
| Total | 349,531 (44.6%) | 434,087 (55.4%) |
Female Fertility in Area Code 646
Fertility by Age in Area Code 646
Average fertility rate in Area Code 646 is 43.1 births per 1,000 women. Women in the age bracket of 15 to 19 years have the highest fertility rate with 74.0 births per 1,000 women. Women in the age bracket of 20 to 34 years acount for 55.3% of all women with births.
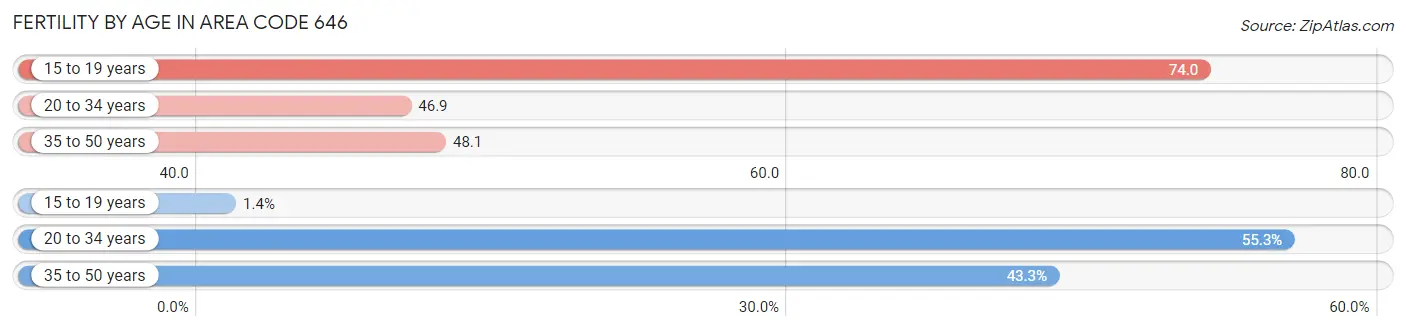
| Age Bracket | Women with Births | Births / 1,000 Women |
| 15 to 19 years | 285 (1.4%) | 74.0 |
| 20 to 34 years | 11,021 (55.3%) | 46.9 |
| 35 to 50 years | 8,635 (43.3%) | 48.1 |
| Total | 19,941 (100.0%) | 43.1 |
Fertility by Age by Marriage Status in Area Code 646
71.8% of women with births (19,941) in Area Code 646 are married. The highest percentage of unmarried women with births falls into 15 to 19 years age bracket with 100.0% of them unmarried at the time of birth, while the lowest percentage of unmarried women with births belong to 35 to 50 years age bracket with 26.9% of them unmarried.
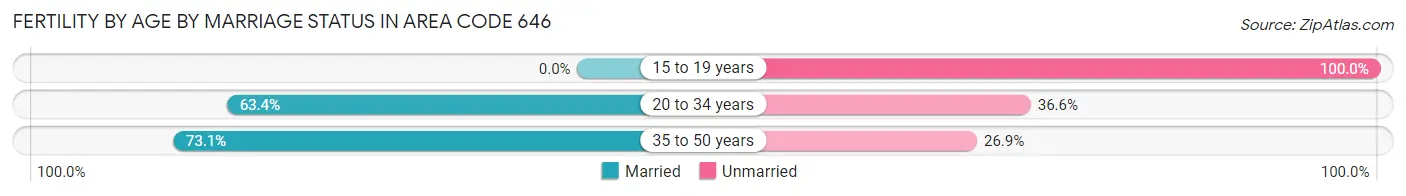
| Age Bracket | Married | Unmarried |
| 15 to 19 years | 0 (0.0%) | 285 (100.0%) |
| 20 to 34 years | 6,984 (63.4%) | 4,037 (36.6%) |
| 35 to 50 years | 6,314 (73.1%) | 2,321 (26.9%) |
| Total | 14,313 (71.8%) | 5,628 (28.2%) |
Fertility by Education in Area Code 646
Average fertility rate in Area Code 646 is 43.1 births per 1,000 women. Women with the education attainment of high school diploma have the highest fertility rate of 65.7 births per 1,000 women, while women with the education attainment of college or associate's degree have the lowest fertility at 32.3 births per 1,000 women. Women with the education attainment of graduate degree represent 35.0% of all women with births.
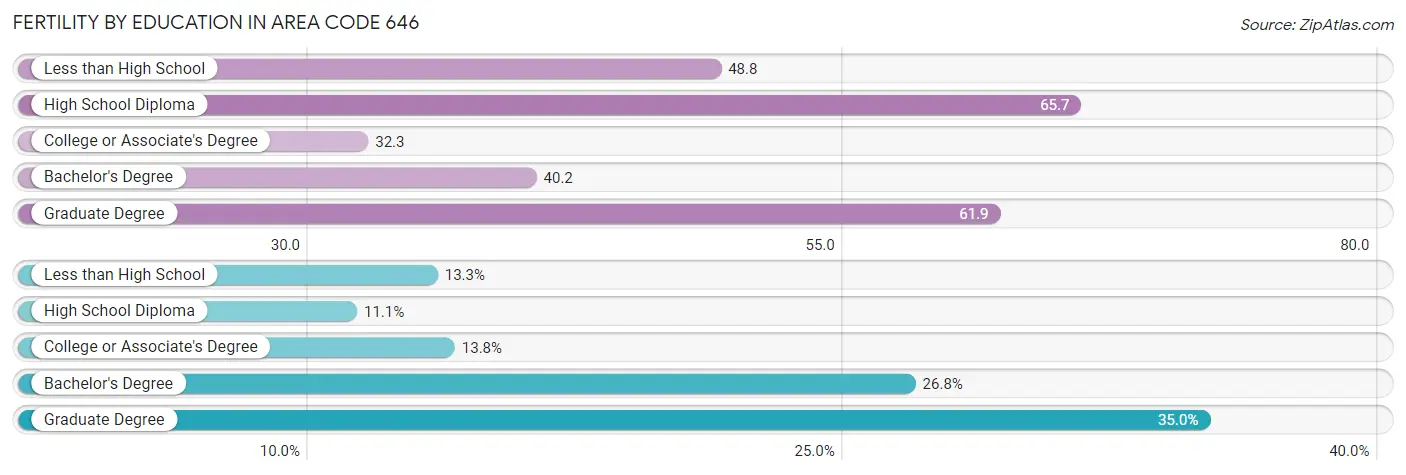
| Educational Attainment | Women with Births | Births / 1,000 Women |
| Less than High School | 2,659 (13.3%) | 48.8 |
| High School Diploma | 2,206 (11.1%) | 65.7 |
| College or Associate's Degree | 2,754 (13.8%) | 32.3 |
| Bachelor's Degree | 5,336 (26.8%) | 40.2 |
| Graduate Degree | 6,986 (35.0%) | 61.9 |
| Total | 19,941 (100.0%) | 43.1 |
Fertility by Education by Marriage Status in Area Code 646
28.2% of women with births in Area Code 646 are unmarried. Women with the educational attainment of graduate degree are most likely to be married with 75.1% of them married at childbirth, while women with the educational attainment of high school diploma are least likely to be married with 73.1% of them unmarried at childbirth.
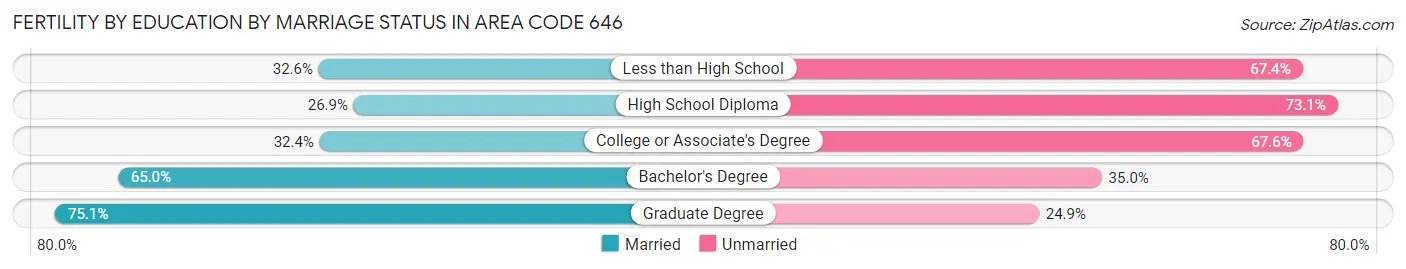
| Educational Attainment | Married | Unmarried |
| Less than High School | 866 (32.6%) | 1,793 (67.4%) |
| High School Diploma | 594 (26.9%) | 1,612 (73.1%) |
| College or Associate's Degree | 893 (32.4%) | 1,861 (67.6%) |
| Bachelor's Degree | 3,466 (65.0%) | 1,870 (35.0%) |
| Graduate Degree | 5,246 (75.1%) | 1,740 (24.9%) |
| Total | 14,313 (71.8%) | 5,628 (28.2%) |
Employment Characteristics in Area Code 646
Employment by Class of Employer in Area Code 646
Among the 896,146 employed individuals in Area Code 646, private company employees (585,257 | 65.3%), not-for-profit organizations (123,917 | 13.8%), and self-employed (not incorporated) (60,186 | 6.7%) make up the most common classes of employment.
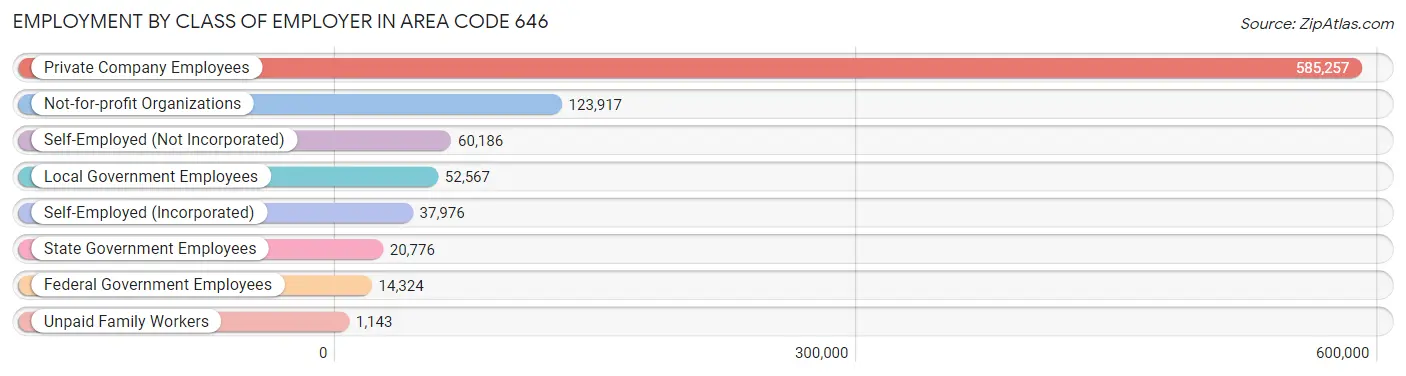
| Employer Class | # Employees | % Employees |
| Private Company Employees | 585,257 | 65.3% |
| Self-Employed (Incorporated) | 37,976 | 4.2% |
| Self-Employed (Not Incorporated) | 60,186 | 6.7% |
| Not-for-profit Organizations | 123,917 | 13.8% |
| Local Government Employees | 52,567 | 5.9% |
| State Government Employees | 20,776 | 2.3% |
| Federal Government Employees | 14,324 | 1.6% |
| Unpaid Family Workers | 1,143 | 0.1% |
| Total | 896,146 | 100.0% |
Employment Status by Age in Area Code 646
According to the labor force statistics for Area Code 646, out of the total population over 16 years of age (1,487,740), 69.0% or 1,026,838 individuals are in the labor force, with 7.1% or 72,495 of them unemployed. The age group with the highest labor force participation rate is 25 to 29 years, with 88.0% or 161,436 individuals in the labor force. Within the labor force, the 16 to 19 years age range has the highest percentage of unemployed individuals, with 958.3% or 155,130 of them being unemployed.
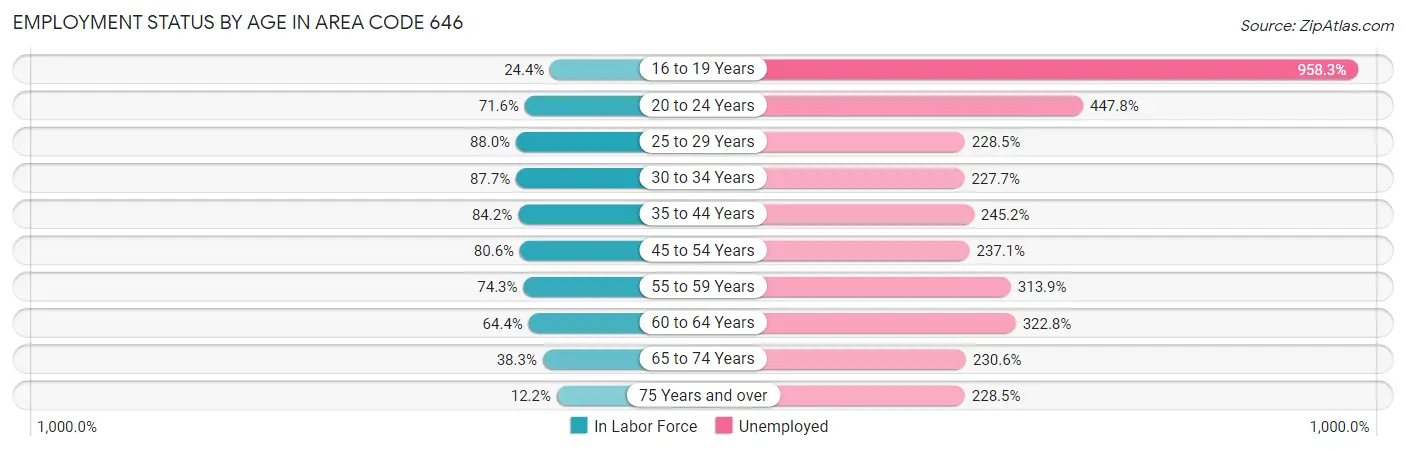
| Age Bracket | In Labor Force | Unemployed |
| 16 to 19 Years | 16,186 (24.4%) | 155,130 (958.3%) |
| 20 to 24 Years | 83,544 (71.6%) | 374,097 (447.8%) |
| 25 to 29 Years | 161,437 (88.0%) | 368,881 (228.5%) |
| 30 to 34 Years | 157,174 (87.7%) | 357,887 (227.7%) |
| 35 to 44 Years | 216,394 (84.2%) | 530,588 (245.2%) |
| 45 to 54 Years | 172,058 (80.6%) | 407,954 (237.1%) |
| 55 to 59 Years | 77,182 (74.3%) | 242,281 (313.9%) |
| 60 to 64 Years | 60,137 (64.4%) | 194,125 (322.8%) |
| 65 to 74 Years | 58,698 (38.3%) | 135,351 (230.6%) |
| 75 Years and over | 14,820 (12.2%) | 33,855 (228.5%) |
| Total | 1,026,788 (69.0%) | 72,495 (7.1%) |
Employment Status by Educational Attainment in Area Code 646
According to labor force statistics for Area Code 646, 82.1% of individuals (846,118) out of the total population between 25 and 64 years of age (1,030,343) are in the labor force, with 252.7% or 2,138,140 of them being unemployed. The group with the highest labor force participation rate are those with the educational attainment of bachelor's degree or higher, with 88.8% or 563,442 individuals in the labor force. Within the labor force, individuals with high school diploma education have the highest percentage of unemployment, with 455.6% or 404,668 of them being unemployed.
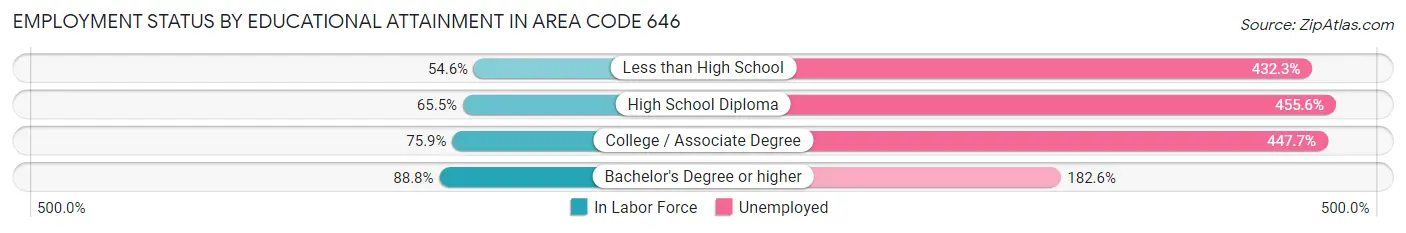
| Educational Attainment | In Labor Force | Unemployed |
| Less than High School | 58,979 (54.5%) | 467,407 (432.3%) |
| High School Diploma | 88,818 (65.5%) | 617,912 (455.6%) |
| College / Associate Degree | 115,653 (75.9%) | 681,865 (447.7%) |
| Bachelor's Degree or higher | 563,463 (88.8%) | 1,158,217 (182.6%) |
| Total | 846,108 (82.1%) | 2,603,677 (252.7%) |
Employment Occupations by Sex in Area Code 646
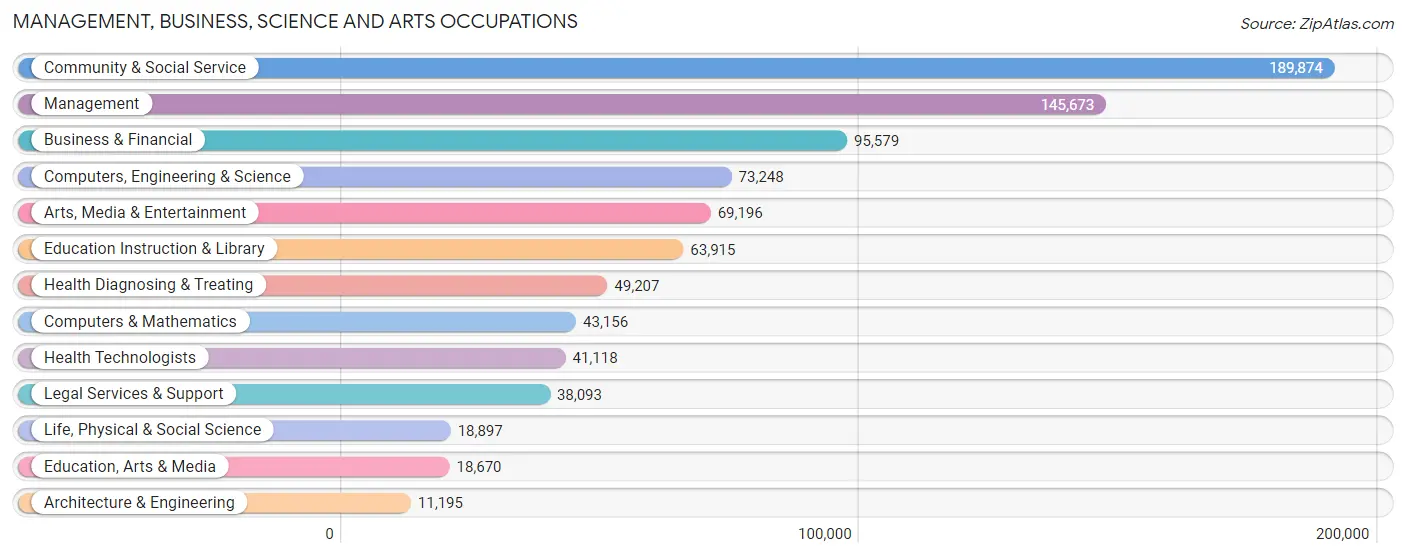
Management, Business, Science and Arts Occupations
The most common Management, Business, Science and Arts occupations in Area Code 646 are Community & Social Service (189,874 | 20.7%), Management (145,673 | 15.9%), Business & Financial (95,579 | 10.4%), Computers, Engineering & Science (73,248 | 8.0%), and Arts, Media & Entertainment (69,196 | 7.6%).
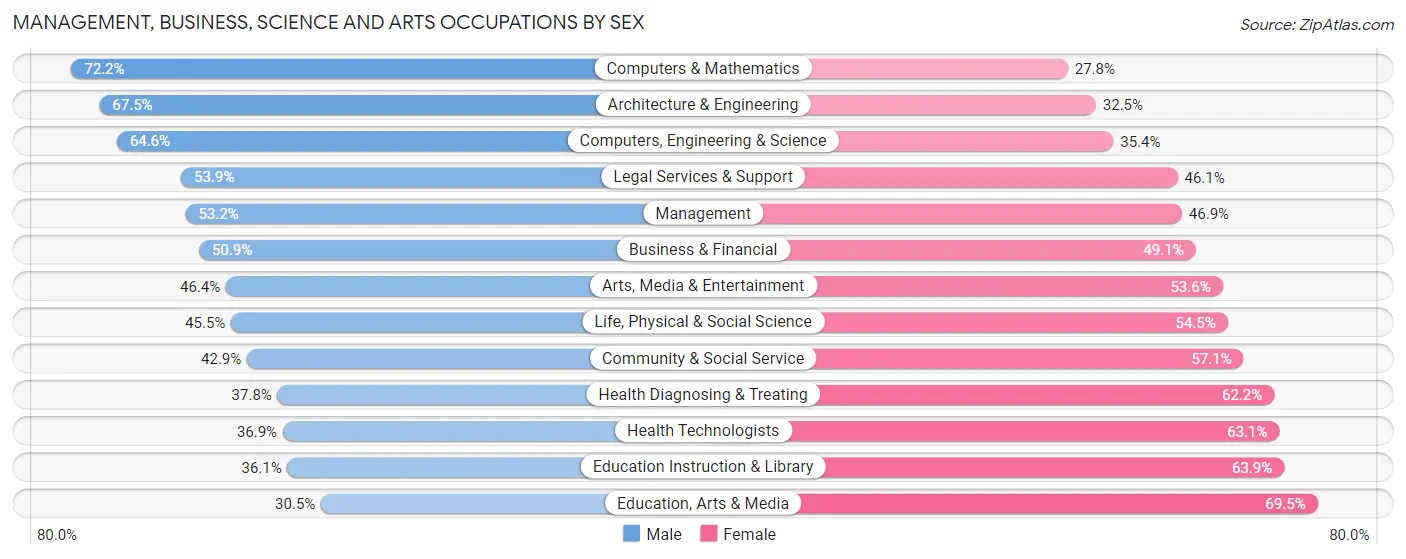
Management, Business, Science and Arts Occupations by Sex
Within the Management, Business, Science and Arts occupations in Area Code 646, the most male-oriented occupations are Computers & Mathematics (72.2%), Architecture & Engineering (67.5%), and Computers, Engineering & Science (64.6%), while the most female-oriented occupations are Education, Arts & Media (69.5%), Education Instruction & Library (63.9%), and Health Technologists (63.1%).
| Occupation | Male | Female |
| Management | 77,424 (53.1%) | 68,249 (46.9%) |
| Business & Financial | 48,638 (50.9%) | 46,941 (49.1%) |
| Computers, Engineering & Science | 47,318 (64.6%) | 25,930 (35.4%) |
| Computers & Mathematics | 31,156 (72.2%) | 12,000 (27.8%) |
| Architecture & Engineering | 7,558 (67.5%) | 3,637 (32.5%) |
| Life, Physical & Social Science | 8,604 (45.5%) | 10,293 (54.5%) |
| Community & Social Service | 81,391 (42.9%) | 108,483 (57.1%) |
| Education, Arts & Media | 5,697 (30.5%) | 12,973 (69.5%) |
| Legal Services & Support | 20,524 (53.9%) | 17,569 (46.1%) |
| Education Instruction & Library | 23,080 (36.1%) | 40,835 (63.9%) |
| Arts, Media & Entertainment | 32,090 (46.4%) | 37,106 (53.6%) |
| Health Diagnosing & Treating | 18,585 (37.8%) | 30,622 (62.2%) |
| Health Technologists | 15,169 (36.9%) | 25,949 (63.1%) |
| Total (Category) | 273,356 (49.4%) | 280,225 (50.6%) |
| Total (Overall) | 455,707 (49.8%) | 460,036 (50.2%) |
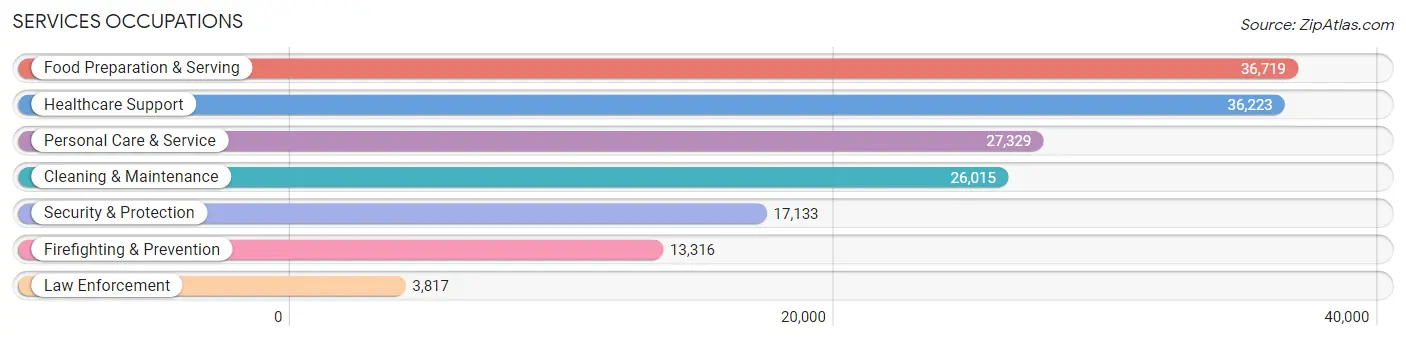
Services Occupations
The most common Services occupations in Area Code 646 are Food Preparation & Serving (36,719 | 4.0%), Healthcare Support (36,223 | 4.0%), Personal Care & Service (27,329 | 3.0%), Cleaning & Maintenance (26,015 | 2.8%), and Security & Protection (17,133 | 1.9%).
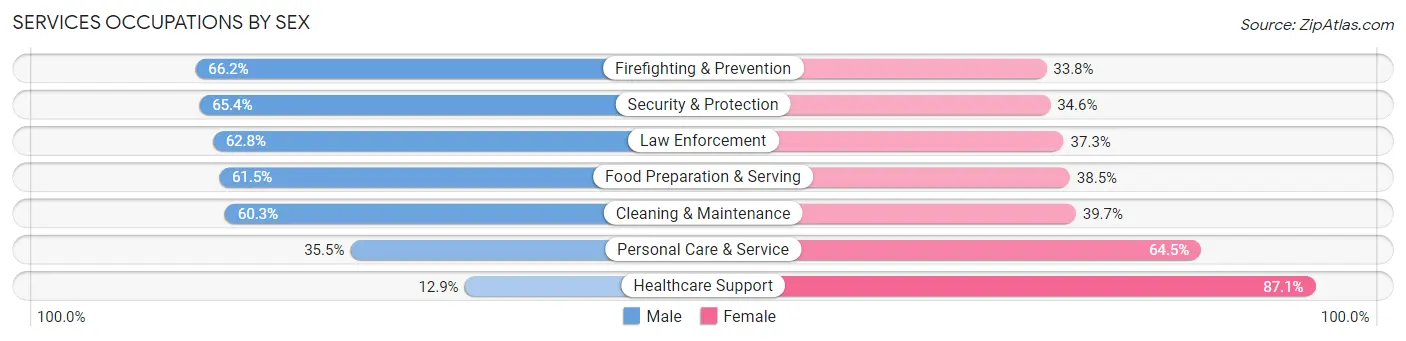
Services Occupations by Sex
Within the Services occupations in Area Code 646, the most male-oriented occupations are Firefighting & Prevention (66.2%), Security & Protection (65.4%), and Law Enforcement (62.7%), while the most female-oriented occupations are Healthcare Support (87.1%), Personal Care & Service (64.5%), and Cleaning & Maintenance (39.7%).
| Occupation | Male | Female |
| Healthcare Support | 4,671 (12.9%) | 31,552 (87.1%) |
| Security & Protection | 11,207 (65.4%) | 5,926 (34.6%) |
| Firefighting & Prevention | 8,812 (66.2%) | 4,504 (33.8%) |
| Law Enforcement | 2,395 (62.7%) | 1,422 (37.2%) |
| Food Preparation & Serving | 22,585 (61.5%) | 14,134 (38.5%) |
| Cleaning & Maintenance | 15,698 (60.3%) | 10,317 (39.7%) |
| Personal Care & Service | 9,706 (35.5%) | 17,623 (64.5%) |
| Total (Category) | 63,867 (44.5%) | 79,552 (55.5%) |
| Total (Overall) | 455,707 (49.8%) | 460,036 (50.2%) |
Sales and Office Occupations
The most common Sales and Office occupations in Area Code 646 are Sales & Related (79,641 | 8.7%), and Office & Administration (72,277 | 7.9%).
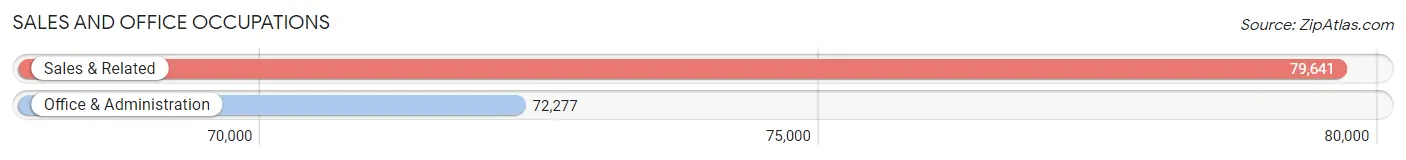
Sales and Office Occupations by Sex
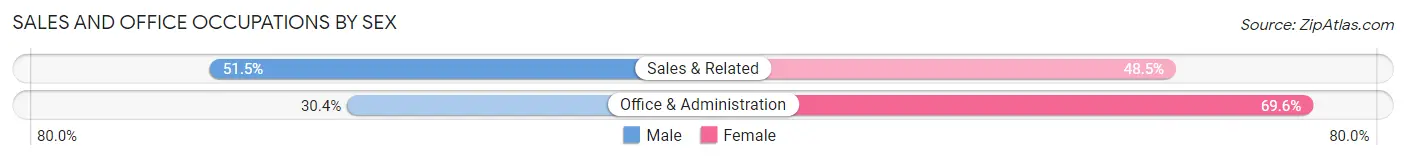
| Occupation | Male | Female |
| Sales & Related | 41,007 (51.5%) | 38,634 (48.5%) |
| Office & Administration | 21,975 (30.4%) | 50,302 (69.6%) |
| Total (Category) | 62,982 (41.5%) | 88,936 (58.5%) |
| Total (Overall) | 455,707 (49.8%) | 460,036 (50.2%) |
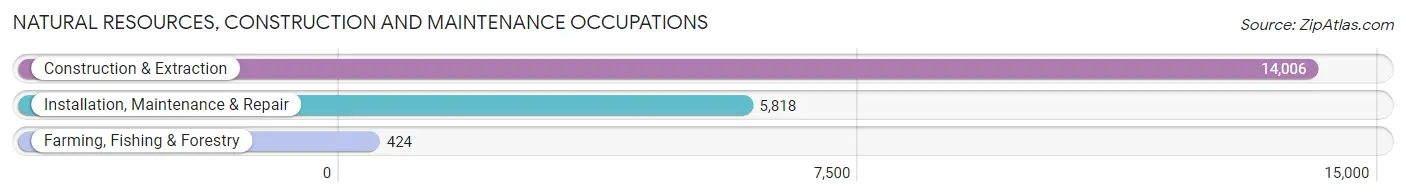
Natural Resources, Construction and Maintenance Occupations
The most common Natural Resources, Construction and Maintenance occupations in Area Code 646 are Construction & Extraction (14,006 | 1.5%), Installation, Maintenance & Repair (5,818 | 0.6%), and Farming, Fishing & Forestry (424 | 0.1%).
Natural Resources, Construction and Maintenance Occupations by Sex
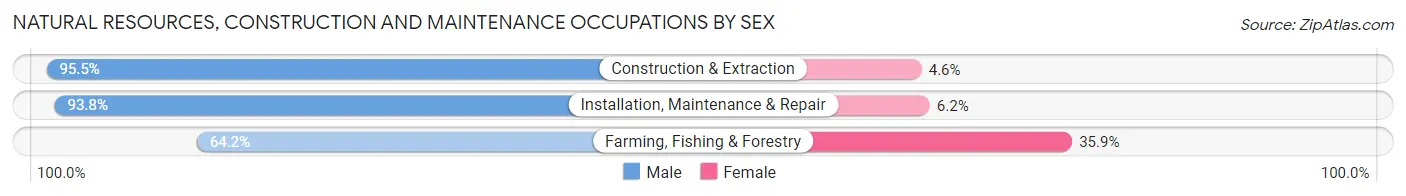
| Occupation | Male | Female |
| Farming, Fishing & Forestry | 272 (64.1%) | 152 (35.8%) |
| Construction & Extraction | 13,369 (95.5%) | 637 (4.5%) |
| Installation, Maintenance & Repair | 5,455 (93.8%) | 363 (6.2%) |
| Total (Category) | 19,096 (94.3%) | 1,152 (5.7%) |
| Total (Overall) | 455,707 (49.8%) | 460,036 (50.2%) |
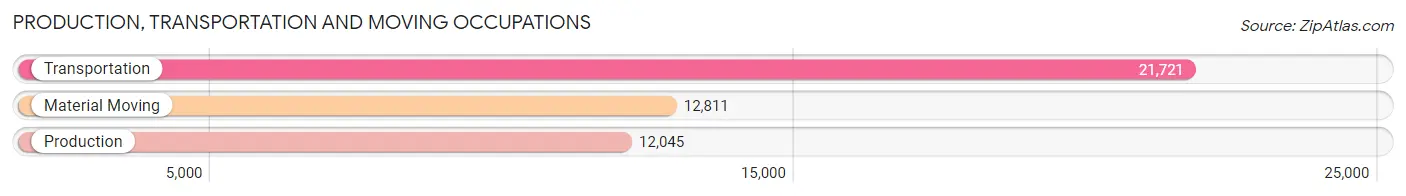
Production, Transportation and Moving Occupations
The most common Production, Transportation and Moving occupations in Area Code 646 are Transportation (21,721 | 2.4%), Material Moving (12,811 | 1.4%), and Production (12,045 | 1.3%).
Production, Transportation and Moving Occupations by Sex
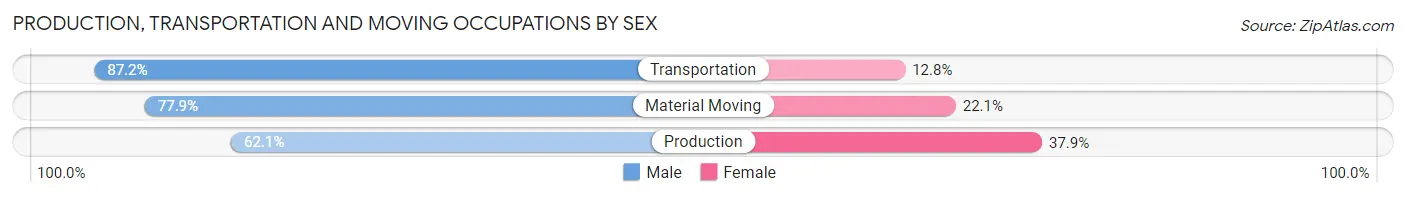
| Occupation | Male | Female |
| Production | 7,481 (62.1%) | 4,564 (37.9%) |
| Transportation | 18,942 (87.2%) | 2,779 (12.8%) |
| Material Moving | 9,983 (77.9%) | 2,828 (22.1%) |
| Total (Category) | 36,406 (78.2%) | 10,171 (21.8%) |
| Total (Overall) | 455,707 (49.8%) | 460,036 (50.2%) |
Employment Industries by Sex in Area Code 646
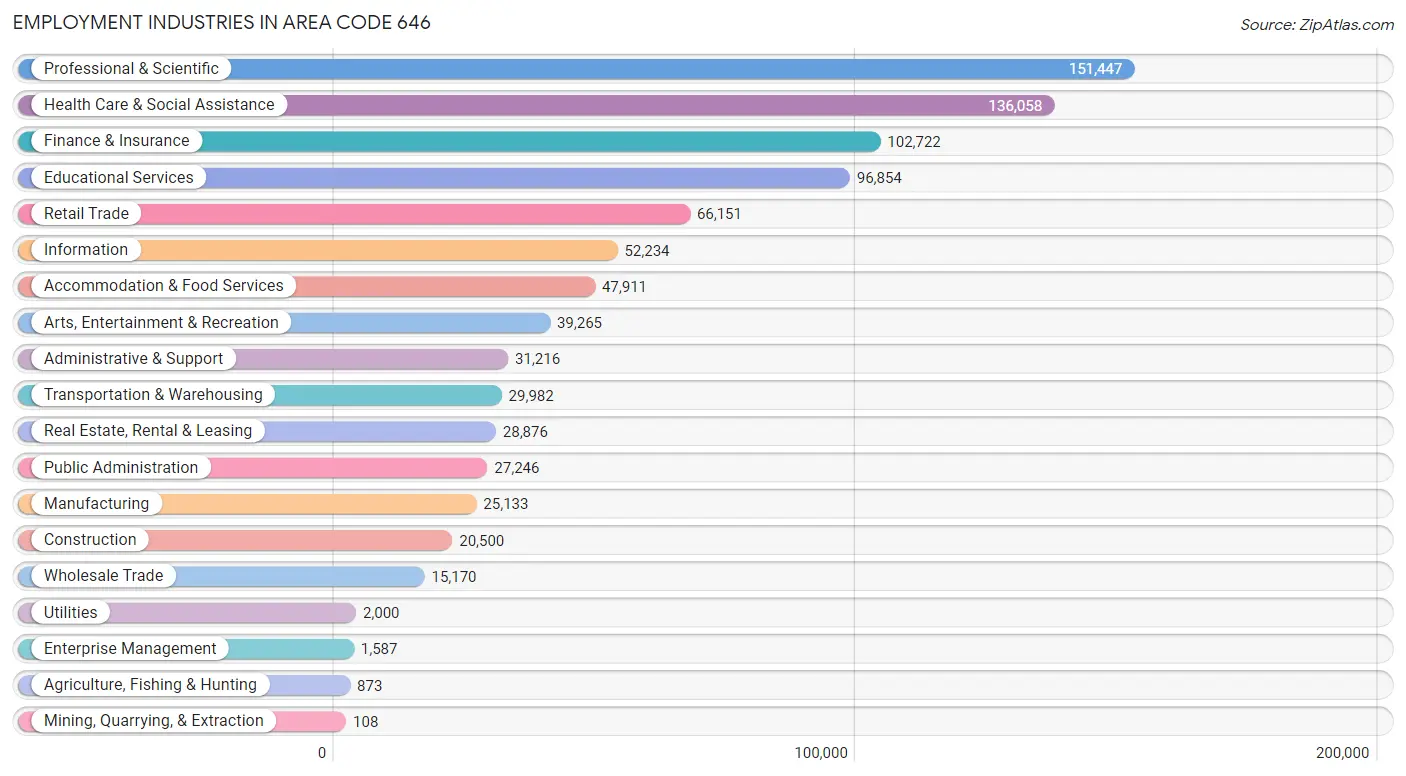
Employment Industries in Area Code 646
The major employment industries in Area Code 646 include Professional & Scientific (151,447 | 16.5%), Health Care & Social Assistance (136,058 | 14.9%), Finance & Insurance (102,722 | 11.2%), Educational Services (96,854 | 10.6%), and Retail Trade (66,151 | 7.2%).
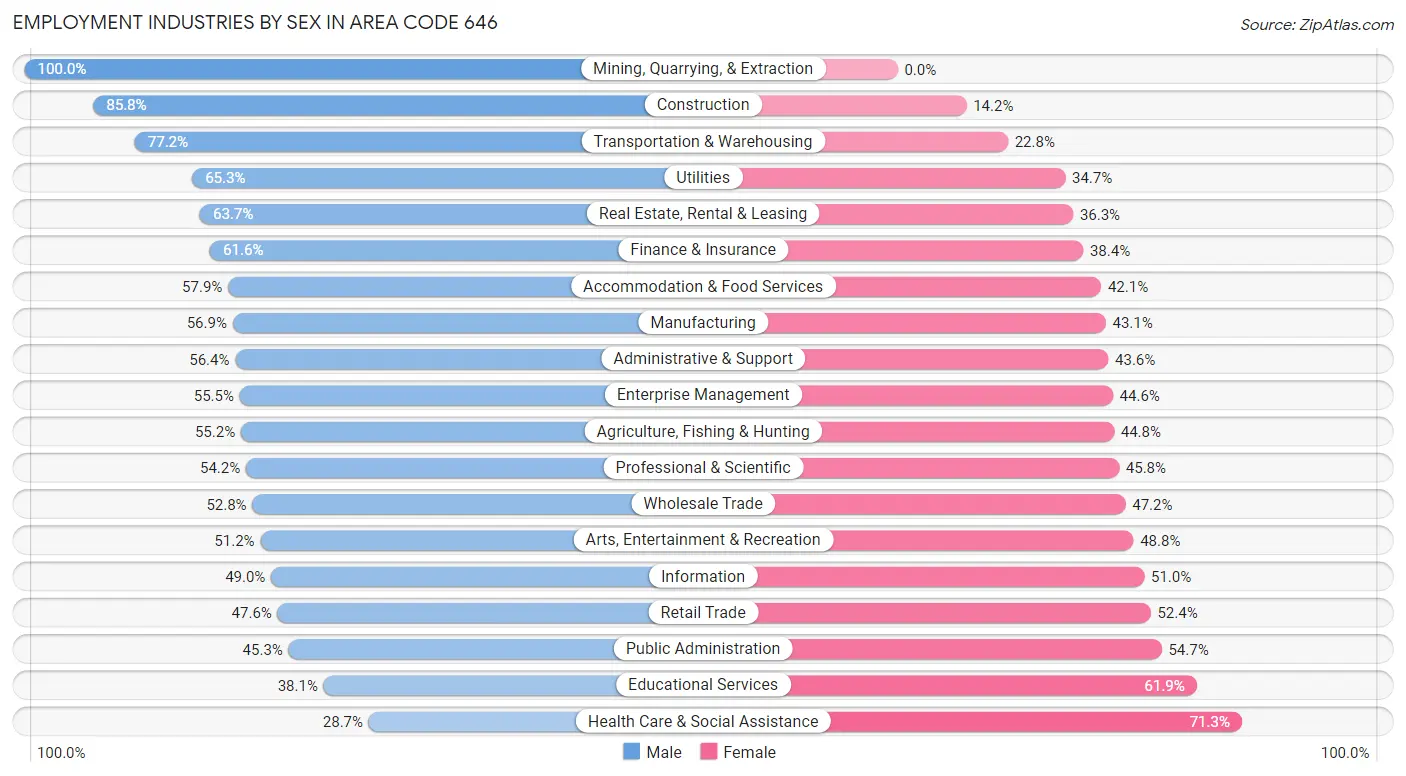
Employment Industries by Sex in Area Code 646
The Area Code 646 industries that see more men than women are Mining, Quarrying, & Extraction (100.0%), Construction (85.8%), and Transportation & Warehousing (77.2%), whereas the industries that tend to have a higher number of women are Health Care & Social Assistance (71.3%), Educational Services (61.9%), and Public Administration (54.7%).
| Industry | Male | Female |
| Agriculture, Fishing & Hunting | 482 (55.2%) | 391 (44.8%) |
| Mining, Quarrying, & Extraction | 108 (100.0%) | 0 (0.0%) |
| Construction | 17,581 (85.8%) | 2,919 (14.2%) |
| Manufacturing | 14,306 (56.9%) | 10,827 (43.1%) |
| Wholesale Trade | 8,016 (52.8%) | 7,154 (47.2%) |
| Retail Trade | 31,502 (47.6%) | 34,649 (52.4%) |
| Transportation & Warehousing | 23,137 (77.2%) | 6,845 (22.8%) |
| Utilities | 1,306 (65.3%) | 694 (34.7%) |
| Information | 25,572 (49.0%) | 26,662 (51.0%) |
| Finance & Insurance | 63,267 (61.6%) | 39,455 (38.4%) |
| Real Estate, Rental & Leasing | 18,385 (63.7%) | 10,491 (36.3%) |
| Professional & Scientific | 82,025 (54.2%) | 69,422 (45.8%) |
| Enterprise Management | 880 (55.4%) | 707 (44.6%) |
| Administrative & Support | 17,603 (56.4%) | 13,613 (43.6%) |
| Educational Services | 36,878 (38.1%) | 59,976 (61.9%) |
| Health Care & Social Assistance | 39,103 (28.7%) | 96,955 (71.3%) |
| Arts, Entertainment & Recreation | 20,101 (51.2%) | 19,164 (48.8%) |
| Accommodation & Food Services | 27,725 (57.9%) | 20,186 (42.1%) |
| Public Administration | 12,352 (45.3%) | 14,894 (54.7%) |
| Total | 455,707 (49.8%) | 460,036 (50.2%) |
Education in Area Code 646
School Enrollment in Area Code 646
The most common levels of schooling among the 368,939 students in Area Code 646 are college / undergraduate (95,779 | 26.0%), middle school (63,244 | 17.1%), and high school (59,946 | 16.3%).
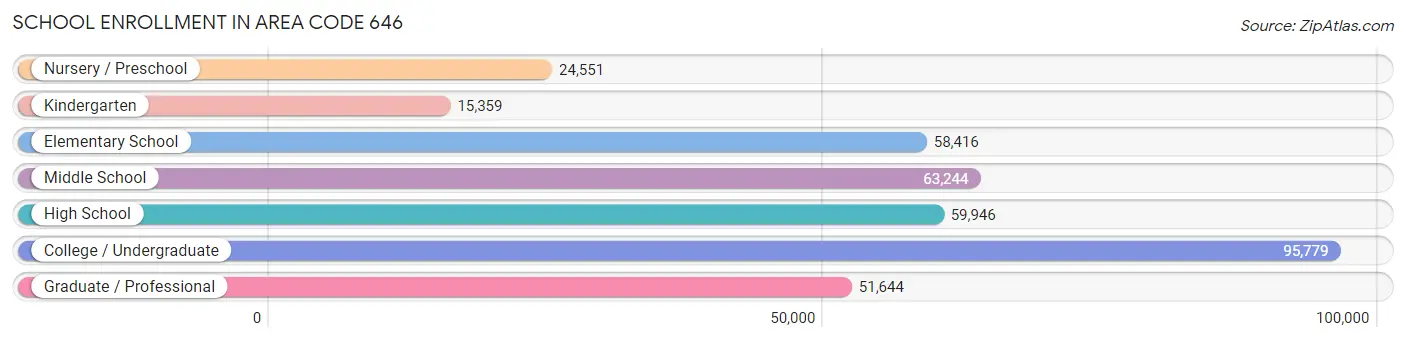
| School Level | # Students | % Students |
| Nursery / Preschool | 24,551 | 6.7% |
| Kindergarten | 15,359 | 4.2% |
| Elementary School | 58,416 | 15.8% |
| Middle School | 63,244 | 17.1% |
| High School | 59,946 | 16.3% |
| College / Undergraduate | 95,779 | 26.0% |
| Graduate / Professional | 51,644 | 14.0% |
| Total | 368,939 | 100.0% |
School Enrollment by Age by Funding Source in Area Code 646
Out of a total of 368,939 students who are enrolled in schools in Area Code 646, 145,028 (39.3%) attend a private institution, while the remaining 223,911 (60.7%) are enrolled in public schools. The age group of 18 to 19 year olds has the highest likelihood of being enrolled in private schools, with 22,340 (65.4% in the age bracket) enrolled. Conversely, the age group of 5 to 9 year old has the lowest likelihood of being enrolled in a private school, with 55,405 (79.0% in the age bracket) attending a public institution.
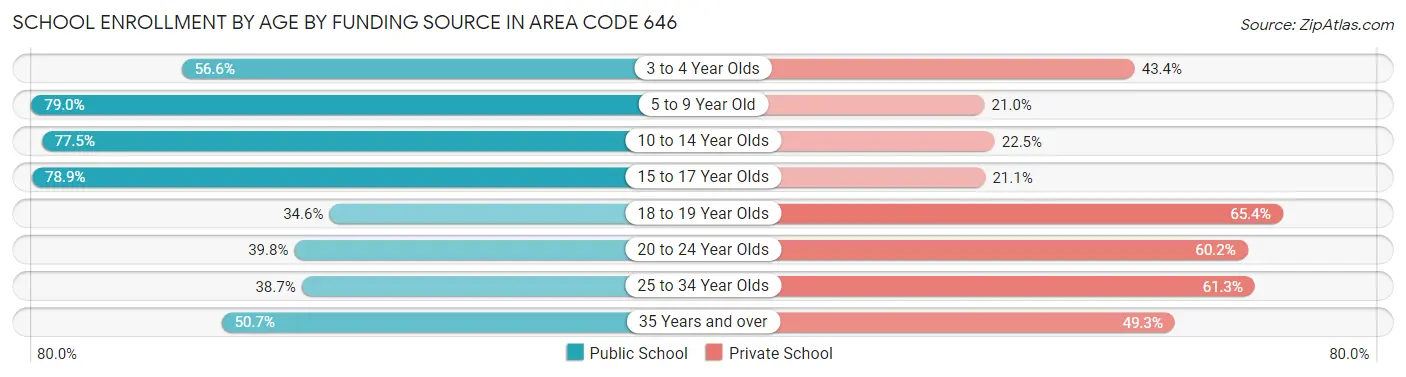
| Age Bracket | Public School | Private School |
| 3 to 4 Year Olds | 13,176 (56.6%) | 10,096 (43.4%) |
| 5 to 9 Year Old | 55,405 (79.0%) | 14,741 (21.0%) |
| 10 to 14 Year Olds | 60,130 (77.5%) | 17,483 (22.5%) |
| 15 to 17 Year Olds | 32,504 (78.9%) | 8,708 (21.1%) |
| 18 to 19 Year Olds | 11,823 (34.6%) | 22,340 (65.4%) |
| 20 to 24 Year Olds | 21,958 (39.8%) | 33,190 (60.2%) |
| 25 to 34 Year Olds | 16,937 (38.7%) | 26,786 (61.3%) |
| 35 Years and over | 11,988 (50.7%) | 11,674 (49.3%) |
| Total | 223,911 (60.7%) | 145,028 (39.3%) |
Educational Attainment by Field of Study in Area Code 646
Business (142,759 | 16.8%), social sciences (136,750 | 16.1%), visual & performing arts (91,349 | 10.7%), literature & languages (70,040 | 8.2%), and liberal arts & history (63,003 | 7.4%) are the most common fields of study among 849,522 individuals in Area Code 646 who have obtained a bachelor's degree or higher.
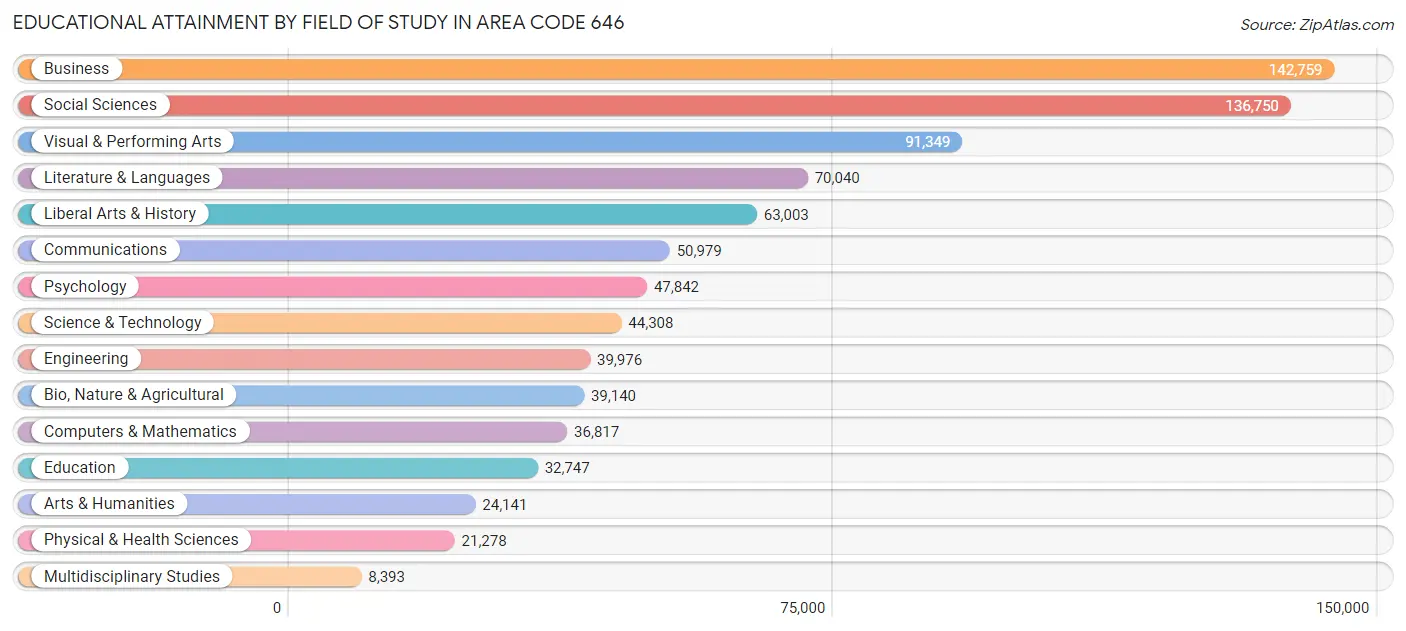
| Field of Study | # Graduates | % Graduates |
| Computers & Mathematics | 36,817 | 4.3% |
| Bio, Nature & Agricultural | 39,140 | 4.6% |
| Physical & Health Sciences | 21,278 | 2.5% |
| Psychology | 47,842 | 5.6% |
| Social Sciences | 136,750 | 16.1% |
| Engineering | 39,976 | 4.7% |
| Multidisciplinary Studies | 8,393 | 1.0% |
| Science & Technology | 44,308 | 5.2% |
| Business | 142,759 | 16.8% |
| Education | 32,747 | 3.8% |
| Literature & Languages | 70,040 | 8.2% |
| Liberal Arts & History | 63,003 | 7.4% |
| Visual & Performing Arts | 91,349 | 10.7% |
| Communications | 50,979 | 6.0% |
| Arts & Humanities | 24,141 | 2.8% |
| Total | 849,522 | 100.0% |
Transportation & Commute in Area Code 646
Vehicle Availability by Sex in Area Code 646
The most prevalent vehicle ownership categories in Area Code 646 are males with no vehicle (302,221, accounting for 68.5%) and females with no vehicle (318,298, making up 69.4%).
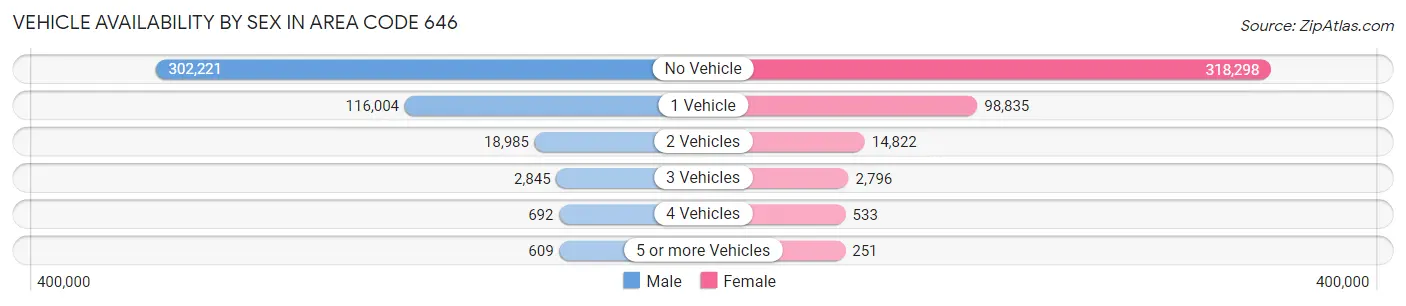
| Vehicles Available | Male | Female |
| No Vehicle | 302,221 (68.5%) | 318,298 (73.1%) |
| 1 Vehicle | 116,004 (26.3%) | 98,835 (22.7%) |
| 2 Vehicles | 18,985 (4.3%) | 14,822 (3.4%) |
| 3 Vehicles | 2,845 (0.6%) | 2,796 (0.6%) |
| 4 Vehicles | 692 (0.2%) | 533 (0.1%) |
| 5 or more Vehicles | 609 (0.1%) | 251 (0.1%) |
| Total | 441,356 (100.0%) | 435,535 (100.0%) |
Commute Time in Area Code 646
The most frequently occuring commute durations in Area Code 646 are 30 to 34 minutes (139,839 commuters, 19.5%), 45 to 59 minutes (97,500 commuters, 13.6%), and 20 to 24 minutes (93,171 commuters, 13.0%).
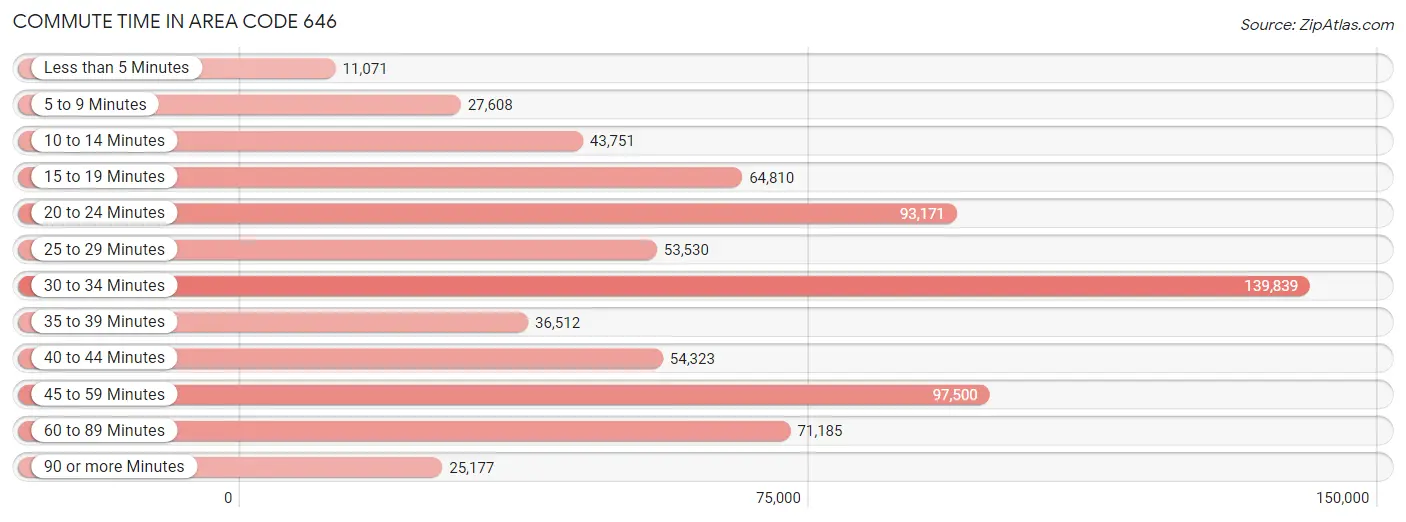
| Commute Time | # Commuters | % Commuters |
| Less than 5 Minutes | 11,071 | 1.5% |
| 5 to 9 Minutes | 27,608 | 3.8% |
| 10 to 14 Minutes | 43,751 | 6.1% |
| 15 to 19 Minutes | 64,810 | 9.0% |
| 20 to 24 Minutes | 93,171 | 13.0% |
| 25 to 29 Minutes | 53,530 | 7.4% |
| 30 to 34 Minutes | 139,839 | 19.5% |
| 35 to 39 Minutes | 36,512 | 5.1% |
| 40 to 44 Minutes | 54,323 | 7.6% |
| 45 to 59 Minutes | 97,500 | 13.6% |
| 60 to 89 Minutes | 71,185 | 9.9% |
| 90 or more Minutes | 25,177 | 3.5% |
Commute Time by Sex in Area Code 646
The most common commute times in Area Code 646 are 30 to 34 minutes (69,046 commuters, 19.1%) for males and 30 to 34 minutes (70,793 commuters, 19.8%) for females.
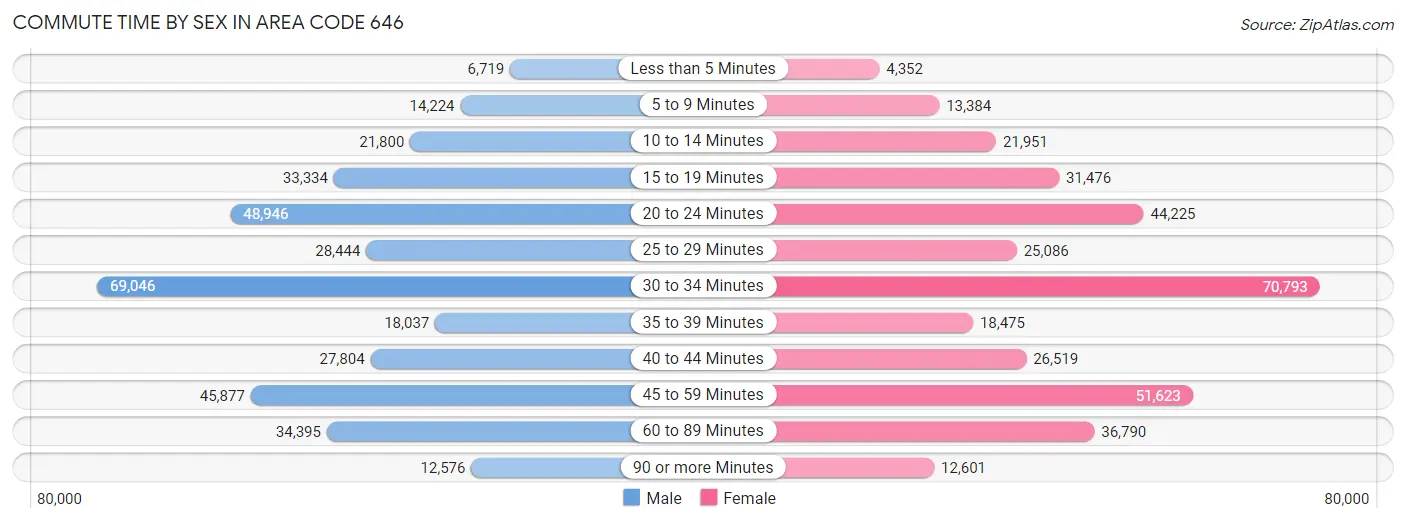
| Commute Time | Male | Female |
| Less than 5 Minutes | 6,719 (1.9%) | 4,352 (1.2%) |
| 5 to 9 Minutes | 14,224 (3.9%) | 13,384 (3.7%) |
| 10 to 14 Minutes | 21,800 (6.0%) | 21,951 (6.1%) |
| 15 to 19 Minutes | 33,334 (9.2%) | 31,476 (8.8%) |
| 20 to 24 Minutes | 48,946 (13.6%) | 44,225 (12.4%) |
| 25 to 29 Minutes | 28,444 (7.9%) | 25,086 (7.0%) |
| 30 to 34 Minutes | 69,046 (19.1%) | 70,793 (19.8%) |
| 35 to 39 Minutes | 18,037 (5.0%) | 18,475 (5.2%) |
| 40 to 44 Minutes | 27,804 (7.7%) | 26,519 (7.4%) |
| 45 to 59 Minutes | 45,877 (12.7%) | 51,623 (14.4%) |
| 60 to 89 Minutes | 34,395 (9.5%) | 36,790 (10.3%) |
| 90 or more Minutes | 12,576 (3.5%) | 12,601 (3.5%) |
Time of Departure to Work by Sex in Area Code 646
The most frequent times of departure to work in Area Code 646 are 8:00 AM to 8:29 AM (65,506, 18.1%) for males and 8:00 AM to 8:29 AM (69,442, 19.4%) for females.
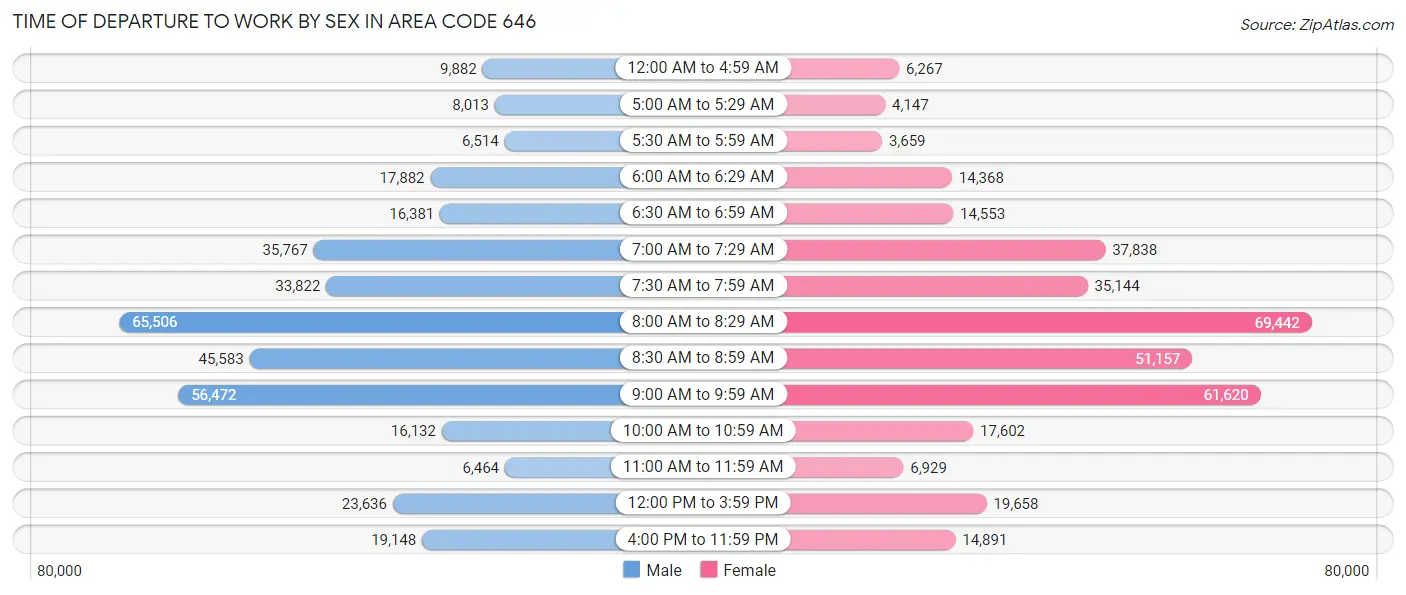
| Time of Departure | Male | Female |
| 12:00 AM to 4:59 AM | 9,882 (2.7%) | 6,267 (1.8%) |
| 5:00 AM to 5:29 AM | 8,013 (2.2%) | 4,147 (1.2%) |
| 5:30 AM to 5:59 AM | 6,514 (1.8%) | 3,659 (1.0%) |
| 6:00 AM to 6:29 AM | 17,882 (5.0%) | 14,368 (4.0%) |
| 6:30 AM to 6:59 AM | 16,381 (4.5%) | 14,553 (4.1%) |
| 7:00 AM to 7:29 AM | 35,767 (9.9%) | 37,838 (10.6%) |
| 7:30 AM to 7:59 AM | 33,822 (9.4%) | 35,144 (9.8%) |
| 8:00 AM to 8:29 AM | 65,506 (18.1%) | 69,442 (19.4%) |
| 8:30 AM to 8:59 AM | 45,583 (12.6%) | 51,157 (14.3%) |
| 9:00 AM to 9:59 AM | 56,472 (15.6%) | 61,620 (17.2%) |
| 10:00 AM to 10:59 AM | 16,132 (4.5%) | 17,602 (4.9%) |
| 11:00 AM to 11:59 AM | 6,464 (1.8%) | 6,929 (1.9%) |
| 12:00 PM to 3:59 PM | 23,636 (6.5%) | 19,658 (5.5%) |
| 4:00 PM to 11:59 PM | 19,148 (5.3%) | 14,891 (4.2%) |
| Total | 361,202 (100.0%) | 357,275 (100.0%) |
Housing Occupancy in Area Code 646
Occupancy by Ownership in Area Code 646
Of the total 783,618 dwellings in Area Code 646, owner-occupied units account for 179,120 (22.9%), while renter-occupied units make up 604,498 (77.1%).
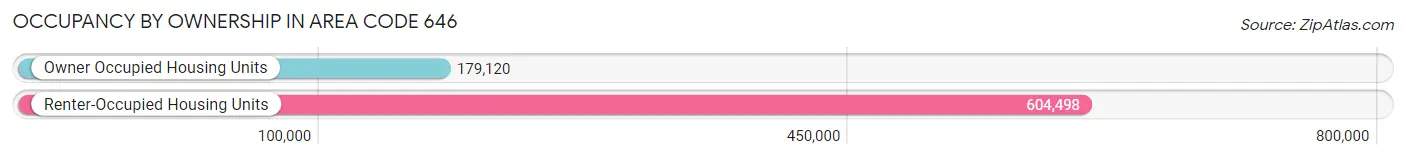
| Occupancy | # Housing Units | % Housing Units |
| Owner Occupied Housing Units | 179,120 | 22.9% |
| Renter-Occupied Housing Units | 604,498 | 77.1% |
| Total Occupied Housing Units | 783,618 | 100.0% |
Occupancy by Household Size in Area Code 646
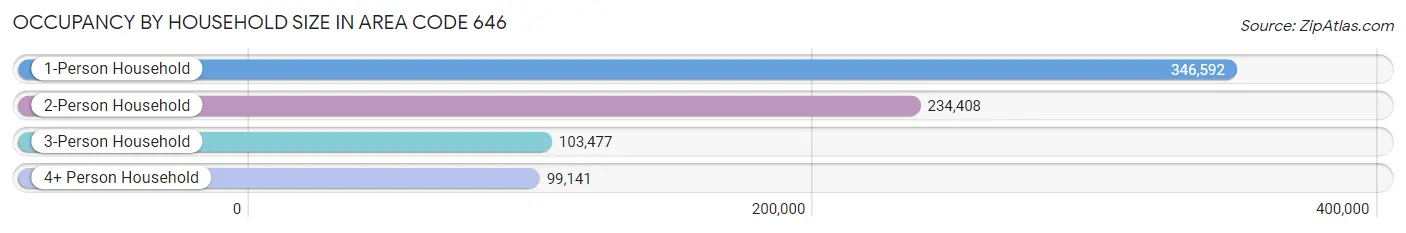
| Household Size | # Housing Units | % Housing Units |
| 1-Person Household | 346,592 | 44.2% |
| 2-Person Household | 234,408 | 29.9% |
| 3-Person Household | 103,477 | 13.2% |
| 4+ Person Household | 99,141 | 12.7% |
| Total Housing Units | 783,618 | 100.0% |
Occupancy by Ownership by Household Size in Area Code 646
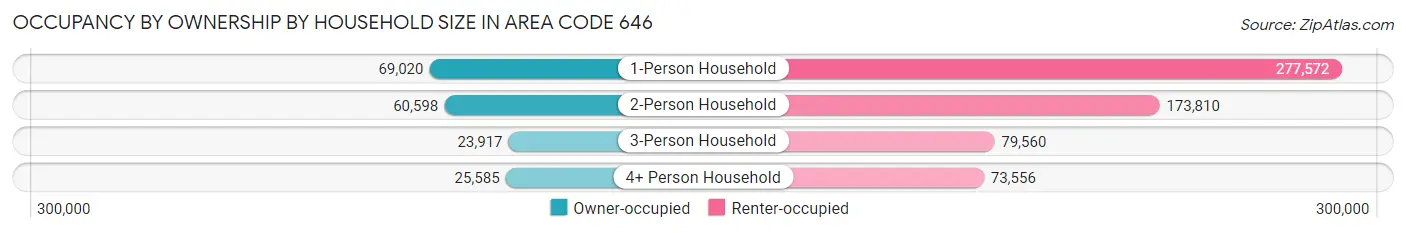
| Household Size | Owner-occupied | Renter-occupied |
| 1-Person Household | 69,020 (19.9%) | 277,572 (80.1%) |
| 2-Person Household | 60,598 (25.9%) | 173,810 (74.2%) |
| 3-Person Household | 23,917 (23.1%) | 79,560 (76.9%) |
| 4+ Person Household | 25,585 (25.8%) | 73,556 (74.2%) |
| Total Housing Units | 179,120 (22.9%) | 604,498 (77.1%) |
Occupancy by Educational Attainment in Area Code 646
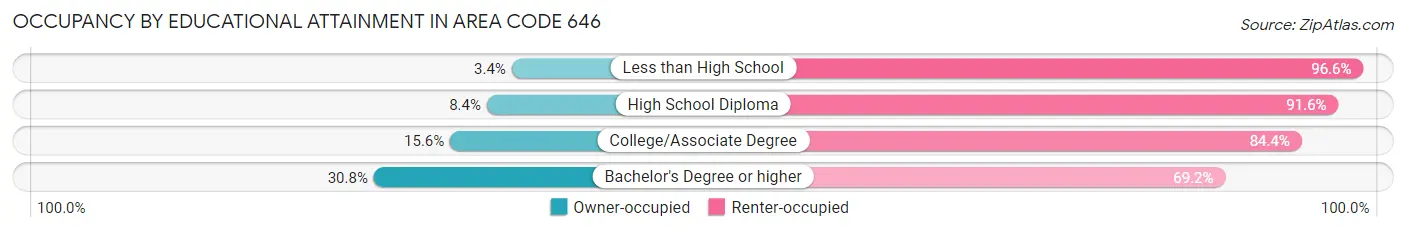
| Household Size | Owner-occupied | Renter-occupied |
| Less than High School | 3,005 (3.4%) | 84,607 (96.6%) |
| High School Diploma | 7,669 (8.4%) | 84,080 (91.6%) |
| College/Associate Degree | 18,141 (15.6%) | 97,851 (84.4%) |
| Bachelor's Degree or higher | 150,305 (30.8%) | 337,960 (69.2%) |
Occupancy by Age of Householder in Area Code 646
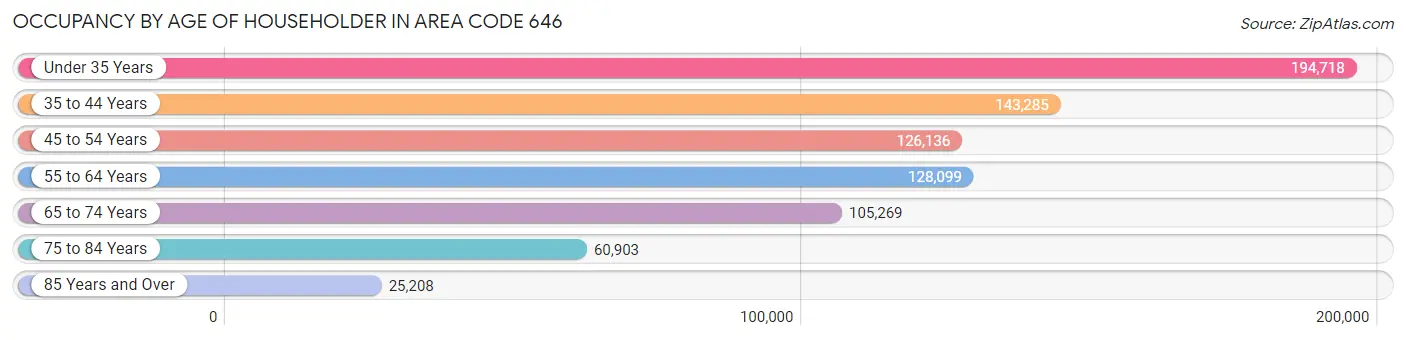
| Age Bracket | # Households | % Households |
| Under 35 Years | 194,718 | 24.8% |
| 35 to 44 Years | 143,285 | 18.3% |
| 45 to 54 Years | 126,136 | 16.1% |
| 55 to 64 Years | 128,099 | 16.4% |
| 65 to 74 Years | 105,269 | 13.4% |
| 75 to 84 Years | 60,903 | 7.8% |
| 85 Years and Over | 25,208 | 3.2% |
| Total | 783,618 | 100.0% |
Housing Finances in Area Code 646
Median Income by Occupancy in Area Code 646
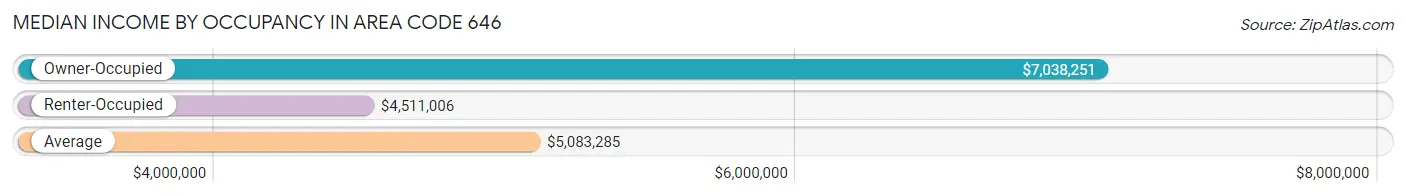
| Occupancy Type | # Households | Median Income |
| Owner-Occupied | 179,120 (22.9%) | $7,038,251 |
| Renter-Occupied | 604,498 (77.1%) | $4,511,006 |
| Average | 783,618 (100.0%) | $5,083,285 |
Occupancy by Householder Income Bracket in Area Code 646
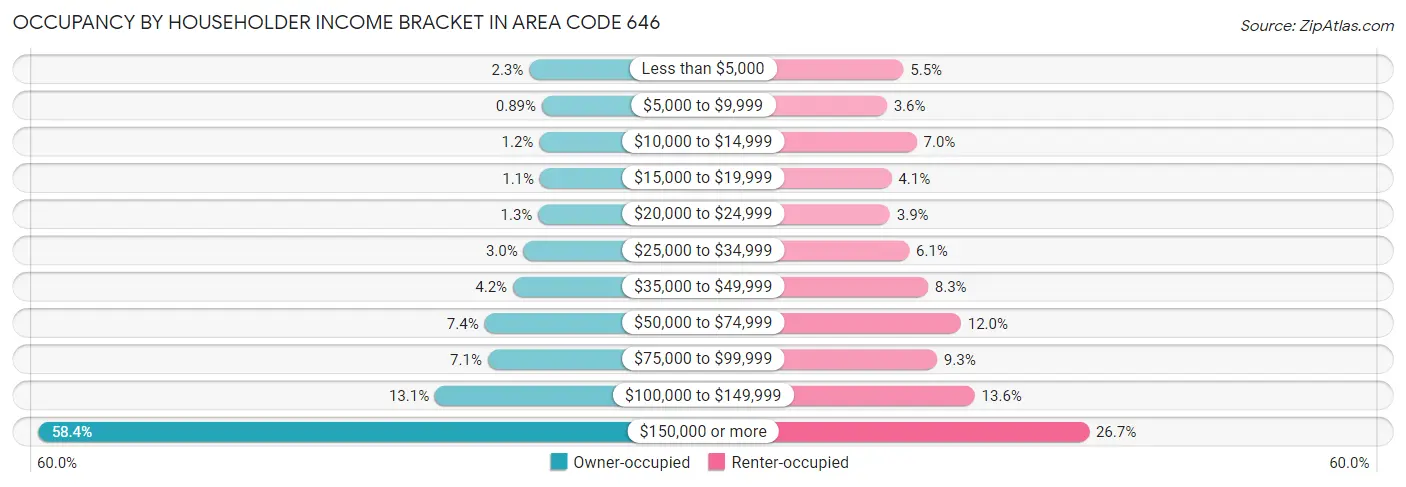
| Income Bracket | Owner-occupied | Renter-occupied |
| Less than $5,000 | 4,186 (2.3%) | 32,985 (5.5%) |
| $5,000 to $9,999 | 1,595 (0.9%) | 21,517 (3.6%) |
| $10,000 to $14,999 | 2,139 (1.2%) | 42,169 (7.0%) |
| $15,000 to $19,999 | 1,994 (1.1%) | 24,811 (4.1%) |
| $20,000 to $24,999 | 2,345 (1.3%) | 23,677 (3.9%) |
| $25,000 to $34,999 | 5,329 (3.0%) | 36,979 (6.1%) |
| $35,000 to $49,999 | 7,507 (4.2%) | 49,937 (8.3%) |
| $50,000 to $74,999 | 13,318 (7.4%) | 72,708 (12.0%) |
| $75,000 to $99,999 | 12,669 (7.1%) | 56,205 (9.3%) |
| $100,000 to $149,999 | 23,468 (13.1%) | 82,253 (13.6%) |
| $150,000 or more | 104,570 (58.4%) | 161,257 (26.7%) |
| Total | 179,120 (100.0%) | 604,498 (100.0%) |
Monthly Housing Cost Tiers in Area Code 646
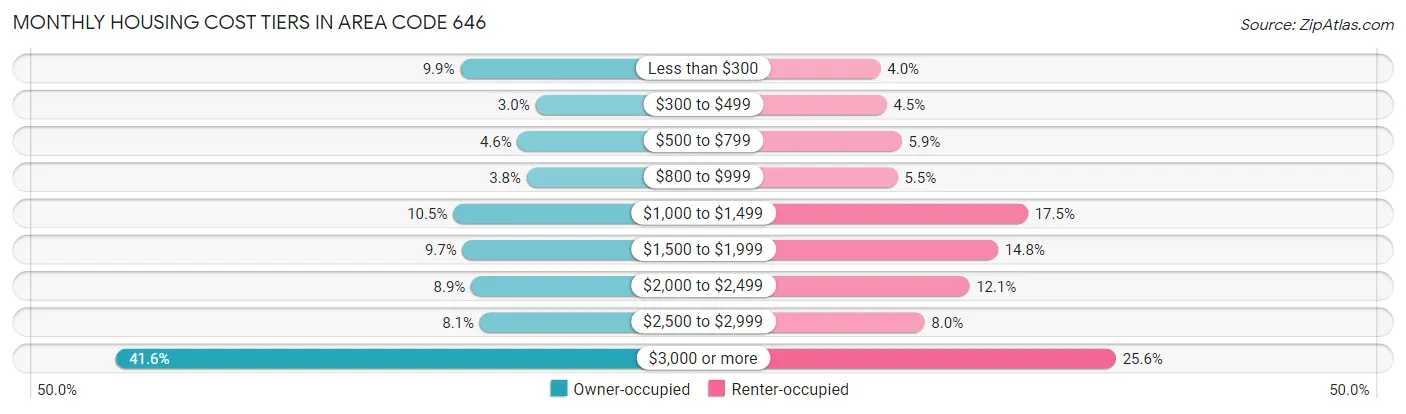
| Monthly Cost | Owner-occupied | Renter-occupied |
| Less than $300 | 17,709 (9.9%) | 23,853 (4.0%) |
| $300 to $499 | 5,322 (3.0%) | 27,306 (4.5%) |
| $500 to $799 | 8,279 (4.6%) | 35,752 (5.9%) |
| $800 to $999 | 6,740 (3.8%) | 33,403 (5.5%) |
| $1,000 to $1,499 | 18,873 (10.5%) | 105,900 (17.5%) |
| $1,500 to $1,999 | 17,340 (9.7%) | 89,229 (14.8%) |
| $2,000 to $2,499 | 15,923 (8.9%) | 73,334 (12.1%) |
| $2,500 to $2,999 | 14,485 (8.1%) | 48,440 (8.0%) |
| $3,000 or more | 74,449 (41.6%) | 154,884 (25.6%) |
| Total | 179,120 (100.0%) | 604,498 (100.0%) |
Physical Housing Characteristics in Area Code 646
Housing Structures in Area Code 646
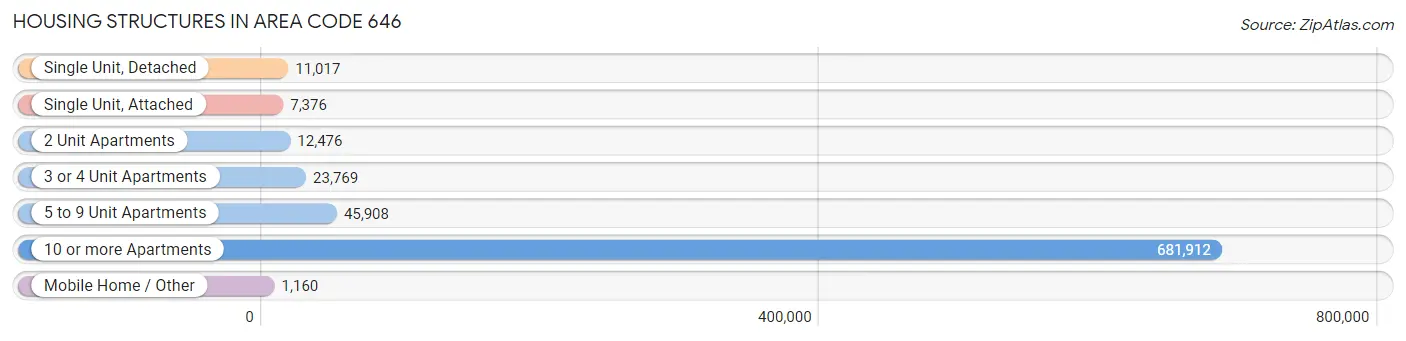
| Structure Type | # Housing Units | % Housing Units |
| Single Unit, Detached | 11,017 | 1.4% |
| Single Unit, Attached | 7,376 | 0.9% |
| 2 Unit Apartments | 12,476 | 1.6% |
| 3 or 4 Unit Apartments | 23,769 | 3.0% |
| 5 to 9 Unit Apartments | 45,908 | 5.9% |
| 10 or more Apartments | 681,912 | 87.0% |
| Mobile Home / Other | 1,160 | 0.2% |
| Total | 783,618 | 100.0% |
Housing Structures by Occupancy in Area Code 646
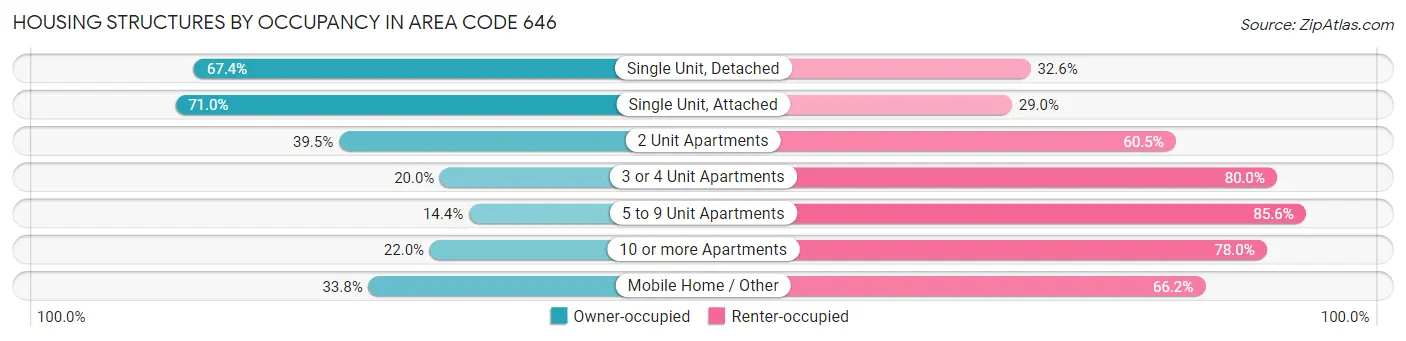
| Structure Type | Owner-occupied | Renter-occupied |
| Single Unit, Detached | 7,426 (67.4%) | 3,591 (32.6%) |
| Single Unit, Attached | 5,237 (71.0%) | 2,139 (29.0%) |
| 2 Unit Apartments | 4,923 (39.5%) | 7,553 (60.5%) |
| 3 or 4 Unit Apartments | 4,749 (20.0%) | 19,020 (80.0%) |
| 5 to 9 Unit Apartments | 6,629 (14.4%) | 39,279 (85.6%) |
| 10 or more Apartments | 149,764 (22.0%) | 532,148 (78.0%) |
| Mobile Home / Other | 392 (33.8%) | 768 (66.2%) |
| Total | 179,120 (22.9%) | 604,498 (77.1%) |
Housing Structures by Number of Rooms in Area Code 646
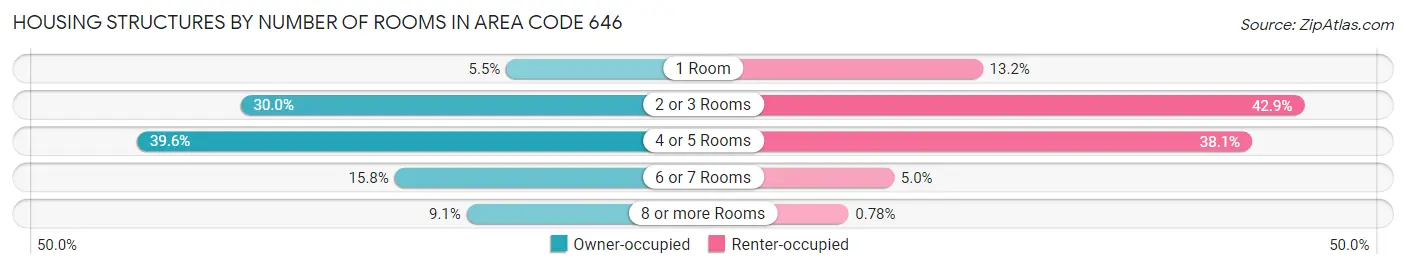
| Number of Rooms | Owner-occupied | Renter-occupied |
| 1 Room | 9,777 (5.5%) | 79,809 (13.2%) |
| 2 or 3 Rooms | 53,792 (30.0%) | 259,546 (42.9%) |
| 4 or 5 Rooms | 70,956 (39.6%) | 230,291 (38.1%) |
| 6 or 7 Rooms | 28,262 (15.8%) | 30,167 (5.0%) |
| 8 or more Rooms | 16,333 (9.1%) | 4,685 (0.8%) |
| Total | 179,120 (100.0%) | 604,498 (100.0%) |
Housing Structure by Heating Type in Area Code 646
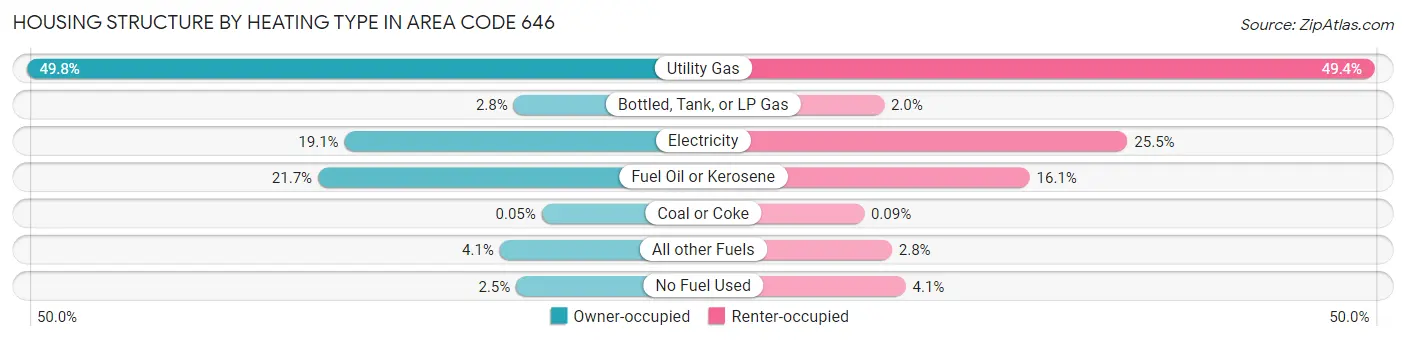
| Heating Type | Owner-occupied | Renter-occupied |
| Utility Gas | 89,242 (49.8%) | 298,336 (49.3%) |
| Bottled, Tank, or LP Gas | 4,952 (2.8%) | 12,229 (2.0%) |
| Electricity | 34,211 (19.1%) | 154,376 (25.5%) |
| Fuel Oil or Kerosene | 38,791 (21.7%) | 97,328 (16.1%) |
| Coal or Coke | 86 (0.1%) | 554 (0.1%) |
| All other Fuels | 7,336 (4.1%) | 16,813 (2.8%) |
| No Fuel Used | 4,502 (2.5%) | 24,862 (4.1%) |
| Total | 179,120 (100.0%) | 604,498 (100.0%) |
Household Vehicle Usage in Area Code 646
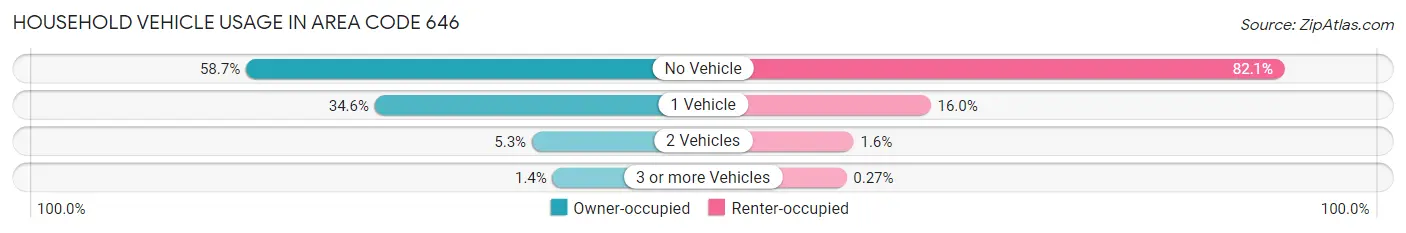
| Vehicles per Household | Owner-occupied | Renter-occupied |
| No Vehicle | 105,096 (58.7%) | 496,468 (82.1%) |
| 1 Vehicle | 62,020 (34.6%) | 96,653 (16.0%) |
| 2 Vehicles | 9,465 (5.3%) | 9,747 (1.6%) |
| 3 or more Vehicles | 2,539 (1.4%) | 1,630 (0.3%) |
| Total | 179,120 (100.0%) | 604,498 (100.0%) |
Real Estate & Mortgages in Area Code 646
Real Estate and Mortgage Overview in Area Code 646
| Characteristic | Without Mortgage | With Mortgage |
| Housing Units | 88,483 | 90,637 |
| Median Property Value | $38,793,504 | $44,438,703 |
| Median Household Income | $4,697,255 | $63,316 |
| Monthly Housing Costs | $42,461 | $59,764 |
| Real Estate Taxes | $292,920 | $19,581 |
Property Value by Mortgage Status in Area Code 646
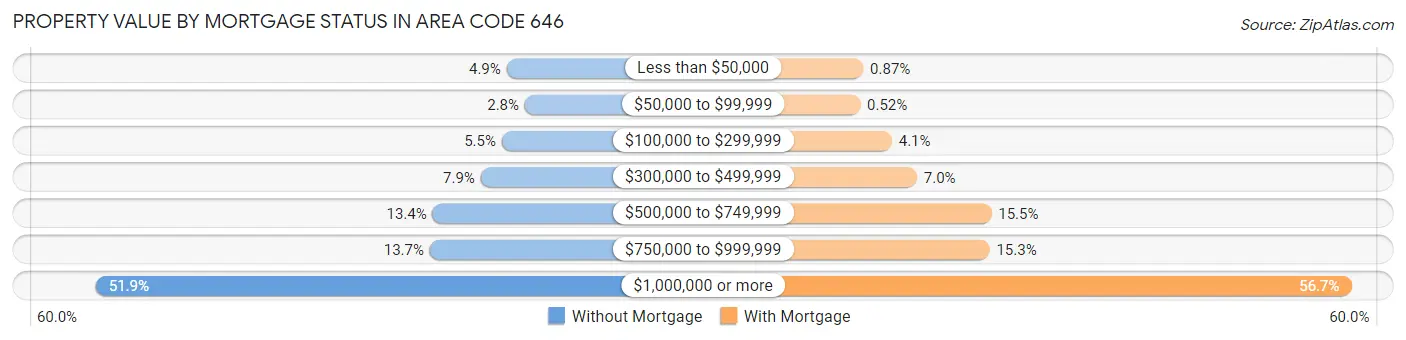
| Property Value | Without Mortgage | With Mortgage |
| Less than $50,000 | 4,344 (4.9%) | 785 (0.9%) |
| $50,000 to $99,999 | 2,504 (2.8%) | 469 (0.5%) |
| $100,000 to $299,999 | 4,829 (5.5%) | 3,749 (4.1%) |
| $300,000 to $499,999 | 6,972 (7.9%) | 6,355 (7.0%) |
| $500,000 to $749,999 | 11,838 (13.4%) | 14,055 (15.5%) |
| $750,000 to $999,999 | 12,110 (13.7%) | 13,877 (15.3%) |
| $1,000,000 or more | 45,886 (51.9%) | 51,347 (56.7%) |
| Total | 88,483 (100.0%) | 90,637 (100.0%) |
Household Income by Mortgage Status in Area Code 646
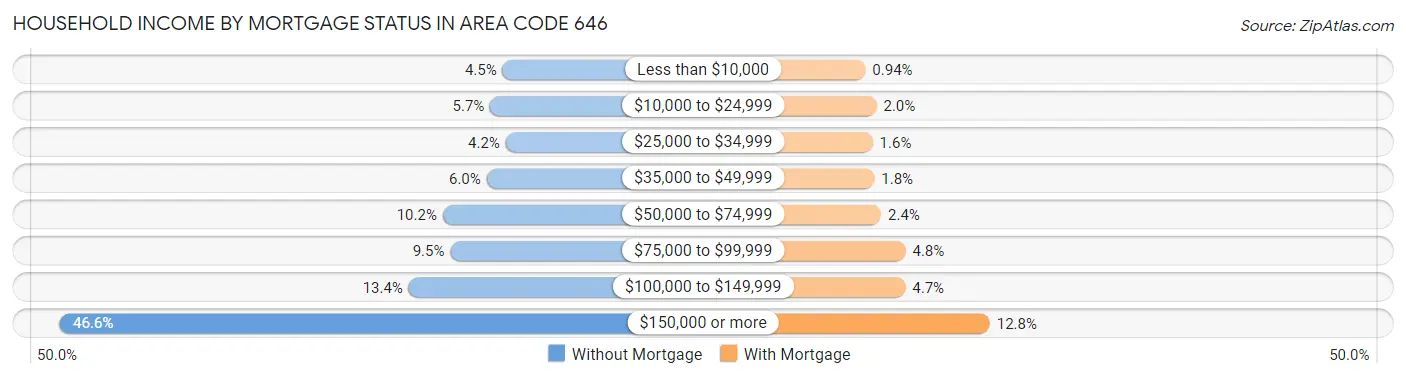
| Household Income | Without Mortgage | With Mortgage |
| Less than $10,000 | 3,967 (4.5%) | 855 (0.9%) |
| $10,000 to $24,999 | 5,005 (5.7%) | 1,814 (2.0%) |
| $25,000 to $34,999 | 3,703 (4.2%) | 1,473 (1.6%) |
| $35,000 to $49,999 | 5,305 (6.0%) | 1,626 (1.8%) |
| $50,000 to $74,999 | 9,004 (10.2%) | 2,202 (2.4%) |
| $75,000 to $99,999 | 8,370 (9.5%) | 4,314 (4.8%) |
| $100,000 to $149,999 | 11,875 (13.4%) | 4,299 (4.7%) |
| $150,000 or more | 41,254 (46.6%) | 11,593 (12.8%) |
| Total | 88,483 (100.0%) | 90,637 (100.0%) |
Property Value to Household Income Ratio in Area Code 646
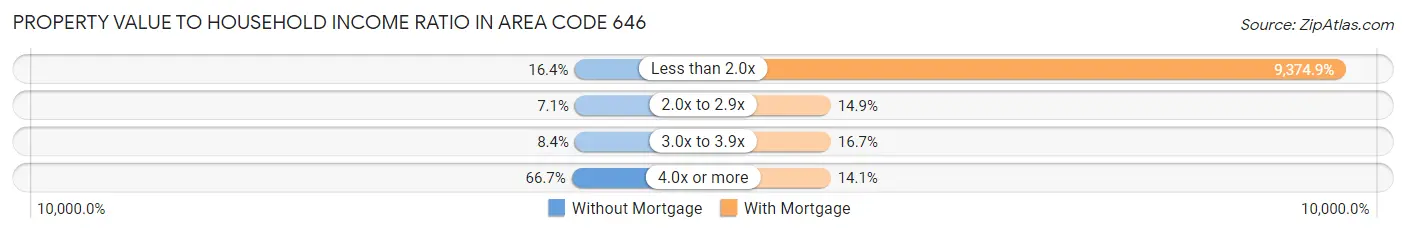
| Value-to-Income Ratio | Without Mortgage | With Mortgage |
| Less than 2.0x | 14,473 (16.4%) | 8,497,081 (9,374.9%) |
| 2.0x to 2.9x | 6,297 (7.1%) | 13,481 (14.9%) |
| 3.0x to 3.9x | 7,406 (8.4%) | 15,166 (16.7%) |
| 4.0x or more | 59,022 (66.7%) | 12,778 (14.1%) |
| Total | 88,483 (100.0%) | 90,637 (100.0%) |
Real Estate Taxes by Mortgage Status in Area Code 646
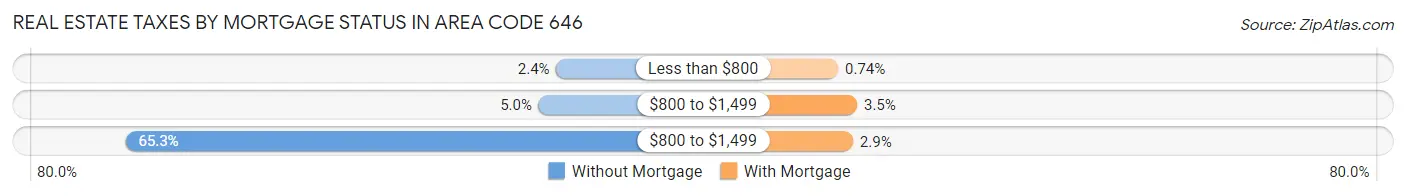
| Property Taxes | Without Mortgage | With Mortgage |
| Less than $800 | 2,159 (2.4%) | 672 (0.7%) |
| $800 to $1,499 | 4,433 (5.0%) | 3,180 (3.5%) |
| $800 to $1,499 | 57,743 (65.3%) | 2,624 (2.9%) |
| Total | 88,483 (100.0%) | 90,637 (100.0%) |
Health & Disability in Area Code 646
Health Insurance Coverage by Age in Area Code 646
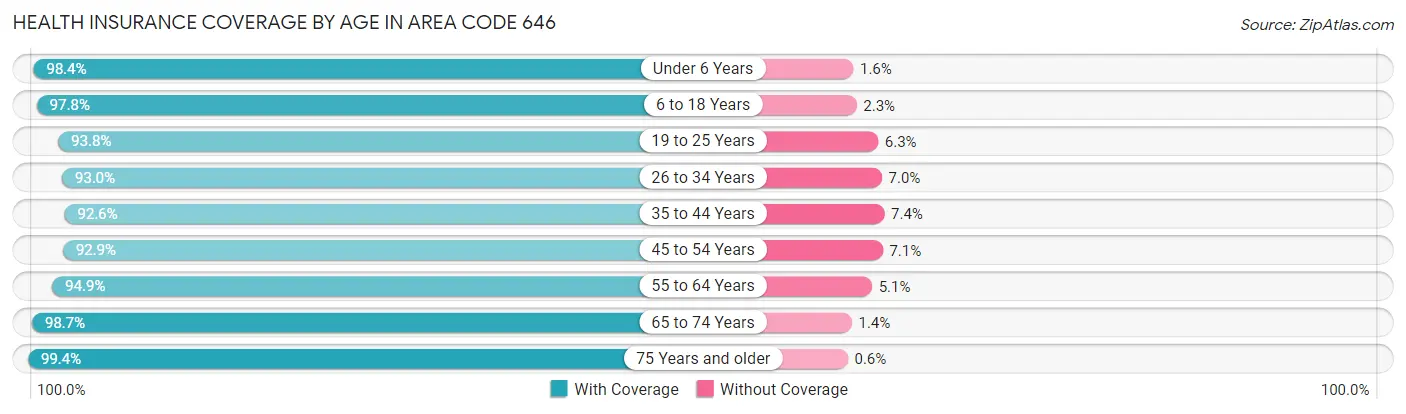
| Age Bracket | With Coverage | Without Coverage |
| Under 6 Years | 101,820 (98.4%) | 1,683 (1.6%) |
| 6 to 18 Years | 194,618 (97.8%) | 4,474 (2.2%) |
| 19 to 25 Years | 164,759 (93.8%) | 10,981 (6.2%) |
| 26 to 34 Years | 300,086 (93.0%) | 22,432 (7.0%) |
| 35 to 44 Years | 237,387 (92.6%) | 19,022 (7.4%) |
| 45 to 54 Years | 197,744 (92.9%) | 15,127 (7.1%) |
| 55 to 64 Years | 186,207 (94.9%) | 10,046 (5.1%) |
| 65 to 74 Years | 149,692 (98.7%) | 2,052 (1.3%) |
| 75 Years and older | 116,558 (99.4%) | 701 (0.6%) |
| Total | 1,648,871 (95.0%) | 86,518 (5.0%) |
Health Insurance Coverage by Citizenship Status in Area Code 646
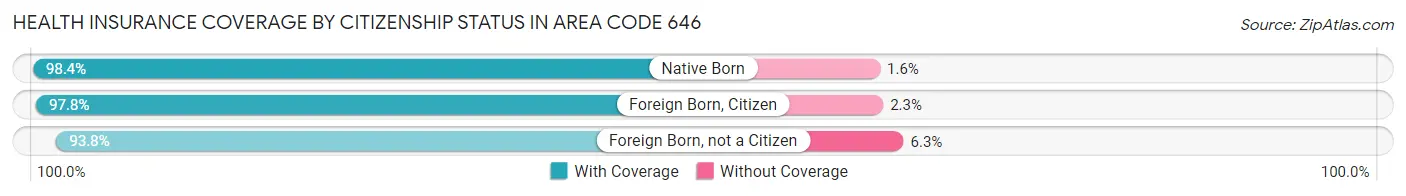
| Citizenship Status | With Coverage | Without Coverage |
| Native Born | 101,820 (98.4%) | 1,683 (1.6%) |
| Foreign Born, Citizen | 194,618 (97.8%) | 4,474 (2.2%) |
| Foreign Born, not a Citizen | 164,759 (93.8%) | 10,981 (6.2%) |
Health Insurance Coverage by Household Income in Area Code 646
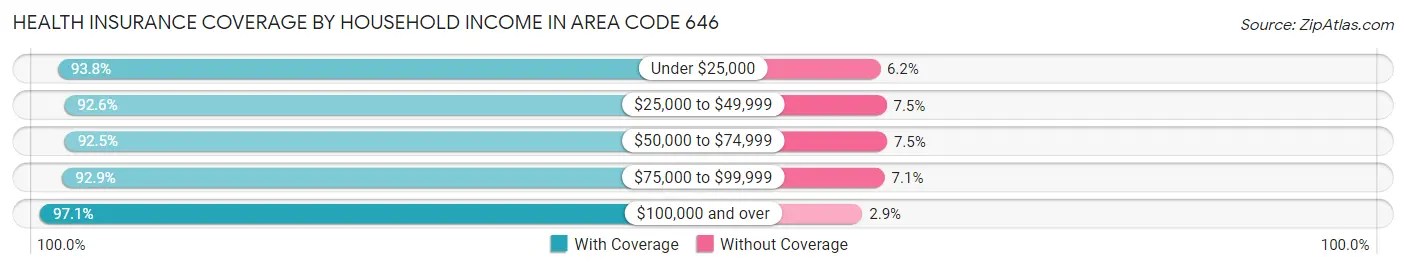
| Household Income | With Coverage | Without Coverage |
| Under $25,000 | 250,931 (93.8%) | 16,640 (6.2%) |
| $25,000 to $49,999 | 191,773 (92.5%) | 15,440 (7.4%) |
| $50,000 to $74,999 | 174,773 (92.5%) | 14,213 (7.5%) |
| $75,000 to $99,999 | 135,350 (92.9%) | 10,328 (7.1%) |
| $100,000 and over | 836,851 (97.1%) | 25,144 (2.9%) |
Public vs Private Health Insurance Coverage by Age in Area Code 646
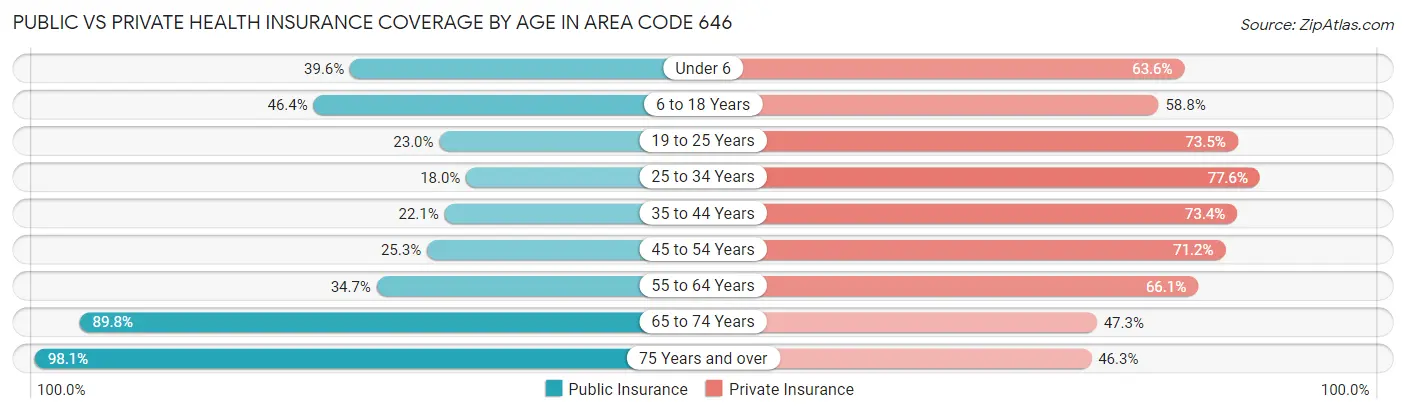
| Age Bracket | Public Insurance | Private Insurance |
| Under 6 | 40,962 (39.6%) | 65,783 (63.6%) |
| 6 to 18 Years | 92,310 (46.4%) | 117,021 (58.8%) |
| 19 to 25 Years | 40,432 (23.0%) | 129,116 (73.5%) |
| 25 to 34 Years | 58,136 (18.0%) | 250,201 (77.6%) |
| 35 to 44 Years | 56,532 (22.1%) | 188,148 (73.4%) |
| 45 to 54 Years | 53,871 (25.3%) | 151,505 (71.2%) |
| 55 to 64 Years | 68,006 (34.6%) | 129,751 (66.1%) |
| 65 to 74 Years | 136,225 (89.8%) | 71,806 (47.3%) |
| 75 Years and over | 115,016 (98.1%) | 54,292 (46.3%) |
| Total | 661,490 (38.1%) | 1,157,623 (66.7%) |
Disability Status by Sex by Age in Area Code 646
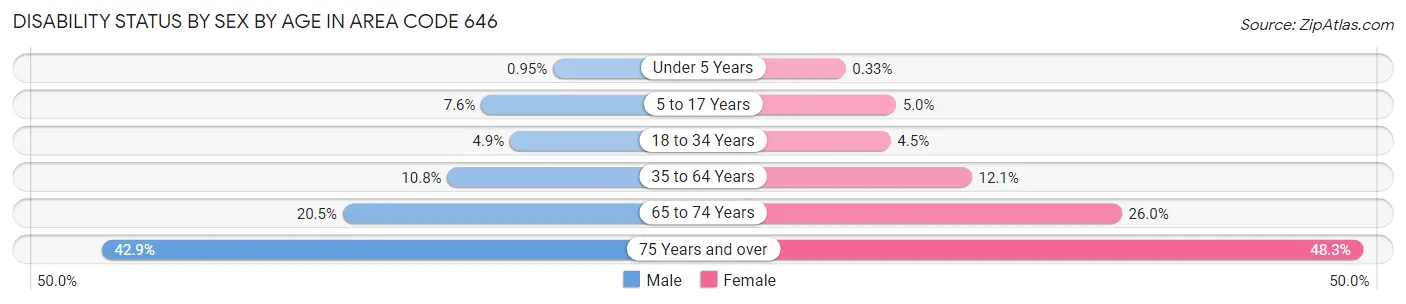
| Age Bracket | Male | Female |
| Under 5 Years | 416 (0.9%) | 149 (0.3%) |
| 5 to 17 Years | 7,419 (7.6%) | 4,848 (5.0%) |
| 18 to 34 Years | 12,043 (4.9%) | 12,331 (4.5%) |
| 35 to 64 Years | 35,427 (10.8%) | 40,519 (12.0%) |
| 65 to 74 Years | 13,242 (20.5%) | 22,600 (26.0%) |
| 75 Years and over | 18,963 (42.9%) | 35,286 (48.3%) |
Disability Class by Sex by Age in Area Code 646
Disability Class: Hearing Difficulty
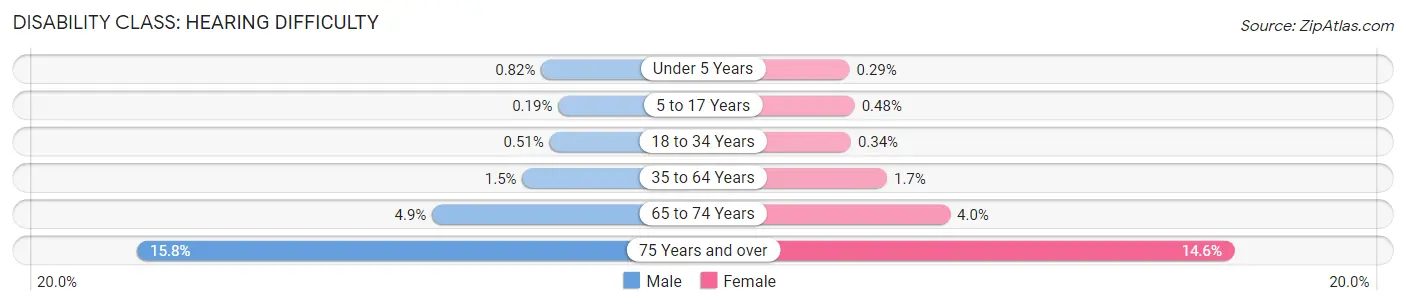
| Age Bracket | Male | Female |
| Under 5 Years | 359 (0.8%) | 130 (0.3%) |
| 5 to 17 Years | 188 (0.2%) | 460 (0.5%) |
| 18 to 34 Years | 1,245 (0.5%) | 919 (0.3%) |
| 35 to 64 Years | 5,005 (1.5%) | 5,656 (1.7%) |
| 65 to 74 Years | 3,150 (4.9%) | 3,500 (4.0%) |
| 75 Years and over | 6,998 (15.8%) | 10,622 (14.5%) |
Disability Class: Vision Difficulty
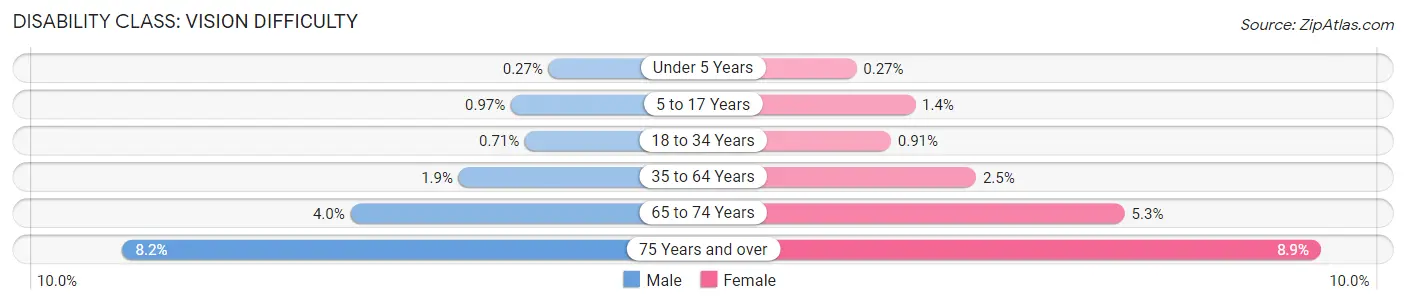
| Age Bracket | Male | Female |
| Under 5 Years | 117 (0.3%) | 124 (0.3%) |
| 5 to 17 Years | 950 (1.0%) | 1,316 (1.4%) |
| 18 to 34 Years | 1,735 (0.7%) | 2,496 (0.9%) |
| 35 to 64 Years | 6,387 (1.9%) | 8,369 (2.5%) |
| 65 to 74 Years | 2,555 (4.0%) | 4,570 (5.2%) |
| 75 Years and over | 3,621 (8.2%) | 6,489 (8.9%) |
Disability Class: Cognitive Difficulty
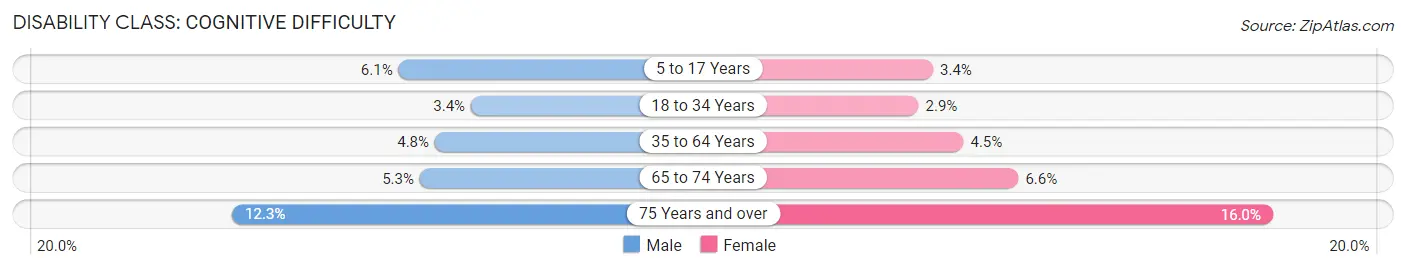
| Age Bracket | Male | Female |
| 5 to 17 Years | 5,973 (6.1%) | 3,274 (3.4%) |
| 18 to 34 Years | 8,354 (3.4%) | 7,800 (2.9%) |
| 35 to 64 Years | 15,710 (4.8%) | 15,184 (4.5%) |
| 65 to 74 Years | 3,448 (5.3%) | 5,714 (6.6%) |
| 75 Years and over | 5,444 (12.3%) | 11,685 (16.0%) |
Disability Class: Ambulatory Difficulty
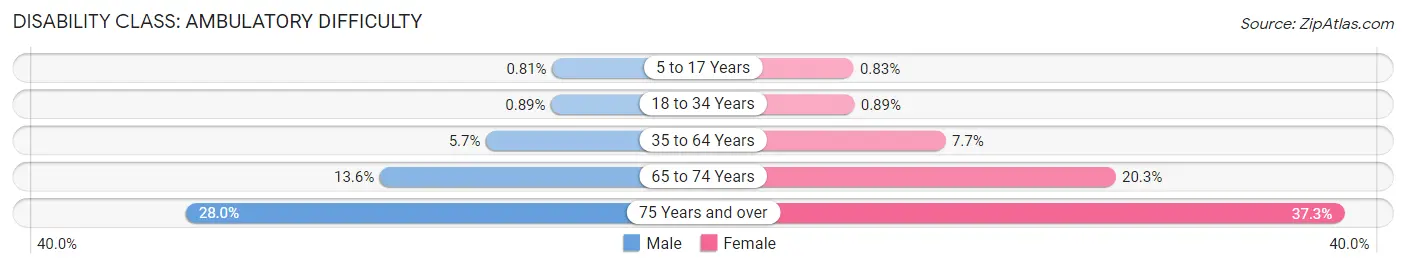
| Age Bracket | Male | Female |
| 5 to 17 Years | 786 (0.8%) | 802 (0.8%) |
| 18 to 34 Years | 2,164 (0.9%) | 2,445 (0.9%) |
| 35 to 64 Years | 18,837 (5.7%) | 25,745 (7.7%) |
| 65 to 74 Years | 8,806 (13.6%) | 17,658 (20.3%) |
| 75 Years and over | 12,403 (28.0%) | 27,227 (37.3%) |
Disability Class: Self-Care Difficulty
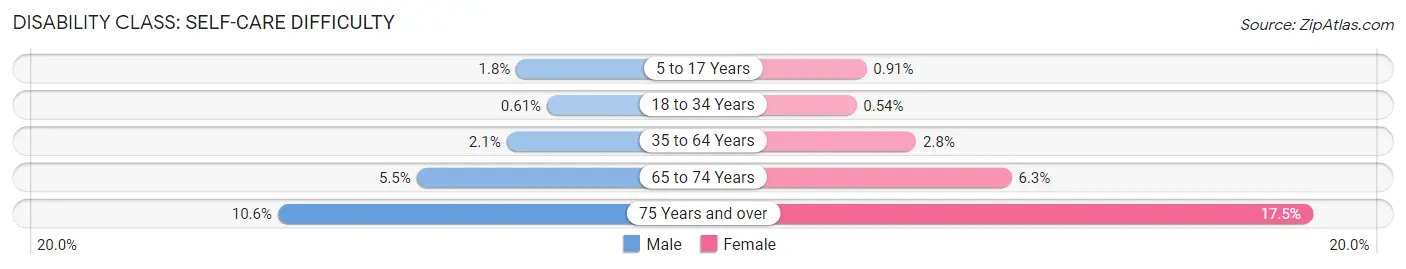
| Age Bracket | Male | Female |
| 5 to 17 Years | 1,710 (1.8%) | 878 (0.9%) |
| 18 to 34 Years | 1,479 (0.6%) | 1,474 (0.5%) |
| 35 to 64 Years | 6,963 (2.1%) | 9,286 (2.8%) |
| 65 to 74 Years | 3,527 (5.4%) | 5,484 (6.3%) |
| 75 Years and over | 4,691 (10.6%) | 12,761 (17.5%) |
Technology Access in Area Code 646
Computing Device Access in Area Code 646
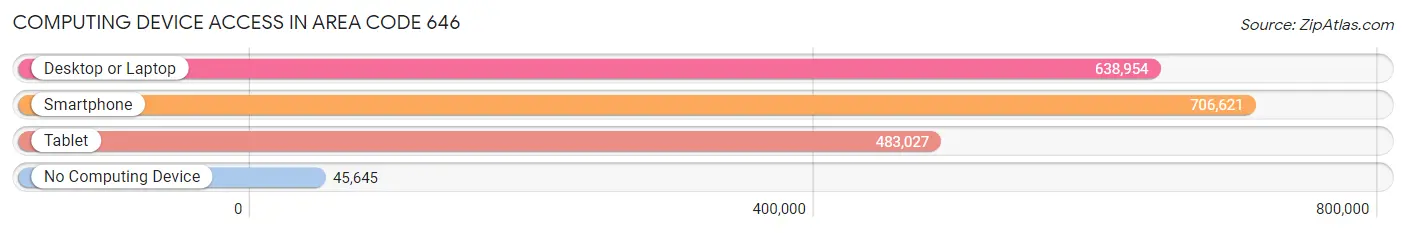
| Device Type | # Households | % Households |
| Desktop or Laptop | 638,954 | 81.5% |
| Smartphone | 706,621 | 90.2% |
| Tablet | 483,027 | 61.6% |
| No Computing Device | 45,645 | 5.8% |
| Total | 783,618 | 100.0% |
Internet Access in Area Code 646
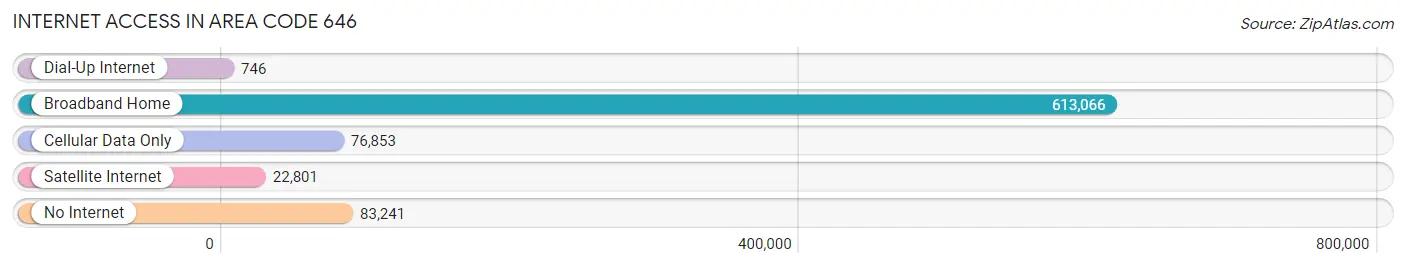
| Internet Type | # Households | % Households |
| Dial-Up Internet | 746 | 0.1% |
| Broadband Home | 613,066 | 78.2% |
| Cellular Data Only | 76,853 | 9.8% |
| Satellite Internet | 22,801 | 2.9% |
| No Internet | 83,241 | 10.6% |
| Total | 783,618 | 100.0% |
Area Code 646 Summary
Geography
Area code 646 is an area code in the North American Numbering Plan (NANP) for the boroughs of Manhattan and the Bronx in New York City. It was created in 1999 as an overlay to area code 212, which had been in use since 1947.
Social
Area code 646 is a popular area code in New York City, as it is associated with the city's vibrant culture and lifestyle. It is often associated with the city's financial and entertainment industries, as well as its diverse population.
Economics
Area code 646 is an important area code for the economy of New York City. It is home to many of the city's financial institutions, as well as its entertainment industry. It is also home to many of the city's small businesses, which are essential to the city's economy.
Demographics
Area code 646 is home to a diverse population, with a large number of immigrants from all over the world. The population is largely made up of young professionals, as well as students and families. The area is also home to a large number of artists, musicians, and other creative types.
Common Questions
What is Per Capita Income in Area Code 646?
Per Capita income in Area Code 646 is $109,745.
What is the Median Family Income in Area Code 646?
Median Family Income in Area Code 646 is $159,202.
What is the Median Household income in Area Code 646?
Median Household Income in Area Code 646 is $121,031.
What is Income or Wage Gap in Area Code 646?
Income or Wage Gap in Area Code 646 is 26.6%.
Women in Area Code 646 earn 73.4 cents for every dollar earned by a man.
What is Family Income Deficit in Area Code 646?
Family Income Deficit in Area Code 646 is $10,978.
Families that are below poverty line in Area Code 646 earn $10,978 less on average than the poverty threshold level.
What is Inequality or Gini Index in Area Code 646?
Inequality or Gini Index in Area Code 646 is 22.00.
What is the Total Population of Area Code 646?
Total Population of Area Code 646 is 1,744,020.
What is the Total Male Population of Area Code 646?
Total Male Population of Area Code 646 is 828,349.
What is the Total Female Population of Area Code 646?
Total Female Population of Area Code 646 is 915,671.
What is the Ratio of Males per 100 Females in Area Code 646?
There are 90.46 Males per 100 Females in Area Code 646.
What is the Ratio of Females per 100 Males in Area Code 646?
There are 110.54 Females per 100 Males in Area Code 646.
What is the Median Population Age in Area Code 646?
Median Population Age in Area Code 646 is 38.8 Years.
What is the Average Family Size in Area Code 646
Average Family Size in Area Code 646 is 3.0 People.
What is the Average Household Size in Area Code 646
Average Household Size in Area Code 646 is 2.1 People.
How Large is the Labor Force in Area Code 646?
There are 1,026,788 People in the Labor Forcein in Area Code 646.
What is the Percentage of People in the Labor Force in Area Code 646?
69.0% of People are in the Labor Force in Area Code 646.
What is the Unemployment Rate in Area Code 646?
Unemployment Rate in Area Code 646 is 7.1%.