Area Code 212 Map & Demographics
Area Code 212 Map
Area Code 212 Overview
$90,748
PER CAPITA INCOME
$142,105
AVG FAMILY INCOME
$109,070
AVG HOUSEHOLD INCOME
24.2%
WAGE / INCOME GAP [ % ]
75.8¢/ $1
WAGE / INCOME GAP [ $ ]
$10,328
FAMILY INCOME DEFICIT
31.84
INEQUALITY / GINI INDEX
2,356,980
TOTAL POPULATION
1,126,647
MALE POPULATION
1,230,333
FEMALE POPULATION
91.57
MALES / 100 FEMALES
109.20
FEMALES / 100 MALES
40.2
MEDIAN AGE
3.1
AVG FAMILY SIZE
2.3
AVG HOUSEHOLD SIZE
1,282,019
LABOR FORCE [ PEOPLE ]
64.5%
PERCENT IN LABOR FORCE
7.8%
UNEMPLOYMENT RATE
Income in Area Code 212
Income Overview in Area Code 212
Per Capita Income in Area Code 212 is $90,748, while median incomes of families and households are $142,105 and $109,070 respectively.
| Characteristic | Number | Measure |
| Per Capita Income | 2,356,980 | $90,748 |
| Median Family Income | 494,127 | $142,105 |
| Mean Family Income | 494,127 | $14,083,977 |
| Median Household Income | 1,007,101 | $109,070 |
| Mean Household Income | 1,007,101 | $12,033,017 |
| Income Deficit | 494,127 | $10,328 |
| Wage / Income Gap (%) | 2,356,980 | 24.20% |
| Wage / Income Gap ($) | 2,356,980 | 75.80¢ per $1 |
| Gini / Inequality Index | 2,356,980 | 31.84 |
Earnings by Sex in Area Code 212
Average Earnings in Area Code 212 are $74,346, $89,109 for men and $61,403 for women, a difference of 31.1%.
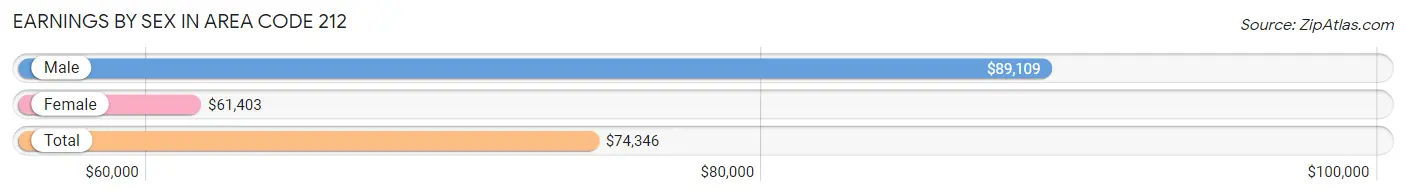
| Sex | Number | Average Earnings |
| Male | 653,189 (50.3%) | $89,109 |
| Female | 646,257 (49.7%) | $61,403 |
| Total | 1,299,446 (100.0%) | $74,346 |
Earnings by Sex by Income Bracket in Area Code 212
The most common earnings brackets in Area Code 212 are $100,000+ for men (225,368 | 34.5%) and $100,000+ for women (163,340 | 25.3%).
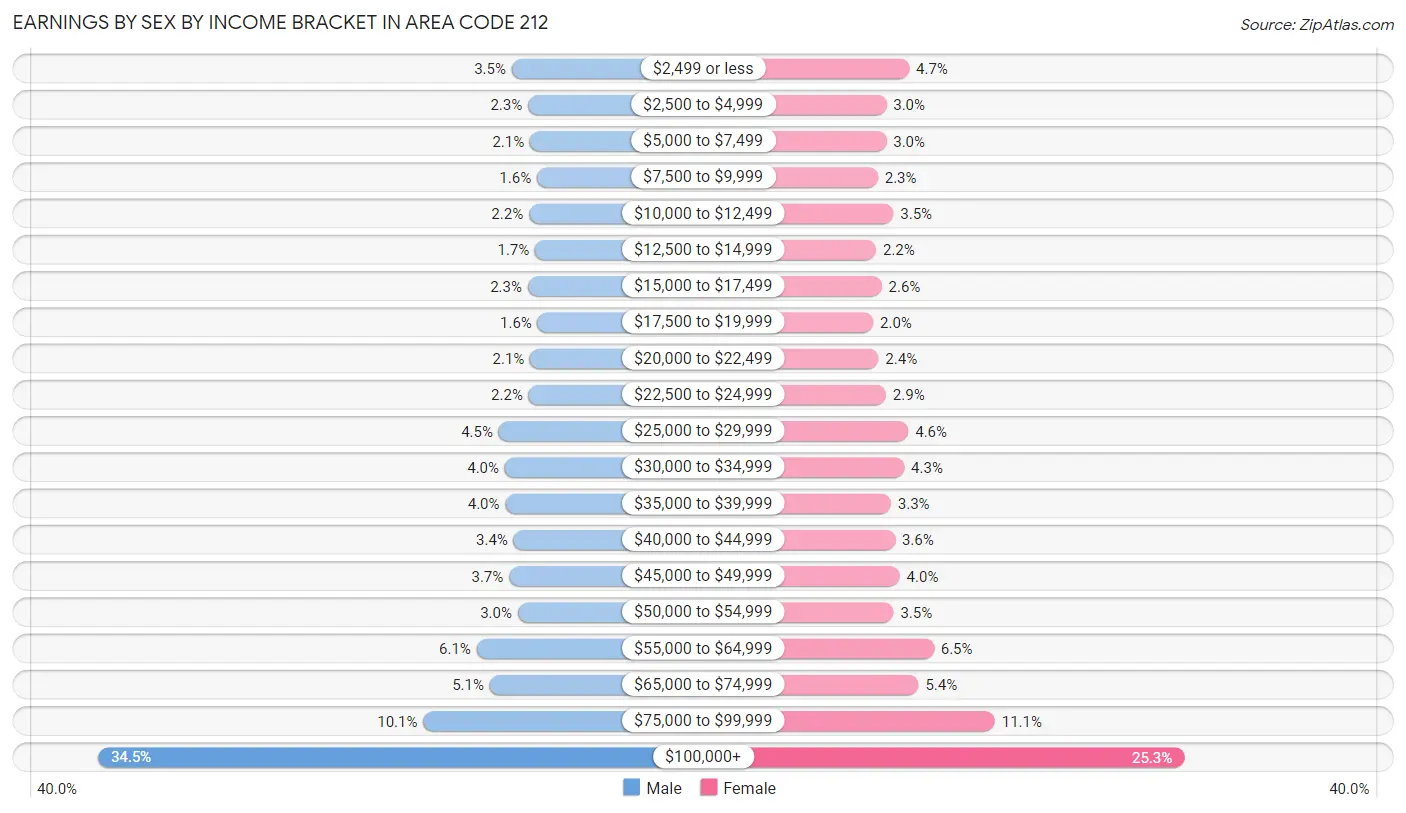
| Income | Male | Female |
| $2,499 or less | 22,813 (3.5%) | 30,172 (4.7%) |
| $2,500 to $4,999 | 14,795 (2.3%) | 19,151 (3.0%) |
| $5,000 to $7,499 | 13,837 (2.1%) | 19,098 (3.0%) |
| $7,500 to $9,999 | 10,464 (1.6%) | 14,981 (2.3%) |
| $10,000 to $12,499 | 14,379 (2.2%) | 22,573 (3.5%) |
| $12,500 to $14,999 | 11,385 (1.7%) | 14,169 (2.2%) |
| $15,000 to $17,499 | 14,933 (2.3%) | 16,868 (2.6%) |
| $17,500 to $19,999 | 10,119 (1.5%) | 12,760 (2.0%) |
| $20,000 to $22,499 | 13,773 (2.1%) | 15,318 (2.4%) |
| $22,500 to $24,999 | 14,507 (2.2%) | 18,923 (2.9%) |
| $25,000 to $29,999 | 29,116 (4.5%) | 29,763 (4.6%) |
| $30,000 to $34,999 | 26,209 (4.0%) | 27,764 (4.3%) |
| $35,000 to $39,999 | 25,928 (4.0%) | 21,319 (3.3%) |
| $40,000 to $44,999 | 21,899 (3.4%) | 23,298 (3.6%) |
| $45,000 to $49,999 | 24,126 (3.7%) | 25,615 (4.0%) |
| $50,000 to $54,999 | 19,879 (3.0%) | 22,593 (3.5%) |
| $55,000 to $64,999 | 39,987 (6.1%) | 42,143 (6.5%) |
| $65,000 to $74,999 | 33,572 (5.1%) | 34,716 (5.4%) |
| $75,000 to $99,999 | 66,100 (10.1%) | 71,693 (11.1%) |
| $100,000+ | 225,368 (34.5%) | 163,340 (25.3%) |
| Total | 653,189 (100.0%) | 646,257 (100.0%) |
Earnings by Sex by Educational Attainment in Area Code 212
Average earnings in Area Code 212 are $6,112,650 for men and $4,294,365 for women, a difference of 29.7%. Men with an educational attainment of graduate degree enjoy the highest average annual earnings of $7,678,442, while those with less than high school education earn the least with $1,353,468. Women with an educational attainment of graduate degree earn the most with the average annual earnings of $5,867,017, while those with less than high school education have the smallest earnings of $1,175,731.
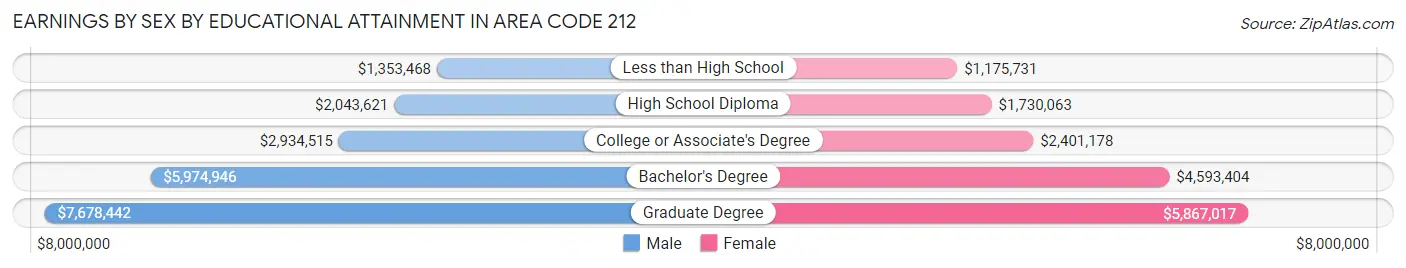
| Educational Attainment | Male Income | Female Income |
| Less than High School | $1,353,468 | $1,175,731 |
| High School Diploma | $2,043,621 | $1,730,063 |
| College or Associate's Degree | $2,934,515 | $2,401,178 |
| Bachelor's Degree | $5,974,946 | $4,593,404 |
| Graduate Degree | $7,678,442 | $5,867,017 |
| Total | $6,112,650 | $4,294,365 |
Family Income in Area Code 212
Family Income Brackets in Area Code 212
According to the Area Code 212 family income data, there are 10,452,268 families falling into the $200,000+ income range, which is the most common income bracket and makes up 2,115.3% of all families. Conversely, the $10,000 to $14,999 income bracket is the least frequent group with only 772,815 families (156.4%) belonging to this category.
| Income Bracket | # Families | % Families |
| Less than $10,000 | 1,239,765 | 250.9% |
| $10,000 to $14,999 | 772,815 | 156.4% |
| $15,000 to $24,999 | 1,789,234 | 362.1% |
| $25,000 to $34,999 | 1,417,156 | 286.8% |
| $35,000 to $49,999 | 2,176,629 | 440.5% |
| $50,000 to $74,999 | 3,391,688 | 686.4% |
| $75,000 to $99,999 | 2,673,227 | 541.0% |
| $100,000 to $149,999 | 4,149,184 | 839.7% |
| $150,000 to $199,999 | 3,063,587 | 620.0% |
| $200,000+ | 10,452,268 | 2,115.3% |
Family Income by Famaliy Size in Area Code 212
4-person families (82,548 | 16.7%) account for the highest median family income in Area Code 212 with $152,832 per family, while 2-person families (233,850 | 47.3%) have the highest median income of $62,161 per family member.
| Income Bracket | # Families | Median Income |
| 2-Person Families | 233,850 (47.3%) | $124,322 |
| 3-Person Families | 123,363 (25.0%) | $143,471 |
| 4-Person Families | 82,548 (16.7%) | $152,832 |
| 5-Person Families | 33,500 (6.8%) | $139,566 |
| 6-Person Families | 12,652 (2.6%) | $114,678 |
| 7+ Person Families | 8,214 (1.7%) | $139,062 |
| Total | 494,127 (100.0%) | $142,105 |
Family Income by Number of Earners in Area Code 212
The median family income in Area Code 212 is $142,105, with families comprising 2 earners (205,413) having the highest median family income of $171,476, while families with no earners (71,717) have the lowest median family income of $53,792, accounting for 41.6% and 14.5% of families, respectively.
| Number of Earners | # Families | Median Income |
| No Earners | 71,717 (14.5%) | $53,792 |
| 1 Earner | 171,301 (34.7%) | $110,480 |
| 2 Earners | 205,413 (41.6%) | $171,476 |
| 3+ Earners | 45,696 (9.2%) | $170,243 |
| Total | 494,127 (100.0%) | $142,105 |
Household Income in Area Code 212
Household Income Brackets in Area Code 212
With 15,709,768 households falling in the category, the $200,000+ income range is the most frequent in Area Code 212, accounting for 1,559.9% of all households. In contrast, only 3,089,786 households (306.8%) fall into the $10,000 to $14,999 income bracket, making it the least populous group.
| Income Bracket | # Households | % Households |
| Less than $10,000 | 4,159,327 | 413.0% |
| $10,000 to $14,999 | 3,089,786 | 306.8% |
| $15,000 to $24,999 | 4,101,922 | 407.3% |
| $25,000 to $34,999 | 3,404,001 | 338.0% |
| $35,000 to $49,999 | 4,777,687 | 474.4% |
| $50,000 to $74,999 | 7,325,653 | 727.4% |
| $75,000 to $99,999 | 5,869,385 | 582.8% |
| $100,000 to $149,999 | 9,090,094 | 902.6% |
| $150,000 to $199,999 | 5,932,832 | 589.1% |
| $200,000+ | 15,709,768 | 1,559.9% |
Household Income by Householder Age in Area Code 212
The median household income in Area Code 212 is $109,070, with the highest median household income of $126,583 found in the 25 to 44 years age bracket for the primary householder. A total of 374,393 households (37.2%) fall into this category. Meanwhile, the 65+ years age bracket for the primary householder has the lowest median household income of $65,643, with 264,286 households (26.2%) in this group.
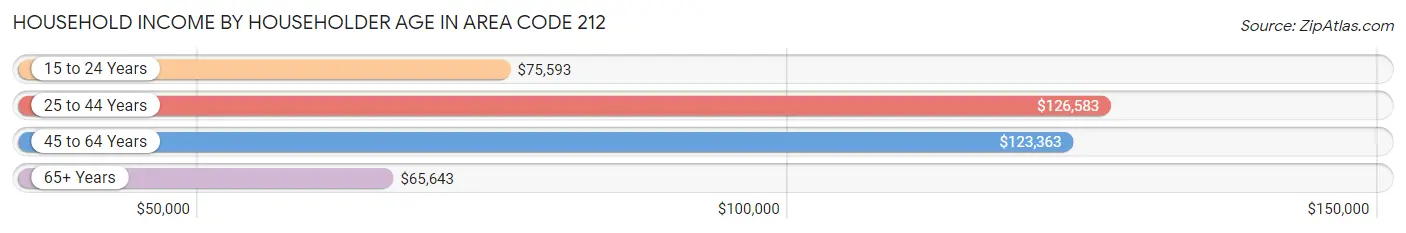
| Income Bracket | # Households | Median Income |
| 15 to 24 Years | 28,208 (2.8%) | $75,593 |
| 25 to 44 Years | 374,393 (37.2%) | $126,583 |
| 45 to 64 Years | 340,214 (33.8%) | $123,363 |
| 65+ Years | 264,286 (26.2%) | $65,643 |
| Total | 1,007,101 (100.0%) | $109,070 |
Poverty in Area Code 212
Income Below Poverty by Sex and Age in Area Code 212
With 16.1% poverty level for males and 18.9% for females among the residents of Area Code 212, 5 year old males and 18 to 24 year old females are the most vulnerable to poverty, with 2,580 males (26.4%) and 23,393 females (27.0%) in their respective age groups living below the poverty level.
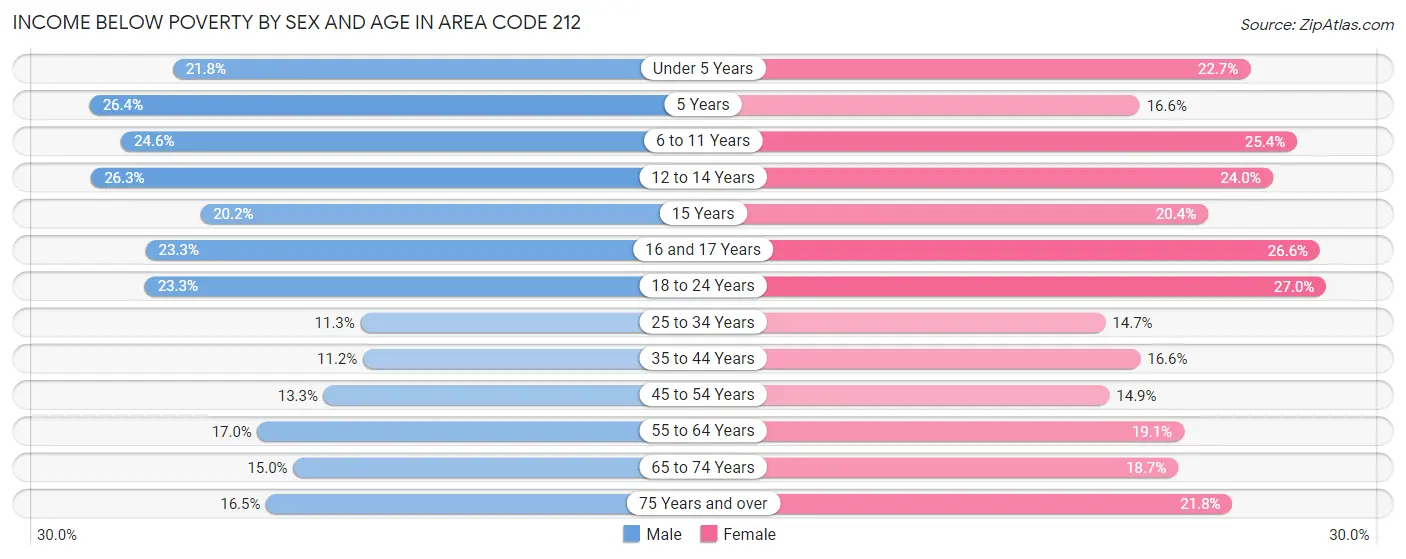
| Age Bracket | Male | Female |
| Under 5 Years | 13,402 (21.7%) | 13,585 (22.7%) |
| 5 Years | 2,580 (26.4%) | 1,840 (16.6%) |
| 6 to 11 Years | 16,556 (24.6%) | 15,958 (25.4%) |
| 12 to 14 Years | 9,262 (26.3%) | 8,106 (24.0%) |
| 15 Years | 2,173 (20.2%) | 2,343 (20.4%) |
| 16 and 17 Years | 5,136 (23.3%) | 5,555 (26.6%) |
| 18 to 24 Years | 19,130 (23.3%) | 23,393 (27.0%) |
| 25 to 34 Years | 24,167 (11.3%) | 33,142 (14.7%) |
| 35 to 44 Years | 18,333 (11.2%) | 27,716 (16.6%) |
| 45 to 54 Years | 18,980 (13.3%) | 21,442 (14.9%) |
| 55 to 64 Years | 23,004 (17.0%) | 27,485 (19.1%) |
| 65 to 74 Years | 14,147 (15.0%) | 23,223 (18.7%) |
| 75 Years and over | 10,549 (16.5%) | 22,926 (21.7%) |
| Total | 177,419 (16.1%) | 226,714 (18.9%) |
Income Above Poverty by Sex and Age in Area Code 212
According to the poverty statistics in Area Code 212, males aged 35 to 44 years and females aged 25 to 34 years are the age groups that are most secure financially, with 88.8% of males and 85.3% of females in these age groups living above the poverty line.
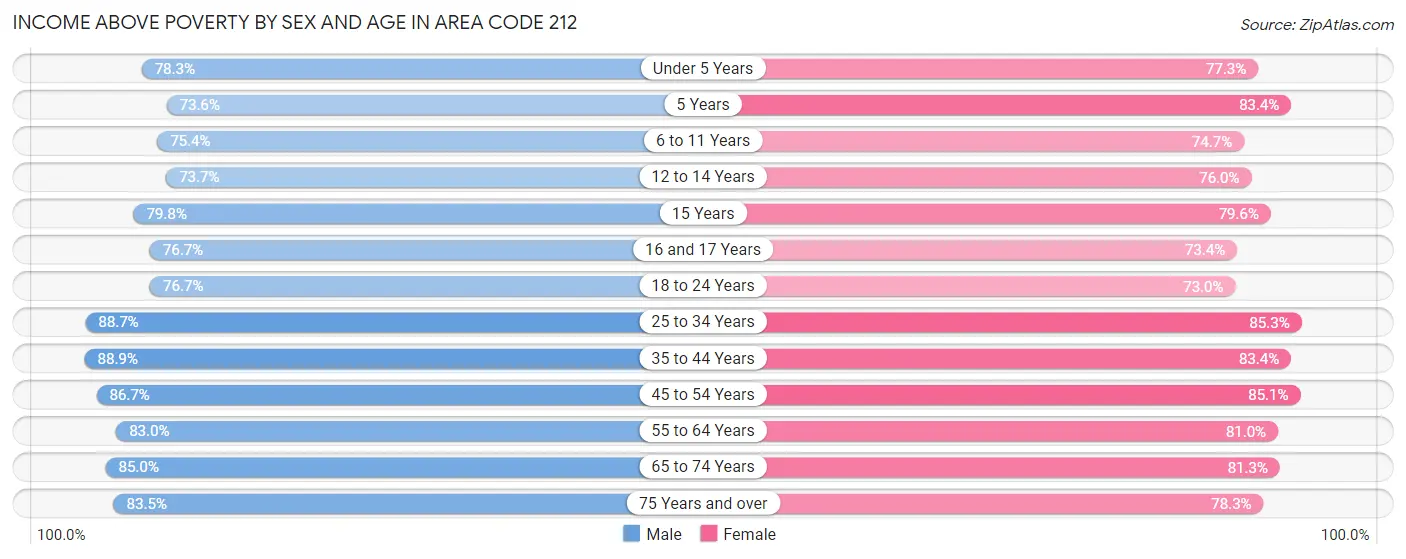
| Age Bracket | Male | Female |
| Under 5 Years | 48,226 (78.2%) | 46,174 (77.3%) |
| 5 Years | 7,204 (73.6%) | 9,251 (83.4%) |
| 6 to 11 Years | 50,687 (75.4%) | 46,991 (74.7%) |
| 12 to 14 Years | 25,974 (73.7%) | 25,677 (76.0%) |
| 15 Years | 8,572 (79.8%) | 9,149 (79.6%) |
| 16 and 17 Years | 16,941 (76.7%) | 15,313 (73.4%) |
| 18 to 24 Years | 62,930 (76.7%) | 63,329 (73.0%) |
| 25 to 34 Years | 189,949 (88.7%) | 192,576 (85.3%) |
| 35 to 44 Years | 146,040 (88.8%) | 139,016 (83.4%) |
| 45 to 54 Years | 123,285 (86.7%) | 122,507 (85.1%) |
| 55 to 64 Years | 112,168 (83.0%) | 116,775 (80.9%) |
| 65 to 74 Years | 79,963 (85.0%) | 100,799 (81.3%) |
| 75 Years and over | 53,226 (83.5%) | 82,461 (78.2%) |
| Total | 925,165 (83.9%) | 970,018 (81.1%) |
Income Below Poverty Among Married-Couple Families in Area Code 212
The poverty statistics for married-couple families in Area Code 212 show that 6.4% or 19,476 of the total 304,360 families live below the poverty line. Families with 5 or more children have the highest poverty rate of 44.6%, comprising of 826 families. On the other hand, families with 1 or 2 children have the lowest poverty rate of 5.0%, which includes 5,289 families.
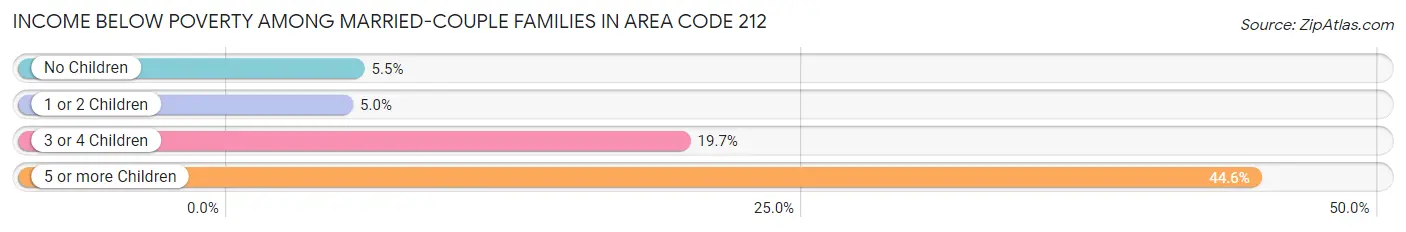
| Children | Above Poverty | Below Poverty |
| No Children | 169,491 (94.5%) | 9,884 (5.5%) |
| 1 or 2 Children | 100,192 (95.0%) | 5,289 (5.0%) |
| 3 or 4 Children | 14,173 (80.3%) | 3,477 (19.7%) |
| 5 or more Children | 1,028 (55.4%) | 826 (44.6%) |
| Total | 284,884 (93.6%) | 19,476 (6.4%) |
Income Below Poverty Among Single-Parent Households in Area Code 212
According to the poverty data in Area Code 212, 16.8% or 7,628 single-father households and 27.7% or 40,037 single-mother households are living below the poverty line. Among single-father households, those with 5 or more children have the highest poverty rate, with 96 households (53.0%) experiencing poverty. Likewise, among single-mother households, those with 5 or more children have the highest poverty rate, with 519 households (77.8%) falling below the poverty line.
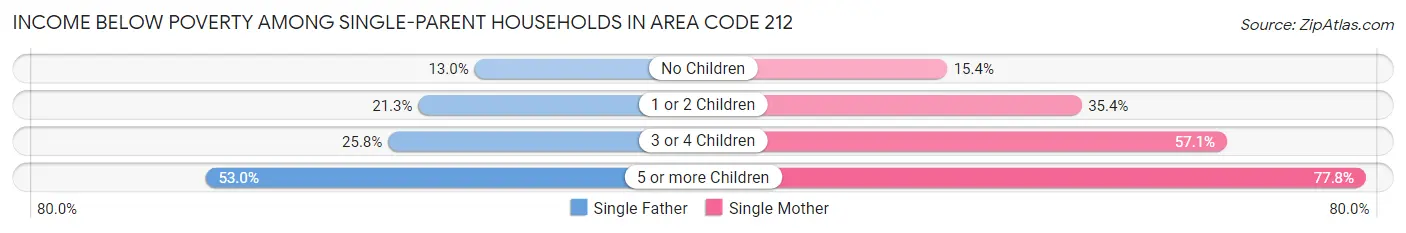
| Children | Single Father | Single Mother |
| No Children | 3,392 (13.0%) | 10,357 (15.4%) |
| 1 or 2 Children | 3,650 (21.3%) | 23,499 (35.4%) |
| 3 or 4 Children | 490 (25.8%) | 5,662 (57.1%) |
| 5 or more Children | 96 (53.0%) | 519 (77.8%) |
| Total | 7,628 (16.8%) | 40,037 (27.7%) |
Income Below Poverty Among Married-Couple vs Single-Parent Households in Area Code 212
The poverty data for Area Code 212 shows that 19,476 of the married-couple family households (6.4%) and 47,665 of the single-parent households (25.1%) are living below the poverty level. Within the married-couple family households, those with 5 or more children have the highest poverty rate, with 826 households (44.6%) falling below the poverty line. Among the single-parent households, those with 5 or more children have the highest poverty rate, with 615 household (72.5%) living below poverty.
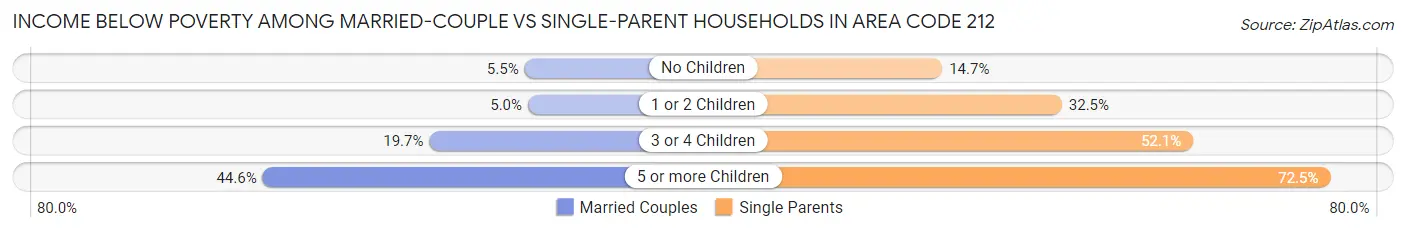
| Children | Married-Couple Families | Single-Parent Households |
| No Children | 9,884 (5.5%) | 13,749 (14.7%) |
| 1 or 2 Children | 5,289 (5.0%) | 27,149 (32.5%) |
| 3 or 4 Children | 3,477 (19.7%) | 6,152 (52.1%) |
| 5 or more Children | 826 (44.6%) | 615 (72.5%) |
| Total | 19,476 (6.4%) | 47,665 (25.1%) |
Race in Area Code 212
The most populous races in Area Code 212 are White / Caucasian (1,052,064 | 44.6%), Hispanic or Latino (740,970 | 31.4%), and Black / African American (427,652 | 18.1%).
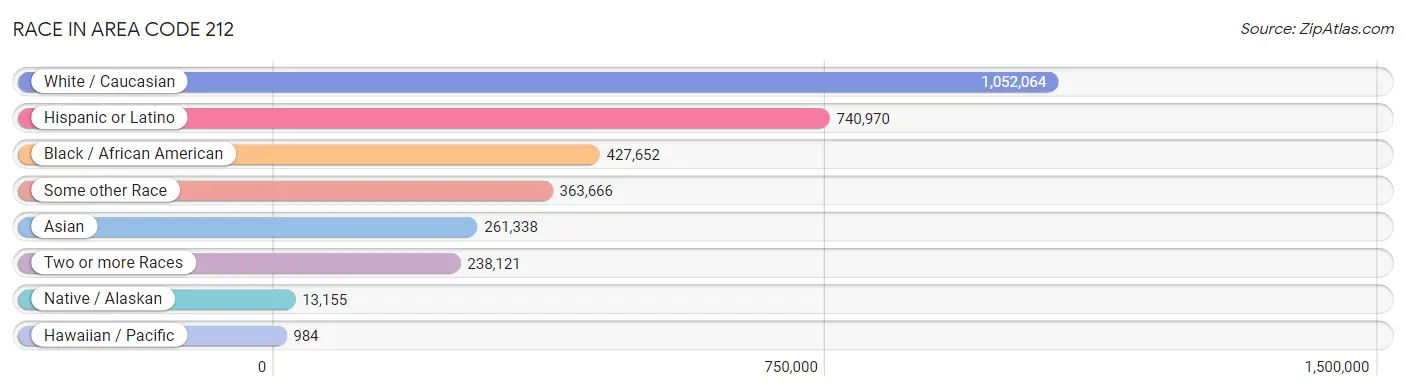
| Race | # Population | % Population |
| Asian | 261,338 | 11.1% |
| Black / African American | 427,652 | 18.1% |
| Hawaiian / Pacific | 984 | 0.0% |
| Hispanic or Latino | 740,970 | 31.4% |
| Native / Alaskan | 13,155 | 0.6% |
| White / Caucasian | 1,052,064 | 44.6% |
| Two or more Races | 238,121 | 10.1% |
| Some other Race | 363,666 | 15.4% |
| Total | 2,356,980 | 100.0% |
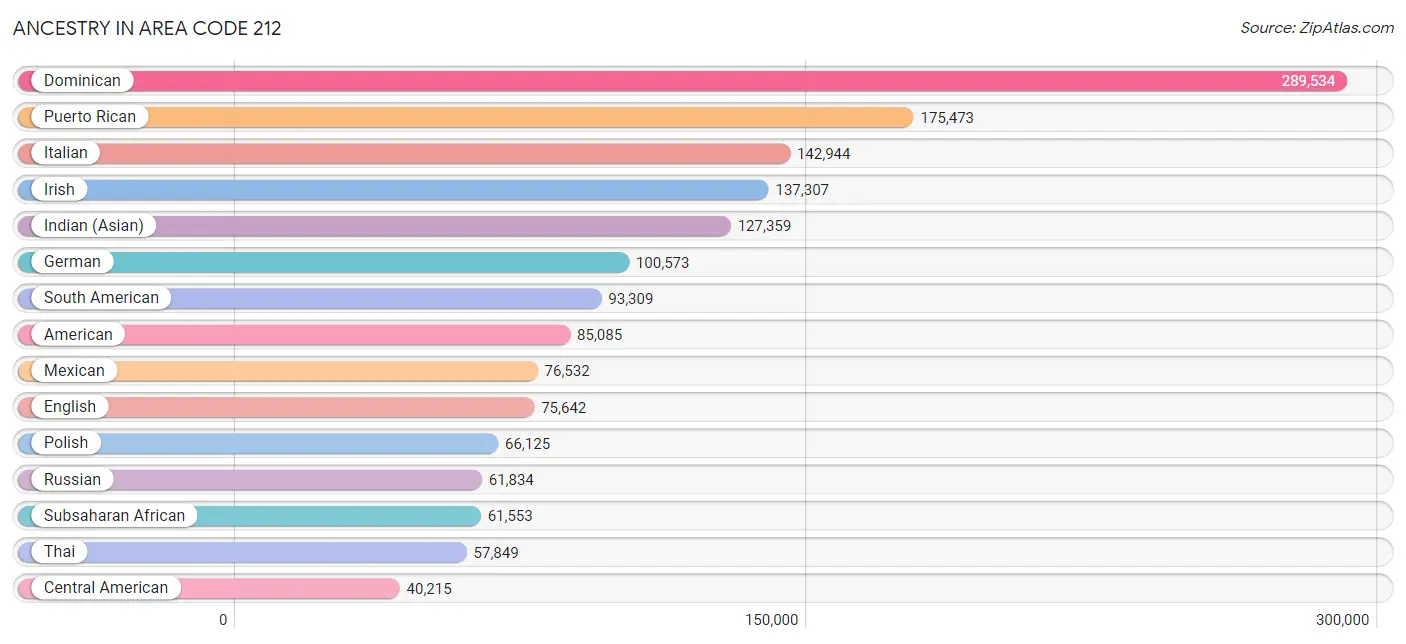
Ancestry in Area Code 212
The most populous ancestries reported in Area Code 212 are Dominican (289,534 | 12.3%), Puerto Rican (175,473 | 7.4%), Italian (142,944 | 6.1%), Irish (137,307 | 5.8%), and Indian (Asian) (127,359 | 5.4%), together accounting for 37.0% of all Area Code 212 residents.
| Ancestry | # Population | % Population |
| Afghan | 755 | 0.0% |
| African | 30,549 | 1.3% |
| Alaska Native | 75 | 0.0% |
| Albanian | 5,817 | 0.3% |
| Aleut | 34 | 0.0% |
| Alsatian | 181 | 0.0% |
| American | 85,085 | 3.6% |
| Apache | 219 | 0.0% |
| Arab | 24,287 | 1.0% |
| Argentinean | 6,604 | 0.3% |
| Armenian | 3,231 | 0.1% |
| Assyrian / Chaldean / Syriac | 125 | 0.0% |
| Australian | 2,997 | 0.1% |
| Austrian | 8,987 | 0.4% |
| Bahamian | 544 | 0.0% |
| Bangladeshi | 37 | 0.0% |
| Barbadian | 2,100 | 0.1% |
| Basque | 229 | 0.0% |
| Belgian | 1,843 | 0.1% |
| Belizean | 1,204 | 0.1% |
| Bermudan | 164 | 0.0% |
| Bhutanese | 16,629 | 0.7% |
| Blackfeet | 838 | 0.0% |
| Bolivian | 1,640 | 0.1% |
| Brazilian | 4,773 | 0.2% |
| British | 12,412 | 0.5% |
| British West Indian | 4,929 | 0.2% |
| Bulgarian | 1,261 | 0.1% |
| Burmese | 31,600 | 1.3% |
| Cajun | 159 | 0.0% |
| Cambodian | 133 | 0.0% |
| Canadian | 4,155 | 0.2% |
| Cape Verdean | 144 | 0.0% |
| Carpatho Rusyn | 28 | 0.0% |
| Celtic | 109 | 0.0% |
| Central American | 40,215 | 1.7% |
| Central American Indian | 10,669 | 0.4% |
| Cherokee | 3,259 | 0.1% |
| Chickasaw | 238 | 0.0% |
| Chilean | 2,052 | 0.1% |
| Chippewa | 116 | 0.0% |
| Choctaw | 189 | 0.0% |
| Colombian | 25,166 | 1.1% |
| Colville | 18 | 0.0% |
| Comanche | 21 | 0.0% |
| Costa Rican | 1,379 | 0.1% |
| Cree | 212 | 0.0% |
| Creek | 126 | 0.0% |
| Croatian | 3,529 | 0.2% |
| Cuban | 15,278 | 0.6% |
| Cypriot | 397 | 0.0% |
| Czech | 4,880 | 0.2% |
| Czechoslovakian | 810 | 0.0% |
| Danish | 3,343 | 0.1% |
| Delaware | 150 | 0.0% |
| Dominican | 289,534 | 12.3% |
| Dutch | 9,819 | 0.4% |
| Dutch West Indian | 225 | 0.0% |
| Eastern European | 35,820 | 1.5% |
| Ecuadorian | 38,992 | 1.7% |
| Egyptian | 4,881 | 0.2% |
| English | 75,642 | 3.2% |
| Estonian | 356 | 0.0% |
| Ethiopian | 1,911 | 0.1% |
| European | 30,967 | 1.3% |
| Filipino | 5,822 | 0.3% |
| Finnish | 1,410 | 0.1% |
| French | 31,536 | 1.3% |
| French American Indian | 61 | 0.0% |
| French Canadian | 3,686 | 0.2% |
| German | 100,573 | 4.3% |
| German Russian | 41 | 0.0% |
| Ghanaian | 8,197 | 0.4% |
| Greek | 21,344 | 0.9% |
| Guamanian / Chamorro | 222 | 0.0% |
| Guatemalan | 7,372 | 0.3% |
| Guyanese | 10,264 | 0.4% |
| Haitian | 10,763 | 0.5% |
| Hmong | 24 | 0.0% |
| Honduran | 12,590 | 0.5% |
| Hungarian | 17,662 | 0.7% |
| Icelander | 237 | 0.0% |
| Indian (Asian) | 127,359 | 5.4% |
| Indonesian | 908 | 0.0% |
| Inupiat | 11 | 0.0% |
| Iranian | 5,704 | 0.2% |
| Iraqi | 933 | 0.0% |
| Irish | 137,307 | 5.8% |
| Iroquois | 620 | 0.0% |
| Israeli | 5,789 | 0.3% |
| Italian | 142,944 | 6.1% |
| Jamaican | 20,981 | 0.9% |
| Japanese | 348 | 0.0% |
| Jordanian | 262 | 0.0% |
| Kenyan | 411 | 0.0% |
| Korean | 24,171 | 1.0% |
| Laotian | 1,311 | 0.1% |
| Latvian | 1,560 | 0.1% |
| Lebanese | 4,663 | 0.2% |
| Liberian | 1,118 | 0.1% |
| Lithuanian | 5,118 | 0.2% |
| Lumbee | 18 | 0.0% |
| Luxembourger | 87 | 0.0% |
| Macedonian | 2,443 | 0.1% |
| Malaysian | 190 | 0.0% |
| Maltese | 1,494 | 0.1% |
| Menominee | 11 | 0.0% |
| Mexican | 76,532 | 3.3% |
| Mexican American Indian | 2,527 | 0.1% |
| Mongolian | 1,069 | 0.1% |
| Moroccan | 3,349 | 0.1% |
| Native Hawaiian | 1,228 | 0.1% |
| Navajo | 71 | 0.0% |
| New Zealander | 226 | 0.0% |
| Nicaraguan | 2,929 | 0.1% |
| Nigerian | 3,976 | 0.2% |
| Northern European | 2,805 | 0.1% |
| Norwegian | 8,841 | 0.4% |
| Okinawan | 383 | 0.0% |
| Osage | 98 | 0.0% |
| Pakistani | 1,992 | 0.1% |
| Palestinian | 1,025 | 0.0% |
| Panamanian | 4,152 | 0.2% |
| Paraguayan | 1,157 | 0.1% |
| Pennsylvania German | 180 | 0.0% |
| Peruvian | 11,435 | 0.5% |
| Polish | 66,125 | 2.8% |
| Portuguese | 5,488 | 0.2% |
| Potawatomi | 20 | 0.0% |
| Pueblo | 183 | 0.0% |
| Puerto Rican | 175,473 | 7.4% |
| Romanian | 11,936 | 0.5% |
| Russian | 61,834 | 2.6% |
| Salvadoran | 11,582 | 0.5% |
| Samoan | 209 | 0.0% |
| Scandinavian | 2,480 | 0.1% |
| Scotch-Irish | 6,412 | 0.3% |
| Scottish | 18,217 | 0.8% |
| Senegalese | 2,614 | 0.1% |
| Serbian | 1,900 | 0.1% |
| Shoshone | 82 | 0.0% |
| Sierra Leonean | 498 | 0.0% |
| Sioux | 283 | 0.0% |
| Slavic | 820 | 0.0% |
| Slovak | 2,321 | 0.1% |
| Slovene | 444 | 0.0% |
| Somali | 556 | 0.0% |
| South African | 1,341 | 0.1% |
| South American | 93,309 | 4.0% |
| South American Indian | 1,463 | 0.1% |
| Soviet Union | 202 | 0.0% |
| Spaniard | 11,513 | 0.5% |
| Spanish | 4,400 | 0.2% |
| Spanish American | 154 | 0.0% |
| Spanish American Indian | 284 | 0.0% |
| Sri Lankan | 5,286 | 0.2% |
| Subsaharan African | 61,553 | 2.6% |
| Sudanese | 136 | 0.0% |
| Swedish | 8,838 | 0.4% |
| Swiss | 3,684 | 0.2% |
| Syrian | 1,860 | 0.1% |
| Taiwanese | 80 | 0.0% |
| Thai | 57,849 | 2.5% |
| Tohono O'Odham | 22 | 0.0% |
| Tongan | 47 | 0.0% |
| Trinidadian and Tobagonian | 5,852 | 0.3% |
| Turkish | 5,479 | 0.2% |
| U.S. Virgin Islander | 1,135 | 0.1% |
| Ugandan | 348 | 0.0% |
| Ukrainian | 16,493 | 0.7% |
| Uruguayan | 979 | 0.0% |
| Ute | 25 | 0.0% |
| Venezuelan | 4,590 | 0.2% |
| Vietnamese | 8,674 | 0.4% |
| Welsh | 5,223 | 0.2% |
| West Indian | 11,300 | 0.5% |
| Yugoslavian | 774 | 0.0% |
| Zimbabwean | 30 | 0.0% | View All 178 Rows |
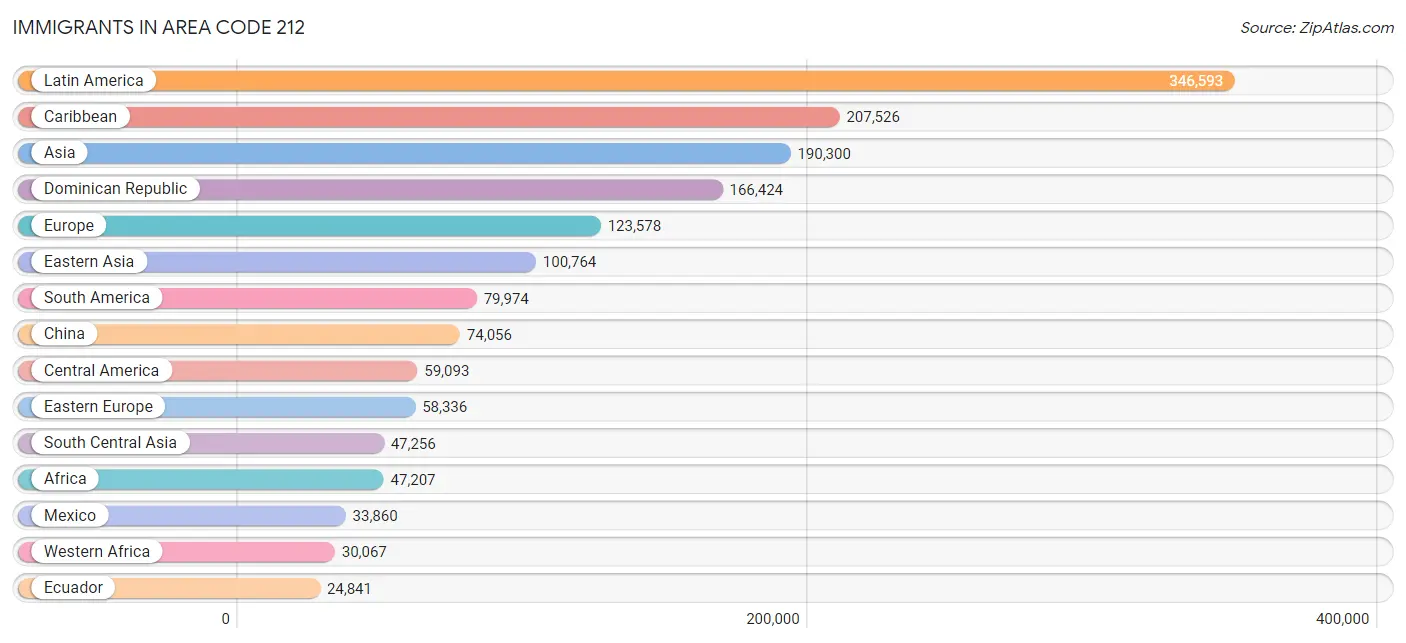
Immigrants in Area Code 212
The most numerous immigrant groups reported in Area Code 212 came from Latin America (346,593 | 14.7%), Caribbean (207,526 | 8.8%), Asia (190,300 | 8.1%), Dominican Republic (166,424 | 7.1%), and Europe (123,578 | 5.2%), together accounting for 43.9% of all Area Code 212 residents.
| Immigration Origin | # Population | % Population |
| Afghanistan | 662 | 0.0% |
| Africa | 47,207 | 2.0% |
| Albania | 2,721 | 0.1% |
| Argentina | 5,127 | 0.2% |
| Armenia | 657 | 0.0% |
| Asia | 190,300 | 8.1% |
| Australia | 5,574 | 0.2% |
| Austria | 819 | 0.0% |
| Bahamas | 289 | 0.0% |
| Bangladesh | 11,689 | 0.5% |
| Barbados | 1,252 | 0.1% |
| Belarus | 2,406 | 0.1% |
| Belgium | 1,391 | 0.1% |
| Belize | 1,142 | 0.1% |
| Bolivia | 843 | 0.0% |
| Bosnia and Herzegovina | 473 | 0.0% |
| Brazil | 6,442 | 0.3% |
| Bulgaria | 1,117 | 0.1% |
| Cambodia | 248 | 0.0% |
| Cameroon | 279 | 0.0% |
| Canada | 12,291 | 0.5% |
| Caribbean | 207,526 | 8.8% |
| Central America | 59,093 | 2.5% |
| Chile | 1,452 | 0.1% |
| China | 74,056 | 3.1% |
| Colombia | 16,756 | 0.7% |
| Congo | 196 | 0.0% |
| Costa Rica | 733 | 0.0% |
| Croatia | 1,707 | 0.1% |
| Cuba | 5,127 | 0.2% |
| Czechoslovakia | 1,230 | 0.1% |
| Denmark | 458 | 0.0% |
| Dominica | 1,678 | 0.1% |
| Dominican Republic | 166,424 | 7.1% |
| Eastern Africa | 4,033 | 0.2% |
| Eastern Asia | 100,764 | 4.3% |
| Eastern Europe | 58,336 | 2.5% |
| Ecuador | 24,841 | 1.1% |
| Egypt | 3,620 | 0.2% |
| El Salvador | 6,710 | 0.3% |
| England | 3,422 | 0.2% |
| Eritrea | 130 | 0.0% |
| Ethiopia | 1,523 | 0.1% |
| Europe | 123,578 | 5.2% |
| France | 9,661 | 0.4% |
| Germany | 6,034 | 0.3% |
| Ghana | 11,117 | 0.5% |
| Greece | 6,088 | 0.3% |
| Grenada | 772 | 0.0% |
| Guatemala | 4,157 | 0.2% |
| Guyana | 11,590 | 0.5% |
| Haiti | 7,150 | 0.3% |
| Honduras | 8,286 | 0.4% |
| Hong Kong | 6,798 | 0.3% |
| Hungary | 1,210 | 0.1% |
| India | 20,649 | 0.9% |
| Indonesia | 1,057 | 0.0% |
| Iran | 3,440 | 0.2% |
| Iraq | 254 | 0.0% |
| Ireland | 4,781 | 0.2% |
| Israel | 5,993 | 0.3% |
| Italy | 10,328 | 0.4% |
| Jamaica | 13,224 | 0.6% |
| Japan | 9,212 | 0.4% |
| Jordan | 415 | 0.0% |
| Kazakhstan | 568 | 0.0% |
| Kenya | 685 | 0.0% |
| Korea | 17,471 | 0.7% |
| Kuwait | 332 | 0.0% |
| Laos | 11 | 0.0% |
| Latin America | 346,593 | 14.7% |
| Latvia | 532 | 0.0% |
| Lebanon | 1,227 | 0.1% |
| Liberia | 706 | 0.0% |
| Lithuania | 448 | 0.0% |
| Malaysia | 2,581 | 0.1% |
| Mexico | 33,860 | 1.4% |
| Middle Africa | 798 | 0.0% |
| Moldova | 1,083 | 0.1% |
| Morocco | 1,826 | 0.1% |
| Nepal | 1,430 | 0.1% |
| Netherlands | 1,240 | 0.1% |
| Nicaragua | 1,610 | 0.1% |
| Nigeria | 3,479 | 0.2% |
| North Macedonia | 807 | 0.0% |
| Northern Africa | 7,027 | 0.3% |
| Northern Europe | 21,249 | 0.9% |
| Norway | 612 | 0.0% |
| Oceania | 6,290 | 0.3% |
| Pakistan | 5,134 | 0.2% |
| Panama | 2,531 | 0.1% |
| Peru | 7,296 | 0.3% |
| Philippines | 13,780 | 0.6% |
| Poland | 9,021 | 0.4% |
| Portugal | 708 | 0.0% |
| Romania | 4,720 | 0.2% |
| Russia | 12,182 | 0.5% |
| Saudi Arabia | 499 | 0.0% |
| Scotland | 854 | 0.0% |
| Senegal | 3,118 | 0.1% |
| Serbia | 1,160 | 0.1% |
| Sierra Leone | 981 | 0.0% |
| Singapore | 1,467 | 0.1% |
| Somalia | 188 | 0.0% |
| South Africa | 1,994 | 0.1% |
| South America | 79,974 | 3.4% |
| South Central Asia | 47,256 | 2.0% |
| South Eastern Asia | 24,243 | 1.0% |
| Southern Europe | 22,822 | 1.0% |
| Spain | 5,071 | 0.2% |
| Sri Lanka | 472 | 0.0% |
| St. Vincent and the Grenadines | 597 | 0.0% |
| Sudan | 354 | 0.0% |
| Sweden | 1,027 | 0.0% |
| Switzerland | 1,375 | 0.1% |
| Syria | 419 | 0.0% |
| Taiwan | 6,000 | 0.3% |
| Thailand | 1,500 | 0.1% |
| Trinidad and Tobago | 6,365 | 0.3% |
| Turkey | 3,289 | 0.1% |
| Uganda | 295 | 0.0% |
| Ukraine | 12,778 | 0.5% |
| Uruguay | 447 | 0.0% |
| Uzbekistan | 2,561 | 0.1% |
| Venezuela | 3,995 | 0.2% |
| Vietnam | 2,467 | 0.1% |
| West Indies | 1,076 | 0.1% |
| Western Africa | 30,067 | 1.3% |
| Western Asia | 17,600 | 0.7% |
| Western Europe | 20,615 | 0.9% |
| Yemen | 2,283 | 0.1% |
| Zaire | 253 | 0.0% |
| Zimbabwe | 114 | 0.0% | View All 133 Rows |
Sex and Age in Area Code 212
Sex and Age in Area Code 212
The most populous age groups in Area Code 212 are 30 to 34 Years (108,241 | 9.6%) for men and 25 to 29 Years (116,003 | 9.4%) for women.
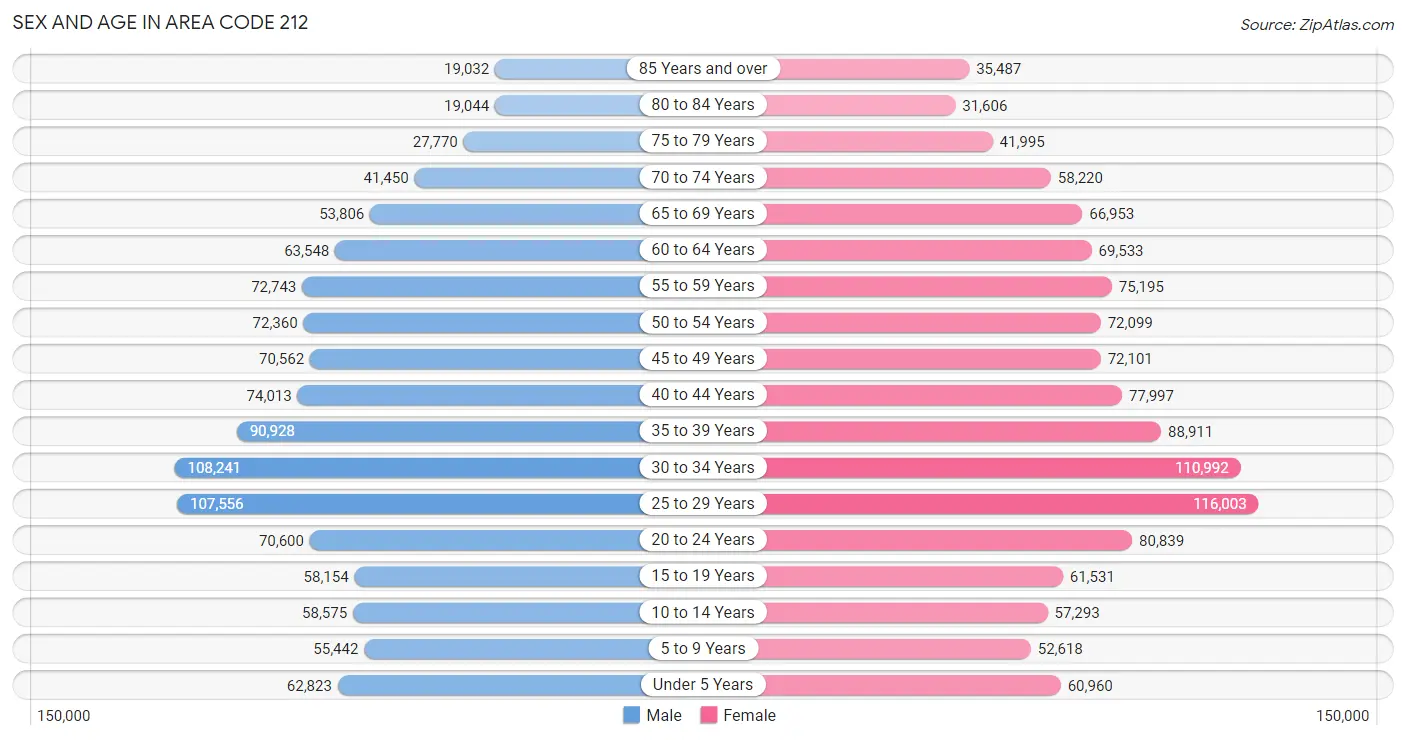
| Age Bracket | Male | Female |
| Under 5 Years | 62,823 (5.6%) | 60,960 (5.0%) |
| 5 to 9 Years | 55,442 (4.9%) | 52,618 (4.3%) |
| 10 to 14 Years | 58,575 (5.2%) | 57,293 (4.7%) |
| 15 to 19 Years | 58,154 (5.2%) | 61,531 (5.0%) |
| 20 to 24 Years | 70,600 (6.3%) | 80,839 (6.6%) |
| 25 to 29 Years | 107,556 (9.6%) | 116,003 (9.4%) |
| 30 to 34 Years | 108,241 (9.6%) | 110,992 (9.0%) |
| 35 to 39 Years | 90,928 (8.1%) | 88,911 (7.2%) |
| 40 to 44 Years | 74,013 (6.6%) | 77,997 (6.3%) |
| 45 to 49 Years | 70,562 (6.3%) | 72,101 (5.9%) |
| 50 to 54 Years | 72,360 (6.4%) | 72,099 (5.9%) |
| 55 to 59 Years | 72,743 (6.5%) | 75,195 (6.1%) |
| 60 to 64 Years | 63,548 (5.6%) | 69,533 (5.7%) |
| 65 to 69 Years | 53,806 (4.8%) | 66,953 (5.4%) |
| 70 to 74 Years | 41,450 (3.7%) | 58,220 (4.7%) |
| 75 to 79 Years | 27,770 (2.5%) | 41,995 (3.4%) |
| 80 to 84 Years | 19,044 (1.7%) | 31,606 (2.6%) |
| 85 Years and over | 19,032 (1.7%) | 35,487 (2.9%) |
| Total | 1,126,647 (100.0%) | 1,230,333 (100.0%) |
Families and Households in Area Code 212
Median Family Size in Area Code 212
The median family size in Area Code 212 is 3.06 persons per family, with married-couple families (304,360 | 61.6%) accounting for the largest median family size of 3.13603 persons per family. On the other hand, single male/father families (45,361 | 9.2%) represent the smallest median family size with 2.86 persons per family.
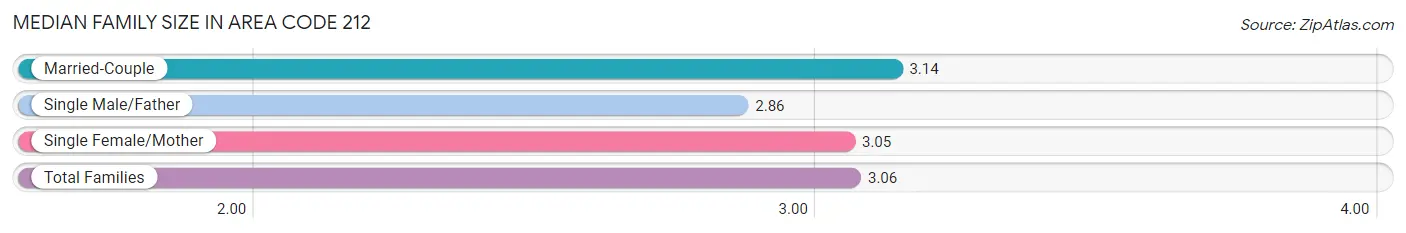
| Family Type | # Families | Family Size |
| Married-Couple | 304,360 (61.6%) | 3.14 |
| Single Male/Father | 45,361 (9.2%) | 2.86 |
| Single Female/Mother | 144,406 (29.2%) | 3.05 |
| Total Families | 494,127 (100.0%) | 3.06 |
Median Household Size in Area Code 212
The median household size in Area Code 212 is 2.28 persons per household, with single female/mother households (144,406 | 14.3%) accounting for the largest median household size of 3.18 persons per household. non-family households (512,974 | 50.9%) represent the smallest median household size with 1.29 persons per household.
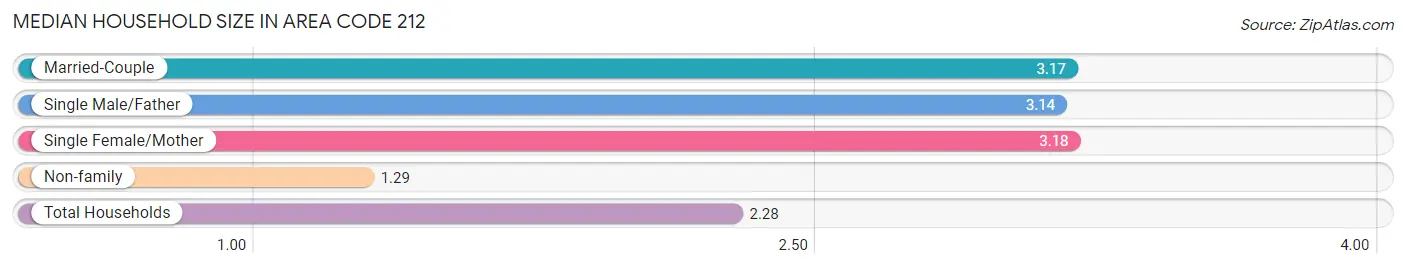
| Household Type | # Households | Household Size |
| Married-Couple | 304,360 (30.2%) | 3.17 |
| Single Male/Father | 45,361 (4.5%) | 3.14 |
| Single Female/Mother | 144,406 (14.3%) | 3.18 |
| Non-family | 512,974 (50.9%) | 1.29 |
| Total Households | 1,007,101 (100.0%) | 2.28 |
Household Size by Marriage Status in Area Code 212
Out of a total of 1,007,101 households in Area Code 212, 494,127 (49.1%) are family households, while 512,974 (50.9%) are nonfamily households. The most numerous type of family households are 2-person households, comprising 218,981, and the most common type of nonfamily households are 1-person households, comprising 416,407.
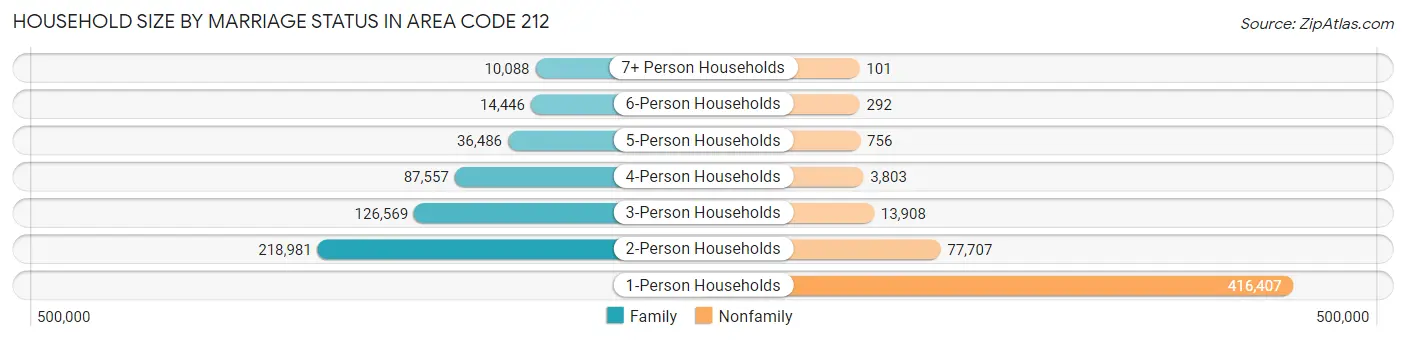
| Household Size | Family Households | Nonfamily Households |
| 1-Person Households | - | 416,407 (41.3%) |
| 2-Person Households | 218,981 (21.7%) | 77,707 (7.7%) |
| 3-Person Households | 126,569 (12.6%) | 13,908 (1.4%) |
| 4-Person Households | 87,557 (8.7%) | 3,803 (0.4%) |
| 5-Person Households | 36,486 (3.6%) | 756 (0.1%) |
| 6-Person Households | 14,446 (1.4%) | 292 (0.0%) |
| 7+ Person Households | 10,088 (1.0%) | 101 (0.0%) |
| Total | 494,127 (49.1%) | 512,974 (50.9%) |
Female Fertility in Area Code 212
Fertility by Age in Area Code 212
Average fertility rate in Area Code 212 is 44.5 births per 1,000 women. Women in the age bracket of 15 to 19 years have the highest fertility rate with 59.6 births per 1,000 women. Women in the age bracket of 20 to 34 years acount for 57.8% of all women with births.
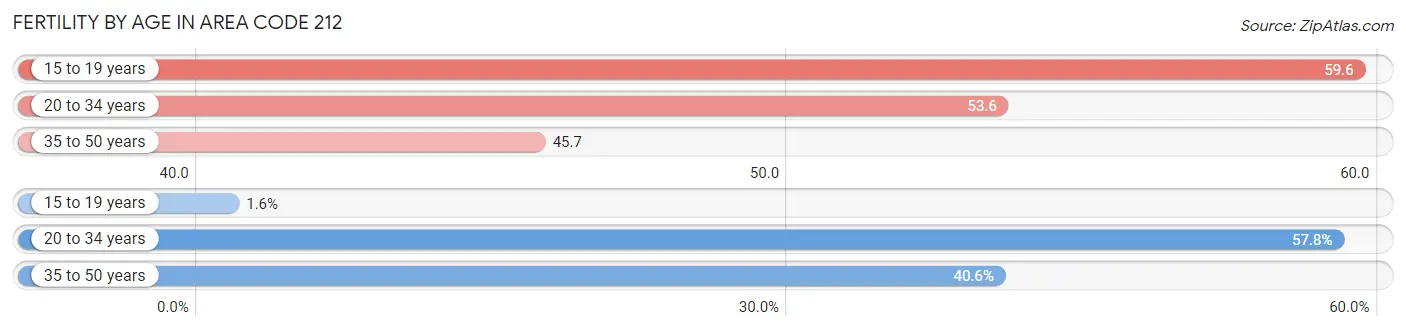
| Age Bracket | Women with Births | Births / 1,000 Women |
| 15 to 19 years | 420 (1.6%) | 59.6 |
| 20 to 34 years | 15,304 (57.8%) | 53.6 |
| 35 to 50 years | 10,745 (40.6%) | 45.7 |
| Total | 26,469 (100.0%) | 44.5 |
Fertility by Age by Marriage Status in Area Code 212
70.7% of women with births (26,469) in Area Code 212 are married. The highest percentage of unmarried women with births falls into 15 to 19 years age bracket with 100.0% of them unmarried at the time of birth, while the lowest percentage of unmarried women with births belong to 35 to 50 years age bracket with 28.4% of them unmarried.
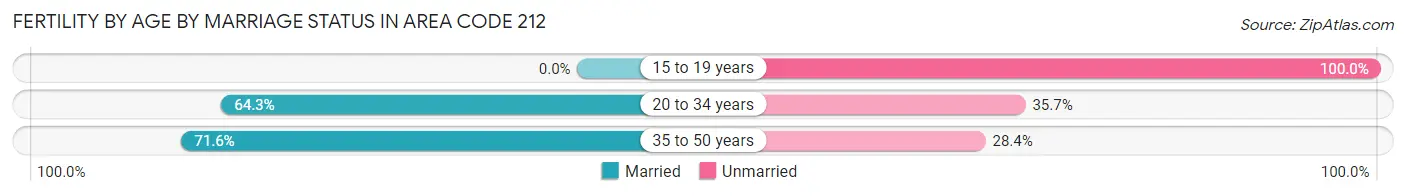
| Age Bracket | Married | Unmarried |
| 15 to 19 years | 0 (0.0%) | 420 (100.0%) |
| 20 to 34 years | 9,847 (64.3%) | 5,457 (35.7%) |
| 35 to 50 years | 7,691 (71.6%) | 3,054 (28.4%) |
| Total | 18,709 (70.7%) | 7,760 (29.3%) |
Fertility by Education in Area Code 212
Average fertility rate in Area Code 212 is 44.5 births per 1,000 women. Women with the education attainment of high school diploma have the highest fertility rate of 62.4 births per 1,000 women, while women with the education attainment of college or associate's degree have the lowest fertility at 37.5 births per 1,000 women. Women with the education attainment of graduate degree represent 28.1% of all women with births.
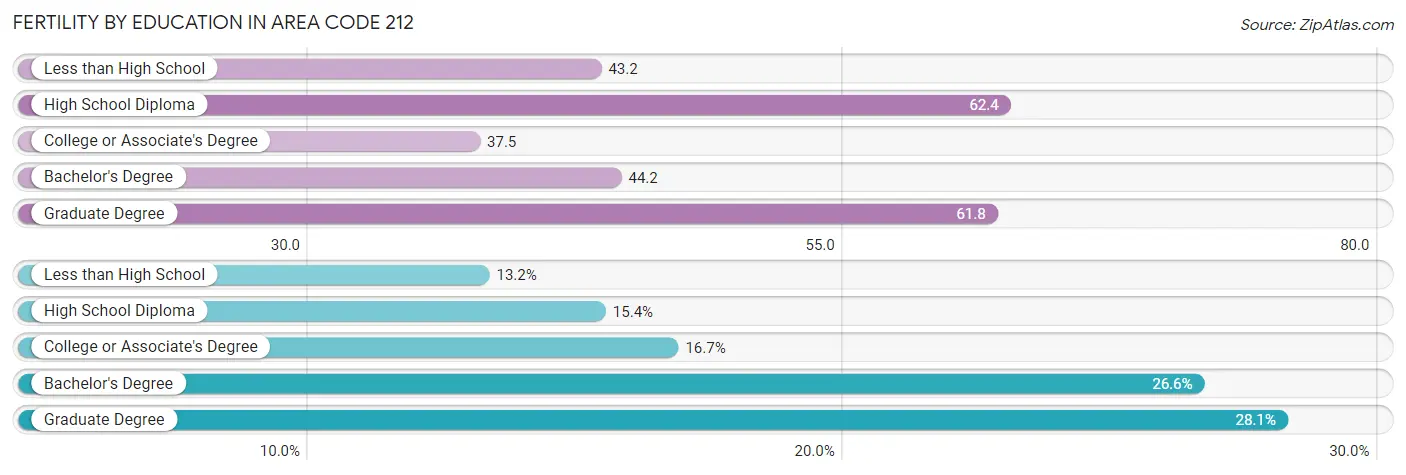
| Educational Attainment | Women with Births | Births / 1,000 Women |
| Less than High School | 3,491 (13.2%) | 43.2 |
| High School Diploma | 4,067 (15.4%) | 62.4 |
| College or Associate's Degree | 4,428 (16.7%) | 37.5 |
| Bachelor's Degree | 7,035 (26.6%) | 44.2 |
| Graduate Degree | 7,448 (28.1%) | 61.8 |
| Total | 26,469 (100.0%) | 44.5 |
Fertility by Education by Marriage Status in Area Code 212
29.3% of women with births in Area Code 212 are unmarried. Women with the educational attainment of graduate degree are most likely to be married with 66.3% of them married at childbirth, while women with the educational attainment of less than high school are least likely to be married with 72.5% of them unmarried at childbirth.
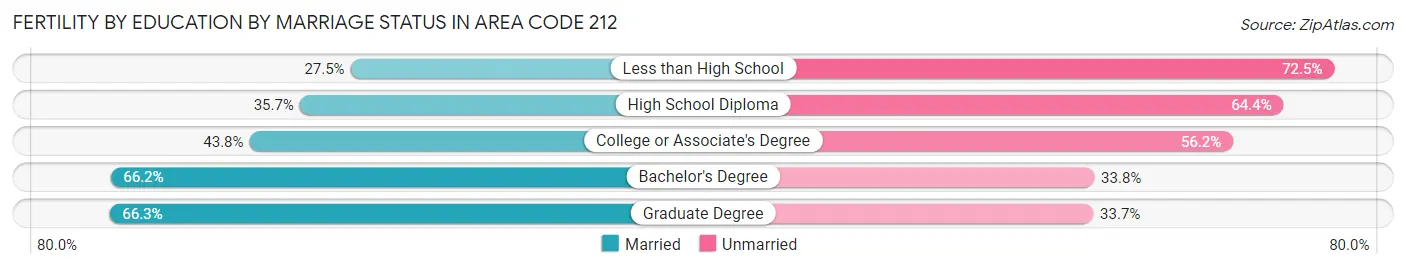
| Educational Attainment | Married | Unmarried |
| Less than High School | 959 (27.5%) | 2,532 (72.5%) |
| High School Diploma | 1,450 (35.6%) | 2,617 (64.3%) |
| College or Associate's Degree | 1,938 (43.8%) | 2,490 (56.2%) |
| Bachelor's Degree | 4,655 (66.2%) | 2,380 (33.8%) |
| Graduate Degree | 4,940 (66.3%) | 2,508 (33.7%) |
| Total | 18,709 (70.7%) | 7,760 (29.3%) |
Employment Characteristics in Area Code 212
Employment by Class of Employer in Area Code 212
Among the 1,144,459 employed individuals in Area Code 212, private company employees (750,459 | 65.6%), not-for-profit organizations (145,623 | 12.7%), and local government employees (82,665 | 7.2%) make up the most common classes of employment.
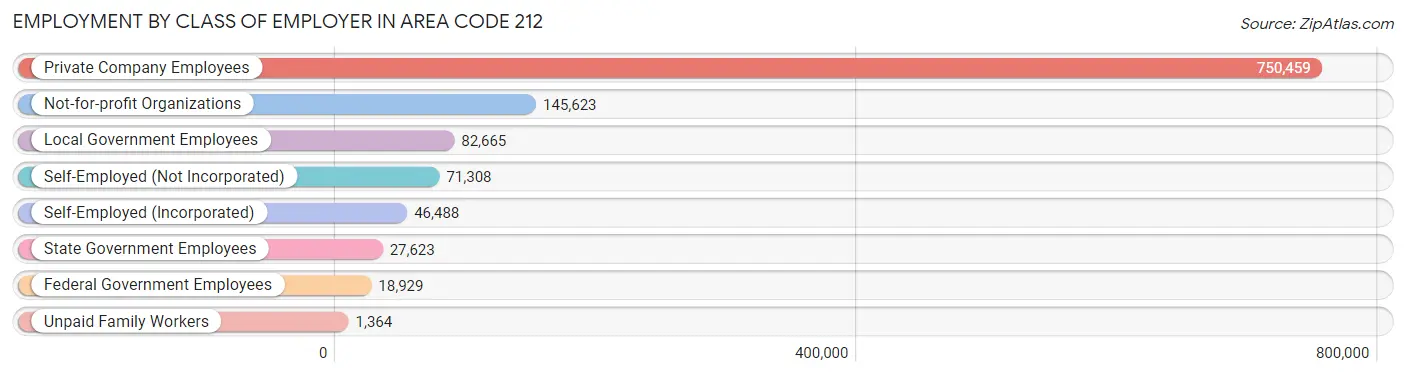
| Employer Class | # Employees | % Employees |
| Private Company Employees | 750,459 | 65.6% |
| Self-Employed (Incorporated) | 46,488 | 4.1% |
| Self-Employed (Not Incorporated) | 71,308 | 6.2% |
| Not-for-profit Organizations | 145,623 | 12.7% |
| Local Government Employees | 82,665 | 7.2% |
| State Government Employees | 27,623 | 2.4% |
| Federal Government Employees | 18,929 | 1.7% |
| Unpaid Family Workers | 1,364 | 0.1% |
| Total | 1,144,459 | 100.0% |
Employment Status by Age in Area Code 212
According to the labor force statistics for Area Code 212, out of the total population over 16 years of age (1,987,001), 64.5% or 1,282,013 individuals are in the labor force, with 7.8% or 99,869 of them unemployed. The age group with the highest labor force participation rate is 25 to 29 years, with 86.5% or 193,267 individuals in the labor force. Within the labor force, the 16 to 19 years age range has the highest percentage of unemployed individuals, with 1,500.7% or 327,183 of them being unemployed.
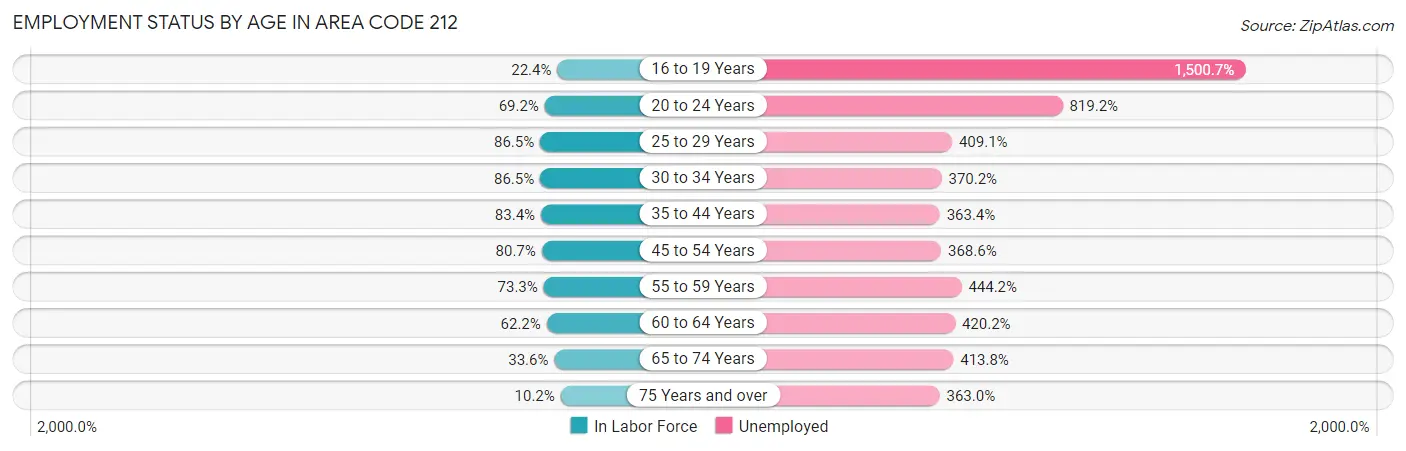
| Age Bracket | In Labor Force | Unemployed |
| 16 to 19 Years | 21,805 (22.4%) | 327,183 (1,500.7%) |
| 20 to 24 Years | 104,850 (69.2%) | 858,980 (819.2%) |
| 25 to 29 Years | 193,263 (86.5%) | 790,655 (409.1%) |
| 30 to 34 Years | 189,518 (86.5%) | 701,629 (370.2%) |
| 35 to 44 Years | 276,615 (83.4%) | 1,005,270 (363.4%) |
| 45 to 54 Years | 231,625 (80.7%) | 853,755 (368.6%) |
| 55 to 59 Years | 108,494 (73.3%) | 481,948 (444.2%) |
| 60 to 64 Years | 82,745 (62.2%) | 347,716 (420.2%) |
| 65 to 74 Years | 74,153 (33.6%) | 306,841 (413.8%) |
| 75 Years and over | 17,846 (10.2%) | 64,770 (363.0%) |
| Total | 1,282,019 (64.5%) | 99,808 (7.8%) |
Employment Status by Educational Attainment in Area Code 212
According to labor force statistics for Area Code 212, 80.5% of individuals (1,080,671) out of the total population between 25 and 64 years of age (1,342,782) are in the labor force, with 382.9% or 4,137,889 of them being unemployed. The group with the highest labor force participation rate are those with the educational attainment of bachelor's degree or higher, with 88.0% or 646,762 individuals in the labor force. Within the labor force, individuals with less than high school education have the highest percentage of unemployment, with 643.8% or 563,261 of them being unemployed.
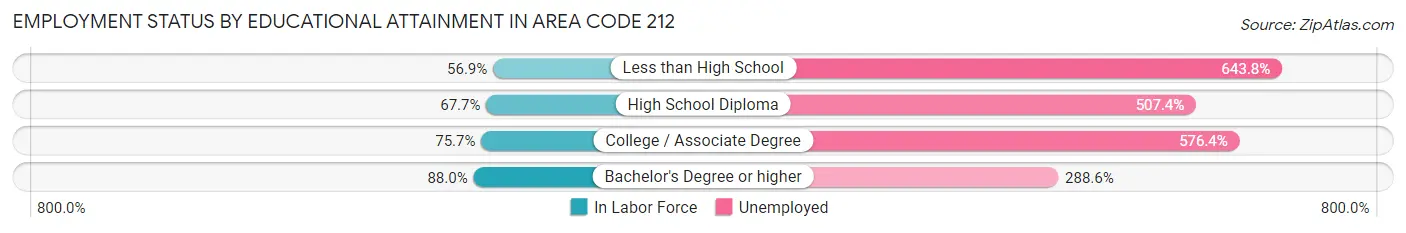
| Educational Attainment | In Labor Force | Unemployed |
| Less than High School | 87,490 (56.9%) | 990,609 (643.8%) |
| High School Diploma | 149,506 (67.7%) | 1,119,842 (507.4%) |
| College / Associate Degree | 176,563 (75.7%) | 1,344,960 (576.4%) |
| Bachelor's Degree or higher | 646,734 (88.0%) | 2,120,843 (288.6%) |
| Total | 1,080,646 (80.5%) | 5,141,512 (382.9%) |
Employment Occupations by Sex in Area Code 212
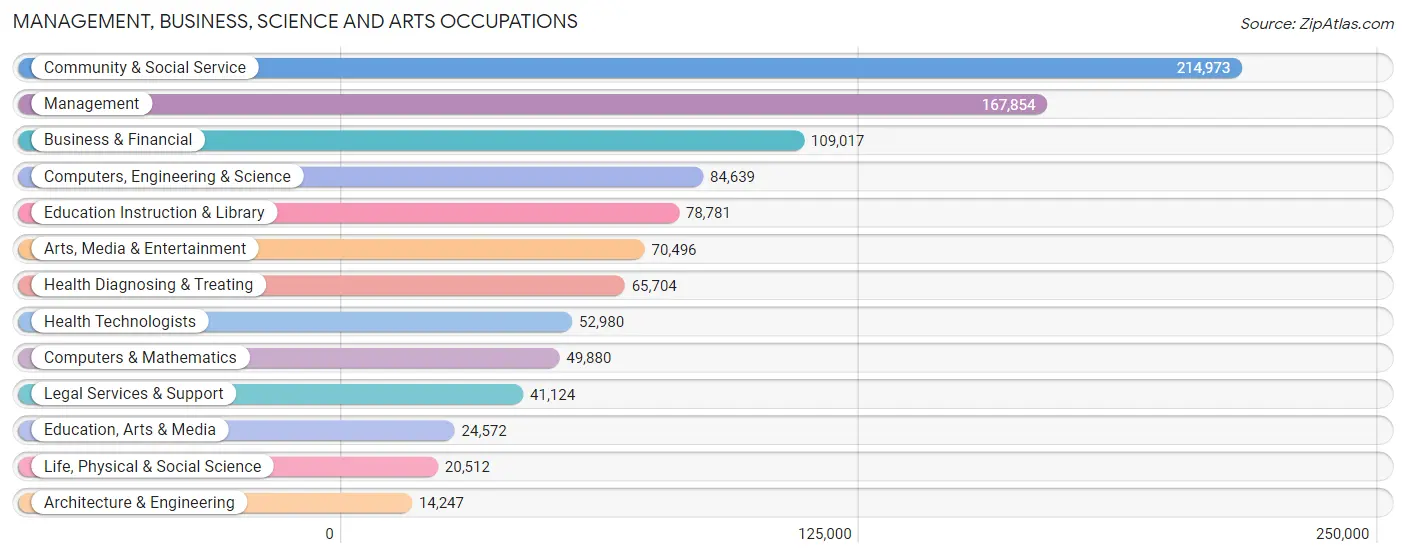
Management, Business, Science and Arts Occupations
The most common Management, Business, Science and Arts occupations in Area Code 212 are Community & Social Service (214,973 | 18.3%), Management (167,854 | 14.3%), Business & Financial (109,017 | 9.3%), Computers, Engineering & Science (84,639 | 7.2%), and Education Instruction & Library (78,781 | 6.7%).
Management, Business, Science and Arts Occupations by Sex
Within the Management, Business, Science and Arts occupations in Area Code 212, the most male-oriented occupations are Computers & Mathematics (72.5%), Architecture & Engineering (72.0%), and Computers, Engineering & Science (65.5%), while the most female-oriented occupations are Education, Arts & Media (70.2%), Education Instruction & Library (67.3%), and Health Technologists (63.5%).
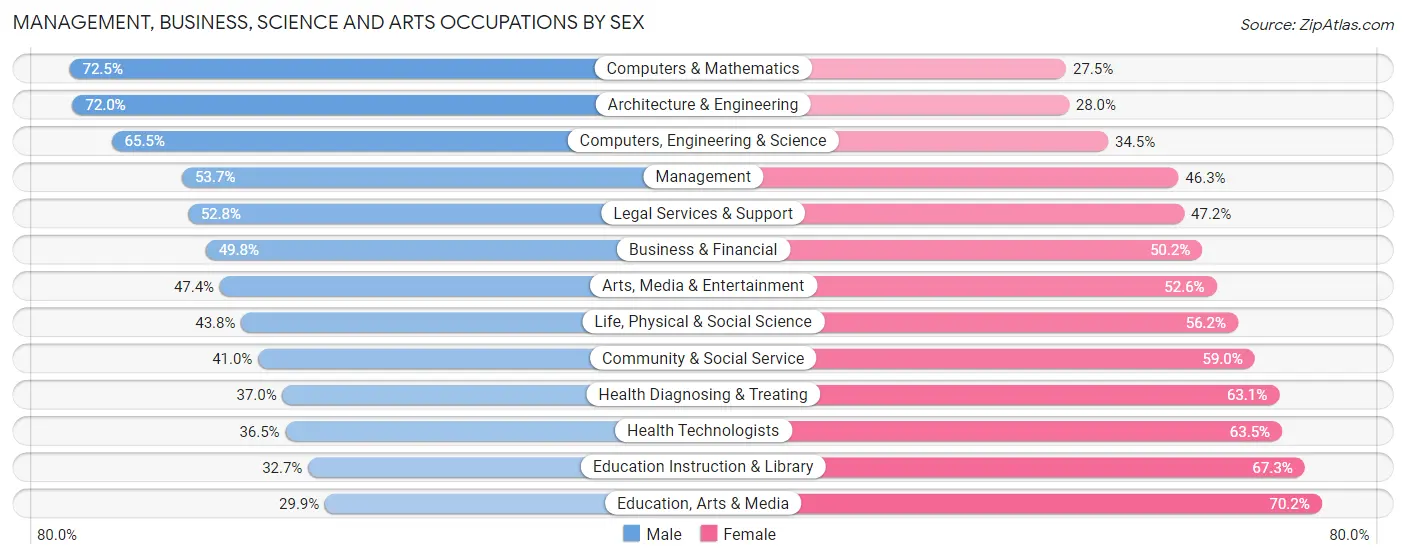
| Occupation | Male | Female |
| Management | 90,190 (53.7%) | 77,664 (46.3%) |
| Business & Financial | 54,257 (49.8%) | 54,760 (50.2%) |
| Computers, Engineering & Science | 55,411 (65.5%) | 29,228 (34.5%) |
| Computers & Mathematics | 36,159 (72.5%) | 13,721 (27.5%) |
| Architecture & Engineering | 10,261 (72.0%) | 3,986 (28.0%) |
| Life, Physical & Social Science | 8,991 (43.8%) | 11,521 (56.2%) |
| Community & Social Service | 88,190 (41.0%) | 126,783 (59.0%) |
| Education, Arts & Media | 7,335 (29.8%) | 17,237 (70.2%) |
| Legal Services & Support | 21,705 (52.8%) | 19,419 (47.2%) |
| Education Instruction & Library | 25,735 (32.7%) | 53,046 (67.3%) |
| Arts, Media & Entertainment | 33,415 (47.4%) | 37,081 (52.6%) |
| Health Diagnosing & Treating | 24,275 (36.9%) | 41,429 (63.0%) |
| Health Technologists | 19,324 (36.5%) | 33,656 (63.5%) |
| Total (Category) | 312,323 (48.6%) | 329,864 (51.4%) |
| Total (Overall) | 590,247 (50.3%) | 582,539 (49.7%) |
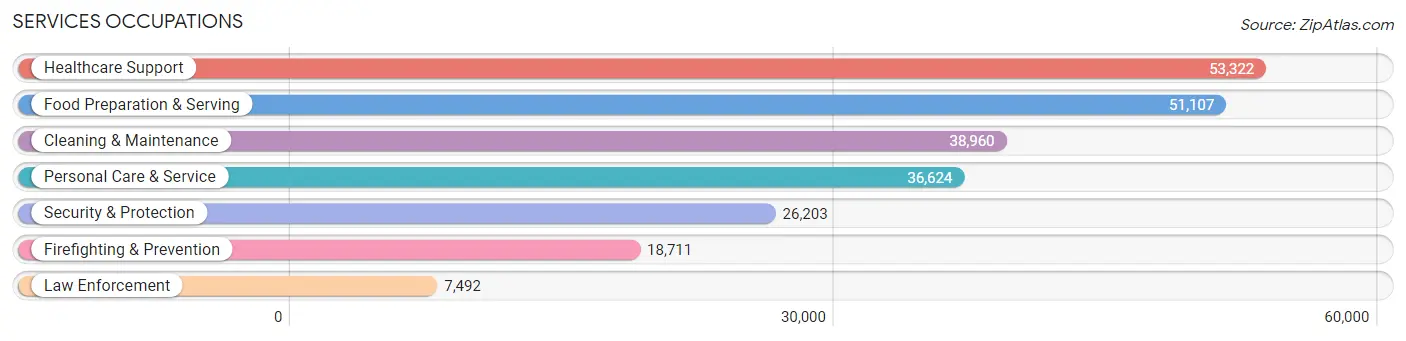
Services Occupations
The most common Services occupations in Area Code 212 are Healthcare Support (53,322 | 4.5%), Food Preparation & Serving (51,107 | 4.4%), Cleaning & Maintenance (38,960 | 3.3%), Personal Care & Service (36,624 | 3.1%), and Security & Protection (26,203 | 2.2%).
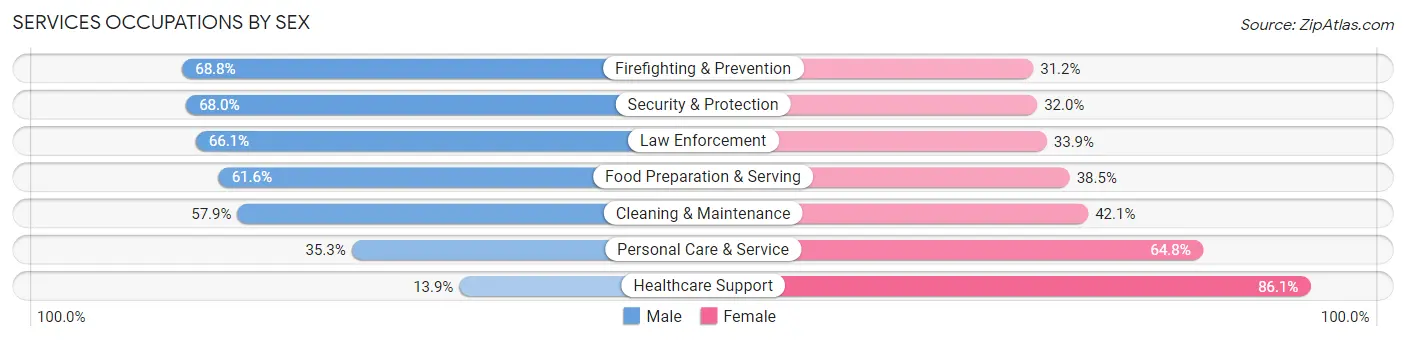
Services Occupations by Sex
Within the Services occupations in Area Code 212, the most male-oriented occupations are Firefighting & Prevention (68.8%), Security & Protection (68.0%), and Law Enforcement (66.1%), while the most female-oriented occupations are Healthcare Support (86.1%), Personal Care & Service (64.7%), and Cleaning & Maintenance (42.1%).
| Occupation | Male | Female |
| Healthcare Support | 7,432 (13.9%) | 45,890 (86.1%) |
| Security & Protection | 17,816 (68.0%) | 8,387 (32.0%) |
| Firefighting & Prevention | 12,865 (68.8%) | 5,846 (31.2%) |
| Law Enforcement | 4,951 (66.1%) | 2,541 (33.9%) |
| Food Preparation & Serving | 31,458 (61.6%) | 19,649 (38.5%) |
| Cleaning & Maintenance | 22,550 (57.9%) | 16,410 (42.1%) |
| Personal Care & Service | 12,911 (35.2%) | 23,713 (64.7%) |
| Total (Category) | 92,167 (44.7%) | 114,049 (55.3%) |
| Total (Overall) | 590,247 (50.3%) | 582,539 (49.7%) |
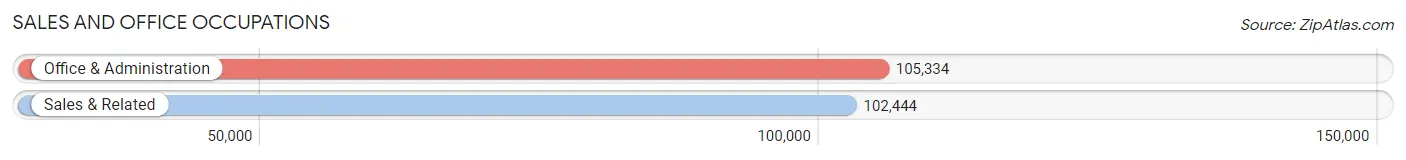
Sales and Office Occupations
The most common Sales and Office occupations in Area Code 212 are Office & Administration (105,334 | 9.0%), and Sales & Related (102,444 | 8.7%).
Sales and Office Occupations by Sex
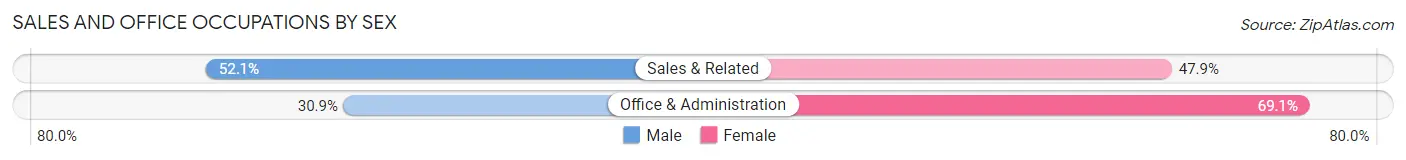
| Occupation | Male | Female |
| Sales & Related | 53,386 (52.1%) | 49,058 (47.9%) |
| Office & Administration | 32,540 (30.9%) | 72,794 (69.1%) |
| Total (Category) | 85,926 (41.3%) | 121,852 (58.7%) |
| Total (Overall) | 590,247 (50.3%) | 582,539 (49.7%) |
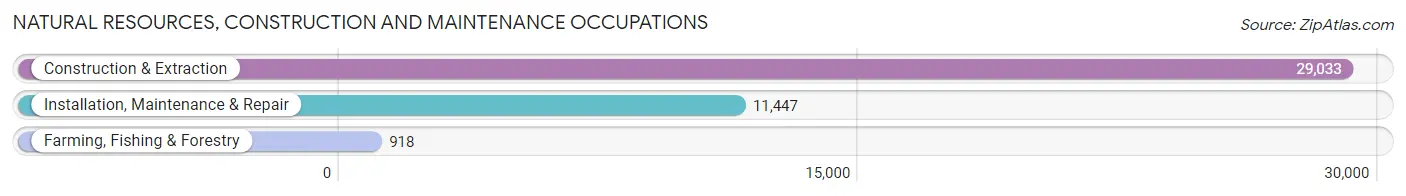
Natural Resources, Construction and Maintenance Occupations
The most common Natural Resources, Construction and Maintenance occupations in Area Code 212 are Construction & Extraction (29,033 | 2.5%), Installation, Maintenance & Repair (11,447 | 1.0%), and Farming, Fishing & Forestry (918 | 0.1%).
Natural Resources, Construction and Maintenance Occupations by Sex
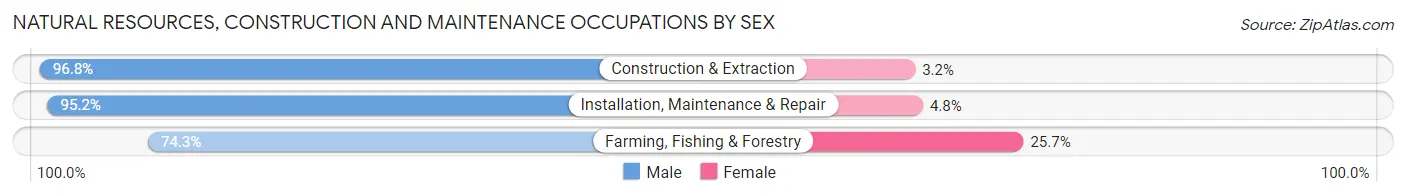
| Occupation | Male | Female |
| Farming, Fishing & Forestry | 682 (74.3%) | 236 (25.7%) |
| Construction & Extraction | 28,106 (96.8%) | 927 (3.2%) |
| Installation, Maintenance & Repair | 10,897 (95.2%) | 550 (4.8%) |
| Total (Category) | 39,685 (95.9%) | 1,713 (4.1%) |
| Total (Overall) | 590,247 (50.3%) | 582,539 (49.7%) |
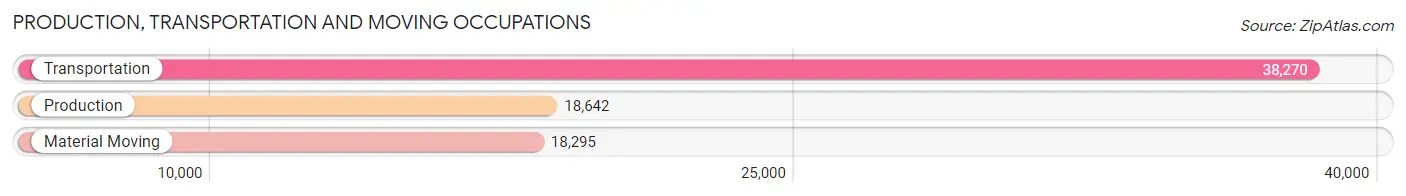
Production, Transportation and Moving Occupations
The most common Production, Transportation and Moving occupations in Area Code 212 are Transportation (38,270 | 3.3%), Production (18,642 | 1.6%), and Material Moving (18,295 | 1.6%).
Production, Transportation and Moving Occupations by Sex
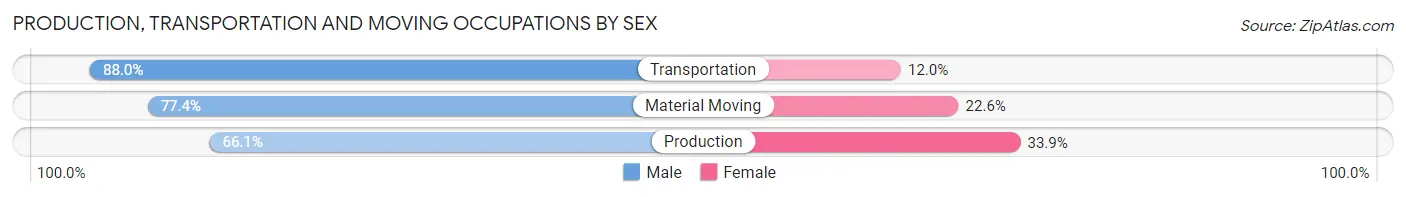
| Occupation | Male | Female |
| Production | 12,314 (66.1%) | 6,328 (33.9%) |
| Transportation | 33,670 (88.0%) | 4,600 (12.0%) |
| Material Moving | 14,162 (77.4%) | 4,133 (22.6%) |
| Total (Category) | 60,146 (80.0%) | 15,061 (20.0%) |
| Total (Overall) | 590,247 (50.3%) | 582,539 (49.7%) |
Employment Industries by Sex in Area Code 212
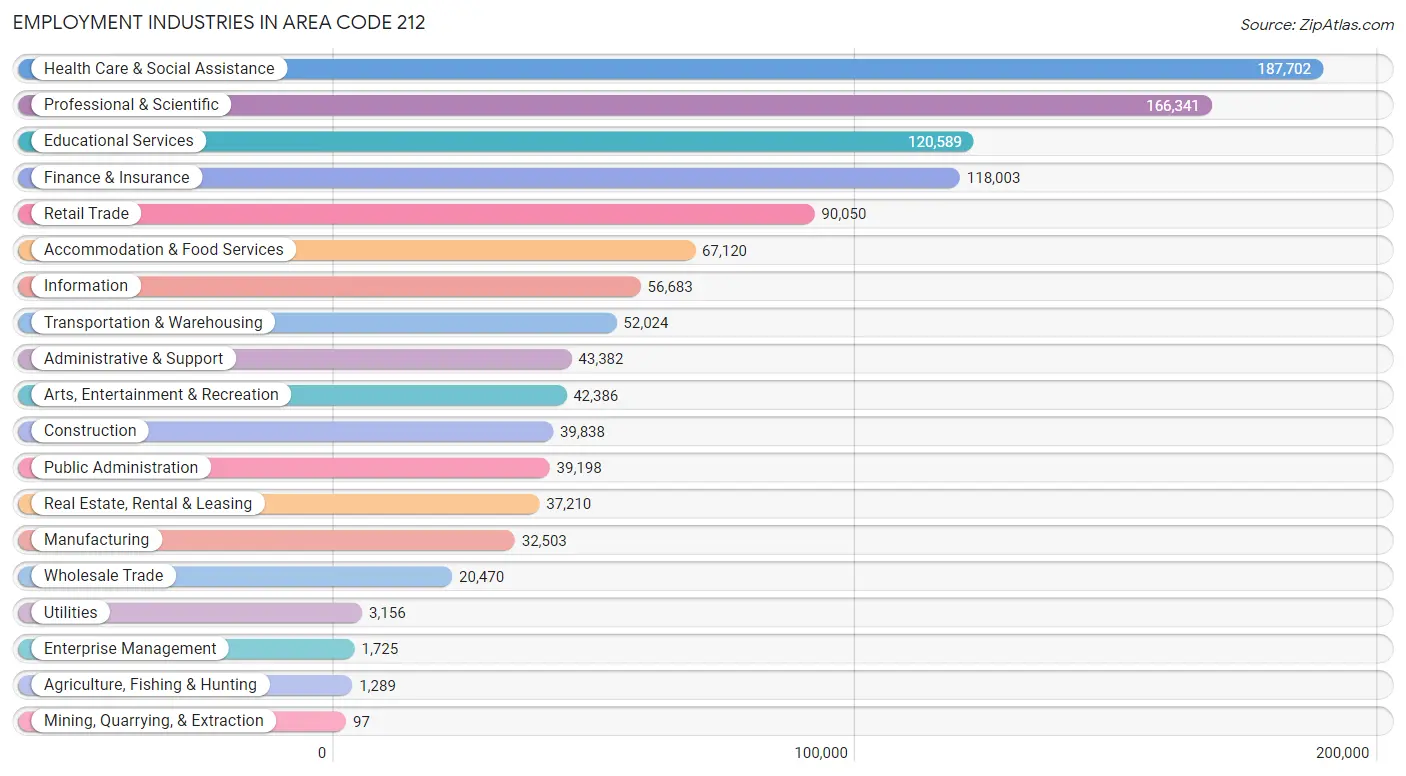
Employment Industries in Area Code 212
The major employment industries in Area Code 212 include Health Care & Social Assistance (187,702 | 16.0%), Professional & Scientific (166,341 | 14.2%), Educational Services (120,589 | 10.3%), Finance & Insurance (118,003 | 10.1%), and Retail Trade (90,050 | 7.7%).
Employment Industries by Sex in Area Code 212
The Area Code 212 industries that see more men than women are Mining, Quarrying, & Extraction (100.0%), Construction (87.9%), and Transportation & Warehousing (77.9%), whereas the industries that tend to have a higher number of women are Health Care & Social Assistance (71.8%), Educational Services (64.0%), and Public Administration (51.5%).
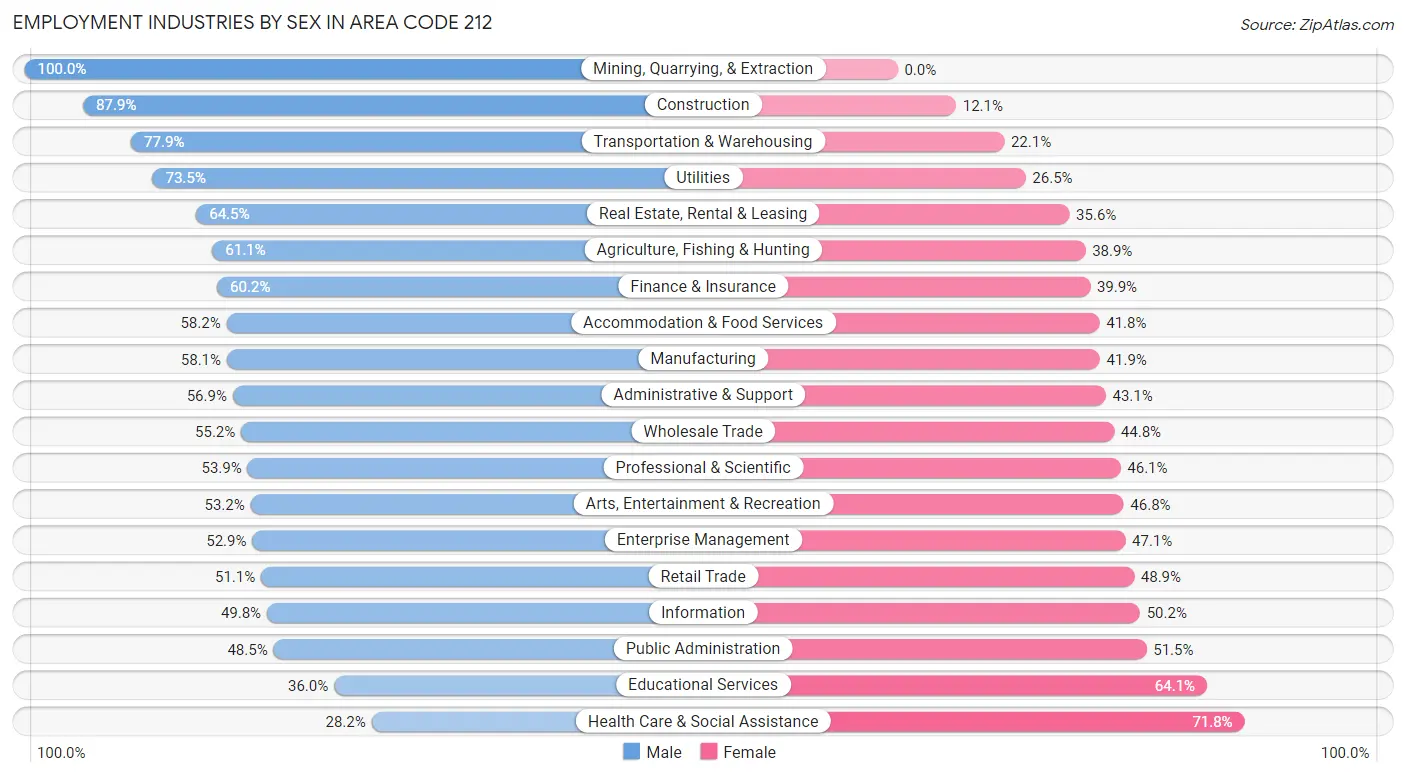
| Industry | Male | Female |
| Agriculture, Fishing & Hunting | 788 (61.1%) | 501 (38.9%) |
| Mining, Quarrying, & Extraction | 97 (100.0%) | 0 (0.0%) |
| Construction | 35,021 (87.9%) | 4,817 (12.1%) |
| Manufacturing | 18,896 (58.1%) | 13,607 (41.9%) |
| Wholesale Trade | 11,297 (55.2%) | 9,173 (44.8%) |
| Retail Trade | 45,980 (51.1%) | 44,070 (48.9%) |
| Transportation & Warehousing | 40,548 (77.9%) | 11,476 (22.1%) |
| Utilities | 2,320 (73.5%) | 836 (26.5%) |
| Information | 28,250 (49.8%) | 28,433 (50.2%) |
| Finance & Insurance | 70,973 (60.2%) | 47,030 (39.9%) |
| Real Estate, Rental & Leasing | 23,981 (64.4%) | 13,229 (35.5%) |
| Professional & Scientific | 89,589 (53.9%) | 76,752 (46.1%) |
| Enterprise Management | 912 (52.9%) | 813 (47.1%) |
| Administrative & Support | 24,694 (56.9%) | 18,688 (43.1%) |
| Educational Services | 43,354 (35.9%) | 77,235 (64.0%) |
| Health Care & Social Assistance | 52,896 (28.2%) | 134,806 (71.8%) |
| Arts, Entertainment & Recreation | 22,564 (53.2%) | 19,822 (46.8%) |
| Accommodation & Food Services | 39,068 (58.2%) | 28,052 (41.8%) |
| Public Administration | 19,003 (48.5%) | 20,195 (51.5%) |
| Total | 590,247 (50.3%) | 582,539 (49.7%) |
Education in Area Code 212
School Enrollment in Area Code 212
The most common levels of schooling among the 517,495 students in Area Code 212 are college / undergraduate (130,582 | 25.2%), high school (92,267 | 17.8%), and middle school (91,563 | 17.7%).
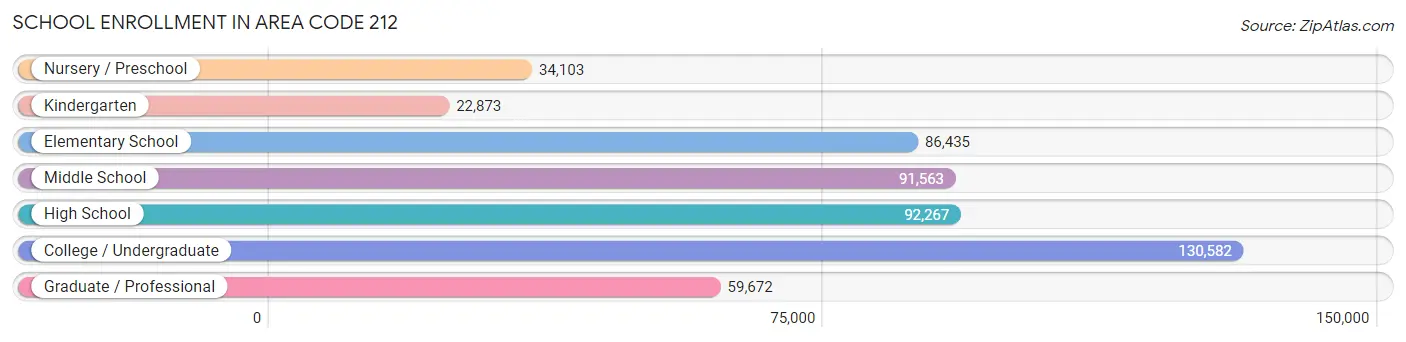
| School Level | # Students | % Students |
| Nursery / Preschool | 34,103 | 6.6% |
| Kindergarten | 22,873 | 4.4% |
| Elementary School | 86,435 | 16.7% |
| Middle School | 91,563 | 17.7% |
| High School | 92,267 | 17.8% |
| College / Undergraduate | 130,582 | 25.2% |
| Graduate / Professional | 59,672 | 11.5% |
| Total | 517,495 | 100.0% |
School Enrollment by Age by Funding Source in Area Code 212
Out of a total of 517,495 students who are enrolled in schools in Area Code 212, 181,516 (35.1%) attend a private institution, while the remaining 335,979 (64.9%) are enrolled in public schools. The age group of 18 to 19 year olds has the highest likelihood of being enrolled in private schools, with 27,261 (58.3% in the age bracket) enrolled. Conversely, the age group of 5 to 9 year old has the lowest likelihood of being enrolled in a private school, with 83,105 (79.8% in the age bracket) attending a public institution.
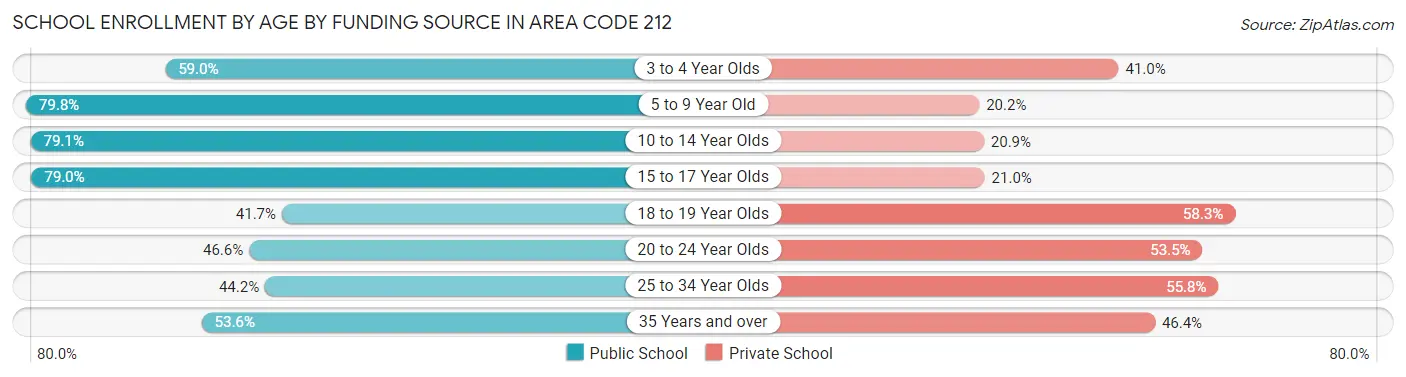
| Age Bracket | Public School | Private School |
| 3 to 4 Year Olds | 19,346 (59.0%) | 13,422 (41.0%) |
| 5 to 9 Year Old | 83,105 (79.8%) | 21,038 (20.2%) |
| 10 to 14 Year Olds | 89,537 (79.1%) | 23,645 (20.9%) |
| 15 to 17 Year Olds | 50,667 (79.0%) | 13,477 (21.0%) |
| 18 to 19 Year Olds | 19,476 (41.7%) | 27,261 (58.3%) |
| 20 to 24 Year Olds | 33,316 (46.6%) | 38,251 (53.4%) |
| 25 to 34 Year Olds | 23,471 (44.2%) | 29,651 (55.8%) |
| 35 Years and over | 17,067 (53.6%) | 14,765 (46.4%) |
| Total | 335,979 (64.9%) | 181,516 (35.1%) |
Educational Attainment by Field of Study in Area Code 212
Business (171,270 | 17.3%), social sciences (149,247 | 15.1%), visual & performing arts (97,362 | 9.9%), literature & languages (75,805 | 7.7%), and liberal arts & history (69,796 | 7.1%) are the most common fields of study among 988,194 individuals in Area Code 212 who have obtained a bachelor's degree or higher.
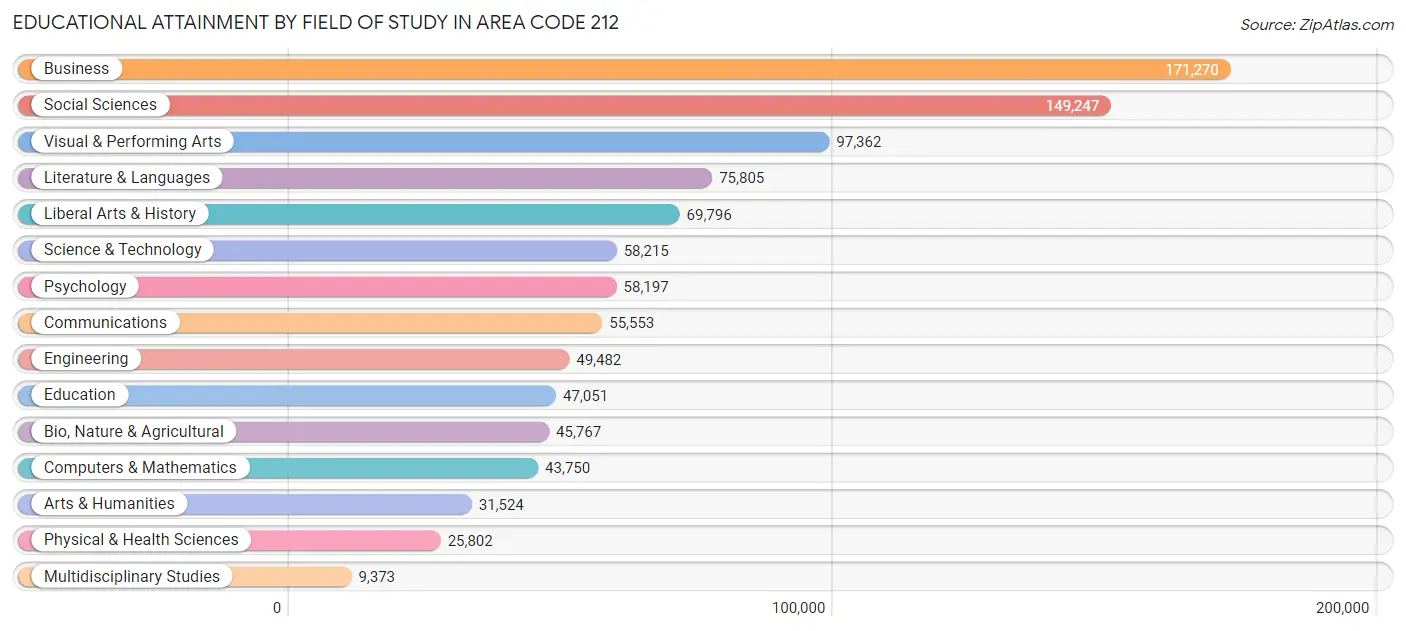
| Field of Study | # Graduates | % Graduates |
| Computers & Mathematics | 43,750 | 4.4% |
| Bio, Nature & Agricultural | 45,767 | 4.6% |
| Physical & Health Sciences | 25,802 | 2.6% |
| Psychology | 58,197 | 5.9% |
| Social Sciences | 149,247 | 15.1% |
| Engineering | 49,482 | 5.0% |
| Multidisciplinary Studies | 9,373 | 0.9% |
| Science & Technology | 58,215 | 5.9% |
| Business | 171,270 | 17.3% |
| Education | 47,051 | 4.8% |
| Literature & Languages | 75,805 | 7.7% |
| Liberal Arts & History | 69,796 | 7.1% |
| Visual & Performing Arts | 97,362 | 9.9% |
| Communications | 55,553 | 5.6% |
| Arts & Humanities | 31,524 | 3.2% |
| Total | 988,194 | 100.0% |
Transportation & Commute in Area Code 212
Vehicle Availability by Sex in Area Code 212
The most prevalent vehicle ownership categories in Area Code 212 are males with no vehicle (333,033, accounting for 58.4%) and females with no vehicle (351,237, making up 60.2%).
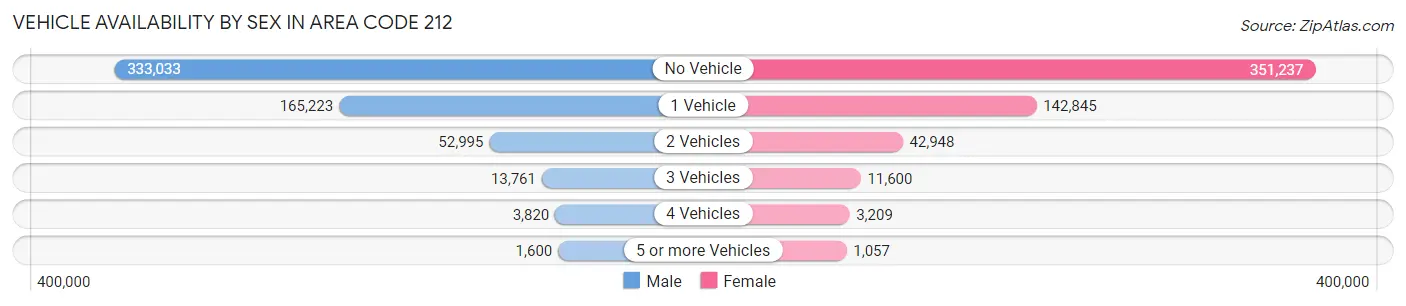
| Vehicles Available | Male | Female |
| No Vehicle | 333,033 (58.4%) | 351,237 (63.5%) |
| 1 Vehicle | 165,223 (29.0%) | 142,845 (25.8%) |
| 2 Vehicles | 52,995 (9.3%) | 42,948 (7.8%) |
| 3 Vehicles | 13,761 (2.4%) | 11,600 (2.1%) |
| 4 Vehicles | 3,820 (0.7%) | 3,209 (0.6%) |
| 5 or more Vehicles | 1,600 (0.3%) | 1,057 (0.2%) |
| Total | 570,432 (100.0%) | 552,896 (100.0%) |
Commute Time in Area Code 212
The most frequently occuring commute durations in Area Code 212 are 30 to 34 minutes (170,418 commuters, 18.0%), 45 to 59 minutes (134,681 commuters, 14.2%), and 60 to 89 minutes (124,882 commuters, 13.2%).
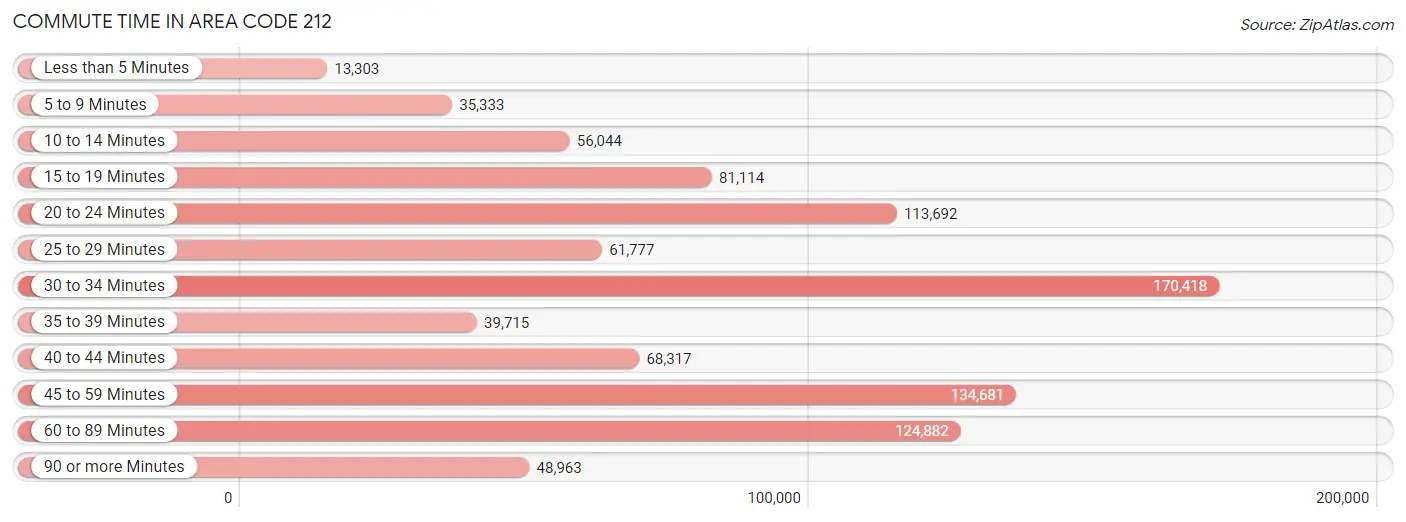
| Commute Time | # Commuters | % Commuters |
| Less than 5 Minutes | 13,303 | 1.4% |
| 5 to 9 Minutes | 35,333 | 3.7% |
| 10 to 14 Minutes | 56,044 | 5.9% |
| 15 to 19 Minutes | 81,114 | 8.6% |
| 20 to 24 Minutes | 113,692 | 12.0% |
| 25 to 29 Minutes | 61,777 | 6.5% |
| 30 to 34 Minutes | 170,418 | 18.0% |
| 35 to 39 Minutes | 39,715 | 4.2% |
| 40 to 44 Minutes | 68,317 | 7.2% |
| 45 to 59 Minutes | 134,681 | 14.2% |
| 60 to 89 Minutes | 124,882 | 13.2% |
| 90 or more Minutes | 48,963 | 5.2% |
Commute Time by Sex in Area Code 212
The most common commute times in Area Code 212 are 30 to 34 minutes (85,475 commuters, 17.7%) for males and 30 to 34 minutes (84,943 commuters, 18.3%) for females.
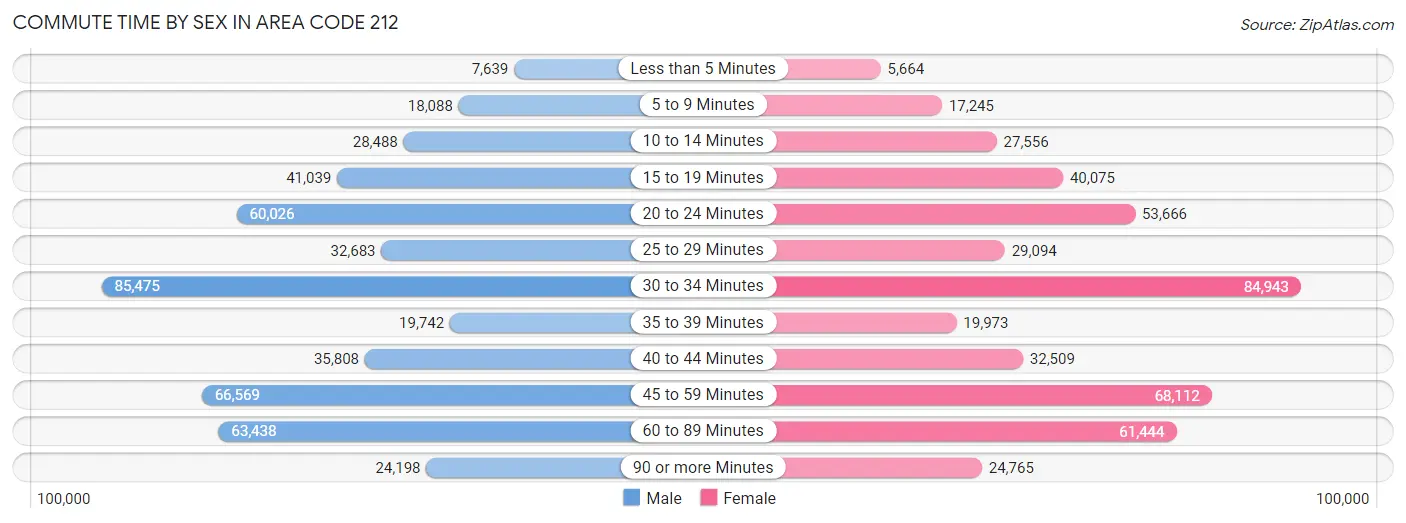
| Commute Time | Male | Female |
| Less than 5 Minutes | 7,639 (1.6%) | 5,664 (1.2%) |
| 5 to 9 Minutes | 18,088 (3.7%) | 17,245 (3.7%) |
| 10 to 14 Minutes | 28,488 (5.9%) | 27,556 (5.9%) |
| 15 to 19 Minutes | 41,039 (8.5%) | 40,075 (8.6%) |
| 20 to 24 Minutes | 60,026 (12.4%) | 53,666 (11.5%) |
| 25 to 29 Minutes | 32,683 (6.8%) | 29,094 (6.3%) |
| 30 to 34 Minutes | 85,475 (17.7%) | 84,943 (18.3%) |
| 35 to 39 Minutes | 19,742 (4.1%) | 19,973 (4.3%) |
| 40 to 44 Minutes | 35,808 (7.4%) | 32,509 (7.0%) |
| 45 to 59 Minutes | 66,569 (13.8%) | 68,112 (14.6%) |
| 60 to 89 Minutes | 63,438 (13.1%) | 61,444 (13.2%) |
| 90 or more Minutes | 24,198 (5.0%) | 24,765 (5.3%) |
Time of Departure to Work by Sex in Area Code 212
The most frequent times of departure to work in Area Code 212 are 8:00 AM to 8:29 AM (79,396, 16.4%) for males and 8:00 AM to 8:29 AM (89,439, 19.2%) for females.
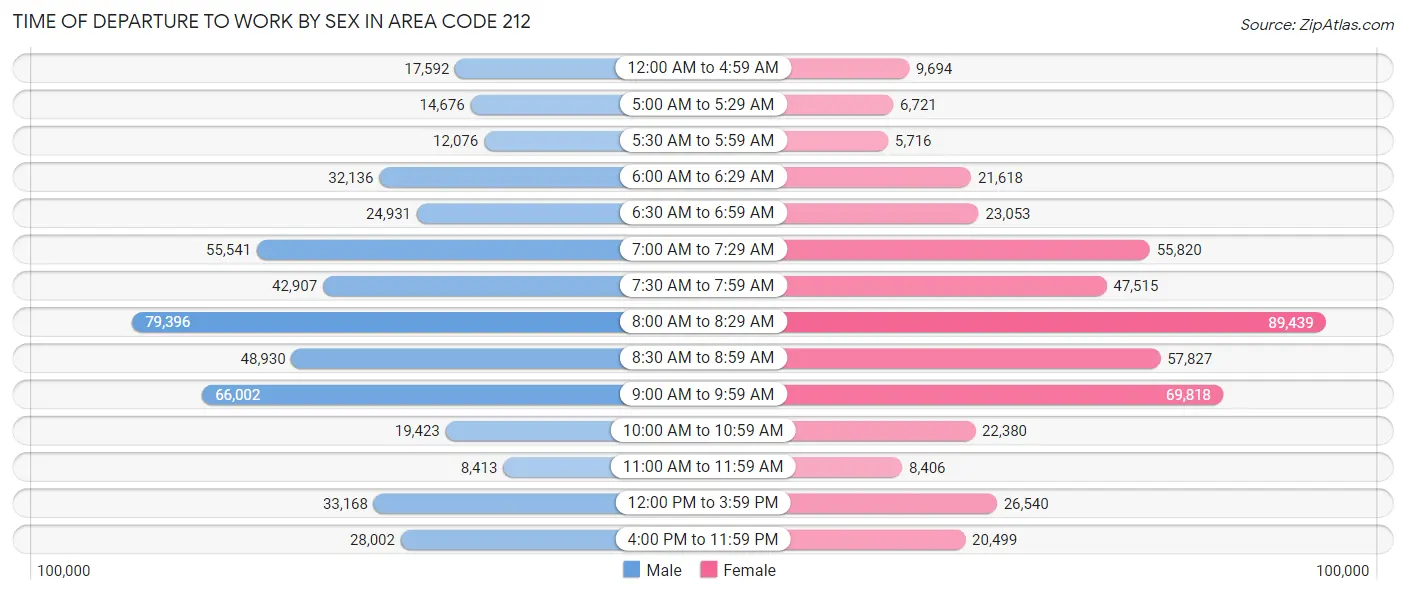
| Time of Departure | Male | Female |
| 12:00 AM to 4:59 AM | 17,592 (3.6%) | 9,694 (2.1%) |
| 5:00 AM to 5:29 AM | 14,676 (3.0%) | 6,721 (1.5%) |
| 5:30 AM to 5:59 AM | 12,076 (2.5%) | 5,716 (1.2%) |
| 6:00 AM to 6:29 AM | 32,136 (6.7%) | 21,618 (4.6%) |
| 6:30 AM to 6:59 AM | 24,931 (5.2%) | 23,053 (5.0%) |
| 7:00 AM to 7:29 AM | 55,541 (11.5%) | 55,820 (12.0%) |
| 7:30 AM to 7:59 AM | 42,907 (8.9%) | 47,515 (10.2%) |
| 8:00 AM to 8:29 AM | 79,396 (16.4%) | 89,439 (19.2%) |
| 8:30 AM to 8:59 AM | 48,930 (10.1%) | 57,827 (12.4%) |
| 9:00 AM to 9:59 AM | 66,002 (13.7%) | 69,818 (15.0%) |
| 10:00 AM to 10:59 AM | 19,423 (4.0%) | 22,380 (4.8%) |
| 11:00 AM to 11:59 AM | 8,413 (1.7%) | 8,406 (1.8%) |
| 12:00 PM to 3:59 PM | 33,168 (6.9%) | 26,540 (5.7%) |
| 4:00 PM to 11:59 PM | 28,002 (5.8%) | 20,499 (4.4%) |
| Total | 483,193 (100.0%) | 465,046 (100.0%) |
Housing Occupancy in Area Code 212
Occupancy by Ownership in Area Code 212
Of the total 1,007,101 dwellings in Area Code 212, owner-occupied units account for 276,058 (27.4%), while renter-occupied units make up 731,043 (72.6%).
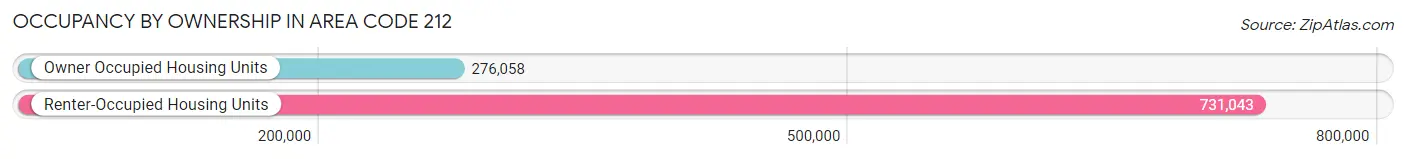
| Occupancy | # Housing Units | % Housing Units |
| Owner Occupied Housing Units | 276,058 | 27.4% |
| Renter-Occupied Housing Units | 731,043 | 72.6% |
| Total Occupied Housing Units | 1,007,101 | 100.0% |
Occupancy by Household Size in Area Code 212
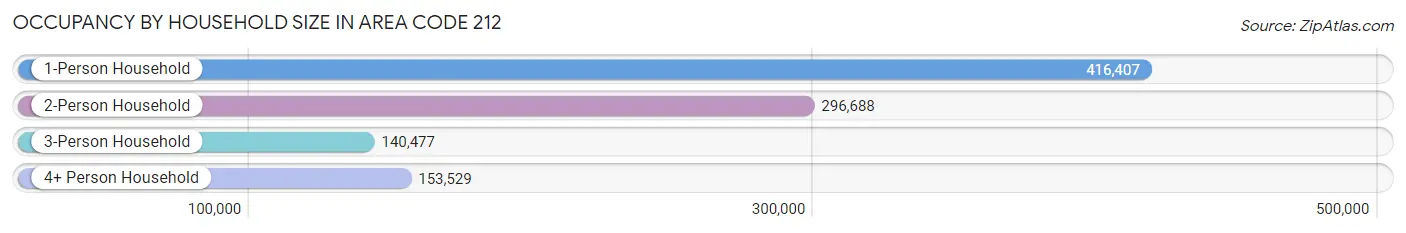
| Household Size | # Housing Units | % Housing Units |
| 1-Person Household | 416,407 | 41.3% |
| 2-Person Household | 296,688 | 29.5% |
| 3-Person Household | 140,477 | 14.0% |
| 4+ Person Household | 153,529 | 15.2% |
| Total Housing Units | 1,007,101 | 100.0% |
Occupancy by Ownership by Household Size in Area Code 212
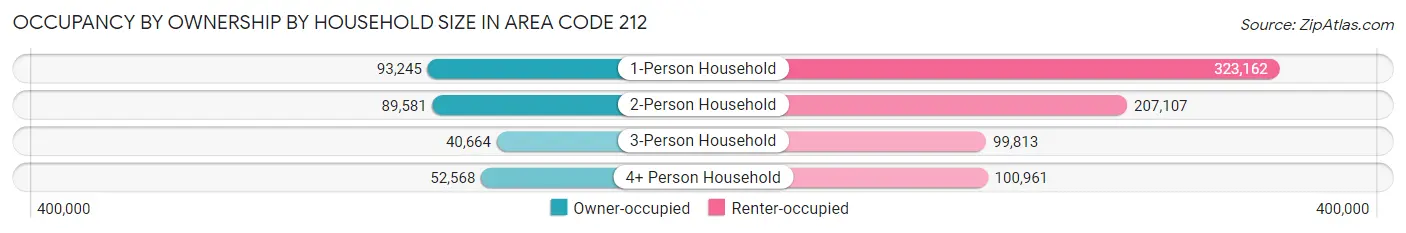
| Household Size | Owner-occupied | Renter-occupied |
| 1-Person Household | 93,245 (22.4%) | 323,162 (77.6%) |
| 2-Person Household | 89,581 (30.2%) | 207,107 (69.8%) |
| 3-Person Household | 40,664 (28.9%) | 99,813 (71.1%) |
| 4+ Person Household | 52,568 (34.2%) | 100,961 (65.8%) |
| Total Housing Units | 276,058 (27.4%) | 731,043 (72.6%) |
Occupancy by Educational Attainment in Area Code 212
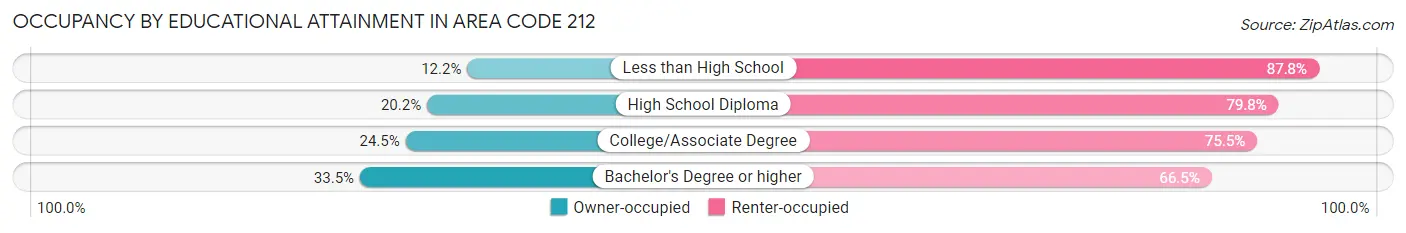
| Household Size | Owner-occupied | Renter-occupied |
| Less than High School | 14,857 (12.2%) | 106,479 (87.8%) |
| High School Diploma | 30,614 (20.2%) | 120,798 (79.8%) |
| College/Associate Degree | 42,115 (24.5%) | 129,976 (75.5%) |
| Bachelor's Degree or higher | 188,472 (33.5%) | 373,790 (66.5%) |
Occupancy by Age of Householder in Area Code 212
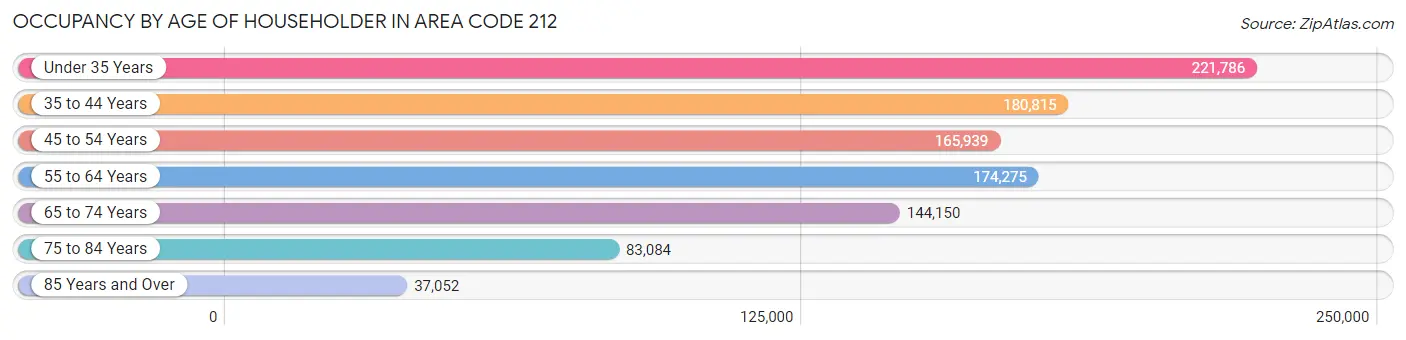
| Age Bracket | # Households | % Households |
| Under 35 Years | 221,786 | 22.0% |
| 35 to 44 Years | 180,815 | 17.9% |
| 45 to 54 Years | 165,939 | 16.5% |
| 55 to 64 Years | 174,275 | 17.3% |
| 65 to 74 Years | 144,150 | 14.3% |
| 75 to 84 Years | 83,084 | 8.3% |
| 85 Years and Over | 37,052 | 3.7% |
| Total | 1,007,101 | 100.0% |
Housing Finances in Area Code 212
Median Income by Occupancy in Area Code 212
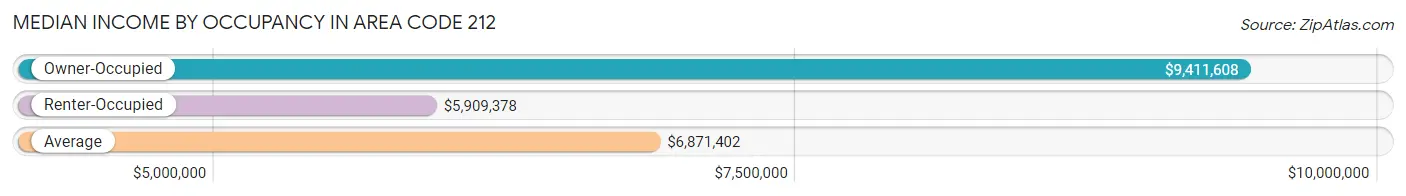
| Occupancy Type | # Households | Median Income |
| Owner-Occupied | 276,058 (27.4%) | $9,411,608 |
| Renter-Occupied | 731,043 (72.6%) | $5,909,378 |
| Average | 1,007,101 (100.0%) | $6,871,402 |
Occupancy by Householder Income Bracket in Area Code 212
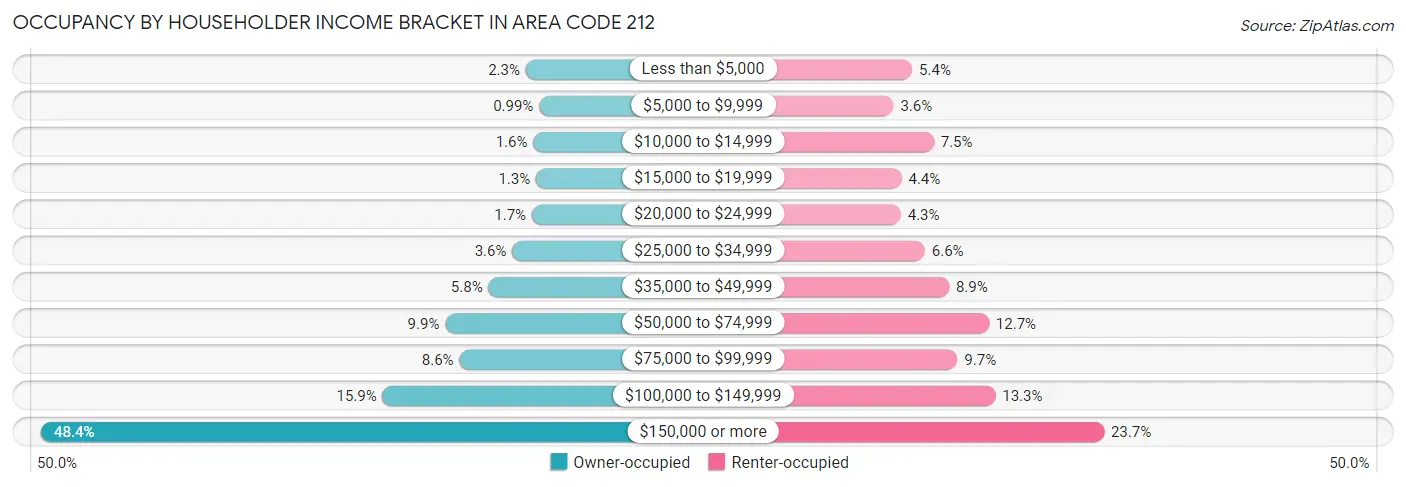
| Income Bracket | Owner-occupied | Renter-occupied |
| Less than $5,000 | 6,271 (2.3%) | 39,389 (5.4%) |
| $5,000 to $9,999 | 2,741 (1.0%) | 26,356 (3.6%) |
| $10,000 to $14,999 | 4,279 (1.5%) | 54,472 (7.4%) |
| $15,000 to $19,999 | 3,549 (1.3%) | 31,997 (4.4%) |
| $20,000 to $24,999 | 4,634 (1.7%) | 31,530 (4.3%) |
| $25,000 to $34,999 | 9,796 (3.5%) | 48,248 (6.6%) |
| $35,000 to $49,999 | 16,062 (5.8%) | 65,076 (8.9%) |
| $50,000 to $74,999 | 27,437 (9.9%) | 92,821 (12.7%) |
| $75,000 to $99,999 | 23,707 (8.6%) | 70,920 (9.7%) |
| $100,000 to $149,999 | 43,912 (15.9%) | 97,291 (13.3%) |
| $150,000 or more | 133,670 (48.4%) | 172,943 (23.7%) |
| Total | 276,058 (100.0%) | 731,043 (100.0%) |
Monthly Housing Cost Tiers in Area Code 212
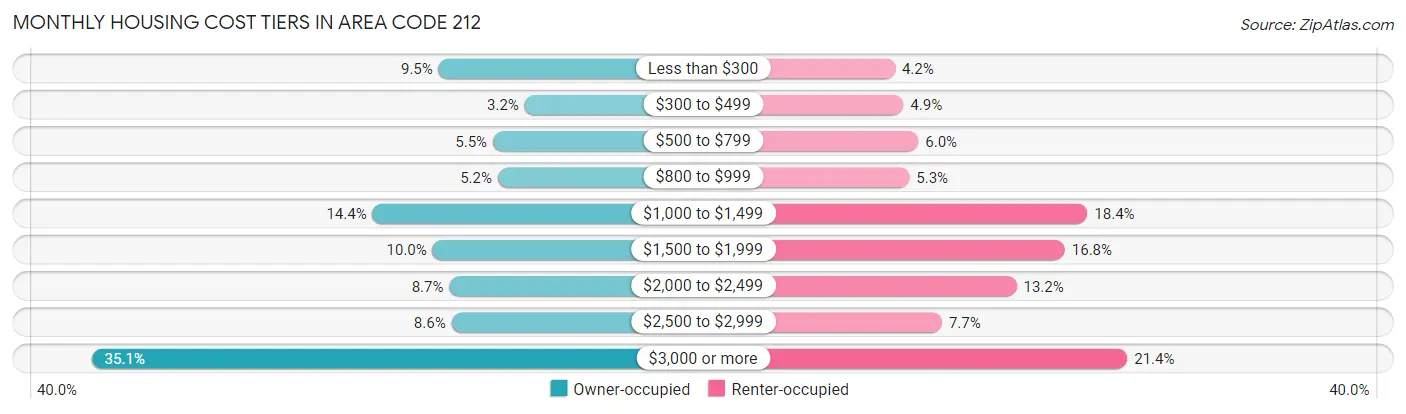
| Monthly Cost | Owner-occupied | Renter-occupied |
| Less than $300 | 26,253 (9.5%) | 31,021 (4.2%) |
| $300 to $499 | 8,741 (3.2%) | 35,523 (4.9%) |
| $500 to $799 | 15,202 (5.5%) | 43,543 (6.0%) |
| $800 to $999 | 14,204 (5.1%) | 38,727 (5.3%) |
| $1,000 to $1,499 | 39,697 (14.4%) | 134,601 (18.4%) |
| $1,500 to $1,999 | 27,473 (10.0%) | 122,464 (16.8%) |
| $2,000 to $2,499 | 24,076 (8.7%) | 96,435 (13.2%) |
| $2,500 to $2,999 | 23,636 (8.6%) | 56,307 (7.7%) |
| $3,000 or more | 96,776 (35.1%) | 156,095 (21.3%) |
| Total | 276,058 (100.0%) | 731,043 (100.0%) |
Physical Housing Characteristics in Area Code 212
Housing Structures in Area Code 212
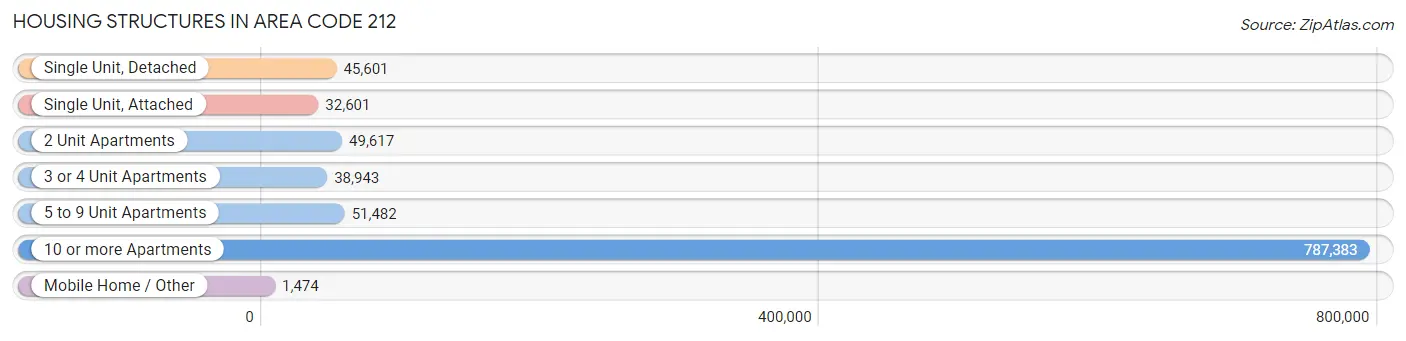
| Structure Type | # Housing Units | % Housing Units |
| Single Unit, Detached | 45,601 | 4.5% |
| Single Unit, Attached | 32,601 | 3.2% |
| 2 Unit Apartments | 49,617 | 4.9% |
| 3 or 4 Unit Apartments | 38,943 | 3.9% |
| 5 to 9 Unit Apartments | 51,482 | 5.1% |
| 10 or more Apartments | 787,383 | 78.2% |
| Mobile Home / Other | 1,474 | 0.2% |
| Total | 1,007,101 | 100.0% |
Housing Structures by Occupancy in Area Code 212
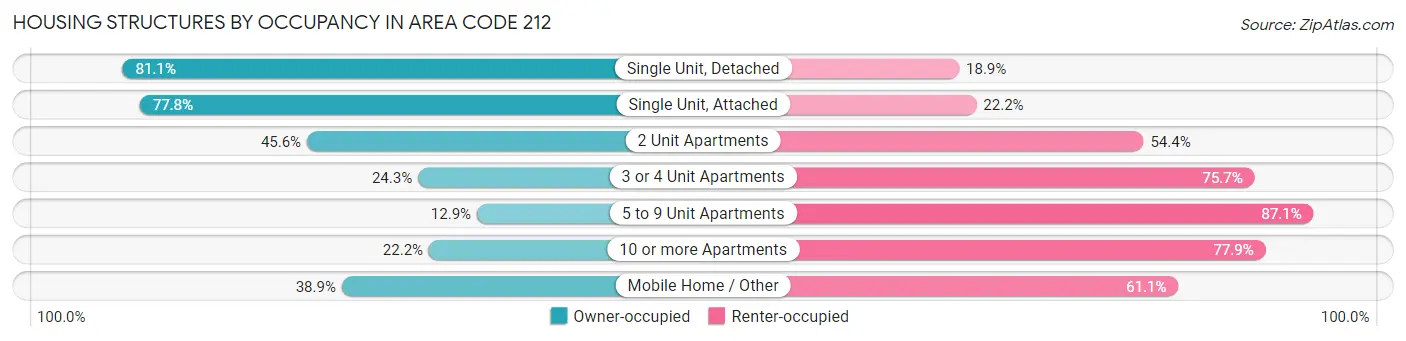
| Structure Type | Owner-occupied | Renter-occupied |
| Single Unit, Detached | 37,001 (81.1%) | 8,600 (18.9%) |
| Single Unit, Attached | 25,367 (77.8%) | 7,234 (22.2%) |
| 2 Unit Apartments | 22,646 (45.6%) | 26,971 (54.4%) |
| 3 or 4 Unit Apartments | 9,448 (24.3%) | 29,495 (75.7%) |
| 5 to 9 Unit Apartments | 6,648 (12.9%) | 44,834 (87.1%) |
| 10 or more Apartments | 174,374 (22.2%) | 613,009 (77.8%) |
| Mobile Home / Other | 574 (38.9%) | 900 (61.1%) |
| Total | 276,058 (27.4%) | 731,043 (72.6%) |
Housing Structures by Number of Rooms in Area Code 212
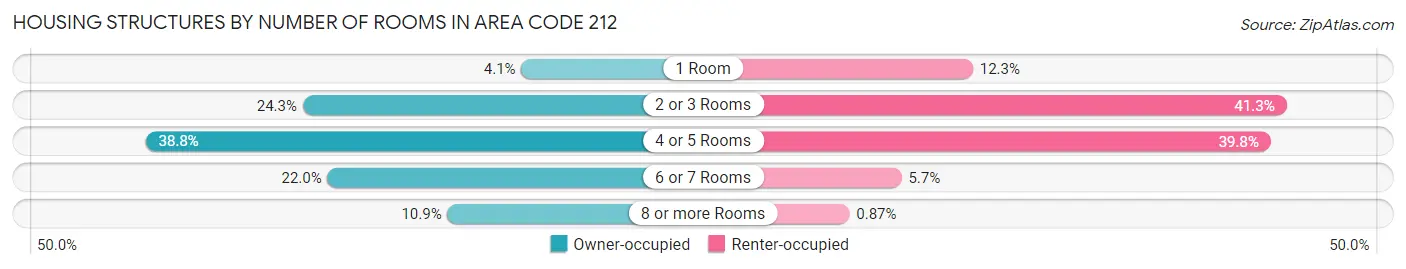
| Number of Rooms | Owner-occupied | Renter-occupied |
| 1 Room | 11,171 (4.1%) | 89,864 (12.3%) |
| 2 or 3 Rooms | 66,993 (24.3%) | 301,949 (41.3%) |
| 4 or 5 Rooms | 107,165 (38.8%) | 291,256 (39.8%) |
| 6 or 7 Rooms | 60,675 (22.0%) | 41,612 (5.7%) |
| 8 or more Rooms | 30,054 (10.9%) | 6,362 (0.9%) |
| Total | 276,058 (100.0%) | 731,043 (100.0%) |
Housing Structure by Heating Type in Area Code 212
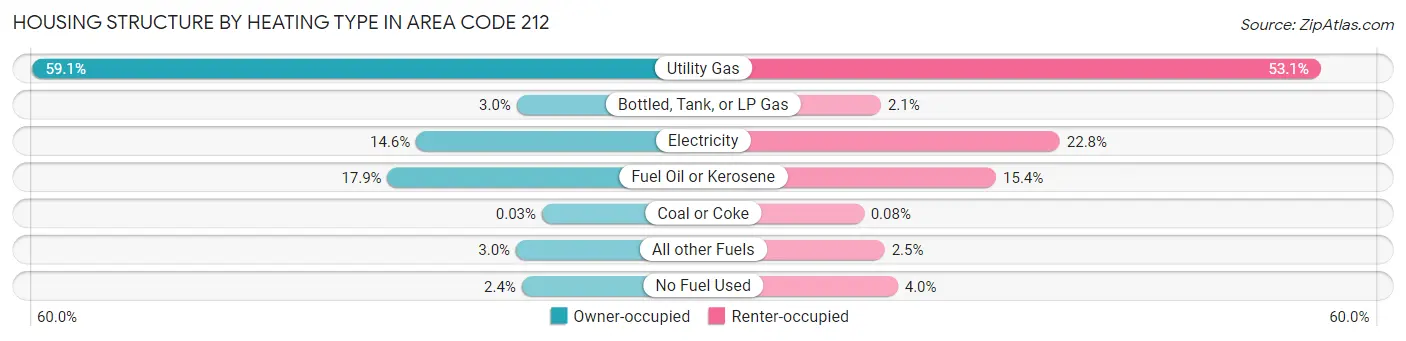
| Heating Type | Owner-occupied | Renter-occupied |
| Utility Gas | 163,097 (59.1%) | 387,852 (53.0%) |
| Bottled, Tank, or LP Gas | 8,157 (2.9%) | 15,234 (2.1%) |
| Electricity | 40,340 (14.6%) | 166,818 (22.8%) |
| Fuel Oil or Kerosene | 49,490 (17.9%) | 112,812 (15.4%) |
| Coal or Coke | 86 (0.0%) | 552 (0.1%) |
| All other Fuels | 8,358 (3.0%) | 18,318 (2.5%) |
| No Fuel Used | 6,530 (2.4%) | 29,457 (4.0%) |
| Total | 276,058 (100.0%) | 731,043 (100.0%) |
Household Vehicle Usage in Area Code 212
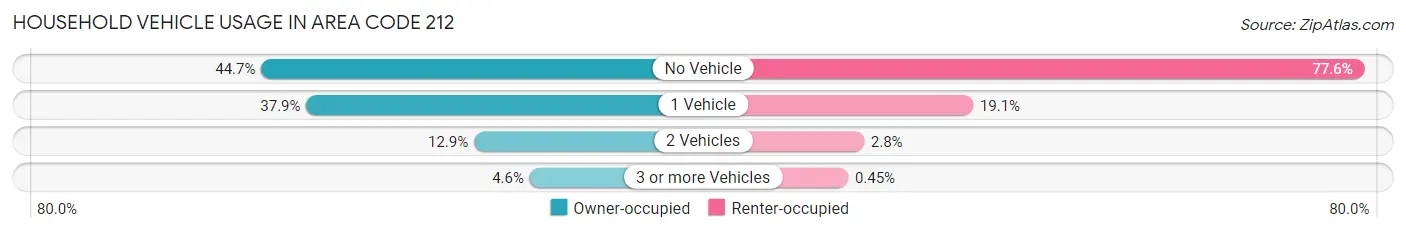
| Vehicles per Household | Owner-occupied | Renter-occupied |
| No Vehicle | 123,272 (44.7%) | 567,293 (77.6%) |
| 1 Vehicle | 104,679 (37.9%) | 139,787 (19.1%) |
| 2 Vehicles | 35,542 (12.9%) | 20,696 (2.8%) |
| 3 or more Vehicles | 12,565 (4.5%) | 3,267 (0.4%) |
| Total | 276,058 (100.0%) | 731,043 (100.0%) |
Real Estate & Mortgages in Area Code 212
Real Estate and Mortgage Overview in Area Code 212
| Characteristic | Without Mortgage | With Mortgage |
| Housing Units | 137,059 | 138,999 |
| Median Property Value | $53,101,805 | $58,919,404 |
| Median Household Income | $6,946,887 | $79,909 |
| Monthly Housing Costs | $62,281 | $80,922 |
| Real Estate Taxes | $414,623 | $24,100 |
Property Value by Mortgage Status in Area Code 212
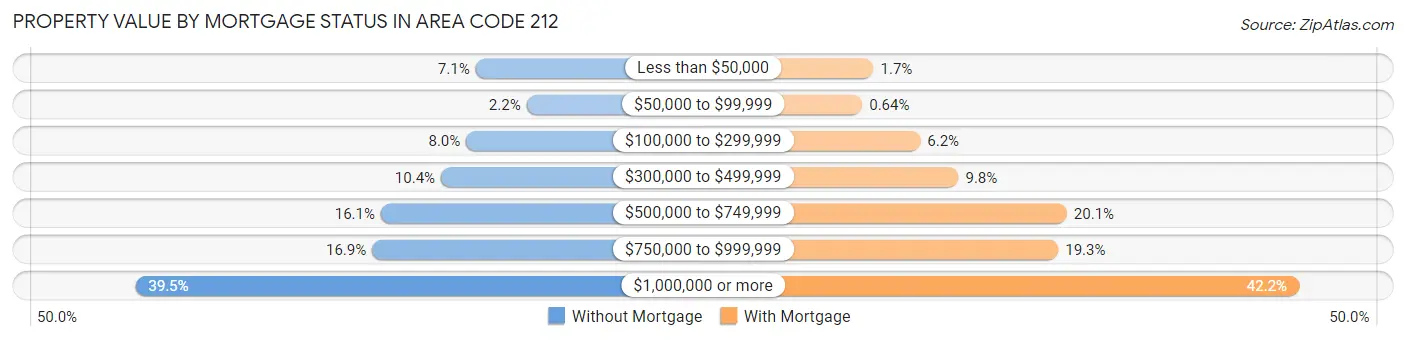
| Property Value | Without Mortgage | With Mortgage |
| Less than $50,000 | 9,682 (7.1%) | 2,386 (1.7%) |
| $50,000 to $99,999 | 3,014 (2.2%) | 889 (0.6%) |
| $100,000 to $299,999 | 10,897 (8.0%) | 8,571 (6.2%) |
| $300,000 to $499,999 | 14,185 (10.3%) | 13,642 (9.8%) |
| $500,000 to $749,999 | 22,038 (16.1%) | 27,987 (20.1%) |
| $750,000 to $999,999 | 23,179 (16.9%) | 26,835 (19.3%) |
| $1,000,000 or more | 54,064 (39.5%) | 58,689 (42.2%) |
| Total | 137,059 (100.0%) | 138,999 (100.0%) |
Household Income by Mortgage Status in Area Code 212
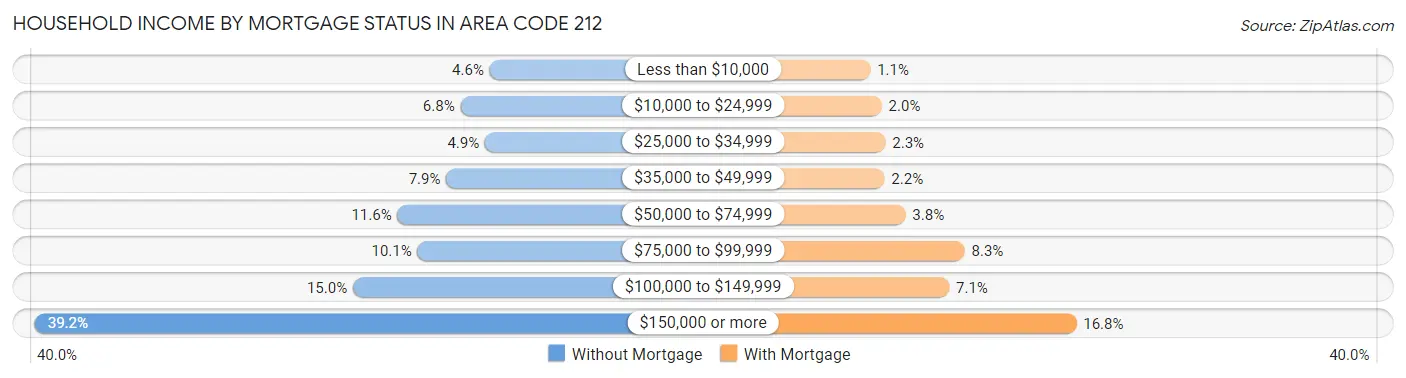
| Household Income | Without Mortgage | With Mortgage |
| Less than $10,000 | 6,251 (4.6%) | 1,562 (1.1%) |
| $10,000 to $24,999 | 9,311 (6.8%) | 2,761 (2.0%) |
| $25,000 to $34,999 | 6,740 (4.9%) | 3,151 (2.3%) |
| $35,000 to $49,999 | 10,781 (7.9%) | 3,056 (2.2%) |
| $50,000 to $74,999 | 15,888 (11.6%) | 5,281 (3.8%) |
| $75,000 to $99,999 | 13,791 (10.1%) | 11,549 (8.3%) |
| $100,000 to $149,999 | 20,536 (15.0%) | 9,916 (7.1%) |
| $150,000 or more | 53,761 (39.2%) | 23,376 (16.8%) |
| Total | 137,059 (100.0%) | 138,999 (100.0%) |
Property Value to Household Income Ratio in Area Code 212
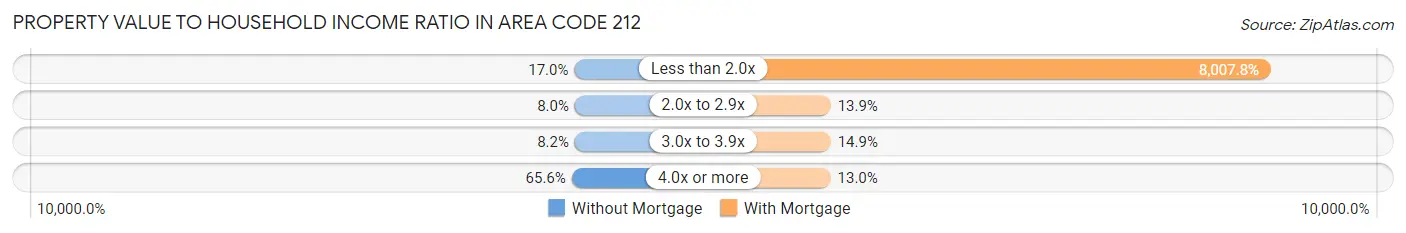
| Value-to-Income Ratio | Without Mortgage | With Mortgage |
| Less than 2.0x | 23,297 (17.0%) | 11,130,762 (8,007.8%) |
| 2.0x to 2.9x | 10,904 (8.0%) | 19,281 (13.9%) |
| 3.0x to 3.9x | 11,192 (8.2%) | 20,636 (14.8%) |
| 4.0x or more | 89,896 (65.6%) | 18,046 (13.0%) |
| Total | 137,059 (100.0%) | 138,999 (100.0%) |
Real Estate Taxes by Mortgage Status in Area Code 212
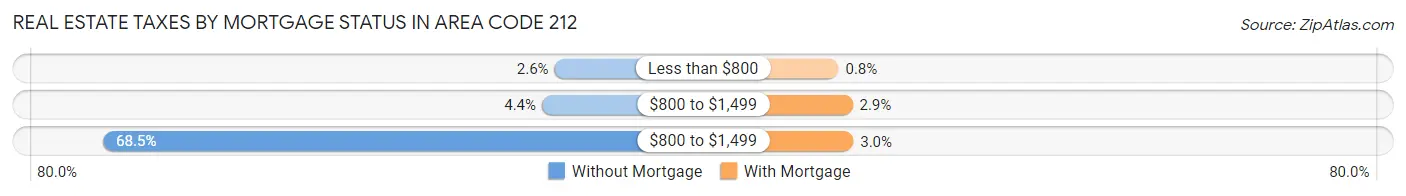
| Property Taxes | Without Mortgage | With Mortgage |
| Less than $800 | 3,532 (2.6%) | 1,110 (0.8%) |
| $800 to $1,499 | 6,055 (4.4%) | 3,966 (2.9%) |
| $800 to $1,499 | 93,924 (68.5%) | 4,112 (3.0%) |
| Total | 137,059 (100.0%) | 138,999 (100.0%) |
Health & Disability in Area Code 212
Health Insurance Coverage by Age in Area Code 212
| Age Bracket | With Coverage | Without Coverage |
| Under 6 Years | 142,282 (98.2%) | 2,630 (1.8%) |
| 6 to 18 Years | 288,069 (97.6%) | 7,212 (2.4%) |
| 19 to 25 Years | 210,973 (93.3%) | 15,048 (6.7%) |
| 26 to 34 Years | 362,082 (92.0%) | 31,330 (8.0%) |
| 35 to 44 Years | 303,238 (91.6%) | 27,702 (8.4%) |
| 45 to 54 Years | 264,874 (92.5%) | 21,325 (7.4%) |
| 55 to 64 Years | 264,115 (94.5%) | 15,347 (5.5%) |
| 65 to 74 Years | 214,909 (98.5%) | 3,223 (1.5%) |
| 75 Years and older | 168,117 (99.4%) | 1,045 (0.6%) |
| Total | 2,218,659 (94.7%) | 124,862 (5.3%) |
Health Insurance Coverage by Citizenship Status in Area Code 212
| Citizenship Status | With Coverage | Without Coverage |
| Native Born | 142,282 (98.2%) | 2,630 (1.8%) |
| Foreign Born, Citizen | 288,069 (97.6%) | 7,212 (2.4%) |
| Foreign Born, not a Citizen | 210,973 (93.3%) | 15,048 (6.7%) |
Health Insurance Coverage by Household Income in Area Code 212
| Household Income | With Coverage | Without Coverage |
| Under $25,000 | 333,387 (93.9%) | 21,499 (6.1%) |
| $25,000 to $49,999 | 281,861 (92.6%) | 22,540 (7.4%) |
| $50,000 to $74,999 | 253,854 (92.5%) | 20,666 (7.5%) |
| $75,000 to $99,999 | 199,093 (92.6%) | 15,916 (7.4%) |
| $100,000 and over | 1,079,416 (96.6%) | 38,264 (3.4%) |
Public vs Private Health Insurance Coverage by Age in Area Code 212
| Age Bracket | Public Insurance | Private Insurance |
| Under 6 | 63,865 (44.1%) | 86,393 (59.6%) |
| 6 to 18 Years | 142,110 (48.1%) | 167,605 (56.8%) |
| 19 to 25 Years | 59,058 (26.1%) | 158,417 (70.1%) |
| 25 to 34 Years | 80,324 (20.4%) | 292,284 (74.3%) |
| 35 to 44 Years | 78,543 (23.7%) | 234,680 (70.9%) |
| 45 to 54 Years | 76,797 (26.8%) | 198,755 (69.5%) |
| 55 to 64 Years | 95,179 (34.1%) | 184,005 (65.8%) |
| 65 to 74 Years | 196,673 (90.2%) | 102,640 (47.0%) |
| 75 Years and over | 166,014 (98.1%) | 75,503 (44.6%) |
| Total | 958,563 (40.9%) | 1,500,282 (64.0%) |
Disability Status by Sex by Age in Area Code 212
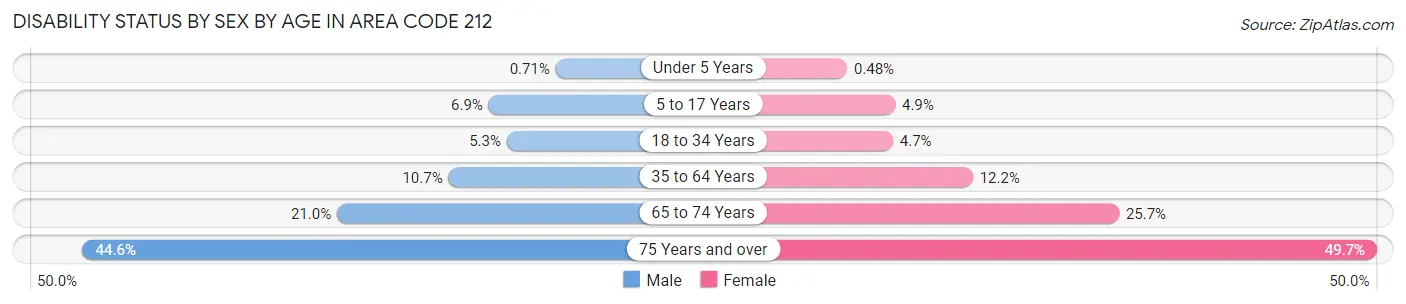
| Age Bracket | Male | Female |
| Under 5 Years | 446 (0.7%) | 290 (0.5%) |
| 5 to 17 Years | 10,179 (6.9%) | 7,041 (4.9%) |
| 18 to 34 Years | 16,272 (5.2%) | 15,957 (4.7%) |
| 35 to 64 Years | 47,078 (10.7%) | 55,270 (12.1%) |
| 65 to 74 Years | 19,767 (21.0%) | 31,895 (25.7%) |
| 75 Years and over | 28,450 (44.6%) | 52,340 (49.7%) |
Disability Class by Sex by Age in Area Code 212
Disability Class: Hearing Difficulty
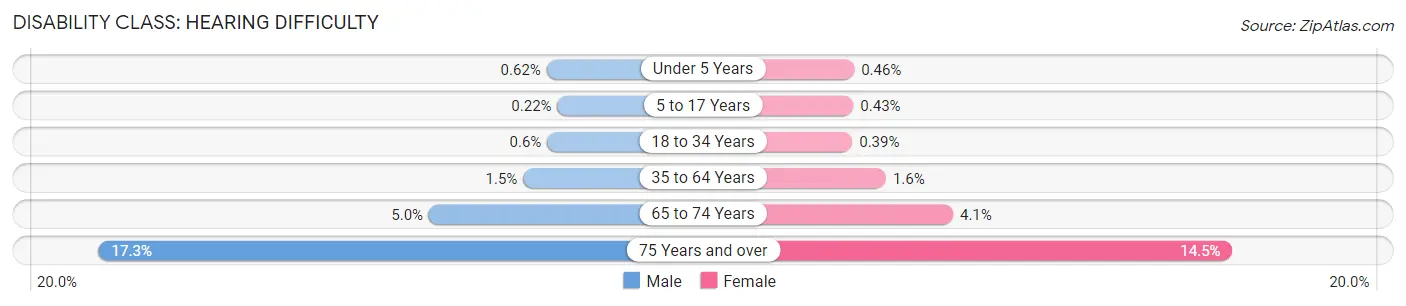
| Age Bracket | Male | Female |
| Under 5 Years | 389 (0.6%) | 278 (0.5%) |
| 5 to 17 Years | 318 (0.2%) | 618 (0.4%) |
| 18 to 34 Years | 1,861 (0.6%) | 1,295 (0.4%) |
| 35 to 64 Years | 6,578 (1.5%) | 7,457 (1.6%) |
| 65 to 74 Years | 4,698 (5.0%) | 5,121 (4.1%) |
| 75 Years and over | 10,998 (17.2%) | 15,285 (14.5%) |
Disability Class: Vision Difficulty
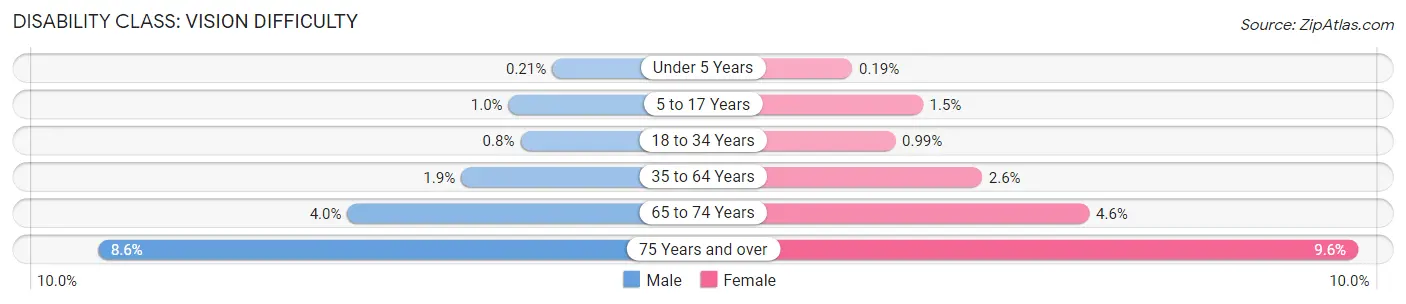
| Age Bracket | Male | Female |
| Under 5 Years | 129 (0.2%) | 117 (0.2%) |
| 5 to 17 Years | 1,495 (1.0%) | 2,144 (1.5%) |
| 18 to 34 Years | 2,492 (0.8%) | 3,336 (1.0%) |
| 35 to 64 Years | 8,387 (1.9%) | 11,813 (2.6%) |
| 65 to 74 Years | 3,770 (4.0%) | 5,690 (4.6%) |
| 75 Years and over | 5,511 (8.6%) | 10,094 (9.6%) |
Disability Class: Cognitive Difficulty
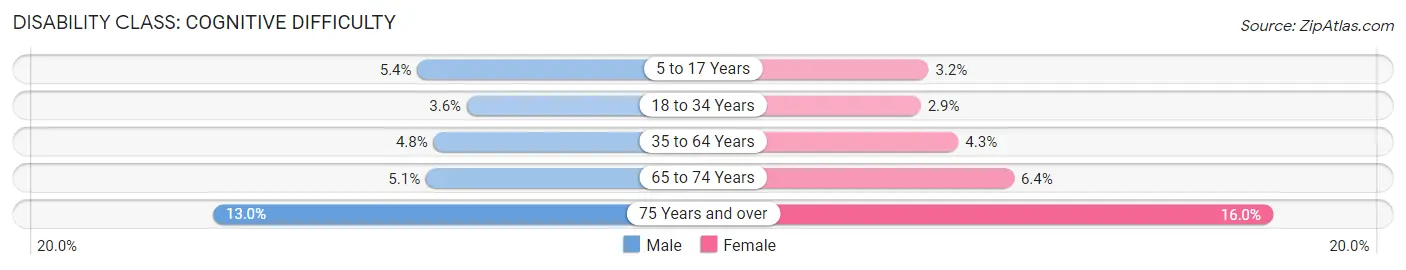
| Age Bracket | Male | Female |
| 5 to 17 Years | 7,971 (5.4%) | 4,595 (3.2%) |
| 18 to 34 Years | 11,081 (3.6%) | 9,842 (2.9%) |
| 35 to 64 Years | 21,273 (4.8%) | 19,687 (4.3%) |
| 65 to 74 Years | 4,797 (5.1%) | 7,928 (6.4%) |
| 75 Years and over | 8,295 (13.0%) | 16,858 (16.0%) |
Disability Class: Ambulatory Difficulty
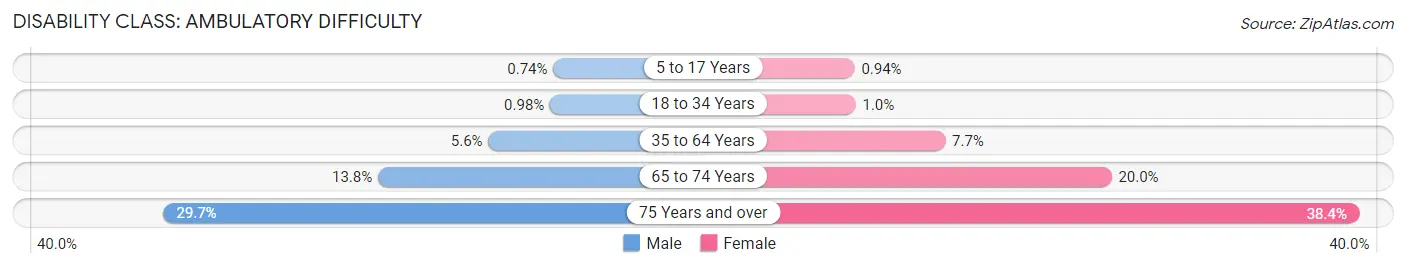
| Age Bracket | Male | Female |
| 5 to 17 Years | 1,094 (0.7%) | 1,337 (0.9%) |
| 18 to 34 Years | 3,031 (1.0%) | 3,416 (1.0%) |
| 35 to 64 Years | 24,566 (5.6%) | 34,911 (7.7%) |
| 65 to 74 Years | 12,951 (13.8%) | 24,826 (20.0%) |
| 75 Years and over | 18,934 (29.7%) | 40,450 (38.4%) |
Disability Class: Self-Care Difficulty
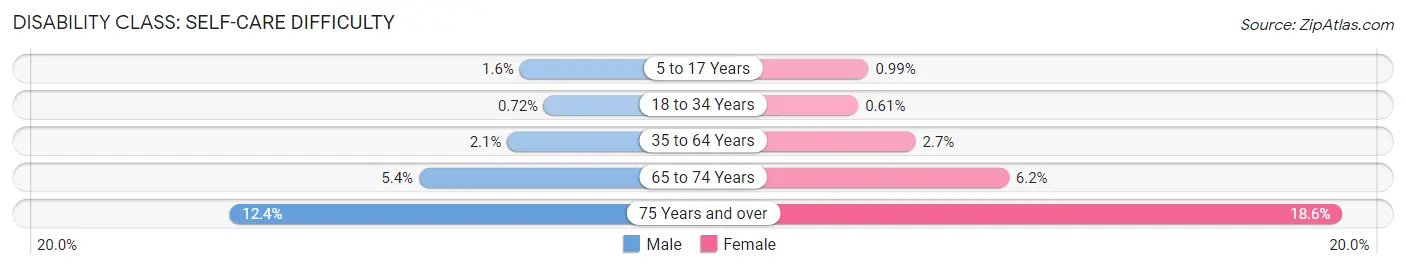
| Age Bracket | Male | Female |
| 5 to 17 Years | 2,387 (1.6%) | 1,415 (1.0%) |
| 18 to 34 Years | 2,233 (0.7%) | 2,054 (0.6%) |
| 35 to 64 Years | 9,184 (2.1%) | 12,457 (2.7%) |
| 65 to 74 Years | 5,044 (5.4%) | 7,693 (6.2%) |
| 75 Years and over | 7,910 (12.4%) | 19,578 (18.6%) |
Technology Access in Area Code 212
Computing Device Access in Area Code 212
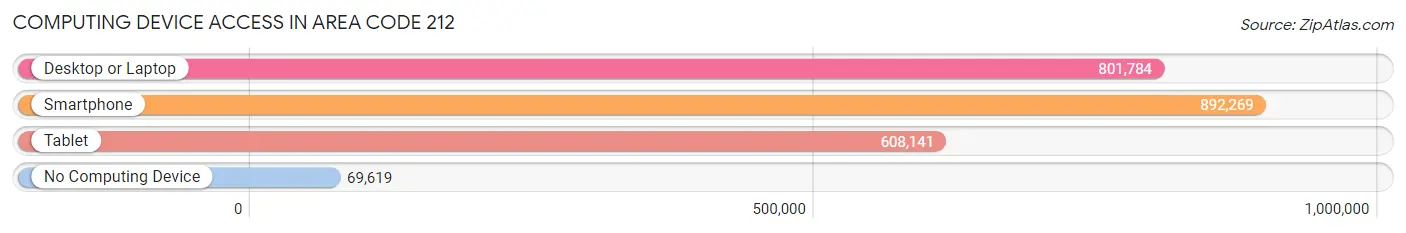
| Device Type | # Households | % Households |
| Desktop or Laptop | 801,784 | 79.6% |
| Smartphone | 892,269 | 88.6% |
| Tablet | 608,141 | 60.4% |
| No Computing Device | 69,619 | 6.9% |
| Total | 1,007,101 | 100.0% |
Internet Access in Area Code 212
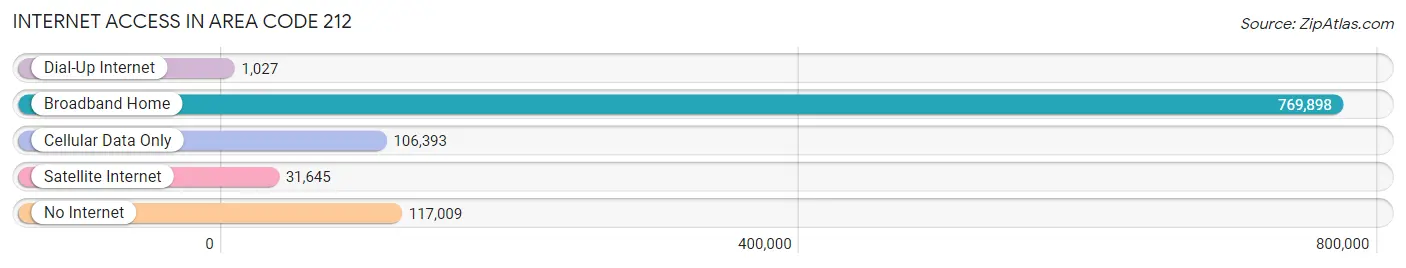
| Internet Type | # Households | % Households |
| Dial-Up Internet | 1,027 | 0.1% |
| Broadband Home | 769,898 | 76.4% |
| Cellular Data Only | 106,393 | 10.6% |
| Satellite Internet | 31,645 | 3.1% |
| No Internet | 117,009 | 11.6% |
| Total | 1,007,101 | 100.0% |
Area Code 212 Summary
Geography
Area code 212 is located in the borough of Manhattan in New York City. It is the original area code for the city, and is one of the few original area codes still in use in the United States.
Social
Area code 212 is associated with the hustle and bustle of New York City. It is a symbol of the city's energy and vibrancy, and is often associated with the city's iconic skyline.
Economics
Area code 212 is associated with the financial and business sectors of New York City. It is home to many of the city's major financial institutions, as well as many of the world's largest corporations.
Demographics
Area code 212 is home to a diverse population. It is home to many different ethnic and racial groups, as well as a wide range of socioeconomic backgrounds. The area code is also home to many of the city's most affluent neighborhoods.
Common Questions
What is Per Capita Income in Area Code 212?
Per Capita income in Area Code 212 is $90,748.
What is the Median Family Income in Area Code 212?
Median Family Income in Area Code 212 is $142,105.
What is the Median Household income in Area Code 212?
Median Household Income in Area Code 212 is $109,070.
What is Income or Wage Gap in Area Code 212?
Income or Wage Gap in Area Code 212 is 24.2%.
Women in Area Code 212 earn 75.8 cents for every dollar earned by a man.
What is Family Income Deficit in Area Code 212?
Family Income Deficit in Area Code 212 is $10,328.
Families that are below poverty line in Area Code 212 earn $10,328 less on average than the poverty threshold level.
What is Inequality or Gini Index in Area Code 212?
Inequality or Gini Index in Area Code 212 is 31.84.
What is the Total Population of Area Code 212?
Total Population of Area Code 212 is 2,356,980.
What is the Total Male Population of Area Code 212?
Total Male Population of Area Code 212 is 1,126,647.
What is the Total Female Population of Area Code 212?
Total Female Population of Area Code 212 is 1,230,333.
What is the Ratio of Males per 100 Females in Area Code 212?
There are 91.57 Males per 100 Females in Area Code 212.
What is the Ratio of Females per 100 Males in Area Code 212?
There are 109.20 Females per 100 Males in Area Code 212.
What is the Median Population Age in Area Code 212?
Median Population Age in Area Code 212 is 40.2 Years.
What is the Average Family Size in Area Code 212
Average Family Size in Area Code 212 is 3.1 People.
What is the Average Household Size in Area Code 212
Average Household Size in Area Code 212 is 2.3 People.
How Large is the Labor Force in Area Code 212?
There are 1,282,019 People in the Labor Forcein in Area Code 212.
What is the Percentage of People in the Labor Force in Area Code 212?
64.5% of People are in the Labor Force in Area Code 212.
What is the Unemployment Rate in Area Code 212?
Unemployment Rate in Area Code 212 is 7.8%.