Queens County, NY Map & Demographics
Queens County Map
Queens County Overview
$39,201
PER CAPITA INCOME
$92,848
AVG FAMILY INCOME
$82,431
AVG HOUSEHOLD INCOME
13.3%
WAGE / INCOME GAP [ % ]
86.7¢/ $1
WAGE / INCOME GAP [ $ ]
$9,943
FAMILY INCOME DEFICIT
0.46
INEQUALITY / GINI INDEX
2,360,826
TOTAL POPULATION
1,155,898
MALE POPULATION
1,204,928
FEMALE POPULATION
95.93
MALES / 100 FEMALES
104.24
FEMALES / 100 MALES
39.9
MEDIAN AGE
3.5
AVG FAMILY SIZE
2.9
AVG HOUSEHOLD SIZE
1,237,639
LABOR FORCE [ PEOPLE ]
63.7%
PERCENT IN LABOR FORCE
7.0%
UNEMPLOYMENT RATE
Income in Queens County
Income Overview in Queens County
Per Capita Income in Queens County is $39,201, while median incomes of families and households are $92,848 and $82,431 respectively.
| Characteristic | Number | Measure |
| Per Capita Income | 2,360,826 | $39,201 |
| Median Family Income | 548,963 | $92,848 |
| Mean Family Income | 548,963 | $120,569 |
| Median Household Income | 816,859 | $82,431 |
| Mean Household Income | 816,859 | $109,287 |
| Income Deficit | 548,963 | $9,943 |
| Wage / Income Gap (%) | 2,360,826 | 13.28% |
| Wage / Income Gap ($) | 2,360,826 | 86.72¢ per $1 |
| Gini / Inequality Index | 2,360,826 | 0.46 |
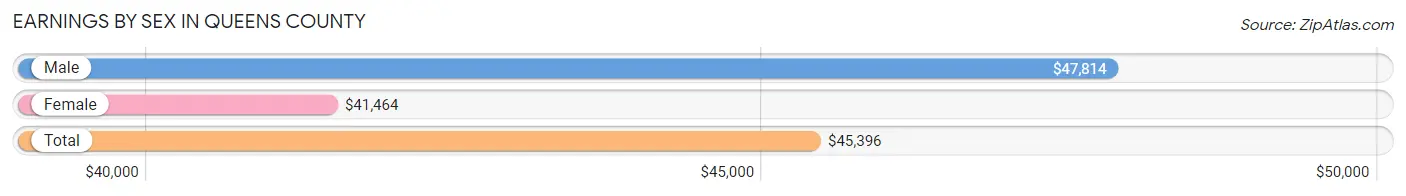
Earnings by Sex in Queens County
Average Earnings in Queens County are $45,396, $47,814 for men and $41,464 for women, a difference of 13.3%.
| Sex | Number | Average Earnings |
| Male | 661,890 (52.7%) | $47,814 |
| Female | 594,536 (47.3%) | $41,464 |
| Total | 1,256,426 (100.0%) | $45,396 |
Earnings by Sex by Income Bracket in Queens County
The most common earnings brackets in Queens County are $100,000+ for men (119,360 | 18.0%) and $100,000+ for women (83,937 | 14.1%).
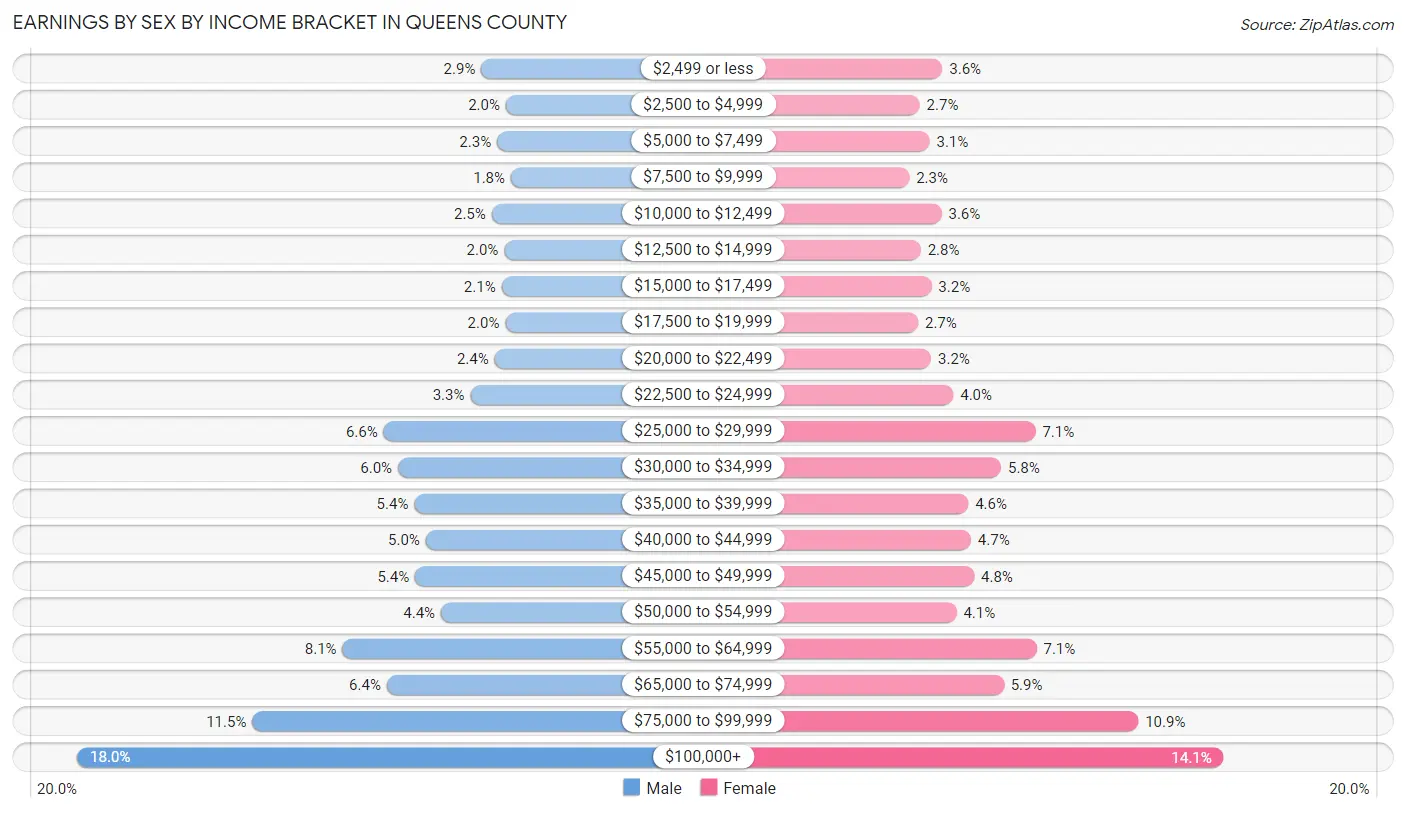
| Income | Male | Female |
| $2,499 or less | 19,099 (2.9%) | 21,291 (3.6%) |
| $2,500 to $4,999 | 13,062 (2.0%) | 16,225 (2.7%) |
| $5,000 to $7,499 | 15,193 (2.3%) | 18,408 (3.1%) |
| $7,500 to $9,999 | 11,813 (1.8%) | 13,914 (2.3%) |
| $10,000 to $12,499 | 16,541 (2.5%) | 21,127 (3.5%) |
| $12,500 to $14,999 | 13,466 (2.0%) | 16,446 (2.8%) |
| $15,000 to $17,499 | 14,107 (2.1%) | 18,819 (3.2%) |
| $17,500 to $19,999 | 13,198 (2.0%) | 15,859 (2.7%) |
| $20,000 to $22,499 | 15,797 (2.4%) | 18,784 (3.2%) |
| $22,500 to $24,999 | 21,858 (3.3%) | 23,718 (4.0%) |
| $25,000 to $29,999 | 43,332 (6.6%) | 42,030 (7.1%) |
| $30,000 to $34,999 | 39,801 (6.0%) | 34,352 (5.8%) |
| $35,000 to $39,999 | 35,765 (5.4%) | 27,075 (4.5%) |
| $40,000 to $44,999 | 32,916 (5.0%) | 27,635 (4.6%) |
| $45,000 to $49,999 | 35,535 (5.4%) | 28,356 (4.8%) |
| $50,000 to $54,999 | 29,103 (4.4%) | 24,407 (4.1%) |
| $55,000 to $64,999 | 53,516 (8.1%) | 42,265 (7.1%) |
| $65,000 to $74,999 | 42,528 (6.4%) | 34,965 (5.9%) |
| $75,000 to $99,999 | 75,900 (11.5%) | 64,923 (10.9%) |
| $100,000+ | 119,360 (18.0%) | 83,937 (14.1%) |
| Total | 661,890 (100.0%) | 594,536 (100.0%) |
Earnings by Sex by Educational Attainment in Queens County
Average earnings in Queens County are $51,949 for men and $45,567 for women, a difference of 12.3%. Men with an educational attainment of graduate degree enjoy the highest average annual earnings of $91,014, while those with less than high school education earn the least with $34,064. Women with an educational attainment of graduate degree earn the most with the average annual earnings of $81,628, while those with less than high school education have the smallest earnings of $23,388.
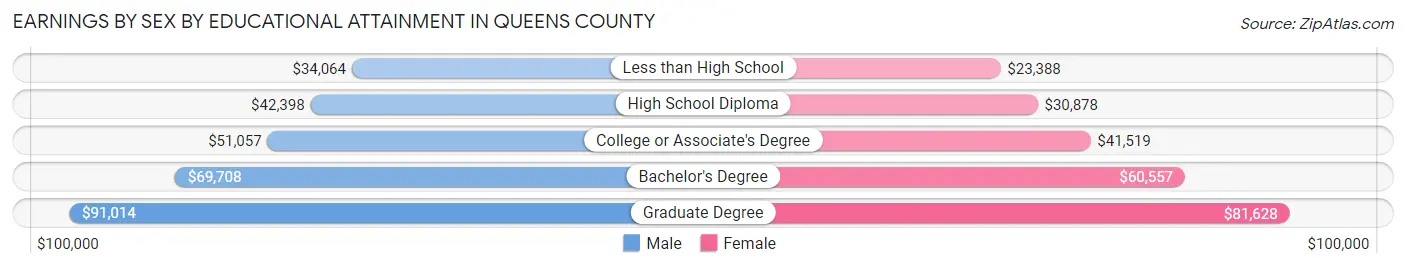
| Educational Attainment | Male Income | Female Income |
| Less than High School | $34,064 | $23,388 |
| High School Diploma | $42,398 | $30,878 |
| College or Associate's Degree | $51,057 | $41,519 |
| Bachelor's Degree | $69,708 | $60,557 |
| Graduate Degree | $91,014 | $81,628 |
| Total | $51,949 | $45,567 |
Family Income in Queens County
Family Income Brackets in Queens County
According to the Queens County family income data, there are 107,048 families falling into the $100,000 to $149,999 income range, which is the most common income bracket and makes up 19.5% of all families. Conversely, the $10,000 to $14,999 income bracket is the least frequent group with only 9,332 families (1.7%) belonging to this category.
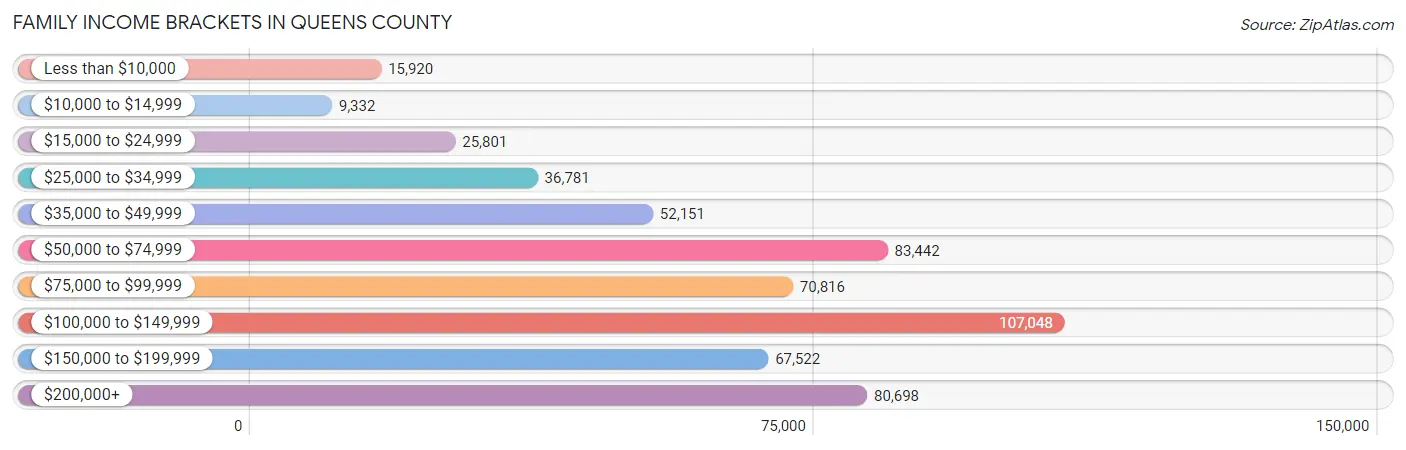
| Income Bracket | # Families | % Families |
| Less than $10,000 | 15,920 | 2.9% |
| $10,000 to $14,999 | 9,332 | 1.7% |
| $15,000 to $24,999 | 25,801 | 4.7% |
| $25,000 to $34,999 | 36,781 | 6.7% |
| $35,000 to $49,999 | 52,151 | 9.5% |
| $50,000 to $74,999 | 83,442 | 15.2% |
| $75,000 to $99,999 | 70,816 | 12.9% |
| $100,000 to $149,999 | 107,048 | 19.5% |
| $150,000 to $199,999 | 67,522 | 12.3% |
| $200,000+ | 80,698 | 14.7% |
Family Income by Famaliy Size in Queens County
7+ person families (15,021 | 2.7%) account for the highest median family income in Queens County with $153,675 per family, while 2-person families (205,790 | 37.5%) have the highest median income of $37,454 per family member.
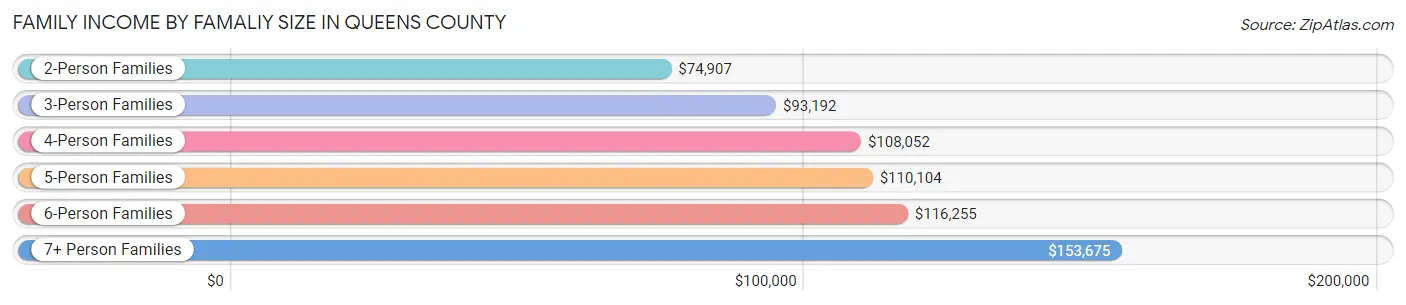
| Income Bracket | # Families | Median Income |
| 2-Person Families | 205,790 (37.5%) | $74,907 |
| 3-Person Families | 141,752 (25.8%) | $93,192 |
| 4-Person Families | 111,812 (20.4%) | $108,052 |
| 5-Person Families | 52,590 (9.6%) | $110,104 |
| 6-Person Families | 21,998 (4.0%) | $116,255 |
| 7+ Person Families | 15,021 (2.7%) | $153,675 |
| Total | 548,963 (100.0%) | $92,848 |
Family Income by Number of Earners in Queens County
The median family income in Queens County is $92,848, with families comprising 3+ earners (97,549) having the highest median family income of $149,709, while families with no earners (64,149) have the lowest median family income of $35,079, accounting for 17.8% and 11.7% of families, respectively.
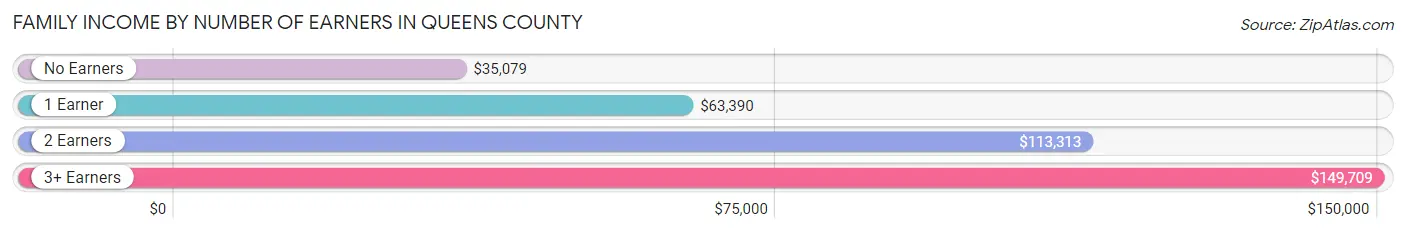
| Number of Earners | # Families | Median Income |
| No Earners | 64,149 (11.7%) | $35,079 |
| 1 Earner | 167,963 (30.6%) | $63,390 |
| 2 Earners | 219,302 (40.0%) | $113,313 |
| 3+ Earners | 97,549 (17.8%) | $149,709 |
| Total | 548,963 (100.0%) | $92,848 |
Household Income in Queens County
Household Income Brackets in Queens County
With 150,302 households falling in the category, the $100,000 to $149,999 income range is the most frequent in Queens County, accounting for 18.4% of all households. In contrast, only 28,590 households (3.5%) fall into the $10,000 to $14,999 income bracket, making it the least populous group.
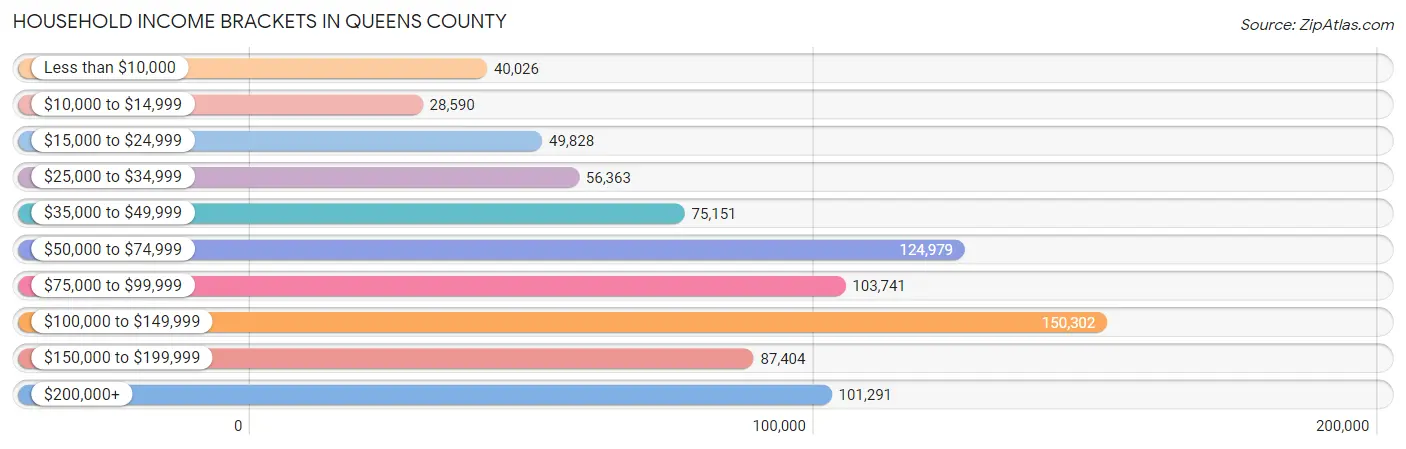
| Income Bracket | # Households | % Households |
| Less than $10,000 | 40,026 | 4.9% |
| $10,000 to $14,999 | 28,590 | 3.5% |
| $15,000 to $24,999 | 49,828 | 6.1% |
| $25,000 to $34,999 | 56,363 | 6.9% |
| $35,000 to $49,999 | 75,151 | 9.2% |
| $50,000 to $74,999 | 124,979 | 15.3% |
| $75,000 to $99,999 | 103,741 | 12.7% |
| $100,000 to $149,999 | 150,302 | 18.4% |
| $150,000 to $199,999 | 87,404 | 10.7% |
| $200,000+ | 101,291 | 12.4% |
Household Income by Householder Age in Queens County
The median household income in Queens County is $82,431, with the highest median household income of $95,939 found in the 25 to 44 years age bracket for the primary householder. A total of 262,264 households (32.1%) fall into this category. Meanwhile, the 65+ years age bracket for the primary householder has the lowest median household income of $55,710, with 213,754 households (26.2%) in this group.
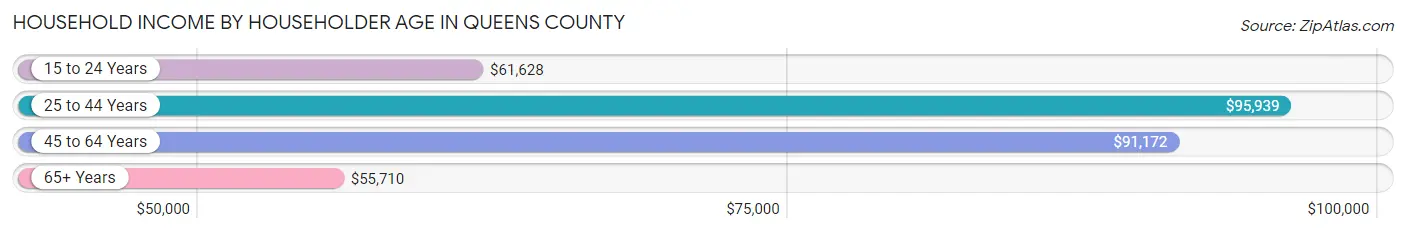
| Income Bracket | # Households | Median Income |
| 15 to 24 Years | 14,317 (1.8%) | $61,628 |
| 25 to 44 Years | 262,264 (32.1%) | $95,939 |
| 45 to 64 Years | 326,524 (40.0%) | $91,172 |
| 65+ Years | 213,754 (26.2%) | $55,710 |
| Total | 816,859 (100.0%) | $82,431 |
Poverty in Queens County
Income Below Poverty by Sex and Age in Queens County
With 10.6% poverty level for males and 12.8% for females among the residents of Queens County, 15 year old males and 75 year old and over females are the most vulnerable to poverty, with 2,013 males (15.6%) and 17,277 females (17.9%) in their respective age groups living below the poverty level.
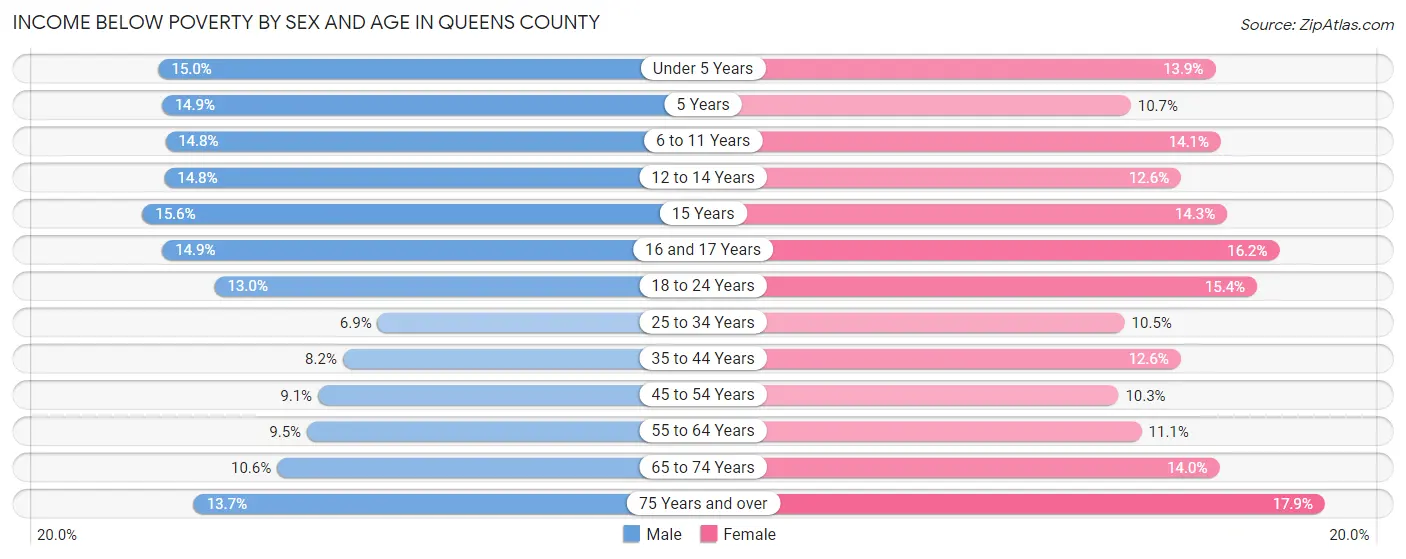
| Age Bracket | Male | Female |
| Under 5 Years | 10,273 (15.0%) | 8,913 (13.9%) |
| 5 Years | 1,785 (14.9%) | 1,411 (10.7%) |
| 6 to 11 Years | 11,198 (14.8%) | 9,857 (14.1%) |
| 12 to 14 Years | 6,198 (14.8%) | 4,914 (12.6%) |
| 15 Years | 2,013 (15.6%) | 1,518 (14.3%) |
| 16 and 17 Years | 3,856 (14.9%) | 4,192 (16.2%) |
| 18 to 24 Years | 11,485 (13.0%) | 13,606 (15.4%) |
| 25 to 34 Years | 12,634 (6.9%) | 19,032 (10.5%) |
| 35 to 44 Years | 13,356 (8.2%) | 20,197 (12.6%) |
| 45 to 54 Years | 14,182 (9.1%) | 16,225 (10.3%) |
| 55 to 64 Years | 14,539 (9.5%) | 18,125 (11.1%) |
| 65 to 74 Years | 10,760 (10.6%) | 16,961 (14.0%) |
| 75 Years and over | 8,419 (13.7%) | 17,277 (17.9%) |
| Total | 120,698 (10.6%) | 152,228 (12.8%) |
Income Above Poverty by Sex and Age in Queens County
According to the poverty statistics in Queens County, males aged 25 to 34 years and females aged 45 to 54 years are the age groups that are most secure financially, with 93.1% of males and 89.7% of females in these age groups living above the poverty line.
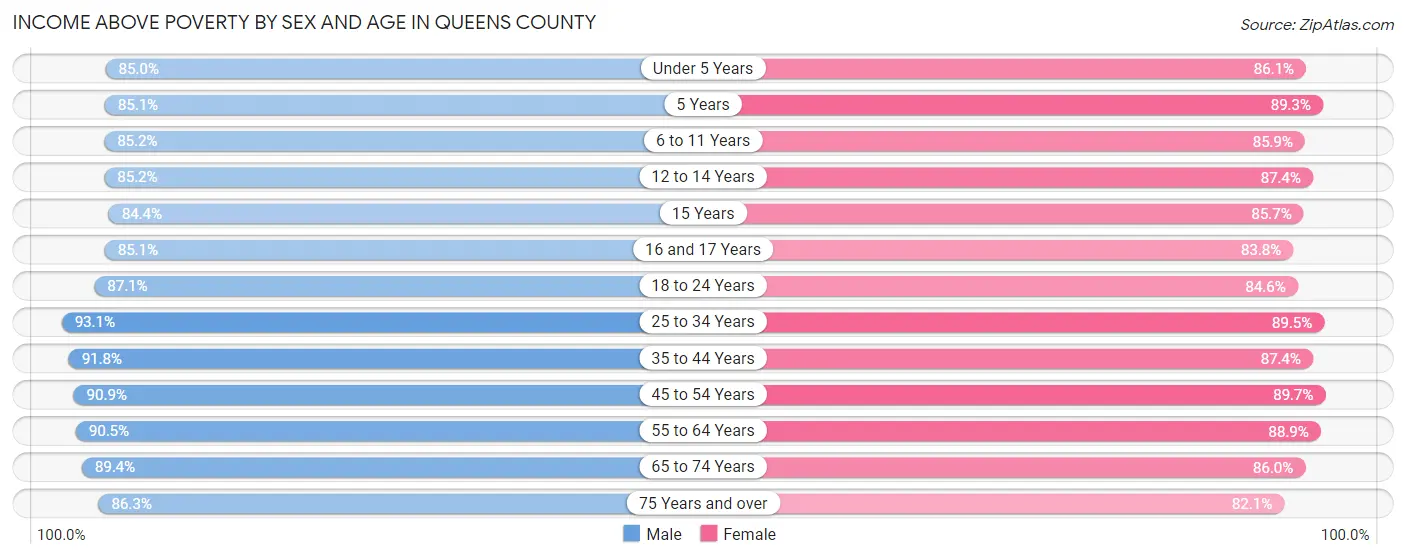
| Age Bracket | Male | Female |
| Under 5 Years | 58,058 (85.0%) | 55,411 (86.1%) |
| 5 Years | 10,185 (85.1%) | 11,740 (89.3%) |
| 6 to 11 Years | 64,579 (85.2%) | 60,219 (85.9%) |
| 12 to 14 Years | 35,644 (85.2%) | 34,114 (87.4%) |
| 15 Years | 10,862 (84.4%) | 9,098 (85.7%) |
| 16 and 17 Years | 22,042 (85.1%) | 21,627 (83.8%) |
| 18 to 24 Years | 77,218 (87.1%) | 74,692 (84.6%) |
| 25 to 34 Years | 170,524 (93.1%) | 162,292 (89.5%) |
| 35 to 44 Years | 149,681 (91.8%) | 140,291 (87.4%) |
| 45 to 54 Years | 141,562 (90.9%) | 141,747 (89.7%) |
| 55 to 64 Years | 138,250 (90.5%) | 144,694 (88.9%) |
| 65 to 74 Years | 90,449 (89.4%) | 104,092 (86.0%) |
| 75 Years and over | 52,945 (86.3%) | 79,080 (82.1%) |
| Total | 1,021,999 (89.4%) | 1,039,097 (87.2%) |
Income Below Poverty Among Married-Couple Families in Queens County
The poverty statistics for married-couple families in Queens County show that 6.6% or 24,448 of the total 370,408 families live below the poverty line. Families with 5 or more children have the highest poverty rate of 13.8%, comprising of 254 families. On the other hand, families with no children have the lowest poverty rate of 5.5%, which includes 11,762 families.
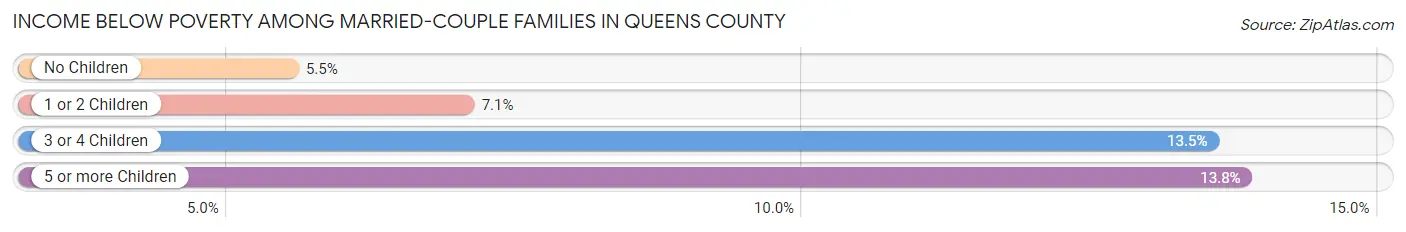
| Children | Above Poverty | Below Poverty |
| No Children | 200,870 (94.5%) | 11,762 (5.5%) |
| 1 or 2 Children | 124,605 (92.9%) | 9,472 (7.1%) |
| 3 or 4 Children | 18,903 (86.5%) | 2,960 (13.5%) |
| 5 or more Children | 1,582 (86.2%) | 254 (13.8%) |
| Total | 345,960 (93.4%) | 24,448 (6.6%) |
Income Below Poverty Among Single-Parent Households in Queens County
According to the poverty data in Queens County, 8.5% or 4,525 single-father households and 15.7% or 19,742 single-mother households are living below the poverty line. Among single-father households, those with 5 or more children have the highest poverty rate, with 39 households (32.2%) experiencing poverty. Likewise, among single-mother households, those with 3 or 4 children have the highest poverty rate, with 2,506 households (40.5%) falling below the poverty line.
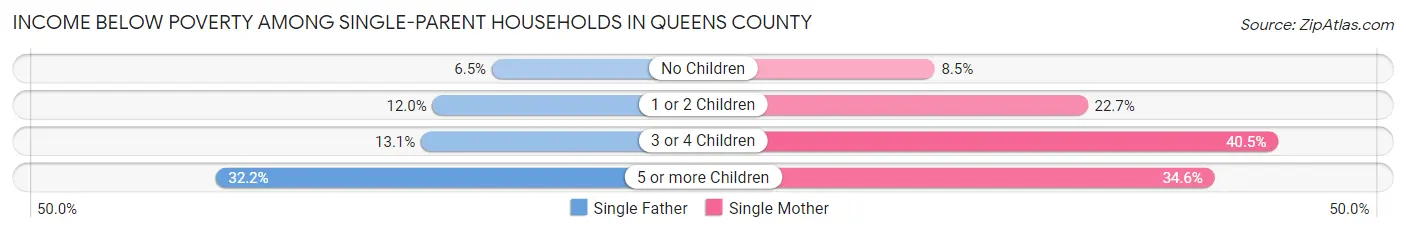
| Children | Single Father | Single Mother |
| No Children | 2,227 (6.5%) | 5,876 (8.5%) |
| 1 or 2 Children | 1,980 (12.0%) | 11,218 (22.7%) |
| 3 or 4 Children | 279 (13.1%) | 2,506 (40.5%) |
| 5 or more Children | 39 (32.2%) | 142 (34.5%) |
| Total | 4,525 (8.5%) | 19,742 (15.7%) |
Income Below Poverty Among Married-Couple vs Single-Parent Households in Queens County
The poverty data for Queens County shows that 24,448 of the married-couple family households (6.6%) and 24,267 of the single-parent households (13.6%) are living below the poverty level. Within the married-couple family households, those with 5 or more children have the highest poverty rate, with 254 households (13.8%) falling below the poverty line. Among the single-parent households, those with 5 or more children have the highest poverty rate, with 181 household (34.0%) living below poverty.
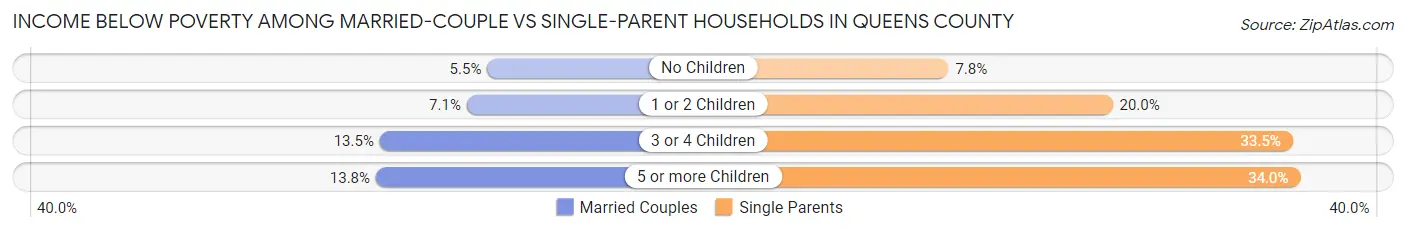
| Children | Married-Couple Families | Single-Parent Households |
| No Children | 11,762 (5.5%) | 8,103 (7.8%) |
| 1 or 2 Children | 9,472 (7.1%) | 13,198 (20.0%) |
| 3 or 4 Children | 2,960 (13.5%) | 2,785 (33.5%) |
| 5 or more Children | 254 (13.8%) | 181 (34.0%) |
| Total | 24,448 (6.6%) | 24,267 (13.6%) |
Race in Queens County
The most populous races in Queens County are White / Caucasian (720,630 | 30.5%), Hispanic or Latino (661,807 | 28.0%), and Asian (614,652 | 26.0%).
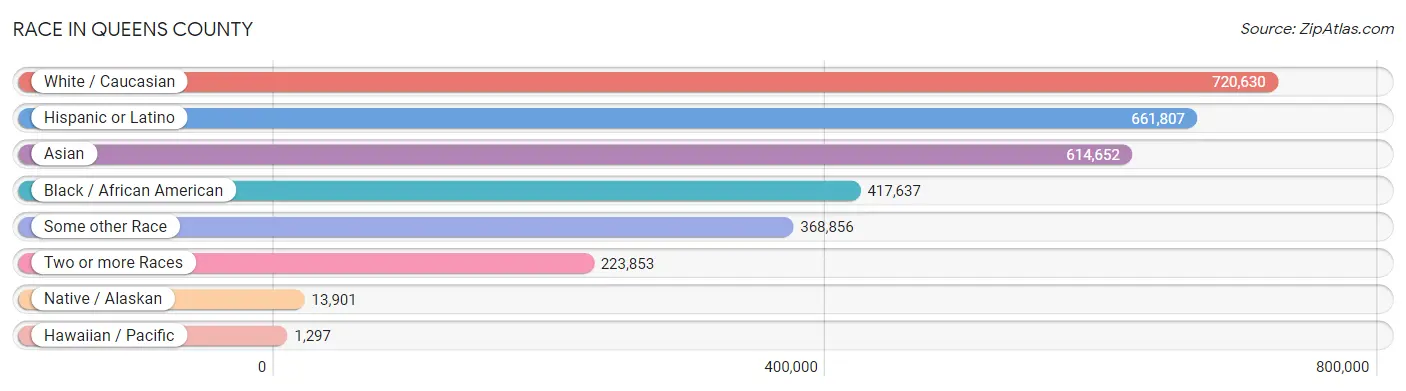
| Race | # Population | % Population |
| Asian | 614,652 | 26.0% |
| Black / African American | 417,637 | 17.7% |
| Hawaiian / Pacific | 1,297 | 0.1% |
| Hispanic or Latino | 661,807 | 28.0% |
| Native / Alaskan | 13,901 | 0.6% |
| White / Caucasian | 720,630 | 30.5% |
| Two or more Races | 223,853 | 9.5% |
| Some other Race | 368,856 | 15.6% |
| Total | 2,360,826 | 100.0% |
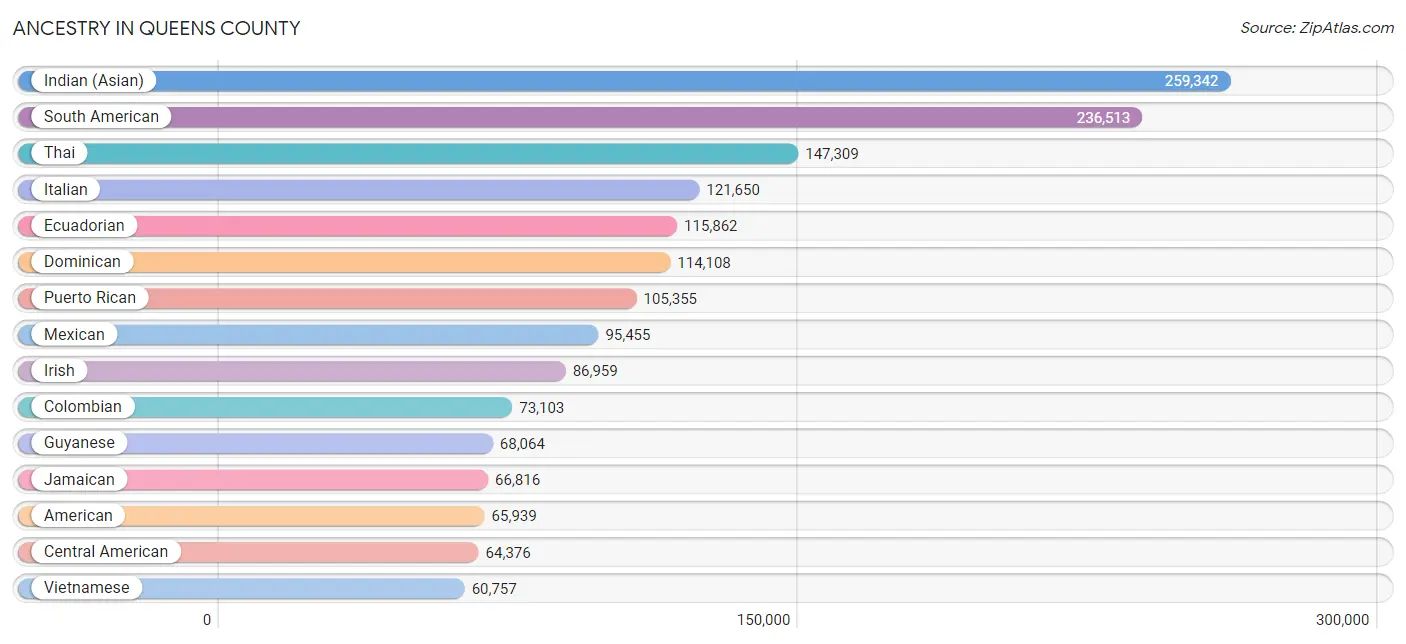
Ancestry in Queens County
The most populous ancestries reported in Queens County are Indian (Asian) (259,342 | 11.0%), South American (236,513 | 10.0%), Thai (147,309 | 6.2%), Italian (121,650 | 5.1%), and Ecuadorian (115,862 | 4.9%), together accounting for 37.3% of all Queens County residents.
| Ancestry | # Population | % Population |
| Afghan | 2,575 | 0.1% |
| African | 9,743 | 0.4% |
| Alaska Native | 197 | 0.0% |
| Albanian | 8,939 | 0.4% |
| Aleut | 32 | 0.0% |
| Alsatian | 6 | 0.0% |
| American | 65,939 | 2.8% |
| Apache | 65 | 0.0% |
| Arab | 24,899 | 1.1% |
| Argentinean | 6,257 | 0.3% |
| Armenian | 3,445 | 0.2% |
| Assyrian / Chaldean / Syriac | 27 | 0.0% |
| Australian | 562 | 0.0% |
| Austrian | 4,936 | 0.2% |
| Bahamian | 282 | 0.0% |
| Bangladeshi | 189 | 0.0% |
| Barbadian | 3,657 | 0.2% |
| Basque | 217 | 0.0% |
| Belgian | 585 | 0.0% |
| Belizean | 1,345 | 0.1% |
| Bermudan | 105 | 0.0% |
| Bhutanese | 10,155 | 0.4% |
| Blackfeet | 942 | 0.0% |
| Bolivian | 2,478 | 0.1% |
| Brazilian | 5,237 | 0.2% |
| British | 2,784 | 0.1% |
| British West Indian | 5,954 | 0.3% |
| Bulgarian | 1,665 | 0.1% |
| Burmese | 50,864 | 2.1% |
| Cajun | 45 | 0.0% |
| Cambodian | 150 | 0.0% |
| Canadian | 1,551 | 0.1% |
| Cape Verdean | 30 | 0.0% |
| Carpatho Rusyn | 28 | 0.0% |
| Celtic | 62 | 0.0% |
| Central American | 64,376 | 2.7% |
| Central American Indian | 7,208 | 0.3% |
| Cherokee | 2,356 | 0.1% |
| Chickasaw | 206 | 0.0% |
| Chilean | 3,430 | 0.2% |
| Chinese | 6 | 0.0% |
| Chippewa | 305 | 0.0% |
| Choctaw | 236 | 0.0% |
| Colombian | 73,103 | 3.1% |
| Comanche | 8 | 0.0% |
| Costa Rican | 1,791 | 0.1% |
| Creek | 103 | 0.0% |
| Croatian | 4,407 | 0.2% |
| Cuban | 8,588 | 0.4% |
| Cypriot | 1,014 | 0.0% |
| Czech | 2,808 | 0.1% |
| Czechoslovakian | 448 | 0.0% |
| Danish | 885 | 0.0% |
| Delaware | 70 | 0.0% |
| Dominican | 114,108 | 4.8% |
| Dutch | 3,483 | 0.2% |
| Dutch West Indian | 316 | 0.0% |
| Eastern European | 7,437 | 0.3% |
| Ecuadorian | 115,862 | 4.9% |
| Egyptian | 8,698 | 0.4% |
| English | 21,582 | 0.9% |
| Estonian | 194 | 0.0% |
| Ethiopian | 326 | 0.0% |
| European | 11,327 | 0.5% |
| Fijian | 8 | 0.0% |
| Filipino | 7,022 | 0.3% |
| Finnish | 555 | 0.0% |
| French | 10,088 | 0.4% |
| French American Indian | 58 | 0.0% |
| French Canadian | 1,542 | 0.1% |
| German | 54,269 | 2.3% |
| German Russian | 154 | 0.0% |
| Ghanaian | 4,213 | 0.2% |
| Greek | 30,882 | 1.3% |
| Guamanian / Chamorro | 324 | 0.0% |
| Guatemalan | 17,851 | 0.8% |
| Guyanese | 68,064 | 2.9% |
| Haitian | 34,260 | 1.5% |
| Hmong | 16 | 0.0% |
| Honduran | 12,118 | 0.5% |
| Hungarian | 6,893 | 0.3% |
| Icelander | 26 | 0.0% |
| Indian (Asian) | 259,342 | 11.0% |
| Indonesian | 4,491 | 0.2% |
| Inupiat | 58 | 0.0% |
| Iranian | 3,113 | 0.1% |
| Iraqi | 265 | 0.0% |
| Irish | 86,959 | 3.7% |
| Iroquois | 1,612 | 0.1% |
| Israeli | 3,446 | 0.2% |
| Italian | 121,650 | 5.1% |
| Jamaican | 66,816 | 2.8% |
| Japanese | 713 | 0.0% |
| Jordanian | 384 | 0.0% |
| Kenyan | 350 | 0.0% |
| Korean | 49,590 | 2.1% |
| Laotian | 4,755 | 0.2% |
| Latvian | 657 | 0.0% |
| Lebanese | 2,371 | 0.1% |
| Liberian | 553 | 0.0% |
| Lithuanian | 3,317 | 0.1% |
| Luxembourger | 16 | 0.0% |
| Macedonian | 2,457 | 0.1% |
| Malaysian | 298 | 0.0% |
| Maltese | 1,071 | 0.1% |
| Menominee | 10 | 0.0% |
| Mexican | 95,455 | 4.0% |
| Mexican American Indian | 2,932 | 0.1% |
| Mongolian | 1,824 | 0.1% |
| Moroccan | 3,588 | 0.2% |
| Native Hawaiian | 865 | 0.0% |
| Navajo | 110 | 0.0% |
| New Zealander | 100 | 0.0% |
| Nicaraguan | 3,352 | 0.1% |
| Nigerian | 8,498 | 0.4% |
| Northern European | 408 | 0.0% |
| Norwegian | 2,620 | 0.1% |
| Okinawan | 266 | 0.0% |
| Osage | 40 | 0.0% |
| Pakistani | 5,238 | 0.2% |
| Palestinian | 386 | 0.0% |
| Panamanian | 4,477 | 0.2% |
| Paraguayan | 3,522 | 0.2% |
| Pennsylvania German | 101 | 0.0% |
| Peruvian | 22,741 | 1.0% |
| Pima | 29 | 0.0% |
| Polish | 51,435 | 2.2% |
| Portuguese | 4,028 | 0.2% |
| Potawatomi | 24 | 0.0% |
| Pueblo | 29 | 0.0% |
| Puerto Rican | 105,355 | 4.5% |
| Puget Sound Salish | 12 | 0.0% |
| Romanian | 9,802 | 0.4% |
| Russian | 33,101 | 1.4% |
| Salvadoran | 24,644 | 1.0% |
| Samoan | 571 | 0.0% |
| Scandinavian | 716 | 0.0% |
| Scotch-Irish | 2,235 | 0.1% |
| Scottish | 6,099 | 0.3% |
| Seminole | 65 | 0.0% |
| Senegalese | 195 | 0.0% |
| Serbian | 2,510 | 0.1% |
| Sierra Leonean | 11 | 0.0% |
| Sioux | 90 | 0.0% |
| Slavic | 952 | 0.0% |
| Slovak | 1,833 | 0.1% |
| Slovene | 587 | 0.0% |
| Somali | 121 | 0.0% |
| South African | 325 | 0.0% |
| South American | 236,513 | 10.0% |
| South American Indian | 2,789 | 0.1% |
| Soviet Union | 84 | 0.0% |
| Spaniard | 8,431 | 0.4% |
| Spanish | 3,047 | 0.1% |
| Spanish American | 250 | 0.0% |
| Spanish American Indian | 366 | 0.0% |
| Sri Lankan | 6,794 | 0.3% |
| Subsaharan African | 28,622 | 1.2% |
| Sudanese | 251 | 0.0% |
| Swedish | 3,586 | 0.2% |
| Swiss | 1,052 | 0.0% |
| Syrian | 1,107 | 0.1% |
| Taiwanese | 111 | 0.0% |
| Thai | 147,309 | 6.2% |
| Tohono O'Odham | 59 | 0.0% |
| Tongan | 271 | 0.0% |
| Trinidadian and Tobagonian | 21,770 | 0.9% |
| Turkish | 3,608 | 0.2% |
| U.S. Virgin Islander | 426 | 0.0% |
| Ugandan | 50 | 0.0% |
| Ukrainian | 7,933 | 0.3% |
| Uruguayan | 1,273 | 0.1% |
| Venezuelan | 6,640 | 0.3% |
| Vietnamese | 60,757 | 2.6% |
| Welsh | 1,509 | 0.1% |
| West Indian | 18,794 | 0.8% |
| Yugoslavian | 1,920 | 0.1% |
| Yuman | 27 | 0.0% |
| Yup'ik | 49 | 0.0% |
| Zimbabwean | 68 | 0.0% | View All 180 Rows |
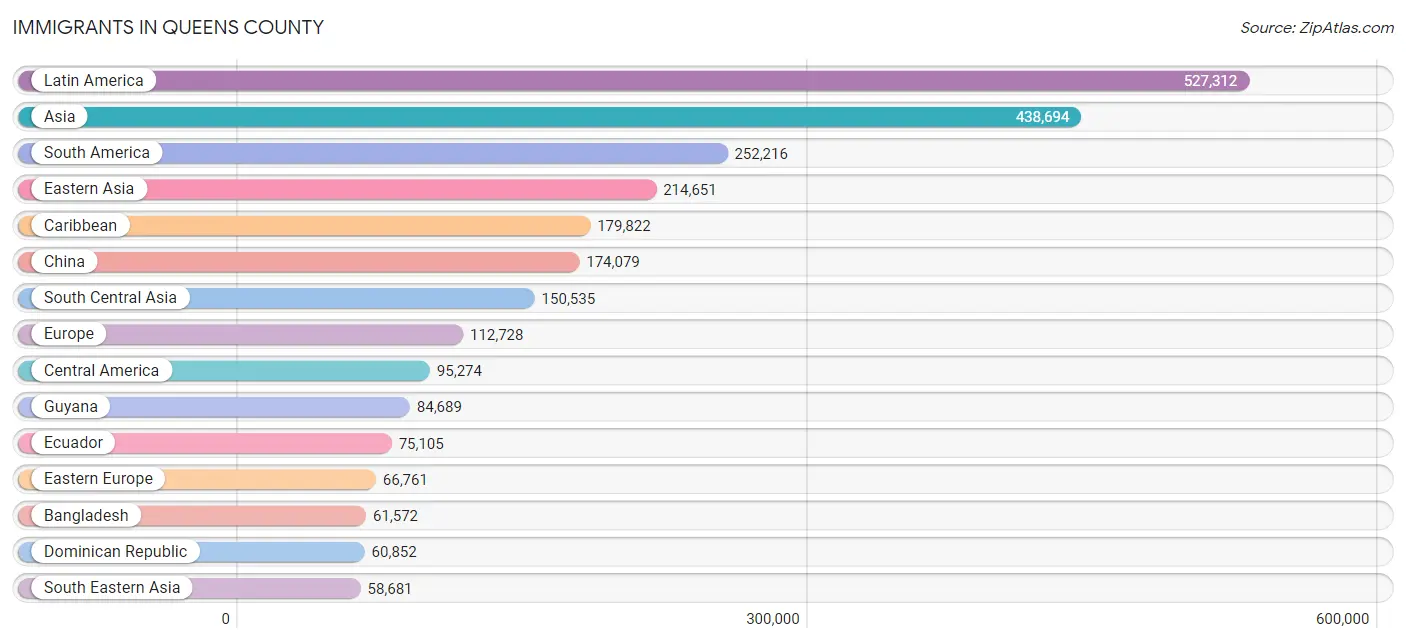
Immigrants in Queens County
The most numerous immigrant groups reported in Queens County came from Latin America (527,312 | 22.3%), Asia (438,694 | 18.6%), South America (252,216 | 10.7%), Eastern Asia (214,651 | 9.1%), and Caribbean (179,822 | 7.6%), together accounting for 68.3% of all Queens County residents.
| Immigration Origin | # Population | % Population |
| Afghanistan | 2,623 | 0.1% |
| Africa | 29,734 | 1.3% |
| Albania | 6,141 | 0.3% |
| Argentina | 4,333 | 0.2% |
| Armenia | 615 | 0.0% |
| Asia | 438,694 | 18.6% |
| Australia | 695 | 0.0% |
| Austria | 822 | 0.0% |
| Bahamas | 195 | 0.0% |
| Bangladesh | 61,572 | 2.6% |
| Barbados | 3,840 | 0.2% |
| Belarus | 865 | 0.0% |
| Belgium | 261 | 0.0% |
| Belize | 1,515 | 0.1% |
| Bolivia | 1,955 | 0.1% |
| Bosnia and Herzegovina | 1,005 | 0.0% |
| Brazil | 6,119 | 0.3% |
| Bulgaria | 1,485 | 0.1% |
| Cambodia | 597 | 0.0% |
| Cameroon | 165 | 0.0% |
| Canada | 3,299 | 0.1% |
| Caribbean | 179,822 | 7.6% |
| Central America | 95,274 | 4.0% |
| Chile | 2,650 | 0.1% |
| China | 174,079 | 7.4% |
| Colombia | 50,345 | 2.1% |
| Congo | 30 | 0.0% |
| Costa Rica | 1,081 | 0.1% |
| Croatia | 2,368 | 0.1% |
| Cuba | 3,571 | 0.2% |
| Czechoslovakia | 1,643 | 0.1% |
| Denmark | 221 | 0.0% |
| Dominica | 2,092 | 0.1% |
| Dominican Republic | 60,852 | 2.6% |
| Eastern Africa | 1,954 | 0.1% |
| Eastern Asia | 214,651 | 9.1% |
| Eastern Europe | 66,761 | 2.8% |
| Ecuador | 75,105 | 3.2% |
| Egypt | 7,602 | 0.3% |
| El Salvador | 15,604 | 0.7% |
| England | 1,717 | 0.1% |
| Ethiopia | 342 | 0.0% |
| Europe | 112,728 | 4.8% |
| Fiji | 11 | 0.0% |
| France | 1,849 | 0.1% |
| Germany | 3,420 | 0.1% |
| Ghana | 3,138 | 0.1% |
| Greece | 11,474 | 0.5% |
| Grenada | 1,815 | 0.1% |
| Guatemala | 11,480 | 0.5% |
| Guyana | 84,689 | 3.6% |
| Haiti | 23,904 | 1.0% |
| Honduras | 8,225 | 0.4% |
| Hong Kong | 14,982 | 0.6% |
| Hungary | 1,295 | 0.1% |
| India | 46,688 | 2.0% |
| Indonesia | 3,670 | 0.2% |
| Iran | 2,083 | 0.1% |
| Iraq | 167 | 0.0% |
| Ireland | 4,791 | 0.2% |
| Israel | 3,424 | 0.2% |
| Italy | 12,881 | 0.5% |
| Jamaica | 52,647 | 2.2% |
| Japan | 5,665 | 0.2% |
| Jordan | 472 | 0.0% |
| Kazakhstan | 804 | 0.0% |
| Kenya | 378 | 0.0% |
| Korea | 34,829 | 1.5% |
| Kuwait | 92 | 0.0% |
| Laos | 316 | 0.0% |
| Latin America | 527,312 | 22.3% |
| Latvia | 446 | 0.0% |
| Lebanon | 744 | 0.0% |
| Liberia | 525 | 0.0% |
| Lithuania | 525 | 0.0% |
| Malaysia | 4,482 | 0.2% |
| Mexico | 51,982 | 2.2% |
| Middle Africa | 393 | 0.0% |
| Moldova | 450 | 0.0% |
| Morocco | 2,515 | 0.1% |
| Nepal | 11,072 | 0.5% |
| Netherlands | 415 | 0.0% |
| Nicaragua | 2,073 | 0.1% |
| Nigeria | 6,491 | 0.3% |
| North Macedonia | 326 | 0.0% |
| Northern Africa | 11,876 | 0.5% |
| Northern Europe | 9,220 | 0.4% |
| Norway | 96 | 0.0% |
| Oceania | 1,029 | 0.0% |
| Pakistan | 12,881 | 0.5% |
| Panama | 3,132 | 0.1% |
| Peru | 16,626 | 0.7% |
| Philippines | 35,016 | 1.5% |
| Poland | 20,038 | 0.9% |
| Portugal | 778 | 0.0% |
| Romania | 6,650 | 0.3% |
| Russia | 10,962 | 0.5% |
| Saudi Arabia | 206 | 0.0% |
| Scotland | 119 | 0.0% |
| Senegal | 503 | 0.0% |
| Serbia | 1,770 | 0.1% |
| Sierra Leone | 80 | 0.0% |
| Singapore | 529 | 0.0% |
| Somalia | 63 | 0.0% |
| South Africa | 628 | 0.0% |
| South America | 252,216 | 10.7% |
| South Central Asia | 150,535 | 6.4% |
| South Eastern Asia | 58,681 | 2.5% |
| Southern Europe | 29,121 | 1.2% |
| Spain | 3,512 | 0.2% |
| Sri Lanka | 1,385 | 0.1% |
| St. Vincent and the Grenadines | 1,688 | 0.1% |
| Sudan | 511 | 0.0% |
| Sweden | 145 | 0.0% |
| Switzerland | 214 | 0.0% |
| Syria | 360 | 0.0% |
| Taiwan | 13,089 | 0.5% |
| Thailand | 4,263 | 0.2% |
| Trinidad and Tobago | 24,950 | 1.1% |
| Turkey | 2,557 | 0.1% |
| Uganda | 198 | 0.0% |
| Ukraine | 5,770 | 0.2% |
| Uruguay | 1,309 | 0.1% |
| Uzbekistan | 9,210 | 0.4% |
| Venezuela | 5,312 | 0.2% |
| Vietnam | 5,491 | 0.2% |
| West Indies | 854 | 0.0% |
| Western Africa | 13,506 | 0.6% |
| Western Asia | 13,938 | 0.6% |
| Western Europe | 7,057 | 0.3% |
| Yemen | 2,073 | 0.1% |
| Zaire | 111 | 0.0% |
| Zimbabwe | 87 | 0.0% | View All 133 Rows |
Sex and Age in Queens County
Sex and Age in Queens County
The most populous age groups in Queens County are 30 to 34 Years (95,088 | 8.2%) for men and 30 to 34 Years (91,773 | 7.6%) for women.
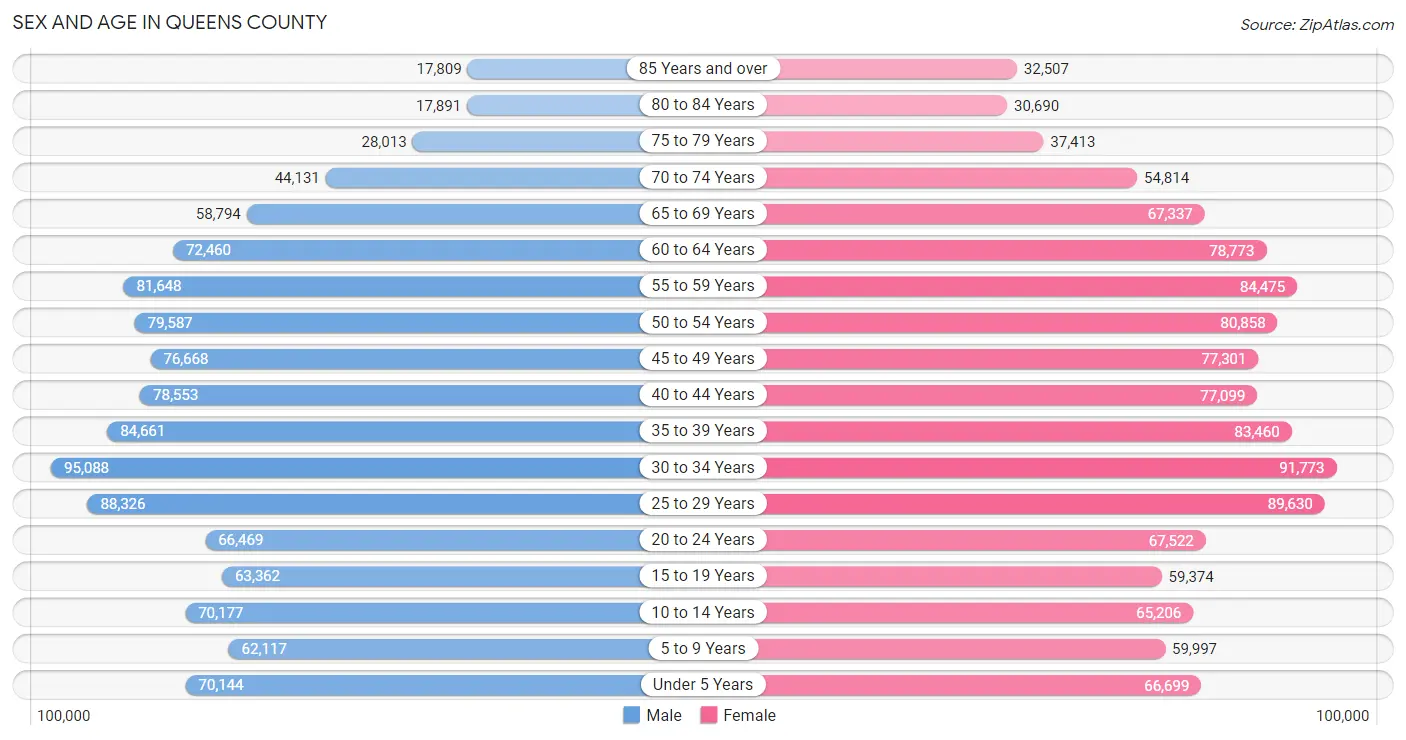
| Age Bracket | Male | Female |
| Under 5 Years | 70,144 (6.1%) | 66,699 (5.5%) |
| 5 to 9 Years | 62,117 (5.4%) | 59,997 (5.0%) |
| 10 to 14 Years | 70,177 (6.1%) | 65,206 (5.4%) |
| 15 to 19 Years | 63,362 (5.5%) | 59,374 (4.9%) |
| 20 to 24 Years | 66,469 (5.8%) | 67,522 (5.6%) |
| 25 to 29 Years | 88,326 (7.6%) | 89,630 (7.4%) |
| 30 to 34 Years | 95,088 (8.2%) | 91,773 (7.6%) |
| 35 to 39 Years | 84,661 (7.3%) | 83,460 (6.9%) |
| 40 to 44 Years | 78,553 (6.8%) | 77,099 (6.4%) |
| 45 to 49 Years | 76,668 (6.6%) | 77,301 (6.4%) |
| 50 to 54 Years | 79,587 (6.9%) | 80,858 (6.7%) |
| 55 to 59 Years | 81,648 (7.1%) | 84,475 (7.0%) |
| 60 to 64 Years | 72,460 (6.3%) | 78,773 (6.5%) |
| 65 to 69 Years | 58,794 (5.1%) | 67,337 (5.6%) |
| 70 to 74 Years | 44,131 (3.8%) | 54,814 (4.5%) |
| 75 to 79 Years | 28,013 (2.4%) | 37,413 (3.1%) |
| 80 to 84 Years | 17,891 (1.5%) | 30,690 (2.5%) |
| 85 Years and over | 17,809 (1.5%) | 32,507 (2.7%) |
| Total | 1,155,898 (100.0%) | 1,204,928 (100.0%) |
Families and Households in Queens County
Median Family Size in Queens County
The median family size in Queens County is 3.46 persons per family, with married-couple families (370,408 | 67.5%) accounting for the largest median family size of 3.56 persons per family. On the other hand, single male/father families (53,111 | 9.7%) represent the smallest median family size with 3.18 persons per family.
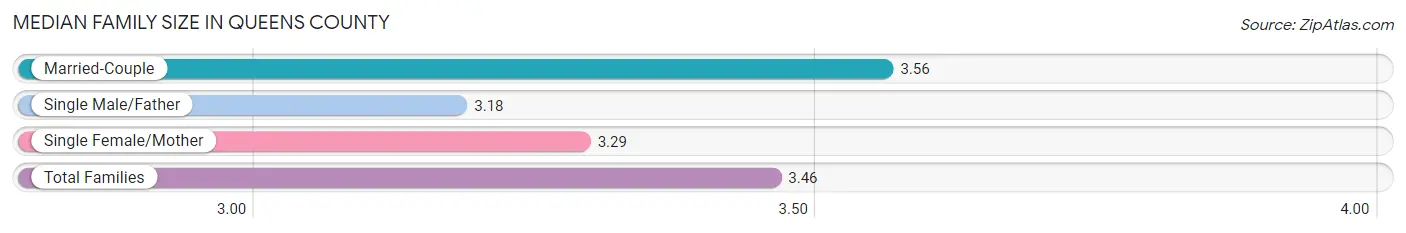
| Family Type | # Families | Family Size |
| Married-Couple | 370,408 (67.5%) | 3.56 |
| Single Male/Father | 53,111 (9.7%) | 3.18 |
| Single Female/Mother | 125,444 (22.9%) | 3.29 |
| Total Families | 548,963 (100.0%) | 3.46 |
Median Household Size in Queens County
The median household size in Queens County is 2.85 persons per household, with married-couple households (370,408 | 45.4%) accounting for the largest median household size of 3.63 persons per household. non-family households (267,896 | 32.8%) represent the smallest median household size with 1.32 persons per household.
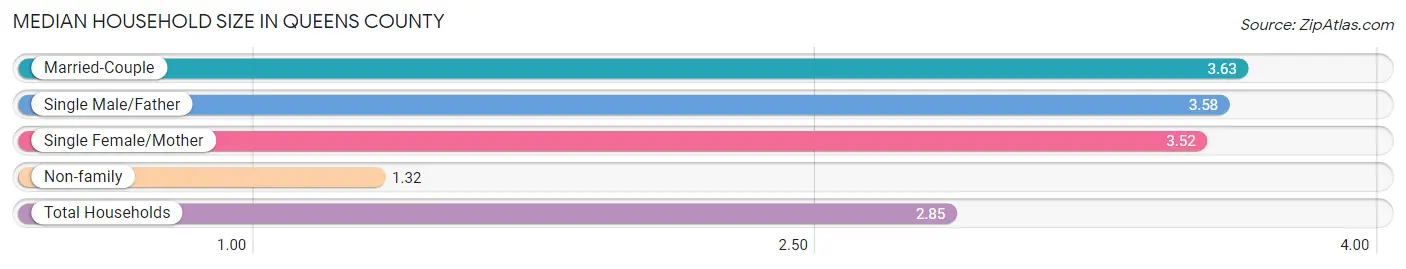
| Household Type | # Households | Household Size |
| Married-Couple | 370,408 (45.4%) | 3.63 |
| Single Male/Father | 53,111 (6.5%) | 3.58 |
| Single Female/Mother | 125,444 (15.4%) | 3.52 |
| Non-family | 267,896 (32.8%) | 1.32 |
| Total Households | 816,859 (100.0%) | 2.85 |
Household Size by Marriage Status in Queens County
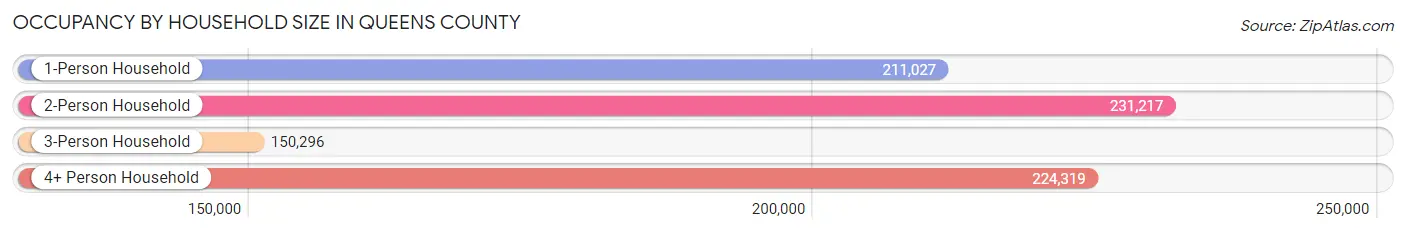
Out of a total of 816,859 households in Queens County, 548,963 (67.2%) are family households, while 267,896 (32.8%) are nonfamily households. The most numerous type of family households are 2-person households, comprising 187,707, and the most common type of nonfamily households are 1-person households, comprising 211,027.
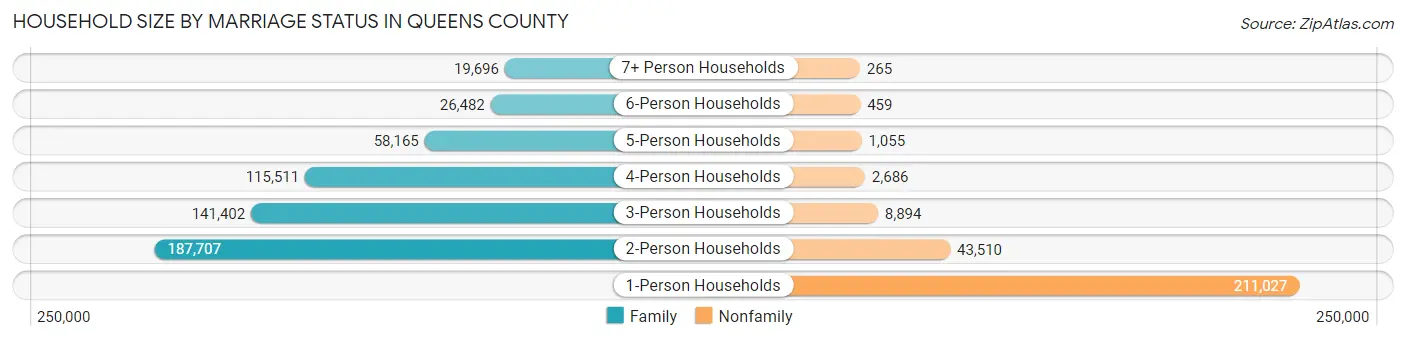
| Household Size | Family Households | Nonfamily Households |
| 1-Person Households | - | 211,027 (25.8%) |
| 2-Person Households | 187,707 (23.0%) | 43,510 (5.3%) |
| 3-Person Households | 141,402 (17.3%) | 8,894 (1.1%) |
| 4-Person Households | 115,511 (14.1%) | 2,686 (0.3%) |
| 5-Person Households | 58,165 (7.1%) | 1,055 (0.1%) |
| 6-Person Households | 26,482 (3.2%) | 459 (0.1%) |
| 7+ Person Households | 19,696 (2.4%) | 265 (0.0%) |
| Total | 548,963 (67.2%) | 267,896 (32.8%) |
Female Fertility in Queens County
Fertility by Age in Queens County
Average fertility rate in Queens County is 42.0 births per 1,000 women. Women in the age bracket of 20 to 34 years have the highest fertility rate with 53.0 births per 1,000 women. Women in the age bracket of 20 to 34 years acount for 55.7% of all women with births.
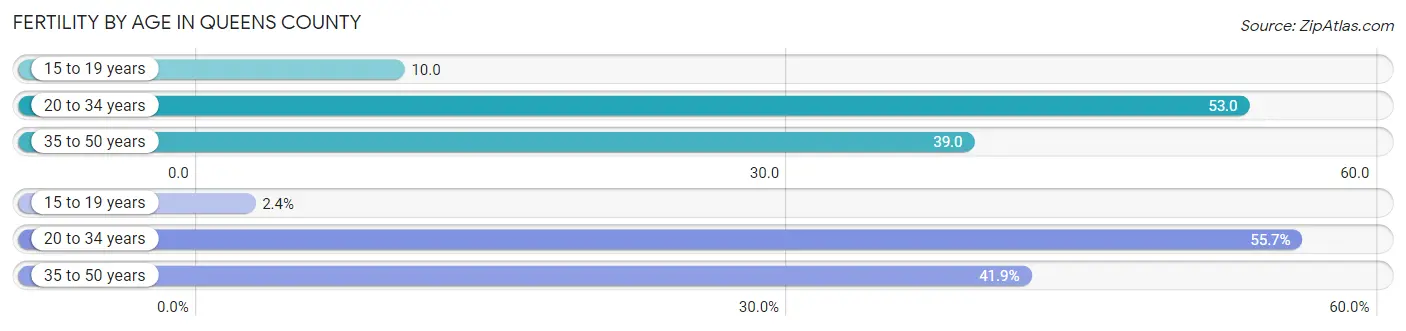
| Age Bracket | Women with Births | Births / 1,000 Women |
| 15 to 19 years | 567 (2.4%) | 10.0 |
| 20 to 34 years | 13,151 (55.7%) | 53.0 |
| 35 to 50 years | 9,891 (41.9%) | 39.0 |
| Total | 23,609 (100.0%) | 42.0 |
Fertility by Age by Marriage Status in Queens County
74.0% of women with births (23,609) in Queens County are married. The highest percentage of unmarried women with births falls into 15 to 19 years age bracket with 95.8% of them unmarried at the time of birth, while the lowest percentage of unmarried women with births belong to 35 to 50 years age bracket with 17.8% of them unmarried.
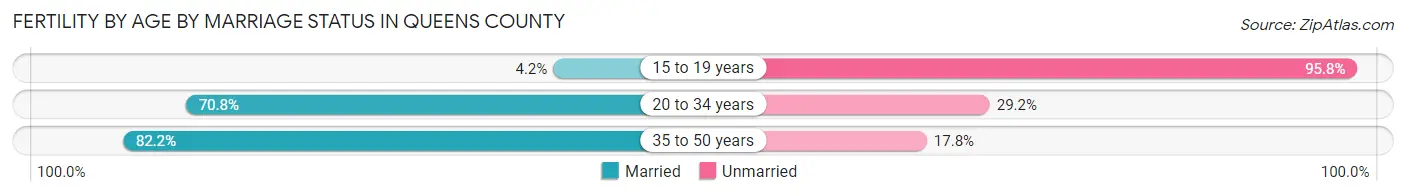
| Age Bracket | Married | Unmarried |
| 15 to 19 years | 24 (4.2%) | 543 (95.8%) |
| 20 to 34 years | 9,311 (70.8%) | 3,840 (29.2%) |
| 35 to 50 years | 8,130 (82.2%) | 1,761 (17.8%) |
| Total | 17,471 (74.0%) | 6,138 (26.0%) |
Fertility by Education in Queens County
Average fertility rate in Queens County is 42.0 births per 1,000 women. Women with the education attainment of graduate degree have the highest fertility rate of 63.0 births per 1,000 women, while women with the education attainment of less than high school have the lowest fertility at 29.0 births per 1,000 women. Women with the education attainment of bachelor's degree represent 25.3% of all women with births.
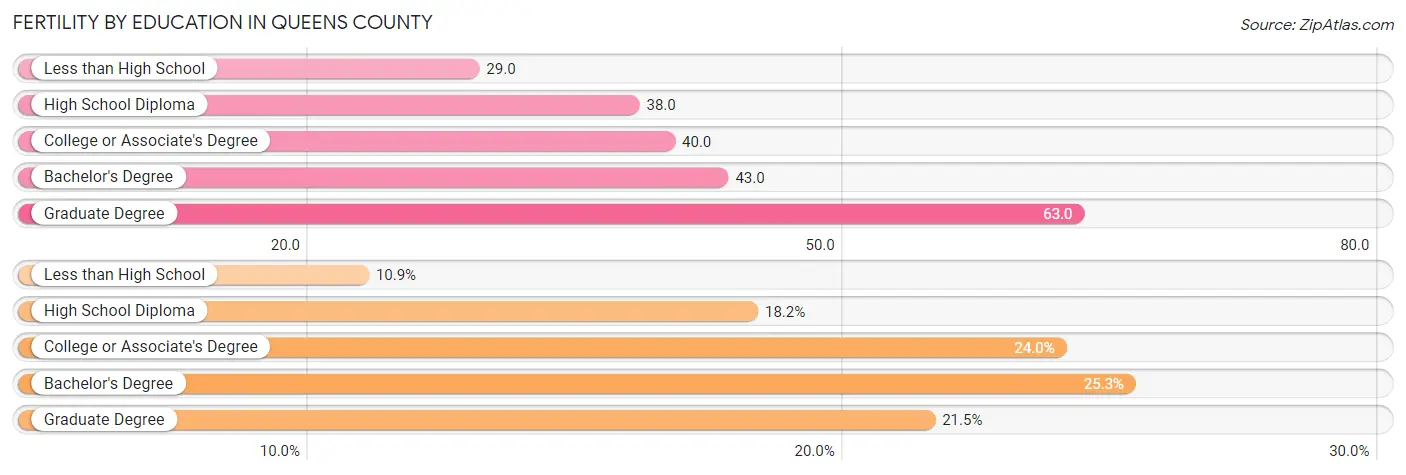
| Educational Attainment | Women with Births | Births / 1,000 Women |
| Less than High School | 2,581 (10.9%) | 29.0 |
| High School Diploma | 4,302 (18.2%) | 38.0 |
| College or Associate's Degree | 5,667 (24.0%) | 40.0 |
| Bachelor's Degree | 5,974 (25.3%) | 43.0 |
| Graduate Degree | 5,085 (21.5%) | 63.0 |
| Total | 23,609 (100.0%) | 42.0 |
Fertility by Education by Marriage Status in Queens County
26.0% of women with births in Queens County are unmarried. Women with the educational attainment of graduate degree are most likely to be married with 92.3% of them married at childbirth, while women with the educational attainment of less than high school are least likely to be married with 44.8% of them unmarried at childbirth.
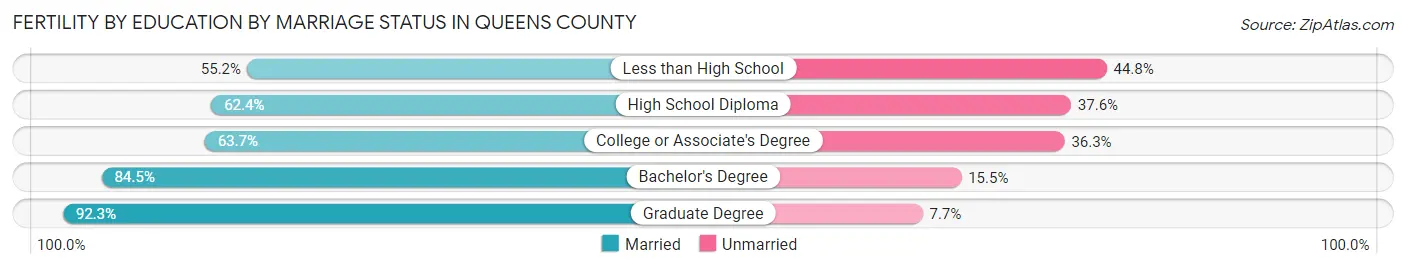
| Educational Attainment | Married | Unmarried |
| Less than High School | 1,425 (55.2%) | 1,156 (44.8%) |
| High School Diploma | 2,684 (62.4%) | 1,618 (37.6%) |
| College or Associate's Degree | 3,610 (63.7%) | 2,057 (36.3%) |
| Bachelor's Degree | 5,048 (84.5%) | 926 (15.5%) |
| Graduate Degree | 4,693 (92.3%) | 392 (7.7%) |
| Total | 17,471 (74.0%) | 6,138 (26.0%) |
Employment Characteristics in Queens County
Employment by Class of Employer in Queens County
Among the 1,112,766 employed individuals in Queens County, private company employees (746,659 | 67.1%), local government employees (105,844 | 9.5%), and not-for-profit organizations (98,057 | 8.8%) make up the most common classes of employment.
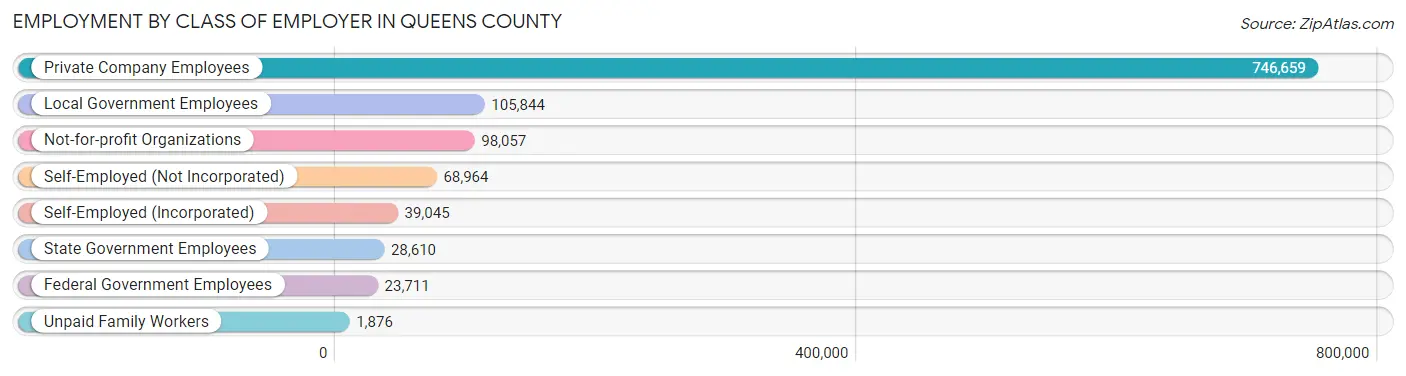
| Employer Class | # Employees | % Employees |
| Private Company Employees | 746,659 | 67.1% |
| Self-Employed (Incorporated) | 39,045 | 3.5% |
| Self-Employed (Not Incorporated) | 68,964 | 6.2% |
| Not-for-profit Organizations | 98,057 | 8.8% |
| Local Government Employees | 105,844 | 9.5% |
| State Government Employees | 28,610 | 2.6% |
| Federal Government Employees | 23,711 | 2.1% |
| Unpaid Family Workers | 1,876 | 0.2% |
| Total | 1,112,766 | 100.0% |
Employment Status by Age in Queens County
According to the labor force statistics for Queens County, out of the total population over 16 years of age (1,942,919), 63.7% or 1,237,639 individuals are in the labor force, with 7.0% or 86,635 of them unemployed. The age group with the highest labor force participation rate is 30 to 34 years, with 84.7% or 158,271 individuals in the labor force. Within the labor force, the 16 to 19 years age range has the highest percentage of unemployed individuals, with 25.3% or 5,169 of them being unemployed.
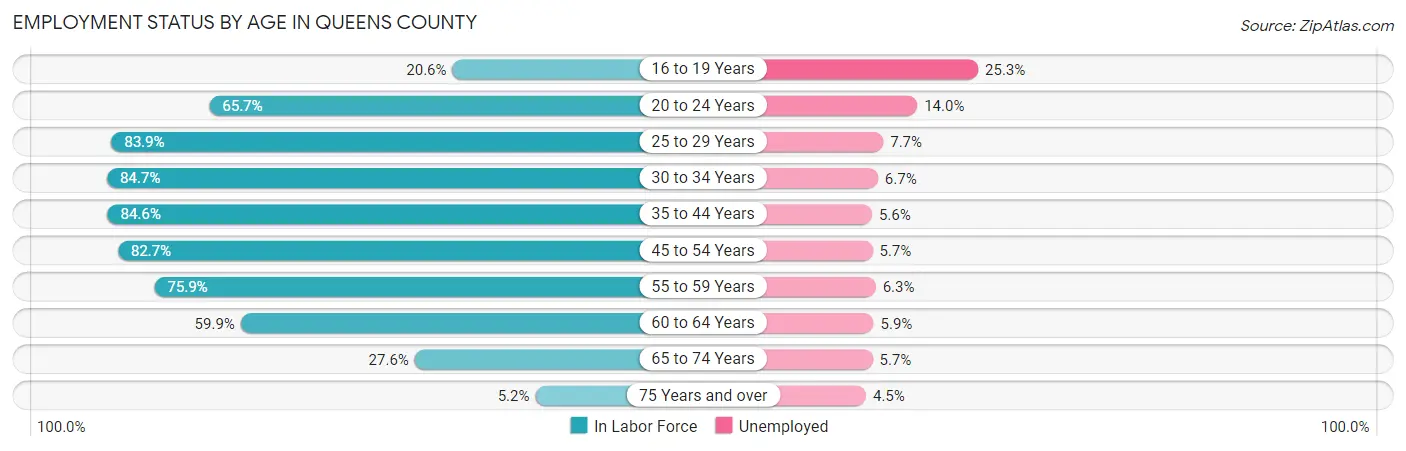
| Age Bracket | In Labor Force | Unemployed |
| 16 to 19 Years | 20,429 (20.6%) | 5,169 (25.3%) |
| 20 to 24 Years | 88,032 (65.7%) | 12,324 (14.0%) |
| 25 to 29 Years | 149,305 (83.9%) | 11,496 (7.7%) |
| 30 to 34 Years | 158,271 (84.7%) | 10,604 (6.7%) |
| 35 to 44 Years | 273,912 (84.6%) | 15,339 (5.6%) |
| 45 to 54 Years | 260,020 (82.7%) | 14,821 (5.7%) |
| 55 to 59 Years | 126,087 (75.9%) | 7,943 (6.3%) |
| 60 to 64 Years | 90,589 (59.9%) | 5,345 (5.9%) |
| 65 to 74 Years | 62,121 (27.6%) | 3,541 (5.7%) |
| 75 Years and over | 8,545 (5.2%) | 385 (4.5%) |
| Total | 1,237,639 (63.7%) | 86,635 (7.0%) |
Employment Status by Educational Attainment in Queens County
According to labor force statistics for Queens County, 80.1% of individuals (1,057,608) out of the total population between 25 and 64 years of age (1,320,360) are in the labor force, with 6.2% or 65,572 of them being unemployed. The group with the highest labor force participation rate are those with the educational attainment of bachelor's degree or higher, with 87.9% or 435,644 individuals in the labor force. Within the labor force, individuals with less than high school education have the highest percentage of unemployment, with 7.3% or 9,435 of them being unemployed.
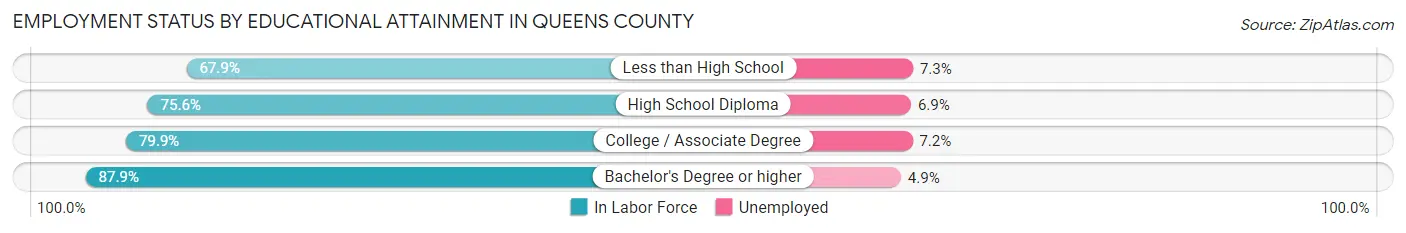
| Educational Attainment | In Labor Force | Unemployed |
| Less than High School | 129,253 (67.9%) | 13,896 (7.3%) |
| High School Diploma | 248,001 (75.6%) | 22,635 (6.9%) |
| College / Associate Degree | 244,770 (79.9%) | 22,057 (7.2%) |
| Bachelor's Degree or higher | 435,644 (87.9%) | 24,285 (4.9%) |
| Total | 1,057,608 (80.1%) | 81,862 (6.2%) |
Employment Occupations by Sex in Queens County
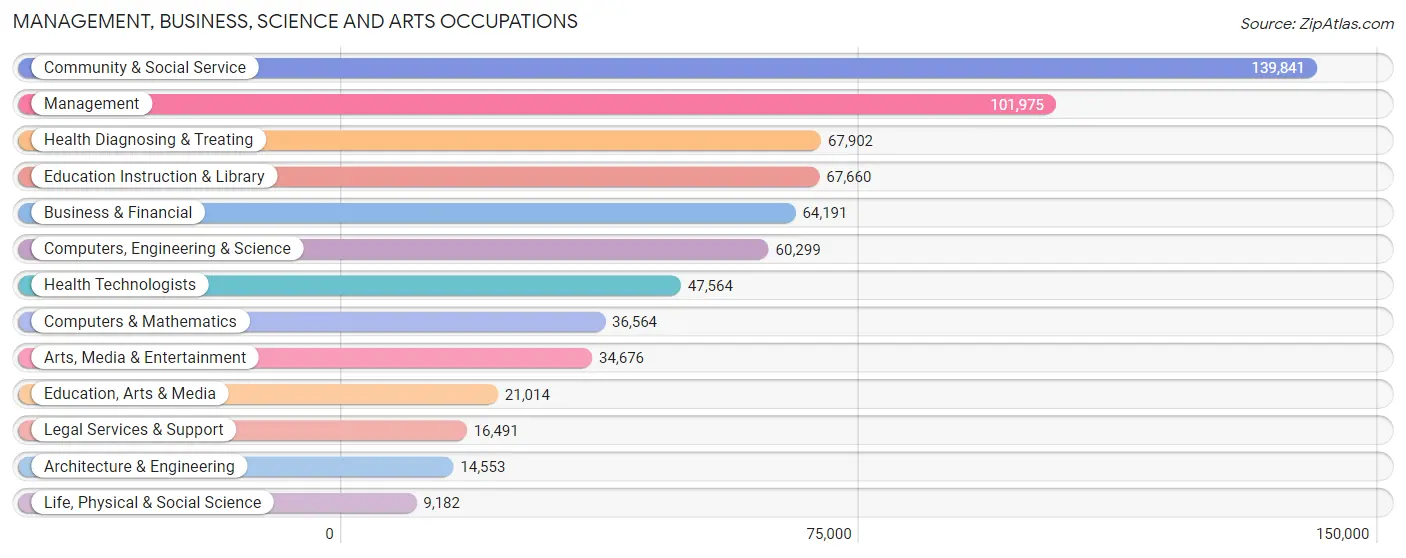
Management, Business, Science and Arts Occupations
The most common Management, Business, Science and Arts occupations in Queens County are Community & Social Service (139,841 | 12.2%), Management (101,975 | 8.9%), Health Diagnosing & Treating (67,902 | 5.9%), Education Instruction & Library (67,660 | 5.9%), and Business & Financial (64,191 | 5.6%).
Management, Business, Science and Arts Occupations by Sex
Within the Management, Business, Science and Arts occupations in Queens County, the most male-oriented occupations are Architecture & Engineering (82.3%), Computers & Mathematics (75.4%), and Computers, Engineering & Science (72.2%), while the most female-oriented occupations are Health Technologists (72.5%), Education Instruction & Library (72.4%), and Health Diagnosing & Treating (70.3%).
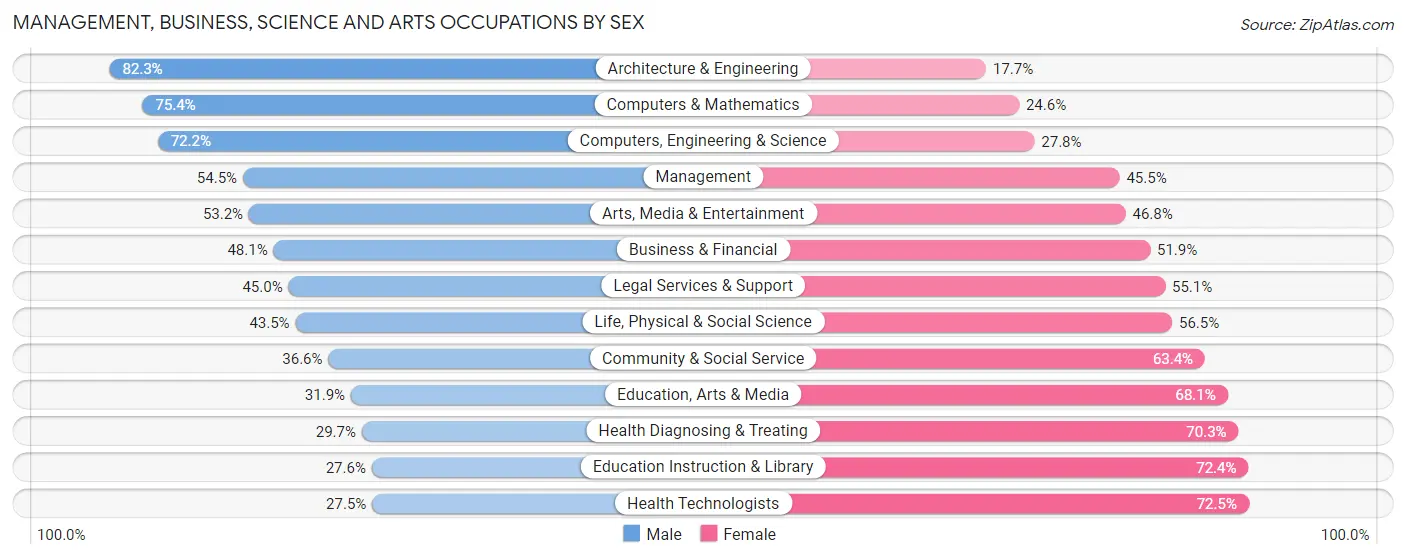
| Occupation | Male | Female |
| Management | 55,534 (54.5%) | 46,441 (45.5%) |
| Business & Financial | 30,863 (48.1%) | 33,328 (51.9%) |
| Computers, Engineering & Science | 43,545 (72.2%) | 16,754 (27.8%) |
| Computers & Mathematics | 27,575 (75.4%) | 8,989 (24.6%) |
| Architecture & Engineering | 11,976 (82.3%) | 2,577 (17.7%) |
| Life, Physical & Social Science | 3,994 (43.5%) | 5,188 (56.5%) |
| Community & Social Service | 51,237 (36.6%) | 88,604 (63.4%) |
| Education, Arts & Media | 6,710 (31.9%) | 14,304 (68.1%) |
| Legal Services & Support | 7,413 (45.0%) | 9,078 (55.0%) |
| Education Instruction & Library | 18,666 (27.6%) | 48,994 (72.4%) |
| Arts, Media & Entertainment | 18,448 (53.2%) | 16,228 (46.8%) |
| Health Diagnosing & Treating | 20,142 (29.7%) | 47,760 (70.3%) |
| Health Technologists | 13,080 (27.5%) | 34,484 (72.5%) |
| Total (Category) | 201,321 (46.4%) | 232,887 (53.6%) |
| Total (Overall) | 606,541 (52.8%) | 543,027 (47.2%) |
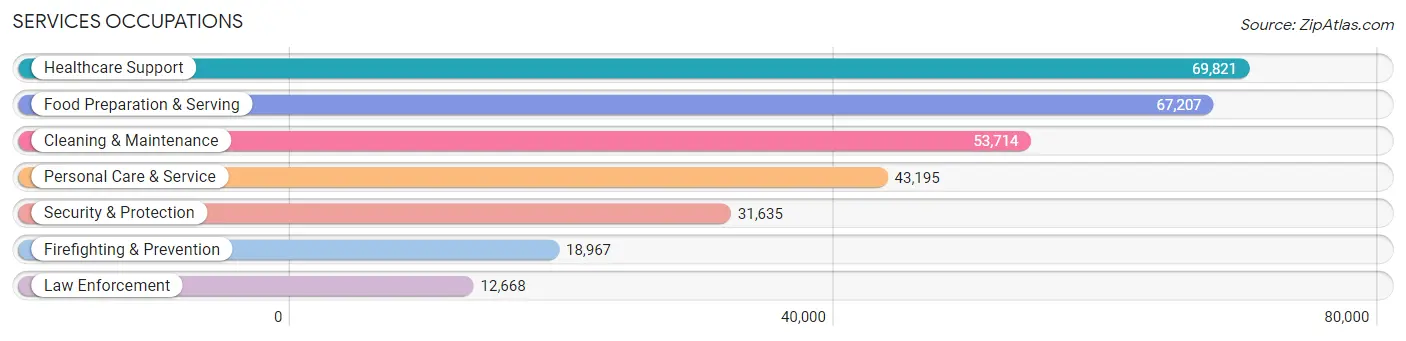
Services Occupations
The most common Services occupations in Queens County are Healthcare Support (69,821 | 6.1%), Food Preparation & Serving (67,207 | 5.9%), Cleaning & Maintenance (53,714 | 4.7%), Personal Care & Service (43,195 | 3.8%), and Security & Protection (31,635 | 2.8%).
Services Occupations by Sex
Within the Services occupations in Queens County, the most male-oriented occupations are Firefighting & Prevention (77.0%), Security & Protection (74.5%), and Law Enforcement (70.7%), while the most female-oriented occupations are Healthcare Support (85.3%), Personal Care & Service (67.0%), and Cleaning & Maintenance (54.1%).
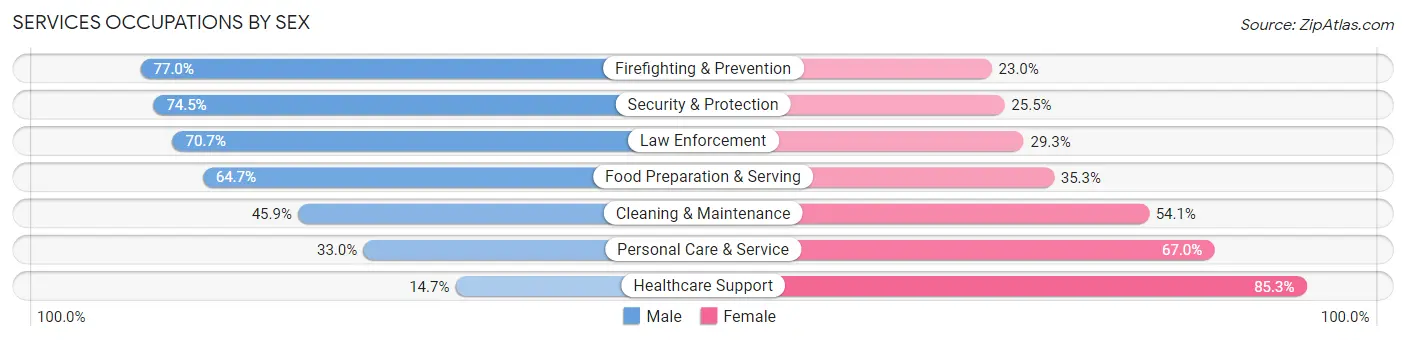
| Occupation | Male | Female |
| Healthcare Support | 10,279 (14.7%) | 59,542 (85.3%) |
| Security & Protection | 23,563 (74.5%) | 8,072 (25.5%) |
| Firefighting & Prevention | 14,608 (77.0%) | 4,359 (23.0%) |
| Law Enforcement | 8,955 (70.7%) | 3,713 (29.3%) |
| Food Preparation & Serving | 43,491 (64.7%) | 23,716 (35.3%) |
| Cleaning & Maintenance | 24,661 (45.9%) | 29,053 (54.1%) |
| Personal Care & Service | 14,246 (33.0%) | 28,949 (67.0%) |
| Total (Category) | 116,240 (43.8%) | 149,332 (56.2%) |
| Total (Overall) | 606,541 (52.8%) | 543,027 (47.2%) |
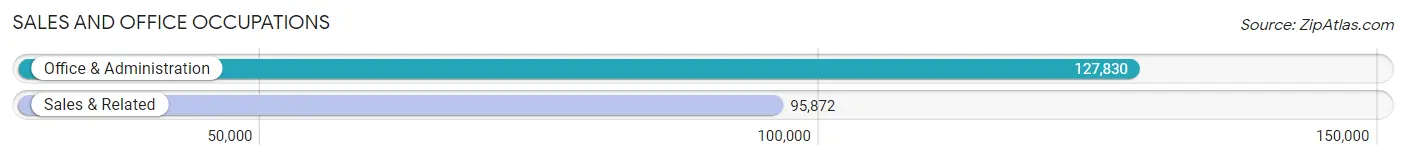
Sales and Office Occupations
The most common Sales and Office occupations in Queens County are Office & Administration (127,830 | 11.1%), and Sales & Related (95,872 | 8.3%).
Sales and Office Occupations by Sex
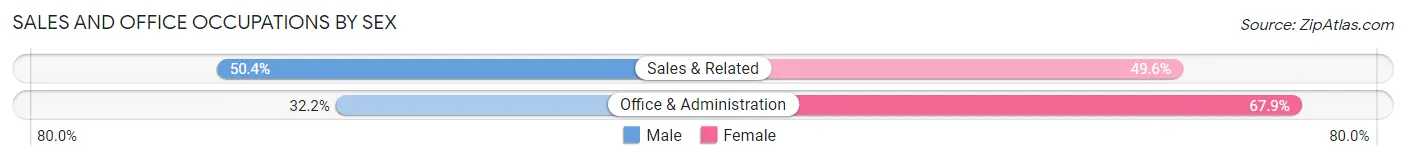
| Occupation | Male | Female |
| Sales & Related | 48,347 (50.4%) | 47,525 (49.6%) |
| Office & Administration | 41,101 (32.2%) | 86,729 (67.8%) |
| Total (Category) | 89,448 (40.0%) | 134,254 (60.0%) |
| Total (Overall) | 606,541 (52.8%) | 543,027 (47.2%) |
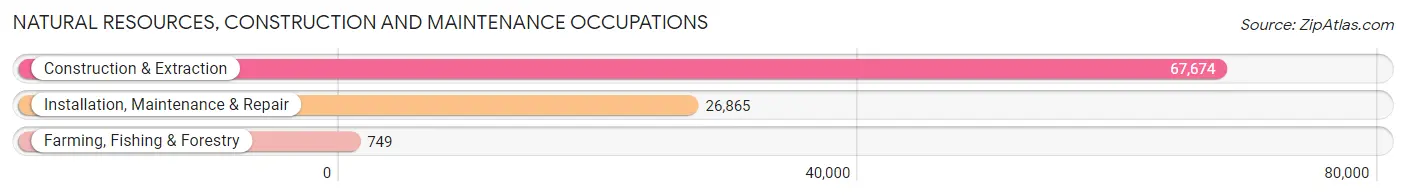
Natural Resources, Construction and Maintenance Occupations
The most common Natural Resources, Construction and Maintenance occupations in Queens County are Construction & Extraction (67,674 | 5.9%), Installation, Maintenance & Repair (26,865 | 2.3%), and Farming, Fishing & Forestry (749 | 0.1%).
Natural Resources, Construction and Maintenance Occupations by Sex
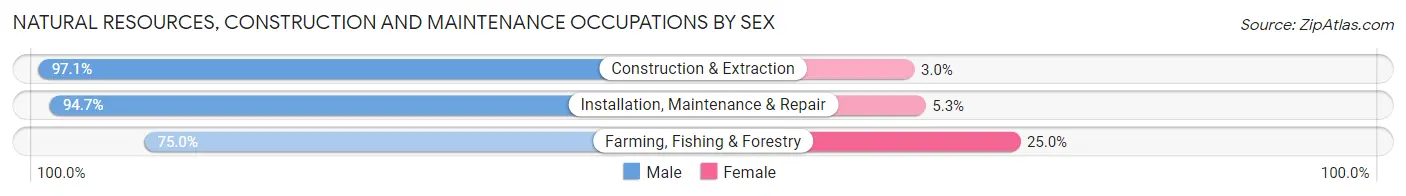
| Occupation | Male | Female |
| Farming, Fishing & Forestry | 562 (75.0%) | 187 (25.0%) |
| Construction & Extraction | 65,675 (97.1%) | 1,999 (2.9%) |
| Installation, Maintenance & Repair | 25,443 (94.7%) | 1,422 (5.3%) |
| Total (Category) | 91,680 (96.2%) | 3,608 (3.8%) |
| Total (Overall) | 606,541 (52.8%) | 543,027 (47.2%) |
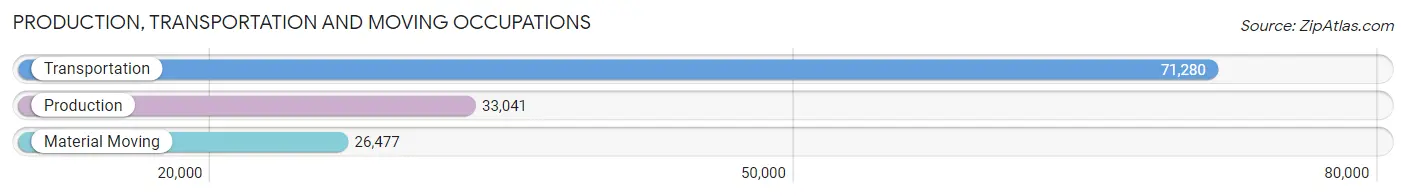
Production, Transportation and Moving Occupations
The most common Production, Transportation and Moving occupations in Queens County are Transportation (71,280 | 6.2%), Production (33,041 | 2.9%), and Material Moving (26,477 | 2.3%).
Production, Transportation and Moving Occupations by Sex
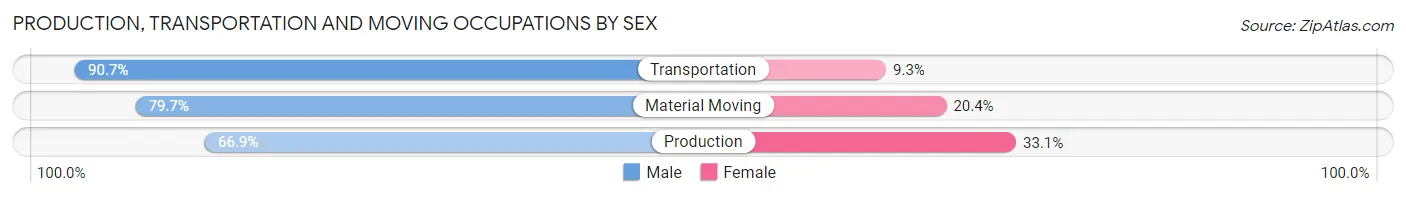
| Occupation | Male | Female |
| Production | 22,094 (66.9%) | 10,947 (33.1%) |
| Transportation | 64,668 (90.7%) | 6,612 (9.3%) |
| Material Moving | 21,090 (79.6%) | 5,387 (20.3%) |
| Total (Category) | 107,852 (82.5%) | 22,946 (17.5%) |
| Total (Overall) | 606,541 (52.8%) | 543,027 (47.2%) |
Employment Industries by Sex in Queens County
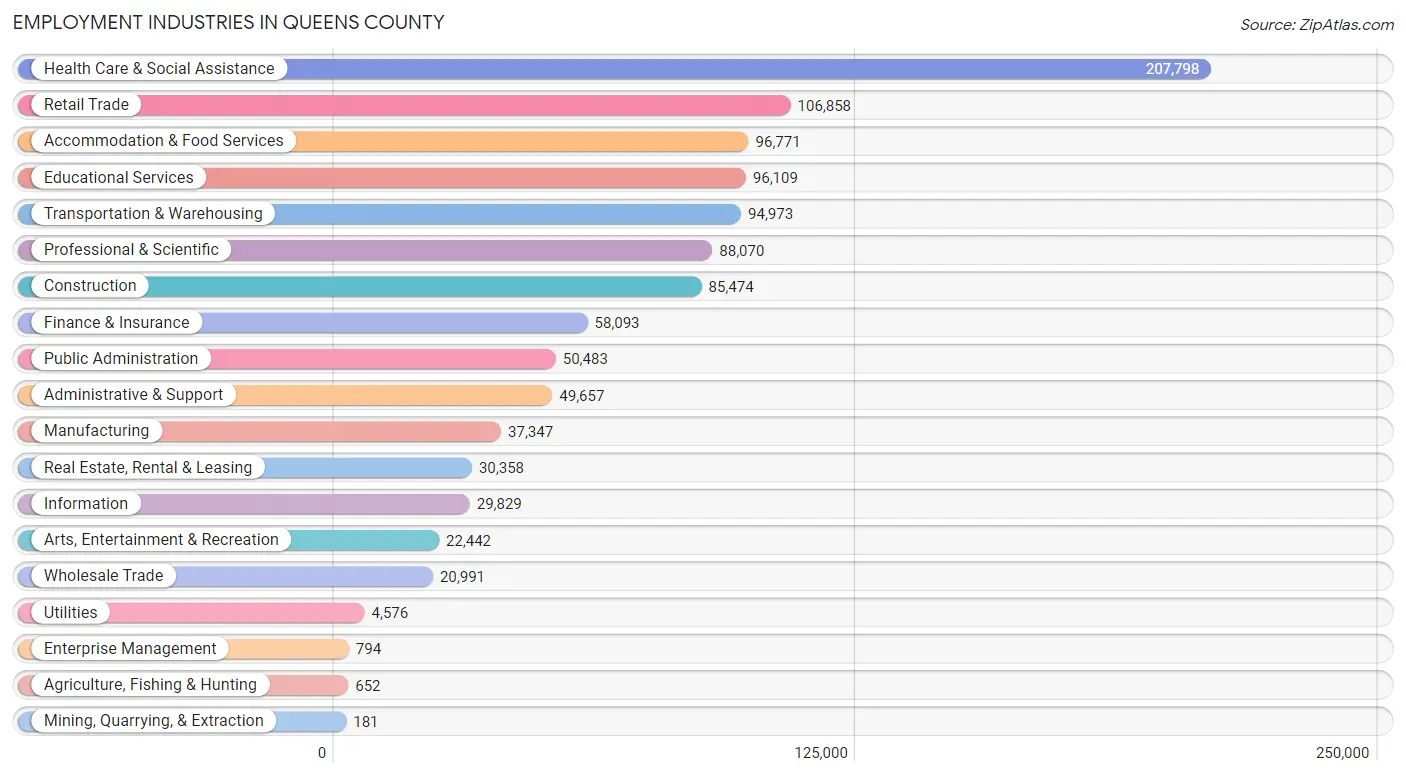
Employment Industries in Queens County
The major employment industries in Queens County include Health Care & Social Assistance (207,798 | 18.1%), Retail Trade (106,858 | 9.3%), Accommodation & Food Services (96,771 | 8.4%), Educational Services (96,109 | 8.4%), and Transportation & Warehousing (94,973 | 8.3%).
Employment Industries by Sex in Queens County
The Queens County industries that see more men than women are Mining, Quarrying, & Extraction (100.0%), Construction (91.4%), and Transportation & Warehousing (81.7%), whereas the industries that tend to have a higher number of women are Health Care & Social Assistance (75.1%), Educational Services (67.5%), and Finance & Insurance (50.0%).
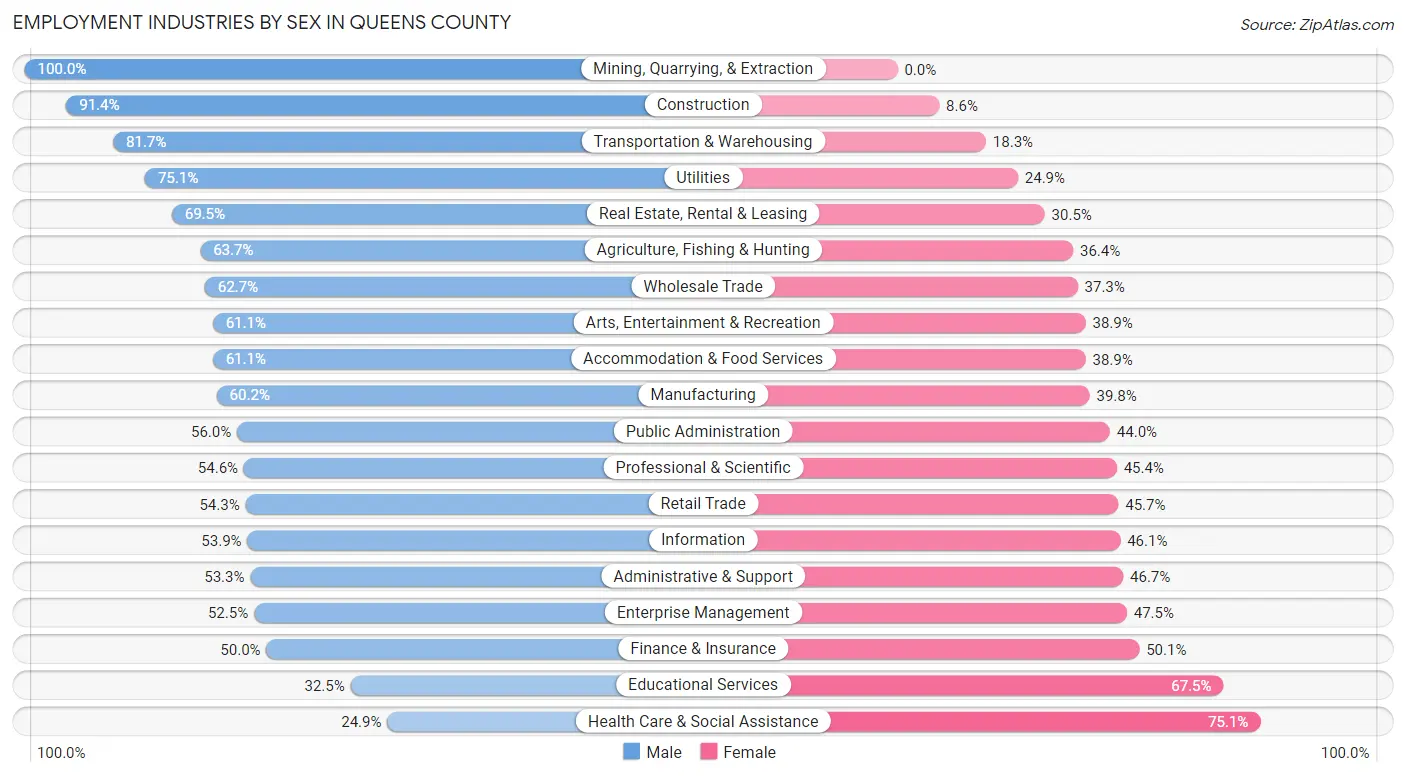
| Industry | Male | Female |
| Agriculture, Fishing & Hunting | 415 (63.6%) | 237 (36.3%) |
| Mining, Quarrying, & Extraction | 181 (100.0%) | 0 (0.0%) |
| Construction | 78,086 (91.4%) | 7,388 (8.6%) |
| Manufacturing | 22,496 (60.2%) | 14,851 (39.8%) |
| Wholesale Trade | 13,162 (62.7%) | 7,829 (37.3%) |
| Retail Trade | 58,003 (54.3%) | 48,855 (45.7%) |
| Transportation & Warehousing | 77,581 (81.7%) | 17,392 (18.3%) |
| Utilities | 3,435 (75.1%) | 1,141 (24.9%) |
| Information | 16,072 (53.9%) | 13,757 (46.1%) |
| Finance & Insurance | 29,016 (49.9%) | 29,077 (50.0%) |
| Real Estate, Rental & Leasing | 21,106 (69.5%) | 9,252 (30.5%) |
| Professional & Scientific | 48,095 (54.6%) | 39,975 (45.4%) |
| Enterprise Management | 417 (52.5%) | 377 (47.5%) |
| Administrative & Support | 26,462 (53.3%) | 23,195 (46.7%) |
| Educational Services | 31,270 (32.5%) | 64,839 (67.5%) |
| Health Care & Social Assistance | 51,782 (24.9%) | 156,016 (75.1%) |
| Arts, Entertainment & Recreation | 13,702 (61.1%) | 8,740 (38.9%) |
| Accommodation & Food Services | 59,089 (61.1%) | 37,682 (38.9%) |
| Public Administration | 28,281 (56.0%) | 22,202 (44.0%) |
| Total | 606,541 (52.8%) | 543,027 (47.2%) |
Education in Queens County
School Enrollment in Queens County
The most common levels of schooling among the 532,177 students in Queens County are college / undergraduate (124,738 | 23.4%), high school (105,074 | 19.7%), and middle school (104,838 | 19.7%).
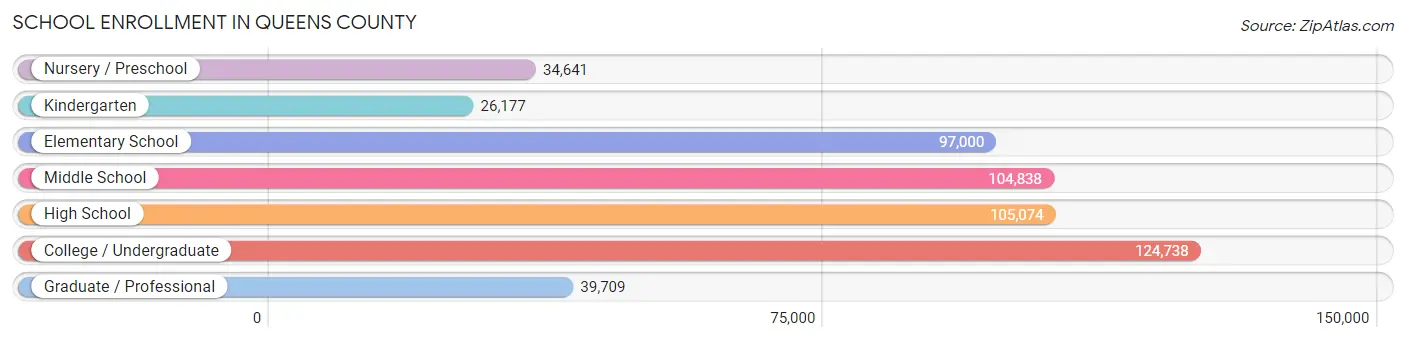
| School Level | # Students | % Students |
| Nursery / Preschool | 34,641 | 6.5% |
| Kindergarten | 26,177 | 4.9% |
| Elementary School | 97,000 | 18.2% |
| Middle School | 104,838 | 19.7% |
| High School | 105,074 | 19.7% |
| College / Undergraduate | 124,738 | 23.4% |
| Graduate / Professional | 39,709 | 7.5% |
| Total | 532,177 | 100.0% |
School Enrollment by Age by Funding Source in Queens County
Out of a total of 532,177 students who are enrolled in schools in Queens County, 105,903 (19.9%) attend a private institution, while the remaining 426,274 (80.1%) are enrolled in public schools. The age group of 35 years and over has the highest likelihood of being enrolled in private schools, with 13,467 (41.0% in the age bracket) enrolled. Conversely, the age group of 5 to 9 year old has the lowest likelihood of being enrolled in a private school, with 103,806 (88.0% in the age bracket) attending a public institution.
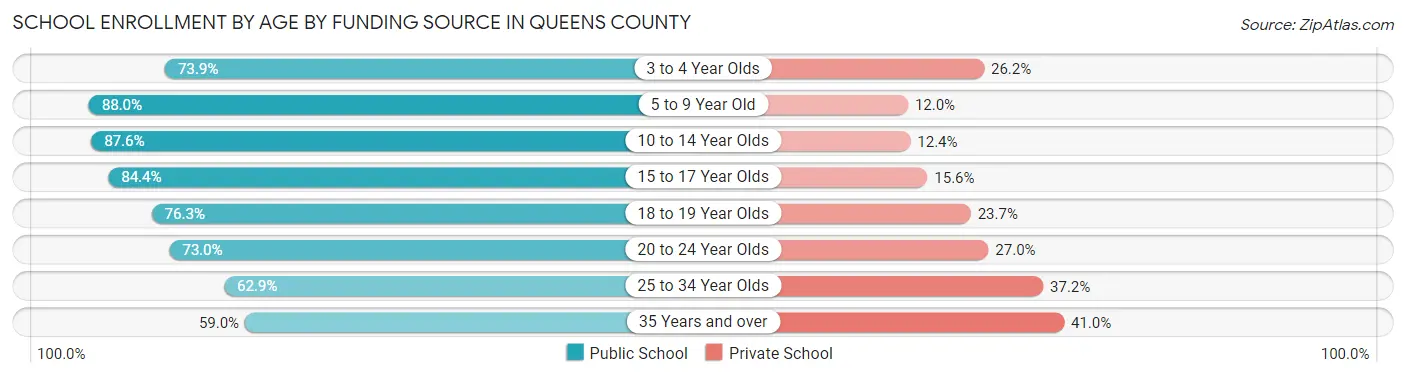
| Age Bracket | Public School | Private School |
| 3 to 4 Year Olds | 24,202 (73.9%) | 8,569 (26.2%) |
| 5 to 9 Year Old | 103,806 (88.0%) | 14,109 (12.0%) |
| 10 to 14 Year Olds | 115,284 (87.6%) | 16,343 (12.4%) |
| 15 to 17 Year Olds | 61,541 (84.4%) | 11,367 (15.6%) |
| 18 to 19 Year Olds | 29,216 (76.3%) | 9,062 (23.7%) |
| 20 to 24 Year Olds | 45,239 (73.0%) | 16,702 (27.0%) |
| 25 to 34 Year Olds | 27,609 (62.8%) | 16,317 (37.1%) |
| 35 Years and over | 19,344 (59.0%) | 13,467 (41.0%) |
| Total | 426,274 (80.1%) | 105,903 (19.9%) |
Educational Attainment by Field of Study in Queens County
Business (126,250 | 19.9%), science & technology (65,480 | 10.3%), social sciences (63,972 | 10.1%), education (50,973 | 8.0%), and visual & performing arts (41,986 | 6.6%) are the most common fields of study among 634,980 individuals in Queens County who have obtained a bachelor's degree or higher.
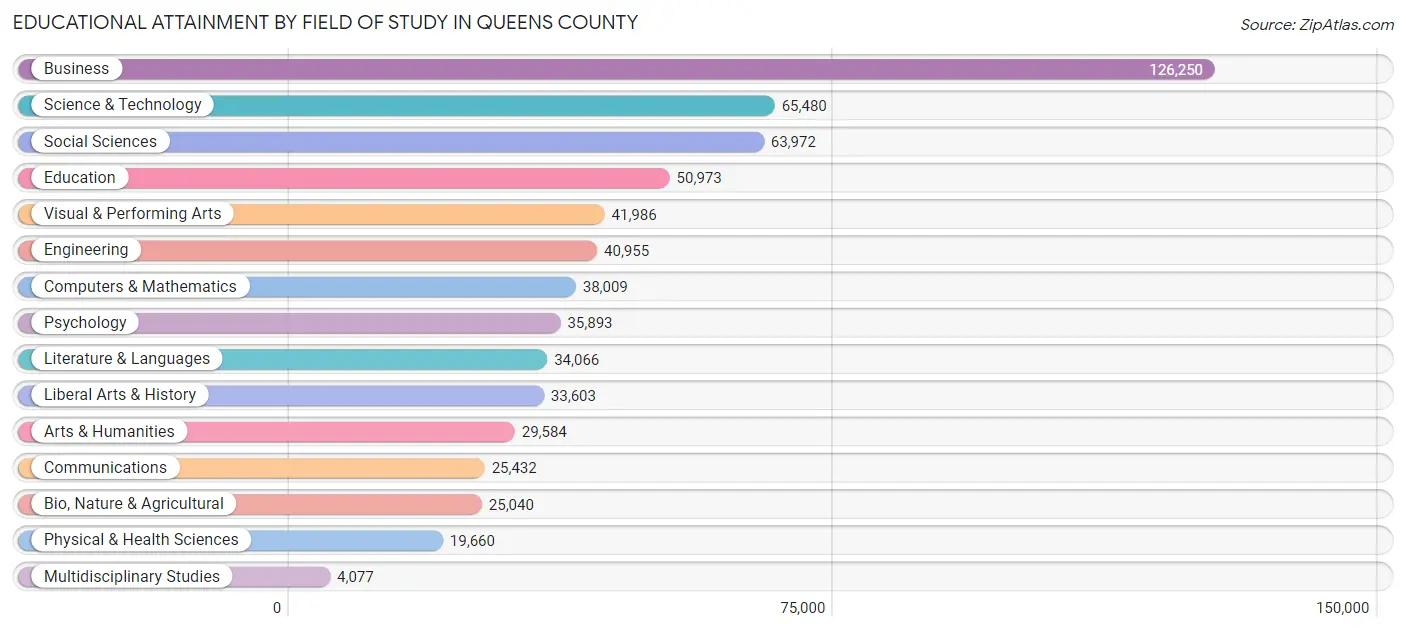
| Field of Study | # Graduates | % Graduates |
| Computers & Mathematics | 38,009 | 6.0% |
| Bio, Nature & Agricultural | 25,040 | 3.9% |
| Physical & Health Sciences | 19,660 | 3.1% |
| Psychology | 35,893 | 5.7% |
| Social Sciences | 63,972 | 10.1% |
| Engineering | 40,955 | 6.5% |
| Multidisciplinary Studies | 4,077 | 0.6% |
| Science & Technology | 65,480 | 10.3% |
| Business | 126,250 | 19.9% |
| Education | 50,973 | 8.0% |
| Literature & Languages | 34,066 | 5.4% |
| Liberal Arts & History | 33,603 | 5.3% |
| Visual & Performing Arts | 41,986 | 6.6% |
| Communications | 25,432 | 4.0% |
| Arts & Humanities | 29,584 | 4.7% |
| Total | 634,980 | 100.0% |
Transportation & Commute in Queens County
Vehicle Availability by Sex in Queens County
The most prevalent vehicle ownership categories in Queens County are males with 1 vehicle (227,810, accounting for 38.7%) and females with 1 vehicle (200,708, making up 43.7%).
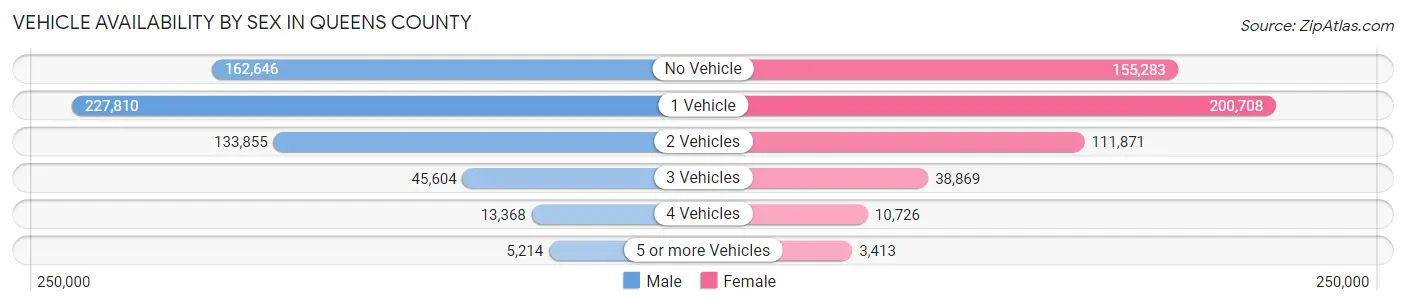
| Vehicles Available | Male | Female |
| No Vehicle | 162,646 (27.6%) | 155,283 (29.8%) |
| 1 Vehicle | 227,810 (38.7%) | 200,708 (38.5%) |
| 2 Vehicles | 133,855 (22.8%) | 111,871 (21.5%) |
| 3 Vehicles | 45,604 (7.7%) | 38,869 (7.5%) |
| 4 Vehicles | 13,368 (2.3%) | 10,726 (2.1%) |
| 5 or more Vehicles | 5,214 (0.9%) | 3,413 (0.7%) |
| Total | 588,497 (100.0%) | 520,870 (100.0%) |
Commute Time in Queens County
The most frequently occuring commute durations in Queens County are 60 to 89 minutes (217,931 commuters, 21.7%), 45 to 59 minutes (167,727 commuters, 16.7%), and 30 to 34 minutes (162,208 commuters, 16.1%).
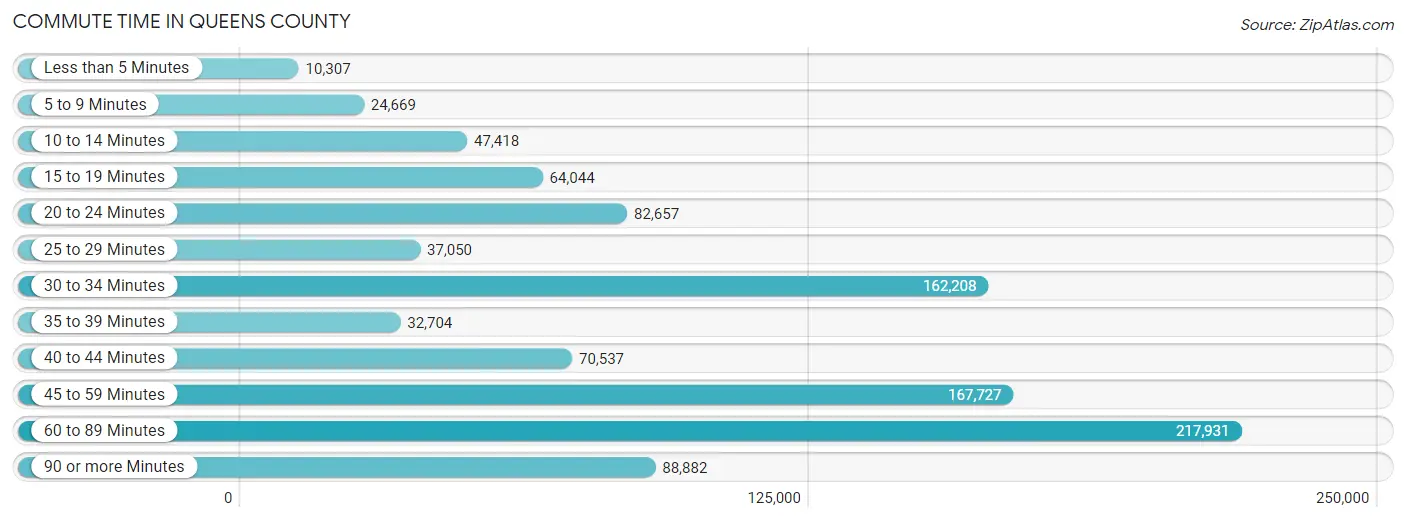
| Commute Time | # Commuters | % Commuters |
| Less than 5 Minutes | 10,307 | 1.0% |
| 5 to 9 Minutes | 24,669 | 2.5% |
| 10 to 14 Minutes | 47,418 | 4.7% |
| 15 to 19 Minutes | 64,044 | 6.4% |
| 20 to 24 Minutes | 82,657 | 8.2% |
| 25 to 29 Minutes | 37,050 | 3.7% |
| 30 to 34 Minutes | 162,208 | 16.1% |
| 35 to 39 Minutes | 32,704 | 3.3% |
| 40 to 44 Minutes | 70,537 | 7.0% |
| 45 to 59 Minutes | 167,727 | 16.7% |
| 60 to 89 Minutes | 217,931 | 21.7% |
| 90 or more Minutes | 88,882 | 8.8% |
Commute Time by Sex in Queens County
The most common commute times in Queens County are 60 to 89 minutes (120,798 commuters, 22.3%) for males and 60 to 89 minutes (97,133 commuters, 20.9%) for females.
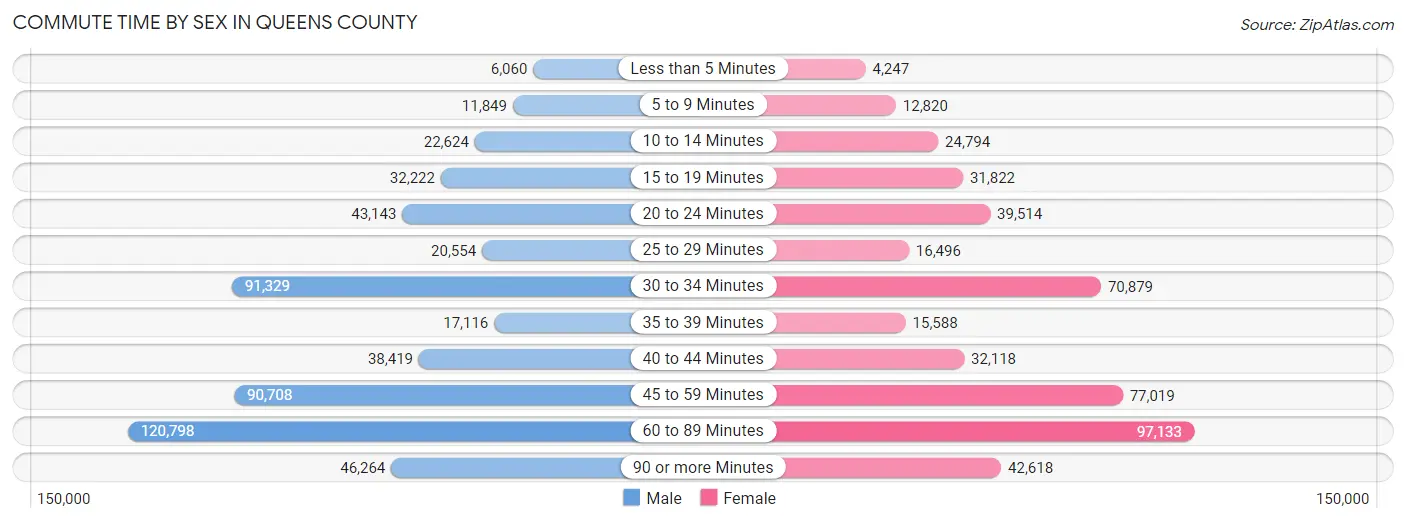
| Commute Time | Male | Female |
| Less than 5 Minutes | 6,060 (1.1%) | 4,247 (0.9%) |
| 5 to 9 Minutes | 11,849 (2.2%) | 12,820 (2.8%) |
| 10 to 14 Minutes | 22,624 (4.2%) | 24,794 (5.3%) |
| 15 to 19 Minutes | 32,222 (6.0%) | 31,822 (6.8%) |
| 20 to 24 Minutes | 43,143 (8.0%) | 39,514 (8.5%) |
| 25 to 29 Minutes | 20,554 (3.8%) | 16,496 (3.5%) |
| 30 to 34 Minutes | 91,329 (16.9%) | 70,879 (15.2%) |
| 35 to 39 Minutes | 17,116 (3.2%) | 15,588 (3.4%) |
| 40 to 44 Minutes | 38,419 (7.1%) | 32,118 (6.9%) |
| 45 to 59 Minutes | 90,708 (16.8%) | 77,019 (16.6%) |
| 60 to 89 Minutes | 120,798 (22.3%) | 97,133 (20.9%) |
| 90 or more Minutes | 46,264 (8.6%) | 42,618 (9.2%) |
Time of Departure to Work by Sex in Queens County
The most frequent times of departure to work in Queens County are 7:00 AM to 7:29 AM (94,136, 17.4%) for males and 8:00 AM to 8:29 AM (82,638, 17.8%) for females.
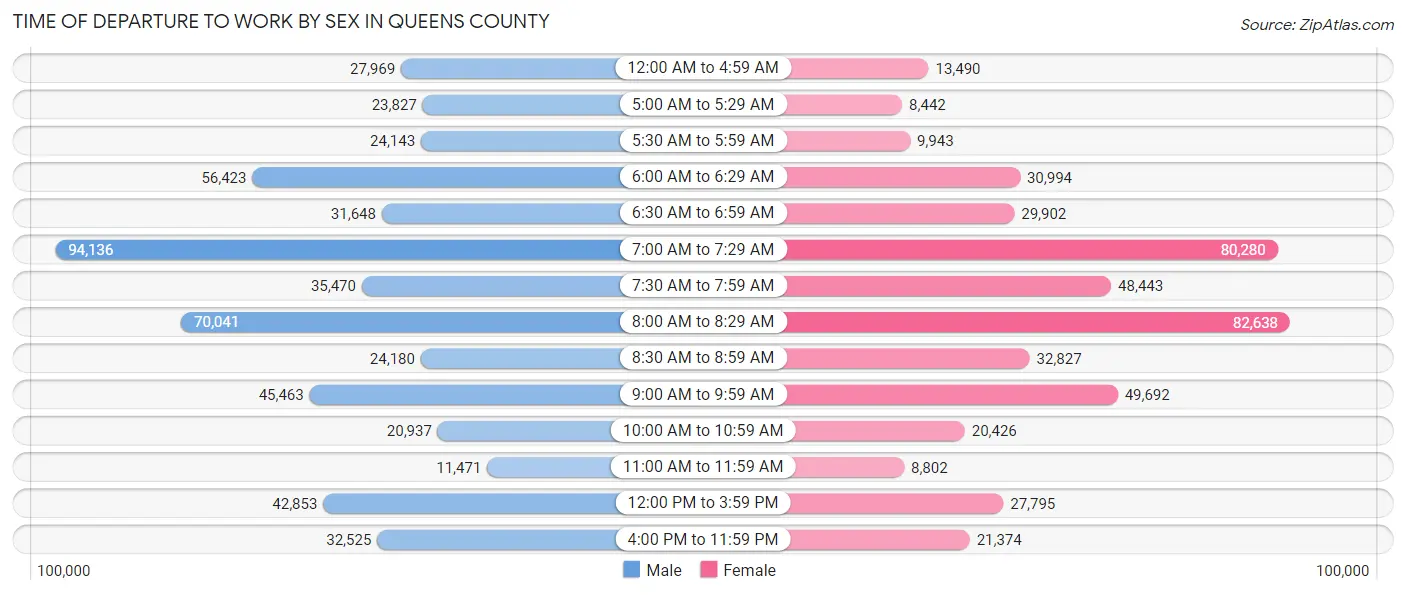
| Time of Departure | Male | Female |
| 12:00 AM to 4:59 AM | 27,969 (5.2%) | 13,490 (2.9%) |
| 5:00 AM to 5:29 AM | 23,827 (4.4%) | 8,442 (1.8%) |
| 5:30 AM to 5:59 AM | 24,143 (4.5%) | 9,943 (2.1%) |
| 6:00 AM to 6:29 AM | 56,423 (10.4%) | 30,994 (6.7%) |
| 6:30 AM to 6:59 AM | 31,648 (5.9%) | 29,902 (6.4%) |
| 7:00 AM to 7:29 AM | 94,136 (17.4%) | 80,280 (17.3%) |
| 7:30 AM to 7:59 AM | 35,470 (6.6%) | 48,443 (10.4%) |
| 8:00 AM to 8:29 AM | 70,041 (12.9%) | 82,638 (17.8%) |
| 8:30 AM to 8:59 AM | 24,180 (4.5%) | 32,827 (7.1%) |
| 9:00 AM to 9:59 AM | 45,463 (8.4%) | 49,692 (10.7%) |
| 10:00 AM to 10:59 AM | 20,937 (3.9%) | 20,426 (4.4%) |
| 11:00 AM to 11:59 AM | 11,471 (2.1%) | 8,802 (1.9%) |
| 12:00 PM to 3:59 PM | 42,853 (7.9%) | 27,795 (6.0%) |
| 4:00 PM to 11:59 PM | 32,525 (6.0%) | 21,374 (4.6%) |
| Total | 541,086 (100.0%) | 465,048 (100.0%) |
Housing Occupancy in Queens County
Occupancy by Ownership in Queens County
Of the total 816,859 dwellings in Queens County, owner-occupied units account for 369,150 (45.2%), while renter-occupied units make up 447,709 (54.8%).
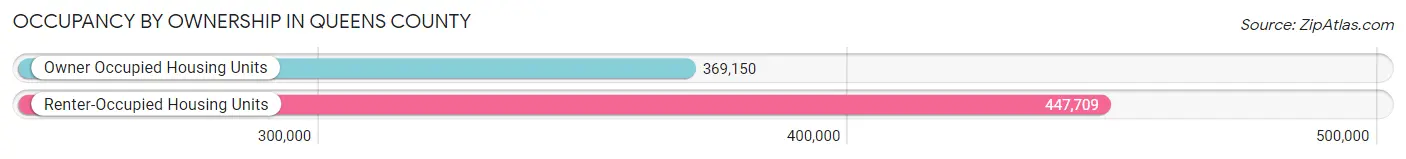
| Occupancy | # Housing Units | % Housing Units |
| Owner Occupied Housing Units | 369,150 | 45.2% |
| Renter-Occupied Housing Units | 447,709 | 54.8% |
| Total Occupied Housing Units | 816,859 | 100.0% |
Occupancy by Household Size in Queens County
| Household Size | # Housing Units | % Housing Units |
| 1-Person Household | 211,027 | 25.8% |
| 2-Person Household | 231,217 | 28.3% |
| 3-Person Household | 150,296 | 18.4% |
| 4+ Person Household | 224,319 | 27.5% |
| Total Housing Units | 816,859 | 100.0% |
Occupancy by Ownership by Household Size in Queens County
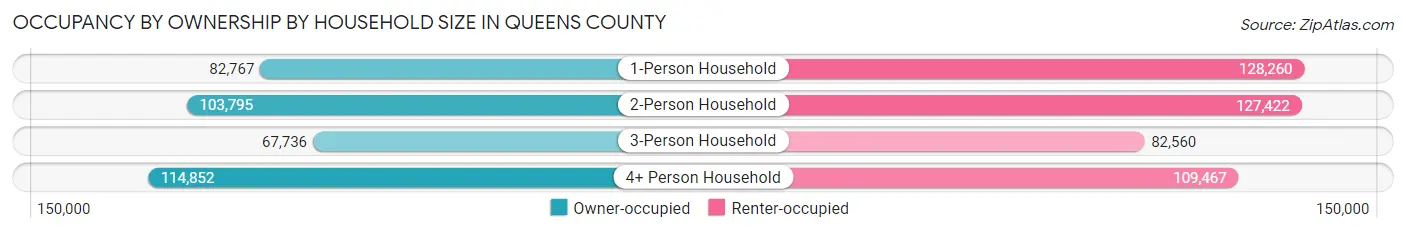
| Household Size | Owner-occupied | Renter-occupied |
| 1-Person Household | 82,767 (39.2%) | 128,260 (60.8%) |
| 2-Person Household | 103,795 (44.9%) | 127,422 (55.1%) |
| 3-Person Household | 67,736 (45.1%) | 82,560 (54.9%) |
| 4+ Person Household | 114,852 (51.2%) | 109,467 (48.8%) |
| Total Housing Units | 369,150 (45.2%) | 447,709 (54.8%) |
Occupancy by Educational Attainment in Queens County
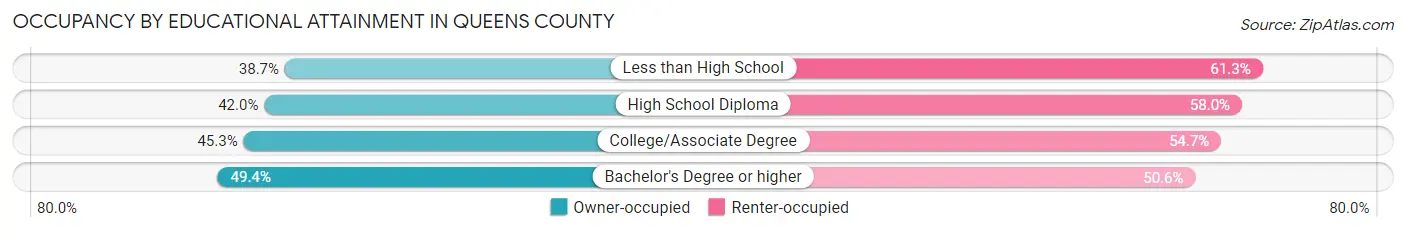
| Household Size | Owner-occupied | Renter-occupied |
| Less than High School | 43,791 (38.7%) | 69,297 (61.3%) |
| High School Diploma | 82,207 (42.0%) | 113,552 (58.0%) |
| College/Associate Degree | 85,122 (45.3%) | 102,870 (54.7%) |
| Bachelor's Degree or higher | 158,030 (49.4%) | 161,990 (50.6%) |
Occupancy by Age of Householder in Queens County
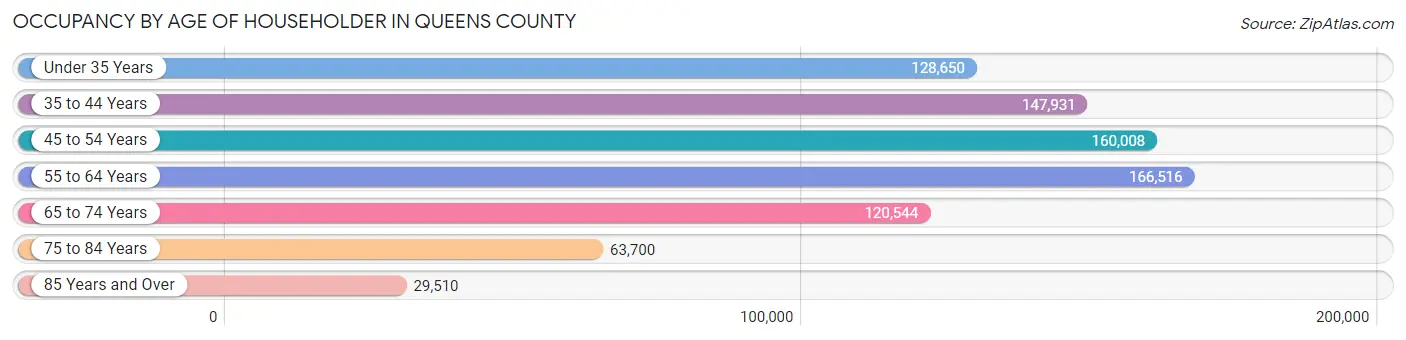
| Age Bracket | # Households | % Households |
| Under 35 Years | 128,650 | 15.8% |
| 35 to 44 Years | 147,931 | 18.1% |
| 45 to 54 Years | 160,008 | 19.6% |
| 55 to 64 Years | 166,516 | 20.4% |
| 65 to 74 Years | 120,544 | 14.8% |
| 75 to 84 Years | 63,700 | 7.8% |
| 85 Years and Over | 29,510 | 3.6% |
| Total | 816,859 | 100.0% |
Housing Finances in Queens County
Median Income by Occupancy in Queens County
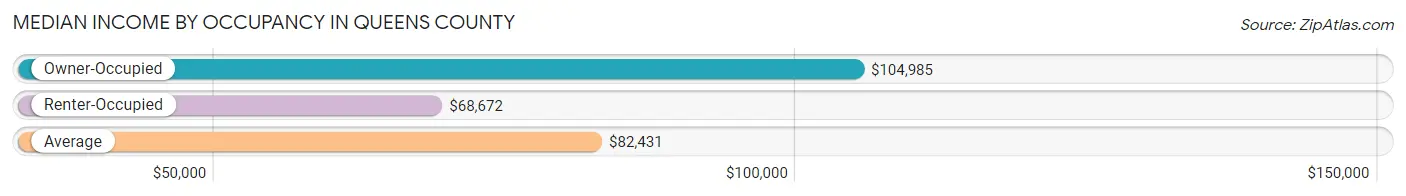
| Occupancy Type | # Households | Median Income |
| Owner-Occupied | 369,150 (45.2%) | $104,985 |
| Renter-Occupied | 447,709 (54.8%) | $68,672 |
| Average | 816,859 (100.0%) | $82,431 |
Occupancy by Householder Income Bracket in Queens County
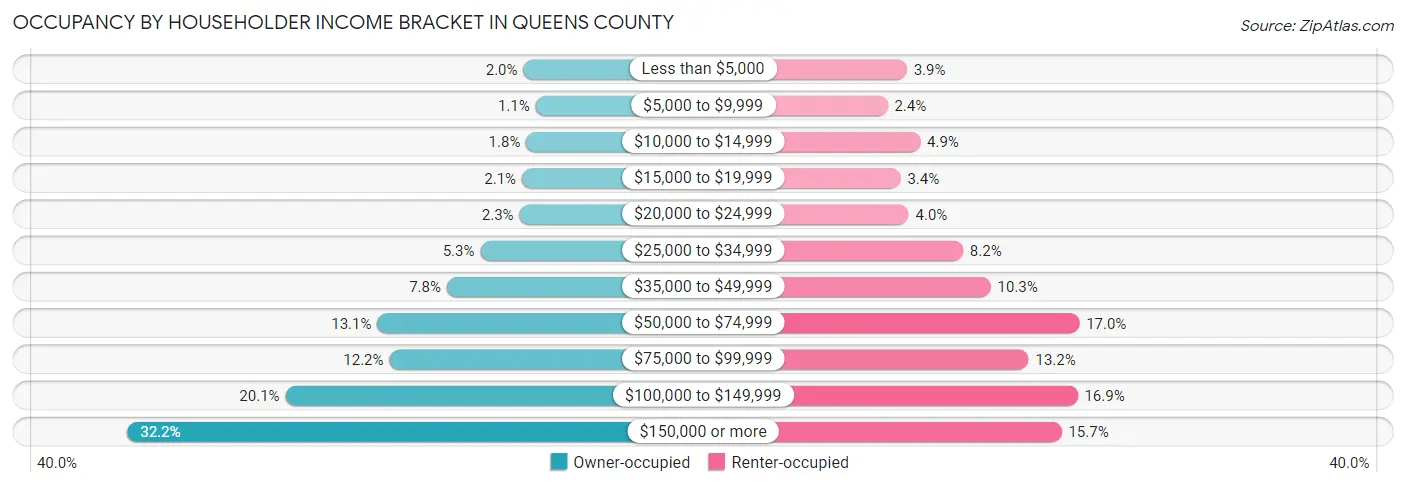
| Income Bracket | Owner-occupied | Renter-occupied |
| Less than $5,000 | 7,372 (2.0%) | 17,455 (3.9%) |
| $5,000 to $9,999 | 3,965 (1.1%) | 10,884 (2.4%) |
| $10,000 to $14,999 | 6,557 (1.8%) | 22,043 (4.9%) |
| $15,000 to $19,999 | 7,786 (2.1%) | 15,323 (3.4%) |
| $20,000 to $24,999 | 8,472 (2.3%) | 18,086 (4.0%) |
| $25,000 to $34,999 | 19,479 (5.3%) | 36,606 (8.2%) |
| $35,000 to $49,999 | 28,919 (7.8%) | 46,074 (10.3%) |
| $50,000 to $74,999 | 48,481 (13.1%) | 76,282 (17.0%) |
| $75,000 to $99,999 | 45,057 (12.2%) | 59,030 (13.2%) |
| $100,000 to $149,999 | 74,295 (20.1%) | 75,694 (16.9%) |
| $150,000 or more | 118,767 (32.2%) | 70,232 (15.7%) |
| Total | 369,150 (100.0%) | 447,709 (100.0%) |
Monthly Housing Cost Tiers in Queens County
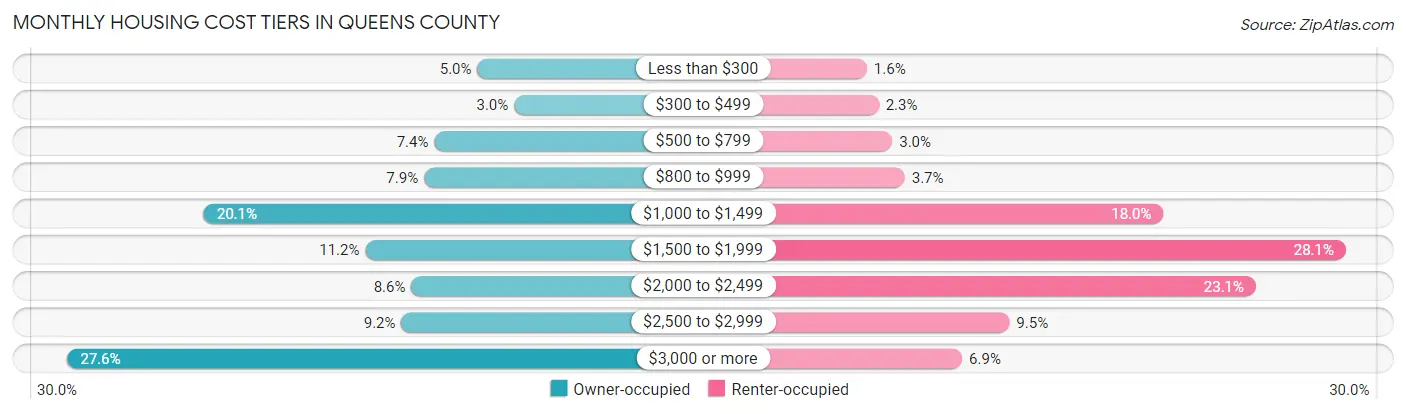
| Monthly Cost | Owner-occupied | Renter-occupied |
| Less than $300 | 18,435 (5.0%) | 7,276 (1.6%) |
| $300 to $499 | 10,917 (3.0%) | 10,193 (2.3%) |
| $500 to $799 | 27,206 (7.4%) | 13,571 (3.0%) |
| $800 to $999 | 29,297 (7.9%) | 16,641 (3.7%) |
| $1,000 to $1,499 | 74,204 (20.1%) | 80,573 (18.0%) |
| $1,500 to $1,999 | 41,254 (11.2%) | 125,702 (28.1%) |
| $2,000 to $2,499 | 31,889 (8.6%) | 103,459 (23.1%) |
| $2,500 to $2,999 | 33,930 (9.2%) | 42,532 (9.5%) |
| $3,000 or more | 102,018 (27.6%) | 30,869 (6.9%) |
| Total | 369,150 (100.0%) | 447,709 (100.0%) |
Physical Housing Characteristics in Queens County
Housing Structures in Queens County
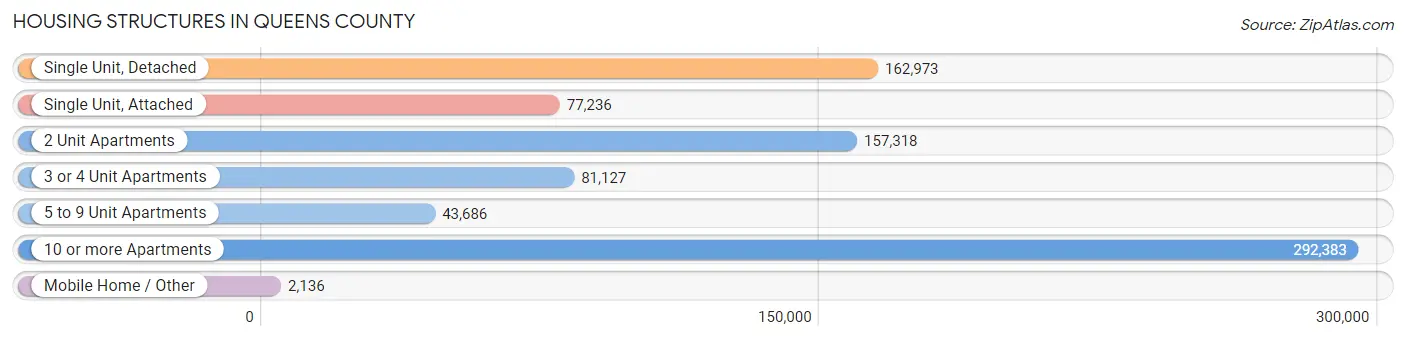
| Structure Type | # Housing Units | % Housing Units |
| Single Unit, Detached | 162,973 | 20.0% |
| Single Unit, Attached | 77,236 | 9.5% |
| 2 Unit Apartments | 157,318 | 19.3% |
| 3 or 4 Unit Apartments | 81,127 | 9.9% |
| 5 to 9 Unit Apartments | 43,686 | 5.3% |
| 10 or more Apartments | 292,383 | 35.8% |
| Mobile Home / Other | 2,136 | 0.3% |
| Total | 816,859 | 100.0% |
Housing Structures by Occupancy in Queens County
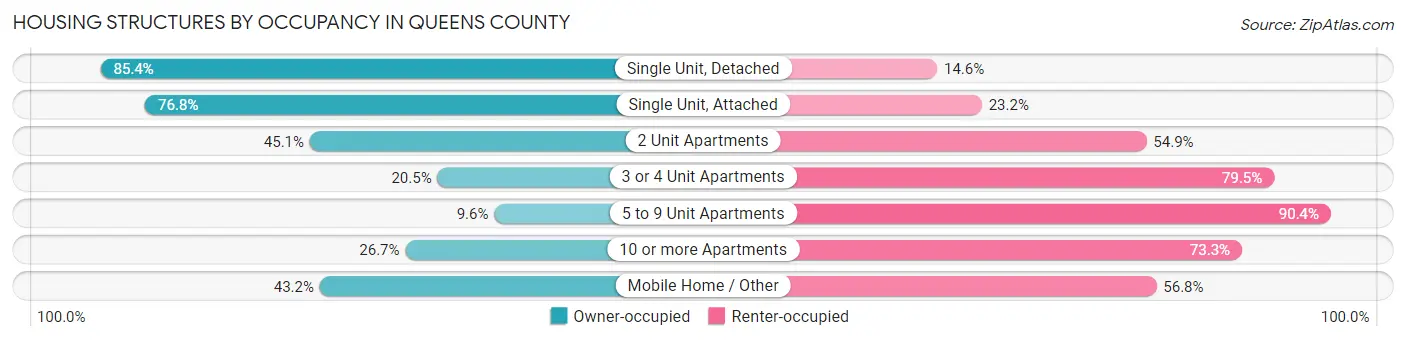
| Structure Type | Owner-occupied | Renter-occupied |
| Single Unit, Detached | 139,170 (85.4%) | 23,803 (14.6%) |
| Single Unit, Attached | 59,307 (76.8%) | 17,929 (23.2%) |
| 2 Unit Apartments | 70,914 (45.1%) | 86,404 (54.9%) |
| 3 or 4 Unit Apartments | 16,632 (20.5%) | 64,495 (79.5%) |
| 5 to 9 Unit Apartments | 4,180 (9.6%) | 39,506 (90.4%) |
| 10 or more Apartments | 78,025 (26.7%) | 214,358 (73.3%) |
| Mobile Home / Other | 922 (43.2%) | 1,214 (56.8%) |
| Total | 369,150 (45.2%) | 447,709 (54.8%) |
Housing Structures by Number of Rooms in Queens County
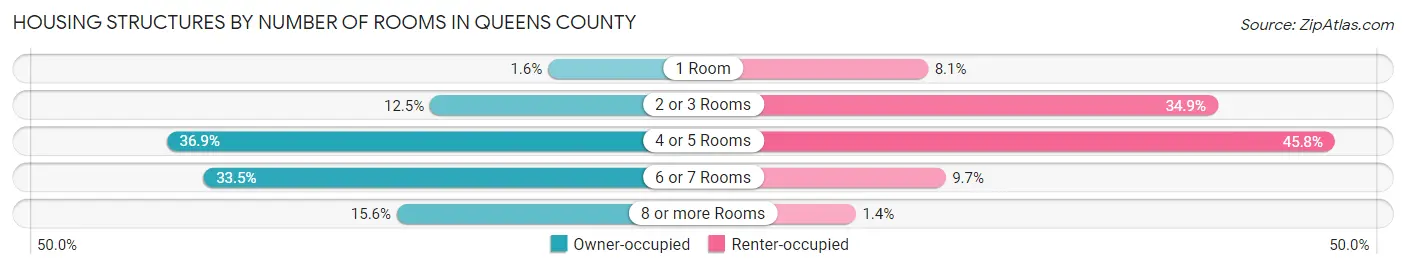
| Number of Rooms | Owner-occupied | Renter-occupied |
| 1 Room | 5,863 (1.6%) | 36,337 (8.1%) |
| 2 or 3 Rooms | 46,136 (12.5%) | 156,408 (34.9%) |
| 4 or 5 Rooms | 136,108 (36.9%) | 204,905 (45.8%) |
| 6 or 7 Rooms | 123,580 (33.5%) | 43,618 (9.7%) |
| 8 or more Rooms | 57,463 (15.6%) | 6,441 (1.4%) |
| Total | 369,150 (100.0%) | 447,709 (100.0%) |
Housing Structure by Heating Type in Queens County
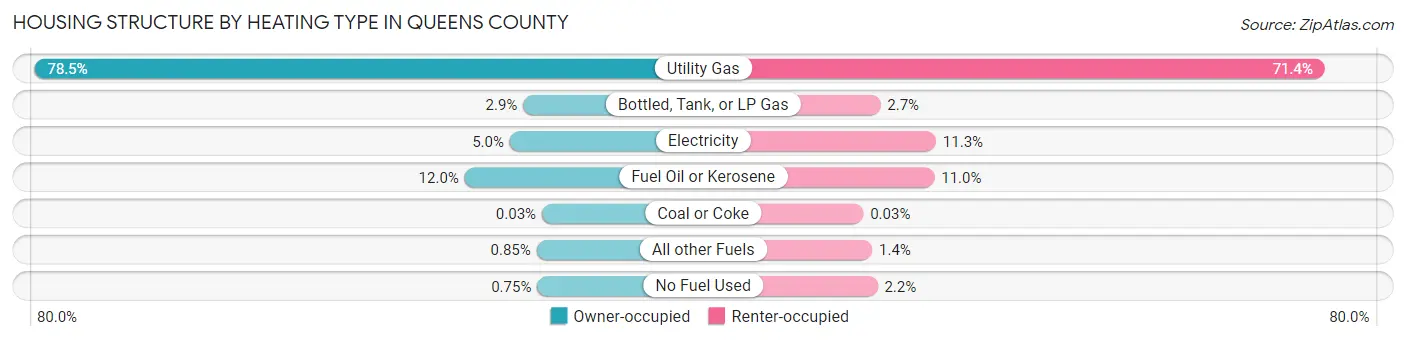
| Heating Type | Owner-occupied | Renter-occupied |
| Utility Gas | 289,728 (78.5%) | 319,546 (71.4%) |
| Bottled, Tank, or LP Gas | 10,787 (2.9%) | 12,009 (2.7%) |
| Electricity | 18,405 (5.0%) | 50,428 (11.3%) |
| Fuel Oil or Kerosene | 44,199 (12.0%) | 49,315 (11.0%) |
| Coal or Coke | 109 (0.0%) | 147 (0.0%) |
| All other Fuels | 3,147 (0.9%) | 6,259 (1.4%) |
| No Fuel Used | 2,775 (0.7%) | 10,005 (2.2%) |
| Total | 369,150 (100.0%) | 447,709 (100.0%) |
Household Vehicle Usage in Queens County
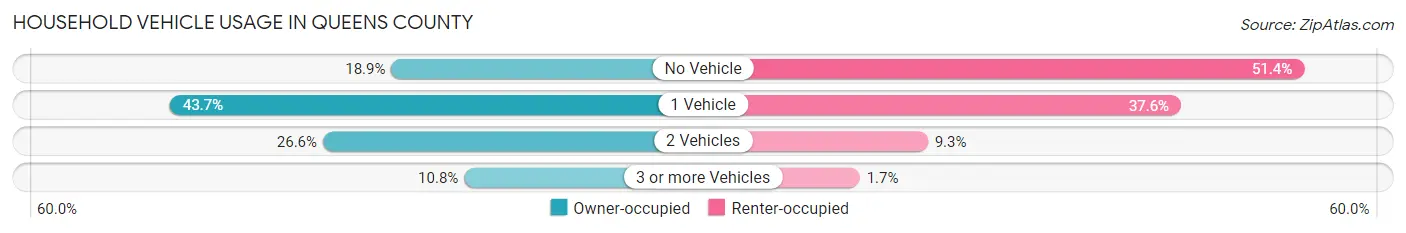
| Vehicles per Household | Owner-occupied | Renter-occupied |
| No Vehicle | 69,848 (18.9%) | 230,264 (51.4%) |
| 1 Vehicle | 161,421 (43.7%) | 168,499 (37.6%) |
| 2 Vehicles | 98,151 (26.6%) | 41,514 (9.3%) |
| 3 or more Vehicles | 39,730 (10.8%) | 7,432 (1.7%) |
| Total | 369,150 (100.0%) | 447,709 (100.0%) |
Real Estate & Mortgages in Queens County
Real Estate and Mortgage Overview in Queens County
| Characteristic | Without Mortgage | With Mortgage |
| Housing Units | 164,661 | 204,489 |
| Median Property Value | $657,700 | $689,600 |
| Median Household Income | $81,794 | $79,337 |
| Monthly Housing Costs | $1,042 | $100,749 |
| Real Estate Taxes | $5,982 | $19,304 |
Property Value by Mortgage Status in Queens County
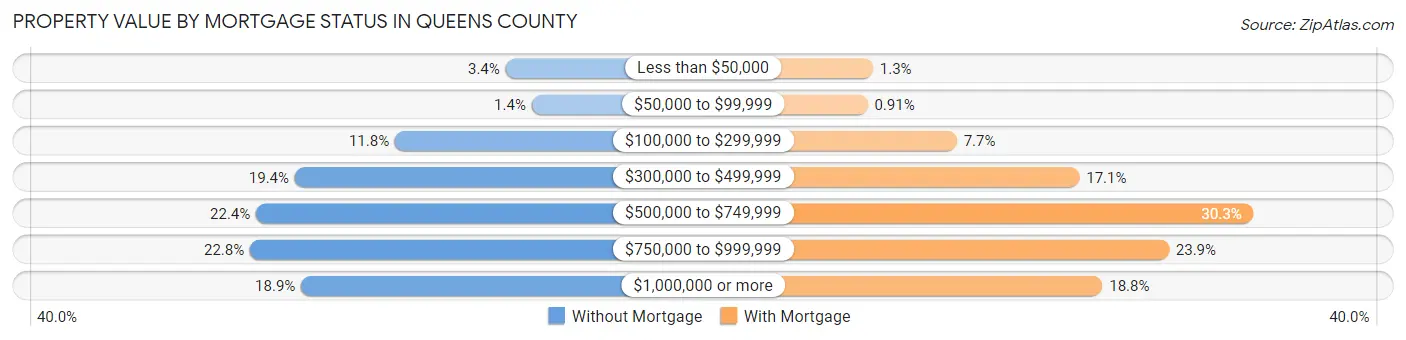
| Property Value | Without Mortgage | With Mortgage |
| Less than $50,000 | 5,517 (3.4%) | 2,698 (1.3%) |
| $50,000 to $99,999 | 2,232 (1.4%) | 1,867 (0.9%) |
| $100,000 to $299,999 | 19,398 (11.8%) | 15,775 (7.7%) |
| $300,000 to $499,999 | 31,956 (19.4%) | 34,873 (17.1%) |
| $500,000 to $749,999 | 36,821 (22.4%) | 62,021 (30.3%) |
| $750,000 to $999,999 | 37,569 (22.8%) | 48,802 (23.9%) |
| $1,000,000 or more | 31,168 (18.9%) | 38,453 (18.8%) |
| Total | 164,661 (100.0%) | 204,489 (100.0%) |
Household Income by Mortgage Status in Queens County
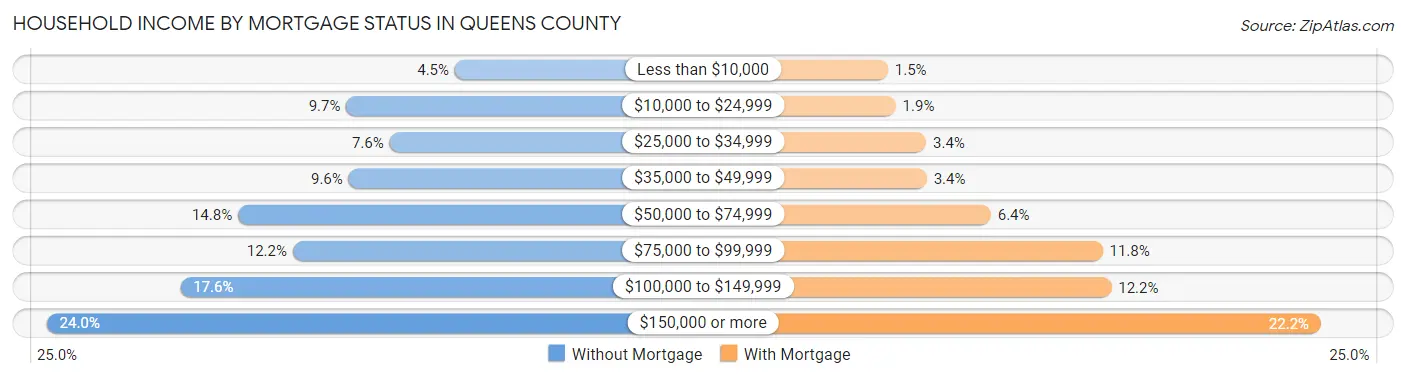
| Household Income | Without Mortgage | With Mortgage |
| Less than $10,000 | 7,432 (4.5%) | 3,141 (1.5%) |
| $10,000 to $24,999 | 15,941 (9.7%) | 3,905 (1.9%) |
| $25,000 to $34,999 | 12,553 (7.6%) | 6,874 (3.4%) |
| $35,000 to $49,999 | 15,758 (9.6%) | 6,926 (3.4%) |
| $50,000 to $74,999 | 24,433 (14.8%) | 13,161 (6.4%) |
| $75,000 to $99,999 | 20,143 (12.2%) | 24,048 (11.8%) |
| $100,000 to $149,999 | 28,971 (17.6%) | 24,914 (12.2%) |
| $150,000 or more | 39,430 (23.9%) | 45,324 (22.2%) |
| Total | 164,661 (100.0%) | 204,489 (100.0%) |
Property Value to Household Income Ratio in Queens County
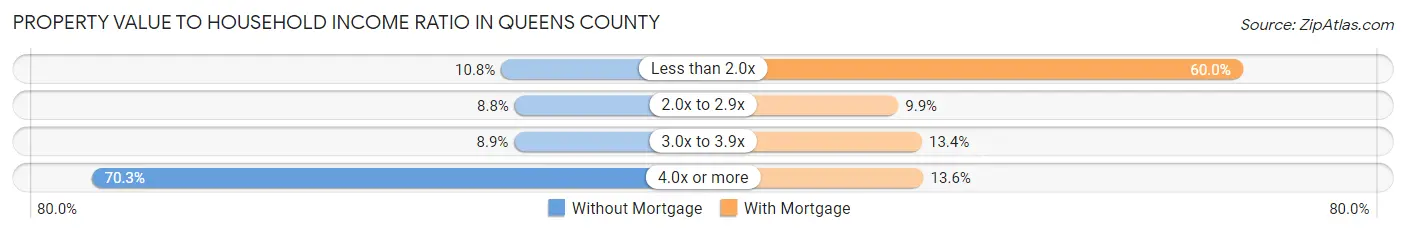
| Value-to-Income Ratio | Without Mortgage | With Mortgage |
| Less than 2.0x | 17,741 (10.8%) | 122,598 (60.0%) |
| 2.0x to 2.9x | 14,491 (8.8%) | 20,329 (9.9%) |
| 3.0x to 3.9x | 14,606 (8.9%) | 27,365 (13.4%) |
| 4.0x or more | 115,686 (70.3%) | 27,853 (13.6%) |
| Total | 164,661 (100.0%) | 204,489 (100.0%) |
Real Estate Taxes by Mortgage Status in Queens County
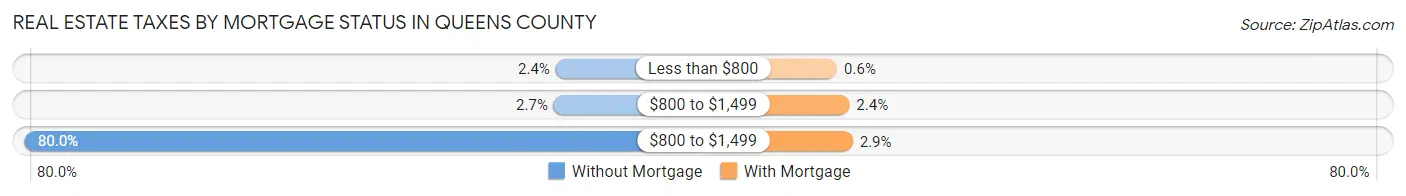
| Property Taxes | Without Mortgage | With Mortgage |
| Less than $800 | 3,949 (2.4%) | 1,224 (0.6%) |
| $800 to $1,499 | 4,414 (2.7%) | 4,880 (2.4%) |
| $800 to $1,499 | 131,653 (79.9%) | 5,896 (2.9%) |
| Total | 164,661 (100.0%) | 204,489 (100.0%) |
Health & Disability in Queens County
Health Insurance Coverage by Age in Queens County
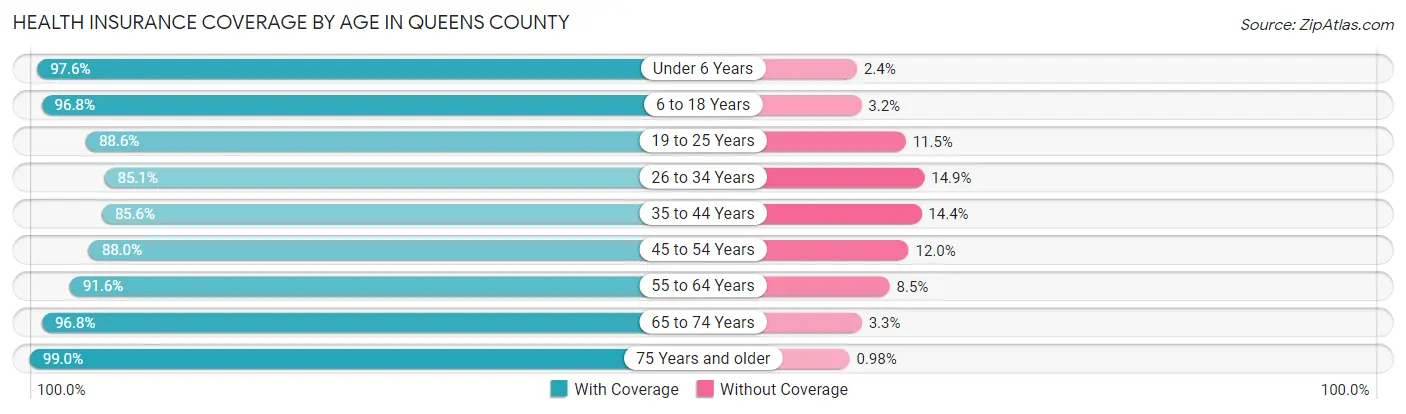
| Age Bracket | With Coverage | Without Coverage |
| Under 6 Years | 158,553 (97.6%) | 3,840 (2.4%) |
| 6 to 18 Years | 320,825 (96.8%) | 10,532 (3.2%) |
| 19 to 25 Years | 169,093 (88.5%) | 21,857 (11.5%) |
| 26 to 34 Years | 280,787 (85.1%) | 49,253 (14.9%) |
| 35 to 44 Years | 276,887 (85.6%) | 46,505 (14.4%) |
| 45 to 54 Years | 275,989 (88.0%) | 37,557 (12.0%) |
| 55 to 64 Years | 288,901 (91.5%) | 26,670 (8.5%) |
| 65 to 74 Years | 215,043 (96.8%) | 7,219 (3.3%) |
| 75 Years and older | 156,170 (99.0%) | 1,551 (1.0%) |
| Total | 2,142,248 (91.3%) | 204,984 (8.7%) |
Health Insurance Coverage by Citizenship Status in Queens County
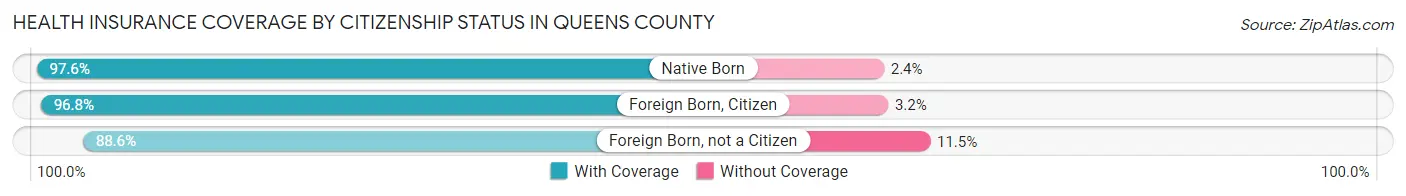
| Citizenship Status | With Coverage | Without Coverage |
| Native Born | 158,553 (97.6%) | 3,840 (2.4%) |
| Foreign Born, Citizen | 320,825 (96.8%) | 10,532 (3.2%) |
| Foreign Born, not a Citizen | 169,093 (88.5%) | 21,857 (11.5%) |
Health Insurance Coverage by Household Income in Queens County
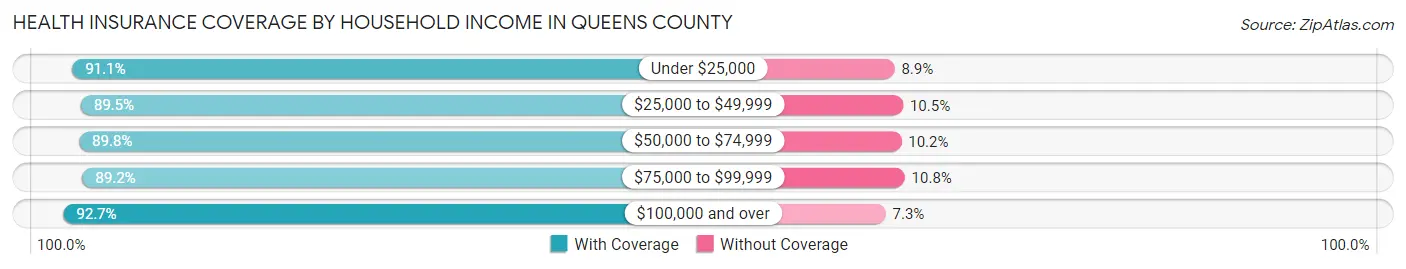
| Household Income | With Coverage | Without Coverage |
| Under $25,000 | 197,516 (91.1%) | 19,359 (8.9%) |
| $25,000 to $49,999 | 283,835 (89.5%) | 33,420 (10.5%) |
| $50,000 to $74,999 | 298,179 (89.8%) | 33,912 (10.2%) |
| $75,000 to $99,999 | 262,749 (89.2%) | 31,947 (10.8%) |
| $100,000 and over | 1,082,383 (92.7%) | 84,848 (7.3%) |
Public vs Private Health Insurance Coverage by Age in Queens County
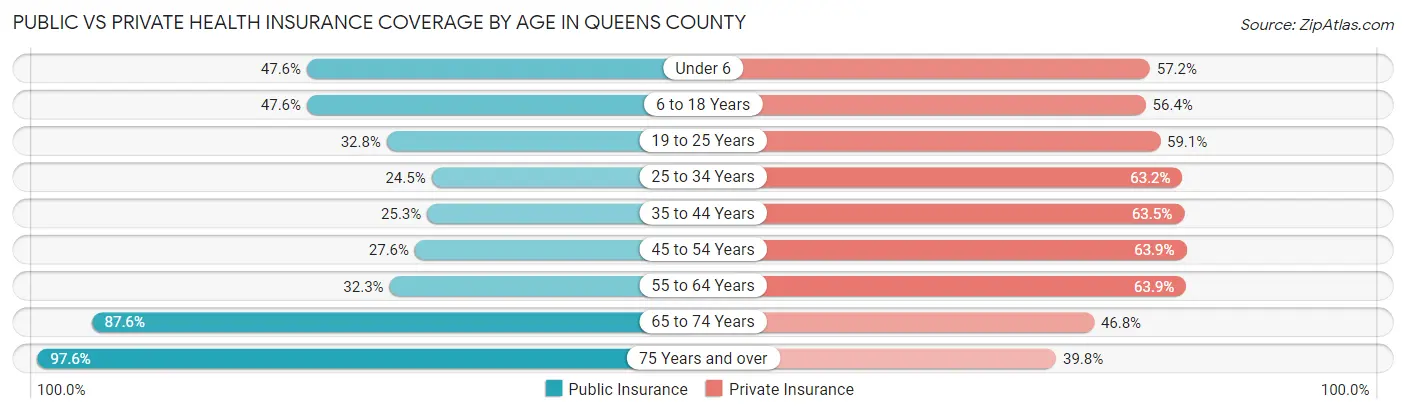
| Age Bracket | Public Insurance | Private Insurance |
| Under 6 | 77,322 (47.6%) | 92,845 (57.2%) |
| 6 to 18 Years | 157,755 (47.6%) | 186,878 (56.4%) |
| 19 to 25 Years | 62,608 (32.8%) | 112,800 (59.1%) |
| 25 to 34 Years | 80,786 (24.5%) | 208,611 (63.2%) |
| 35 to 44 Years | 81,794 (25.3%) | 205,383 (63.5%) |
| 45 to 54 Years | 86,425 (27.6%) | 200,493 (63.9%) |
| 55 to 64 Years | 101,910 (32.3%) | 201,691 (63.9%) |
| 65 to 74 Years | 194,612 (87.6%) | 104,025 (46.8%) |
| 75 Years and over | 153,962 (97.6%) | 62,721 (39.8%) |
| Total | 997,174 (42.5%) | 1,375,447 (58.6%) |
Disability Status by Sex by Age in Queens County
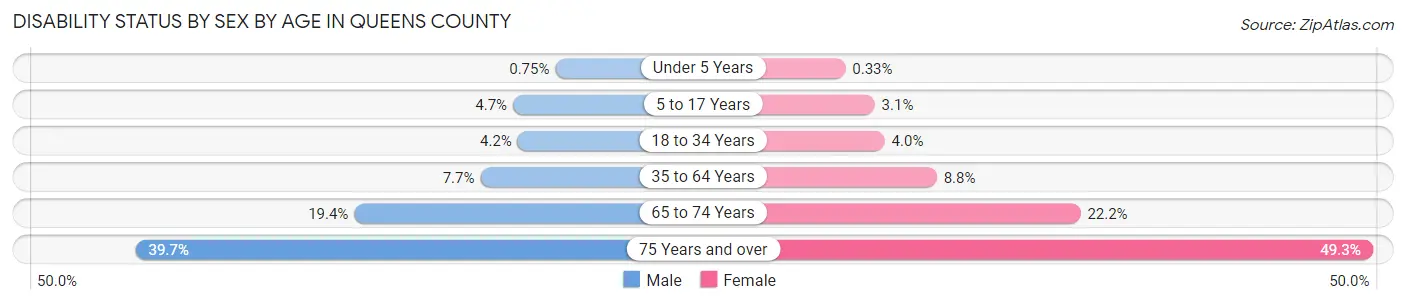
| Age Bracket | Male | Female |
| Under 5 Years | 529 (0.7%) | 218 (0.3%) |
| 5 to 17 Years | 8,007 (4.7%) | 4,936 (3.0%) |
| 18 to 34 Years | 11,592 (4.2%) | 10,805 (4.0%) |
| 35 to 64 Years | 36,313 (7.7%) | 42,414 (8.8%) |
| 65 to 74 Years | 19,642 (19.4%) | 26,814 (22.2%) |
| 75 Years and over | 24,359 (39.7%) | 47,455 (49.2%) |
Disability Class by Sex by Age in Queens County
Disability Class: Hearing Difficulty
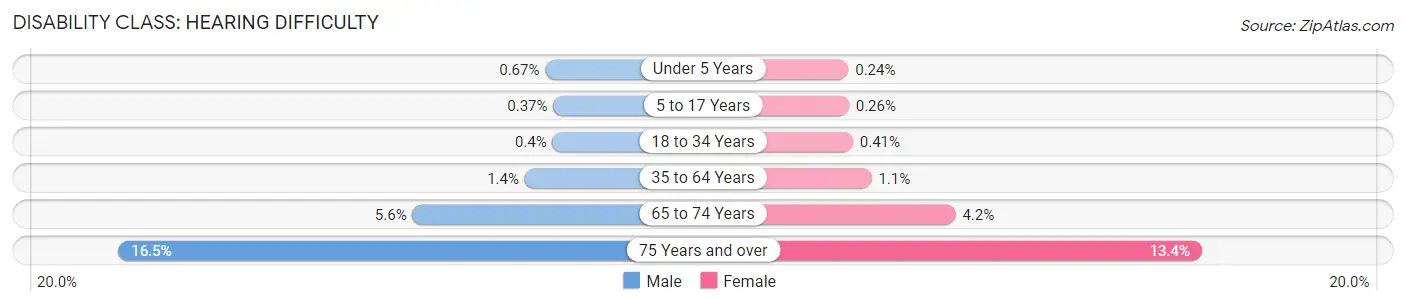
| Age Bracket | Male | Female |
| Under 5 Years | 469 (0.7%) | 158 (0.2%) |
| 5 to 17 Years | 628 (0.4%) | 413 (0.3%) |
| 18 to 34 Years | 1,106 (0.4%) | 1,111 (0.4%) |
| 35 to 64 Years | 6,743 (1.4%) | 5,291 (1.1%) |
| 65 to 74 Years | 5,666 (5.6%) | 5,106 (4.2%) |
| 75 Years and over | 10,139 (16.5%) | 12,869 (13.4%) |
Disability Class: Vision Difficulty
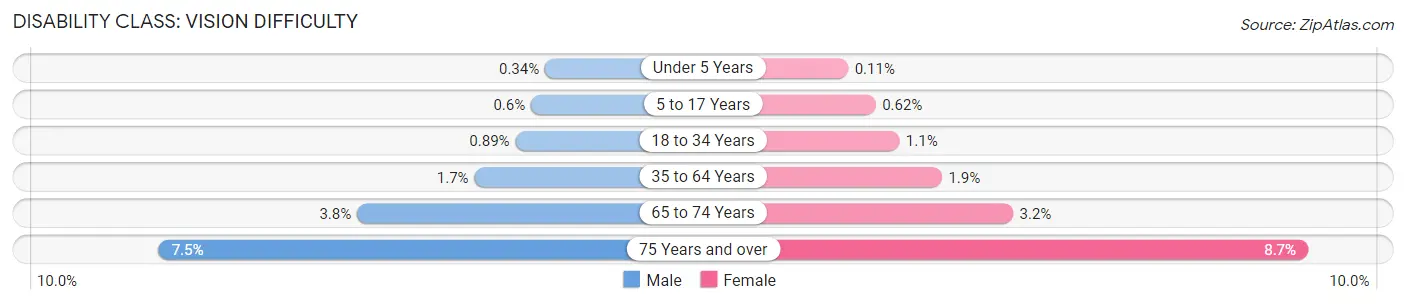
| Age Bracket | Male | Female |
| Under 5 Years | 241 (0.3%) | 72 (0.1%) |
| 5 to 17 Years | 1,033 (0.6%) | 995 (0.6%) |
| 18 to 34 Years | 2,447 (0.9%) | 2,887 (1.1%) |
| 35 to 64 Years | 7,755 (1.7%) | 8,898 (1.8%) |
| 65 to 74 Years | 3,878 (3.8%) | 3,834 (3.2%) |
| 75 Years and over | 4,611 (7.5%) | 8,331 (8.6%) |
Disability Class: Cognitive Difficulty
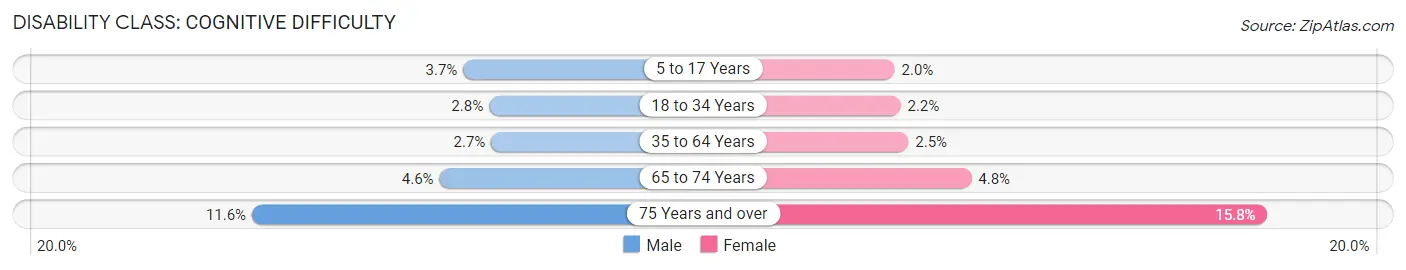
| Age Bracket | Male | Female |
| 5 to 17 Years | 6,359 (3.7%) | 3,171 (2.0%) |
| 18 to 34 Years | 7,557 (2.8%) | 5,915 (2.2%) |
| 35 to 64 Years | 12,615 (2.7%) | 11,886 (2.5%) |
| 65 to 74 Years | 4,657 (4.6%) | 5,821 (4.8%) |
| 75 Years and over | 7,093 (11.6%) | 15,222 (15.8%) |
Disability Class: Ambulatory Difficulty
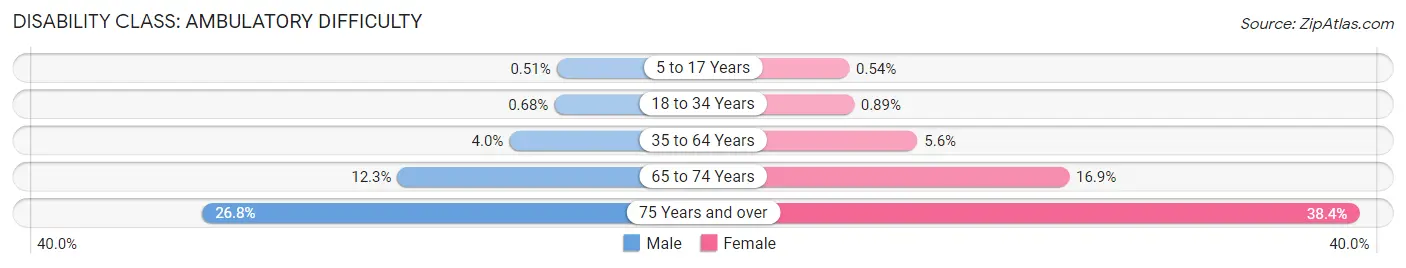
| Age Bracket | Male | Female |
| 5 to 17 Years | 880 (0.5%) | 874 (0.5%) |
| 18 to 34 Years | 1,870 (0.7%) | 2,412 (0.9%) |
| 35 to 64 Years | 18,940 (4.0%) | 26,979 (5.6%) |
| 65 to 74 Years | 12,476 (12.3%) | 20,416 (16.9%) |
| 75 Years and over | 16,449 (26.8%) | 37,007 (38.4%) |
Disability Class: Self-Care Difficulty
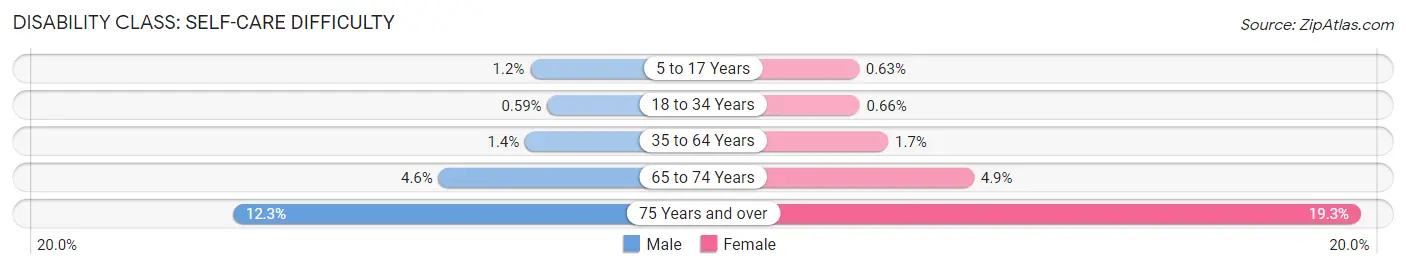
| Age Bracket | Male | Female |
| 5 to 17 Years | 2,103 (1.2%) | 1,025 (0.6%) |
| 18 to 34 Years | 1,616 (0.6%) | 1,796 (0.7%) |
| 35 to 64 Years | 6,689 (1.4%) | 8,274 (1.7%) |
| 65 to 74 Years | 4,687 (4.6%) | 5,933 (4.9%) |
| 75 Years and over | 7,530 (12.3%) | 18,568 (19.3%) |
Technology Access in Queens County
Computing Device Access in Queens County
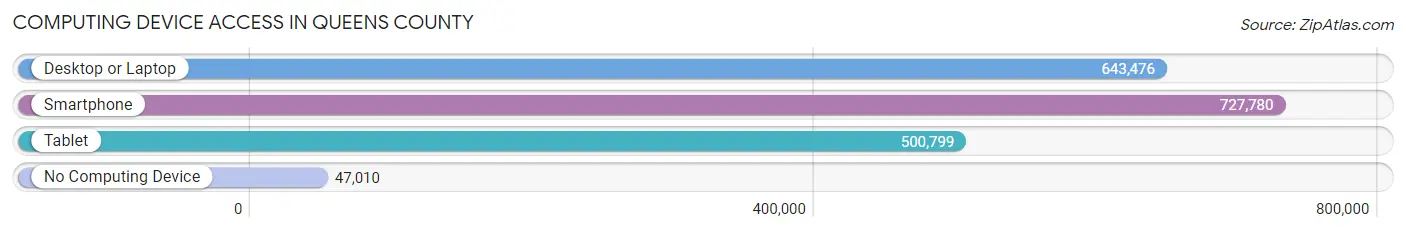
| Device Type | # Households | % Households |
| Desktop or Laptop | 643,476 | 78.8% |
| Smartphone | 727,780 | 89.1% |
| Tablet | 500,799 | 61.3% |
| No Computing Device | 47,010 | 5.8% |
| Total | 816,859 | 100.0% |
Internet Access in Queens County
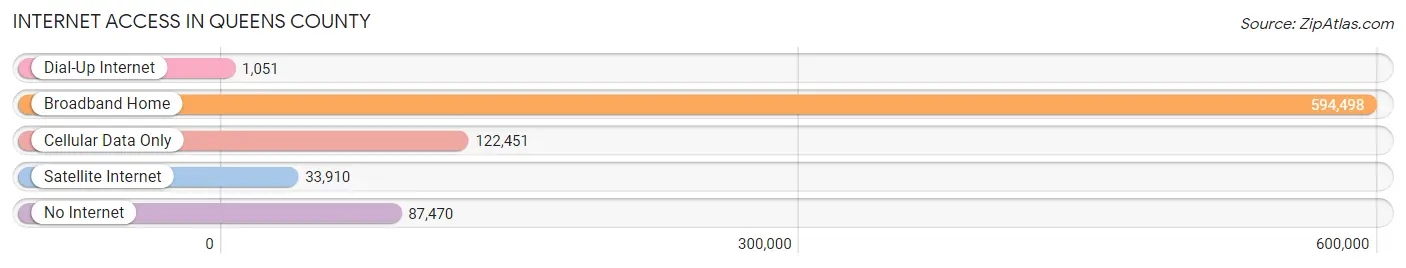
| Internet Type | # Households | % Households |
| Dial-Up Internet | 1,051 | 0.1% |
| Broadband Home | 594,498 | 72.8% |
| Cellular Data Only | 122,451 | 15.0% |
| Satellite Internet | 33,910 | 4.2% |
| No Internet | 87,470 | 10.7% |
| Total | 816,859 | 100.0% |
Queens County Summary
Queens County, NY is located in the southeastern part of the state of New York and is the largest of the five boroughs of New York City. It is bordered by the East River and Long Island Sound to the north, Nassau County to the east, Brooklyn to the west, and the Atlantic Ocean to the south. Queens County is home to over 2.3 million people, making it the second most populous county in the state of New York.
History
The area that is now Queens County was originally inhabited by the Lenape Native Americans. The Dutch began to settle the area in the 1630s, and the area was named New Netherland. In 1683, the British took control of the area and renamed it Queens County, after Queen Catherine of Braganza. The county was part of the original 12 counties of New York State, and was one of the original five boroughs of New York City when it was established in 1898.
Geography
Queens County covers an area of 109 square miles and is the second largest borough in New York City. It is located on the western end of Long Island and is bordered by the East River and Long Island Sound to the north, Nassau County to the east, Brooklyn to the west, and the Atlantic Ocean to the south. The county is divided into 14 neighborhoods, including Astoria, Flushing, Jamaica, Long Island City, and Woodside.
Economy
Queens County has a diverse economy, with a mix of manufacturing, retail, and service industries. The county is home to the second largest airport in the United States, John F. Kennedy International Airport, which is a major hub for international travel. The county is also home to the Queens Center Mall, one of the largest shopping malls in the country. Other major employers in the county include the New York City Department of Education, the New York City Police Department, and the New York City Fire Department.
Demographics
As of the 2010 census, Queens County had a population of 2,230,722 people. The population was spread out, with 24.3% under the age of 18, 10.3% from 18 to 24, 32.3% from 25 to 44, 22.5% from 45 to 64, and 10.6% who were 65 years of age or older. The median age was 36.5 years. The racial makeup of the county was 44.3% White, 25.3% African American, 0.5% Native American, 11.7% Asian, 0.1% Pacific Islander, 15.2% from other races, and 3.0% from two or more races. Hispanic or Latino of any race were 28.3% of the population.
The median household income in Queens County was $55,856, and the median family income was $63,856. The per capita income for the county was $27,868. About 15.3% of the population was below the poverty line.
Overall, Queens County is a diverse and vibrant county with a rich history and a strong economy. It is home to a variety of cultures and ethnicities, and is a major hub for international travel. The county is a great place to live, work, and visit.
Common Questions
What is Per Capita Income in Queens County?
Per Capita income in Queens County is $39,201.
What is the Median Family Income in Queens County?
Median Family Income in Queens County is $92,848.
What is the Median Household income in Queens County?
Median Household Income in Queens County is $82,431.
What is Income or Wage Gap in Queens County?
Income or Wage Gap in Queens County is 13.3%.
Women in Queens County earn 86.7 cents for every dollar earned by a man.
What is Family Income Deficit in Queens County?
Family Income Deficit in Queens County is $9,943.
Families that are below poverty line in Queens County earn $9,943 less on average than the poverty threshold level.
What is Inequality or Gini Index in Queens County?
Inequality or Gini Index in Queens County is 0.46.
What is the Total Population of Queens County?
Total Population of Queens County is 2,360,826.
What is the Total Male Population of Queens County?
Total Male Population of Queens County is 1,155,898.
What is the Total Female Population of Queens County?
Total Female Population of Queens County is 1,204,928.
What is the Ratio of Males per 100 Females in Queens County?
There are 95.93 Males per 100 Females in Queens County.
What is the Ratio of Females per 100 Males in Queens County?
There are 104.24 Females per 100 Males in Queens County.
What is the Median Population Age in Queens County?
Median Population Age in Queens County is 39.9 Years.
What is the Average Family Size in Queens County
Average Family Size in Queens County is 3.5 People.
What is the Average Household Size in Queens County
Average Household Size in Queens County is 2.9 People.
How Large is the Labor Force in Queens County?
There are 1,237,639 People in the Labor Forcein in Queens County.
What is the Percentage of People in the Labor Force in Queens County?
63.7% of People are in the Labor Force in Queens County.
What is the Unemployment Rate in Queens County?
Unemployment Rate in Queens County is 7.0%.