Area Code 516 Map & Demographics
Area Code 516 Map
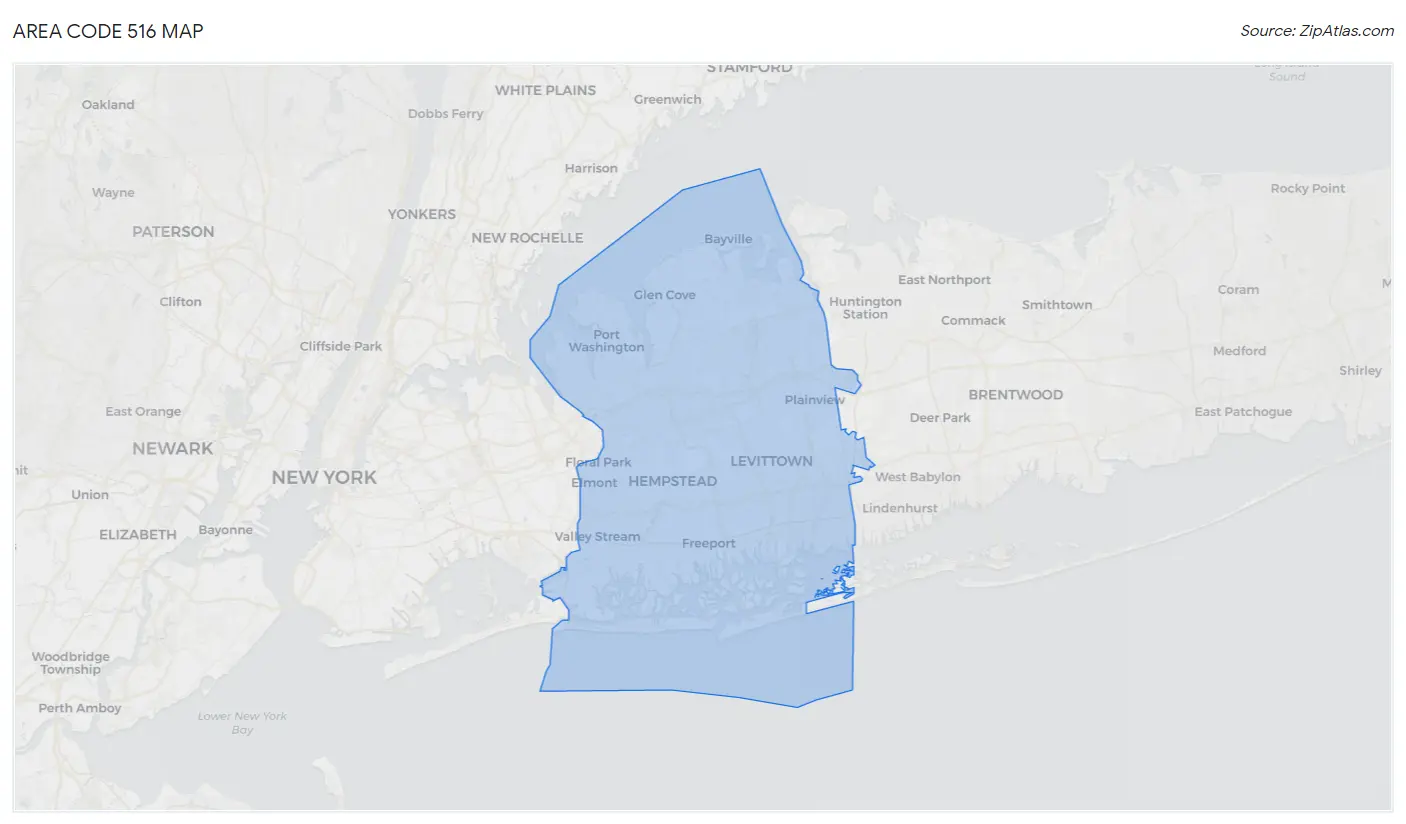
Area Code 516 Overview
$62,206
PER CAPITA INCOME
$162,858
AVG FAMILY INCOME
$141,302
AVG HOUSEHOLD INCOME
32.6%
WAGE / INCOME GAP [ % ]
67.4¢/ $1
WAGE / INCOME GAP [ $ ]
$11,043
FAMILY INCOME DEFICIT
40.13
INEQUALITY / GINI INDEX
2,130,132
TOTAL POPULATION
1,043,512
MALE POPULATION
1,086,620
FEMALE POPULATION
96.03
MALES / 100 FEMALES
104.13
FEMALES / 100 MALES
42.2
MEDIAN AGE
3.5
AVG FAMILY SIZE
3.0
AVG HOUSEHOLD SIZE
1,109,208
LABOR FORCE [ PEOPLE ]
64.2%
PERCENT IN LABOR FORCE
4.8%
UNEMPLOYMENT RATE
Income in Area Code 516
Income Overview in Area Code 516
Per Capita Income in Area Code 516 is $62,206, while median incomes of families and households are $162,858 and $141,302 respectively.
| Characteristic | Number | Measure |
| Per Capita Income | 2,130,132 | $62,206 |
| Median Family Income | 521,412 | $162,858 |
| Mean Family Income | 521,412 | $19,321,392 |
| Median Household Income | 690,356 | $141,302 |
| Mean Household Income | 690,356 | $17,152,466 |
| Income Deficit | 521,412 | $11,043 |
| Wage / Income Gap (%) | 2,130,132 | 32.63% |
| Wage / Income Gap ($) | 2,130,132 | 67.37¢ per $1 |
| Gini / Inequality Index | 2,130,132 | 40.13 |
Earnings by Sex in Area Code 516
Average Earnings in Area Code 516 are $63,698, $78,317 for men and $49,491 for women, a difference of 36.8%.
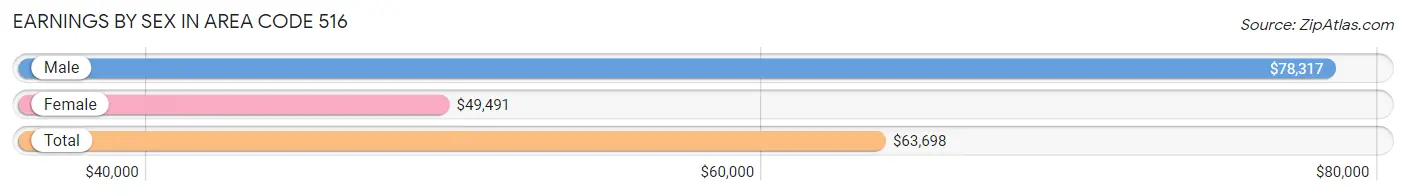
| Sex | Number | Average Earnings |
| Male | 604,201 (52.0%) | $78,317 |
| Female | 558,352 (48.0%) | $49,491 |
| Total | 1,162,553 (100.0%) | $63,698 |
Earnings by Sex by Income Bracket in Area Code 516
The most common earnings brackets in Area Code 516 are $100,000+ for men (196,094 | 32.5%) and $100,000+ for women (114,362 | 20.5%).
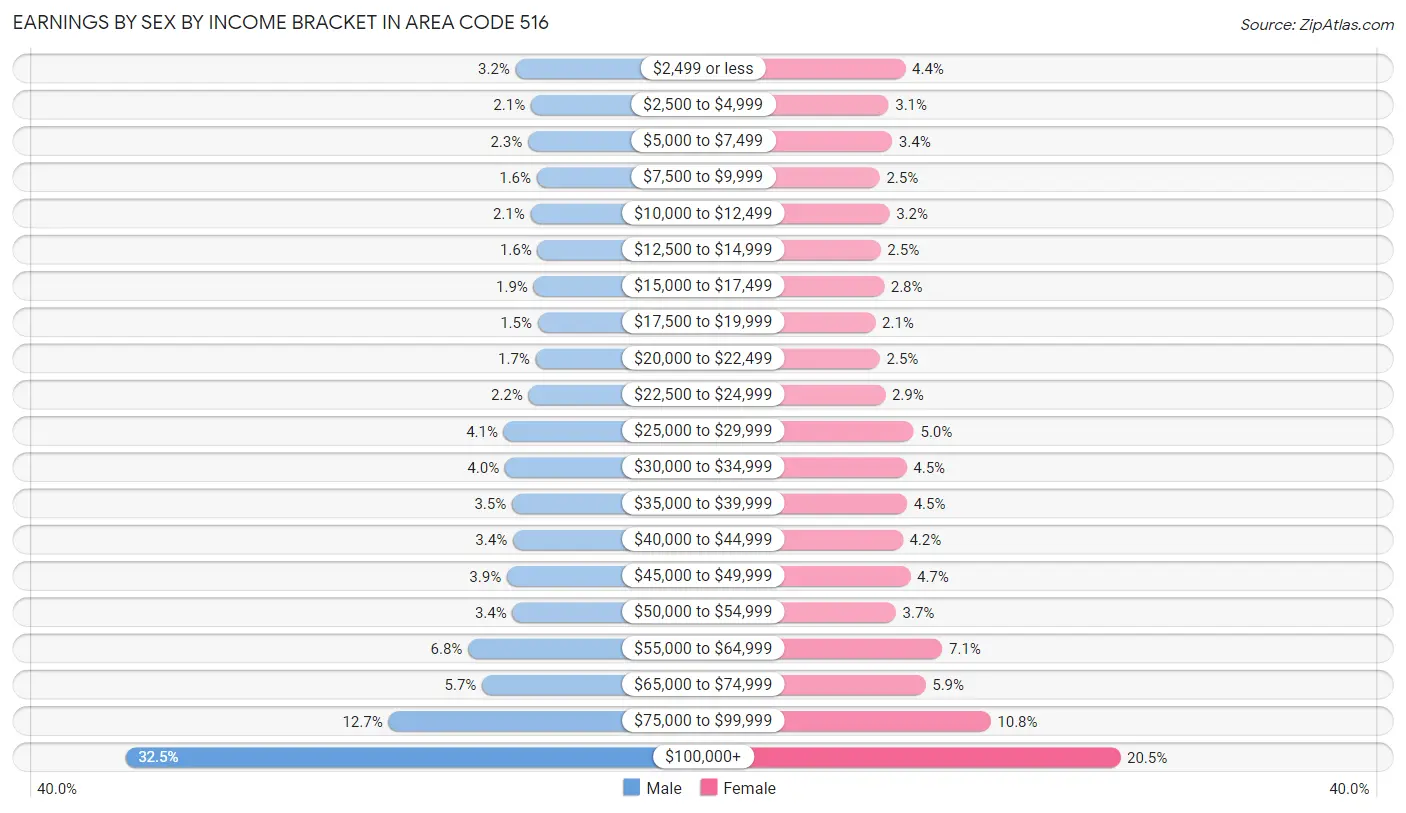
| Income | Male | Female |
| $2,499 or less | 19,346 (3.2%) | 24,412 (4.4%) |
| $2,500 to $4,999 | 12,395 (2.1%) | 17,355 (3.1%) |
| $5,000 to $7,499 | 13,705 (2.3%) | 18,853 (3.4%) |
| $7,500 to $9,999 | 9,756 (1.6%) | 13,659 (2.5%) |
| $10,000 to $12,499 | 12,541 (2.1%) | 17,764 (3.2%) |
| $12,500 to $14,999 | 9,402 (1.6%) | 14,088 (2.5%) |
| $15,000 to $17,499 | 11,190 (1.8%) | 15,482 (2.8%) |
| $17,500 to $19,999 | 9,275 (1.5%) | 11,851 (2.1%) |
| $20,000 to $22,499 | 10,291 (1.7%) | 13,720 (2.5%) |
| $22,500 to $24,999 | 13,485 (2.2%) | 15,961 (2.9%) |
| $25,000 to $29,999 | 24,726 (4.1%) | 27,907 (5.0%) |
| $30,000 to $34,999 | 24,146 (4.0%) | 24,876 (4.5%) |
| $35,000 to $39,999 | 20,986 (3.5%) | 25,070 (4.5%) |
| $40,000 to $44,999 | 20,567 (3.4%) | 23,295 (4.2%) |
| $45,000 to $49,999 | 23,286 (3.8%) | 26,445 (4.7%) |
| $50,000 to $54,999 | 20,748 (3.4%) | 20,446 (3.7%) |
| $55,000 to $64,999 | 40,852 (6.8%) | 39,860 (7.1%) |
| $65,000 to $74,999 | 34,510 (5.7%) | 32,855 (5.9%) |
| $75,000 to $99,999 | 76,900 (12.7%) | 60,091 (10.8%) |
| $100,000+ | 196,094 (32.5%) | 114,362 (20.5%) |
| Total | 604,201 (100.0%) | 558,352 (100.0%) |
Earnings by Sex by Educational Attainment in Area Code 516
Average earnings in Area Code 516 are $8,367,406 for men and $5,410,646 for women, a difference of 35.3%. Men with an educational attainment of graduate degree enjoy the highest average annual earnings of $11,358,488, while those with less than high school education earn the least with $2,999,541. Women with an educational attainment of graduate degree earn the most with the average annual earnings of $8,251,742, while those with less than high school education have the smallest earnings of $1,647,730.
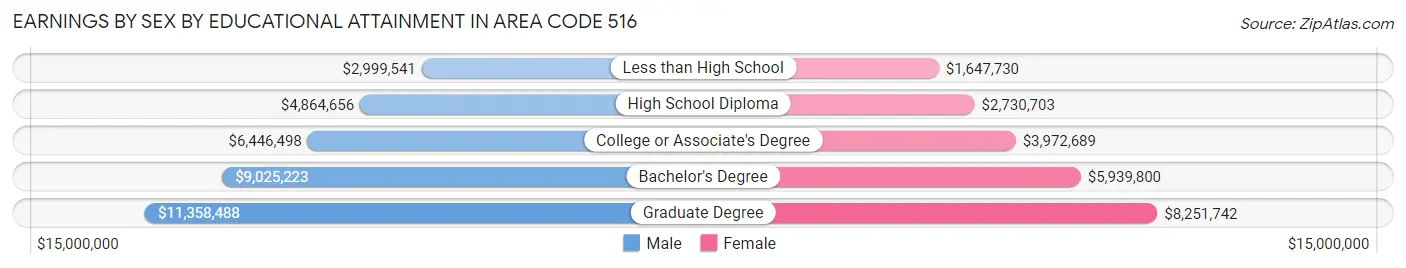
| Educational Attainment | Male Income | Female Income |
| Less than High School | $2,999,541 | $1,647,730 |
| High School Diploma | $4,864,656 | $2,730,703 |
| College or Associate's Degree | $6,446,498 | $3,972,689 |
| Bachelor's Degree | $9,025,223 | $5,939,800 |
| Graduate Degree | $11,358,488 | $8,251,742 |
| Total | $8,367,406 | $5,410,646 |
Family Income in Area Code 516
Family Income Brackets in Area Code 516
According to the Area Code 516 family income data, there are 17,538,214 families falling into the $200,000+ income range, which is the most common income bracket and makes up 3,363.6% of all families. Conversely, the $10,000 to $14,999 income bracket is the least frequent group with only 400,444 families (76.8%) belonging to this category.
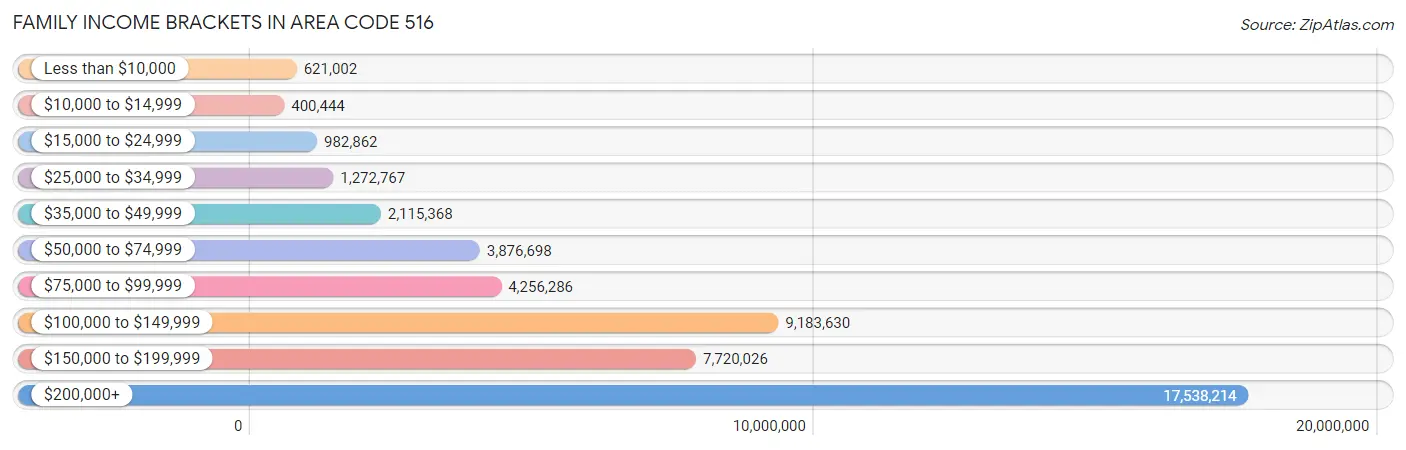
| Income Bracket | # Families | % Families |
| Less than $10,000 | 621,002 | 119.1% |
| $10,000 to $14,999 | 400,444 | 76.8% |
| $15,000 to $24,999 | 982,862 | 188.5% |
| $25,000 to $34,999 | 1,272,767 | 244.1% |
| $35,000 to $49,999 | 2,115,368 | 405.7% |
| $50,000 to $74,999 | 3,876,698 | 743.5% |
| $75,000 to $99,999 | 4,256,286 | 816.3% |
| $100,000 to $149,999 | 9,183,630 | 1,761.3% |
| $150,000 to $199,999 | 7,720,026 | 1,480.6% |
| $200,000+ | 17,538,214 | 3,363.6% |
Family Income by Famaliy Size in Area Code 516
7+ person families (16,107 | 3.1%) account for the highest median family income in Area Code 516 with $195,017 per family, while 2-person families (181,492 | 34.8%) have the highest median income of $65,130 per family member.
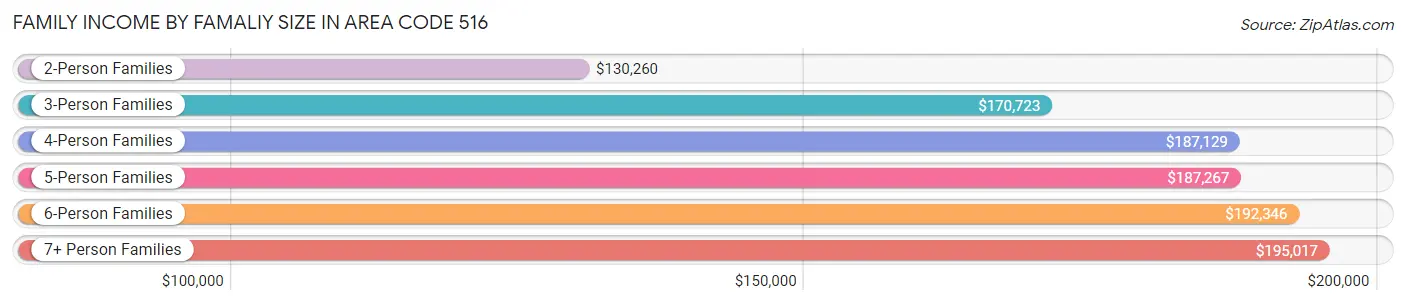
| Income Bracket | # Families | Median Income |
| 2-Person Families | 181,492 (34.8%) | $130,260 |
| 3-Person Families | 124,119 (23.8%) | $170,723 |
| 4-Person Families | 122,814 (23.5%) | $187,129 |
| 5-Person Families | 54,930 (10.5%) | $187,267 |
| 6-Person Families | 21,950 (4.2%) | $192,346 |
| 7+ Person Families | 16,107 (3.1%) | $195,017 |
| Total | 521,412 (100.0%) | $162,858 |
Family Income by Number of Earners in Area Code 516
The median family income in Area Code 516 is $162,858, with families comprising 3+ earners (109,271) having the highest median family income of $213,780, while families with no earners (56,667) have the lowest median family income of $79,610, accounting for 21.0% and 10.9% of families, respectively.
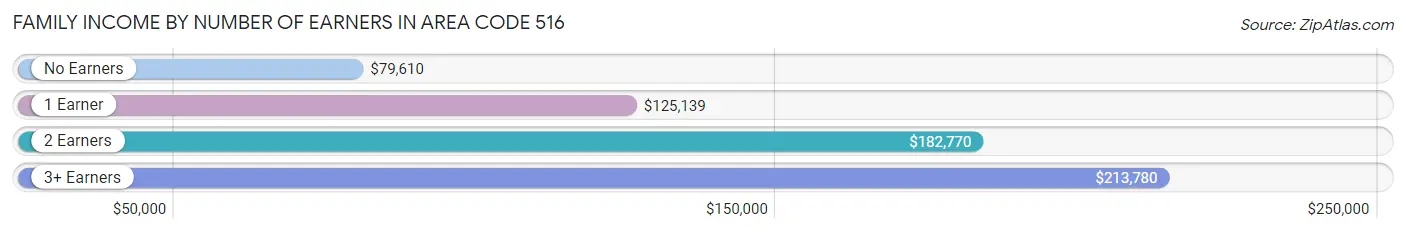
| Number of Earners | # Families | Median Income |
| No Earners | 56,667 (10.9%) | $79,610 |
| 1 Earner | 136,216 (26.1%) | $125,139 |
| 2 Earners | 219,258 (42.0%) | $182,770 |
| 3+ Earners | 109,271 (21.0%) | $213,780 |
| Total | 521,412 (100.0%) | $162,858 |
Household Income in Area Code 516
Household Income Brackets in Area Code 516
With 19,567,450 households falling in the category, the $200,000+ income range is the most frequent in Area Code 516, accounting for 2,834.4% of all households. In contrast, only 1,017,585 households (147.4%) fall into the $10,000 to $14,999 income bracket, making it the least populous group.
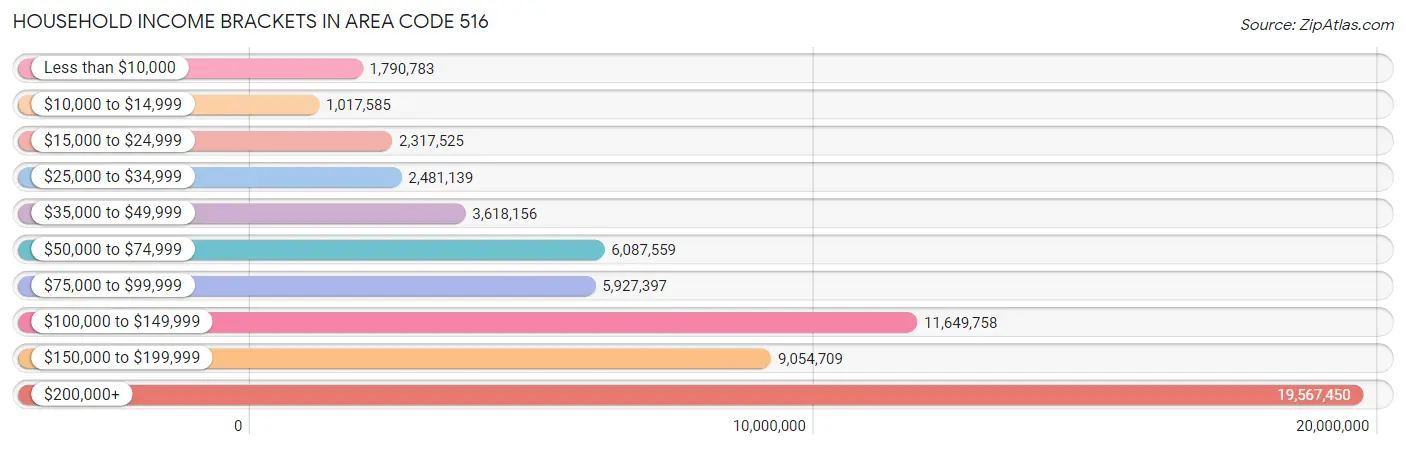
| Income Bracket | # Households | % Households |
| Less than $10,000 | 1,790,783 | 259.4% |
| $10,000 to $14,999 | 1,017,585 | 147.4% |
| $15,000 to $24,999 | 2,317,525 | 335.7% |
| $25,000 to $34,999 | 2,481,139 | 359.4% |
| $35,000 to $49,999 | 3,618,156 | 524.1% |
| $50,000 to $74,999 | 6,087,559 | 881.8% |
| $75,000 to $99,999 | 5,927,397 | 858.6% |
| $100,000 to $149,999 | 11,649,758 | 1,687.5% |
| $150,000 to $199,999 | 9,054,709 | 1,311.6% |
| $200,000+ | 19,567,450 | 2,834.4% |
Household Income by Householder Age in Area Code 516
The median household income in Area Code 516 is $141,302, with the highest median household income of $167,271 found in the 45 to 64 years age bracket for the primary householder. A total of 301,919 households (43.7%) fall into this category. Meanwhile, the 15 to 24 years age bracket for the primary householder has the lowest median household income of $75,175, with 6,530 households (0.9%) in this group.
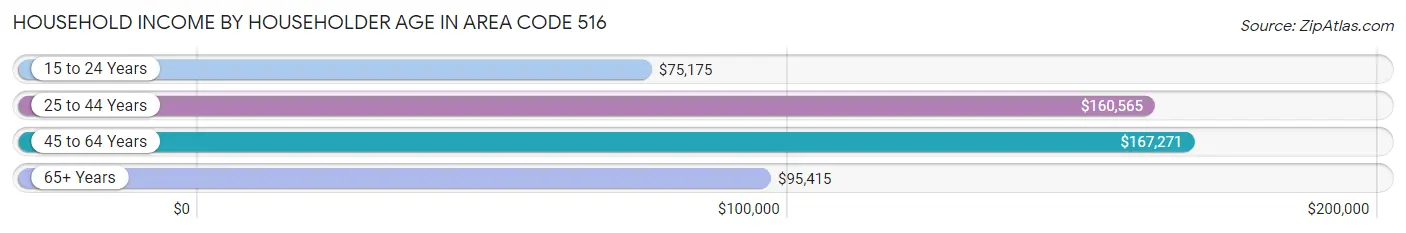
| Income Bracket | # Households | Median Income |
| 15 to 24 Years | 6,530 (0.9%) | $75,175 |
| 25 to 44 Years | 171,322 (24.8%) | $160,565 |
| 45 to 64 Years | 301,919 (43.7%) | $167,271 |
| 65+ Years | 210,585 (30.5%) | $95,415 |
| Total | 690,356 (100.0%) | $141,302 |
Poverty in Area Code 516
Income Below Poverty by Sex and Age in Area Code 516
With 5.6% poverty level for males and 7.0% for females among the residents of Area Code 516, 16 and 17 year old males and 75 year old and over females are the most vulnerable to poverty, with 2,288 males (8.1%) and 9,272 females (9.9%) in their respective age groups living below the poverty level.
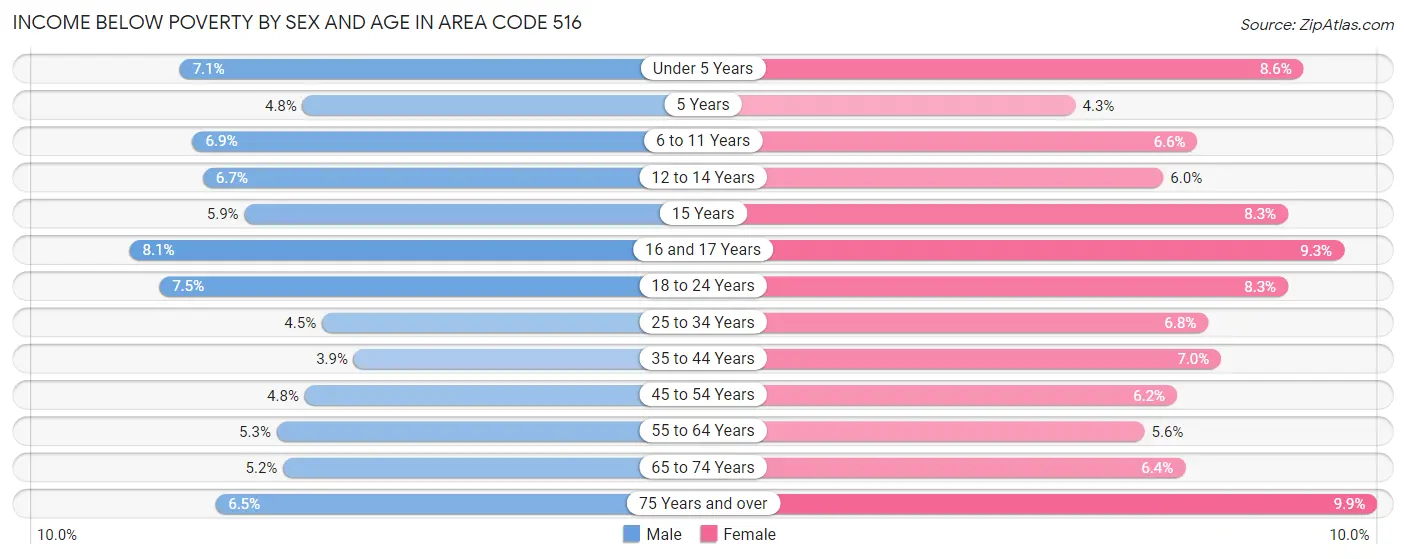
| Age Bracket | Male | Female |
| Under 5 Years | 4,035 (7.1%) | 4,613 (8.6%) |
| 5 Years | 574 (4.8%) | 517 (4.3%) |
| 6 to 11 Years | 5,339 (6.9%) | 4,744 (6.6%) |
| 12 to 14 Years | 2,767 (6.7%) | 2,415 (6.0%) |
| 15 Years | 880 (5.9%) | 1,097 (8.3%) |
| 16 and 17 Years | 2,288 (8.1%) | 2,538 (9.3%) |
| 18 to 24 Years | 6,877 (7.5%) | 7,311 (8.3%) |
| 25 to 34 Years | 5,837 (4.5%) | 8,667 (6.8%) |
| 35 to 44 Years | 5,030 (3.9%) | 9,126 (7.0%) |
| 45 to 54 Years | 6,766 (4.8%) | 9,132 (6.2%) |
| 55 to 64 Years | 7,840 (5.3%) | 8,808 (5.6%) |
| 65 to 74 Years | 5,067 (5.2%) | 7,044 (6.4%) |
| 75 Years and over | 3,952 (6.5%) | 9,272 (9.9%) |
| Total | 57,252 (5.6%) | 75,284 (7.0%) |
Income Above Poverty by Sex and Age in Area Code 516
According to the poverty statistics in Area Code 516, males aged 35 to 44 years and females aged 5 years are the age groups that are most secure financially, with 96.1% of males and 95.7% of females in these age groups living above the poverty line.
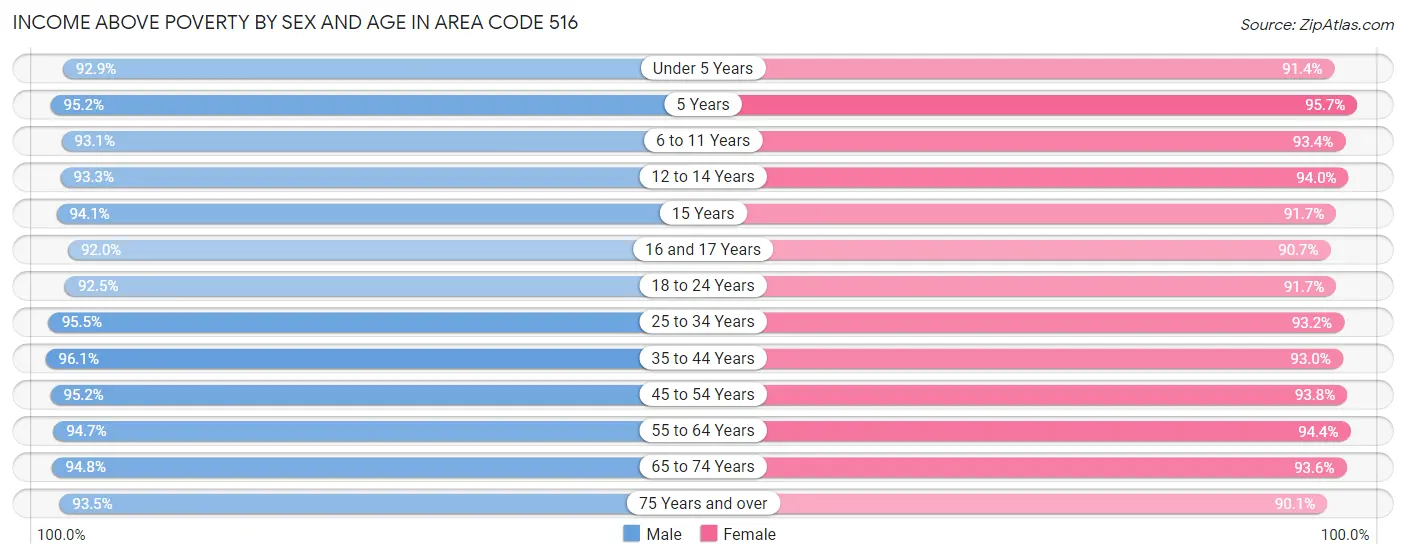
| Age Bracket | Male | Female |
| Under 5 Years | 52,645 (92.9%) | 49,208 (91.4%) |
| 5 Years | 11,286 (95.2%) | 11,387 (95.7%) |
| 6 to 11 Years | 72,281 (93.1%) | 67,154 (93.4%) |
| 12 to 14 Years | 38,585 (93.3%) | 38,070 (94.0%) |
| 15 Years | 13,984 (94.1%) | 12,148 (91.7%) |
| 16 and 17 Years | 26,121 (91.9%) | 24,692 (90.7%) |
| 18 to 24 Years | 84,872 (92.5%) | 81,024 (91.7%) |
| 25 to 34 Years | 124,440 (95.5%) | 118,724 (93.2%) |
| 35 to 44 Years | 124,235 (96.1%) | 120,485 (93.0%) |
| 45 to 54 Years | 134,225 (95.2%) | 137,571 (93.8%) |
| 55 to 64 Years | 139,461 (94.7%) | 147,898 (94.4%) |
| 65 to 74 Years | 92,327 (94.8%) | 103,521 (93.6%) |
| 75 Years and over | 57,198 (93.5%) | 83,979 (90.1%) |
| Total | 971,660 (94.4%) | 995,861 (93.0%) |
Income Below Poverty Among Married-Couple Families in Area Code 516
The poverty statistics for married-couple families in Area Code 516 show that 2.4% or 9,506 of the total 395,589 families live below the poverty line. Families with 5 or more children have the highest poverty rate of 4.4%, comprising of 106 families. On the other hand, families with 1 or 2 children have the lowest poverty rate of 2.1%, which includes 3,075 families.
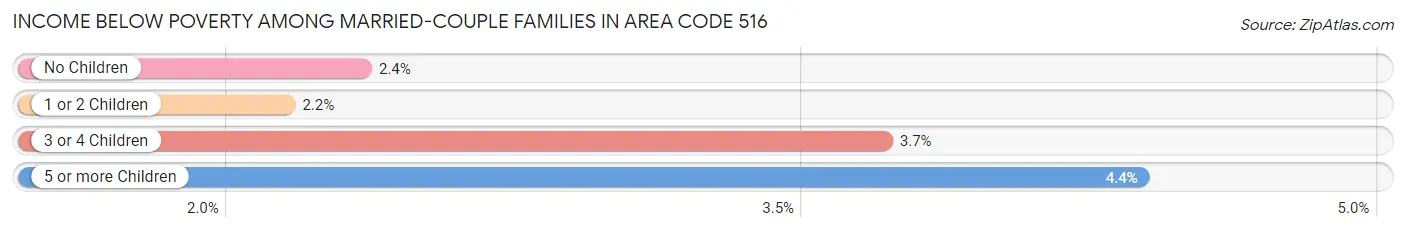
| Children | Above Poverty | Below Poverty |
| No Children | 212,563 (97.7%) | 5,111 (2.4%) |
| 1 or 2 Children | 139,698 (97.9%) | 3,075 (2.1%) |
| 3 or 4 Children | 31,510 (96.3%) | 1,214 (3.7%) |
| 5 or more Children | 2,312 (95.6%) | 106 (4.4%) |
| Total | 386,083 (97.6%) | 9,506 (2.4%) |
Income Below Poverty Among Single-Parent Households in Area Code 516
According to the poverty data in Area Code 516, 6.6% or 2,364 single-father households and 11.0% or 9,888 single-mother households are living below the poverty line. Among single-father households, those with 5 or more children have the highest poverty rate, with 40 households (19.6%) experiencing poverty. Likewise, among single-mother households, those with 5 or more children have the highest poverty rate, with 277 households (39.2%) falling below the poverty line.
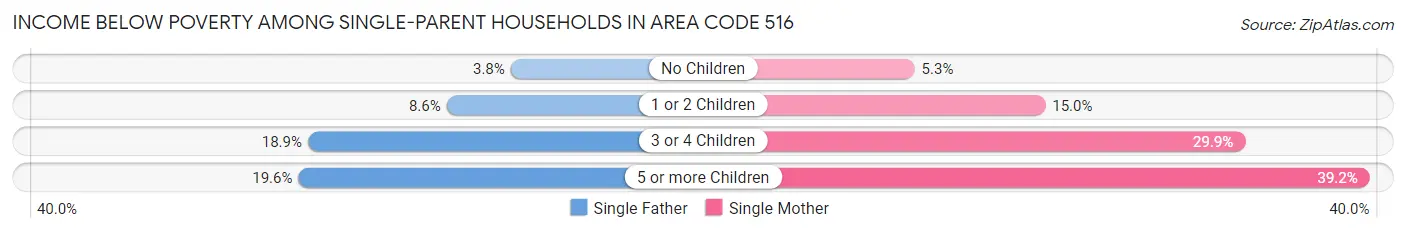
| Children | Single Father | Single Mother |
| No Children | 807 (3.8%) | 2,534 (5.3%) |
| 1 or 2 Children | 997 (8.6%) | 5,335 (15.0%) |
| 3 or 4 Children | 520 (18.9%) | 1,742 (29.9%) |
| 5 or more Children | 40 (19.6%) | 277 (39.2%) |
| Total | 2,364 (6.6%) | 9,888 (11.0%) |
Income Below Poverty Among Married-Couple vs Single-Parent Households in Area Code 516
The poverty data for Area Code 516 shows that 9,506 of the married-couple family households (2.4%) and 12,252 of the single-parent households (9.7%) are living below the poverty level. Within the married-couple family households, those with 5 or more children have the highest poverty rate, with 106 households (4.4%) falling below the poverty line. Among the single-parent households, those with 5 or more children have the highest poverty rate, with 317 household (34.8%) living below poverty.
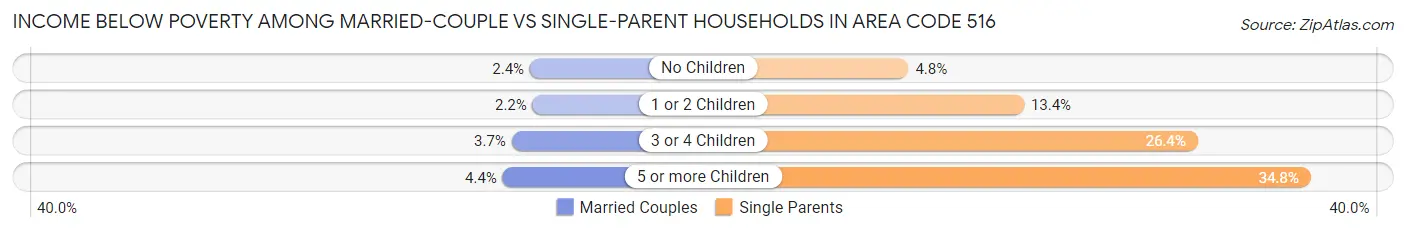
| Children | Married-Couple Families | Single-Parent Households |
| No Children | 5,111 (2.4%) | 3,341 (4.8%) |
| 1 or 2 Children | 3,075 (2.1%) | 6,332 (13.4%) |
| 3 or 4 Children | 1,214 (3.7%) | 2,262 (26.4%) |
| 5 or more Children | 106 (4.4%) | 317 (34.8%) |
| Total | 9,506 (2.4%) | 12,252 (9.7%) |
Race in Area Code 516
The most populous races in Area Code 516 are White / Caucasian (1,227,609 | 57.6%), Hispanic or Latino (411,176 | 19.3%), and Black / African American (358,461 | 16.8%).
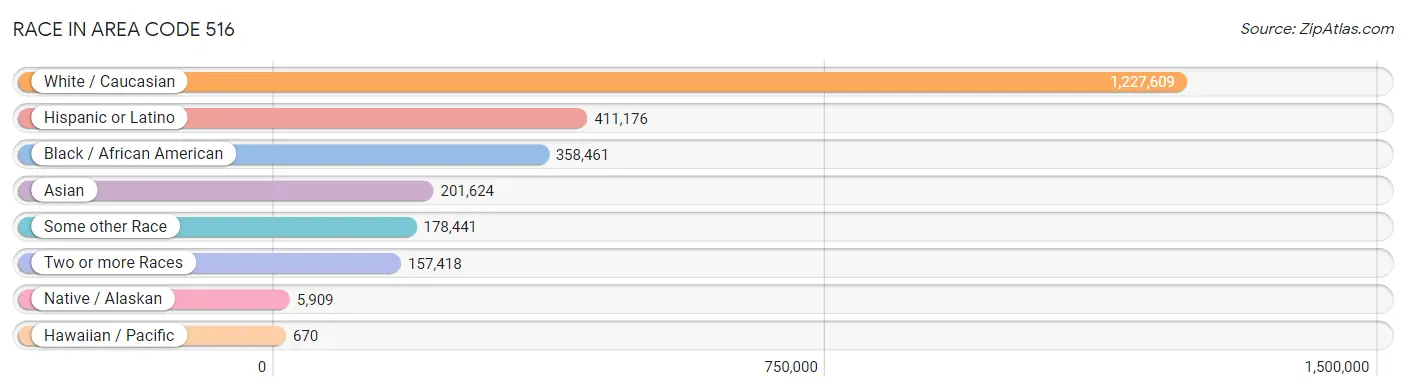
| Race | # Population | % Population |
| Asian | 201,624 | 9.5% |
| Black / African American | 358,461 | 16.8% |
| Hawaiian / Pacific | 670 | 0.0% |
| Hispanic or Latino | 411,176 | 19.3% |
| Native / Alaskan | 5,909 | 0.3% |
| White / Caucasian | 1,227,609 | 57.6% |
| Two or more Races | 157,418 | 7.4% |
| Some other Race | 178,441 | 8.4% |
| Total | 2,130,132 | 100.0% |
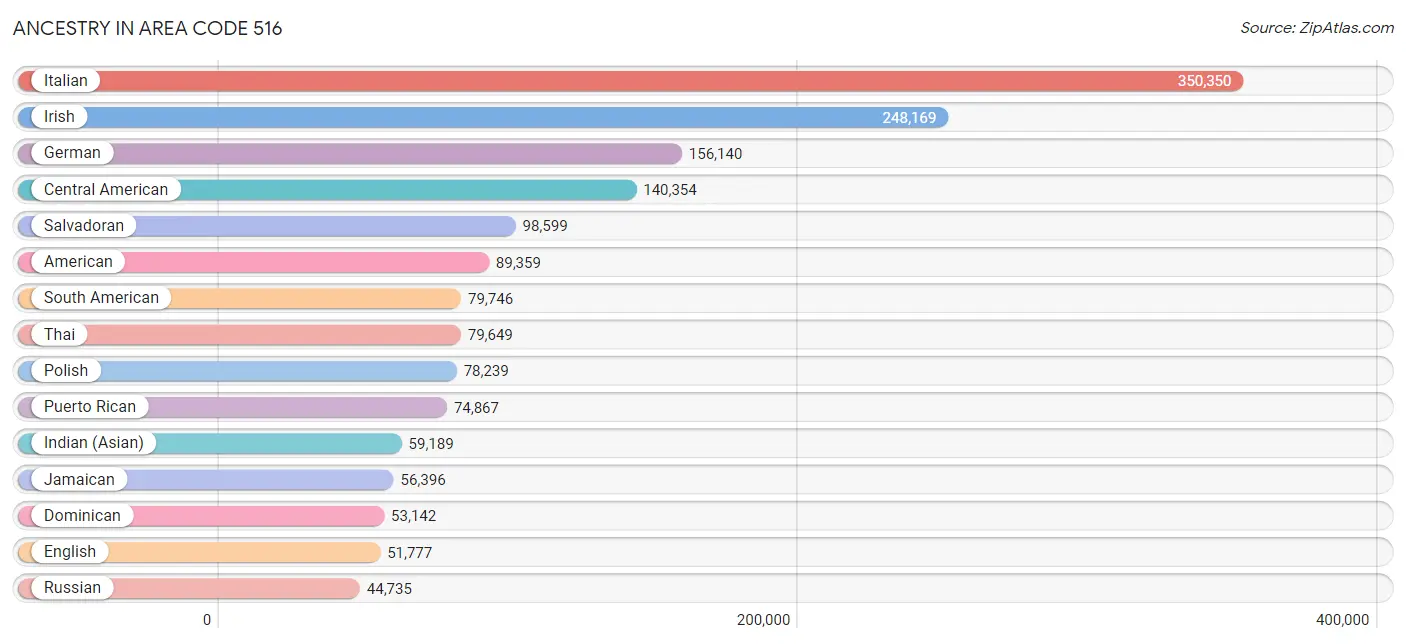
Ancestry in Area Code 516
The most populous ancestries reported in Area Code 516 are Italian (350,350 | 16.5%), Irish (248,169 | 11.7%), German (156,140 | 7.3%), Central American (140,354 | 6.6%), and Salvadoran (98,599 | 4.6%), together accounting for 46.7% of all Area Code 516 residents.
| Ancestry | # Population | % Population |
| Afghan | 1,923 | 0.1% |
| African | 7,917 | 0.4% |
| Albanian | 2,453 | 0.1% |
| Aleut | 13 | 0.0% |
| Alsatian | 56 | 0.0% |
| American | 89,359 | 4.2% |
| Apache | 39 | 0.0% |
| Arab | 10,884 | 0.5% |
| Argentinean | 4,814 | 0.2% |
| Armenian | 3,179 | 0.2% |
| Assyrian / Chaldean / Syriac | 48 | 0.0% |
| Australian | 443 | 0.0% |
| Austrian | 9,353 | 0.4% |
| Bahamian | 144 | 0.0% |
| Barbadian | 2,561 | 0.1% |
| Basque | 77 | 0.0% |
| Belgian | 868 | 0.0% |
| Belizean | 762 | 0.0% |
| Bermudan | 56 | 0.0% |
| Bhutanese | 4,052 | 0.2% |
| Blackfeet | 768 | 0.0% |
| Bolivian | 1,171 | 0.1% |
| Brazilian | 2,573 | 0.1% |
| British | 3,401 | 0.2% |
| British West Indian | 4,866 | 0.2% |
| Bulgarian | 303 | 0.0% |
| Burmese | 18,914 | 0.9% |
| Cajun | 20 | 0.0% |
| Cambodian | 36 | 0.0% |
| Canadian | 2,512 | 0.1% |
| Cape Verdean | 64 | 0.0% |
| Carpatho Rusyn | 11 | 0.0% |
| Celtic | 232 | 0.0% |
| Central American | 140,354 | 6.6% |
| Central American Indian | 4,503 | 0.2% |
| Cherokee | 1,451 | 0.1% |
| Chickasaw | 11 | 0.0% |
| Chilean | 4,423 | 0.2% |
| Choctaw | 100 | 0.0% |
| Colombian | 27,854 | 1.3% |
| Comanche | 18 | 0.0% |
| Costa Rican | 1,655 | 0.1% |
| Cree | 62 | 0.0% |
| Creek | 50 | 0.0% |
| Croatian | 3,970 | 0.2% |
| Crow | 26 | 0.0% |
| Cuban | 10,610 | 0.5% |
| Cypriot | 584 | 0.0% |
| Czech | 5,055 | 0.2% |
| Czechoslovakian | 1,533 | 0.1% |
| Danish | 2,827 | 0.1% |
| Delaware | 60 | 0.0% |
| Dominican | 53,142 | 2.5% |
| Dutch | 6,427 | 0.3% |
| Dutch West Indian | 310 | 0.0% |
| Eastern European | 23,515 | 1.1% |
| Ecuadorian | 19,331 | 0.9% |
| Egyptian | 2,794 | 0.1% |
| English | 51,777 | 2.4% |
| Estonian | 93 | 0.0% |
| Ethiopian | 180 | 0.0% |
| European | 18,174 | 0.9% |
| Filipino | 2,103 | 0.1% |
| Finnish | 1,997 | 0.1% |
| French | 14,724 | 0.7% |
| French American Indian | 55 | 0.0% |
| French Canadian | 3,294 | 0.2% |
| German | 156,140 | 7.3% |
| German Russian | 5 | 0.0% |
| Ghanaian | 2,066 | 0.1% |
| Greek | 25,048 | 1.2% |
| Guamanian / Chamorro | 210 | 0.0% |
| Guatemalan | 14,141 | 0.7% |
| Guyanese | 19,576 | 0.9% |
| Haitian | 41,896 | 2.0% |
| Hmong | 53 | 0.0% |
| Honduran | 20,061 | 0.9% |
| Houma | 11 | 0.0% |
| Hungarian | 12,571 | 0.6% |
| Icelander | 128 | 0.0% |
| Indian (Asian) | 59,189 | 2.8% |
| Indonesian | 309 | 0.0% |
| Inupiat | 19 | 0.0% |
| Iranian | 9,744 | 0.5% |
| Iraqi | 685 | 0.0% |
| Irish | 248,169 | 11.7% |
| Iroquois | 832 | 0.0% |
| Israeli | 4,381 | 0.2% |
| Italian | 350,350 | 16.5% |
| Jamaican | 56,396 | 2.6% |
| Japanese | 73 | 0.0% |
| Jordanian | 409 | 0.0% |
| Kenyan | 143 | 0.0% |
| Korean | 21,920 | 1.0% |
| Laotian | 718 | 0.0% |
| Latvian | 729 | 0.0% |
| Lebanese | 2,161 | 0.1% |
| Liberian | 89 | 0.0% |
| Lithuanian | 5,146 | 0.2% |
| Lumbee | 27 | 0.0% |
| Luxembourger | 39 | 0.0% |
| Macedonian | 372 | 0.0% |
| Malaysian | 204 | 0.0% |
| Maltese | 1,685 | 0.1% |
| Menominee | 10 | 0.0% |
| Mexican | 18,625 | 0.9% |
| Mexican American Indian | 803 | 0.0% |
| Mongolian | 475 | 0.0% |
| Moroccan | 1,319 | 0.1% |
| Native Hawaiian | 437 | 0.0% |
| Navajo | 162 | 0.0% |
| New Zealander | 18 | 0.0% |
| Nicaraguan | 2,074 | 0.1% |
| Nigerian | 7,341 | 0.3% |
| Northern European | 857 | 0.0% |
| Norwegian | 7,475 | 0.4% |
| Okinawan | 205 | 0.0% |
| Pakistani | 1,398 | 0.1% |
| Palestinian | 693 | 0.0% |
| Panamanian | 3,163 | 0.2% |
| Paraguayan | 461 | 0.0% |
| Pennsylvania German | 136 | 0.0% |
| Peruvian | 17,021 | 0.8% |
| Pima | 8 | 0.0% |
| Polish | 78,239 | 3.7% |
| Portuguese | 7,870 | 0.4% |
| Potawatomi | 73 | 0.0% |
| Puerto Rican | 74,867 | 3.5% |
| Romanian | 5,450 | 0.3% |
| Russian | 44,735 | 2.1% |
| Salvadoran | 98,599 | 4.6% |
| Samoan | 283 | 0.0% |
| Scandinavian | 1,264 | 0.1% |
| Scotch-Irish | 3,637 | 0.2% |
| Scottish | 9,976 | 0.5% |
| Seminole | 161 | 0.0% |
| Senegalese | 101 | 0.0% |
| Serbian | 966 | 0.1% |
| Shoshone | 31 | 0.0% |
| Sierra Leonean | 127 | 0.0% |
| Sioux | 102 | 0.0% |
| Slavic | 781 | 0.0% |
| Slovak | 1,559 | 0.1% |
| Slovene | 349 | 0.0% |
| Somali | 33 | 0.0% |
| South African | 429 | 0.0% |
| South American | 79,746 | 3.7% |
| South American Indian | 1,242 | 0.1% |
| Soviet Union | 35 | 0.0% |
| Spaniard | 7,083 | 0.3% |
| Spanish | 4,024 | 0.2% |
| Spanish American | 148 | 0.0% |
| Spanish American Indian | 119 | 0.0% |
| Sri Lankan | 1,736 | 0.1% |
| Subsaharan African | 19,250 | 0.9% |
| Sudanese | 169 | 0.0% |
| Swedish | 6,813 | 0.3% |
| Swiss | 1,783 | 0.1% |
| Syrian | 772 | 0.0% |
| Thai | 79,649 | 3.7% |
| Trinidadian and Tobagonian | 11,568 | 0.5% |
| Turkish | 6,094 | 0.3% |
| U.S. Virgin Islander | 243 | 0.0% |
| Ugandan | 60 | 0.0% |
| Ukrainian | 9,948 | 0.5% |
| Uruguayan | 1,744 | 0.1% |
| Ute | 17 | 0.0% |
| Venezuelan | 1,880 | 0.1% |
| Vietnamese | 5,736 | 0.3% |
| Welsh | 2,736 | 0.1% |
| West Indian | 11,771 | 0.5% |
| Yugoslavian | 1,591 | 0.1% |
| Zimbabwean | 100 | 0.0% | View All 173 Rows |
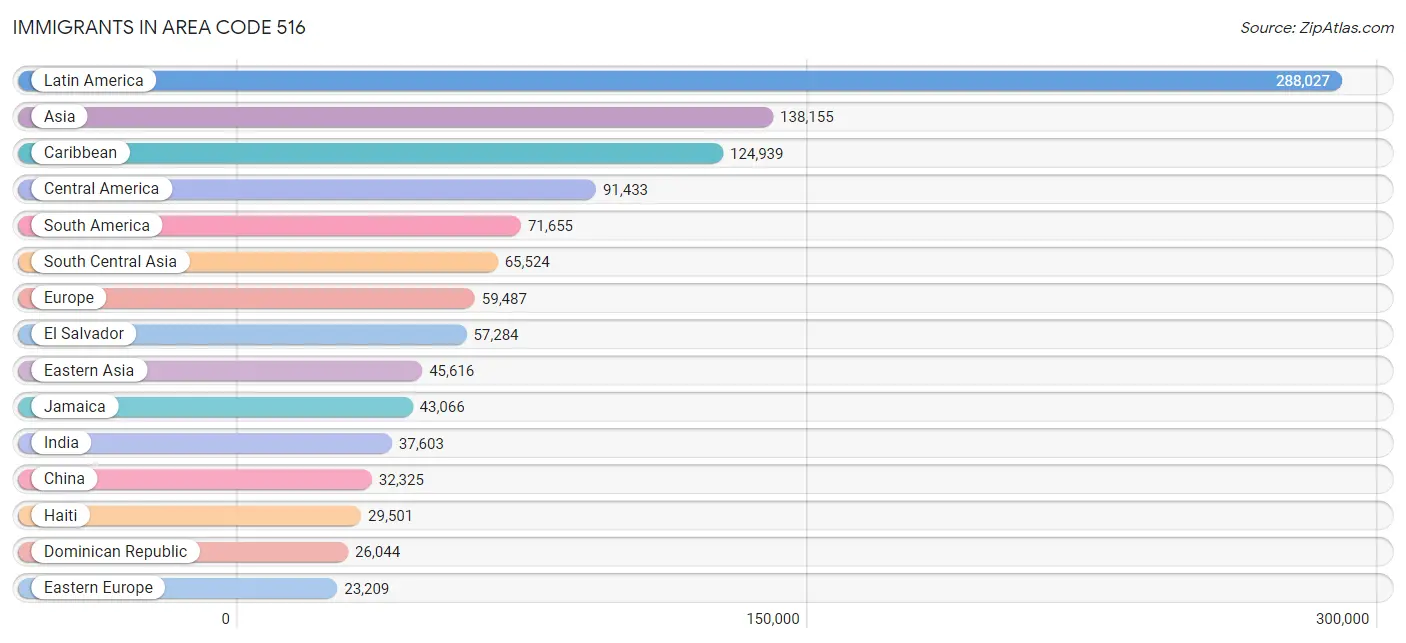
Immigrants in Area Code 516
The most numerous immigrant groups reported in Area Code 516 came from Latin America (288,027 | 13.5%), Asia (138,155 | 6.5%), Caribbean (124,939 | 5.9%), Central America (91,433 | 4.3%), and South America (71,655 | 3.4%), together accounting for 33.5% of all Area Code 516 residents.
| Immigration Origin | # Population | % Population |
| Afghanistan | 1,655 | 0.1% |
| Africa | 15,027 | 0.7% |
| Albania | 750 | 0.0% |
| Argentina | 3,423 | 0.2% |
| Armenia | 67 | 0.0% |
| Asia | 138,155 | 6.5% |
| Australia | 619 | 0.0% |
| Austria | 400 | 0.0% |
| Bahamas | 242 | 0.0% |
| Bangladesh | 6,460 | 0.3% |
| Barbados | 3,036 | 0.1% |
| Belarus | 814 | 0.0% |
| Belgium | 572 | 0.0% |
| Belize | 865 | 0.0% |
| Bolivia | 880 | 0.0% |
| Bosnia and Herzegovina | 571 | 0.0% |
| Brazil | 3,106 | 0.2% |
| Bulgaria | 302 | 0.0% |
| Cambodia | 64 | 0.0% |
| Cameroon | 23 | 0.0% |
| Canada | 2,979 | 0.1% |
| Caribbean | 124,939 | 5.9% |
| Central America | 91,433 | 4.3% |
| Chile | 2,504 | 0.1% |
| China | 32,325 | 1.5% |
| Colombia | 14,433 | 0.7% |
| Congo | 8 | 0.0% |
| Costa Rica | 878 | 0.0% |
| Croatia | 695 | 0.0% |
| Cuba | 2,636 | 0.1% |
| Czechoslovakia | 1,098 | 0.1% |
| Denmark | 296 | 0.0% |
| Dominica | 1,302 | 0.1% |
| Dominican Republic | 26,044 | 1.2% |
| Eastern Africa | 998 | 0.1% |
| Eastern Asia | 45,616 | 2.1% |
| Eastern Europe | 23,209 | 1.1% |
| Ecuador | 10,950 | 0.5% |
| Egypt | 1,925 | 0.1% |
| El Salvador | 57,284 | 2.7% |
| England | 1,966 | 0.1% |
| Eritrea | 7 | 0.0% |
| Ethiopia | 161 | 0.0% |
| Europe | 59,487 | 2.8% |
| Fiji | 15 | 0.0% |
| France | 835 | 0.0% |
| Germany | 3,969 | 0.2% |
| Ghana | 2,159 | 0.1% |
| Greece | 4,062 | 0.2% |
| Grenada | 1,741 | 0.1% |
| Guatemala | 9,170 | 0.4% |
| Guyana | 21,263 | 1.0% |
| Haiti | 29,501 | 1.4% |
| Honduras | 13,292 | 0.6% |
| Hong Kong | 4,178 | 0.2% |
| Hungary | 850 | 0.0% |
| India | 37,603 | 1.8% |
| Indonesia | 520 | 0.0% |
| Iran | 6,382 | 0.3% |
| Iraq | 364 | 0.0% |
| Ireland | 3,381 | 0.2% |
| Israel | 3,694 | 0.2% |
| Italy | 12,870 | 0.6% |
| Jamaica | 43,066 | 2.0% |
| Japan | 1,700 | 0.1% |
| Jordan | 352 | 0.0% |
| Kazakhstan | 164 | 0.0% |
| Kenya | 61 | 0.0% |
| Korea | 11,591 | 0.5% |
| Kuwait | 292 | 0.0% |
| Laos | 25 | 0.0% |
| Latin America | 288,027 | 13.5% |
| Latvia | 278 | 0.0% |
| Lebanon | 560 | 0.0% |
| Liberia | 150 | 0.0% |
| Lithuania | 353 | 0.0% |
| Malaysia | 554 | 0.0% |
| Mexico | 7,140 | 0.3% |
| Middle Africa | 250 | 0.0% |
| Moldova | 269 | 0.0% |
| Morocco | 704 | 0.0% |
| Nepal | 242 | 0.0% |
| Netherlands | 171 | 0.0% |
| Nicaragua | 1,035 | 0.1% |
| Nigeria | 5,882 | 0.3% |
| North Macedonia | 218 | 0.0% |
| Northern Africa | 2,931 | 0.1% |
| Northern Europe | 8,871 | 0.4% |
| Norway | 95 | 0.0% |
| Oceania | 819 | 0.0% |
| Pakistan | 11,665 | 0.5% |
| Panama | 1,759 | 0.1% |
| Peru | 11,927 | 0.6% |
| Philippines | 12,051 | 0.6% |
| Poland | 6,784 | 0.3% |
| Portugal | 2,636 | 0.1% |
| Romania | 1,563 | 0.1% |
| Russia | 3,199 | 0.2% |
| Saudi Arabia | 246 | 0.0% |
| Scotland | 519 | 0.0% |
| Senegal | 210 | 0.0% |
| Serbia | 427 | 0.0% |
| Sierra Leone | 305 | 0.0% |
| Singapore | 250 | 0.0% |
| South Africa | 586 | 0.0% |
| South America | 71,655 | 3.4% |
| South Central Asia | 65,524 | 3.1% |
| South Eastern Asia | 16,204 | 0.8% |
| Southern Europe | 21,063 | 1.0% |
| Spain | 1,106 | 0.1% |
| Sri Lanka | 657 | 0.0% |
| St. Vincent and the Grenadines | 1,337 | 0.1% |
| Sudan | 152 | 0.0% |
| Sweden | 155 | 0.0% |
| Switzerland | 215 | 0.0% |
| Syria | 121 | 0.0% |
| Taiwan | 3,591 | 0.2% |
| Thailand | 692 | 0.0% |
| Trinidad and Tobago | 12,309 | 0.6% |
| Turkey | 3,287 | 0.2% |
| Uganda | 120 | 0.0% |
| Ukraine | 3,982 | 0.2% |
| Uruguay | 1,030 | 0.1% |
| Uzbekistan | 606 | 0.0% |
| Venezuela | 1,498 | 0.1% |
| Vietnam | 1,276 | 0.1% |
| West Indies | 1,134 | 0.1% |
| Western Africa | 9,138 | 0.4% |
| Western Asia | 10,564 | 0.5% |
| Western Europe | 6,168 | 0.3% |
| Yemen | 203 | 0.0% |
| Zaire | 162 | 0.0% |
| Zimbabwe | 458 | 0.0% | View All 133 Rows |
Sex and Age in Area Code 516
Sex and Age in Area Code 516
The most populous age groups in Area Code 516 are 55 to 59 Years (77,516 | 7.4%) for men and 55 to 59 Years (79,586 | 7.3%) for women.
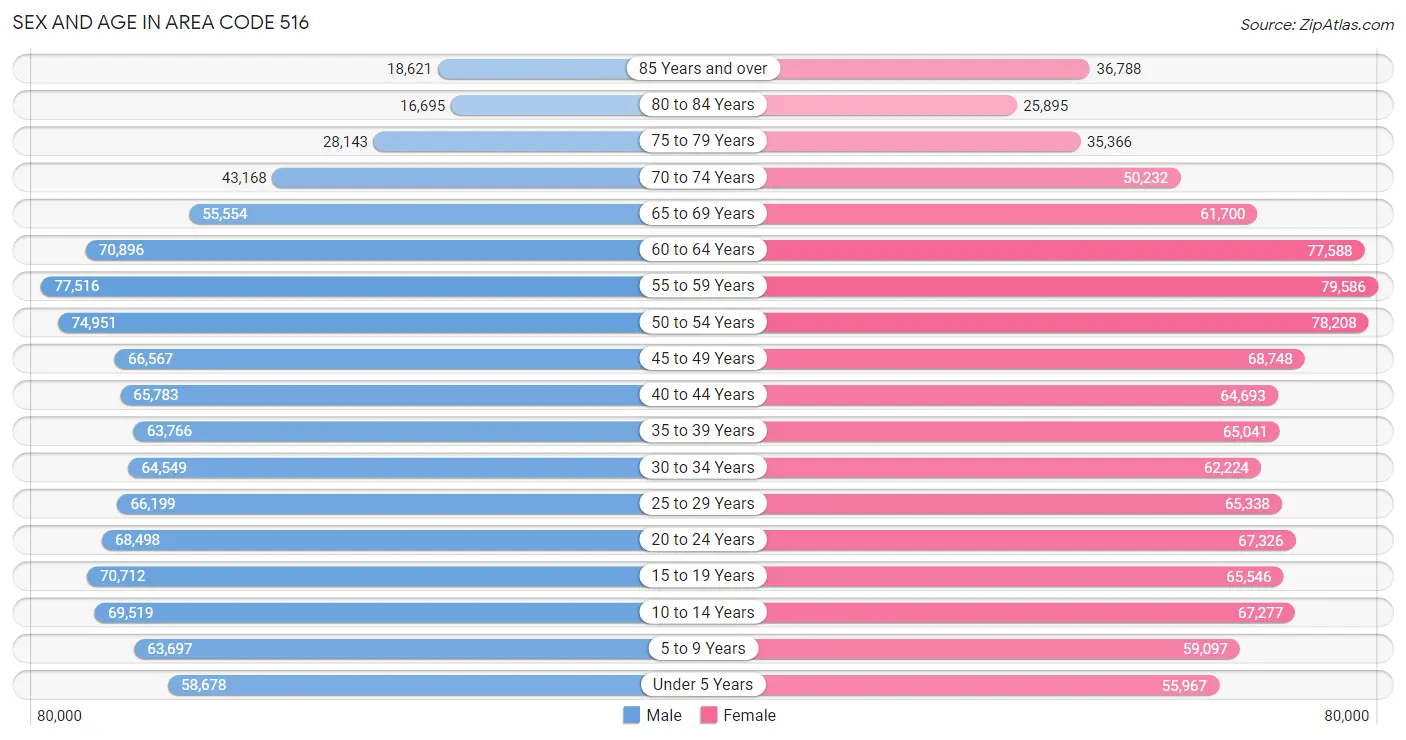
| Age Bracket | Male | Female |
| Under 5 Years | 58,678 (5.6%) | 55,967 (5.1%) |
| 5 to 9 Years | 63,697 (6.1%) | 59,097 (5.4%) |
| 10 to 14 Years | 69,519 (6.7%) | 67,277 (6.2%) |
| 15 to 19 Years | 70,712 (6.8%) | 65,546 (6.0%) |
| 20 to 24 Years | 68,498 (6.6%) | 67,326 (6.2%) |
| 25 to 29 Years | 66,199 (6.3%) | 65,338 (6.0%) |
| 30 to 34 Years | 64,549 (6.2%) | 62,224 (5.7%) |
| 35 to 39 Years | 63,766 (6.1%) | 65,041 (6.0%) |
| 40 to 44 Years | 65,783 (6.3%) | 64,693 (5.9%) |
| 45 to 49 Years | 66,567 (6.4%) | 68,748 (6.3%) |
| 50 to 54 Years | 74,951 (7.2%) | 78,208 (7.2%) |
| 55 to 59 Years | 77,516 (7.4%) | 79,586 (7.3%) |
| 60 to 64 Years | 70,896 (6.8%) | 77,588 (7.1%) |
| 65 to 69 Years | 55,554 (5.3%) | 61,700 (5.7%) |
| 70 to 74 Years | 43,168 (4.1%) | 50,232 (4.6%) |
| 75 to 79 Years | 28,143 (2.7%) | 35,366 (3.3%) |
| 80 to 84 Years | 16,695 (1.6%) | 25,895 (2.4%) |
| 85 Years and over | 18,621 (1.8%) | 36,788 (3.4%) |
| Total | 1,043,512 (100.0%) | 1,086,620 (100.0%) |
Families and Households in Area Code 516
Median Family Size in Area Code 516
The median family size in Area Code 516 is 3.45 persons per family, with married-couple families (395,589 | 75.9%) accounting for the largest median family size of 3.53489 persons per family. On the other hand, single male/father families (35,892 | 6.9%) represent the smallest median family size with 3.05 persons per family.
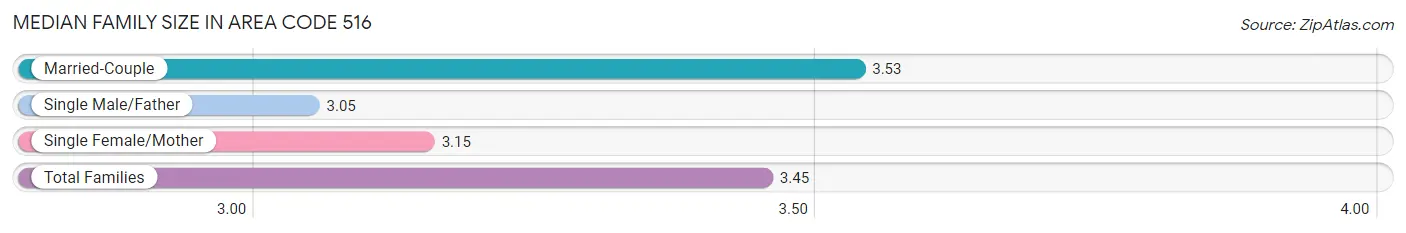
| Family Type | # Families | Family Size |
| Married-Couple | 395,589 (75.9%) | 3.53 |
| Single Male/Father | 35,892 (6.9%) | 3.05 |
| Single Female/Mother | 89,931 (17.2%) | 3.15 |
| Total Families | 521,412 (100.0%) | 3.45 |
Median Household Size in Area Code 516
The median household size in Area Code 516 is 3.01 persons per household, with married-couple households (395,589 | 57.3%) accounting for the largest median household size of 3.58891 persons per household. non-family households (168,944 | 24.5%) represent the smallest median household size with 1.25 persons per household.
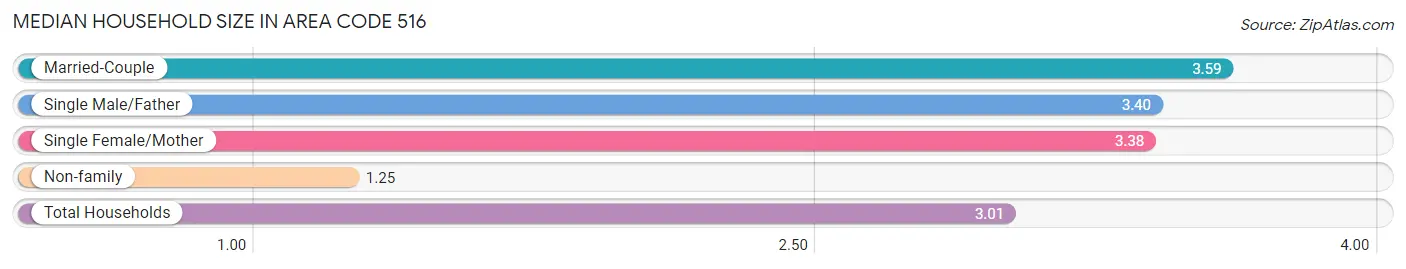
| Household Type | # Households | Household Size |
| Married-Couple | 395,589 (57.3%) | 3.59 |
| Single Male/Father | 35,892 (5.2%) | 3.40 |
| Single Female/Mother | 89,931 (13.0%) | 3.38 |
| Non-family | 168,944 (24.5%) | 1.25 |
| Total Households | 690,356 (100.0%) | 3.01 |
Household Size by Marriage Status in Area Code 516
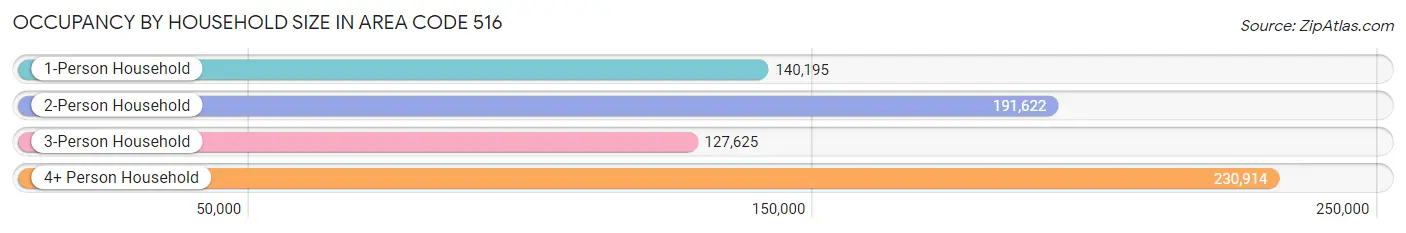
Out of a total of 690,356 households in Area Code 516, 521,412 (75.5%) are family households, while 168,944 (24.5%) are nonfamily households. The most numerous type of family households are 2-person households, comprising 168,784, and the most common type of nonfamily households are 1-person households, comprising 140,195.
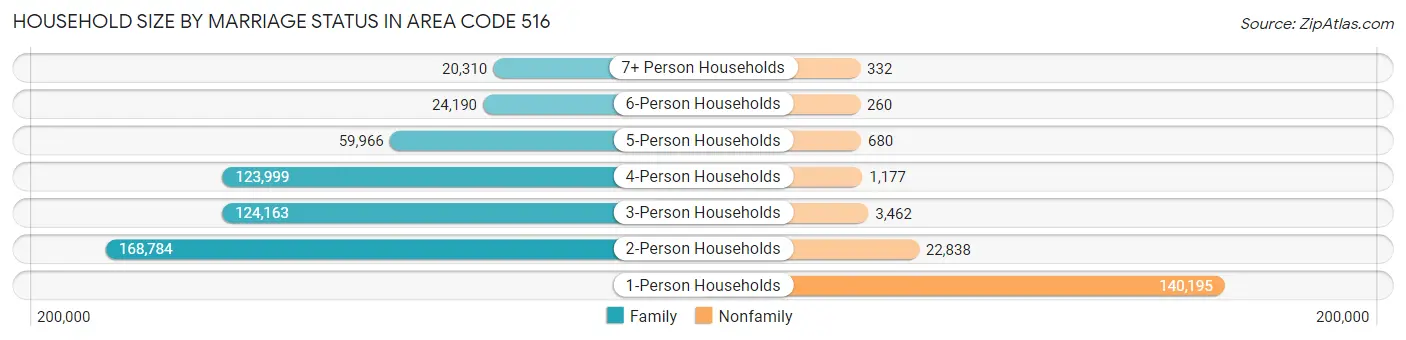
| Household Size | Family Households | Nonfamily Households |
| 1-Person Households | - | 140,195 (20.3%) |
| 2-Person Households | 168,784 (24.4%) | 22,838 (3.3%) |
| 3-Person Households | 124,163 (18.0%) | 3,462 (0.5%) |
| 4-Person Households | 123,999 (18.0%) | 1,177 (0.2%) |
| 5-Person Households | 59,966 (8.7%) | 680 (0.1%) |
| 6-Person Households | 24,190 (3.5%) | 260 (0.0%) |
| 7+ Person Households | 20,310 (2.9%) | 332 (0.1%) |
| Total | 521,412 (75.5%) | 168,944 (24.5%) |
Female Fertility in Area Code 516
Fertility by Age in Area Code 516
Average fertility rate in Area Code 516 is 51.1 births per 1,000 women. Women in the age bracket of 20 to 34 years have the highest fertility rate with 74.7 births per 1,000 women. Women in the age bracket of 20 to 34 years acount for 56.2% of all women with births.
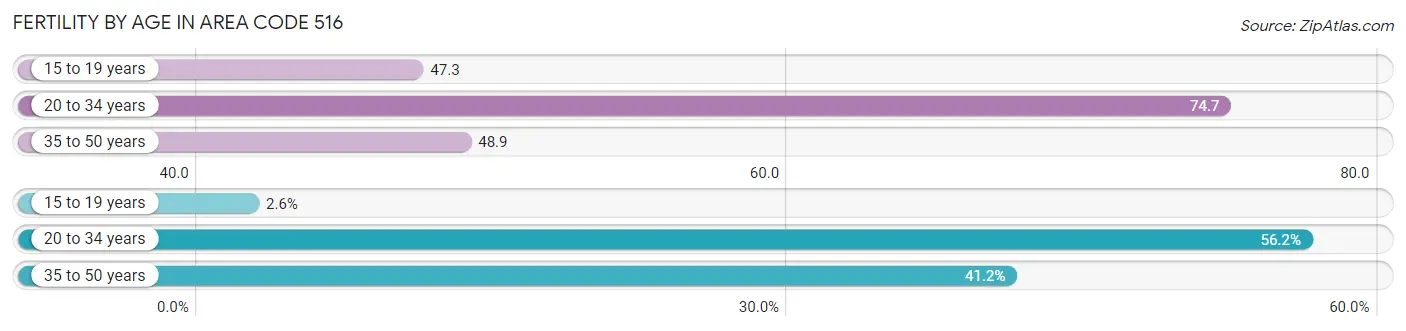
| Age Bracket | Women with Births | Births / 1,000 Women |
| 15 to 19 years | 613 (2.6%) | 47.3 |
| 20 to 34 years | 13,277 (56.2%) | 74.7 |
| 35 to 50 years | 9,726 (41.2%) | 48.9 |
| Total | 23,616 (100.0%) | 51.1 |
Fertility by Age by Marriage Status in Area Code 516
75.9% of women with births (23,616) in Area Code 516 are married. The highest percentage of unmarried women with births falls into 15 to 19 years age bracket with 98.5% of them unmarried at the time of birth, while the lowest percentage of unmarried women with births belong to 35 to 50 years age bracket with 26.0% of them unmarried.
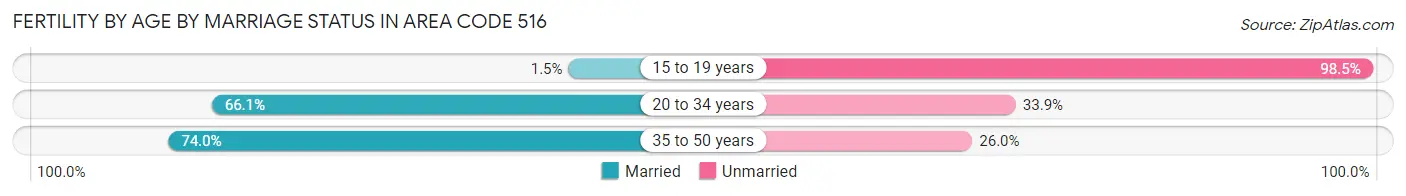
| Age Bracket | Married | Unmarried |
| 15 to 19 years | 9 (1.5%) | 604 (98.5%) |
| 20 to 34 years | 8,772 (66.1%) | 4,505 (33.9%) |
| 35 to 50 years | 7,193 (74.0%) | 2,533 (26.0%) |
| Total | 17,928 (75.9%) | 5,688 (24.1%) |
Fertility by Education in Area Code 516
Average fertility rate in Area Code 516 is 51.1 births per 1,000 women. Women with the education attainment of graduate degree have the highest fertility rate of 76.9 births per 1,000 women, while women with the education attainment of college or associate's degree have the lowest fertility at 51.7 births per 1,000 women. Women with the education attainment of graduate degree represent 28.3% of all women with births.
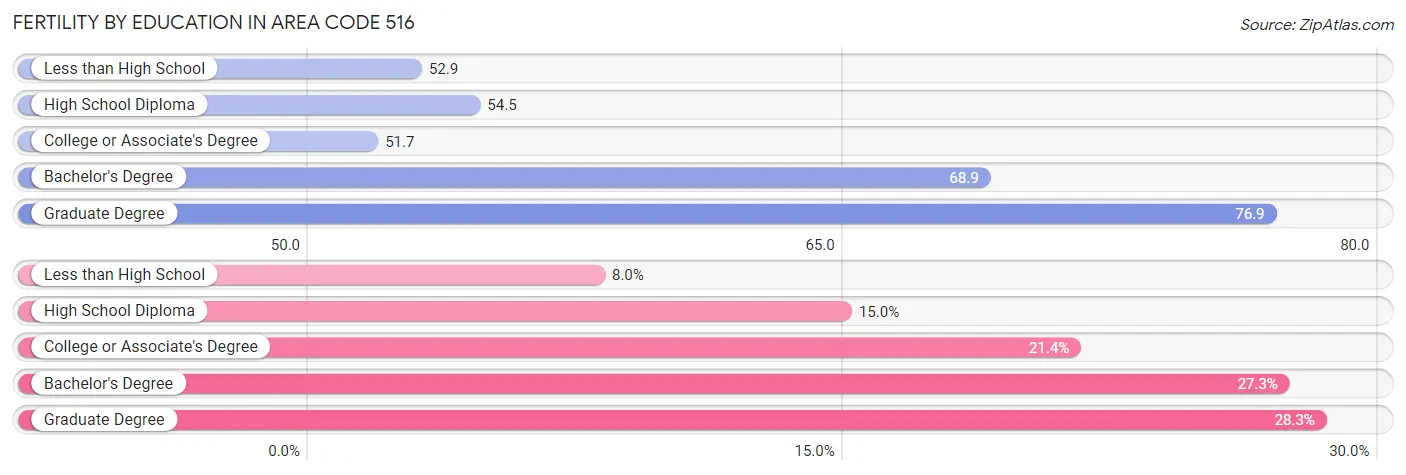
| Educational Attainment | Women with Births | Births / 1,000 Women |
| Less than High School | 1,897 (8.0%) | 52.9 |
| High School Diploma | 3,536 (15.0%) | 54.5 |
| College or Associate's Degree | 5,056 (21.4%) | 51.7 |
| Bachelor's Degree | 6,441 (27.3%) | 68.9 |
| Graduate Degree | 6,686 (28.3%) | 76.9 |
| Total | 23,616 (100.0%) | 51.1 |
Fertility by Education by Marriage Status in Area Code 516
24.1% of women with births in Area Code 516 are unmarried. Women with the educational attainment of graduate degree are most likely to be married with 77.4% of them married at childbirth, while women with the educational attainment of high school diploma are least likely to be married with 64.6% of them unmarried at childbirth.
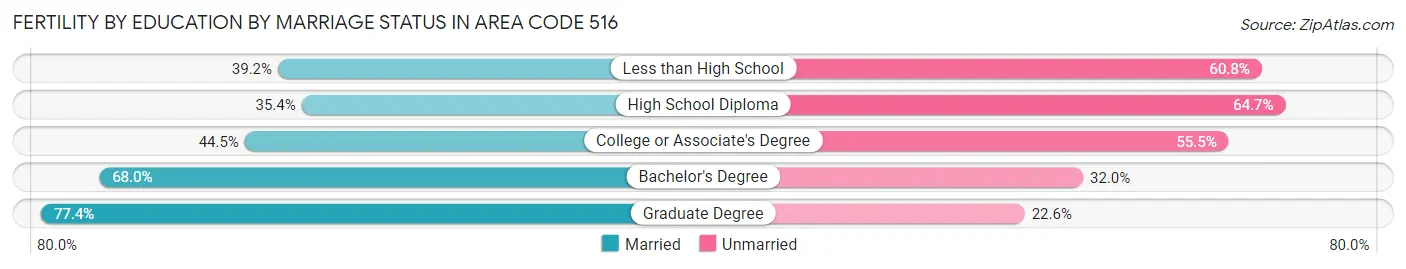
| Educational Attainment | Married | Unmarried |
| Less than High School | 743 (39.2%) | 1,154 (60.8%) |
| High School Diploma | 1,250 (35.3%) | 2,286 (64.6%) |
| College or Associate's Degree | 2,251 (44.5%) | 2,805 (55.5%) |
| Bachelor's Degree | 4,377 (68.0%) | 2,064 (32.0%) |
| Graduate Degree | 5,172 (77.4%) | 1,514 (22.6%) |
| Total | 17,928 (75.9%) | 5,688 (24.1%) |
Employment Characteristics in Area Code 516
Employment by Class of Employer in Area Code 516
Among the 1,048,879 employed individuals in Area Code 516, private company employees (661,923 | 63.1%), local government employees (125,714 | 12.0%), and not-for-profit organizations (96,121 | 9.2%) make up the most common classes of employment.
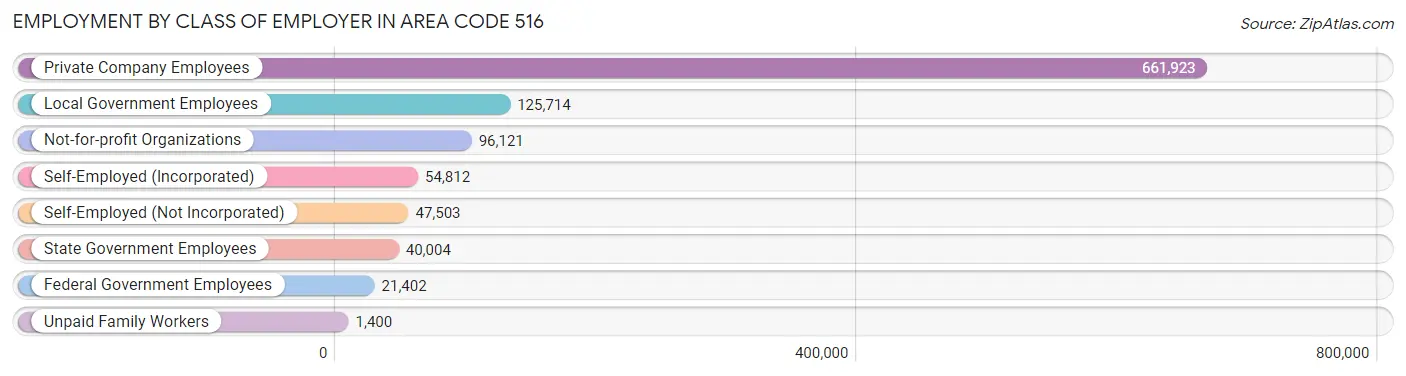
| Employer Class | # Employees | % Employees |
| Private Company Employees | 661,923 | 63.1% |
| Self-Employed (Incorporated) | 54,812 | 5.2% |
| Self-Employed (Not Incorporated) | 47,503 | 4.5% |
| Not-for-profit Organizations | 96,121 | 9.2% |
| Local Government Employees | 125,714 | 12.0% |
| State Government Employees | 40,004 | 3.8% |
| Federal Government Employees | 21,402 | 2.0% |
| Unpaid Family Workers | 1,400 | 0.1% |
| Total | 1,048,879 | 100.0% |
Employment Status by Age in Area Code 516
According to the labor force statistics for Area Code 516, out of the total population over 16 years of age (1,727,681), 64.2% or 1,109,171 individuals are in the labor force, with 4.8% or 53,462 of them unemployed. The age group with the highest labor force participation rate is 30 to 34 years, with 86.4% or 109,481 individuals in the labor force. Within the labor force, the 16 to 19 years age range has the highest percentage of unemployed individuals, with 1,323.7% or 398,725 of them being unemployed.
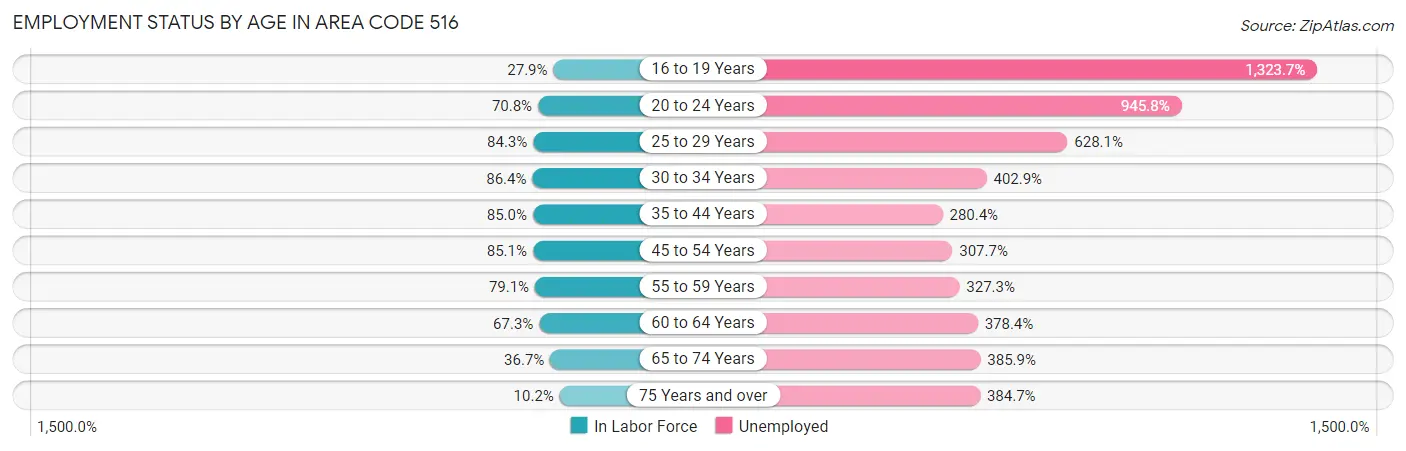
| Age Bracket | In Labor Force | Unemployed |
| 16 to 19 Years | 30,125 (27.9%) | 398,725 (1,323.7%) |
| 20 to 24 Years | 96,127 (70.8%) | 909,131 (945.8%) |
| 25 to 29 Years | 110,854 (84.3%) | 696,305 (628.1%) |
| 30 to 34 Years | 109,480 (86.4%) | 441,099 (402.9%) |
| 35 to 44 Years | 220,368 (85.0%) | 617,903 (280.4%) |
| 45 to 54 Years | 245,473 (85.1%) | 755,290 (307.7%) |
| 55 to 59 Years | 124,283 (79.1%) | 406,778 (327.3%) |
| 60 to 64 Years | 99,996 (67.3%) | 378,358 (378.4%) |
| 65 to 74 Years | 77,287 (36.7%) | 298,258 (385.9%) |
| 75 Years and over | 16,519 (10.2%) | 63,560 (384.7%) |
| Total | 1,109,208 (64.2%) | 53,421 (4.8%) |
Employment Status by Educational Attainment in Area Code 516
According to labor force statistics for Area Code 516, 81.0% of individuals (900,439) out of the total population between 25 and 64 years of age (1,111,653) are in the labor force, with 355.9% or 3,204,662 of them being unemployed. The group with the highest labor force participation rate are those with the educational attainment of bachelor's degree or higher, with 86.2% or 442,271 individuals in the labor force. Within the labor force, individuals with high school diploma education have the highest percentage of unemployment, with 453.0% or 769,896 of them being unemployed.
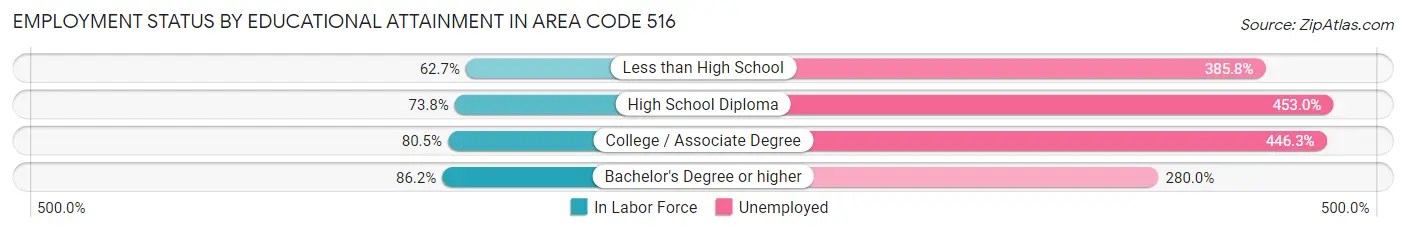
| Educational Attainment | In Labor Force | Unemployed |
| Less than High School | 60,578 (62.7%) | 372,745 (385.8%) |
| High School Diploma | 169,951 (73.8%) | 1,043,644 (453.0%) |
| College / Associate Degree | 218,420 (80.5%) | 1,211,517 (446.3%) |
| Bachelor's Degree or higher | 442,296 (86.2%) | 1,436,943 (280.0%) |
| Total | 900,439 (81.0%) | 3,956,373 (355.9%) |
Employment Occupations by Sex in Area Code 516
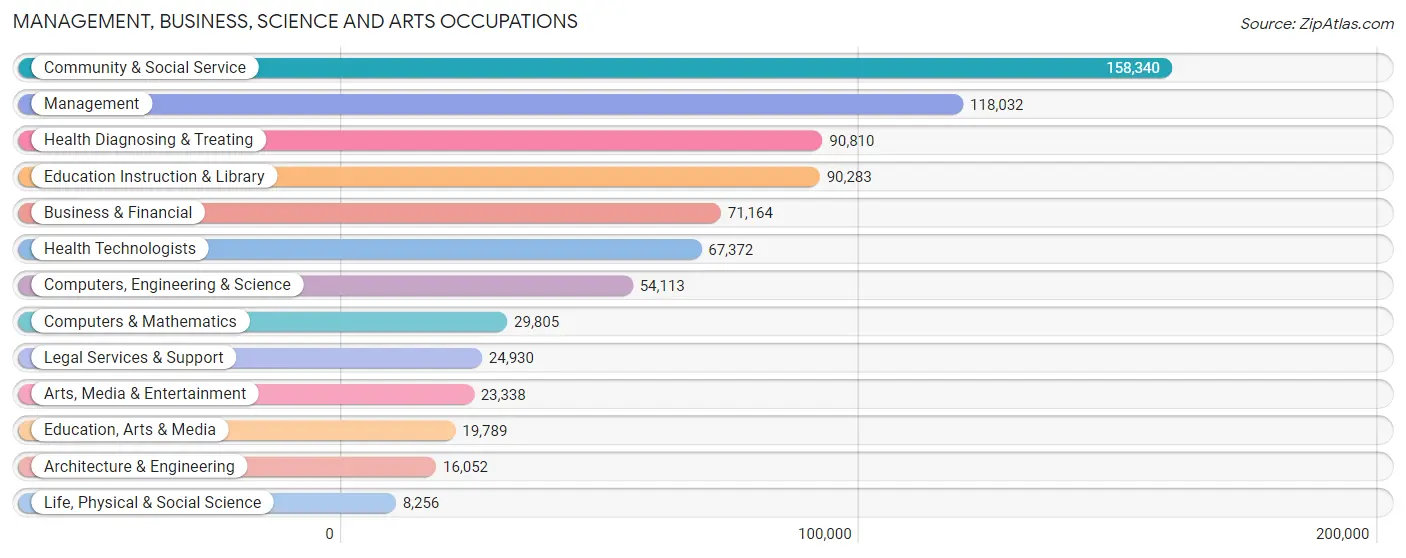
Management, Business, Science and Arts Occupations
The most common Management, Business, Science and Arts occupations in Area Code 516 are Community & Social Service (158,340 | 14.8%), Management (118,032 | 11.0%), Health Diagnosing & Treating (90,810 | 8.5%), Education Instruction & Library (90,283 | 8.4%), and Business & Financial (71,164 | 6.6%).
Management, Business, Science and Arts Occupations by Sex
Within the Management, Business, Science and Arts occupations in Area Code 516, the most male-oriented occupations are Architecture & Engineering (83.9%), Computers & Mathematics (77.4%), and Computers, Engineering & Science (74.4%), while the most female-oriented occupations are Education Instruction & Library (73.9%), Education, Arts & Media (71.4%), and Health Technologists (68.7%).
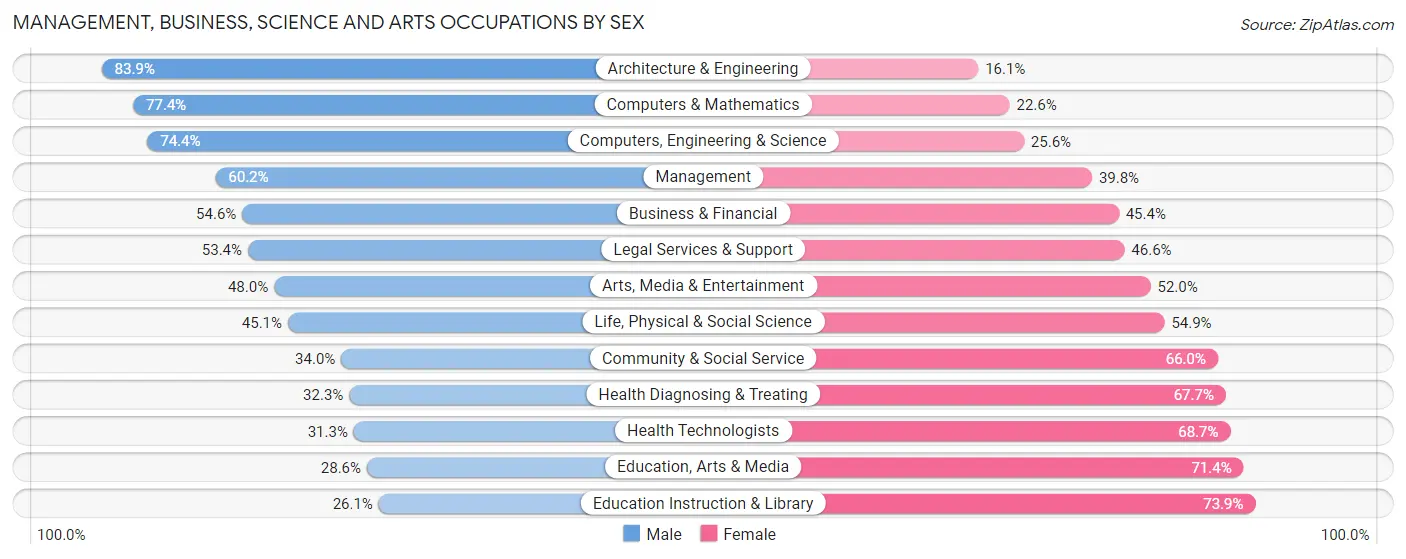
| Occupation | Male | Female |
| Management | 71,059 (60.2%) | 46,973 (39.8%) |
| Business & Financial | 38,867 (54.6%) | 32,297 (45.4%) |
| Computers, Engineering & Science | 40,261 (74.4%) | 13,852 (25.6%) |
| Computers & Mathematics | 23,067 (77.4%) | 6,738 (22.6%) |
| Architecture & Engineering | 13,472 (83.9%) | 2,580 (16.1%) |
| Life, Physical & Social Science | 3,722 (45.1%) | 4,534 (54.9%) |
| Community & Social Service | 53,767 (34.0%) | 104,573 (66.0%) |
| Education, Arts & Media | 5,659 (28.6%) | 14,130 (71.4%) |
| Legal Services & Support | 13,321 (53.4%) | 11,609 (46.6%) |
| Education Instruction & Library | 23,590 (26.1%) | 66,693 (73.9%) |
| Arts, Media & Entertainment | 11,197 (48.0%) | 12,141 (52.0%) |
| Health Diagnosing & Treating | 29,332 (32.3%) | 61,478 (67.7%) |
| Health Technologists | 21,116 (31.3%) | 46,256 (68.7%) |
| Total (Category) | 233,286 (47.4%) | 259,173 (52.6%) |
| Total (Overall) | 560,133 (52.2%) | 512,006 (47.8%) |
Services Occupations
The most common Services occupations in Area Code 516 are Healthcare Support (42,399 | 4.0%), Food Preparation & Serving (38,999 | 3.6%), Security & Protection (37,323 | 3.5%), Cleaning & Maintenance (34,435 | 3.2%), and Personal Care & Service (29,421 | 2.7%).
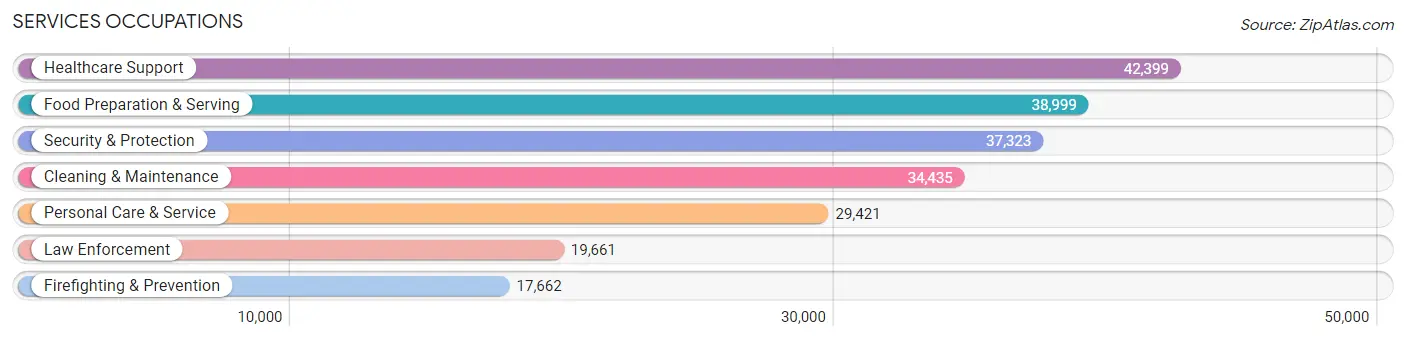
Services Occupations by Sex
Within the Services occupations in Area Code 516, the most male-oriented occupations are Law Enforcement (80.9%), Security & Protection (77.8%), and Firefighting & Prevention (74.3%), while the most female-oriented occupations are Healthcare Support (83.0%), Personal Care & Service (72.3%), and Food Preparation & Serving (47.5%).
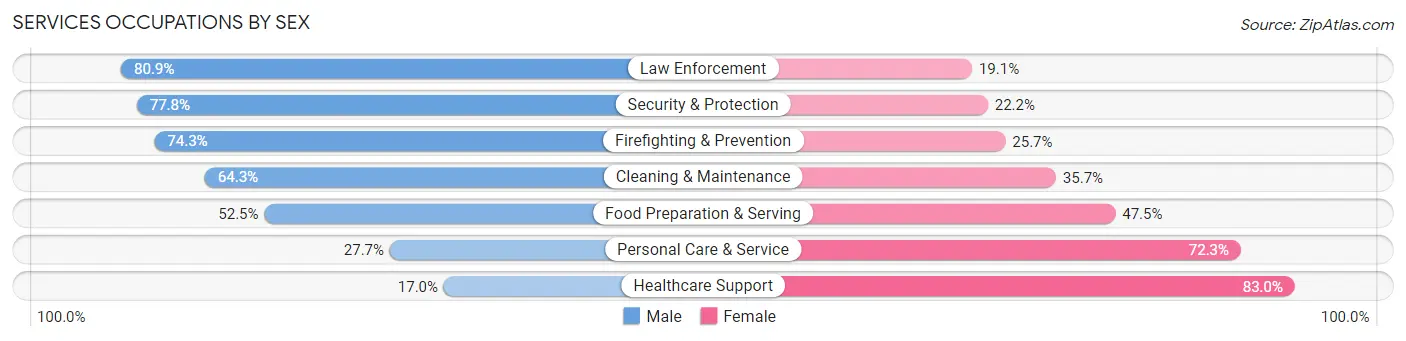
| Occupation | Male | Female |
| Healthcare Support | 7,198 (17.0%) | 35,201 (83.0%) |
| Security & Protection | 29,026 (77.8%) | 8,297 (22.2%) |
| Firefighting & Prevention | 13,121 (74.3%) | 4,541 (25.7%) |
| Law Enforcement | 15,905 (80.9%) | 3,756 (19.1%) |
| Food Preparation & Serving | 20,481 (52.5%) | 18,518 (47.5%) |
| Cleaning & Maintenance | 22,137 (64.3%) | 12,298 (35.7%) |
| Personal Care & Service | 8,140 (27.7%) | 21,281 (72.3%) |
| Total (Category) | 86,982 (47.6%) | 95,595 (52.4%) |
| Total (Overall) | 560,133 (52.2%) | 512,006 (47.8%) |
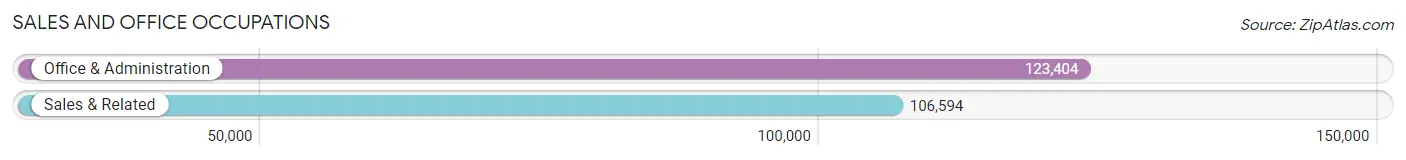
Sales and Office Occupations
The most common Sales and Office occupations in Area Code 516 are Office & Administration (123,404 | 11.5%), and Sales & Related (106,594 | 9.9%).
Sales and Office Occupations by Sex
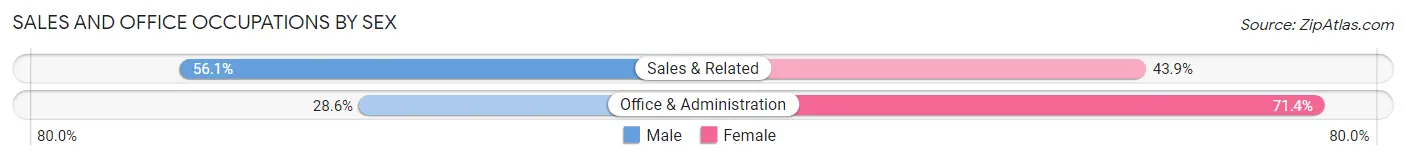
| Occupation | Male | Female |
| Sales & Related | 59,805 (56.1%) | 46,789 (43.9%) |
| Office & Administration | 35,260 (28.6%) | 88,144 (71.4%) |
| Total (Category) | 95,065 (41.3%) | 134,933 (58.7%) |
| Total (Overall) | 560,133 (52.2%) | 512,006 (47.8%) |
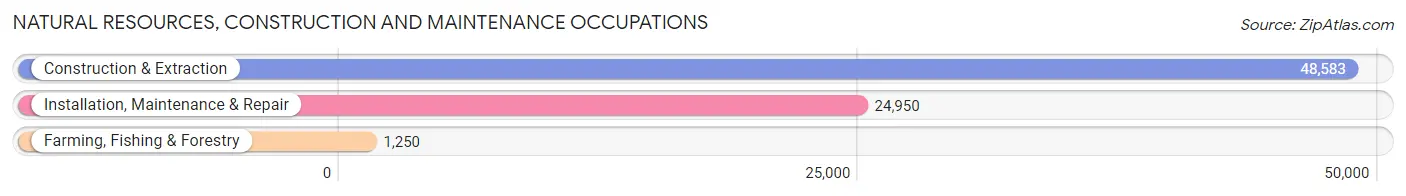
Natural Resources, Construction and Maintenance Occupations
The most common Natural Resources, Construction and Maintenance occupations in Area Code 516 are Construction & Extraction (48,583 | 4.5%), Installation, Maintenance & Repair (24,950 | 2.3%), and Farming, Fishing & Forestry (1,250 | 0.1%).
Natural Resources, Construction and Maintenance Occupations by Sex
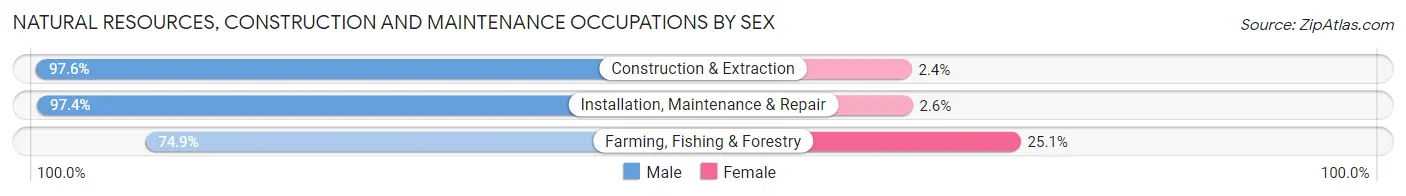
| Occupation | Male | Female |
| Farming, Fishing & Forestry | 936 (74.9%) | 314 (25.1%) |
| Construction & Extraction | 47,414 (97.6%) | 1,169 (2.4%) |
| Installation, Maintenance & Repair | 24,297 (97.4%) | 653 (2.6%) |
| Total (Category) | 72,647 (97.1%) | 2,136 (2.9%) |
| Total (Overall) | 560,133 (52.2%) | 512,006 (47.8%) |
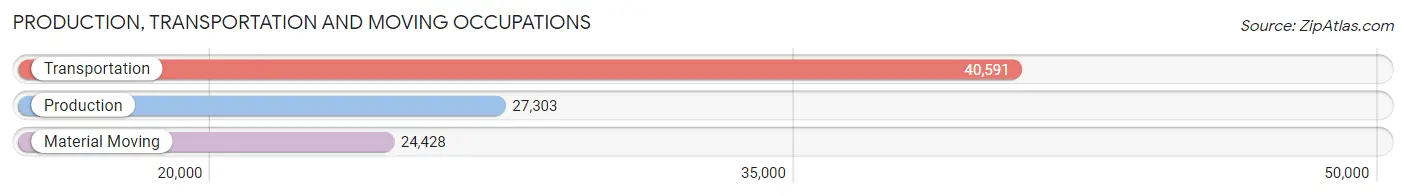
Production, Transportation and Moving Occupations
The most common Production, Transportation and Moving occupations in Area Code 516 are Transportation (40,591 | 3.8%), Production (27,303 | 2.5%), and Material Moving (24,428 | 2.3%).
Production, Transportation and Moving Occupations by Sex
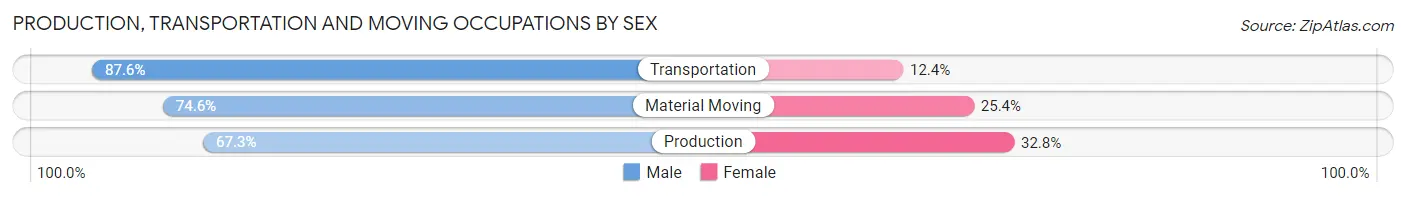
| Occupation | Male | Female |
| Production | 18,361 (67.2%) | 8,942 (32.8%) |
| Transportation | 35,565 (87.6%) | 5,026 (12.4%) |
| Material Moving | 18,227 (74.6%) | 6,201 (25.4%) |
| Total (Category) | 72,153 (78.1%) | 20,169 (21.8%) |
| Total (Overall) | 560,133 (52.2%) | 512,006 (47.8%) |
Employment Industries by Sex in Area Code 516
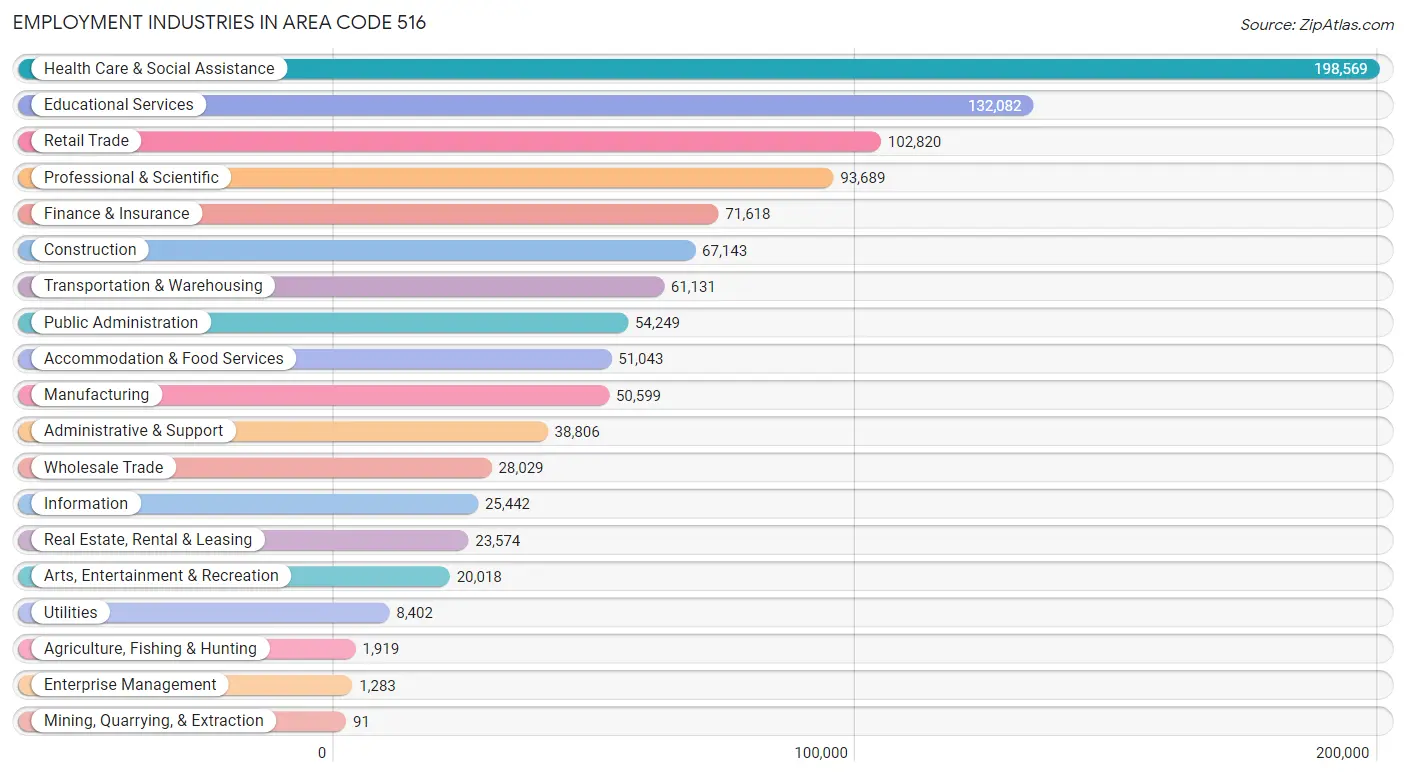
Employment Industries in Area Code 516
The major employment industries in Area Code 516 include Health Care & Social Assistance (198,569 | 18.5%), Educational Services (132,082 | 12.3%), Retail Trade (102,820 | 9.6%), Professional & Scientific (93,689 | 8.7%), and Finance & Insurance (71,618 | 6.7%).
Employment Industries by Sex in Area Code 516
The Area Code 516 industries that see more men than women are Construction (90.1%), Mining, Quarrying, & Extraction (89.0%), and Utilities (82.6%), whereas the industries that tend to have a higher number of women are Health Care & Social Assistance (71.9%), Educational Services (70.1%), and Enterprise Management (46.9%).
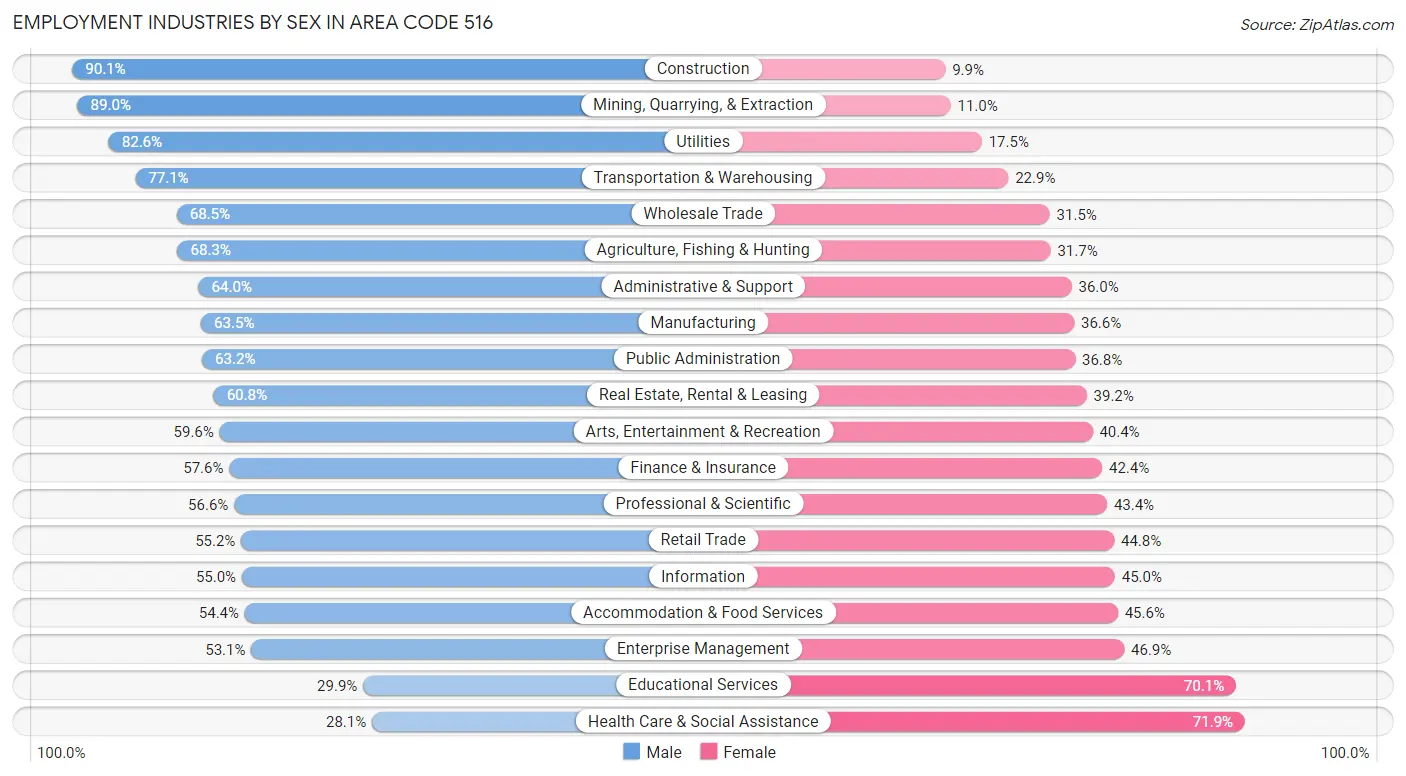
| Industry | Male | Female |
| Agriculture, Fishing & Hunting | 1,311 (68.3%) | 608 (31.7%) |
| Mining, Quarrying, & Extraction | 81 (89.0%) | 10 (11.0%) |
| Construction | 60,500 (90.1%) | 6,643 (9.9%) |
| Manufacturing | 32,105 (63.4%) | 18,494 (36.5%) |
| Wholesale Trade | 19,198 (68.5%) | 8,831 (31.5%) |
| Retail Trade | 56,721 (55.2%) | 46,099 (44.8%) |
| Transportation & Warehousing | 47,109 (77.1%) | 14,022 (22.9%) |
| Utilities | 6,936 (82.6%) | 1,466 (17.4%) |
| Information | 13,996 (55.0%) | 11,446 (45.0%) |
| Finance & Insurance | 41,280 (57.6%) | 30,338 (42.4%) |
| Real Estate, Rental & Leasing | 14,343 (60.8%) | 9,231 (39.2%) |
| Professional & Scientific | 53,055 (56.6%) | 40,634 (43.4%) |
| Enterprise Management | 681 (53.1%) | 602 (46.9%) |
| Administrative & Support | 24,822 (64.0%) | 13,984 (36.0%) |
| Educational Services | 39,515 (29.9%) | 92,567 (70.1%) |
| Health Care & Social Assistance | 55,766 (28.1%) | 142,803 (71.9%) |
| Arts, Entertainment & Recreation | 11,936 (59.6%) | 8,082 (40.4%) |
| Accommodation & Food Services | 27,771 (54.4%) | 23,272 (45.6%) |
| Public Administration | 34,309 (63.2%) | 19,940 (36.8%) |
| Total | 560,133 (52.2%) | 512,006 (47.8%) |
Education in Area Code 516
School Enrollment in Area Code 516
The most common levels of schooling among the 522,572 students in Area Code 516 are high school (114,908 | 22.0%), college / undergraduate (111,483 | 21.3%), and middle school (105,999 | 20.3%).
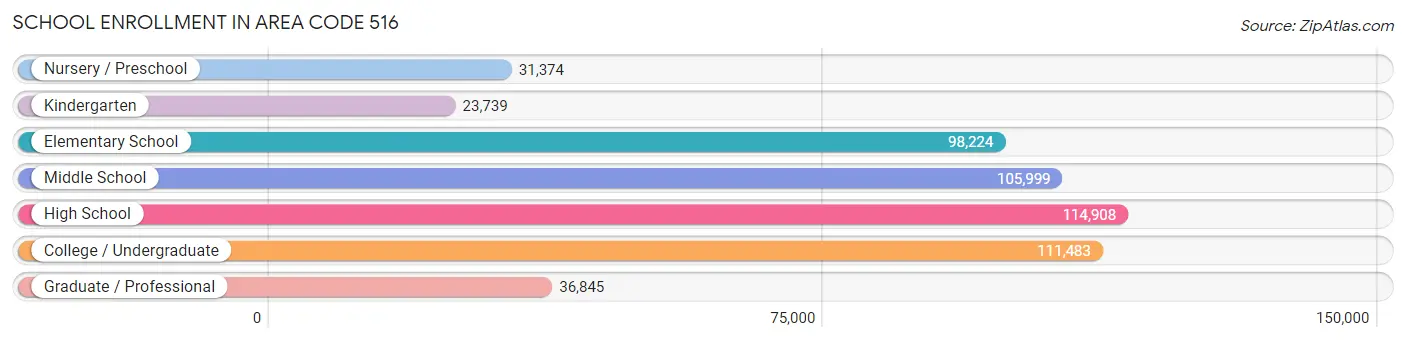
| School Level | # Students | % Students |
| Nursery / Preschool | 31,374 | 6.0% |
| Kindergarten | 23,739 | 4.5% |
| Elementary School | 98,224 | 18.8% |
| Middle School | 105,999 | 20.3% |
| High School | 114,908 | 22.0% |
| College / Undergraduate | 111,483 | 21.3% |
| Graduate / Professional | 36,845 | 7.0% |
| Total | 522,572 | 100.0% |
School Enrollment by Age by Funding Source in Area Code 516
Out of a total of 522,572 students who are enrolled in schools in Area Code 516, 123,459 (23.6%) attend a private institution, while the remaining 399,113 (76.4%) are enrolled in public schools. The age group of 3 to 4 year olds has the highest likelihood of being enrolled in private schools, with 13,375 (48.3% in the age bracket) enrolled. Conversely, the age group of 10 to 14 year olds has the lowest likelihood of being enrolled in a private school, with 116,450 (87.3% in the age bracket) attending a public institution.
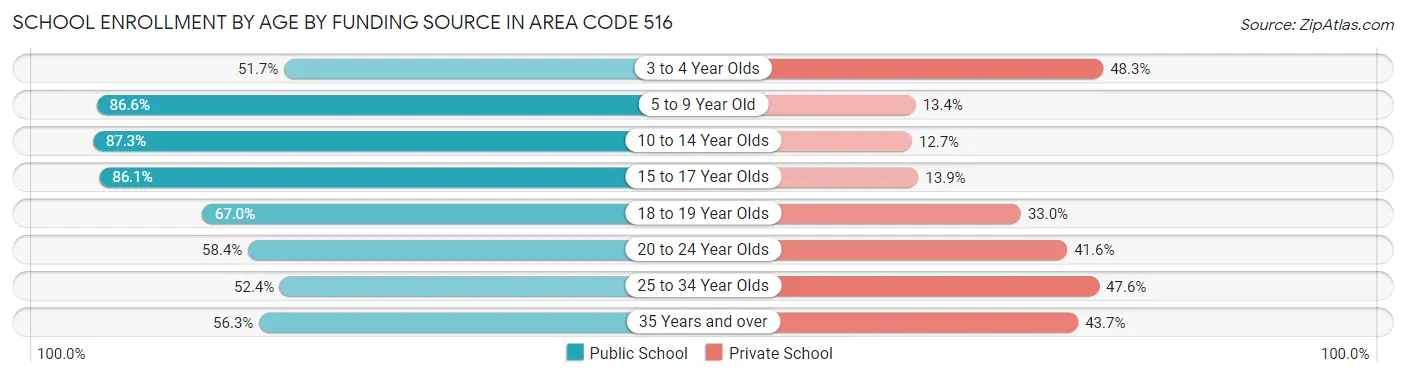
| Age Bracket | Public School | Private School |
| 3 to 4 Year Olds | 14,295 (51.7%) | 13,375 (48.3%) |
| 5 to 9 Year Old | 102,531 (86.6%) | 15,890 (13.4%) |
| 10 to 14 Year Olds | 116,450 (87.3%) | 16,974 (12.7%) |
| 15 to 17 Year Olds | 70,207 (86.1%) | 11,352 (13.9%) |
| 18 to 19 Year Olds | 28,212 (67.0%) | 13,908 (33.0%) |
| 20 to 24 Year Olds | 37,592 (58.4%) | 26,817 (41.6%) |
| 25 to 34 Year Olds | 14,928 (52.4%) | 13,554 (47.6%) |
| 35 Years and over | 14,914 (56.3%) | 11,573 (43.7%) |
| Total | 399,113 (76.4%) | 123,459 (23.6%) |
Educational Attainment by Field of Study in Area Code 516
Business (153,142 | 22.2%), education (81,604 | 11.8%), science & technology (76,145 | 11.1%), social sciences (60,482 | 8.8%), and psychology (42,730 | 6.2%) are the most common fields of study among 689,080 individuals in Area Code 516 who have obtained a bachelor's degree or higher.
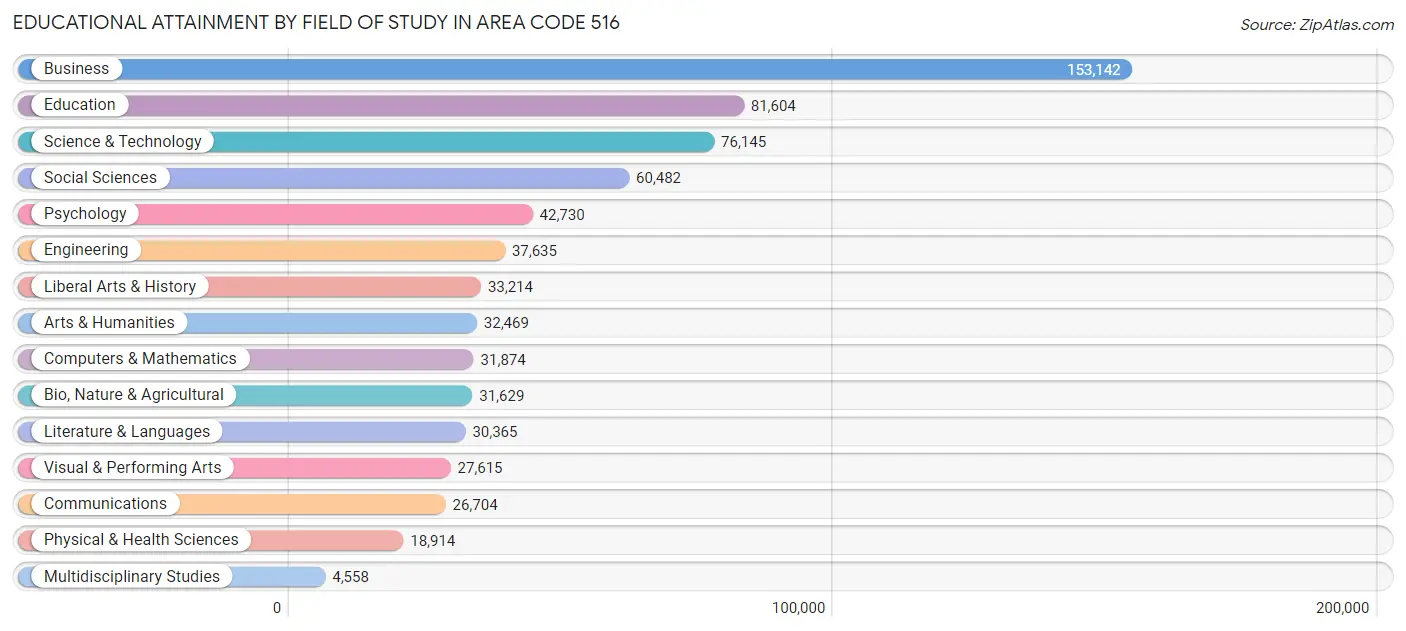
| Field of Study | # Graduates | % Graduates |
| Computers & Mathematics | 31,874 | 4.6% |
| Bio, Nature & Agricultural | 31,629 | 4.6% |
| Physical & Health Sciences | 18,914 | 2.7% |
| Psychology | 42,730 | 6.2% |
| Social Sciences | 60,482 | 8.8% |
| Engineering | 37,635 | 5.5% |
| Multidisciplinary Studies | 4,558 | 0.7% |
| Science & Technology | 76,145 | 11.1% |
| Business | 153,142 | 22.2% |
| Education | 81,604 | 11.8% |
| Literature & Languages | 30,365 | 4.4% |
| Liberal Arts & History | 33,214 | 4.8% |
| Visual & Performing Arts | 27,615 | 4.0% |
| Communications | 26,704 | 3.9% |
| Arts & Humanities | 32,469 | 4.7% |
| Total | 689,080 | 100.0% |
Transportation & Commute in Area Code 516
Vehicle Availability by Sex in Area Code 516
The most prevalent vehicle ownership categories in Area Code 516 are males with 2 vehicles (221,507, accounting for 40.4%) and females with 2 vehicles (189,324, making up 44.7%).
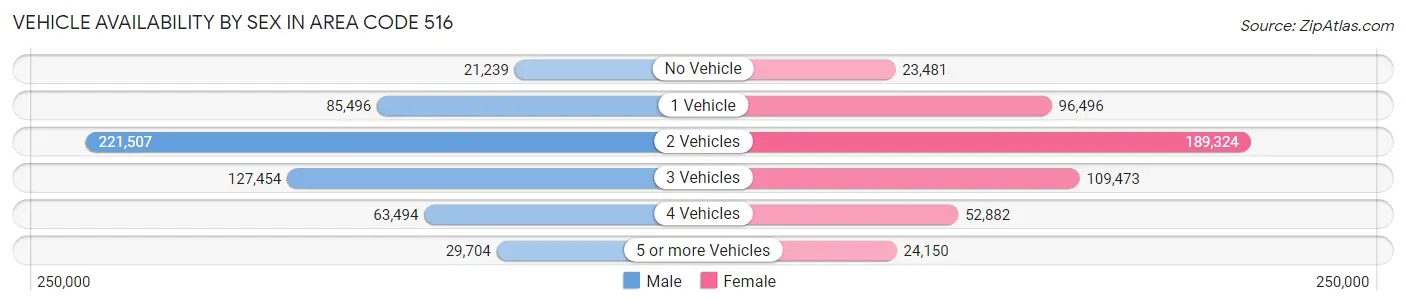
| Vehicles Available | Male | Female |
| No Vehicle | 21,239 (3.9%) | 23,481 (4.7%) |
| 1 Vehicle | 85,496 (15.6%) | 96,496 (19.5%) |
| 2 Vehicles | 221,507 (40.4%) | 189,324 (38.2%) |
| 3 Vehicles | 127,454 (23.2%) | 109,473 (22.1%) |
| 4 Vehicles | 63,494 (11.6%) | 52,882 (10.7%) |
| 5 or more Vehicles | 29,704 (5.4%) | 24,150 (4.9%) |
| Total | 548,894 (100.0%) | 495,806 (100.0%) |
Commute Time in Area Code 516
The most frequently occuring commute durations in Area Code 516 are 30 to 34 minutes (138,040 commuters, 14.8%), 60 to 89 minutes (129,400 commuters, 13.8%), and 20 to 24 minutes (109,001 commuters, 11.7%).
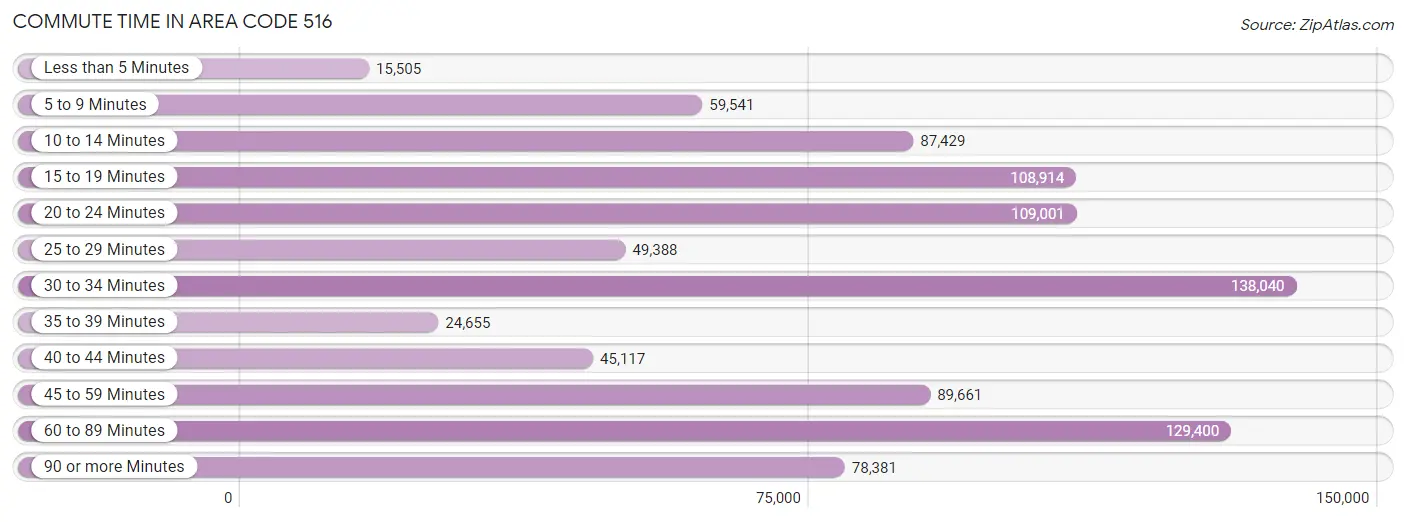
| Commute Time | # Commuters | % Commuters |
| Less than 5 Minutes | 15,505 | 1.7% |
| 5 to 9 Minutes | 59,541 | 6.4% |
| 10 to 14 Minutes | 87,429 | 9.3% |
| 15 to 19 Minutes | 108,914 | 11.7% |
| 20 to 24 Minutes | 109,001 | 11.7% |
| 25 to 29 Minutes | 49,388 | 5.3% |
| 30 to 34 Minutes | 138,040 | 14.8% |
| 35 to 39 Minutes | 24,655 | 2.6% |
| 40 to 44 Minutes | 45,117 | 4.8% |
| 45 to 59 Minutes | 89,661 | 9.6% |
| 60 to 89 Minutes | 129,400 | 13.8% |
| 90 or more Minutes | 78,381 | 8.4% |
Commute Time by Sex in Area Code 516
The most common commute times in Area Code 516 are 60 to 89 minutes (79,493 commuters, 16.1%) for males and 30 to 34 minutes (63,594 commuters, 14.4%) for females.
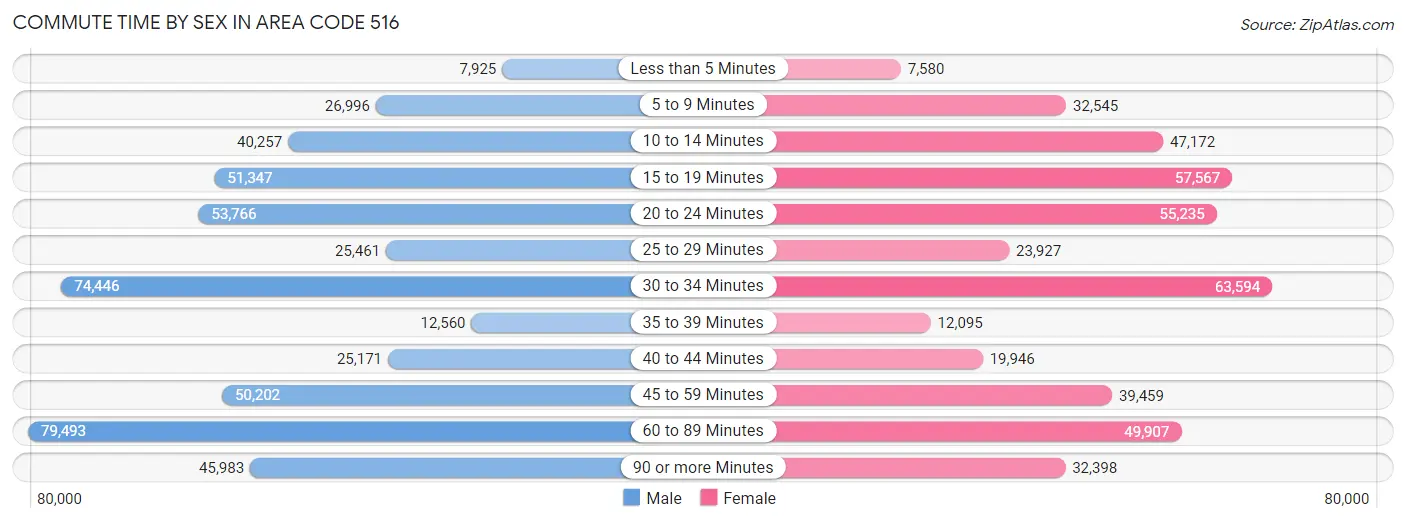
| Commute Time | Male | Female |
| Less than 5 Minutes | 7,925 (1.6%) | 7,580 (1.7%) |
| 5 to 9 Minutes | 26,996 (5.5%) | 32,545 (7.4%) |
| 10 to 14 Minutes | 40,257 (8.2%) | 47,172 (10.7%) |
| 15 to 19 Minutes | 51,347 (10.4%) | 57,567 (13.0%) |
| 20 to 24 Minutes | 53,766 (10.9%) | 55,235 (12.5%) |
| 25 to 29 Minutes | 25,461 (5.2%) | 23,927 (5.4%) |
| 30 to 34 Minutes | 74,446 (15.1%) | 63,594 (14.4%) |
| 35 to 39 Minutes | 12,560 (2.5%) | 12,095 (2.7%) |
| 40 to 44 Minutes | 25,171 (5.1%) | 19,946 (4.5%) |
| 45 to 59 Minutes | 50,202 (10.2%) | 39,459 (8.9%) |
| 60 to 89 Minutes | 79,493 (16.1%) | 49,907 (11.3%) |
| 90 or more Minutes | 45,983 (9.3%) | 32,398 (7.3%) |
Time of Departure to Work by Sex in Area Code 516
The most frequent times of departure to work in Area Code 516 are 7:00 AM to 7:29 AM (72,615, 14.7%) for males and 8:00 AM to 8:29 AM (73,935, 16.8%) for females.
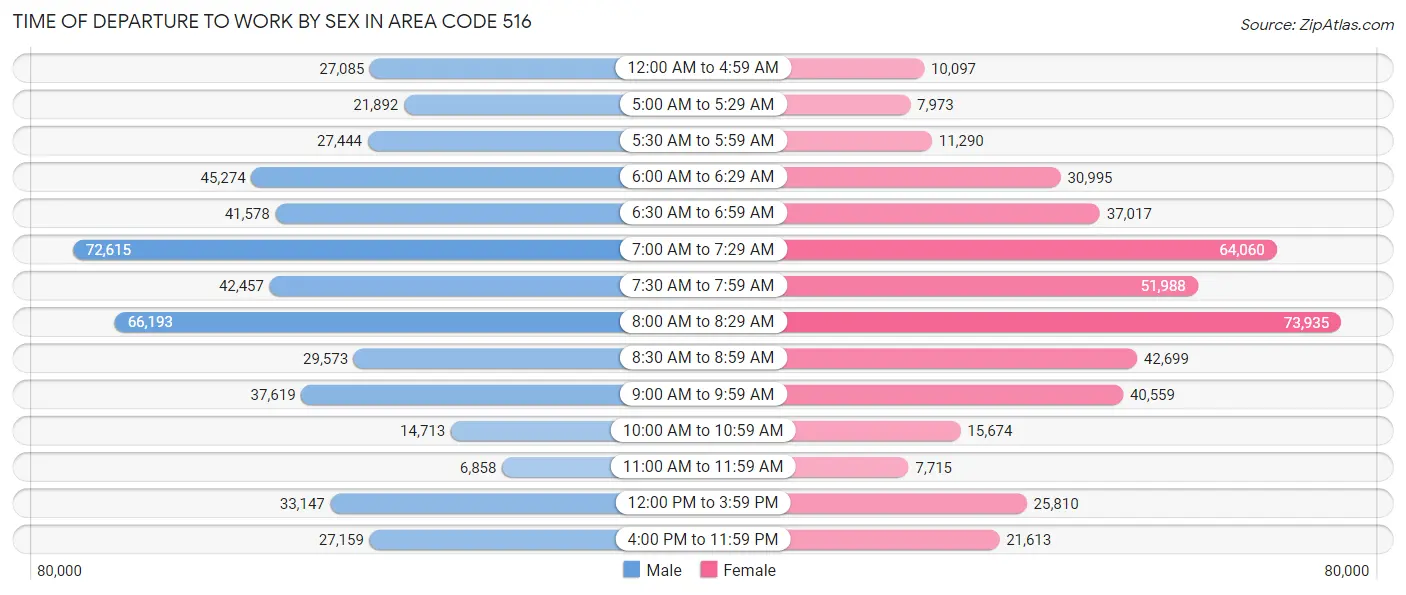
| Time of Departure | Male | Female |
| 12:00 AM to 4:59 AM | 27,085 (5.5%) | 10,097 (2.3%) |
| 5:00 AM to 5:29 AM | 21,892 (4.4%) | 7,973 (1.8%) |
| 5:30 AM to 5:59 AM | 27,444 (5.6%) | 11,290 (2.6%) |
| 6:00 AM to 6:29 AM | 45,274 (9.2%) | 30,995 (7.0%) |
| 6:30 AM to 6:59 AM | 41,578 (8.4%) | 37,017 (8.4%) |
| 7:00 AM to 7:29 AM | 72,615 (14.7%) | 64,060 (14.5%) |
| 7:30 AM to 7:59 AM | 42,457 (8.6%) | 51,988 (11.8%) |
| 8:00 AM to 8:29 AM | 66,193 (13.4%) | 73,935 (16.8%) |
| 8:30 AM to 8:59 AM | 29,573 (6.0%) | 42,699 (9.7%) |
| 9:00 AM to 9:59 AM | 37,619 (7.6%) | 40,559 (9.2%) |
| 10:00 AM to 10:59 AM | 14,713 (3.0%) | 15,674 (3.5%) |
| 11:00 AM to 11:59 AM | 6,858 (1.4%) | 7,715 (1.8%) |
| 12:00 PM to 3:59 PM | 33,147 (6.7%) | 25,810 (5.9%) |
| 4:00 PM to 11:59 PM | 27,159 (5.5%) | 21,613 (4.9%) |
| Total | 493,607 (100.0%) | 441,425 (100.0%) |
Housing Occupancy in Area Code 516
Occupancy by Ownership in Area Code 516
Of the total 690,356 dwellings in Area Code 516, owner-occupied units account for 538,932 (78.1%), while renter-occupied units make up 151,424 (21.9%).
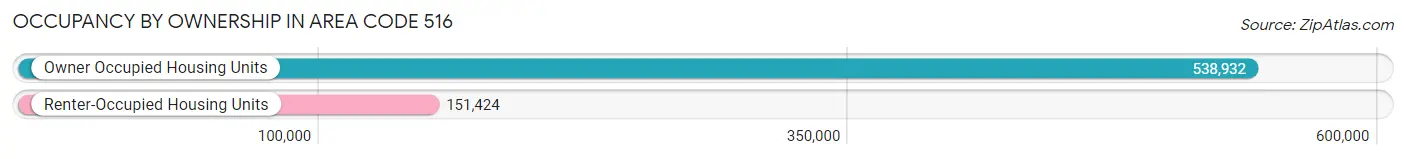
| Occupancy | # Housing Units | % Housing Units |
| Owner Occupied Housing Units | 538,932 | 78.1% |
| Renter-Occupied Housing Units | 151,424 | 21.9% |
| Total Occupied Housing Units | 690,356 | 100.0% |
Occupancy by Household Size in Area Code 516
| Household Size | # Housing Units | % Housing Units |
| 1-Person Household | 140,195 | 20.3% |
| 2-Person Household | 191,622 | 27.8% |
| 3-Person Household | 127,625 | 18.5% |
| 4+ Person Household | 230,914 | 33.5% |
| Total Housing Units | 690,356 | 100.0% |
Occupancy by Ownership by Household Size in Area Code 516
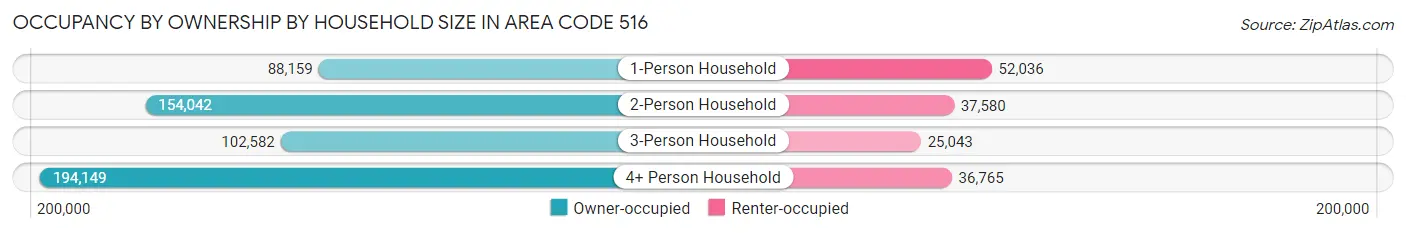
| Household Size | Owner-occupied | Renter-occupied |
| 1-Person Household | 88,159 (62.9%) | 52,036 (37.1%) |
| 2-Person Household | 154,042 (80.4%) | 37,580 (19.6%) |
| 3-Person Household | 102,582 (80.4%) | 25,043 (19.6%) |
| 4+ Person Household | 194,149 (84.1%) | 36,765 (15.9%) |
| Total Housing Units | 538,932 (78.1%) | 151,424 (21.9%) |
Occupancy by Educational Attainment in Area Code 516
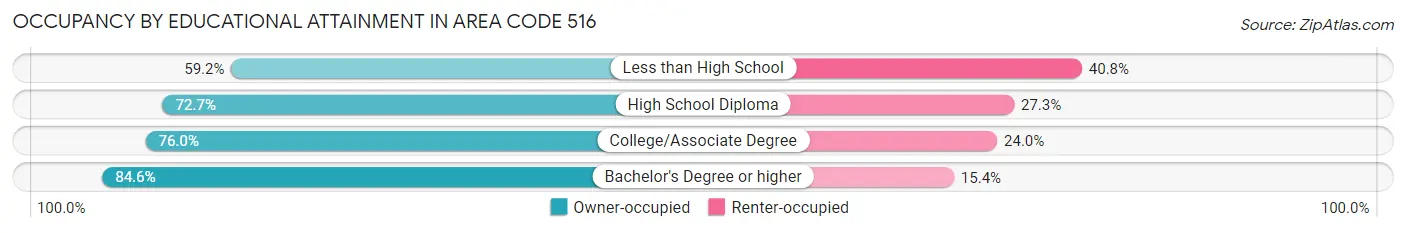
| Household Size | Owner-occupied | Renter-occupied |
| Less than High School | 30,664 (59.2%) | 21,119 (40.8%) |
| High School Diploma | 104,757 (72.7%) | 39,421 (27.3%) |
| College/Associate Degree | 130,230 (76.0%) | 41,086 (24.0%) |
| Bachelor's Degree or higher | 273,281 (84.6%) | 49,798 (15.4%) |
Occupancy by Age of Householder in Area Code 516
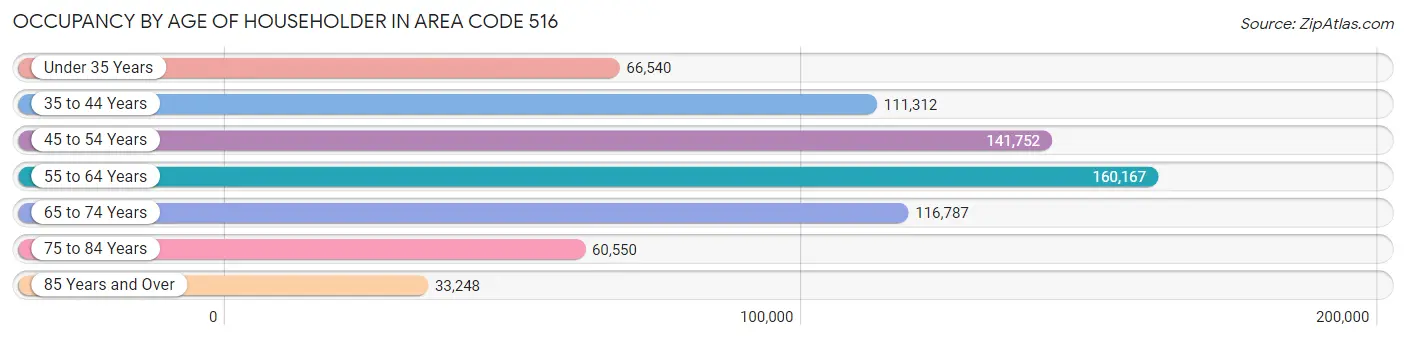
| Age Bracket | # Households | % Households |
| Under 35 Years | 66,540 | 9.6% |
| 35 to 44 Years | 111,312 | 16.1% |
| 45 to 54 Years | 141,752 | 20.5% |
| 55 to 64 Years | 160,167 | 23.2% |
| 65 to 74 Years | 116,787 | 16.9% |
| 75 to 84 Years | 60,550 | 8.8% |
| 85 Years and Over | 33,248 | 4.8% |
| Total | 690,356 | 100.0% |
Housing Finances in Area Code 516
Median Income by Occupancy in Area Code 516
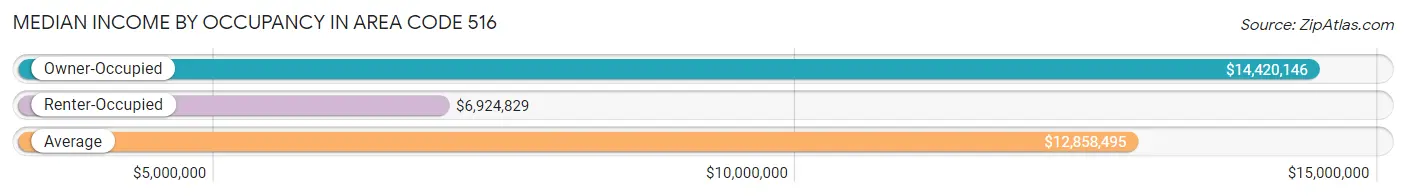
| Occupancy Type | # Households | Median Income |
| Owner-Occupied | 538,932 (78.1%) | $14,420,146 |
| Renter-Occupied | 151,424 (21.9%) | $6,924,829 |
| Average | 690,356 (100.0%) | $12,858,495 |
Occupancy by Householder Income Bracket in Area Code 516
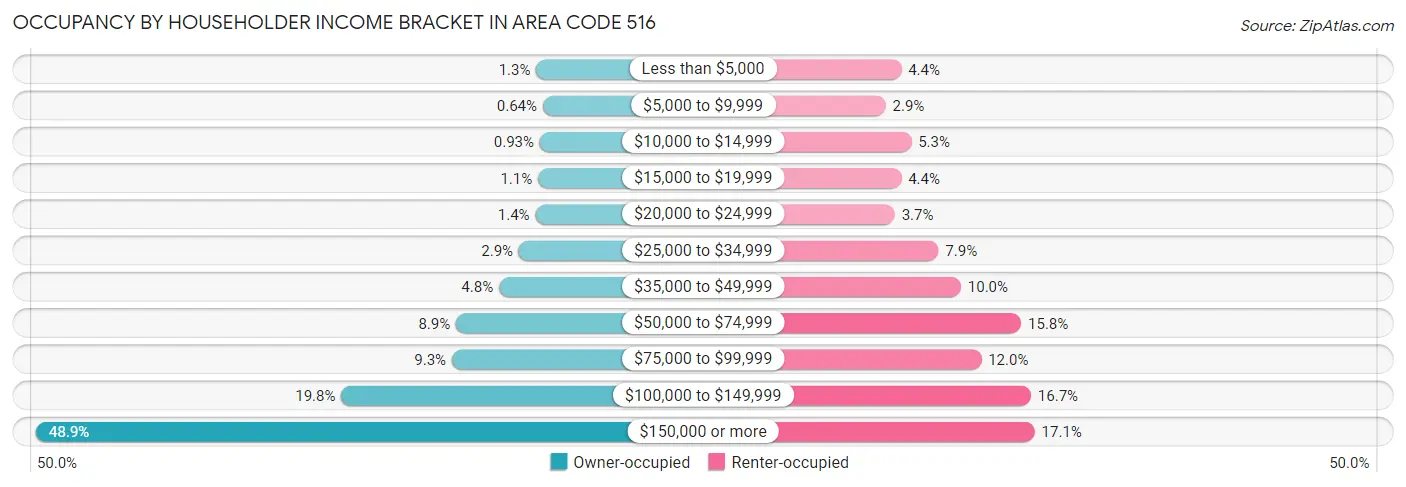
| Income Bracket | Owner-occupied | Renter-occupied |
| Less than $5,000 | 6,820 (1.3%) | 6,588 (4.3%) |
| $5,000 to $9,999 | 3,475 (0.6%) | 4,326 (2.9%) |
| $10,000 to $14,999 | 5,029 (0.9%) | 8,029 (5.3%) |
| $15,000 to $19,999 | 5,913 (1.1%) | 6,588 (4.3%) |
| $20,000 to $24,999 | 7,267 (1.3%) | 5,641 (3.7%) |
| $25,000 to $34,999 | 15,763 (2.9%) | 11,946 (7.9%) |
| $35,000 to $49,999 | 25,964 (4.8%) | 15,185 (10.0%) |
| $50,000 to $74,999 | 48,014 (8.9%) | 23,879 (15.8%) |
| $75,000 to $99,999 | 50,128 (9.3%) | 18,129 (12.0%) |
| $100,000 to $149,999 | 106,920 (19.8%) | 25,286 (16.7%) |
| $150,000 or more | 263,639 (48.9%) | 25,827 (17.1%) |
| Total | 538,932 (100.0%) | 151,424 (100.0%) |
Monthly Housing Cost Tiers in Area Code 516
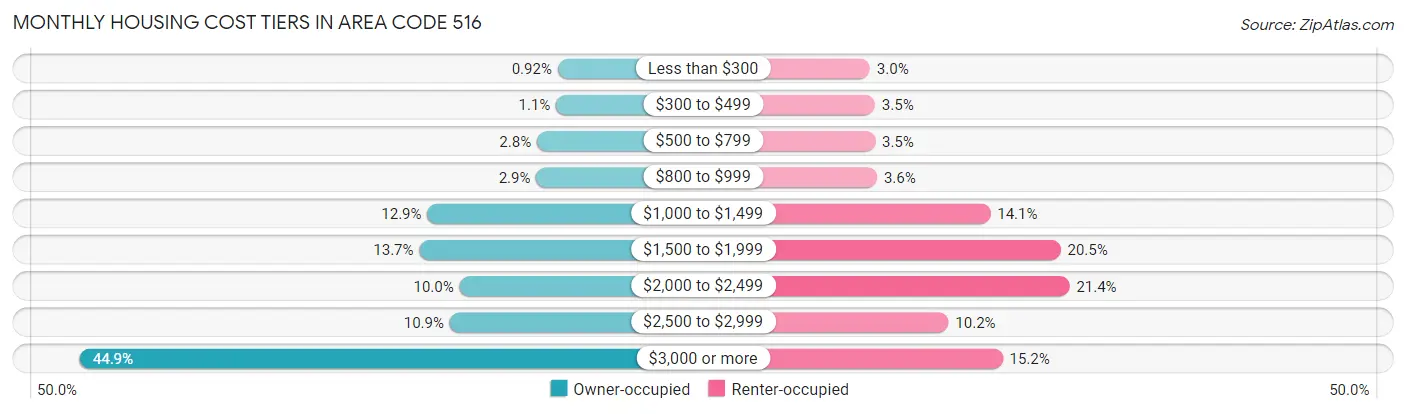
| Monthly Cost | Owner-occupied | Renter-occupied |
| Less than $300 | 4,985 (0.9%) | 4,526 (3.0%) |
| $300 to $499 | 5,703 (1.1%) | 5,225 (3.5%) |
| $500 to $799 | 15,227 (2.8%) | 5,236 (3.5%) |
| $800 to $999 | 15,549 (2.9%) | 5,510 (3.6%) |
| $1,000 to $1,499 | 69,632 (12.9%) | 21,305 (14.1%) |
| $1,500 to $1,999 | 73,629 (13.7%) | 31,095 (20.5%) |
| $2,000 to $2,499 | 53,676 (10.0%) | 32,338 (21.4%) |
| $2,500 to $2,999 | 58,523 (10.9%) | 15,473 (10.2%) |
| $3,000 or more | 242,008 (44.9%) | 23,009 (15.2%) |
| Total | 538,932 (100.0%) | 151,424 (100.0%) |
Physical Housing Characteristics in Area Code 516
Housing Structures in Area Code 516
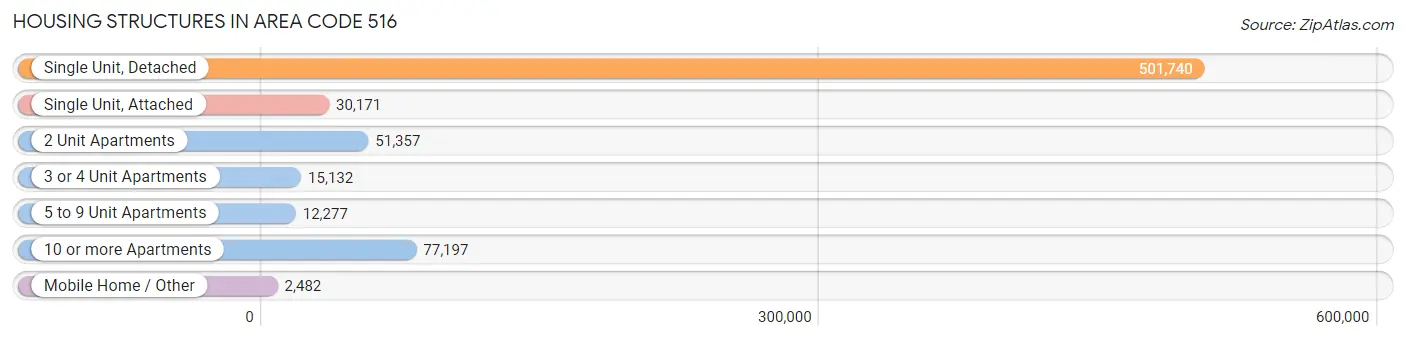
| Structure Type | # Housing Units | % Housing Units |
| Single Unit, Detached | 501,740 | 72.7% |
| Single Unit, Attached | 30,171 | 4.4% |
| 2 Unit Apartments | 51,357 | 7.4% |
| 3 or 4 Unit Apartments | 15,132 | 2.2% |
| 5 to 9 Unit Apartments | 12,277 | 1.8% |
| 10 or more Apartments | 77,197 | 11.2% |
| Mobile Home / Other | 2,482 | 0.4% |
| Total | 690,356 | 100.0% |
Housing Structures by Occupancy in Area Code 516
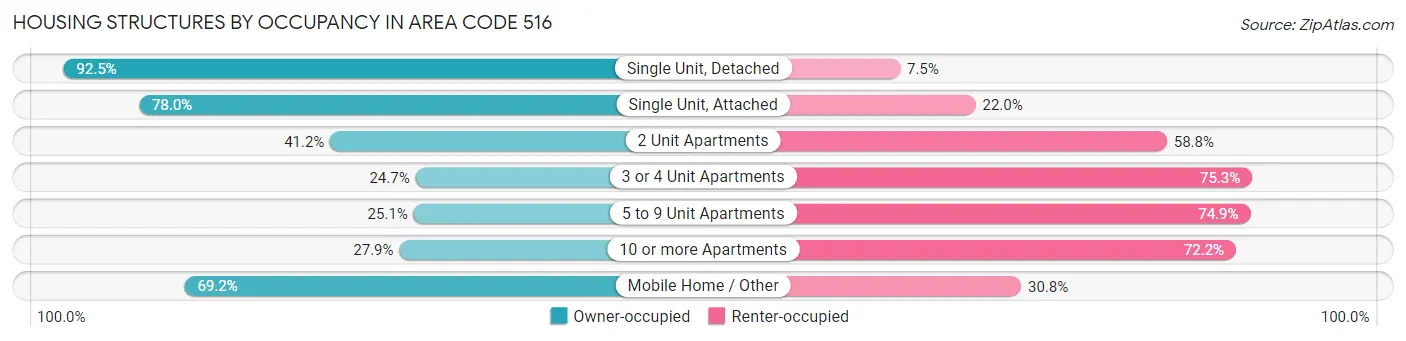
| Structure Type | Owner-occupied | Renter-occupied |
| Single Unit, Detached | 464,222 (92.5%) | 37,518 (7.5%) |
| Single Unit, Attached | 23,527 (78.0%) | 6,644 (22.0%) |
| 2 Unit Apartments | 21,140 (41.2%) | 30,217 (58.8%) |
| 3 or 4 Unit Apartments | 3,743 (24.7%) | 11,389 (75.3%) |
| 5 to 9 Unit Apartments | 3,080 (25.1%) | 9,197 (74.9%) |
| 10 or more Apartments | 21,502 (27.9%) | 55,695 (72.2%) |
| Mobile Home / Other | 1,718 (69.2%) | 764 (30.8%) |
| Total | 538,932 (78.1%) | 151,424 (21.9%) |
Housing Structures by Number of Rooms in Area Code 516
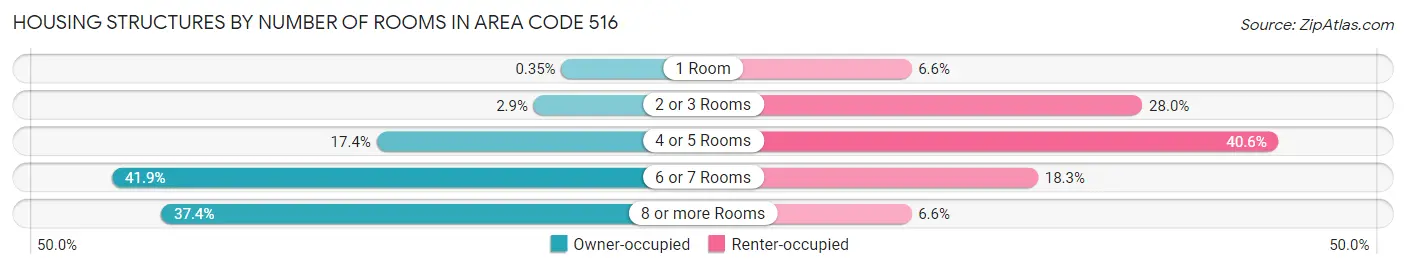
| Number of Rooms | Owner-occupied | Renter-occupied |
| 1 Room | 1,907 (0.4%) | 9,979 (6.6%) |
| 2 or 3 Rooms | 15,702 (2.9%) | 42,326 (28.0%) |
| 4 or 5 Rooms | 94,008 (17.4%) | 61,436 (40.6%) |
| 6 or 7 Rooms | 225,837 (41.9%) | 27,711 (18.3%) |
| 8 or more Rooms | 201,478 (37.4%) | 9,972 (6.6%) |
| Total | 538,932 (100.0%) | 151,424 (100.0%) |
Housing Structure by Heating Type in Area Code 516
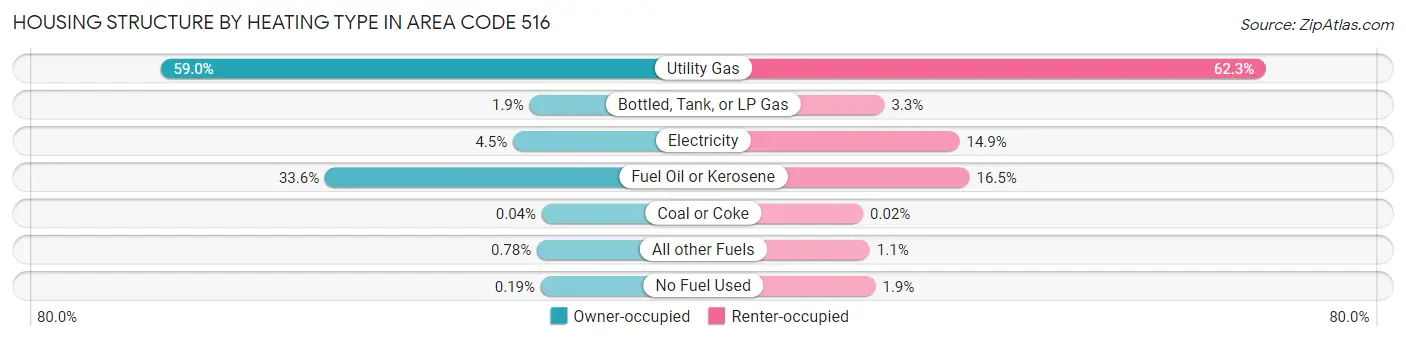
| Heating Type | Owner-occupied | Renter-occupied |
| Utility Gas | 317,986 (59.0%) | 94,332 (62.3%) |
| Bottled, Tank, or LP Gas | 10,389 (1.9%) | 5,007 (3.3%) |
| Electricity | 24,215 (4.5%) | 22,586 (14.9%) |
| Fuel Oil or Kerosene | 180,887 (33.6%) | 24,950 (16.5%) |
| Coal or Coke | 205 (0.0%) | 31 (0.0%) |
| All other Fuels | 4,216 (0.8%) | 1,602 (1.1%) |
| No Fuel Used | 1,034 (0.2%) | 2,916 (1.9%) |
| Total | 538,932 (100.0%) | 151,424 (100.0%) |
Household Vehicle Usage in Area Code 516
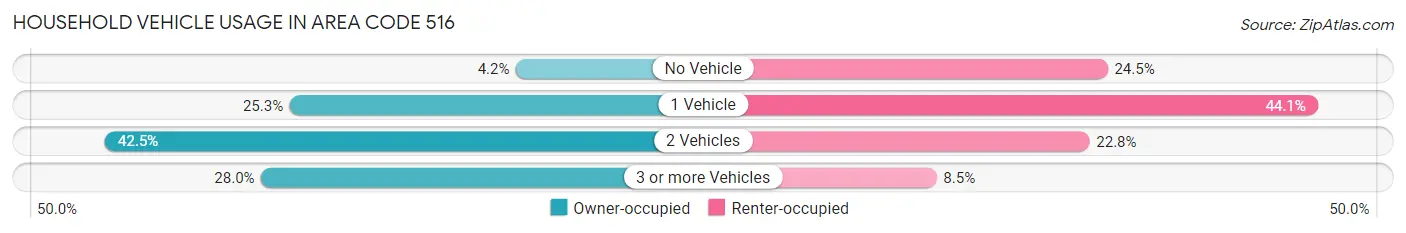
| Vehicles per Household | Owner-occupied | Renter-occupied |
| No Vehicle | 22,592 (4.2%) | 37,109 (24.5%) |
| 1 Vehicle | 136,455 (25.3%) | 66,824 (44.1%) |
| 2 Vehicles | 229,043 (42.5%) | 34,559 (22.8%) |
| 3 or more Vehicles | 150,842 (28.0%) | 12,932 (8.5%) |
| Total | 538,932 (100.0%) | 151,424 (100.0%) |
Real Estate & Mortgages in Area Code 516
Real Estate and Mortgage Overview in Area Code 516
| Characteristic | Without Mortgage | With Mortgage |
| Housing Units | 194,752 | 344,180 |
| Median Property Value | $64,200,101 | $67,976,302 |
| Median Household Income | $10,969,771 | $192,723 |
| Monthly Housing Costs | $129,850 | $230,949 |
| Real Estate Taxes | $875,339 | $7,301 |
Property Value by Mortgage Status in Area Code 516
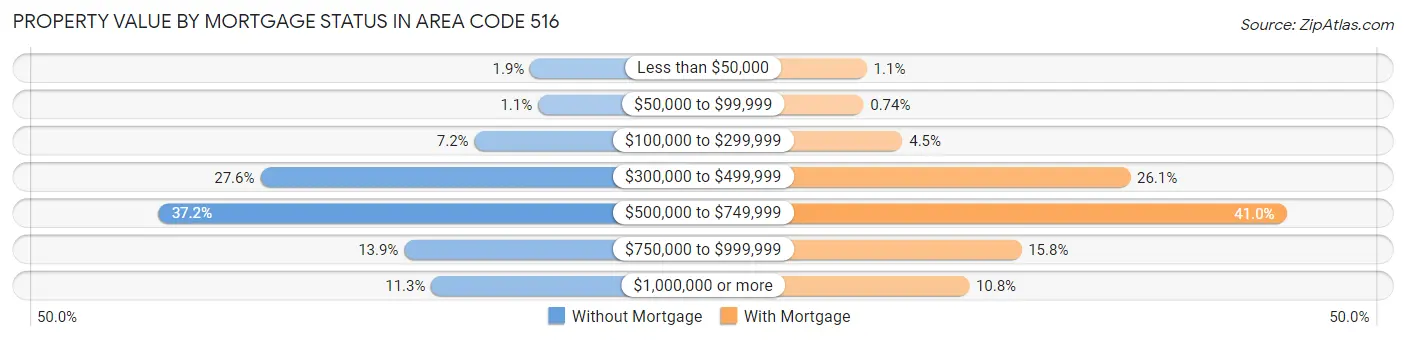
| Property Value | Without Mortgage | With Mortgage |
| Less than $50,000 | 3,604 (1.8%) | 3,639 (1.1%) |
| $50,000 to $99,999 | 2,140 (1.1%) | 2,558 (0.7%) |
| $100,000 to $299,999 | 13,938 (7.2%) | 15,316 (4.4%) |
| $300,000 to $499,999 | 53,648 (27.6%) | 89,985 (26.1%) |
| $500,000 to $749,999 | 72,493 (37.2%) | 141,212 (41.0%) |
| $750,000 to $999,999 | 26,977 (13.9%) | 54,314 (15.8%) |
| $1,000,000 or more | 21,952 (11.3%) | 37,156 (10.8%) |
| Total | 194,752 (100.0%) | 344,180 (100.0%) |
Household Income by Mortgage Status in Area Code 516
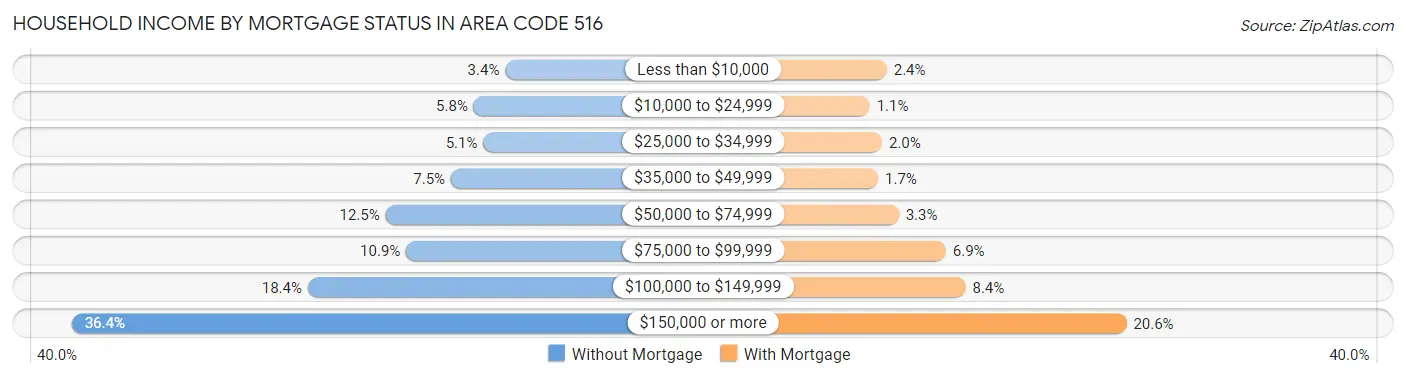
| Household Income | Without Mortgage | With Mortgage |
| Less than $10,000 | 6,578 (3.4%) | 8,189 (2.4%) |
| $10,000 to $24,999 | 11,266 (5.8%) | 3,717 (1.1%) |
| $25,000 to $34,999 | 9,839 (5.1%) | 6,943 (2.0%) |
| $35,000 to $49,999 | 14,641 (7.5%) | 5,924 (1.7%) |
| $50,000 to $74,999 | 24,348 (12.5%) | 11,323 (3.3%) |
| $75,000 to $99,999 | 21,296 (10.9%) | 23,666 (6.9%) |
| $100,000 to $149,999 | 35,868 (18.4%) | 28,832 (8.4%) |
| $150,000 or more | 70,916 (36.4%) | 71,052 (20.6%) |
| Total | 194,752 (100.0%) | 344,180 (100.0%) |
Property Value to Household Income Ratio in Area Code 516
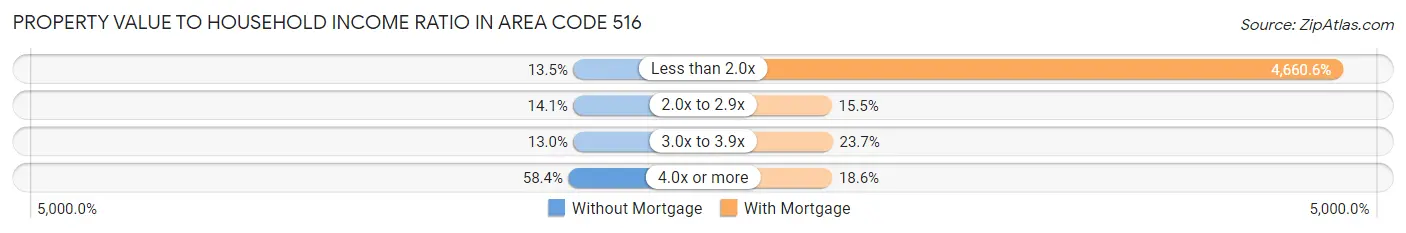
| Value-to-Income Ratio | Without Mortgage | With Mortgage |
| Less than 2.0x | 26,189 (13.5%) | 16,040,979 (4,660.6%) |
| 2.0x to 2.9x | 27,466 (14.1%) | 53,264 (15.5%) |
| 3.0x to 3.9x | 25,371 (13.0%) | 81,437 (23.7%) |
| 4.0x or more | 113,688 (58.4%) | 63,891 (18.6%) |
| Total | 194,752 (100.0%) | 344,180 (100.0%) |
Real Estate Taxes by Mortgage Status in Area Code 516
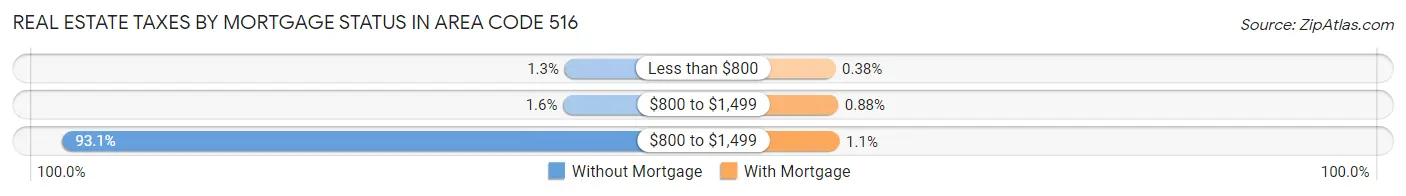
| Property Taxes | Without Mortgage | With Mortgage |
| Less than $800 | 2,609 (1.3%) | 1,324 (0.4%) |
| $800 to $1,499 | 3,127 (1.6%) | 3,025 (0.9%) |
| $800 to $1,499 | 181,298 (93.1%) | 3,863 (1.1%) |
| Total | 194,752 (100.0%) | 344,180 (100.0%) |
Health & Disability in Area Code 516
Health Insurance Coverage by Age in Area Code 516
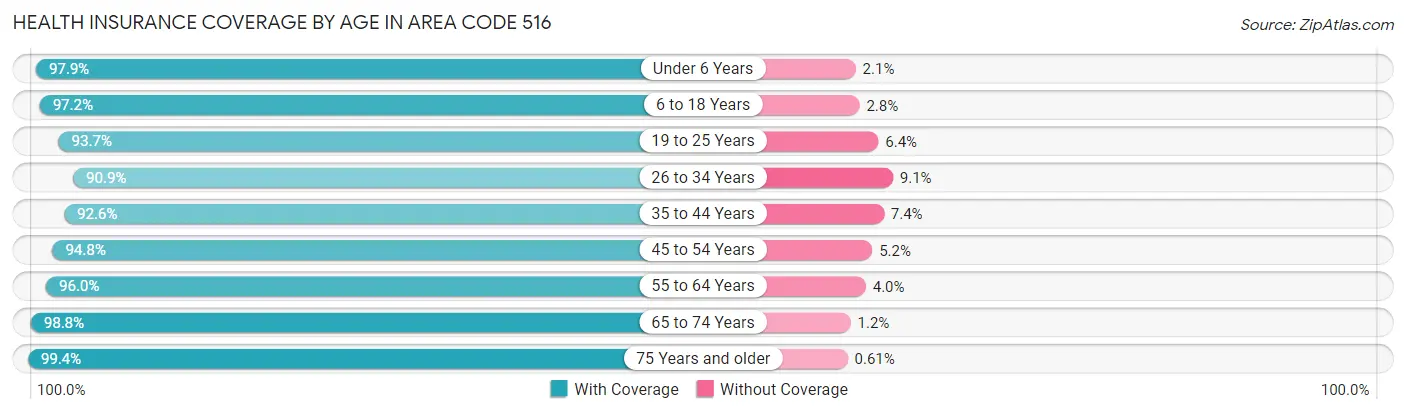
| Age Bracket | With Coverage | Without Coverage |
| Under 6 Years | 135,788 (97.9%) | 2,940 (2.1%) |
| 6 to 18 Years | 335,354 (97.2%) | 9,782 (2.8%) |
| 19 to 25 Years | 174,614 (93.6%) | 11,831 (6.4%) |
| 26 to 34 Years | 211,265 (90.9%) | 21,049 (9.1%) |
| 35 to 44 Years | 239,423 (92.6%) | 19,042 (7.4%) |
| 45 to 54 Years | 272,606 (94.8%) | 14,990 (5.2%) |
| 55 to 64 Years | 291,755 (96.0%) | 12,183 (4.0%) |
| 65 to 74 Years | 205,496 (98.8%) | 2,463 (1.2%) |
| 75 Years and older | 153,460 (99.4%) | 941 (0.6%) |
| Total | 2,019,761 (95.5%) | 95,221 (4.5%) |
Health Insurance Coverage by Citizenship Status in Area Code 516
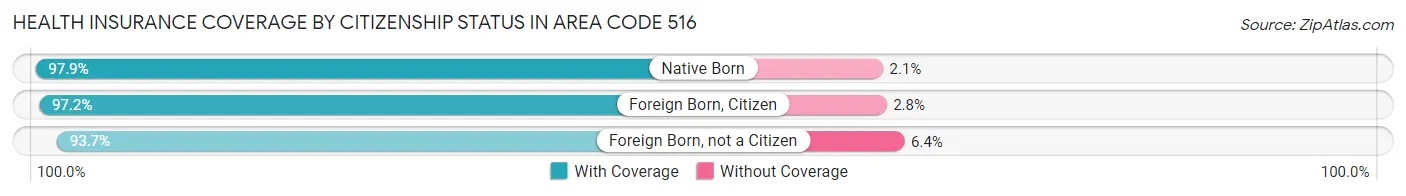
| Citizenship Status | With Coverage | Without Coverage |
| Native Born | 135,788 (97.9%) | 2,940 (2.1%) |
| Foreign Born, Citizen | 335,354 (97.2%) | 9,782 (2.8%) |
| Foreign Born, not a Citizen | 174,614 (93.6%) | 11,831 (6.4%) |
Health Insurance Coverage by Household Income in Area Code 516
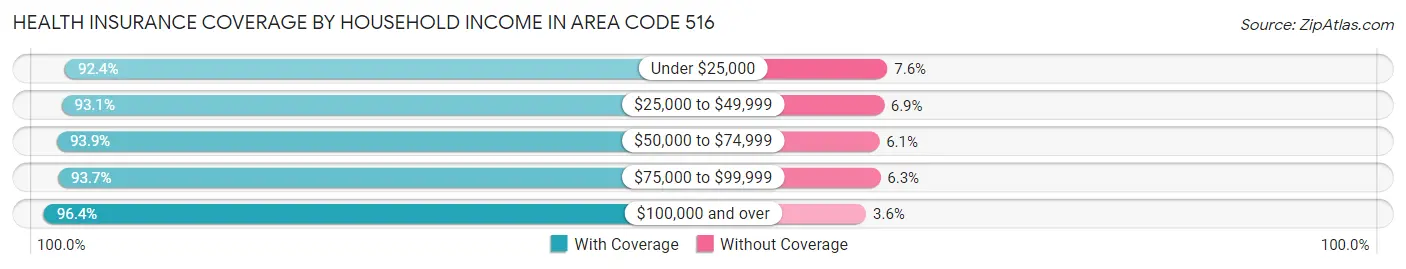
| Household Income | With Coverage | Without Coverage |
| Under $25,000 | 95,894 (92.4%) | 7,876 (7.6%) |
| $25,000 to $49,999 | 137,629 (93.1%) | 10,253 (6.9%) |
| $50,000 to $74,999 | 164,427 (93.9%) | 10,624 (6.1%) |
| $75,000 to $99,999 | 173,083 (93.7%) | 11,627 (6.3%) |
| $100,000 and over | 1,431,142 (96.4%) | 53,770 (3.6%) |
Public vs Private Health Insurance Coverage by Age in Area Code 516
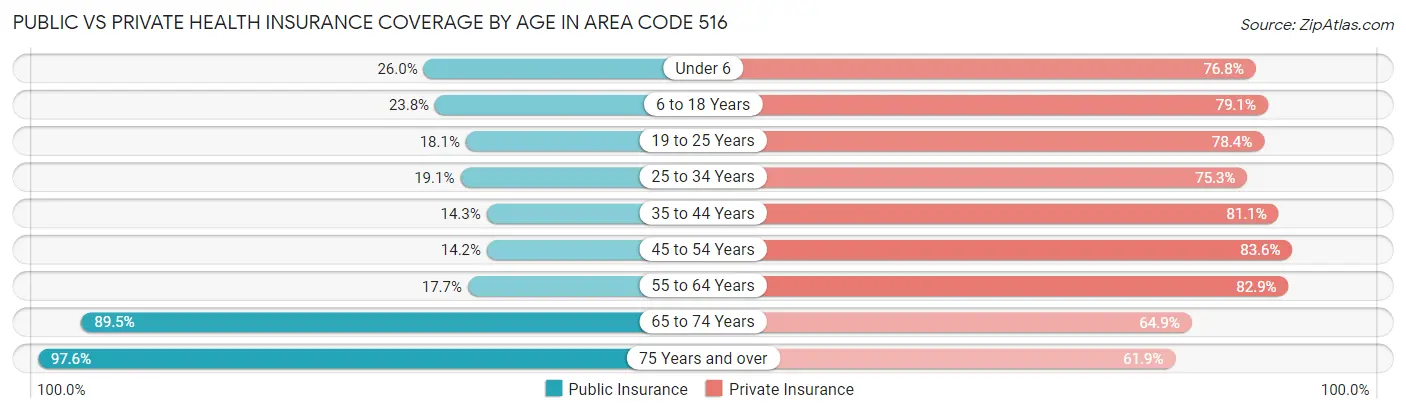
| Age Bracket | Public Insurance | Private Insurance |
| Under 6 | 36,017 (26.0%) | 106,518 (76.8%) |
| 6 to 18 Years | 82,254 (23.8%) | 272,910 (79.1%) |
| 19 to 25 Years | 33,789 (18.1%) | 146,122 (78.4%) |
| 25 to 34 Years | 44,463 (19.1%) | 174,844 (75.3%) |
| 35 to 44 Years | 36,863 (14.3%) | 209,528 (81.1%) |
| 45 to 54 Years | 40,845 (14.2%) | 240,452 (83.6%) |
| 55 to 64 Years | 53,883 (17.7%) | 251,923 (82.9%) |
| 65 to 74 Years | 186,045 (89.5%) | 135,030 (64.9%) |
| 75 Years and over | 150,616 (97.6%) | 95,563 (61.9%) |
| Total | 664,775 (31.4%) | 1,632,890 (77.2%) |
Disability Status by Sex by Age in Area Code 516

| Age Bracket | Male | Female |
| Under 5 Years | 342 (0.6%) | 185 (0.3%) |
| 5 to 17 Years | 8,345 (4.7%) | 4,278 (2.6%) |
| 18 to 34 Years | 12,124 (5.4%) | 9,689 (4.4%) |
| 35 to 64 Years | 30,641 (7.3%) | 33,038 (7.6%) |
| 65 to 74 Years | 16,661 (17.1%) | 18,042 (16.3%) |
| 75 Years and over | 22,666 (37.1%) | 41,548 (44.6%) |
Disability Class by Sex by Age in Area Code 516
Disability Class: Hearing Difficulty
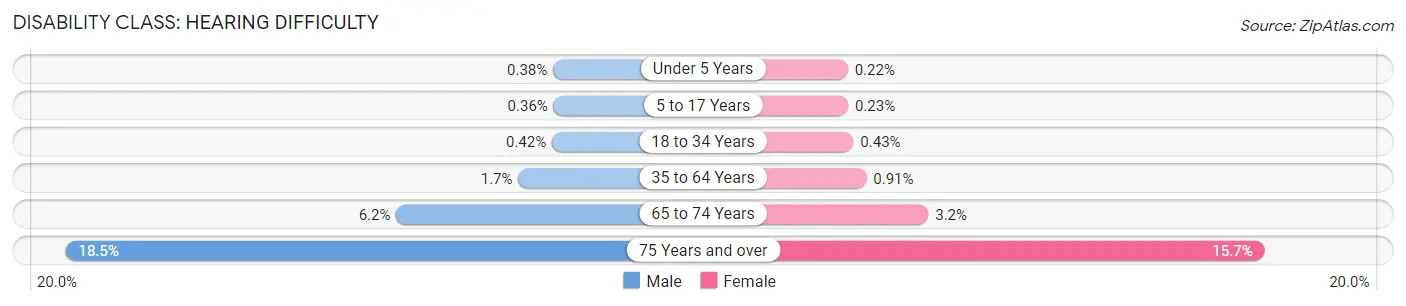
| Age Bracket | Male | Female |
| Under 5 Years | 223 (0.4%) | 125 (0.2%) |
| 5 to 17 Years | 629 (0.4%) | 383 (0.2%) |
| 18 to 34 Years | 937 (0.4%) | 952 (0.4%) |
| 35 to 64 Years | 6,959 (1.7%) | 3,957 (0.9%) |
| 65 to 74 Years | 6,038 (6.2%) | 3,544 (3.2%) |
| 75 Years and over | 11,298 (18.5%) | 14,630 (15.7%) |
Disability Class: Vision Difficulty
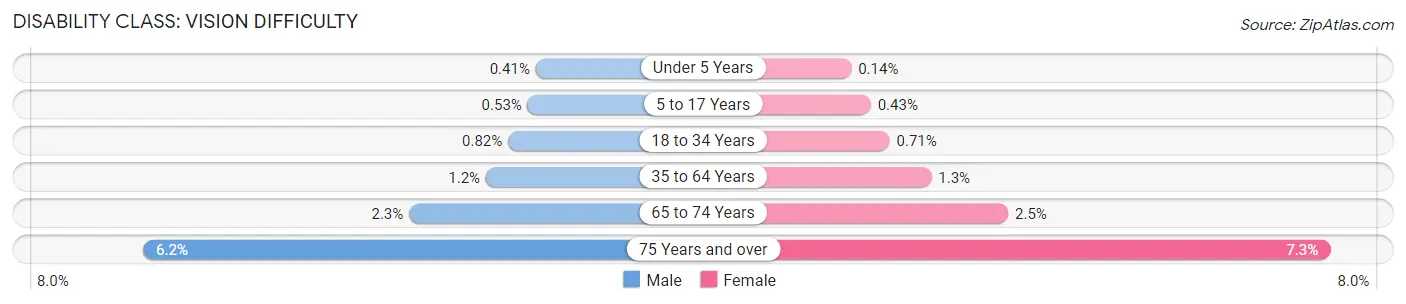
| Age Bracket | Male | Female |
| Under 5 Years | 239 (0.4%) | 77 (0.1%) |
| 5 to 17 Years | 944 (0.5%) | 712 (0.4%) |
| 18 to 34 Years | 1,855 (0.8%) | 1,556 (0.7%) |
| 35 to 64 Years | 4,777 (1.1%) | 5,737 (1.3%) |
| 65 to 74 Years | 2,231 (2.3%) | 2,729 (2.5%) |
| 75 Years and over | 3,816 (6.2%) | 6,757 (7.2%) |
Disability Class: Cognitive Difficulty
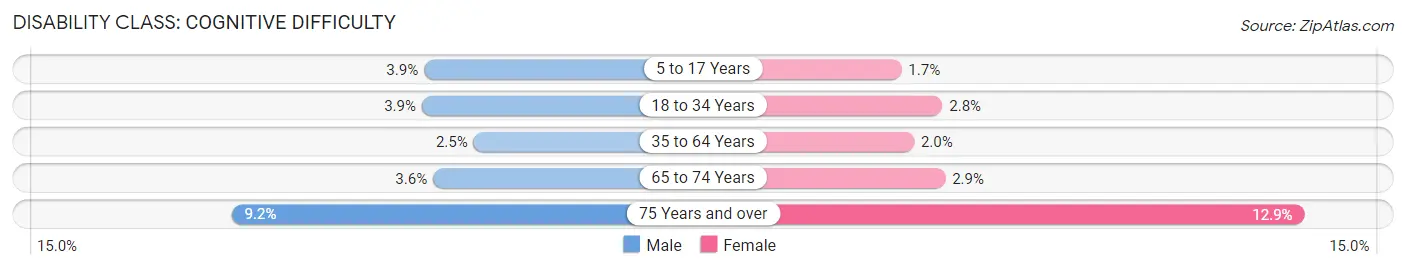
| Age Bracket | Male | Female |
| 5 to 17 Years | 6,842 (3.9%) | 2,778 (1.7%) |
| 18 to 34 Years | 8,858 (3.9%) | 6,147 (2.8%) |
| 35 to 64 Years | 10,412 (2.5%) | 8,689 (2.0%) |
| 65 to 74 Years | 3,535 (3.6%) | 3,189 (2.9%) |
| 75 Years and over | 5,651 (9.2%) | 12,013 (12.9%) |
Disability Class: Ambulatory Difficulty
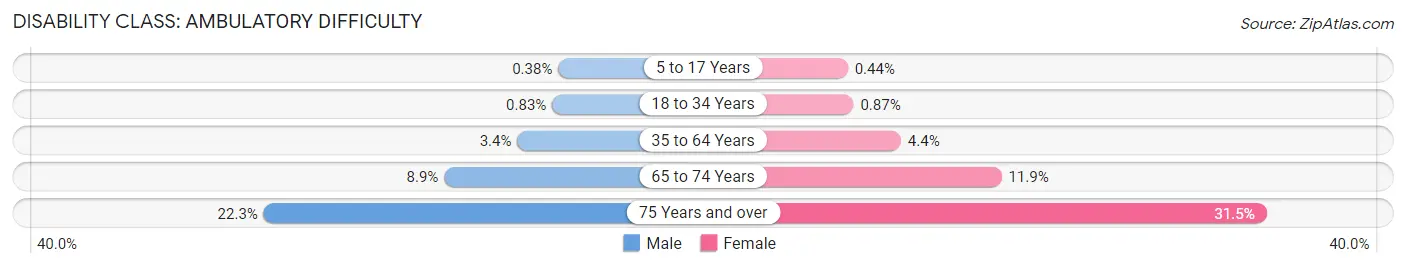
| Age Bracket | Male | Female |
| 5 to 17 Years | 669 (0.4%) | 740 (0.4%) |
| 18 to 34 Years | 1,866 (0.8%) | 1,903 (0.9%) |
| 35 to 64 Years | 14,245 (3.4%) | 18,996 (4.4%) |
| 65 to 74 Years | 8,617 (8.8%) | 13,108 (11.9%) |
| 75 Years and over | 13,605 (22.3%) | 29,403 (31.5%) |
Disability Class: Self-Care Difficulty
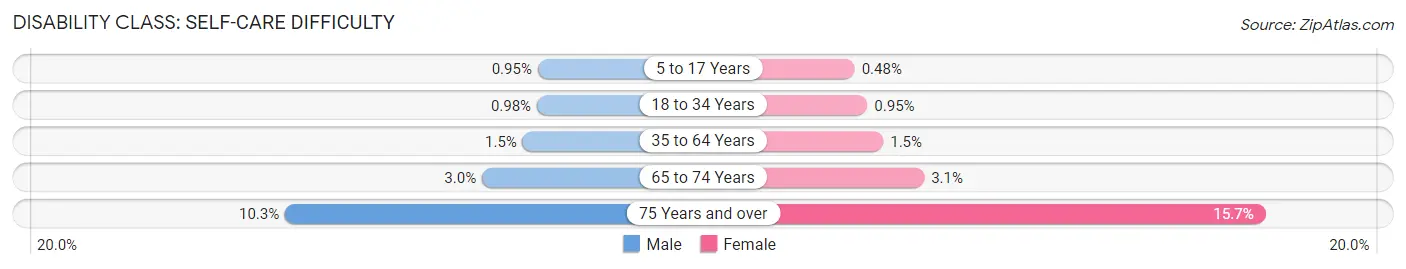
| Age Bracket | Male | Female |
| 5 to 17 Years | 1,677 (0.9%) | 804 (0.5%) |
| 18 to 34 Years | 2,205 (1.0%) | 2,089 (0.9%) |
| 35 to 64 Years | 6,299 (1.5%) | 6,660 (1.5%) |
| 65 to 74 Years | 2,946 (3.0%) | 3,380 (3.1%) |
| 75 Years and over | 6,319 (10.3%) | 14,670 (15.7%) |
Technology Access in Area Code 516
Computing Device Access in Area Code 516
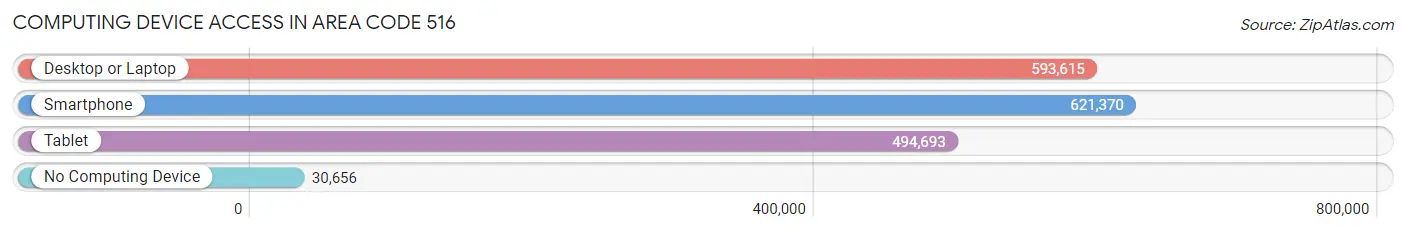
| Device Type | # Households | % Households |
| Desktop or Laptop | 593,615 | 86.0% |
| Smartphone | 621,370 | 90.0% |
| Tablet | 494,693 | 71.7% |
| No Computing Device | 30,656 | 4.4% |
| Total | 690,356 | 100.0% |
Internet Access in Area Code 516
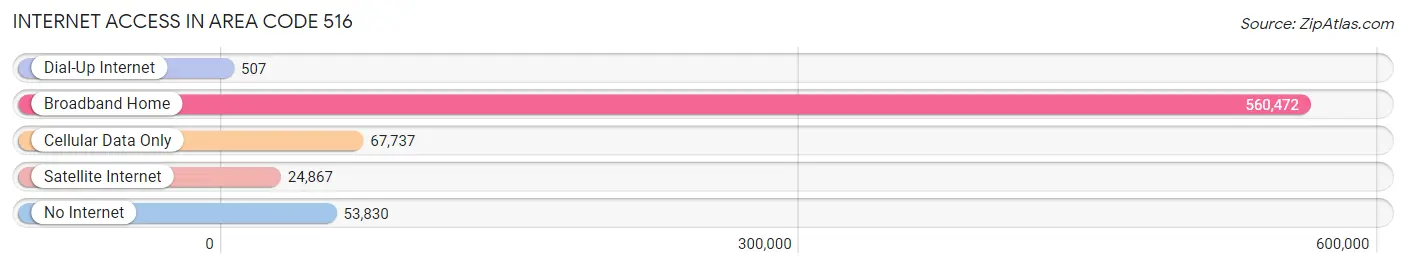
| Internet Type | # Households | % Households |
| Dial-Up Internet | 507 | 0.1% |
| Broadband Home | 560,472 | 81.2% |
| Cellular Data Only | 67,737 | 9.8% |
| Satellite Internet | 24,867 | 3.6% |
| No Internet | 53,830 | 7.8% |
| Total | 690,356 | 100.0% |
Area Code 516 Summary
Geography
Area code 516 is located in the state of New York. It covers the Nassau County area, which is located on the western part of Long Island. The area code also covers parts of Queens and Suffolk County.
Social
Area code 516 is home to many affluent communities, such as the Five Towns, Great Neck, and Manhasset. The area is known for its high-end shopping, dining, and entertainment. It is also home to many prestigious universities, such as Hofstra University and Adelphi University.
Economics
Area code 516 is home to many large businesses and corporations, such as Cablevision, Northwell Health, and Estee Lauder. The area is also home to many financial institutions, such as Bank of America and Citibank.
Demographics
Area code 516 is home to a diverse population. According to the 2010 census, the population of the area is approximately 1.3 million people. The population is made up of a variety of ethnicities, including African American, Hispanic, Asian, and White. The median household income in the area is approximately $90,000.
Common Questions
What is Per Capita Income in Area Code 516?
Per Capita income in Area Code 516 is $62,206.
What is the Median Family Income in Area Code 516?
Median Family Income in Area Code 516 is $162,858.
What is the Median Household income in Area Code 516?
Median Household Income in Area Code 516 is $141,302.
What is Income or Wage Gap in Area Code 516?
Income or Wage Gap in Area Code 516 is 32.6%.
Women in Area Code 516 earn 67.4 cents for every dollar earned by a man.
What is Family Income Deficit in Area Code 516?
Family Income Deficit in Area Code 516 is $11,043.
Families that are below poverty line in Area Code 516 earn $11,043 less on average than the poverty threshold level.
What is Inequality or Gini Index in Area Code 516?
Inequality or Gini Index in Area Code 516 is 40.13.
What is the Total Population of Area Code 516?
Total Population of Area Code 516 is 2,130,132.
What is the Total Male Population of Area Code 516?
Total Male Population of Area Code 516 is 1,043,512.
What is the Total Female Population of Area Code 516?
Total Female Population of Area Code 516 is 1,086,620.
What is the Ratio of Males per 100 Females in Area Code 516?
There are 96.03 Males per 100 Females in Area Code 516.
What is the Ratio of Females per 100 Males in Area Code 516?
There are 104.13 Females per 100 Males in Area Code 516.
What is the Median Population Age in Area Code 516?
Median Population Age in Area Code 516 is 42.2 Years.
What is the Average Family Size in Area Code 516
Average Family Size in Area Code 516 is 3.5 People.
What is the Average Household Size in Area Code 516
Average Household Size in Area Code 516 is 3.0 People.
How Large is the Labor Force in Area Code 516?
There are 1,109,208 People in the Labor Forcein in Area Code 516.
What is the Percentage of People in the Labor Force in Area Code 516?
64.2% of People are in the Labor Force in Area Code 516.
What is the Unemployment Rate in Area Code 516?
Unemployment Rate in Area Code 516 is 4.8%.