New York County, NY Map & Demographics
New York County Map
New York County Overview
$89,702
PER CAPITA INCOME
$131,344
AVG FAMILY INCOME
$99,880
AVG HOUSEHOLD INCOME
23.1%
WAGE / INCOME GAP [ % ]
76.9¢/ $1
WAGE / INCOME GAP [ $ ]
$10,536
FAMILY INCOME DEFICIT
0.60
INEQUALITY / GINI INDEX
1,645,867
TOTAL POPULATION
788,264
MALE POPULATION
857,603
FEMALE POPULATION
91.91
MALES / 100 FEMALES
108.80
FEMALES / 100 MALES
38.5
MEDIAN AGE
3.0
AVG FAMILY SIZE
2.0
AVG HOUSEHOLD SIZE
953,136
LABOR FORCE [ PEOPLE ]
66.5%
PERCENT IN LABOR FORCE
6.8%
UNEMPLOYMENT RATE
Income in New York County
Income Overview in New York County
Per Capita Income in New York County is $89,702, while median incomes of families and households are $131,344 and $99,880 respectively.
| Characteristic | Number | Measure |
| Per Capita Income | 1,645,867 | $89,702 |
| Median Family Income | 324,614 | $131,344 |
| Mean Family Income | 324,614 | $251,781 |
| Median Household Income | 772,601 | $99,880 |
| Mean Household Income | 772,601 | $184,058 |
| Income Deficit | 324,614 | $10,536 |
| Wage / Income Gap (%) | 1,645,867 | 23.14% |
| Wage / Income Gap ($) | 1,645,867 | 76.86¢ per $1 |
| Gini / Inequality Index | 1,645,867 | 0.60 |
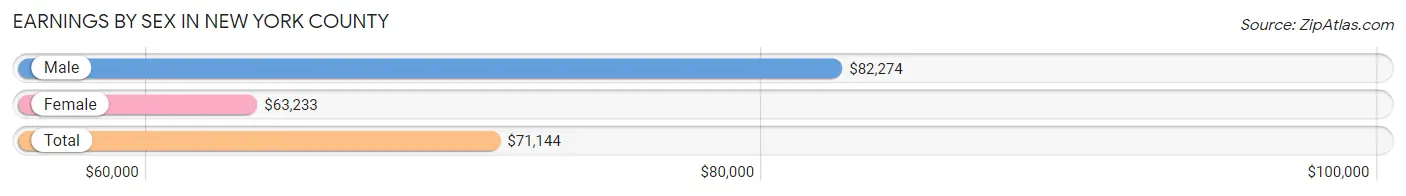
Earnings by Sex in New York County
Average Earnings in New York County are $71,144, $82,274 for men and $63,233 for women, a difference of 23.1%.
| Sex | Number | Average Earnings |
| Male | 489,468 (50.0%) | $82,274 |
| Female | 489,394 (50.0%) | $63,233 |
| Total | 978,862 (100.0%) | $71,144 |
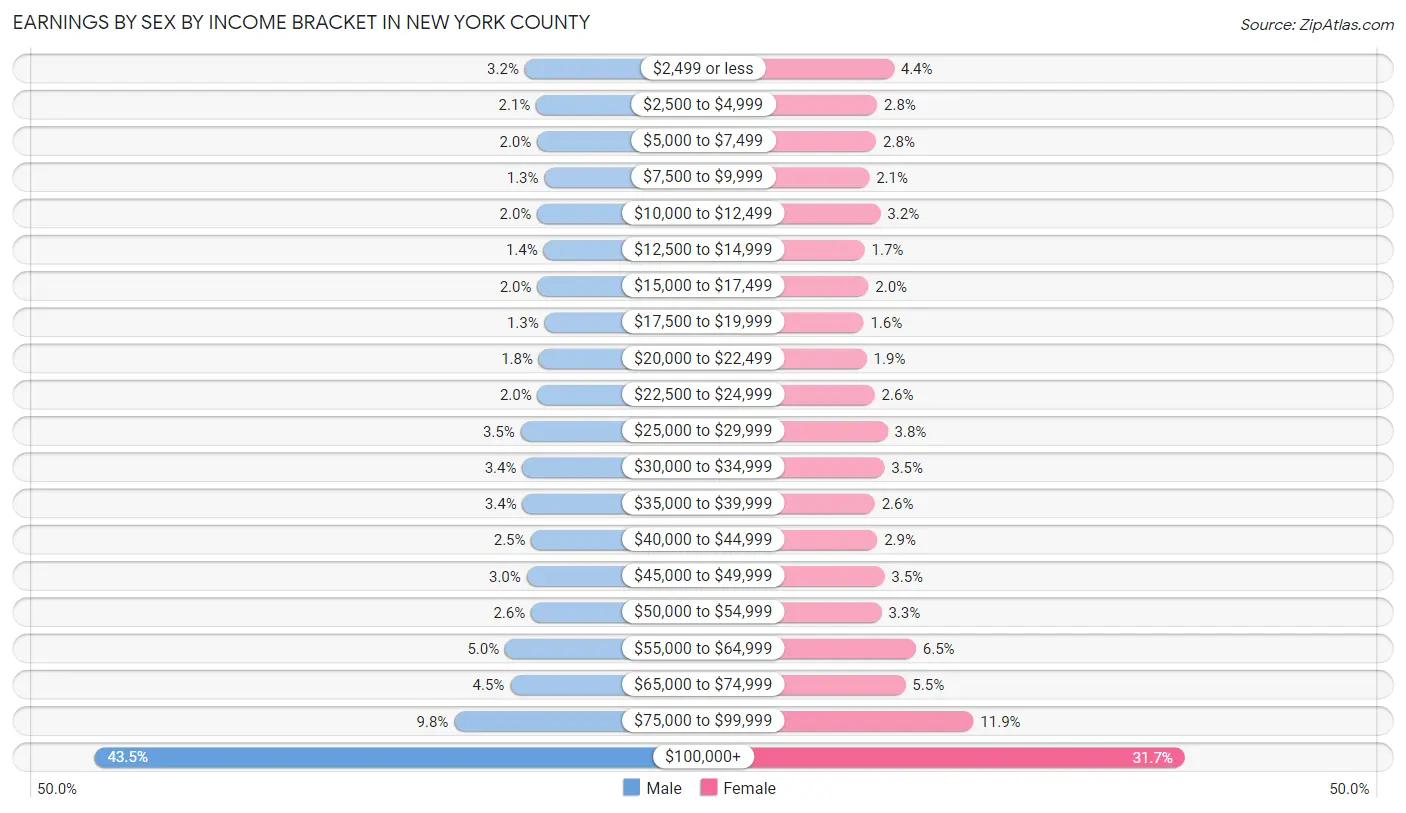
Earnings by Sex by Income Bracket in New York County
The most common earnings brackets in New York County are $100,000+ for men (212,689 | 43.4%) and $100,000+ for women (154,903 | 31.7%).
| Income | Male | Female |
| $2,499 or less | 15,416 (3.2%) | 21,534 (4.4%) |
| $2,500 to $4,999 | 10,190 (2.1%) | 13,919 (2.8%) |
| $5,000 to $7,499 | 9,756 (2.0%) | 13,465 (2.8%) |
| $7,500 to $9,999 | 6,389 (1.3%) | 10,299 (2.1%) |
| $10,000 to $12,499 | 9,688 (2.0%) | 15,408 (3.2%) |
| $12,500 to $14,999 | 6,809 (1.4%) | 8,171 (1.7%) |
| $15,000 to $17,499 | 9,653 (2.0%) | 9,888 (2.0%) |
| $17,500 to $19,999 | 6,327 (1.3%) | 7,625 (1.6%) |
| $20,000 to $22,499 | 8,973 (1.8%) | 9,086 (1.9%) |
| $22,500 to $24,999 | 9,563 (1.9%) | 12,790 (2.6%) |
| $25,000 to $29,999 | 17,313 (3.5%) | 18,704 (3.8%) |
| $30,000 to $34,999 | 16,525 (3.4%) | 17,183 (3.5%) |
| $35,000 to $39,999 | 16,429 (3.4%) | 12,810 (2.6%) |
| $40,000 to $44,999 | 12,397 (2.5%) | 13,956 (2.9%) |
| $45,000 to $49,999 | 14,537 (3.0%) | 17,212 (3.5%) |
| $50,000 to $54,999 | 12,513 (2.6%) | 15,902 (3.3%) |
| $55,000 to $64,999 | 24,431 (5.0%) | 31,658 (6.5%) |
| $65,000 to $74,999 | 22,094 (4.5%) | 26,848 (5.5%) |
| $75,000 to $99,999 | 47,776 (9.8%) | 58,033 (11.9%) |
| $100,000+ | 212,689 (43.4%) | 154,903 (31.7%) |
| Total | 489,468 (100.0%) | 489,394 (100.0%) |
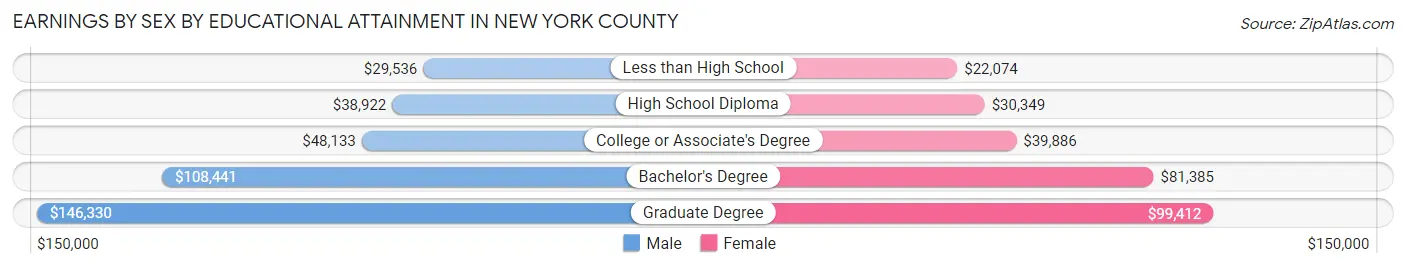
Earnings by Sex by Educational Attainment in New York County
Average earnings in New York County are $89,740 for men and $70,776 for women, a difference of 21.1%. Men with an educational attainment of graduate degree enjoy the highest average annual earnings of $146,330, while those with less than high school education earn the least with $29,536. Women with an educational attainment of graduate degree earn the most with the average annual earnings of $99,412, while those with less than high school education have the smallest earnings of $22,074.
| Educational Attainment | Male Income | Female Income |
| Less than High School | $29,536 | $22,074 |
| High School Diploma | $38,922 | $30,349 |
| College or Associate's Degree | $48,133 | $39,886 |
| Bachelor's Degree | $108,441 | $81,385 |
| Graduate Degree | $146,330 | $99,412 |
| Total | $89,740 | $70,776 |
Family Income in New York County
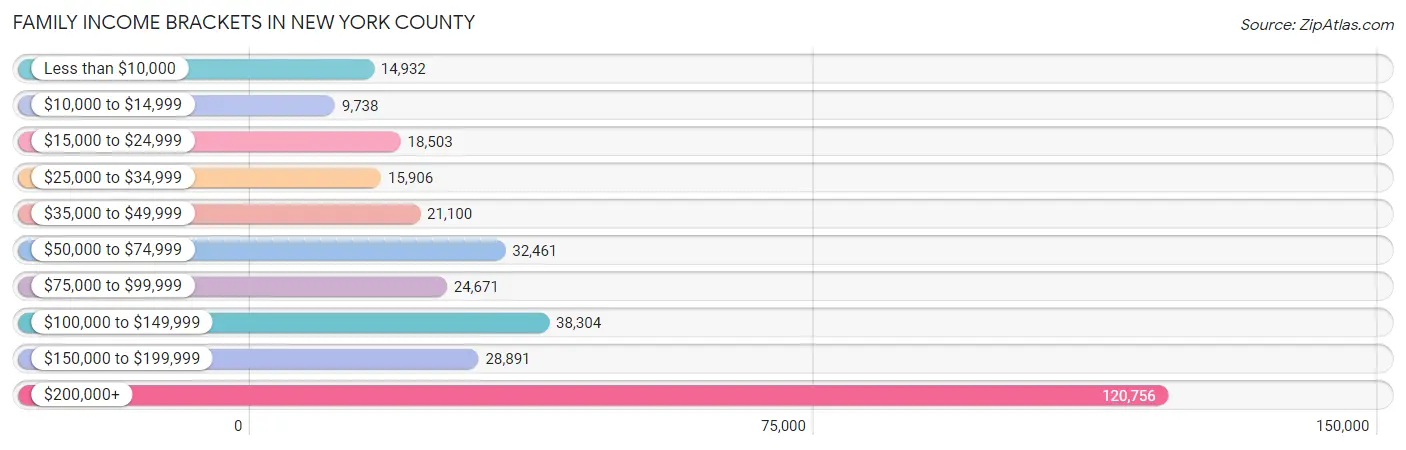
Family Income Brackets in New York County
According to the New York County family income data, there are 120,756 families falling into the $200,000+ income range, which is the most common income bracket and makes up 37.2% of all families. Conversely, the $10,000 to $14,999 income bracket is the least frequent group with only 9,738 families (3.0%) belonging to this category.
| Income Bracket | # Families | % Families |
| Less than $10,000 | 14,932 | 4.6% |
| $10,000 to $14,999 | 9,738 | 3.0% |
| $15,000 to $24,999 | 18,503 | 5.7% |
| $25,000 to $34,999 | 15,906 | 4.9% |
| $35,000 to $49,999 | 21,100 | 6.5% |
| $50,000 to $74,999 | 32,461 | 10.0% |
| $75,000 to $99,999 | 24,671 | 7.6% |
| $100,000 to $149,999 | 38,304 | 11.8% |
| $150,000 to $199,999 | 28,891 | 8.9% |
| $200,000+ | 120,756 | 37.2% |
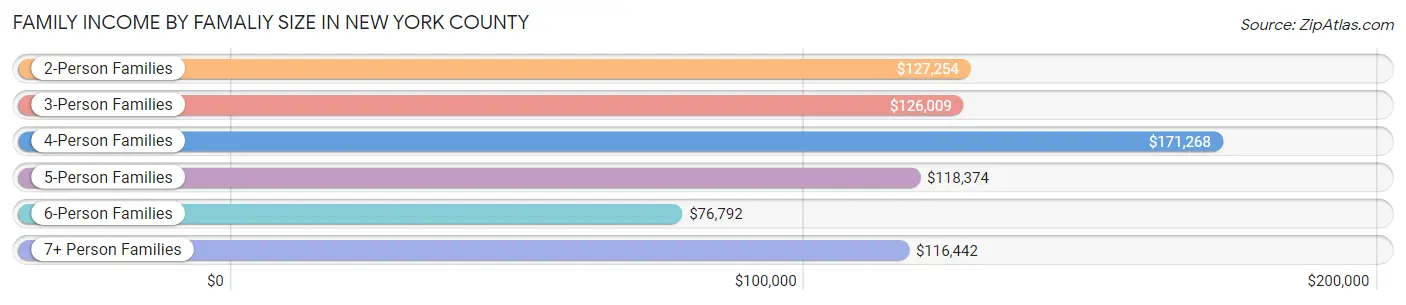
Family Income by Famaliy Size in New York County
4-person families (50,064 | 15.4%) account for the highest median family income in New York County with $171,268 per family, while 2-person families (173,843 | 53.5%) have the highest median income of $63,627 per family member.
| Income Bracket | # Families | Median Income |
| 2-Person Families | 173,843 (53.5%) | $127,254 |
| 3-Person Families | 76,897 (23.7%) | $126,009 |
| 4-Person Families | 50,064 (15.4%) | $171,268 |
| 5-Person Families | 16,547 (5.1%) | $118,374 |
| 6-Person Families | 4,543 (1.4%) | $76,792 |
| 7+ Person Families | 2,720 (0.8%) | $116,442 |
| Total | 324,614 (100.0%) | $131,344 |
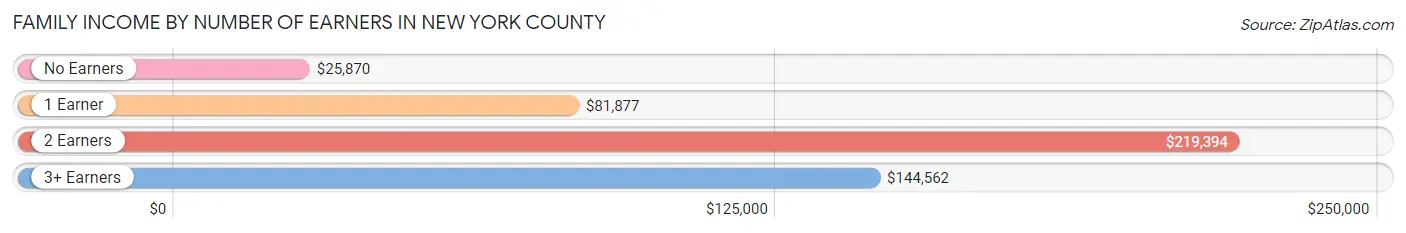
Family Income by Number of Earners in New York County
The median family income in New York County is $131,344, with families comprising 2 earners (149,024) having the highest median family income of $219,394, while families with no earners (48,008) have the lowest median family income of $25,870, accounting for 45.9% and 14.8% of families, respectively.
| Number of Earners | # Families | Median Income |
| No Earners | 48,008 (14.8%) | $25,870 |
| 1 Earner | 107,475 (33.1%) | $81,877 |
| 2 Earners | 149,024 (45.9%) | $219,394 |
| 3+ Earners | 20,107 (6.2%) | $144,562 |
| Total | 324,614 (100.0%) | $131,344 |
Household Income in New York County
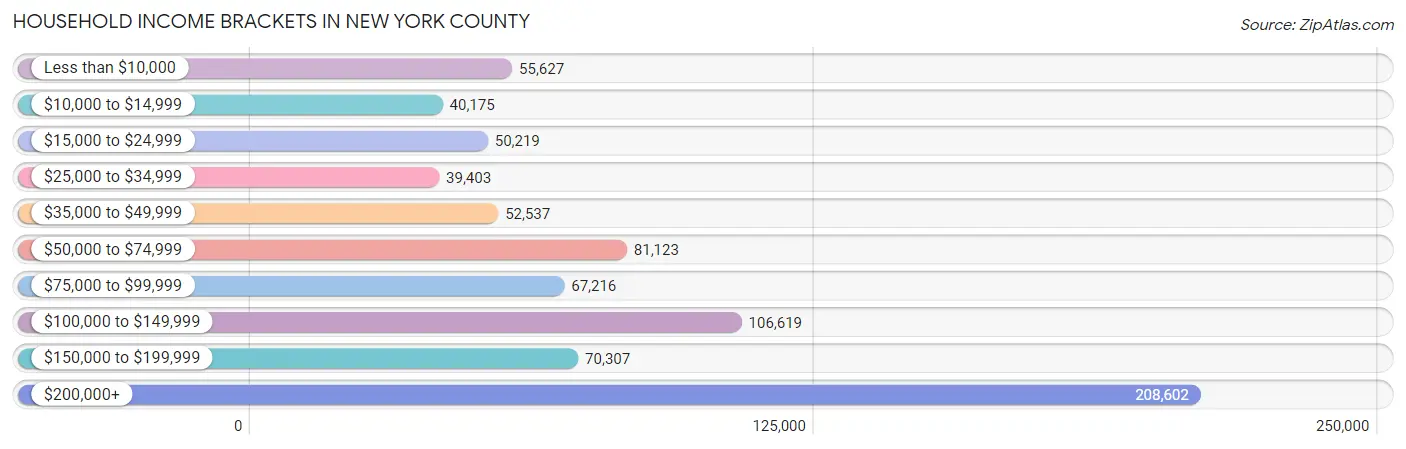
Household Income Brackets in New York County
With 208,602 households falling in the category, the $200,000+ income range is the most frequent in New York County, accounting for 27.0% of all households. In contrast, only 39,403 households (5.1%) fall into the $25,000 to $34,999 income bracket, making it the least populous group.
| Income Bracket | # Households | % Households |
| Less than $10,000 | 55,627 | 7.2% |
| $10,000 to $14,999 | 40,175 | 5.2% |
| $15,000 to $24,999 | 50,219 | 6.5% |
| $25,000 to $34,999 | 39,403 | 5.1% |
| $35,000 to $49,999 | 52,537 | 6.8% |
| $50,000 to $74,999 | 81,123 | 10.5% |
| $75,000 to $99,999 | 67,216 | 8.7% |
| $100,000 to $149,999 | 106,619 | 13.8% |
| $150,000 to $199,999 | 70,307 | 9.1% |
| $200,000+ | 208,602 | 27.0% |
Household Income by Householder Age in New York County
The median household income in New York County is $99,880, with the highest median household income of $134,223 found in the 25 to 44 years age bracket for the primary householder. A total of 305,421 households (39.5%) fall into this category. Meanwhile, the 65+ years age bracket for the primary householder has the lowest median household income of $53,766, with 198,346 households (25.7%) in this group.
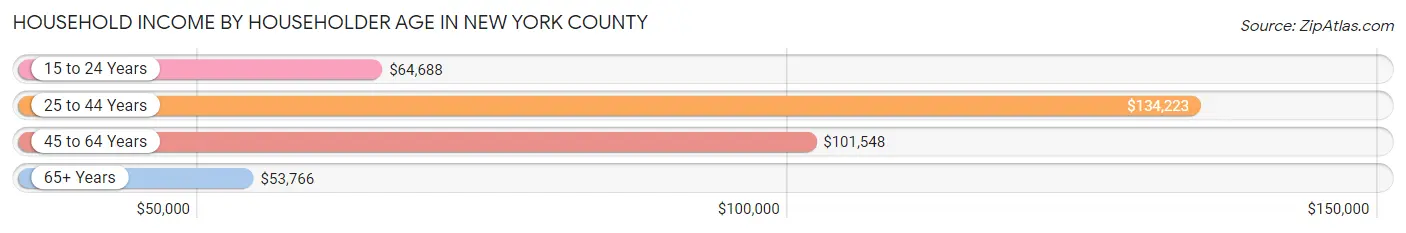
| Income Bracket | # Households | Median Income |
| 15 to 24 Years | 25,749 (3.3%) | $64,688 |
| 25 to 44 Years | 305,421 (39.5%) | $134,223 |
| 45 to 64 Years | 243,085 (31.5%) | $101,548 |
| 65+ Years | 198,346 (25.7%) | $53,766 |
| Total | 772,601 (100.0%) | $99,880 |
Poverty in New York County
Income Below Poverty by Sex and Age in New York County
With 14.8% poverty level for males and 16.8% for females among the residents of New York County, 18 to 24 year old males and 18 to 24 year old females are the most vulnerable to poverty, with 13,075 males (25.1%) and 17,602 females (30.5%) in their respective age groups living below the poverty level.
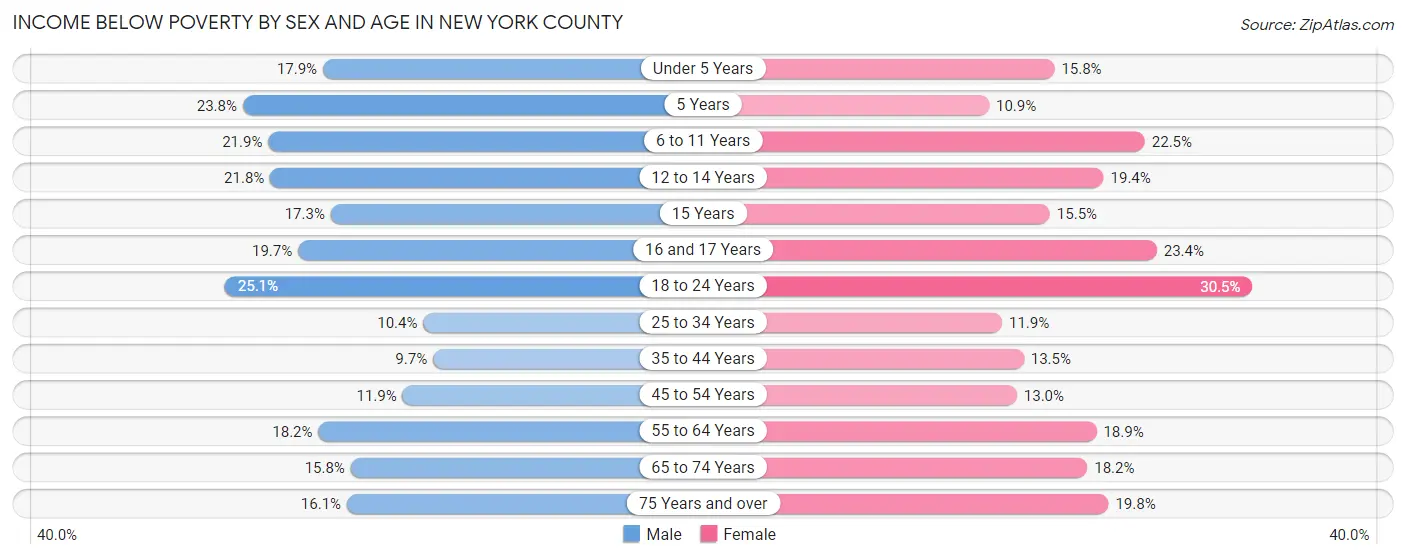
| Age Bracket | Male | Female |
| Under 5 Years | 6,658 (17.8%) | 5,660 (15.8%) |
| 5 Years | 1,442 (23.8%) | 646 (10.9%) |
| 6 to 11 Years | 8,405 (21.9%) | 8,146 (22.5%) |
| 12 to 14 Years | 4,101 (21.8%) | 3,777 (19.4%) |
| 15 Years | 1,002 (17.3%) | 1,020 (15.4%) |
| 16 and 17 Years | 2,305 (19.7%) | 2,548 (23.4%) |
| 18 to 24 Years | 13,075 (25.1%) | 17,602 (30.5%) |
| 25 to 34 Years | 17,492 (10.4%) | 21,167 (11.9%) |
| 35 to 44 Years | 11,740 (9.7%) | 16,061 (13.5%) |
| 45 to 54 Years | 12,188 (11.9%) | 12,969 (13.0%) |
| 55 to 64 Years | 16,876 (18.2%) | 18,359 (18.9%) |
| 65 to 74 Years | 10,574 (15.8%) | 15,784 (18.2%) |
| 75 Years and over | 7,733 (16.1%) | 15,347 (19.8%) |
| Total | 113,591 (14.8%) | 139,086 (16.8%) |
Income Above Poverty by Sex and Age in New York County
According to the poverty statistics in New York County, males aged 35 to 44 years and females aged 5 years are the age groups that are most secure financially, with 90.3% of males and 89.1% of females in these age groups living above the poverty line.
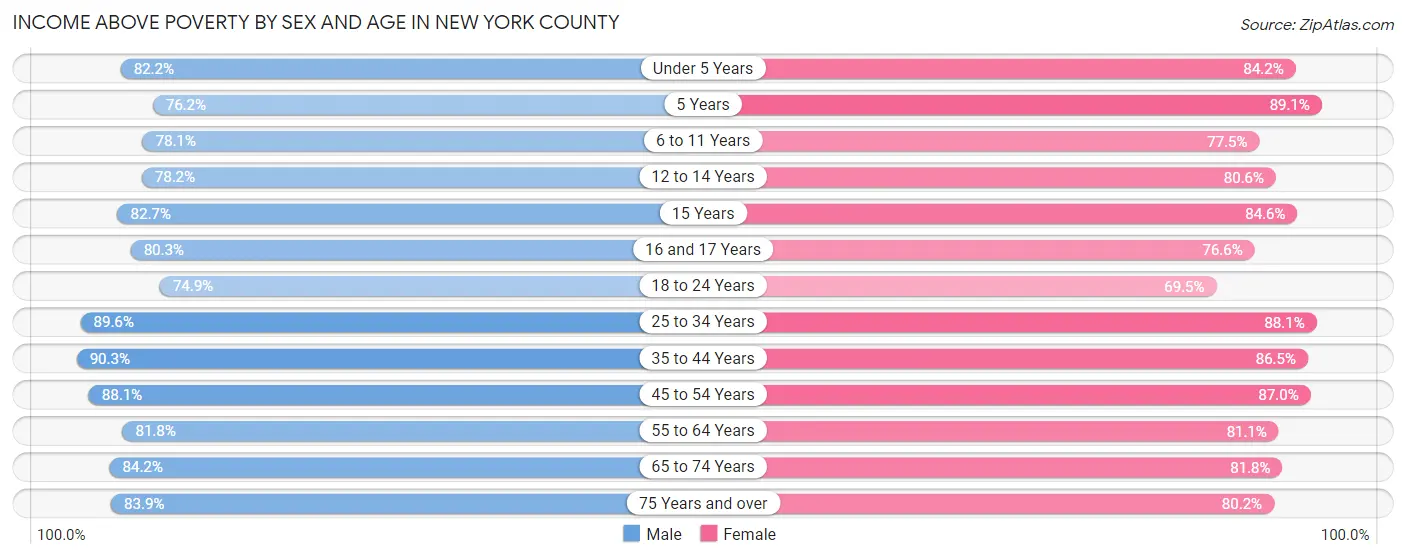
| Age Bracket | Male | Female |
| Under 5 Years | 30,649 (82.2%) | 30,179 (84.2%) |
| 5 Years | 4,616 (76.2%) | 5,262 (89.1%) |
| 6 to 11 Years | 29,951 (78.1%) | 28,060 (77.5%) |
| 12 to 14 Years | 14,741 (78.2%) | 15,652 (80.6%) |
| 15 Years | 4,800 (82.7%) | 5,581 (84.6%) |
| 16 and 17 Years | 9,398 (80.3%) | 8,345 (76.6%) |
| 18 to 24 Years | 38,950 (74.9%) | 40,144 (69.5%) |
| 25 to 34 Years | 150,729 (89.6%) | 156,711 (88.1%) |
| 35 to 44 Years | 109,522 (90.3%) | 102,787 (86.5%) |
| 45 to 54 Years | 89,863 (88.1%) | 86,798 (87.0%) |
| 55 to 64 Years | 75,882 (81.8%) | 78,714 (81.1%) |
| 65 to 74 Years | 56,382 (84.2%) | 70,812 (81.8%) |
| 75 Years and over | 40,380 (83.9%) | 62,148 (80.2%) |
| Total | 655,863 (85.2%) | 691,193 (83.3%) |
Income Below Poverty Among Married-Couple Families in New York County
The poverty statistics for married-couple families in New York County show that 5.7% or 12,202 of the total 215,530 families live below the poverty line. Families with 5 or more children have the highest poverty rate of 18.3%, comprising of 90 families. On the other hand, families with 1 or 2 children have the lowest poverty rate of 4.1%, which includes 2,995 families.
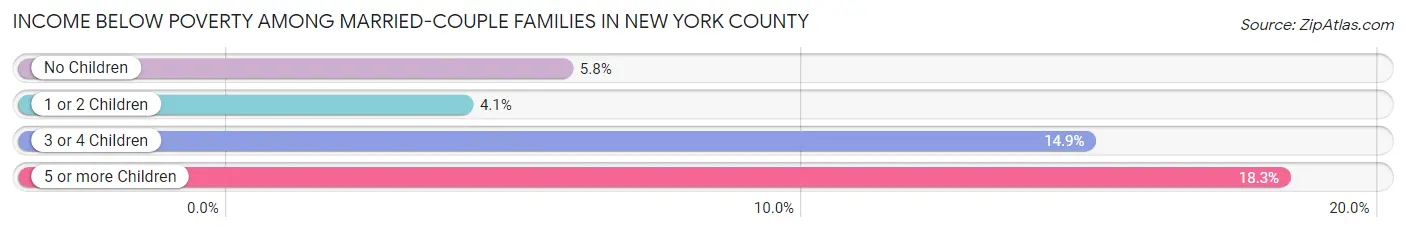
| Children | Above Poverty | Below Poverty |
| No Children | 124,877 (94.2%) | 7,728 (5.8%) |
| 1 or 2 Children | 70,143 (95.9%) | 2,995 (4.1%) |
| 3 or 4 Children | 7,907 (85.1%) | 1,389 (14.9%) |
| 5 or more Children | 401 (81.7%) | 90 (18.3%) |
| Total | 203,328 (94.3%) | 12,202 (5.7%) |
Income Below Poverty Among Single-Parent Households in New York County
According to the poverty data in New York County, 19.0% or 4,654 single-father households and 25.6% or 21,649 single-mother households are living below the poverty line. Among single-father households, those with 3 or 4 children have the highest poverty rate, with 268 households (39.4%) experiencing poverty. Likewise, among single-mother households, those with 3 or 4 children have the highest poverty rate, with 2,636 households (59.7%) falling below the poverty line.
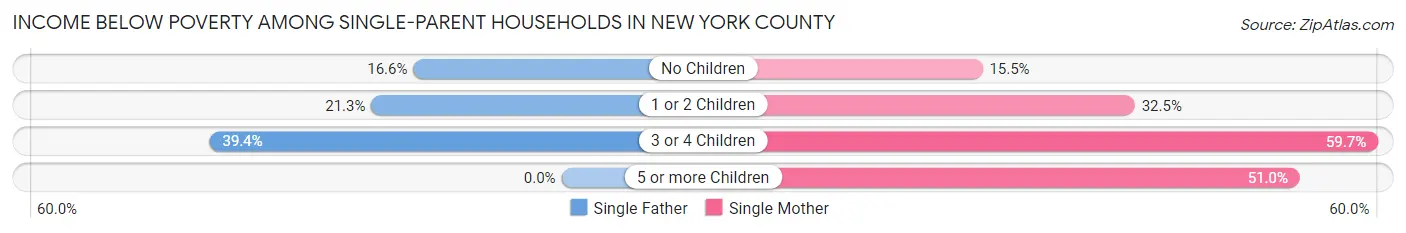
| Children | Single Father | Single Mother |
| No Children | 2,337 (16.6%) | 6,466 (15.5%) |
| 1 or 2 Children | 2,049 (21.2%) | 12,468 (32.5%) |
| 3 or 4 Children | 268 (39.4%) | 2,636 (59.7%) |
| 5 or more Children | 0 (0.0%) | 79 (51.0%) |
| Total | 4,654 (19.0%) | 21,649 (25.6%) |
Income Below Poverty Among Married-Couple vs Single-Parent Households in New York County
The poverty data for New York County shows that 12,202 of the married-couple family households (5.7%) and 26,303 of the single-parent households (24.1%) are living below the poverty level. Within the married-couple family households, those with 5 or more children have the highest poverty rate, with 90 households (18.3%) falling below the poverty line. Among the single-parent households, those with 3 or 4 children have the highest poverty rate, with 2,904 household (57.0%) living below poverty.
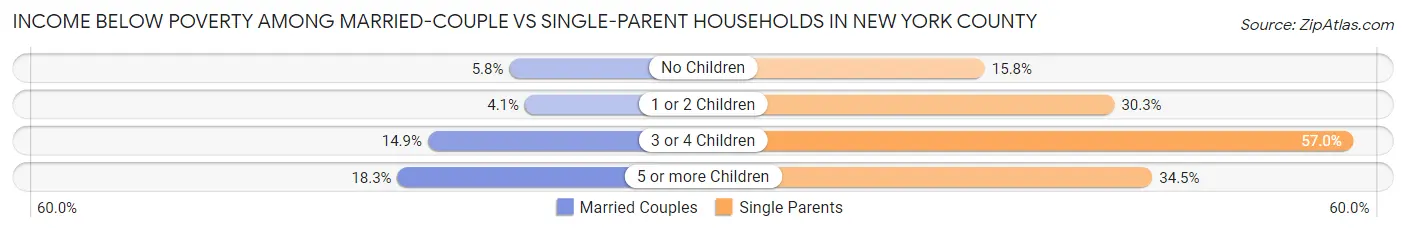
| Children | Married-Couple Families | Single-Parent Households |
| No Children | 7,728 (5.8%) | 8,803 (15.8%) |
| 1 or 2 Children | 2,995 (4.1%) | 14,517 (30.3%) |
| 3 or 4 Children | 1,389 (14.9%) | 2,904 (57.0%) |
| 5 or more Children | 90 (18.3%) | 79 (34.5%) |
| Total | 12,202 (5.7%) | 26,303 (24.1%) |
Race in New York County
The most populous races in New York County are White / Caucasian (842,952 | 51.2%), Hispanic or Latino (428,297 | 26.0%), and Black / African American (230,583 | 14.0%).
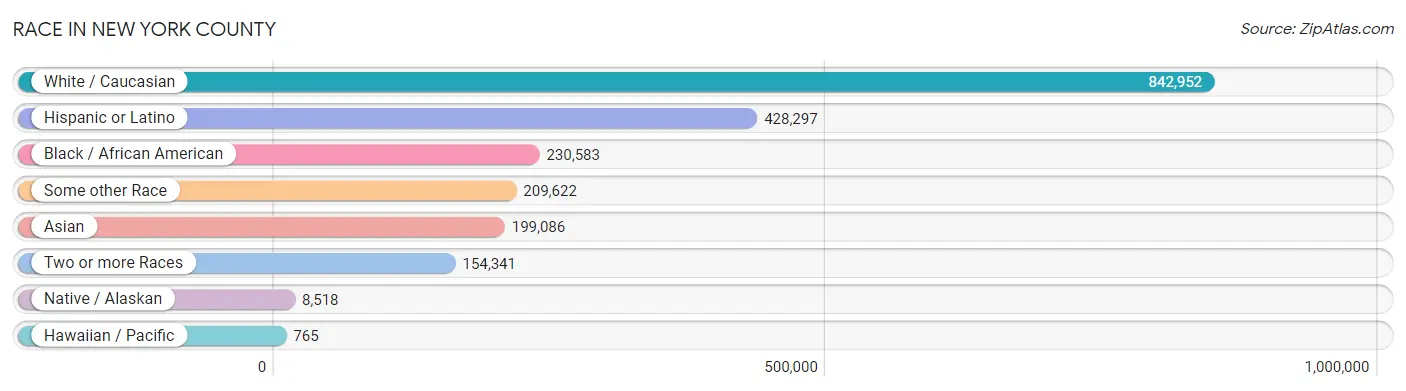
| Race | # Population | % Population |
| Asian | 199,086 | 12.1% |
| Black / African American | 230,583 | 14.0% |
| Hawaiian / Pacific | 765 | 0.1% |
| Hispanic or Latino | 428,297 | 26.0% |
| Native / Alaskan | 8,518 | 0.5% |
| White / Caucasian | 842,952 | 51.2% |
| Two or more Races | 154,341 | 9.4% |
| Some other Race | 209,622 | 12.7% |
| Total | 1,645,867 | 100.0% |
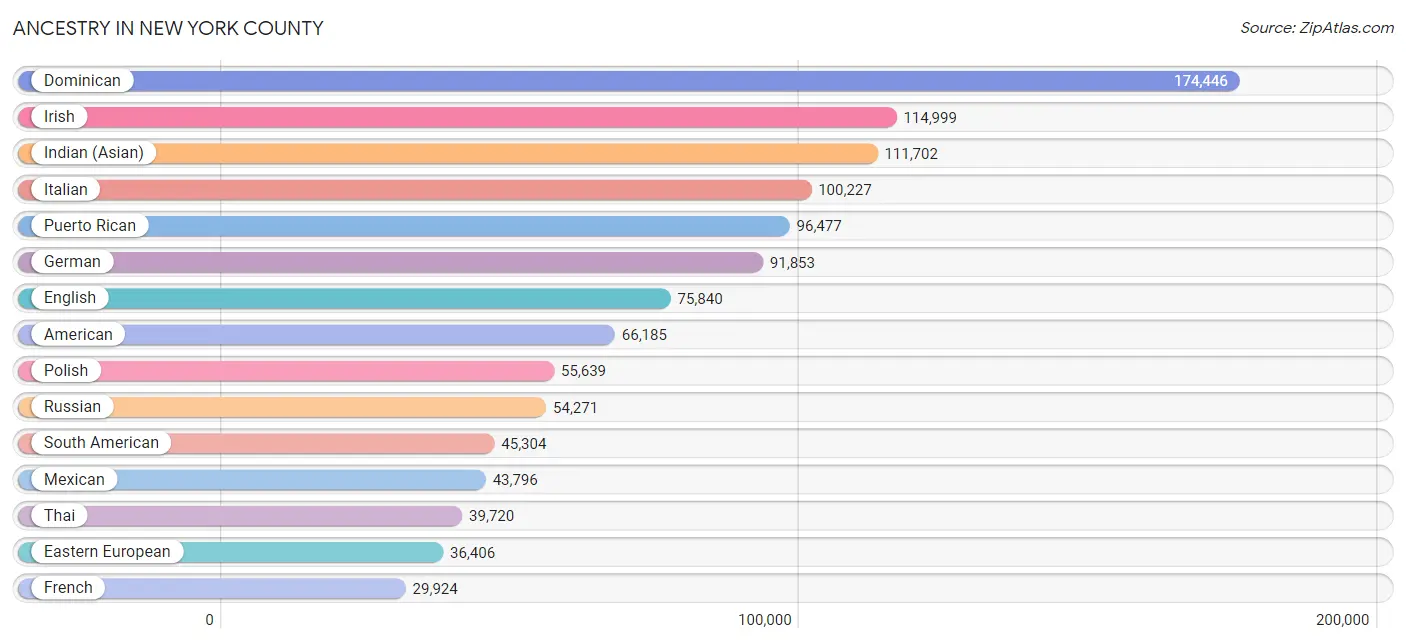
Ancestry in New York County
The most populous ancestries reported in New York County are Dominican (174,446 | 10.6%), Irish (114,999 | 7.0%), Indian (Asian) (111,702 | 6.8%), Italian (100,227 | 6.1%), and Puerto Rican (96,477 | 5.9%), together accounting for 36.3% of all New York County residents.
| Ancestry | # Population | % Population |
| Afghan | 324 | 0.0% |
| African | 13,232 | 0.8% |
| Alaska Native | 7 | 0.0% |
| Albanian | 2,309 | 0.1% |
| Aleut | 2 | 0.0% |
| Alsatian | 181 | 0.0% |
| American | 66,185 | 4.0% |
| Apache | 292 | 0.0% |
| Arab | 17,861 | 1.1% |
| Argentinean | 6,025 | 0.4% |
| Armenian | 2,479 | 0.2% |
| Assyrian / Chaldean / Syriac | 140 | 0.0% |
| Australian | 3,015 | 0.2% |
| Austrian | 9,037 | 0.5% |
| Bahamian | 568 | 0.0% |
| Bangladeshi | 37 | 0.0% |
| Barbadian | 1,308 | 0.1% |
| Basque | 160 | 0.0% |
| Belgian | 1,763 | 0.1% |
| Belizean | 1,044 | 0.1% |
| Bermudan | 164 | 0.0% |
| Bhutanese | 16,253 | 1.0% |
| Blackfeet | 589 | 0.0% |
| Bolivian | 961 | 0.1% |
| Brazilian | 3,973 | 0.2% |
| British | 12,695 | 0.8% |
| British West Indian | 2,122 | 0.1% |
| Bulgarian | 1,115 | 0.1% |
| Burmese | 21,313 | 1.3% |
| Cajun | 192 | 0.0% |
| Cambodian | 130 | 0.0% |
| Canadian | 4,383 | 0.3% |
| Cape Verdean | 257 | 0.0% |
| Carpatho Rusyn | 20 | 0.0% |
| Celtic | 118 | 0.0% |
| Central American | 20,479 | 1.2% |
| Central American Indian | 6,844 | 0.4% |
| Cherokee | 2,558 | 0.2% |
| Chickasaw | 73 | 0.0% |
| Chilean | 1,607 | 0.1% |
| Chippewa | 129 | 0.0% |
| Choctaw | 180 | 0.0% |
| Colombian | 9,427 | 0.6% |
| Colville | 18 | 0.0% |
| Comanche | 21 | 0.0% |
| Costa Rican | 821 | 0.1% |
| Cree | 212 | 0.0% |
| Creek | 43 | 0.0% |
| Croatian | 2,517 | 0.2% |
| Cuban | 11,877 | 0.7% |
| Cypriot | 190 | 0.0% |
| Czech | 4,498 | 0.3% |
| Czechoslovakian | 733 | 0.0% |
| Danish | 3,291 | 0.2% |
| Delaware | 150 | 0.0% |
| Dominican | 174,446 | 10.6% |
| Dutch | 9,207 | 0.6% |
| Dutch West Indian | 219 | 0.0% |
| Eastern European | 36,406 | 2.2% |
| Ecuadorian | 17,223 | 1.1% |
| Egyptian | 2,698 | 0.2% |
| English | 75,840 | 4.6% |
| Estonian | 348 | 0.0% |
| Ethiopian | 1,964 | 0.1% |
| European | 28,896 | 1.8% |
| Fijian | 32 | 0.0% |
| Filipino | 5,548 | 0.3% |
| Finnish | 1,685 | 0.1% |
| French | 29,924 | 1.8% |
| French American Indian | 61 | 0.0% |
| French Canadian | 3,416 | 0.2% |
| German | 91,853 | 5.6% |
| German Russian | 41 | 0.0% |
| Ghanaian | 1,395 | 0.1% |
| Greek | 12,228 | 0.7% |
| Guamanian / Chamorro | 128 | 0.0% |
| Guatemalan | 2,714 | 0.2% |
| Guyanese | 1,894 | 0.1% |
| Haitian | 6,704 | 0.4% |
| Hmong | 24 | 0.0% |
| Honduran | 5,291 | 0.3% |
| Hungarian | 11,518 | 0.7% |
| Icelander | 237 | 0.0% |
| Indian (Asian) | 111,702 | 6.8% |
| Indonesian | 246 | 0.0% |
| Inupiat | 11 | 0.0% |
| Iranian | 5,857 | 0.4% |
| Iraqi | 955 | 0.1% |
| Irish | 114,999 | 7.0% |
| Iroquois | 798 | 0.1% |
| Israeli | 5,584 | 0.3% |
| Italian | 100,227 | 6.1% |
| Jamaican | 9,954 | 0.6% |
| Japanese | 243 | 0.0% |
| Jordanian | 185 | 0.0% |
| Kenyan | 527 | 0.0% |
| Korean | 14,615 | 0.9% |
| Laotian | 581 | 0.0% |
| Latvian | 1,361 | 0.1% |
| Lebanese | 4,323 | 0.3% |
| Liberian | 306 | 0.0% |
| Lithuanian | 4,509 | 0.3% |
| Lumbee | 18 | 0.0% |
| Luxembourger | 87 | 0.0% |
| Macedonian | 1,616 | 0.1% |
| Malaysian | 137 | 0.0% |
| Maltese | 1,000 | 0.1% |
| Menominee | 11 | 0.0% |
| Mexican | 43,796 | 2.7% |
| Mexican American Indian | 1,108 | 0.1% |
| Mongolian | 1,269 | 0.1% |
| Moroccan | 1,648 | 0.1% |
| Native Hawaiian | 1,014 | 0.1% |
| Navajo | 24 | 0.0% |
| New Zealander | 215 | 0.0% |
| Nicaraguan | 2,035 | 0.1% |
| Nigerian | 2,209 | 0.1% |
| Northern European | 2,898 | 0.2% |
| Norwegian | 8,366 | 0.5% |
| Okinawan | 462 | 0.0% |
| Osage | 44 | 0.0% |
| Pakistani | 1,720 | 0.1% |
| Palestinian | 837 | 0.1% |
| Panamanian | 3,261 | 0.2% |
| Paraguayan | 327 | 0.0% |
| Pennsylvania German | 160 | 0.0% |
| Peruvian | 5,433 | 0.3% |
| Polish | 55,639 | 3.4% |
| Portuguese | 4,839 | 0.3% |
| Potawatomi | 20 | 0.0% |
| Pueblo | 93 | 0.0% |
| Puerto Rican | 96,477 | 5.9% |
| Romanian | 8,100 | 0.5% |
| Russian | 54,271 | 3.3% |
| Salvadoran | 6,216 | 0.4% |
| Samoan | 200 | 0.0% |
| Scandinavian | 2,757 | 0.2% |
| Scotch-Irish | 6,132 | 0.4% |
| Scottish | 17,332 | 1.1% |
| Senegalese | 1,823 | 0.1% |
| Serbian | 1,656 | 0.1% |
| Sierra Leonean | 67 | 0.0% |
| Sioux | 234 | 0.0% |
| Slavic | 728 | 0.0% |
| Slovak | 2,211 | 0.1% |
| Slovene | 413 | 0.0% |
| Somali | 517 | 0.0% |
| South African | 1,221 | 0.1% |
| South American | 45,304 | 2.8% |
| South American Indian | 974 | 0.1% |
| Soviet Union | 61 | 0.0% |
| Spaniard | 9,021 | 0.5% |
| Spanish | 3,861 | 0.2% |
| Spanish American | 78 | 0.0% |
| Spanish American Indian | 124 | 0.0% |
| Sri Lankan | 4,439 | 0.3% |
| Subsaharan African | 29,866 | 1.8% |
| Sudanese | 101 | 0.0% |
| Swedish | 8,847 | 0.5% |
| Swiss | 3,848 | 0.2% |
| Syrian | 1,840 | 0.1% |
| Taiwanese | 48 | 0.0% |
| Thai | 39,720 | 2.4% |
| Tohono O'Odham | 22 | 0.0% |
| Trinidadian and Tobagonian | 2,753 | 0.2% |
| Turkish | 4,769 | 0.3% |
| U.S. Virgin Islander | 421 | 0.0% |
| Ugandan | 348 | 0.0% |
| Ukrainian | 11,439 | 0.7% |
| Uruguayan | 766 | 0.1% |
| Ute | 25 | 0.0% |
| Venezuelan | 3,269 | 0.2% |
| Vietnamese | 1,565 | 0.1% |
| Welsh | 5,149 | 0.3% |
| West Indian | 5,350 | 0.3% |
| Yugoslavian | 589 | 0.0% |
| Zimbabwean | 30 | 0.0% | View All 177 Rows |
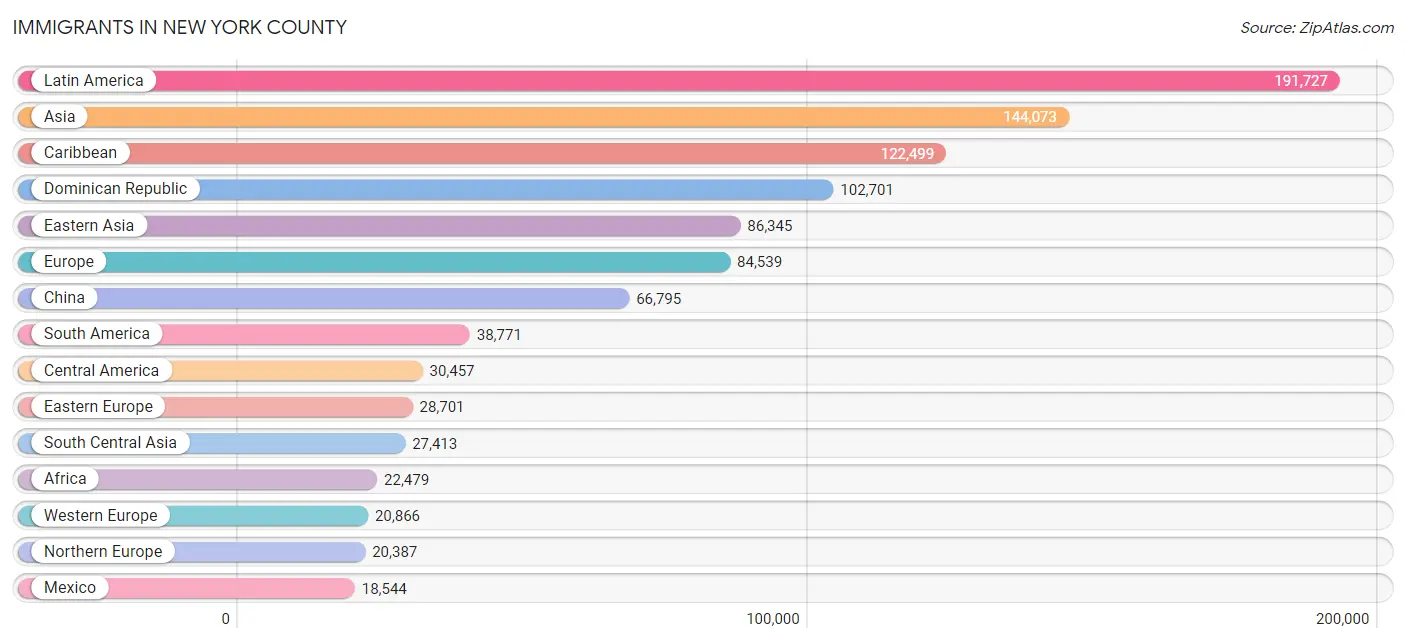
Immigrants in New York County
The most numerous immigrant groups reported in New York County came from Latin America (191,727 | 11.7%), Asia (144,073 | 8.7%), Caribbean (122,499 | 7.4%), Dominican Republic (102,701 | 6.2%), and Eastern Asia (86,345 | 5.2%), together accounting for 39.3% of all New York County residents.
| Immigration Origin | # Population | % Population |
| Afghanistan | 151 | 0.0% |
| Africa | 22,479 | 1.4% |
| Albania | 1,083 | 0.1% |
| Argentina | 4,700 | 0.3% |
| Armenia | 342 | 0.0% |
| Asia | 144,073 | 8.7% |
| Australia | 5,995 | 0.4% |
| Austria | 721 | 0.0% |
| Bahamas | 245 | 0.0% |
| Bangladesh | 1,925 | 0.1% |
| Barbados | 694 | 0.0% |
| Belarus | 602 | 0.0% |
| Belgium | 1,215 | 0.1% |
| Belize | 629 | 0.0% |
| Bolivia | 424 | 0.0% |
| Bosnia and Herzegovina | 474 | 0.0% |
| Brazil | 5,392 | 0.3% |
| Bulgaria | 1,053 | 0.1% |
| Cabo Verde | 101 | 0.0% |
| Cambodia | 179 | 0.0% |
| Cameroon | 97 | 0.0% |
| Canada | 12,816 | 0.8% |
| Caribbean | 122,499 | 7.4% |
| Central America | 30,457 | 1.8% |
| Chile | 1,454 | 0.1% |
| China | 66,795 | 4.1% |
| Colombia | 6,155 | 0.4% |
| Congo | 69 | 0.0% |
| Costa Rica | 417 | 0.0% |
| Croatia | 944 | 0.1% |
| Cuba | 4,171 | 0.3% |
| Czechoslovakia | 1,129 | 0.1% |
| Denmark | 489 | 0.0% |
| Dominica | 919 | 0.1% |
| Dominican Republic | 102,701 | 6.2% |
| Eastern Africa | 3,862 | 0.2% |
| Eastern Asia | 86,345 | 5.2% |
| Eastern Europe | 28,701 | 1.7% |
| Ecuador | 11,597 | 0.7% |
| Egypt | 1,572 | 0.1% |
| El Salvador | 3,251 | 0.2% |
| England | 3,181 | 0.2% |
| Eritrea | 130 | 0.0% |
| Ethiopia | 1,401 | 0.1% |
| Europe | 84,539 | 5.1% |
| France | 10,258 | 0.6% |
| Germany | 5,914 | 0.4% |
| Ghana | 1,558 | 0.1% |
| Greece | 2,636 | 0.2% |
| Grenada | 372 | 0.0% |
| Guatemala | 1,416 | 0.1% |
| Guyana | 2,241 | 0.1% |
| Haiti | 3,921 | 0.2% |
| Honduras | 3,209 | 0.2% |
| Hong Kong | 5,766 | 0.4% |
| Hungary | 1,006 | 0.1% |
| India | 17,031 | 1.0% |
| Indonesia | 788 | 0.1% |
| Iran | 3,223 | 0.2% |
| Iraq | 238 | 0.0% |
| Ireland | 3,307 | 0.2% |
| Israel | 5,600 | 0.3% |
| Italy | 6,266 | 0.4% |
| Jamaica | 4,309 | 0.3% |
| Japan | 9,384 | 0.6% |
| Jordan | 327 | 0.0% |
| Kazakhstan | 430 | 0.0% |
| Kenya | 760 | 0.1% |
| Korea | 10,100 | 0.6% |
| Kuwait | 304 | 0.0% |
| Laos | 11 | 0.0% |
| Latin America | 191,727 | 11.7% |
| Latvia | 303 | 0.0% |
| Lebanon | 928 | 0.1% |
| Liberia | 238 | 0.0% |
| Lithuania | 231 | 0.0% |
| Malaysia | 2,458 | 0.2% |
| Mexico | 18,544 | 1.1% |
| Middle Africa | 446 | 0.0% |
| Moldova | 389 | 0.0% |
| Morocco | 729 | 0.0% |
| Nepal | 497 | 0.0% |
| Netherlands | 1,176 | 0.1% |
| Nicaragua | 1,111 | 0.1% |
| Nigeria | 1,414 | 0.1% |
| North Macedonia | 581 | 0.0% |
| Northern Africa | 3,601 | 0.2% |
| Northern Europe | 20,387 | 1.2% |
| Norway | 671 | 0.0% |
| Oceania | 6,845 | 0.4% |
| Pakistan | 2,621 | 0.2% |
| Panama | 1,880 | 0.1% |
| Peru | 3,160 | 0.2% |
| Philippines | 7,938 | 0.5% |
| Poland | 4,270 | 0.3% |
| Portugal | 638 | 0.0% |
| Romania | 3,196 | 0.2% |
| Russia | 7,345 | 0.4% |
| Saudi Arabia | 475 | 0.0% |
| Scotland | 1,112 | 0.1% |
| Senegal | 2,536 | 0.2% |
| Serbia | 799 | 0.1% |
| Sierra Leone | 331 | 0.0% |
| Singapore | 1,480 | 0.1% |
| Somalia | 188 | 0.0% |
| South Africa | 1,809 | 0.1% |
| South America | 38,771 | 2.4% |
| South Central Asia | 27,413 | 1.7% |
| South Eastern Asia | 16,497 | 1.0% |
| Southern Europe | 14,230 | 0.9% |
| Spain | 4,324 | 0.3% |
| Sri Lanka | 410 | 0.0% |
| St. Vincent and the Grenadines | 192 | 0.0% |
| Sudan | 188 | 0.0% |
| Sweden | 1,082 | 0.1% |
| Switzerland | 1,497 | 0.1% |
| Syria | 252 | 0.0% |
| Taiwan | 4,605 | 0.3% |
| Thailand | 1,276 | 0.1% |
| Trinidad and Tobago | 2,900 | 0.2% |
| Turkey | 2,811 | 0.2% |
| Uganda | 295 | 0.0% |
| Ukraine | 3,189 | 0.2% |
| Uruguay | 290 | 0.0% |
| Uzbekistan | 772 | 0.1% |
| Venezuela | 2,976 | 0.2% |
| Vietnam | 2,051 | 0.1% |
| West Indies | 682 | 0.0% |
| Western Africa | 10,808 | 0.7% |
| Western Asia | 13,332 | 0.8% |
| Western Europe | 20,866 | 1.3% |
| Yemen | 861 | 0.1% |
| Zaire | 217 | 0.0% |
| Zimbabwe | 240 | 0.0% | View All 134 Rows |
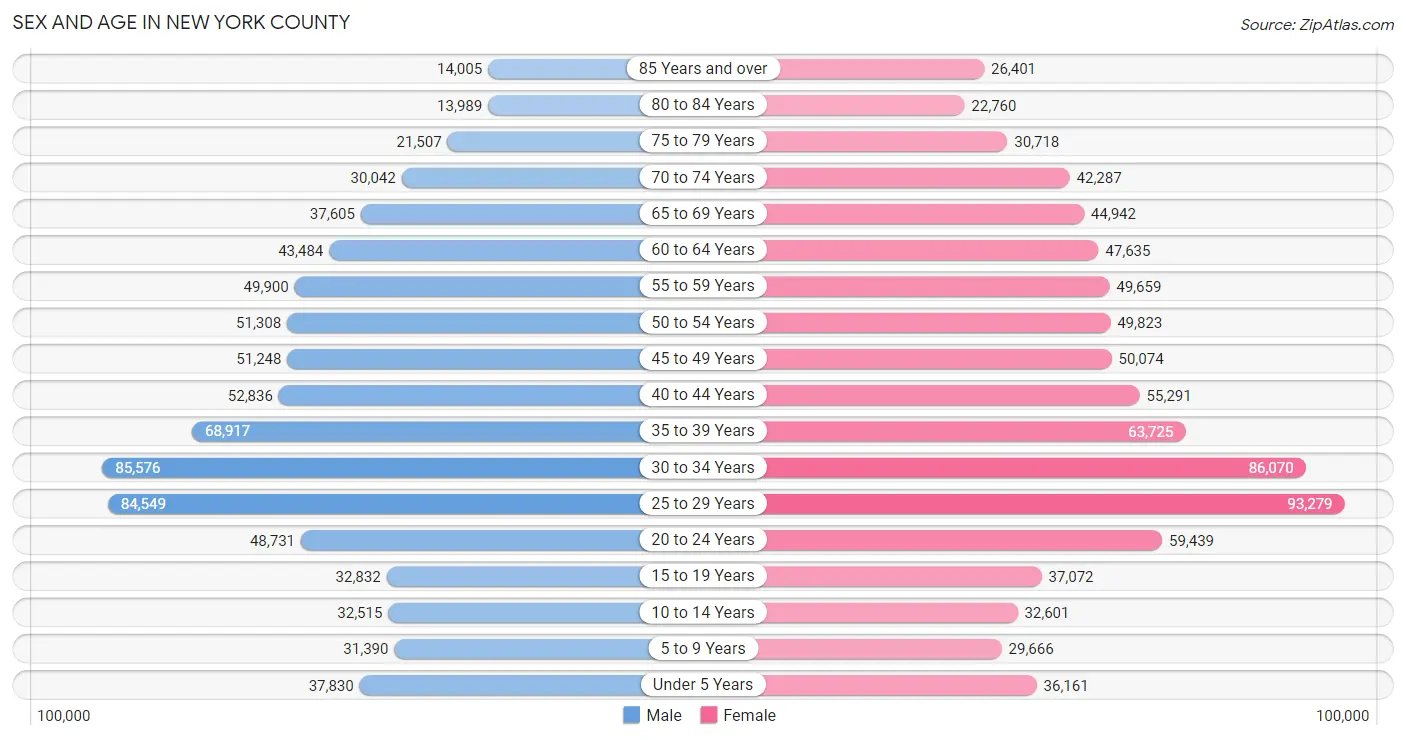
Sex and Age in New York County
Sex and Age in New York County
The most populous age groups in New York County are 30 to 34 Years (85,576 | 10.9%) for men and 25 to 29 Years (93,279 | 10.9%) for women.
| Age Bracket | Male | Female |
| Under 5 Years | 37,830 (4.8%) | 36,161 (4.2%) |
| 5 to 9 Years | 31,390 (4.0%) | 29,666 (3.5%) |
| 10 to 14 Years | 32,515 (4.1%) | 32,601 (3.8%) |
| 15 to 19 Years | 32,832 (4.2%) | 37,072 (4.3%) |
| 20 to 24 Years | 48,731 (6.2%) | 59,439 (6.9%) |
| 25 to 29 Years | 84,549 (10.7%) | 93,279 (10.9%) |
| 30 to 34 Years | 85,576 (10.9%) | 86,070 (10.0%) |
| 35 to 39 Years | 68,917 (8.7%) | 63,725 (7.4%) |
| 40 to 44 Years | 52,836 (6.7%) | 55,291 (6.5%) |
| 45 to 49 Years | 51,248 (6.5%) | 50,074 (5.8%) |
| 50 to 54 Years | 51,308 (6.5%) | 49,823 (5.8%) |
| 55 to 59 Years | 49,900 (6.3%) | 49,659 (5.8%) |
| 60 to 64 Years | 43,484 (5.5%) | 47,635 (5.6%) |
| 65 to 69 Years | 37,605 (4.8%) | 44,942 (5.2%) |
| 70 to 74 Years | 30,042 (3.8%) | 42,287 (4.9%) |
| 75 to 79 Years | 21,507 (2.7%) | 30,718 (3.6%) |
| 80 to 84 Years | 13,989 (1.8%) | 22,760 (2.6%) |
| 85 Years and over | 14,005 (1.8%) | 26,401 (3.1%) |
| Total | 788,264 (100.0%) | 857,603 (100.0%) |
Families and Households in New York County
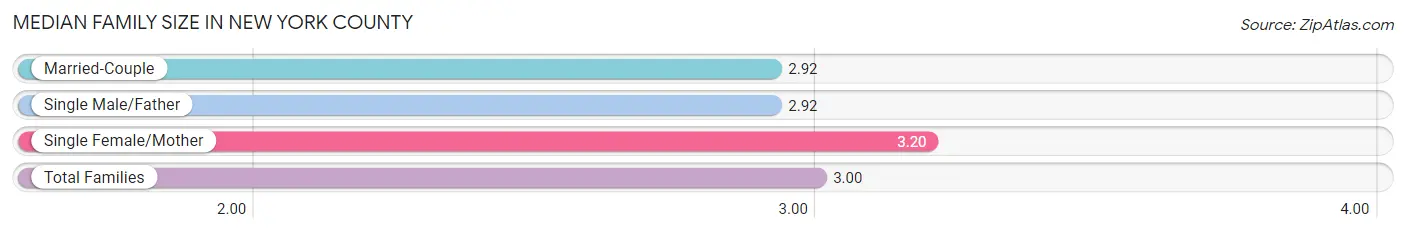
Median Family Size in New York County
The median family size in New York County is 3.00 persons per family, with single female/mother families (84,572 | 26.1%) accounting for the largest median family size of 3.2 persons per family. On the other hand, married-couple families (215,530 | 66.4%) represent the smallest median family size with 2.92 persons per family.
| Family Type | # Families | Family Size |
| Married-Couple | 215,530 (66.4%) | 2.92 |
| Single Male/Father | 24,512 (7.5%) | 2.92 |
| Single Female/Mother | 84,572 (26.1%) | 3.20 |
| Total Families | 324,614 (100.0%) | 3.00 |
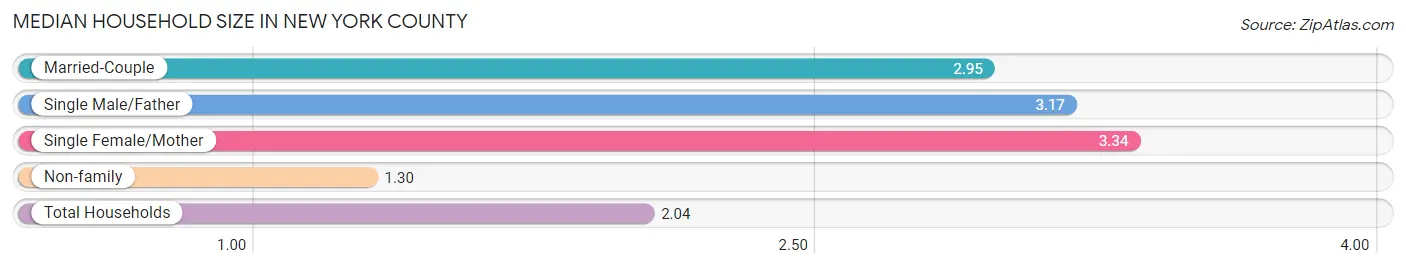
Median Household Size in New York County
The median household size in New York County is 2.04 persons per household, with single female/mother households (84,572 | 11.0%) accounting for the largest median household size of 3.34 persons per household. non-family households (447,987 | 58.0%) represent the smallest median household size with 1.30 persons per household.
| Household Type | # Households | Household Size |
| Married-Couple | 215,530 (27.9%) | 2.95 |
| Single Male/Father | 24,512 (3.2%) | 3.17 |
| Single Female/Mother | 84,572 (11.0%) | 3.34 |
| Non-family | 447,987 (58.0%) | 1.30 |
| Total Households | 772,601 (100.0%) | 2.04 |
Household Size by Marriage Status in New York County
Out of a total of 772,601 households in New York County, 324,614 (42.0%) are family households, while 447,987 (58.0%) are nonfamily households. The most numerous type of family households are 2-person households, comprising 165,282, and the most common type of nonfamily households are 1-person households, comprising 361,746.
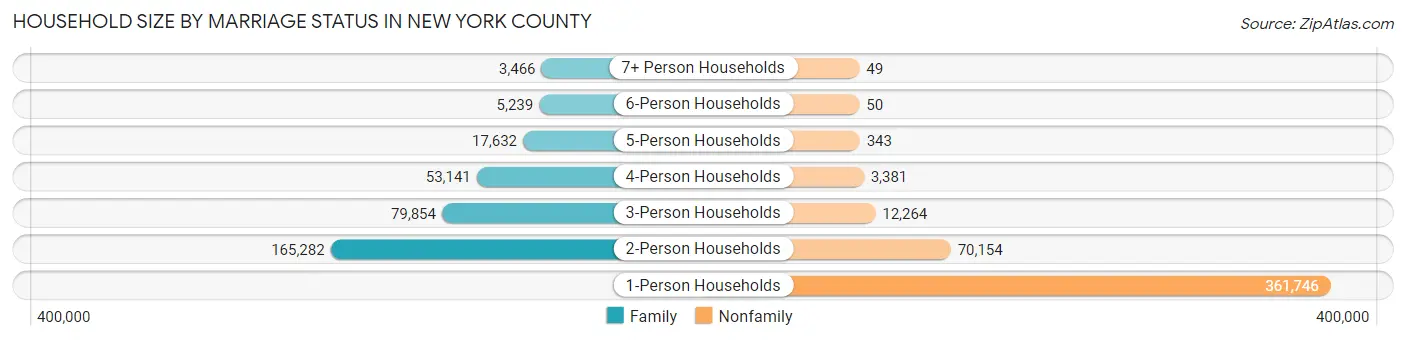
| Household Size | Family Households | Nonfamily Households |
| 1-Person Households | - | 361,746 (46.8%) |
| 2-Person Households | 165,282 (21.4%) | 70,154 (9.1%) |
| 3-Person Households | 79,854 (10.3%) | 12,264 (1.6%) |
| 4-Person Households | 53,141 (6.9%) | 3,381 (0.4%) |
| 5-Person Households | 17,632 (2.3%) | 343 (0.0%) |
| 6-Person Households | 5,239 (0.7%) | 50 (0.0%) |
| 7+ Person Households | 3,466 (0.4%) | 49 (0.0%) |
| Total | 324,614 (42.0%) | 447,987 (58.0%) |
Female Fertility in New York County
Fertility by Age in New York County
Average fertility rate in New York County is 36.0 births per 1,000 women. Women in the age bracket of 35 to 50 years have the highest fertility rate with 44.0 births per 1,000 women. Women in the age bracket of 20 to 34 years acount for 51.6% of all women with births.
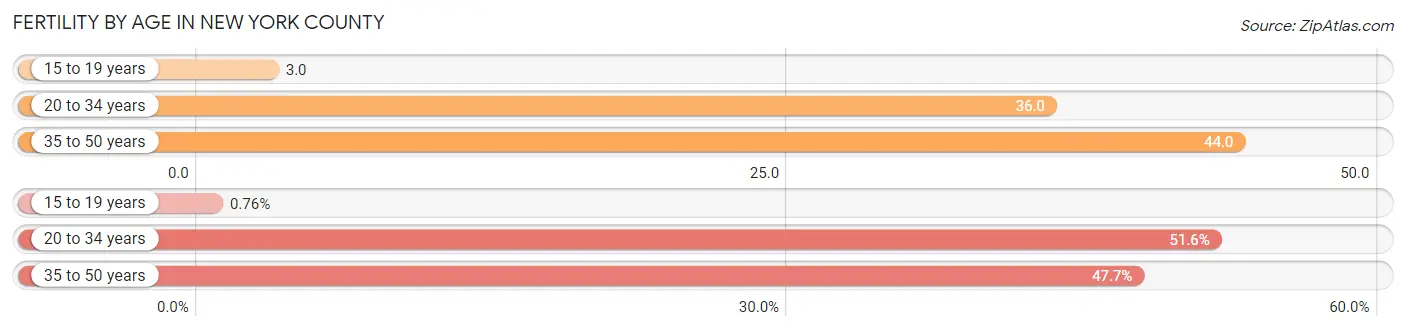
| Age Bracket | Women with Births | Births / 1,000 Women |
| 15 to 19 years | 126 (0.8%) | 3.0 |
| 20 to 34 years | 8,568 (51.6%) | 36.0 |
| 35 to 50 years | 7,913 (47.6%) | 44.0 |
| Total | 16,607 (100.0%) | 36.0 |
Fertility by Age by Marriage Status in New York County
80.8% of women with births (16,607) in New York County are married. The highest percentage of unmarried women with births falls into 15 to 19 years age bracket with 100.0% of them unmarried at the time of birth, while the lowest percentage of unmarried women with births belong to 35 to 50 years age bracket with 15.6% of them unmarried.
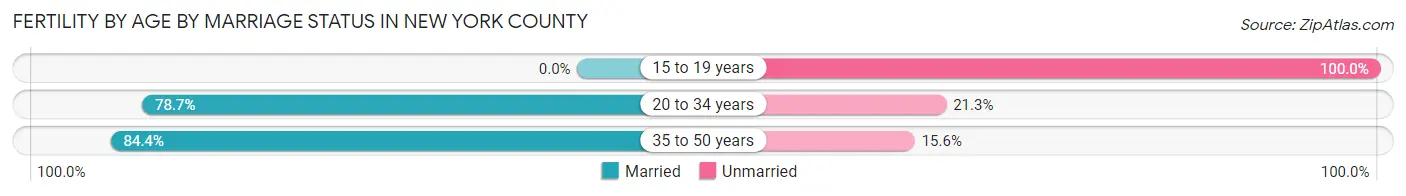
| Age Bracket | Married | Unmarried |
| 15 to 19 years | 0 (0.0%) | 126 (100.0%) |
| 20 to 34 years | 6,743 (78.7%) | 1,825 (21.3%) |
| 35 to 50 years | 6,679 (84.4%) | 1,234 (15.6%) |
| Total | 13,418 (80.8%) | 3,189 (19.2%) |
Fertility by Education in New York County
Average fertility rate in New York County is 36.0 births per 1,000 women. Women with the education attainment of graduate degree have the highest fertility rate of 55.0 births per 1,000 women, while women with the education attainment of college or associate's degree have the lowest fertility at 23.0 births per 1,000 women. Women with the education attainment of graduate degree represent 40.9% of all women with births.
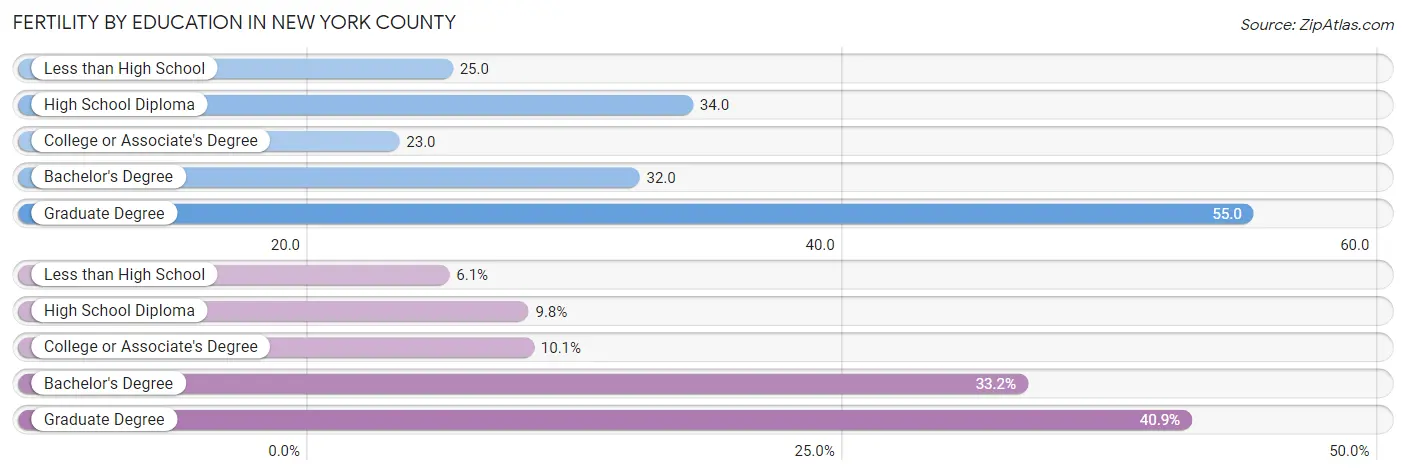
| Educational Attainment | Women with Births | Births / 1,000 Women |
| Less than High School | 1,011 (6.1%) | 25.0 |
| High School Diploma | 1,628 (9.8%) | 34.0 |
| College or Associate's Degree | 1,669 (10.1%) | 23.0 |
| Bachelor's Degree | 5,511 (33.2%) | 32.0 |
| Graduate Degree | 6,788 (40.9%) | 55.0 |
| Total | 16,607 (100.0%) | 36.0 |
Fertility by Education by Marriage Status in New York County
19.2% of women with births in New York County are unmarried. Women with the educational attainment of graduate degree are most likely to be married with 93.4% of them married at childbirth, while women with the educational attainment of high school diploma are least likely to be married with 62.7% of them unmarried at childbirth.
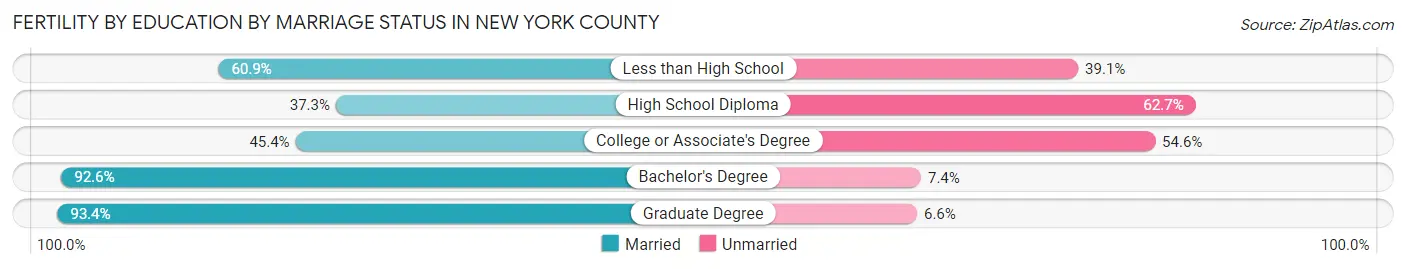
| Educational Attainment | Married | Unmarried |
| Less than High School | 616 (60.9%) | 395 (39.1%) |
| High School Diploma | 607 (37.3%) | 1,021 (62.7%) |
| College or Associate's Degree | 758 (45.4%) | 911 (54.6%) |
| Bachelor's Degree | 5,103 (92.6%) | 408 (7.4%) |
| Graduate Degree | 6,340 (93.4%) | 448 (6.6%) |
| Total | 13,418 (80.8%) | 3,189 (19.2%) |
Employment Characteristics in New York County
Employment by Class of Employer in New York County
Among the 870,794 employed individuals in New York County, private company employees (573,922 | 65.9%), not-for-profit organizations (116,193 | 13.3%), and self-employed (not incorporated) (58,947 | 6.8%) make up the most common classes of employment.
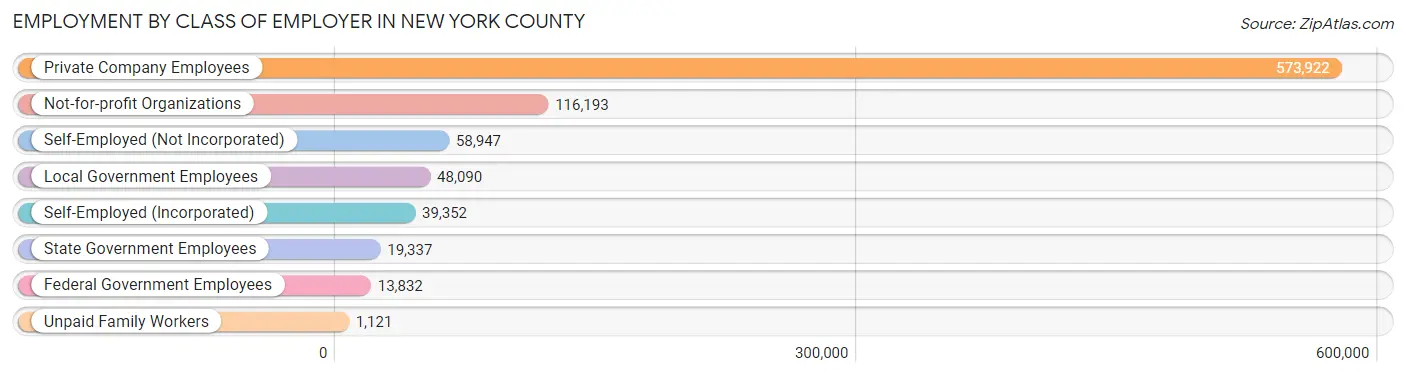
| Employer Class | # Employees | % Employees |
| Private Company Employees | 573,922 | 65.9% |
| Self-Employed (Incorporated) | 39,352 | 4.5% |
| Self-Employed (Not Incorporated) | 58,947 | 6.8% |
| Not-for-profit Organizations | 116,193 | 13.3% |
| Local Government Employees | 48,090 | 5.5% |
| State Government Employees | 19,337 | 2.2% |
| Federal Government Employees | 13,832 | 1.6% |
| Unpaid Family Workers | 1,121 | 0.1% |
| Total | 870,794 | 100.0% |
Employment Status by Age in New York County
According to the labor force statistics for New York County, out of the total population over 16 years of age (1,433,287), 66.5% or 953,136 individuals are in the labor force, with 6.8% or 64,813 of them unemployed. The age group with the highest labor force participation rate is 30 to 34 years, with 87.8% or 150,705 individuals in the labor force. Within the labor force, the 16 to 19 years age range has the highest percentage of unemployed individuals, with 27.2% or 3,878 of them being unemployed.
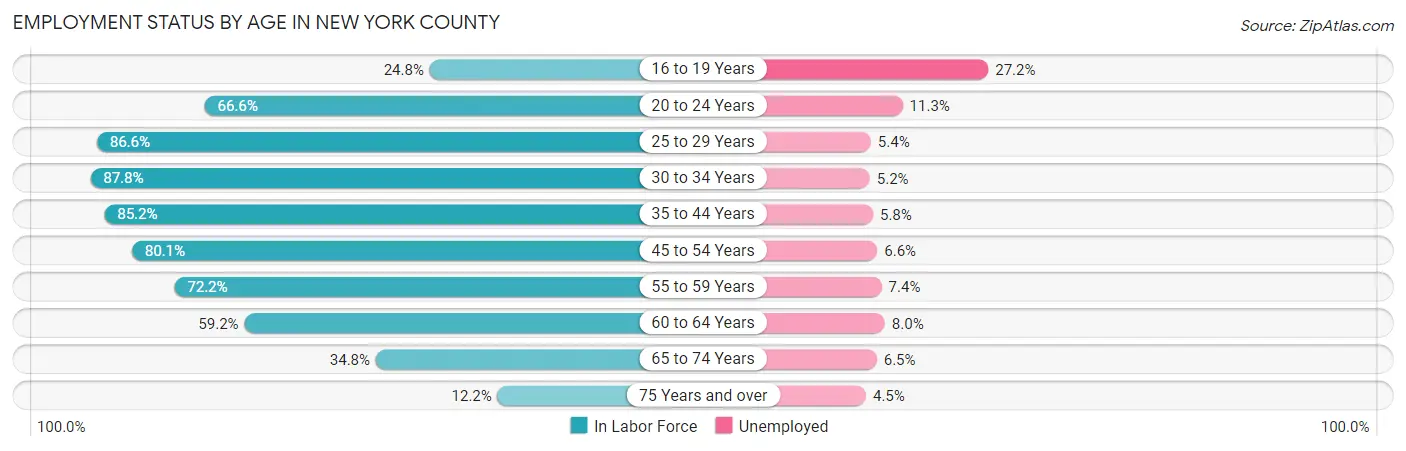
| Age Bracket | In Labor Force | Unemployed |
| 16 to 19 Years | 14,257 (24.8%) | 3,878 (27.2%) |
| 20 to 24 Years | 72,041 (66.6%) | 8,141 (11.3%) |
| 25 to 29 Years | 153,999 (86.6%) | 8,316 (5.4%) |
| 30 to 34 Years | 150,705 (87.8%) | 7,837 (5.2%) |
| 35 to 44 Years | 205,135 (85.2%) | 11,898 (5.8%) |
| 45 to 54 Years | 162,165 (80.1%) | 10,703 (6.6%) |
| 55 to 59 Years | 71,882 (72.2%) | 5,319 (7.4%) |
| 60 to 64 Years | 53,942 (59.2%) | 4,315 (8.0%) |
| 65 to 74 Years | 53,897 (34.8%) | 3,503 (6.5%) |
| 75 Years and over | 15,784 (12.2%) | 710 (4.5%) |
| Total | 953,136 (66.5%) | 64,813 (6.8%) |
Employment Status by Educational Attainment in New York County
According to labor force statistics for New York County, 81.1% of individuals (797,516) out of the total population between 25 and 64 years of age (983,374) are in the labor force, with 6.1% or 48,648 of them being unemployed. The group with the highest labor force participation rate are those with the educational attainment of bachelor's degree or higher, with 88.8% or 581,775 individuals in the labor force. Within the labor force, individuals with less than high school education have the highest percentage of unemployment, with 13.0% or 6,151 of them being unemployed.
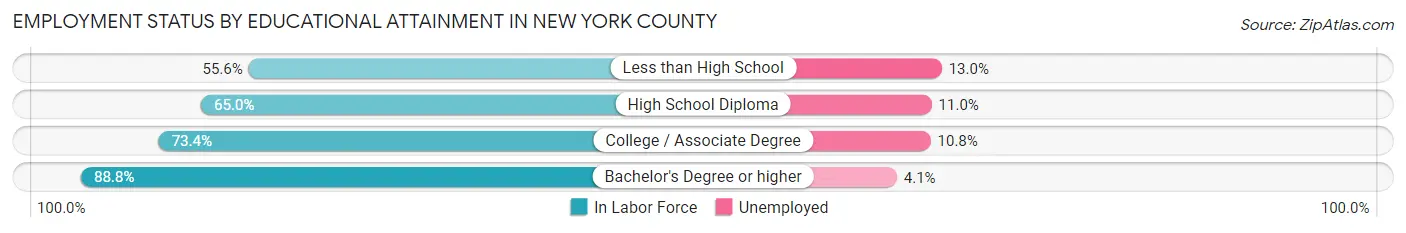
| Educational Attainment | In Labor Force | Unemployed |
| Less than High School | 47,315 (55.6%) | 11,063 (13.0%) |
| High School Diploma | 73,634 (65.0%) | 12,461 (11.0%) |
| College / Associate Degree | 95,303 (73.4%) | 14,023 (10.8%) |
| Bachelor's Degree or higher | 581,775 (88.8%) | 26,861 (4.1%) |
| Total | 797,516 (81.1%) | 59,986 (6.1%) |
Employment Occupations by Sex in New York County
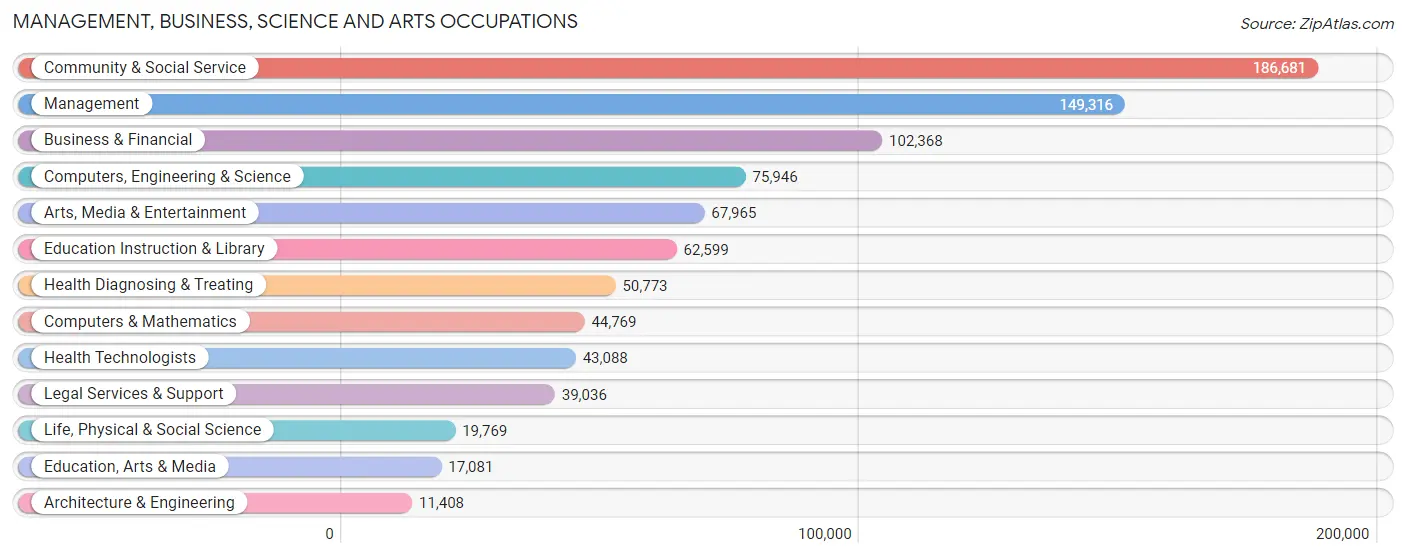
Management, Business, Science and Arts Occupations
The most common Management, Business, Science and Arts occupations in New York County are Community & Social Service (186,681 | 21.0%), Management (149,316 | 16.8%), Business & Financial (102,368 | 11.5%), Computers, Engineering & Science (75,946 | 8.5%), and Arts, Media & Entertainment (67,965 | 7.6%).
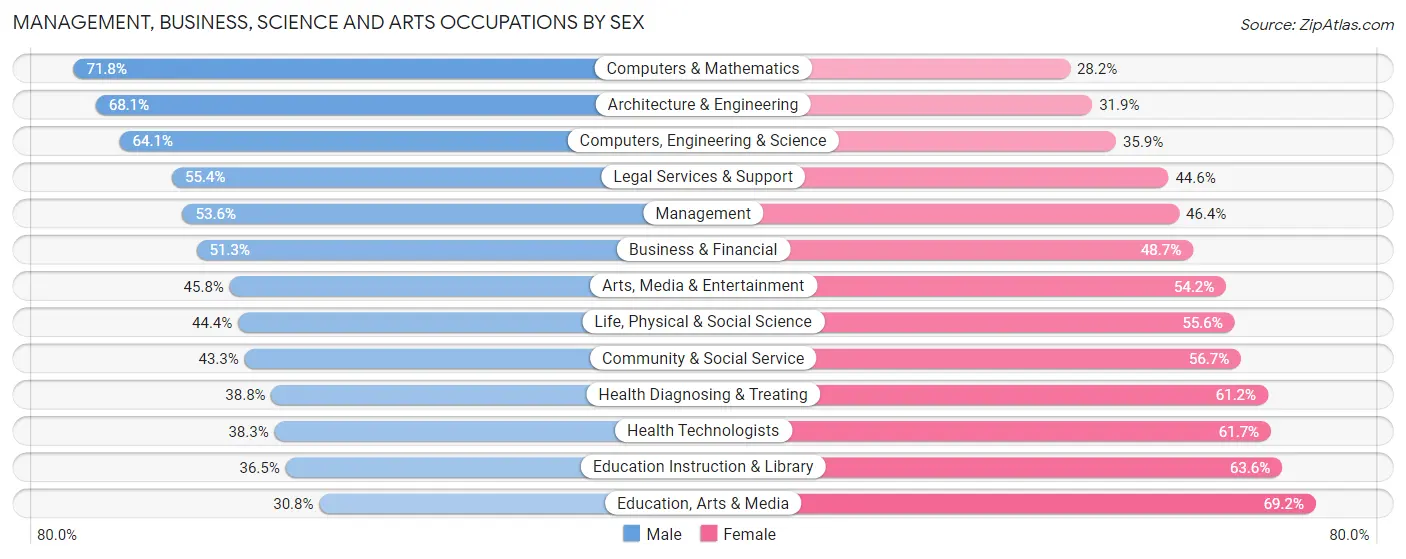
Management, Business, Science and Arts Occupations by Sex
Within the Management, Business, Science and Arts occupations in New York County, the most male-oriented occupations are Computers & Mathematics (71.8%), Architecture & Engineering (68.1%), and Computers, Engineering & Science (64.1%), while the most female-oriented occupations are Education, Arts & Media (69.2%), Education Instruction & Library (63.5%), and Health Technologists (61.7%).
| Occupation | Male | Female |
| Management | 80,056 (53.6%) | 69,260 (46.4%) |
| Business & Financial | 52,529 (51.3%) | 49,839 (48.7%) |
| Computers, Engineering & Science | 48,701 (64.1%) | 27,245 (35.9%) |
| Computers & Mathematics | 32,159 (71.8%) | 12,610 (28.2%) |
| Architecture & Engineering | 7,770 (68.1%) | 3,638 (31.9%) |
| Life, Physical & Social Science | 8,772 (44.4%) | 10,997 (55.6%) |
| Community & Social Service | 80,817 (43.3%) | 105,864 (56.7%) |
| Education, Arts & Media | 5,264 (30.8%) | 11,817 (69.2%) |
| Legal Services & Support | 21,622 (55.4%) | 17,414 (44.6%) |
| Education Instruction & Library | 22,820 (36.4%) | 39,779 (63.5%) |
| Arts, Media & Entertainment | 31,111 (45.8%) | 36,854 (54.2%) |
| Health Diagnosing & Treating | 19,705 (38.8%) | 31,068 (61.2%) |
| Health Technologists | 16,504 (38.3%) | 26,584 (61.7%) |
| Total (Category) | 281,808 (49.9%) | 283,276 (50.1%) |
| Total (Overall) | 445,882 (50.2%) | 442,954 (49.8%) |
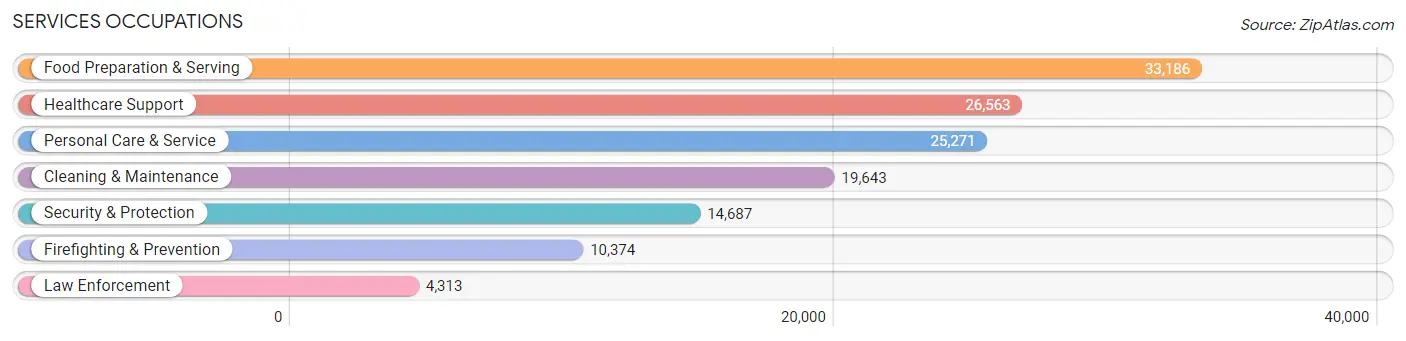
Services Occupations
The most common Services occupations in New York County are Food Preparation & Serving (33,186 | 3.7%), Healthcare Support (26,563 | 3.0%), Personal Care & Service (25,271 | 2.8%), Cleaning & Maintenance (19,643 | 2.2%), and Security & Protection (14,687 | 1.7%).
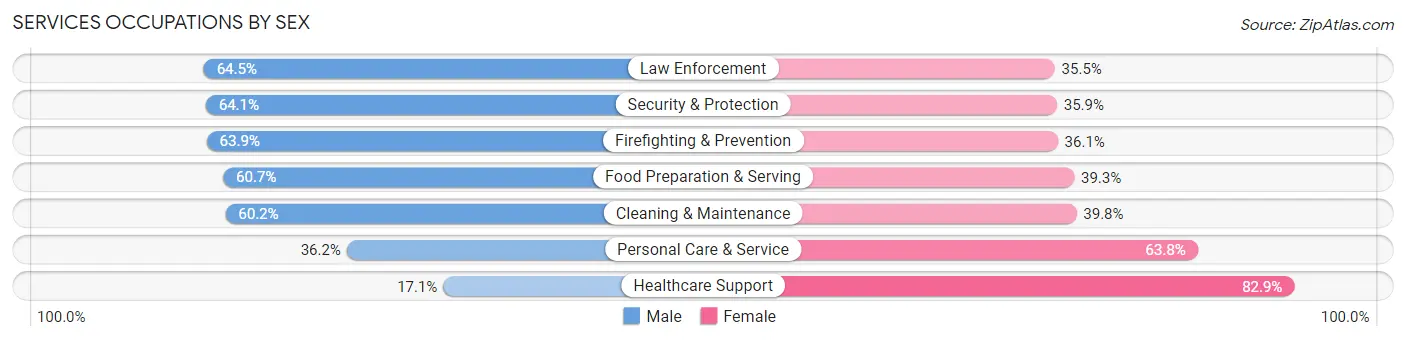
Services Occupations by Sex
Within the Services occupations in New York County, the most male-oriented occupations are Law Enforcement (64.5%), Security & Protection (64.1%), and Firefighting & Prevention (63.9%), while the most female-oriented occupations are Healthcare Support (82.9%), Personal Care & Service (63.8%), and Cleaning & Maintenance (39.8%).
| Occupation | Male | Female |
| Healthcare Support | 4,545 (17.1%) | 22,018 (82.9%) |
| Security & Protection | 9,416 (64.1%) | 5,271 (35.9%) |
| Firefighting & Prevention | 6,633 (63.9%) | 3,741 (36.1%) |
| Law Enforcement | 2,783 (64.5%) | 1,530 (35.5%) |
| Food Preparation & Serving | 20,140 (60.7%) | 13,046 (39.3%) |
| Cleaning & Maintenance | 11,833 (60.2%) | 7,810 (39.8%) |
| Personal Care & Service | 9,153 (36.2%) | 16,118 (63.8%) |
| Total (Category) | 55,087 (46.2%) | 64,263 (53.8%) |
| Total (Overall) | 445,882 (50.2%) | 442,954 (49.8%) |
Sales and Office Occupations
The most common Sales and Office occupations in New York County are Sales & Related (81,061 | 9.1%), and Office & Administration (69,326 | 7.8%).

Sales and Office Occupations by Sex
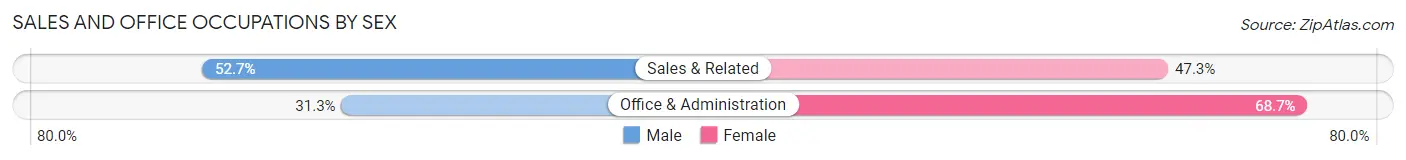
| Occupation | Male | Female |
| Sales & Related | 42,703 (52.7%) | 38,358 (47.3%) |
| Office & Administration | 21,674 (31.3%) | 47,652 (68.7%) |
| Total (Category) | 64,377 (42.8%) | 86,010 (57.2%) |
| Total (Overall) | 445,882 (50.2%) | 442,954 (49.8%) |
Natural Resources, Construction and Maintenance Occupations
The most common Natural Resources, Construction and Maintenance occupations in New York County are Construction & Extraction (11,496 | 1.3%), Installation, Maintenance & Repair (5,086 | 0.6%), and Farming, Fishing & Forestry (248 | 0.0%).

Natural Resources, Construction and Maintenance Occupations by Sex
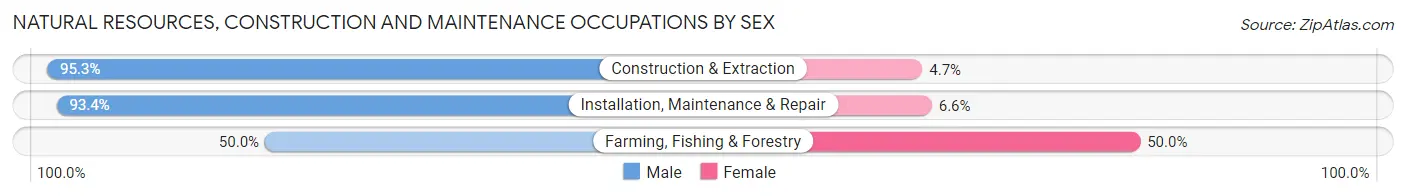
| Occupation | Male | Female |
| Farming, Fishing & Forestry | 124 (50.0%) | 124 (50.0%) |
| Construction & Extraction | 10,959 (95.3%) | 537 (4.7%) |
| Installation, Maintenance & Repair | 4,749 (93.4%) | 337 (6.6%) |
| Total (Category) | 15,832 (94.1%) | 998 (5.9%) |
| Total (Overall) | 445,882 (50.2%) | 442,954 (49.8%) |
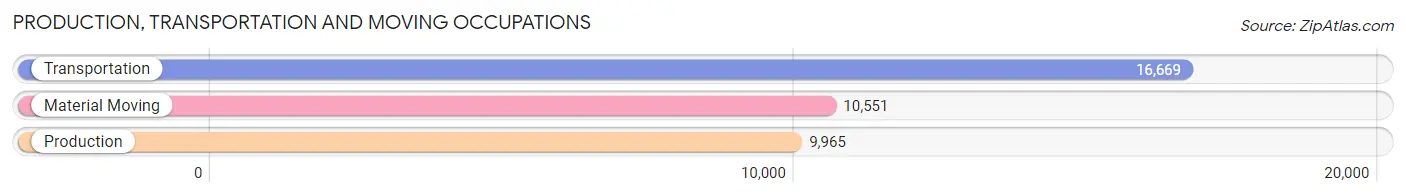
Production, Transportation and Moving Occupations
The most common Production, Transportation and Moving occupations in New York County are Transportation (16,669 | 1.9%), Material Moving (10,551 | 1.2%), and Production (9,965 | 1.1%).
Production, Transportation and Moving Occupations by Sex
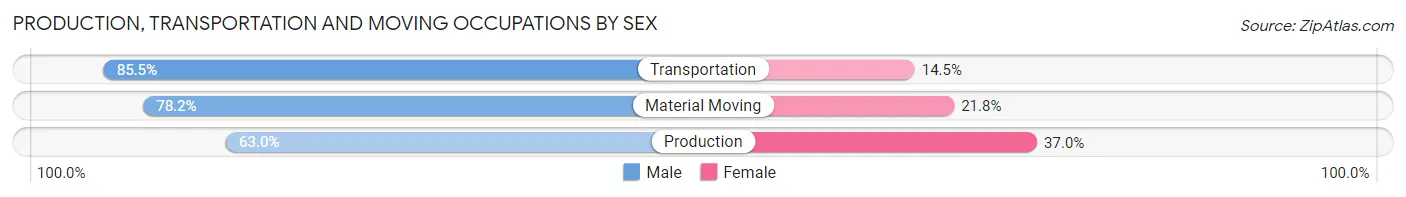
| Occupation | Male | Female |
| Production | 6,279 (63.0%) | 3,686 (37.0%) |
| Transportation | 14,246 (85.5%) | 2,423 (14.5%) |
| Material Moving | 8,253 (78.2%) | 2,298 (21.8%) |
| Total (Category) | 28,778 (77.4%) | 8,407 (22.6%) |
| Total (Overall) | 445,882 (50.2%) | 442,954 (49.8%) |
Employment Industries by Sex in New York County
Employment Industries in New York County
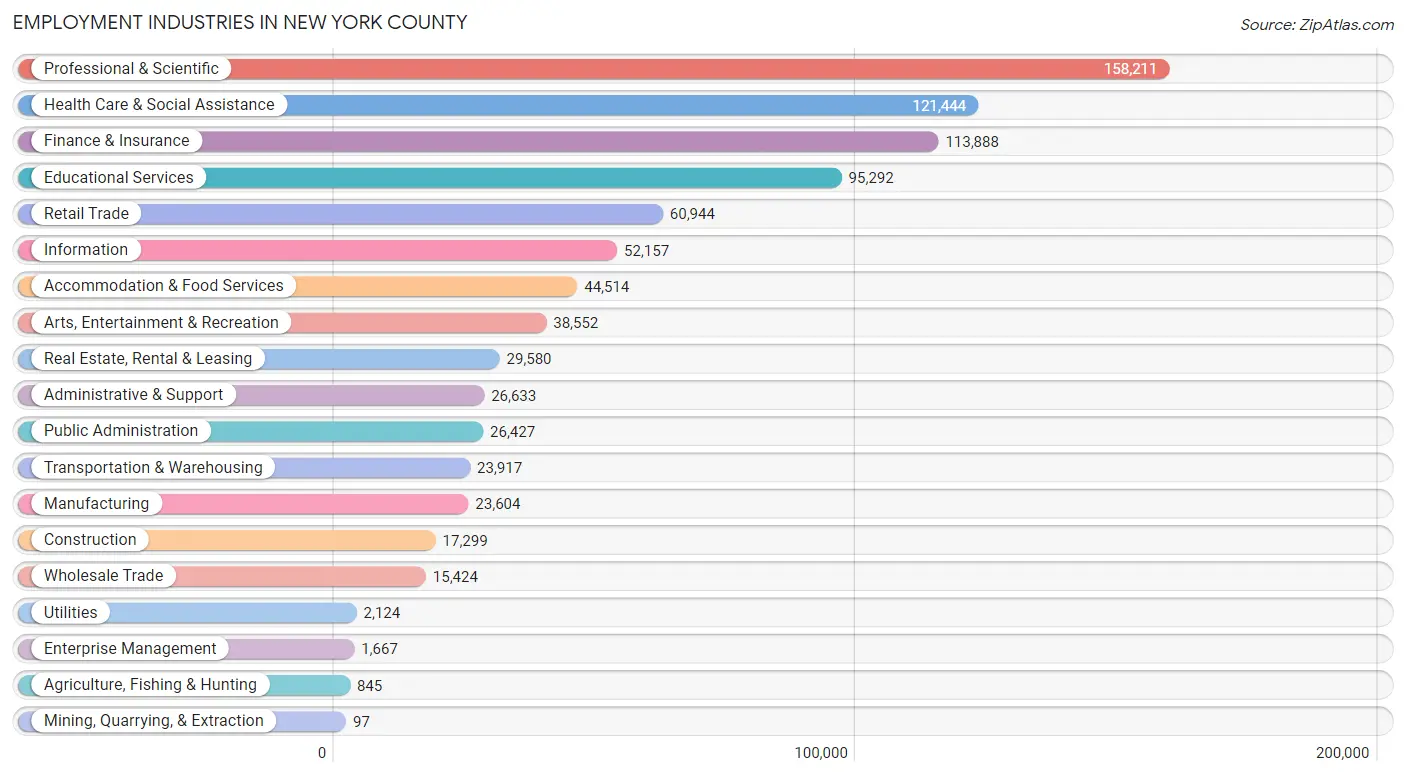
The major employment industries in New York County include Professional & Scientific (158,211 | 17.8%), Health Care & Social Assistance (121,444 | 13.7%), Finance & Insurance (113,888 | 12.8%), Educational Services (95,292 | 10.7%), and Retail Trade (60,944 | 6.9%).
Employment Industries by Sex in New York County
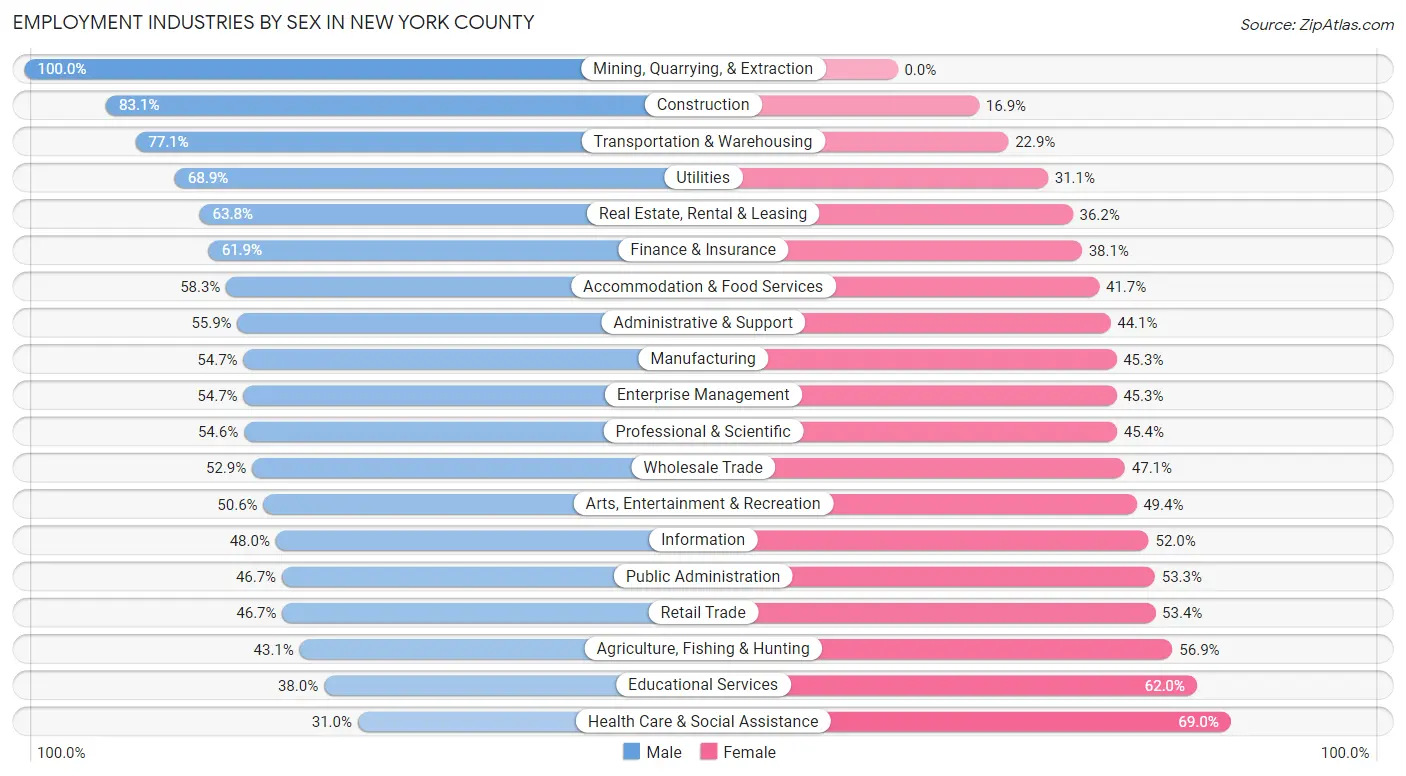
The New York County industries that see more men than women are Mining, Quarrying, & Extraction (100.0%), Construction (83.1%), and Transportation & Warehousing (77.1%), whereas the industries that tend to have a higher number of women are Health Care & Social Assistance (69.0%), Educational Services (62.0%), and Agriculture, Fishing & Hunting (56.9%).
| Industry | Male | Female |
| Agriculture, Fishing & Hunting | 364 (43.1%) | 481 (56.9%) |
| Mining, Quarrying, & Extraction | 97 (100.0%) | 0 (0.0%) |
| Construction | 14,380 (83.1%) | 2,919 (16.9%) |
| Manufacturing | 12,914 (54.7%) | 10,690 (45.3%) |
| Wholesale Trade | 8,163 (52.9%) | 7,261 (47.1%) |
| Retail Trade | 28,432 (46.7%) | 32,512 (53.3%) |
| Transportation & Warehousing | 18,434 (77.1%) | 5,483 (22.9%) |
| Utilities | 1,463 (68.9%) | 661 (31.1%) |
| Information | 25,045 (48.0%) | 27,112 (52.0%) |
| Finance & Insurance | 70,450 (61.9%) | 43,438 (38.1%) |
| Real Estate, Rental & Leasing | 18,860 (63.8%) | 10,720 (36.2%) |
| Professional & Scientific | 86,374 (54.6%) | 71,837 (45.4%) |
| Enterprise Management | 912 (54.7%) | 755 (45.3%) |
| Administrative & Support | 14,898 (55.9%) | 11,735 (44.1%) |
| Educational Services | 36,244 (38.0%) | 59,048 (62.0%) |
| Health Care & Social Assistance | 37,686 (31.0%) | 83,758 (69.0%) |
| Arts, Entertainment & Recreation | 19,494 (50.6%) | 19,058 (49.4%) |
| Accommodation & Food Services | 25,940 (58.3%) | 18,574 (41.7%) |
| Public Administration | 12,349 (46.7%) | 14,078 (53.3%) |
| Total | 445,882 (50.2%) | 442,954 (49.8%) |
Education in New York County
School Enrollment in New York County
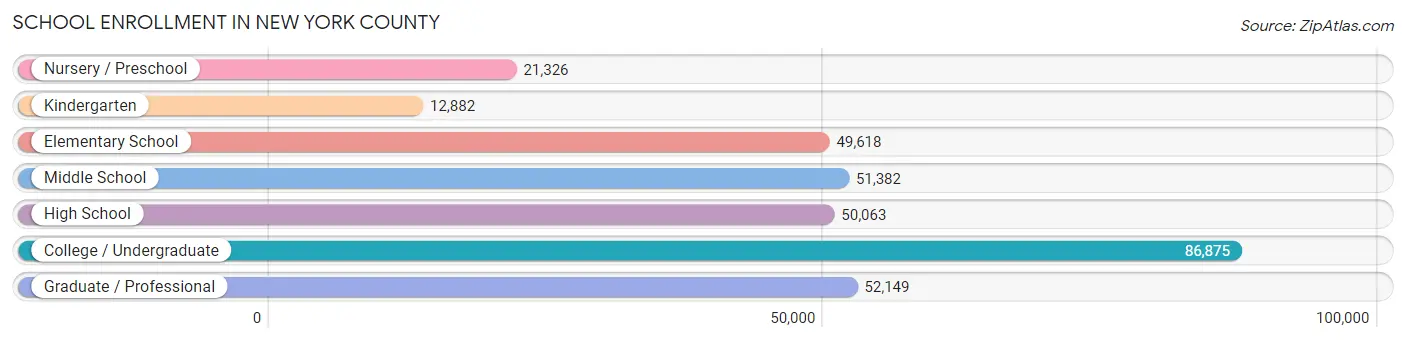
The most common levels of schooling among the 324,295 students in New York County are college / undergraduate (86,875 | 26.8%), graduate / professional (52,149 | 16.1%), and middle school (51,382 | 15.8%).
| School Level | # Students | % Students |
| Nursery / Preschool | 21,326 | 6.6% |
| Kindergarten | 12,882 | 4.0% |
| Elementary School | 49,618 | 15.3% |
| Middle School | 51,382 | 15.8% |
| High School | 50,063 | 15.4% |
| College / Undergraduate | 86,875 | 26.8% |
| Graduate / Professional | 52,149 | 16.1% |
| Total | 324,295 | 100.0% |
School Enrollment by Age by Funding Source in New York County
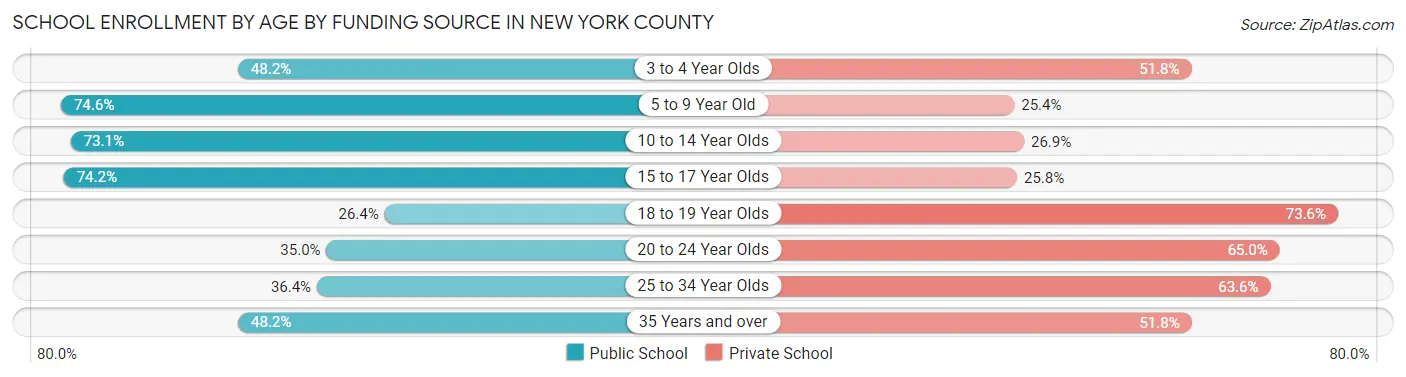
Out of a total of 324,295 students who are enrolled in schools in New York County, 145,933 (45.0%) attend a private institution, while the remaining 178,362 (55.0%) are enrolled in public schools. The age group of 18 to 19 year olds has the highest likelihood of being enrolled in private schools, with 22,912 (73.6% in the age bracket) enrolled. Conversely, the age group of 5 to 9 year old has the lowest likelihood of being enrolled in a private school, with 44,007 (74.6% in the age bracket) attending a public institution.
| Age Bracket | Public School | Private School |
| 3 to 4 Year Olds | 9,594 (48.2%) | 10,308 (51.8%) |
| 5 to 9 Year Old | 44,007 (74.6%) | 15,006 (25.4%) |
| 10 to 14 Year Olds | 46,920 (73.1%) | 17,248 (26.9%) |
| 15 to 17 Year Olds | 25,717 (74.2%) | 8,959 (25.8%) |
| 18 to 19 Year Olds | 8,207 (26.4%) | 22,912 (73.6%) |
| 20 to 24 Year Olds | 18,216 (35.0%) | 33,789 (65.0%) |
| 25 to 34 Year Olds | 15,180 (36.4%) | 26,482 (63.6%) |
| 35 Years and over | 10,479 (48.2%) | 11,271 (51.8%) |
| Total | 178,362 (55.0%) | 145,933 (45.0%) |
Educational Attainment by Field of Study in New York County
Business (153,698 | 17.4%), social sciences (142,362 | 16.1%), visual & performing arts (93,095 | 10.5%), literature & languages (72,283 | 8.2%), and liberal arts & history (65,235 | 7.4%) are the most common fields of study among 882,058 individuals in New York County who have obtained a bachelor's degree or higher.
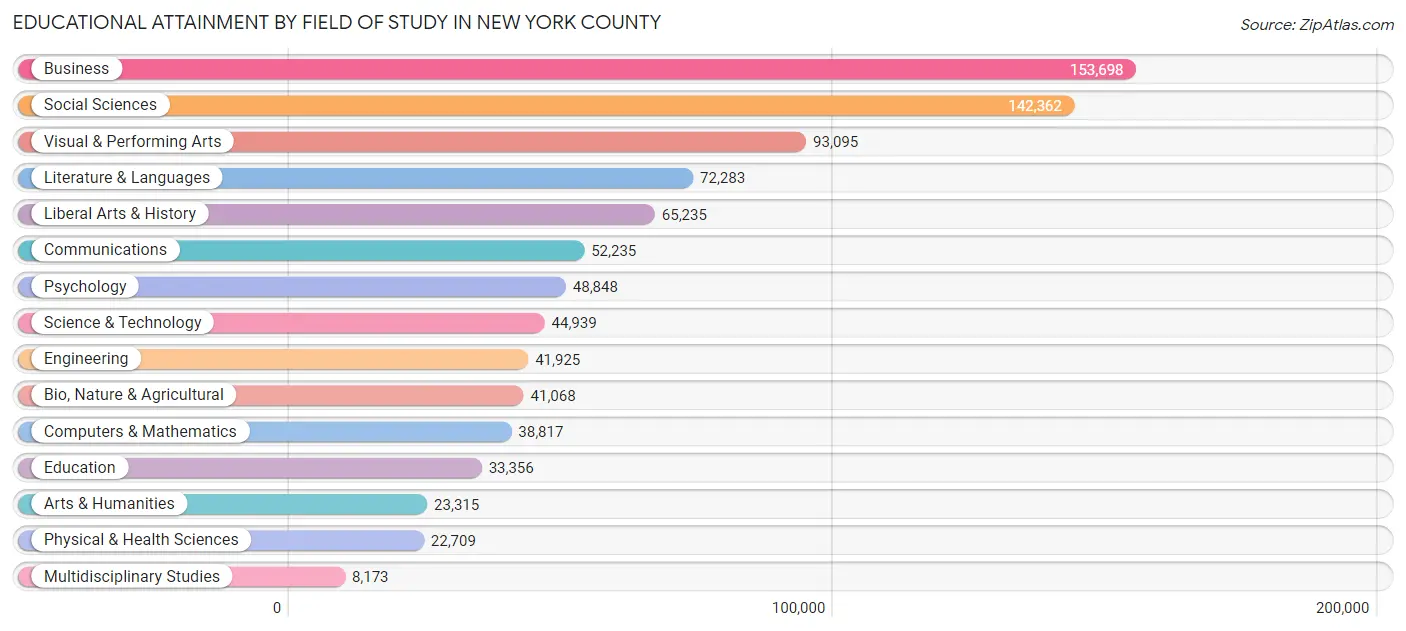
| Field of Study | # Graduates | % Graduates |
| Computers & Mathematics | 38,817 | 4.4% |
| Bio, Nature & Agricultural | 41,068 | 4.7% |
| Physical & Health Sciences | 22,709 | 2.6% |
| Psychology | 48,848 | 5.5% |
| Social Sciences | 142,362 | 16.1% |
| Engineering | 41,925 | 4.8% |
| Multidisciplinary Studies | 8,173 | 0.9% |
| Science & Technology | 44,939 | 5.1% |
| Business | 153,698 | 17.4% |
| Education | 33,356 | 3.8% |
| Literature & Languages | 72,283 | 8.2% |
| Liberal Arts & History | 65,235 | 7.4% |
| Visual & Performing Arts | 93,095 | 10.5% |
| Communications | 52,235 | 5.9% |
| Arts & Humanities | 23,315 | 2.6% |
| Total | 882,058 | 100.0% |
Transportation & Commute in New York County
Vehicle Availability by Sex in New York County
The most prevalent vehicle ownership categories in New York County are males with no vehicle (302,474, accounting for 70.1%) and females with no vehicle (315,090, making up 71.9%).
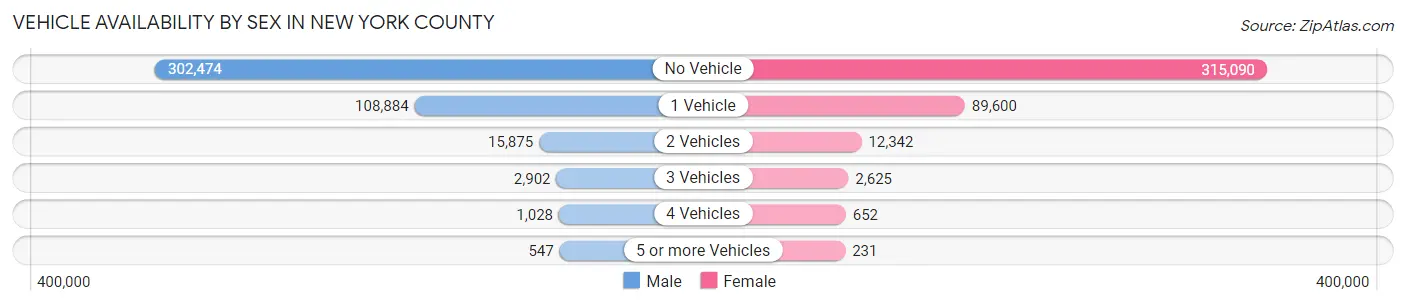
| Vehicles Available | Male | Female |
| No Vehicle | 302,474 (70.1%) | 315,090 (74.9%) |
| 1 Vehicle | 108,884 (25.2%) | 89,600 (21.3%) |
| 2 Vehicles | 15,875 (3.7%) | 12,342 (2.9%) |
| 3 Vehicles | 2,902 (0.7%) | 2,625 (0.6%) |
| 4 Vehicles | 1,028 (0.2%) | 652 (0.2%) |
| 5 or more Vehicles | 547 (0.1%) | 231 (0.1%) |
| Total | 431,710 (100.0%) | 420,540 (100.0%) |
Commute Time in New York County
The most frequently occuring commute durations in New York County are 30 to 34 minutes (139,941 commuters, 20.2%), 20 to 24 minutes (98,852 commuters, 14.3%), and 45 to 59 minutes (83,931 commuters, 12.1%).
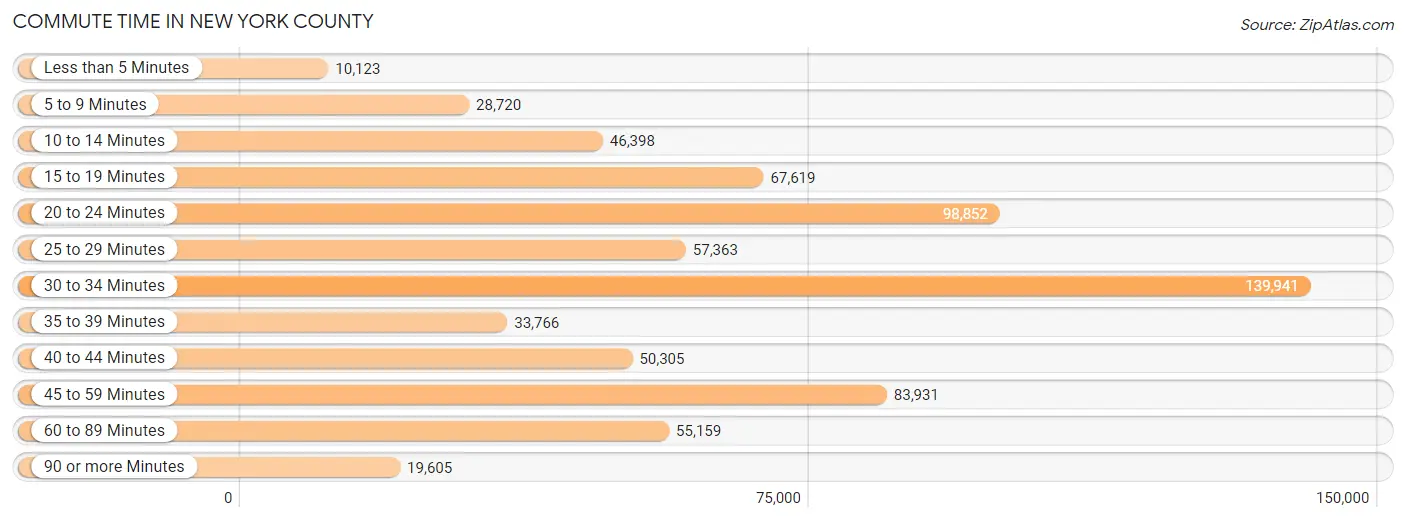
| Commute Time | # Commuters | % Commuters |
| Less than 5 Minutes | 10,123 | 1.5% |
| 5 to 9 Minutes | 28,720 | 4.2% |
| 10 to 14 Minutes | 46,398 | 6.7% |
| 15 to 19 Minutes | 67,619 | 9.8% |
| 20 to 24 Minutes | 98,852 | 14.3% |
| 25 to 29 Minutes | 57,363 | 8.3% |
| 30 to 34 Minutes | 139,941 | 20.2% |
| 35 to 39 Minutes | 33,766 | 4.9% |
| 40 to 44 Minutes | 50,305 | 7.3% |
| 45 to 59 Minutes | 83,931 | 12.1% |
| 60 to 89 Minutes | 55,159 | 8.0% |
| 90 or more Minutes | 19,605 | 2.8% |
Commute Time by Sex in New York County
The most common commute times in New York County are 30 to 34 minutes (69,209 commuters, 19.8%) for males and 30 to 34 minutes (70,732 commuters, 20.7%) for females.
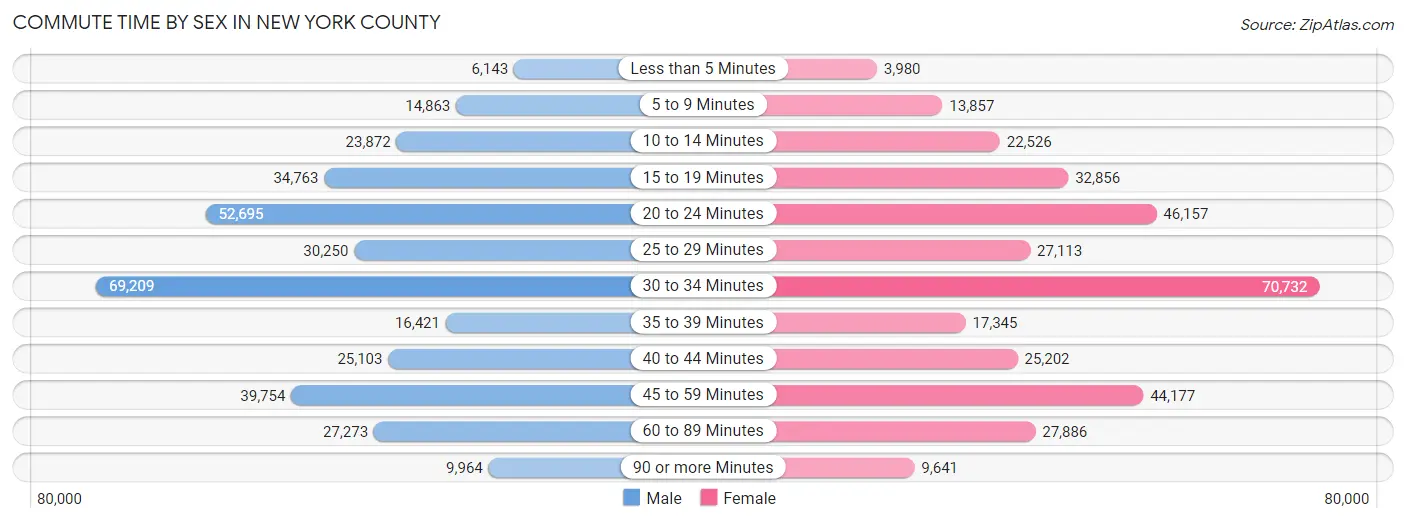
| Commute Time | Male | Female |
| Less than 5 Minutes | 6,143 (1.8%) | 3,980 (1.2%) |
| 5 to 9 Minutes | 14,863 (4.2%) | 13,857 (4.1%) |
| 10 to 14 Minutes | 23,872 (6.8%) | 22,526 (6.6%) |
| 15 to 19 Minutes | 34,763 (9.9%) | 32,856 (9.6%) |
| 20 to 24 Minutes | 52,695 (15.0%) | 46,157 (13.5%) |
| 25 to 29 Minutes | 30,250 (8.6%) | 27,113 (7.9%) |
| 30 to 34 Minutes | 69,209 (19.8%) | 70,732 (20.7%) |
| 35 to 39 Minutes | 16,421 (4.7%) | 17,345 (5.1%) |
| 40 to 44 Minutes | 25,103 (7.2%) | 25,202 (7.4%) |
| 45 to 59 Minutes | 39,754 (11.4%) | 44,177 (12.9%) |
| 60 to 89 Minutes | 27,273 (7.8%) | 27,886 (8.2%) |
| 90 or more Minutes | 9,964 (2.8%) | 9,641 (2.8%) |
Time of Departure to Work by Sex in New York County
The most frequent times of departure to work in New York County are 8:00 AM to 8:29 AM (66,519, 19.0%) for males and 8:00 AM to 8:29 AM (68,762, 20.1%) for females.
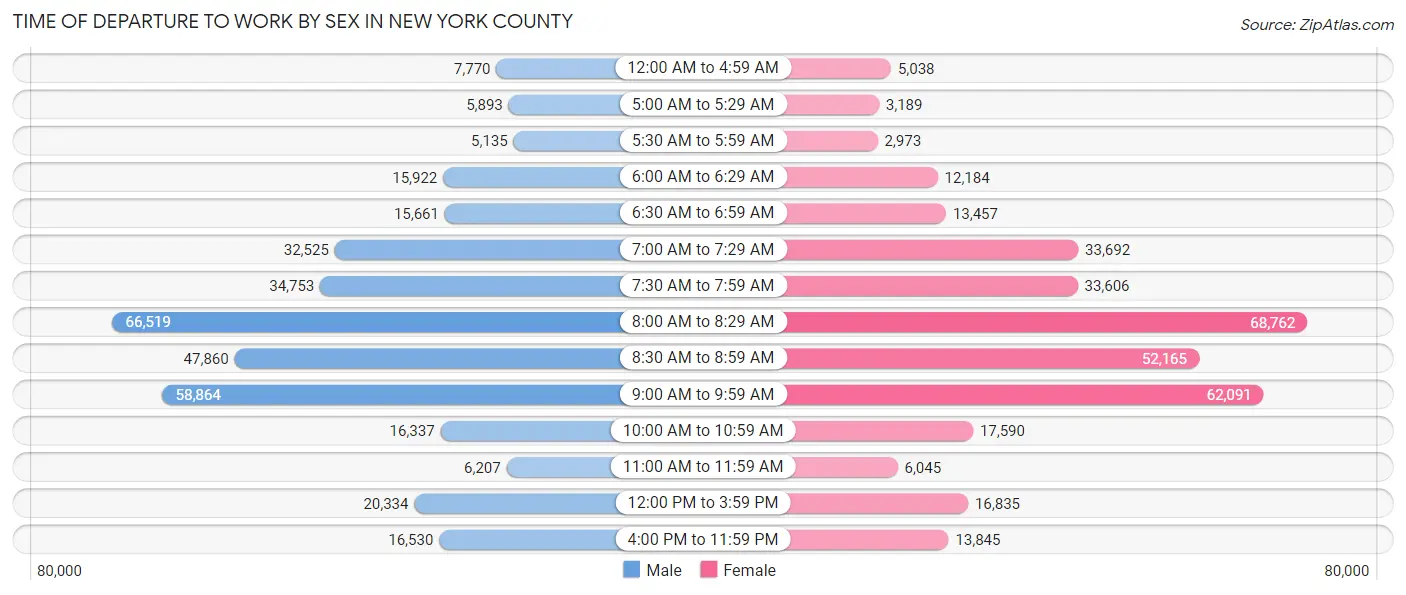
| Time of Departure | Male | Female |
| 12:00 AM to 4:59 AM | 7,770 (2.2%) | 5,038 (1.5%) |
| 5:00 AM to 5:29 AM | 5,893 (1.7%) | 3,189 (0.9%) |
| 5:30 AM to 5:59 AM | 5,135 (1.5%) | 2,973 (0.9%) |
| 6:00 AM to 6:29 AM | 15,922 (4.5%) | 12,184 (3.6%) |
| 6:30 AM to 6:59 AM | 15,661 (4.5%) | 13,457 (3.9%) |
| 7:00 AM to 7:29 AM | 32,525 (9.3%) | 33,692 (9.9%) |
| 7:30 AM to 7:59 AM | 34,753 (9.9%) | 33,606 (9.8%) |
| 8:00 AM to 8:29 AM | 66,519 (19.0%) | 68,762 (20.1%) |
| 8:30 AM to 8:59 AM | 47,860 (13.7%) | 52,165 (15.3%) |
| 9:00 AM to 9:59 AM | 58,864 (16.8%) | 62,091 (18.2%) |
| 10:00 AM to 10:59 AM | 16,337 (4.7%) | 17,590 (5.1%) |
| 11:00 AM to 11:59 AM | 6,207 (1.8%) | 6,045 (1.8%) |
| 12:00 PM to 3:59 PM | 20,334 (5.8%) | 16,835 (4.9%) |
| 4:00 PM to 11:59 PM | 16,530 (4.7%) | 13,845 (4.1%) |
| Total | 350,310 (100.0%) | 341,472 (100.0%) |
Housing Occupancy in New York County
Occupancy by Ownership in New York County
Of the total 772,601 dwellings in New York County, owner-occupied units account for 187,921 (24.3%), while renter-occupied units make up 584,680 (75.7%).
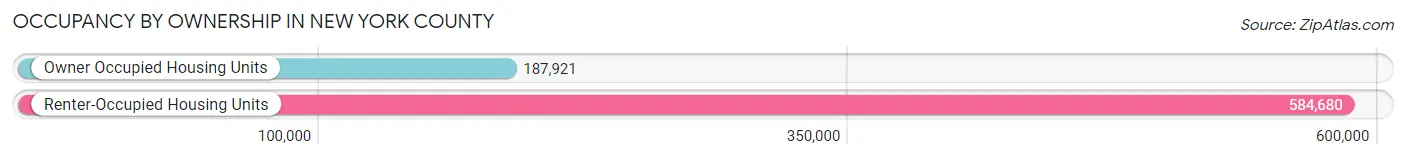
| Occupancy | # Housing Units | % Housing Units |
| Owner Occupied Housing Units | 187,921 | 24.3% |
| Renter-Occupied Housing Units | 584,680 | 75.7% |
| Total Occupied Housing Units | 772,601 | 100.0% |
Occupancy by Household Size in New York County
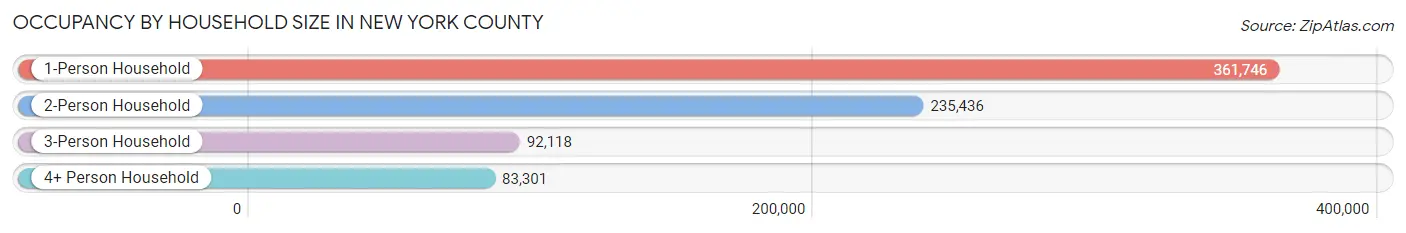
| Household Size | # Housing Units | % Housing Units |
| 1-Person Household | 361,746 | 46.8% |
| 2-Person Household | 235,436 | 30.5% |
| 3-Person Household | 92,118 | 11.9% |
| 4+ Person Household | 83,301 | 10.8% |
| Total Housing Units | 772,601 | 100.0% |
Occupancy by Ownership by Household Size in New York County
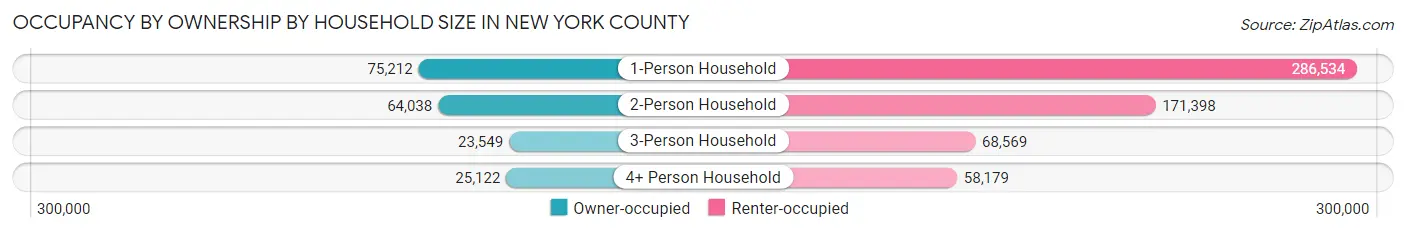
| Household Size | Owner-occupied | Renter-occupied |
| 1-Person Household | 75,212 (20.8%) | 286,534 (79.2%) |
| 2-Person Household | 64,038 (27.2%) | 171,398 (72.8%) |
| 3-Person Household | 23,549 (25.6%) | 68,569 (74.4%) |
| 4+ Person Household | 25,122 (30.2%) | 58,179 (69.8%) |
| Total Housing Units | 187,921 (24.3%) | 584,680 (75.7%) |
Occupancy by Educational Attainment in New York County
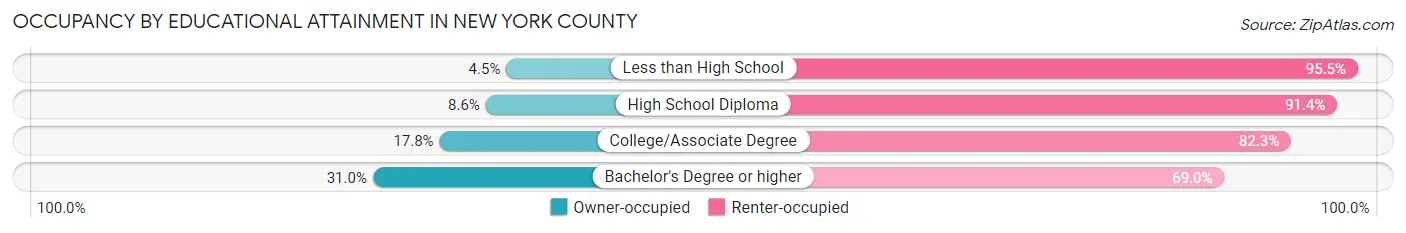
| Household Size | Owner-occupied | Renter-occupied |
| Less than High School | 3,397 (4.5%) | 71,883 (95.5%) |
| High School Diploma | 6,871 (8.6%) | 73,084 (91.4%) |
| College/Associate Degree | 18,278 (17.7%) | 84,704 (82.3%) |
| Bachelor's Degree or higher | 159,375 (31.0%) | 355,009 (69.0%) |
Occupancy by Age of Householder in New York County
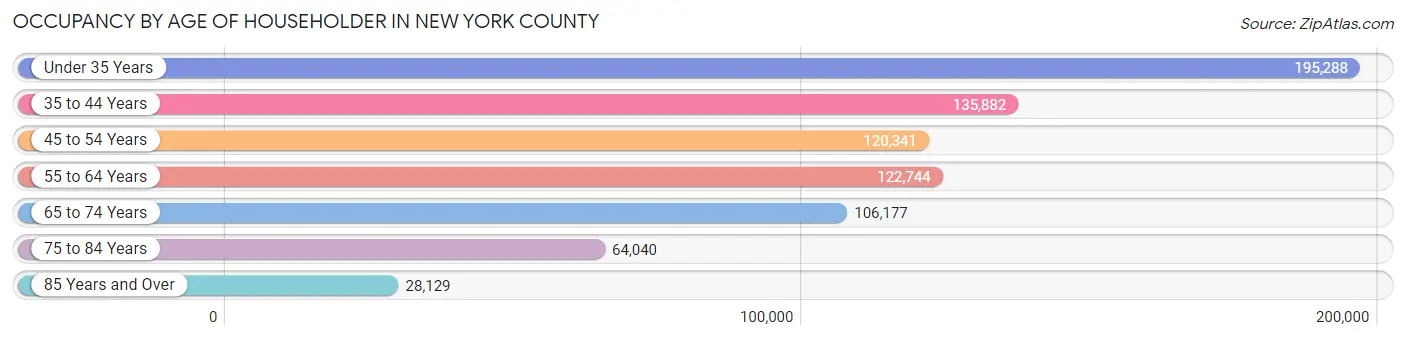
| Age Bracket | # Households | % Households |
| Under 35 Years | 195,288 | 25.3% |
| 35 to 44 Years | 135,882 | 17.6% |
| 45 to 54 Years | 120,341 | 15.6% |
| 55 to 64 Years | 122,744 | 15.9% |
| 65 to 74 Years | 106,177 | 13.7% |
| 75 to 84 Years | 64,040 | 8.3% |
| 85 Years and Over | 28,129 | 3.6% |
| Total | 772,601 | 100.0% |
Housing Finances in New York County
Median Income by Occupancy in New York County
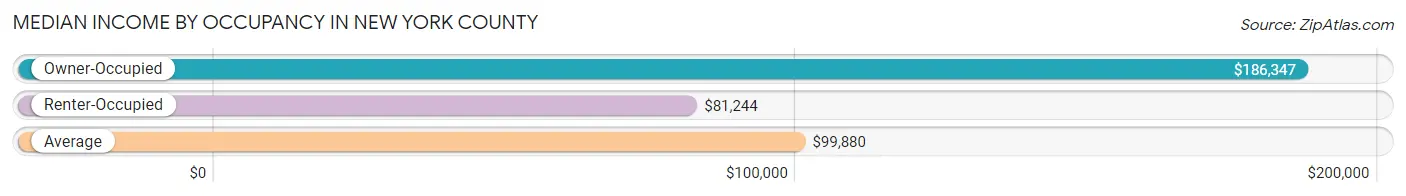
| Occupancy Type | # Households | Median Income |
| Owner-Occupied | 187,921 (24.3%) | $186,347 |
| Renter-Occupied | 584,680 (75.7%) | $81,244 |
| Average | 772,601 (100.0%) | $99,880 |
Occupancy by Householder Income Bracket in New York County
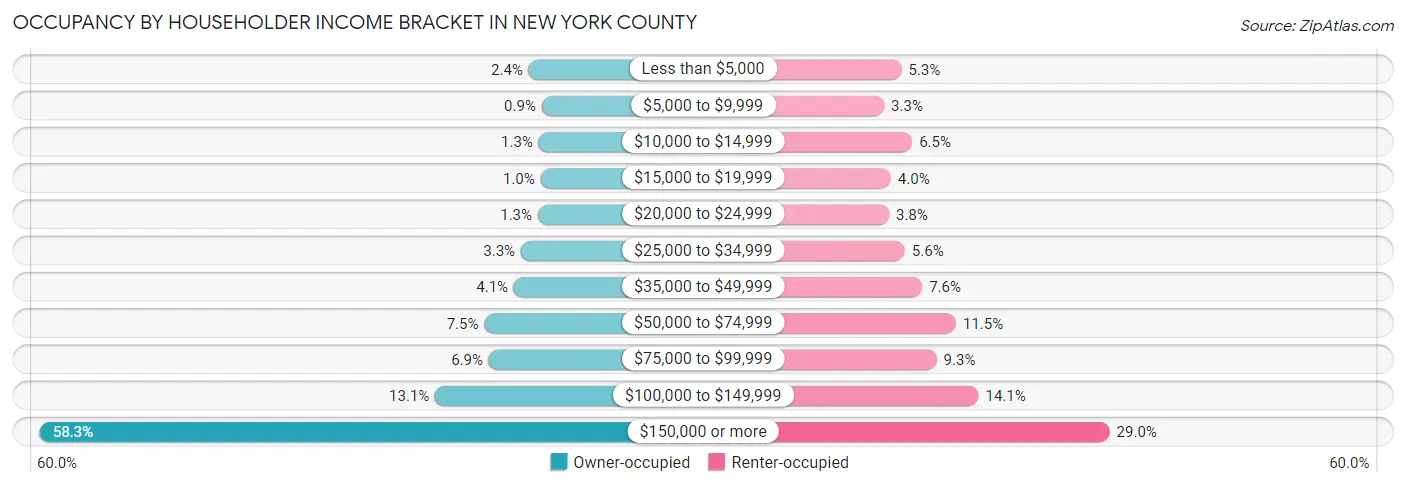
| Income Bracket | Owner-occupied | Renter-occupied |
| Less than $5,000 | 4,493 (2.4%) | 30,718 (5.2%) |
| $5,000 to $9,999 | 1,682 (0.9%) | 19,113 (3.3%) |
| $10,000 to $14,999 | 2,352 (1.3%) | 37,895 (6.5%) |
| $15,000 to $19,999 | 1,934 (1.0%) | 23,622 (4.0%) |
| $20,000 to $24,999 | 2,520 (1.3%) | 22,407 (3.8%) |
| $25,000 to $34,999 | 6,157 (3.3%) | 32,987 (5.6%) |
| $35,000 to $49,999 | 7,666 (4.1%) | 44,526 (7.6%) |
| $50,000 to $74,999 | 14,017 (7.5%) | 67,205 (11.5%) |
| $75,000 to $99,999 | 13,037 (6.9%) | 54,224 (9.3%) |
| $100,000 to $149,999 | 24,585 (13.1%) | 82,177 (14.1%) |
| $150,000 or more | 109,478 (58.3%) | 169,806 (29.0%) |
| Total | 187,921 (100.0%) | 584,680 (100.0%) |
Monthly Housing Cost Tiers in New York County
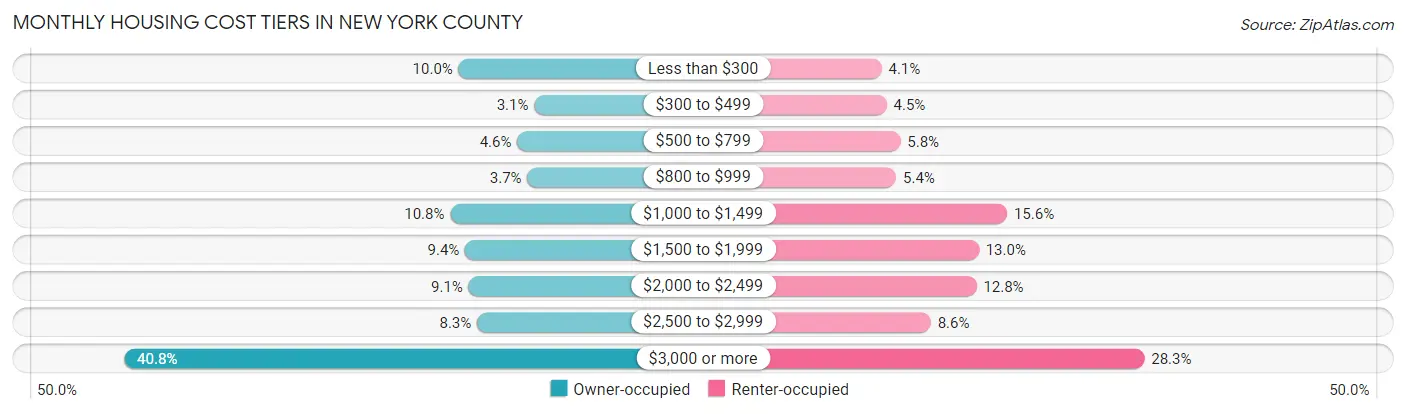
| Monthly Cost | Owner-occupied | Renter-occupied |
| Less than $300 | 18,868 (10.0%) | 23,717 (4.1%) |
| $300 to $499 | 5,788 (3.1%) | 26,505 (4.5%) |
| $500 to $799 | 8,716 (4.6%) | 33,843 (5.8%) |
| $800 to $999 | 6,963 (3.7%) | 31,583 (5.4%) |
| $1,000 to $1,499 | 20,313 (10.8%) | 91,288 (15.6%) |
| $1,500 to $1,999 | 17,733 (9.4%) | 76,057 (13.0%) |
| $2,000 to $2,499 | 17,139 (9.1%) | 74,842 (12.8%) |
| $2,500 to $2,999 | 15,666 (8.3%) | 50,243 (8.6%) |
| $3,000 or more | 76,735 (40.8%) | 165,166 (28.2%) |
| Total | 187,921 (100.0%) | 584,680 (100.0%) |
Physical Housing Characteristics in New York County
Housing Structures in New York County
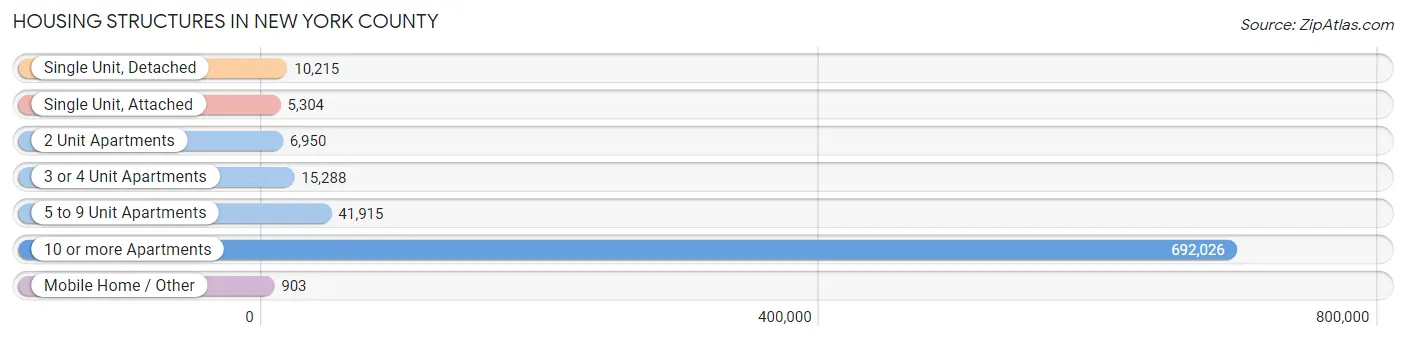
| Structure Type | # Housing Units | % Housing Units |
| Single Unit, Detached | 10,215 | 1.3% |
| Single Unit, Attached | 5,304 | 0.7% |
| 2 Unit Apartments | 6,950 | 0.9% |
| 3 or 4 Unit Apartments | 15,288 | 2.0% |
| 5 to 9 Unit Apartments | 41,915 | 5.4% |
| 10 or more Apartments | 692,026 | 89.6% |
| Mobile Home / Other | 903 | 0.1% |
| Total | 772,601 | 100.0% |
Housing Structures by Occupancy in New York County
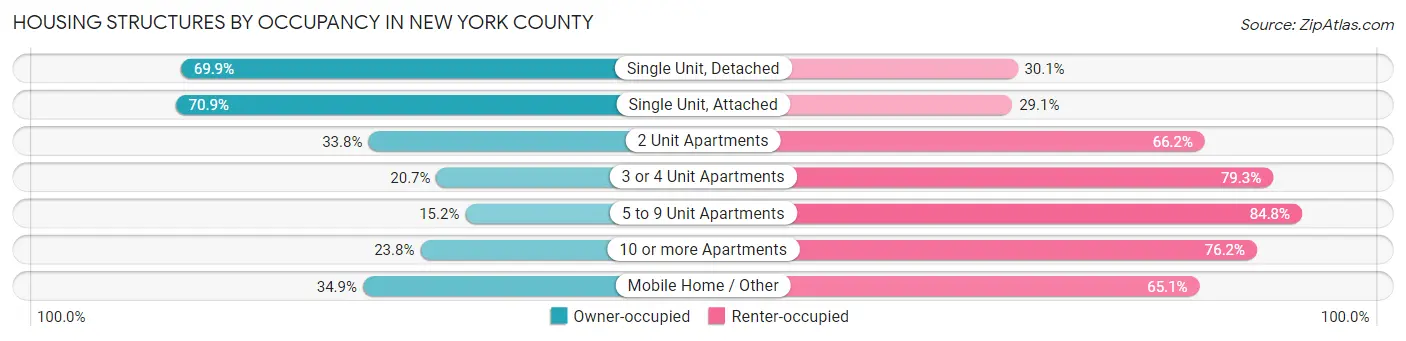
| Structure Type | Owner-occupied | Renter-occupied |
| Single Unit, Detached | 7,141 (69.9%) | 3,074 (30.1%) |
| Single Unit, Attached | 3,761 (70.9%) | 1,543 (29.1%) |
| 2 Unit Apartments | 2,352 (33.8%) | 4,598 (66.2%) |
| 3 or 4 Unit Apartments | 3,168 (20.7%) | 12,120 (79.3%) |
| 5 to 9 Unit Apartments | 6,355 (15.2%) | 35,560 (84.8%) |
| 10 or more Apartments | 164,829 (23.8%) | 527,197 (76.2%) |
| Mobile Home / Other | 315 (34.9%) | 588 (65.1%) |
| Total | 187,921 (24.3%) | 584,680 (75.7%) |
Housing Structures by Number of Rooms in New York County
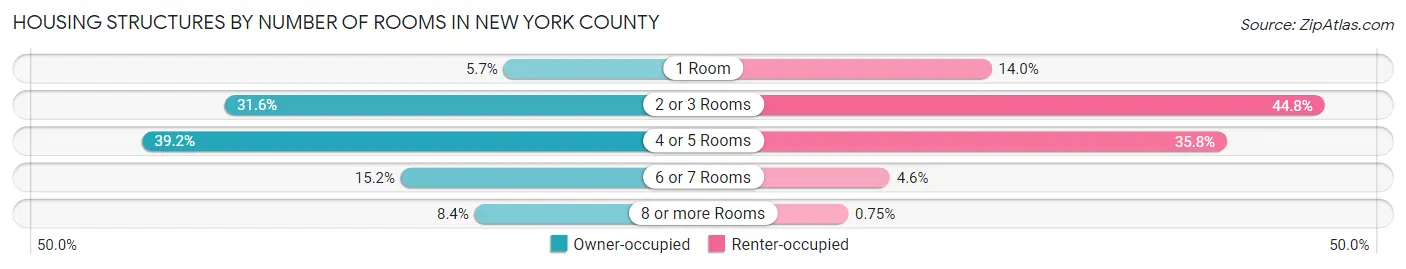
| Number of Rooms | Owner-occupied | Renter-occupied |
| 1 Room | 10,693 (5.7%) | 81,957 (14.0%) |
| 2 or 3 Rooms | 59,301 (31.6%) | 262,137 (44.8%) |
| 4 or 5 Rooms | 73,614 (39.2%) | 209,251 (35.8%) |
| 6 or 7 Rooms | 28,565 (15.2%) | 26,976 (4.6%) |
| 8 or more Rooms | 15,748 (8.4%) | 4,359 (0.7%) |
| Total | 187,921 (100.0%) | 584,680 (100.0%) |
Housing Structure by Heating Type in New York County
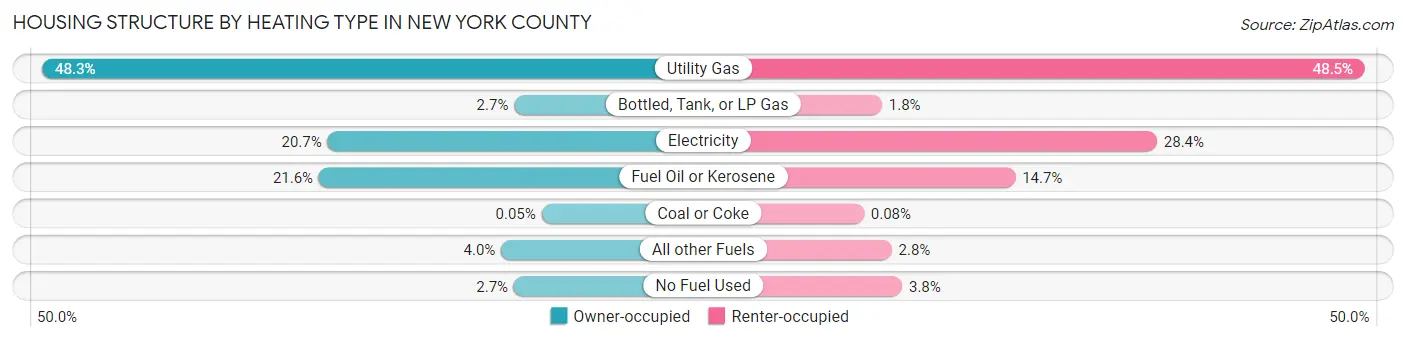
| Heating Type | Owner-occupied | Renter-occupied |
| Utility Gas | 90,767 (48.3%) | 283,453 (48.5%) |
| Bottled, Tank, or LP Gas | 5,060 (2.7%) | 10,657 (1.8%) |
| Electricity | 38,951 (20.7%) | 165,969 (28.4%) |
| Fuel Oil or Kerosene | 40,507 (21.6%) | 85,944 (14.7%) |
| Coal or Coke | 86 (0.1%) | 481 (0.1%) |
| All other Fuels | 7,432 (4.0%) | 16,123 (2.8%) |
| No Fuel Used | 5,118 (2.7%) | 22,053 (3.8%) |
| Total | 187,921 (100.0%) | 584,680 (100.0%) |
Household Vehicle Usage in New York County
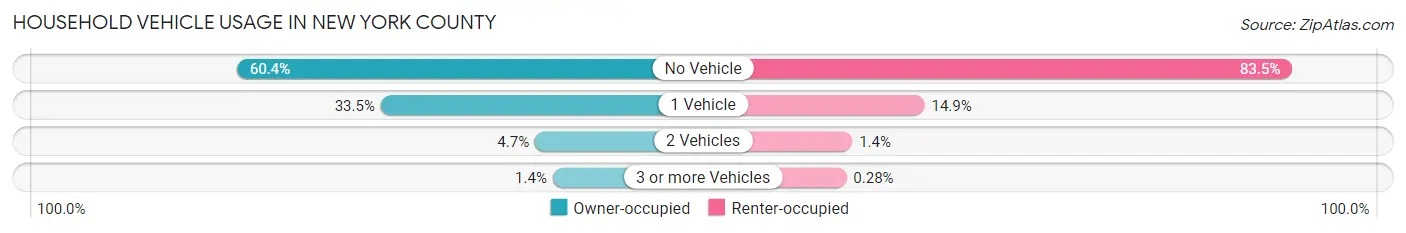
| Vehicles per Household | Owner-occupied | Renter-occupied |
| No Vehicle | 113,473 (60.4%) | 488,148 (83.5%) |
| 1 Vehicle | 62,967 (33.5%) | 86,907 (14.9%) |
| 2 Vehicles | 8,852 (4.7%) | 8,011 (1.4%) |
| 3 or more Vehicles | 2,629 (1.4%) | 1,614 (0.3%) |
| Total | 187,921 (100.0%) | 584,680 (100.0%) |
Real Estate & Mortgages in New York County
Real Estate and Mortgage Overview in New York County
| Characteristic | Without Mortgage | With Mortgage |
| Housing Units | 96,018 | 91,903 |
| Median Property Value | $1,053,800 | $1,157,900 |
| Median Household Income | $136,272 | $64,350 |
| Monthly Housing Costs | $1,367 | $60,235 |
| Real Estate Taxes | $10,001 | $20,503 |
Property Value by Mortgage Status in New York County
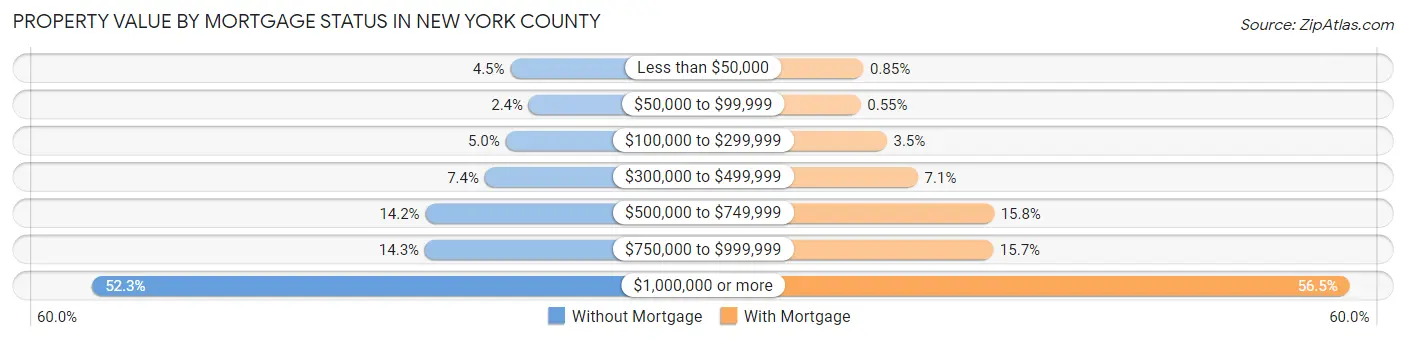
| Property Value | Without Mortgage | With Mortgage |
| Less than $50,000 | 4,297 (4.5%) | 781 (0.9%) |
| $50,000 to $99,999 | 2,274 (2.4%) | 502 (0.5%) |
| $100,000 to $299,999 | 4,834 (5.0%) | 3,255 (3.5%) |
| $300,000 to $499,999 | 7,117 (7.4%) | 6,521 (7.1%) |
| $500,000 to $749,999 | 13,625 (14.2%) | 14,514 (15.8%) |
| $750,000 to $999,999 | 13,686 (14.2%) | 14,428 (15.7%) |
| $1,000,000 or more | 50,185 (52.3%) | 51,902 (56.5%) |
| Total | 96,018 (100.0%) | 91,903 (100.0%) |
Household Income by Mortgage Status in New York County
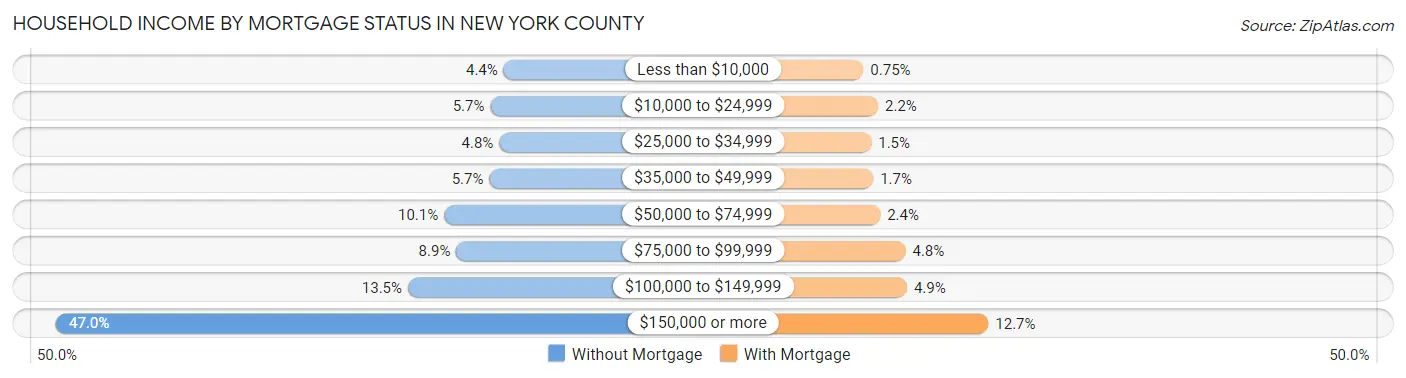
| Household Income | Without Mortgage | With Mortgage |
| Less than $10,000 | 4,203 (4.4%) | 686 (0.7%) |
| $10,000 to $24,999 | 5,424 (5.7%) | 1,972 (2.1%) |
| $25,000 to $34,999 | 4,613 (4.8%) | 1,382 (1.5%) |
| $35,000 to $49,999 | 5,508 (5.7%) | 1,544 (1.7%) |
| $50,000 to $74,999 | 9,646 (10.1%) | 2,158 (2.4%) |
| $75,000 to $99,999 | 8,534 (8.9%) | 4,371 (4.8%) |
| $100,000 to $149,999 | 12,962 (13.5%) | 4,503 (4.9%) |
| $150,000 or more | 45,128 (47.0%) | 11,623 (12.7%) |
| Total | 96,018 (100.0%) | 91,903 (100.0%) |
Property Value to Household Income Ratio in New York County
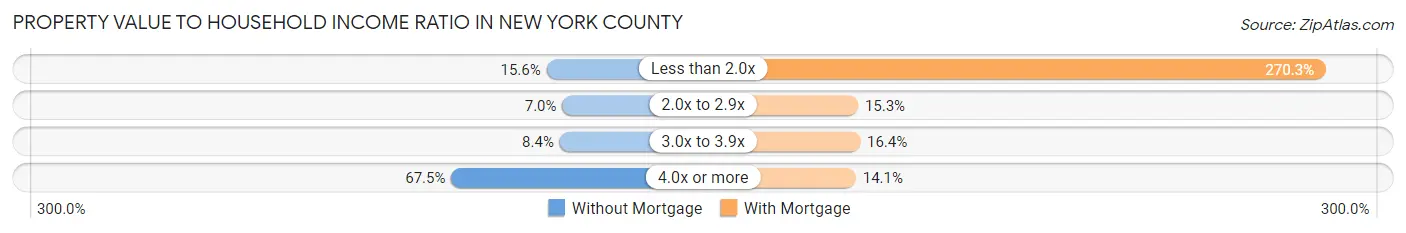
| Value-to-Income Ratio | Without Mortgage | With Mortgage |
| Less than 2.0x | 15,005 (15.6%) | 248,422 (270.3%) |
| 2.0x to 2.9x | 6,730 (7.0%) | 14,021 (15.3%) |
| 3.0x to 3.9x | 8,094 (8.4%) | 15,101 (16.4%) |
| 4.0x or more | 64,849 (67.5%) | 12,955 (14.1%) |
| Total | 96,018 (100.0%) | 91,903 (100.0%) |
Real Estate Taxes by Mortgage Status in New York County
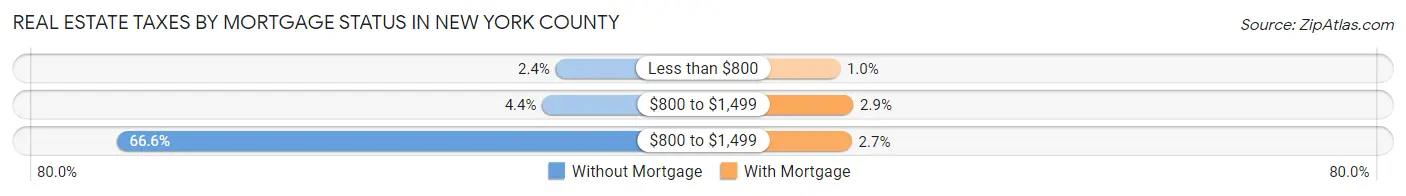
| Property Taxes | Without Mortgage | With Mortgage |
| Less than $800 | 2,300 (2.4%) | 928 (1.0%) |
| $800 to $1,499 | 4,188 (4.4%) | 2,701 (2.9%) |
| $800 to $1,499 | 63,898 (66.5%) | 2,503 (2.7%) |
| Total | 96,018 (100.0%) | 91,903 (100.0%) |
Health & Disability in New York County
Health Insurance Coverage by Age in New York County
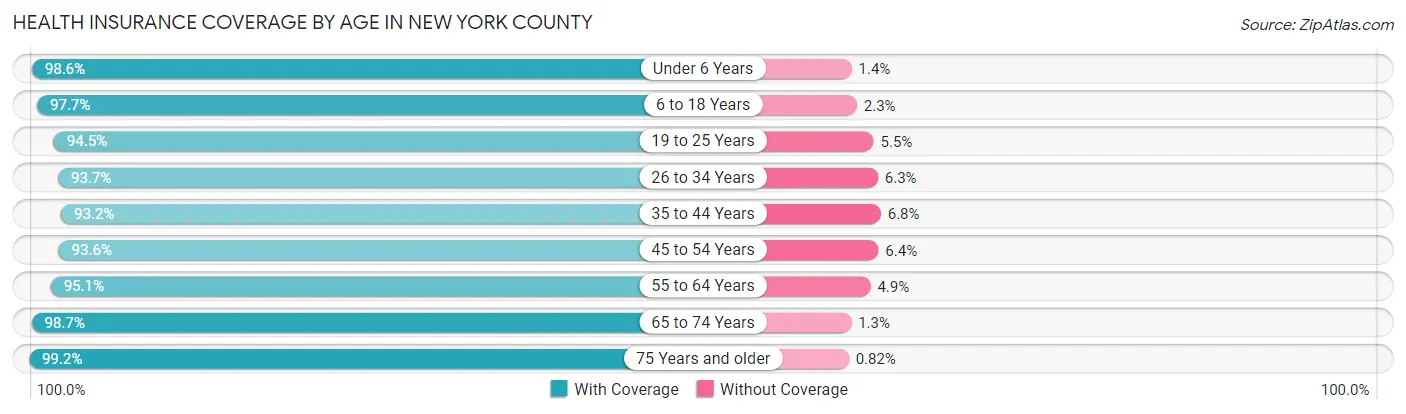
| Age Bracket | With Coverage | Without Coverage |
| Under 6 Years | 84,886 (98.6%) | 1,174 (1.4%) |
| 6 to 18 Years | 162,258 (97.7%) | 3,884 (2.3%) |
| 19 to 25 Years | 156,570 (94.5%) | 9,059 (5.5%) |
| 26 to 34 Years | 289,085 (93.7%) | 19,299 (6.3%) |
| 35 to 44 Years | 223,765 (93.2%) | 16,331 (6.8%) |
| 45 to 54 Years | 188,977 (93.6%) | 12,843 (6.4%) |
| 55 to 64 Years | 180,613 (95.1%) | 9,263 (4.9%) |
| 65 to 74 Years | 151,577 (98.7%) | 1,975 (1.3%) |
| 75 Years and older | 124,576 (99.2%) | 1,032 (0.8%) |
| Total | 1,562,307 (95.4%) | 74,860 (4.6%) |
Health Insurance Coverage by Citizenship Status in New York County
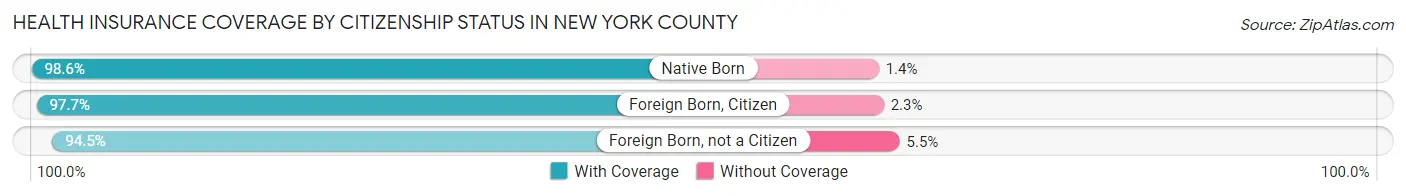
| Citizenship Status | With Coverage | Without Coverage |
| Native Born | 84,886 (98.6%) | 1,174 (1.4%) |
| Foreign Born, Citizen | 162,258 (97.7%) | 3,884 (2.3%) |
| Foreign Born, not a Citizen | 156,570 (94.5%) | 9,059 (5.5%) |
Health Insurance Coverage by Household Income in New York County
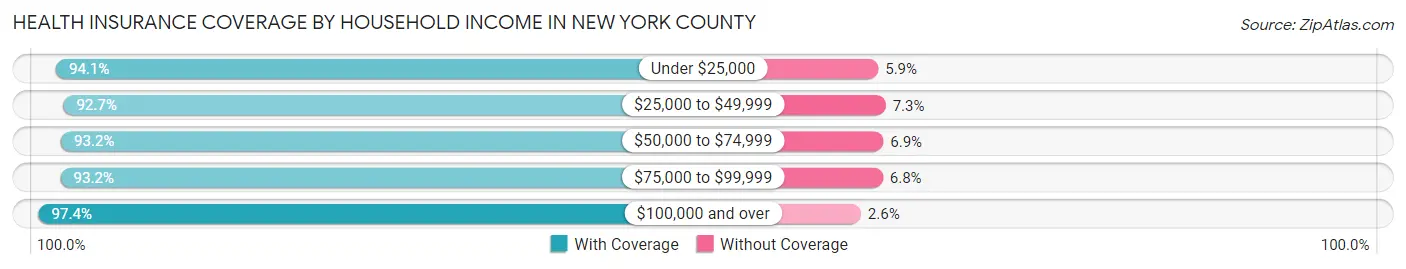
| Household Income | With Coverage | Without Coverage |
| Under $25,000 | 221,678 (94.1%) | 13,897 (5.9%) |
| $25,000 to $49,999 | 164,176 (92.7%) | 12,911 (7.3%) |
| $50,000 to $74,999 | 152,011 (93.1%) | 11,172 (6.9%) |
| $75,000 to $99,999 | 123,808 (93.2%) | 8,970 (6.8%) |
| $100,000 and over | 845,224 (97.4%) | 22,896 (2.6%) |
Public vs Private Health Insurance Coverage by Age in New York County
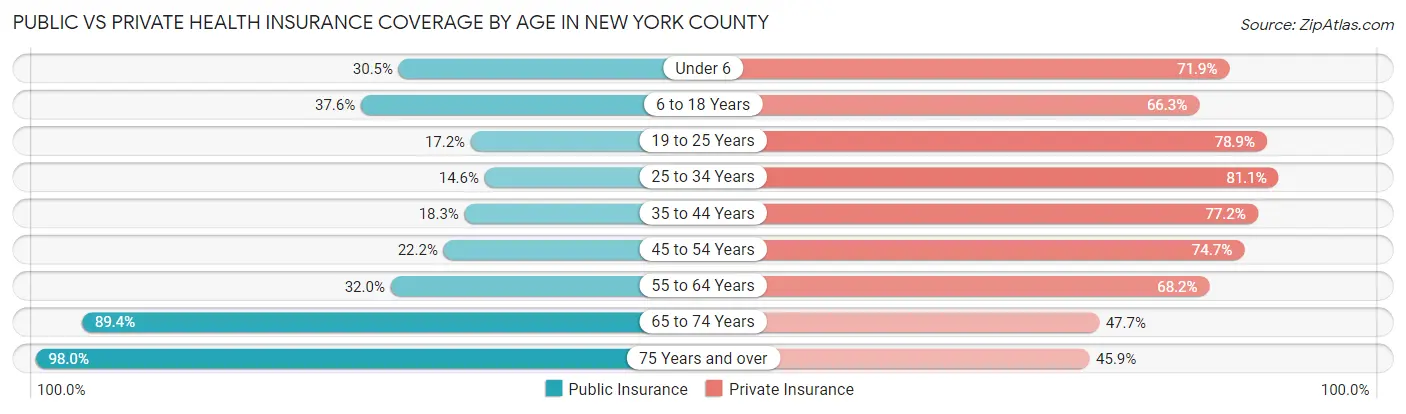
| Age Bracket | Public Insurance | Private Insurance |
| Under 6 | 26,277 (30.5%) | 61,894 (71.9%) |
| 6 to 18 Years | 62,390 (37.6%) | 110,142 (66.3%) |
| 19 to 25 Years | 28,400 (17.2%) | 130,647 (78.9%) |
| 25 to 34 Years | 44,956 (14.6%) | 249,979 (81.1%) |
| 35 to 44 Years | 43,959 (18.3%) | 185,255 (77.2%) |
| 45 to 54 Years | 44,801 (22.2%) | 150,679 (74.7%) |
| 55 to 64 Years | 60,831 (32.0%) | 129,533 (68.2%) |
| 65 to 74 Years | 137,250 (89.4%) | 73,224 (47.7%) |
| 75 Years and over | 123,052 (98.0%) | 57,648 (45.9%) |
| Total | 571,916 (34.9%) | 1,149,001 (70.2%) |
Disability Status by Sex by Age in New York County
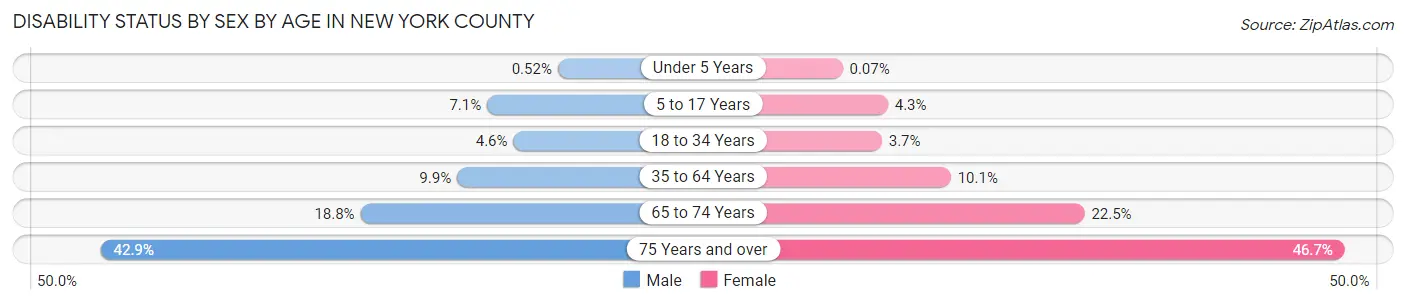
| Age Bracket | Male | Female |
| Under 5 Years | 197 (0.5%) | 25 (0.1%) |
| 5 to 17 Years | 5,774 (7.1%) | 3,413 (4.3%) |
| 18 to 34 Years | 10,796 (4.6%) | 9,567 (3.7%) |
| 35 to 64 Years | 31,181 (9.9%) | 31,921 (10.1%) |
| 65 to 74 Years | 12,608 (18.8%) | 19,503 (22.5%) |
| 75 Years and over | 20,660 (42.9%) | 36,168 (46.7%) |
Disability Class by Sex by Age in New York County
Disability Class: Hearing Difficulty
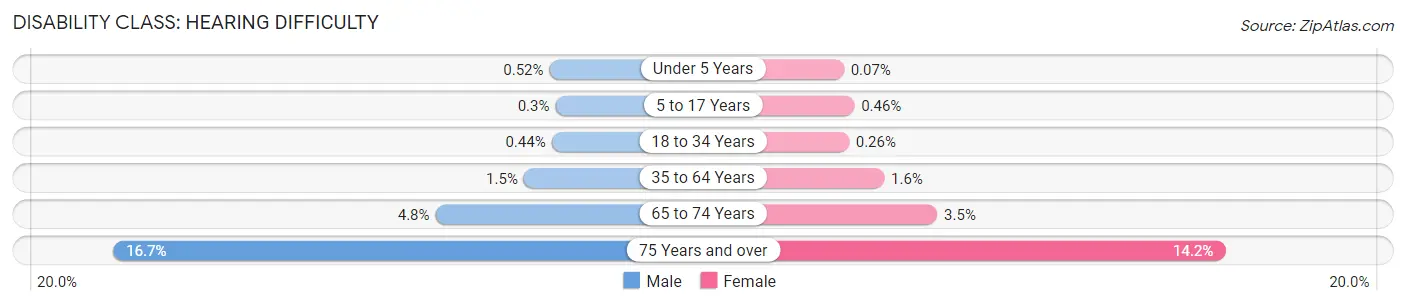
| Age Bracket | Male | Female |
| Under 5 Years | 197 (0.5%) | 25 (0.1%) |
| 5 to 17 Years | 248 (0.3%) | 365 (0.5%) |
| 18 to 34 Years | 1,014 (0.4%) | 673 (0.3%) |
| 35 to 64 Years | 4,639 (1.5%) | 4,944 (1.6%) |
| 65 to 74 Years | 3,183 (4.8%) | 3,062 (3.5%) |
| 75 Years and over | 8,039 (16.7%) | 11,024 (14.2%) |
Disability Class: Vision Difficulty
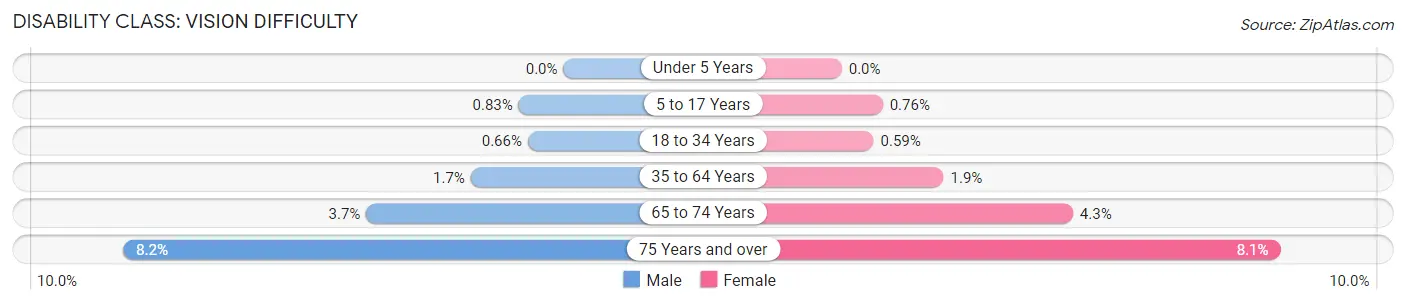
| Age Bracket | Male | Female |
| Under 5 Years | 0 (0.0%) | 0 (0.0%) |
| 5 to 17 Years | 678 (0.8%) | 605 (0.8%) |
| 18 to 34 Years | 1,529 (0.7%) | 1,531 (0.6%) |
| 35 to 64 Years | 5,435 (1.7%) | 5,968 (1.9%) |
| 65 to 74 Years | 2,449 (3.7%) | 3,711 (4.3%) |
| 75 Years and over | 3,933 (8.2%) | 6,309 (8.1%) |
Disability Class: Cognitive Difficulty
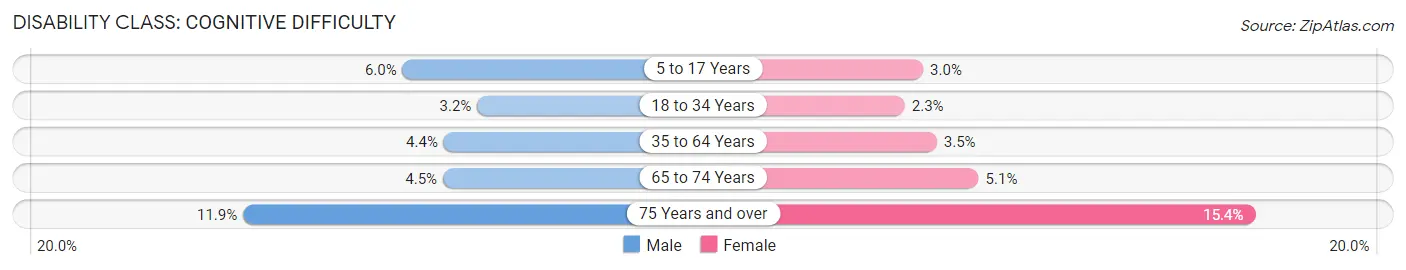
| Age Bracket | Male | Female |
| 5 to 17 Years | 4,863 (6.0%) | 2,413 (3.0%) |
| 18 to 34 Years | 7,444 (3.2%) | 6,031 (2.3%) |
| 35 to 64 Years | 14,037 (4.4%) | 11,144 (3.5%) |
| 65 to 74 Years | 2,993 (4.5%) | 4,401 (5.1%) |
| 75 Years and over | 5,720 (11.9%) | 11,898 (15.3%) |
Disability Class: Ambulatory Difficulty
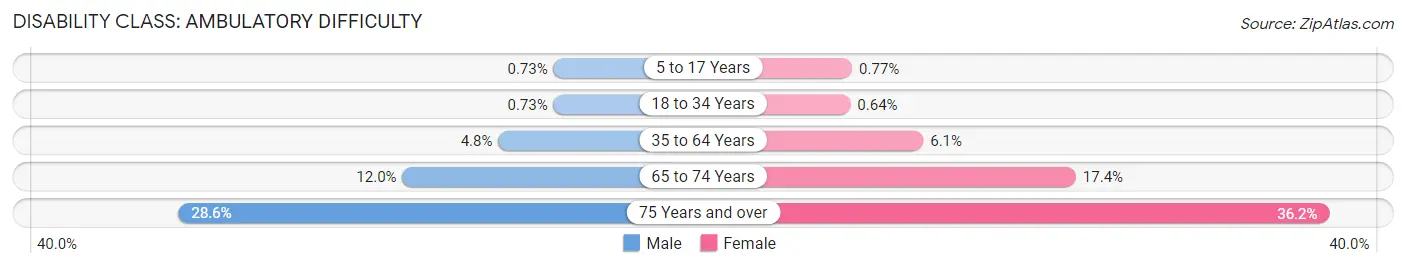
| Age Bracket | Male | Female |
| 5 to 17 Years | 592 (0.7%) | 618 (0.8%) |
| 18 to 34 Years | 1,705 (0.7%) | 1,644 (0.6%) |
| 35 to 64 Years | 15,251 (4.8%) | 19,104 (6.0%) |
| 65 to 74 Years | 8,003 (11.9%) | 15,053 (17.4%) |
| 75 Years and over | 13,751 (28.6%) | 28,048 (36.2%) |
Disability Class: Self-Care Difficulty
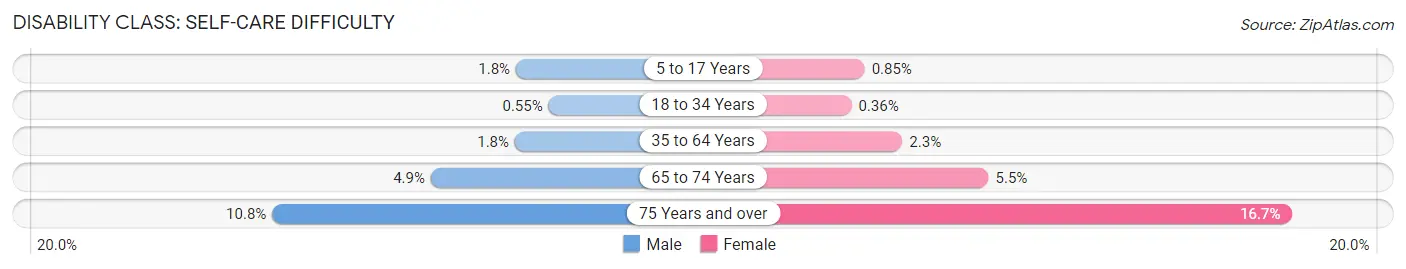
| Age Bracket | Male | Female |
| 5 to 17 Years | 1,435 (1.8%) | 680 (0.9%) |
| 18 to 34 Years | 1,290 (0.5%) | 937 (0.4%) |
| 35 to 64 Years | 5,702 (1.8%) | 7,105 (2.2%) |
| 65 to 74 Years | 3,297 (4.9%) | 4,721 (5.4%) |
| 75 Years and over | 5,201 (10.8%) | 12,958 (16.7%) |
Technology Access in New York County
Computing Device Access in New York County
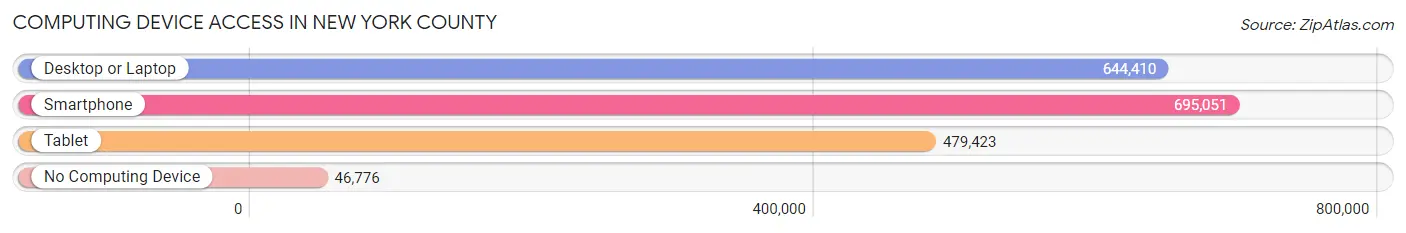
| Device Type | # Households | % Households |
| Desktop or Laptop | 644,410 | 83.4% |
| Smartphone | 695,051 | 90.0% |
| Tablet | 479,423 | 62.1% |
| No Computing Device | 46,776 | 6.0% |
| Total | 772,601 | 100.0% |
Internet Access in New York County
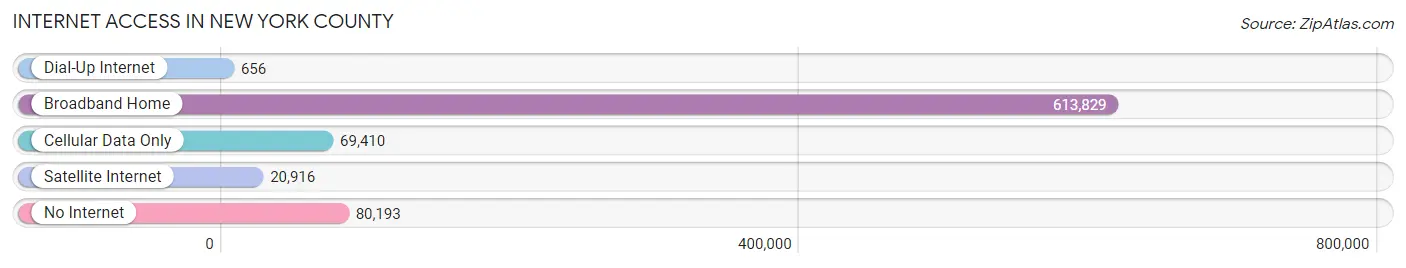
| Internet Type | # Households | % Households |
| Dial-Up Internet | 656 | 0.1% |
| Broadband Home | 613,829 | 79.4% |
| Cellular Data Only | 69,410 | 9.0% |
| Satellite Internet | 20,916 | 2.7% |
| No Internet | 80,193 | 10.4% |
| Total | 772,601 | 100.0% |
New York County Summary
New York County, also known as Manhattan, is the most densely populated county in the United States. It is located in the heart of New York City and is home to some of the most iconic landmarks in the world. The county is bordered by the Hudson River to the west, the East River to the east, and the Harlem River to the north. It is also home to the boroughs of Manhattan, the Bronx, and Staten Island.
History
The history of New York County dates back to the 1600s when the Dutch first settled in the area. The Dutch named the area New Amsterdam and it was the first permanent European settlement in what is now New York City. In 1664, the British took control of the area and renamed it New York. The area was then divided into 12 counties, with New York County being the largest.
In the late 1700s, New York County was the site of the first capital of the United States. The city of New York was the first capital of the United States from 1785 to 1790. During this time, the city was the center of the nation’s political and economic life.
In the 1800s, New York County was the site of the first subway system in the United States. The first subway line opened in 1904 and was the first of its kind in the world. The subway system has since grown to become one of the largest in the world.
In the 1900s, New York County was the site of the construction of the Empire State Building. The building was completed in 1931 and is one of the most iconic landmarks in the world.
Geography
New York County is located in the southeastern part of New York State. It is bordered by the Hudson River to the west, the East River to the east, and the Harlem River to the north. The county is made up of five boroughs: Manhattan, the Bronx, Queens, Brooklyn, and Staten Island.
The county is divided into three main sections: Lower Manhattan, Midtown Manhattan, and Upper Manhattan. Lower Manhattan is the oldest part of the county and is home to many of the city’s most iconic landmarks, such as the Statue of Liberty and the Empire State Building. Midtown Manhattan is the commercial center of the city and is home to many of the city’s most famous skyscrapers. Upper Manhattan is the northernmost part of the county and is home to many of the city’s parks and green spaces.
Economy
New York County is the economic center of the United States. It is home to the New York Stock Exchange, the largest stock exchange in the world. The county is also home to many of the world’s largest corporations, such as JPMorgan Chase, Goldman Sachs, and Citigroup.
The county is also home to many of the world’s most famous museums, such as the Metropolitan Museum of Art and the Museum of Modern Art. The county is also home to many of the world’s most famous theaters, such as the Broadway Theater and the Lincoln Center.
Demographics
As of the 2010 census, New York County had a population of 1,585,873. The population is made up of a diverse mix of people from all over the world. The largest ethnic group in the county is Hispanic, making up 28.6% of the population. The second largest ethnic group is White, making up 25.7% of the population. The third largest ethnic group is Asian, making up 19.3% of the population.
The median household income in New York County is $75,738, which is higher than the national median of $50,046. The median home value in the county is $1,072,400, which is higher than the national median of $184,700.
New York County is a vibrant and diverse county with a rich history and a bright future. It is home to some of the world’s most iconic landmarks and is the economic center of the United States. The county is home to a diverse mix of people from all over the world and is a great place to live, work, and visit.
Common Questions
What is Per Capita Income in New York County?
Per Capita income in New York County is $89,702.
What is the Median Family Income in New York County?
Median Family Income in New York County is $131,344.
What is the Median Household income in New York County?
Median Household Income in New York County is $99,880.
What is Income or Wage Gap in New York County?
Income or Wage Gap in New York County is 23.1%.
Women in New York County earn 76.9 cents for every dollar earned by a man.
What is Family Income Deficit in New York County?
Family Income Deficit in New York County is $10,536.
Families that are below poverty line in New York County earn $10,536 less on average than the poverty threshold level.
What is Inequality or Gini Index in New York County?
Inequality or Gini Index in New York County is 0.60.
What is the Total Population of New York County?
Total Population of New York County is 1,645,867.
What is the Total Male Population of New York County?
Total Male Population of New York County is 788,264.
What is the Total Female Population of New York County?
Total Female Population of New York County is 857,603.
What is the Ratio of Males per 100 Females in New York County?
There are 91.91 Males per 100 Females in New York County.
What is the Ratio of Females per 100 Males in New York County?
There are 108.80 Females per 100 Males in New York County.
What is the Median Population Age in New York County?
Median Population Age in New York County is 38.5 Years.
What is the Average Family Size in New York County
Average Family Size in New York County is 3.0 People.
What is the Average Household Size in New York County
Average Household Size in New York County is 2.0 People.
How Large is the Labor Force in New York County?
There are 953,136 People in the Labor Forcein in New York County.
What is the Percentage of People in the Labor Force in New York County?
66.5% of People are in the Labor Force in New York County.
What is the Unemployment Rate in New York County?
Unemployment Rate in New York County is 6.8%.